nhe Outlook for Thermal Coal - World Bank Document
86
SCP-12 nhe Outlook for Thermal Coal Boum-Jong Choe WORLD BANK STAFF COMMODII Y WORKING PAPERS Number 12 Public Disclosure Authorized Public Disclosure Authorized Public Disclosure Authorized Public Disclosure Authorized Public Disclosure Authorized Public Disclosure Authorized Public Disclosure Authorized Public Disclosure Authorized
-
Upload
khangminh22 -
Category
Documents
-
view
0 -
download
0
Transcript of nhe Outlook for Thermal Coal - World Bank Document
SCP-12
nhe Outlook for Thermal Coal
Boum-Jong Choe
WORLD BANK STAFF COMMODII Y WORKING PAPERSNumber 12
Pub
lic D
iscl
osur
e A
utho
rized
Pub
lic D
iscl
osur
e A
utho
rized
Pub
lic D
iscl
osur
e A
utho
rized
Pub
lic D
iscl
osur
e A
utho
rized
Pub
lic D
iscl
osur
e A
utho
rized
Pub
lic D
iscl
osur
e A
utho
rized
Pub
lic D
iscl
osur
e A
utho
rized
Pub
lic D
iscl
osur
e A
utho
rized

WORLD BANK STAFF COMMODITY WORKING PAPERSNumber 12
The Outlook for Thermal Coal
Boum-Jong Choe
The World BankWashington, D.C., U.S.A.
Copyright © 1985The Intemational Bank for Reconstructionand Development / THE WORLD BANK
1818 H Street, N.W.Washington, D.C. 20433, U.S.A.
All rights reservedManufactured in the United States of AmericaFirst printing January 1985
This is a document published informally by the World Bank. In order that theinformation contained in it can be presented with the least possible delay, thetypescript has not been prepared in accordance with the procedures appropriate toformal printed texts, and the World Bank accepts no responsibility for errors. Thepublication is supplied at a token charge to defray part of the cost of manufacture anddistribution.
The World Bank does not accept responsibility for the views expressed herein, whichare those of the author(s) and should not be attributed to the World Bank or to itsaffiliated organizations. The findings, interpretations, and conclusions are the resultsof research supported by the Bank; they do not necessarily represent official policy ofthe Bank. The designations employed, the presentation of material, and any maps usedin this document are solely for the convenience of the reader and do not imply theexpression of any opinion whatsoever on the part of the World Bank or its affiliatesconceming the legal status of any country, territory, city, area, or of its authorities, orconceming the delimitation of its boundaries or national affiliation.
The full range of World Bank publications, both free and for sale, is described in theCatalog of Publications; the continuing research program is outlined in Abstracts ofCurrent Studies. Both booklets are updated annually; the most recent edition of each isavailable without charge from the Publications Sales Unit, Department T, The WorldBank, 1818 H Street, N.W., Washington, D.C. 20433, U.S.A., or from the EuropeanOffice of the Bank, 66 avenue d'1ena, 75116 Paris, France.
Boum-Jong Choe is an economist with the Economic Analysis and ProjectionsDepartment of the World Bank.
Library of Congress Cataloging in Publication DataChoe, Boum Jong.
The outlook for thermal coal.
(World Bank staff commodity working papers, ISSN0253-3537 ; no. 12)
Bibliography: p.1. Coal trade--Mathematical models. I. Title.
II. Series: World Bank staff commodity working paperno. 12.HD9540.5.C37 1985 380.1'4224 84-29944ISBN 0-8213-0499-2
- iii -
ABSTRACT
This paper uses an econometric simulation model of world energy
markets to project the competitive supply, demand, and prices for thermal coal
as a part of overall energy balance projections. Under the assumptions of
moderate economic growth in the market-economy countries and a pricing path
for OPEC oil that remains relatively stable for the rest of the 1980s but
increases steadily in the 1990s, the market economies' demand for thermal coal
is projected to increase from 1,247 mtce in 1982 to 1,505 mtce in 1990 and
2,020 mtce in the year 2000. The share of coal in total primary energy
consumption is expected to remain approximately constant for the 1982-90
period but increase slightly in the 1990s.
Recent setback suffered by the coal industry resulted primarily from
economic recession. Latest data show that substitution of thermal coal for
hydrocarbon fuels in thermal electricity generation took place steadily in the
industrial countries, despite the softening of petroleum prices. It is the
continuation of this substitution process that will provide one of the main
sources of demand growth for thermal coal in the medium term. Sensitivity
results with the model, however, show that petroleum prices will have a major
medium- to long-term impact on the degree of substitution and hence on the
demand for thermal coal. Uncertainties of economic growth, nuclear power
supplies, and price elasticities of fuel demand are also shown to be the key
elements that can substantially change the future of thermal coal.
World coal resources are more than adequate to meet the increasing
demand for thermal coal to the year 2000 and beyond. In view of the basically
competitive structure of the world coal industry, it is reasonable to expect
that, in the long term, the international coal prices will not increase beyond
its long-term costs of supply. Based on the available estimates of the long-
term supply curve for the important coal exporters, the international export
price of thermal coal is projected to increase at 1.3% p.a. between 1985 and
the year 2000.
- iv -
CONDENSE
Cette 6tude utilise un modele de simulation econometrique des
marches mondiaux de 1'energie pour projeter la situation de l'offre, de la
demande et des prix du charbon de chaufferie dans le cadre de projections
globales du bilan energetique. Si l'on suppose que les pays a economie de
marche auront une croissance economique moderee et que les prix du p6trole
de l'OPEP resteront relativement stables vers la fin des annees 80 mais
qu'ils augmenteront regulierement dans les annees 90, la demande de
charbon de chaufferie dans les economies de marche devrait passer de
1.247 millions de tonnes d'equivalent charbon a 1.505 en 1990 et 2.020 en
l'an 2000. La part du charbon dans la consommation totale d'energie
primaire devrait rester a peu pres constante de 1982 a 1990 mais on
s'attend a ce qu'elle soit legerement en hausse dans les annees 90.
La crise recente de l'industrie charbonniere tient
principalement a la recession economique. Les dernieres donnees montrent
que le remplacement des hydrocarbures par du charbon de chaufferie pour la
production d'electricite thermique s'est de plus en plus impose dans les
pays industrialises malgre le flechissement des prix du petrole. La
poursuite de cette tendance sera l'une des principales causes de la
croissance de la demande de charbon de chaufferie a moyen terme. Les
r6sultats de I'analyse de sensibilite montrent pourtant que les prix du
petrole auront une forte influence a moyen et a long terme sur l'intensite
- v -
du remplacement et par la meme sur la demande de charbon de chaufferie.
Les incertitudes de la croissance 6conomique, l'approvisionnement en
energie nucl6aire et 1'e1asticite-prix de la demande de combustible sont
6galement consideres comme des el6ments cles susceptibles de modifier
sensiblement l'avenir du charbon de chaufferie.
Les ressources mondiales de charbon suffisent amplement a faire
face a la demande croissante de charbon de chaufferie jusqu'en l'an 2000
et au-dela. Vu la structure generalement competitive de l'industrie
mondiale du charbon, il est raisonnable de penser que, a long terme, les
prix internationaux du charbon ne depasseront pas les coats a long terme
de l'offre. Selon les estimations disponibles de la courbe de l'offre a
long terme chez les principaux exportateurs de charbon, le prix
international du charbon de chaufferie a l'exportation devrait augmenter
de 1,3 % par an entre 1985 et l'an 2000.
- vi -
EXTRACTO
En este documento se utiliza un modelo de simulaci6n econome-
trica de los mercados mundiales de energia a fin de proyectar la oferta,
la demanda y los precios competitivos del carb6n termico como parte de las
proyecciones globales de balance de energia. Seguin los supuestos de cre-
cimiento econ6mico moderado en los paises con economia de mercado y la
trayectoria de precios para el petr6leo de la OPEP que seguira relativa-
mente estable durante el resto del decenio de 1980, pero se elevara paula-
tinamente en los aiios noventa, se preve que la demanda de las economias de
mercado con respecto al carb6n t6rmico aumentara de 1.247 Mtec (millones
de toneladas de equivalente en carb6n) en 1982 a 1.505 Mtec en 1990 y a
2.020 Mtec en el anio 2000. La proporci6n de carb6n en el consumo total de
energia primaria debera permanecer constante en el periodo de 1982-90,
pero aumentar ligeramente en el decenio de 1990.
Los recientes reveses experimentados por la industria del carb6n
fueron basicamente el resultado de la recesi6n econ6mica. Los- ultimos
datos muestran que la sustituci6n de combustibles de hidrocarburo por car-
b6n t6rmico en la generaci6n de electricidad tuvo lugar regularmente en
los paises industriales, no obstante la disminuci6n de los precios del
petr6leo. Es la continuaci6n de este proceso de sustituci6n lo que pro-
porcionara una de las principales fuentes de aumento de la demanda de car-
b6n termico a plazo mediano. Sin embargo, los resultados de la prueba de
sensibilidad con el modelo indican que los precios del petr6leo tendrin un
- vii -
importante efecto a mediano y largo plazo sobre el grado de sustituci6n y,
por lo tanto, sobre la demanda de carb6n termico. Tambien muestran que
las incertidumbres en cuanto al crecimiento econ6mico, los suministros de
energia nuclear y las elasticidades en funci6n de los precios del combus-
tible seran los elementos criticos que pueden cambiar considerablemente el
futuro del carb6n termico.
Las reservas mundiales de carb6n son mAs que suficientes para
atender la creciente demanda de carb6n termico hasta el anio 2000 y des-
pues. En vista de la estructura basicamente competitiva de la industria
mundial del carb6n, es razonable prever que, a largo plazo, los precios
internacionales no aumentaran mas alla de sus costos de suministro a largo
plazo. Con base en las estimaciones disponibles de la curva de suministro
a largo plazo de los exportadores importantes de carb6n, se preve que el
precio internacional de exportaci6n del carb6n termico aumentara a raz6n
de 1,3% anual entre 1985 y el anio 2000.

- ix -
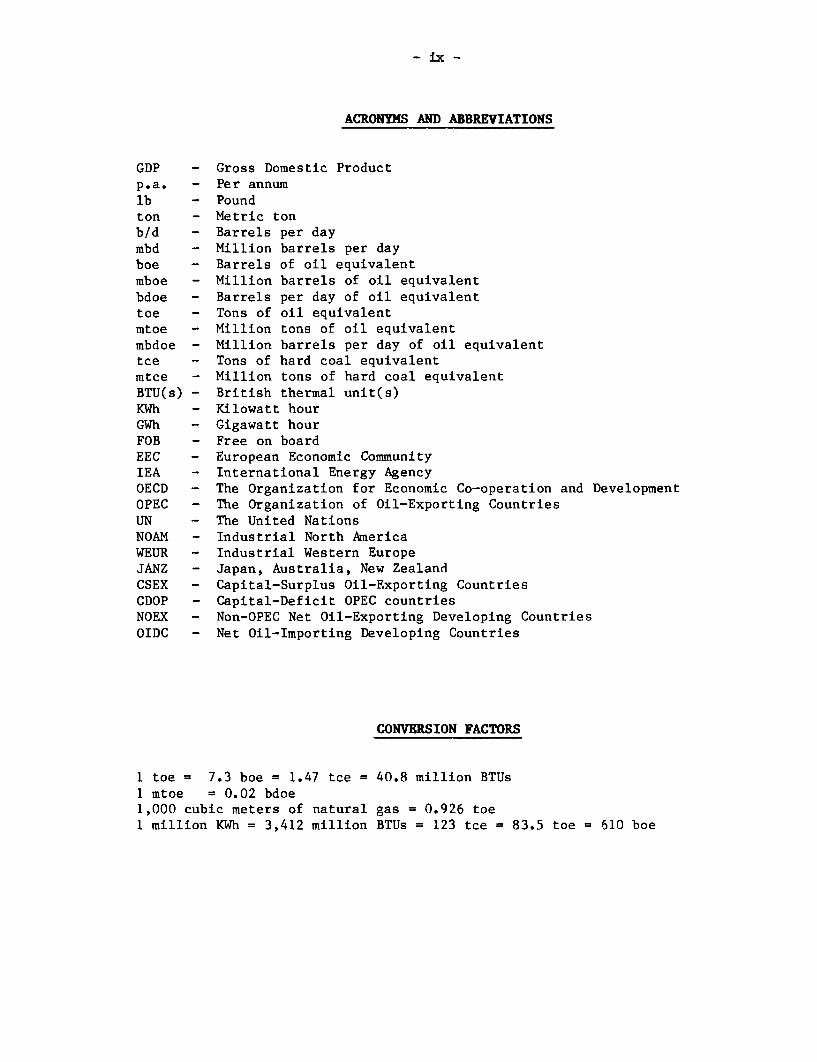
ACRONYMS AND ABBREVIATIONS
GDP - Gross Domestic Productp.a. - Per annumlb - Poundton - Metric tonb/d - Barrels per daymbd - Million barrels per dayboe - Barrels of oil equivalentmboe - Million barrels of oil equivalentbdoe - Barrels per day of oil equivalenttoe - Tons of oil equivalentmtoe - Million tons of oil equivalentmbdoe - Million barrels per day of oil equivalenttce - Tons of hard coal equivalentmtce - Million tons of hard coal equivalentBTU(s) - British thermal unit(s)KWh - Kilowatt hourGWh - Gigawatt hourFOB - Free on boardEEC - European Economic CommunityIEA - International Energy AgencyOECD - The Organization for Economic Co-operation and DevelopmentOPEC - The Organization of Oil-Exporting CountriesUN - The United NationsNOAM - Industrial North AmericaWEUR - Industrial Western EuropeJANZ - Japan, Australia, New ZealandCSEX - Capital-Surplus Oil-Exporting CountriesCDOP - Capital-Deficit OPEC countriesNOEX - Non-OPEC Net Oil-Exporting Developing CountriesOIDC - Net Oil-Importing Developing Countries
CONVERSION FACTORS
1 toe 7.3 boe = 1.47 tce = 40.8 million BTUs1 mtoe = 0.02 bdoe1,000 cubic meters of natural gas = 0.926 toe1 million KWh = 3,412 million BTUs = 123 tce = 83.5 toe = 610 boe
-x -
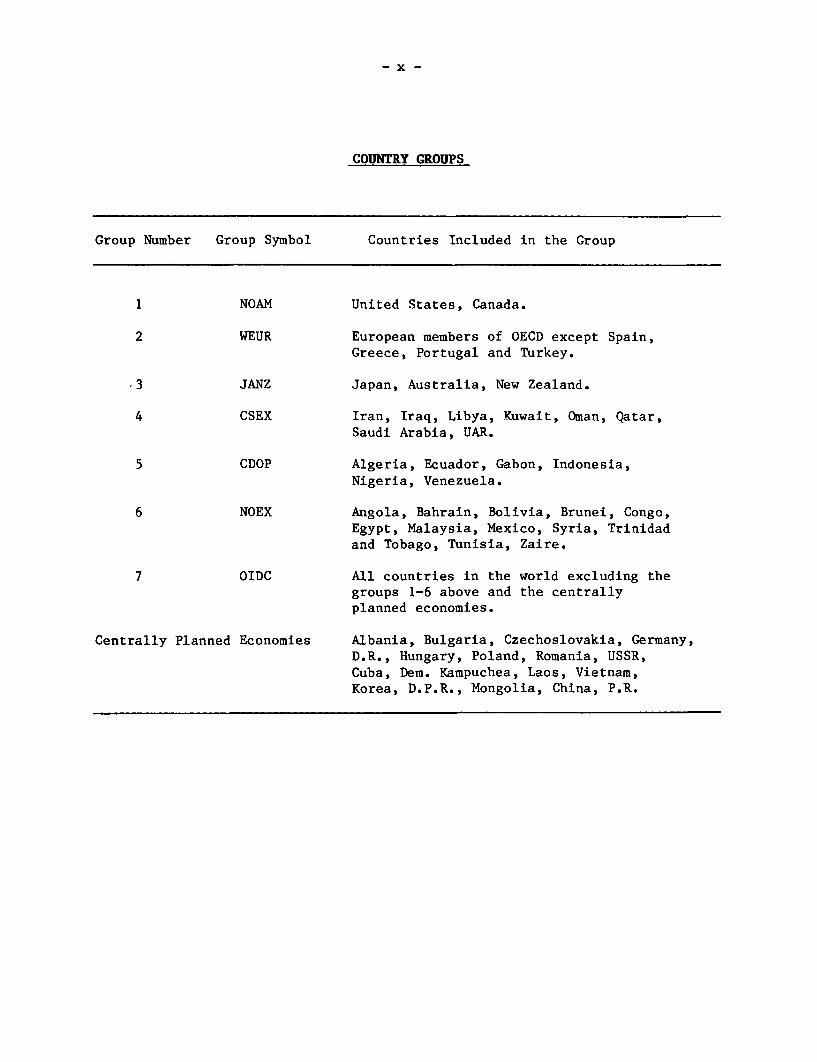
COUNTRY GROUPS
Group Number Group Symbol Countries Included in the Group
1 NOAM United States, Canada.
2 WEUR European members of OECD except Spain,Greece, Portugal and Turkey.
,3 JANZ Japan, Australia, New Zealand.
4 CSEX Iran, Iraq, Libya, Kuwait, Oman, Qatar,Saudi Arabia, UAR.
5 CDOP Algeria, Ecuador, Gabon, Indonesia,Nigeria, Venezuela.
6 NOEX Angola, Bahrain, Bolivia, Brunei, Congo,Egypt, Malaysia, Mexico, Syria, Trinidadand Tobago, Tunisia, Zaire.
7 OIDC All countries in the world excluding thegroups 1-6 above and the centrallyplanned economies.
Centrally Planned Economies Albania, Bulgaria, Czechoslovakia, Germany,D.R., Hungary, Poland, Romania, USSR,Cuba, Dem. Kampuchea, Laos, Vietnam,Korea, D.P.R., Mongolia, China, P.R.
- xi -
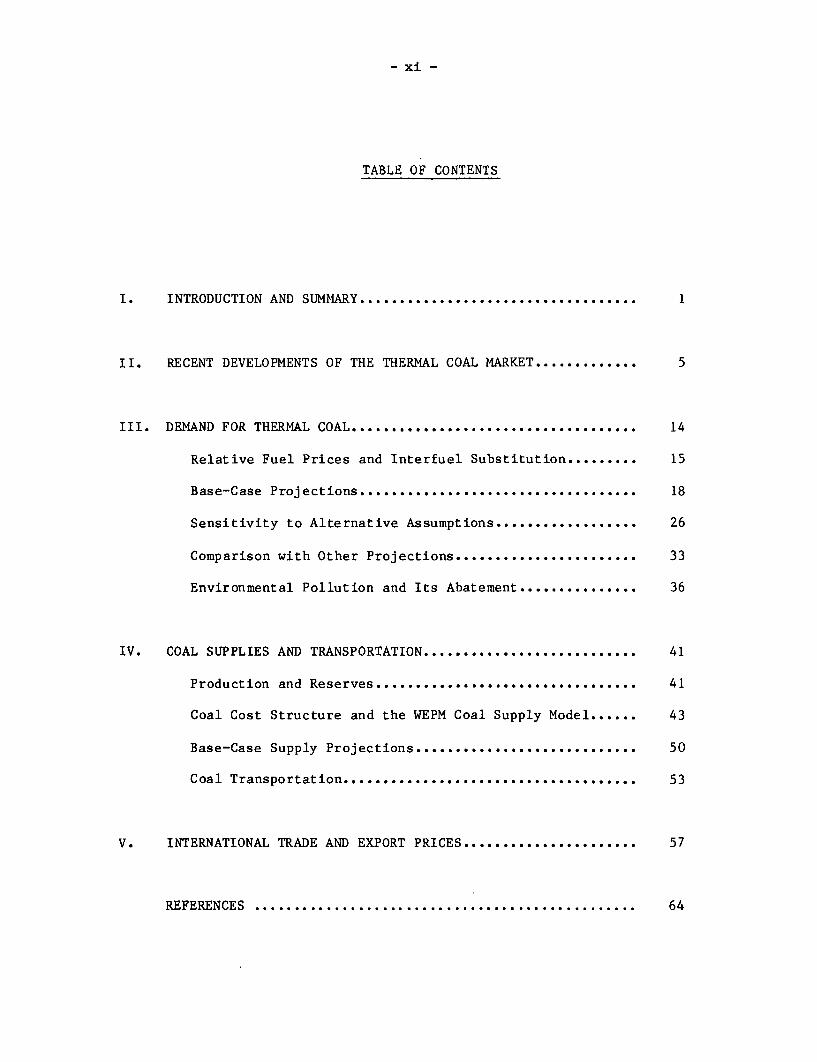
TABLE OF CONTENTS
I. INTRODUCTION AND SUMMARY ................................... 1
II. RECENT DEVELOPMENTS OF THE THERMAL COAL MARKET ............. 5
III. DEMAND FOR THERMAL COAL . ................................... 14
Relative Fuel Prices and Interfuel Substitution ......... 15
Base-Case Projections .. 18
Sensitivity to Alternative Assumptions . . 26
Comparison with Other Projections . . 33
Environmental Pollution and Its Abatement ............... 36
IV. COAL SUPPLIES AND TRANSPORTATION .......................... . 41
Production and Reserves . . . ....... . 41
Coal Cost Structure and the WEPM Coal Supply Model ...... 43
Base-Case Supply Projections ............................ 50
Coal Transportation .. ................................... 53
V. INTERNATIONAL TRADE AND EXPORT PERCE .57
REFERENCES .64
- xii -
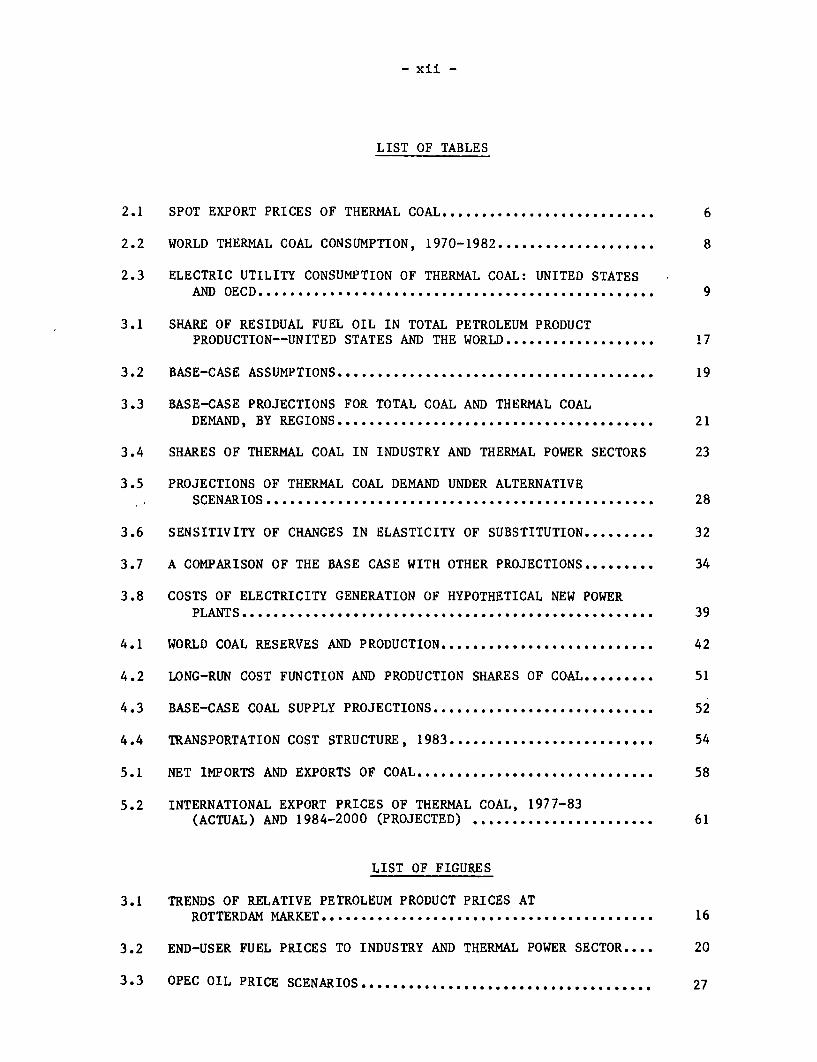
LIST OF TABLES
2.1 SPOT EXPORT PRICES OF THERMAL COAL........................... 6
2.2 WORLD THERMAL COAL CONSUMPTION, 1970-1982.................... 8
2.3 ELECTRIC UTILITY CONSUMPTION OF THERMAL COAL: UNITED STATESAND OECD.................................................. 9
3.1 SHARE OF RESIDUAL FUEL OIL IN TOTAL PETROLEUM PRODUCTPRODUCTION--UNITED STATES AND THE WORLD ................... 17
3.2 BASE-CASE ASSUMPTIONS .................................. .... .. 19
3.3 BASE-CASE PROJECTIONS FOR TOTAL COAL AND THERMAL COALDEMAND, BY REGIONS .. .. .... .. ..... . 21
3.4 SHARES OF THERMAL COAL IN INDUSTRY AND THERMAL POWER SECTORS 23
3.5 PROJECTIONS OF THERMAL COAL DEMAND UNDER ALTERNATIVESCENARIOS ................................................. . ............ 28
3.6 SENSITIVITY OF CHANGES IN ELASTICITY OF SUBSTITUTION ......... 32
3.7 A COMPARISON OF THE BASE CASE WITH OTHER PROJECTIONS ......... 34
3.8 COSTS OF ELECTRICITY GENERATION OF HYPOTHETICAL NEW POWERPLANTS ........... ..................................... ... . .......... 39
4.1 WORLD COAL RESERVES AND PRODUCTION ........................ *.. 42
4.2 LONG-RUN COST FUNCTION AND PRODUCTION SHARES OF COAL ......... 51
4.3 BASE-CASE COAL SUPPLY PROJECTIONS ................... ........... 52
4.4 TRANSPORTATION COST STRUCTURE, 1983 ...... ............... set*. 54
5.1 NET IMPORTS AND EXPORTS OF COAL ......... 58
5.2 INTERNATIONAL EXPORT PRICES OF THERMAL COAL, 1977-83(ACTUAL) AND 1984-2000 (PROJECTED) ....................... 61
LIST OF FIGURES
3.1 TRENDS OF RELATIVE PETROLEUM PRODUCT PRICES ATROTTERDAM MARKET ...... .. ................ ............ . 16
3.2 END-USER FUEL PRICES TO INDUSTRY AND THERMAL POWER SECTOR .... 20
3.3 OPEC OIL PRICE SCENARIOS ...................... ..... . .. ... i 27
1. INTRODUCTION AND SUMMARY
The state of high expectations for thermal coal prices in the wake of
the second oil-price increases in 1979-80 has been followed by a sharp down-
turn in the coal market since late-1982, with severely depressed export
prices, low demand, and excessive production capacities and stocks. However,
recent market conditions do not suggest a fundamental reversal of the trend
towards substitution of thermal coal for petroleum that was set in motion
after the 1973-74 oil-price increases. The setback can be explained for the
most part by such transitory developments as economic recession, excessive
capacity expansion and stock accumulation, and exchange rate adjustments. The
share of coal in thermal electric power generation, the largest market for
thermal coal, steadily increased until the most recent period for which data
are available, indicating that competitiveness of coal vis-a-vis other fuels
largely remained intact.
This paper uses a seven-region econometric simulation model of world
energy markets--known as the World Energy and Petroleum Model (WEPM)--to
project the competitive supply, demand and prices for thermal coal as a part
of overall energy balance projections. Under a set of base-case assumptions
about economic growth and OPEC oil pricing, world demand for thermal coal 1/
is projected to increase from 1,247 mtce in 1982 to 1,520 mtce in 1990 and
2,105 mtce in the year 2000. The demand growth rate is projected to
accelerate from 2.5% p.a. between 1982 and 1990 to 3.3% p.a. in the 1990s.
1/ World is defined as the totality of the market-economy countries. Thermalcoal demand is defined as the demand for coal by all economic sectorsexcept the iron and steel industry.
The projected growth rate of thermal coal demand for the 1982-2000
period is approximately equal to that of total primary energy demand and
slightly falls short of that of electricity demand. Rapid increases in
nuclear and hydro electricity supplies projected for this period substantially
reduce the scope for expansion of thermal electricity generation, restricting
its average annual growth rate to about one percentage point below that of
total electricity demand. However, the share of thermal coal in thermal
electricity generation is projected to increase steadily through continued
substitution of coal for petroleum and natural gas in existing and new power
plants. This is expected to raise the growth rate of thermal coal demand to a
level only slightly below that of total electricity demand. Substitution of
coal for petroleum and natural gas in thermal electricity generation is
expected to be almost completed by the year 2000, when the share of coal is
projected to reach 85% of the market.
It is important to keep in mind that projections of thermal coal
demand will be subject to wide variations, depending upon the particular
assumptions made; these include, among others, assumptions about economic
growth, the price of OPEC oil, demand adjustments to fuel prices, and nuclear
power supplies. Simulations with WEPM suggest that the demand for thermal
coal changes more than proportionately in response to changes in GDP, because
of the relatively high income elasticity of the demand for electricity and the
assumed non-responsiveness of primary electricity supply projections to
changes in GDP. If the primary energy and electricity demands are projected
to increase faster than the base case (because of higher GDP growth or lower
price elasticities of final energy demand), the demand for thermal coal will
be higher than the base case by a greater percentage than that of primary
energy.
-3 -
The simulation results suggest that the prospects for thermal coal
critically depend on the ease with which coal can he substituted for other
fuels. Environmental constraints as well as technological and economic
factors will determine the degree of substitution. The tacit assumption
adopted in this naDer is that even under stringent environmental standards,
and given enough time, coal will he canable of replacing the bulk of petroleum
and natural gas-fired power plants in base-load thermal power generation at
today's relative fuel orices. Tn the industrial sector market, however,
technological and economic factors do not favor coal as much as in thermal
power generation, considerablv restricting coal's Denetration into that
market.
Tf OPEC follows a pricing path somewhat lower than that of the base
case, the long-tern demand for thermal coal could suffer appreciablv. Under
the current market conditions, the cost advantage of thermal coal vis-a-vis
other fuels is not an overwhelming one for a large segment of the market; for
example, Dower generation using imported coal and the industrial boiler
market. Substitution to coal cannot be sustained in these markets if the
price of oil falls below the current level.
An OPEC oil Drice path somewhat higher than that of the base case can
stimulate the growth in the demand for thermal coal, hut the elasticitv of
thermal coal demand with respect to crude oil prices is substantially less
than unity and steadilv declines over time along with increases in crude oil
nrices. This results from the exhaustion of substitution Possibilities in the
long run while higher oil prices damDen the demand growth rates of primarv
energy and electricity.
-4-
A lower growth of nuclear Dower supplies than assumed in the base
case is translated mostly into additional demand for thermal coal,
apDroximately in proportion to the market share of coal in thermal power
generation. For instance, if half of the nuclear power supplies projected for
the year 2000 do not materialize, world thermal coal demand would be 24%
higher than in the base case.
World coal resources are more than adequate to meet the increasing
demand for thermal coal to the vear 2000 and beyond. Currentlv, reserves and
Droduction are heavily concentrated in several cotntries (United States,
Canada, Australia, South Africa, India, Poland, UJSSR, and China), but the
notential exists for several developing countries to become important
produicers and exnorters.
As in the past, the international coal market is exnected to maintain
its hasically competitive structuire. Tn the short term, the international
export price of thermal coal is not likelv to recover substantiallv from its
currentlv deoressed level because of relativelv slow demand growth and
excessively large capacity and stocks at hand. In the long term, the price of
thermal coal will be determined at the level of the long-term marginal cost of
supplving the equilibrium level of demand. Based on the available estimates
of the long-run suDDly curve for the imnortant coal exporters, the inter-
national export price of thermal coal is projected to increase at 1.3% p.a.
between 1985 and the vear 2000. This assumes constant real costs of
transporting coal from mines to ports and 2% D.a. increases in the cost of
mining.
5-
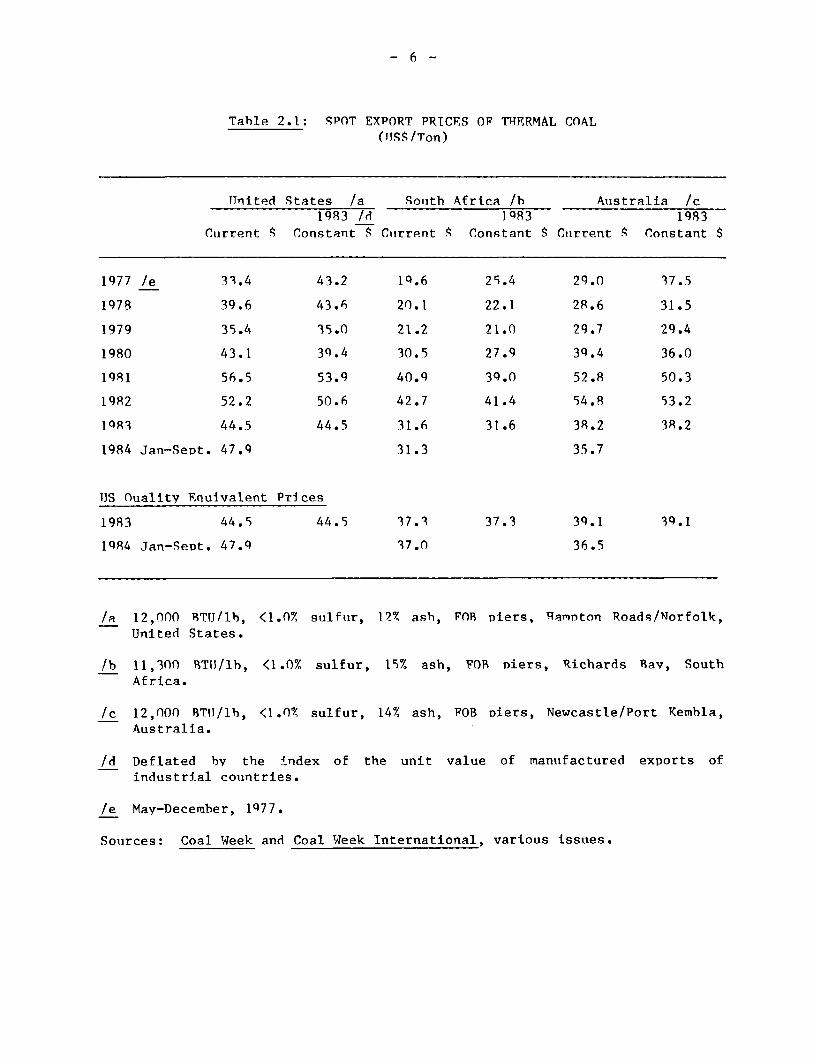
II. RECENT DEVELOPMENTS OF THE THERMAL COAL MARKET
After a period of expectations of high prices for thermal coal in the
wake of the second oil price increases, the international thermal coal market
has been beset by a progressively worsening supply/demand balance and lower
prices. After increasing from $39.6/ton in 1978 to $56.5/ton in 1981 (in
current US dollars), the international export price of thermal coal 1/
declined to $43.5 in early 1984. Table 2.1 shows recent movements in export
prices of thermal coal for the major exporting countries. The severity of the
market downturn is better revealed by the fact that in 1983 US thermal coal
exports suffered a 34% decline below its level in 1982. In addition to the
general market weakness, US exports suffered because of their higher export
prices during this period; South African thermal coal of comparable quality
was available in 1983 for $37.3/ton and Australian thermal coal for $39.1/ton
while US coal was priced at $44.5/ton.
What do these developments portend for the future of thermal coal?
To answer this question, we need an analysis of the factors that led to the
market downturn. The following is a descriptive account of the developments
in the thermal coal market in the 1970s and early 1980s.
1/ Spot export price of thermal coal (12,000 BTU/lb, (1.0% sulfur, 12% ash),FOB piers, Hampton Roads/Norfolk, United States.
- 6 -
Tahle 2.1: SPOT EXPORT PRICES OF THFERMAL COAL(ITSS/Ton)
rTnited States /a Souith Africa /b Australia /c1983 /d 1q83 1983
Cuirrent S Constant S Cutrrent q Constant S Current r Constant $
1977 /e 33.4 43.2 1Q.6 25.4 29.0 37.5
1978 39.6 43.6 20.1 22.1 28.6 31.5
1979 35.4 35.0 21.2 21.0 29.7 29.4
1980 43.1 3(.4 30.5 27.9 39.4 36.0
1981 56.5 53.9 40.9 39.0 52.8 50.3
1982 52.2 50.6 42.7 41.4 54.8 53.2
1Q83 44.5 44.5 31.6 31.6 38.2 38.2
1984 Jan-Sept. 47.9 31.3 35.7
US Ouality Equivalent Prices
1983 44.5 44.5 37.3 37.3 39.1 39.1
1984 Jan-Sept. 47.9 37.0 36.9
/a 12,000 BTIJ/lb, (1.0% sulfur, 12%T ash, FOR Diers, TRamnton Roads/Norfolk,United States.
/b 11,300 BTU/lb, <1.0% sulfur, 15% ash, FOB Diers, Richards Bav, SouthAfrica.
/c 12,n00 BTIT/lb, <1.0%/ sulfur, 14% ash, FOB Diers, Newcastle/Port Kembla,Australia.
/d Deflated by the index of the unit value of mantufactured exports ofindustrial countries.
/e May-December, 1Q77.
Souirces: Coal Week and Coal Week International, various issues.
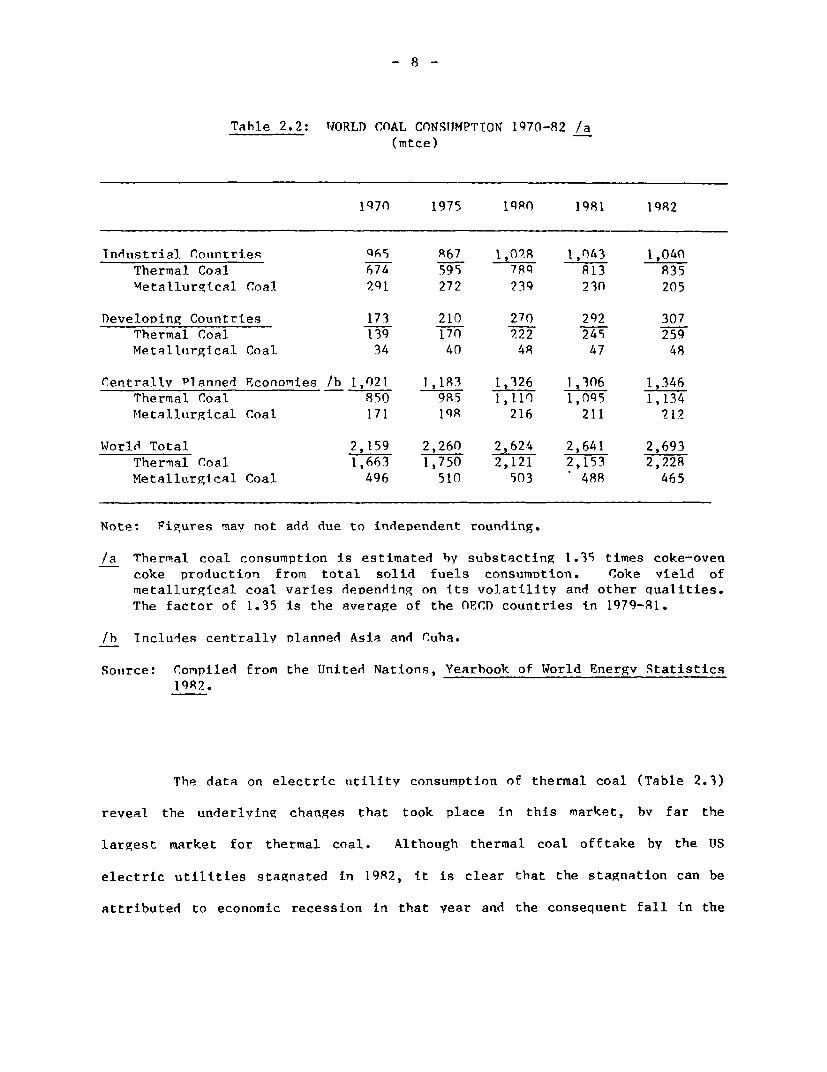
Table 2.2 shows for the period 1970-82 data on world consumption of
thermal coal--defined as solid fuels used for non-coking Durooses. 1/ After
decades of stagnation, world thermal coal consumption 2/ registered a strong
3.5% D .a. growth between 1q75 and 1QR2. The share of thermal coal in world
coal consumDtion increased from 77% in 1975 to R3% in 1982 as a result of
strong growth of thermal coal demand at a time when metallurgicat coal demand
remained weak. The consumption increases were more oronounced in the market-
economv countries than in the centrallv planned economies. In the industrial
countries, thermal coal consumption started to reverse its long-term declining
trend (an exception is North America) only a few years after the first oil
orice increases; significant increases in consumption took place during the
1976-80 economic exoansion, giving rise to a substantial increase in
international trade in thermal coal. Increases in thermal coal consumption
slowed down in 1981 and 1482 as economic recession in the industrial countries
began to take its toll. Increases in thermal coal demand in developing
countries took nlace somewhat later than in industrial countries, hut
continued through 1982.
1/ Published data rarelv show consumotion of thermal coal as a senarateitem. Two different definitions of thermal coal consumption are used inthis paper. The first one used for descriptive purooses in this sectiondefines thermal coal consumption as total solid fuels consumption minuscoal used by coke plants. This definition could produce underestimationof thermal coal consumption because coke plants use a certain blend ofmetallurgical and thermal coals. The second definition used in the nextsection for analytical and projection purposes measures thermal coalconsumption by subtracting from total solid fuels consumption the vortionused bv the iron and steel industrv. This definition will result in over-estimation of thermal coal consumption because some metallurgical coal isconsumed bv other sectors.
2/ World including the centrallv Planned economies.
- 8 -
Tahle 2.2: TqORLD COAL CONSIJMPTI0N 1970-82 /a
(mtce)
1q70 1975 19Ro 1981 1982
Industrial Countries Q65 R67 1,028 1,043 1,040
Thermal Coal 674 595 79Q 813 835
Metallurgical Coal 2Q1 272 239 230 205
Developing Countries 173 210 270 292 307
Thermal Coal 139 170 222 245 259
Metallurgical Coal 34 40 48 47 48
Centrallv Planned Rconomies /b 1,021 1,183 1,326 1,3n6 1,346
Thermal Coal 850 985 1,110 1,095 1,134
Metallturgical Coal 171 19R 216 211 212
World Total 2,159 2,260 2,624 2,641 2,693
Thermal Coal 1,663 1,750 2,121 2,153 2,228
Metallurgical Coal 496 510 503 488 465
Note: Figures may not add due to independent rounding.
/a Thermal coal consumption is estimated by substacting 1.39 times coke-oven
coke production from total solid fuels consumnDtion. Coke vield of
metallurgical coal varies depending on its volatility and other qualities.
The factor of 1.35 is the average of the OECD countries in 1979-81.
/b Includes centrally nlanned Asia and Cuba.
Souirce: Compiled from the United Nations, Yearbook of World Energv Statistics
1982.
The data on electric utility consumption of thermal coal (Table 2.3)
reveal the underlying changes that took place in this market, bv far the
largest market for thermal coal. Although thermal coal offtake by the US
electric utilities stagnated in 1982, it is clear that the stagnation can be
attributed to economic recession in that year and the consequent fall in the
-9-
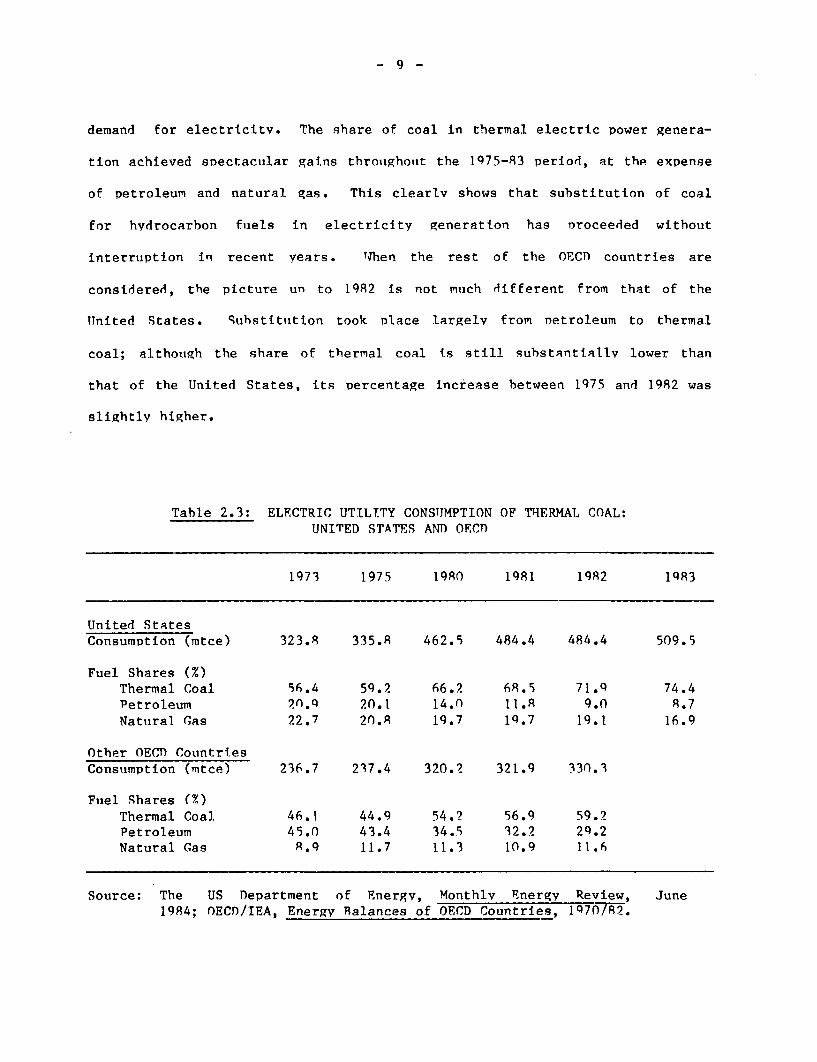
demand for electricitv. The share of coal in thermal electric power genera-
tion achieved spectacular gains throughout the 1975-83 period, at the expense
of petroleum and natural gas. This clearlv shows that substitution of coal
for hydrocarbon f uels in electricity generation has oroceeded without
interruption in recent years. When the rest oF the OEC1 countries are
considered, the picture un to 1982 is not much different from that of the
United States. qubstitution took Dlace largely from netroleum to thermal
coal; although the share of thermal coal is still substantially lower than
that of the United States, its percentage increase between 1975 and 1982 was
slightlv higher.
Table 2.3: ELECTRIC UTILITY CONSTJMPTION OF ThERMAL COAL:UNITED STATES AND OECT
1973 1975 1980 1981 1982 1Q83
United StatesConsumption (mtce) 323.8 335.8 462.5 484.4 484.4 509.5
Fuel Shares (M)Thermal Coal 56.4 59.2 66.2 68.5 71.9 74.4Petroleum 2n.q 20.1 14.0 11.8 9.0 8.7Natura1 Gas 22.7 20.8 19.7 14.7 19.1 16.9
Other OECD CountriesConsumption (mtce) 236.7 237.4 320.2 321.9 330.3
Fuel Shares (x)Thermal Coal 46.1 44.9 54.2 56.9 59.2Petroleum 45.0 43.4 34.5 32.2 29.2Natural Gas 8.9 11.7 11.3 10.9 11.6
Source: The US Department of Energy, Monthlv Energy Review, June1984; OECD/IEA, Energy Balances of OECD Countries, 1q70/82.
- 10 -
The recent slowdown in the demand for thermal coal, therefore, can he
attributed for the most part to economic recession rather than to a deteriora-
tion in economic competitiveness of thermal coal vis-a-vis other fuels. Demand
for thermal electricity fluctuates more than that for total electricity
because operating costs of thermal electricitv production are higher than
those of hvdro and nuclear Dower generation, resulting in lower capacity
utilization rates at times of lower demand. Total electricity production in
the OECD countries declined bv 0.2% in 1982 from its 1QR1 level, hut that of
thermal electricitv was down hv 2.8X. In the Tlnited States, total electricity
generation fell by 2.3% in 1982 and increased hv 3.1T in 19R3 over the preced-
ing years. Thermal electricitv Droduction, however, declined bv 6.3% in 19R2
and increased bv.onlv 2.1% in 1983.
World production of solid fuiels (including metallutrgical coal)
increased steadily from 2.15 billion tce in 1970 to 2.71 billion tce in
1982. 1/ Of the world incremental production between 1970 and 1982, about
51% was accounted for by the People's Reo. of China, 2/ U.S.S.R. and Poland,
and 45% by United States, Canada, South Africa and Australia. Solid fuels
production in OECTl Europe, where a substantial increase in the demand for
thermal coal was partially offset by a decline in the demand for metallurgical
coal, experienced an 18% decline between 1970 and 1978 but there was a 9.7%
increase between lQ78 and 1982. Among develoDing countries other than South
1/ Published data do not show the thermal coal component of this total. One
can safelv assumte, however, that world total oroduiction of thermal coal
would aDoroximately be the same as world thermal coal consumption shown in
Table 2.2.
2! The People's Republic of China alone accounted for 37% of the world
incremental production during the period.
- 11 -
Africa, India had the most imPressive increase in production, from 54 mtce in
1970 to 94 mtce in 1982. Moderate increases were recorded in several Latin
American countries (Colombia, Brazil and Mexico), Republic of Korea, Turkey,
and Yugoslavia.
Between 1975 and 1982 when world thermal coal demand sharply
increased, world coal imports and exports increased at 5.2% p.a. and 4.7%
p.a., respectivelv. Three countries--the UJnited States, Australia and South
Africa--virtually monoDolized the increment of world exports during this
period as well as the declines in exports from other countries. The
incremental exports were shared almost equallv between the three countries.
In 1983, however, Australia and South Africa were able to capture a larger
share of the export market at the expense of the IJnited States, by virtue of
their lower export prices than those of the United States. The appreciation
of the US dollar vis-a-vis the currencies of these countries partly
contributed to this shift. Sharp increases in production in the centrally
planned economies, particularly in the People's Republic of China, were mostly
for domestic consumption, implying little changes in the net trade of this
group. Production increases in developing countries other than South Africa
were also used primarily for domestic consumption.
On the imoort side, increases were most pronounced in OECn Europe,
Japan and a few developing countries such as Turkev, Republic of Korea, and
Brazil. Net imports of coal in OECD Europe and JaDan increased from 123.8
mtce in 1975 to 165.2 mtce in 1980, to 170.2 mtce in 1981, and to 173.2 mtce
in 1982. Of the 1981 net imports, 67 mtce were net imports of thermal coal,
- 12 -
or 39.4% of total net imports of coal. 1/ In 1982, OECD Europe and Japan
accounted for 69% of world gross imports of coal. Between 1978 and 1982, net
imports plus production in OECD Europe and Japan increased by 20% while
consumption increased by 14%. This meant an accumulation of stocks,
particularly in OECD EuroDe where net additions to stocks amounted to 57 mtce
in the three year Deriod, 1980-82. The lack of significant increases in
production or imPorts in the majority of developing countries is indicative of
the poor state of progress in substituting coal for hydrocarbon fuels.
The behavior of imports and stocks in the wake of the 1979-80 oil
price shock explains a good part of the fluctuation of thermal coal export
prices shown in Table 2.1. The second round of petroleum nrice increases
provided a strong incentive to substitute coal for oetroleum in power
generation and industrial sector consumption. This led to a rush on the part
of the importers to secure enough supplies for short-term needs that have
suddenly increased and to line up long-term sources of supplies for
substantiallv expanded future thermal power programs. This rush is
understandable because the cost of failing to obtain sufficient and secure
sources of coal supplv is high. The result was a large increase in imports
and in accumulations of stocks. The subsequent economic recession, which
dragged on longer than anticipated, worsened the situation. This behavior
probably resulted in increases in thermal coal export prices during 1979-81
beyond normal supply/demand eciuilibrium, and sustained orices at the high
level until the latter part of 1982. Conversely, the 1983 crash in thermal
coal prices would have been less severe had the stock levels not been so high.
1/ IEA/OECD, Coal Information Report, Paris, 1983, Part II tables.

- 13 -
In brief, the recent developments of the thermal coal market can be
explained for the most part in terms of short-term overshooting phenomenon
which is typical of markets characterized by low, short-term price
elasticities of demand and supply.
- 14 -
III. DEMAND FOR THERMAL COAL
Until the first oil price shock of 1973/74 the coal industry was a
declining industry, largely because of the availability of cheap petroleum.
The petroleum price increases in the 1970s, however, brought on a reversal of
this trend. The extent to which this new trend will continue will depend for
the most Dart on the price of coal relative to that of petroleum and other
fuels. Apart from the economic competitiveness of coal, its future will also
be affected by economic growth, environmental regulations, and government
policies affecting nuclear/hydro electric power supplies and synthetic fuels
from coal.
In this section we will look at the demand prospects for thermal
coal, primarily on the basis of the economic competitiveness of coal burning
in relation to the use of other fuels. This analysis is carried out by means
of the World Energy and Petroleum Model (WEPM) that features three final
energy consumotion sectors and one energy transformation sector (thermal
electricity generation). Since the details of the model are described else-
where, 1/ discussion here will be limited to those features of the model that
have an important bearing upon the prospects for thermal coal. Implications
of the uncertainties surrounding future economic growth, nuclear/hydro
supplies and petroleum prices for the demand for thermal coal will be
investigated through sensitivity analysis. The section ends with a discussion
of environmental issues associated with coal burning.
1/ B.J. Choe, "A Model of World Energy Markets and OPEC Pricing," World BankStaff Working Papers, No. 633, March 1984.
- 15 -
Relative Fuel Prices and Interfuel Substitution
Economic growth, the price of OPEC crude oil, poDulation growth, non-
OPEC supplies of hydrocarbon fuels and supplies of nuclear/hydro electricity
and svnthetic fuels are exogenous to WEPM. On the hasis of these assumptions,
the model generates energy balance projections for the seven world regions.
The market shares of the various fuels are determined by a translog cost share
model of interfuel substitution, under the assumption of competitive cost
minimization in the industrial, residential/commercial and thermal power
sectors; for rail/barge transportation, fixed fuel shares of the recent past
are used.
An important assumption for interfuel substitution between petroleum
and coal in the model is the way petroleum prodtuct prices, particularly the
price of heavy fuel oil, are determined. The model assumes that the ex-
refinery Drice differentials between petroleum products will remain constant
at their 1976-78 average levels for each region. This assumption may result
in an overestimation of the demand for thermal coal if the price of heavy fuel
oil fails to increase as fast as those of other petroleum products because of
its direct competition with low-cost thermal coal.
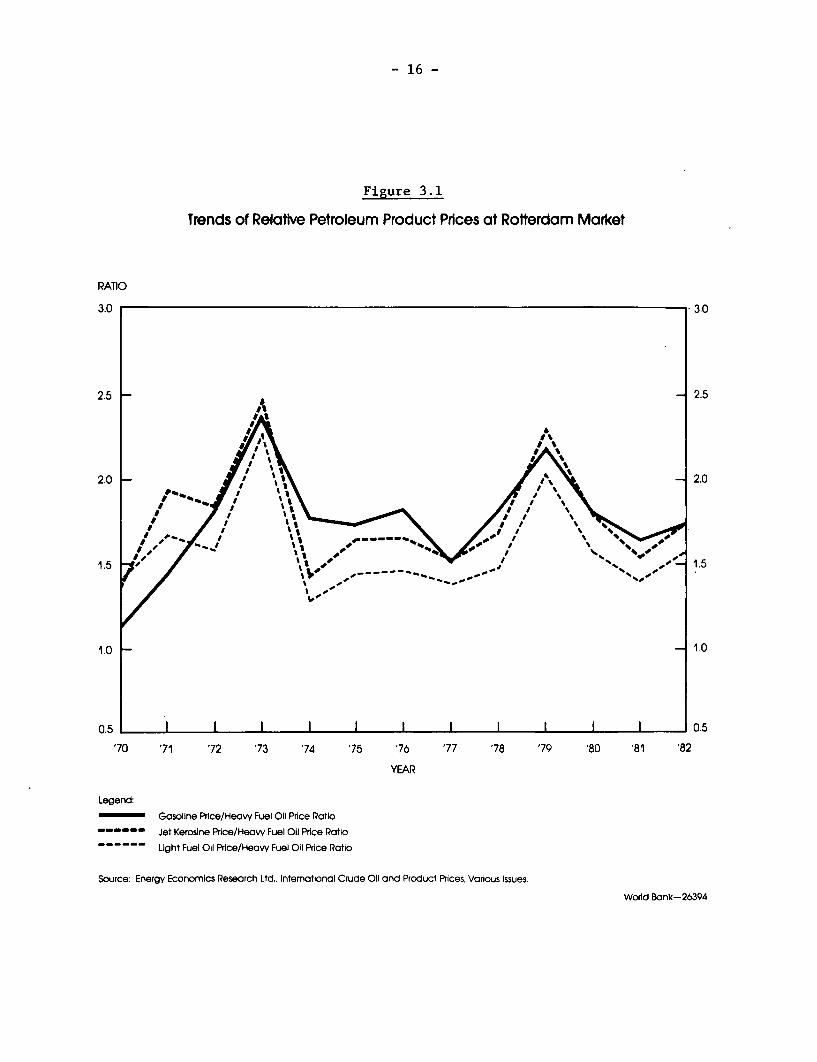
Past experience, however, shows that the assumption of fixed
petroleum product price differentials may not be an unrealistic one. Figure
3.1 plots the ratios of the prices of regular motor gasoline, Jet kerosine and
light fuel oil to the price of low-sulfur heaw fuel oil at the Rotterdam
international product market. No clear long-term trend can be detected in any
of these ratios over the 1970-82 period. It can he seen that the prices of
gasoline, let fuel and light fuel oil increased more than that of heavy fuel
oil during the periods of severe market disruption (1973-74 and 1979-80) but
the price ratios were eventually restored to the long-term average levels.
- 16 -
Figure 3. 1
Trends of Relative Petroleum Product Prices at Rotterdam Market
RATIO
3.0 3.0
2.5 2.5
'727 7 73 '4 '5 '6 7 7 7 0 2'8 '8
I~~~~~~~~~~~~~~I. %I~~~~~~~~~~~~~~~~~~~~~
YEAR
*~~~~~~~~~~~~~~~~~~~~~
2.0 ' 2.0
Legend:
Gasoline Prce/Heavy Fuel Oil Price Ratio
- - -- - Jet Kerosine Price/Heavy Fuel Oil Prce Ratio
- - -- - Light Fuel Oil Price/Heavy Fuel Oil Price Ratio
Source: Energy Economics Research Ltd., Intemnational Crude Oil and Product Prices, Various Issues.
World Bank-26394
- 17 -
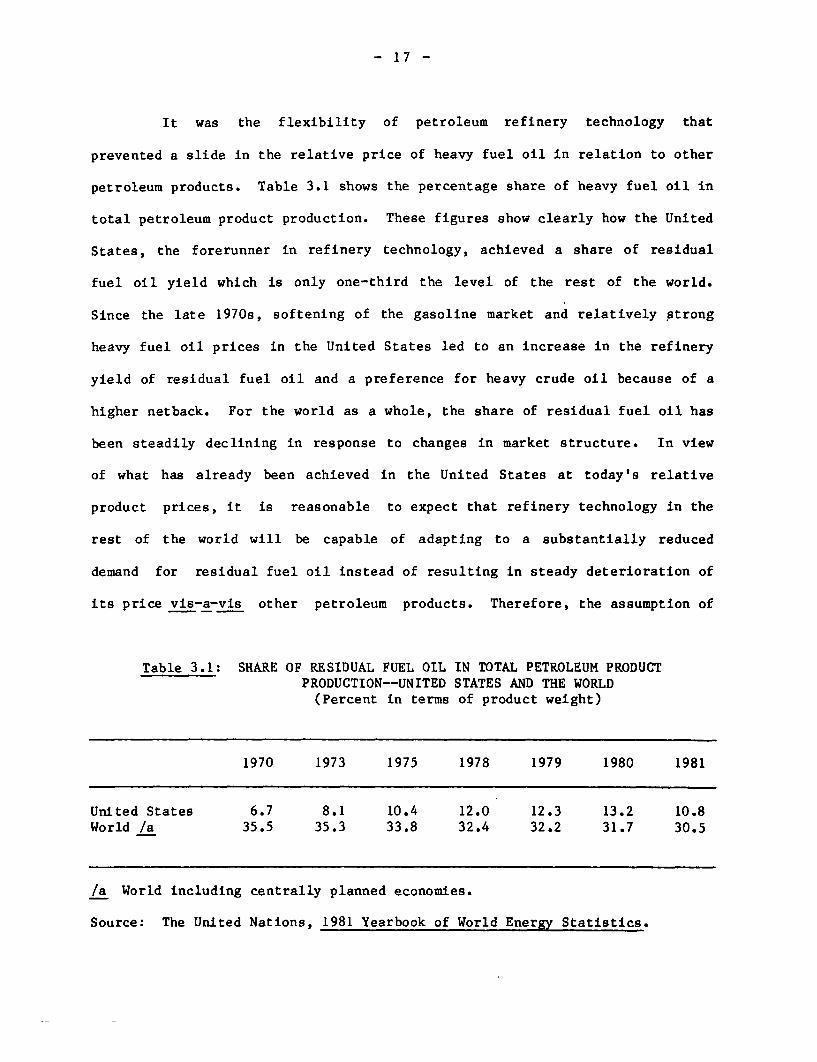
It was the flexibility of petroleum refinery technology that
prevented a slide in the relative price of heavy fuel oil in relation to other
petroleum products. Table 3.1 shows the percentage share of heavy fuel oil in
total petroleum product production. These figures show clearly how the United
States, the forerunner in refinery technology, achieved a share of residual
fuel oil yield which is only one-third the level of the rest of the world.
Since the late 1970s, softening of the gasoline market and relatively strong
heavy fuel oil prices in the United States led to an increase in the refinery
yield of residual fuel oil and a preference for heavy crude oil because of a
higher netback. For the world as a whole, the share of residual fuel oil has
been steadily declining in response to changes in market structure. In view
of what has already been achieved in the United States at today's relative
product prices, it is reasonable to expect that refinery technology in the
rest of the world will be capable of adapting to a substantially reduced
demand for residual fuel oil instead of resulting in steady deterioration of
its price vis-a-vis other petroleum products. Therefore, the assumption of
Table 3.1: SHARE OF RESIDUAL FUEL OIL IN TOTAL PETROLEUM PRODUCTPRODUCTION--UNITED STATES AND THE WORLD(Percent in terms of product weight)
1970 1973 1975 1978 1979 1980 1981
United States 6.7 8.1 10.4 12.0 12.3 13.2 10.8World /a 35.5 35.3 33.8 32.4 32.2 31.7 30.5
/a World including centrally planned economies.
Source: The United Nations, 1981 Yearbook of World Energy Statistics.
- 18 -
fixed price differentials between petroleum products is not considered an
unrealistic one.
Interfuel substitution responses also depend on the choice of own-
and cross-price elasticities as well as on changes in relative fuel prices.
In the translog cost share model of interfuel substitution, however, the
substitution elasticities are determined largely by the fuel shares rather
than by the coefficients of the relative fuel price variables. For this
reason, the choice of the coefficients has a relatively minor imDact on the
results. The coefficients in WEPM, chosen on the basis of recent studies of
industrial countries, are assumed to he the same for all seven regions of the
model. This may appear to ignore the interregional differences in substitution
characteristics, but a large Dart of the differences has to do with the
differences in fuel shares, which are reflected in the form of interregional
differences in interfuel substitution elasticities.
Base-Case Projections
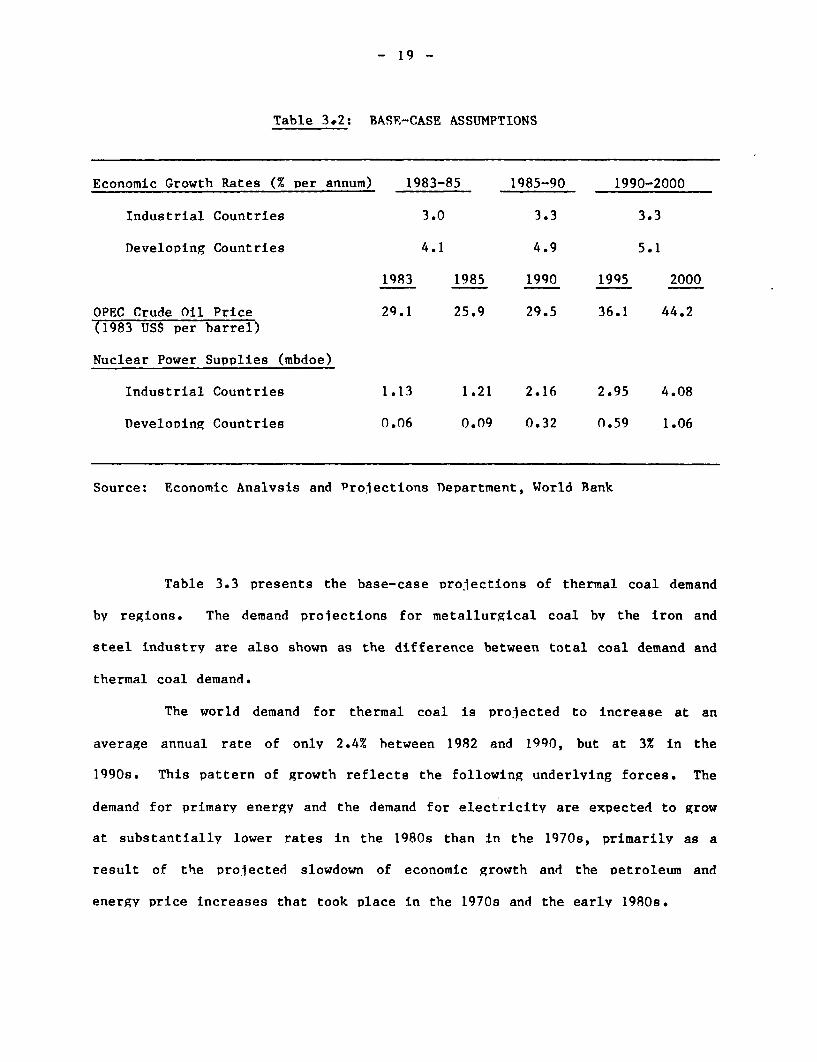
To serve as a reference point, let us start with the base-case
projections for thermal coal demand, which were made under the set of
asSumDtions summarized in Table 3.2. The demand for thermal coal here is
defined as solid fuels consumption by sectors other than the iron and steel
industry. Although this will overstate the demand for thermal coal, it
greatly simplifies demand analvsis and projection. The base case assumes
moderate economic growth rates for the industrial and developing countries and
a price path for OPEC oil that remains at relatively low levels for the
rest of the 1980s, but increases at about 47 p.a. in the 1940s (Table 3.2).
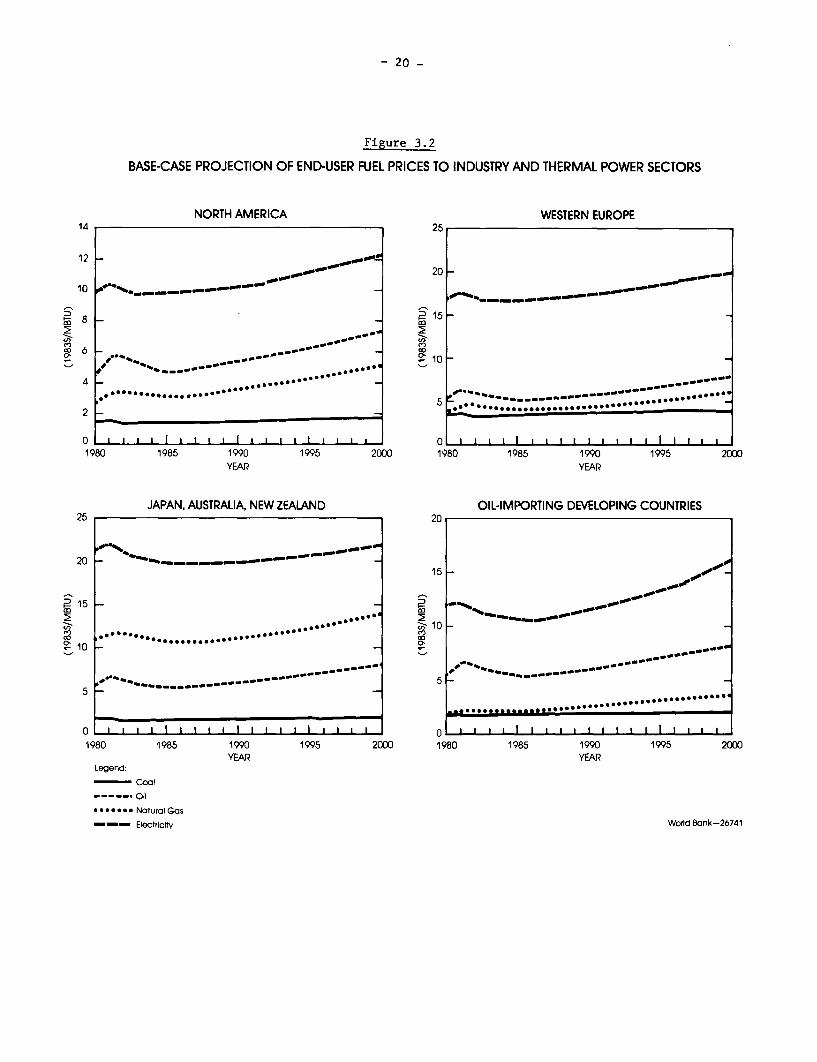
The end-user prices of various fuels to the industrial and thermal power
sectors underlying the base-case projections are shown in Figure 3.2.
- 19 -
Table 3.2: BASE-CASE ASSUMPTIONS
Economic Growth Rates (% per annum) 1983-85 1985-90 1990-2000
Industrial Countries 3.0 3.3 3.3
Developing Countries 4.1 4.9 5.1
1983 1985 1990 1995 2000
OPEC Crude Oil Price 29.1 25.9 29.5 36.1 44.2(1983 USS per barrel)
Nuclear Power Supplies (mbdoe)
Industrial Countries 1.13 1.21 2.16 2.95 4.08
Developing Countries 0.06 0.09 0.32 0.59 1.06
Source: Economic Analvsis and Projections Department, World Bank
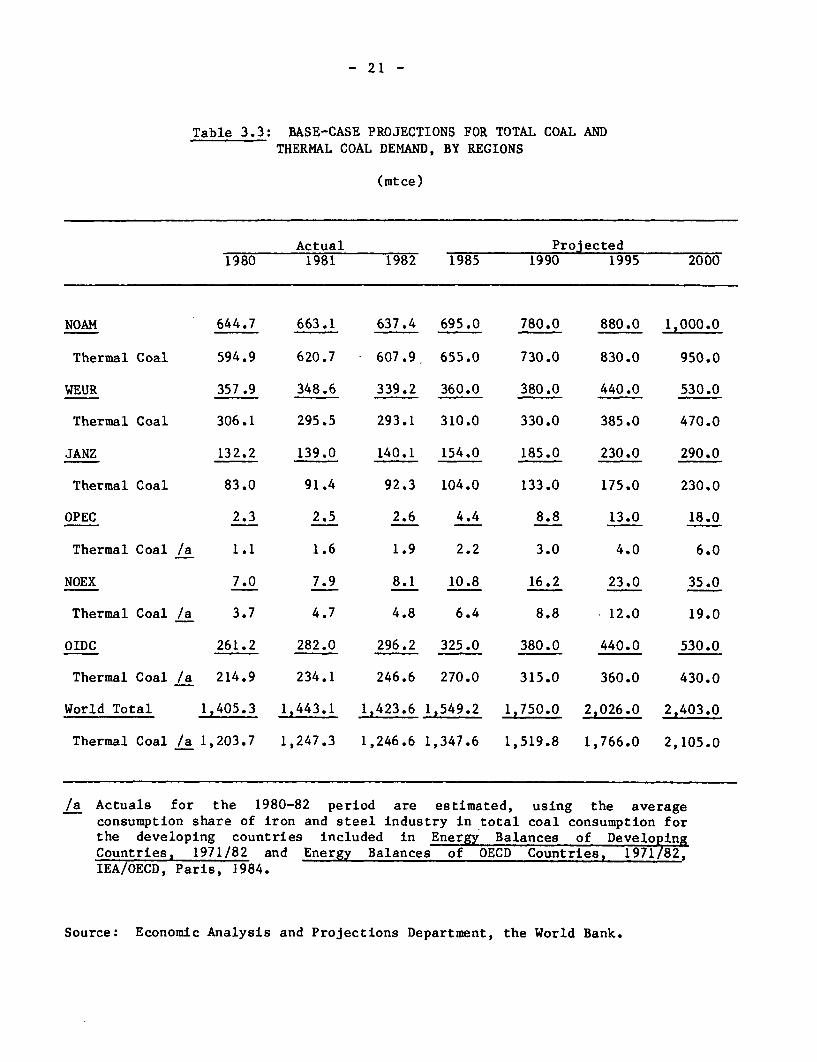
Table 3.3 presents the base-case Drojections of thermal coal demand
by regions. The demand prolections for metallurgical coal by the iron and
steel industry are also shown as the difference between total coal demand and
thermal coal demand.
The world demand for thermal coal is projected to increase at an
average annual rate of only 2.4% hetween 1982 and 1990, but at 3% in the
1990s. This pattern of growth reflects the following underlving forces. The
demand for primary energy and the demand for electricity are expected to grow
at substantially lower rates in the 1980s than in the 1970s, primarily as a
result of the projected slowdown of economic growth and the oetroleum and
energy price increases that took place in the 1970s and the early 1980s.
- 20 -
Figure 3.2
BASE-CASE PROJECTION OF END-USER FUEL PRICES TO INDUSTRY AND THERMAL POWER SECTORS
NORTH AMERICA WESTERN EUROPE
1220 --
m 8 _ _ j2 15 -
00 6~~~~~~~~~~~~~~~~~~~~~0
4- ... 0
S s ~~~~~~~~~~~~~~~~~5
2 _
0 ,,,,It I,,,,I, . o0 II,,,,1980 1985 1990 1995 2000 1980 1985 1990 1995 2000
YEAR YEAR
JAPAN, AUSTRALIA, NEW ZEALAND OIL-IMPORTING DEVELOPING COUNTRIES25 20
20 - go15
RY15 -
-Cool~~~~~~~~~~~~~~~~~~~~~c* f * * * * * Naturczl Gos ~ ~ ~ .. * ,. .
--------------------------- ........... ......
0 I 1 1 1 1 1 1 i0 il I i i ,ii
1980 1985 1990 1995 2000 1980 1985 1990 1995 2000YEAR YEAR
Legend:
-CCoal- - .- Oil
-*****. Natural Gas
--- Electricity World Bank-26741
- 21 -
Table 3.3: BASE-CASE PROJECTIONS FOR TOTAL COAL ANDTHERMAL COAL DEMAND, BY REGIONS
(mtce)
Actual Projected1980 1981 1982 1985 1990 1995 2000
NOAM 644.7 663.1 637.4 695.0 780.0 880.0 1,000.0
Thermal Coal 594.9 620.7 607.9. 655.0 730.0 830.0 950.0
WEUR 357.9 348.6 339.2 360.0 380.0 440.0 530.0
Thermal Coal 306.1 295.5 293.1 310.0 330.0 385.0 470.0
JANZ 132.2 139.0 140.1 154.0 185.0 230.0 290.0
Thermal Coal 83.0 91.4 92.3 104.0 133.0 175.0 230.0
OPEC 2.3 2.5 2.6 4.4 8.8 13.0 18.0
Thermal Coal /a 1.1 1.6 1.9 2.2 3.0 4.0 6.0
NOEX 7.0 7.9 8.1 10.8 16.2 23.0 35.0
Thermal Coal /a 3.7 4.7 4.8 6.4 8.8 12.0 19.0
OIDC 261.2 282.0 296.2 325.0 380.0 440.0 530.0
Thermal Coal /a 214.9 234.1 246.6 270.0 315.0 360.0 430.0
World Total 1,405.3 1,443.1 1,423.6 1,549.2 1,750.0 2,026.0 2,403.0
Thermal Coal /a 1,203.7 1,247.3 1,246.6 1,347.6 1,519.8 1,766.0 2,105.0
/a Actuals for the 1980-82 period are estimated, using the averageconsumption share of iron and steel industry in total coal consumption forthe developing countries included in Energy Balances of DevelopingCountries, 1971/82 and Energy Balances of OECD Countries, 1971/82,IEA/OECD, Paris, 1984.
Source: Economic Analysis and Projections Department, the World Bank.
- 22 -
World consumption of primary energy is projected to increase at 2.5% p.a.
between 1982 and 1990, and total electricity consumption at 2.8% p.a..
However, given the projected increase at 4.6% p.a. in primary electricity
supplies (mostly nuclear power) over the same period, there is little room
left for expansion of thermal electric power generation (projected to increase
only at 1.5% p.a. for the period). Despite the setback suffered by the
nuclear power industry, the nuclear power plants already under construc-
tion will substantially increase the medium-term supply capacity of nuclear
power.
For the period up to 1990, therefore, the main source of the base-
case projected increases in the demand for thermal coal is the substitution of
coal for petroleum and natural gas in industry and thermal power generation.
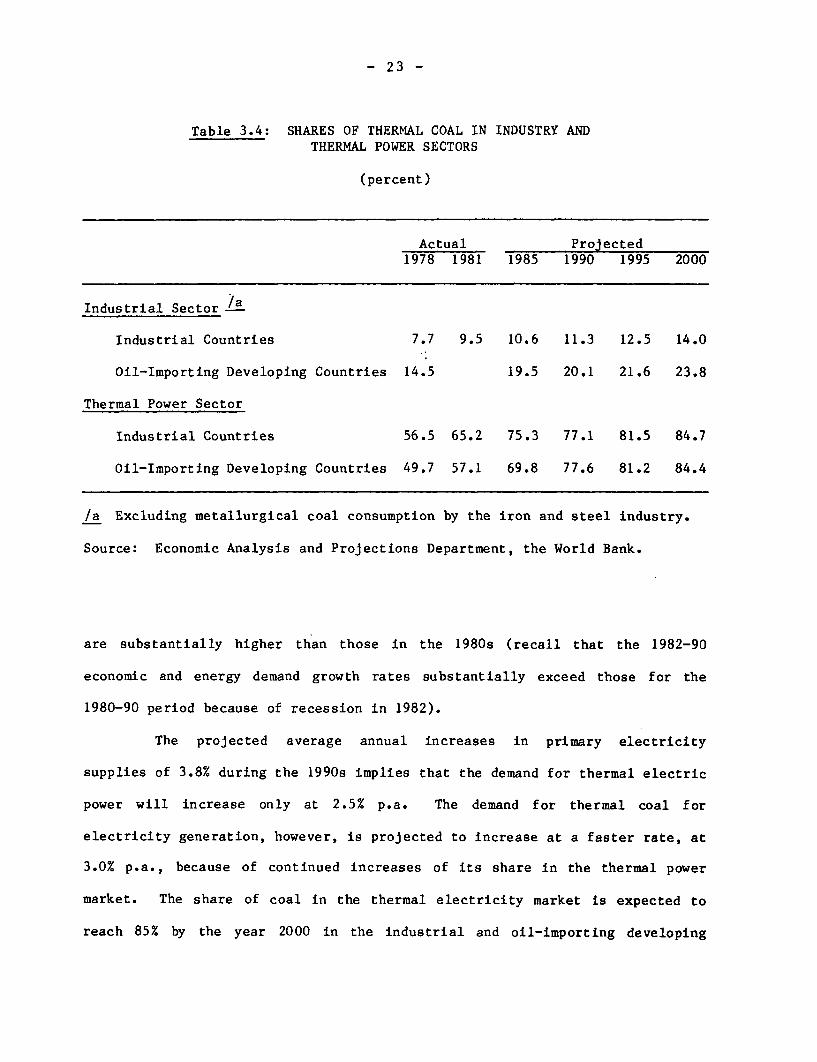
Table 3.4 shows that the share of coal is projected to increase steadily
throughout the projection period. Recall that the share had reached 68% in
1982 in OECD as a whole and 74% in the United States in 1983; the rate of
increase in this share is projected to decelerate during 1985-90 partly
because of the weakness of petroleum prices assumed for this period.
The 1990s present a somewhat different picture. The world demand for
thermal coal is projected to increase at a faster rate than in the 1980s, on
account of the projected increases in world primary energy demand (2.9% p.a.)
and world electricity demand (3.2% p.a.). The impact on energy demand of the
dramatic petroleum price increases of the past should by and large have
dissipated by 1990 and the moderate increases of petroleum prices assumed for
the 1990s are expected to only mildly dampen the growth rate of energy demand.
Steady growth in the world economy projected for the 1990s are expected to
result in growth rates of the dcmand for primary energy and electricity that
- 23 -
Table 3.4: SHARES OF THERMAL COAL IN INDUSTRY ANDTHERMAL POWER SECTORS
(percent)
Actual Projected1978 1981 1985 1990 1995 2000
Industrial Sector /a
Industrial Countries 7.7 9.5 10.6 11.3 12.5 14.0
Oil-Importing Developing Countries 14.5 19.5 20.1 21.6 23.8
Thermal Power Sector
Industrial Countries 56.5 65.2 75.3 77.1 81.5 84.7
Oil-Importing Developing Countries 49.7 57.1 69.8 77.6 81.2 84.4
/a Excluding metallurgical coal consumption by the iron and steel industry.
Source: Economic Analysis and Projections Department, the World Bank.
are substantially higher than those in the 1980s (recall that the 1982-90
economic and energy demand growth rates substantially exceed those for the
1980-90 period because of recession in 1982).
The projected average annual increases in primary electricity
supplies of 3.8% during the 1990s implies that the demand for thermal electric
power will increase only at 2.5% p.a. The demand for thermal coal for
electricity generation, however, is projected to increase at a faster rate, at
3.0% p.a., because of continued increases of its share in the thermal power
market. The share of coal in the thermal electricity market is expected to
reach 85% by the year 2000 in the industrial and oil-importing developing
- 24 -
countries. This share is Drobablv close to the maximum in view of the
requirement for veak-load power generation. In other words, under the
relative fuel prices assumed for the base case, substitution to coal in the
thermal power sector is expected to be completed for the most part by the year
2000.
The world industrial sector (excluding the iron and steel industry)
demand for thermal coal is expected to increase at 3.2% p.a. between 1982 and
the year 2000, while the world industrial sector final energy demand is
Projected to increase at 2.3% p.a. This imDlies a substantial increase in the
share of thermal coal in world industrial energy consumption--approximately
doubling between 1978 and the year 200n (Table 3.4). Although this is a
significant increase, the level of coal's projected share indicates that it is
not likely to play a prominent role even in the long run in meeting industrial
energy needs.
The ease of substitutability hetween coal and other fuels varies
widelv between industries. The cement and brick-making industries have been
recognized as ones in which there is a high degree of substitutability. A
substantial part of the potential conversions to coal in these industries have
alreadv been realized and the remainder are expected to follow in the near
future. The total potential demand for thermal coal by these industries,
however, is relatively small; the total in OECD countries is estimated at only
about 50 mtce by the year 2000.
In OECD countries in 1977, about 80% of the industrial consumption of
thermal coal was used as a boiler fuel by a variety of industries and the
- 25 -
remaining 20% as a non-boiler fuel by the cement and other industries. 1/
Since the hulk of industrial boilers still relv on hydrocarbon fuels, it would
seem that this sector presents a great potential market for thermal coal. How-
ever, the economic advantages of thermal coal as an industrial boiler fuel are
not as great as in the case of coal-fired thermal power generation because of:
(a) the relativelv small size of industrial boilers, (b) the low capacitv
utilization rate or load factor (20-35%), (c) industrial location, which is
mostly dictated by factors other than the availabilitv of coal, and (d) large
infrastructure investments for conversions to coal.
The base-case projections here assume that thermal coal will capture
about 30% of the industrial boiler fuel market by the year 2000 in the
industrial countries, up from the current market share of 15%. One studv has
suggested that this share could be in the range of 40-75% bv the year
2000. 2/ The low end of this range corresponds to the case where conversion
to coal is carried out bv the private sector on the basis of market prices,
while the high end postulates heavy government intervention and subsidization.
Since our base-case projections do not assume anv government intervention in
this regard, the proper comDarison would he with the low end of this range.
However, Ezra does not appear to have taken full account of the costs
mentioned above, particularly the costs of infrastructure.
1/ OECD/IEA, The Use of Coal in Industry, May 1982, Paris, p. 59.
2/ Derek Ezra, "The Use of Coal in Industrial Boilers," in The Ilse of Coal inIndustrv, op. cit., Dp. 257-315.
- 26 -
Sensitivity to Alternative Assumptions
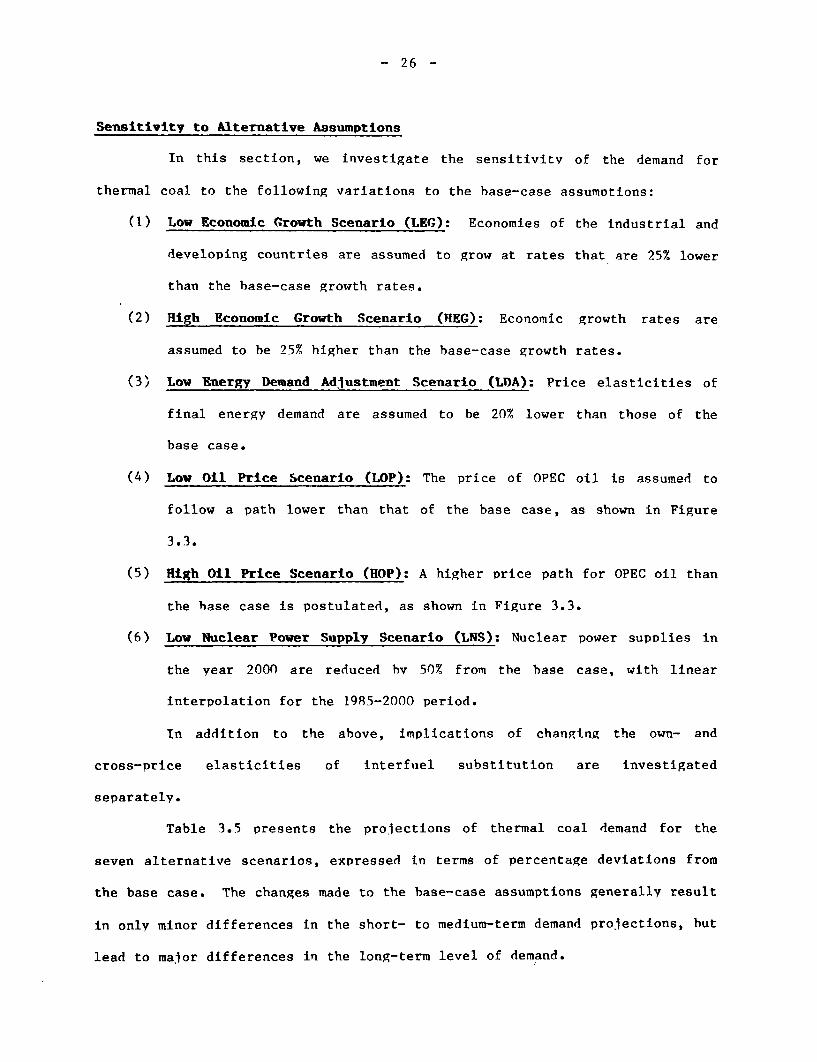
In this section, we investigate the sensitivitv of the demand for
thermal coal to the following variations to the base-case assumotions:
(1) Low Economic Growth Scenario (LEG): Economies of the industrial and
developing countries are assumed to grow at rates that are 25% lower
than the base-case growth rates.
(2) High Economic Growth Scenario (REG): Economic growth rates are
assumed to be 25% higher than the base-case growth rates.
(3) Low Energy Demand Adjustment Scenario (LDA): Price elasticities of
final energy demand are assumed to be 20% lower than those of the
base case.
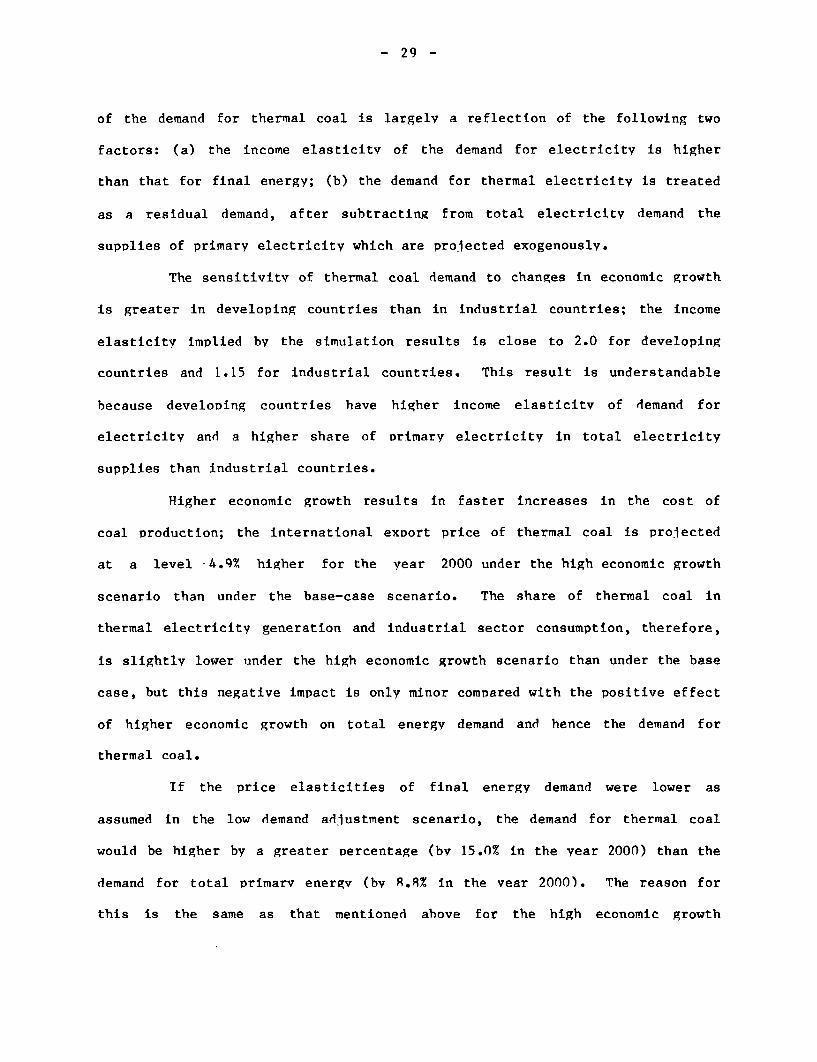
(4) Low Oil Price Scenario (LOP): The price of OPEC oil is assumed to
follow a path lower than that of the base case, as shown in Figure
3.3.
(5) High Oil Price Scenario (HOP): A higher price path for OPEC oil than
the base case is postulated, as shown in Figure 3.3.
(6) Low Nuclear Power Supply Scenario (LNS): Nuclear power supplies in
the year 2000 are reduced hv 50% from the base case, with linear
interpolation for the 1985-2000 period.
En addition to the above, implications of changing the own- and
cross-price elasticities of interfuel substitution are investigated
separately.
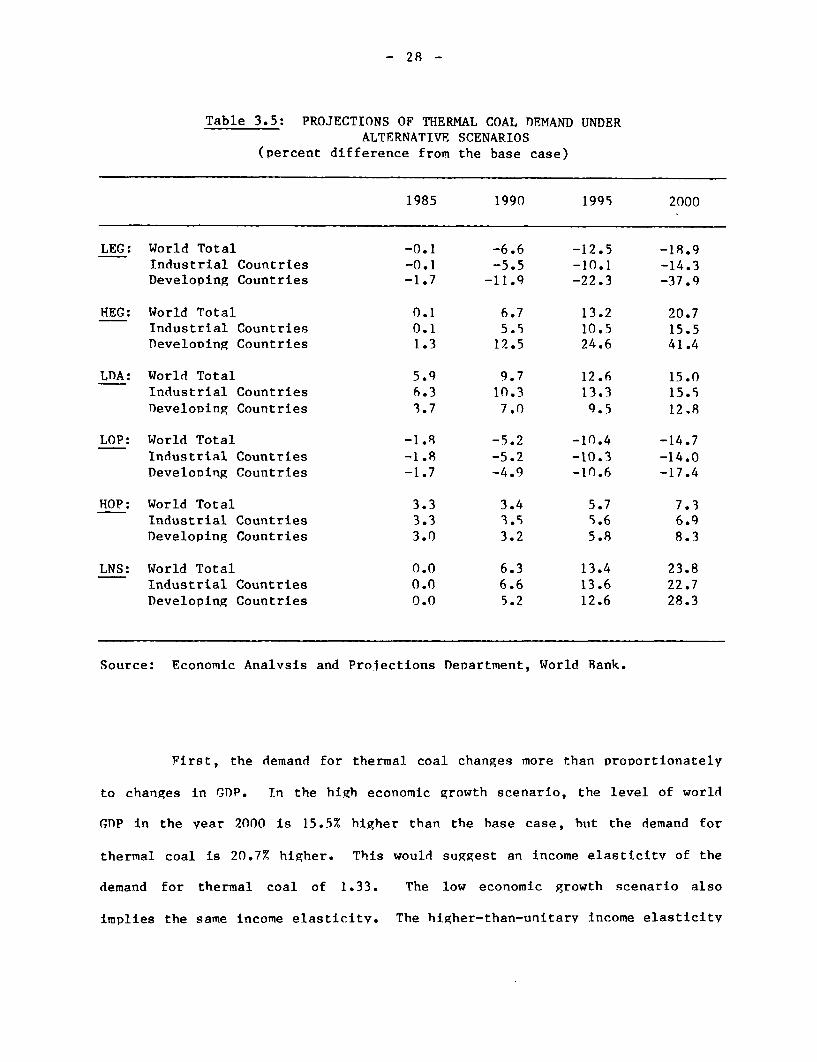
Table 3.5 presents the projections of thermal coal demand for the
seven alternative scenarios, expressed in terms of percentage deviations from
the base case. The changes made to the base-case assumptions generally result
in only minor differences in the short- to medium-term demand projections, but
lead to major differences in the long-term level of demand.
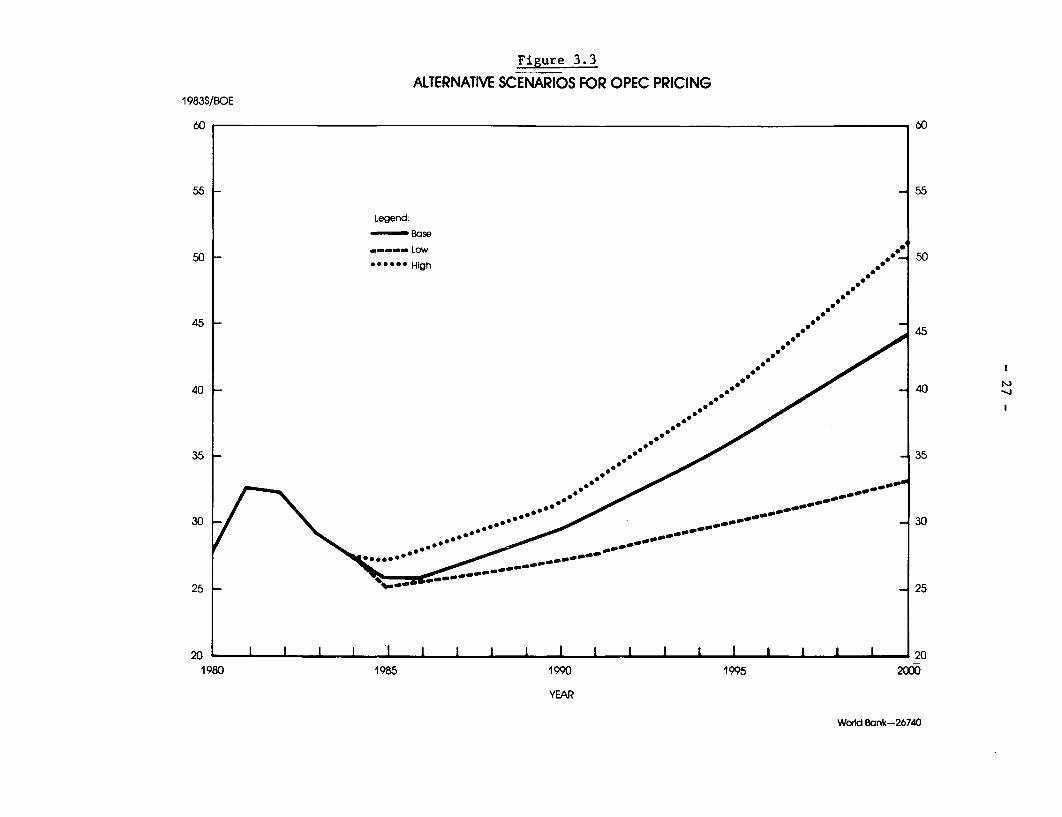
Figure 3.3
ALTERNATIVE SCENARIOS FOR OPEC PRICING1983S/BOE
60 60
55 55
Legend:-BBase
50 Low .0****High
45 Se4
40 40 -
35 35
30 ~~~~~~~~~~~~~~~~~~~~~~~~~~~~~~~~30
25 -25
20 1 ' I I I 201980 1985 1990 1995 2000
YEAR
Wo1d Bank-26740
- 28 -
Table 3.5: PROJECTIONS OF THERMAL COAL DEMAND UNDERALTERNATIVE SCENARIOS
(percent difference from the base case)
1985 1990 1995 2000
LEG: World Total -0.1 -6.6 -12.5 -18.9Industrial Countries -0.1 -5.5 -10.1 -14.3Developing Countries -1.7 -11.9 -22.3 -37.9
HEG: World Total 0.1 6.7 13.2 20.7Industrial Countries 0.1 5.5 10.5 15.5DeveloDing Countries 1.3 12.5 24.6 41.4
LDA: World Total 5.9 9.7 12.6 15.0Industrial Countries 6.3 10.3 13.3 15.5neveloping Countries 3.7 7.0 9.5 12,8
LOP: World Total -1.8 -5.2 -1n.4 -14.7Industrial Countries -1.8 -5.2 -10.3 -14.0DeveloDing Countries -1.7 -4.9 -10.6 -17.4
HOP: World Total 3.3 3.4 5.7 7.3Industrial Countries 3.3 3.s 5.6 6.9Developing Countries 3.0 3.2 5.8 8.3
LNS: World Total 0.0 6.3 13.4 23.8Industrial Countries 0.0 6.6 13.6 22.7Developing Countries 0.0 5.2 12.6 28.3
Source: Economic Analvsis and Projections DeDartment, World Bank.
First, the demand for thermal coal changes more than proportionately
to changes in GDP. In the high economic growth scenario, the level of world
GDP in the year 2000 is 15.5% higher than the base case, but the demand for
thermal coal is 20.7% higher. This would suggest an income elasticitv of the
demand for thermal coal of 1.33. The low economic growth scenario also
implies the same income elasticity. The higher-than-unitary income elasticity
- 29 -
of the demand for thermal coal is largely a reflection of the following two
factors: (a) the income elasticitv of the demand for electricity is higher
than that for final energy; (b) the demand for thermal electricity is treated
as a residual demand, after subtracting from total electricity demand the
supplies of primary electricity which are projected exogenouslv.
The sensitivitv of thermal coal demand to changes in economic growth
is greater in developing countries than in industrial countries; the income
elasticity implied by the simulation results is close to 2.0 for developing
countries and 1.15 for industrial countries. This result is understandable
because develoDing countries have higher income elasticitv of demand for
electricity and a higher share of Drimary electricity in total electricity
supplies than industrial countries.
Higher economic growth results in faster increases in the cost of
coal production; the international exnort price of thermal coal is projected
at a level 4.9% higher for the year 2000 under the high economic growth
scenario than under the base-case scenario. The share of thermal coal in
thermal electricity generation and industrial sector consumption, therefore,
is slightlv lower inder the high economic growth scenario than under the base
case, but this negative impact is only minor compared with the positive effect
of higher economic growth on total energy demand and hence the demand for
thermal coal.
If the price elasticities of final energy demand were lower as
assumed in the low demand adjustment scenario, the demand for thermal coal
would be higher by a greater percentage (by 15.0% in the year 2000) than the
demand for total primarv energv (bv R.8% in the vear 2000). The reason for
this is the same as that mentioned above for the high economic growth
- 30 -
scenario. It is also of interest to note that the short- to medium-term
impact of lower demand adjustments to prices could be quite substantial. This
is because the prospects for energy demand over the next several years depend
critically on how economies adjust to the energy price increases that took
place in 1973-74 and 1979-80.
Variations in the price of OPEC oil are shown to have a substantial
impact on the demand for thermal coal. It was, after all, the two rounds of
OPEC oil price increases that led to the rejuvenation of thermal coal as a
substitute fuel. The low oil price scenario assumes somewhat lower prices
than the base case until 1990, but the gap between them drastically widens in
the 1990s (Figure 3.3). The sensitivity results show that in the short- to
medium-term the demand for thermal coal will not suffer greatly from a
moderate softening of oil prices. Over the long term, however, the difference
becomes substantial as the oil price diverges widely between the two
scenarios. Under the low oil price scenario, the growth rate of the demand
for thermal coal is projected at 2.0% p.a. between 1982 and the year 2000,
down sharply from 2.9% p.a. growth in the base case.
More illustrative of the impact of lower oil prices is the share of
thermal coal in thermal power generation. In industrial countries, for
example, the share reaches 75% by 1990 under the low oil price scenario
compared with 77% under the base-case oil prices, but only to 79% by the year
2000 compared with the base case share of 85%. Under the low oil price
scenario, substitution of coal for petroleum continues to take place but at a
substantially reduced rate.
The impact of higher oil prices is asymmetrical to that of lower oil
prices. The elasticity of thermal coal demand with respect to the price of
- 31 -
OPEC oil is aporoximately the same in the short term for both oil Drice
increases and oil Drice declines, but the long term elasticitv for oil Drice
increases is substantiallv lower than that for oil price declines. This makes
sense because in the long term the ootential for interfuel substitution will
be exhausted even under the base-case oil price scenario, and further oil
price increases will make only marginal differences.
With nuclear power supplies 50% below the base-case level for the
vear 2000, the demand for thermal coal will increase bv 24% (or by 550 mtce)
for the same year. About 85% of this reduction in nuclear power supplies is
replaced by coal-fired electricity generation, in accordance with the base-
case projected share of thermal coal in thermal power generation. It is,
however, likely that all of the reduction in nuclear power supplies will be
replaced by coal-fired electricity in oil-importing countries because nuclear
power plants are base-load facilities and all future base-load thermal Power
caoacities in these countries are likelv to rely on thermal coal.
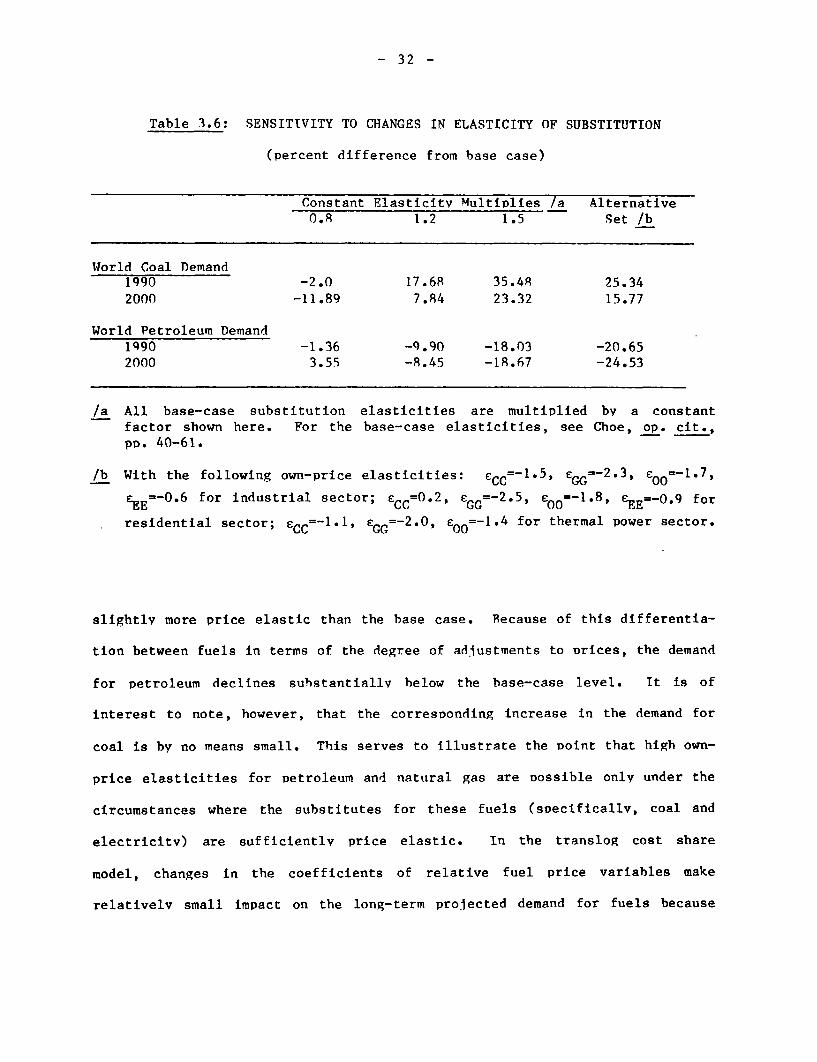
Sensitivitv results of the WEPM translog cost share model of
interfuel substitution suggest that the long-term Drojections of fuel shares
can vary considerably depending on the assumDtions about the substitution
elasticities. Table 3.6 shows the effect on world demand for coal and
petroleum of changing the own- and cross-nrice elasticities bv a constant
factor. A 20% increase in all the elasticities, for example, results in
approximately 7.8% increase in world coal demand and 8.5% decrease in world
petroleum demand by the year 2000. Instead of changing all the elasticities
by the same proportion, the alternative set of own price elasticities
postulate that the demand for petroleum and natural gas are much more price
elastic than the base case, while the demand for coal is assumed to be
- 32 -
Table 3.6: SENSITIVITY TO CHANGES IN ELASTICITY OF SUBSTITUTION
(percent difference from base case)
Constant Elasticitv Multiplies /a Alternative0.8 1.2 1.5 Set /b
World Coal Demand1990 -2.0 17.6R 35.48 25.342000 -11.89 7.84 23.32 15.77
World Petroleum Demand1990 -1.36 -9.90 -18.03 -20.652000 3.55 -8.45 -18.67 -24.53
/a All base-case substitution elasticities are multiplied by a constantfactor shown here. For the base-case elasticities, see Choe, op. cit.,pp. 40-61.
/b With the following own-price elasticities: eCC= 1*5' eGr=-2.3, e =-1.7,
LEE=-0.6 for industrial sector; LCCO=O 2, EGG=-2.5, 00=-1.8, LEE=-0.9 for
residential sector; cc=-1.1, EGG=-2.0, £OO=-1.4 for thermal power sector.
slightly more price elastic than the base case. Recause of this differentia-
tion between fuels in terms of the degree of adjustments to Drices, the demand
for petroleum declines substantiallv helow the base-case level. It is of
interest to note, however, that the corresponding increase in the demand for
coal is by no means small. This serves to illustrate the Doint that high own-
price elasticities for petroleum and natural gas are nossible only under the
circumstances where the substitutes for these fuels (specificallv, coal and
electricitv) are sufficiently price elastic. In the translog cost share
model, changes in the coefficients of relative fuel price variables make
relativelv small impact on the long-term projected demand for fuels because
- 33 -
the substitution elasticities of the model are determined mostly by the cost
shares rather than the coefficients.
In summary, world demand for thermal coal in the years ahead is
subject to a wide range of uncertainty depending, among other things, on
economic growth, petroleum prices, energy demand adjustments to prices and
supplies of nuclear power. Changes in economic growth result in greater than
proportional changes in the demand for thermal coal. The demand for thermal
coal shows sizable but asymmetrical responses to high and low OPEC oil price
scenarios; the short-term impact on thermal coal demand of higher OPEC oil
prices is relatively larger than its long-term impact and vice versa. The
likelihood of a significant shortfall in nuclear power supplies points to the
possibility of a substantially higher demand for thermal coal. The future
demand for thermal coal will be determined largely by what happens in the
industrial countries, not only because they will account for the bulk (75-80%)
of the market but also because they will play the pivotal role in determining
the final outcome of the uncertainties considered here.
Comparison with Other Projections
It is of interest to compare the base-case projections with those
made by other groups in this field. The projections chosen here for
comparison are the projections of total coal demand made by other inter-
national and national organizations. No attempt has been made to reconcile
the differences in the underlying assumptions.
The International Energy Agency (IEA) in its World Energy Outlook
1982 foresees substantially higher long-term demand for coal than our base-
case projections for most of the industrial-country regions (Table 3.7). The
projections in World Energy Outlook were done immediately following the second
- 34 -
Table 3.7: A COMPARISON OF THE BASE CASE WITH OTHER PROJECTIONS
(percent difference from the base case)
1990 2000
World Energy Outlook /a
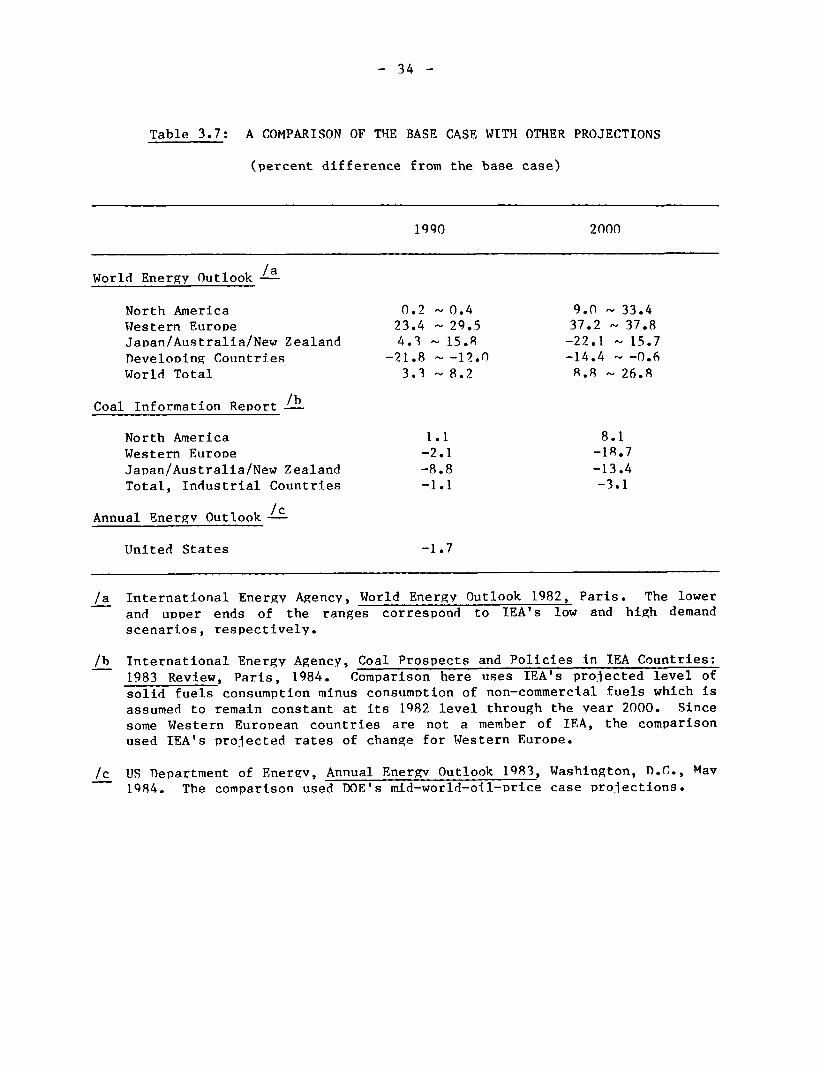
North America 0.2 0.4 9.0 33.4Western Europe 23.4 29.5 37.2 37.8Janan/Australia/New Zealand 4.3 15.8 -22.1 15.7DeveloDing Countries -21.8 -12.0 -14.4 -0.6World Total 3.3 8.2 R.8 26.8
Coal Information Reoort /h
North America 1.1 8.1Western EuroDe -2.1 -18.7JaDan/Australia/New Zealand -8.8 -13.4Total, Industrial Countries -1.1 -3.1
Annual Energv Outlook /c
United States -1.7
/a International Energy Agency, World Energy Outlook 1982, Paris. The lowerand upper ends of the ranges correspond to IEA's low and high demandscenarios, respectively.
/b International Energy Agency, Coal Prospects and Policies in IEA Countries:1983 Review, Paris, 1984. Comparison here uses IEA's projected level ofsolid fuels consumption minus consumntion of non-commercial fuels which isassumed to remain constant at its 1982 level through the year 2000. Sincesome Western European countries are not a member of IEA, the comparisonused IEA's projected rates of change for Western Eurooe.
/c US Department of Energv, Annual Energv Outlook 1983, Washington, D.C., Mav1984. The comparison used DOE's mid-world-oil-price case projections.
- 35 -
oil price increases, at the height of optimism for thermal coal. The IEA's
projections for the developing countries, however, are substantially lower
than our base-case projections. Although the differences are within the ranges
of sensitivity results shown in the preceding section, it is difficult to
account for them in terms of differences in the underlying assumptions. IEA's
high demand scenario assumes constant real prices for OPEC oil throughout the
projection period and economic growth rates that are close to our base-case
assumption. It would, therefore, be more appropriate to compare IEA's high
demand scenario with our low oil price scenario, suggesting that the
differences in perception are greater than the percentage differences shown in
Table 3.7. A notable feature of IEA's projections is the insensitivity of the
demand for thermal coal to OPEC oil prices.
Projections contained in IEA's Coal Prospects and Policies in IEA
Countries are based on recent individual country submissions to IEA. Also
shown is the latest projection of US coal demand done by the US Department of
Energy. A notable feature of these recent projections is a sharp downward
revision from the earlier ones, particularly for Western Europe and Japan.
Recent projections by Data Resources Inc. (Europe) of net imports of coal into
Western Europe show an increase from 69 mtce in 1982 to 123 mtce in 1990 and
243 mtce in the year 2000. The low demand scenario of IEA's World Energy
Outlook puts coal net imports of Western Europe at 196 mtce in 1990 and 399
mtce in the year 2000. Our base-case projections imply net imports of 115
mtce in 1990 and 280 mtce the year 2000. This is an illustration of not only
the degree of uncertainties involved but also of the severity of the change in
the perception of analysts.
- 36 -
Environmental Pollution and Its Abatement
An array of environmental problems are associated with the coal fuel
cycle, significantly distracting from its cost advantage. Remedial measures
taken so far in the industrial countries have successfully alleviated most of
the problems at costs that allow coal's cost advantage vis-a-vis hydrocarbon
fuels to be maintained. Coal mining can cause land subsidence (in the case of
underground mining) or disturbance of surface terrain and vegetation (in the
case of surface mining); emissions of noise and dust affect surrounding areas,
and pollution of surface and ground water by drainage occurs wherever coal is
exposed to leaching. Conscientious efforts and careful planning made it
possible to eliminate most of these problems at new and existing mines.
While progress is continuing through wider application and improvement of
pollution- control technology, environmental concern also keeps shifting its
focus. Recently, attention has been centered on acid rain and the climatic
implications of carbon dioxide, which transcend national boundaries and
encompass all fossil fuels.
It is often difficult to separate environmental control costs from
general mining costs; available estimates put the environmental costs of coal
mining at $1.00-5.00 (1982 US dollars) per ton of coal produced. Coal
preparation enhances the quality of coal by reducing the content of sulfur,
ash and other impurities. For this reason, not all of the costs of
preparation, estimated at $1.00-4.00 (1982 US dollars) depending upon the
quality of the run-of-mine coal, can be considered environmental. Reduction
of the sulfur content through a preparation process can substantially ease the
problem of sulfur oxide emission at the combustion stage.
- 37 -
The costs of pollution control at mining and Drenaration stages are
included as a Dart of the total cost of production. The long-run coal supply
function in WEPM implicitly assumes that the environmental control costs will
increase at the same rate as the total cost of production.
Combustion of coal Droduces such pollutants as sulfur oxides, carbon
monoxide and dioxide, particulates, and organic compounds and trace metals.
Among these, sulfur oxides pose the most serious and costly pollution problem.
Methods of coping with sulfur oxide emissions have been primarily twofold: one
is to burn low-sulfur coal and the other is to use one of the available flue
gas desulfurization (FGD) technologies, or "scrubbers." Develooments in FGD
systems have overcome much of the inefficiency and unreliability Droblems
encountered initially, and now are widelv accepted. TyDical svstems can
eliminate 95% of sulfur oxides from flue gas. With more stringent sulfur
emission standards being imnDosed in industrial countries, application of FGD
technologies is exDected to expand rapidlv, even to some of the facilities
initially designed to use low-sulfur coal.
One important drawback of FGD is its high cost; the capital cost of
an FGT) svstem is tvpically S70-180 (1982 IJS dollars) per KW of capacity,
deDending on the sulfur content of coal it is designed to nrocess. This is
11-20% of non-environmental capital costs of a large-scale coal-fired power
plant, or 8-18% of the total cost of electricity generation. Technological
progress in several directions (use of adiDic acid or other organic acids in
conjunction with wet limestone systems, limestone injection multistage
burners, and fluidized bed combustion) nromises to either reduce the capital
cost or enhance the efficiency of sulfur oxide removal.
- 38 -
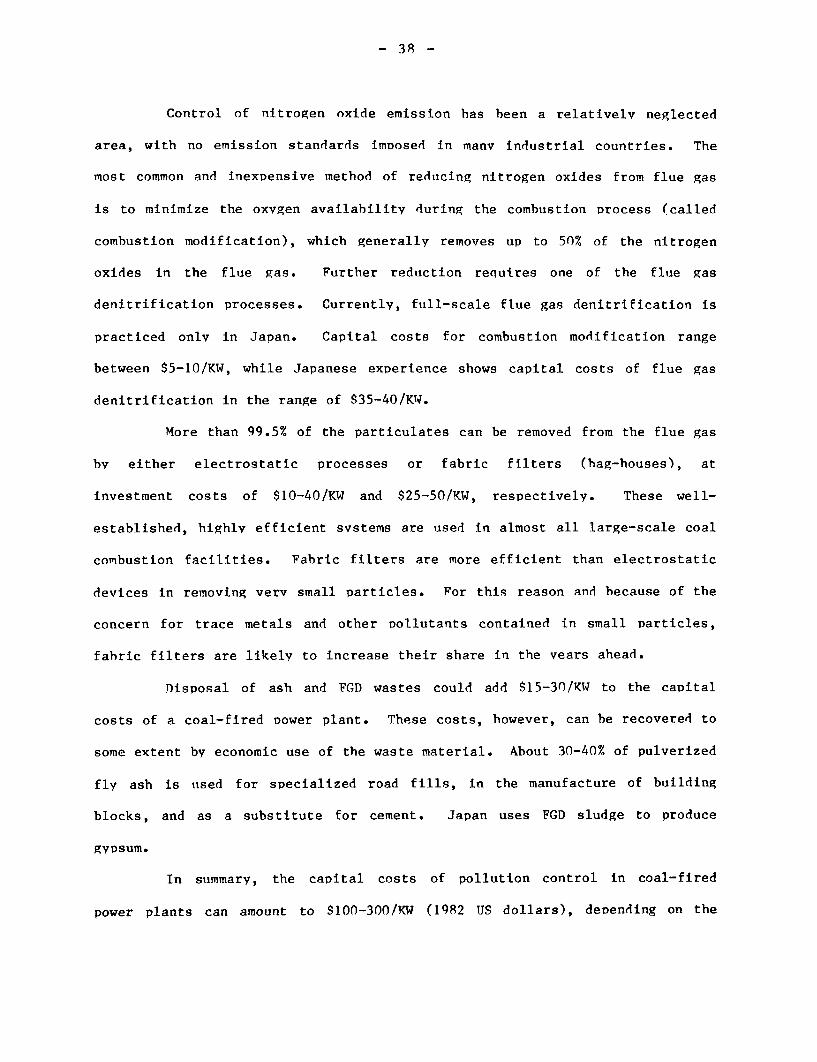
Control of nitrogen oxide emission has been a relatively neglected
area, with no emission standards imoosed in manv industrial countries. The
most common and inexpensive method of reducing nitrogen oxides from flue gas
is to minimize the oxvgen availability during the combustion vrocess (called
combustion modification), which generally removes up to 50% of the nitrogen
oxides in the flue gas. Further reduction requires one of the flue gas
denitrification processes. Currently, full-scale flue gas denitrification is
practiced onlv in Japan. Capital costs for combustion modification range
between $5-10/KW, while Japanese experience shows capital costs of flue gas
denitrification in the range of $35-40/KW.
More than 99.5% of the particulates can be removed from the flue gas
bv either electrostatic processes or fabric filters (bag-houses), at
investment costs of $10-40/KW and $25-50/KW, respectively. These well-
established, highly efficient svstems are used in almost all large-scale coal
combustion facilities. Fabric filters are more efficient than electrostatic
devices in removing verv small particles. For this reason and because of the
concern for trace metals and other Dollutants contained in small particles,
fabric filters are likely to increase their share in the vears ahead.
Disposal of ash and FGD wastes could add $15-30/KW to the capital
costs of a coal-fired nower plant. These costs, however, can be recovered to
some extent by economic use of the waste material. About 30-40% of pulverized
fly ash is used for specialized road fills, in the manufacture of building
blocks, and as a substitute for cement. Japan uses FGD sludge to produce
gypsum.
In summary, the capital costs of pollution control in coal-fired
power plants can amount to $100-300/KW (1982 US dollars), deDending on the
- 39 -
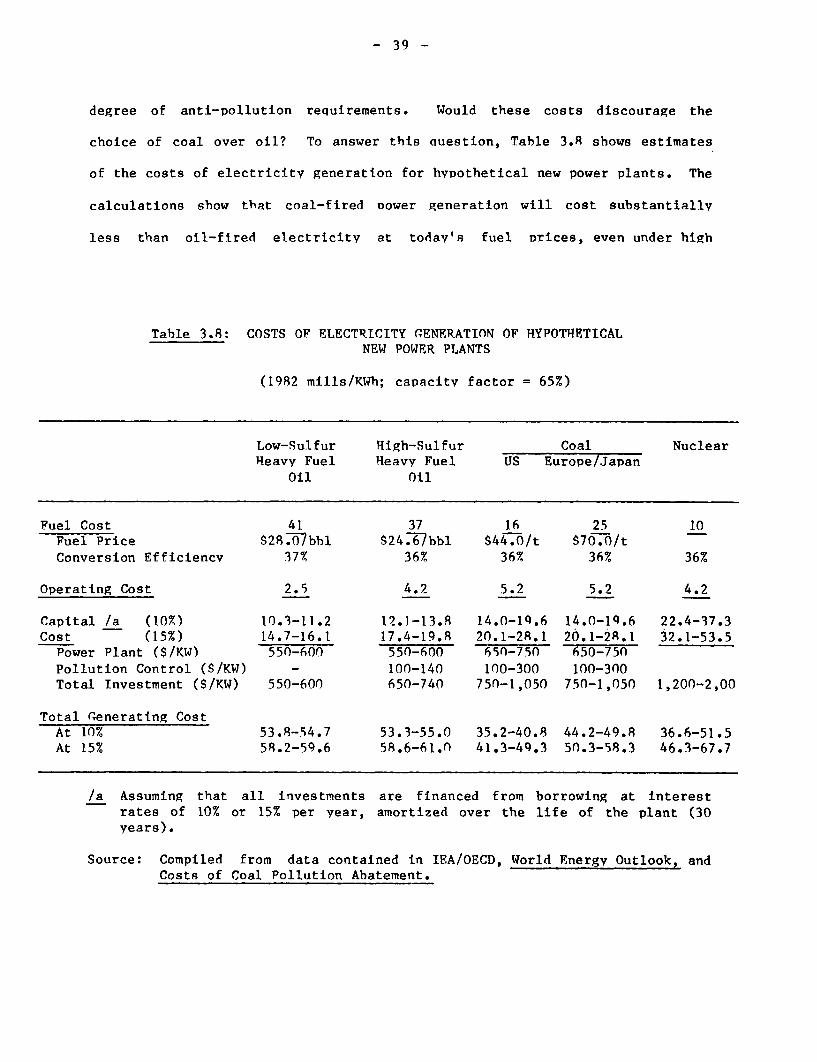
degree of anti-pollution requirements. Would these costs discourage the
choice of coal over oil? To answer this question, Table 3.R shows estimates
of the costs of electricity generation for hvyothetical new power plants. The
calculations show that coal-fired nower generation will cost substantially
less than oil-fired electricity at today's fuel prices, even under high
Table 3.8: COSTS OF ELECTRICITY GENERATION OF HYPOTHETICALNEW POWER PLANTS
(1982 mills/KWh; capacitv factor = 65%)
Low-Sulfur High-Sulfur Coal NuclearHeavy Fuel Heavy Fuel US Europe/Japan
Oil Oil
Fuel Cost 41 37 16 25 10Fuel Price $2R.70bbl S24.6/bbl $44.0/t S70.0/tConversion Efficiencv 37% 36% 36% 36% 36%
Operating Cost 2.5 4.2 5.2 5.2 4.2
Capital /a (10%) 10.3-11.2 12.1-13.8 14.0-19.6 14.0-19.6 22.4-37.3Cost (15%) 14.7-16.1 17.4-19.8 20.1-28.1 20.1-28.1 32.1-53.5
Power Plant ($/KW) 550-600 550-600 650-750 650-750Pollution Control ($/KW) - 100-140 100-300 100-300Total Investment (S/KW) 550-600 650-740 750-1,050 750-1,050 1,200-2,00
Total Generating CostAt 10% 53.8-54.7 53.3-55.0 35.2-40.8 44.2-49.8 36.6-51.5At 15% 58.2-59.6 58.6-61.0 41.3-49.3 50.3-58.3 46.3-67.7
/a Assuming that all investments are financed from borrowing at interestrates of 10% or 15% per year, amortized over the life of the plant (30years).
Source: Compiled from data contained in IEA/OECD, World Energy Outlook, andCosts of Coal Pollution Abatement.
- 40 -
capital costs for environmental control. It is only under the highest
capital expenditures for pollution control and a high rate of capital charge
(15%) that the cost of electricity generated from imported coal in Western
Europe and Japan approximates that of oil-fired electricity generation. The
cost of nuclear electricity can vary from the least expensive to the most
expensive among the alternatives considered, because of the uncertainty of
investment requirements for enhancing reactor safety.
- 41 -
IV. COAL SUPPLIES AND TRANSPORTATION
This section presents estimates of coal mining and transportation
costs that are used to specify the long-term coal supply function for the
major coal-producing countries. The supply functions are used in WEPM to
endogenously determine the levels of coal production and exports of each
region on the basis of its cost competitiveness in the world market. It is
shown that, although much more work needs to be done to estimate the supply
function for several key producers, the available evidence strongly indicates
that the long-term costs of coal mining are not likely to increase appreciably
over the next 20 years.
Production and Reserves
The main advantage of coal, compared with petroleum and natural gas,
is its relative abundance; proven worldwide recoverable reserves of coal
amount to more than 200 times the current annual production (Table 4.1). 1/
World coal production today is concentrated in a few countries. Close to two-
1/ There are three broad categories of coal: anthracite, bituminous and sub-bituminous coal, and lignite, classified according to the degree ofcarbonization. Slightly more than 5% of world coal production consists ofanthracite, about 69% of bituminous coal and the remaining 26% oflignite. Compared to bituminous coal and lignite, anthracite has theadvantage of being a clean-burning fuel. Bituminous coal has a higherheat value than sub-bituminous coal and lignite. Some bituminous coalshave "caking" properties when heated in the absence of air. These areknown as coking or metallurgical coal. About 27% of the coal producedoutside the centrally planned economies consists of metallurgical coal.The non-coking coal is also known as steam or thermal coal. Technologicaladvances have made it possible to blend to some extent coking and non-coking coals in production of cokes. Only a small number of countrieshave data on proven reserves of metallurgical coal. The total of thesereserves (75 billion tons) amounts to 18% of the world's proven recover-able reserves of anthracite and bituminous coals. About 20% of the provenrecoverable reserves in the United States is metallurgical coal. InAustralia and West Germany, metallurgical coal reserves are close to 60%of their total bituminous coal reserves, while South African coal ismostly non-metallurgical.
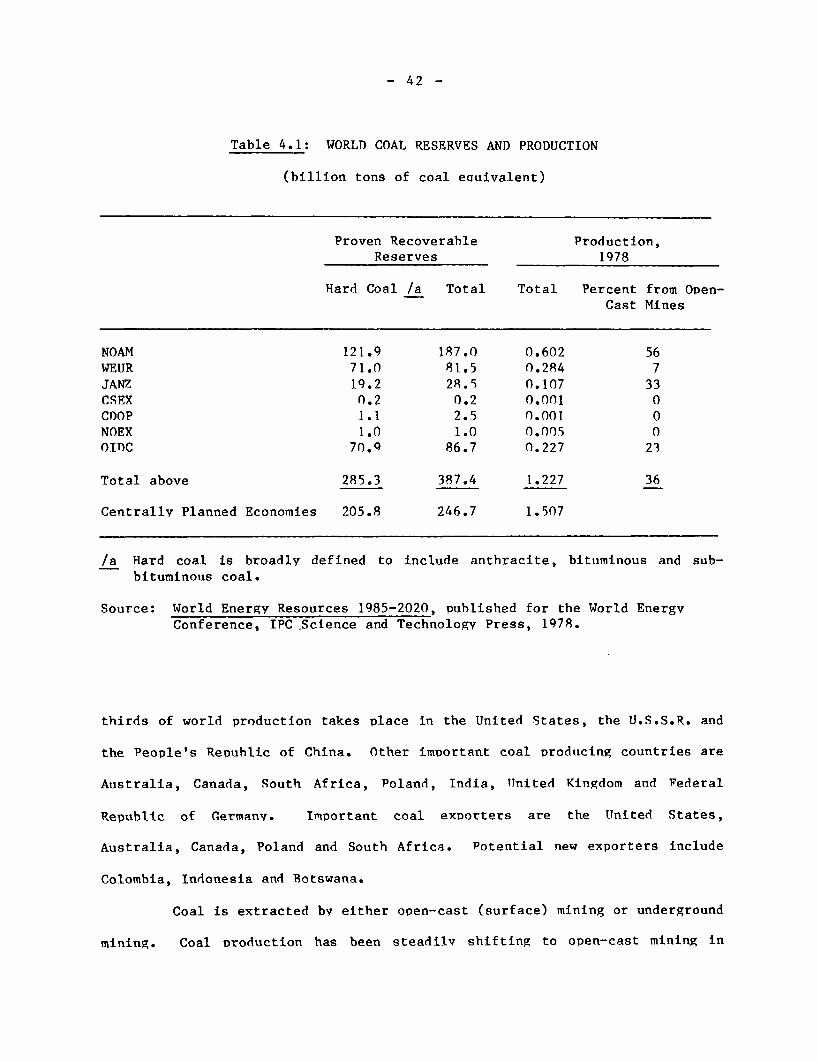
- 42 -
Table 4.1: WORLD COAL RESERVES AND PRODUCTION
(billion tons of coal eauivalent)
Proven Recoverable Production,Reserves 1978
Hard Coal /a Total Total Percent from Open-Cast Mines
NOAM 121.9 187.0 0.602 56WEUR 71.0 81.5 0.284 7JANZ 19.2 28.5 0.107 33CSEX 0.2 0.2 0.001 0CDOP 1.1 2.5 0.001 0NOEX 1.0 1.0 0.005 0oTnc 70.Q 86.7 0.227 23
Total above 285.3 387.4 1.227 36
Centrally Planned Economies 205.8 246.7 1.507
/a Hard coal is broadly defined to include anthracite, bituminous and sub-bituminous coal.
Source: World Energy Resources 1985-2020, published for the World EnergyConference, IPC Science and Technology Press, 1978.
thirds of world production takes place in the United States, the U.S.S.R. and
the People's ReDublic of China. Other imDortant coal producing countries are
Australia, Canada, South Africa, Poland, India, UTnited Kingdom and Federal
Republic of Germanv. Important coal exDorters are the United States,
Australia, Canada, Poland and South Africa. Potential new exporters include
Colombia, Indonesia and Botswana.
Coal is extracted by either open-cast (surface) mining or underground
mining. Coal production has been steadilv shifting to open-cast mining in
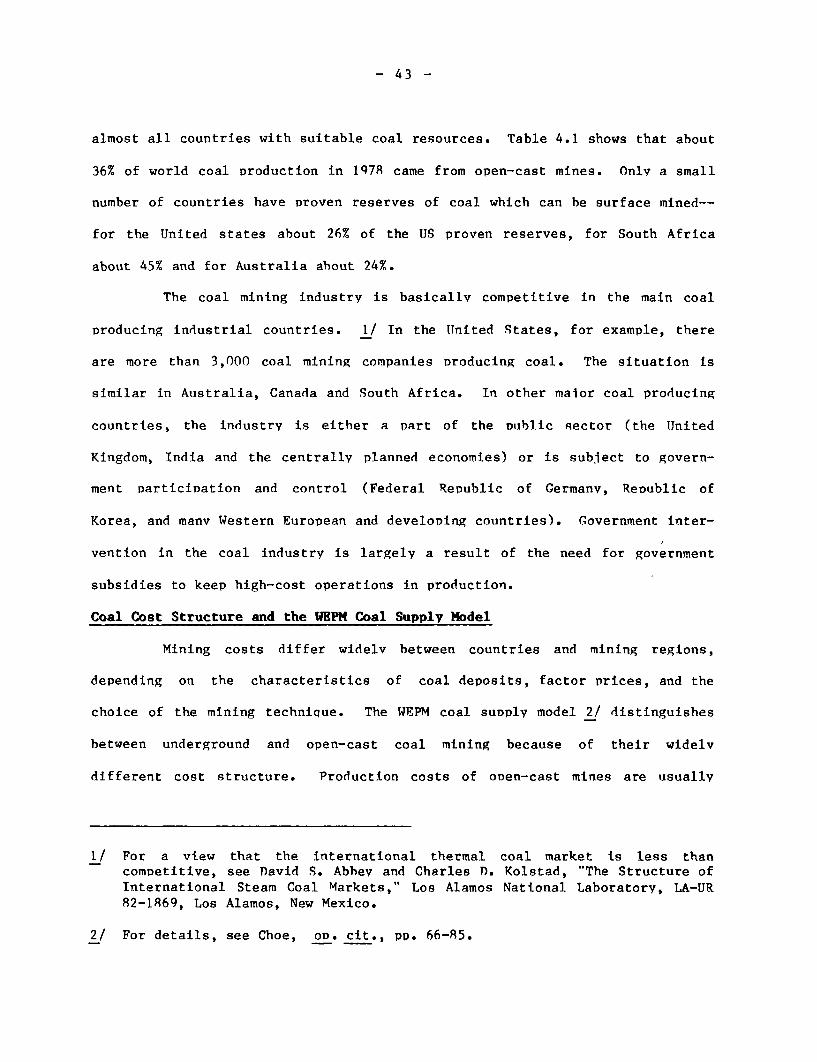
- 43 -
almost all countries with suitable coal resources. Table 4.1 shows that about
36% of world coal production in 1Q78 came from open-cast mines. Only a small
number of countries have proven reserves of coal which can be surface mined--
for the United states about 26% of the US proven reserves, for South Africa
about 45% and for Australia about 24%.
The coal mining industry is basicallv competitive in the main coal
producing industrial countries. 1/ In the ITnited States, for example, there
are more than 3,000 coal mining companies Producing coal. The situation is
similar in Australia, Canada and South Africa. In other major coal producing
countries, the industry is either a part of the Dublic sector (the UJnited
Kingdom, India and the centrally planned economies) or is subject to govern-
ment particiDation and control (Federal Republic of Germanv, Republic of
Korea, and manv Western European and developing countries). Government inter-
vention in the coal industry is largely a result of the need for government
subsidies to keep high-cost operations in production.
Coal Cost Structure and the WEPH Coal Supply Model
Mining costs differ widelv between countries and mining regions,
depending on the characteristics of coal deposits, factor prices, and the
choice of the mining technique. The WEPM coal suDply model 2/ distinguishes
between underground and open-cast coal mining because of their widelv
different cost structure. Production costs of onen-cast mines are usually
1/ For a view that the international thermal coal market is less thancomDetitive, see David S. Abbev and Charles D. Kolstad, "The Structure ofInternational Steam Coal Markets," Los Alamos National Laboratory, LA-UR82-1869, Los Alamos, New Mexico.
2/ For details, see Choe, oD. cit., pp. 66-85.
- 44 -
substantially lower than those of underground mines due to higher labor
productivitv, greater economies of scale and faster development. In under-
ground mining the cost of mining deDends on the thickness, deDth and grade of
coal seams, roof and floor conditions, complexitv of geological structure,
extent of water and methane presence, etc. In open-cast mining the key factor
is the ratio of overburden thickness to depth of coal seam.
Open-cast mining involves more capital and less labor than under-
ground mining. As a rule of thumb, the cost of labor is apDroximately 50% of
the total mining costs of underground mining in industrial countries. In the
case of developing countries, the cost share of labor can be higher (e.g.,
India) or lower (e.g., South Africa) than in the industrial countries. In the
case of open-cast mining, the cost share of labor is tvDicallv 15-20%, and
that of capital around 40-50%. The wide variation in the cost share suggests
that labor and capital are highlv substitutable in coal mining, although
productivity of capital is such that under a relative factor Drice configura-
tion such as that in South Africa, fairlv capital intensive mechanized mining
could be the preferred choice if coal deposits are suitable for such mining
methods.
In WEPM, the short- and long-run coal supply functions are defined by
the short- and long-run marginal costs of production, respectively. Estimation
of the long-run supply curve for the maior coal-producing countries is
described below. For the short run, it is postulated that the supplv has
unitary price elasticity, which closely replicates the actual export price
movements during the 1980-82 price increases. Coal suoDlv is assumed to take
place along the short-run supply curve whenever world demand exceeds world
production capacitv bv more than 5%. Capacity expansion is assumed to respond
- 45 -
to coal vrices with certain lags (3 to 5 vears). The coal mining wage rates
are assumed to increase at the rate of growth of ner capita GDP.
United States and Canada
Assuming constant factor prices and no technical progress in mining,
Zimmerman 1/ developed a long-run coal suDplv model for the United States.
From the known characteristics of the proven reserves in the United States and
using historical and engineering data, he estimated the long-run supply
function for different regions and for different sulfur categories. His main
finding was that the costs of mining will increase at about 1.4% p.a. for the
eastern low-sulfur coal over the next 20 years at the current rate of
production; for the eastern high sulfur coal, mining cost will increase at
0.5% p.a. at the current rate of production, and for the western surface-
mined, low-sulfur coal, at a 0.25% D.a. at five times the current rate of
Droduction. He also found that even under strict environmental controls 2/
and some increases in the rail transportation cost of, the western coal,
interregional comDetition will stronglv favor the low-sulfur western coal to
take the place of the high-cost eastern low sulfur coal. These adjustments
would implv that the costs of the eastern low-sulfur coal will increase at a
rate lower than 1.4% p.a. as the level of its production is projected to
decline in the years ahead. On the other hand, the mining costs of the
western low-sulfur coal and high-sulfur coal in the midwestern and eastern
regions will increase at faster rates than the case when Production remains
static.
1/ Martin B. Zimmerman, The U.S. Coal Industry: The Economics of PolicvChoice (Cambridge, Mass.: The MIT Press), 1981.
2/ The Best Available Control Technologv (BACT) provision of the Clean AirAct favors the eastern high-sulftur coal.
- 46 -
The average annual rate of cost increases for US underground mining
as a whole is estimated at about 0.9% D.a. over the next 20 vears at the
current rates of production for each region and sulfur category. T-owever, if
the share of the eastern low-sulfur coal declines while that of high-sulfur
coal increases as in Zimmerman's low-sulfur-emission-standard scenario, 1/ the
rate of underground mining cost increases is reduced to 0.7% D.a. at the
current rate of total underground production.
In the case of surface mining, the average rate of cost increases for
the ITnited States as a whole is likely to be slowed down considerably by the
shift of production to the low-cost western mines. The average rate of
increase comes to about 0.45-0.50% p.a. at the current rate of total surface-
mine production.
Results of several other studies 2/ of the costs of long-term US coal
supplies do not deviate substantively from Zimmerman's findings. Although the
gist of these findings is nrobablv near to the true Dicture, it is difficult
to arrive at Drecise estimates of the slope of the long-term supply curve
largely because of the lack of sufficient geologic information for a large
Dart of the proven reserves.
Significant coal reserves are found in the provinces of British
Columbia and Alberta in Canada, which are not significantlv different from the
US western coal in terms of cost characteristics. Little, however, has been
done to estimate Canada's long-term coal supply function. New mines nlanned
1/ 1.2 lb SO2 per million BTUs.
2/ Examples are the coal supply functions developed by the ICF, Inc. and thesurface and underground mining cost equations developed bv ScienceApplications, Inc. for the US Energy Information Administration.
- 47 -
for the near future show a cost structure that is closely comparable with that
of the US western mines.
Australia
Australia's large coal resources are located mostlv in the states of
New South Wales and Queensland, which together accounted for more than 95% of
its production in 1982. Surface mining provided about 54% of the total
production. As in the US ApDalachia, most of underground production comes
from seams more than 3 meters thick and less than 500 meters deep. The over-
burden/seam thickness ratios of the Australian surface mines are comparable
with those of the Power River Basin in Montana/Wvoming, but are at a dis-
advantage in terms of scale economies.
A recent study 1/ shows that the real cost of Droduction in
Australia increased bv almost 20% between 1977 and 1982, mostlv because of
increases in the unit cost of inputs, particularly mining wages and
royalties. These increases were mostlv of short-term nature and reflected the
fierce competition for a larger share of the rent between the supDliers of
factor inDuts to the Australian coal mining industrv.
A survev of existing mines in the above studv shows that the costs of
thermal coal, FOB exnort terminals, currentlv range between A$35-55 per ton.
It is also suggested that within this cost range substantial new cavacities
(as much as the existing capacities) are likelv to be available. This
information, however, does not lead us to the likely shave of the long-term
suDply curve.
1/ Longworth and McKenzie, Ltd., "Australian Coal Production and TransportCost Studv," prepared for the World Bank, August 1983.
- 48 -
Doherty 1/ estimated that Australian thermal coal exports can be
increased from 25 mtce to 50 mtce if the export price (in January 1982 prices)
is increased from AS50 per ton to approximately AS57. The order of magnitude
involved here does not seem to be significantlv different from that of the
Longworth and McKenzie report. Again, however, it is difficult to translate
this tvpe of information into a long-run supDly curve.
In the absence of tangible estimates, it is assumed that Australia's
long-term coal supplv curves should closely resemble those of the IJnited
States. This assumption is equivalent to saying that Australia will be able
to maintain its current comDetitive position vis-a-vis the Ufnited States in
the world export market in the vears ahead.
South Africa
South Africa is probably the lowest-cost producer and exporter of
thermal coal. Several factors make this possible: a generally favorable
resource base, low wages, relatively small transportation costs, and favorable
government policies.
Coal deposits in South Africa are found in isolated basins, in
several flat lavers of seams with an average depth of less than 200 meters and
seam thickness of more than two meters. These characteristics permit highly
mechanized mining under generally good mining conditions. Surface mining
currently accounts for about 25% of total production. Coal quality, seam
thickness, and mining conditions deteriorate graduallv as production moves
from the center to the periphery of the basins. The run-of-mine coal
1/ J.K. Doherty, "Producer's View--Australian Steaming Coal," Pacific RimCoal Trade Conference, January 1982.
- 49 -
generally has high ash content but low sulfur content, and requires extensive
upgrading to reach export quality.
Denletion of coal resources in South Africa asserts itself primarily
in the form of deteriorating quality of raw coal. It is estimated that for
the planned phase IV expansion of exports by 30-40 mtce for the period after
1987 the average washery yield of raw coal could be reduced bv as much as 5%
below the current level. 1/. This is equivalent to a 7% increase in the cost
oer ton of exvort qualitv coal.
The real coal mining wage rate of miners in South Africa has
quadrupled between 1970 and 1982 and is expected to increase at a fast rate.
It is also expected that these increases will be partiallv offset by continued
improvements in labor productivitv, which has slightly less than doubled
during the same period. The increases in labor productivity, however, will
require more capital than before.
The future of factor prices and costs is, of course, highly
uncertain. Under a set of assumptions about future factor costs, Olliver 2/
estimated that the cost per ton of new capacities to come on stream by 1995
will be on the average 15% higher than the current level, and more than half
of this increase will result from coal qualitv deterioration. However, one
cannot rule out the possibility of much faster cost increases, considering the
fact that the average wage rate of miners is still less than US$1.50 per
1/ Temple, Barker and Sloane, Inc. and R.B. Olliver, "Export Coal Productionin the Republic of South Africa," a renort prepared for the World Bank,Februarv 1983.
2/ R.B. Olliver, "Steam Coal in South Africa," EIU Special Report No. 122,London, Anril 1982.
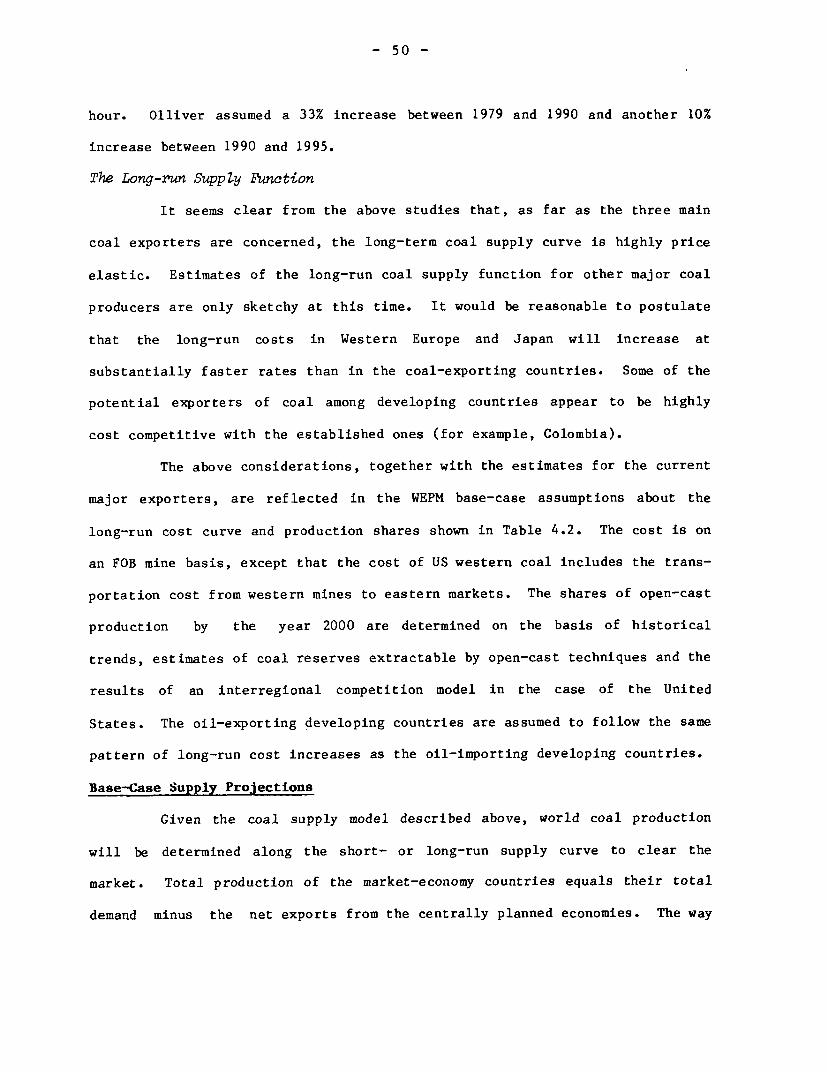
- 50
hour. Olliver assumed a 33% increase between 1979 and 1990 and another 10%
increase between 1990 and 1995.
The Long-run SuppZy Function
It seems clear from the above studies that, as far as the three main
coal exporters are concerned, the long-term coal supply curve is highly price
elastic. Estimates of the long-run coal supply function for other major coal
producers are only sketchy at this time. It would be reasonable to postulate
that the long-run costs in Western Europe and Japan will increase at
substantially faster rates than in the coal-exporting countries. Some of the
potential exporters of coal among developing countries appear to be highly
cost competitive with the established ones (for example, Colombia).
The above considerations, together with the estimates for the current
major exporters, are reflected in the WEPM base-case assumptions about the
long-run cost curve and production shares shown in Table 4.2. The cost is on
an FOB mine basis, except that the cost of US western coal includes the trans-
portation cost from western mines to eastern markets. The shares of open-cast
production by the year 2000 are determined on the basis of historical
trends, estimates of coal reserves extractable by open-cast techniques and the
results of an interregional competition model in the case of the United
States. The oil-exporting developing countries are assumed to follow the same
pattern of long-run cost increases as the oil-importing developing countries.
Base-Case Supply Projections
Given the coal supply model described above, world coal production
will be determined along the short- or long-run supply curve to clear the
market. Total production of the market-economy countries equals their total
demand minus the net exports from the centrally planned economies. The way
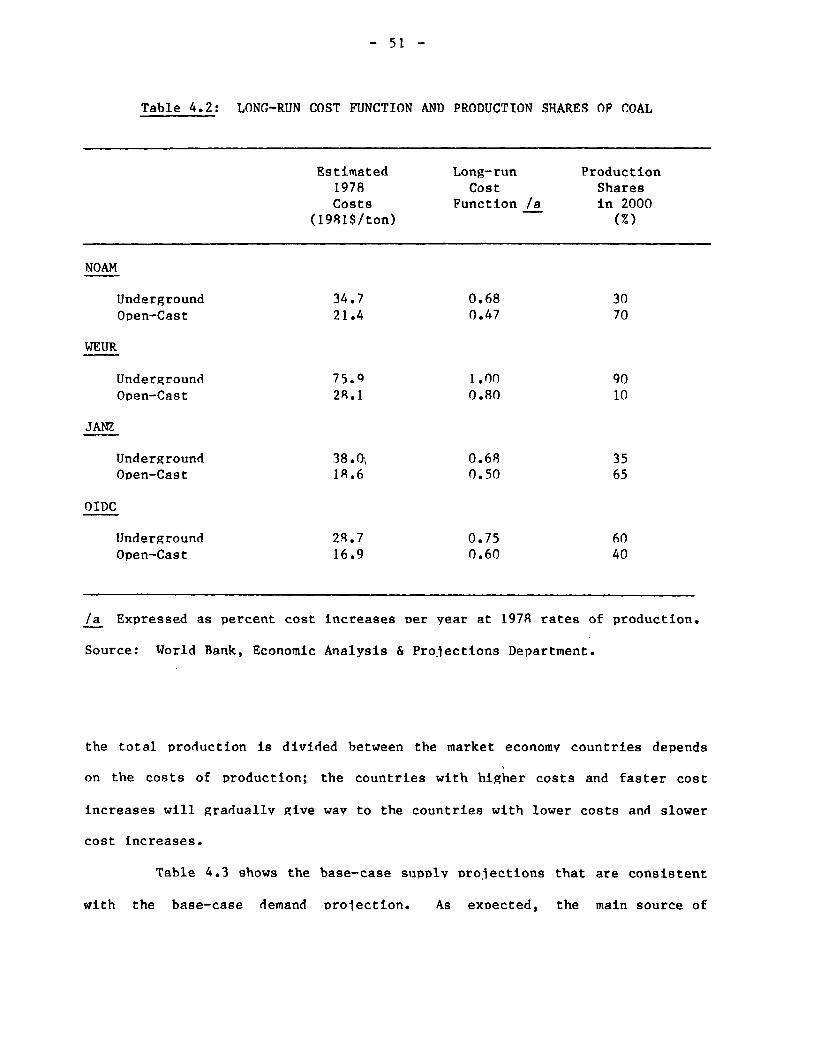
- 51 -
Table 4.2: LONG-RUN COST FUNCTION AND PRODUCTION SHARES OF COAL
Estimated Long-run Production1978 Cost SharesCosts Function /a in 2000
(1981$/ton) (x)
NOAM
Underground 34.7 0.68 30Open-Cast 21.4 0.47 70
WEUR
Underground 75.9 1.00 90Open-Cast 28.1 0.80 10
JANZ
Underground 38.0 0.68 35Open-Cast 18.6 0.50 65
OIDC
Underground 28.7 0.75 60Open-Cast 16.9 0.60 40
/a Expressed as percent cost increases Der year at 1978 rates of production.
Source: World Bank, Economic Analysis & Projections Department.
the total production is divided between the market economv countries depends
on the costs of production; the countries with higher costs and faster cost
increases will graduallv give way to the countries with lower costs and slower
cost increases.
Table 4.3 shows the base-case supplv Drojections that are consistent
with the base-case demand Drolection. As exnected, the main source of
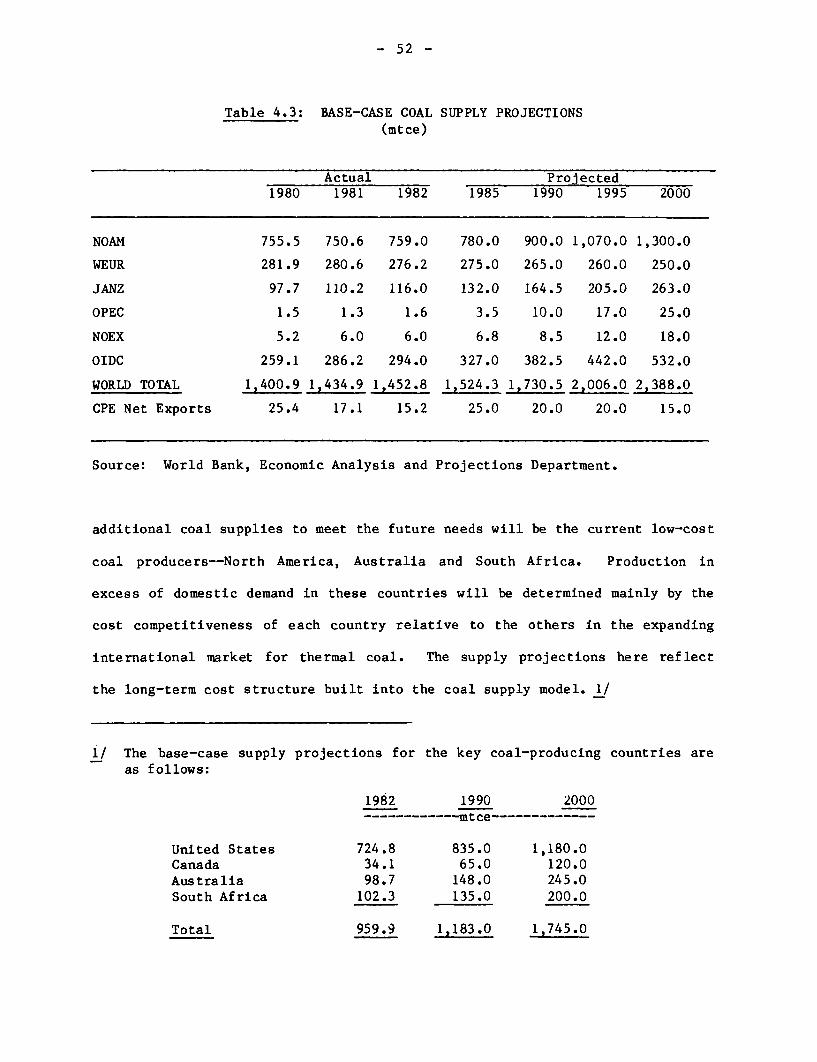
- 52 -
Table 4.3: BASE-CASE COAL SUPPLY PROJECTIONS(mtce)
Actual Projected1980 1981 1982 1985 1990 1995 2000
NOAM 755.5 750.6 759.0 780.0 900.0 1,070.0 1,300.0
WEUR 281.9 280.6 276.2 275.0 265.0 260.0 250.0
JANZ 97.7 110.2 116.0 132.0 164.5 205.0 263.0
OPEC 1.5 1.3 1.6 3.5 10.0 17.0 25.0
NOEX 5.2 6.0 6.0 6.8 8.5 12.0 18.0
OIDC 259.1 286.2 294.0 327.0 382.5 442.0 532.0
WORLD TOTAL 1,400.9 1,434.9 1,452.8 1,524.3 1,730.5 2,006.0 2,388.0
CPE Net Exports 25.4 17.1 15.2 25.0 20.0 20.0 15.0
Source: World Bank, Economic Analysis and Projections Department.
additional coal supplies to meet the future needs will be the current low-cost
coal producers--North America, Australia and South Africa. Production in
excess of domestic demand in these countries will be determined mainly by the
cost competitiveness of each country relative to the others in the expanding
international market for thermal coal. The supply projections here reflect
the long-term cost structure built into the coal supply model. 1/
1/ The base-case supply projections for the key coal-producing countries areas follows:
1982 1990 2000------------mtce-------------
United States 724.8 835.0 1,180.0Canada 34.1 65.0 120.0Australia 98.7 148.0 245.0South Africa 102.3 135.0 200.0
Total 959.9 1,183.0 1,745.0
- 53 -
Because of close cost competitiveness, market shares of these coun-
tries can he highly sensitive to changes in the relative cost configuration
that can be brought about not only by changes in factor costs but also by
exchange rate changes and transnort costs. An examDle is the sharp decline in
uIS production in lQR2-83 which resulted, among other things, from the
appreciation of the US dollar.
Western Europe and JaDan, despite efforts to maximize domestic coal
supplies, will face increasing difficulties in maintaining their current level
of production. The share of Western Europe in world production is projected
to decline from 19% in 1982 to 10% bv the vear 2000. Capital expenditures bv
the coal mining industry of Western Europe increased from less than 0.4
billion ECIJs (European Currency IJnits) in 1974 to 1.15 billion ECUs in 1979
and 1.65 billion ECTJs in 1980. The bulk of the increase was recorded in the
United Kingdom in new mines in Yorkshire and the Midlands. Coal production,
however, has not been commensurate with the increased exDenditure hecause of
rapid increases in caDital costs per ton of new capacity. New capacities
likelv to come on stream in the TJnited Kingdom will not he sufficient to
offset the closure of inefficient old mines elsewhere in Europe. The lack of
coal resources in Japan is also likely to limit production in that country to
no more than its current level.
Coal Transportation
Costs of coal transportation constitute a major component of the CIF
cost of thermal coal to the coal-importing countries. Table 4.4 shows the
transportation cost components as of 19R3 for the main international flows of
thermal coal.
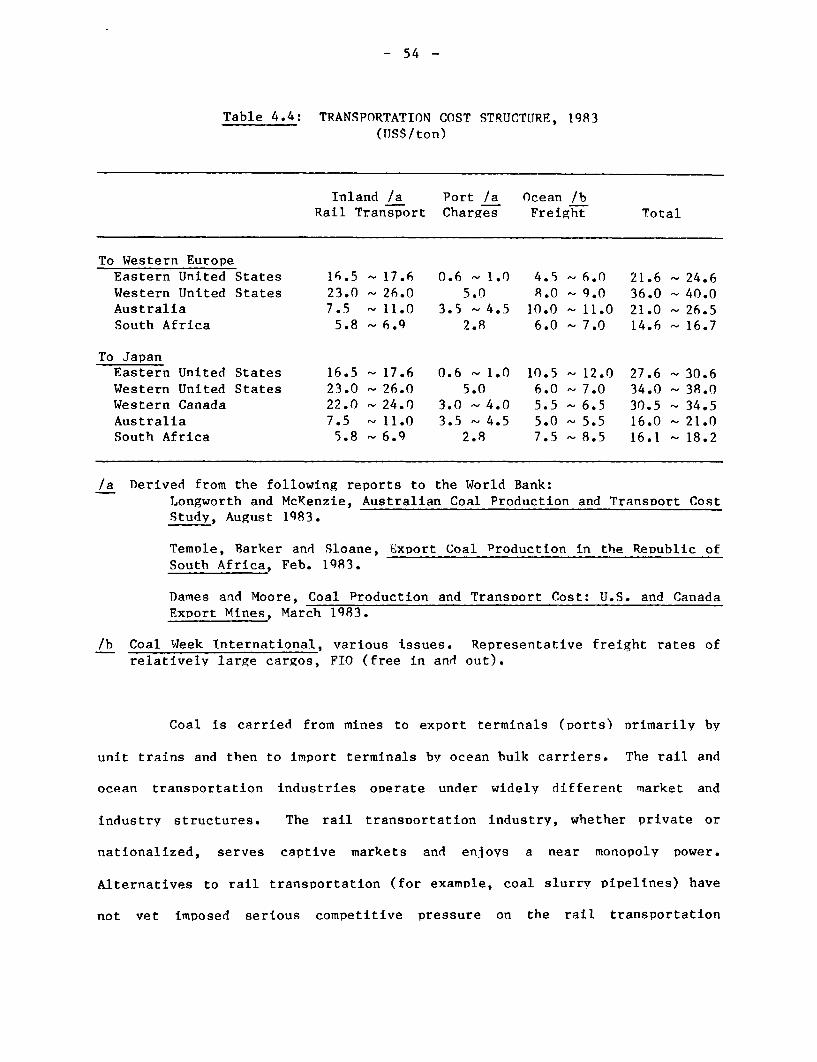
- 54 -
Table 4.4: TRANSPORTATION COST STRUCTURE, 1983(TJS$/ton)
Inland /a Port /a Ocean /bRail Transport Charges Freight Total
To Western EuropeEastern United States 16.5 - 17.6 0.6 - 1.0 4.5 - 6.0 21.6 - 24.6Western United States 23.0 - 26.0 5.0 8.0 - 9.0 36.0 - 40.0Australia 7.5 - 11.0 3.5 - 4.5 10.0- 11.0 21.0 - 26.5South Africa 5.8 - 6.9 2.8 6.0 - 7.0 14.6 - 16.7
To JapanEastern United States 16.5 - 17.6 0.6 - 1.0 10.5- 12.0 27.6 - 30.6Western United States 23.0 - 26.0 5.0 6.0 - 7.0 34.0 38.0Western Canada 22.0 - 24.0 3.0 - 4.0 5.5 6.5 30.5 - 34.5Australia 7.5 - 11.0 3.5 - 4.5 5.0 - 5.5 16.0 - 21.0South Africa 5.8 - 6.9 2.8 7.5 - 8.5 16.1 - 18.2
/a Derived from the following reports to the World Bank:Longworth and McKenzie, Australian Coal Production and Transport CostStudy, August 1983.
Temple, Barker and Sloane, Export Coal Production in the ReDublic ofSouth Africa, Feb. 1983.
Dames and Moore, Coal Production and Transport Cost: U.S. and CanadaExport Mines, March 1983.
/b Coal Week International, various issues. Representative freight rates ofrelatively large cargos, FIO (free in and out).
Coal is carried from mines to export terminals (ports) Drimarily by
unit trains and then to import terminals by ocean bulk carriers. The rail and
ocean transDortation industries oDerate under widely different market and
industry structures. The rail transDortation industry, whether private or
nationalized, serves captive markets and enjoys a near monopoly power.
Alternatives to rail transportation (for example, coal slurry pipelines) have
not vet imposed serious competitive pressure on the rail transportation
- 55 -
industry and are not likely to do so in the near future. As a result, the
rail freight rate in most of the coal-exporting countries (particularly, the
United States and Australia) has been maintained at high levels, considerably
above cost.
The ocean shipping industry, on the other hand, can be characterized
as being essentially a competitive industry. Ocean freight rates for coal
have declined considerably in recent years not only because of global
recession and reduced international trade but also because of increasing
proliferation of large coal vessels of 100,000-150,000 DWT class. For
example, it now costs less than $5.00 per ton to ship a large (100,000 tons
and above) cargo of coal from the US east coast to the major Western European
ports, compared with the lowest available freight rate of $15.00 per ton in
early 1981 for the same route.
The coal supply/demand outlook presented here assumes no significant
changes in the real costs of coal transportation. This is a reflection more
of the lack of firm understanding of the industry than of an informed judge-
ment. One can speculate, however, that the ocean freight rate can be further
reduced as larger vessels (possibly in the 200,000-300,000 DWT range) are
introduced. In such a case, a major upgrading of existing port facilities
will be required, which will involve substantially higher port charges. This
will make economic sense only when international coal trade volume increases
far beyond its current level, perhaps in the late 1990s.
There is obviously some room for rail freight rates to come down, but
such an eventuality is unlikely under the present industry structure. In the
United States the real freight rate of rail transportation of coal has been
increasing at an average annual rate of 4% in the 1970s. The rates have

- 56 -
reached the point where further increases would severely reduce competitive-
ness of US coal exports in international markets. A positive side to this
story is that the rail industry over the years has accumulated sufficient
capital to meet investment needs for future capacity expansion. In Australia,
the rail industry is a state enterprise and the rail rates have always been
set at high levels to expropriate a part of the economic rent of its coal
resources. Despite industry complaints, this policy is not likely to change.
In South Africa, on the other hand, the state-owned rail system has adopted
cost-based pricing of rail rates. This policy is expected to be continued in
future expansion of rail capacities, which incidentally are likely to cost
more than the existing rail system.
- 57 -
V. INTERNATIONAL TRADE AND EXPORT PRICES
The future volume of world trade in thermal coal will be determined
largely by the extent of increases in the demand for thermal coal in Western
Europe, Japan, and several newly industralizing developing countries. Table
5.1 shows the base-case projection of net trade 1/ of coal for the major
exporting and importing regions. The projected increases in trade will mostly
consist of thermal coal, particularly in the form of net imports of Western
Europe and Japan. The projected increases in metallurgical coal demand by the
iron and steel industry of Western Europe and Japan amount to less than 25
mtce over its 1982 level through the year 2000. Even if domestic production
of metallurgical coal in these regions declines in proportion to total coal
production, the net import requirements for metallurgical coal by the iron and
steel industry are not likely to increase by more than 35 mtce between 1982
and the year 2000. This implies that close to 90% of the incremental net
import requirements by these regions over the 18-year period will consist of
thermal coal.
The developing country net trade projections hide the anticipated
increases in imports by newly industrializing developing countries (for
example, Rep. of Korea, Turkey, Yugoslavia, Brazil, Mexico) for both thermal
and metallurgical coal. A large part of these increases is expected to be met
by increases in exports from Colombia, Indonesia, and South Africa.
Between 1982 and 1985, the net import demand for coal in Western
Europe, Japan and the developing market economies other than South Africa,
1/ Net trade is defined as the difference between gross exports and grossimports for the 1982 actuals, but as the difference between consumptionand production for the projections.
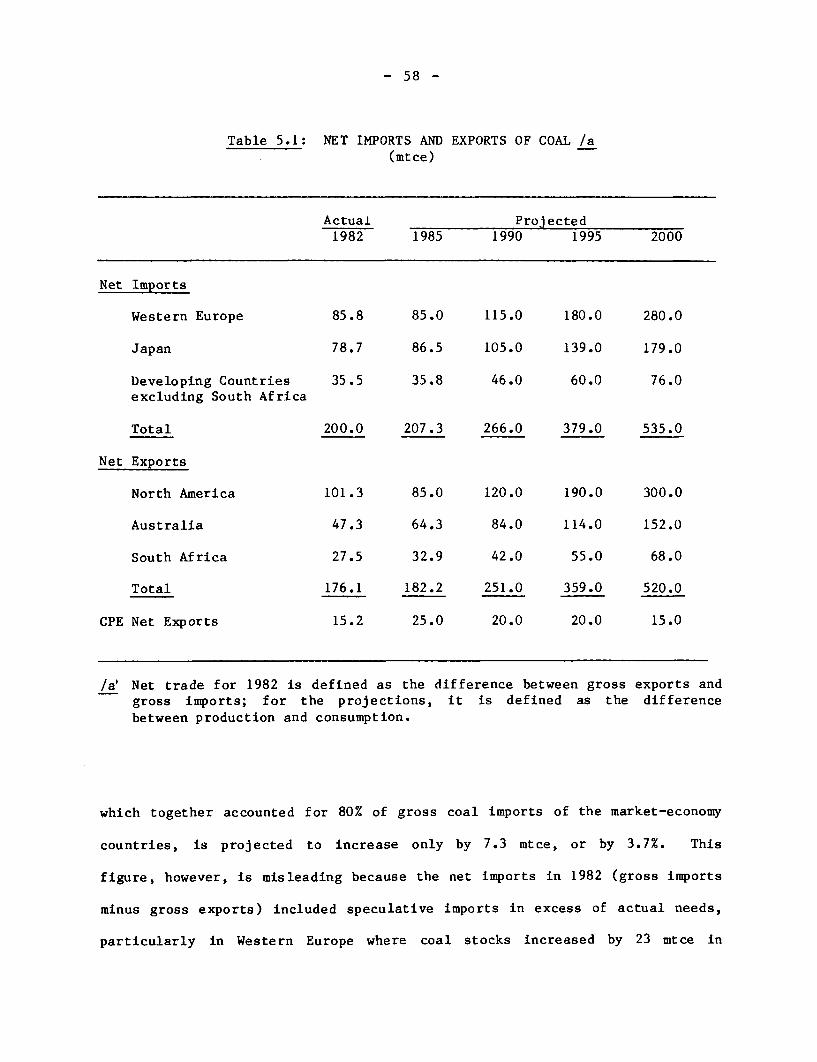
- 58 -
Table 5.1: NET IMPORTS AND EXPORTS OF COAL /a(mtce)
Actual Projected1982 1985 1990 1995 2000
Net Imports
Western Europe 85.8 85.0 115.0 180.0 280.0
Japan 78.7 86.5 105.0 139.0 179.0
Developing Countries 35.5 35.8 46.0 60.0 76.0excluding South Africa
Total 200.0 207.3 266.0 379.0 535.0
Net Exports
North America 101.3 85.0 120.0 190.0 300.0
Australia 47.3 64.3 84.0 114.0 152.0
South Africa 27.5 32.9 42.0 55.0 68.0
Total 176.1 182.2 251.0 359.0 520.0
CPE Net Exports 15.2 25.0 20.0 20.0 15.0
/a' Net trade for 1982 is defined as the difference between gross exports andgross imports; for the projections, it is defined as the differencebetween production and consumption.
which together accounted for 80% of gross coal imports of the market-economy
countries, is projected to increase only by 7.3 mtce, or by 3.7%. This
figure, however, is misleading because the net imports in 1982 (gross imports
minus gross exports) included speculative imports in excess of actual needs,
particularly in Western Europe where coal stocks increased by 23 mtce in
- 59 -
1982. The net import demand in 1982, defined as the excess of consumption
over production, amounted to only 174 mtce in 1982 for the three importing
regions combined. In terms of import requirements (demand in excess over
domestic supply), the projections imply an increase by 33 mtce between 1982
and 1985, or at 6% p.a. An increase of this magnitude is plausible in view of
the expectation for substantial economic recovery by 1985 in these regions
from the bottom of recession in 1982. The import demand for thermal coal in
Western Europe was extremely weak in 1983 when the countries in the region
worked off their excessive stocks. Stock drawdown in Western Europe probably
will continue through 1984, leaving little room for an increase in imports for
this year. A positive element from the point of view of the coal exporting
countries is the prolonged strike by the UK coal miners which threatens to
reverse UK's position from a net exporter to a net importer of coal. Japan,
which does not have a high stock level, presents some room for expansion for
both thermal and metallurgical coal imports in 1984. Prospects for developing
country markets in 1984 are also not promising, with several key developing
countries struggling with the problems of servicing large external debts.
Modest increases may be expected from Korea, Turkey and Spain. As a whole,
therefore, the international coal trade may see the start of a recovery in
1984, but the recovery is expected to be only in the order of 10-20 mtce
increases in world exports.
During the second and third quarters of 1984, uncertainty surrounding
the United Mine Workers' Union contract renegotiation in the United States,
magnified in part by the prolonged and bitter strike by the UK coal miners,
led to a highly unsettled situation in the international coal market. Pre-
cautionary stockpiling by the US electric utilities in fear of a prolonged
- 60 -
strike at a time of strong domestic demand resulted in substantial increases
in US domestic coal prices and a sudden jump in June in the US export price of
thermal coal by $10/ton (to $53.5/ton). The major importers of thermal coal
in Western Europe and Japan, apparently unwilling to pay the high US export
prices, have been attempting to tide over this period by turning to other
exporters (mainly South Africa and Australia) and by drawing down on stocks.
This has resulted in moderate increases in export prices of South African
thermal coal by $6-7/ton between May and August, and for Australian thermal
coal by $2-3/ton. Now that the contract has been settled without a strike,
the US export price is poised for a significant drop during the rest of this
year and early next year as the US electric utilities attempt to work off
their cumulated stocks. It is, however, likely that the price will not be
rolled back to its level in the first half of 1984, given the improvements in
market fundamentals.
The prospects for 1985 look substantially better than this year.
Steady recovery of demand coupled with substantial reduction of excessive
stocks in the previous year point to the likelihood of a sizable increase in
import demand in the major markets. The combined net imports of Western
Europe and Japan are projected to increase by about 50 mtce in 1985 over their
1983 level. The US export price in current dollars, therefore, is expected be
significantly above its 1983 level, although probably not sufficiently so to
catch up with inflation during the period. The recent 20% increase, however,
is not likely to be sustained through 1985. In view of the severely depressed
current level of US exports, an increase in the demand for US coal arising
from US dollar depreciation is not likely to lead to a significant increase in
US export prices. Instead, depreciation of the US dollar is likely to be
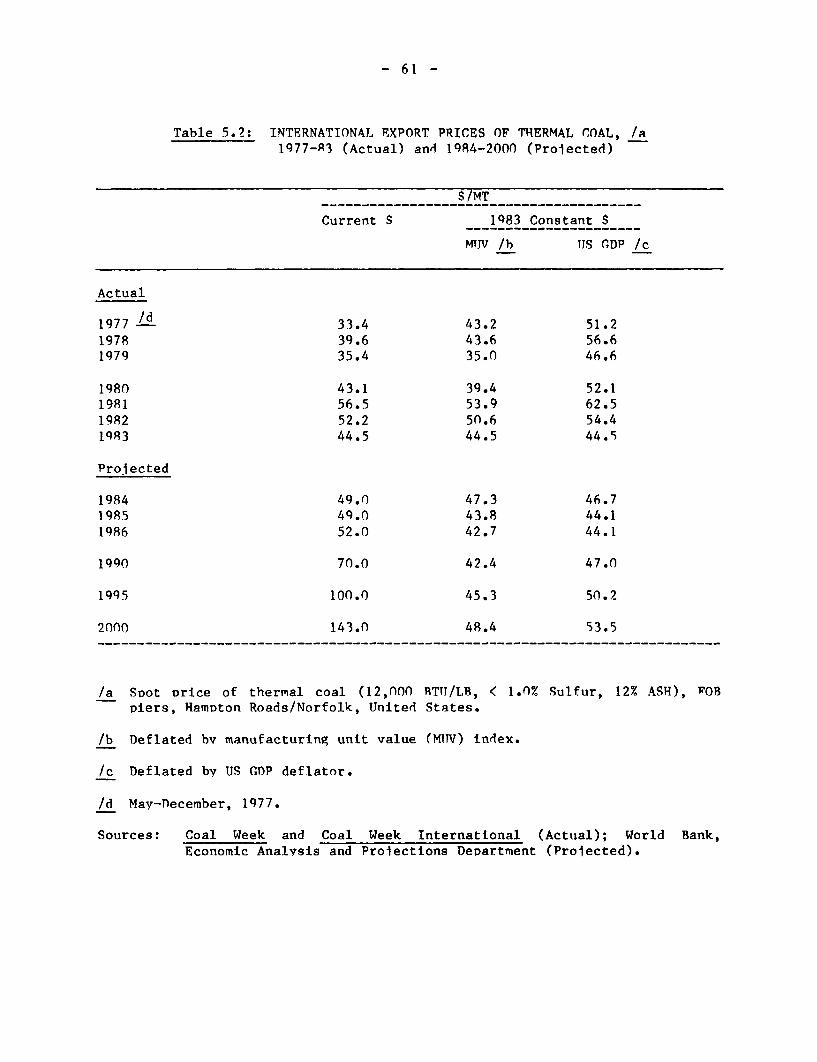
- 61 -
Table 5.2: INTERNATIONAL EXPORT PRICES OF THERMAL COAL, /a1977-R3 (Actual) and 1984-2000 (Projected)
S/MT
Current S 1983 Constant S
MliV /b IJS GDP /c
Actual
1977 /d 33.4 43.2 51.21978 39.6 43.6 56.61979 35.4 35.0 46.6
1980 43.1 39.4 52.11981 56.5 53.9 62.51982 52.2 5n.6 54.41Q43 44.5 44.5 44.5
Projected
1984 49.0 47.3 46.71985 49.0 43.8 44.11986 52.0 42.7 44.1
1990 70.0 42.4 47.0
1995 100.0 45.3 50.2
2000 143.0 49.4 53.5------------------------------------------------------------------- __--------_
/a SDot price of thermal coal (12,000 RTTJ/LB, < 1.0% Sulfur, 12X ASH), WOBDiers, HamDton Roads/Norfolk, United States.
/b Deflated bv manufacturing unit value (MTV) index.
/c Deflated by US GDP deflator.
/d May-December, 1Q77.
Sources: Coal Week and Coal Week International (Actual); World Bank,Economic Analysis and Proiections Devartment (Prolected).
- 62 -
absorbed mostly by raising the export prices of South Africa and Australia,
which will help boost the US export volume relative to those of South Africa
and Australia.
In the long term, world trade in thermal coal is projected to
increase rapidly, particularly in the 1990s. The long-term pattern of trade
is not likely to change significantly from what has transpired so far, except
for the emergence of several developing countries as exporters and importers.
The international market will continue to be dominated by the current major
trading partners--Western Europe and Japan on the one hand and North America,
Australia and South Africa on the other.
The international export price of thermal coal for the long term is
projected at the level of long-run supply and demand equilibrium. The
projected prices for 1990 and beyond are equal to the marginal cost of supply-
ing the equilibrium level of demand in those years. The marginal cost of US
coal exports is estimated to increase at 1.3% p.a. in real terms between 1985
and 1995, to meet US domestic demand and exports. This is equivalent to a
2.0% p.a. increase in the cost of mining, including mining wage rate increases
at the rate of per capita income growth. The cost of transportation from
mines to export terminals is assumed to remain constant at its present level.
In current dollar terms, the costs of coal production in the United
States are expected to be pushed up by US domestic inflation. It is assumed
that the effect of inflation on coal production costs will be neutral, i.e., a
one percent inflation will result in a one percent increase in coal production
costs. US domestic inflation is measured by the US GDP deflator; the long-
term coal price projections in 1983 constant dollars are converted into those
in current dollars by using the Bank's projected US GDP deflator.
- 63 -
Because of relativelv small weight of international trade in the US
economv, exchange rate adjustments usuallv have little imoact on TIS domestic
prices and hence on a measure of inflation such as G1)P deflator. The MUV
index, however, is significantlv affected bv exchange rate adjustments and the
Bank's Drojection of the index assurmes steadv eiepreciation of the US dollar
against major industrial countrv currencies, Dushing tlD the MIJV inflation by a
cumulative 13 percentage points between 1Q84 and 1989. Under the basically
competitive environment assumed for the international coal market in the long
term, the impact of US dollar depreciation is likely to be mostlv in the form
of an improvement in the competitive position of ITS coal exDorts instead of an
increase in US export prices. This will be a reverse of the process that
resulted from US dollar appreciation in recent years. As soon as exchange
rate adjustments are completed, the TJS exDort prices of thermal coal are
expected to rise in real terms when the MUV index is used as the deflator, to
register a net gain of 0.3% p.a. between 1985 and 1995. This much of a net
gain for thermal coal orices would be warranted when the OPEC crude oil prices
are proiected to increase in real MUV terms at 3.4% D.a. between 1985 and
1995.
- 64 -
REFERENCES
1. Abbey, David S. and Charles D. Kolstad, "The Structure of InternationalSteam Coal Markets," Los Alamos National Laboratory,; LA-UR-82-1869,1982.
2. Choe, B.J., "A Model of World Energy Markets and OPEC Pricing," WorldBank Staff Working Paper No. 633, Washington, D.C., March 1984.
3. Dames and Moore Inc., "Coal Production and Transportation Cost: U.S. andCanada Export Mines," Report prepared for the World Bank, Washington,D.C., March, 1983.
4. Dunkerley, Joy, "The Future of Coal in Western Europe," Resource Policy,September 1978, pp. 151-159.
5. European Coal and Steel Community, "Investment in the Community CoalMining and Iron and Steel Industries," Report on the 1981 Survey, 1982.
6. Energy Modeling Forum, "Coal in Transition: 1980-2000," EMF Report 2,vol. 1, Stanford, California, July 1978.
7. Gordon, R.L., Coal in the U.S. Energy Market (Lexington, Mass.: D.C.Heath and Co.), 1978.
8. International Energy Agency, World Energy Outlook, OECD/IEA, Paris,1982.
9. International Energy Agency, Coal Information Report, OECD/IEA, Paris,1983.
10. International Energy Agency, The Use of Coal in Industry, OECD/IEA,Paris, 1982.
11. ICF, Inc., "The Coal Supply Cost Function," Vol. 4 in Coal and ElectricUtilities Model, MIT Energy Laboratory Report No. MIT-EL 81-015,Cambridge, Mass., 1981.
12. Longworth and McKenzie, Ltd., and Hannes Walpole and Barlow, Ltd.,"Australian Coal Production and Transport Cost Study," Report preparedfor the World Bank, Washington, D.C., August 1983.
13. Office of Technology Assessment, The Direct Use of Coal (Cambridge,Mass.: Ballinger Publishing Co.), 1982.
14. OECD, Coal: Environmental Issues and Remedies, OECD, Paris, 1983.
15. OECD, Costs of Coal Pollution Abatement, OECD, Paris, 1983.
- 65 -
16. Quirk, James, K. Tevasawa, and D. Whipple & Col.), Coal Models and TheirUse in Government Planning (New York: Praeger Publishers), 1982.
17. Temple, Barker and Sloane, Inc., "Export Coal Production in the Republicof South Africa," Report prepared for the World Bank, Washington, D.C.,February, 1983.
18. U.S. Department of Energy, "National Coal Model," DOE/EIA-0428,Washington, D.C., September 1983.
19. Zimmerman, Martin B., The U.S. Coal Industry: The Economics of PolicyChoice (Cambridge, Mass.: The MIT Press), 1981.

W orld Bank Commodity Trade and Price tices and the effects of trade policy onTrends (1983-84 edition) output prices using nominal protection
coefficients. Builds a simultaneousPublicationis Historical information on the trade of supply/demand model for cotton and
developing countries and eighty mar- textiles that incorporates trade in tex-of Related ket price quotations for fifty-one com- tiles and cotton lint and the behaviorInterest modities that figure importantly in in- of textile mills. Used for five- and ten-
temational trade. Actual current and year projections given a range of pol-constant dollar prices are shown in icy alternatives. Part of continuingtabular and graphic form to indicate work on the long-run prospects of In-
Analysis of the World Cocoa commodity price movements relative dian agriculture.Market to the international price level. Staff Working Paper No. 618. 1983. 104Takamasa Akiyama and Ronald C. The Johns Hopkins University Press, jour- pages.Duncan nals Division. 1983. Annual. 173 pages. ISBN 0-8213-0322-8. Stock No. WP 0618.Commodity Working Paper No. 8. 1982. ISSN 0251-401X. Stock No. IB 0505 $20 $564 pages (including 4 annexes). paperback.Stock No. BK 9050. $3. French and Spanish translations are pro- Industrial Processing of
vided alongside the English in the same Natural Resourcesvolume. David Wall
Analysis of the World Coffee Control, Accountability, and Commodity Working Paper No. 4. 1979.
Tarkamas Aim adR alC. Incentives in a Successful 23 pages.Takamasa Akiyama and Ronald C. Development Institution: The Stock No. BK 9046. $3.
Commodity Working Paper No. 7. 1982. Kenya Tea Development International Cotton Market59 pages (including 4 annexes). Authority ProspectsStock No. BK 9049. $3. Geoffrey Lamb and Linda Muller M. Elton Thigpen,
Analyzes the institutional factors in with Maw-Cheng Yangthe success of the Kenya Tea Develop- Commodity Working Paper No. 2. 1978.
Case Studies on Industrial ment Authority. Draws lessons useful 72 pages (including 3 aNn .2exes).Processing of Primary Products to other development institutions.
Vol. 1 Bauxite, Staff Working Paper No. 550. 1983. 71Rubber,Tropical Hardwood pages. Natural RubberAnalyzes primary products of ISBN 0-8213-0118-7. Stock No. WP 0550. Theodore J. Goeringinterest to developing countries to A Examines recent developments in theprovide a basis for some general A Dynamic Simulation Model global rubber market that form the ba-principles regarding industrial of the World Jute Economy sis for establishing World Bank policiesprocessing in those countries. The Jock Anderson and others in lending for natural rubber produc-first of two volumes of case Staff Working Paper No. 397. 1980. 39 tion. Builds on a comprehensive studystudies based on a joint research pages (including references). of the world rubber economy that wasproject begun in April 1979 Stock No. WP-0391. $3. prepared jointly by the Bank and thebetween the World Bank and the Food and Agriculture Organization of
the United Nations in 1978. It alsoCommonwealth Secretariat. An Econometric Model of the takes note of several subsequent de-1983. 364 pages. World Rubber Economy velopments that are likelv to affect theISBN 0-8213-0154-3. Stock No. BK Enzo R. Grilli, Ray M. Helterline, demand for and supply of natural rub-0154. $20. and Peter K. Pollak ber.
Commodity Working Paper No. 3. 1979. Sector Policv Paper. 1982. 67 pages.Volume II. Cocoa, Coconut 44 pages. ISBN 0-8213-0045-8. $5.Oil, Tea Stock No. BK 9171. $3. The Outlook for PrimaryIn-depth study assesses the problems Commoditiesand potential benefits of processing NEW Enzo R. Grilli, editorthese primary products and gives pol- Commodity Working Paper No 9. 1982.icy recommendations. Considers the The Economics of Cotton 162 pages (including 3 annexes).most important factors in determining Cultivation in India: Supply Stock No. BK 0142. 55the partucular location of the process- and Demand for 1980-90 A S E ting chains, gains and losses that might Jon A Hitchin A Simultaneous Equationresult from the initiation or expansion Model of Price and Quantityof local processing, and selected policy Analyzes the contribution of irrigation Md eltfPic and Qu an ymeasures to relocate the processing ac- to the cotton production growth rate. Adjustments In World Prmarytivities so that a greater share of the Notes the returns to cotton cultivation Commodity Marketsvalue added accrues to developing over time. Discusses the potential for Erh-Cheng Hwacountry suppliers. increasing profitability through im- Staff Working Paper No. 499. 1981. 481983. 290 pages. proved varieties and cultivation prac- pages (including footnotes. retere,ices, ap-
ISBN 0-8213-0155-1. Stock No. BK 0155. pendix).$10. Stock No. WP-0499. $3.
Order both Volumes I and II (Stock No. IB0506) for $20 and save $10.
Tropical Hardwood Trade in The World Rubber Economy: World Rubber Marketthe Asia-Pacific Region Structure, Changes, and Structure and Stabilization: AnKenji Takeuchi Prospects Econometric StudyThe Philippines, Malavsia, and Indo- Enzo R. Grilli, Barbara Bennett C. Suan Tannesia could industrialize remote areas Agostini, and Maria J. 't Hooft- Examines the specification. estimation,and more than triple foreign-exchange Welvaars and validation of an econometricearnings through expansion of wood- The first integrated analysis of the nat- model of the world rubber market.processing operations. ural and synthetic rubber economies, Uses the model to forecast natural rub-The Johns Hopkins University Press, 1974. with a unique study of the relative ber prices and to analyze the implica-108 pages (including 3 annexes, statistical costs of production of the main kinds tions of natural rubber market stabili-appendix, references). of rubber. zation. Discusses problems of theLC 74-4214. ISBN 0-8018-7627-0, Stock The Johns Hopkins University Press, 1980. world rubber market, demand for rub-No. IH 1627, $5 paperback. 222 pages. ber products, supply of rubber, naturalWorld Bank Commodity LC 80-554. ISBN 0-8018-2421-4, Stock rubber export taxation, behavior of
No. IH 2421, SIO ~~~rubber stocks and prices. IllustratesModels No. JH 2421, $ the impact of national government in-Shamsher Singh, editor paperback. terventions in world commodity mar-
kets. Includes nine appendixes andCommodity Working Paper No. 6. 1981. bibliography.547 pages. The World Sugar Economy: An Commodity Working Paper. 1984. 424Stock No. BK 9048. 520. Econometric Analysis of Long- pages.
Term Developments Stock No. BK 0264. S20.Jos de VriesCommodity Working Paper No. 5. 1980.132 pages (including 2 annexes).Stock No. BK 9047. $5.
The World BankPublications Order Form
SEND TO: YOUR LOCAL DISTRIBUTOR OR TO. WORLD BANK PUBLICATIONS(See the other side of this,firm.) P.O. BOX 37525
WASHINGTON, D.C. 20013 U.S.A.
Date
Name Ship to: (Enter if different from purchaser)
Title Name
Firm Title
Address Firm
City State_ Postal Code_ _ Address
Country Telephone ( ) City State_ Postal Code_
Purchaser Reference No. Country e'Ilephone I
Check your method of payment.Enclosed is my Z Check 1l International Money Order Z Unesco Coupons D International Postal Coupon.Make payable to World Bank Publications for U.S. dollars unless you are ordering from your local distributor.
Charge my D VISA D MasterCard Z1 American Express Fl Choice. (Credit cards accepted only for orders addressedto World Bank Publications.)
Credit Card Account Number Expiration Date Signature
El Invoice me and please reference my Purchase Order No.
Please ship me the items listed below.
Customer intermalStock Number Author/ Title Routing Code Quantity Unit Price Total Amount S
All prices subject to change Prices may vary by country. Allow 6-8 weeks for delivery.
Subtotal Cost $_
Tbtal copies Air mail surcharge if desired ($2.00 each) $
Postage and handling for more than two complimentary items ($2.00 each) S_ _
Thtal S
IBRDs0053 Thank you for your order.
Distributors of World Attn~ Mr Giancarlo Bigazzi Attn Mr J.M. HernandezVia Lamarmora 45 ~~~~CastelIlo 37Bank Publications 5 0 I2 1amroriMadrid
ARGENTINA Florence SRI LANKA AND THE MALDIVESCarlos Hirsch. SRL, JAPAN Lake House BookshopAttn Ms. Monica Bustos Eastern Book Service Attn Mr Victor WalataraFlorida 165 40 pis Attn- Mr, Terumasa Hirano 41 Wad Ramanavake MawathaGaleria Guemes 37-3, Hongo 3-Chome, Bunkvo-ku 113 Colombo 2Buenos Aires 1307 Tokyo SWEDENAUSTRALIA, PAPUA NEW GUIINEA, KENYA ABCE Fritzes Kungi. Hov-bokhandelFIJI, SOLOMON ISLANDS, Africa Book Services IE A.) Ltd Attn- Mr. Eide Se,ferbackWESTERN SAMOA, AND Attn. Mr. MI B Dar Re rin~gatan I2, Box 16356VANUATU P.O. Box 45245 S-to3r2/ StockholmThe Australian Financial Review Nairobi SWITZERLANDInformation Service (AFRIS) KOREA, REPUBLIC OF Librairie PavotAttn Mr. David Jamieson Pan Korea Book Corporation Attn Mr Henrin de Perrot235-243 Jones Street Attn. Mr Yoon-_SunvlKm 6. rue GrenusBroadway PO Box 101. Kwanghwamun 1211 GenevaSydney. NSW 20001 Seoul TANZANIABELGIUM MALAYSIA Oxtord University PressPublications des Nations Unies L'niversitv ot Malaya Cooperative Attn Mr Anthony TheoboldAttn Mr jean de Lannov Bookshop Ltd. Maktaba Road, P 0 Box 5299av du Roi 202 Attn. Mr Mohammed Fahim Htj Dar es Salaam1060 Brussels Yacob THAILAND
CANADA ~~~~~~~~~~P.O. Box 1127, jalan Pantai Baru Central Depatment Store, Head OfficeLeNADifuAu Koala Lumpur Attn- Mrs. RWatanaAttn M0rs. Suzanne Vermette MEXICO 36SlmRaC P 85, Boucherville J41B 5E6 INFOTEC BangkokQuebec Attn: Mvr Jore Cefeda Thailand Management Association
COSTA RICA ~~~~~~~~San Loren.zo 1~53- I . Col del Valle, Attn Mrs. SaunanLibSerA TReICA Deleg Benito Juarez 308 Silom RoadAttn Mtr. Hugo Chamberlain 010Mxc,DF agoCalle 11-13. Av Fernandez Gueil MIDDLE EASTTUIA
San Jose ~~~~~~Middle East Marketing Research TNSoIAt uiine i itsoSan Jose ~~~~~~~~Bureau Attn Mr Slaheddine Ben Hamida
DENMARK Attn Mr George Vatsdiou ; Avenue de CarthageSanfundslitteratur %liti-is Bldg 3 TunisAttn: Mr Wilfried Rolotf %lakarios 61 AvenueRosenderns Alle II N'ictisa TURKEYDK-1970 Copenhagen V C~ prus Haset Kita pevi A SEGYPT, Arab Republic of (Branch oitfices in Bahrain, Greece, Akttn Mr. fzzet IzerelAl Ahram Mlorocco, Kuwait, United Arab 469. Istiklal CaddesiAl Galaa Street Emnirates. Jordan) Bevoglu-lstarnbulCairo NETHERLANDS UNITED KINGDOM AND
MIBE BV NORTHERN IRELANDFINLAND Attn Mr. Gerhard van Bussell Microinto Ltd.Akateeminen Kirjakauppa Noorderwal 38. Attn Mr Roy SelwynAttn- Mr Kari Litmanen 7241 BL Lochem Newman Lan'e, P 0 Box 3Keskuskatu 1, SF-00100 NORWAY Alton, Hampshire GU34 2PGHelsinki 10 Johan Grundt Tanum A 5 EnglandFRANCE Attn Ms Randi MlikkelborgUNTDSAEWorld Bank Publications P0Bo177enrmThe World Bank Book Store66. avenue dl6na Oslo I 600 19th Street, N W'75116 Paris PANAMA Washington. D C 20433GERMANY, Federal Republic of Ediciones Libreria Cultural Panamena (Postal address. P.O. Box 37525LNO.Verlag Attn. Mtr Lois Fernandez Fraguela R Washington, D C. 20013. U S A.)Attn Mvr Joachim Krause Ax' 7. Espana lb Baker and Tavlor CompanySimrockstrasse 23 Panama Zone 1 501 South Gla diola AvenueD-5300 Bonn I PHILIPPINES Momence, Illinois, 60954HONG KONG, MACAU National Book Store 380 Ediison Way
Asa2000 Ltd Attn Mrs Socorro C. Ramos Reno, Nevada: 89564Asia. M GrthnWaigSth701 Rizal Avenue 5,0 Kirby Avenue
6 Fl , 146 Prince Edward Road Mnl oevle e esv 87Kowloon PORTUGAL Commerce, Georgia 36599INDIA Livraria PortugalBennAscasUBS Publishers' Distributors Ltd Atti DO CArmono Al0-4 rin 9730-E George Palmer High wayAttn Mr D P Veer Lu oCro7-4Ianham, Marvland. 207615 Aknsari Road, Post Box 7015 I2 0tONew Delhi 110002 1 i.bon Blackwell North America. Inc
1001 Fries, Mill Road(Branch oftices in Bombay, Bangalore, SAUDI ARABIA Blackwood, New Jersey 08012Kanpur, Calcutta, and M{adras) Jarir Book Store
INDONESIA ~~~~~Attn: Mr AkramA-gi Sidney Kramer BooksPt Indiira Limited PO0 Box 3196 12 tet Attn- Mr. Bambang Wah-yuodi Rivadh Washington, D C. 20006JI. Dr. Sam Ratulangi No; 37 SINGAPORE. TAIWAN, BURMA United Nations Bookshop
Jakarta Pusat ~~~~~~~Information Publications Private. Ltd UntdNtiosPlzIRELAND Attn MIs Janet David New York, N.Y. 10017TDC Publishers 02-06 lot Floor, Pei-Fu Industrial VENEZUELAAttn. Mr. James Booth BuildingLbriadlEt12 North Frederick Street 24 New Industrial Road Libnrei deln Eseria
Dublin I Singapore ~~~~~~~~~~~~~Avda Francisco de Miranda, no. 52ITALY SPAIN Edificio GalZip an. Aptdo 60 337Licosa Comnmissionaria Sansoni SPA Mundi-Prensa Libros, S A. Caracas 1064-A

The World Bank
Headquarters European Office Tokyo Office1818 H Street, N.W. 66, avenue d'lena Kokusai BuildingWashington, D.C. 20433, U.S.A. 75116 Paris, France 1-1 Marunouchi 3-chome
Telephone: (202) 477-1234 Telephone: (1) 723-54.21 Chiyoda-ku, Tokyo 100, JapanTelex: WUI 64145 WORLDBANK Telex: 842-620628 Telephone: (03) 214-5001
RCA 248423 WORLDBK Telex: 781-26838Cable Address: INTBAFRAD
WASHINGTONDC
ISSN 0253-3537/ISBN 0-8213-0499-2