New product development benchmarks: The Japanese, North American, and UK consumer electronics...
17
New product development benchmarks: The Japanese, North American, and UK consumer electronics industries Nick Oliver a, * , Isabelle Dostaler b , Emma Dewberry c a Centre for Business Research, Judge Institute of Management Studies, University of Cambridge, Cambridge CB2 1AG, UK b Concordia University, Montreal, Canada c Goldsmiths College, London, UK Available online Abstract This paper presents the results of a study into new product development (NPD) in the high-end audio industry in Japan, North America, and the UK. A total of 38 companies were visited and interviewed, and detailed benchmarks of product development performance and practice were obtained from 21 companies and 31 NPD projects. Performance was gauged by several measures including lead times, cost and schedule adherence, internal and external quality, and product profitability. The organization of the development process was assessed through measures of project team composition, linkages between key constituencies of the development process (e.g., development, manufacturing, and suppliers), and processes of information capture and exchange. UK projects were generally executed more quickly than those in Japan and North America, but displayed a higher incidence of postlaunch problems. Japanese lead times were the longest, and Japanese companies performed relatively poorly on measures of development productivity. However, their manufacturing performance was vastly superior to that of Western companies. The paper concludes that organizational and national context significantly shapes NPD practice and that this is reflected in patterns of product development performance. D 2004 Elsevier Inc. All rights reserved. Keywords: New product development; Benchmarks; Consumer electronics industries 1. Introduction Many observers claim that pressures of global competition, the fragmentation of markets into smaller segments, and the rapid pace of change in many industries mean that companies’ product development capabilities are crucial determinants of business success (Brown & Eisenhardt, 1995; Clark & Fujimoto, 1047-8310/$ - see front matter D 2004 Elsevier Inc. All rights reserved. doi:10.1016/j.hitech.2004.03.006 * Corresponding author. Tel.: +44-1223-338179; fax: +44-1223-339701. E-mail address: [email protected] (N. Oliver). Journal of High Technology Management Research 15 (2004) 249 – 265
Transcript of New product development benchmarks: The Japanese, North American, and UK consumer electronics...
Journal of High Technology
Management Research 15 (2004) 249–265
New product development benchmarks: The Japanese,
North American, and UK consumer electronics industries
Nick Olivera,*, Isabelle Dostalerb, Emma Dewberryc
aCentre for Business Research, Judge Institute of Management Studies, University of Cambridge, Cambridge CB2 1AG, UKbConcordia University, Montreal, Canada
cGoldsmiths College, London, UK
Available online
Abstract
This paper presents the results of a study into new product development (NPD) in the high-end audio industry
in Japan, North America, and the UK. A total of 38 companies were visited and interviewed, and detailed
benchmarks of product development performance and practice were obtained from 21 companies and 31 NPD
projects. Performance was gauged by several measures including lead times, cost and schedule adherence, internal
and external quality, and product profitability. The organization of the development process was assessed through
measures of project team composition, linkages between key constituencies of the development process (e.g.,
development, manufacturing, and suppliers), and processes of information capture and exchange. UK projects
were generally executed more quickly than those in Japan and North America, but displayed a higher incidence of
postlaunch problems. Japanese lead times were the longest, and Japanese companies performed relatively poorly
on measures of development productivity. However, their manufacturing performance was vastly superior to that
of Western companies. The paper concludes that organizational and national context significantly shapes NPD
practice and that this is reflected in patterns of product development performance.
D 2004 Elsevier Inc. All rights reserved.
Keywords: New product development; Benchmarks; Consumer electronics industries
1. Introduction
Many observers claim that pressures of global competition, the fragmentation of markets into smaller
segments, and the rapid pace of change in many industries mean that companies’ product development
capabilities are crucial determinants of business success (Brown & Eisenhardt, 1995; Clark & Fujimoto,
1047-8310/$ - see front matter D 2004 Elsevier Inc. All rights reserved.
doi:10.1016/j.hitech.2004.03.006
* Corresponding author. Tel.: +44-1223-338179; fax: +44-1223-339701.
E-mail address: [email protected] (N. Oliver).

N. Oliver et al. / Journal of High Technology Management Research 15 (2004) 249–265250
1991; Schilling & Hill, 1998). As organizational success often depends on the timely and consistent
introduction of new products, it is unsurprising that the new product development (NPD) literature
contains many prescriptions for high-performance product development (Brown & Eisenhardt, 1995;
Clark & Fujimoto, 1991; Crawford, 1992; Griffin, 1997; Lee, Lee, & Sonder, 2000; Loch, Stein, &
Terwiesch, 1996; Parnaby, 1995).
However, there are many difficulties in assessing the effectiveness of development activities (Loch et
al., 1996; Schumann, Ransley, & Prestwood 1995), aside from the difficulty of defining the concept of
success in NPD itself. For example, recognizing that innovation has multiple dimensions, Gopalak-
rishnan (2000) distinguishes between rapid new product introduction, namely, innovation speed, and the
number of new products introduced, that is, innovation magnitude. However, speed and magnitude do
not capture the full extent of successful NPD. For example, an engineering function may be very good at
rapidly developing numbers of new products, yet, these products may fail to meet customers’
expectations and/or generate significant revenues and profit. Although studies have examined the
relationship between product development processes and product success (Clark & Fujimoto, 1991;
Cooper & Kleinschmidt, 1996), difficulties in assessing success have meant that the focus is often on
process performance, as indicated by measures such as lead times, engineering hours, and late design
changes. Indicators of how the product is received in the market are often neglected in such studies.
This paper reports the findings of a study into NPD performance and practice in the consumer
electronics industries in Japan, North America, and the UK. The study focused on two main issues. The
first of these was the problem of measuring the performance of NPD processes. This study specifically set
out to take multiple measurements of performance and to investigate the associations between them. The
results question whether it is sensible to adopt a unitary conception of good NPD and imply that product
development performance may be better conceived as a profile, where high performance on some
elements, perhaps of necessity, means lower performance on others. The second issue addressed by this
paper concerns national differences in of NPD performance and practice. Much of the literature on NPD is
preoccupied with identifying prescriptions for universal best practice and consequently tends to neglect
how practice—and performance—may be shaped by national and institutional context. This paper
proposes an integrative conceptual framework combining various levels of analysis, such as the national
and institutional contexts, that should be considered when studying NPD. The paper thus explores some of
these differences by comparing patterns of NPD in Japanese, North American, and UK companies in the
consumer electronics industry. In contrast to the picture of Japanese superiority in innovative performance
in the 1980s, the results present a mixed picture. This points to a need to conceive of the product
development process as one in which there are trade offs between various performance dimensions. While
some commentators believe in the existence of a global formula for successful NPD (Lee et al., 2000), the
results presented here question the existence of universal best practices and indicate that different
companies, in different contexts, resolve NPD performance trade offs in different ways.
2. Theoretical background
2.1. NPD practices
Practices supportive of successful product development, whether judged by product or process
performance, may be analysed at a number of levels, the two main levels being the company and

N. Oliver et al. / Journal of High Technology Management Research 15 (2004) 249–265 251
the individual development project (Clark & Fujimoto, 1991; Wheelwright & Clark, 1995). Good
practice has been characterized by team-based organization and product champions (Markham &
Griffin, 1998; Wheelwright & Clark, 1995), formalized (but flexible) design and development
processes (Iansiti, 1995), cross-functional integration (Cooper, 1995; Dimanescu, 1992; Keller,
2001; McDonough, 2000; Tatikonda & Montoya-Weiss, 2001), and high autonomy and authority
on the part of project leaders (Clark & Fujimoto, 1991; Crawford, 1992; Jassawella & Sashittal,
2000).
The organization of development teams within the NPD process has received extensive attention
(Wheelwright & Clark, 1995). In particular, relatively autonomous, multifunctional teams have been
advocated as routes to effective product development. However, it is recognized that although project
team organization is significant, so are appropriate techniques of planning, controlling, and communi-
cation (Clark & Fujimoto, 1991; Munns & Bjeirmi, 1996). Concurrent engineering has been widely
advocated as a tool for reducing time-to-market, as has the related practice of overlapping different
stages of the development process (Birou & Fawcett, 1994; Haque & Pawar, 2001; Iansiti, 1995;
Thomke, 1997), although McDermott and Handfield (2000) have recently suggested that concurrent
development activities are not suitable for radically new projects.
Given that many products comprise a high proportion of components from suppliers, the ability to
manage interactions with external parties is also clearly important. Good practice is said to involve the
early integration of customer requirements into the design process (Gruner & Homburg, 2000; Huang,
Soutar, & Brown, 2002; Khurana & Rosenthal, 1997; Neale & Corkindale, 1998; Souder, Buisson, &
Garrett, 1997), the extensive involvement of suppliers (Birou & Fawcett, 1994; Handfield, Ragatz,
Peterson, & Monczka, 1999; LaBahn, 2000; McGinnis & Vallopra, 1999), and the early inclusion of
manufacturing personnel in concept generation (Ettlie, 1995; Srinivasan, Lovejoy, & Beach, 1997;
Swink, 1999). Such actions facilitate the inclusion of downstream information at the front-end of the
process, thereby decreasing the probability of problems later in the project, when solutions may be much
more costly.
Strong supplier relationships, it is claimed, are linked to growth and profitability (Karlsson &
Ahlstrom, 1996). There are a number of reasons for this. Supplier involvement in the cost-determining,
early stages of the design process allows for customer access to suppliers’ technological and design
expertise. Long-term commitment from a buyer to suppliers encourages suppliers to be more creative, to
accept risk, and to make investments in technology and R&D relevant to that buyer. Close relationships
facilitate communication of greater quality and consistency between buyers and suppliers than do
distant, antagonistic ones (Birou & Fawcett, 1994).
Cusumano and Nobeoka (1998) emphasize the need to consider product development projects as part
of a portfolio. They argue that good practices at project level, such as those described above, should be
combined with a multiproject thinking, allowing organizations to make the best out of potential
connections between projects that share technologies and components.
Some authors have combined the above practices to create integrative models of NPD. The Academy
of Management article of Brown and Eisenhardt (1995) is probably the best-known example of this and
has inspired a large amount of research (e.g., Song & Montoya-Weiss, 2001). Similarly, Cusumano and
Nobeoka (1998) distinguish between what they call ‘‘lean product development,’’ a model which
combines many of the practices described above, and the more traditional ‘‘functional product
development,’’ in which there are lightweight project coordinators, high levels of in-house engineering,
and less need for cross-strong functional integration.

2.2. NPD performance
In this paper, NPD performance is conceived as a multidimensional concept that includes the
performance of the development process itself, the performance of the product, and financial
performance. The latter is considered as an outcome of both process and product performance (Brown
& Eisenhardt, 1995). Product performance refers to the success of the product in the market place and
addresses whether the product development process has led to the creation of a product that is attractive,
functional, and reliable. This is what Brown and Eisenhardt (1995, p. 34) call the ‘‘fit with market
needs.’’ Product performance can be gauged by indicators such as sales and market share, the number of
awards received, and the number of customer returns. In their study of NPD in the automotive industry,
Clark and Fujimoto (1991) used a ‘‘total product quality’’ indicator based on general measures of
customer satisfaction. In their recent review of research in product development, Krishman and Ulrich
(2001) argue that different academic fields differ in the emphasis that they place on different metrics of
product development performance. For example, research conducted from a marketing perspective tends
to focus on the fit to market, while engineering design is primarily concerned with the form and function
of the product. This study attempts to integrate these perspectives.
The indicators of NPD process performance typically include schedule and budget adherence (Keller,
2001), as well as lead time (or speed) and productivity (Brown & Eisenhardt, 1995; Clark & Fujimoto,
1991; Eisenhardt & Tabrizi, 1995), with Iansiti (1995) distinguishing between concept and development
lead time. As mentioned above, external quality is a key indicator of the performance of the product
developed. However, internal failure rate can also be regarded as a measure of the performance of a
development process. Indeed, it has been estimated that as many as 85% of manufacturing problems
N. Oliver et al. / Journal of High Technology Management Research 15 (2004) 249–265252
Fig. 1. Integrative framework.

N. Oliver et al. / Journal of High Technology Management Research 15 (2004) 249–265 253
have their genesis in poor initial design (Schonberger, 1982). A consistent NPD process should result in
fewer manufacturing problems and, thus, in fewer requests for engineering changes.
2.3. An integrative framework
Fig. 1 illustrates the conceptual framework used for this research. Integrating three levels of analysis,
the proposed model focuses on factors that the literature suggests: the process, product, and financial
performance.
The first level of analysis focuses on the NPD process itself. This level covers practices supportive of
high performance, such as concurrent engineering, the early inclusion of the views of manufacturing,
colocation, stability of team membership, good communication, project planning and control, strong
project leadership, and so on. However, a product development project is conducted in a specific context
and will be shaped by this context. The dotted border of the product development process performance
box in Fig. 1 illustrates the porous barrier between product development projects, the general approach
to NPD in the company (second level of analysis), as well as the institutional and national context (third
level of analysis) in which the projects are conducted. This framework questions the concept of universal
best practice by recognizing that national and organizational characteristics shape product development
practices, which, in turn, drive NPD performance.
3. Methods
Data to test this research framework were gathered during a benchmarking study of the NPD
processes of 38 consumer electronics firms in Japan, North America, and the UK. The study followed
the style and approach of the study of Clark and Fujimoto (1991) of the automotive industry but focused
on consumer electronics (specifically, high-end audio equipment for home use). The emphasis was on
like-for-like comparison across NPD projects.
As the focus of the research was on the organization of the NPD process, the study targeted products
sufficiently complex to require a range of specialist skills to develop and produce them. Audio products
comprise internal functional electronic components, requiring the skills of electronics, software,
mechanical, and acoustic engineers, as well as those of industrial designers; there are therefore
significant coordination and integration challenges. Audio products also require a substantial number
of bought in parts; hence, they are also suitable for investigating supplier involvement in the
development process. Being manufactured products, high-end audio products also reveal issues around
the manufacturing/development interface.
The identification of audio companies in each of the three regions was undertaken using a variety of
methods—contacts with trade associations, address lists from trade fairs and other sources, discussions
with industry observers, and examination of products in the marketplace. Companies with 50 employees
or more, who developed and produced amplifiers and loudspeakers, were targeted; in very small
companies, much of the process is embedded in the heads of a small number of people and is therefore
difficult to investigate. Companies were identified, approached, and an initial meeting and interview
requested. These interviews typically lasted between 2 and 3 h and reviewed the nature and character-
istics of each firm’s NPD process. They were usually conducted with the Product Development Director
or the Manager. In line with the integrative research framework, a protocol containing open-ended

N. Oliver et al. / Journal of High Technology Management Research 15 (2004) 249–265254
questions about the company’s general approach to NPD was used to conduct these initial interviews.
These open-ended questions were also used as triggers to uncover the factors that shape the process,
thereby giving clues to the institutional and national characteristics that influence the NPD process.
As Table 1 shows, a total of 38 companies participated in the first stage of the research, comprising
8 companies located in Japan, 14 in the UK, and 16 in North America. At the end of this process,
recently launched products were identified for inclusion in the subsequent and more detailed data
collection process, and the companies were invited to take part in a full benchmarking exercise.
Participation in this exercise involved the completion of two questionnaires. The first of these covered
company characteristics (in the case of large multidivisional companies, this typically referred to an
appropriate business unit within the whole corporation) and the characteristics of the product
development process in the company or business unit as a whole.
The second questionnaire covered a recently completed NPD project and comprised measures of
development performance and practice. Each company provided data on one or two projects; a separate
questionnaire was completed for each project. A total of 21 companies participated in the full
benchmarking exercise, comprising a total of 31 NPD projects. Companies were given several weeks
to complete the benchmarking questionnaire. The research team then returned to each site for a second
visit and reviewed the completed questionnaires on site. Following data analysis, each company was
issued with a benchmarking report, showing its position on over 100 measures of NPD performance and
practice.
3.1. The questionnaires
While the higher level of the integrated framework were covered during the initial interviews, the
benchmarking questionnaires operationalized the lower levels of the framework. The questionnaire on
company or business unit characteristics contained a total of 43 items. The questionnaire took measures
such as annual value of sales, number of employees, profitability, and so forth, over the preceding 3
years. It covered issues of NPD, using indicators such as the breadth of the product portfolio, production
volumes, expenditure, and headcount on NPD, market share, patenting activity, and percentage of sales
going to export. This questionnaire also reviewed the company’s emphasis on, and management of,
NPD, covering issues such as the percentage of revenue derived from recently launched products, the
number of NPD projects active at any one time, NPD organization and leadership, the presence or
absence of a formal NPD process, and information flows and staff exchanges between the development
function and other functional areas.
The project questionnaire covered two main areas, namely, (a) the NPD practices used during the
chosen project and (b) a portfolio of performance measures relating both to the product itself and to the
Table 1
Companies and projects
Total number of
companies interviewed
Number of companies
(benchmarking data)
Number of
NPD projects
Japan 8 3 4
UK 14 7 10
US/Canada 16 11 17
Total 38 21 31

N. Oliver et al. / Journal of High Technology Management Research 15 (2004) 249–265 255
process which created it, as illustrated in Fig. 1. Product profitability was taken as a major performance
indicator, measured by revenues generated by the product in relation to its development costs. Product
characteristics include desirability, functionality, and reliability. Desirability and functionality were
gauged by sales performance, and reliability by warranty data. Process characteristics were covered by
measures such as concept to production time, engineering hours and cost adjusted for product novelty,
and complexity and accuracy of forecasting (of costs, lead times, sales, etc.).
For NPD practice, the questionnaire covered issues such as the size and composition of development
teams, the frequency of interaction between the members of the team and others in the organization, the
methods of information recording and capture, the concurrency of the process, and the closeness of the
linkages with other constituencies, for example, manufacturing, suppliers, and so on. In combination, the
data from the business unit and project questionnaires yielded a dataset of 473 fields per case.
3.2. Data analysis
Comparison between the two product areas (loudspeakers and amplifiers) revealed a number of
significant differences on the performance measures due to inherent differences in the characteristics of
the products. Performance measures were therefore converted into standard (z) scores for each product.
Simple regression analysis between these multiple performance indicators indicated some clusters of
intercorrelation. However, it was striking that overall, there did not appear to be a single common
performance factor with which all the performance measures correlated. This initial result questions the
assumption of a common underlying performance construct for NPD. A factor analysis of the multiple
performance measures was then performed to investigate whether the multiple measures could be
reduced to a set of common factors. Two main factors emerged, a ‘planning and control’ factor and a
‘profitability/efficiency’ factor. The planning and control factor comprised five items:
� time for productivity to settle to target levels,� the deviation in actual concept to production time from planned,� the deviation between actual and forecast costs,� the deviation between actual and forecast sales, and� external defect rate.
The profitability/efficiency factor comprised four items:
� development hours per new part,� development cost per new part,� product cost as a percentage of recommended retail price (RRP; an indicator of gross margin), and� development cost as a percentage of gross profit in the first six months of the product’s life.
The presentation of the results is therefore grouped around these clusters.
The next section of the paper presents the results broken down by region—Japan, the UK, and North
America. These comparisons are based on the objective measurements taken with the benchmarking
questionnaires and on the qualitative material collected during the interviews. We see how the various
regions performed in terms of planning and control and in terms of profitability and efficiency. We then
proceed to identify the NPD practices typically used in the three regions, uncovering the company

N. Oliver et al. / Journal of High Technology Management Research 15 (2004) 249–265256
approach to NPD and the more general institutional and national context in which the NPD projects
studied were conducted.
4. Results
4.1. Company characteristics
Table 2 shows the characteristics of the companies in the three regions covered by the research.
Although Japan is generally known for mass market, rather than high-end, products in the audio
industry, many of the major corporations also produce high-end products. In Japan, high-end audio
products are typically produced by specialist divisions of the major electronics corporations. These
divisions are relatively self-contained and autonomous within their parent companies. Even so, the total
production volumes of these divisions were much higher than in the UK or North America—
approximately 25 times higher than that of the United States and 75 times higher than that of the
UK. As we shall see shortly, these greater volumes are largely due to the greater product ranges of the
Japanese divisions, rather than much higher volumes of individual products. The annual sales showed a
similar pattern, as did the number of employees.
In terms of growth and profitability, the North American companies showed both the strongest growth
and the highest profit margins. A number of Japanese companies had been making a loss in the 2 to 3
years preceding the study, and the overall average of profit margin on sales for Japan was 0.9%,
approximately one-seventh of the figure for the United States. The relatively buoyant condition of the
U.S. economy at the time that the study was conducted may be one explanation of this, as the North
American firms were relatively dependent on a domestic market, with the lowest export ratio of the three
countries. This illustrates the significance of the third level in the framework, the national/institutional
level, in shaping performance and practice.
Table 3 summarizes the general patterns of NPD found across the three regions. The Japanese
companies clearly show more innovative activity than their UK or North American counterparts,
specifically, percentage of sales from recently launched products, patents, and the number of people—
and products—in development.
The effect of scale is clearly discernible in these figures. However, if the number of development
projects in progress is divided by the number of development staff, the Japanese firms show more
modest levels of activity—less than one development project per member of development staff
compared with two in the UK and three in the Unite States. Expenditure on R&D as a percentage of
Table 2
Company characteristics
Japan UK N. America
Production volumes (units) 8,199,402 130,794 337,801
Annual sales (average for last 3 years) [US$] 621,248,816 20,799,864 45,967,232
Profit margins (averaged over last 3 years) [%] 0.9 5.4 6.5
Number of employees (averaged over last 3 years) 1082 115 174
Mean annual growth (average over last 3 years) [%] + 2.5 + 9.1 + 15.4
Percentage of sales exported 59.2 69.5 43.4

Table 3
New product development patterns
Japan UK N. America
R&D expenditure as a percentage of sales 5.7 4.8 5.7
Percentage of sales from products launched in last 2 years 84.7 68.8 44.5
Number of people in development 208 12 19
Number of development projects started in last 3 years 162 25 16
Development projects started per member of development staff 0.7 1.8 3.0
Average number of patents per company (registered in last 3 years) 430.0 0.9 13.9
N. Oliver et al. / Journal of High Technology Management Research 15 (2004) 249–265 257
sales is identical for Japan and the United States, at approximately 6%, with the UK lagging
approximately one percentage point behind the other two regions.
4.2. Product development performance
The initial data analysis led to a combination of the various performance measures into two clusters:
planning and control and a profitability/efficiency clusters. This section compares how the various
regions performed in terms of planning and control and in terms of profitability and efficiency and
explores the association between them.
Table 4 shows that the Japanese and North American projects both overran their original schedules by
a margin of 15% to 16%. The UK projects were also late, although by a much smaller margin. This
picture is reversed for deviations between actual and forecast product costs, with the UK showing the
largest deviation of just over 4% over target and Japan the lowest, with less than 1% over. It appears that
firms are trading off schedule against cost adherence, with the U.S. and Japanese firms spending longer
on development than they had anticipated to stay closer to product cost targets. Projects in all three
countries exceeded their forecast sales by 20% to 30%, indicating that overall, these products had
achieved greater success in the marketplace than had originally been envisaged, although the UK and
U.S. deviations were larger than those in Japan. This is probably a function of sampling, as each firm
was asked to put forward an example of what it considered to be a good project.
The two measures that really separate Japanese projects from their UK and North American
counterparts both concern the development/manufacturing interface. Productivity in Japan takes a mere
2.5 weeks to settle to target levels compared with 6 weeks in the UK and over a month in North
America. Similarly, the external defect rate (as indicated by the number of returns under warranty in the
first 6 months of production) is approximately 20 times greater in North America and the UK than in
Japan. It was clear that the Japanese paid great attention to manufacturability, with, in one case, nearly
Table 4
Performance data I: planning and control
Japan UK N. America
Percentage deviation from schedule 15.5 4.6 15.4
Actual vs. forecast costs (%) + 0.9 + 4.3 + 3.1
Deviation between forecast and actual sales (%) + 21.7 + 29.8 + 28.7
Time for productivity levels to settle (weeks) 2.5 5.8 4.4
External defect rate (ppm) 716 15,419 13,969
N. Oliver et al. / Journal of High Technology Management Research 15 (2004) 249–265258
50% of development hours going into manufacturing engineering issues. National differences on these
measures may be tangible manifestations of this difference in emphasis, which may have its genesis in a
culture of uncertainty avoidance and consequent up-front effort in problem solving.
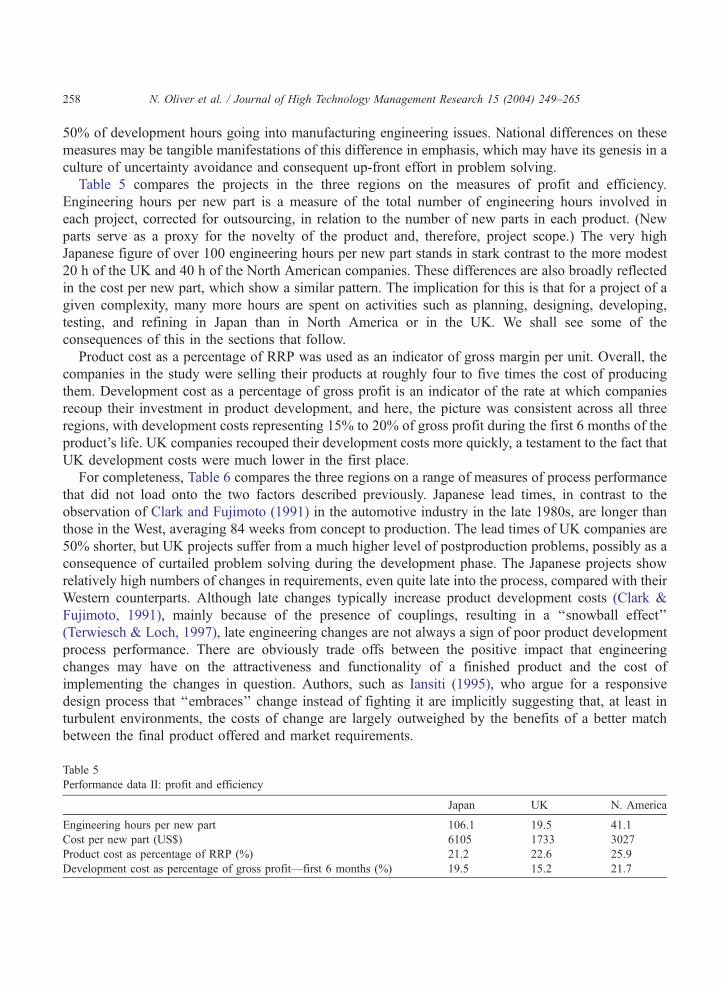
Table 5 compares the projects in the three regions on the measures of profit and efficiency.
Engineering hours per new part is a measure of the total number of engineering hours involved in
each project, corrected for outsourcing, in relation to the number of new parts in each product. (New
parts serve as a proxy for the novelty of the product and, therefore, project scope.) The very high
Japanese figure of over 100 engineering hours per new part stands in stark contrast to the more modest
20 h of the UK and 40 h of the North American companies. These differences are also broadly reflected
in the cost per new part, which show a similar pattern. The implication for this is that for a project of a
given complexity, many more hours are spent on activities such as planning, designing, developing,
testing, and refining in Japan than in North America or in the UK. We shall see some of the
consequences of this in the sections that follow.
Product cost as a percentage of RRP was used as an indicator of gross margin per unit. Overall, the
companies in the study were selling their products at roughly four to five times the cost of producing
them. Development cost as a percentage of gross profit is an indicator of the rate at which companies
recoup their investment in product development, and here, the picture was consistent across all three
regions, with development costs representing 15% to 20% of gross profit during the first 6 months of the
product’s life. UK companies recouped their development costs more quickly, a testament to the fact that
UK development costs were much lower in the first place.
For completeness, Table 6 compares the three regions on a range of measures of process performance
that did not load onto the two factors described previously. Japanese lead times, in contrast to the
observation of Clark and Fujimoto (1991) in the automotive industry in the late 1980s, are longer than
those in the West, averaging 84 weeks from concept to production. The lead times of UK companies are
50% shorter, but UK projects suffer from a much higher level of postproduction problems, possibly as a
consequence of curtailed problem solving during the development phase. The Japanese projects show
relatively high numbers of changes in requirements, even quite late into the process, compared with their
Western counterparts. Although late changes typically increase product development costs (Clark &
Fujimoto, 1991), mainly because of the presence of couplings, resulting in a ‘‘snowball effect’’
(Terwiesch & Loch, 1997), late engineering changes are not always a sign of poor product development
process performance. There are obviously trade offs between the positive impact that engineering
changes may have on the attractiveness and functionality of a finished product and the cost of
implementing the changes in question. Authors, such as Iansiti (1995), who argue for a responsive
design process that ‘‘embraces’’ change instead of fighting it are implicitly suggesting that, at least in
turbulent environments, the costs of change are largely outweighed by the benefits of a better match
between the final product offered and market requirements.
Table 5
Performance data II: profit and efficiency
Japan UK N. America
Engineering hours per new part 106.1 19.5 41.1
Cost per new part (US$) 6105 1733 3027
Product cost as percentage of RRP (%) 21.2 22.6 25.9
Development cost as percentage of gross profit—first 6 months (%) 19.5 15.2 21.7

Table 6
Performance data III: miscellaneous measures
Japan UK N. America
Concept to production time (weeks) 84.3 48.1 70.6
Late changes in requirements 4.8 1.1 0.8
Time for quality levels to settle (weeks) 2.6 7.9 5.9
Self-reported success (1 = unsuccessful, 5 = highly successful) 4.2 4.1 4.1
N. Oliver et al. / Journal of High Technology Management Research 15 (2004) 249–265 259
The time taken for quality to settle down to target levels mirrors that for productivity, with quality
taking 2 to 3 weeks to settle down in the case of the Japanese firms and nearly 2 months in the case of the
UK firms.
It is interesting to note that despite considerable variations in the objective measures of project
performance across the companies in the study, self-reported success was uniformly high across all
companies, with most companies rating their projects as either quite or highly successful. This indicates
some of the limitations of using self-reports of success as performance measures.
4.3. Project characteristics and practices
Moving to the third level of analysis of the framework, this section compares the three regions in
terms of the characteristics of their projects and the ways in which the projects were managed. Table 7
shows a cross-section of indicators of project and product characteristics. These indicators are sensitive
to differences, such as product positioning, employment, and other managerial practices, that are shaped
(although not wholly determined) by national characteristics.
Typically, 30 to 40 months had elapsed since the previous generation product had been launched, and
the product life cycle is rather shorter in the UK than in Japan or North America. Compared with mass-
market consumer electronics products, these cycles are relatively long. RRPs lay in the US$3000 to 5000
unit range, with UK showing slightly higher prices, on average, than Japan or North America did. The
expected sales for the whole life of the product averaged from 10,000 to 15,000 units in Japan and the
UK, but were rather higher than this in North America, at over 30,000 units. Again, by standards of
mass-market products, these figures are modest. Companies expected products to be in production for 3
to 5 years, indicating no radical shortening of product life cycles in this sector of the market. The UK
stands out as having shorter product life cycles than Japan or North America do. There is an interesting
question of cause and effect here. Do UK firms spend less time on development because of a short
expected product life? Or does a more modest development effort inevitably lead to a shorter product
life?
Table 7
Project characteristics
Japan UK N. America
Months since previous project 38.7 31.7 36.1
Average recommended retail price (US$) 3570 4670 3516
Expected sales for life of product (in units) 10,684 12,644 34,553
Number of years production expected 4.2 3.7 4.7

Table 8
Project team characteristics
Japan UK N. America
Number of people involved: early concept 7.0 5.5 4.4
Number of members on core team 3.9 5.9 4.3
Number of members on wider team 8.2 10.0 9.2
Average number of projects live per member 3.3 5.6 6.2
Average years of experience in company 13.3 8.6 7.1
Average years of experience in the industry 14.0 12.2 11.6
Breadth of experience of project leader (0–100) 21 31 67
Concurrency ratio 29.2 41.9 45.9
N. Oliver et al. / Journal of High Technology Management Research 15 (2004) 249–265260
Table 8 shows project team characteristics in the three regions. The general picture is of uniformity,
rather than variety, across the three regions, with relatively small tight development teams in evidence
everywhere. In all cases, a relatively restricted number of people were involved in early discussions of
the product concept, this number being slightly higher in Japan than in the West. However, as the
product moved into development, this picture reverses, with a smaller number of core members on the
core team in Japan, a picture mirrored for membership of the wider project team (i.e., the group who
have some involvement in the project, but who are not consistently involved all the way through, e.g.,
functional specialists). The smaller number of people involved in the Japanese teams may be indicative
of greater focus, as the number of projects that each team member was servicing was lower in Japan,
three to four live projects per team member compared with five or six in the UK and the United States.
The difference in size between the Japanese companies and their Western counterparts is significant here.
In smaller companies, with a narrower resource base, most people have of necessity to be involved in
most projects. This means that the Japanese companies offered individual development teams much
more focus than their Western counterparts did, despite the fact that they were running much larger
portfolios of projects.
Long-term employment, which has been so characteristic of the major Japanese corporations, is seen
in the number of years of experience in each company (approximately double in Japan compared with
the UK and United States), although this effect is weaker if one considers industry, rather than company-
specific, experience. The value of company- versus industry-specific experience was a matter of some
debate to a number of the Western companies interviewed. Does it matter if an engineer has not had a
long career in a specific company if she/he has extensive experience in that industry?
The breadth of experience of the project leader, which was gauged on a scale of 0 to 100 according to
how many different functional areas that the project team leader had worked on during his or her career,
showed Japanese project team leaders to have the narrowest experience and the U.S. team leaders the
Table 9
Information exchange and knowledge capture
Japan UK N. America
Importance of different media for information recording and retrieval (1–5)
Formal methods (technical reports, project reviews) 3.7 3.4 3.5
Informal methods (tacit knowledge, individual/group memory) 2.9 3.4 3.6
Electronic methods (intranets, email archives) 3.3 2.9 2.3
Frequency of formal meetings of project team (every x days) 25.2 14.3 7.7

Table 10
Supplier involvement
Japan UK N. America
Number of suppliers 27 26 19
Number of previous projects involving main supplier 13 5 10
Percentage of suppliers overseas 20.0 38.7 41.5
N. Oliver et al. / Journal of High Technology Management Research 15 (2004) 249–265 261
widest. This appears to be explicable in terms of a large/small firm effect, with the Japanese firms
showing greater specialization than their Western counterparts do, and consistent with this is greater
formalization in the coordination, control, and roles of these specialists.
Information exchange and information recording are major challenges in any nonroutine, iterative
process. Table 9 indicates that Japanese companies show greater reliance on formal methods of
information recording than their Western counterparts do and also appear to be more advanced in their
use of electronic methods, such as corporate intranets, for knowledge capture and retrieval. Formal
meetings, however, are less frequent in Japan, occurring on approximately a monthly basis compared
with fortnightly in the UK and weekly in the United States. Much of this pattern may be explained by
different organizational patterns. Even the relatively small and autonomous high-end divisions of
Japanese electronics firms tend to be much larger than their stand-alone Western counterparts, and this
difference in size tends to be reflected in differences in both the specialization and formalization of
processes.
As described in the literature review, the benefits of supplier involvement in the development process
have been forcibly extolled in the literature. As presented in Table 10, the characteristics of the supply
bases in the three regions were remarkably consistent in terms of the number of suppliers (approximately
20 to 30 in all cases), with Japan and North America showing longer track records of working with their
major supplier.
In some of the Japanese cases, key suppliers were divisions of the same company, a phenomenon
that was absent in the West. It was difficult to ascertain how big an advantage that such ‘in-house’
suppliers represented or, indeed, if it was an advantage at all. The percentage of suppliers located
overseas (with whom close relations were clearly difficult) was much higher for the UK and North
America than for Japan. It should also be pointed out that the Japanese figure was inflated by the
presence of some off-shore manufacturing, a practice that was becoming more commonplace in North
America, but was still unusual for the UK firms, who perceived a risk of brand erosion if their
products were manufactured in low-cost locations. However, there are signs that this was changing,
and some UK firms have, often controversially, shifted production to East Asia, while retaining design
and development in the UK.
5. Discussion
What are the implications of these results for the two main foci of the paper, namely, the problem of
measuring the performance of and the national differences in the patterns of the NPD process? As argued
previously, a number of studies have looked at the relationship between NPD performance and practice
but have focused on process performance, overlooking the question of how products are received in the

N. Oliver et al. / Journal of High Technology Management Research 15 (2004) 249–265262
market. To address this, multiple indicators of process performance, product profitability, and product
performance were used in this study.
Initial data analysis showed no strong intercorrelations between the full set of performance measures
utilized here, indicating that product development performance is not a unitary construct. This lack of
intercorrelation points to the danger of an overly narrow focus on one or two measures of performance,
such as development lead times or design changes, both of which are obvious and much-used examples.
Using a large set of performance indicators grouped in different categories allows for the identification of
trade offs between some of the indicators of process performance, on one hand, and, on the other hand,
between process performance and, product performance and product profitability. For example, in the
international comparisons, the UK firms performed well on measures of speed and efficiency during the
development cycle itself. However, high process performance also means having a controlled consistent
process, and, in this respect, the UK firms appeared to pay a price for their quick process because they
suffer from more postlaunch problems than their Japanese counterparts do.
The idea of performance trade offs also applies to the relationship between process performance and
product performance and profitability. The development processes of the Japanese companies that took
part in the study appeared to be slower and less efficient. However, these companies were perhaps
sacrificing the speed of development against other performance parameters such as manufacturability
and reliability. Designing for manufacture, in the first place, and making changes for the sake of
manufacturability during development may add time to the development phase, but the benefits of doing
so become very clear once the product is in production.
Despite some differences, there are also remarkable similarities in how the companies in the different
countries went about the task of developing high-end audio products. The composition of the
development teams used were similar, although there were slight differences in terms of size, member
experience, and company tenure (the last of these, arguably, being primarily a national difference). The
ways in which information was recorded and exchanged throughout the NPD projects also differed, with
Japanese companies showing a greater use of formal methods but putting lower emphasis on formal
meetings. Supplier involvement in product development, despite the rhetoric in the literature, was
generally low in all companies, although less so in Japan.
Where differences in practice exist, it appears that these largely lie at the second and third levels of
analysis in Fig. 1. For example, the evidence indicates that the industry structure has an impact on how
companies develop new products. In Japan, high-end audio products are largely developed and
manufactured by specialist divisions of larger electronics companies. As a result, the Japanese high-
end audio business units in the research sample had higher volumes and wider product portfolios and
therefore conducted more development projects using more specialized development teams. They
typically interfaced with their markets through large and sophisticated marketing functions, who
presented them with the requirements of multiple markets that then had to be reconciled in the course
of the development process. The smaller UK and North American firms tended to be run by audiophiles,
who produced products that they themselves liked for consumption by fellow audiophiles.
Many studies have presented Japan as the incontestable champion of design for manufacture (Clark &
Fujimoto, 1991; Womack, Jones, & Roos, 1990). In keeping with those studies, the present findings
demonstrate that Japanese development teams put in the time and effort needed to ensure manufactur-
ability and smooth production launch. Similarly, much has been written about the tradition of long-term
employment in Japan. This tradition appears to be continuing because the present results show
cumulative, company-specific experience in Japanese teams to be much higher than in the Western

N. Oliver et al. / Journal of High Technology Management Research 15 (2004) 249–265 263
ones. This national characteristic has an impact on development team composition, with team members
having a higher number of years of experience in each company. This undoubtedly carries benefits in
terms of the capture and retention of tacit knowledge and assists in transferring learning from project to
project and may partly explain why the production of Japanese firms settled much more quickly did that
of the Western ones. Design engineers who have years of experience in their company will be more
aware of what can go wrong in production and, relative to engineers who have recently joined a
company, will be better equipped to prevent problems. However, company-specific experience may also
pose greater obstacles to more radical innovations than the more fluid Western model, in which labour
mobility across firms and across sectors is more commonplace.
While employment stability favours knowledge capture, which in turn determines how well issues
that span organizational boundaries such as Development/Manufacturing are managed, the use of formal
information recording tools adds to those benefits. However, formal mechanisms of information
recording have their limitations in terms of knowledge retention. Cusumano and Nobeoka (1998)
distinguish between two types of knowledge: the local knowledge, which is related to the development
of specific component, and the system or integrative knowledge, which is related to the integration of
different components. They argue that local knowledge can be recorded with archival-based mechanisms
such as the tools above. System or integrative knowledge, however, is much more complex to manage
because much of it is tacit knowledge embedded in people, developed through routines that they
perform, in which case, the more stable Japanese system may convey certain advantages. However, this
is a challenge that must be faced, according to Iansiti and Clark (1994), who argue that the integrative
capabilities of an organization are based on its ability to generate and merge and on its accumulation
knowledge. Indeed, there is a growing body of literature that argues that NPD is essentially a knowledge-
creation activity (e.g., Madhavan & Grover, 1998).
6. Conclusions
The paper has explored a number of product development performance and practice issues within a
particular industry, and although the strength of the findings is inevitably limited by the small number of
observations in each country, the results pose some important questions about NPD practice and
performance. First, the findings underline the multidimensional nature of NPD performance and, in this
sector at least, imply the presence of trade offs between different aspects of performance. It may be that
in the future, NPD performance may be better conceived as a profile, with individual projects high on
some indices and low on others, rather than as a unitary entity. This is in keeping with Lambert and
Slater (1999), who have questioned the correlation between schedule adherence in NPD and subsequent
profit and market share.
Moreover, in contrast to the picture of Japanese superiority in innovative performance in the 1980s, at
least in the automotive industry, this research presents a much more mixed picture. On the measures on
manufacturing performance, the Japanese companies in this study outperformed their Western counter-
parts by a significant margin; their products also came in much closer to their original cost targets. On
most measures of development productivity and speed, the Japanese lagged their Western competitors by
substantial margins. Perhaps, this is inevitable, given a product strategy emphasizing value and
reliability. This points to a need to conceive the product development process as one that is beset by
dilemmas and trade offs, which different companies, in different contexts, resolve in different ways.

N. Oliver et al. / Journal of High Technology Management Research 15 (2004) 249–265264
Acknowledgements
Thanks are due to Professors Ikeda and Nakagawa of Chuo University, Japan, for their invaluable
work in setting up the field visits in Japan and to Geoff Gardiner and John Mills for their input to the
design of the study. The research was funded by the UK’s Design Council and EPSRC (Engineering and
Physical Sciences Research Council), whose support is gratefully acknowledged.
References
Birou, L. M., & Fawcett, S. E. (1994). Supplier involvement in integrated product development: A comparison of US and
European practices. International Journal of Physical Distribution and Logistics Management, 24(5), 4–14.
Brown, S. L., & Eisenhardt, K. M. (1995). Product development: Past research, present findings and future decisions. Academy
of Management Review, 20(2), 343–378.
Clark, K. B., & Fujimoto, T. (1991). Product development performance. Boston: Harvard Business School Press.
Cooper, R. G. (1995). Developing new products on time, in time. Research Technology Management, 38(5), 49–57.
Cooper, R. G., & Kleinschmidt, E. J. (1996). Winning businesses in product development: The critical success factors.
Research Technology Management, 39(4), 18–29.
Crawford, C. M. (1992). The hidden costs of accelerated product development. Journal of Product Innovation Management, 9,
188–199.
Cusumano, M. A., & Nobeoka, K. (1998). Thinking beyond lean: How multi-project management is transforming product
development at Toyota and other companies. New York: Free Press.
Dimanescu, D. (1992). The seamless enterprise-making cross-functional management work. New York: Oliver Wright.
Eisenhardt, K. M., & Tabrizi, B. N. (1995). Accelerating adaptive processes: Product innovation in the global computer
industry. Administrative Science Quarterly, 40, 84–110.
Ettlie, J. E. (1995, July). Product-process development integration in manufacturing. Management Science, 41(7), 1224–1237.
Gopalakrishnan, S. (2000). Unraveling the links between dimensions of innovation and organizational performance. Journal of
High Technology Management Research, 11(1), 137–153.
Griffin, A. (1997). PDMA research on new product development practices: Updating trends and benchmarking best practices.
Journal of Product Innovation Management, 14, 429–458.
Gruner, K. E., & Homburg, C. (2000). Does customer interaction enhance new product success? Journal of Business
Research, 49(1), 1–14.
Handfield, R. B., Ragatz, G. L., Peterson, K. J., & Monczka, R. M. (1999). Involving suppliers in new product development.
California Management Review, 42(1), 59–82.
Haque, B., Pawar, K. S. (2001). Improving the management of concurrent new product development using process modeling
and analysis 31(1) 27–40.
Huang, X., Soutar, G. N., & Brown, A. (2002). New product development processes in small and medium-sized enterprises:
Some Australian evidence. Journal of Small Business Management, 40(1), 27–42.
Iansiti, M. (1995). Shooting the rapids: Managing product development in turbulent environments. California Management
Review, 38(1), 37–58.
Iansiti, M., & Clark, K. B. (1994). Integration and dynamic capability: Evidence from product development in automobiles and
mainframes computers. Industrial and Corporate Change, 3(3), 557–605.
Jassawella, A. R., & Sashittal, H. C. (2000). Strategies of effective new product team leaders. California Management
Review, 42(2), 34–51.
Karlsson, C., & Ahlstrom, P. (1996). The difficult path to lean product development. Journal of Product Innovation Manage-
ment, 13, 283–295.
Keller, R. T. (2001). Cross-functional projects groups in research and new product development: Diversity, communications,
job stress, and outcomes. Academy of Management Journal, 44, 547–555.
Khurana, A., & Rosenthal, S. R. (1997, Winter). Integrating the fuzzy front end of new product development. Sloan Manage-
ment Review, 103–120.

N. Oliver et al. / Journal of High Technology Management Research 15 (2004) 249–265 265
Krishman, V., & Ulrich, K. T. (2001). Product development decisions: A review of the literature. Management Science, 47,
1–21.
LaBahn, D. W. (2000). Early supplier involvement in customer new product development: A contingency model of component
supplier intentions. Journal of Business Research, 47(3), 173–190.
Lambert, D., & Slater, S. F. (1999). Perspective: First, fast, and on time: The path to success. Or is it? Journal of Product
Innovation Management, 16, 427–438.
Lee, J., Lee, J., & Sonder, W. E. (2000). Differences of organizational characteristics in new product development: Cross-
cultural comparison of Korea and the US. Technovation, 20(9), 497–508.
Loch, C., Stein, L., & Terwiesch, C. (1996). Measuring product development performance in the electronics industry. Journal
of Product Innovation Management, 13, 3–20.
Madhavan, R., & Grover, R. (1998). From embedded knowledge to embodied knowledge: New product development as
knowledge management. Journal of Marketing, 62, 1–12.
Markham, S. K., & Griffin, A. (1998). The breakfast of champions: Associations between champions and product development
environments, practices and performance. Journal of Product Innovation Management, 15, 436–454.
McDermott, C., & Handfield, R. (2000). Concurrent development and strategic outsourcing: Do the rules change in break-
through innovation? Journal of High Technology Management Research, 11(1), 35–57.
McDonough, E. F. (2000). Investigation of factors contributing to the success of cross-functional teams. Journal of Product
Innovation Management, 17(3), 221–235.
McGinnis, M. A., & Vallopra, R. M. (1999, August). Purchasing and supplier involvement: Issues and insights regarding new
product success. Journal of Supply Chain Management, 4–15.
Munns, A. K., & Bjeirmi, B. F. (1996). The role of project management in achieving project success. International Journal of
Project Management, 14(2), 81–87.
Neale, M. R., & Corkindale, D. R. (1998). Co-developing products: Involving customers earlier and more deeply. Long Range
Planning, 31(3), 418–425.
Parnaby, J. (1995). Design of the new product introduction process to achieve world class benchmarks. IEE Proceedings. A,
Science, Measurement and Technology, 142(5).
Schilling, M. A., & Hill, C. W. L. (1998). Managing the new product development process: Strategic imperatives. Academy of
Management Executive, 12(3), 67–81.
Schonberger, R. (1982). Japanese manufacturing techniques. New York: Free Press.
Schumann, P. A., Ransley, D. L., & Prestwood, D. C. L. (1995). Measuring R&D performance. Research Technology
Management, 38(3), 45–55.
Song, X. M., & Montoya-Weiss, M. M. (2001). The effect of perceived technological uncertainty on Japanese new product
development. Academy of Management Journal, 44, 61–80.
Souder, W. E., Buisson, D., & Garrett, T. (1997). Success through customer-driven new product development: A com-
parison of U.S. and New Zealand small entrepreneurial high technology firms. Journal of Product Innovation Man-
agement, 14, 459–472.
Srinivasan, V., Lovejoy, W. S., & Beach, D. (1997). Integrated product design for marketability and manufacturing. Journal of
Marketing Research, XXXIV, 154–163.
Swink, M. (1999). Threats to new product manufacturability and the effects of development team integration processes. Journal
of Operations Management, 17(6), 691–709.
Tatikonda, M. V., & Montoya-Weiss, M. M. (2001). Integrating operations and marketing perspectives of product innovation:
The influence of organizational process factors and capabilities on development performance. Management Science, 47(1),
151–172.
Terwiesch, C., Loch, C. H., 1997. Managing the process of engineering change orders: The case of the climate control system
in automobile development. Working paper no. 97/56/TM, INSEAD, Fontainebleau.
Thomke, S. H. (1997). The role of flexibility in the development of new products: An empirical study. Research Policy, 26,
105–119.
Wheelwright, S. C., & Clark, K. B. (1995). Leading product development: The managers guide to creating and shaping the
enterprise. New York: Free Press.
Womack, J. P., Jones, D. T., & Roos, D. (1990). The machine that changed the world. New York, NY: Rawson Associates.