NEW PRODUCT DEVELOPMENT 2.0:Preference Markets How Scalable Securities Markets Identify Winning...
18
New Product Development 2.0: Preference Markets—How Scalable Securities Markets Identify Winning Product Concepts and Attributes Ely Dahan, Arina Soukhoroukova, and Martin Spann Preference markets address the need for scalable, fast, and engaging market research in new product development. The Web 2.0 paradigm, in which users contribute numerous ideas that may lead to new products, requires new methods of screening those ideas for their marketability, and preference markets offer just such a mechanism. For faster new product development decisions, a flexible prioritization methodology is implemented for product features and concepts, one that scales up in the number of testable alternatives, limited only by the number of participants. New product preferences for concepts, attributes, and attribute levels are measured by trading stocks whose prices are based upon share of choice of new products and features. A conceptual model of scalable preference markets is developed and tested experimentally. Benefits of the methodology are found to include speed (less than one hour per trading experiment), scalability (question capacity grows linearly in the number of traders), flexibility (features and concepts can be tested simultaneously), and respondent enthusiasm for the method. Introduction I n an environment of accelerating technology and short product life cycles, one in which a plethora of product concepts and features proliferates, new product development teams need fast and accu- rate marketing research to filter out the most prom- ising opportunities. Smart phones, video gaming systems, home entertainment, information appliances, and other durable goods require development teams to prioritize literally hundreds of design decisions (Thompson, Hamilton, and Rust, 2005). There is a need to bridge the front end and design phases by narrowing many features and concepts down to those key, make-or-break success factors. This requires a fast prioritization methodology, one that scales up in the number of testable product features and concepts. The quantity of new product concepts and features to be evaluated will steadily increase, driven by the Web 2.0 paradigm, in which users volunteer new product and feature ideas over the Internet. This new form of ‘‘collaborative creativity’’ generates thousands of possibilities and demands new methods of identifying the more marketable ideas and of screening out those with lower potential. In tradi- tional market research, the more features or product concepts to be studied, the greater the number of par- ticipants and the cost and time required. Limits on the number of questions for participants derive from bounded rationality (Simon, 1955), respondent fa- tigue (Shugan, 1980), and time constraints. Faced with too many questions, respondents may resort to simplifying heuristics, even with tasks involving as few as 10–20 product features (Gilbride and Allenby, 2004; Yee et al., 2007). This paper proposes a flexible new approach to test preferences for large numbers of new product features and concepts through the use of scalable preference markets. Preference markets offer an ideal first-cut screening mechanism, thereby complementing other methods, such as conjoint analysis and concept test- ing, that perform better on a limited number of attri- butes and product concepts. By relying on the wisdom of crowds (Surowiecki, 2004), preference markets identify potential winning and losing ideas. By engag- ing in stock trading, in which the price of each stock represents the degree of preference for a product at- tribute level, new feature, or fully integrated product concept, participants reveal their own preferences and their expectations of others’ new product preferences The authors thank Martin Bernhardt, Barnaby Feder, Craig Fox, Mark Garmaise, John Hauser, Oliver Hinz, Rich Johnson, Adlar Kim, Andrew Lo, Donald Morrison, Tomaso Poggio, Ricardo dos Santos, Hyun Shin, Bernd Skiera, Vicky Smith, Sven Theysohn, Agnieszka Wolk, and EMAC 2006, Marketing Science 2005, Sawtooth Software 2006, and the Product Development & Management Association (PDMA) 2007 Research Conference attendees and judges for their valuable feedback. This paper won the best paper award at the Annual PDMA Research Conference in 2007. Address correspondence to: Ely Dahan, UCLA Medical School, 2542 Cardigan Court, Los Angeles, CA 90077. Tel.: (310) 985-9703. E-mail: [email protected]. J PROD INNOV MANAG 2010;27:937–954 r 2010 Product Development & Management Association
-
Upload
independent -
Category
Documents
-
view
5 -
download
0
Transcript of NEW PRODUCT DEVELOPMENT 2.0:Preference Markets How Scalable Securities Markets Identify Winning...
New Product Development 2.0: Preference Markets—How
Scalable Securities Markets Identify Winning Product Concepts
and Attributes�
Ely Dahan, Arina Soukhoroukova, and Martin Spann
Preference markets address the need for scalable, fast, and engaging market research in new product development.
The Web 2.0 paradigm, in which users contribute numerous ideas that may lead to new products, requires new
methods of screening those ideas for their marketability, and preference markets offer just such a mechanism. For
faster new product development decisions, a flexible prioritization methodology is implemented for product features
and concepts, one that scales up in the number of testable alternatives, limited only by the number of participants.
New product preferences for concepts, attributes, and attribute levels are measured by trading stocks whose prices
are based upon share of choice of new products and features. A conceptual model of scalable preference markets is
developed and tested experimentally. Benefits of the methodology are found to include speed (less than one hour per
trading experiment), scalability (question capacity grows linearly in the number of traders), flexibility (features and
concepts can be tested simultaneously), and respondent enthusiasm for the method.
Introduction
In an environment of accelerating technology and
short product life cycles, one in which a plethora
of product concepts and features proliferates,
new product development teams need fast and accu-
rate marketing research to filter out the most prom-
ising opportunities. Smart phones, video gaming
systems, home entertainment, information appliances,
and other durable goods require development teams
to prioritize literally hundreds of design decisions
(Thompson, Hamilton, and Rust, 2005). There is a
need to bridge the front end and design phases by
narrowing many features and concepts down to those
key, make-or-break success factors. This requires a
fast prioritization methodology, one that scales up in
the number of testable product features and concepts.
The quantity of new product concepts and features
to be evaluated will steadily increase, driven by the
Web 2.0 paradigm, in which users volunteer new
product and feature ideas over the Internet. This
new form of ‘‘collaborative creativity’’ generates
thousands of possibilities and demands new methods
of identifying the more marketable ideas and of
screening out those with lower potential. In tradi-
tional market research, the more features or product
concepts to be studied, the greater the number of par-
ticipants and the cost and time required. Limits on the
number of questions for participants derive from
bounded rationality (Simon, 1955), respondent fa-
tigue (Shugan, 1980), and time constraints. Faced
with too many questions, respondents may resort to
simplifying heuristics, even with tasks involving as few
as 10–20 product features (Gilbride and Allenby,
2004; Yee et al., 2007).
This paper proposes a flexible new approach to test
preferences for large numbers of new product features
and concepts through the use of scalable preference
markets. Preference markets offer an ideal first-cut
screening mechanism, thereby complementing other
methods, such as conjoint analysis and concept test-
ing, that perform better on a limited number of attri-
butes and product concepts. By relying on the wisdom
of crowds (Surowiecki, 2004), preference markets
identify potential winning and losing ideas. By engag-
ing in stock trading, in which the price of each stock
represents the degree of preference for a product at-
tribute level, new feature, or fully integrated product
concept, participants reveal their own preferences and
their expectations of others’ new product preferences
�The authors thank Martin Bernhardt, Barnaby Feder, Craig Fox,Mark Garmaise, John Hauser, Oliver Hinz, Rich Johnson, Adlar Kim,Andrew Lo, Donald Morrison, Tomaso Poggio, Ricardo dos Santos,Hyun Shin, Bernd Skiera, Vicky Smith, Sven Theysohn, AgnieszkaWolk, and EMAC 2006, Marketing Science 2005, Sawtooth Software2006, and the Product Development & Management Association(PDMA) 2007 Research Conference attendees and judges for theirvaluable feedback.
This paper won the best paper award at the Annual PDMAResearch Conference in 2007.
Address correspondence to: Ely Dahan, UCLA Medical School,2542 Cardigan Court, Los Angeles, CA 90077. Tel.: (310) 985-9703.E-mail: [email protected].
J PROD INNOV MANAG 2010;27:937–954r 2010 Product Development & Management Association
and converge toward an equilibrium which captures
the consensus view.
Preference markets address the need for scalable, fast,
and engaging market research by combining elements of
three methods: (1) actual financial markets, in which
huge numbers of securities undergo continuous valua-
tion through a fluid network of individuals trading with
each other; (2) opinion surveys, which measure individ-
ual preferences; and (3) prediction markets, which mea-
sure expectations of future events through the market
pricing mechanism using virtual stock markets.
Although preference markets build upon these
three approaches, they differ from them in important
ways. Financial markets operate more efficiently
when they are ‘‘thick,’’ that is, when the number of
traders exceeds the number of securities being traded
(Fama, 1970). Even though no single individual has
the capacity to follow every security, every security is
still traded by a large number of individuals. Unlike in
real financial markets, where traders self-select secu-
rities, the experiments in the present study were con-
trolled by assigning traders to specific bundles of
stocks, thus ensuring that every stock gets traded.
In opinions surveys, respondents answer each ques-
tion once, do not learn from each other, and typically
express self-preferences for new product features and
concepts. Though stock trading outcomes are related
to those measured by opinion surveys, they differ
substantially. Preference market participants ‘‘an-
swer’’ each question multiple times by buying and
selling stocks throughout a trading task. Traders may
learn from, and be influenced by, the behavior of fel-
low traders. In addition, they may base their trading
decisions on self-preferences, on expectations of oth-
ers’ preferences, or on some combination of both. In-
deed, Hoch (1987, 1988) showed that aggregating the
opinions of heterogeneous individuals produces
different results than averaging those individuals’ ex-
pectations of others. While not completely eliminating
biases, aggregation of diverse opinions frequently out-
performs those of individual ‘‘experts,’’ particularly if
responses are weighted based on competence or con-
fidence (Van Bruggen, Lilien, and Kacker, 2002). Lar-
rick and Soll (2006) highlighted the error-reduction
benefits of aggregating individual estimates when the
‘‘truth’’ is bracketed by the heterogeneous estimates
provided by individuals. However, they also pointed
out that most people have poor intuition about the
benefits of aggregating these estimates. The present
research suggests that the market pricing mechanism
may do a better job aggregating multiple perspectives
than would individuals using intuition alone.
Scalable preference markets also continue the trend
toward Internet-based market research, yielding ben-
efits such as speed, adaptive interactivity, and task
engagement (Dahan and Hauser, 2002; Sawhney, Ve-
rona, and Prandelli, 2005). Other research has recog-
nized the challenge of respondent fatigue and has
addressed it through adaptive questioning (Sawtooth
Software, Inc., 1999; Toubia et al., 2003), more en-
gaging tasks such as user design (Liechty, Ramasw-
amy, and Cohen, 2001; Park, Jun, and MacInnis,
2000; Randall, Terwiesch, and Ulrich, 2007), and task
simplification as in self-explicated questioning (Ki-
vetz, Netzer, and Srinivasan, 2004). Preference mar-
kets build upon these Internet benefits but add
competition and interactivity to enhance the respon-
dent experience and align incentives for truth telling.
Finally, previous research on prediction markets
has used stock trading to forecast actual outcomes
such as election results, movie box office receipts,
or sporting event outcomes (see Table 1 for a sum-
mary of prior research on prediction and preference
markets). In addition to this published research, firms
BIOGRAPHICAL SKETCHES
Dr. Ely Dahan is associate professor of marketing at the Claremont
Graduate University Drucker/Ito School of Management (visiting),
National Institutes of Health (NIH) researcher in urology at
University of California—Los Angeles (UCLA) Medical School,
and Dean’s Visiting Professor of Entrepreneurship at Princeton
University. His research interests include preference markets and
games, new forms of individual adaptive conjoint analysis for
marketing and health, the new product development process,
collaborative creativity, the economics of unit cost reduction, and
parallel and sequential prototyping. His work has been published in
Marketing Science, Journal of Marketing Research, Management
Science, Journal of Product Innovation Management, and Production
and Operations Management.
Dr. Arina Soukhoroukova holds a Ph.D. in innovation manage-
ment from Passau University in Germany. She is an expert on
developing and implementing ecommerce applications. She has sup-
ported several corporations for enhancing their innovation man-
agement initiatives and has presented her work, among others, at
the INFORMS Marketing Science Conference and the European
Conference on Information Systems.
Dr. Martin Spann is professor of electronic commerce at the
Munich School of Management of the Ludwig-Maximilians-
University Munich in Germany. His research interests are predic-
tion markets, pricing, electronic commerce, online marketing, and
innovation and new product management. His work has been
published in Marketing Science, Management Science, Information
Systems Research, Journal of Marketing, MIS Quarterly, Journal of
Interactive Marketing, Journal of Product Innovation Management,
Journal of Forecasting, and European Journal of Operational
Research.
938 J PROD INNOV MANAG2010;27:937–954
E. DAHAN ET AL.
such as Microsoft (Proebsting, 2005) employ internal
prediction markets.
Preference markets, on the other hand, do not pre-
dict actual outcomes, nor are they based upon exter-
nal information. Rather, they measure expectations of
others’ new product preferences, based upon individ-
ual self-preferences combined with insights about oth-
ers. While prediction markets typically run for weeks
or longer, preference markets require only minutes, as
there is no outside ‘‘news’’ to affect the market. For
example, Dahan et al. (2011) evaluate product con-
cepts in stock trading tasks that run less than an hour.
Participants are presented with new product concepts
and then trade securities representing the competing
designs. In effect, traders place bets on the concepts
they expect to curry favor with their fellow traders.
Their results exhibit high consistency and reliability
across trading experiments and against independent
surveys. Shin and Dahan (2009) show that preference
markets are more like market research than they are
like finance and also validate the use of volume-
weighted average prices (VWAP).
To the best of our knowledge, the present paper is
the first to test the scalability of such markets for
measuring new product preferences over a larger
number of concepts and features than any individual
trader can process. In effect, this study builds on the
‘‘wisdom of crowds’’ effect and, adding to it a twist on
Simon (1955), the unbounded rationality of crowds.
In the context of new product development (NPD),
this paper is also the first to analyze customer prefer-
ences not only for integrated product concepts but
also for product attributes and attribute levels at
varying prices, including product and service brands.
Such a decompositional approach frequently proves
useful to NPD managers when making design trade-
offs and positioning new products in the marketplace.
The aim of this research is to propose a conceptual
model and methodology of scalable preference mar-
kets to handle large numbers of product concepts and
features, to position the methodology in the context of
other methods of new product research, to validate
the approach through empirical tests, and to derive
insights about the application of scalable prefer-
ence markets to marketing problems. The paper is
structured as follows. First, potential applications of
preference markets were matched to the different
phases of new product development. Then, previous
research on prediction markets is discussed and con-
nected to the present study’s conceptual model of
preference markets. The preference market method-
ology is then presented, after which Collected empir-
ical data from repeated preference markets for smart
phones and their attributes are analyzed. The paper
concludes with a general discussion, managerial in-
sights, limitations, and areas of future research.
Application of Preference Markets to Phases
of New Product Development (NPD)
Preference markets may apply during four phases of
new product development. In the early idea genera-
tion and concept selection phases, preference markets
can narrow potential concepts and product attributes
to a manageable number, focusing resources where
they will yield the greatest marginal benefit. In the
later detailed design and testing and launch phases,
preference markets can help assess price sensitivity,
detailed new product feature preferences, and optimal
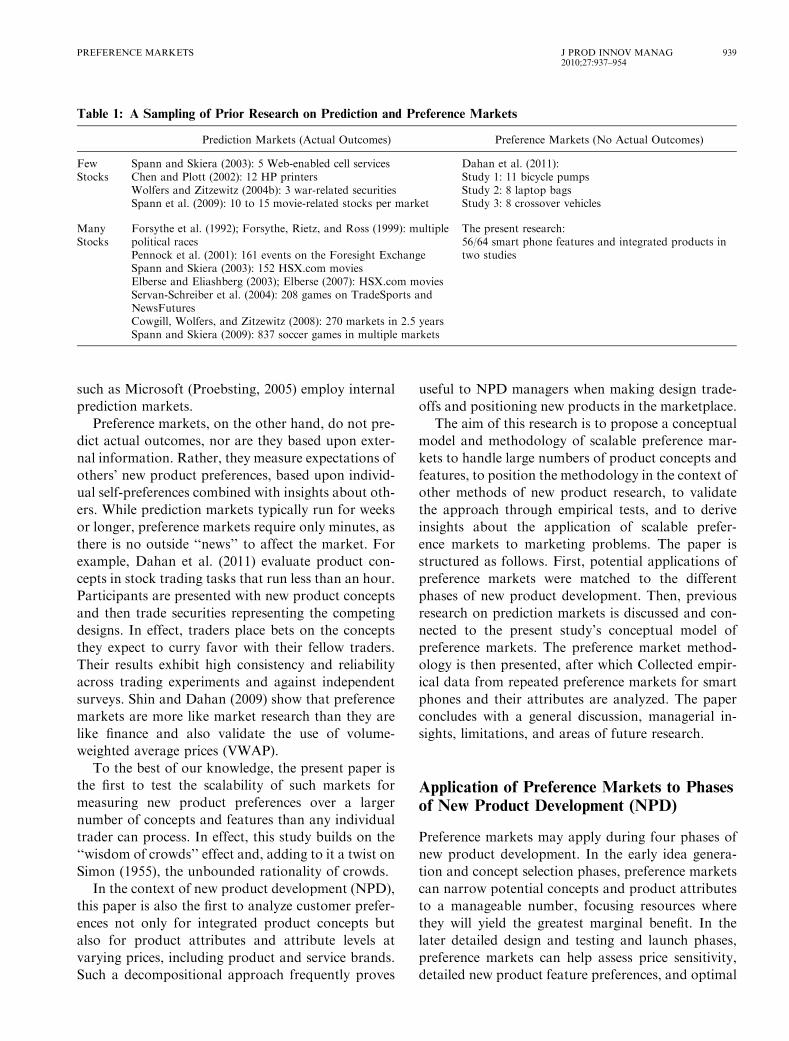
Table 1: A Sampling of Prior Research on Prediction and Preference Markets
Prediction Markets (Actual Outcomes) Preference Markets (No Actual Outcomes)
FewStocks
Spann and Skiera (2003): 5 Web-enabled cell servicesChen and Plott (2002): 12 HP printersWolfers and Zitzewitz (2004b): 3 war-related securitiesSpann et al. (2009): 10 to 15 movie-related stocks per market
Dahan et al. (2011):Study 1: 11 bicycle pumpsStudy 2: 8 laptop bagsStudy 3: 8 crossover vehicles
ManyStocks
Forsythe et al. (1992); Forsythe, Rietz, and Ross (1999): multiplepolitical racesPennock et al. (2001): 161 events on the Foresight ExchangeSpann and Skiera (2003): 152 HSX.com moviesElberse and Eliashberg (2003); Elberse (2007): HSX.com moviesServan-Schreiber et al. (2004): 208 games on TradeSports andNewsFuturesCowgill, Wolfers, and Zitzewitz (2008): 270 markets in 2.5 yearsSpann and Skiera (2009): 837 soccer games in multiple markets
The present research:56/64 smart phone features and integrated products intwo studies
PREFERENCE MARKETS J PROD INNOV MANAG2010;27:937–954
939
advertising and promotion. However, at these later
stages (especially during testing and launch), prefer-
ence markets are only a special case of prediction
markets that forecast the market potential of a prod-
uct prior to introduction. A primary distinction of
preference markets in the latter NPD stages is that the
concepts tested need not ultimately be launched and
that actual outcome is not required as is the case for
prediction markets. For example, an NPD team might
use preference markets to test potential advertising
campaigns, price points, or distribution strategies
prior to product launch. Only one option will be
realized based on the new product preferences of the
traders, but the lack of actual outcomes does not pre-
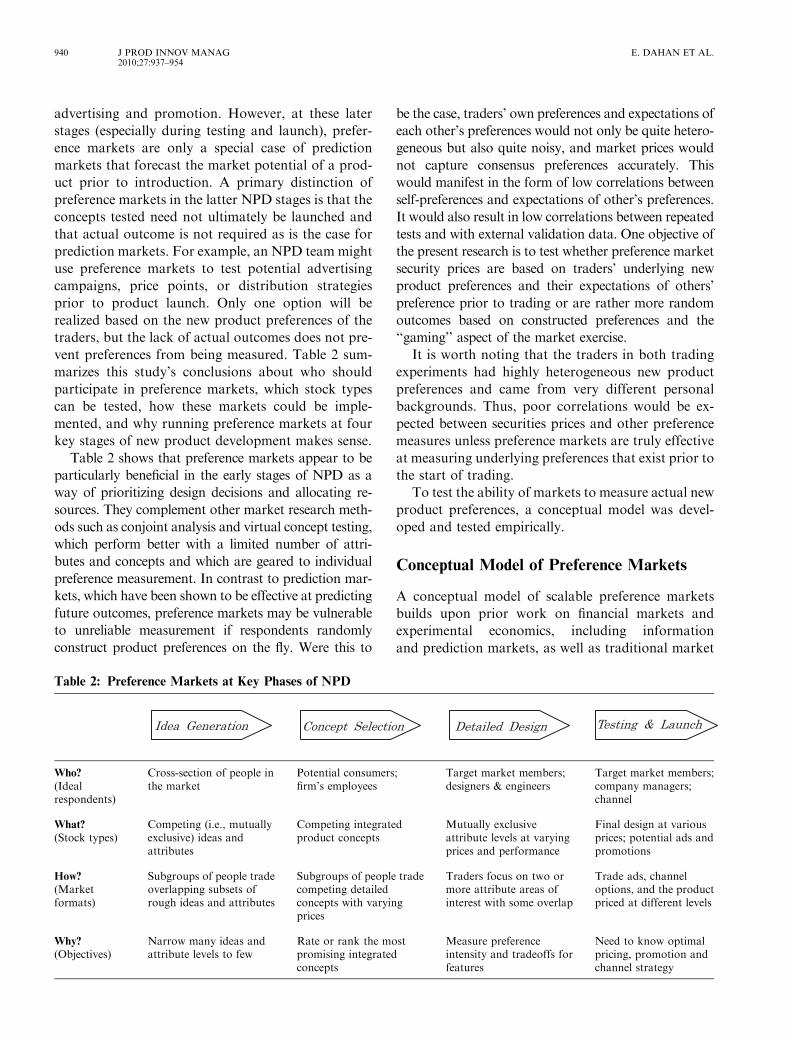
vent preferences from being measured. Table 2 sum-
marizes this study’s conclusions about who should
participate in preference markets, which stock types
can be tested, how these markets could be imple-
mented, and why running preference markets at four
key stages of new product development makes sense.
Table 2 shows that preference markets appear to be
particularly beneficial in the early stages of NPD as a
way of prioritizing design decisions and allocating re-
sources. They complement other market research meth-
ods such as conjoint analysis and virtual concept testing,
which perform better with a limited number of attri-
butes and concepts and which are geared to individual
preference measurement. In contrast to prediction mar-
kets, which have been shown to be effective at predicting
future outcomes, preference markets may be vulnerable
to unreliable measurement if respondents randomly
construct product preferences on the fly. Were this to
be the case, traders’ own preferences and expectations of
each other’s preferences would not only be quite hetero-
geneous but also quite noisy, and market prices would
not capture consensus preferences accurately. This
would manifest in the form of low correlations between
self-preferences and expectations of other’s preferences.
It would also result in low correlations between repeated
tests and with external validation data. One objective of
the present research is to test whether preference market
security prices are based on traders’ underlying new
product preferences and their expectations of others’
preference prior to trading or are rather more random
outcomes based on constructed preferences and the
‘‘gaming’’ aspect of the market exercise.
It is worth noting that the traders in both trading
experiments had highly heterogeneous new product
preferences and came from very different personal
backgrounds. Thus, poor correlations would be ex-
pected between securities prices and other preference
measures unless preference markets are truly effective
at measuring underlying preferences that exist prior to
the start of trading.
To test the ability of markets to measure actual new
product preferences, a conceptual model was devel-
oped and tested empirically.
Conceptual Model of Preference Markets
A conceptual model of scalable preference markets
builds upon prior work on financial markets and
experimental economics, including information
and prediction markets, as well as traditional market
Table 2: Preference Markets at Key Phases of NPD
Who?
(Idealrespondents)
Cross-section of people inthe market
Potential consumers;firm’s employees
Target market members;designers & engineers
Target market members;company managers;channel
What?
(Stock types)Competing (i.e., mutuallyexclusive) ideas andattributes
Competing integratedproduct concepts
Mutually exclusiveattribute levels at varyingprices and performance
Final design at variousprices; potential ads andpromotions
How?
(Marketformats)
Subgroups of people tradeoverlapping subsets ofrough ideas and attributes
Subgroups of people tradecompeting detailedconcepts with varyingprices
Traders focus on two ormore attribute areas ofinterest with some overlap
Trade ads, channeloptions, and the productpriced at different levels
Why?
(Objectives)Narrow many ideas andattribute levels to few
Rate or rank the mostpromising integratedconcepts
Measure preferenceintensity and tradeoffs forfeatures
Need to know optimalpricing, promotion andchannel strategy
940 J PROD INNOV MANAG2010;27:937–954
E. DAHAN ET AL.

research. Four hypotheses are linked: (1) individual new
product preferences lead to expectations about others;
(2) rational traders use their expectations to decide
when to buy and sell securities; (3) market prices ag-
gregate information and beliefs held by individuals; and
(4) individuals learn from markets. These four effects
combine to explain how market prices measure people’s
beliefs about others’ new product preferences.
The Wisdom (and Biases) of Crowds: Connectingthe Self to Others
The task of estimating the market success of new
products requires experts to distinguish between self-
preferences and those of others, which may or may not
be similar. Prior research has demonstrated that indi-
viduals’ self-preferences can bias their expectations of
others’ preferences (Hoch, 1987). Yet aggregating in-
dividual opinions, even biased ones, produces surpris-
ingly accurate and objective estimates of the consensus
of opinion (cf. Larrick and Soll, 2006; Lorge et al.,
1958; Surowiecki, 2004). In prediction markets with
actual outcomes, such as the Iowa Electronic Market
for the 1988 presidential race (Forsythe et al., 1992,
p. 1156), ‘‘62% of the Bush supporters bought more
Bush stock than they sold, while 68% of Dukakis
supporters bought more Dukakis stock than they
sold.’’ In marketing surveys, respondents may over-
weight their own opinions when estimating the new
product preferences of others, a simple result of ‘‘false
consensus.’’ So, aggregate self-preferences are ex-
pected to be strongly correlated to aggregate expecta-
tions of others while being subject to the effect of
biases at the individual level. To the extent that indi-
viduals may lean in opposite directions—that is, that
some individuals prefer an option while others reject
that option—this will result in preference heterogene-
ity, which the market pricing mechanism will have to
correct through the process of trading.
In the context of new product development, re-
spondents’ expectations of others’ preferences may
provide insight, albeit indirect and at the aggregate
level, into individual preferences.
H1a: Wisdom: Self-preferences for new product features
and concepts provide insight about others’ preferences;
therefore, mean self-preferences and mean expectations
of others’ preferences will be highly correlated.
H1b. Bias: Individuals who prefer a new product
concept or attribute level have higher expectations of
others’ preferences for that option than do individuals
who reject that option.
Rational Expectations: How Expectations ofOthers Affect Orders to Buy and Sell
Rational, profit-maximizing investors utilize personal
knowledge in determining the value of a stock, and
make trading decisions based upon this knowledge
(Lucas, 1972). This principle, well-established in
financial markets, is also evident in experimental mar-
kets, where traders have an incentive to reveal their
version of the truth (Plott and Sunder, 1982; Smith,
1982). Experimental markets have been shown to be
quite robust to manipulation by some traders because
other traders take the possibility of manipulation into
account when setting their own expectations (Hanson,
Oprea, and Porter, 2005). Even in opinion surveys
where participants are rewarded for making insightful
observations, reward-maximizing contributors factor in
their expectations of others’ reactions (Toubia, 2006).
Similarly, portfolio-maximizing traders in preference
markets are expected to buy and sell based on their
expectations of others rather than on their self-prefer-
ences for product features and concepts. Therefore,
stock prices are expected to more closely correlate
with expectations of others than with self-preferences.
H2: Focus on Others: Expectations of others’ prefer-
ences for new product features and concepts affect in-
dividual buy and sell decisions for stocks more than do
self-preferences, so stock prices will correlate more
highly with expectations of others.
In new product development, design teams must con-
sider preference heterogeneity with regards to market
segmentation and targeting. After all, individuals, not
crowds, make product purchase decisions. However,
NPD teams also benefit from learning aggregate new
product preferences, especially when there are many
possible product concepts, attributes, and levels. Iden-
tifying the standout ideas and key features early on,
and filtering out weaker ones, enables NPD teams to
focus resources on higher-leverage opportunities.
Prices: How Markets Achieve Consensus Basedon Orders
In a competitive economy, the price of a good reveals
its value (von Hayek, 1945). Similarly, in financial
markets, the efficient market hypothesis posits that
PREFERENCE MARKETS J PROD INNOV MANAG2010;27:937–954
941

stock prices aggregate all information known to trad-
ers (Fama, 1970, 1991). Experimental markets con-
firm the theory and converge toward ‘‘truth’’ within a
few iterations, even when information is dispersed
(Forsythe, Palfrey, and Plott, 1982; Plott and Sunder,
1988). Importantly, not all market participants are
equal in their influence on prices. In financial and
prediction markets, traders with greater knowledge or
certainty exert greater influence on prices, thus
weighting their opinions more heavily. Elberse and
Eliashberg (2003) and Elberse (2007) use the HSX
prices to incorporate ex ante expectations of the rev-
enues of new motion pictures. Cowgill et al. (2008)
demonstrate that participants are able to learn from
their initial mistakes. ‘‘Informed’’ traders with private
information effectively set market prices for the ‘‘less
informed’’ (Oliven and Rietz, 2004).
For prices to be truly informative, profit-maximizing
participants should be rewarded based upon real out-
comes (Smith, Suchanek, and Williams, 1988). But real
outcomes may be hard to come by at the front end of
new product development. For example, only a few of
many product concepts or features may actually be
launched. Product development teams may not be able
to afford to wait for actual market outcomes because
speed to market, and the first-mover-advantage that
results from speed, are frequently key success factors.
For such research questions, the prerequisite that
securities be linked to actual outcomes may have to be
relaxed and may either be replaced with an alternative
such as actual survey results or at least with the belief
on the part of traders that their portfolio valuation
depends on such external survey results. As long as
traders behave consistently with the belief that their
portfolio performance will be measured based on ac-
tual, observable results, then market prices should re-
flect traders’ expectations of those results. Even
lacking observable outcomes, preference markets
can use the market pricing mechanism to efficiently
aggregate consensus expectations.
H3: Consensus: The preference market pricing mech-
anism summarizes the consensus of individual offers to
buy and sell stocks representing product features and
concepts, so preference market prices will correlate
highly to mean expectations of others’ preferences for
new product features and concepts.
Learning from Market Prices
In financial markets, investors continuously observe
prices and rapidly update valuations in response to
news and exogenous events (MacKinlay, 1997). In
this context, stock price shocks can become newswor-
thy in their own right. Upon receiving news or ob-
serving stock price changes, traders may respond by
adding further volatility (Blanchard and Watson,
1982; Timmermann, 1993). Of course, one risk of
this price-based communication is the possibility that
traders will learn the wrong thing from each other and
will jump on a ‘‘misguided bandwagon.’’ Smith et al.
(1988) showed that inexperienced traders may pro-
duce market bubbles and crashes. A few marginal
traders with strong (but inaccurate) beliefs can influ-
ence a majority of traders who are weaker in their
beliefs, leading to herding behavior. Further, the un-
derlying individual new product preferences them-
selves can be influenced by such communication.
Salganik, Dodds, and Watts (2006) showed that the
individual preferences change dramatically when peo-
ple are exposed to the preferences of others’. Addi-
tionally, publicly posted opinion surveys, such as
critical reviews, polls, or even Web chat, may affect
individual opinions (cf. Chevalier and Mayzlin, 2006).
In the case of preference markets, the potential for
herding behavior suggests that repeated, independent
market simulations are called for to verify intertest
reliability. On the other hand, for fashion goods or
those with network externalities, where individual
new product preferences are heavily influenced by
others, the intertrader communication inherent in
preference markets offers potential insight about
how preferences can evolve.
Regarding learning, preference markets are simpler
than financial and prediction markets. Rather than
outside news, the only new information revealed to
traders is the stock price itself. Therefore, traders in
preference markets are expected to learn from stock
prices, to update their own beliefs, and to converge in
their expectations of others.
H4: Updating: The process of trading will cause trad-
ers to update their expectations of others’ preferences
for new product features and concepts and will reduce
the variability in these expectations across traders.
A Conceptual Model of Preference Markets
Figure 1 illustrates the study’s conceptual model of
preference markets and highlights the five types of
data collected in the studies.
The first circle represents self-preferences, that is,
each trader’s new product preferences for himself or
942 J PROD INNOV MANAG2010;27:937–954
E. DAHAN ET AL.
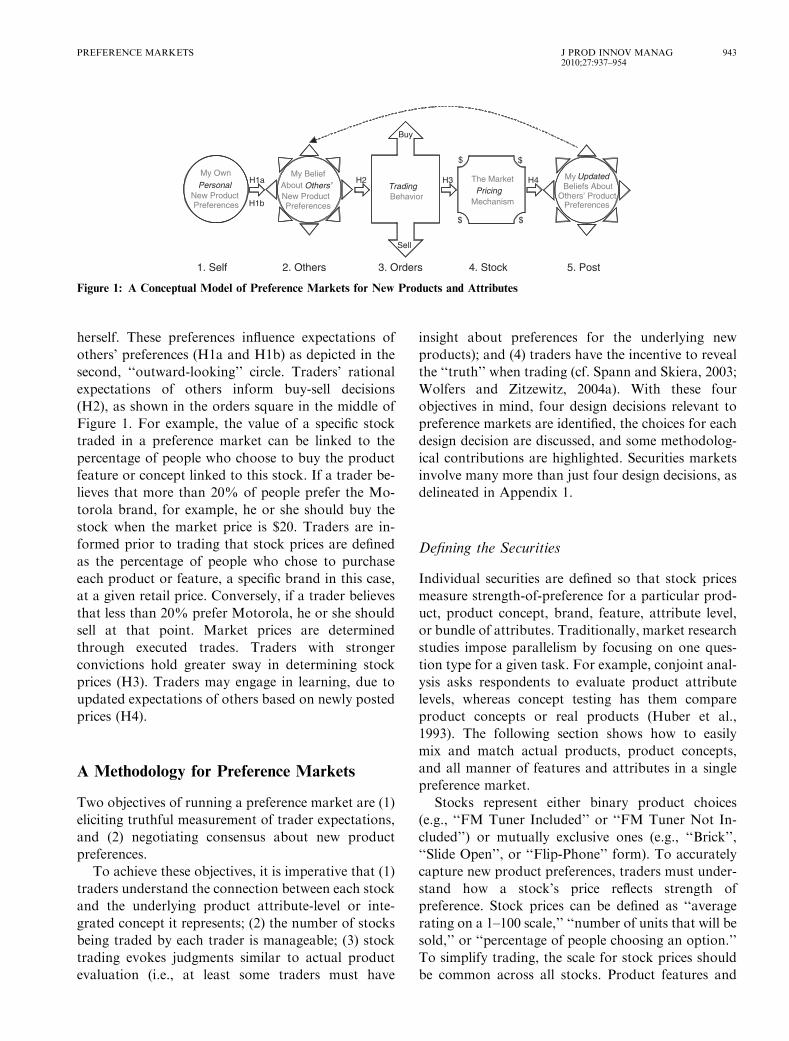
herself. These preferences influence expectations of
others’ preferences (H1a and H1b) as depicted in the
second, ‘‘outward-looking’’ circle. Traders’ rational
expectations of others inform buy-sell decisions
(H2), as shown in the orders square in the middle of
Figure 1. For example, the value of a specific stock
traded in a preference market can be linked to the
percentage of people who choose to buy the product
feature or concept linked to this stock. If a trader be-
lieves that more than 20% of people prefer the Mo-
torola brand, for example, he or she should buy the
stock when the market price is $20. Traders are in-
formed prior to trading that stock prices are defined
as the percentage of people who chose to purchase
each product or feature, a specific brand in this case,
at a given retail price. Conversely, if a trader believes
that less than 20% prefer Motorola, he or she should
sell at that point. Market prices are determined
through executed trades. Traders with stronger
convictions hold greater sway in determining stock
prices (H3). Traders may engage in learning, due to
updated expectations of others based on newly posted
prices (H4).
A Methodology for Preference Markets
Two objectives of running a preference market are (1)
eliciting truthful measurement of trader expectations,
and (2) negotiating consensus about new product
preferences.
To achieve these objectives, it is imperative that (1)
traders understand the connection between each stock
and the underlying product attribute-level or inte-
grated concept it represents; (2) the number of stocks
being traded by each trader is manageable; (3) stock
trading evokes judgments similar to actual product
evaluation (i.e., at least some traders must have
insight about preferences for the underlying new
products); and (4) traders have the incentive to reveal
the ‘‘truth’’ when trading (cf. Spann and Skiera, 2003;
Wolfers and Zitzewitz, 2004a). With these four
objectives in mind, four design decisions relevant to
preference markets are identified, the choices for each
design decision are discussed, and some methodolog-
ical contributions are highlighted. Securities markets
involve many more than just four design decisions, as
delineated in Appendix 1.
Defining the Securities
Individual securities are defined so that stock prices
measure strength-of-preference for a particular prod-
uct, product concept, brand, feature, attribute level,
or bundle of attributes. Traditionally, market research
studies impose parallelism by focusing on one ques-
tion type for a given task. For example, conjoint anal-
ysis asks respondents to evaluate product attribute
levels, whereas concept testing has them compare
product concepts or real products (Huber et al.,
1993). The following section shows how to easily
mix and match actual products, product concepts,
and all manner of features and attributes in a single
preference market.
Stocks represent either binary product choices
(e.g., ‘‘FM Tuner Included’’ or ‘‘FM Tuner Not In-
cluded’’) or mutually exclusive ones (e.g., ‘‘Brick’’,
‘‘Slide Open’’, or ‘‘Flip-Phone’’ form). To accurately
capture new product preferences, traders must under-
stand how a stock’s price reflects strength of
preference. Stock prices can be defined as ‘‘average
rating on a 1–100 scale,’’ ‘‘number of units that will be
sold,’’ or ‘‘percentage of people choosing an option.’’
To simplify trading, the scale for stock prices should
be common across all stocks. Product features and
My Own
PersonalNew ProductPreferences
My BeliefAbout Others’New Product Preferences
TradingBehavior
Sell
Buy
The MarketPricing
Mechanism
$ $
$ $
MyUpdatedBeliefs About
Others’ ProductPreferences
1. Self 2. Others 3. Orders 4. Stock 5. Post
H1a
H1b
H2 H3 H4
Figure 1: A Conceptual Model of Preference Markets for New Products and Attributes
PREFERENCE MARKETS J PROD INNOV MANAG2010;27:937–954
943
concepts must be vividly and clearly communicated to
the traders.
Experimental Design for Scalability: TheUnbounded Rationality of Crowds
After connecting stocks to product characteristics,
individual traders must be connected with stocks.
In other stock markets, traders self-select stocks,
typically trading only a tiny percentage of the
universe of securities. This study seeks both the scal-
ability of financial markets and the control of exper-
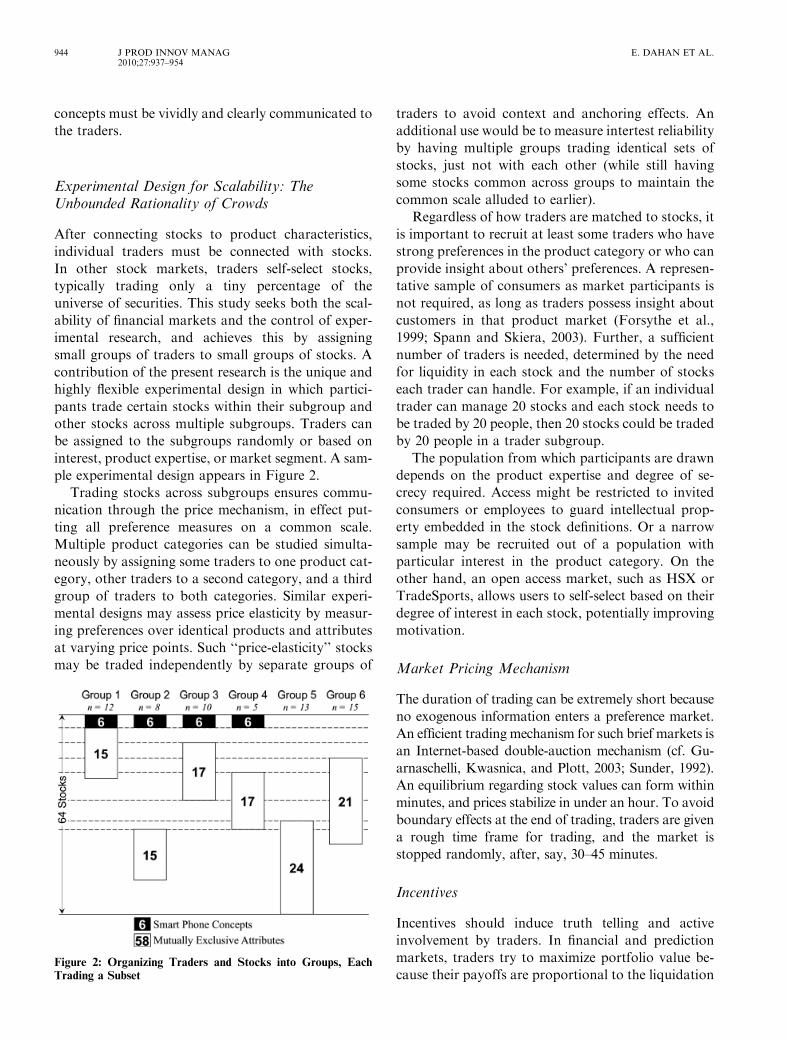
imental research, and achieves this by assigning
small groups of traders to small groups of stocks. A
contribution of the present research is the unique and
highly flexible experimental design in which partici-
pants trade certain stocks within their subgroup and
other stocks across multiple subgroups. Traders can
be assigned to the subgroups randomly or based on
interest, product expertise, or market segment. A sam-
ple experimental design appears in Figure 2.
Trading stocks across subgroups ensures commu-
nication through the price mechanism, in effect put-
ting all preference measures on a common scale.
Multiple product categories can be studied simulta-
neously by assigning some traders to one product cat-
egory, other traders to a second category, and a third
group of traders to both categories. Similar experi-
mental designs may assess price elasticity by measur-
ing preferences over identical products and attributes
at varying price points. Such ‘‘price-elasticity’’ stocks
may be traded independently by separate groups of
traders to avoid context and anchoring effects. An
additional use would be to measure intertest reliability
by having multiple groups trading identical sets of
stocks, just not with each other (while still having
some stocks common across groups to maintain the
common scale alluded to earlier).
Regardless of how traders are matched to stocks, it
is important to recruit at least some traders who have
strong preferences in the product category or who can
provide insight about others’ preferences. A represen-
tative sample of consumers as market participants is
not required, as long as traders possess insight about
customers in that product market (Forsythe et al.,
1999; Spann and Skiera, 2003). Further, a sufficient
number of traders is needed, determined by the need
for liquidity in each stock and the number of stocks
each trader can handle. For example, if an individual
trader can manage 20 stocks and each stock needs to
be traded by 20 people, then 20 stocks could be traded
by 20 people in a trader subgroup.
The population from which participants are drawn
depends on the product expertise and degree of se-
crecy required. Access might be restricted to invited
consumers or employees to guard intellectual prop-
erty embedded in the stock definitions. Or a narrow
sample may be recruited out of a population with
particular interest in the product category. On the
other hand, an open access market, such as HSX or
TradeSports, allows users to self-select based on their
degree of interest in each stock, potentially improving
motivation.
Market Pricing Mechanism
The duration of trading can be extremely short because
no exogenous information enters a preference market.
An efficient trading mechanism for such brief markets is
an Internet-based double-auction mechanism (cf. Gu-
arnaschelli, Kwasnica, and Plott, 2003; Sunder, 1992).
An equilibrium regarding stock values can form within
minutes, and prices stabilize in under an hour. To avoid
boundary effects at the end of trading, traders are given
a rough time frame for trading, and the market is
stopped randomly, after, say, 30–45 minutes.
Incentives
Incentives should induce truth telling and active
involvement by traders. In financial and prediction
markets, traders try to maximize portfolio value be-
cause their payoffs are proportional to the liquidationFigure 2: Organizing Traders and Stocks into Groups, Each
Trading a Subset
944 J PROD INNOV MANAG2010;27:937–954
E. DAHAN ET AL.
value of all stocks and cash. Preference markets need
not provide payoffs to each trader or reveal actual
outcomes. Rather than basing incentives on realized
outcomes, they can be based on closing or average
stock prices, which are endogenous to the market, and
act as a surrogate for actual outcomes. The lack of
actual outcomes may leave preference markets vul-
nerable to pricing bubbles and gaming. So one could
generate exogenous ‘‘truth’’ by conducting an inde-
pendent preference survey and by using its results as
the actual outcome for each stock. In addition, be-
yond rewarding trader performance and accuracy,
one might reward effort (e.g., number of trades).
To reduce the cost of compensating every trader
based on final portfolio values, prize winners might be
randomly selected based on the ranking of each port-
folio within a trading subgroup. Maximizing one’s
expected reward would still be consistent with maxi-
mizing one’s portfolio value, even if one is not the top
trader within the subgroup. The short duration of
preference markets add to the intrinsic reward of
competing, since within minutes of completing the
market one discovers one’s ranking among all traders.
The incentives need to be high enough to attract trad-
ers. Details are provided in Appendix 1.
Empirical Studies
To test the feasibility and accuracy of scalable pref-
erence markets and to test the conceptual model,
two studies were run within the smart phone product
category: (1) a laboratory test involving M.B.A.
students; and (2) a field test at a multinational corpo-
ration involving managers and engineers. The results
from the two studies support the hypotheses and con-
ceptual model but must be viewed as the preliminary
empirical studies that they are.
Study 1: Laboratory Test of ScalablePreference Markets
The first study tests the key aspects of preference
markets—scalability, flexibility, and learning—in a
laboratory test with a student sample.
Study Design and Procedure. A total of 56 different
design and concept stocks were modeled with differ-
ent types of scales: 31 binary feature levels, 19 mutu-
ally exclusive feature levels, and 6 full phone concepts
(Appendix 2). In all, 116 M.B.A. student respondents
(a 38% response rate) were recruited to complete two
surveys in advance of stock trading. In advance of
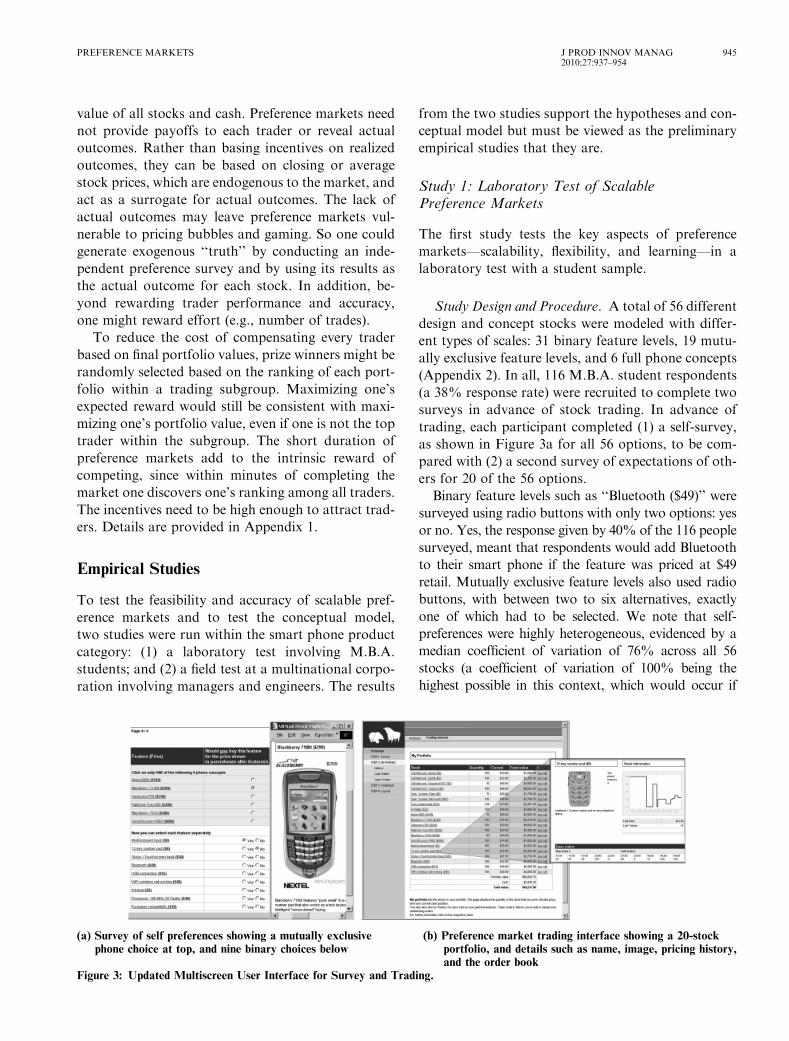
trading, each participant completed (1) a self-survey,
as shown in Figure 3a for all 56 options, to be com-
pared with (2) a second survey of expectations of oth-
ers for 20 of the 56 options.
Binary feature levels such as ‘‘Bluetooth ($49)’’ were
surveyed using radio buttons with only two options: yes
or no. Yes, the response given by 40% of the 116 people
surveyed, meant that respondents would add Bluetooth
to their smart phone if the feature was priced at $49
retail. Mutually exclusive feature levels also used radio
buttons, with between two to six alternatives, exactly
one of which had to be selected. We note that self-
preferences were highly heterogeneous, evidenced by a
median coefficient of variation of 76% across all 56
stocks (a coefficient of variation of 100% being the
highest possible in this context, which would occur if
(a) Survey of self preferences showing a mutually exclusive (b) Preference market trading interface showing a 20-stock
phone choice at top, and nine binary choices below portfolio, and details such as name, image, pricing history,and the order book
Figure 3: Updated Multiscreen User Interface for Survey and Trading.
PREFERENCE MARKETS J PROD INNOV MANAG2010;27:937–954
945
50% of respondents chose an option and the rest re-
jected it).
After the self-survey, respondents who would be
trading a particular stock also answered a question
about others’ preferences: ‘‘What percentage of par-
ticipants would buy this feature?’’ For example,
among the 41 respondents who were about to trade
the Bluetooth stock, the average answer to the ques-
tion about others was 26% (s.d. 19%).
After trading, a postsurvey (56% response rate) asked
traders to provide updated estimates of others’ prefer-
ences. No significant differences were observed between
the respondents and non-respondents to the postsurvey
in terms of trading activity, offers to buy and sell, and
trader performance. In this experiment surveys of self,
others, and post can be compared against stock trading,
enabling the four hypotheses that comprise the concep-
tual model in Figure 1 to be tested.
A total of 113 of the 116 survey respondents opted
to participate in the stock trading experiment on a
university holiday, 93 of them in person in two class-
rooms, and 20 off-site logged into the market over the
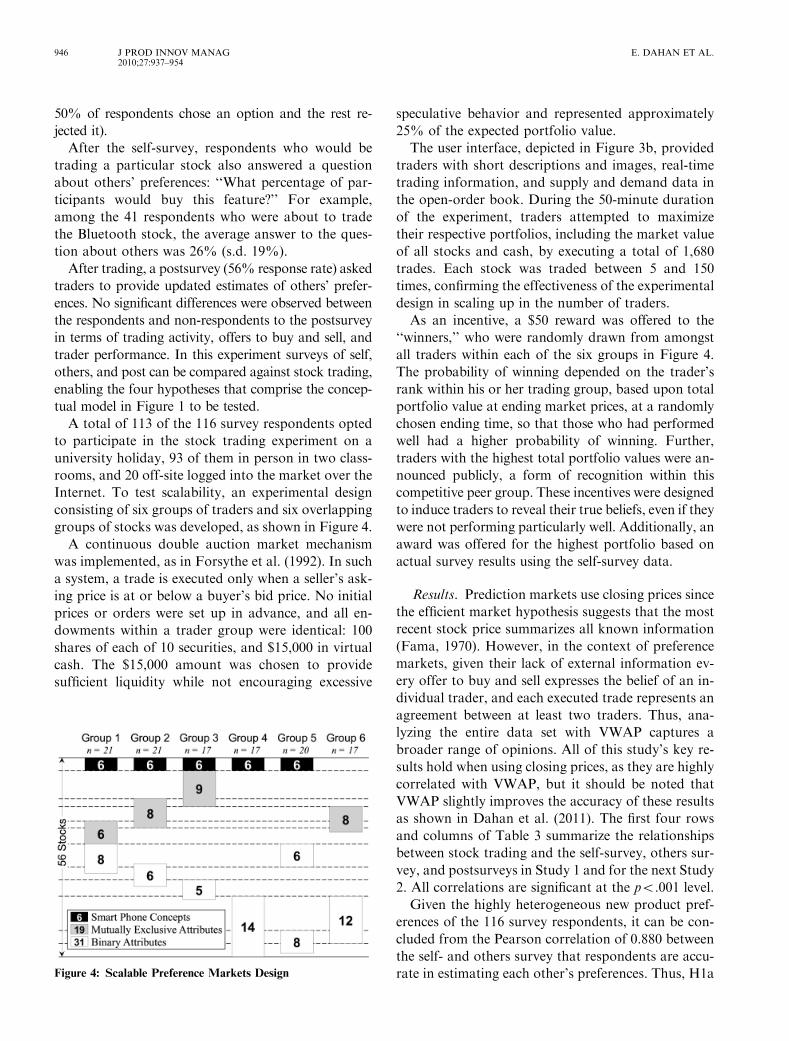
Internet. To test scalability, an experimental design
consisting of six groups of traders and six overlapping
groups of stocks was developed, as shown in Figure 4.
A continuous double auction market mechanism
was implemented, as in Forsythe et al. (1992). In such
a system, a trade is executed only when a seller’s ask-
ing price is at or below a buyer’s bid price. No initial
prices or orders were set up in advance, and all en-
dowments within a trader group were identical: 100
shares of each of 10 securities, and $15,000 in virtual
cash. The $15,000 amount was chosen to provide
sufficient liquidity while not encouraging excessive
speculative behavior and represented approximately
25% of the expected portfolio value.
The user interface, depicted in Figure 3b, provided
traders with short descriptions and images, real-time
trading information, and supply and demand data in
the open-order book. During the 50-minute duration
of the experiment, traders attempted to maximize
their respective portfolios, including the market value
of all stocks and cash, by executing a total of 1,680
trades. Each stock was traded between 5 and 150
times, confirming the effectiveness of the experimental
design in scaling up in the number of traders.
As an incentive, a $50 reward was offered to the
‘‘winners,’’ who were randomly drawn from amongst
all traders within each of the six groups in Figure 4.
The probability of winning depended on the trader’s
rank within his or her trading group, based upon total
portfolio value at ending market prices, at a randomly
chosen ending time, so that those who had performed
well had a higher probability of winning. Further,
traders with the highest total portfolio values were an-
nounced publicly, a form of recognition within this
competitive peer group. These incentives were designed
to induce traders to reveal their true beliefs, even if they
were not performing particularly well. Additionally, an
award was offered for the highest portfolio based on
actual survey results using the self-survey data.
Results. Prediction markets use closing prices since
the efficient market hypothesis suggests that the most
recent stock price summarizes all known information
(Fama, 1970). However, in the context of preference
markets, given their lack of external information ev-
ery offer to buy and sell expresses the belief of an in-
dividual trader, and each executed trade represents an
agreement between at least two traders. Thus, ana-
lyzing the entire data set with VWAP captures a
broader range of opinions. All of this study’s key re-
sults hold when using closing prices, as they are highly
correlated with VWAP, but it should be noted that
VWAP slightly improves the accuracy of these results
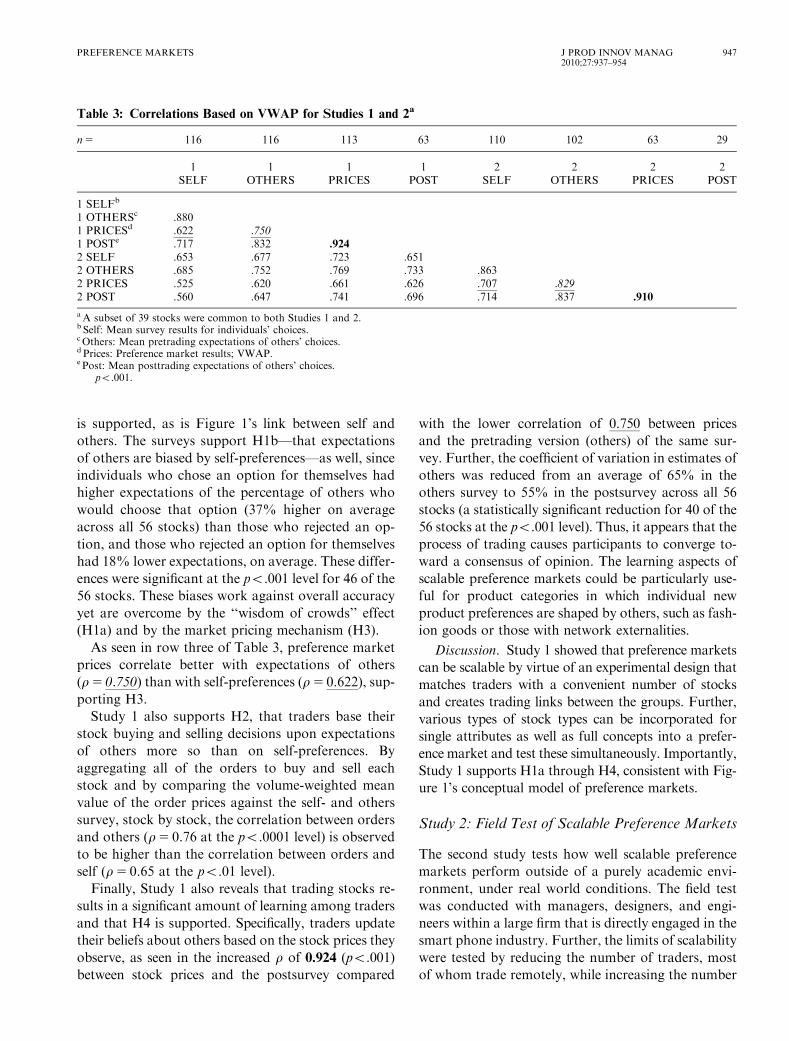
as shown in Dahan et al. (2011). The first four rows
and columns of Table 3 summarize the relationships
between stock trading and the self-survey, others sur-
vey, and postsurveys in Study 1 and for the next Study
2. All correlations are significant at the po.001 level.
Given the highly heterogeneous new product pref-
erences of the 116 survey respondents, it can be con-
cluded from the Pearson correlation of 0.880 between
the self- and others survey that respondents are accu-
rate in estimating each other’s preferences. Thus, H1aFigure 4: Scalable Preference Markets Design
946 J PROD INNOV MANAG2010;27:937–954
E. DAHAN ET AL.
is supported, as is Figure 1’s link between self and
others. The surveys support H1b—that expectations
of others are biased by self-preferences—as well, since
individuals who chose an option for themselves had
higher expectations of the percentage of others who
would choose that option (37% higher on average
across all 56 stocks) than those who rejected an op-
tion, and those who rejected an option for themselves
had 18% lower expectations, on average. These differ-
ences were significant at the po.001 level for 46 of the
56 stocks. These biases work against overall accuracy
yet are overcome by the ‘‘wisdom of crowds’’ effect
(H1a) and by the market pricing mechanism (H3).
As seen in row three of Table 3, preference market
prices correlate better with expectations of others
(r5 0.750) than with self-preferences (r5 0.622), sup-
porting H3.
Study 1 also supports H2, that traders base their
stock buying and selling decisions upon expectations
of others more so than on self-preferences. By
aggregating all of the orders to buy and sell each
stock and by comparing the volume-weighted mean
value of the order prices against the self- and others
survey, stock by stock, the correlation between orders
and others (r5 0.76 at the po.0001 level) is observed
to be higher than the correlation between orders and
self (r5 0.65 at the po.01 level).
Finally, Study 1 also reveals that trading stocks re-
sults in a significant amount of learning among traders
and that H4 is supported. Specifically, traders update
their beliefs about others based on the stock prices they
observe, as seen in the increased r of 0.924 (po.001)
between stock prices and the postsurvey compared
with the lower correlation of 0.750 between prices
and the pretrading version (others) of the same sur-
vey. Further, the coefficient of variation in estimates of
others was reduced from an average of 65% in the
others survey to 55% in the postsurvey across all 56
stocks (a statistically significant reduction for 40 of the
56 stocks at the po.001 level). Thus, it appears that the
process of trading causes participants to converge to-
ward a consensus of opinion. The learning aspects of
scalable preference markets could be particularly use-
ful for product categories in which individual new
product preferences are shaped by others, such as fash-
ion goods or those with network externalities.
Discussion. Study 1 showed that preference markets
can be scalable by virtue of an experimental design that
matches traders with a convenient number of stocks
and creates trading links between the groups. Further,
various types of stock types can be incorporated for
single attributes as well as full concepts into a prefer-
ence market and test these simultaneously. Importantly,
Study 1 supports H1a through H4, consistent with Fig-
ure 1’s conceptual model of preference markets.
Study 2: Field Test of Scalable Preference Markets
The second study tests how well scalable preference
markets perform outside of a purely academic envi-
ronment, under real world conditions. The field test
was conducted with managers, designers, and engi-
neers within a large firm that is directly engaged in the
smart phone industry. Further, the limits of scalability
were tested by reducing the number of traders, most
of whom trade remotely, while increasing the number
Table 3: Correlations Based on VWAP for Studies 1 and 2a
n5 116 116 113 63 110 102 63 29
1 1 1 1 2 2 2 2SELF OTHERS PRICES POST SELF OTHERS PRICES POST
1 SELFb
1 OTHERSc .880���
1 PRICESd .622��� .750���
1 POSTe .717��� .832��� .924���
2 SELF .653��� .677��� .723��� .651���
2 OTHERS .685��� .752��� .769��� .733��� .863���
2 PRICES .525��� .620��� .661��� .626��� .707��� .829���
2 POST .560��� .647��� .741��� .696��� .714��� .837��� .910���
aA subset of 39 stocks were common to both Studies 1 and 2.b Self: Mean survey results for individuals’ choices.cOthers: Mean pretrading expectations of others’ choices.d Prices: Preference market results; VWAP.e Post: Mean posttrading expectations of others’ choices.��� po.001.
PREFERENCE MARKETS J PROD INNOV MANAG2010;27:937–954
947
of stocks. As in Study 1, the four hypotheses of the
conceptual model were tested.
Study Design and Procedure. With the help of an
internal innovation team at the firm, 63 people par-
ticipated in the on-site experiment, of whom 15%
were in marketing and sales, 65% in technical posi-
tions, 5% in finance, and the remaining 15% in other
functional areas. Participants reported an average of
4.5 years of industry experience, and 53% claimed a
management position. The experiment was conducted
at the firm’s corporate headquarters, with over 60%
of participants accessing the market remotely from
their offices, after having completed self- and others
survey in advance. The remote participants learned
how the experiment worked through a live, 15-minute
video Web cast with audio questions and answers.
The experiment employed the same user interface and
experimental design as Study 1. Six groups were
formed, ranging in size from 5 to 15 traders, with 21
to 24 stocks each (Figure 2). While Study 1 had ap-
proximately two traders per stock (113 traders, 56
stocks), Study 2 was twice as intensive, with an aver-
age of only one trader per stock (63 traders, 64
stocks). In discussion with the firm’s executives, 64
stocks were defined, encompassing mutually exclusive
features, 39 of which could be compared against those
in Study 1 and 25 of which were new and included
recent advances and features of interest to the firm.
Results. Referring to the fifth through eighth rows
and columns of Table 3, the correlation of 0.863 be-
tween the self- and others survey confirms that respon-
dents are accurate in estimating each other’s new
product preferences, supporting H1 as in Study 1.
Again, preference market prices capture expectations
of others (r50.829) better than self-preferences
(r50.707), supporting H2 and H3. For the 29 respon-
dents (46% response rate) who completed the postsur-
vey, the hypothesis that they learned from trading
stocks, H4, is supported by the higher r of 0.910
between the postsurvey and stock prices (compared
with r50.829) and by the reduction in the average
coefficient of variation (c.v.) from 68% for the others
survey to 41% in the postsurvey. There are no signifi-
cant differences between the 29 individuals who
responded to the postsurvey and the 34 who did not
in the amount of trading activity, offers to buy and sell,
and performance. In fact, learning manifests itself in the
form of statistically significantly reduced coefficients of
variation for 61 of the 64, or 95%, of the smart phone
features.
For the 39 stocks common to Studies 1 and 2, the
students and firm participants diverged somewhat in
their self-preferences (r5only 0.661 between Study 1
and Study 2), so it is not surprising that Study 2’s
stock prices were weaker predictors of Study 1’s self-
preferences (r5 0.525) than they were of Study 2’s
self-preferences (r5 0.707). Differences between the
groups’ results may be due to time-varying new prod-
uct preferences (Studies 1 and 2 took place 20 months
apart), differences in how stocks were defined, and the
distinction between students and professionals. Con-
sidering all of these differences, the degree of conver-
gent validity between Studies 1 and 2 is encouraging.
In effect, Study 2 was a real-world replication of
Study 1. First, it demonstrated that scalable preference
markets perform well in the field, with managers and
employees trading in an efficient manner. Specifically,
the majority of traders mastered the user interface and
were able to trade remotely from their offices. Further,
the high ratio of one stock per trader was still sufficient
to achieve accurate results. Mitigating the high stock-
per-trader ratio and remote participation rate were the
high level of participants’ market expertise and the use
of easier, mutually exclusive questions. Study 2 pro-
duced remarkable results in a very short time, with
fewer people, over a very larger number of questions.
The wisdom-of-crowds-, expertise-aggregation-, and
learn-from-trading effects were all evident.
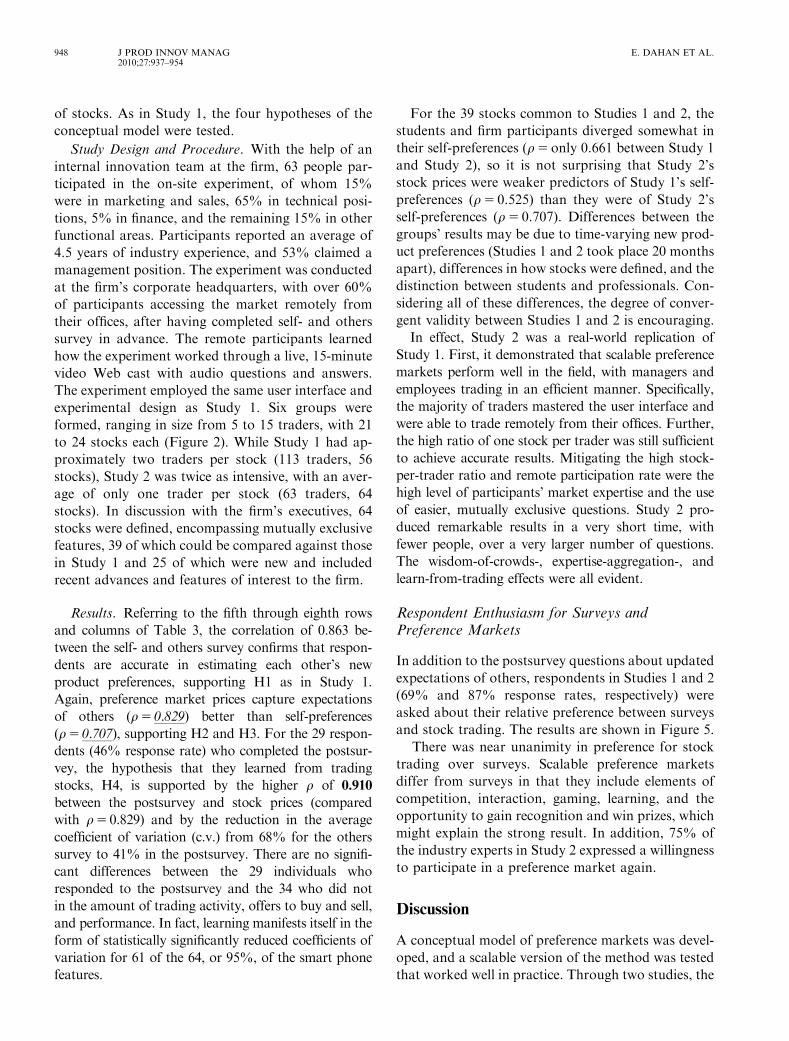
Respondent Enthusiasm for Surveys andPreference Markets
In addition to the postsurvey questions about updated
expectations of others, respondents in Studies 1 and 2
(69% and 87% response rates, respectively) were
asked about their relative preference between surveys
and stock trading. The results are shown in Figure 5.
There was near unanimity in preference for stock
trading over surveys. Scalable preference markets
differ from surveys in that they include elements of
competition, interaction, gaming, learning, and the
opportunity to gain recognition and win prizes, which
might explain the strong result. In addition, 75% of
the industry experts in Study 2 expressed a willingness
to participate in a preference market again.
Discussion
A conceptual model of preference markets was devel-
oped, and a scalable version of the method was tested
that worked well in practice. Through two studies, the
948 J PROD INNOV MANAG2010;27:937–954
E. DAHAN ET AL.
model that self-preferences influence expectationsof
others was validated, which in turn are reflected in
stock prices. Of course, reverse causality, in which one’s
expectations of others’ tastes and preferences may help
form self-preferences, may also explain some of these
results. Were that the case, measuring expectations of
others would be all the more important. However,
given that high variation was observed between traders
in their expectations of others, it seems likely that in-
dividuals have more confidence in their self-preferences
than in their expectations of others, so that causality is
more likely to be from self to others. This is further
evidenced by the fact that two independent groups of
traders had higher correlations between their average
expectations of others (0.752) than in their average in-
dividual preferences (0.653). In other words, preference
markets address the challenges of heterogeneous new
product preferences quite well.
These results suggest that scalable preference mar-
kets offer an effective tool for product development
teams, especially when large numbers of design deci-
sions need to be prioritized. For example, the top 5–10
stocks may merit further study via conjoint analysis.
The number of features and concepts that can be
tested scales in the number of traders, with one trader
per stock representing a minimum. Respondents ex-
press a strong preference for trading stocks over an-
swering surveys. In addition, they learn from each
other while trading, updating their expectations in a
way that converges toward a clearer consensus.
Despite these promising results, some issues re-
main: external validity, comparison with conventional
methods, and directions for future research.
External Validity
Validating methods with actual, external data poses a
challenge in new product development research, as
many of the ideas tested may not exist. And even in
the case of existing features and concepts, access to
accurate data may be limited. Instead, new product
releases and comparisons to prior market research
studies were examined for at least some degree of val-
idation of the accuracy of the present study’s results.
Looking across both experiments, several clear trends
emerge in the data.
Table 4 shows that five smart phone traits were
preferred by the majority, even at a price premium, in
5%10%
31%
54%
2%
9%
35%
55%
0%
10%
20%
30%
40%
50%
60%
Enjoyed theSurvey
Much More
Enjoyed theSurveyMore
Enjoyed themBoth Aboutthe Same
EnjoyedStock Trading
More
EnjoyedStock tradingMuch More
Study 1 (n = 78) Study 2 (n = 55)
Figure 5: Which Method Did Respondents Prefer: Survey or Stock Trading?
Table 4: ‘‘Triage’’ of Smart Phone New Product Preferences as of 2005
Preferred by a Majority Heterogeneous Preference Rejected by a Majority
Small Size and Weight (3–400) Oper. System (Microsoft rising) Hands Free OperationColor Display (320 � 240þ ) Memory Capacity & Battery Life Bluetooth, Infrared, USBCamera (quality rising) Mini-Keybd. vs. 12-key vs. Stylus GPS (but rising)Verizon Cell Network WiFi Capability and Push Email FM radio, Video CameraBlack or Silver Phone Slot types (SD rising) Changeable Faceplates
MP3 vs. TV European CompatibilityPhone Brands and Models e-Wallet
PREFERENCE MARKETS J PROD INNOV MANAG2010;27:937–954
949
virtually every survey and preference market. These
five features can be interpreted as ‘‘must haves,’’ while
10 others were consistently rejected by over two thirds
of respondents. The rejected smart phone aspects may
represent low-priority, or niche, design consider-
ations. From a marketing perspective, the features
in the middle represent differentiation opportunities
that merit further study. Scalable preference markets
facilitate ‘‘triage’’ of customer preferences; design
teams may prioritize opportunities and focus their
product development efforts.
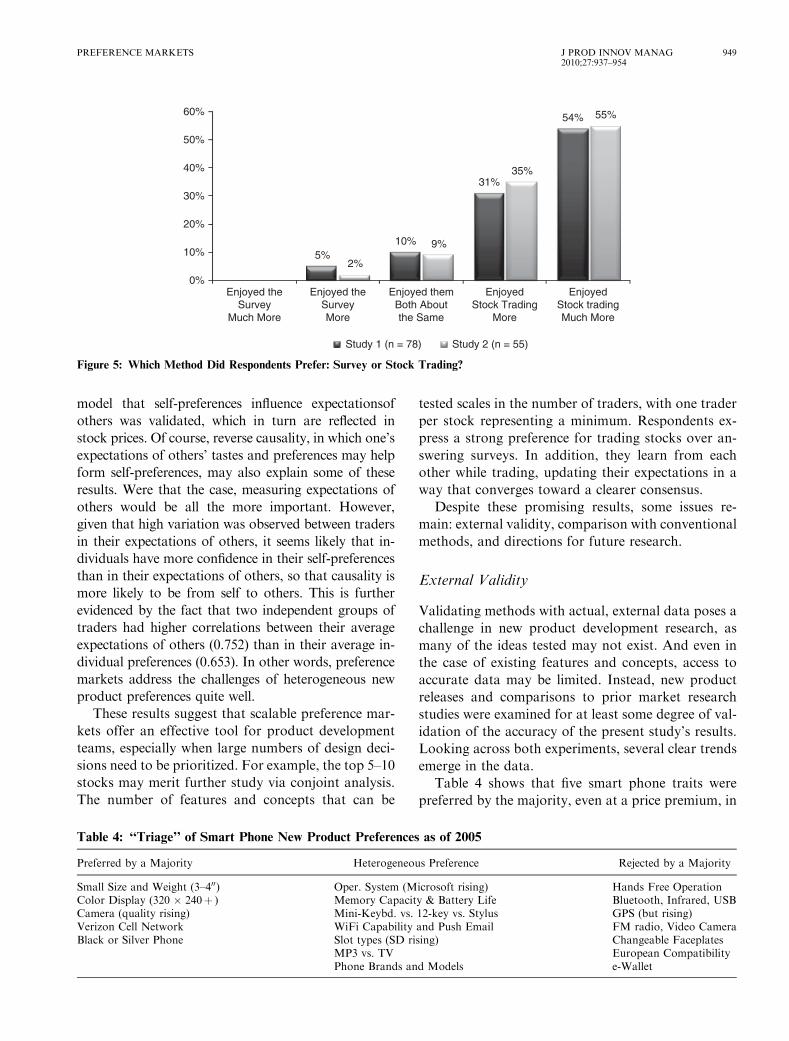
Table 4 also presents an interesting example of ex-
ternal validity, in that one would expect leading smart
phone manufacturers to launch new products conform-
ing to these results. As shown in Figure 6, Nokia, Mo-
torola, and BlackBerry launched smart phones in 2006
that largely fit the table and appeared to be converging
toward a dominant design. On January 27, 2007, Apple
shook up the smart phone market by humanizing the
dilemma of keypad versus mini-keyboard versus stylus
user interface with its innovative touch screen interface,
which has the added benefit of greater screen real estate
in many applications. The iPhone included all of the
‘‘preferred by a majority’’ features on the left side of
Table 4 except for the cell network, for which Apple
opted to strategically partner with AT&T, and with the
exception of Bluetooth, left out all of the features ‘‘re-
jected by the majority.’’
Further, stock prices from Studies 1 and 2
were compared with self-stated preferences for 14
and 11 features, respectively, from two individual
surveys conducted independently of the present
research. The 2004 study, with 518 M.B.A. student
respondents, was published recently in a leading
journal, and the more recent 2005 study, also
with M.B.A. respondents, is part of a working paper.
Both studies focused on new methods of conjoint
analysis.
The correlations, which range from 0.714 to 0.885,
relate the two sets of stock market results from the
present stud’s experiments to the two external studies
and provide further evidence of external validity. In
Table 5, Study 1’s stock trading, also conducted with
M.B.A. students, correlates slightly better with the
external data than does Study 2, which was conducted
with industry experts.
The data support the hypotheses and offer a rea-
sonable degree of external validity, leading to the con-
clusion that preference markets can be quite useful to
new product development teams in measuring prod-
uct concept and attribute preferences as part of NPD.
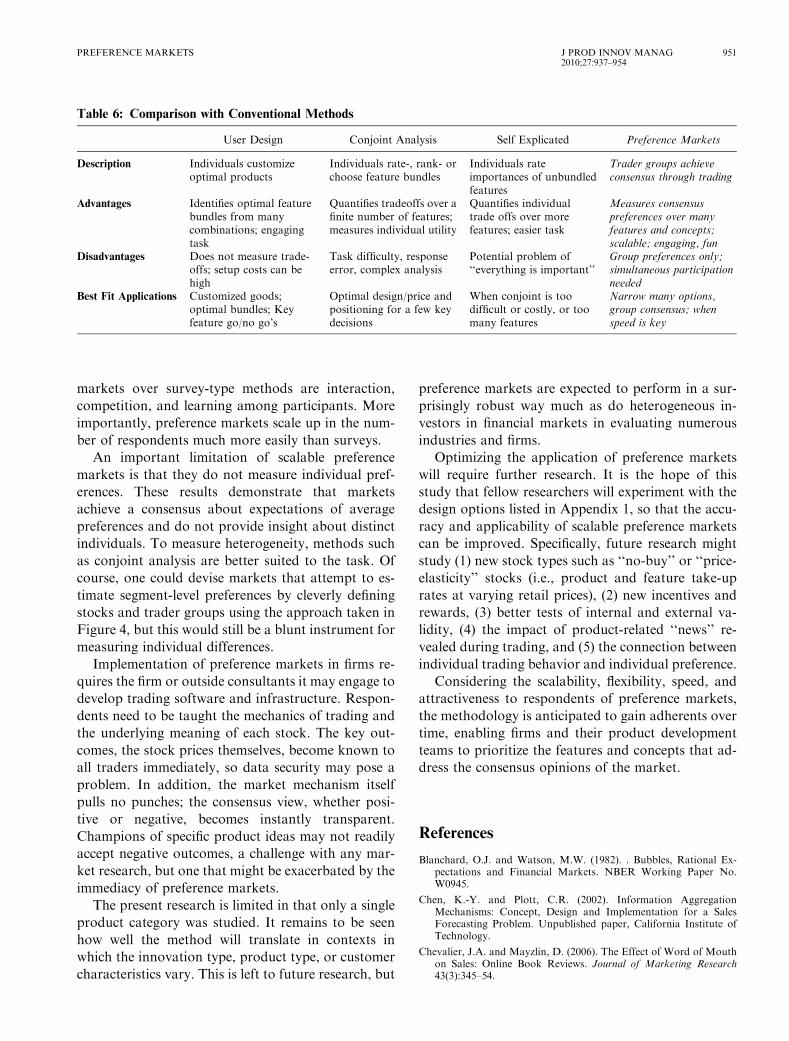
Comparison of Preference Markets withConventional Methods, Limitations, and Directionsfor Future Research
Table 6 compares preference markets with other
methods and highlights their scalability. Preference
markets complement other methods by narrowing a
large number of potential product features and
concepts to a manageable set that can be further
analyzed at the individual level using the other
approaches. Further, distinct benefits of preference
Figure 6: Four New Smart Phones Launched in 2006 and 2007
Table 5: Indication of External Validity (PearsonCorrelations between Stock Results and Two IndependentStudies, 14 and 11 Attributes Compared)
1 2
PRICES PRICES
2004 Study(n5 518) .802�� .714�
2005 Study(n5 206) .885�� .769�
� po.10.�� po.05.
950 J PROD INNOV MANAG2010;27:937–954
E. DAHAN ET AL.
markets over survey-type methods are interaction,
competition, and learning among participants. More
importantly, preference markets scale up in the num-
ber of respondents much more easily than surveys.
An important limitation of scalable preference
markets is that they do not measure individual pref-
erences. These results demonstrate that markets
achieve a consensus about expectations of average
preferences and do not provide insight about distinct
individuals. To measure heterogeneity, methods such
as conjoint analysis are better suited to the task. Of
course, one could devise markets that attempt to es-
timate segment-level preferences by cleverly defining
stocks and trader groups using the approach taken in
Figure 4, but this would still be a blunt instrument for
measuring individual differences.
Implementation of preference markets in firms re-
quires the firm or outside consultants it may engage to
develop trading software and infrastructure. Respon-
dents need to be taught the mechanics of trading and
the underlying meaning of each stock. The key out-
comes, the stock prices themselves, become known to
all traders immediately, so data security may pose a
problem. In addition, the market mechanism itself
pulls no punches; the consensus view, whether posi-
tive or negative, becomes instantly transparent.
Champions of specific product ideas may not readily
accept negative outcomes, a challenge with any mar-
ket research, but one that might be exacerbated by the
immediacy of preference markets.
The present research is limited in that only a single
product category was studied. It remains to be seen
how well the method will translate in contexts in
which the innovation type, product type, or customer
characteristics vary. This is left to future research, but
preference markets are expected to perform in a sur-
prisingly robust way much as do heterogeneous in-
vestors in financial markets in evaluating numerous
industries and firms.
Optimizing the application of preference markets
will require further research. It is the hope of this
study that fellow researchers will experiment with the
design options listed in Appendix 1, so that the accu-
racy and applicability of scalable preference markets
can be improved. Specifically, future research might
study (1) new stock types such as ‘‘no-buy’’ or ‘‘price-
elasticity’’ stocks (i.e., product and feature take-up
rates at varying retail prices), (2) new incentives and
rewards, (3) better tests of internal and external va-
lidity, (4) the impact of product-related ‘‘news’’ re-
vealed during trading, and (5) the connection between
individual trading behavior and individual preference.
Considering the scalability, flexibility, speed, and
attractiveness to respondents of preference markets,
the methodology is anticipated to gain adherents over
time, enabling firms and their product development
teams to prioritize the features and concepts that ad-
dress the consensus opinions of the market.
References
Blanchard, O.J. and Watson, M.W. (1982). . Bubbles, Rational Ex-pectations and Financial Markets. NBER Working Paper No.W0945.
Chen, K.-Y. and Plott, C.R. (2002). Information AggregationMechanisms: Concept, Design and Implementation for a SalesForecasting Problem. Unpublished paper, California Institute ofTechnology.
Chevalier, J.A. and Mayzlin, D. (2006). The Effect of Word of Mouthon Sales: Online Book Reviews. Journal of Marketing Research43(3):345–54.
Table 6: Comparison with Conventional Methods
User Design Conjoint Analysis Self Explicated Preference Markets
Description Individuals customizeoptimal products
Individuals rate-, rank- orchoose feature bundles
Individuals rateimportances of unbundledfeatures
Trader groups achieveconsensus through trading
Advantages Identifies optimal featurebundles from manycombinations; engagingtask
Quantifies tradeoffs over afinite number of features;measures individual utility
Quantifies individualtrade offs over morefeatures; easier task
Measures consensuspreferences over manyfeatures and concepts;scalable; engaging, fun
Disadvantages Does not measure trade-offs; setup costs can behigh
Task difficulty, responseerror, complex analysis
Potential problem of‘‘everything is important’’
Group preferences only;simultaneous participationneeded
Best Fit Applications Customized goods;optimal bundles; Keyfeature go/no go’s
Optimal design/price andpositioning for a few keydecisions
When conjoint is toodifficult or costly, or toomany features
Narrow many options,group consensus; whenspeed is key
PREFERENCE MARKETS J PROD INNOV MANAG2010;27:937–954
951

Cowgill, B., Wolfers, J., and Zitzewitz, E. (2008). Using PredictionMarkets to Track Information Flows: Evidence from Google.Working Paper, Mountain View, CA.
Dahan, E. and Hauser, J.R. (2002). The Virtual Customer. Journal ofProduct Innovation Management 19(5):332–53.
Dahan, E., Kim, A., Lo, A.W., Poggio, T., and Chang, N.T. (2011).Securities Trading of Concepts (STOC). Journal of MarketingResearch 48(8).
Elberse, A. (2007). The Power of Stars: Do Star Actors Drive the Suc-cess of Movies? Journal of Marketing 71(4):102–120.
Elberse, A. and Eliashberg, J. (2003). Dynamic Behavior of Consumersand Retailers Regarding Sequentially Released Products in Inter-national Markets: The Case of Motion Pictures. Marketing Science22(3):329–354.
Fama, E.F. (1970). Efficient Capital Markets: A Review of Theory andEmpirical Work. Journal of Finance 25(2):383–417.
Fama, E.F. (1991). Efficient Capital Markets: II. Journal of Finance46(5):1575–1617.
Forsythe, R., Nelson, F., Neumann, G.R., and Wright, J. (1992).Anatomy of an Experimental Political Stock Market. AmericanEconomic Review 82(5):1142–61.
Forsythe, R., Palfrey, T.R., and Plott, C.R. (1982). Asset Valuation inan Experimental Market. Econometrica 5(3):537–68.
Forsythe, R., Rietz, T.A., and Ross, T.W. (1999). Wishes, Expectationsand Actions: A Survey on Price Formation in Election StockMarkets. Journal of Economic Behavior & Organization 39(1):83–110.
Gilbride, T.J. and Allenby, G.M. (2004). A Choice Model with Con-junctive, Disjunctive, and Compensatory Screening Rules. Market-ing Science 23(3):391–406.
Guarnaschelli, S., Kwasnica, A.M., and Plott, C.R. (2003). Informa-tion Aggregation in Double Auctions: Rational Expectationsand the Winner’s Curse. Information Systems Frontiers 5(1):61–75.
Hanson, R., Oprea, R., and Porter, D. (2005). Information Aggrega-tion and Manipulation in an Experimental Market. Journal of Eco-nomic Behavior and Organization 60(4):449–59.
Hoch, S.J. (1987). Perceived Consensus and Predictive Accuracy: ThePros and Cons of Projection. Journal of Personality and SocialPsychology 53(2):221–34.
Hoch, S.J. (1988). Who Do We Know: Predicting the Interests andOpinions of the American Consumer. Journal of ConsumerResearch 15(3):315–24.
Huber, J., Wittink, D., Fiedler, J.A., and Miller, R. (1993). The Effec-tiveness of Alternative Preference Elicitation Procedures in Predict-ing Choice. Journal of Marketing Research 30(1):105–14.
Kivetz, R., Netzer, O., and Srinivasan, V. (2004). Alternative Modelsfor Capturing the Compromise Effect. Journal of MarketingResearch 41(3):237–57.
Larrick, R.P. and Soll, J.B. (2006). Intuitions About Combining Opin-ions: Misappreciation of the Averaging Principle. ManagementScience 52(1):111–127.
Liechty, J., Ramaswamy, V., and Cohen, S. (2001). Choice-Menus forMass Customization: An Experimental Approach for AnalyzingCustomer Demand with an Application to a Web-Based Informa-tion Service. Journal of Marketing Research 38(2):183–96.
Lorge, I., Fox, D., Davitz, J., and Brenner, M. (1958). A Survey ofStudies Contrasting the Quality of Group Performance and Individ-ual Performance, 1920–1957. Psychological Bulletin 55(6):337–72.
Lucas, R.E. (1972). Expectations and the Neutrality of Money. Journalof Economic Theory 4(2):103–24.
MacKinlay, C.M. (1997). Event Studies in Economics and Finance.Journal of Economic Literature 35(3):13–39.
Oliven, K. and Rietz, T.A. (2004). Suckers Are Born but Markets AreMade: Individual Rationality, Arbitrage, and Market Efficiency onan Electronic Futures Market. Management Science 50(3):336–51.
Park, C.W., Jun, S.Y., and MacInnis, D.J. (2000). Choosing WhatI Want versus Rejecting What I Don’t Want: An Application ofDecision Framing to Product Option Choice Decisions. Journal ofMarketing Research 37(5):187–202.
Pennock, D.M., Lawrence, S., Giles, L.C., and Nielsen, F.A. (2001).The Real Power of Artificial Markets. Science 291(5506):987–88.
Plott, C.R. and Sunder, S. (1982). Efficiency of Experimental SecurityMarkets with Insider Information: An Application of Rational Ex-pectations Models. Journal of Political Economy 90(4):663–98.
Plott, C.R. and Sunder, S. (1988). Rational Expectations and the Ag-gregation of Diverse Information in Laboratory Security Markets.Econometrica 56(5):1085–118.
Proebsting, T. (2005). Tee Time with Admiral Poindexter. MicrosoftResearch. Presentation at DIMACS Workshop on Markets as Pre-dictive Devices (Information Markets).
Randall, T., Terwiesch, C., and Ulrich, K.T. (2007). User Design ofCustomized Products. Marketing Science 26(2):268–80.
Salganik, M.J., Dodds, P.S., and Watts, D.J. (2006). ExperimentalStudy of Inequality and Unpredictability in an Artificial CulturalMarket. Science 311(5762):854–856.
Sawhney, M., Verona, G., and Prandelli, E. (2005). Collaborating toCreate: The Internet as a Platform for Customer Engagement inProduct Innovation. Journal of Interactive Marketing 19(4):4–17.
Sawtooth Software, Inc. (1999). CBC User Manual. Sequim (WA).
Servan-Schreiber, E., Wolfers, J., Pennock, D.M., and Galebach, B.(2004). Prediction Markets: Does Money Matter? ElectronicMarkets 14(3):243–51.
Shin, H. and Dahan, E. (2009). Is It Finance or Is It Marketing? UnitRoot Testing of STOC Data. University of California at LosAngeles, Working Paper.
Shugan, S.M. (1980). The Cost of Thinking. Journal of ConsumerResearch 7(2):99–111.
Simon, H.A. (1955). A Behavioral Model of Rational Choice. Quar-terly Journal of Economics 69(1):99–118.
Smith, V.L. (1982). Microeconomic Systems as an Experimental Sci-ence. American Economic Review 72(5):923–55.
Smith, V.L., Suchanek, G.L., and Williams, A.W. (1988). Bubbles,Crashes and Endogenous Expectations in Experimental Spot AssetMarkets. Econometrica 56(5):1119–51.
Spann, M. and Skiera, B. (2003). Internet-Based Virtual StockMarketsfor Business Forecasting. Management Science 49(10):1310–26.
Spann, M. and Skiera, B. (2009). Sports Forecasting: A Comparison ofthe Forecast Accuracy of Prediction Markets, Betting Odds andTipsters. Journal of Forecasting 28(1):55–72.
Spann, M., Ernst, H., Skiera, B., and Soll, J.H. (2009). Identification ofLead Users for Consumer Products via Virtual Stock Markets.Journal of Product Innovation Management 26(3):322–335.
Sunder, S. (1992). Market for Information: Experimental Evidence.Econometrica 60(3):667–95.
Surowiecki, J. (2004). The Wisdom of Crowds. New York: Doubleday.
Thompson, D.V., Hamilton, R.W., and Rust, R.T. (2005). FeatureFatigue: When Product Capabilities Become Too Much of a GoodThing. Journal of Marketing Research 42(4):431–42.
Timmermann, A.G. (1993). How Learning in Financial Markets Gen-erates Excess Volatility and Predictability in Stock Prices.QuarterlyJournal of Economics 108(4):1135–45.
Toubia, O. (2006). Idea Generation, Creativity, and Incentives. Mar-keting Science 25(5):411–25.
Toubia, O., Simester, D.I., Hauser, J.R., and Dahan, E. (2003). FastPolyhedral Adaptive Conjoint Estimation. Marketing Science22(3):273–303.
Van Bruggen, G.H., Lilien, G.L., and Kacker, M. (2002). Informantsin Organizational Marketing Research: Why Use Multiple Infor-mants and How to Aggregate Responses. Journal of MarketingResearch 39(4):469–78.
952 J PROD INNOV MANAG2010;27:937–954
E. DAHAN ET AL.

Von Hayek, F.A. (1945). The Use of Knowledge in Society. AmericanEconomic Review 35(4):519–30.
Wolfers, J. and Zitzewitz, E. (2004a). Prediction Markets. Journal ofEconomic Perspectives 18(2):107–26.
Wolfers, J. and Zitzewitz, E. (2004b). Using Markets to Evaluate Policy:The Case of the IraqWar. Stanford GSB and NBER,Working Paper.
Yee, M., Dahan, E., Hauser, J.R., and Orlin, J. (2007). Greedoid-BasedNoncompensatory Inference. Marketing Science 26(4):532–549.
Appendix 1: Design of Preference Markets
Marketing ResearchObjective
Design of VirtualSecurities
Stock definition (Stimuli)- Product features- Product concepts or real products
Stock structure- Binary- Mutually exclusive- Bundles
Include price for the option or notExperimental Design Respondents
- How many respondents?- Which population: Convenient sample, consumers, insiders, outsiders, users,
experts, managers- Open or closed access- How many repetitions?- Remote access or central location?
Assignments of stocks- Random- Self selection/Rule-based- Sorting/Filtering
Information display- Allow outside information- Show last price, quantities, volume, order book, past data, rankings
Market MechanismDesign
Trading actions- Limit orders, market orders, restrictions- Short selling, options- Position limits and price limits- Trading fees or no trading fees
Trading mechanism- Call auction- Market maker (i.e., dealer)- Pari-mutuel engine- Double auction
Duration, Trading hours- Initial conditions- Initial prices- Endowment- ‘‘Bank’’
Incentives Reward type- Non-monetary (Recognition, enjoyment)- Monetary rewards
Rewarding rules- Not based on performance: everyone, random sample- Performance based: tournament, sample, everyone, proportional to the portfolio
valueRewarding
- Accuracy: best predictors- Effort: trading behavior
Winner determination- Actual prices- Other replications- ‘‘truth’’- Exogenous: parallel market research
PREFERENCE MARKETS J PROD INNOV MANAG2010;27:937–954
953

Appendix 2: Three Stock Types for Study 1
(19) Mutually Exclusive Smartphone Feature Levels and (6) Mutually Exclusive Smart Phones (each of the 6 categories sums to 100%)
(31) Binary Smartphone Feature Levels (each garners between 0% and 100% ‘‘share’’ at the feature price shown)
954 J PROD INNOV MANAG2010;27:937–954
E. DAHAN ET AL.