Chinese President Xi Jinping meets with visiting Indian Prime ...
Upload
khangminh22Category
view
1download
0
1
1
Introduction
This first Annual Home Visiting Outcomes Report presents aggregate data about the outcomes for all Children, Youth and Families Department (CYFD)-administered home visiting programs funded by the State of New Mexico in Fiscal Year 2013 (FY13). The report was prepared according to the requirements of NMSA 1978, Sections 32A-23B-1 (2013), referred to here as the “Home Visiting Accountability Act,” and is designed to inform policymakers and practitioners about the impact of the state’s Home Visiting System on families and children in New Mexico.
New Mexico’s 20 home visiting programs serve 22 of New Mexico’s 33 counties.
New Mexico Home Visiting Annual Outcomes Report, Fiscal Year 2013
J A N U A R Y 1 , 2 0 1 4
Home Visiting in
FY13, At a Glance:
Programs: 20
Counties Served: 22
Families Funded:
1,005
Home Visits: 20,224
Home Visitors: 144
Prepared by the University of New Mexico Center for Education Policy Research and the Center for Rural and Community Behavioral Health for the New Mexico Children, Youth and Families Department
New Mexico’s Home Visiting System, FY13
The map shows program offices as red dots. Green
indicates counties where home visiting is available.
2 2
2
Home Visiting Annual Outcomes Report for FY13
Home Visiting
Program Goals
Children are Born Healthy
Children are Nurtured by
their Parents and Caregivers
Children are Physically and
Mentally Healthy
Children are Ready for
School
Children and Families are
Safe
Families are Connected to
Formal and Informal
Supports in their
Communities
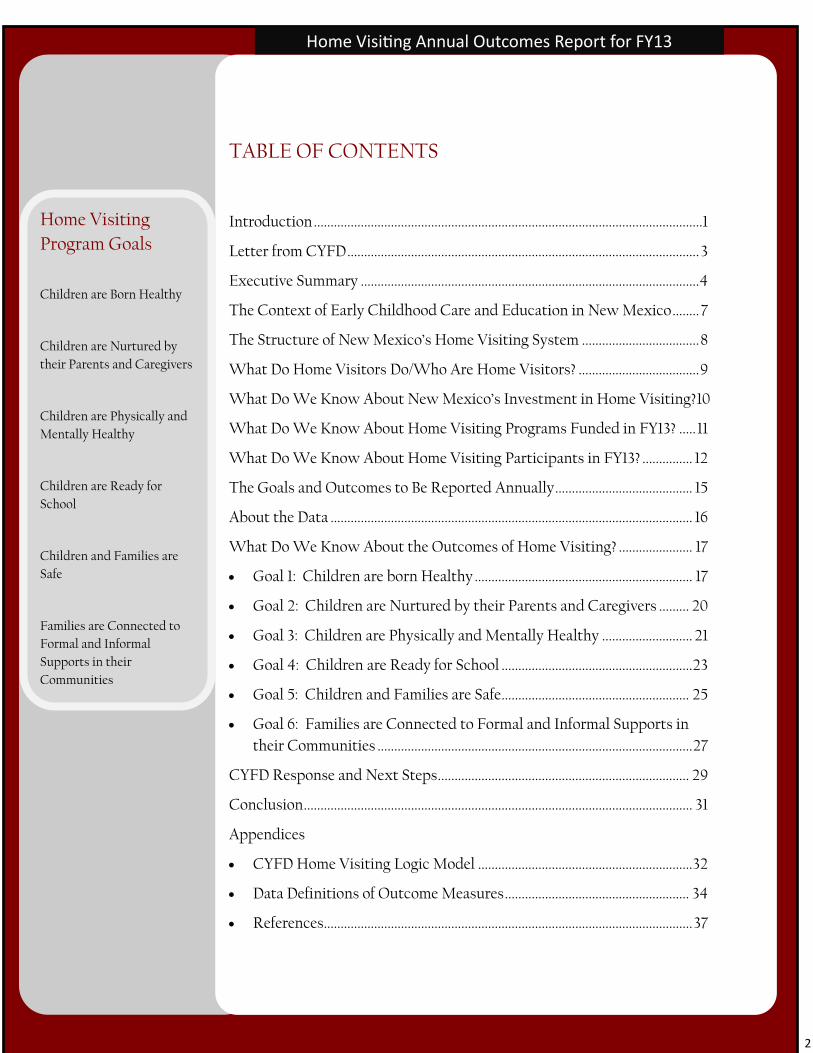
TABLE OF CONTENTS
Introduction ....................................................................................................................1
Letter from CYFD ......................................................................................................... 3
Executive Summary ..................................................................................................... 4
The Context of Early Childhood Care and Education in New Mexico ........ 7
The Structure of New Mexico’s Home Visiting System ................................... 8
What Do Home Visitors Do/Who Are Home Visitors? .................................... 9
What Do We Know About New Mexico’s Investment in Home Visiting?10
What Do We Know About Home Visiting Programs Funded in FY13? ..... 11
What Do We Know About Home Visiting Participants in FY13? ............... 12
The Goals and Outcomes to Be Reported Annually ......................................... 15
About the Data ............................................................................................................ 16
What Do We Know About the Outcomes of Home Visiting? ...................... 17
Goal 1: Children are born Healthy ................................................................. 17
Goal 2: Children are Nurtured by their Parents and Caregivers ......... 20
Goal 3: Children are Physically and Mentally Healthy ........................... 21
Goal 4: Children are Ready for School ......................................................... 23
Goal 5: Children and Families are Safe ........................................................ 25
Goal 6: Families are Connected to Formal and Informal Supports in
their Communities .............................................................................................. 27
CYFD Response and Next Steps ........................................................................... 29
Conclusion .................................................................................................................... 31
Appendices
CYFD Home Visiting Logic Model ................................................................ 32
Data Definitions of Outcome Measures ....................................................... 34
References .............................................................................................................. 37

3
3
Home Visiting Annual Outcomes Report for FY13
New Mexico’s Home
Visiting System on the
National Stage
In the past few years, New Mexico has become a key player in national conversa-tions about home visiting. But New Mexico’s efforts to de-velop a Home Visiting System date back decades, and reflect the hard work of profession-als, advocates, and communi-ties, as well as the bipartisan efforts of lawmakers and elected officials. Those efforts are now being acknowledged in the national dialogue. National interest in New Mexico’s Home Visiting Sys-tem is reflected in numerous invitations during 2013 for CYFD staff to present about the state’s system at national conferences: “Integrating Home Visiting
into a Comprehensive Early Childhood System,” presented in Texas to the Health Re-sources and Services Admin-istration Maternal, Infant and Early Childhood Home Visit-ing (MIECHV) Region VI Conference
“New Mexico Home Visiting,” presented in Washington, DC at the Pew Foundation Na-tional Summit on Quality in Home Visiting Programs
“New Mexico’s Home Visiting Accountability Act,” presented at the Pew Founda-tion National Webinar
“New Mexico’s Comprehen-sive Early Childhood System,” presented in Florida at the Pew Foundation Home Visit-ing State Leaders Meeting
“Is there an App for That? Strengthening Family Engage-ment with Technology,” presented at MIECHV Tech-nical Assistance Coordinating Center (TACC) Webinar

4 4
4
Introduction
On April 2, 2013, Governor Susana Martinez signed SB365: The Home Visiting Accountability Act into law. The Act, which was passed overwhelmingly by both the Senate and House, granted the Children, Youth, and Families Department (CYFD) statutory authority to establish a statewide system of home visiting services.
The Act contains a great deal of detailed information about home visiting, much of which is included throughout this Annual Report. For the purposes of this Executive Summary, it is important to note that home visiting is intended to deliver a variety of informational, educational, developmental, referral and other support services for eligible families who are expecting or who have children who have not yet entered kindergarten. It is designed to promote child well-being and prevent adverse childhood experi-ences. New Mexico is committed to building a Home Visiting System that includes both the infrastruc-ture and programs needed to provide universal, voluntary access for pregnant women, expectant fa-thers, and parents and primary caregivers of children from birth to kindergarten entry. The services provided during home visiting are expected to be research-based, grounded in best practices, and linked to six overarching goals:
Babies that are born healthy;
Children that are nurtured by their parents and caregivers;
Children that are physically and mentally healthy;
Children that are ready for school;
Children and families that are safe; and
Families that are connected to formal and informal supports in their communities.
Finally, the Home Visiting Accountability Act requires CYFD to produce an Annual Outcomes Report to the Governor, the Legislature, and the Early Learning Advisory Council. The Annual Outcomes Report is to include information on the implementation of the Home Visiting System, as well as the system’s pro-gress in meeting specific goals and outcomes.
The University of New Mexico’s Center for Education Policy Research and the Center for Rural and Community Behavioral Health have collaborated to produce the Annual Outcomes Report for CYFD. As the authors of this report, we have had the opportunity to work with policy makers, agency and pro-gram staff, community advocates, and families involved in home visiting. We have the deepest respect for the time, compassion, and effort that these New Mexicans have dedicated to ensuring our state’s youngest and most vulnerable residents begin their lives in the best way possible.
Here are some key points from this year’s report:
What Do We Know About The Implementation Of Home Visiting Programs
In FY13?
New Mexico has a large and impressive system of home visiting that is still in development, and saw its most significant funding come in just the past two years. Home visiting as a state system is in an early phase, and measures of implementation in this report are most usefully considered as a baseline from which to compare future performance. As home visiting has expanded, CYFD has worked to keep con-tracted programs in compliance with its standards for service delivery, screenings, and data reporting. Where data in this report show instances where implementation has lagged, it is important to keep in mind that the system is still growing, with new programs coming online, new employees being recruit-ed and trained, and new research-validated screens being brought into use across all programs in the system.
Home Visiting Annual Outcomes Report for FY13
Executive Summary

5
5
High-level data on implementation of home visiting in FY13 clearly shows a system in expansion: Since FY06, funding for home visiting has increased from $500,000 for a small pilot program to
$8.5 million in state and federal funds in FY14.
In FY13, CYFD received $5.9 million in state and federal funds to support the Home Visiting System.
CYFD funded 20 home visiting programs with the capacity to provide openings and services to 1,005 families at any one time. During FY13, those 20 programs provided home visiting services to 1,911 families and 1,630 children.
Home visiting programs are designed to engage families for varying numbers of visits and lengths of time, depending on the family’s needs and requests. In FY13, 18% of the families had one visit, 21% had two to four visits, and the remaining families had between five and more than 20 visits. Almost 74% of families’ participation in the program ranged from two months to more than two years, in-cluding a large number of families who were continuing their services from previous years.
The average cost per client served in state funded programs was $2,998, and the average cost per client served in federally funded programs was $5,614. The difference is because the state contracts with agencies to provide home visiting services based on required contractual costs of $3,000 per client opening. Federal funds support contracts based on actual costs, and so federal contracts vary by program and home visiting model.
In FY13, 144 professionals provided home visiting services. These home visitors hold a wide variety of educational credentials, ranging from high school diplomas to doctoral degrees. They receive pro-fessional development in curriculum, working with children and families, and use of screening tools and data entry, which is critical to achieving both outcomes and accountability.
What Do We Know About The Outcomes Of Home Visiting In FY13? One of the most important questions about home visiting is whether the program is achieving its goals. This is also one of the most technically challenging questions to answer, because we need valid and reli-able measures related to healthy births, nurturance, physical and mental health, school readiness, safe-ty, and sources of support. In addition, we need to develop a sense of how many families would have to participate in home visiting programs in order to see statewide improvements in child well-being. Clear-ly, many individual children and families benefit from home visiting, but one of the hopes in establishing a statewide Home Visiting System is to have statewide impact. Finally, some of the goals outlined for home visiting are long-term goals, and New Mexico needs an effective system for tracking children as they move through early childhood programs, into K-12 education, and beyond.
It is clear from the data that New Mexico has made important progress in developing measures related to the six key goals of home visiting. Here are some of those results:
Pregnant women in home visiting accessed prenatal care earlier and more often than pregnant women statewide.
Postpartum depression screens were done for 536 eligible mothers. Approximately 30% of those mothers were identified as having symptoms of postpartum depression. Of those mothers, 75% were referred for services, where available, and more than half of those mothers engaged in referral supports.
Home Visiting Annual Outcomes Report for FY13
Executive Summary (cont’d)

6 6
6
The state piloted the use of an important tool (Parenting Interactions with Children: Checklist of Observations Linked to Outcomes -PICCOLO) with 163 families during FY13. This assessment will provide valuable information about how well children are being nurtured.
Becoming ready for school is an ongoing process that begins in infancy and encompasses secure relationships, language skills and other cognitive development, and strong socio-emotional devel-opment. The state used a number of screening assessments to measure these outcomes, includ-ing the Ages & Stages Questionnaire: Social Emotional (ASQ-SE). Three-quarters of eligible chil-dren were screened on the ASQ-SE and 8% were identified as at risk.
Domestic violence risk screens were administered to 1,092 caregivers. Of these, 98 (9%) scored at risk on the Woman Abuse Screening Tool (WAST). Of these 98, 26 were referred for services and 13 engaged in services.
Three important screening tools [The Ages & Stages Questionnaire (ASQ), the Woman Abuse Screening Tool (WAST) and the Edinburgh Postnatal Depression Scale (EPDS)] were used with the majority of eligible clients. These screens provided home visitors with valuable information used to guide the kinds of services offered to families, from learning about particular topics to clinical referrals.
CYFD will use the findings of this report to continue to strengthen the implementation of home visiting and the services provided to families. Their response to the data in this report, and plans for moving forward, begin on page 29.
Conclusion
Over the past decade, New Mexico has committed itself to improving the lives of infants and young children. The state has increased funding, passed key legislation, implemented programs, developed infrastructure, and touched the lives of numerous young children and their families. Even more importantly, New Mexicans from all political persuasions, diverse communities, and geographic regions have forged a powerful alliance that focuses on the care and education of our youngest residents. New Mexico is nationally recognized as a leader in early childhood, and these efforts should be a point of pride for this state.
The passage of New Mexico’s Home Visiting Accountability Act places our state firmly in the midst of the national discussion on how to support young children during their most critical de-velopmental period, how to help families become self-sufficient, and how to build stronger com-munities. Leading states (including New Mexico) are grappling with issues including how to better protect children from adverse experiences, how to develop different models of home visiting that meet the needs of diverse communities, how to gather the data that lead to continuous improve-ment, how to finance home visiting, how to recruit and support the most effective staff, how to build collaborative relationships among all the stakeholders committed to the care and education of young children, and how to build realistic plans for expansion. These are daunting challenges for sure, but they are challenges worth facing. And surely, they are challenges we can meet.
Home Visiting Annual Outcomes Report for FY13
Executive Summary (cont’d)

7
7
CYFD Home Visiting Principles “The Home Visiting Program is designed to promote child well-being and prevent adverse childhood experiences. Home Visiting Program staff provide a compre-hensive array of services that promote parental competence and successful early childhood health and development by building long-term relationships with families and optimizing the relationships between parents and children in their home environments. Home visiting from this perspective is both a promotion- and prevention-level strategy.” - Home Visiting Program
Standards Manual
In recent years, New Mexico has emerged as a national leader in promoting policies and pro-grams that support early childhood development. In 2011, The Early Childhood Care and Ed-ucation Act (NMSA 1978, Section 32A-23A-1) was passed by the Legislature and signed by Governor Martinez. The bill’s purpose was to establish a comprehensive early childhood care and education system through an aligned continuum of state and private programs, includ-ing home visiting, early intervention, child care, Early Head Start, Head Start, early childhood special education, family support, and pre-kindergarten, and to maintain or establish the infrastructure necessary to support program quality.
State-funded home visiting programs began in New Mexico in 1989, when a variety of pro-grams began to spread in communities around the state. In 2005, a Home Visiting Task Force, comprised of CYFD, the Public Education Department, the Department of Health, and the Human Services Department, began to address the expansion, coordination, and align-ment of state-funded services. In 2007, the Legislature established a Home Visitation Work Group, charged with developing a long-term plan to phase in a statewide system of home visiting. In 2009, CYFD was designated the state’s lead agency for this coordinated statewide Home Visiting System. The 2013 legislative session saw passage of the New Mexico Home Visiting Accountability Act, which defines the Home Visiting System, establishes a common framework for service delivery and accountability across all programs, and outlines expectations for annual re-porting of home visiting outcomes. The Act defines “Home Visiting” for New Mexico in these terms:
Home Visiting Annual Outcomes Report for FY13
The Context of Early Childhood Care and Education in New Mexico
New Mexico’s 2013 Home Visiting Accountability Act
Why: To promote child well-being and prevent adverse childhood experiences
What: “Home visiting” is a program strategy that delivers a variety of informational, educational, developmental, referral and other support services
For Whom: Families who are expecting or who have children who have not yet entered kindergarten
By Whom: Well-trained and competent staff, including nurses, social workers and other early childhood and health professionals, or trained and supervised lay workers
How: By promoting parental competence and successful early childhood health and development by building long-term relationships with families and optimizing the relationships between parents and children
-NMSA 1978, Sections 32c; 32D1-2; G4 (2013)

8 8
8
Rather than adopt a single model of home visiting, CYFD led a process to review current home visiting research and best practices. This research was used to establish program standards that provide a common framework of service delivery and accountability across all programs. This has allowed the New Mexico Home Visiting System to promote community-specific home visiting programs that are responsive to their communities’ unique cultural and linguistic heritage, and to respond to the myriad needs of New Mexico’s children beyond the restrictions of some nationally-recognized home visiting models.
CYFD’s Home Visiting Program Standards were developed to establish a clear mission of home visiting as one system; to provide a unifying infrastructure for training, technical assis-tance and data reporting; and to articulate a specific set of expectations for how a home vis-iting program should be implemented. These Home Visiting Program Standards are based on research and best practices for:
Home Visiting Annual Outcomes Report for FY13
The Structure of New Mexico’s Home Visiting System
Home Visiting Mission Statement Home visitors partner with families to promote child development and confident parenting by supporting the relationship among the family, home visitor, and the community.
Program Standard Rationale
1. Program Participation Effective programs clearly identify their target population and intensity and
duration of participation, in order to achieve outcomes.
2. Culturally Competent
Service Delivery
Diversity in New Mexico makes it essential to support services that respect
the culture, values, and preferences of families.
3. Relationship-Based
Practices
The quality of parent-child interactions is central to all intended outcomes.
4. Family and Child Goal
Setting
Screening and family-specific goal setting enable families to work toward
outcomes outlined in the logic model. (See Appendix 1 for logic model).
5. Curriculum and Service
Delivery Approach
New Mexico home visiting programs are required to provide information on
infant/child development, including developmental guidance using a research-
based curriculum.
6. Program Management
Systems
Implementation of sound and coherent management practices ensures support
to staff to provide high quality services.
7. Staff Qualifications and
Supervision
Effectiveness is enhanced when home visitors have knowledge, skills, experi-
ence and personal characteristics to deliver services. Professional develop-
ment fosters effectiveness through specialized training that is directly related
to work requirements.
8. Community
Engagement
Home visiting services should be embedded within each community’s early
childhood system of care. Strategic planning and cross-agency relationships
foster effective community referral networks and a continuum of services that
meet the needs of families.
9. Data Management While different agencies may use different models or approaches to home
visiting within their communities, all follow the same requirements for data
collection and reporting. CYFD uses the data collected by all agencies to
monitor and improve service delivery in each community across the state.

9
9
Professional
Development
All home visitors are
trained in curriculum
implementation and/
or the model used by
their program.
In addition, CYFD
requires training in
relationship-based
practice, pregnancy
and early parenthood,
parent-child interac-
tion, infant/child
growth and develop-
ment, community
resources, use of all
screening tools, and
documentation and
data entry.
Each home visitor
completes at least 10
hours of ongoing
professional develop-
ment annually.
New Mexico’s CYFD-funded home visiting programs vary in many ways; however, all programs are unified by a set of standards and values required by CYFD. Relationships are at the heart of those standards. All CYFD home visiting programs are required to place the child/caregiver re-lationship at the core of the home visiting effort. The guiding philosophy is that every facet of young children’s success – physical, social, cognitive or otherwise – emanates from their rela-tionships with primary caregivers. Home visitors are tasked with establishing a trusting relationship with families, and working with them in a non-judgmental way. According to the CYFD Home Visiting Program Standards manual, “Giving up on families or labeling them as ‘unmotivated’ or ‘resistant’ is not accepta-ble within this framework. In instances where services are not accepted and/or families are not satisfied, providers reflect and try to understand the family’s perspective.” Within this framework of relationships and trust, home visitors provide support and infor-mation, with an emphasis on preventing adverse experiences for children and families. Home visitors administer numerous screenings, which allow them to check for early signs of develop-mental delay in children, depression in mothers, abuse within the family, and other risk fac-tors. When these screenings show families have challenges that are beyond the scope of pre-vention, home visitors refer families to support services in their communities. They also follow up on these referrals to see if families are using the services. Beyond the formal screenings, home visitors provide families with information, support, and advice. This part of the service is uniquely tailored to families and their goals, and can include everything from handouts on coping with teething to information on the importance of read-ing to children. Families work with home visitors to set goals for their home visiting experi-ence, and those goals help define logistics such as the frequency of home visits and how long the family remains in the program.
Who Are Home Visitors?
Programs may be staffed with a combination of degreed and non-degreed professionals who have knowledge of the prenatal period, infant/toddler safety and health, early childhood development, early childhood mental health principles and practices, knowledge of communi-ty resources, and strong relationship-building skills. In FY13, there were 144 home visitors providing home visiting services. Some were full-time, some part-time, and some were supervisors who also provide home visits. Home visitors hold a wide variety of educational credentials, ranging from high school diploma to doctoral de-gree. Twenty-seven of the system’s home visiting staff have additional endorsements and certifications, such as infant mental health endorsement, licensed professional counselor, or li-censed baccalaureate or master’s social worker.
Home Visiting Annual Outcomes Report for FY13
Supervision
All home visitors
receive at least two
hours per month of
individual reflective
supervision with a
qualified supervisor
and have access to a
master’s level licensed
mental health profes-
sional for consulta-
tion.
What Do Home Visitors Do?
Highest Education of Home Visitors (n= 72 of 144 total)
22%
12%
46%
18%
2%High SchoolDiploma or GED
Associate's
Degree
Bachelor'sDegree
Master's Degree
Doctoral Degree
* Educational attainment data was not reported for 50% of
home visiting staff.

10 10
10
Openings
Versus
Families
CYFD funds a given
number of openings
per program, but each
opening does not nec-
essarily represent one
family.
For example, a family
may successfully par-
ticipate in home visit-
ing for six months and
exit the program. A
second family would
then occupy that same
funded opening for
the remaining six
months.
In FY13,
1,005 openings served
1,911 families (receiving at least one home visit).
New Mexico is deeply committed to building a comprehensive system of early childhood pro-grams to ensure the best returns on its investments in the state’s youngest residents. The Ear-ly Childhood Care and Education Act, passed by the Legislature and signed by Governor Mar-tinez in 2011, calls for “an aligned continuum of state and private programs, including home visitation, early intervention, child care, Early Head Start, Head Start, early childhood special education, family support and prekindergarten, and to maintain or establish the infrastruc-ture to support quality in the system’s programs.” (NMSA 1978, § 32A-23A-1)
New Mexico’s Long-Term Investment in Home Visiting
Both the Executive and Legislative branches have demonstrated an ever-increasing commit-ment to home visiting, and have increased funding significantly since FY06. State funding for home visiting began in FY06 with a small pilot funded for $500,000. In FY14, funding reached $8,451,800, including both state and federal funds. This represents almost a sixteen-fold (1590%) increase in eight years.
How Much Does Home Visiting Cost Per Family?
In FY13, CYFD funded 800 openings with state general funds for a total of $2.4 million. The average cost per opening was $2,998.
In FY13, CYFD funded 205 openings using federal funds, for an average cost per opening of $5,614.
The state contracts with agencies to provide home visiting services based on a required contractual cost of $3,000 per opening. Federal funds support contracts based on actual costs, and so federal contracts vary by program and home visiting model.
The cost of building a comprehensive Home Visiting System includes both direct services and infrastructure development. Infrastructure costs include data system development and man-agement, professional development, and other administrative costs. In FY13, CYFD spent 75% of its state general funds on direct services and 25% on infra-
structure development (data and management systems and training). In FY13, CYFD received a $1.1 million non-recurring federal competitive grant for infra-
structure development. Of the remaining federal funds, CYFD spent 72% on direct services.
Home Visiting Annual Outcomes Report for FY13
What Do We Know About New Mexico’s Investments In Home Visiting?
Source: LFC Post-Session Reviews
FY13 Funding
= $5.9 million

11
11
FY13 Programs
New Mexico’s Home
Visiting System
included 20 programs
serving residents of 22
of New Mexico’s 33
counties.
The total number of
funded openings was
1,005.
Home Visiting Annual Outcomes Report for FY13
Program Service Areas and Number of Openings Funded
What Do We Know About Home Visiting Programs Funded in FY13?
How Do Program Models Match Community Needs?
CYFD-funded home visiting programs served both rural and urban communities in FY13, and are contracted through a variety of clinic-, hospital-, and community-based entities. All programs are required to identify the specific needs of the communities in which they work. Programs are encouraged to select home visiting models and tools that research indicates will effectively serve their prioritized populations and goals. While the majority of the state’s programs have developed their own mixed service delivery models using approved research-based curricula, some programs follow proprietary, comprehensive models:
CYFD-approved evidence-based and promising practice models are:
First Born Parents as Teachers Nurse-Family Partnership
CYFD-approved research-based home visiting curricula include:
Partners for a Healthy Baby Portage Project Growing: Birth to Three Partners in Parenting Education

12 12
12
Who Receives State-Funded Home Visiting? According to the Home Visiting Accountability Act, state-funded home visiting services are offered: On a voluntary basis To pregnant women, expectant fathers, and parents and primary caregivers of children from birth to kindergar-ten entry.
Who Did the Home Visiting System Serve in 2013? In FY13, 2,306 families were in-volved with CYFD home visiting pro-grams in some way, either through initial contact and/or engagement with services.
Of these, 83% (1,911) have had at least one home visit.
Seventeen percent (395) made con-tact with a program but were either too new to the program to have had a visit or discontinued contact prior to a first completed visit. In this report, we are considering active home visiting participants to be those 1,911 families who engaged with at least one actual home visit. These families included 1,630 chil-dren.
How Do Families Flow Through the Home Visiting System? Home visiting services are volun-tary and have no eligibility require-ments, with the exception of the Nurse-Family Partnership and First Born programs, and are considered universal access. Services are free of charge and a physician’s referral is not required. Programs vary in the manner in which they enroll families. In many cases, an interested caregiver or parent-to-be can contact the local home visiting program and begin services. In other cases, families are referred from health care pro-viders, social service agencies, or other early childhood providers.
Families by Active Status, FY13 (n=2,306; active=1,911)
Home Visiting Annual Outcomes Report for FY13
Referred- Family
can be introduced to home visiting on a referral from another provider
Waiting List- If program is at
capacity, family is added to a waiting list
Off Waiting List-Family decides to leave waiting list for services
Referral Declined -Family decides to not follow up referral into home visiting
Active- Family
consents to accept home visiting services
Exited- A once-
active family leaves the program for various reasons, including completion of goals
Blue = Active or In ProcessRed = Inactive
Eligibility and
Target
Populations
The Act guides CYFD-
funded home visiting
services to be voluntary
and universally availa-
ble to families. As pre-
vention and promotion
services, they carry no
eligibility requirements
(unless required by the
program model, such as
Nurse-Family Partner-
ship or First Born.)
In cases where demand
is greater than available
openings, programs
determine appropriate
criteria for priority
enrollment.
For example, programs
may prioritize enroll-
ment for pregnant
women, first-time par-
ents, teen parents, and
families considered to
face additional risks.
What Do We Know About Home Visiting Participants in FY13?
17% (n=395)
15%(n=341)
17%(n=398)
19% (n=449)
18%(n=404)
14% (n=319) No FY13 visits
1 visit
2 to 4 visits
5 to 10 visits
11 to 20 visits
More than 20 visits
Family Involvement of Any Type, FY13 (n=2,306)
Note: The 395 families with no visits include families who are newly enrolled or
waiting for available openings. Families may have begun services in past FYs.
83%
(n=1,911)
17%
(n= 395)Active (at least 1home visit)
Inactive (No visitin FY13)

13
13
Who Were Home Visiting Participants in 2013?
Home Visiting Annual Outcomes Report for FY13
What Do We Know About Home Visiting Participants in FY13?
Caregivers by Age, FY13 (n=2,381*)
Child, by Age at Start of FY13 (n=910*)
Caregivers and Children, by Race/Ethnicity, FY13 (n=4,204*)
*Total of 2,381 reflects multiple caregivers in the 1,911
families with 1 or more home visits in FY13.
*Total of 4,204 reflects both caregivers and children in the
1,911 active families with 1 or more home visits in FY13.
Language Spoken at Home, All Active Families (n=954*)
Families by Annual Income (n=386*)
*Annual income is collected on a voluntary basis, and was only
collected for 20.2% of the 1,911 active families with 1 or more
home visits in FY13 (n=386).
*Home language was only collected for 49.9% of the 1,911
active families with 1 or more home visits in FY13 (n=954).
Children Birth to Age 3 in New Mexico
There were
approximately
84,000 children
age birth to 3 in
New Mexico in
FY13.
A total of 1,630
children were
in families who
received at
least one home
visit in FY13.
Babies Born to Teens in New Mexico In 2012, 1,048
babies were
born to
mothers age
10-19.
(New Mexico
Birth Certificates
Database, Depart-
ment of Health)
In FY13, 228
caregivers in
home visiting
programs were
age 13-18.
12.1%
(n=288)
43.4%
(n=1,034)
33.9%
(n=806
10%
(n=237)0.7% (n=16)
13-18
19-25
26-35
36-44
45 & older
59%20%
16%
3% 1% 1% 0%Hispanic of Any Race
White Non-Hispanic
American Indian orAlaska Native
Asian or Pacific Islander
African American
Two or More Races
Unknown
10%(n=93)
10%(n=91)
8%(n=72)
11%(n=102
10%(n=92)
30%(n=271)
16%(n=147
4%n=35)
1%(n=7) 0 to 2 months
2 to 4 months
4 to 6 months
6 to 9 months
9 to 12 months
1 to 2 years
2 to 3 years
3 to 4 years
4 to 5 years
*A total of 1,630 child clients were served in the 1,911 active families with 1 or more home visits in FY13. Of these, 1,623 had useable
birthdate data available. Of these 1,623, 910 were born and receiving services at the start of FY13. The remaining 713 children who
received services in FY13 were not yet born at the start of the FY; their families were still receiving prenatal services.
49%
29%
10%
5%
4% 3%
$0 - $10,000
$10,001 - $20,000
$20,001 - $30,000
$30,001 - $40,000
$40,001 - $50,000
> $50,000
78% of families who
reported income* had
an annual income below
$20,000.
67.9%
24.5%
0.5%3.4% 3.7%
English
Spanish
BilingualEnglish/Spanish
Indigenous
Language
Other

14 14
14
Educational Attainment of Caregivers in Home Visiting
Of the 699 caregivers for whom educational at-tainment was recorded:
14% were still in high school
20% had less than a high school degree
26% had a high school diploma or GED
25% had some college but less than a bache-lor’s degree
14% had a bachelor’s degree or higher
What is the Duration of Family Participation?
Because models are designed to engage families for varying lengths of time, it is difficult to compare participation durations across families. The goal of all programs, however, is to retain participants until family goals are achieved or the home vis-iting curriculum is completed.
Ideal frequency and duration of services is determined jointly by the home visitor and the family, according to the family’s needs, preferences, and cultural con-text, and according to CYFD’s guidelines for screening proto-cols and curricula completion. The results of screenings are used as one of the key elements for planning services, including frequency of home visits.
How Many Visits Have Families Received?
Home Visiting Annual Outcomes Report for FY13
What Do We Know About Home Visiting Participants in FY13?
Number of FY13 Visits Received by Participating Families (Total Families =1,911)
Total Duration of Family Participation, from Initial Date of Enrollment, in Months (Total FY13 Families = 1,911)
17.8%(n= 341)
20.8%(n= 398)
23.5%(n= 449)
21.1%(n= 404)
16.7%(n= 319)
0
100
200
300
400
500
1 visit 2 to 4visits
5 to 10visits
11 to 20visits
More than20 visits
Nu
mb
er
of
Fam
ilie
s
Of the 1,911 families active in FY13:
746 (39%) were enrolled for the first time
1,165 (61%) were continuing services begun in a prior fiscal year
33% have received a cumulative total of 20 or more home visits
17% have received more than 40 visits
61% (n=1,165)
39%
(n=746)First enrolledin FY13
First enrolledprior to FY13
19.7%(n= 376)
8%(n= 152)
32.7%(n= 624)
7.6%(n= 146)
18.9%(n= 362)
13.1%(n= 251)
0
100
200
300
400
500
600
700
<2months:
Exited
<2months:
Active/InProcess
2 to 8months
9 to 11months
12 to 24months
>24months
15
15
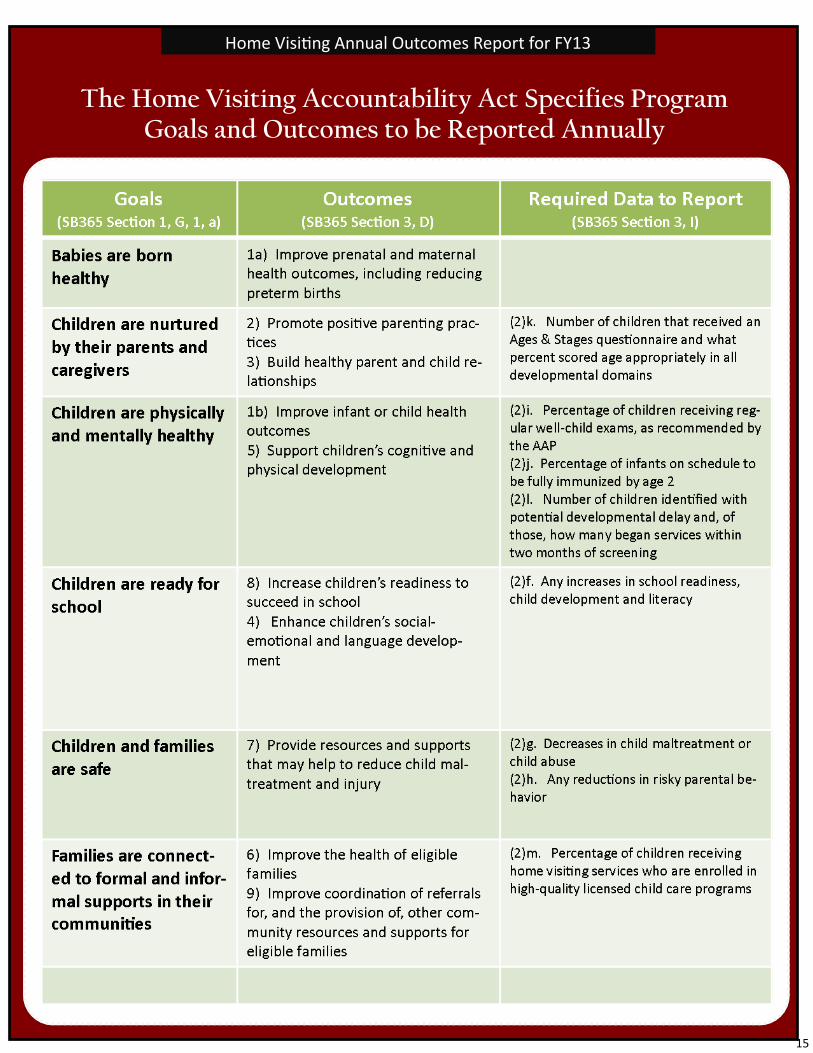
Home Visiting Annual Outcomes Report for FY13
The Home Visiting Accountability Act Specifies Program Goals and Outcomes to be Reported Annually

16 16
16
CYFD Home Visiting Database
Data for nearly all program descriptors and outcome measures are reported and collected in the state’s Home Visiting Database, maintained and managed for CYFD by the Early Childhood Services Center at UNM Continuing Education. In addition to its use for external accountability, the database is used by program managers, who are trained to use data internally for program improvement.
Data is entered by the home visitors who work directly with families. Part of the professional development provided by CYFD is training on how to collect and report data completely and accurately. This has been an increasing focus for CYFD. Nonetheless, home visitors find it challenging to balance the time needed to fully serve families with the time demands of extensive data entry on all families, services, and screens. It is also a challenge to bring new programs and new home visitors up to speed on the use of the database in timely fashion.
The data analyzed for this report is de-identified, family-level data. Families’ privacy was protected by the removal of all names and other identifying information, while still allowing researchers to analyze data at the individual family level. Researchers did not have access to detailed case files, which might shed light on specific family circumstances or the reasons particular decisions were made.
The Screening Tools Linked to Outcomes
Home Visiting Annual Outcomes Report for FY13
About the Data

17
17
Home Visiting Annual Outcomes Report for FY13
Real People: Jacqueline,
Carlos, and Isaiah
Jacqueline and Carlos’ favorite pictures of their family were taken by Louise, the home visitor who has been part of their family for more than a year. The pictures, which hang in the family’s south-east Albuquerque apartment, were taken in the neonatal inten-sive care unit after their son Isaiah was born six weeks early. Louise began working with the family through a midwife’s refer-ral when Jacqueline was 10 weeks pregnant. They ended up needing her support more than they ex-pected, because Jacqueline was in a car crash a few months later. The crash led to nerve damage in her arm, stacks of medical bills, and the loss of the couple’s car. Carlos said Louise was crucial for the family during that time. “Louise was with us through the accident,” he said. “When Jacquel-ine was depressed, Louise was there picking her up, letting her know she can move that arm.” Despite his premature birth in April of 2013, Isaiah is now a pretty healthy guy. He has some webbing on his hand and some delays in development, but most of his parents’ challenges — getting him to sleep and finding new foods to feed him — are typi-cal for first-time parents. On a recent home visit Louise, who is a nurse, brought a baby scale and weighed Isaiah. She measured the circumference of his head and few other dimen-sions before he began to squirm.
Goal 1: Children are Born Healthy SB365 Outcome 1: Improve prenatal, maternal, infant or child health out-comes, including reducing preterm births
Background: What the Research Says Research tells us that healthy babies tend to grow into healthier adults, resulting in healthier overall communities. Two classic measures of physical health for infants are birth weight and preterm births. Research has also identified a number of strate-gies that are helpful in improving children’s health, including: Encouraging the use of prenatal care Discontinuing substance abuse during pregnancy Increasing rates of childhood immunizations (Institute of Medicine, 2013) Encouraging good nutritional intake Initiation of breastfeeding (Ip et al., 2007) Preventing maternal depression (Center for the Developing Child, 2010) While it may not be intuitive that maternal depression is linked to a child’s health, children of depressed mothers demonstrate poorer health compared to children of non-depressed mothers (Casey et al., 2004). Moreover, infants of clinically de-pressed mothers often withdraw from their caregivers, which affects their language skills as well as their physical and cognitive development (Embry and Dawson, 2002).
How Home Visiting Addresses this Goal
Research shows that quality home visiting programs improve birth outcomes and facilitate a more efficient use of the health care system (Lee et al., 2007). Home visi-tors screen families regularly for perinatal depression and health care access and usage. CYFD requires that home visitors work with families to address: Adequate use of prenatal, postpartum, and well-child medical care Reported prenatal substance abuse Postpartum depression Initiation of breastfeeding
When a need or risk in these areas is identified, home visitors are trained to help families access community resources and to make appropriate referrals.
Outcome Measurement The measures used here to examine home visiting’s impact are: Connection to prenatal care Discontinuation of substance use during pregnancy Rates of screening and referral to services for postpartum depression Initiation of breastfeeding Rates of immunization by age 2 Completion of recommended well-child pediatric health care visits
Continued on next page
What Do We Know About the Outcomes of Home Visiting?

18 18
18
Home Visiting Annual Outcomes Report for FY13
Real People, (cont.)
She brought pamphlets on teeth-ing, anticipating that Isaiah has started the process or soon will, and chatted with Jacqueline about strategies for coping with teething and keeping Isaiah’s mouth clean. Once teeth start poking through his gums, she said, those openings can become infection sites. Louise has helped the family in a variety of ways, Carlos said. She referred them to services that helped them get baby supplies, and helped them get signed up for Women, Infants and Children ser-vices. But Carlos also described less tangible ways Louise has sup-ported the family. “She gives me confidence that I can be the best dad,” he said. “And she makes me want to be that best dad.” And when he and Jacqueline see positive results from their par-enting, it boosts that confidence further. For example, at six months old, Isaiah hasn’t had a diaper rash. Carlos attributes this to tips from Louise about how often to change his diapers and how to do it properly. Given how much home visiting has helped his family, Carlos has asked Louise about ways he can give back. He said he would like to give some of his time to help inspire other fathers. “I’d tell them if I can do it they can do it,” he said.
Percentage of Mothers Enrolled Prenatally who Reported Accessing Prenatal Care* in FY13
Percentage of Mothers Enrolled Prenatally who Reported Substance Use While Pregnant, FY13*
Comparison of Prenatal Care Starts, Home Visiting Mothers (FY13) and Mothers Statewide (2008-12)
Outcome Data
A total of 731 women (38.3% of active families) were enrolled in home visiting services prenatally in FY13. Of these, 87 answered a relevant Perinatal Question-naire item about their engagement in prenatal care. All (100%) reported receiving prenatal care, and all (100%) reported receiving prenatal care before the third trimester of pregnancy.
88.1%
(n= 644)
11.9%
(n=87)
Data notavailablePrenatal CareReceived
* Total = 87 of the mothers who entered the program prenatally (total=731) and answered a Perinatal Questionnaire item which asks when prenatal care began. Programs began us-ing the Perinatal Questionnaire during FY13.
While only 14 mothers enrolled prenatally reported substance use dur-ing pregnancy, it is significant that 79% (11) of them dis-continued use be-fore giving birth, 64% of them before the third trimester.
*Total = 114 of the mothers who entered the program prenatally (n=731) were screened using the Perinatal Questionnaire, which asks when prenatal care began. Of the 114, 31 were screened but did not answer the substance abuse item.
100%
67%
98%
59%50%
55%
60%
65%
70%
75%
80%
85%
90%
95%
100%
Prenatal Care Accessed Early (1st Trimester)
Start of Care
CYFD HomeVisiting(total = 87)
WomenStatewide(averagetotal=16,565)
Pregnant women in home visiting who reported accessing prenatal care accessed it more often and earlier than women statewide. (New Mexico Birth Certificates Database, Department of Health)
12.3%(n=14)
60.5%(n=69)
27.2%(n=31)
Use Reported
No UseReported
No Response

19
19
Home Visiting Annual Outcomes Report for FY13
Maternal Health Outcome Data
In FY13, 536 eligible* mothers were screened for postpartum depression using the Edinburgh Post-
natal Depression Scale. Of the 158 (29.5%) who were identified as having symptoms of postpartum
depression (“at risk”), 119 (75.3%) were referred for services, where available. Sixty-seven of these
women (56.3%) are recorded as having engaged referral supports.
Percentage of Postpartum Mothers Screened for Depression and Connected to
Available Services
Infant and Child Health Outcome Data
Respondents to the Perinatal Questionnaire and the Maternal Child Health Form provided data on the following measures:
% of Mothers who Report* Initiating Breastfeeding
Data Development Recommendation
We recommend that CYFD add a reporting protocol to measure this indicator required by the Home Visiting Accountability Act: The percentage of babies and children receiving the well-child visits recommended
for their age by the American Academy of Pediatrics
Childhood
Immunizations
Of parents who
responded to a
home visiting Ma-
ternal Health Form
question in FY13
(n=255), 93%
reported that their
children have had
all recommended
shots.
Statewide, 88% of
2-3 year-old chil-
dren in 2011-12 had
received the rec-
ommended vaccine
series by their 2nd
birthday.
(NM Immunization
Program, NM De-
partment of Health)
Total = 374 mothers who were
screened using the Perinatal
Questionnaire, which asks
whether mother has begun
breastfeeding.
72%
15%
13%
Yes
No
Not Reported
% of Children Screened* who were Immunized on Schedule, by Parent Report
*Total = 114 mothers who entered the program prena-
tally (total=731) and were screened using the Perinatal
Questionnaire, which asks whether breastfeeding was
initiated
*Total = 289 children whose caregivers were screened with
relevant portions of the Maternal Child Health Form. 255
answered the question, “Has your child had all recommend-
ed shots?”
82%
(n=237)
6.2%
(n=18)
11.8%(n=34)
Immunizations Upto Date
Immunizations NotUp to Date
No Response
536
158(29.5% of screened)
119(75.3% of "At
Risk")67
(56.3% of referred)
0
100
200
300
400
500
600
All Screened Scored on Screenas "At Risk"
Referred forServices
Mother Engagedwith Services
*Eligible were those caregivers enrolled with a child six months old or younger during FY13

20 20
20
Home Visiting Annual Outcomes Report for FY13
Goal 2: Children are Nurtured SB365 Outcome 2: Promote positive parenting practices
SB365 Outcome 3: Build healthy parent and child relationships
Background: What the Research Says
The first few months and years of a child’s life are critical for cognitive, social, and emo-tional development, which build the foundation for future success and well-being. Nur-turing, responsive relationships between a child and a small group of consistent caregiv-ers foster attachments, support brain development, and promote social and emotional development. But when parents lack the skills or resources to meet their babies’ needs, the resulting damage can be severe and long lasting. Research indicates many of our cost-liest social problems such as poor infant and maternal health, child abuse and neglect, school failure, and crime are rooted in this early period (Pew Center on the States, 2011; Heckman and Masterov, 2007). Research tells us that mothers who receive home visits are more sensitive and supportive in interactions with their children. According to several studies, they report less stress than mothers who did not receive home visits (Howard and Brooks-Gunn, 2009).
How Home Visiting Addresses this Goal
New Mexico home visitors are trained to use various strategies to support positive inter-actions between caregivers and their infants through play, by fostering regular feeding routines, and by educating caregivers about how to read their infants’ cues and respond appropriately. New Mexico home visiting programs use the Parenting Interactions with Children: Checklist of Observations Linked to Outcomes (PICCOLO) observational tool to measure healthy parenting practices and relationships. Based on the results, home visi-tors help families implement strategies to foster nurturing relationships between young children and their caregivers. Home visitors are also trained to recognize signs that a young child’s social and emotional development are at risk or that a parent suffers from depression. When these risks are identified, home visitors connect families with the ap-propriate community services.
Outcome Measurement The primary indicator used here to measure healthy parenting practices is: Caregiver progress in practicing positive parent-child interactions, as measured by the
PICCOLO observational tool
Outcome Data
In FY13, home visitors completed initial PICCOLO screens with 163 families. The PICCOLO tool was piloted for use in the CYFD Home Visiting System in FY13, with all programs completing professional development training by the end of the fiscal year. In this pilot year, at least one entire screen was completed by each CYFD-funded program. The PICCOLO is fundamentally a screen for progress over time, and is not intended for use as a one-time snapshot. As of the end of FY13, only a handful of programs had com-pleted a second screen, which would serve to measure progress. Therefore, data on fami-ly progress in nurturing parenting interactions will first be available in FY14, as home visi-tors continue implementation of follow-up PICCOLO screens.
New in FY13:
Screening with the
PICCOLO tool
In FY13, CYFD-funded home visiting programs became trained in use of the PICCOLO (Parenting Interactions with Chil-dren: Checklist of Obser-vations Linked to Out-comes) research-based observational tool. PICCOLO is a check-list of observable, developmentally supportive parenting behaviors with children ages 10-47 months, in four domains of parenting behavior: Affection Responsiveness Encouragement Teaching CYFD has worked with PICCOLO authors to develop guidance for using PICCOLO with infants as young as 4 months. This tool helps home visitors to both show and measure what parents can do to support their child’s development.
“Nurturing begets nurturing. A caring, professional-parent/family relationship supports a caring, nurturing parent-child relationship.” (Bernstein, 2003)

21
21
Home Visiting Annual Outcomes Report for FY13
Goal 3: Children are Physically and Mentally Healthy SB365 Outcome 1: Improve prenatal, maternal, infant or child health out-comes, including reducing preterm births SB365 Outcome 5: Support children’s cognitive and physical development
Background: What the Research Says
Early childhood development is influenced by a host of individual, family, and system-ic factors. Programs that focus on early childhood development and provide family support promote the well-being of young children, and lead to improved physical and mental health outcomes for parents and children. The scientific literature provides numerous examples of the effectiveness of such programs in identifying developmen-tal delays and providing intervention. These efforts lead to a significant reduction in grade retention and reduced placement in special education (Anderson et al., 2003). The American Academy of Pediatrics recommends that all children be screened for developmental delays and disabilities with a standardized tool at regular intervals, to ensure the early detection of developmental concerns. The prevalence of develop-mental delays in infants and toddlers is estimated nationwide at about 13%, with chil-dren from low-income families more likely to have delays than children from families living above the poverty level. Early detection of developmental concerns will result in appropriate referrals and implementation of early intervention services as needed (American Academy of Pediatrics, 2008).
How Home Visiting Addresses this Goal
During visits, home visitors are trained to discuss issues such as nutritional needs of the baby and mother, well/sick child care, and behavioral health needs. They are in-structed to educate the family in monitoring the child’s growth, and to discuss the child’s feeding experiences and any concerns. Home visitors are also trained to note concerns regarding the child’s growth and health and to subsequently provide appro-priate referrals to providers. To track the overall development of the child, home visi-tors use the Ages & Stages Questionnaire, Third Edition (ASQ-3) and the Ages & Stag-es Questionnaire-Social-Emotional (ASQ-SE).
Outcome Measurement The data used to measure the impact of home visiting services on children’s physical and mental health examine: Percentage of children screened on schedule for potential delay in development
with the ASQ-3 or ASQ-SE screening tool Percentage of children screened as at risk of delay who are referred successfully
to available services
Ages & Stages
Questionnaire-3
The ASQ-3 is an assessment tool that helps parents provide infor-mation about the developmental status of their infant or young child across five developmental areas:
Communication
Gross Motor
Fine Motor
Problem Solving
Personal-Social
The assessment tool comes in ver-sions to measure development at 21 different ages, from 2 months to 5 years old. Completing the questionnaire takes about 15 minutes, and involves parents observing the behavior of their children.
When a child’s ASQ-3 score is below the cut-off and indicates that further assessment is necessary, an appropriate refer-ral and linkages are made to the New Mexico Family-Infant Toddler (FIT) early inter-vention program.

22 22
22
Home Visiting Annual Outcomes Report for FY13
Outcome Data In FY13, 927 children were old enough to receive the first ASQ-3 screen (4 months) required by the CYFD Home Visiting System, and had been in home visiting for long enough to receive a screen (at least five home visits). Children already receiving early intervention services were not expected to receive the screen, which has a preventive intent. Of these 927 children, 792 (85%) received at least one ASQ-3 screen. Sixteen percent, or 127, were identified by the screen as having characteristics of a delay in develop-ment (“at risk”). Depending on the degree and nature of the possible delay identified, home visitors may either refer families directly to early intervention/FIT services or supply parents with developmentally appropriate activities and rescreen at the next age interval. In FY13, 60% of the 127 “at risk” scores in FY13 resulted in referral of 76 children to early intervention/FIT services. Of these 76 children, 52 (68%) are record-ed as having engaged with services.
Percentage of Eligible Children* (n=927) Screened On Schedule for Potential Delay in Development with the ASQ-3, and Percentage Connected to Early Intervention Services
For Comparison:
Statewide, 38% of children under age 6 were reported to have received a developmental screening in 2011-12 during a health care visit. (National Survey of Children’s Health)
23% of children in New Mexico aged 4 months-5 years were determined to be at moderate to high risk of de-velopmental prob-lems, based on par-ents’ concerns, in 2011-12. (National Survey of Children’s Health) 22% of children in New Mexico aged 2-5 were reported to demonstrate a developmental delay in 2009-10. (National Survey of Children with Special Health Care Needs)
927 792(85% of
Eligible)
127(16% of
Screened)
76(60% of At
Risk)
52(68% of
Referred)
-
200
400
600
800
1,000
Eligible* # Screened # At-Risk Referred Engaged
*Total of 927 eligible children represents the children who were at least 4 months old as of May 1, 2013, who also had received at least 5 home visits, and who were not already enrolled in early intervention services.
23
23
Home Visiting Annual Outcomes Report for FY13
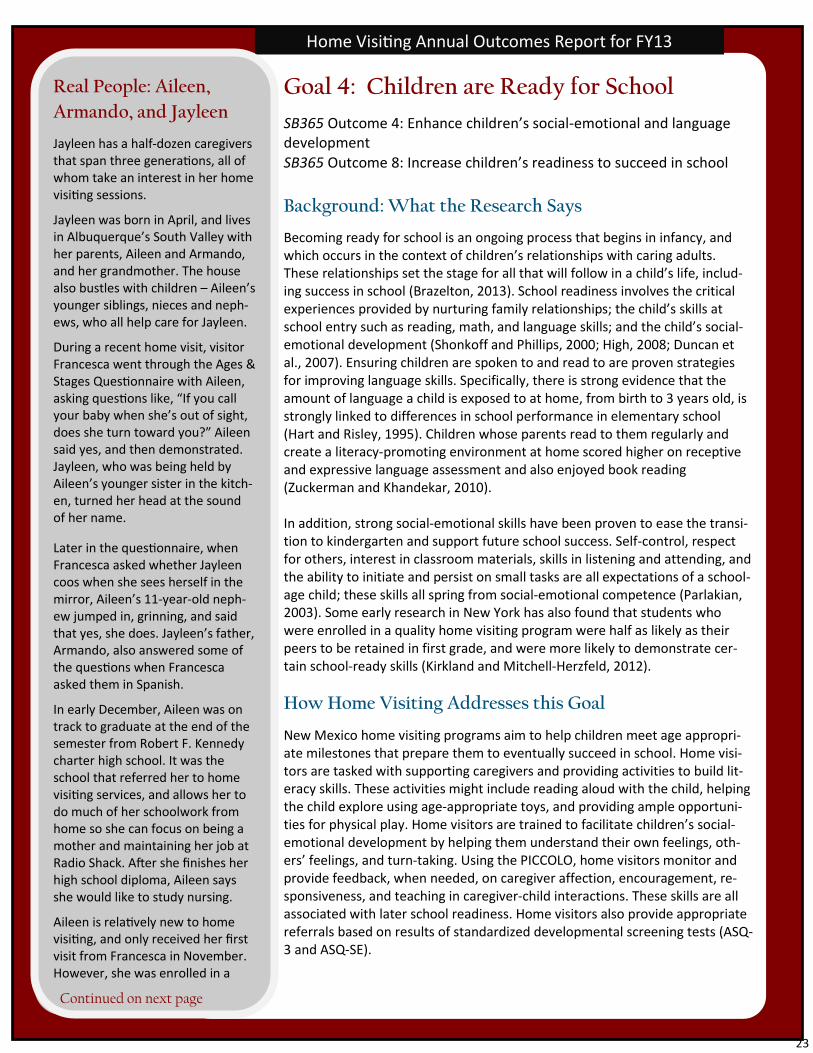
Goal 4: Children are Ready for School
SB365 Outcome 4: Enhance children’s social-emotional and language development SB365 Outcome 8: Increase children’s readiness to succeed in school
Background: What the Research Says
Becoming ready for school is an ongoing process that begins in infancy, and which occurs in the context of children’s relationships with caring adults. These relationships set the stage for all that will follow in a child’s life, includ-ing success in school (Brazelton, 2013). School readiness involves the critical experiences provided by nurturing family relationships; the child’s skills at school entry such as reading, math, and language skills; and the child’s social-emotional development (Shonkoff and Phillips, 2000; High, 2008; Duncan et al., 2007). Ensuring children are spoken to and read to are proven strategies for improving language skills. Specifically, there is strong evidence that the amount of language a child is exposed to at home, from birth to 3 years old, is strongly linked to differences in school performance in elementary school (Hart and Risley, 1995). Children whose parents read to them regularly and create a literacy-promoting environment at home scored higher on receptive and expressive language assessment and also enjoyed book reading (Zuckerman and Khandekar, 2010). In addition, strong social-emotional skills have been proven to ease the transi-tion to kindergarten and support future school success. Self-control, respect for others, interest in classroom materials, skills in listening and attending, and the ability to initiate and persist on small tasks are all expectations of a school-age child; these skills all spring from social-emotional competence (Parlakian, 2003). Some early research in New York has also found that students who were enrolled in a quality home visiting program were half as likely as their peers to be retained in first grade, and were more likely to demonstrate cer-tain school-ready skills (Kirkland and Mitchell-Herzfeld, 2012).
How Home Visiting Addresses this Goal
New Mexico home visiting programs aim to help children meet age appropri-ate milestones that prepare them to eventually succeed in school. Home visi-tors are tasked with supporting caregivers and providing activities to build lit-eracy skills. These activities might include reading aloud with the child, helping the child explore using age-appropriate toys, and providing ample opportuni-ties for physical play. Home visitors are trained to facilitate children’s social-emotional development by helping them understand their own feelings, oth-ers’ feelings, and turn-taking. Using the PICCOLO, home visitors monitor and provide feedback, when needed, on caregiver affection, encouragement, re-sponsiveness, and teaching in caregiver-child interactions. These skills are all associated with later school readiness. Home visitors also provide appropriate referrals based on results of standardized developmental screening tests (ASQ-3 and ASQ-SE).
Real People: Aileen,
Armando, and Jayleen
Jayleen has a half-dozen caregivers that span three generations, all of whom take an interest in her home visiting sessions.
Jayleen was born in April, and lives in Albuquerque’s South Valley with her parents, Aileen and Armando, and her grandmother. The house also bustles with children – Aileen’s younger siblings, nieces and neph-ews, who all help care for Jayleen.
During a recent home visit, visitor Francesca went through the Ages & Stages Questionnaire with Aileen, asking questions like, “If you call your baby when she’s out of sight, does she turn toward you?” Aileen said yes, and then demonstrated. Jayleen, who was being held by Aileen’s younger sister in the kitch-en, turned her head at the sound of her name.
Later in the questionnaire, when Francesca asked whether Jayleen coos when she sees herself in the mirror, Aileen’s 11-year-old neph-ew jumped in, grinning, and said that yes, she does. Jayleen’s father, Armando, also answered some of the questions when Francesca asked them in Spanish.
In early December, Aileen was on track to graduate at the end of the semester from Robert F. Kennedy charter high school. It was the school that referred her to home visiting services, and allows her to do much of her schoolwork from home so she can focus on being a mother and maintaining her job at Radio Shack. After she finishes her high school diploma, Aileen says she would like to study nursing.
Aileen is relatively new to home visiting, and only received her first visit from Francesca in November. However, she was enrolled in a
Continued on next page

24 24
24
-3
Home Visiting Annual Outcomes Report for FY13
Outcome Measurement
The measures used here to examine the impact of home visiting services on infants and young children’s readiness for learning and school are: Percentage of children screened on schedule for potential delay in develop-
ment with the ASQ-3 or ASQ-SE screening tool Percentage of children screened at risk of delay who are referred success-
fully to available services Caregiver progress in practicing positive parent-child interactions, as meas-
ured by the PICCOLO observational tool
Outcome Data
See Goal 3 outcome data (p. 23) on ASQ-3 screening, which shows that 85% of eligible infants and young children received a screening for possible delay in development, and that 60% of those identified with possible characteristics of developmental delay were referred to early intervention services for further assessment. Parents’ progress in practicing the positive parent-child interac-tions that support infant and young child social-emotional development will be reported in FY14, when new PICCOLO follow-up screens have been adminis-tered (see Goal 2, p. 21).
In addition, the ASQ-Social/Emotional screen was administered to 630 (75%) of 843 eligible* children. Of these, 51 (8%), scored below cut-off. Such scores on the ASQ-SE help guide home visitors’ work with families in the preventive inter-actions designed to address children’s social and emotional difficulties.
Percentages of Eligible* Children (n=843) Screened and Identified as at Risk of Social-Emotional Delay on the ASQ-SE Screen
Data Development Recommendation
The Home Visiting Accountability Act requires that the Home Visiting System report on:
Any increases in school readiness, child development and literacy
We recommend that CYFD establish a system for tracking the percentage of children receiving home visiting services who enter kindergarten at or above grade level on state assessments. The Public Education Department and CYFD are currently developing plans for a statewide, validated kindergarten readiness assessment. We recommend CYFD begin plans for coordinated collection of as-sessment data for the children who have received home visiting services, as PED pilots the assessment in the 2014-15 school year.
CYFD may also consider adding a measure that would capture its successes in promoting family literacy. One national measure used is the number of days in a week that family members report reading to their infants and children. In 2011-12, 13% of children age 1-5 in New Mexico were read to less than 3 days a week by family members. (National Survey of Children’s Health)
Real People, (cont.)
different home visiting program during part of her pregnancy, be-fore she briefly moved to Texas and then returned. She said she hopes home visiting can help her be a more informed mother, equipped with information about nutrition, development, and how to give her daughter the best life possible. She gave an example about nutrition, and said her hus-band recently wanted to give Jayleen fresh milk. She told him not to, but she wasn’t sure if she was correct or what the reason might be. These are the kinds of things she wants to learn.
Aileen speaks in fluent English with Francesca, and alternately speaks in English and Spanish when she addresses Jayleen. She said it’s important to her that Jayleen become bilingual, and she hopes to eventually enroll her in a dual language school setting.
Francesca is also helping connect Aileen to community supports, including a service that links local donors to low-income families in need of holiday presents. At each visit she asks about Aileen’s appli-cation for Medicaid, which has been pending for several weeks, and gives her advice on how to move forward and who to call.
On a home visit in early Decem-ber, Francesca talked to Aileen about her goals, which are fo-cused on learning different par-enting techniques, and learning what Jayleen should be doing at different stages. Francesca asked what assets and strengths Aileen brings to these goals, and then asked what obstacles might get in the way of her achieving them.
After a pause, Aileen said, “I wouldn’t let anything get in the way. It’s her first and then it’s me.”
*Eligible children were at
least 6 months old by May
2013, had received at least
5 visits, and were not in early
intervention programs.
843630
(75% of Eligible)
51(8% of
Screened)
0
100
200
300
400
500
600
700
800
900
Eligible* # Screened # At-Risk

25
25
Home Visiting Annual Outcomes Report for FY13
Goal 5: Children and Families are Safe
SB365 Outcome 6: Improve the health of eligible families SB365 Outcome 7: Provide resources and supports that may help to reduce child maltreatment and injury
Background: What the Research Says
Young children who experience developmental trauma, such as exposure to domestic vio-lence, abuse, and neglect, are significantly impacted in their brain development. These children are at higher risk for nearly every psychiatric disorder, as well as for poor perfor-mance in school and in relationships with others (Perry, 2008). Research has shown that programs targeting parent-child relationships can help protect children from these harms and even help heal damage from harm that has already occurred (Ludy-Dobson & Perry, 2010). In a review of hundreds of studies of child maltreatment, several variables were identified as risk factors for child abuse and neglect. These factors include parents with high levels of anger, a hyper-reactive style of parenting, parents with symptoms of anxiety and de-pression, and families with high levels of conflict and low cohesion (Stith et al., 2009). Unintentional injuries account for a significant number of child fatalities annually in the United States, with an average of 33 child deaths each day from an injury-related event (Borse et al., 2008). In a review of multiple home visiting and center-based programs, Kendrick et al. (2008) found home-based parenting interventions significantly reduced such unintentional injuries to children. Factors like educating parents about home haz-ards, safety practices and equipment for young children, and the organization of the home environment were all related to the decrease in reported injuries.
How Home Visiting Addresses this Goal
During visits, home visitors are instructed to help families who may be at risk for family violence to develop safety plans. Home visitors discuss unintentional injury issues includ-ing potential poisoning, pet safety, and water safety. They also discuss child physical abuse prevention and child neglect prevention strategies with caregivers. If home visitors identify safety or abuse concerns, they are required to make a referral to Child Protective Services. Children potentially benefit in multiple ways; they benefit from the prevention strategies provided by home visiting, and they also benefit when safety risks are identified and appropriate referrals are made. Screenings for possible safety risk factors (using CYFD selected tools and measures) include home safety, developmental concerns in children, perinatal depression in mothers, domestic violence, and family social support.
Outcome Measurement The indicators used to measure home visiting’s impact on safety are the percentage of families: Identified as at risk of domestic violence on the Woman Abuse Screening Tool Identified as at risk of domestic violence who have a safety plan in place Identified as at risk of domestic violence who are referred to and receive support
services Engaged in discussion of unintentional injury prevention
Prevention of Adverse Childhood Experiences Adverse childhood ex-
periences (ACE) such
as abuse, neglect, wit-
nessing domestic vio-
lence or growing up in
a home with parental
discord, substance
abuse, mental illness or
crime have been found
to predict poor health
outcomes in adults.
These outcomes in-
clude increased risk for
substance abuse,
depression, suicide
attempt, smoking,
obesity, premature
mortality, and
revictimization.
Child Well-Being in New Mexico
New Mexico’s children
are ranked the lowest
in well-being of all the
50 states.
( Annie E. Casey Foundation;
KidsCount.org)

26 26
26
Home Visiting Annual Outcomes Report for FY13
Outcome Data Of the 1,911 active families with one or more home visits in FY13, 1,092 were screened for potential risk of do-mestic violence with the Woman Abuse Screening Tool (WAST). Not all caregivers are in a relationship, so it is difficult to determine how many more than the 1,092 screened might have benefited from screening. Of those screened, 98 (9%) scored as potentially at risk, and 26 (26.5%) of these caregivers were referred to available be-havioral health services. Thirteen (13.3%) of those referred are recorded as having engaged in services as a result of referral.
Percentage of Caregivers Screened (n=1,092) for Domestic Violence Risk and Connected to Services
Percentage of Families At Risk of Domestic Violence who Have a Safety Plan in Place
Of the 98 families scored as at risk on the WAST screen, 21 (21%) are recorded as having safety plan in place. Another 64 families (65%) report no safety plan in place, and 13 (13%) have no data reported.
Percentage of Families Engaged in Discussion of Injury Prevention
Of the 1,911 active families with 1 or more home visits in FY13, 1,172 had received at least 5 home visits. At this point in service, it is reasonable to expect that discussions of injury prevention have taken place. Of these 1,172 families, 940, or 80%, have a record of discussion of at least one injury preven-tion topic with a home visitor.
Data Development Recommendation The Home Visiting Accountability Act requires the Home Visiting System to report annually on: Decreases in child maltreatment or child abuse
In order to meet these reporting requirements, we recommend CYFD develop rigorous data collection and reporting protocols to ensure complete and accurate reporting of the number of reported and substantiated cases of maltreatment experienced by children after entry into the home visiting program.
We recommend that CYFD’s Child Protective Services (CPS) and Early Childhood Services establish a data sharing strategy. Such a strategy could allow Early Childhood Services to give CPS the names of the families and children in home visiting, and CPS to share numbers of reported and substantiated cases of maltreatment for those chil-dren. The data fed back to Early Childhood Services could be in aggregate form to protect confidentiality.
1,092
9% At Risk(n= 98)
26.5% of At Risk Referred
(n= 26)*
13.3% Referrals
Engaged(n= 13)*
-100
100
300
500
700
900
1,100
Screened forDomestic
Violence Risk
Scored onScreen as "At
Risk"
Referred forServices
Engaged inServices
Num
ber o
f Fam
ilies
80%
20% Injury Prevention
Discussed
No Record of InjuryPreventionDiscussion
79%
21% No SafetyPlan/MissingData
Safety Plan inPlace
*Referral data was miss-ing for 11.2% of clients screened as "at risk," and engagement data was missing for 11.2% of referrals made.

27
27
Home Visiting Annual Outcomes Report for FY13
Goal 6: Families are Connected to Formal and Informal Supports in Their Communities
SB365 Outcome 9: Improve coordination of referrals for, and the provi-sion of, other community resources and supports for eligible families
Background: What the Research Says
Connecting families to supports in their communities is important for fostering safe and healthy children. New Mexico’s communities offer numerous supports and services to help families thrive, but the families who need them most may not always be aware that these services exist or may not know how to access them.
Research shows that families value referrals as a useful part of home visiting (Paris and Dubus, 2005), and are more engaged with home visiting when visi-tors have the knowledge base to make appropriate referrals (Wagner et al., 2000).
Home visiting is an essential part of the state’s effort to ensure families are con-nected to the social support services they need or want. Multiple researchers have identified cohesive networks among home visiting programs and the ser-vices they refer families to as an important best practice in successful home visiting (eg Golden et al., 2011; Dodge and Goodman, 2012).
How Home Visiting Addresses this Goal
Home visiting programs funded by CYFD place a high priority on screening fami-lies for potential risks and identifying community resources and supports to bolster maternal and child outcomes. Keeping families connected to social sup-port services is part of CYFD’s goal-setting and planning process with each fami-ly, which is informed by screening tools and questionnaires to identify risks. Appropriate referrals, and follow-ups on those referrals within a month, should occur on a regular basis while each family is receiving home visiting services. Home visitors issue referrals to a variety of services and agencies, including pri-mary care providers, behavioral health service providers, early intervention programs, domestic violence services, and child protective services. Home visi-tors also use a screening tool called the Social Support Index to assess whether families are experiencing isolation, and use that information to connect families to community supports and services as needed.
Outcome Measurement The indicators used to measure home visiting’s effectiveness in connecting families to formal and informal community supports are the number of:
Families identified for referral to support services available in their community, by type
Families identified who receive referral to available community supports, by type
Families referred who are actively engaged in referral services, by type
Real People: Sara, Clemente, and Jendaya In the months after her daughter was born in November 2012, Sara found herself feeling isolated. She and her husband Clemente share one car, which he would take to work, leaving Sara and her daugh-ter unable to leave the house easi-ly, especially in those winter months. It was during this time that Sara began to suffer from post-partum depression, and signed up for home visiting services, which she heard about from a friend.
“That was a really tough time, and knowing that I’m going to have someone I like talking to come to my house every week was really helpful,” Sara said.
Now, Sara talks about her depres-sion in the past tense, and said her home visiting experience has evolved over the past year as her needs have changed. On a recent home visit, Sara talked with her home visitor, Chrissy, about begin-ning to impose discipline and set boundaries for her daughter, Jendaya.
Sara said Jendaya has bitten her a few times – not in an aggressive way, but as part of teething. She said she dealt with the biting by telling Jendaya not to bite and putting her down, creating a natu-ral consequence for the biting. Chrissy suggested she might follow that up by giving the baby some-thing appropriate to bite on.
Chrissy offered to start using a cur-riculum called “Circle of Security,” which deals with attachment and bonding, and places an emphasis on helping parents recognize issues from their own pasts and how those issues may affect their par-enting.
Continued on next page

28 28
28
Home Visiting Annual Outcomes Report for FY13
Outcome Data Many of home visitors’ activities with families are informed by the results of key screening tools. These screens are designed to be completed by a child’s caregiver, often with the home visitor. Screens serve to identify areas where home visitors can strengthen caregivers’ parenting skills and knowledge through curriculum and activi-ties, and to flag areas of possible concern that merit continued monitoring. Where concern continues or exceeds the scope of the preventive services that home vis-iting offers, the screens trigger referrals to available community support services.
Three key screens used by the Home Visiting System to identify areas of concern and to guide the continuum of home visitor activity, from curriculum emphasis to clinical referral, are:
The following shows the number of children or caregivers considered eligible to re-ceive either an ASQ-3, WAST, or EPDS screen; the number and percentage of clients eligible for screens who received them; the number screened who showed charac-teristics of concern or risk; and the number of clients receiving referrals who engage them. Areas flagged by screen scores can sometimes be addressed by home visitors, so not all subscale scores require immediate referral to intervention services. There are also communities with inadequate access to needed services, where referrals cannot be made.
Screenings and Referrals for Enrolled Families (total families = 1,911*)
Data Development Recommendation
We recommend CYFD develop data collection and reporting protocols to ensure reporting of the following measure, required by the Home Visiting Accountability Act:
Percentage of children receiving home visiting services who are enrolled in a high-quality, licensed child care program
Real People, (cont.)
She said much of the curriculum centers on helping parents rec-ognize their own blind spots and areas of discomfort, and helping them avoid passing those on to their children.
“It’s powerful, to help parents understand themselves,” Chrissy said. “Some parents are really great with their baby when the baby cries or needs something, or when the baby nurses, but when it want to crawl away and see another person and explore the world, they freak out be-cause their experience was the world wasn’t safe.”
She said Circle of Security can be helpful in such situations. “They can start to see, ‘That’s my blind spot, it’s actually safe for my kid to do that.’”
Sara said curricula and work-shops have been helpful to her throughout the home visiting process. She recently attended a workshop Chrissy recommended about sleep for parents and ba-bies, which included childcare for parents who attended, and information about the sleep needs and sleep patterns of chil-dren.
Sara said she thinks all mothers could benefit from home vis-iting. “It’s amazing that the sup-port is out there, because it’s incredibly important for moms to get that support, especially in the first year,” she said, adding, “I don’t know what the second year is going to be like.”
* See Appendix 2 for explanation of how eligibility was determined for ASQ-3, WAST, and EPDS screens and referrals.
927
1,911
911792
1,092
536
127 98158
7626
11952 13
67
0
500
1000
1500
2000
2500
ASQ (Child Clients) WAST (Caregivers) EPDS (Caregivers)
Total Eligible
Total Screened
Total At-Risk
Total Referred
Total FollowedUp

29
29
Home Visiting Annual Outcomes Report for FY13
CYFD Response and Next Steps
CYFD is proud of the accomplishments of the Home Visiting System reflected in this first re-port. CYFD recognizes and appreciates the work of many committed individuals and organi-zations that have developed, implemented, and continue to support programs and infra-structure to address the needs of New Mexico’s families. We especially appreciate the con-tracted home visiting agencies for their ongoing contributions to the system and the wisdom gained through their direct experience. Because the New Mexico Home Visiting System is in early stages of its development, we know that much more can be done to ensure that the growing system is strong and effective.
CYFD has identified Next Steps for program improvement in response to the findings of the report. They are organized into three interrelated categories: 1) Data and Accountability, 2) Program Improvement, and 3) Home Visiting Policy.
Data and Accountability:
CYFD will develop a plan for collection of the data required by the Home Visiting Ac-countability Act that is currently unavailable: 1) the percentage of children in home vis-iting receiving regular well-child exams as recommended by the American Academy of Pediatrics; 2) any increases in school readiness, child development, and literacy skills; 3) the number of children in home visiting enrolled in high-quality licensed child care pro-grams; and 4) decreases in child maltreatment or child abuse.
CYFD will continue to implement the monitoring system described in the Home Visiting Program Standards to help programs achieve superior data integrity. Training, technical assistance, and support to programs is adjusted according to data compliance needs. CYFD will continue to emphasize the importance of data for program management to improve services to children and families, and to have complete and accurate data for accountability purposes.
CYFD will review child and family demographic data, in order to have more extensive information about the families served. CYFD will continue to ensure that monitoring, training, technical assistance, and follow-up assist programs to avoid incomplete data. Annual completion of CYFD forms will continue to be emphasized, to enhance CYFD’s ability to compare data and assess children and families’ progress towards meeting pro-gram goals.
CYFD will expand the data collected on the CYFD-funded home visiting workforce, in or-der to better understand challenges and to have the information needed to recruit, train, support, and retain the best home visitors possible.
Data Sources Data for nearly all indicators are currently re-ported and col-lected in the state’s Home Visiting Data-base, main-tained and man-aged for CYFD by the Early Childhood Ser-vices Center at UNM Continu-ing Education.

30 30
30
Home Visiting Annual Outcomes Report for FY13
CYFD Next Steps (cont’d)
Program Improvement:
CYFD will continue to develop a workable definition of what constitutes successful completion of the home visiting process. This is being developed in accordance with the CYFD Home Vis-iting Program Standards, which require programs to define the frequency, intensity, and dura-tion of the home visits received by a family. This is based on the family’s needs, goals set with the home visiting program, and the family’s capacity to fully participate in the program. This definition will be reflected in the data, in order to better indicate why families leave the pro-gram, and to differentiate between families who left because they achieved their goals and those who left the program for other reasons.
Home Visiting Policy:
CYFD suggests that discussions continue on how funding for home visiting can be stable and predictable, rather than having to rely on an ever-changing mix of funding streams that have included such sources as one-time tobacco funds or one-time federal grants.
CYFD is in the process of conducting a study to better understand the full costs of developing
and sustaining home visiting programs in different communities across the state. This study will include analyses of direct service costs as well as infrastructure costs. The results are ex-pected to inform future procurements and contracts for home visiting.
CYFD recognizes that the Home Visiting Accountability Act encourages strategies for collabo-rating with non-CYFD home visiting programs, including private foundation-funded programs, in order to better map the entire home visiting landscape in the state. This information will be helpful in determining how many young children and families who need home visiting pro-grams are receiving these services from state-contracted providers and non-state providers.

31
31
Home Visiting Annual Outcomes Report for FY13
Conclusion
Over the past decade, New Mexico has committed itself to improving the lives of infants and young children. The state has increased funding, passed key legislation, implemented programs, developed infrastructure, and touched the lives of numerous young children and their families. Even more importantly, New Mexicans from all political persuasions, diverse communities, and geographic regions have forged a powerful alliance that focuses on the care and education of our youngest residents. New Mexico is nationally recognized as a leader in early childhood, and these efforts should be a point of pride for this state.
The data contained in this first Annual Outcomes Report clearly show the extensive implementa-tion of home visiting across New Mexico. There were 1,911 families who received at least one home visit in FY13. Those families were provided with a rich variety of services and supports. A significant number of families and children were screened for potential risks and then referred for additional services. Other families had the opportunity to talk with knowledgeable professionals and to feel they live in a state that cares about their well-being. The data in this report also show that home visiting programs, services, and supports can be strengthened, and it is hoped that the information presented in this report will be used constructively to do so.
It is equally clear, from the data in this report and other national and state reports, that New Mexico has a long way to go in terms of reaching all the young children and families who need programs like home visiting. In FY13, home visiting served 1,630 children. In 2012, New Mexico had an estimated 144,000 children under 5 years old. Clearly, not all of those children or their families would want to participate in home visiting. But we need to think wisely about how many of those children and their families would benefit, and then develop a plan to expand the home visiting system to reach these families.
The passage of New Mexico’s Home Visiting Accountability Act places our state firmly in the midst of the national discussion on how to support young children during their most critical develop-mental period, how to help families become self-sufficient, and how to build stronger communi-ties. The leading states (including New Mexico) are grappling with issues including: How to better protect children from adverse experiences, how to develop different models of home visiting that meet the needs of diverse communities, how to gather the data that lead to continuous improve-ment, how to finance home visiting, how to recruit and support the most effective staff, how to build collaborative relationships among all the stakeholders committed to the care and education of young children, and how to build realistic plans for expansion. These are daunting challenges for sure, but they are challenges worth facing. And surely, they are challenges we can meet.

32 32
32
Home Visiting Annual Outcomes Report for FY13
APPENDIX 1: New Mexico CYFD Home Visiting Program Logic Model, Part 1

33
33
Home Visiting Annual Outcomes Report for FY13
APPENDIX 1: New Mexico CYFD Home Visiting Program Logic Model, Part 2

34 34
34
Home Visiting Annual Outcomes Report for FY13
APPENDIX 2: Outcome Measures Defined
Measure Measurement Tool Operational Definition
Number and type of programs funded Children, Youth and Families Department
(CYFD) All home visiting programs both contracted and reporting data in FY13 (n=20)
Number of families funded (openings) CYFD As reported by CYFD (n=1,005)
Number of families served Home Visiting Database All families reported in data set for FY13 (n=2,306), regard-less of receipt of home visit
Number of active families Home Visiting Database All families receiving one or more home visits in FY13 (n=1,911)
Cost per family Calculated from CYFD data and Home
Visiting Database Total funding divided by number of funded openings
Demographics of families served Home Visiting Database Reported on caregivers and children in families with at least one home visit
Duration of participation by families Home Visiting Database Time between most recent enrollment and most recent service date
Home visitors/supervisors by level of educational training
Home Visiting Database Database entry
Percentage of mothers enrolled prena-tally who receive prenatal care
Perinatal Questionnaire; item asks "Did you receive prenatal care? If Y, when did
you start with prenatal care?”
Numerator: Number of below who reported receiving prenatal care
Denominator: Number of mothers enrolled prenatally during reporting period who answered relevant Perinatal Questionnaire item
Percentage of mothers enrolled prena-tally who discontinue reported sub-stance use by end of pregnancy
Perinatal Questionnaire; item asks "During pregnancy, did you drink any alcohol, smoke cigarettes, or use any recreational/illegal drugs? If you used
substances during pregnancy, when did you quit?
Numerator: Number of below who report discontinued substance use by end of pregnancy
Denominator: Number of mothers enrolled prenatally during reporting period who self-reported substance use on Perinatal Questionnaire
Percentage of postpartum mothers screened for postpartum depression
Edinburgh Postpartum Depression Scale
Numerator: Number of below screened for depressive symptoms using the EPDS during the reporting period
Denominator: Number of maternal caregivers enrolled with a child age 6 months or younger in reporting period
Percentage of postpartum mothers identified at risk for postpartum de-pression who are referred for services
Edinburgh Postpartum Depression Scale & Home Visiting Database Referral
Records
Numerator: Number of below referred for behavioral health services
Denominator: Number of maternal caregivers enrolled with a child age 6 months or younger in reporting period who were screened as at risk on the EPDS
Percentage of postpartum mothers identified at risk for postpartum de-pression who receive services
Edinburgh Postpartum Depression Scale & Home Visiting Database Referral
Records
Numerator: Number of below recorded as engaged in behavioral health services
Denominator: Number of maternal caregivers enrolled with a child age 6 months or younger in reporting period screened as at risk on EPDS who were referred for behav-ioral health services
Percentage of mothers who initiate breastfeeding
Perinatal Questionnaire; item asks, "Did you begin breastfeeding your baby?”
Numerator: Number of below who reported initiation of breastfeeding
Denominator: Number of mothers who had a delivery during the reporting period and answered "breastfeeding" question on the Perinatal Questionnaire
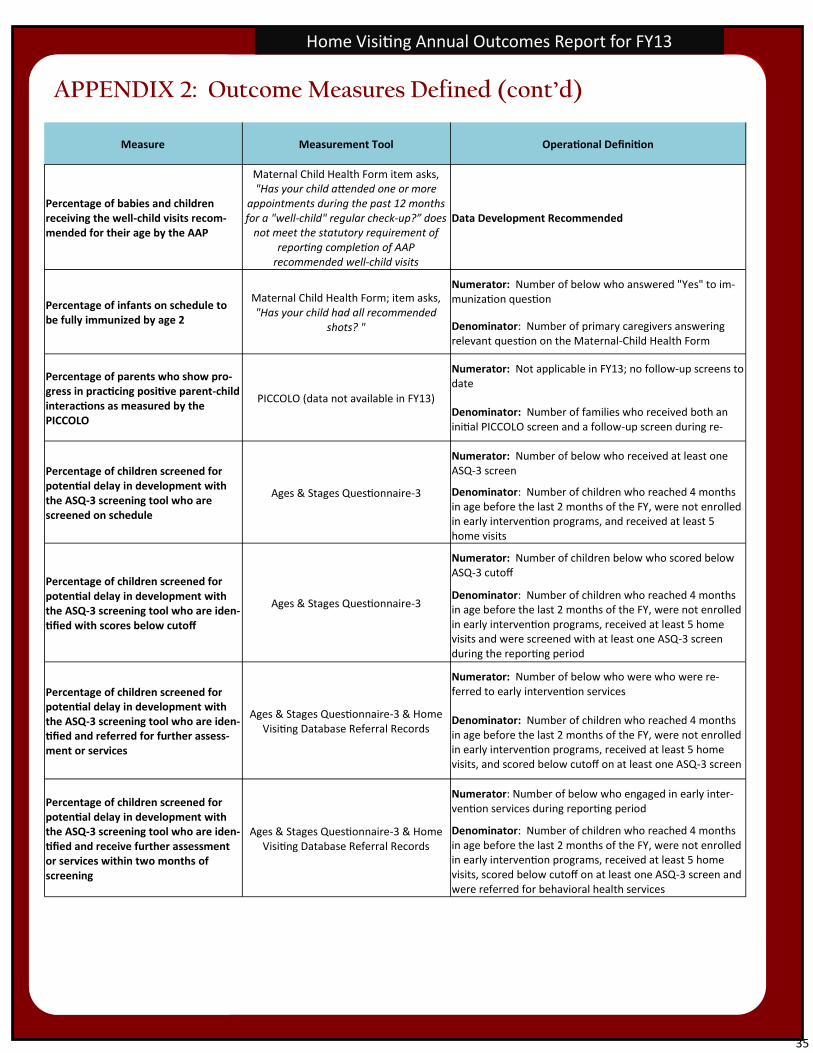
35
35
Home Visiting Annual Outcomes Report for FY13
APPENDIX 2: Outcome Measures Defined (cont’d)
Measure Measurement Tool Operational Definition
Percentage of babies and children receiving the well-child visits recom-mended for their age by the AAP
Maternal Child Health Form item asks, "Has your child attended one or more
appointments during the past 12 months for a "well-child" regular check-up?” does
not meet the statutory requirement of reporting completion of AAP
recommended well-child visits
Data Development Recommended
Percentage of infants on schedule to be fully immunized by age 2
Maternal Child Health Form; item asks, "Has your child had all recommended
shots? "
Numerator: Number of below who answered "Yes" to im-munization question
Denominator: Number of primary caregivers answering relevant question on the Maternal-Child Health Form
Percentage of parents who show pro-gress in practicing positive parent-child interactions as measured by the PICCOLO
PICCOLO (data not available in FY13)
Numerator: Not applicable in FY13; no follow-up screens to date
Denominator: Number of families who received both an initial PICCOLO screen and a follow-up screen during re-
Percentage of children screened for potential delay in development with the ASQ-3 screening tool who are screened on schedule
Ages & Stages Questionnaire-3
Numerator: Number of below who received at least one ASQ-3 screen
Denominator: Number of children who reached 4 months in age before the last 2 months of the FY, were not enrolled in early intervention programs, and received at least 5 home visits
Percentage of children screened for potential delay in development with the ASQ-3 screening tool who are iden-tified with scores below cutoff
Ages & Stages Questionnaire-3
Numerator: Number of children below who scored below ASQ-3 cutoff
Denominator: Number of children who reached 4 months in age before the last 2 months of the FY, were not enrolled in early intervention programs, received at least 5 home visits and were screened with at least one ASQ-3 screen during the reporting period
Percentage of children screened for potential delay in development with the ASQ-3 screening tool who are iden-tified and referred for further assess-ment or services
Ages & Stages Questionnaire-3 & Home Visiting Database Referral Records
Numerator: Number of below who were who were re-ferred to early intervention services
Denominator: Number of children who reached 4 months in age before the last 2 months of the FY, were not enrolled in early intervention programs, received at least 5 home visits, and scored below cutoff on at least one ASQ-3 screen
Percentage of children screened for potential delay in development with the ASQ-3 screening tool who are iden-tified and receive further assessment or services within two months of screening
Ages & Stages Questionnaire-3 & Home Visiting Database Referral Records
Numerator: Number of below who engaged in early inter-vention services during reporting period
Denominator: Number of children who reached 4 months in age before the last 2 months of the FY, were not enrolled in early intervention programs, received at least 5 home visits, scored below cutoff on at least one ASQ-3 screen and were referred for behavioral health services

36 36
36
Home Visiting Annual Outcomes Report for FY13
APPENDIX 2: Outcome Measures Defined (cont’d)
Measure Measurement Tool Operational Definition
Percentage of children entering kin-dergarten at or above grade level on state school readiness assessments
None available Data Development Recommended
Percentage of families identified at risk of domestic violence
Woman Abuse Screening Tool
Numerator: Of below, number identified at risk of domes-tic violence
Denominator: Number of families screened with WAST during reporting period
Percentage of families identified at risk of domestic violence who receive support services
Woman Abuse Screening Tool and Home Visiting Database Referral Records
Numerator: Of below, number who received behavioral health support services
Denominator: Number of families screened with WAST and identified as at risk during reporting period
Percentage of families at risk for do-mestic violence who have a safety plan in place
Woman Abuse Screening Tool and Home Visiting Database Referral Records
Numerator: Of below, number who had a safety plan completed in reporting period
Denominator: Number of families screened with WAST and identified as at risk during reporting period
Percentage of families engaged in discussion of injury prevention
Home Visiting Database Activity Records
Numerator: Of below, number of families who received information or training on injury prevention during re-porting period
Denominator: Number of families receiving more than 5 cumulative home visits
Number of substantiated cases of maltreatment suffered by children after entry into program
None Data Development Recommendation
Number of families identified for re-ferral to support services available in their community, by type
Home Visiting Database Activity Records See operational definition for ASQ-3, WAST, and EPDS screens and referrals, above
Number of families identified who receive referral to available communi-ty supports, by type
Home Visiting Database Activity Records See operational definition for ASQ-3, WAST, and EPDS screens and referrals, above
Number of families referred who are actively engaged in referral services, by type
Home Visiting Database Activity Records See operational definition for ASQ-3, WAST, and EPDS screens and referrals, above
Number of children receiving home visiting services who are enrolled in a high-quality licensed child care pro-gram
None Data Development Recommendation
37
37
Home Visiting Annual Outcomes Report for FY13
APPENDIX 3: References
American Academy of Pediatrics, Recommendations for Preventive Pediatric Health Care, 2008, http://brightfutures.aap.org/pdfs/
AAP_Bright_Futures_Periodicity_Sched_101107.pdf.
Anderson, L.M., Shinn, C., Fullilove, M.T., Scrimshaw, S.C., Fielding, J.E., Normand, J., & Carande-Kulis, V.G. (2003). The effectiveness of early childhood development programs: A systematic review. American Journal of Preventive Medicine, 24(3), pp. 32-46. Barlow, J., Hampshire, A., Stewart-Brown, S., & Polnay, L. (2008). Parenting interventions and the prevention of unintentional inju-ries in childhood: Systematic review and meta-analysis. Child: Care, Health, and Development, 34(5), pp. 682-695. Bernstein, V. (2003). Standing firm against the forces of risk: Supporting home visiting and early intervention workers through reflec-tive supervision. Newsletter of the Infant Mental Health Promotion Project (IMP), 35. Borse, N.N., Gilchrist, J., Dellinger, A.M., Rudd, R.A., Ballesteros, M.F., & Sleet, D.A. (2008). CDC childhood injury report: Patterns of unintentional injuries among 0-19 year olds in the United States, 2000-2006. Atlanta, GA: Centers for Disease Control and Preven-tion, National Center for Injury Prevention and Control. Brazelton, T. (2013). Foreword in Infant and Early Childhood Mental Health: Core Concepts and Clinical Practice, Eds. Kristie Brandt, Bruce Perry, Stephen Seligman, & Ed Tronick. American Psychiatric Publishing. Casey, Patrick, Goolsby, S., Berkowitz, C., Frank, D., Cook, J., Cutts, D., Black, M., Zaldivar, N., Levenson, S., Heeren, T., Meyers, A., & the Children’s Sentinel Nutritional Assessment Program Study Group. (2004). Maternal Depression, Changing Public Assistance, Food Security, and Child Health Status. Pediatrics, 113(2): 298-304. Center on the Developing Child. (2010). In Brief: Early Childhood Mental Health. Harvard University. Retrieved from http://developingchild.harvard.edu/resources/briefs/inbrief_series/inbrief_early_childhood_mental_health/ Cox, J.L., Holden, J.M, and Sagovsky, R. 1987. Detection of Postnatal Depression: Development of the 10-Item Edinburgh Postnatal Depression Scale. British Journal of Psychiatry 150: 782-786. Dodge, K. & Goodman, B. (2012). Durham Connects Impact Evaluation Final Report [to] Pew Center on the States. DuMont, K., Mitchell-Herzfeld, S., Greene, R., Lee, E., Lowenfels, A., Rodriguez, M., & Dorabawila, V. (2008). Healthy Families New York (HFNY) randomized trial: Effects on early child abuse and neglect. Child Abuse & Neglect, 32 (3), pp. 295-315. Duncan, G.J., Dowsett, C.J., Claessens, A., Magnuson, K., Huston, A.C., Klebanov, P., Pagani, L.S., Feinstein, L., Engel, M., Brooks-Gunn, J., Sexton, H., Duckworth, K., & Japel, C. (2007). School readiness and later achievement. Developmental Psychology, 43(6), pp. 1428-1446. Embry, L. & Dawson, G. (2002). Disruptions in parenting behavior related to maternal depression: Influences on children's behavior-al and psychobiological development. In Parenting and the child's world: Influences on academic, intellectual, and social-emotional development. Monographs in parenting. Borkowski, John G. (Ed) & Ramey, Sharon Landesman (Ed) & Bristol-Power, Marie (Ed). Mahwah, NJ: Lawrence Erlbaum Associates Publishers. Golden, O., Hawkins, A., & Beardslee, W. (2011). Home Visiting and Maternal Depression: Seizing the Opportunities to Help Mothers and Young Children. The Urban Institute. Hart, B., & Risley, T.R. (1995). Meaningful differences in the everyday experiences of young American children. Baltimore, MD: Paul H Brookes Publishing.

38 38
38
Home Visiting Annual Outcomes Report for FY13
APPENDIX 3: References (cont’d)
Heckman, J.J. & Masterov, D.V. (2007). The Productivity Argument for Investing in Young Children. Paper presented at the T.W. Schultz Award Lecture at the Allied Social Sciences Association Annual Meeting, Chicago: January 5-7. High, P (2008) School readiness, Pediatrics 2008;121;e1008, DOI: 10.1542/peds.2008-0079 Howard, K.S. & J. Brooks-Gunn. (2009). The Role of Home-Visiting Programs in Preventing Child Abuse and Neglect. The Future of Children, 19 (2): 119-146. Institute of Medicine. (2013). The childhood immunization schedule and safety. Report Brief, January. Washington DC: Institute of Medicine. Ip, S, Chung, M., Raman, G., Chew, P., Magula, N., DeVine, D., Trikalinos, T., Lau, J. (2007). Breastfeeding and Maternal and Infant Health Outcomes in Developed Countries. Evidence Report/Technology Assessment, 153: 1-186. Kendrick, D., Barlow, J., Hampshire, A., Stewart-Brown, S., & Polnay, L. (2008). Parenting interventions and the prevention of unin-tentional injuries in childhood: Systematic review and meta-analysis. Child: Care, Health, and Development, 34(5), pp. 682-695
Kirkland, K. & Mitchell-Herzfeld, S. (2012). Evaluating the Effectiveness of Home Visiting Services in Promoting Children’s Adjustment
in School. New York State Office of Children and Family Services, Bureau of Evaluation and Research.
Lee, E., Mitchell-Herzfeld, S., Lowenfels, A., Greene, R., Dorabawila, V., & DuMont, K. (2009). Reducing Low Birth Weight through Home Visitation: A Randomized Controlled Trial. American Journal of Preventive Medicine, 36 (2): 154-160. Ludy-Dobson, Christine R., & Perry, Bruce D. (2010). The role of healthy relational interactions in buffering the impact of child trau-ma. In: Working with children to heal interpersonal trauma: The power of play. Gil, Eliana (Ed.): pp. 26-43. New York, NY: Guilford Press. Olds, D. L., Kitzman, H., Hanks, C., Cole, R., Anson, E., Sidora-Arcoleo, K., Luckey, D.W., Henderson, C. R. Jr., Holmberg, J., Tutt, R.A., Stevenson, A.J., & Bondy, J. (2007). Effects of nurse home visiting on maternal and child functioning: Age-9 follow-up of a random-ized trial. Pediatrics, 120 (4), pp. 3832-3845.
Paris, R. & Dubus, N. (2005). Staying Connected While Nurturing an Infant: A Challenge of New Motherhood. Family Relations, 54, 72-83.
Parlakian, R. (2003). Before the ABC’s: Promoting school readiness in infants and toddlers. Washington, DC: ZERO TO THREE.
Perry, Bruce D. (2008). Child maltreatment: A neurodevelopmental perspective on the role of trauma and neglect in psychopatholo-gy. In Child and Adolescent Psychopathology. Beauchaine, Theodore P. (Ed.), & Hinshaw, Stephen P. (Ed.): pp. 93-128. Hoboken, NJ: John Wiley & Sons, Inc.
Pew Center on the States. (2011). States and the New Federal Home Visiting Initiative: An Assessment from the Starting Line. Re-trieved from http://www.pewcenteronthestates.org/uploadedFiles/assessment_from_the_starting_line.pdf.pewstates.org/uploadedFiles/PCS_Assets/2013/HOME_Summit_Brief.pdf
Sameroff, A.J., & Fiese, B.H. (2000). Transactional regulation: The developmental ecology of early intervention. In Handbook of Ear-ly Childhood Intervention: 2nd edition. Shonkoff, J.P. (Ed.) & Meisels, S.J. (Ed.). Cambridge University Press.
Shonkoff, J. P., & Phillips, D. A. (2000). From neurons to neighborhoods: The science of child development.
State of New Mexico Children, Youth and Families Department, Home Visiting Program Standards manual, revised October 2013. http://cyfd.org/docs/HV_Standards10.7.13.pdf.

39
39
Home Visiting Annual Outcomes Report for FY13
APPENDIX 3: References (cont’d)
Stith, S. M., Ting Liu, L., Davies, C., Boykin, E. L., Alder, M.C., Harris, J.M., Som, A., McPherson, M., & Dees, J.E.M.E.G. (2009). Risk factors in child maltreatment: A meta-analytic review of the literature. Aggression and Violent Behavior, 14(1), pp. 13-29.
Wagner, M., Spiker, D., Gerlach-Downie, S., & Hernandez, F. (2000). Parental engagement in home visiting programs – findings from the Parents as Teachers multisite evaluation. SRI International. Menlo Park, CA.
Zuckerman, B. & Khandekar, A. (2010). Reach Out and Read: Evidence based approach to promoting early child development. Cur-rent Opinion In Pediatrics, 22, pp. 1-6. 2. Committee on Children and Disabilities, American Academy of Pediatrics. Developmental surveillance and screening for infants and young children. Pediatrics 2001;108(1):192-195. 3, Pediatrics Vol. 121 No. 6 June 1, 2008 pp. e1503 -e1509 (doi: 10.1542/peds.2007-1680)

40 40
40
Copyright © 2022 FDOKUMEN