New methods for seed potato production - Epsilon Archive for ...
62
Faculty of Landscape Architecture, Horticulture and Crop Production Science New methods for seed potato production: an investigation into the production and farmer uptake of mini tubers in South Africa Alba Sáez Fernández Degree Project • 30 credits Agroecology - Master´s Programme Alnarp 2018
-
Upload
khangminh22 -
Category
Documents
-
view
0 -
download
0
Transcript of New methods for seed potato production - Epsilon Archive for ...

Faculty of Landscape Architecture, Horticulture and Crop Production Science
New methods for seed potato production: an
investigation into the production and farmer
uptake of mini tubers in South Africa
Alba Sáez Fernández
Degree Project • 30 credits
Agroecology - Master´s Programme
Alnarp 2018

1
New methods for seed potato production: an investigation into the
production and farmer uptake of mini tubers in South Africa
Alba Sáez Fernández
Supervisor: Laura Grenville-Briggs Didymus, SLU, Department of Plant Protection Biology
Co-supervisors: Kristina Blennow, SLU, Department of Landscape Architecture, Planning and
Management
Examiner: Erik Alexandersson, SLU, Department of Plant Protection Biology
Credits: 30 credits
Project level: A2E
Course title: Master’s Thesis in Agricultural Science/Agroecology
Course code: EX0829
Programme: Agroecology – Master’s Programme
Place of publication: Alnarp
Year of publication: 2018
Cover picture: Name of photographer
Online publication: http://stud.epsilon.slu.se
Keywords: mini-tubers, Chlorophyll fluorescence, Leaf Area Index, small-scale farming,
SLU, Swedish University of Agricultural Sciences Faculty of Landscape Architecture, Horticulture and Crop Production Science Department of Biosystems and Technology

2
Table of contents
Foreword ....................................................................................................................................... 4
Summary ....................................................................................................................................... 5
List of acronyms ............................................................................................................................ 7
Treatments applied to mini-tubers:............................................................................................... 7
List of figures and tables .............................................................................................................. 7
Introduction ................................................................................................................................ 10
The potato industry in South Africa ............................................................................................. 10
The ARC and the breeding programme ....................................................................................... 10
Potato Certification Service (PCS) ................................................................................................ 11
Mini-tuber production ................................................................................................................. 12
An Integrated Pest Management (IPM) approach ...................................................................... 12
o Biological control ................................................................................................................. 13
Small-scale farming ..................................................................................................................... 14
Motivations, aims and research questions .................................................................................. 15
Biological and social research: setting the boundaries ............................................................... 16
Literature review ......................................................................................................................... 17
Materials and methods .............................................................................................................. 18
Trials design................................................................................................................................. 18
o The facility: .......................................................................................................................... 18
o Fertirrigation: ...................................................................................................................... 18
o Cultivars: .............................................................................................................................. 19
o Maintenance: ...................................................................................................................... 20
o Treatments: ......................................................................................................................... 21
Tests ............................................................................................................................................ 22
o Leaf Area Index .................................................................................................................... 22
o Chlorophyll Fluorescence Analysis (CFA) ............................................................................. 23
o Statistical analysis ............................................................................................................... 25
o Microbial tests ..................................................................................................................... 25
Interviews to small-scale farmers ............................................................................................... 26
Results ......................................................................................................................................... 27
Leaf Area Index ........................................................................................................................ 27
Chlorophyll Fluorescence Analysis ........................................................................................... 28

3
Microbial tests ......................................................................................................................... 34
Questionnaires and interviews ................................................................................................ 36
o General information ............................................................................................................ 36
o Production challenges ......................................................................................................... 37
o Knowledge ........................................................................................................................... 41
o Potato seed production ....................................................................................................... 43
o Interests ............................................................................................................................... 44
Discussion ................................................................................................................................... 45
Discussion of results ................................................................................................................ 45
Discussion of the methodology ............................................................................................... 47
Social research ......................................................................................................................... 48
Communication of the findings to the Agricultural Research Council...................................... 51
Conclusions ................................................................................................................................. 51
Critical reflections ....................................................................................................................... 52
Acknowledgements .................................................................................................................... 52
References .................................................................................................................................. 53
Appendices ................................................................................................................................. 56
Appendix 1: List of pesticides applied on the plants at Moedersbond .................................... 56
Appendix 2: questionnaire template ....................................................................................... 57

4
Foreword
I did my bachelor’s in microbiology because I believed that microorganisms could be efficiently
used to solve environmental problems through bioremediation of contaminated media , and
enrolled in the Agroecology programme because I wanted to merge microbiology and
environmental sciences, though I had no knowledge whatsoever of agroecosystems. During
the past two years, I underwent an introspective phase in which I started to see myself not as
an individual that is isolated from the rest, but as a dynamic system that belongs in and affects
a bigger one, while being in turn affected by it. Simultaneously, agroecology taught me how
much interconnected systems are, how much they affect and rely on each other and how
difficult it is to draw a line between systems. I might not have acquired practical skills in
farming, yet I have acquired the tools to comprehend, through the application of systems
thinking, agricultural systems and how they are affected by socio-economic and environmental
externalities. Systemic problems need to be tackled with systemic approaches. It is true,
nonetheless, that the reductionist approach allows for a more detailed analysis of a
component of the system and that the more components included in the analysis, the lesser
we know about each one. I find it very challenging to know how much I should know about a
system, how many parts I should integrate and where I should set the boundaries, for the
information is unlimited and there will always be elements that will be left out of the analysis
even when they interact with the inner ones. Along the journey of this programme, I have
learned the importance of running sustainable agri-food businesses in a responsible way for
the sake of humanity, all other organisms and the environment, which all should coexist in
harmony, as they are irreplaceable pieces of the system in which food production takes place.
Agriculture is indispensable for the survival of humankind and is completely dependent on
natural resources. Thus, compromising food systems or the environment in which they are
embedded impairs inexorably the well-functioning of society. Having realised that, I made up
my mind regarding my purpose as agroecologist: to bring about change through the
improvement of agricultural systems. Through the completion of the Agroecology programme
I shoulder this purpose as my duty, for I firmly believe in the words of Albert Einstein when he
said “Those who have the privilege to know, have the duty to act”.
The major change that I experienced through undertaking the Agroecology Master Programme
was that I developed a sense of responsibility. Learning about systems thinking has influenced
the way I see the world. Identifying all the components of a system allows us to see the effects
that our actions have on each one of these components. Taking responsibility is about taking
into consideration such effects or consequences when making decisions, so that the minimum
damage is caused. During the programme and especially during my thesis research journey, I
have learned to apply the systems theory and take responsibility for my actions in order to find
the most sustainable way of living.

5
Summary
Potatoes are by far the most produced fresh vegetable crop in South Africa. Remarkably,
potato sales represent more than 30% of the turnover in the Fresh Produce Markets (FPM).
The potato industry in South Africa has experienced great improvements mainly due to the
development of a reliable and healthy seed industry, the introduction of potato production
under irrigation and of locally developed potato cultivars that are better-adapted to the South
African climate. The Agricultural Research Council (ARC), founded in 1990, played an important
role by introducing the potato breeding program. Furthermore, the foundation of the Potato
Certification Services in 1995 brought about a sound structure for the production of clean,
healthy and viable potato seeds, which are most commonly commercialised as mini-tubers or
potato seeds.
The use of suitable potato cultivars and certified seeds is pivotal from an IPM point of view, as
it reduces the need for agrochemicals and the incidence of diseases, therefore increasing the
profitability of the crop. However, the use of agrochemicals is the main strategy to combat
diseases in South African agricultural systems. Inputs-intensive, as opposed to knowledge-
intensive agriculture, is environmentally degrading and not always affordable. According to the
literature, the reuse of late-generation seeds from one year to the next one as a result of
money shortages by poverty-stricken smallholding farmers increases the occurrence of
diseases.
Certified mini-tubers, namely pathogen-free potato seeds that have been cultivated in
sterilised medium, are currently being produced, although not commercialised, at the potato
section of the department of Vegetables and Ornamental Plants of the ARC (ARC-VOP). Mini-
tubers allow for the multiplication of seed for several generations before tuber-borne diseases
reach dangerous levels that compromise food and economic security. The aim of the social
research is to find out, through a survey carried out in a small-scale farming community of the
Kwazulu-Natal province (KZN), whether the use of mini-tubers could improve the overall
sustainability of smallholding agriculture. To this end, questionnaires and semi-structures
interviews are conducted in a total of 30 farms and a descriptive analysis of the data is
performed. Flip Steyn, potato breeder and mini-tuber producer at the Council, is already
including IPM techniques such as germplasm management and sanitation, as he certifies the
mini-tubers and uses developed varieties. The biological research of this work focuses on the
improvement of such IPM strategy through the use of plant growth-promoting
microorganisms, namely plant growth-promoting rhizobacteria (PGPR) and fungi. Seventeen
different combinations of PGPR and fungi are inoculated into the substrate where potatoes are
cultivated in order to compare plant performance from three different potato cultivars.
Differences in plant growth rate and performance among treatments and varieties are
determined by measuring leaf area and chlorophyll fluorescence through non-destructive
methods. Post-harvest tests consisting of tuber size and yield measurements are also a part of
the methodology, although not carried out within the timeframe of this study, in order to
observe differences between treatments and varieties. The ultimate goal of this thesis
research is to communicate the findings to the ARC and the Provincial Department of
Agriculture of KZN (DARD-KZN) with the purpose of engaging them in future projects regarding
the use of mini-tubers to empower small-scale farmers. Results indicate that differences
between varieties are statistically significant, which suggests that cultivar plays a role in plant

6
performance. However, differences between treatments are not as obvious, and drawing
conclusions with the available data is difficult. Further research needs to be carried out. The
incidence of pests and diseases in small-scale farming, which reported to be the major of the
surveyed farmers’ challenge, can be overcome by introducing mini-tubers in their system, yet
this initiative need to be accompanied with a sound project including trainings on specific
topics. The low-cost methodology developed in this study has given satisfactory and reliable
results.

7
List of acronyms
AMF= Arbuscular Mycorrhizal Fungi
ARC= Agricultural Research Council
ARC-VOP= ARC- department of Vegetables and Ornamental plants
CFA= Chlorophyll Fluorescence Analysis
ChlF= Chlorophyll Fluorescence
KZN= Kwazulu-Natal
DARD-KZN= Department of Agriculture and Rural Development of KZN
LSD= Least Significant Difference
NA= Nutrient Agar
PDA= Potato Dextrose Agar
PGPR= Plant Growth-Promoting Rhizobacteria
PSA= Potatoes South Africa
Treatments applied to mini-tubers:
B= Bacillus subtilis (Extrasol)
C= control
P= Pseudomonas fluorescens (N04)
G= Trichoderma harzianum (Gliogrow)
M= AMF mixture consisting of Glomus mosseae, G. intraradices and G. etunicatum
(Mycorrhizae WS)
T= Trichoderma harzianum (Excalibur™)
BP= a combination of Bacillus subtilis (Extrasol) + Pseudomonas fluorescens (N04)
MB= a combination of AMF (Mycorrhizae WS) + Bacillus subtilis (Extrasol)
MBP= a combination of AMF (Mycorrhizae WS) + Bacillus subtilis (Extrasol) + Pseudomonas
fluorescens (N04)
MP= a combination of Bacillus subtilis (Extrasol) + Pseudomonas fluorescens (N04)
TB= a combination of Trichoderma harzianum (Excalibur™) + Bacillus subtilis (Extrasol)
TBP= a combination of Trichoderma harzianum (Excalibur™) + Bacillus subtilis (Extrasol) +
Pseudomonas fluorescens (N04)
TM= a combination of Trichoderma harzianum (Excalibur™) + AMF (Mycorrhizae WS)
TMB= a combination of Trichoderma harzianum (Excalibur™) + AMF (Mycorrhizae WS) +
Bacillus subtilis (Extrasol)
TMBP= a combination of all microorganisms except for Trichoderma harzianum (Gliogrow)
TMP= a combination of Trichoderma harzianum (Excalibur™) + AMF (Mycorrhizae WS) +
Pseudomonas fluorescens (N04)
TP= a combination of Trichoderma harzianum (Excalibur™) + Pseudomonas fluorescens (N04)
List of figures and tables Figure 1: Potato crop size and hectares planted over time.
Figure 2: table design at Moedersbond.
Figure 3: crate with installed drip irrigation system.
Figure 4: diagram of the device developed for the performance of the measurements for leaf
area estimations.
Figure 5: methodology for the measurements of leaf area in three steps.

8
Figure 6: Leaf area development for the three varieties MC24, MC126 and MC2 over time (at
20, 25, 32, 42 and 50 DAP) as determined from RBG values with Easy Leaf Area.
Figure 7: exponential curve representing increase of percentage of canopy cover over time
(from 0 to 50 DAP) for the treatment TMP.
Figure 8: interaction between variety and day (left) and between treatments (right) for PI total.
Figure 9: interaction between variety and day (A) and between variety and treatment (B) for PI
abs.
Figure 10: interaction between variety and day (A) and between variety and treatment (B) for
𝜹𝑹𝒐𝟏 − 𝜹𝑹𝒐.
Figure 11: interaction between variety and day (left) and between treatments (right)
for𝜸𝑹𝑪𝟏 − 𝜸𝑹𝑪.
Figure 12: interaction between variety and day (left) and between treatments (right) for
𝝋𝑷𝒐𝟏 − 𝝋𝑷𝒐.
Figure 13: interaction between variety and day (A) and between variety and treatment (B) for
𝝍𝒐𝟏 − 𝝍𝒐.
Figure 14: presumable Trichoderma harzianum on a PDA plate isolated from the -1 dilution
PDA plate corresponding to the plant treated with ‘TMBP’.
Figure 15: direct plating of root pieces from plants treated with ‘B’ (left) or with ‘TMBP’ (right)
on NA plates. Plates were incubated for 48h.
Figure 16: spread plating in PDA (A) and NA (B) plates of endophytes recovered from the roots
of Mondial plants treated with ‘T’, ‘B, ‘P’ and ‘M’ (left) and with only ‘B’ (right) after 48 hours
of incubation.
Figure 17: spread plating of ectorhizosphere microorganisms (left) and endophytes (right) from
‘B’-treated plant roots in NA plates incubated for 48 hours.
Figure 18: frequency of respondents growing each crop.
Figure 19: frequency distribution of data dealing with income information gathered from the
interviews and questionnaires conducted to 30 small-scale farmers of KZN, South Africa.
Figure 20: frequency distribution of data dealing with production challenges (left) and pests
and diseases (right) gathered from the interviews and questionnaires conducted to 30 small-
scale farmers of KZN, South Africa.
Figure 21: frequency distribution of data dealing with irrigation systems gathered from the
interviews and questionnaires conducted to 30 small-scale farmers of KZN, South Africa.
Figure 22: frequency distribution of data dealing with transport challenges (left) and trading
information (right) gathered from the interviews and questionnaires conducted to 30 small-
scale farmers of KZN, South Africa.
Figure 23: frequency distribution of data dealing with market challenges (left) and price
negotiation (right) gathered from the interviews and questionnaires conducted to 30 small-
scale farmers of KZN, South Africa.
Figure 24: frequency distribution of data dealing with farm expenses per season gathered from
the interviews and questionnaires conducted to 30 small-scale farmers of KZN, South Africa.
Figure 25: frequency distribution of data dealing with years of experience in farming (left) and
access to information (right) gathered from the interviews and questionnaires conducted to 30
small-scale farmers of KZN, South Africa.
Figure 26: frequency distribution of cultivar used, gathered from the interviews and
questionnaires conducted to 30 small-scale farmers of KZN, South Africa.
Figure 27: frequency distribution of data dealing with seeds (left) and allocation of excess
harvest (right), gathered from the interviews and questionnaires conducted to 30 small-scale
farmers of KZN, South Africa.

9
Figure 28: frequency distribution of the price the respondents pay for each bag of potato seeds
(n=26).
Figure 29: frequency distribution of data dealing with goals (left) and purpose (right) of the
respondents in agriculture.
Table 1: layout of the tables at Moedersbond, indicating variety planted on each table, date of
planting, number of crates per table and number of plants per pot.
Table 2: name and description of each treatment used in this study.

10
Introduction
The potato industry in South Africa
According to the World Bank collection of development indicators, agricultural land in South
Africa comprises 79.83% of land area, 12% of which can be used for crop production with great
limitations on availability of water and of high-potential arable land (World Bank, 2014;
Theron, 2003). Potato constitutes the biggest vegetable crop within the country and the
second largest field crop grown in South Africa (Agricultural Research Council [ARC], 2014) and
in 2015, 53.933 ha were planted, out of 12.5 million ha of total arable land (Potatoes South
Africa [PSA], 2016). Interestingly, the crop size has increased over the past decade while the
number of hectares has more or less remained stable (see Figure 1), which can be attributed to
the use of high-yielding varieties, improved quality seed, increased production under irrigation
and better management of resources (PSA, 2016; Theron, 2003).
Figure 1: Potato crop size and hectares planted over time. Source: Potato South Africa, 2015.
The ARC and the breeding programme
The ARC is the principal agricultural research institution in South Africa. Established in 1990, it
conducts research with partners in forestry and agriculture, develops human capital and
fosters innovation by ensuring that the outcomes of the research are applied in the industry
and shared with society. It gives special emphasis to rural and poor communities through
communicating knowledge and helping them participate in the country’s economy (ARC, 2014;
South African Agency for Science and Technology [SAAST], National Research Foundation [NRF]
& ARC, n.d.).
Plant breeding involves the artificial selection of varieties, an evolutionary process quickened
by human intervention. The mission of the potato breeding program at the ARC is to produce
and commercialise varieties that are suitable and well-adapted to local conditions in Africa
(ARC, 2014). The programme starts with the acquisition of selected varieties from all over the
world in the form of in vitro plant material or mini-tubers from approved institutions that can
certify that there is no risk of importing tuber-borne diseases. The importation of conventional
potato seeds into the country is otherwise not allowed (Theron, 2003). Most of the breeding
varieties developed globally are meant to be used in the traditional potato producing

11
countries, where the climatic conditions are more favourable compared to those in countries
of Southern Africa: high temperatures, low humidity and erratic rainfall. Besides being adapted
to temperate climates, traditional varieties are resistant to the diseases that occur in such
countries, but they are generally susceptible to the ones occurring in warmer climates (ARC,
2014). Potato production in South Africa was seasonal and very limited to specific areas of the
Mpumalanga and Free State provinces until the breeding programme introduced locally
developed varieties, which led to the potato crop to spread out to other regions in the Free
State, Limpopo, the Western Cape and Kwazulu-Natal (ibid).
Potato Certification Service (PCS)
Before the Second World War, the potato industry in South Africa relied completely on the
importation of potato seeds, which were multiplied locally at the expenses of quality and
safety, as the presence of pests and pathogens was not tested. The onset of a healthy seed
potato industry was in the early 1970’s with the establishment of a potato seed farm in
Lydenburg. Testing laboratories in the seed production regions and in vitro multiplication and
production of mini-tubers arose during the 1980s and were the base of clean potato seed
production. The increasing establishment of potato seed businesses hugely improved potato
farming and made the country independent of imports and the risks associated with them
(Nortjé, 2003). In 1995, seed growers’ requests led to the foundation of Potato Certification
Service, an article 21 company, namely a non-profit company, that provided certification
services. During the same year and after many drastic changes and amendments were
procured, a seed programme and certification scheme were introduced (ibid), which set
stringent requirements regarding seed production facilities, field inspection and seed testing.
Certified seed potatoes in South Africa are labelled from generation 0 (G0) to G8 according to
the number of times the propagative material has been multiplied and to the insect and
pathogenic infestation levels of the sample, which cease to be 0% after G1 and increase as
generations go by. G1-G8 Tubers are sampled and tested for six different virus diseases and
bacterial wilt, and an additional bacterial test is carried out when G0 plant material is to be
certified. If seed potatoes of a particular generation exceed the permissible levels of
infestation, the material is downgraded to the generation that allows such levels. G0 plant
material corresponds to mini-tubers that originate from in vitro plant material grown in
accredited greenhouses or screenhouses, whereas certified seed potatoes ranging from G1 to
G8 have undergone subsequent field multiplication and are therefore exposed to pests and
diseases. Cultivar authenticity and incidence of diseases are visually examined during field
inspections, followed by tuber inspection after harvesting (ibid). Laboratory tests must be
conducted in laboratories registered with the Department of Agriculture, Forestry and
Fisheries (DAFF) and approved by the Independent Certification Council for Seed Potatoes
(ICCSP) (PCS, n.d.).
The South African Seed Potato Certification Scheme is applied by seed growers in conjunction
with the protocol emanated by the same institution, which describes actions, procedures and
processes in more detail than the guidelines provided by the Scheme and is only available to
registered seed potato growers. This protocol gives provision for the registration of plantings,
conduction of field inspections, sampling, tuber inspection, certification and inspection
reports. A plethora of requirements need to be met for a seed grower to be registered with

12
the PCS. These requirements appear in the Plant Improvement Act 1976 (Act No. 53 of 1976),
under which the Scheme is promulgated. Complying with the scheme entails time and money
investment, as the grower needs to pay registration fees of plantings per hectare, provide bags
and available labourers for the sampling and sacrifice a portion of the harvest to get the
certification of seeds. Besides, the seed grower bears the expense of the certification service in
itself.
Mini-tuber production
Potato mini-tubers are potato nuclear seeds that have been cultivated in vivo and that are
originated from vegetative in vitro propagating plant material. Thus, certified mini-tubers are
disease-free because they are cultivated in artificial soil and therefore have not been in
contact with soil-borne pathogens. They will be issued the G0 label provided that no diseases,
insect damage or non-pathogenic deviations are found. In contrast, G1-G8 potato seeds,
which have been cultivated in the field, are the most demanded type of potato seed in the
potato seed market. In 2015, 78% of the overall potato production came from G1-G4 potato
seeds (Coleman, 2015).
Flip Steyn, potato breeder and PhD student at the ARC, produces mini-tubers with research
purposes and gives away the limited amounts obtained according to demand. Flip’s vision with
mini-tuber production is to assist small-scale farmers with their businesses and develop
smallholder agriculture. Potato seeds represent the highest input cost in agricultural systems,
and many farmers obtain their seeds from the harvest of the previous year (Coleman 2015).
Vegetative tuber propagation is not a problem in itself, but purchasing late-generation seeds,
which contain increasing levels of diseases, and planting a stock of the harvest obtained
thereof the following season can have devastating effects for the crop. Purchasing early-
generation disease-free plant material allows for the multiplication of seeds without
compromising food security and the economic viability of the crop. Production costs are higher
for mini-tubers compared to those applicable to tuber seed production due to the costs of the
in vitro plant material and the stricter cultivation requirements, because the former is
developed in greenhouses or screenhouses that need to be maintained pest and disease-free.
The facility where mini-tubers are being produced at the ARC is not insect-proof, which
downgrades the product to G1, notwithstanding it does not exceed pathogenic or non-
pathogenic damage levels. This is an advantage with respects to product pricing, as later-
generation-labelled seeds have lower costs, which would make mini-tubers from the ARC more
accessible to low-income farmers.
An Integrated Pest Management (IPM) approach
The onset of the South African industrial revolution dates back to the third quarter of the 19th
century, when chemical companies started to rise. The first agricultural chemicals company
was founded as such during the last quarter of the 20th century by the South African chemical
company Sentrachem, after the acquisition of Agricura, an insecticides and herbicides
formulator (Majozi & Veldhuizen, 2015). In 1999, South Africa was the fourth largest importer

13
of pesticides in sub-Saharan Africa (Osibanjo et al., 2002). Notably, the United Nations
Environment Programme developed a country ranking according to pesticides imports,
agricultural production and Persistent Toxic Substances (PTSs) in which South Africa ranked
first (ibid). PTS refers to unwanted and banned pesticides and persistent organic pollutants
(POPs). The data yielded by the same report and by more recent studies provide evidence that
these compounds have deleterious effects in the environment and human health (ibid; Quinn
et al, 2011; Dabrowski, 2016).
Integrated Pest Management (IPM) involves the integration of plant protection methods in a
compatible manner in order to keep populations of harmful organisms below a level of
economic injury (Bajwa & Kogan, 2002). The regulation (EC) No 1107/2009 and the Directive
2009/128/EC require EU member states to introduce an integrated pest management strategy
in their action plans from 2014. However, the use of chemicals is generally the most practiced
method to combat and even prevent pests and diseases in South Africa. For this reason, the
application of an IPM strategy in agricultural systems is vital for the conservation of natural
resources, human health and the socio-economic status of South African farms. Humans have
been in constant competition with pests and diseases since the beginning of agriculture. Crop
profitability began to increase as farmers gained competences and skills due to a better
understanding of their systems. The first methods used to control pests and diseases in
primitive agriculture included handpicking and crushing insects, crop rotation and selection of
high-yielding plants for seed (Gray, Ratcliffe & Rice, 2011). Today, four types of management
strategies have been described for the farmer to adopt, depending on the interaction between
the host, the pest and the environment: do nothing strategy, reduction of pest numbers,
reduction of host susceptibility to pest damage and a combination of the last two strategies
(ibid). In order to implement the chosen strategy, multiple methods or IPM tactics should be
applied to avoid economic injury and pest outbreaks. These tactics are classified in 4
categories: cultural, physical-mechanical, biological and chemical control methods (University
of Nevada Cooperative Extension [UNCE], n.d; Morse, n.d).
The way mini-tubers are produced at the ARC takes into consideration cultural and genetic
preventive methods to achieve a reduction of pest incidence. In fact, the ARC published a
guide to potato production in 2003 dedicating one entire chapter to the IPM methods
available and being used within the potato industry in South Africa (Theron & Mienie, 2003).
Such methods involve the use of pathogen-free propagative material, the sterilisation of the
substrate to eliminate soil-borne pathogens and the selection of varieties that are tolerant to
environmental disturbances and/or certain pests and diseases. Preventive practices usually fall
into the cultural and genetic management categories. Nonetheless, some sources such as the
UNCE include all preventive methods in a separate category (UNCE, n.d). The IPM strategy that
the ARC uses and promotes with the breeding program is, therefore, that of reducing host
susceptibility to pest damage.
o Biological control Theron and Mienie provided a comprehensive description of the IPM methods that potato
farmers and growers could apply to their agricultural systems in South Africa (Theron &
Mienie, 2003). Many of these methods involve soil management, which does not apply to
mini-tuber production, as mini-tubers are cultivated in sterilised artificial substrate. Commonly
used sterile growth media include vermiculite, sawdust, coir and wood shavings (Ferreira
2013). The trade-off of using sterilised substrate is that the diversity and abundance of life in
the soil, which provides a myriad of ecosystem services, is totally absent. There is

14
overwhelming evidence for the notion that the interactions between soil inhabitants and plant
roots positively affect plant growth and performance (Huang et al 2014; Beneduzi, Ambrosini
& Passaglia 2012; Frew et al. 2017). For instance, soil invertebrates modify soil structure and
impact nutrient immobilization and availability in the soil, which positively affects water and
nutrient uptake by the plant. Earthworms, springtails, millipedes and isopods have the
potential to increase nitrogen (N) uptake by plants, whereas invertebrate biomass may store
and therefore immobilize significant amounts of carbon (C), N and phosphorous (P), which
prevents them from being leached (Mehring et al. 2016). Microbial communities play a crucial
role in the well-functioning of the soil ecosystem. Plant roots release a wide variety of
exudates that attract and select microorganisms in the rhizosphere (Huang X. F et al 2014).
Plant-microbe interactions provide ecosystem services such as nutrient cycling and carbon
sequestration (ibid). Moreover, positive effects on the plant and on pest and disease
management have also been observed in such interactions (Beneduzi 2012). Examples of
beneficial associations between plants and microbes include those with plant-growth-
promoting rhizobacteria (PGPR), epiphytes and mycorrhizal fungi (Huang X. F et al 2014).
Biological control was defined by Eilenberg as “the use of living organisms to suppress the
population density or impact of a specific pest organism, making it less abundant or less
damaging than it would otherwise be” (Eilenberg p.1, 2016). Natural enemies of pests are used
in biological control strategies to decrease pest population density. Alternatively, beneficial
microorganisms may be inoculated in order to directly or indirectly promote plant growth
(Eilenberg 2006). Direct growth-promotion mechanisms involve either providing the plant with
a compound synthesised by the microbe itself or facilitating nutrient uptake from the soil
(Beneduzi 2012). Indirect growth promotion occurs when antagonistic microorganisms lessen
the impact of pathogens, resulting in the plant performing better. Production of antagonistic
substances such as antibiotics, bacteriocins or siderophores and induction of systemic
resistance are mechanisms of indirect plant growth promotion (ibid).
Plant-microbe and microbe-microbe interactions at the plant root level have been proven to
promote plant growth and health by means of increasing nutrient availability and uptake from
the soil, enhancing immunity to abiotic and biotic factors, and supressing diseases through
antagonistic interactions (Huang X. F et al 2014). They may be a more sustainable alternative
to the intensive resource-depleting chemical control practices that largely constitute the
agriculture scenario in South Africa. In fact, biological control agents are currently being
commercialised in the country. Examples of companies supplying them are Stimuplant CC,
ABM™ Africa Division and Rolfes Agri (Pty) Ltd.
Small-scale farming
Small-scale potato production in South Africa within the agricultural framework sits among
several threats. Climatic conditions favour the occurrence and persistence of potato diseases
and limit the production due to lack of rainfall and sometimes extreme temperatures, above
30˚C, that impair tuber initiation, which is optimal at a soil temperature between 15˚C and
20˚C (Steyn, 2003). However, many small non-commercial farms currently lack irrigation
systems in their fields. Breeding programs make sure that different varieties adapted to
different abiotic and biotic factors are available on the market, but some farmers do not know
which improved cultivars are most suitable for their fields. Large-scale commercial farmers
15
avoid the prevalence of diseases in the soil by rotating their crops with maize and wheat in a 3-
4-year rotation system (ibid.), but many small-scale farmers cannot rotate because of the size
of their farms, and soil-borne diseases are almost impossible to treat if the hosts are
permanently present in the soil. Moreover, for a small-scale farmer who wants to produce
seeds, certification services are hardly affordable, due to the reasons mentioned above (see
Potato Certification Service section). The use of non-tested seeds potentially harbouring tuber-
borne diseases, the stressful environmental conditions in which potatoes are cultivated and
the lack of knowledge about IPM and sustainability places poverty-stricken smallholder farms
in a situation in which they are up a river without a paddle, that is to say, without the means to
improve their systems or progress.
As mentioned in the “mini-tuber production” section, the high costs of seeds force many
farmers to multiply the seeds they buy one year and use them several times, which results in
the accumulation of tuber-borne diseases and a higher degree of production instability. The
use of mini-tubers would allow small-scale farmers to multiply potatoes for more generations
without having the risk of losing their crops.
Motivations, aims and research questions
If I were to define agroecology in three words or concepts, I would say it is about sustainability,
responsibility and systems thinking. Given the overuse of the word sustainability, I find it
imperative to give an accurate definition of the term.
“Sustainable development (in the agriculture, forestry and fisheries sectors)
conserves land, water, plant and animal genetic resources, is environmentally non-
degrading, technically appropriate, economically viable and socially acceptable”
(FAO Council, 1989).
Since the day I read this definition, sustainable development has been my motto and what I
strive for in life, therefore it is also my motivation for carrying out this thesis study. In order to
develop agricultural systems in a sustainable way, a holistic approach for the analysis of the
production site must be taken. In other words, systems thinking must be applied to reach a
comprehensive understanding of the system and find solutions for improvement. Systems’
thinking involves the use of methods from different disciplines and local knowledge, which
takes into account ecological, social and economic concepts and principles (Wezel et al. 2009).
Within the scope of this study, environmental, economic and social issues associated to mini-
tuber production are being tackled to some extent, because agriculture is not only about the
farm and the money that can be made out of it, but also about the environment and the
community that encompass it. Agroecology was introduced to me as an inter-disciplinary
science and I also adopted it as a philosophy. As a result, I cannot see agricultural systems as
isolated and independent entities anymore. In line with Gliessman’s regard of agricultural
systems as agroecosystems, I believe that food production sites should be analysed as wholes
and integrated into the environment which they are inexorably connected to instead of
putting so much effort in removing externalities.
The benefits of mini-tubers over later-generation potato seeds have already been discussed
above. However, they are not being used by small-scale farmers. Moreover, mini-tuber
production can still be improved with regards to costs of production. On these grounds, my
aims for this research are as follows:

16
To find out if the use of microorganisms as plant-growth promoters in mini-tuber
production at the ARC improves plant growth and increases yield.
To come up with an efficient but economically reasonable methodology for the
analysis of the trials.
To find out, through a survey carried out in a small-scale farming community of KZN,
whether the use of mini-tubers could improve the overall sustainability of smallholding
agriculture.
To engage the ARC and the DARD-KZN in a discussion, based on the results, for future
projects with smallholder farmers through presenting the findings from this research,
which should include the outcomes of the survey, to the two institutions.
The following research questions guide my thesis study:
Do the microorganisms applied to the substrate have an impact on plant performance,
growth and yield? If so, which treatment is the best?
Could any of the challenges that small-scale farming in the surveyed area face be
fulfilled by introducing mini-tubers into agricultural systems?
What do the aforementioned farmers, the ARC and the DARD-KZN need to know to
engage in such discussion?
Biological and social research: setting the boundaries
As mentioned above, the social and environmental sustainability are tackled in this work. To
this end, a primary research project consisting of two parts is developed. On the one hand, a
biological research involving the use of microorganisms is carried out. On the other hand, a
survey of small-scale farmers from the Kwazulu-natal province is conducted and accounts for a
social research. For the biological research, I chose to undertake the project that deals with
the use of microorganisms as plant growth promoters for the purpose of improving the overall
sustainability of the cultivation of mini-tubers G1 at the ARC. Five different microorganisms are
tested in combination with each other to see the effects that they have on seven
commercialised South African varieties and newly bred lines’ plant performance and yield.
However, the results presented and discussed in this report refer only to the three breeding
lines that the ARC is planning to release, which will nonetheless allow me to compare not only
treatments, but also varieties.
Bacterial species include Bacillus subtilis and Pseudomonas fluorescens, whereas fungal species
consist of Arbuscular Mycorrhizal Fungi (AMF) and two strains of Trichoderma harzianum. If
results indicate that using beneficial microbes has a positive effect on productivity, that is to
say, crop yield, further research on the field could allow the ARC to come up with a
standardised mini-tuber production method that includes plant growth-promoters and is less
costly than the current one. Lower production costs might make mini-tubers more affordable
by small-scale farmers. Further research on the effects of such microorganisms on the potato
crop regarding tolerance to diseases by the induction of systemic resistance could lead to a
lesser use of agrochemicals. The drift from chemical pest management practices toward a
more integrated strategy is essential not only for the environment, but also for society,
particularly for poverty-stricken small-scale farmers who struggle to pay the high costs of
pesticides.
17
As for the social research, I aim to understand how farming is practiced in a small scale in order
to identify key problems and communicate them to the relevant institutions so that future
projects involving the use of mini-tubers in small-scale farming can be discussed.
Only two communities from one single province of South Africa are surveyed because of time
constraints. The selected are is the coastal province Kwazulu-Natal (KZN), located in the
southeast of the country. The reason I chose to survey this area was because the Department
of Agriculture and Rural Development of KZN (DARD), which is affiliated with the ARC, enabled
me to gain access to local farmers from remote areas.
Literature review
Plant-growth promoting microorganisms colonise naturally the rhizosphere of potato plants
with variable abundance and diversity (Senés-Guerrero et al. 2014, Kesaulya et al. 2015). Kotan
et al. showed that some PGPR strains are effective biocontrol agents against several plant
pathogenic bacteria and fungi in in vivo and in vitro conditions (Kotan et al. 2009). The same
study claims that Pseudomonas sp., Pantoea sp., Enterobacter sp., Bacillus sp. and Trichoderma
sp. may be used to control potato dry rot, caused by Fusarium sp. (ibid). In fact, biological
control agents based on Bacillus subtilis and Trichoderma harzianum strains are registered in
USA for potato cultivation (Wharton & Kirk 2014). Such commercial products appear to be
effective against some of the major potato diseases in South Africa: late blight, black scurf, dry
rot and silver scurf (ibid, Theron & Mienie 2003). Moreover, the data yielded by Wharton &
Kirk provides evidence that the aforementioned biocontrol agents reduced sprout rot and seed
piece decay caused by Fusarium sambucinum on seed re-stored under optimal conditions.
Another study showed that Trichoderma harzianum reduced the incidence of the disease
caused by Verticillium dahliae and increased total potato yield when inoculated in potato fields
infested with the pathogen (Ordentlich, Nachmias & Chet 1990).
Similarly, Bacillus and Pseudomonas species have been implied in biocontrol due to their
ability to produce antibiotics and induce systemic resistance in plants (Beneduzi, Ambrosini &
Passaglia 2012, Larkin 2016). Additionally, Pseudomonas species produce siderophores,
namely low molecular weight iron chelators, with particularly high affinity to the ferric ion.
Iron is solubilised and extracted from mineral or organic complexes (ibid). This iron can be
easily taken up by the plant when such strains are in symbiosis with plant roots. As far as
arbuscular mycorrhizal fungi are concerned, Funneliformis mosseae (syn. Glomus mosseae)
appears to naturally colonise potato plants in the Peruvian Andes and has proven to be a good
colonizer in greenhouses (Senés-Guerrero et al. 2014).
This study employs a methodology based on plant phenotyping techniques, which allow for
the analysis of plant traits. The tests carried out in this project are based on the analysis of
responses of different genotypes, i.e. the three breeding lines used as subject of the
experiments, to different environmental triggers, namely the 17 treatments based on plant
growth-promoting microorganisms that are applied to such lines. According to Walter, Liebisch
& Hund, phenotyping is more complex than the determination of the arrangement of genes in
a genotype, because it encompasses a myriad of processes that occur at different levels or, as
they put it, dimensions. Fortunately, the increasing and urgent need for superior varieties to
improve crop management has led to the development of non-destructive optical analyses of

18
plant traits, which are used in this study to analyse the products of gene-environment
interactions (Walter, Liebisch & Hund 2015). Breeders and farmers pursue the best genetic
variation to maximise breeding efficiency, and plant phenotyping allows for the identification
of quantitative traits related to growth, yield and adaptation to stress (Li, Zhang & Huang
2014). The techniques used in this study involve plant imaging, to estimate leaf area, and
Chlorophyll a fluorescence, to measure photosynthetic efficiency. Yield-related tests are also
part of the mini-tubers research at the ARC but will not be carried out within the timeframe of
this study. Thus, results derived thereof are not included in this report.
Materials and methods
Trials design
o The facility: The plants were grown at Modaersbond, a screenhouse located in the ARC-VOPI campus, at
Roodeplaat, Gauteng province, South Africa. The layer net of the facility allows for the
entrance of small insects, but sticky traps are placed in order to monitor them and control that
no thrips or aphids, which are potential virus carriers, feed on the plants. The potatoes were
planted in pots along 22 tables which carried 38 crates each (see Figure 2), except for three
smaller tables, which could only fit 31 crates. Each crate contained 6 pots, which consisted of
plastic bags filled with previously sterilised wood shavings and 2, 3 or 4 plants, depending on
the variety and the trial intended to be performed on them (see Table 1 below). The three
breeding lines that this study focuses on, which make up a total of 9 tables, are shaded on
table 1.
Figure 2: table design at Moedersbond. The left picture shows how the 19 rows (2 crates placed horizontally) are arranged within a table, whereas the right picture displays the arrangement of tables. Source: author.
o Fertirrigation: The setup of the trials at the Moedersbond screenhouse was totally new with regards to the
irrigation equipment. As shown in the pictures above, water was provided by means of a drip
irrigation system based on on-line pressure compensating button drippers that delivered

19
water at a flow rate of 12L/hour (Woodpecker PC CNL Dripper, Netafim™). The components
were ensembled and set in place from January 28th to February the 1st, with one delivering
dripper per crate and each bag receiving an individual emitter (see Figure 3). Further pressure
adjustments were needed afterwards and on February 23rd, an automated irrigation controller
was installed (X-core, Hunter®), which controlled daily water times, volume applied and to
which tables it should be applied. Fertilisation was added to the system on the same. In order
to solve pressure problems, four stations consisting of 5 or 6 tables each were set for different
irrigation times and equal water delivery. A bigger pump was installed later on.
Figure 3: crate with installed drip irrigation system. Source: author.
o Cultivars: The plant material was obtained from the In Vitro Genebank facility located at the ARC-VOP
campus (South Africa), which is in charge of ensuring the in vitro conservation of plant
germplasm. One of the services provided is the mass propagation of in vitro plants based on
the cutting of plant stems and the subsequent growth of the plantlets in a sterile micro-
environment. Eight different potato varieties were selected for their traits and planted
immediately after receiving such plantlets. Three tables were used for each variety, except for
one (table 22, see Table 1), which was planted using only one table.
Table 1: layout of the tables at Moedersbond, indicating variety planted on each table, date of planting, number of crates per table and number of plants per pot. The shading applies to those varieties that this study is focusing on.
Table Name of variety
Date of planting
Number of crates
Nbr of plants/bag
1 Mondial 31/01/18 38 3
2 Mondial 31/01/18 38 3, except for the 1st row of bags on right tables (4 plants/bag)
3 Mondial 31/01/18 38 3
4 92-047242(8)VF
31/01/18 38 3
5 92-047242(8)VF
31/01/18 38 3
6 92-047242(8)VF
01/02/18 38 3

20
7 Darius 01/02/18 38 3
8 Darius 01/02/18 38 3
9 Darius 01/02/18 38 2
10 BP1 02/02/18 38 3
11 Mnandi 02/02/18 31 2
12 Mnandi 02/02/18 31 2
13 Mnandi 02/02/18 31 2
14 BP1 02/02/18 38 3
15 BP1 02/02/18 38 3
16 95-0521-126 (6)
02/02/18 38 3
17 95-0521-126 (6)
05/02/18 38 3
18 95-0521-126 (6)
05/02/18 38 3
19 96-0568-2(13)
05/02/18 38 3
20 96-0568-2(13)
05/02/18 38 3
21 96-0568-2(13)
05/02/18 38 3
22 94-0530-8(22)VF
05/02/18 38 3
o Maintenance: Chemical control was applied to the plants once a week. The list of pesticides can be found on
the Appendix 1, which includes the application dose and the date to be applied. None of the
pesticides used in this study appear in the list of PTSs analysed by Osbanjo et al. (2002).
The irrigation system needed maintenance and reparation several times, with regards to the
pipes, the pump and the bottom drippers. The pressure problem lasted long enough for some
plants to die due to water shortages. For the statistical analyses to give accurate results,
ensuring that all the plants are growing under the same conditions is pivotal, hence why the
number of plants in each pot must be the same for all the pots belonging in the same variety.
The same conditions will apply for different varieties if they are to be compared with each
other. In other words, the three varieties to be analysed in this study can be compared with
each other because the number of plants per pot is the same for all the tables, whereas
Mnandi cannot be compared with any other variety because the number of plants per pot is
two (see Table 1 above). For this reason, replacement of dead plants was carried out in several
occasions from February the 8th to the 26th. In vitro plant material was provided for the
replacement of dead plants until there was no more. Alternatively, stems from the best-
performing plants were cut and replanted in those pots where plants were missing. Although
this was intended to reduce variation within the results, it must be born in mind that plants’
root systems were not equally developed in all plants, as replanted stems had barely any roots,
replanted in vitro plant material’s roots were very young and surviving plants had the most
developed root systems.

21
o Treatments: Five inoculants, most of which are commercial products, containing plant growth-promoting
microorganisms were tested in the potato trial in a total of 16 treatments —and one control—
consisting of a single or a combination of up to four products. Each table was subject to the
whole set of treatments, that is to say, 22 tables were treated with all the possible
combinations of microorganisms. Each plot, consisting of two crates, corresponded to one
treatment, and the edges of the tables were not treated, leaving room for 17 experiments to
take place. All treatments were randomised within each table, whereas different varieties
were not mixed and the tables belonging to each variety were placed next to each other (see
Table 1 above).
The microorganisms used in this experiment included two commercial products containing
Trichoderma harzianum (Gliogrow, Molcast Holdings (Pty) LTD; and Excalibur™ Gold, ABM™
Advanced Biological Marketing, Africa Division), a mixture of three arbuscular mycorrhizal
fungi that includes Glomus mossae, G. intraradices and G. etunicatum (Mycorrhizae WS Water
Soluble, Biocult), two strains of Bacillus subtilis in one formulation (Extrasol, Stimuplant) and a
non-commercial isolate of Pseudomonas fluorescens named N04. The acronyms used for each
treatment are displayed in Table 2.
Table 2: name and description of each treatment used in this study.
Treatment Name
Description
B Bacillus subtilis (Extrasol)
C Control
G Trichoderma harzianum (Gliogrow)
M AMF mixture consisting of Glomus mosseae, G. intraradices and G. etunicatum
(Mycorrhizae WS)
T Trichoderma harzianum (Excalibur™)
P Pseudomonas fluorescens (N04)
BP a combination of B. subtilis (Extrasol) + P. fluorescens (N04)
MB a combination of AMF (Mycorrhizae WS) + B. subtilis (Extrasol)
MBP a combination of AMF (Mycorrhizae WS) + B. subtilis (Extrasol) + P. fluorescens (N04)
MP a combination of B. subtilis (Extrasol) + P. fluorescens (N04)
TB a combination of T. harzianum (Excalibur™) + B. subtilis (Extrasol)
TBP a combination of T. harzianum (Excalibur™) + B. subtilis (Extrasol) + P. fluorescens
(N04)
TM a combination of T. harzianum (Excalibur™) + AMF (Mycorrhizae WS)
TMB a combination of T. harzianum (Excalibur™) + AMF (Mycorrhizae WS) + B. subtilis
(Extrasol)
TMBP a combination of all microorganisms except for T. harzianum (Gliogrow)
TMP a combination of T. harzianum (Excalibur™) + AMF (Mycorrhizae WS) + P.fluorescens
(N04)
TP a combination of T. harzianum (Excalibur™) + P. fluorescens (N04)
The inoculation of microorganisms was conducted from Friday the 16th of February to Friday of
the following week, on the 23rd. 1ml of B. subtilis, P. fluorescens and Excalibur equally diluted
were inoculated on each plant. The mixture of AMF came as a 100g powder formulation, which
was dissolved in 5l distilled water. 0,6ml of the solution were applied to each plant. Gliogrow

22
came as a liquid solution that was recommended to be applied at a dilution ratio of 1:100. 1ml
of the solution was applied to each plant.
Tests
o Leaf Area Index Leaf Area Index was used as a measurement of plant growth and was used to assess whether
or not the microbial treatments had a measurable impact on overall plant growth. Leaf area
measurements were taken using the software Easy Leaf Area, developed by Easlon & Bloom in
2014, on pictures taken with a phone. The software performs rapid, automated digital image
analyses with little user inputs and gives an estimation of the leaf area of individual images
within seconds (Easlon & Bloom 2014). The output is a spreadsheet-ready CSV file with image
names, pixel counts, leaf area in cm2 and percentage of canopy cover values. In order to get
pictures of the same size, we developed a low-cost cell phone shuttle made of two poles, one
at each end of the table, and wires connecting them, serving as a track over the plants (see
device diagram on Figure 4). Plants were filmed with a phone placed in a case which was
mounted on this hanging track for smooth horizontal movement generated by pulling a rope
attached to the shuttle from one of the sides of the table (see Figure 4 and Figure 5). The wires
were as tight as possible to avoid the bouncing of the case while pulling and the position and
tilt of the poles was adjusted as to ensure that the crates were properly framed in the videos.
Videos were then snipped with the Snipping Tool of Windows®, capturing one single plot,
namely two crates wherein the same treatment had been applied, in each screenshot (Figure
5B). Images were analysed using the auto-settings provided by the software, except for the
minimum leaf size, which was adjusted according to the growth stage of the plant. Figure 5C
highlights the green areas of the picture, and the percentage of canopy cover is given thereof.
The sampling times are referred to as days after planting (DAP). Videos were taken at 20, 25,
32, 42 and 50 DAP, approximately once a week until the percentage of canopy cover was
nearly 100% for most of the plants.
Figure 4: diagram of the device developed for the performance of the measurements for leaf area estimations. Source: Steyn P. (ARC)

23
A B C Figure 5: methodology for the measurements of leaf area in three steps. Videos of the plants are taken with the phone shuttle device (A). The snipping of videos gives pictures of each plot (B). A picture with highlighted green areas is obtained after the analysis with the Easy Leaf Area software (C). Source: author.
o Chlorophyll Fluorescence Analysis (CFA) Chlorophyll fluorescence (ChlF) technology is widely used for photosynthesis probing purposes
(Kalaji et al. 2017; Hansatech Instruments Ltd 2006; Murchie & Lawson 2013). It is based on
the principle that absorbed solar radiation by antenna pigments from PSI, PSII and Light-
harvesting Complexes (LHCs) is converted into energy through three processes that compete
with each other, which can be classified as photochemical and non-photochemical processes.
Photochemical processes involve the donation of excited electrons from chlorophyll molecules
to electron acceptors from the photosystems, which then drives photochemistry. The state of
reduction and oxidation (redox) of electron carriers along the thylakoid membrane is the base
of the chlorophyll fluorescence analysis procedure (Murchie & Lawson 2013). When key
electron carriers such as the bound quinone QA receive an electron, they are not able to accept
another one until they have passed the one they carry to the next acceptor, and in that state,
that reaction centre (RC) is considered to be closed (ibid). In non-photochemical processes, on
the other hand, absorbed sun light can be dissipated either as heat or fluorescence, depending
on whether the energy is re-emitted in the form of infra-red or red/far-red radiation,
respectively (Hansatech Instruments Ltd 2006). Heat dissipation or non-photochemical
quenching (NPQ) occurs when plants are exposed to light, as it is a photoprotective process
that releases excess excitation energy from chlorophyll-containing structures in order to
prevent the formation of damaging free radicals (Murchie & Lawson 2013). Importantly, a
reduction in one of the processes is associated with an increase in the ones competing with it.
Thus, measuring chlorophyll fluorescence not only gives information about energy dissipation
within the red/far-red radiation, but also allows the user to infer information about
photochemical processes (ibid; Cendrero-Mateo et al. 2016; Handsatech Instruments Ltd
2006).
In this study, a non-modulated fluorescence system, namely a system that analyses
fluorescence induction transients that result from the application of light sources after a
period of darkness, is utilised. The fluorescence instrument used was the advanced continuous
excitation chlorophyll fluorimeter Handy Pea (Hansatech Instruments, Norfolk, UK). The

24
fluorimeter illuminates the sample with a 1 sec light pulse of high intensity that induces a
polyphasic rise in chlorophyll fluorescence. This process is known as the Kautsky induction
phenomenon and the fluorescence induction kinetics curve shows four peaks that occur within
the first 300msec and are denoted by the letters O, J, I and P, which the literature refers to as
the OJIP transients (Handsatech Instruments Ltd 2006; Bussotti et al. 2010; Paul 2016). The
analysis of the OJIP transients is known as the JIP test and translates the readings into a
plethora of biophysical parameters that can be classified in three groups: specific energy
fluxes, flux of ratios or yields and the phenomenological energy fluxes.
Leaves were dark-adapted for 20min following instructions from the manufacturer’s
operations manual (Hansatech Instruments Ltd, 2006). They were covered with leafclips, which
have a small shutter plate that should be closed to exclude light and allow dark-adaptation in
the sample area. The fluorimeter performed the measurements using the default protocol and
readings were taken on the adaxial surface of the third leaf of each plant, following directions
from Robert Laurie, researcher at the Crop Science division of the ARC-VOPI. Cendrero-Mateo
et al. (2016), in a study where they compared active and passive techniques assessing Chl F at
different temporal and spatial scales, put the claim that leaf-to-leaf heterogeneity causes
uncertainty at leaf-scale measurements due to stomatal conductance, leaf photosynthesis and
leaf chlorophyll content, and suggested that averaging a number of representative leaves to a
unique value reduces such uncertainty. In order to reduce leaf-to-leaf variability, the same two
plants from each crate were sampled every time, which gave a total of 4 values per treatment
and day within a table. Considering that each variety was planted using three tables, the total
number of values corresponding to one treatment (i.e. the number of replicates) for a single
variety was 12. The maximum sample size was 612 plants, but some crates were not
performing well and it was therefore not possible to test all crates. Measurements were taken
once a week starting from March the 29th to April the 27th. The reason for taking weekly
measurements was to test whether there would be any differences in the results over time. As
plants go through different developmental stages, which in turn might affect, or be affected by
the population dynamics of the microbial communities living in the rhizosphere, one might
expect to see differences within treatments and varieties over time (Senés-Guerrero et al.
2014). The crates containing poorly-performing plants were not analysed.
The two basic parameters used for calculations are the O and P transients from Kautsky
induction phenomenon mentioned above, namely the minimum level of fluorescence emitted
or fluorescence origin, termed FO, and the maximum level of fluorescence, termed FM. In order
to obtain FM, leaves need to be fully dark-adapted because all reaction centres are open and all
the primary electron acceptors (QA) are oxidised after a period of darkness. In other words,
only when photochemistry is not being carried out and consequently, no NPQ is present,
fluorescence emission can reach its highest levels. FO corresponds to the signal emitted when
QA is oxidised at the onset of the illumination. All the readings were computed using a
Windows® software package, PEA Plus (Handsatech Instrument Ltd). The parameters derived
from the JIP test used for this experiment were as follows: (1) transients FO and FM; (2) partial
vitality indexes, that is, the density of active reaction centres (RC/ABS), the maximum quantum
yield of primary photochemistry (𝜑Po), the probability to move an electron further than the
quinone acceptor QA (ΨE0) which allows for the determination of the ability to convert sunlight
into chemical energy and the probability to reduce and an end electron acceptor (δRo) with
which it is possible to calculate the ability to use chemical energy; (3) vitality indexes
calculated from the partial vitality indexes, that is Performance Index (PIABS) and total
Performance Index (PITotal).

25
o Statistical analysis Prior to the statistical analysis, a histogram of all the LAI data was created with the software
Microsoft Office Excel and values located too far from the trend were regarded as missing
values. The analysis was made with a total of 758 values. For each day, 560 Chlorophyll
fluorescence measurements were collected. After a detailed examination of the dataset, bad
measurements giving negative values or values standing out too far from the trend were
regarded as missing values. The final dataset amounted to 2154 samples.
In order to compare the effect of days, varieties and treatments on the different fluorescence
parameters used, an analysis of variance by ANOVA, regression or REML was carried out using
the software Genstat 18th edition on a single set of data corresponding to 5 sampling times for
the leaf area analysis and 4 for the CFA, 3 varieties and 17 treatments. Differences were
considered to be statistically significant up to P=0.05. Means of significant effects were
determined with the LSD-test (Least Significant Difference).
o Microbial tests The preliminary plan included the determination of microorganisms isolated from the
rhizosphere of the plants in order to confirm that the inoculants had established. One of the
aims of the work was to come up with a low-cost and efficient methodology for the analysis of
the trial. To that end, a pilot trial to figure out a suitable method for the isolation of
rhizosphere microorganisms and endophytes was carried out. However, the identification of
the isolates to the species level was not possible due to time constraints, and the confirmation
of the presence of the inoculants was therefore missing.
The pilot trial involved the sampling of the roots of two randomly selected plants from the
variety Mondial subjected to two different treatments: the combination of Excalibur T.
harzianum, AMF, Bacillus subtilis and Pseudomonas fluorescens (TMBP) and B. subtilis alone
(B). Plants were carefully removed from the soil with properly sterilised tweezers and placed in
plastic bags for a rapid transport to the lab. Once they arrived in the lab, the top part was cut
off and the roots were plated out in Nutrient Agar (NA) and Potato Dextrose Agar (PDA)
following three different methods:
- Direct plating of the roots, without washing the excess of wood shavings attached to
them. That should allow microorganisms from the rhizoplane and the ectorhizosphere
to grow on the plates. Small pieces of roots were cut and plated in NA and PDA to
select for bacteria and fungi, respectively. No antibiotics were added to PDA for a
more efficient isolation of fungi.
- Selection of microorganisms from the rhizoplane, namely those living on the root
epidermis and mucilage, by washing the roots with distilled water to get rid of
microorganisms belonging in the ectorhizosphere, mainly those attached to the wood
shavings. Once the roots were washed, they were transferred to an Erlenmeyer flask
with 100ml distilled water and shaken for 10min. 100µL from the flask, as well as 4
dilutions, were spread plated onto NA and PDA plates.
- Selection of endophytes, i.e. microorganisms from the endorhizosphere. The roots
were surface sterilised with commercial laundry bleach (sodium hypochlorite) that had
been diluted to a final concentration of 1%. The plant material was immersed in this
solution for 5min and rinsed 3 times with distilled water, after which it was transferred
to a mortar and crashed with a pestle and 1ml distilled water to get the endophytes
26
out of the inner plant tissues. 2 dilutions were made for each plant and 100µL of
dilutions 0, -1 and -2 were spread plated onto NA and PDA plates.
All the plates were incubated at 25˚C for 48h under light exposure.
Interviews to small-scale farmers
The ARC partners with the Cedara College of Agriculture, a training institution from the
Department of Agriculture of KZN, which allowed for the arrangement of the social research of
this study. A meeting with Mr Morgan Naidoo of the Cedara College took place on February
the 7th in order to define the objectives of the interviews and schedule the visits. He provided
insights into how small-scale farming is carried out in KZN, as well as the point of view of the
farmers, which influenced the questions asked in the questionnaires, as some of them were
aimed at confirming or rejecting Naidoo’s affirmations. Based on the objectives of the study,
the Cedara College took the task of selecting potato growers and informing them about my
visit. The criterion to select farmers was to have experience in potato cultivation. All the
selected farmers had been trained in potato cultivation at least once within the previous 5
years and had some experience in potato farming, most of which were cultivating potatoes at
the time of the interview. 30 farmers from two communities, Appelsboch and Swayimane,
were interviewed. A total of 7 wards were surveyed. An MSc student from the ARC, Lesiba
Klaas Ledwaba, joined the trip as a translator because most of the farmers could only speak
Zulu. Furthermore, an extension officer of each community accompanied us to all farms.
The questionnaires were written with the help of Versity Kekana, a researcher from the
department of Vegetables and Ornamental Plants of the ARC (ARC-VOP). A bibliographic
review of the suggested literature from the courses at SLU was carried out prior to the
development of the questionnaires in order to get knowledge about the type of questions that
should be asked for the particular purpose of the survey. Meetings with experts from the ARC
and SLU were conducted to develop and narrow down such purpose. Finally, the questions
were reviewed and modified to comply with the Personal Data Act (1998:204), which ensures
and protects people against the violation of their personal integrity. Consequently, data
processing also complied with the Act. Questions asking explicitly about race or disability,
which were suggested by Mr Kekana, were deleted from the template. The sections that
constituted the questionnaires were as follows: interviewer declaration, participant consent,
socio-economic characteristics, financial information and personal interests (see questionnaire
template on the Appendix 2). The visits to the farms were performed from the 13th to the 16th
of March. Each visit was performed in approximately 40min and included a quick visit to the
fields and a semi-structured interview combined with questionnaires that would be filled in by
the interviewer. All respondents signed the consent form at the end of the visit.
Data from the questionnaires and semi-structured interviews was categorised and coded for
further descriptive analyses using Microsoft Office Excel. A data matrix including nominal,
ranked, mix-typed and open-ended questions was manually set up. Each case was laid out in a
separate line and each question, in a separate column. Most of the questions on the
questionnaire were pre-coded. Answers from the semi-structured interview were examined
for data relevant to the overall research question, after which they were either added into the
data matrix and treated as multiple-choice nominal or open-ended questions or brought up in

27
the discussion to complement data from the questionnaires. Answers to open-ended
questions were categorised in themes. Questions with multiple answers were coded as several
variables.
Results
Leaf Area Index The statistical analysis showed a normal distribution of LAI data after the removal of outliers.
There were significant differences between plants belonging in different varieties (>0.001) and
a statistically significant interaction between varieties and days (>0.001). The first graph on
Figure 6 (see green curve on “all treatments”) shows that MC2 experiences a more rapid
development of the canopy, which could explain the significant interaction between variety
and day. Treatments alone did not show significant differences (P value= 0.560). The
interaction between treatments and varieties gave a P value slightly above 0.05 (0.052), which
could be regarded as statistically significant. The analysis of the data with Genstat gave the
constants for the formula of the leaf area increase over time for each treatment, which was
represented by an exponential curve with an average R2 value of 91.14% and a maximum R2
value of 97.44% (see Figure 7). The development of potato plants was determined according to
this formula for the different varieties and also for all the treatments and is shown in Figure 6.
Figure 6: Leaf area development for the three varieties MC24, MC126 and MC2 over time (at 20, 25, 32, 42 and 50 DAP) as determined from RBG values with Easy Leaf Area. Plotted values were calculated with the formula A + B*(RX), where X corresponds to days after planting (DAP) and the constants A, B and R are specific for each treatment, the values of which were extracted from the interaction between percentage of canopy cover and treatment determined by the analysis with Genstat. In order to make the interpretation of results simpler, only data from single treatments have been considered.

28
Figure 7: exponential curve representing increase of percentage of canopy cover over time (from 0 to 50 DAP) for the treatment TMP. Values for each day were calculated with the formula A + B*(RX), where X corresponds to days after planting (DAP) and the constants A, B and R are specific for each treatment, the values of which were extracted from the interaction between percentage of canopy cover and treatment determined by the analysis with Genstat.
Chlorophyll Fluorescence Analysis A significant positive relationship (<0.001) was observed between varieties and days for the
total performance index parameter (PITOTAL), which is an indicator of plant vitality. Besides, the
variable treatment alone also showed a high degree of significance for the same parameter
(<0.001). In order to know which group differs from the rest, i.e. which of all treatments or
varieties has a greater effect on plant performance, the Least Significant Difference (LSD) test
was performed. Any difference between values larger than the LSD value is considered
significant. Results over time show that the best performing cultivar is MC42, with greater
significant differences from day 66 after planting, after which the performance index values
drop. MC2 displayed decreasing vitality from the first sampling time (59 DAP), although the
differences between this variety and MC126 are larger than the LSD (0.1515) only on day 59,
therefore suggesting that only MC42 has a statistically significant effect on total plant
performance index (Figure 8 left). Figure 8-right shows the means of each treatment sorted
from highest to lowest. The LSD value, which amounts to 0.2124, allows for the grouping of
data to mark significant differences. The letter-coded groups indicate the statistical
significance of the values. Treatments with no significant differences get the same letter and
make up a group. The group with the highest values gets the letter a, and the following groups
get b, c, d, e and f, in this case. ‘M’ (PITOTAL prediction=2.483) appears to have the highest value,
yet the closest significantly different treatment is ‘G’ (Figure 8 right). In other words, group a,
consisting of ‘M’, ‘TMBP’, ‘TP’, ‘TM’, ‘MP’, ‘P’, ‘MB’, ‘TB’ and ‘TMP’, has greater positive effects
on plant performance than the rest of the groups.
R² = 0,9744
0,00
20,00
40,00
60,00
80,00
100,00
19 29 39 49 59%
can
op
y co
ver
DAP
TMP

29
Figure 8: interaction between variety and day (left) and between treatments (right) for PI total. (Left) total performance index over time (<0.001, LSD=0.1515) for the three varieties tested: MC2 (yellow), MC42 (green) and MC126 (orange). Plotted values represent the means ± standard error (SE). (Right) Means of measurements of total performance index for each treatment, sorted from highest to lowest (<0.001, LSD=0.2124). The data correspond to measurements of chlorophyll a fluorescence which were conducted on the third youngest leaves of 560 plants.
The other total vitality index, PIABS, differs slightly from PITOTAL in the formula and consequently,
also in the plant functions it is indicator of. PIABS does not provide information about the ability
of the plant to use chemical energy, whereas PITOTAL does. An interaction between day and
variety (<0.001) and between variety and treatment (<0.05) was observed in the analysis of
PIABS (see Figure 9). The breeding line MC2 did not lose vitality from the first day, as the
analysis of PITOTAL in Figure 9A shows. Instead, values decrease from day 66 after planting,
displaying the same type of curve as the other two varieties. MC42 is again the best
performing one, both over time and in response to the treatments (Figure 9A and B). The
interaction treatment-variety gave a least significant difference (LSD) of 0.4771, which is not
exceeded by the difference between any of the treatments corresponding to MC126 and the
same treatment on MC2, which indicates that there are no differences between the two
varieties (Figure 9B). ‘G’ appeared to have the highest PI abs value on MC126. According to the
LSD test, ‘G’ belongs in the same group as ‘MBP’, ‘MB’, ‘TP’, ‘BP’, ‘TB’, ‘TMP’, ‘P’, ‘TBP’, ‘B’,
‘TM’, ‘TMB’, ‘MP’, ‘TMBP’ and ‘M’, under which lies the control. As far as MC2 is concerned,
‘TMP’ (group a) reported the highest value, followed by ‘TM’, ‘MBP’, ‘TBP’, ‘TB’, ‘MP’, ‘B’,
‘TMBP’, ‘TMB’, ‘M’, ‘MB’, ‘T’ and the control, which has the smallest value within the group.
The performance index of MC42 was higher in plants treated with ‘TMBP’, ‘MP’, ‘BP’, ‘TM’, ‘T’,
‘P’, ‘TP’ and ‘TBP’.
0,9
1,4
1,9
2,4
2,9
3,4
3,9
4,4
55 60 65 70 75 80
PI t
ota
l
DAP
MC126
MC2
MC42

30
A
B
Figure 9: interaction between variety and day (A) and between variety and treatment (B) for PI abs. Performance index over time (A) (<0.001, LSD=0.1965) and per treatment (B) (<0.05, LSD=0.4771), for the three tested varieties: MC2 (yellow), MC42 (green) and MC126 (orange). Plotted values in “A” represent the means ± standard error (SE) of measurements conducted on the third youngest leaves of 560 plants. The negative control on “B” is on the left, under the label “C”.
The ability to use chemical energy, expressed asδo
1−δo, is a partial vitality index that is included
in the formula of PI total but not in the PI abs one. MC42 did not present a distinctive
behaviour for this parameter (<0.001) (Figure 10). On the contrary, this parameter remained
stable as well as low over time (Figure 10A). Both MC126 and MC2 presented similar
behaviours over time, showing a decline at 66 DAP and a rise afterwards. Besides, MC126
experienced another fall after day 74. An interaction variety-treatment was found, with an LSD
value of 1.024. All treatment means within the cultivar MC42 were lower than the LSD, which
makes the differences between treatments clearly insignificant. Figure 10B shows a peak on
‘M’ for MC126 that differs strongly from any other treatment, as it is larger than the LSD when
compared to all other means. MC2 shows a better ability to use chemical energy when the
following treatments, named in descending order, are applied: ‘P’, ‘C’, ‘TP’, ‘TM’, ‘TMB’, ‘T’,
‘MB’, ‘G’, ‘M’ and ‘MP’ (Figure 10B).
0,5
1,5
2,5
3,5
4,5
5,5
6,5
58 68 78
PI a
bs
DAP
MC126
MC2
MC42
0
0,5
1
1,5
2
2,5
3
3,5
4
4,5
5
PI_
abs
Treatments
MC126
MC2
MC42

31
A
B
Figure 10: interaction between variety and day (A) and between variety and treatment (B) for 𝜹𝑹𝒐
𝟏−𝜹𝑹𝒐.
Ability to use chemical energy over time (A) (<0.001, LSD=0.4216) and per treatment (B) (<0.001, LSD=1.024) for the three tested three varieties: MC2 (yellow), MC42 (green) and MC126 (orange). Plotted values in A represent the means ± standard error (SE), whereas B shows columns of the means only, both graphs corresponding to measurements conducted on the third youngest leaves of 560 plants. The negative control on “B” appears on the left, under the label “C”.
Measurements of the ability of the plant to absorb sunlight energy, expressed by the formula
RC/ABS or𝛾𝑅𝐶
1−𝛾𝑅𝐶, indicated a better performance of MC42 over time compared to the other
lines (<0.001) (Figure 11 left). All the lines showed a decline in the values from day 66 after
planting. The statistical analysis showed no interactions between treatments and days or
varieties. Nevertheless, the differences within treatments were significant (<0.001,
LSD=0.0182) and ‘TM, ‘TMBP’, ‘TB’, ‘MP’, ‘MBP’, ‘TMP’, ‘BP’, ‘TP’, ‘G’ and ‘MB’, which make up
group a, reported the highest values (Figure 11 right).
0
0,5
1
1,5
2
2,5
3
3,5
4
4,5
58 63 68 73 78
δR
o_1
_δR
o
DAP
MC126
MC2
MC42
0
1
2
3
4
5
6
C B
BP G M
MB
MB
P
MP P T
TB
TBP
TM
TMB
TMB
P
TMP TP
dR
o_1
_dR
o
Treatments
MC126
MC2
MC42

32
Figure 11: interaction between variety and day (left) and between treatments (right) for𝜸𝑹𝑪
𝟏−𝜸𝑹𝑪.
Ability to absorb sunlight energy over time (left) for the three tested three varieties: MC2 (yellow), MC42 (green) and MC126 (orange) (0.001, LSD=0.0130). Plotted values represent the means ± standard error (SE). The table on the left shows the means for each treatment (<0.001, LSD=0.0182). Both graphs correspond to measurements conducted on the third youngest leaves of 560 plants.
Measurements of the plant’s ability to store the absorbed sunlight, also referred to as the
maximum yield of primary photochemistry and represented by the formula 𝝋𝑷𝒐
𝟏−𝝋𝑷𝒐, were also
higher for MC42 than for the other varieties (<0.001), all of them presenting the same type of
curves over time (Figure 12 left). Treatments showed significance on their own (<0.05,
LSD=0.159), being ‘MBP’, ‘TMP, ‘TB’, ‘TBP’, ‘TM’, ‘MP’, ‘BP’ and ‘M’ the most effective in terms
of storage of absorbed sunlight (Figure 12 right).
Figure 12: interaction between variety and day (left) and between treatments (right) for 𝝋𝑷𝒐
𝟏−𝝋𝑷𝒐.
Ability to store absorbed sunlight energy over time (A) for the three tested three varieties: MC2 (yellow), MC42 (green) and MC126 (orange) (0,001, LSD=0.1134). Plotted values represent the means ± standard error (SE). B shows the means for each treatment (<0.05, LSD=0.159). Both graphs correspond to measurements conducted on the third youngest leaves of 560 plants.
0,4
0,45
0,5
0,55
0,6
0,65
0,7
0,75
0,8
0,85
0,9
57 67 77
𝛾𝑅𝐶
_1_𝛾𝑅𝐶
DAP
MC126
MC2
MC42
2
2,5
3
3,5
4
4,5
5
5,5
55 65 75
ϕ_P
o_1
_ϕ_P
o
DAP
MC126
MC2
MC42

33
The partial vitality index indicating sunlight conversion ability is expressed by the formula𝜓𝑜
1−𝜓𝑜.
MC42 presented the highest levels, compared to the other two varieties, over the entire
duration of the experiment (<0.001, LSD=0.04795) (Figure 13A) and with respects to all the
treatments performed (<0.05, LSD=0.1164) (Figure 13B). Nevertheless, Figure 13A shows a
decline starting from the first sampling time (59 DAP) until the end of the experiment. The
curves corresponding to MC2 and MC126, on the other hand, have a peak on day 66 and start
decreasing afterwards. Regarding the interaction variety-treatment, significant differences can
be found for the same treatment when comparing MC42 with any of the other two varieties
(Figure 13B). However, differences are not as clear when the means of MC126 and MC2 are
compared. According to the LSD-test (data not shown), significant differences in sunlight
conversion ability between them could be found in only 9 treatments, one of them being the
control, out of 17. Differences between treatments within each variety can be found when
groups of treatments are considered. MC42 displays the smallest group a, consisting of 9
treatments. The same group is made of 12 treatments for variety MC126 and 15 treatments
(including the control) for variety MC2, suggesting that nearly all treatments have similar
effects on sunlight conversion ability.
A
B
Figure 13: interaction between variety and day (A) and between variety and treatment (B) for
𝝍𝒐
𝟏−𝝍𝒐.
Ability to use chemical energy over time (A) (<0,001, LSD=0.0480) and per treatment (B) (<0.05,
0,5
0,7
0,9
1,1
1,3
1,5
55 65 75
ψ_o
_1_ψ
_o
DAP
MC126
MC2
MC42
0
0,2
0,4
0,6
0,8
1
1,2
1,4
1,6
C B
BP G M
MB
MB
P
MP P T
TB
TBP
TM
TMB
TMB
P
TMP TP
ψ_o
_1_ψ
_o
Treatments
MC126
MC2
MC42

34
LSD=0.1164) for the three tested three varieties: MC2 (yellow), MC42 (green) and MC126 (orange). Plotted values in A represent the means ± standard error (SE), whereas B shows columns of the means only, both graphs corresponding to measurements conducted on the third youngest leaves of 560 plants. The negative control on B is on the left, under the label “C”.
Microbial tests Five dilutions, including the original solution, were plated out to recover microorganisms from
the rhizosphere and 4 dilutions, including the original solution, were plated out for the
culturing of endophytes. The plates corresponding to dilution 0 displayed scattered colonies
the isolation of which was possible, but easier from dilution -1, suggesting that only one
dilution of the solution was necessary.
Figure 14: presumable Trichoderma harzianum on a PDA plate isolated from the -1 dilution PDA plate corresponding to the plant treated with ‘TMBP’. Confirmation of the species was missing.
Figure 14 shows a colony isolated from the ‘TMBP’-treated root sample plate which has the
same appearance as Trichoderma harzianum, according to a mycologist of the ARC who
performed direct and microscopic observation of the colony. However, this type of colony is
not unique, as the colonies of the widely distributed Penicillium also display the same
characteristics, suggesting that identification of the fungus is required. The confirmation of the
microbes could be done at the Biotechnology platform of the ARC and would include DNA
extraction and Sanger DNA sequencing of the 16S ribosomal RNA (rRNA), for bacterial isolates,
and 18S rRNA for fungal colonies. This study was aimed at identifying the inoculants after they
had established within the plant roots. The preliminary protocol included the isolation and
subsequent identification of presumptive colonies from samples taken from one of the tables
at three different times along the development of the plants. Carrying out these microbial
tests at different times allows for a more detailed understanding of microbial population
dynamics, for microbial communities vary with plant developmental stages, which has been
demonstrated in a study of potato-associated AMF in the Peruvian Andes (Senés-Guerrero et
al. 2014).
Direct plating of the roots did not show as much biodiversity as other methods, as everything
grew around the root piece and different colonies could not be observed nor isolated (see
Figure 15).

35
Figure 15: direct plating of root pieces from plants treated with ‘B’ (left) or with ‘TMBP’ (right) on NA plates. Plates were incubated for 48h.
The surface sterilisation and subsequent crashing and diluting of the roots eliminated any
microorganisms living on the surface of the roots and allowed the endophytes to be released.
Figure 16 shows the growth of endophytes from Mondial plant root samples: one of them
corresponding to the treatment with the highest number of inoculants, ‘TMBP’, and the other
one treated only with one microorganism, ‘B’. Both PDA (Figure 16A) and NA (Figure 16B)
plates show a higher number of colonies for roots colonised only by B. subtilis compared to the
sample with the highest possible diversity of microbes. B. subtilis is known to colonise internal
plant tissues and its colonies are typically white or slightly cream on NA, which coincides with
the results observed. In contrast, not as many colonies appear on the plates corresponding to
plant roots treated with ‘TMBP’, which also include B. subtilis, probably because of
competition between the inoculants that resulted in the latter not being able to establish
successfully.
Interestingly, although wood shavings had been sterilised, results show a greater microbial
diversity than what was expected, as the sample inoculated with only B. subtilis appeared to
contain more than one type of microorganism (see right plate on Figure 16A and B).
A
B
Figure 16: spread plating in PDA (A) and NA (B) plates of endophytes recovered from the roots of Mondial plants treated with ‘T’, ‘B, ‘P’ and ‘M’ (left) and with only ‘B’ (right) after 48 hours of incubation.
Plates were spread plated with 100L from the original solution, containing the crashed roots diluted in 1ml (‘TMBP’) or 2ml (‘B’) distilled water.
In order to determine whether it was necessary to carry out the procedure for the culturing of
endophytes or it was possible to recover them by only plating the roots without surface
sterilising and crashing, both methods were used on ‘B’-treated plant roots and results
compared with each other (see Figure 17). A higher diversity and abundance of colonies
appears on the endophytes plates, whereas the plate corresponding to microorganisms from
the ectorhizosphere shows high abundance of big, white-yellow colonies and very few smaller
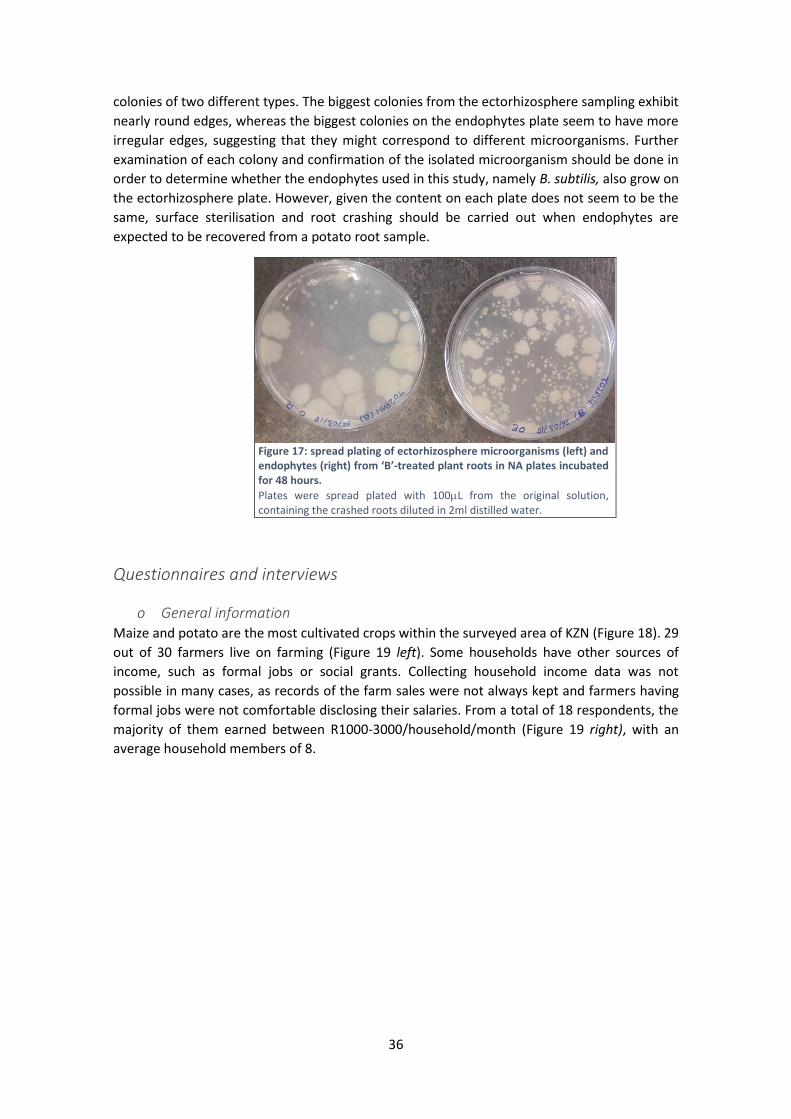
36
colonies of two different types. The biggest colonies from the ectorhizosphere sampling exhibit
nearly round edges, whereas the biggest colonies on the endophytes plate seem to have more
irregular edges, suggesting that they might correspond to different microorganisms. Further
examination of each colony and confirmation of the isolated microorganism should be done in
order to determine whether the endophytes used in this study, namely B. subtilis, also grow on
the ectorhizosphere plate. However, given the content on each plate does not seem to be the
same, surface sterilisation and root crashing should be carried out when endophytes are
expected to be recovered from a potato root sample.
Figure 17: spread plating of ectorhizosphere microorganisms (left) and endophytes (right) from ‘B’-treated plant roots in NA plates incubated for 48 hours.
Plates were spread plated with 100L from the original solution, containing the crashed roots diluted in 2ml distilled water.
Questionnaires and interviews
o General information Maize and potato are the most cultivated crops within the surveyed area of KZN (Figure 18). 29
out of 30 farmers live on farming (Figure 19 left). Some households have other sources of
income, such as formal jobs or social grants. Collecting household income data was not
possible in many cases, as records of the farm sales were not always kept and farmers having
formal jobs were not comfortable disclosing their salaries. From a total of 18 respondents, the
majority of them earned between R1000-3000/household/month (Figure 19 right), with an
average household members of 8.

37
Figure 18: frequency of respondents growing each crop. The graph shows that maize, as well as potatoes, are cultivated by 28 out of 30 surveyed farmers (n=30).
Figure 19: frequency distribution of data dealing with income information gathered from the interviews and questionnaires conducted to 30 small-scale farmers of KZN, South Africa. The graph on the left indicates the number of respondents living on farming, social grants and/or formal jobs. Each respondent might have more than one source of income. The sample volume for the question “household income/month” (right) was 18 instead of 30, and each row corresponds to the number of respondents having a given range of income.
o Production challenges Data regarding production challenges was collected mainly through the question “what are the
challenges that your farm faces?” which is a multiple-choice question (see Figure 20 left), and
questions derived from the answers to the main one. However, that question is somewhat
subjective and contingent on the knowledge that farmers possess about agricultural practices.
Other questions regarding the use of resources, available infrastructure, input expenses and
produce sale also gave information about elements hampering the well-functioning of their
agricultural systems.
28 28
20 2015
8 82
Commodities
Formal jobs Social grants
Farming
9
15
29
Sources of income
ZAR 1000-2000
ZAR 2000-3000
ZAR 3000-4000
ZAR 4000-5000
ZAR 7000-8000
ZAR 8000-9000
5
6
2
3
1
1
Household income/month

38
Figure 20: frequency distribution of data dealing with production challenges (left) and pests and diseases (right) gathered from the interviews and questionnaires conducted to 30 small-scale farmers of KZN, South Africa. Each row or bar corresponds to the number of respondents who face a given challenge/ deal with a given pest or disease.
22 out of 30 respondents reported the presence of pests and diseases to be a major challenge,
making it the most frequent one (Figure 20 left). Among the pests and diseases reported,
insects, especially armyworm (40%), and early and late blight (20%) were the most frequent,
respectively (Figure 20 right). The follow-up question to those farmers was “How do you deal
with these pests and diseases?”. None of them showed knowledge of IPM, as the only way
they knew to control them was chemical management. In those cases where chemical control
did not work any longer, the most common solutions were either to do nothing or to stop
growing that crop because the losses were unaffordable. Some farmers did not know about
crop rotation systems. The second most frequent challenge was the lack of tractor, scoring 18
out of 30. Tractor availability was of serious concern among farmers of the first community, as
most of them could not afford owning one and relied on the few farmers who did and rented it
out. The demand for a tractor appeared to be definitely higher than the offer in the first
community. One of the respondents, who owned and rented out her tractor, was the
chairperson of one of the farmers’ organisation and corroborated the importance of the issue
among members of the organisation. By the time of the interview she had her tractor broken.
30% of the respondents lacked water and infrastructure on their farms, as well as reported
high input costs as a major challenge. 80% of the respondents irrigated at least a portion of
their fields, and although KZN is not as dry as other parts of South Africa, the irrigation system
used in most of the farms was manual application of rain water with buckets or watering cans
(Figure 21).
12
6 6
3 3 32 2
Pests and diseases

39
Figure 21: frequency distribution of data dealing with irrigation systems gathered from the interviews and questionnaires conducted to 30 small-scale farmers of KZN, South Africa. The pie charts show the percentage of respondents who used each source of irrigation (left) or each type of irrigation system (right).
A cold storage room was absent in all the farms, which some farmers pointed out as a
weakness of their systems because it accelerated the spoilage of the produce, thus urging
them to sell. Additionally, the lack of costumers (see market challenges on
Figure 23) as a consequence of transport-related challenges (see transport challenges on
Figure 22) appeared to be the cause of economic losses for many farmers because they failed
to sell the produce before it gets damaged. The main transport challenge observed among the
respondents was the higher costs involved, especially for those who had to hire a vehicle (and
a driver) or get to the trading location by taxi. Lack of transport, either due to unavailability of
vehicles or due to money shortages, is an issue for 23.3% of the respondents (Figure 22 left).
Significantly, only 15% used their own vehicles to transport the produce, as opposed to 28%
who hired it (Figure 22 right). Moreover, 25 out of 30 farmers sold their produce at the farm
gate, which was the only trading point for 16% of them, thus reducing visibility of their
business. In other words, 13.3% of the surveyed farmers relied only on buyers’ transport to get
their produce sold. The market challenges chart reflects that it is not only high costs of
transport, as mentioned above, that hamper the farmers’ ability to sell the produce on time,
but it is also the lack of FPMs or local shops nearby, which was reported especially within
respondents from Swayimane. Finally, there is a tendency towards economic insecurity, as
50% of the farmers interviewed negotiate the price of their produce with buyers and often sell
it at a lower price than they would be willing to, especially when the harvest has been stored
for too long to preserve the characteristics of the produce (see
Figure 23 right).
Municipal water…
River/ stream
20%
Dam7%
Rain50%
Spring water10%
Sources of irrigation
Buckets/cans74%
Sprinkler17%
Hose pipe9%
Irrigation system

40
Figure 22: frequency distribution of data dealing with transport challenges (left) and trading information (right) gathered from the interviews and questionnaires conducted to 30 small-scale farmers of KZN, South Africa. The pie chart shows the answers to the question “how is the produce transported?” and the use of each transportation means in form of percentage. Each respondent might use more than one way of transporting produce.
Figure 23: frequency distribution of data dealing with market challenges (left) and price negotiation (right) gathered from the interviews and questionnaires conducted to 30 small-scale farmers of KZN, South Africa. The pie chart shows the 8 market challenges mentioned by 30 respondents. Each respondent might face more than one challenge. Transport challenges and price negotiation were the two challenges most mentioned. The columns graph shows how many out of 30 farmers uses a given way of setting the price. Each farmer might use more than one pricing strategy.
Regarding farm expenses, all farmers spent money on seeds, inorganic fertilizers and
pesticides (Figure 24). Among the respondents who provided information about farm
expenses, 64%, 50% and 88% of them spent less than R2000/season on seeds, fertilizers and
pesticides, respectively. 37% and 30% of the respondents’ expenses on fertilizers and seeds,
respectively, ranged from R2001-4000.
13
87
1 1
Transport challenges
Lack of FPM/local
shops nearby
Price fluctuations
Price negotiation
Transport challenges
Lack of costumers
No trading location
Non-reliable consumers
Market challenges
15
11
63 2
How is the price set?Competition
with other
farmers
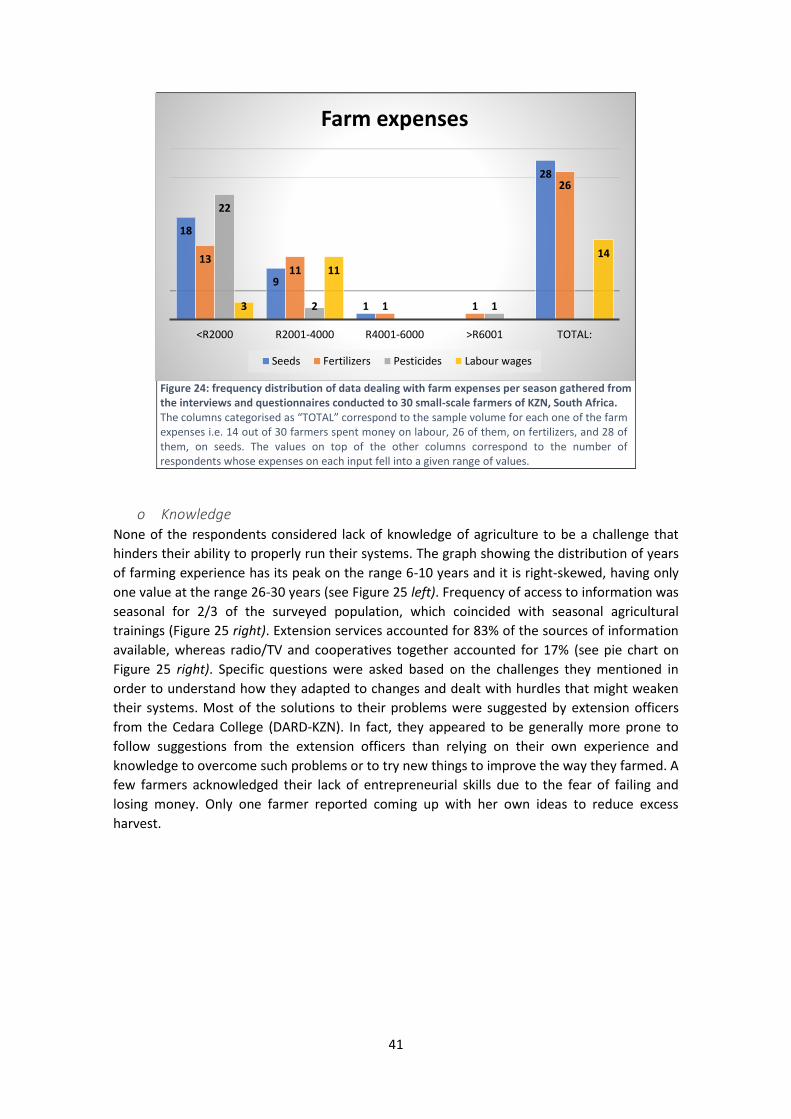
41
Figure 24: frequency distribution of data dealing with farm expenses per season gathered from the interviews and questionnaires conducted to 30 small-scale farmers of KZN, South Africa. The columns categorised as “TOTAL” correspond to the sample volume for each one of the farm expenses i.e. 14 out of 30 farmers spent money on labour, 26 of them, on fertilizers, and 28 of them, on seeds. The values on top of the other columns correspond to the number of respondents whose expenses on each input fell into a given range of values.
o Knowledge None of the respondents considered lack of knowledge of agriculture to be a challenge that
hinders their ability to properly run their systems. The graph showing the distribution of years
of farming experience has its peak on the range 6-10 years and it is right-skewed, having only
one value at the range 26-30 years (see Figure 25 left). Frequency of access to information was
seasonal for 2/3 of the surveyed population, which coincided with seasonal agricultural
trainings (Figure 25 right). Extension services accounted for 83% of the sources of information
available, whereas radio/TV and cooperatives together accounted for 17% (see pie chart on
Figure 25 right). Specific questions were asked based on the challenges they mentioned in
order to understand how they adapted to changes and dealt with hurdles that might weaken
their systems. Most of the solutions to their problems were suggested by extension officers
from the Cedara College (DARD-KZN). In fact, they appeared to be generally more prone to
follow suggestions from the extension officers than relying on their own experience and
knowledge to overcome such problems or to try new things to improve the way they farmed. A
few farmers acknowledged their lack of entrepreneurial skills due to the fear of failing and
losing money. Only one farmer reported coming up with her own ideas to reduce excess
harvest.
18
9
1
28
1311
1 1
26
22
2 13
11
14
<R2000 R2001-4000 R4001-6000 >R6001 TOTAL:
Farm expenses
Seeds Fertilizers Pesticides Labour wages

42
Figure 25: frequency distribution of data dealing with years of experience in farming (left) and access to information (right) gathered from the interviews and questionnaires conducted to 30 small-scale farmers of KZN, South Africa. The pie chart on the right shows the percentage of respondents choosing each source of information represented on it.
As far as mini-tubers are concerned, most of the respondents affirmed that they knew what
mini-tubers were, but only 5 out of 30 really did. The rest, when asked how they got to know
them, referred to them as the small-sized tubers of the harvest. Some of them (5/30) argued,
out of their own experience or based on the information from the trainings, that small-sized
tubers gave lower yield compared to medium or large-sized ones, whereas fewer of them said
otherwise and pointed out that the company where they got potato seeds from sells small-
sized tubers. The number of respondents who did not know which potato cultivars they were
planting accounted for 20% of the total (Figure 26).
Figure 26: frequency distribution of cultivar used, gathered from the interviews and questionnaires conducted to 30 small-scale farmers of KZN, South Africa.
7
12
5
23
1
Years of experience
23
18
6
1 1 1 1
Which cultivars do you plant?

43
o Potato seed production Obtaining potato seeds from the previous year’s harvest is a common practice for 37% of the
interviewed farmers, though not the only way of obtaining potato seeds (see Figure 27 left).
Nearly all farmers obtained potato seeds from private companies. The high inputs costs and
the excess harvest (Figure 27 right), especially when market and transport challenges are
present, were the main drivers of the reuse of seeds from previous years. The number of bags
purchased was contingent on the amount of own seeds produced. The price most paid for a
25Kg bag of potato seeds was R140, with a frequency of 50% (Figure 28). None of the farmers
showed to have genuine interest in potato seed production as a business, yet four of them
seemed to become interested when we briefly introduced the concept to them. Those who
were interested were asked about the certification process of potato seeds, to which they
showed no knowledge.
Figure 27: frequency distribution of data dealing with seeds (left) and allocation of excess harvest (right), gathered from the interviews and questionnaires conducted to 30 small-scale farmers of KZN, South Africa. The columns graph on the left indicates the number of respondents getting seeds from each of the sources represented on it, whereas the pie chart (right) shows what the respondents use excess harvest for, expressed in percentage. Each respondent might choose more than one way to allocate such excess.
29
11
2
where do you get potato seeds from?
Sell10%
Give away for free23%
Plant next year27%
Own consumption
33%
No excess harvest
7%
WHAT DO YOU DO WITH EXCESS HARVEST?
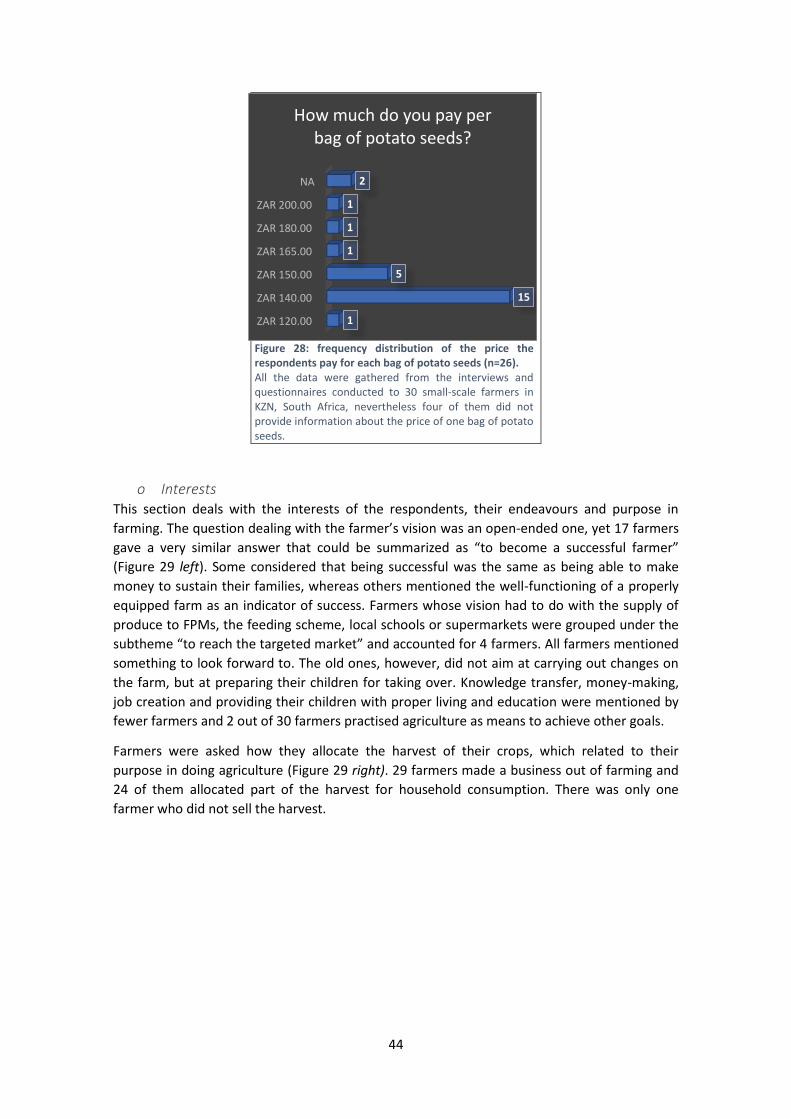
44
Figure 28: frequency distribution of the price the respondents pay for each bag of potato seeds (n=26). All the data were gathered from the interviews and questionnaires conducted to 30 small-scale farmers in KZN, South Africa, nevertheless four of them did not provide information about the price of one bag of potato seeds.
o Interests This section deals with the interests of the respondents, their endeavours and purpose in
farming. The question dealing with the farmer’s vision was an open-ended one, yet 17 farmers
gave a very similar answer that could be summarized as “to become a successful farmer”
(Figure 29 left). Some considered that being successful was the same as being able to make
money to sustain their families, whereas others mentioned the well-functioning of a properly
equipped farm as an indicator of success. Farmers whose vision had to do with the supply of
produce to FPMs, the feeding scheme, local schools or supermarkets were grouped under the
subtheme “to reach the targeted market” and accounted for 4 farmers. All farmers mentioned
something to look forward to. The old ones, however, did not aim at carrying out changes on
the farm, but at preparing their children for taking over. Knowledge transfer, money-making,
job creation and providing their children with proper living and education were mentioned by
fewer farmers and 2 out of 30 farmers practised agriculture as means to achieve other goals.
Farmers were asked how they allocate the harvest of their crops, which related to their
purpose in doing agriculture (Figure 29 right). 29 farmers made a business out of farming and
24 of them allocated part of the harvest for household consumption. There was only one
farmer who did not sell the harvest.
ZAR 120.00
ZAR 140.00
ZAR 150.00
ZAR 165.00
ZAR 180.00
ZAR 200.00
NA
1
15
5
1
1
1
2
How much do you pay per bag of potato seeds?

45
Figure 29: frequency distribution of data dealing with goals (left) and purpose (right) of the respondents in agriculture. The data were gathered from the interviews and questionnaires conducted to 30 small-scale farmers of KZN, South Africa. Each farmer provided only one answer and all farmers answered both questions (n=30).
Discussion Discussion of results As mentioned in the introduction, the selection of high-yielding varieties is an essential part of
the integrated pest management strategy. Thus, analysing chlorophyll fluorescence to gain
knowledge of plant performance can give valuable insights into the improvement of potato
cultivars. The data yielded by the statistical analysis of the CFA shows variety-day interactions
in all parameters analysed, which coincides with results obtained from the leaf area index test,
thus providing compelling evidence that variety influences chlorophyll fluorescence and
canopy cover over time. Furthermore, the data from the CFA test suggests that the variable
variety affects plant performance, for the parameter total performance index or PI total takes
into consideration all partial vitality indexes, namely the plant’s ability to absorb sunlight
energy, to store the absorbed sunlight, to convert it into chemical energy and to use such
chemical energy, for which the interaction variety-day was significant. The data yielded by the
CFA regarding PI total indicates that MC42 is the best-performing variety. MC42 and MC126
experience a decline after day 66, unlike MC2, which displays decreasing values from the first
sampling time (59 DAP). A decline in potato plant performance is expected during the tuber
bulking stage, as the plant has been accumulating nutrients and energy in the canopy during
the vegetative growth stage that needs to be translocated to the tubers. Another contributing
factor could be, however, the fact that some plants started showing symptoms of late blight
shortly after the readings at 66 DAP were taken. The earlier decline in plant performance
observed in MC2 plants compared to MC42 and MC126 can be explained by differences in the
length of the growth cycles of each variety. Conversely, all tested cultivars display an increase
and subsequent decrease of the other performance index (PI abs), which encompasses all
partial vitality indexes except for the ability to use chemical energy. MC42 displays higher
values compared to the other varieties for the whole length of the study. A totally different
behaviour is observed in all varieties when the parameter indicating the ability to use chemical
energy is considered, which bottomed out on day 66 for both MC2 and MC126. The reason for
this fall is unknown. MC42 appears to have the poorest ability to use chemical energy,
subsistence
business
subsistence+ business
1
5
24
Purpose in doing agriculture

46
according to results, but the overall total performance indicates that it is the variety displaying
a higher vitality index.
Unfortunately, yield-related post-harvesting tests, which would give information about the
correlation between plant performance and yield, could not be carried out within the
timeframe of this study and results are therefore not available yet. It seems logical to focus the
attention on the parameter PI total for the interpretation of results because it includes all
partial vitality indexes in its formula. Nevertheless, it might not be the best indicator of yield,
which is ultimately the parameter that breeders need to obtain information about to be able
to select the most suitable varieties for a given climate. Assuming the results of the CFA are
totally reliable and representative of reality, it will only be possible to determine which ChlF
parameter is the best indicator of yield when the results of the post-harvesting tests are
available and can be compared with them.
No significant interactions were found between varieties and treatments for the total
performance index. In contrast, the performance index PI abs showed a statistically significant
variety-treatment interaction. Interestingly, plants treated with only AMF appeared to be the
best performing ones in terms of ability to use chemical energy, which is the parameter that is
absent in the PI abs formula. This is the only case in which one single treatment is significantly
different from all others according to the LSD-test and could be the reason AMF appeared to
be the treatment having the highest value for PI total but not for PI abs. Groups of treatments
having different degrees of significance have been identified for each parameter, yet it is
difficult to find a common denominator due to the large number of treatments belonging in
the same group. For instance, although AMF is clearly the treatment having the greatest
positive impact on the ability of MC126 to use chemical energy, when PI abs is considered,
AMF appears to be as statistically significant as 14 other treatments, which make up the best-
performing group (group a), and in the case of the PI total, it also belongs in group a, together
with 8 more treatments. These results suggest that there is a trend towards some treatments
positively affecting total performance more than others. Nevertheless, it is not possible to
point one of them based on the available data. Furthermore, the slope of the LAI graphs for
each treatment was not calculated, which would have been very useful for the determination
of the best treatment. A principal component analysis of the different variables of Chl F
measurements would shed light on the matter and allow for more developed conclusions to be
drawn.
Results suggest that the answer to my research question “Do the microorganisms applied to
the substrate have an impact on plant performance, growth and yield?” is “yes”. However, it is
not easy to point one or a group of treatments that surpass the rest, for many things need to
be taken into consideration. As mentioned in the introduction, the production of mini-tubers
at the ARC is a very new initiative and the process still needs improvement. The setting up of
the experiment coincided with several modifications regarding the methodology used for the
cultivation of potato plants for mini-tuber production, which might have affected the results.
For instance, the installation of a high-pressure drip irrigation system caused several
inconveniences and variation in the plants’ growth rate due to pressure problems that led to
differences in water delivery. A bigger pump was installed some weeks after planting, which
fixed the problem, but many plants had already suffered from water deficiency. Many of them
even died at different times during the experiment and needed to be replaced, which led to
plant roots not being equally developed at the time of the inoculation. This could have
affected the rate of successful establishment of the inoculants, causing variation within results.

47
Moreover, fertilizer was applied through the irrigation system; therefore insufficient water
supply affected also the amount of nutrients available for the plant. Some of the old pipes
burst when the high pressure was applied and had to be replaced at different times during the
experiment.
Results were interpreted based on the assumption that the inoculants had actually established
in or on the plant roots. However, there was no evidence of such establishment, since
microbial tests did not allow for the identification of the microorganisms down to the species
level. Then again, results showing statistical differences between treatments could be the
regarded as an evidence of their establishment. It would nevertheless not be unreasonable to
entertain the possibility that microorganisms of some crates were washed out from the wood
shavings, for example, as the last day of the inoculation and the day after, the plants received
a heavy rain. Moreover, the results of the microbial tests provide confirmatory evidence that
the inoculants were not the only inhabitants of the plant root systems. Contamination of the
substrate through human manipulation of the plants and growth medium surely occurred
during the setting up of the experiment, the maintenance, the planting and the replacement of
dead plants before and after the inoculation. There is no reason for disregarding the possibility
of cross contamination between inoculants from different crates. If microorganisms as plant
growth promoters be further investigated, confirmation of establishment by the inoculants
needs to be carried out through microbial tests. The literature provides evidence that the
composition of microbial communities varies with plant developmental stages (Senés-
Guerrero et al. 2014). F. mosseae is a generalist, as it colonises the roots at early stages and
seems to persist along the plant growth, which makes it a promising candidate for AFM use in
potato cropping systems (ibid). On these grounds, isolation of microorganisms from the
rhizosphere should be conducted multiple times in further research studies.
Discussion of the methodology The aim “To come up with an efficient but economically reasonable methodology for the
analysis of the trials” has been achieved. Results from the regression analysis on the leaf area
index data demonstrate that the methodology employed can be successfully used to
determine the LAI, for the graph of the development of the canopy cover had a very good
fitting. The Leaf Area Index graph is completed when measurements are taken from the day of
emergence until the day the plant dies. The graph exhibits an initial upward slope, which is
what the study intended to focus on. That slope determines how quickly a variety reaches
100% canopy cover, which can be compared with that of the ideotype, i.e. a behaviour model
of a given cultivar, to direct the breeding efforts to a particular end. Crop ideotype was defined
for the first time by Donald C. M (1968): "A crop ideotype is a plant model, which is expected
to yield a greater quantity or quality of grain, oil or other useful product when developed as a
cultivar." Since the purpose of developing new varieties is to improve the efficiency of
agricultural systems, breeders focus their attention on developing high-yielding cultivars that
are suitable for a particular set of environmental conditions. The ideotype provides a set of
characteristics that suit the plant to its environment, which can be used as guidelines for
breeders who are looking for specific traits. The steeper the slope, the better the plant is
performing. Unfortunately, slopes of the LAI graphs were not calculated in this study, and
therefore conclusions regarding which treatment was the best-performing one could not be
drawn. The conclusion drawn was, nonetheless, that the use of a handmade cell phone shuttle
device as a plant imaging technique and the processing of data through the free open source

48
software Easy Leaf Area seems to be a low-cost, rapid method for the collection of
measurements of leaf area, which is an indicator of plant growth.
The fluorimeter used for the chlorophyll fluorescence analysis might not be economically
affordable for everyone. Nevertheless, all the tests carried out in this study, as well as the
yield-related tests, are non-destructive testing (NDT) methods, which allow analytical research
to be conducted without causing damage. Data collection through non-destructive methods
allows the farmer, breeder or researcher to take as many measurements as necessary without
affecting the yield or crop productivity in any way. Using non-destructive techniques is very
desirable as far as environmental and economical sustainability are concerned, because it
produces no waste and no crop losses. Both the LAI and CFA gave consistent results regarding
the effects of variety and treatments on plant performance and growth, suggesting that the
methodology used is reliable.
The pilot trial revealed that the best method for the recovery of microorganisms from the
rhizosphere is the one in which roots are rinsed with distilled water, which is then spread
plated. When endophytes are the targeted group of microbes, surface sterilization and
crashing of the roots ensures a higher recovery of bacteria than direct plating or the procedure
for the sampling of rhizosphere microbes.
Social research The results from the questionnaires and semi-structured interviews to small-scale farmers
confirm the information available on the literature regarding the weaknesses and threats of
smallholding agriculture: that the high input costs pose a major challenge for farmers and that
one of the ways to reduce costs is through obtaining potato seeds from the previous year’s
harvest. This, in turn, jeopardises the resilience of their systems, for the use of non-certified
late generation potato seeds increases the risk of pests and diseases, which reported to be the
major challenge farmers faced. Crop losses due to pests and diseases damaging the harvest
leads to low or no income generation, which makes the purchase of inputs and transportation
of produce unaffordable, as farmers themselves explained. The lack of inputs in an input-
intensive agricultural system can be devastating for the next year’s crop, causing an even
worse economic situation. Moreover, affordability of transport is taken for granted in Sweden,
but for poverty-stricken small-scale farmers, not being able to transport the produce to market
entails lower product sales, which also lowers income generation. The main challenge,
however, is none of the ones mentioned by the surveyed farmers, but the only one they are
not aware of. Their evident lack of knowledge on IPM prevents their agricultural systems from
reaching their full potential, as the main strategy used to combat pests and diseases is
chemical control. Putting the environmental issues aside, treating pests and diseases only with
pesticides represents a high farm expenditure that negatively impacts the economic
sustainability of the farm. From an agroecological point of view, knowledge-intensive, as
opposed to input or capital-intensive agriculture, integrates the crop into the ecosystem
around it, acknowledging the role each of the elements of the farming system play in it and
making use of their properties, which are totally overlooked and even removed from the
system in input-intensive farming. Evidently, gaining knowledge is also costly, mainly in terms
of time. A knowledge-based agricultural system is inevitably time-intensive too, yet one would
expect those farmers who live only on farming to be able to afford such time investment.
Most of the interviewed farmers mentioned that agriculture made them happy, that they saw
life in it. All surveyed farmers lived on agriculture and 28 of them endeavoured to pursue goals

49
dealing with the improvement of their systems. I expected, therefore, these farmers to have
genuine interest in gaining knowledge of their farms, to seek solutions to their problems and
to come up with new practices to strengthen their business. However, frequency of access to
information was mostly seasonal and through trainings and/or courses from the extension
services. The reason for this apparent lack of interest towards farming education is unknown.
Most farmers belonged to a farmers’ organisation, and yet only one farmer reported getting
knowledge from other farmers of the organisation. All farmers had access to agricultural
trainings offered by the Cedara College of Agriculture at least twice per year, yet the
knowledge farmers showed of IPM indicates a lack of information received on the topic.
Furthermore, the financial problems they face negatively impacts their entrepreneurial skills
by creating a fear of failing that keeps them from practicing the trial and error method of
problem solving and makes them apply changes only when the extension officers recommend
them to do so, without understanding the particularities of their systems to find more suitable
solutions.
Farmers’ lack of knowledge and initiative might be more complex than it seems. Results
provide overwhelming evidence that lack of money and resources hampers farmer’s chances
to progress. However, the available data makes it difficult to gather evidence that lack of
knowledge has the same effect as lack of money, for there are many factors affecting this
situation, and only assumptions can be made in this regard:
First, the support that some of them get from the Cedara college is of high worth, and
obviously they would not like to risk it by appearing too self-sufficient or confident in the eyes
of a stranger sent from the ARC and the Department of Agriculture. This can lead to them
giving misinformation to the interviewer about the state of their farms, if they think that the
interviewer poses a threat to them. Secondly, cultural and historical factors might also play a
role in hindering their ability to find solutions and trust their own judgement regarding the
management of their farms. Indigenous South Africans have for many years lived in a society
that looked down on them and abused them, which has affected the way they define
themselves and has shaped their identity, possibly influencing how capable they think they are
of doing things on their own and of coming up with their own solutions to problems. Thirdly,
hidden social issues that affect the agri-food sector in South Africa might exist and that would
explain why they do not learn from other farmers or obtain information from the media.
Questions such as “Do farmers compete with each other? Does that keep them from sharing
knowledge?” were not asked in this study and could reveal the real causes for this lack of
knowledge.
These assumptions might be real factors that affect potato farming in the surveyed area or
might be not. Understanding the nature of the problem of knowledge would make it easier to
find a way to tackle it. A comprehensive analysis of social factors affecting a system is what the
social part of agroecology deals with and is the key that opens the door towards social
sustainability. The future of small-scale farmers of South Africa can be bright, provided that
further research is carried out on this matter.
Given that the incidence of pests and diseases is the major challenge, and that using late-
generation potato seeds from the previous year’s harvest, which accumulate tuber-borne
diseases, worsens the situation, one can argue that using certified mini-tubers would clearly
reduce the risk of crop losses, as they are pathogen-free and therefore, diseases could only
come from the soil or the environment, but not from the tubers. The answer to the research
question “Could any of the challenges that small-scale farming in the surveyed area face be
50
fulfilled by introducing mini-tubers into agricultural systems?” would therefore be “yes”.
However, mini-tubers alone are not the solution for small-scale farmers, as they are expensive
to purchase and they should be introduced into smallholdings after farmers have been taught
what they are and how to use them. The use of mini-tubers, together with the provision of
appropriate trainings on their use and on IPM strategies that teach farmers how to identify key
elements of their systems, can potentially improve food and economic security, as well as the
quality of the harvest. Cultural and physical/mechanical control practices, such as crop
rotation, sanitation, mechanical removal of pests, use of trap crops to attract the pests that
would otherwise attack the crop of interest, use of certified seeds and suitable varieties etc.,
are IPM strategies that can reduce the incidence of pests and diseases and do not involve the
use of pesticides. Semiochemicals, namely chemicals involving pheromones or other
compounds that interfere with the interactions between organisms, are also used in IPM
programs as they target a specific pest or group of pests. Further research on IPM applied to
South African fields might be required to determine which practices can be used and how they
should be carried out. The most used cultivars within the surveyed area were Mondial and
Sifra, probably because the extension officers recommended them, suggesting that farmers do
not make decisions regarding cultivar selection. Moreover, some of them did not know which
cultivars they were planting.
There is no single IPM approach that offers a universal solution because different strategies
are suitable for different systems. On this grounds, agroecology gives the tools for the
management of a specific farm, as it strives for time investment in order to achieve an
understanding of the elements of a farming system that allow the farmer to run the farm in an
efficient and sustainable way without using a lot of inputs and therefore, without spending a
lot of money. Every farm is a different case, and only someone who regularly spends time in it
can get the most out of it while preserving its natural resources.
Using mini-tubers without being able to identify a disease by its symptoms or to use the
natural resources and tools that the system itself provides will only represent another input to
the farm and, consequently, a higher economic investment. Thus, in order for farmers to
overcome their challenges, they need to understand the importance of having knowledge of
their farms and learn how to integrate their crop into the environment through the application
of an integrated pest management strategy that ultimately should reduce the inputs need and
consequently, the farm expenses. Moreover, fostering their entrepreneurial skills and
encouraging them to try things by themselves might help them be genuinely interested in
learning and seeking information. Nevertheless, understanding why they do not seek
knowledge in the first place might give a profound insight into how to deal with them. The
purpose of this is to ultimately promote their self-sufficiency and independence. To this end,
the extension services of the DARD-KZN, need to provide them with the tools for a proper
management of their farms by means of trainings on:
- The use of pesticides: environmental impact, how to make an efficient use and
alternative methods, such as semiochemicals and biological control.
- The risks of planting potatoes from the previous year’s harvest as seeds.
- IPM with special focus on cultural and mechanical/physical control
- Mini-tubers, their benefits and how to use them.

51
Communication of the findings to the Agricultural
Research Council A lecture on the project was given to researchers and other employees of the ARC on Friday 4th
of May. Unfortunately, nobody from the Department of Agriculture of KZN could attend the
lecture. After presenting the findings, I engaged the audience in a discussion about the
feasibility of introducing mini-tubers in small-scale agricultural systems. Flip Steyn, potato
breeder and mini-tuber producer at the ARC, was very positive about the benefits that mini-
tubers would bring in smallholder agriculture, as they would be a solution against the high
incidence of pests and diseases. Besides, Mr. Steyn argues that, due to their small size and
weight, it would be possible to post them, making them accessible in remote areas where
certified potato seed availability is scarce. The purchase of mini-tubers by small-scale farmers
is a far-fetched option, as mentioned in the discussion, unless the ARC and/or the DARD-KZN
find the support to supply them for free. Ideally, farmers would reach a desirable level of self-
sufficiency if they produced mini-tubers or potato seeds themselves, as they would reduce the
expenses of seeds. To this end, farmers should be provided with mini-tubers and courses in
which they are trained on how to use them. Besides, giving them information about how the
seed production process and certification of potato seeds is carried out might encourage the
interested ones to try to produce seeds of their own. However, this option has some
limitations. First, the in vitro plant material from which mini-tubers are produced is very
expensive to cultivate as well as to transport from the ARC to the farms, as reported by Ms
Nokuthula Myeza, manager of the in vitro Genebank facility at the ARC. Secondly, the Potato
Certification Services (PCS) only certify seeds of farmers who are registered in the Scheme,
which has a cost. As mentioned in the introduction, small-scale farmers are in a
disadvantageous position with respect to potato seed certification because of the size of their
land and the location of their farms. Poverty-stricken small-scale farmers cannot afford giving
up the big sampling volume required for tuber analysis. Transport costs would be higher for
those who live in remote areas, as they should pay for the sample to be picked up and
transported to the analysis lab. In addition, the seed grower pays for the certification of the
seeds. The outcomes of the lecture and the following discussion seemed to provide feasible
alternatives to the aforementioned limitations. Cutting stems of the young plants and
replanting them is a cheap technique for the multiplication of in vitro plant material. This
technique has been carried out in this study (see Materials and methods) when in vitro plant
material ran out and dead plants needed to be replaced, thus proving that it is doable. This
technique would allow for lesser plant material to be purchased and transported, thus
reducing the costs. As far as the certification is concerned, the ARC is planning on starting its
own certification system with the purpose of helping small-scale farmers become seed
growers and achieve a higher level of independence. However, the development of a sound
and economically reasonable certification system seems to be indispensable for smallholding
farmers to be able to become seed growers.
Conclusions This study provides evidence that variety plays an important role in plant performance and
growth, making it imperative for farmers to choose wisely the cultivar they use on their
systems. Results indicate that microorganisms also play a role, but further research is
necessary for the understanding of the factors that affect plant-microbe interactions. As far as
the social part is concerned, I put forward the claim that mini-tubers, together with

52
appropriate trainings, can hugely improve smallholding agriculture. Further research on IPM
might still be necessary, as it does not seem to be a common field of study in South Africa.
Extension officers need to provide adequate trainings that empower farmers and provide them
with knowledge that they can use to find the most efficient and sustainable way to run their
systems.
Critical reflections Doing my Master’s thesis in South Africa has been by far the most wonderful experience of
everything I have experience during the 2-year programme. I was expecting to have a lot of
work, yet I never imagined I could be engaged and dedicated to such a high degree. I
acknowledge, nevertheless, a few things that I would have done differently, had I had the
time. First, having several variables (CFA parameters, LAI) that give information about the
same thing (plant performance and growth) can be very useful yet also bewildering if the
researcher does not know how to handle them. I think that a principal component analysis
(PCA) would have allowed me to compare different results with each other. Unfortunately, my
basic knowledge of statistics and the time constraints made it impossible for me to carry it out.
Similarly, the same reasons kept us (Flip and I) from calculating the slope of the LAI graphs,
which would have given information about the effect of each treatment on plant growth. As I
mentioned in the discussion, I found it imperative to carry out the microbial determination of
inoculants. Regarding the social research, I would have liked to do a correlation analysis of
some of the questions such as the incidence of pests and diseases in correlation with the use
of pesticides or the potato yield in correlation with the amount of pesticides applied to the
field.
Acknowledgements I would like to express a deep gratitude to my supervisor in South Africa, Flip Steyn, for his
dedication and support. I would also like to thank the whole ARC family, specifically Lesiba
Klaas Ledwaba, for being my guide and translator in KZN; Versity Kekana, for assisting me
during the preparation of the questionnaires and the processing of the data; and Elsie, Renné
and Erika, for helping me in several occasions. I profoundly thank the farmers who participated
in this study. I also want to express my gratitude to my supervisors in Sweden, Laura Grenville-
Briggs Didymus, for rooting for me and making possible for me to do my thesis research in
South Africa, and Kristina Blennow, for reminding me of my purpose when I felt confused and
for putting me back on track. I am very grateful for the help I received from Jan-Eric Englund
with statistics.
To my friend Isaac Nape, a scientist who showed me what being passionate about science
means and educated me in many different ways, thank you for being there. And to those who
were not physically there but nevertheless invested your time in giving me advice and
guidance when I needed it, thank you Iris Pla and Albert de Bobes.
To Mohamed Magdi Hussein, whose unconditional support I had along the journey, and whose
laptop I used when mine collapsed, a warm thank you.
To my mother, thank you for being always there.

53
References
Agricultural Research Council (ARC) (2014): Plant breeding. Available from: http://www.arc.agric.za/arc-vopi/Pages/Plant-Breeding.aspx [22-03-2018].
ARC (2014): Breeding and commercialization of potatoes. Available from: http://www.arc.agric.za/arc-vopi/Pages/Plant%20Breeding/Potatoes.aspx [21-06-2018]
ARC (n.d.): ARC Vision and Missions. Available from: http://www.arc.agric.za/Pages/About%20Us/ARC-Vision-Mission.aspx. [25-03-2018]
ARC, National Research Fundation (NRF), South African Agency for Science and Technology Advancement (SAAST) (n.d.): Careers in Agricultural Research. Available from: http://www.nrf.ac.za/sites/default/files/documents/Careers%20in%20Agriculture.pdf. [06-03-2018]
Bajwa, W. I. and Kogan, M. (2002): Compendium of IPM definitions (CID)- What is IPM and how is it defined in the worldwide literature? Oregon State University, Corvallis, OR 97331, USA, Integrated Plant Protection Center (IPPC).
Beneduzi, A., et al. (2012): Plant growth-promoting rhizobacteria (PGPR): Their potential as antagonists and biocontrol agents. Genetics and Molecular Biology, 35 (4): 1044-1051.
Bussotti, F. et al. (2010): The JIP test: a tool to screen the capacity of plant adaptation to climate change. Scandinavian Journal of Forest Research, 25 (8): 43-50
Coleman, A. (2015): Seed potato production – not for the faint-hearted. Farmer's weekly. Available from: https://www.farmersweekly.co.za/bottomline/seed-potato-production-not-for-the-faint-hearted/. [12-04-2018]
Directive 2009/128/EC of 21 October 2009 on establishing a framework for Community action to achieve the sustainable use of pesticides.
Easlon, H. M. and Bloom, A. J. (2014) Easy Leaf Area: automated digital image analysis for rapid and accurate measurement of leaf area. Applications in Plant Science, 2 (7): 1-4.
EE Publishers (2016) Agricultural pesticide-use maps for South Africa. Available from: http://www.ee.co.za/article/agricultural-pesticide-use-maps-south-africa.html. [30-03-2018]
Eilenberg, J. (2006) Concepts and visions of biological control. In: Eilenberg, J. and Hokkanen, H. M. T. (Eds.) An ecological and societal approach to biological control. Springer ed. The Netherlands.
FAO (1989): The state of food and agriculture 1989. FAO agriculture series, no. 22. Italy, Rome. ISSN 0081-4539
Ferreira, J. (2013): Mini-tubers for the seed potato market. Farmer's weekly, Available from https://www.farmersweekly.co.za/crops/field-crops/mini-tubers-for-the-seed-potato-market/.

54
Gliessman, S. R. (2015): The Agroecosystem concept. In: Engles, E. W. (Ed.) Agroecology: the ecology of sustainable food systems. 3rd ed. Bosa Roca Fla.: CRC Press. 405 pages.
Gray, M. E. et al. (2008): The IPM paradigm: concepts, strategies and tactics. In: Radcliffe, E. B. H., William D. and Cancelado, R. E. (Eds.) Integrated Pest Management: concepts, tactics, strategies and case studies. Cambridge University Press ed. p. 551.
Huang, X.-F., et al. (2014) Rhizosphere interactions: root exudates, microbes and microbial communities. NRC Research Press, 92: 267-275.
Handsatech Instruments (2018) Handy PEA: Advanced continuous excitation chlorophyll fluorimeter. Available from: http://www.hansatech-instruments.com/products/introduction-to-chlorophyll-fluorescence/continuous-excitation-chlorophyll-fluorescence/handy-pea/. [19-04-2018].
Kesaulya, H., et al. (2015): Isolation and physiological characterization of PGPR from potato plant rhizosphere in medium land of Buru island. Procedia Food Science, 3: 190-199.
Kotan, R., et al. (2009): Biological control of the potato dry rot caused by Fusarium species using PGPR strains. Biological Control, 50 (2): 194-198.
Larkin, R. P. (2016): Impacts of biocontrol products on Rhizoctonia disease of potato and soil microbial communities, and their persistence in soil. Crop Protection, 90: 96-105.
Li, L., Zhang, Q., Huang, D. A (2014): A review of imaging techniques for plant phenotyping. Sensors, 14: 20078-20111.
Handsatech Instruments LTD (2006): Operations Manual, setup, installation & Maintenance: Handy PEA, Pocket PEA & PEA Plus Software.[Pamphlet] Narborough Road, Pentney, King's Lynn, Norfolk PE32 1JL, England [15-04-2018]
Majozi, T. and Veldhuizen, P. (2015): The chemicals industry in South Africa. CEP: 46-50
Mehring, A. S., et al. (2016): Soil invertebrates in Australian rain gardens and their potential roles in storage and processing of nitrogen. Ecological Engineering, 97: 138-143.
Morse, J. (n.d) General Standards/Core- Exam review. Available from: https://conference.ifas.ufl.edu/aw11/presentations/Wednesday/Session%20A/am/0800%20Morse.pdf. [01-04-2018]
Murchie, E. H. and Lawson, T. (2013): Chlorophyll fluorescence analysis: a guide to good practice and understanding some new applications. Journal of Experimental Botany, 64 (13): 3983-3998.
Nortjé, P. F. (2003): The South African seed potato industry. In: Niederwieser, J. G. (Ed.) Guide to Potato Production in South Africa. Pretoria: ARC-Roodeplaat Vegetable and Ornamental Plants Institute, pp. 103-108.
O'neil, R. J. and Obrycki, J. J. (2008): Introduction and augmentation of biological control agents. In: Radcliffe, E. B., et al. (Eds.) Integrated Pest Management: concepts, tactics, strategies and case studies. Cambridge University Press ed. p. 551.
Ordentlich, A., et al. (1990): Integrated control of Verticillium dahliae in potato by Trichoderma harzianum and captan. Crop Protection, 9 (5): 363-366.

55
Osibanjo, O., Bouwman, H., Bashir, N. H. H., Okond’Ahoka, J., Choong Kwet Yive, R., Onyoyo, H. A. (2002): Regionally based assessment of persistent toxic substances. (UNEP Chemicals). Switzerland. Sub-Saharan Africa regional report.
Paul, K. (2016): Screening and characterisation of plant physiological traits using photosynthetic and phenotyping tools. Diss. Szeged, Hungary: Faculty of Science and Informatics, University of Szeged.
Potato Certification Services (PCS) (n.d): Certification Scheme Protocol. Available from: http://potatocertification.co.za/certification/ [16-03-2018].
Potato South Africa (PSA) (2017). Potato Industry Research Strategy: 2014-17. Available from: http://www.potatoes.co.za/SiteResources/documents/Potato%20Indutry%20Research%20Strategy-2014.pdf [06-03-2018].
PSA (2016): Potato Industry Report 2015-2016. Potatoes South Africa, Potato Certification Scheme, Potato Laboratory Services, Prokon. 1-98
Quinn, L. P., de Vos, B. J., Fernandes-Whaley, M., Roos, C., Bouwman, H., Kylin, H., Pieters, R., Van den Berg, J. (2011) Pesticide use in South Africa: one of the largest importers of pesticides in Africa. In: Pesticides in the modern world- Pesticides Use and Management. Margarita Stoytcheva ed. p. 48.
Senés-guerrero, C., Torres-Cortés, G., Pfeiffer, S., Rojas, M., Schüßler, A. (2014): Potato-associated arbuscular mycorrhizal fungal communities in the Peruvian Andes. Mycorrhiza, 24: 405-417.
SFS 1998:204. Personal Data Act. In: Deparment of Justice Steyn, P. J. (2003): The origin and growth stages of the potato plant. In: Niederwieser, J. G. (Ed.) Guide to Potato Production in South Africa. Pretoria: ARC-Roodeplaat Vegetable and Ornamental Plant Institute, pp. 7-12.
Theron, D. J. (2003): The South African potato industry in perspective. In: Niederwieser, J. G. (Ed.) Guide to Potato Production in South Africa. Pretoria: ARC-Roodeplaat Vegetable and Ornamental Plant Institute, pp. 1-6.
Theron, D. J. and Mienie, N. J. J. (2003): An integrated approach to pest and disease management. In: Niederwieser, J. G. (Ed.) Guide to potato production in South Africa. Pretoria: ARC-Roodeplaat Vegetable and Ornamental Plant Institute, pp. 109-120.
Tiemens-hulscher, M., et al. (2013): Potato Breeding. A practical manual for the potato chain. (Aardappelwereld Magazine) The Hague.
University of Nevada Cooperative Extension (UNCE) (n.d): Integrated Pest Management. Available from: http://www.unce.unr.edu/programs/sites/ipm/. [18-03-2018]
Walter, A., et al. (2015): Plant phenotyping: from beam weighing to image analysis. Plant Methods, 11 (14): 2-11.
Wezel, A., Bellon, S., Doré, T., Francis, C., Vallod, D., David, C. (2009): Agroecology as a science, a movement and a practice. A review. Agronomy for Sustainable Development, 29 (4): 503-515.
Wharton, P. S. and Kirk, W. W. (2014): Evaluation of biological seed treatments in combination with management practices for the control of Fusarium dry rot of potato. Biological Control, 73: 23-30.

56
World bank and Trading economics (2014): South Africa- Agricultural Land (% of land area). Available from: https://tradingeconomics.com/south-africa/agricultural-land-percent-of-land-area-wb-data.html. [25-03-2018]
Appendices Appendix 1: List of pesticides applied on the plants at Moedersbond
Name Dosage to 40 litres of water Date of application
Selecron 80 ml 11/01/2018
Odeon 120 ml 11/01/2018
Hunter 20 ml 11/01/2018
Aquarite 5 30 ml 11/01/2018
Aphox 40 g 19/01/2018
Bellies 24 g 19/01/2018
Biomectin 30 ml 19/01/2018
Citrex-oil 80 ml 19/01/2018
Aquarite 5 30 ml 19/01/2018
Movento 12 ml 24/01/2018
Antracol 80 g 24/01/2018
Aquarite 7 30 ml 24/01/2018
Biscaya 32 Ml 06/02/2018
No Blight 80 g 06/02/2018
Aquarite 7 30 ml 06/02/2018
Steward 36 ml 13/02/2018
Deltathrin 40 ml 13/02/2018
Hydrobuff 160 ml 13/02/2018
Selecron 80 ml 02/03/2018
Odeon 120 ml 02/03/2018
Aquarite 5 30 ml 02/03/2018
Aphox 40 g 13/03/2018
Bellies 24 g 13/03/2018
Aquarite 5 30 ml 13/03/2018
Movento 12 ml 26/03/2018
Antracol 80 g 26/03/2018
Aquarite 5 30 ml 26/03/2018
Hunter 20 ml 05/04/2018
No Blight 80 g 05/04/2018
Biscaya 32 ml 05/04/2018
Aquarite 7 30 ml 05/04/2018
Profenafos 80 ml 11/04/2018
Mission 120 ml 11/04/2018
Aquarite 5 30 ml 11/04/2018
Aphox 40 g 18/04/2018
Bellies 24 g 18/04/2018
Aquarite 5 30 ml 18/04/2018
Movento 12 ml 25/04/2018

57
Antracol 80 g 25/04/2018
Aquarite 30 ml 25/04/2018
Biscaya 32 ml 03/05/2018
No Blight 80 g 03/05/2018
Aquarite 7 30 ml 03/05/2018
Appendix 2: questionnaire template
ARC QUESTIONNAIRE
Enumerator
Tel (work):
Mobile:
E-mail:
Questionnaire:
INFORMATION LEAFLET:
The main aim for this questionnaire is to get some insights in terms of farmer’s
perspectives and interest in mini tuber production.
The objectives of the research project:
The project aims to enhance and improve the conditions of production and value
addition of mini tuber production and thus, contribute to the food and nutritional
security of the farmers.
Please note, information provided will be treated with the highest degree of
confidentiality.
INTERVIEWER DECLARATION:
I, …Alba Saez………………………………………………………………declare that I have
asked this questionnaire as it has been laid out. I declare that all responses which have
been recorded are the true responses of the respondent and that I have fully checked
the questionnaire.

58
Signature: ……………………………………………………………………….
Date: ………………………………………………………………………………
PARTICIPANT CONSENT:
I, Name …………………………………………Surname:…………………………………………….,
agree to take part in the aforementioned survey. I understand that my responses will be
treated with confidentiality and that the outcomes of this survey will be presented to
relevant people within the agricultural sector. I further understand that I will not receive
any compensation for taking part in this study. I agree that you may take a photo of
myself in front of my house.
ID No……………………………………………………………………………….
Signature: ………………………………………………………………………...
Date: ………………………………………………………………………………
Contact Details: …………………………………………………………………
Address: …………………………………………………………………………….
Village: ……………………………………………………………………………..
District: ……………………………………………………………………………..
Local Municipality: ……………………………………………………………….
Ward…………………………………………………………………………………
Province: …………………………………………………………………………...
SECTION A: SOCIO ECONOMIC CHARACTERISTICS
No. Variables Code Selected
Code
A1 Gender 0= Female
1= Male
A4 Level of education 0=no formal education
1-12=Grade 1-12
13=Technician diploma/degree
14=University degree
15=Other post-matric qualifications
A5 Number of Household
members
Specify number ………….
A6 Marital status
1 = Single
2 = Married
3 = widowed
4 = cohabitation (staying with
partner)

59
5 = Other
A7 Land acquisition 1 = family land
2 = communal land
3 = Government lease
A8 Household language (Specify)………………………………
…….
A9 Sources of income (select
more than 1)
Social grants, family support,
temporary jobs, informal trade,
formal jobs, no income
A9.1 Household income per
month
Specify………………………………….
SECTION E: FARMING STATUS
E1 Is there active production
on farm
1 = Yes
2 = No
E2 Total Land size(ha) Specify
E3 Land size under production
(list commodities and land size)
commodities land size (ha)
E6 Farming experience (specify
in years)
Farm labour
Farm manager
Farm residence
Other specify
E7 Available functional farm
infrastructure (tick):
1)Electricity, 2)water pump,
3)centre pivot, 4)sprinkler
irrigation equipment,
5)reservoir, 6)tractor,
7)rotavator/bed maker,
mouldboard plough, cultivator,
disk plough, 8)storage cold
room, computer, printer,
9)tunnels, boom sprayer,10)
knapsack sprayer, 11)bakkie,
truck, trailer, 12)fence,
13)water tank
E8 Do you irrigate?
E8.1 Main water sources for
irrigation:
Municipal water, river/stream,
well, dam, rain, borehole,
lake/pond.
E9 Did you receive potato
production training?
If yes, specify year……………………………..
E10 Major production
challenges:
Lack of infrastructure, lack of
water, pest and diseases
damage the crops, lack of
customers/market, bad

60
weather conditions, costs of
inputs, lack of
knowledge/proper farming
skills, lack of labour
E13 Which month do you get
more harvest (tick more than
one month)
Jan Feb Mar April May Jun Jul Aug Sept Oct Nov Dec
E14 Which potato production
enterprise interest you
1=Seed production
2=Conventional potato
production
E15 Where do you get your
potato seeds (tick)
Buy from seed companies,
specify: ……..
Government subsidy
NGO’s
Produce own seeds
E16.1 How often do you get
them?
E17 which cultivars do you
plant?
Specify
………………………………………
E18 Do you know what mini
tubers are?
1=yes
2=no
E19 If so, have you considered
using them?
Why/Why not?
E20 What are the benefits of
using mini-tubers over potato
seeds or true potato seeds
(TPS)?
SECTION F: FINANCIAL INFORMATION
F1 What do you do with excess harvest: Sell (go to F1), give away for free, plant next
year…
F1.1 Where do you sell your produce (tick)
Farm gate, road side, local shops, FPMs…
F1.3 How do you transport produce to market?
Buyers, hired, own…
F1.6 What are your transport challenges?
Small size of transport, high costs, lack of
transport…
F1.7 How is the price for your
produce set
1= I set the price
2=negotiable
3=market driven
4=dictated by buyers
5=other specify
F2 Type of support the farm
receives (tick)
Monetary funds
Machinery (tractors, irrigation equipment, implements)
Training
Tools
Other specify
None
F3 farm expenses Water 1=<R2000

61
2=R2001-R4000
3=R4001-R6000
4=>R6001
5=not applicable
Electricity
Seeds
Fertilizers
Pesticides
Labour wages
Transport
Packaging materials
Machinery hire
F4 What are your market
challenges?
F5 Sources of farming information
Radio, local agricultural officers,
extension services, market agents,
information days
F6 Frequency of information
access (tick)
SECTION P: PERSONAL INTERESTS
P1 How do you rate condition of the farm 1=very poor
2=poor
3=fair
4=good
5=very good
P2 What is your purpose in doing
agriculture?
Feeding the family, feeding the family and
selling the surplus, selling the whole
harvest…
P3 What is your vision in agriculture?
To produce enough food to feed the family,
to become a commercial farmer…
P4 What are you currently doing to achieve
your goal?
P5 Are you satisfied with the way you do
agriculture?