New Acland
121
4. Land Resources
-
Upload
khangminh22 -
Category
Documents
-
view
1 -
download
0
Transcript of New Acland

4. Land Resources

New Acland Coal Mine Stage 3 Project – Environmental Impact Statement PAGE i
Contents 4. Land Resources 4-1
4.1. Existing Environment 4-1 4.1.1. Topography and Geomorphology 4-1 4.1.2. Climatology 4-3 4.1.3. Earthquakes 4-4 4.1.4. Extreme Climatic Conditions 4-4
4.2. Land Use and Tenure 4-4 4.2.1. Overview 4-4 4.2.2. Stock Routes 4-6 4.2.3. Planning Provisions 4-6 4.2.4. Strategic Cropping Land 4-16 4.2.5. Native Title and Cultural Heritage 4-18 4.2.6. Environmentally Sensitive Areas 4-19
4.3. Geology and Mineral Resources 4-19 4.3.1. Regional Geology 4-19 4.3.2. Local Geology 4-20 4.3.3. Geological and Stratigraphic Profiles 4-24 4.3.4. In-situ Coal Estimates 4-24
4.4. Soils 4-24 4.4.1. Soil Origins 4-24 4.4.2. Acid Sulphate Soils 4-24 4.4.3. Survey Methodology 4-25 4.4.4. Soil Analysis 4-3 4.4.5. Soil Mapping Units 4-7 4.4.6. Soil Conservation Plans 4-15 4.4.7. Forestry Products and Quarry Materials 4-15
4.5. Land Use Suitability 4-15 4.5.1. Agricultural Land Suitability 4-15 4.5.2. Pre-Mine Land Use Suitability 4-17 4.5.3. Good Quality Agricultural Land 4-30 4.5.4. Post-Mine Land Use Suitability 4-32 4.5.5. Adjacent Land Suitability 4-42
4.6. Site Contamination 4-42 4.6.1. Potential for Contamination 4-42 4.6.2. Sites in Acland 4-43 4.6.3. Acland Tip 4-47 4.6.4. Contamination Prevention and Control 4-50
4.7. Mine Waste Characterisation and Management 4-51 4.7.1. Study Area Stratigraphy 4-51 4.7.2. Mine Waste Materials Types and Lithology 4-52 4.7.3. Geochemical Sampling Programmes 4-53

New Acland Coal Mine Stage 3 Project – Environmental Impact Statement PAGE ii
4.7.4. Geochemical Analytical Programs 4-56 4.7.5. Geochemical Mine Waste Classification 4-58 4.7.6. Mine Waste Management 4-61 4.7.7. Mine Water Quality 4-62 4.7.8. Conclusion 4-63
4.8. Rehabilitation 4-64 4.8.1. Post Mining Land Use 4-64 4.8.2. Post Mine Land Form 4-64 4.8.3. Rehabilitation Strategy 4-66 4.8.4. Progressive Rehabilitation 4-70 4.8.5. Rehabilitation Success Criteria 4-71 4.8.6. Rehabilitation Maintenance 4-78 4.8.7. Revegetation 4-78 4.8.8. Topsoil Management 4-80 4.8.9. Erosion Potential and Control 4-84 4.8.10. Fossils 4-85 4.8.11. Decommissioning 4-85
4.9. Road Diversions 4-86 4.10. Rail Corridor 4-86 4.11. Conclusion 4-88 4.12. Summary of Mitigations Measures and Commitments 4-91

New Acland Coal Mine Stage 3 Project – Environmental Impact Statement PAGE 4-1
4. Land Resources This Chapter describes the existing environment, details the potential impacts on land resources as a result of the revised Project and prescribes mitigation measures to prevent or minimise these impacts.
4.1. Existing Environment
4.1.1. Topography and Geomorphology
The topography of the Study area consists of gentle slopes with elevation ranging from 430 m above sea level at Lagoon Creek in the south east of the revised Project site, to 525 m above sea level on the basaltic ridge that occurs across the Study area. Lagoon Creek drains the revised Project site via a broad, flat and poorly defined channel. Lagoon Creek is associated with an alluvial plain (Ison, 1999). The topography of the Study area is shown in Figure 4-1.
The revised Project site is located within the Lagoon Creek catchment. The majority of the terrain within this catchment is undulating and land use is predominantly grazing with areas of dryland cropping on better soil types during favourable seasons. Lagoon Creek is grazed and cultivated up to and within the creek channel. In the upper reaches of the catchment, the terrain becomes steeper and possesses tracts of remnant vegetation. Higher, localised peaks in the Lagoon Creek catchment are also vegetated with trees and scrubs.
The Lagoon Creek channel includes a number of in-stream farm dams which disrupt the natural flow regime. The main channel of the creek is poorly defined with significant erosion along the creek banks. The Condamine Landcare and Catchment Management group reports soil erosion, weeds, dryland salinity, loss of fertility and remnant vegetation decline (including tree loss) as the key issues affecting the catchment (CCMA, 2008). Chapter 5 provides a comprehensive assessment of the surface water resources of the revised Project. In addition, Chapter 8 provides an assessment of the revised Project and its impacts on the aquatic ecological values of Lagoon Creek.

"
!(
!(
!(
ML50
170
ML50
216
MLA5
0232
ML50
216
Manning Vale West Pit
Willeroo Pit
Manning Vale East Pit
W a rregoHighwa y
Jonda r
ya n-Muld
uRoa d
Pec hey-Ma c la ga n Roa d
Ac la n d-Sa b in e Roa d
Acla n
d-Muld
u Roa
d
Oa key-Cooya rRoad
Cain Creek
Oakey Creek
Doctors Creek
Lago on
Cr eek
SpringCreek
Jon da rya n
Ac la n d
Muldu
460
440
420
500
500480
460
520
420
440
500
380
460
460
400
420
540
520
520
500
480
480
460 48046
0
480
540520
380
420
480
500
440
480
440
500
380
500
460
440
460
460
480460
480
500
480
440
460
440
420
520
420
440
440
460
420
460420
440
365000
365000
370000
370000
375000
375000
697000
0
697000
0
697500
0
697500
0
698000
0
698000
0
698500
0
698500
0Pr
oduc
ed: 2
0/11/2
013
NEW ACLAND COAL MINE STAGE 3 PROJECT
Figure 4-1 - Study Area Topography
0 1 2 3 4Kilom etres
Projec tion : Austra lia n Geodetic Da tum – Zon e 56 (AGD84)1:97,500Sc a le on A4
Path:
\\skm
cons
ulting
.com\
BNEP
rojec
ts\QE
NV2\P
rojec
ts\QE
0664
4\Spa
tial\A
rcGIS
\01_F
igures
\01_S
EIS\
04_L
andR
esou
rces\1
3091
0_Ne
wHop
e_La
ndRe
sourc
es_F
igure4
-1_St
udyA
reaTo
pogr
aphy
.mxd
"
"
"
"
N ew Ac la n d
N T
SA
QLD
N SW
MACKAY
CAIRN S
ROCKHAMPTON
BRISBAN E
±LEGEND!( Town s a n d Loc a lities" Tra in Loa dout Fa c ility
Ra il SpurJon da rya n -Muldu Roa d DiversionCon toursRoa dsCreeksStoc k Route
Proposed Exten t of Surfa c e Rights AreaCoa l Resourc e AreaMin in g Ten em en tsSta ge 3 Pit Area sCHPP Prec in c tMa teria l Ha n dlin g Fa c ilityMin e In dustria l Area

New Acland Coal Mine Stage 3 Project – Environmental Impact Statement PAGE 4-3
4.1.2. Climatology
Meteorological data recorded by the Bureau of Meteorology (BoM) at Oakey has been reviewed to describe the existing meteorological and climatological influences for the revised Project site. Table 4-1 provides a summary of the temperature, humidity and rainfall data from the Oakey meteorological station.
Oakey typically has warm days during summer with average maximum daytime temperatures around 30°C falling to 18°C during the winter months. Overnight temperatures are generally cool all year round and cold during the winter months with average minimum daily temperatures of 3°C in July, rising to greater than 15°C between December and March.
Mean 9 am relative humidity is generally greatest during the months from February to July and least during September to December. Mean 3 pm relative humidity is generally lower than 9 am through the year, ranging from 34 % in September up to 47 % in February. The lowest 3 pm relative humidity is experienced between August to October.
Highest rainfall is generally recorded during summer months with monthly rain averages above 75 mm/month from November to February. Mean monthly rainfall generally drops off in late autumn and winter with average monthly rainfall less than 45 mm from March until September. However, it is common for no significant rainfall to occur during the winter period in some years.
Table 4-1 indicates that the highest rainfall and the greatest number of rain days generally occur during the warmer months from November through to February. Driest times of the year are typically June through to September and it is during this period that dust emissions from excavation and wind erosion from exposed areas would be greatest.
Table 4-1 Climatic summary for Oakey (BoM 041359)
Jan Feb Mar Apr May Jun Jul Aug Sep Oct Nov Dec Annual
Mean daily maximum temperature (°C)
30.8 30.0 28.8 25.9 22.3 19.0 18.5 20.2 23.8 26.6 28.5 30.3 25.4
Mean daily minimum temperature (°C)
17.8 17.6 15.7 11.9 8.1 4.0 2.7 3.6 7.1 11.3 14.2 16.5 10.9
Mean 9am relative humidity (%)
63 67 66 67 75 78 76 68 59 56 58 60 66
Mean 3pm relative humidity (%)
43 47 44 43 46 46 44 38 34 36 39 41 42
Mean monthly rainfall (mm)
78.8 83.2 44.6 33.7 41.2 29.9 30.2 25.6 31.1 58.5 76.8 94.3 627.8
Mean no. of rain days 5.9 4.8 4.3 3.2 3.6 3.2 3.5 3.1 3.8 5.5 6.3 6.4 53.6
Mean no. of clear days
3.9 4.3 7.4 8.1 8.5 9.4 11.8 12.9 11.8 9.3 6.5 4.6 98.5
Mean no. of cloudy days
5.4 6.8 6.0 5.1 6.3 5.6 5.4 4.1 3.7 6.4 6.2 5.1 66.1

New Acland Coal Mine Stage 3 Project – Environmental Impact Statement PAGE 4-4
Chapter 9 outlines the dispersion meteorology and wind roses associated with the Study area.
4.1.3. Earthquakes
The revised Project site is in an area of low earthquake risk. The area has an acceleration coefficient of 0.06, equivalent to a 1 in 500 year peak ground velocity of 45 mm/s. In comparison, the highest acceleration coefficient listed for Australia is 0.22 or 165 mm/s (Ison, 1999).
4.1.4. Extreme Climatic Conditions
Rainfall in the Study area is generally low to moderate. However, intense rainfall events have occurred in the past. The Study area experiences drought approximately every six years for an average duration of 20 months. The longest drought duration on record has been 35 months.
The vegetation at the revised Project site is dominated by cropping and grazing. Small scattered areas of remnant/regrowth vegetation remain along road reserves and drainage lines and on elevated areas, such as ridgelines and hill tops. The region experiences fires in the dry months and are usually of low intensity due to the low density of vegetation. Chapter 7 provides an overview and assessment of the terrestrial ecology values of the Study area.
The revised Project site is located approximately 133 km inland from the coast. Therefore, the potential for cyclonic activity to occur is remote. Extreme wind events can occur and are usually associated with thunderstorms. The weather station at Oakey has recorded 3 Category 2 cyclones and 1 Category 1 cyclone since 1974. Potential impacts from flooding have been assessed in Chapter 5.
4.2. Land Use and Tenure
4.2.1. Overview
The revised Project site has a history of grazing and small lot cropping. Allotment and paddock sizes are relatively small and access is generally restricted by a mosaic of boundary and paddock fencing. Within the Study area the former Rosalie Shire Council identified two proposed Key Resources Areas (KRAs), which are very close to the KRA that previously covered the current mining operations. These KRAs are presented in Appendix G.1.1. Predominant land use patterns of the revised Project site in addition to grazing of modified pastures have remained cash and forage cropping. Much of the revised Project site has long been cleared of its original vegetation due to agricultural production. Localised areas of original remnant vegetation remain alongside Lagoon Creek, relic alluvial plains and upland low hills. The revised Project site has been subject to long periods of continued dry years and unreliable rainfall since the early 1990’s.
The existing land uses surrounding the revised Project site comprise a mix of grazing, cropping and mining. The Warrego Highway is located approximately 14 km to the south of the revised Project site and is the main highway leading to the major regional centre of Toowoomba. Adjacent to the Warrego Highway is the Western Rail Corridor which services a variety of commercial and public purposes. The Oakey Army Aviation Centre is located approximately 9 km from the revised Project site and has been in operation since 1943. The revised Project surrounds the original underground mine workings

New Acland Coal Mine Stage 3 Project – Environmental Impact Statement PAGE 4-5
located in Acland. The Acland Coal Mine Museum holds a number of historical items that are significant to the region. The Acland Colliery Conservation Management Plan is presented in Appendix J.12.
There are ten National Parks and two conservation parks within a 50km radius of the revised Project site as described below.
Hampton National Park; Ravensbourne National Park; Tarong National Park; Crows Nest National Park; Lockyer National Park; Mount Binga National Park; Pidna National Park; The Palms National Park; Irongate Conservation Park; and Flagstone Creek Conservation Park.
State Forests located within a 50 km radius of the revised Project site include:
Deongwar State Forest; Geham State Forest; Googa State Forest; Pechey State Forest; Preseverance State Forest; Lockyer State Forest; and Yarraman State Forest.
Other recreational areas used by the public within the vicinity of the revised Project include, Lake Cressbrook which is located approximately 60 km to the north east and Lake Perseverance situated approximately 50 km in the same direction.
The majority of sensitive receptors are situated within a 5 km buffer distance from the revised Project’s surface rights areas. There are:
5 sensitive receptors located within a 1 km buffer distance; 40 sensitive receptors located within a 5 km buffer distance; and 44 sensitive receptors located within a 10 km buffer distance.
Oakey is located approximately 12 km south of the revised Project, Jondaryan is located approximately 14 km south-west of the revised Project site, with Goombungee located approximately 21 km east of the revised Project site. Acland is situated central to the revised Project site (within a 1 km buffer distance) and supports a population of less than 10 people. The proximity of mining operations to Acland are 2 km for the Manning Vale West pit and 1 km for the Manning Vale East pit.

New Acland Coal Mine Stage 3 Project – Environmental Impact Statement PAGE 4-6
The potential impacts associated with dust and noise from mining operations is presented in Chapter 9 and Chapter 11 respectively.
Local commercial services such as small workshops, general store and fuel supply have long ceased operation. The revised Project footprint provides a buffer zone around Acland as presented in Chapter 3. The land associated with the revised Project is predominately owned by the APC, including the majority of the land within Acland. APC was formed during 2006 to productively manage the agricultural land acquired to support the Mine and the implementation of the revised Project. The main focus of APC’s activities is to manage agricultural activities on company land both ahead of and behind the revised Project’s mine path.
This joint land management approach by NAC and APC allows continued agricultural production pre and post mining, which contributes to a more sustainable outcome and ensures that there is an economic imperative as well as environmental and social imperatives driving the revised Project’s rehabilitation success. APC also assists NAC with specific rehabilitation management activities, such as grazing trials, offset establishment trials, offset management and weed and pest management.
An extensive community consultation program has been undertaken for the revised Project and its impacts on the community. The details of the community consultation program are provided in Chapter 19. The settlement of Muldu is located at the northern boundary of the revised Project and comprises several houses mainly owned by the APC.
The land parcels contained within the revised Project site are predominantly freehold and leasehold tenures held by APC. These sites are generally used for cattle grazing and crop production.
4.2.2. Stock Routes
One stock route will potentially be affected by the revised Project, namely, the Jondaryan-Muldu Road, which is shown in Figure 4-1. NAC will consult with the relevant stakeholders, including DEHP, in relation to the realignment of the Jondaryan-Muldu Road and will ensure continuity and operability of the stock route. It should be noted that the Jondaryan-Muldu Road is an ‘inactive’ stock route that possesses no water facilities in the vicinity of the revised Project. NAC is not aware of any use of the Jondaryan-Muldu Road stock route in its 11 years of operation in the Acland district. NAC will liaise with the DEHP and other relevant government agencies to gain all relevant approvals in relation to the opening and closing of roads (including roads which are stock routes) and in land dealings relating to changes in land tenure.
4.2.3. Planning Provisions
This Section describes the land use planning provisions which relate directly to the revised Project.
Sustainable Planning Act and IDAS Related Matters The SP Act establishes the framework for planning and development assessment in Queensland. The SP Act also establishes the IDAS, which calls up other related legislation as appropriate. The SP Act does not apply to development (except for building works and development of a place listed under the Queensland Heritage Register) authorised under the MR Act. However, any development outside the area of the Mining Lease will require assessment under the SP Act if it is assessable development.
New Acland Coal Mine Stage 3 Project – Environmental Impact Statement PAGE 4-7
An activity authorised by the grant of a ML must be undertaken pursuant to an EA granted in accordance with the EP Act.
As the revised Project site is located within the TRC, development applications for assessable development off the mining lease (e.g. roads, powerlines) will be made where required to the TRC. Applications will be in accordance with the relevant provisions of the SP Act and the Toowoomba Regional Planning Scheme (the Planning Scheme) adopted on 20 March 2012 and enacted on 1 July 2012.
For the purposed of this EIS and notwithstanding the exemption for development authorised under the ML from regulation under the SP Act, an assessment of the consistency of the revised Project with land use designations under the applicable State Planning Policy (SPP), regional plans and the Planning Scheme has been undertaken.
State Planning Policies SPPs are statutory planning instruments that relate to matters of State interest. SPPs must be considered in the assessment of development applications lodged under the SP Act. Local Government planning schemes developed under the SP Act must reflect the elements outlined in a SPP.
As per Part 2 of the Planning Scheme, the Minister has identified that the following SPPs are appropriately reflected within the Planning Scheme:
SPP 1/02 Development in the Vicinity of Certain Airports and Aviation Facilities; SPP 1/92 Development and Conservation of Agricultural Land (Expired); SPP 2/07 Protection of Extractive Resources; SPP 4/10 Healthy Waterways; and SPP 5/10 Air, Noise and Hazardous Materials.
The Minister has identified that SPP 1/03 Mitigating the Adverse Impacts of Flood, Bushfire and Landslide is only partially reflected within the Planning Scheme, specifically those parts relating to bushfire and landslide. That part of the SPP relating to the adverse effect of flooding is not applicable to the revised Project as land is not subject to adverse flooding. SPP 1/12 Protection of Queensland’s Strategic Cropping Land is not reflected within the Planning Scheme. For the SPPs that are appropriately reflected in the Planning Scheme, the revised Project has been assessed against relevant Planning Scheme provisions. For SPP1/12, the provisions of the SPP have been addressed. The assessment is provided in Table 4-2.

New Acland Coal Mine Stage 3 Project – Environmental Impact Statement PAGE 4-8
Table 4-2 State Planning Policies
State Planning Policy
Applicability to the revised Project Response
SPP 1/02 Development in the Vicinity of Certain Airports and Aviation Facilities
The revised Project site is identified as being subject to the following (TRC Planning Scheme Development Constraints Overlay Map): 13 km Bird and Bat Strike Zone; and Obstacle Height Restriction Zone (Area
D 45 m and Area E 90m). The following provisions of the Airport Environs Overlay Code need to be considered for the revised Project: The height of buildings or other
structures does not affect the operational efficiency of the Toowoomba Airport or Oakley Army Aviation Centre or create a hazard to the safe navigation of aircraft using the airport.
The development of premises does not cause an obstruction or other potential hazard to aircraft movement associated with the airports by way of: bright surfaces or lighting, interfering with navigation or communication facilities or emissions that may affect visibility of aircraft.
Development and operational activities do not generate emissions within the airport obstacle limitation surface shown on the Airport environs overlay maps that may affect pilot visibility of aircraft operation.
The development of the premises does not cause an obstruction or other potential hazard to aircraft movement associated with the airport by way of attracting birds or bats to the area which could cause or contribute to bird-strike hazard.
Development does not adversely impact on the operational airspace of the Toowoomba Airport or Oakey Army Aviation Centre.
The revised Project site is located 11 km from the Oakey Army Aviation Centre. The highest component of the revised Project will be the out-of-pit dumps located adjacent to Manning Vale and Willeroo Mine Pits. The out-of-pit dumps, at its highest point will be 45 m above ground level. This height is well below the maximum height restrictions of 90 m. The Aviation Hazard Management Plan for the revised Project is located in Appendix J.17. Overall, the revised Project should not interfere with aviation operations of the Oakey Army Aviation Centre.

New Acland Coal Mine Stage 3 Project – Environmental Impact Statement PAGE 4-9
State Planning Policy
Applicability to the revised Project Response
SPP 1/03 Guideline: Mitigating the Adverse Impacts of Flood, Bushfire and Landslide
Parts of the revised Project site are identified as being subject to medium fire risk (TRC Planning Scheme Development Constraints Overlay Map) and as such the following provisions of the Bushfire Hazard Overlay Code within Part 8 of the Planning Scheme apply: Development is provided with an
adequate water supply for fire fighting purposes that is safely located or freely accessible.
Development maintains the safety of people by avoiding areas of High or Medium bushfire hazard.
Development maintains the safety of people and property by mitigating the risk through the siting of buildings.
Importantly, the areas of the revised Project site that are identified as being subject to medium fire risk are outside the pit areas. Furthermore, as discussed in Chapter 18, the following proposed controls will assist in minimising the risk of fire: Relevant site staff will complete fire safety
training during induction. Approved fire alarm, detection,
suppression and fighting system will be installed in consultation with fire control authorities.
NAC will liaise with landowners and local authorities with respect to fire breaks and on-going maintenance programs.
Limit ignition sources around refuelling and fuel storage areas.
Emergency response procedures. Coordination with external emergency
services. Provision of adequate fire fighting
equipment and water. The Mine currently sources potable water
for the site from basalt aquifers and is sourced from licensed groundwater bores on-site and treated by a Reverse Osmosis Water Treatment Plant. In the event that this water supply becomes contaminated, the system can be isolated and water will be sourced from Toowoomba or Dalby and trucked to site for consumption.
Implementation of the Emergency Management Plan located in Appendix J.15.

New Acland Coal Mine Stage 3 Project – Environmental Impact Statement PAGE 4-10
State Planning Policy
Applicability to the revised Project Response
SPP 1/12 Protection of Queensland’s Strategic Cropping Land
This SPP applies to development on SCL where lodging a Material Change of Use or Reconfiguration of a Lot application with TRC. No applications are required to be made to TRC at this time; however the following provisions under the SPP have been considered:
Permanent impacts on SCL or potential SCL are avoided to the greatest extent possible and minimised where the impacts cannot be avoided.
Where the impacts on SCL or potential SCL are temporary, the development is undertaken within a time limit appropriate to allow restoration of impacted SCL or potential SCL to its pre-development condition.
Refer to Section 0.
SPP 1/92 Development and the conservation of Good Quality Agricultural Land (This SPP has now expired)
The revised Project site is identified as good quality agricultural land for which the Good Quality Agricultural Land Overlay Code within the Planning Scheme stipulates the following provisions: Development does not reduce the
productive capacity of the land or result in conflict with nearby rural uses.
Non-rural uses, and rural uses which are not dependant on the agricultural quality of the land, are not located on good quality agricultural land.
The revised Project is considered to provide the following overriding public benefit: it allows the utilisation of the coal
resources of the State; it provides substantial employment
opportunities within the TRC region and elsewhere in Queensland;
it allows the continuation and expansion of a locally significant industry that provides substantial export income to the State;
it allows the continued utilisation of infrastructure associated with the Mine;
there is no alternative location on land of lesser agricultural quality as the Project’s location is dictated by the position of the coal reserves; and
the land is typical of the moderate to good quality grazing land in the region which forms part of a substantial grazing land resource.
In addition, the revised Project will maintain and generate economic activity across the TRC region and Queensland. Chapter 17 describes the economic benefits as a result of the revised Project. Section 4.5.4 provides an assessment of the impacts on GQAL as a result of the revised Project.

New Acland Coal Mine Stage 3 Project – Environmental Impact Statement PAGE 4-11
State Planning Policy
Applicability to the revised Project Response
SPP 2/07 Protection of Extractive Resources
Currently not applicable to the revised Project as the site is not identified as being within an Extractive Resource area (TRC Planning Scheme Natural Resources Overlay). However, a historical KRA for ML 50170 and ML 50216 is provided in Appendix G.1.1.
Not required.
SPP 4/10 Healthy Waterways
This SPP is aimed at mitigating the risks to water quality and waterway health from urban stormwater and waste water management when making decisions about new development. This SPP is mostly applicable to State and Local Governments when making or amending planning schemes and regional policies and has no provisions applicable to the revised Project site.
Not required.
SPP 5/10 Air, Noise and Hazardous Materials
Not applicable to the revised Project. Not required.
One single SPP, the State Planning Policy (SPP) has been developed to replace all current SPPs in order to simplify and clarify state interests. The SPP was released on 29 November 2013.The SPP will apply similarly to existing SPPs:
To local government in the making of a local planning instrument; To the assessment of a development application to the extent that the SPP is not idendified as
being appropriately reflected in the planning scheme; To land designated as community infrastructure by a Minister; To the making or amending of a regional plan; and To the assessment of development applications by the DSDIP responsible for administering the
SP Act.
Regional Planning Provisions There are two regional planning documents of relevance to the revised Project:
Darling Downs Regional Plan (the Regional Plan)– a statutory document which was released on 14 October 2013; and
Surat Basin Regional Planning Framework – a non-statutory document.

New Acland Coal Mine Stage 3 Project – Environmental Impact Statement PAGE 4-12
Similar to SPPs, statutory regional plans are to be reflected in the Planning Schemes. A discussion on the applicability of the Darling Downs Regional plan to the revised Project is provided below. The relevance of the non-statutory Surat Basin Regional Planning Framework is also discussed.
Darling Downs Regional Plan The Darling Downs Statutory Regional Plan provides strategic direction and policies to deliver outcomes which align with the State’s interests in planning and development for the Darling Downs Region. The Darling Downs Region includes the TRC and the Study area. The Regional Plan commenced on 18 October 2013. .
The Regional Plan aims to provide improved certainty for communities and business through specific land use mapping. Of particular relevance to the revised Project, the Regional Plan seeks to provide direction for the competing demands associated with the resources and agricultural industries through the introduction of Priority Agricultural Areas (PAAs), Priority Agricultural Land Uses (PALUs) and Priority Living Areas (PLAs).
The Regional Plan shows the Study area as being within a PAA. The following regional policies apply to development within a PAA:
protect PALUs within PAAs; and maximise opportunities for co-existence of resource and agricultural land uses within PAAs.
To implement these regional policies, PAAs have been mapped and PALUs within these PAAs need to be identified. PALUs mean a land use included in class 3.3, 3.4, 3.5, 4 or 5.1 under the Australian Land Use and Management Classification Version 7, May 2010. In general PALUs include land suitable for continual cropping, horticulture or irrigated agriculture.
The Regional Plan proposes that PALUs will be given priority in the consideration of resource industry proposal to ensure the continuation of the existing high value, intensive agricultural land uses is not threatened by the development of the resource industry.
The Regional Plan states that "PAA co-existence criteria enable compatible resource activities to co-exist with high-value agricultural land uses within PAAs. This will in turn maximise opportunities for economic growth to ensure that the Darling Downs remains a resilient, diversified and prosperous region." The coexistence criteria will be prescribed under future legislation.
The Regional Planning Interests Bill (the Bill) was introduced by the Queensland Government on 20 November 2013 The Bill integrates the policy objectives of the SCL Act by identifying SCL as areas of regional interest. The Bill has been referred to the State Development Infrastructure and Industry Committee for review. If that legislation is enacted the revised Project would require a regional interests authority. The legislation will be considered throughout the approval process for the revised Project.
Surat Basin Regional Planning Framework The purpose of the Surat Basin Regional Planning Framework (SBRPF) is to sustainably manage growth, in particular resource sector growth in the Surat Basin area. The study area of the SBRPF

New Acland Coal Mine Stage 3 Project – Environmental Impact Statement PAGE 4-13
covers parts of the Darling Downs and parts of the regional planning areas contained within the South East Queensland Regional and the Maranoa Balonne Region. While the SBRPF is not a statutory instrument, it is intended to influence local government planning schemes developed and implemented under the SP Act and community plans under the LG Act.
Toowoomba Regional Council The revised Project site is located within the TRC. The Planning Scheme includes the Region’s strategic plan and overarching planning provisions (including preferred land uses through zoning and overlay maps). Under the Planning Scheme, the revised Project site includes land predominantly in the Rural Zone, 100 ha Precinct, and also land in the Township Zone and in the Limited Development (Constrained Land) Zone. This is shown in Figure 4-2.
The purpose of the Rural Zone is to:
protect the productive capacity of all rural land for rural use; protect water quality and the ecological and hydrological processes of waterways and wetlands; protect the landscape character and its associated visual and scenic amenity; minimise the potential for conflict between rural uses and other uses; provide for the establishment of appropriately scaled agri and eco-tourism activities that are based
on farm life or primary production in the locality, or on the scenic or environmental values of the locality;
provide for intensive animal industries including feedlots, piggeries and poultry farms; and protect rural land from fragmentation that diminishes its productive capacity.
The overall outcome of the 100 ha Precinct within the Rural Zone is “that the productive, natural and landscape values of highly fragmented rural land are preserved by the prevention of further fragmentation” (Toowoomba Regional Planning Scheme, Part 6).
Acland is zoned as Township. The purpose of the Township Zone is to provide for small to medium-size service centres located within a rural area (Toowoomba Regional Planning Scheme, Part 6).
The purpose of the Limited Development (Constrained Land) Zone is to identify and limit development within land that is unsuitable for further development as a result of historic subdivisions which are remote, lack urban services or are otherwise unsuitable for additional development (Toowoomba Regional Planning Scheme, Part 6).As discussed in Section 4.2.1, two KRAs had been identified by the former Rosalie Shire Council within close proximity to the revised Project site indicating there intention to designate the area for resource extraction activities. The land use for the revised Project site will change due to the nature of the activity, however, NAC have developed comprehensive rehabilitation objectives to achieve the post mine land status of grazing. Therefore, there is the potential to return the land to its pre-mining state of predominately grazing over time.

!(
!(
!(
ML5 0
170
M L50
216
M LA5
023 2
M L50
216
Muldu
Sabine
Acland
Lagoon Creek
Cain Creek
Sprin
g Creek
Oake
y-Coo
yar R
oad
Jondar
yan-Muld
u Road
Aclan
d-Sab
ine R
oad
Aclan
d-Muld
u Roa
dPechey-Maclagan Road
Acland-Silverleigh Road
365000
365000
370000
370000
375000
375000
697500
0
697500
0
698000
0
698000
0
698500
0
698500
0Pr
oduc
ed: 1
2/12/2
013
NEW ACLAND COAL MINE STAGE 3 PROJECT
Figure 4-2 - Land use designation under the TRC planning scheme
0 1 2 3 4Kilometres
Projection: Australian Geodetic Datum - Zone 56 (AGD84)1:68,000Scale on A4
Path:
\\skm
cons
ulting
.com\
BNEP
rojec
ts\QE
NV2\P
rojec
ts\QE
0664
4\Spa
tial\A
rcGIS
\01_F
igures
\01_S
EIS\
04_L
andR
esou
rces\1
3121
1_Ne
wHop
e_La
ndRe
sourc
es_F
igure4
-2_TR
CPlan
ningS
chem
e.mxd
±LEGEND!( Towns and Localities
Rail SpurRoadsCreeksJondaryan-Muldu Road Diversion
Mining TenementsToowoomba Planning Scheme
RuralTownshipLimited Development (Constrained Land)

New Acland Coal Mine Stage 3 Project – Environmental Impact Statement PAGE 4-15
While the revised Project is not contemplated by the Rural Zone, the revised Project will deliver many community benefits including for instance:
it allows the utilisation of the coal resources of the State; it provides substantial employment opportunities within the TRC region and elsewhere in
Queensland; it enables the continuation and expansion of a locally significant industry that provides substantial
export income to the State; it enables the continued utilisation of infrastructure associated with the Mine; there is no alternative location on land of lesser agricultural quality as the revised Project’s
location is dictated by the position of the coal reserves; and the land is typical of the moderate to good quality grazing land in the region which forms part of a
substantial grazing land resource. The revised Project has been designed and configured to protect Acland, which is zoned as Township. Although it is not expected that Acland will serve as a viable small centre during the life of the Mine, the land would be conserved for future development.
The two locations zoned as Limited Development (Constrained Land) located in the vicinity of the revised Project reflect historic subdivisions intended for the development of townships. It is not expected that these localities would develop in the future, as identified in the purpose of the zone. It is considered that the revised Project’s influence on the Rural Zone would apply to the Limited Development (Constrained Land) Zone.
A comprehensive economic assessment of the revised Project is presented in Chapter 17. No major approvals are required under the Planning Scheme for the revised Project, as it is exempt from assessment against a planning scheme under Schedule 4 of the Sustainable Planning Regulation 2009. However, some off-lease infrastructure such as road diversions and pipelines may be subject to the provisions of the Planning Scheme. In this instance any necessary development permits would be sought from TRC separately to the revised Project’s EIS process, prior to construction and operation. A Regulatory Approvals Plan for the revised Project is located in Appendix C.
New Acland Coal Mine Stage 3 Project – Environmental Impact Statement PAGE 4-16
4.2.4. Strategic Cropping Land
The SCL Act commenced on 30 January 2012. The objectives of the SCL Act are to:
protect land that is highly suitable for cropping; manage the impacts of development on that land; and preserve the productive capacity of that land for future generations.
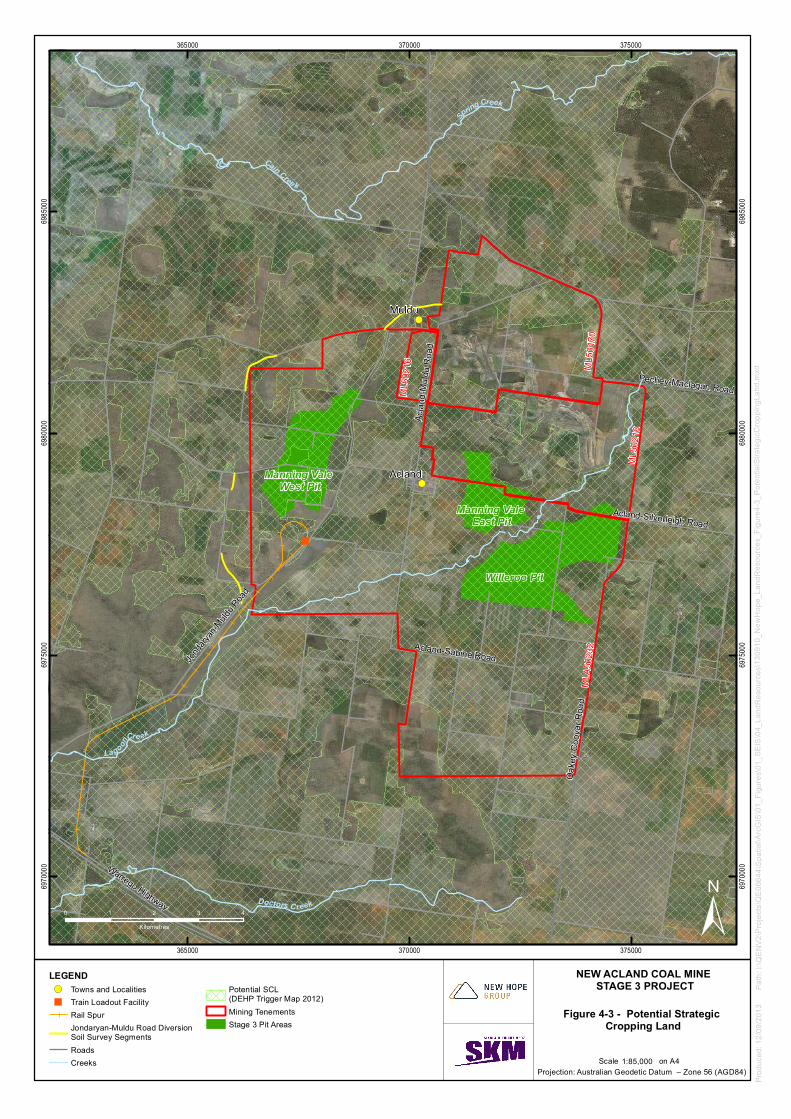
Within the revised Project there are areas mapped as potential SCL as defined under Section 25 of the SCL Act. These areas are shown in Figure 4-3. The revised Project site is located within the Eastern Darling Downs Zone and is in a protection area under the SCL Act. Under the SCL Act permanent impacts cannot be approved in areas mapped as potential SCL if that potential SCL is in the southern protection area (section 94 known as the permanent impact restriction). However, as a certificate of application for MLA 50232 was issued on or before the 23 August 2012 for a contiguous area to the existing mining leases, the mining lease application and its related EA amendment application is excluded from the 'permanent impact restriction'.
NAC must however apply for an SCL protection decision which may impose conditions in the EA to minimise any temporary impacts and mitigate any permanent impacts (where disturbance is unavoidable) on potential SCL. The revised Project will impact upon up to approximately 1,361 ha of land mapped as potential SCL. This impact on potential SCL has been reduced by approximately 2,336 ha as a result of the revised Project’s footprint decreasing from that proposed as part of the original proposal.
NAC plans to undertake further soil surveys in areas within MLA 50232, which have been mapped as potential SCL and which are proposed to be disturbed by the revised Project. This work will support an SCL validation application. The results of the SCL validation will be used to confirm the extent of SCL that will be temporarily or permanently impacted by the revised Project. Appropriate mitigation measures including compensation will subsequently be included in the revised Project’s SCL Protection Decision application.
Areas of land to be disturbed outside MLA 50232 include the rail corridor and road diversion. A number of activities are exempt from the SCL Act, including the construction or maintenance of roads, development relating to specified transport infrastructure, which includes rail transport infrastructure and the construction or maintenance of certain electricity infrastructure. These exempt activities are further detailed in Appendix C.
"
!(
!(
ML5
0170
ML5
021 6
MLA
5023
2
ML5
0216
Manning Vale West Pit
Willeroo Pit
Manning Vale East Pit
Warrego Highway
Jond
arya
n-Muld
u Road
Acland-Silverleigh Road
Pechey-Maclagan Road
Oak
ey-C
ooya
r Roa
d
Acla
nd-M
uldu
Roa
d
Acland-Sabine Road
Cain Creek
Spring Creek
Doctors Creek
Lago on
Cre ek
Acland
Muldu
365000
365000
370000
370000
375000
375000
6970
000
6970
000
6975
000
6975
000
6980
000
6980
000
6985
000
6985
000
Pro
duce
d: 1
2/09
/201
3
NEW ACLAND COAL MINE STAGE 3 PROJECT
Figure 4-3 - Potential Strategic Cropping Land
0 1 2 3 4
Kilometres
Projection: Australian Geodetic Datum – Zone 56 (AGD84)1:85,000Scale on A4
Pat
h: I:
\QE
NV
2\P
roje
cts\
QE
0664
4\S
patia
l\Arc
GIS
\01_
Figu
res\
01_S
EIS
\04_
Land
Res
ourc
es\1
3091
0_N
ewH
ope_
Land
Res
ourc
es_F
igur
e4-3
_Pot
entia
lStra
tegi
cCro
ppin
gLan
d.m
xd
±LEGEND!( Towns and Localities
" Train Loadout FacilityRail SpurJondaryan-Muldu Road Diversion Soil Survey SegmentsRoadsCreeks
Potential SCL (DEHP Trigger Map 2012)Mining TenementsStage 3 Pit Areas
New Acland Coal Mine Stage 3 Project – Environmental Impact Statement PAGE 4-18
4.2.5. Native Title and Cultural Heritage
The only statutory Aboriginal party for the whole of the area of MDL 244, including those areas out of which MLs 50170 and 50216 have been granted and MLA 50232 is being sought, comprises those people who together were the registered native title claimant for the former Western Wakka Wakka People native title claim. In accordance with section 87 of the ACH Act, NAC will require an approved CHMP for the revised Project unless an exemption applies under section 86 of the ACH Act. One such exemption would be triggered if the revised Project were the subject of an ‘existing agreement’ for the purposes of the ACH Act.
In this regard, NAC possesses a signed ‘Co-operation Agreement’ with the Western Wakka Wakka People dated 15 October 2003. This Co-operation Agreement applies to the land within MDL 244, which encompasses MLs 50170, 50216 and MLA 50232. NAC also has a signed CHMP with the Western Wakka Wakka People dated 14 July 2006, which also applies to the land within MDL 244. All documents between NAC and the Western Wakka Wakka People are confidential and will only be discussed in general terms for the purpose of the EIS.
In relation to clearance/collection activities, NAC initially conducted three major activities involving the Traditional Owner group to facilitate mining operations on ML 50170. These clearance/collection activities were conducted under permits administrated by the previous CR Act. All subsequent clearance/collection activities on ML 50170 and more recently ML 50216 have been dealt with under the ACH Act. Clearance/collection activities are normally conducted on an as required basis to ensure a minimum buffer of 6 to 12 months clearance ahead of mining activities. Elsewhere on MDL 244, other minor clearance/collection activities may be conducted on an as required basis for activities, such as drilling. The Western Wakka Wakka People has been involved in clearance/collection activities.
NAC also proposes to develop with the Western Wakka Wakka People Aboriginal party, and have approved, a replacement CHMP under Part 7 of the ACH Act for the revised Project (including the rail spur). NAC's intention is for this CHMP to be the sole instrument governing the management of Aboriginal cultural heritage that may be affected by activities carried out both for the revised Project within the boundaries of MDL 244 and for the proposed rail spur.
Analyses undertaken for the route of the rail spur and the area of MLA 50232 indicate that native title has been extinguished over the whole of these areas. In the circumstances, the proposed grant of the mining leases and of any other statutory approvals or tenure for the revised Project will be valid from a native title perspective.

New Acland Coal Mine Stage 3 Project – Environmental Impact Statement PAGE 4-19
4.2.6. Environmentally Sensitive Areas
Environmentally Sensitive Areas (ESAs) refers to locations, however large or small, that have environmental values that contribute to maintaining biological diversity and integrity have intrinsic or attributed scientific, historical or cultural heritage value, or are important in providing amenity, harmony or sense of community.
The vegetation within the revised Project site is in a generally degraded condition. This state is primarily due to prolonged stress from drought, high levels of grazing by cattle over a long period and extensive road and track construction. The level of disturbance varies across the revised Project site. Of the 11 regional ecosystems identified within the revised Project site, four are listed as a threatened ecological community under the EPBC Act. Nine ecological communities were identified as endangered or of concern under the VM Act.
The closest area of National Heritage to the revised Project site with sensitive environmental values is the Jondaryan East Roadside Remnant Grassland located approximately 5 km to the south between the townships of Oakey and Jondaryan. Other National Heritage Registered Sites within close proximity to the revised Project site include the Jondaryan Homestead Outbuildings, the Jondaryan Woolshed, the Jondaryan Post Office (former) and the St Anne’s Anglican Church; all located approximately 13 km to the southwest of the revised Project site. These sites are identified as either a Registered Place or Indicative Place or on the Register of National Estate.
The closest RAMSAR listed wetlands is Moreton Bay, which lies immediately east of Brisbane and approximately 133 km to the east of the revised Project site. Chapter 7 provides an assessment of the impacts from the revised Project on ESAs.
4.3. Geology and Mineral Resources
4.3.1. Regional Geology
The revised Project site lies within the Cecil Plains Sub-Basin which is located within the western portion of the Clarence-Moreton Basin. In Queensland, the Clarence-Moreton Basin merges with the Surat Basin. The Kumbarilla Ridge is a basement high consisting of the Upper Devonian to Upper Carboniferous Texas beds and separates the Cecil Plains Sub-Basin of the Clarence Moreton Basin, from the Surat Basin. The Clarence-Moreton Basin represents an eastern portion of the Mesozoic GAB. In this portion, major aquifers of the GAB comprise the Marburg Sandstone and Helidon Sandstone. The Walloon Coal Measures is also considered to form a GAB aquifer.
The economic coal-bearing sediments of the Surat and Clarence-Moreton basins occur in the Walloon Coal Measures. The Walloon Coal Measures are Middle to Upper Jurassic in age and are a part of the Injune Creek Group. Although the Kumbarilla Ridge is considered to structurally separate the Clarence-Moreton Basin from the Surat Basin, the Walloon Coal Measures occur on both sides of the Kumbarilla Ridge and are laterally continuous between the Clarence-Moreton Basin and the Surat Basin.

New Acland Coal Mine Stage 3 Project – Environmental Impact Statement PAGE 4-20
The Injune Creek Group cannot be identified as a distinct unit in the western Clarence-Moreton Basin. However it is broken up into a productive coal bearing lower unit, the Walloon Coal Measures, and a coal resource barren upper unit, the Kumbarilla Beds.
Within the revised Project site, the major coal bearing unit within the Walloon Coal Measures is referred to as the Acland-Sabine Sequence. The Acland-Sabine Sequence occurs in the lower coal bearing unit (Taroom Coal Measures equivalent) of the Walloon Coal Measures.
Tertiary Basalts unconformably overlie the Walloon Coal Measures in some areas of the revised Project site. The Tertiary age was a period of intense volcanic activity during which the eroded palaeosurface of the Walloon Coal Measures was covered with basalt flows. Basalt filled palaeo-channels occur within the north western and southern margins of the current Mine’s Central and Southern Pits. Quaternary age alluvium is associated with present day natural drainage channels within the region. Chapter 6 provides a detailed assessment of regional geology.
4.3.2. Local Geology
The local geology of the Study area is described below.
Quaternary Deposits Quaternary deposits consist of recent alluvium deposited by creeks and rivers. Within the revised Project site, these deposits are only likely to occur in association with the Lagoon Creek catchment in the west of the revised Project site.
Tertiary Basalt The Tertiary Basalt unconformably overlies the Walloon Coal Measures in several localities within the revised Project site. Remnants of Tertiary age basalt flows occur on hill tops, and show that the basalt formed as low lying horizontal continuous flows within palaeochannels eroded into the Walloon Coal Measures palaeosurface. Given the depositional environment, it is likely that in some locations the elevation of the base of the basalt flows lies below the elevation of the top of the older Walloon Coal Measures formation lying adjacent to the basalt flow, such that the basalt and coal measures in part lie at similar depths. Following basalt deposition, preferential erosion of the softer Walloon Coal Measures around the channelled basalt flows has resulted in the elevated basalt remnants currently seen at the revised Project site.
The presence of weathered basalt below fresh basalt, in combination with relict soil profiles and sedimentary layers interbedded with the flows, indicates that there has been a succession of basalt flows within the revised Project site. Evidence of two to three distinct flows have been observed during drilling investigations. There is some outcrop of the Tertiary Basalt in the northern section of the Study area, but only very minor outcrop within the proposed western pit (Manning Vale West pit) area.
Borehole logs show that the basalt thickness is highly variable within the revised Project site. In general, whilst basalt extent and thickness is shown to be highly variable, it is known to become more prolific and widespread immediately west of the revised Project site.

New Acland Coal Mine Stage 3 Project – Environmental Impact Statement PAGE 4-21
Walloon Coal Measures The Walloon Coal Measures are around 120 m to 130 m thick across most of the revised Project site, although planned mining activities are limited to the base of the economically recoverable coal reserves lying less than 75 m below ground level at their deepest point. Chapter 3 outlines the mine plan for the revised Project.
The three major coal intervals identified within the lower Walloon Coal Measures (Taroom Coal Measures equivalent) are the Waipanna, Acland-Sabine, and Balgowan. The Mine currently extracts coal from the Acland-Sabine interval within the lower Walloon Coal Measures. The Acland-Sabine interval contains six seam groups. From the top to bottom these are nominated as A to F. Each seam group contains up to 10 seam plies. Seam plies are discrete layers of coal within a seam group. In total, the Acland-Sabine interval has 47 seam plies. The average thickness of an individual seam ply is 0.23 m. Individual seam plies are unlikely to extend great lateral distances, but rather form isolated pods of coal.
The Waipanna interval contains six seam groups which contain 53 seam plies. The Balgowan interval contains seven seam groups which contain 21 seam plies. The regional dip of the Walloon Coal Measures is one to three degrees south-southwest. Local variations of both dip and strike occur due to both folding and faulting. The general geological structure of the revised Project site can best be described as a fault modified southwesterly plunging syncline, with the fold axis centred on the Lagoon Creek drainage channel.
Faulting is known to have occurred from observations made from underground mines in the Acland area and has also been interpreted from drilling results and from the existing open cut. Faulting is developed along two main trends, northeast-southwest and northwest-southeast; however east-west faults with significant throws have also been observed in the mine pits.
Marburg Sandstone The Marburg Sandstone is typically around 200 m to 300 m thick at the revised Project site and regionally dips to the southwest. The unit outcrops 3 km northeast of the Mine, however at the revised Project site the unit lies at a depth of approximately 150 m below ground surface and 75 m below the base of the current and proposed mine workings. The Marburg Sandstone is made up of poorly sorted, coarse to medium-grained, feldspathic sublabile sandstone and fine-grained, well sorted quartzose sandstone. Minor carbonaceous siltstone, mudstone, coal and rare pebble conglomerate also occur within the Marburg Sandstone.
Evergreen Formation The Evergreen Formation is a dominantly finer grained unit than the overlying and underlying Marburg and Helidon sandstones, and is generally up to 200 m thick in the Study area. As described above, the boundary is transitional with the overlying Marburg Sandstone which may be responsible for the Evergreen Formation not being described separately in some parts of the Clarence Moreton Basin. The Evergreen Formation has been described on the 1:250 000 Geology Map of Ipswich (Geological Survey of Queensland, 1980) as consisting of sandstone, siltstone, shale, mudstone and oolitic ironstone.

New Acland Coal Mine Stage 3 Project – Environmental Impact Statement PAGE 4-22
Helidon Sandstone The Helidon Sandstone is up to 170 m thick and is extensive within the Cecil Plains Sub-Basin of the Clarence-Moreton Basin. The unit is generally found at depths of between 500 m and 600 m below ground level at the revised Project site, however the sandstone is known to outcrop near the township of Helidon located approximately 50 km southeast of the revised Project site. The Helidon Sandstone can be divided into two sections, an upper section of interbedded shale and sandstone with kaolinitic clays that is difficult to distinguish from the Evergreen Formation, and a lower section of fine to very coarse quartz sandstone.
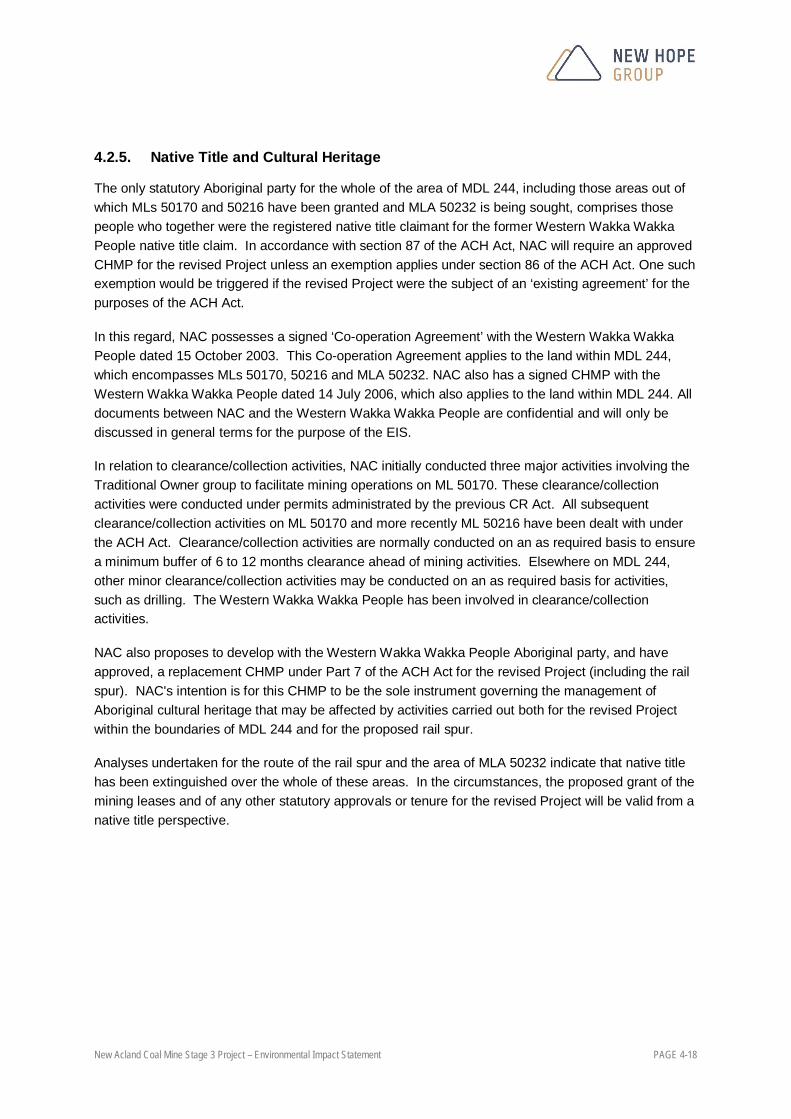
Texas Beds The Upper Carboniferous Texas Beds consist of greywacke, conglomerate, siltstone, mudstone, slate, local phyllite, chert, basalt, limestone and rare tuff. Generally, the Texas Beds are rich in felsic volcanic detritus which were derived from an active magmatic arc to the west. The Texas Beds are low grade regionally metamorphosed and variably deformed. Chapter 6 provides a detailed assessment of regional and local geology. Figure 4-4 depicts the geology of the Study area.
!(
!(
ML5
0170
ML5
021 6
MLA
5 023
2
ML5
0216
Manning Vale West Pit
Willeroo Pit
Manning Vale East Pit
Warrego Highway
Jond
arya
n-Muld
u Road
Acland-Silverleigh Road
Pechey-Maclagan Road
Acland-Sabine Road
Oak
ey-C
ooya
r Roa
d
Oakey-Cooyar Road
Acla
nd-M
u ldu
Roa
d
Acland
Muldu
Qa
QaJbm
JbmTQs
Tm
Tm
Jbm
Jw
Jw
Tm
TQs
Jw
Tm
Jw
Tm
Tm
Jw
365000
365000
370000
370000
375000
375000
6970
000
6970
000
6975
000
6975
000
6980
000
6980
000
6985
000
6985
000
Pro
duce
d: 1
2/09
/201
3
NEW ACLAND COAL MINE STAGE 3 PROJECT
Figure 4-4 - Study AreaGeology
0 1 2 3 4
Kilometres
Projection: Australian Geodetic Datum – Zone 56 (AGD84)1:85,000Scale on A4
Pat
h: I:
\QE
NV
2\P
roje
cts\
QE
0664
4\S
patia
l\Arc
GIS
\01_
Figu
res\
01_S
EIS
\04_
Land
Res
ourc
es\1
3091
0_N
ewH
ope_
Land
Res
ourc
es_F
igur
e4-4
_Geo
logy
.mxd
±LEGEND!( Towns and Localities
Jondaryan-Muldu Road Diversion Soil Survey SegmentsRoadsMining TenementsStage 3 Pit Areas
Dominant GeologyBasalt (Tm)Alluvium (Qa)Colluvium (TQs)Walloon Subgroup (Jw)Marburg Sandstone (Jbm)

New Acland Coal Mine Stage 3 Project – Environmental Impact Statement PAGE 4-24
4.3.3. Geological and Stratigraphic Profiles
The geological and strategic profiles for the Project site are presented in Appendix G.1.2.
4.3.4. In-situ Coal Estimates
The NHG’s coal reserves and resource statement as required by the JORC is presented in Appendix G.1.3. The total JORC reserves that exist within the existing Mining Leases, along with MLA 50232 are approximately 407.1 Mt. The total coal tonnes identified to be mined as part of the revised Project is 191.4Mt. Hence the total amount of coal that will not be mined as part of the revised Project is 215.7 Mt of RoM coal. All of which exists within the MLA 50232 area. The coal beneath Acland (approximately 18 Mt) and the coal beneath Lagoon Creek (approximately 29 Mt) will be sterilized.
4.4. Soils
4.4.1. Soil Origins
A complex of soil types have developed on the gently undulating topography of the Study area in which climate, topographical position and old sedimentary periods with more recent volcanic activity have played an important role in the formation of the soil mass. Most prominent types are the deep, heavy clay alluvia, lighter clay ‘scrub soils’ and well-structured texture contrast soils which occur on undulating plains. Areas of sandy non cracking clays and sandy duplex soils also occur. The basic soil attributes have been governed essentially by the influences of the Walloon sandstones or basalt bed rock. The land is used or has been used for dryland cropping and the major underlying soils for this purpose include basalt clays, cracking earths and alluvium.
4.4.2. Acid Sulphate Soils
Acid Sulphate Soils (ASS) covers approximately 2.3 million hectares of land in Queensland and occur naturally along the coast usually where land elevation is less than 5 metres AHD. These soils affect urban, transport, tourism, agricultural and industrial land uses. The exposure of ASS to oxygen (e.g. by drainage, excavation or filling) results in production of sulfuric acid and toxic quantities of aluminium and other heavy metals, in forms that can be commonly released into waterways. The acid corrodes concrete and steel infrastructure and, together with the metal contaminants, can kill or damage fish, other aquatic organisms, native vegetation and crops (DNRM/DLGP, 2002).
As discussed in Section 4.1.1, the topography of the Study area consists of gentle slopes with elevation ranging from 430 m above sea level at Lagoon Creek in the south east of the revised Project site, to 525 m above sea level on the basaltic ridge that occurs across the Study area. Therefore, it is extremely unlikely that the revised Project will be impacted by the effects of ASS at any stage throughout its life. An assessment of ASS in accordance with the QASSIT Technical Manual and the SPP (State Planning Policy 2/02 Guideline: Acid Sulfate Soils (DNRM 2002b).is therefore not required for the revised Project.

New Acland Coal Mine Stage 3 Project – Environmental Impact Statement PAGE 4-25
4.4.3. Survey Methodology
Two soil surveys have been completed for the revised Project. This included a soil survey within MLA50232 in 2007 and a soil survey for the proposed rail corridor and road diversion in 2013. For the purpose of the describing these surveys in this Chapter the soil survey of MLA50232 is referred to as “the Mining Area” and the rail corridor and road diversion as “the Road and Rail Corridor”.
Mining Area Soils in the Mining Area were mapped at an approximate scale of 1:25 000 in line with methods described by Gunn et al (1988) which involved greater than four observation sites per 100 ha. This scale was selected as most appropriate for the detailed evaluation of topsoil resources for the Mining Area. In addition, land suitability assessments were conducted to document pre-mining and post-mining conditions. Initially, available background information was examined and air photo mosaics of the Mining Area were mapped to delineate proposed soil units on the basis of similar topographic and vegetative patterns.
A brief reference-mapping phase was conducted to develop a draft soil type map legend and document the expected soil variation within the Mining Area. This phase was followed by a detailed site sampling program to verify soil types and define boundaries. The program covered the majority of the Mining Area with minor pockets being inaccessible due to extensive paddock and holding fencing. Overall, soils were able to be examined and collected to sufficiently represent the Mining Area.
Free survey techniques (Gunn et al 1988) were used to verify soil types and boundaries. Free survey is a commonly used method in agricultural land assessment as it enables flexibility in the site selection process to achieve a more accurate and time effective result. It was particularly appropriate in this survey as topographic, vegetative and soil associations were quite uniform across most of the revised Project site.
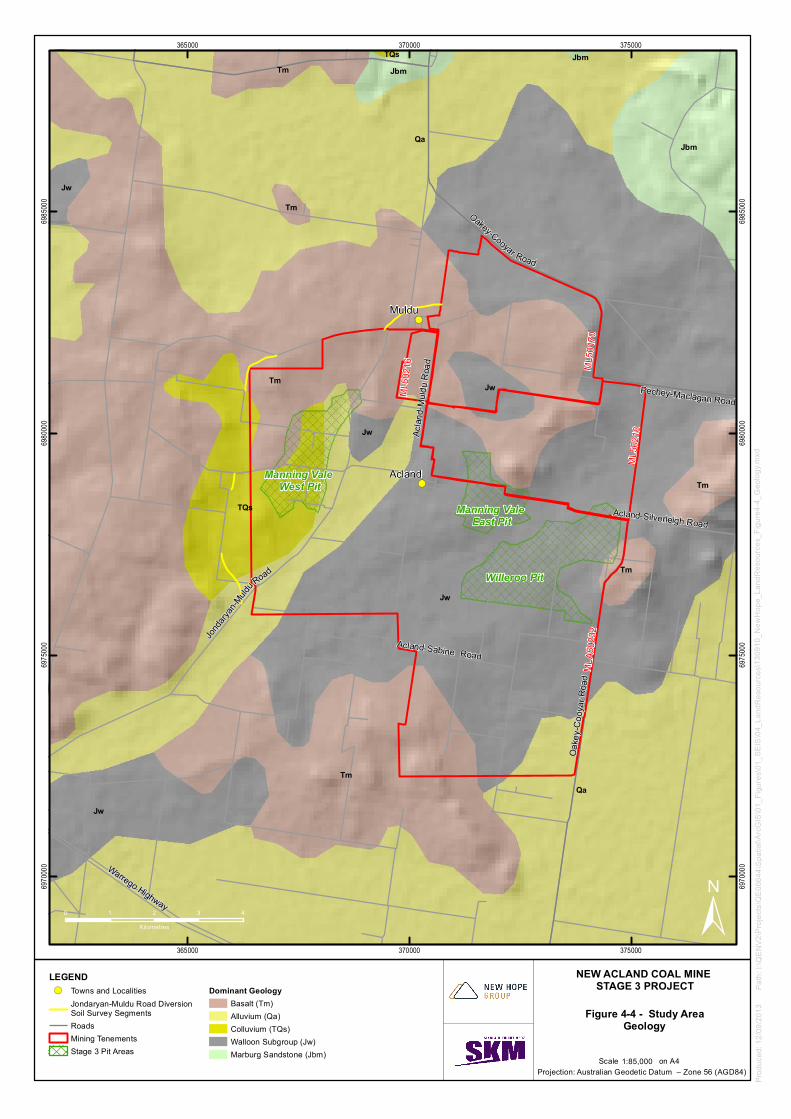
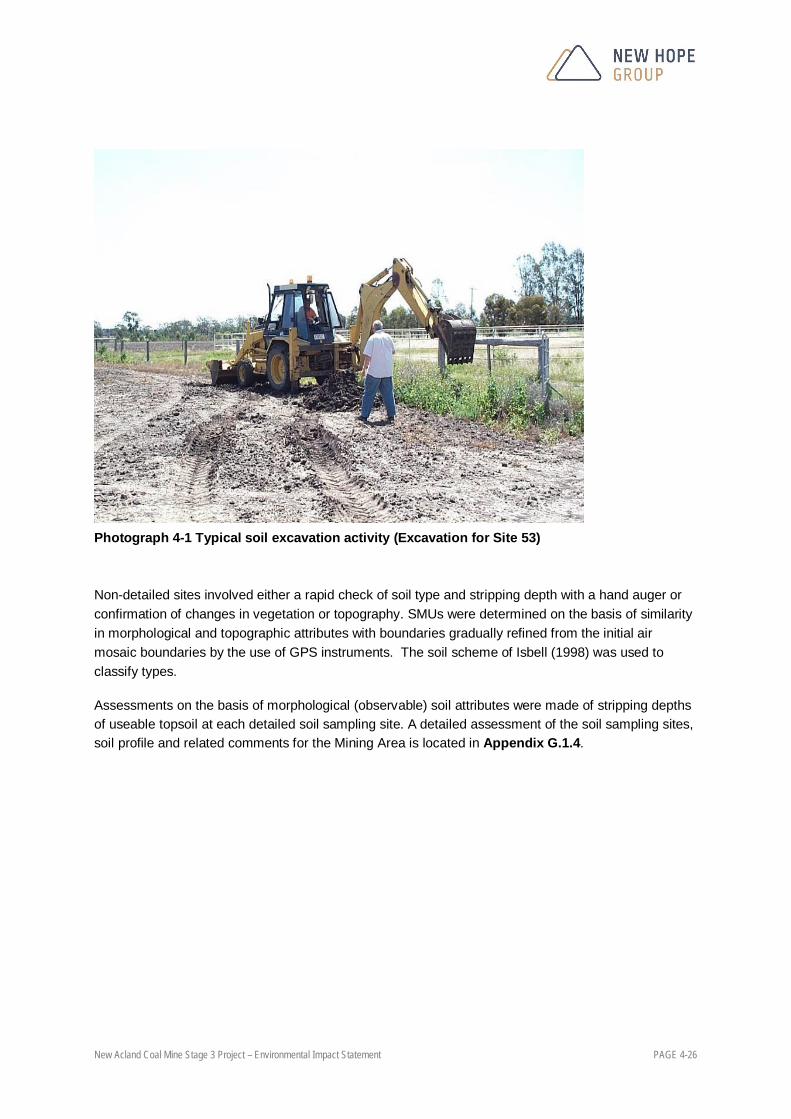
Field mapping involved a total of 170 site descriptions of which 67 (39 %) were detailed. These sampling sites were spread across the Mining Area to characterise all landform elements and geological units. The sites are shown in Figure 4-5. A backhoe with a 100 cm wide bucket was utilised wherever access was available for the field sampling. A hand augur was utilized to enable detailed soil profile descriptions where access was limited by wet conditions, intact fencing or active cropping. Soil pits and/or cuttings were used to better describe subsoil structure and substrate where possible. Shallow excavations using a spade were also made to assist with refining soil boundaries. Aerial imagery and detailed basalt mapping was also useful in determining broad soil and topographical differences. Photograph 4-1 depicts a typical sampling site.
New Acland Coal Mine Stage 3 Project – Environmental Impact Statement PAGE 4-26
Photograph 4-1 Typical soil excavation activity (Excavation for Site 53)
Non-detailed sites involved either a rapid check of soil type and stripping depth with a hand auger or confirmation of changes in vegetation or topography. SMUs were determined on the basis of similarity in morphological and topographic attributes with boundaries gradually refined from the initial air mosaic boundaries by the use of GPS instruments. The soil scheme of Isbell (1998) was used to classify types.
Assessments on the basis of morphological (observable) soil attributes were made of stripping depths of useable topsoil at each detailed soil sampling site. A detailed assessment of the soil sampling sites, soil profile and related comments for the Mining Area is located in Appendix G.1.4.
##
#
#####
##
## ##
# #
#
##
# ### ##
##
#####
## #
## #
# #
##### ###
# ## # ###
###
# ## ### #
### ### ## # # #
#
### ## ### ### #
## # # # #
### #### ## ## ##
####
# ##
# #
#
#
#
#
#
#
#
#
##
#
#
#
#
#
#
#
!(
!(
9
8
7
6
5
4
3
2
1
17
16
15
14
13
12
11
10
Muldu
Acland
Jond
arya
n-M
uldu R
oad
Acla
nd-S
abin
e R
oad
Acla
nd-M
u ldu
Roa
d
Lagoon
Cre
ek
Doctors Creek
9
84
57
6
99 11
95979394
96
98 92
9190
8788 8189 80
82
83 13
12 6984
1417
1615
85
1886
19 2079
21 23
22 7824 25 2677
27
292845
3132 3033
34 35 36 37
4240
106107
108109110
111
114113 112116
115117
101100 104
103105129125
122124 123 128121119120 102118
130133132131155 156
165 134135
154
137161157
160 159158
147153170
146152
145164
166
148
149
362000
362000
364000
364000
366000
366000
368000
368000
370000
370000
372000
372000
6970
000
6970
000
6972
000
6972
000
6974
000
6974
000
6976
000
6976
000
6978
000
6978
000
6980
000
6980
000
6982
000
6982
000
Pro
duce
d: 1
2/09
/201
3
NEW ACLAND COAL MINE STAGE 3 PROJECT
Figure 4-5a - Soil Sampling Sites
0 0.5 1
Kilometres
Projection: Australian Geodetic Datum - Zone 56 (AGD84)1:60,000Scale on A4
Pat
h: I:
\QE
NV
2\P
roje
cts\
QE
0664
4\S
patia
l\Arc
GIS
\01_
Figu
res\
01_S
EIS
\04_
Land
Res
ourc
es\1
3091
0_N
ewH
ope_
Land
Res
ourc
es_F
igur
e4-5
a_S
oilS
ampl
ingS
ites.
mxd
"
"
"
Jondaryan
Acland
Muldu
±LEGEND!( Towns and Localities# Soil Survey Locations
Rail SpurJondaryan-Muldu Road Diversion Soil Survey SegmentsRoads
CreeksMining TenementsStage 3 Pit Areas

## #
#### ##### ## ##
## ## # ## ##
# ###
#
# ## #### ### ### # #
####
##### # ## ###
## # ## #
# ### # #
# # ###### #### ## ### # ## # # ## ## # ####
## ## ## #
## ##
## ### ## # # ##
### ## ### ### #
## # # # #
### #### ## ## ##
####
# ##
# #
#
#
#
##
#
#
#
#
#
#
#
!(
!(
9
8
7
6
17
16
15
14
13
12
11
10
Muldu
Acland
Oak
ey-C
o oya
r Roa
d
Jond
arya
n-M
uldu R
oad
Acla
nd-S
abin
e R
oad
Acla
nd-M
u ldu
Roa
d
Lagoon Creek
Spr ing Creek
9
84
57
36
21
99 11
95979394
96
98 92
9190
8788 8189 80
8267
686683 13
706512 69 64 638472
1417
1615 6261
8573
6018
8619 20 59 71
7974
5821 23 52
7557
22 78 7624 25 2677 5651
27
552928
45 4644 483132 47304933 50
4334 35 36 37 385453
394142
40
106107
108109110
111
114113
112116115
117
101100 104
103105129125
122124 123 128121119120 102118
130133132131155 156
165 134135
154136 139
138137161157
160 159158169140147
153170146 151152
145 163164 168
141
167150
162166
143
148
149
Acland-Silverleigh Road
Pechey-Maclagan Road
366000
366000
368000
368000
370000
370000
372000
372000
374000
374000
6972
000
6972
000
6974
000
6974
000
6976
000
6976
000
6978
000
6978
000
6980
000
6980
000
6982
000
6982
000
6984
000
6984
000
Pro
duce
d: 1
2/09
/201
3
NEW ACLAND COAL MINE STAGE 3 PROJECT
Figure 4-5b - Soil Mapping Units
0 0.5 1
Kilometres
Projection: Australian Geodetic Datum - Zone 56 (AGD84)1:60,000Scale on A4
Pat
h: I:
\QE
NV
2\P
roje
cts\
QE
0664
4\S
patia
l\Arc
GIS
\01_
Figu
res\
01_S
EIS
\04_
Land
Res
ourc
es\1
3091
0_N
ewH
ope_
Land
Res
ourc
es_F
igur
e4-5
b_S
oilS
ampl
ingS
ites.
mxd
"
"
"
Jondaryan
Acland
Muldu
±LEGEND!( Towns and Localities# Soil Survey Locations
Rail SpurJondaryan-Muldu Road Diversion Soil Survey SegmentsRoads
CreeksMining TenementsStage 3 Pit Areas

New Acland Coal Mine Stage 3 Project – Environmental Impact Statement PAGE 4-3
Road and Rail Corridor The survey methodology for the Road and Rail Corridor is similar in many aspects to the survey of the Mining Area. A combination of integrated and free survey techniques was adopted for the survey (McKenzie et al. 2008). Free survey is a conventional form of soil survey efficient for medium scale investigations. The integrated survey component was based on aerial photography interpretation of the landscape and correlations between soil, landform, parent material and vegetation which enabled large areas to be mapped efficiently (Hewitt et al. 2008).
The field survey was conducted at a scale and frequency of approximately 1 site per 1000 linear m. The sites were located on or as near to the Road and Rail Corridor as possible. In each case, interpretation of aerial terrain patterns and topography indicated good compatibility with the landforms on the proposed route.
The field survey involved investigating a total of 17 detailed site descriptions along the route. These sites are shown in Figure 4-5. Sites were chosen for detailed description based on existing soil mapping identified during the desktop study, terrain pattern, position in the landscape and associated vegetation.
Sampling for site descriptions involved the use of a drill-rig mounted on the rear of a light vehicle. The drill-rig advanced a 50 mm diameter push-tube into the soil to a depth of 1m to 1.5 m or practical refusal to extract intact soil materials. Where the push-tube method was not possible, the site was sampled by manual augering. Where soil depth was sufficient, detailed sites considered most representative of the Road and Rail Corridor were sampled at pre-determined depths of 0 m - 0.1 m, 0.2 m - 0.3 m, 0.5 m - 0.6 m, 0.8 m - 0.9 m, 1.0 m -1.1 m. These nominated sampling depths only changed when they crossed an existing soil horizon boundary. A 500 g soil sample was taken at sites selected for laboratory analysis at each of the nominated depths.
A detailed assessment of the soil sampling sites, soil profile and related comments for the Road and Rail Corridor are located in Appendix G.1.5.
4.4.4. Soil Analysis
Mining Area Primary topsoil is the uppermost layer of soil used in site rehabilitation. It is salvaged from the surface horizons of areas to be disturbed, is relatively stable, contains seeds and micro-organisms and is relatively fertile. Secondary topsoil (if used) is placed directly in contact with waste rock and may be obtained from subsurface soil horizons, including weathered rock.
Topsoil was examined to determine its physical and chemical properties. The main chemical properties analysed included pH, electrical conductivity (EC1:5), phosphorus and exchangeable sodium percentage (ESP). Physical properties such as permeability and drainage characteristics were inferred from soil profile morphological characteristics such as concretions, depth to rock, observed root depth, colour and mottling. Typical depths of primary and secondary topsoil were determined using DME (1995) guidelines, site data and experience with similar soil types used in the existing rehabilitation strategy for the Mine.
New Acland Coal Mine Stage 3 Project – Environmental Impact Statement PAGE 4-4
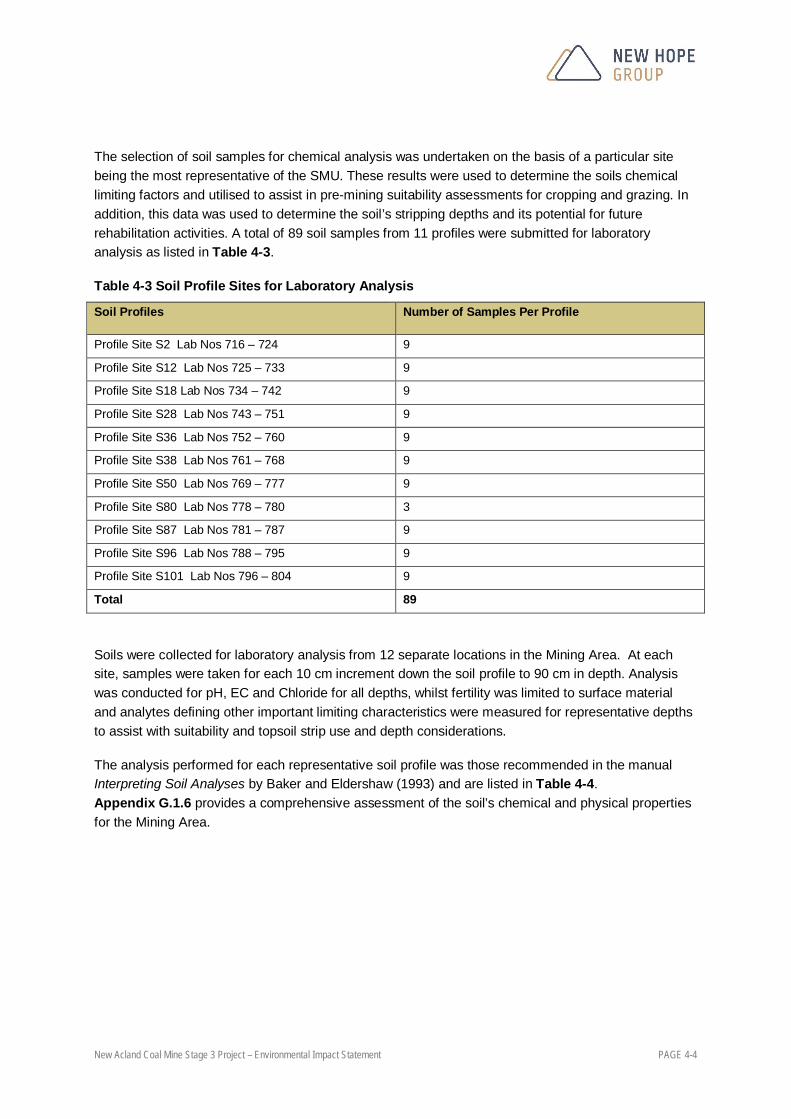
The selection of soil samples for chemical analysis was undertaken on the basis of a particular site being the most representative of the SMU. These results were used to determine the soils chemical limiting factors and utilised to assist in pre-mining suitability assessments for cropping and grazing. In addition, this data was used to determine the soil’s stripping depths and its potential for future rehabilitation activities. A total of 89 soil samples from 11 profiles were submitted for laboratory analysis as listed in Table 4-3.
Table 4-3 Soil Profile Sites for Laboratory Analysis
Soil Profiles Number of Samples Per Profile
Profile Site S2 Lab Nos 716 – 724 9
Profile Site S12 Lab Nos 725 – 733 9
Profile Site S18 Lab Nos 734 – 742 9
Profile Site S28 Lab Nos 743 – 751 9
Profile Site S36 Lab Nos 752 – 760 9
Profile Site S38 Lab Nos 761 – 768 9
Profile Site S50 Lab Nos 769 – 777 9
Profile Site S80 Lab Nos 778 – 780 3
Profile Site S87 Lab Nos 781 – 787 9
Profile Site S96 Lab Nos 788 – 795 9
Profile Site S101 Lab Nos 796 – 804 9
Total 89
Soils were collected for laboratory analysis from 12 separate locations in the Mining Area. At each site, samples were taken for each 10 cm increment down the soil profile to 90 cm in depth. Analysis was conducted for pH, EC and Chloride for all depths, whilst fertility was limited to surface material and analytes defining other important limiting characteristics were measured for representative depths to assist with suitability and topsoil strip use and depth considerations.
The analysis performed for each representative soil profile was those recommended in the manual Interpreting Soil Analyses by Baker and Eldershaw (1993) and are listed in Table 4-4. Appendix G.1.6 provides a comprehensive assessment of the soil’s chemical and physical properties for the Mining Area.

New Acland Coal Mine Stage 3 Project – Environmental Impact Statement PAGE 4-5
Table 4-4 Range Of Laboratory Analyses Performed On Representative Profiles
Soil Test Parameter* P 0-10 cm
P 10-20 cm
P 20-30 cm
P 30-40 cm
P 40-50 cm
P 50-60 cm
P 60-70 cm
P 70-80 cm
P 80-90 cm
pH (1:5 Water) X X X X X X X X X
EC, (1:5 Water) X X X X X X X X X
Cl*, (1:5 Water) X X X X X X X X X
Cations (Alcoholic, pH 8.5)
X X X X
CEC X X X X
ESP X X X X
NO3-N, (1:5 Water) X
Org. Carbon X
Sulfate - S X
Bicarbonate P X
B, Cu, Zn, Mn, Fe (trace elements)
X
% ADM X X X X
PSA (particle size distribution)
X X X
-1500 kPa (wilting point) 15 Bar X X X
Dispersion Ratio. R1 (Dispersion Rating)
X X X
Road and Rail Corridor The soil analysis for the Road and Rail Corridor is similar to the Mining Area survey soil analysis. The selection of soil samples for laboratory analysis was undertaken on the basis of a particular site being the most representative of the SMU. These results were used to determine the soils chemical and physical limiting factors and utilised to assist in pre-mining suitability assessments for cropping and grazing. In addition, the data was used to determine the soil’s stripping depths and its potential for future rehabilitation activities.
To enable full profile characterisation and evaluation of major limiting soil factors to agricultural use, 11 detailed sites, 43 individual samples were submitted for laboratory analysis by the National Association of Testing Authorities accredited ALS laboratory in Brisbane. The soil profile sites for laboratory analysis are summarised in Table 4-5.

New Acland Coal Mine Stage 3 Project – Environmental Impact Statement PAGE 4-6
Table 4-5 Soil Profile Sites for Laboratory Analysis
Soil Profiles Number of Samples Per Profile
Profile Site 1 Lab No. EB1318018 001-005 5
Profile Site 3 Labs No. EB1318018 024-028 5
Profile Site 4 Labs No. EB1318018 029-033 5
Profile Site 6 Labs No. EB1318018 043 1
Profile Site 7 Labs No. EB1318018 006-010 5
Profile Site 8 Labs No. EB1318018 034-038 5
Profile Site 10 Lab No. EB1318018 042 1
Profile Site 11 Lab No. EB1318018 014-018 5
Profile Site 13 Lab No. EB1318018 019-023 5
Profile Site 15 Lab No. EB1318018 039-041 3
Profile Site 17 Lab No. EB1318018 011-013 3
Total 43
Where soil depth was sufficient, detailed sites considered most representative of the Study area were sampled at pre-determined depths of 0 m - 0.1 m, 0.2 m - 0.3 m, 0.5 m - 0.6 m, 0.8 m - 0.9 m, 1.0 m -1.1 m. These nominated sampling depths only changed when they crossed an existing soil horizon boundary. Analysis was conducted for pH, EC and Chloride for all depths. Fertility analysis was undertaken for surface material.
The analysis performed for each representative soil profile was those recommended in the manual Interpreting Soil Analyses by Baker and Eldershaw (1993) and are listed in Table 4-6. Appendix G.1.5 provides a comprehensive assessment of the soil’s chemical and physical properties for the Road and Rail Corridor.

New Acland Coal Mine Stage 3 Project – Environmental Impact Statement PAGE 4-7
Table 4-6 Range Of Laboratory Analyses Performed On Representative Profiles
Soil Test Parameter* P 0-10 cm P 20-30 cm P 50-60 cm P 80-90 cm P 100-110 cm
pH (1:5 Water) X X X X X
EC, (1:5 Water) X X X X X
Cl*, (1:5 Water) X X X X X
Sulfate – S X X X X X
Exchangeable Cations X X X X X
CEC X X X X X
Chloride X X X X X
Organic Matter X - - - -
Bicarbonate P X - - - -
B, Cu, Zn, Mn, Fe (trace elements) X - - - -
Sodium X - - - -
Potassium X - - - -
Total Nitrogen X - - - -
PSA (particle size distribution) X X X X -
4.4.5. Soil Mapping Units
The Central Darling Downs region which includes the revised Project site has been the focus of a range of land resource investigations and surveys over a long period. The most recent and comprehensive source of land resource information is contained in Harris et al. (1999), Central Darling Downs Land Management Manual. This manual correlates information from previous studies to establish a consistent standard for the description of soils and land resources with the Central Darling Downs region. Another relevant report sourced for this assessment was Vandersee, B.E. (1975) Land Inventory and Technical Guide Eastern Darling Downs.
A review of the available information focused on identifying the range of soil types which could be expected to occur within the revised Project site. This process was completed by the following actions:
Reviewing Harris et al (1999) to isolate Land Resource Areas (LRA’s) described for the revised Project site and the range of soil types which occur in each. A soil legend was then produced which was subsequently refined during the course of field sampling. LRA’s for the revised Project site include:
large areas of grey brown cracking clay uplands formed on Walloon Sandstones; significant areas of self-mulching black clays on undulating rises and low hills on Walloon
sandstone; smaller areas of reddish brown clay loams on level plains; minor areas of loamy sodosols in drainage lines; and creeks and brown dark clays on low hills.

New Acland Coal Mine Stage 3 Project – Environmental Impact Statement PAGE 4-8
Reviewing the Soil Survey Report completed by Shell Coal Australia Ltd in 1999. This Report includes comprehensive soil morphological and analytical data from 96 detailed site observations and adjoins the survey area along the north-eastern boundary. Soil types described in this Report were aligned to those described for the Project.
Examining airborne geological survey data which has identified the extent of sub-exposed basalt flows within the revised Project site. The field mapping phase of this survey subsequently delineated in-situ basaltic soil boundaries which were found to be consistent with the existing data outlining the polygons for basalt flow.
The soil mapping task in some situations identified boundaries which are not entirely clear as inter-fingering of different and varied soil attributes has occurred. Therefore, in some instances, a single SMU included separate soils which occur in limited association. Nevertheless, the scale of soil sampling conducted in this survey has been accurately identified to the extent of various soil types.
Mining Area The soil survey of the Mining Area identified a total of 12 soil types which include two variants. A soil variant may possess attributes which are somewhat different from the mainstream soil attributes but either cannot be mapped out at this scale or do not constitute any significant deviation from the agricultural suitability or basic soil morphology. The variants in this survey are for the high quality agricultural soil B1 and cover situations of reduced soil depth (shallow variant) or areas of increasing slope (upland variant). These variants are of minor occurrence but are noted as they have slightly reduced agricultural suitability. Figure 4-6 displays the soil distribution for the revised Project site. The SMUs for the Mining Area have been developed on the basis of similarity in morphology, laboratory data, original vegetation, and topographic position and are outlined in Appendix G.1.7.

#
#
#
#
#
#
#
#
##
#
#
#
#
#
#
#
##
#
#####
##
## ##
# #
#
##
# ### ##
##
#####
## #
## #
# #
##### ###
# ## # ###
###
# ## ### #
### ### ## # # #
#
### ## ### ### #
## # # # #
### #### ## ## ##
####
# ##
# #
!(
!(
A1
B1
A1
BA3
BA3
BA2
A1
Muldu
Acland
Jondaryan-Muldu Road
Acla
nd-S
abin
e R
oad
Acla
nd-M
u ldu
Roa
d
Lagoon
Cre
ek
Doctors Creek
362000
362000
364000
364000
366000
366000
368000
368000
370000
370000
372000
372000
6970
000
6970
000
6972
000
6972
000
6974
000
6974
000
6976
000
6976
000
6978
000
6978
000
6980
000
6980
000
6982
000
6982
000
Pro
duce
d: 1
2/09
/201
3
NEW ACLAND COAL MINE STAGE 3 PROJECT
Figure 4-6a - Soil Mapping UnitsRoad and Rail Corridor
0 0.5 1
Kilometres
Projection: Australian Geodetic Datum - Zone 56 (AGD84)1:60,000Scale on A4
Pat
h: I:
\QE
NV
2\P
roje
cts\
QE
0664
4\S
patia
l\Arc
GIS
\01_
Figu
res\
01_S
EIS
\04_
Land
Res
ourc
es\1
3091
0_N
ewH
ope_
Land
Res
ourc
es_F
igur
e4-6
a_S
oilM
appi
ngU
nits
.mxd
"
"
"
Jondaryan
Acland
Muldu
±LEGEND!( Towns and Localities# Soil Survey Locations
Rail SpurJondaryan-Muldu Road Diversion Soil Survey SegmentsRoads
CreeksMining Tenements
Soil TypesA1A2A3
A4A5B1
B1VB2B3
B4BA1BA2BA3

#
#
#
##
#
#
#
#
#
#
#
## #
#### ##### ## ##
## ## # ## ##
# ###
#
# ## #### ### ### # #
####
##### # ## ###
## # ## #
# ### # #
# # ###### #### ## ### # ## # # ## ## # ####
## ## ## #
## ##
## ### ## # # ##
### ## ### ### #
## # # # #
### #### ## ## ##
####
# ##
# #
!(
!(
A1
A1
BA3
BA3
BA2
A1
B1
A1
B4B3
A2
A1
B2
BA1
B4
A2
A3
A5
B3
A4
BA1
B1V
BA2
BA3
B4
BA3
B2
BA3
BA3
BA3
BA3
BA2
BA3
A1
BA3
BA3
BA3
Muldu
Acland
Oak
ey-C
o oya
r Roa
dJond
arya
n-M
uldu R
oad Ac
land
-Sab
ine
Roa
d
Acla
nd-M
u ldu
Roa
d
Lagoon Creek
Spr ing Creek
Acland-Silverleigh Road
Pechey-Maclagan Road
366000
366000
368000
368000
370000
370000
372000
372000
374000
374000
6972
000
6972
000
6974
000
6974
000
6976
000
6976
000
6978
000
6978
000
6980
000
6980
000
6982
000
6982
000
6984
000
6984
000
Pro
duce
d: 1
2/09
/201
3
NEW ACLAND COAL MINE STAGE 3 PROJECT
Figure 4-6b - Soil Mapping UnitsMining Area
0 0.5 1
Kilometres
Projection: Australian Geodetic Datum - Zone 56 (AGD84)1:60,000Scale on A4
Pat
h: I:
\QE
NV
2\P
roje
cts\
QE
0664
4\S
patia
l\Arc
GIS
\01_
Figu
res\
01_S
EIS
\04_
Land
Res
ourc
es\1
3091
0_N
ewH
ope_
Land
Res
ourc
es_F
igur
e4-6
b_S
oilM
appi
ngU
nits
.mxd
"
"
"
Jondaryan
Acland
Muldu
±LEGEND!( Towns and Localities# Soil Survey Locations
Rail SpurJondaryan-Muldu Road Diversion Soil Survey SegmentsRoads
CreeksMining Tenements
Soil TypesA1A2A3
A4A5B1
B1VB2B3
B4BA1BA2BA3

New Acland Coal Mine Stage 3 Project – Environmental Impact Statement PAGE 4-11
Table 4-7 compares soils described in the local vicinity by Shell Coal Australia (1999) and Harris et al (1999) with those described in the survey undertaken for the Mining Area.
Table 4-7 Relationship between Study area Soils* & Other Surveys
Project Survey (2007) Shell (1999) Harris et al (1999)
Alluvial Plains
A1 Old Alluvial Plains of dark grey brown deep well-structured cracking clays over dark grey brown heavy clay subsoil.
NSG** LRA’s 3a, 2c Soil Type : Waco Deep dark brown to black cracking clays >100 cm deep with self-mulching surface. Broad level old alluvial plains of basaltic colluviums.
A2 Deep Grey brown uniform clay over hard yellowish brown alkaline subsoils.
NSG LRA 3a Mywybilla Deep coarse structured cracking clays on mixed sediments.
A3 Thin sandy alluvial plain on alkaline coarse structured dark brown subsoil.
NSG LRA’s 3a, 2c Cecilvale Very deep clay on mixed sediments. Salty with depth. Oakey - Thin T/C, 20 cm red brown loamy over brown clay on mixed sediments.
A4 Fine thin dark brown sandy loam over hard reddish brown clay subsoil.
NSG LRA 3a Downfall Greyish brown fine sandy loam over dark yellowish brown medium clay with columnar structure. Below 30 cm yellowish red mottled clay with ironstone pebbles.
A5 Recent alluvia Lagoon Creek.
Alluvial clays in drainage ways
LRA 3a Cecilvale or Condamine Very deep clay on mixed sediments. Possibly saline below 50 cm.
Gently undulating clay plains on sandstone and mixed sediments
B1 and shallow variant and steep upslope variant
Deep, dark grey brown well structured, self-mulching and cracking softwood scrub soils on undulating plains.
Dark cracking clays on sediments (upper slopes)
LRA 6a Edgefield Dark and deep cracking and self-mulching medium clay on gently undulating plains overlies brown heavy clay below 60 cm. Possibly saline below 80 cm.
B2 Dark brown cracking self-mulching Brigalow and Belah clays over firm red brown clay sub soils.
Dark Cracking clays in situ on sediments
LRA 6a Edgefield As above
B3 Thin dark cracking and duplex dark grey soils over hard yellowish brown alkaline subsoils. on sandstone.
possibly Red and black clays basaltic influenced on colluvium
LRA 6a Walker Duplex with dark, loamy clay (10-20 cm) over dark grey brown hard clay becoming pale and highly alkaline below 60 cm on sandstone from 130 cm on Walloon sandstone. Possibly saline below 60 cm.

New Acland Coal Mine Stage 3 Project – Environmental Impact Statement PAGE 4-12
Project Survey (2007) Shell (1999) Harris et al (1999)
B4 Thin red brown sandy clay loam or light clays on hard alkaline red brown clay subsoil on mixed sediments.
Reddish non cracking and lesser cracking clays on sediments
LRA 6a Acland Non cracking sandy red brown clay moderately deep on mixed sediments and sandstone. Possibly saline below 80 cm depth.
Soils on basalt
BA1 Fine brown light clay over well-structured red brown medium clays over hard brown clay or weathered basalt Mountain Coolibah.
Shallow and mid depth cracking clays on basalt
LRA 7b Aubigny Shallow to moderately deep (to 70 cm) brown to reddish brown light clays over red clay subsoil on basalt.
BA2 Uplands with thick black cracking and mulching medium clay on fresh and weathered basalt Mountain Coolibah.
NSG Major component of LRA 7a Charlton Black cracking clay on basalt with weathered basalt horizon from 65 cm. Non saline.
BA3 Shallow generally basaltic rocky upland areas.
Shallow basaltic soils in upslope positions with basalt
LRA 7c Kenmuir Very shallow <30cm gravelly red brown SL on basalt.
Note: ** No Suitable Group (NSG)
Table 4-8 provides details of sites described and laboratory analysis undertaken for each soil type.

New Acland Coal Mine Stage 3 Project – Environmental Impact Statement PAGE 4-13
Table 4-8 Soil Mapping Units and Sampling Site Details
Soil Detailed Sites
Non-Detailed Sites Laboratory analysis sites
Analysis sites of Shell (1999)
A1 36, 40, 45, 53, 80, 81, 82, 84, 119, 129, 132,143,
41, 42, 44, 46, 86, 93, 104,148,149,156,157,165.
36 No lab tests
A2 18, 19, 20, 22,152. 21, 23, 24, 79,170. 18 No lab tests
A3 50, 54. 55, 56,142. 50 No lab tests
A4 38, 43. 37, 39, 47, 48, 49. 38 96, 99
A5 66,138 65,67 No lab sites 42, 102
B1 28, 30, 51, 58, 59, 62, 76, 139,141, 144,164,166.
29, 34, 35, 57, 63, 64, 75, 77,140, 145, 146,147,151,162,163,167,168,169.
28 Shallow variant 58 Upslope variant 1
9, 23, 34
B2 2,3,160, 5, 68, 69, 135, 136, 137,159,161.
2 43, 98, 101
B3 87, 91, 118, 120, 121,128,155.
88,127,130,131 87 41,46,47
B4 4, 9, 12, 15, 25, 26, 27, 31, 102,133,134.
6, 7, 8, 13, 16, 17, 32, 33, 78, 89, 90, 153,154,158.
12 24,26, 36,95,104
BA1 97, 101, 109, 112, 117.
10, 98, 99, 107, 110, 111, 113, 114.
101 7, 51, 54, 73
BA2 94, 96, 115, 122, 126. 100, 123, 124, 125. 96 No lab sites
BA3 70, 85, 108. 72, 73, 92, 95, 103, 105, 116.
No lab sites 11,14,25,50
TOTAL SITES
67 detailed (39% of total) 103 non detailed TOTAL SITES : 170
Road and Rail Corridor The soil survey identified four SMUs in the Road and Rail Corridor. The SMUs and are shown in Figure 4-6. The SMUs have been identified on the basis of similarity of soil and landscapes within the Road and Rail Corridor with consideration to morphology, laboratory data, original vegetation, soil origin and topographic position and are outlined in Appendix G.1.5.
Table 4-9 summarises the SMUs and associated survey sites for each soil type within the Road and Rail Corridor.

New Acland Coal Mine Stage 3 Project – Environmental Impact Statement PAGE 4-14
Table 4-9 Soil Mapping Units and Sampling Site Details
SMU Detailed Sites
Non-Detailed Sites Laboratory analysis sites
Analysis sites of Shell (1999)
A1 4, 5, 6, 7, 8, 9, 10, 11, 12
- 4, 6, 7, 8, 10, 11 No lab tests
B1 1, 2, 3 - 1, 3 9, 23, 34
BA2 13, 14 - 13 No lab sites
BA3 15, 16, 17 - 15,17 11,14,25,50
TOTAL SITES
17 detailed (100% of total) TOTAL SITES : 17
Table 4-10 compares soils described in the Study area by Shell Coal Australia (1999) and Harris et al (1999) with those found in the soil survey of the Road and Rail Corridor.
Table 4-10 Relationship between Transport Corridor Soils* & Other Surveys
Project Survey (2007) Shell (1999) Harris et al (1999)
Alluvial Plains
A1 Old Alluvial Plains of dark grey brown deep well-structured cracking clays over dark grey brown heavy clay subsoil.
NSG** LRA’s 3a Soil Type : Waco Deep dark brown to black cracking clays >100 cm deep with self-mulching surface. Broad level old alluvial plains of basaltic colluviums.
Gently undulating clay plains on sandstone and mixed sediments
B1
Deep, dark grey brown well structured, self-mulching and cracking softwood scrub soils on undulating plains.
Dark cracking clays on sediments (upper slopes)
LRA 6a Edgefield Dark and deep cracking and self-mulching medium clay on gently undulating plains overlies brown heavy clay below 60 cm. Possibly saline below 80 cm.
Soils on basalt
BA2 Uplands with thick black cracking and mulching medium clay on fresh and weathered basalt Mountain Coolibah.
NSG Major component of LRA 7a Charlton Black cracking clay on basalt with weathered basalt horizon from 65 cm. Non saline.
BA3 Shallow generally basaltic rocky upland areas.
Shallow basaltic soils in upslope positions with basalt
LRA 7a Kenmuir Very shallow <30cm gravelly red brown SL on basalt.
Note: ** No Suitable Group (NSG)
New Acland Coal Mine Stage 3 Project – Environmental Impact Statement PAGE 4-15
4.4.6. Soil Conservation Plans
NAC acknowledges the requirements of the SC Act. NAC has addressed the revocation of Approved Property Plans under the SC Act during the development of Stage 1 and 2 of the Mine, and therefore, will ensure that the same process is undertaken for the revised Project.
NAC will assess the potential impacts of the revised Project’s water management on surrounding Approved Property Plans as part of the revocation process. NAC’s water management is administered via the Water Resource Management Plan located in Appendix J.4 and in general involves the:
separation of disturbed and undisturbed catchments; capture and treatment of dirty runoff from disturbed areas before potential release off-site; use of appropriate hydraulic design for all onsite water management structures (i.e. based on risk
minimisation); minimisation of the likelihood of offsite discharges through adequate capture and storage facilities;
and maximisation of water recycling, including the preferential use of all captured dirty water sources.
An assessment of the likelihood of offsite water discharges during the revised Project’s operation is provided in Chapter 5. The findings of this assessment demonstrate that the risk of discharge from the revised Project is low. NAC will continue to evaluate and manage this risk over the life of the revised Project. NAC expects that the revised Project’s main discharge risks will be associated with Lagoon Creek. NAC’s Project EA will possess strict conditions in relation to surface water management (e.g. discharge limits for specific physio-chemical and other parameters).
4.4.7. Forestry Products and Quarry Materials
There are no State-owned or privately-owned forest products which will be affected by the revised Project. In addition, there are no previously identified State-owned quarry materials administered under the Forestry Act 1959 within the Study area.
However, NAC is aware from exploration activities within the Study area that a potential extractive resource, comprising basalt, may be available on a suitable scale to facilitate commercial development. NAC will undertake further investigations into the feasibility of developing this extractive resource, and if viable, will consult with the local administering authority and initiate the required approval process under the SP Act.
4.5. Land Use Suitability
4.5.1. Agricultural Land Suitability
The methodology used to assess the revised Project site for land suitability for agriculture follows the guidelines established by the former Queensland Department of Primary Industries (DPI) Land Resources Branch (1990), which forms the basis of the Land Suitability Assessment Techniques of the Department of Mines and Energy (DME 1995). The revised Project site was assessed for suitability for rainfed cropping and grazing land uses and assigned land suitability (LS) classes as

New Acland Coal Mine Stage 3 Project – Environmental Impact Statement PAGE 4-16
outlined by Shields and Williams (1991) and DME (1995). The revised Project site was also assessed for GQAL in accordance with the Planning Guidelines - the identification of Good Quality Agricultural Land (DPI/DLGP, 1993). Agricultural land is defined as land used for crop or animal production, but excluding intensive animal uses. GQAL is land which is capable of sustainable use for agriculture, with a reasonable level of inputs, and without causing degradation of land or other natural resources.
The DPI/DLGP (1993) guidelines were introduced to provide local authorities and development proponents with a system to identify areas of good quality agricultural land for planning and project approval purposes. A summary of the relationship between Land Suitability and GQAL is included in Table 4-11.
Table 4-11 Scheme for Classifying Good Quality Agricultural Land and Correlations with Land Suitability Classes
GQAL Land Class
Land Suitability (Cropping)
Land Suitability (Grazing)
Description
A 1-3 1-3 Crop land - Land that is suitable for current and potential crops with limitations to production that range from none to moderate.
B 4 1-3
Limited crop land - Land that is marginal for current and potential crops due to severe limitations; and suitable for pastures. Engineering and/or agronomic improvements may be required before the land is considered suitable for cropping.
C1 5 1-2
Pasture land - Land that is suitable only for improved or native pastures due to limitations which preclude continuous cultivation for crop production; but some areas may tolerate a short period of ground disturbance for pasture establishment.
C2 5 3 Land suitable for native pastures.
C3 5 4 Land suitable for limited grazing of native pastures.
D 5 5
Non-agricultural land - Land not suitable for agricultural uses due to extreme limitations. This may be undisturbed land with significant habitat, conservation and/or catchment values or land that may be unsuitable because of very steep slopes, shallow soils, rock outcrop or poor drainage.
Source: DPI/ DLGP, 1993
The land suitability class for a land area is determined by the highest ranking limiting factor or a combination of a number of factors defined by DME (1995). Typically only the most severe two or three limiting factors would determine the land suitability and the remainder become irrelevant. The five-class system is based on physical and chemical limiting factors applied directly to specific uses and is described below:
Class 1 - Suitable land with negligible limitations and is highly productive requiring only simple management practices;

New Acland Coal Mine Stage 3 Project – Environmental Impact Statement PAGE 4-17
Class 2 - Suitable land with minor limitations which either reduce production or require more than simple management practices to sustain the use;
Class 3 - Suitable land with moderate limitations which is moderately suited to a proposed use but which requires significant inputs to ensure sustainable use;
Class 4 - Marginal land with severe limitations which make it doubtful whether the inputs required to achieve and maintain production outweigh the benefits in the long term; and
Class 5 - Unsuitable land with extreme limitations that precludes its use.
The land suitability classification identifies limitations of the different soil types present and identifies suitable uses. Land suitability class is determined by the highest ranking limiting factor or a combination of a number of factors. Normally, only the most severe two or three limiting factors would determine suitability and therefore, the remainder become irrelevant. For this reason, only the major limiting factors determining suitability are presented. In this survey, the main limiting factors which determined crop and grazing suitability class include:
plant available water capacity (m); water erosion (e); nutrient deficiency (n); salinity (s); and soil physical factors (p).
The soils present within the revised Project site are generally suitable for cropping to varying degrees on the less steep areas and away from drainage lines. All soils are considered to be suitable for grazing on improved pastures with the exception of some on the upper slopes where steeper soil types exist.
4.5.2. Pre-Mine Land Use Suitability
Mining Area Harris et al (1999) described the revised Project site as having a range of fertile soils with a desirable climate which is capable of growing a wide variety of crops and producing quality livestock. The following summary of historical land use patterns within the revised Project site is based on Harris et al. (1999).
Cropping Lands An area planted for crop production is driven by market demand and the likely on-farm price of the produce. The soil type of an area is also an influencing factor in the determination of a particular enterprise selection. The main risks to sustainable long-term cropping enterprises are decreasing soil fertility, the risk of soil structure degradation, soil erosion and the security of good quality irrigation water supplies. Main summer crops in the Central Darling Downs region are cotton and sorghum followed by mung beans, millet, sunflowers, maize and soybeans. Wheat and barley are the main winter crops along with chickpeas. Summer and winter forage crops are also grown for grazing and/or harvesting as hay or silage.

New Acland Coal Mine Stage 3 Project – Environmental Impact Statement PAGE 4-18
Grain and forage production has introduced intensive livestock enterprises. A number of year-round cattle feedlots and poultry farms exist within the region. The Study area also supports grazing industries for beef and dairy production. Grazing is predominately based on native pastures and also occurs on mixed farming enterprises combining grain and fodder production. A number of other minor industries including piggeries, horticulture and animal studs are present within the Study area due to the diversity of soils, proximity to markets and a favorable climate.
Cropping for grain production is one of the largest agricultural land uses and industries within the Study area with cultivation for cropping and/or sown pasture carried out to some extent within the Study area. While both summer and winter crops are grown, summer crops are preferred due to higher economic returns and the summer dominant rainfall patterns within the Central Darling Downs region. The deep black and grey clays of the recent and older alluvial plains (soil types A1 and A2), the brigalow belah plains (soil types B1 to B4) and basaltic clays (soil types Ba1 and Ba2) have been intensely utilized in varying degrees for grain, oil, fibre and some fodder crops using fallow management systems. Other shallower or coarser structured brigalow grey, brown clays (A3 and A4) have been used for opportunity summer cropping, winter grain and forage crops.
Harris et al (1999) considers that soil types associated with LRAs 7a and 8 in the Eastern Uplands (which include the Study area) depend largely on seasonal soil moisture or, in limited areas, irrigation, where it is available.
Livestock production Pasture lands occur throughout the Study area and mainly occur in soil types A3, A4, A5, B3 and B4. Most of these areas carry native or sown grasses supporting grazing livestock. These pasture lands are (or were) the basis for a number of beef enterprises and to a lesser extent, dairy enterprises. The greatest proportion of these pasture lands is under native pasture.
Major Limiting Factors to Agricultural and Pastoral Production Plant Available Water Capacity (m) Plant available water capacity (PAWC) is the quantity of moisture stored in the soil profile that is available to a plant for uptake. The PAWC is a significant soil parameter as much of the cash cropping within the revised Project site is based on fallow storage of moisture within the soil profile. Table 4-12 shows the criteria proposed for the assessment of the moisture availability limitation for crops.
Table 4-12 PAWC Criteria for Assessing Cropping Limitations (Shields and Williams (1991)
Limitation Level Dryland Cropping PAWC (mm) Grazing PAWC (mm)
1 >150 >125
2 130-150 100-125
3 90-130 75-100
4 70-90 50-75
5 <70 <50
Source: QDPI, 1991

New Acland Coal Mine Stage 3 Project – Environmental Impact Statement PAGE 4-19
In the survey, PAWC for soil groups was assessed from site specific chemistry using effective rooting depth estimations developed in accordance with Harris et al. (1999). Effective rooting depth and PAWC estimations were further refined from observed field morphology. Field morphology observations and chemical data used included the presence of hardpans, bleaching, soil texture, barriers to root growth such as high sodium, gravel, poor soil structure, high electrical conductivity and chloride.
PAWC suitability estimates and limitation levels for soils within the revised Project site are shown in Table 4-13. These results indicate that most soil types have a reasonable to very good soil water storage potential.
Table 4-13 Estimated PAWC and Limitation Levels
Soil Type Est. effective rooting depth (cm)
PAWC (mm) Available plant moisture limitation (m)
Dryland cropping Beef cattle grazing
A1 60 - 90 93 - 134 3 2
A2 50 - 60 85 - 95 4 3
A3 30- 60 70 - 90 4-5 3
A4 80 - 90 80 - 90 4 3
A5 60 - 80 110 -130 2 1
B1 B1 shallow variant
90+ 60 - 70
120-140 95 - 120
2 3
1 1/2
B2 90+ 120 - 140 2 1
B3 30 - 50 65 - 82 4 3
B4 90+ 130 - 142 2 1
Ba1 80 - 90 150 + 1 1
Ba2 50 - 60 120 - 140 2 1
Ba3 30-40 30 - 60 5 4/5
On a moisture availability basis, most soil types offer potential for dryland cropping apart from the sandy duplex A4 and the shallow basalt hills Ba3. High potential cropping soils include Ba1, Ba2, B1, B2 and A1. Other alluvial soils A2, A3, A4 and A5 in addition to B3 are more marginal for cropping.
Pasture production to achieve maximum output for grazing activities occurs in a shallower root zone than for cropping activities (QDPI, 1991). Limitation levels for grazing are also shown in Table 4-12 and Table 4-13.
Susceptibility to Water erosion (e) The risk of soil loss from water erosion magnifies with increased water velocity when the land is devoid of vegetation for cropping. The risk of soil loss has been assessed as low to moderate in the undulating softwood scrub and basaltic upland soils when limitation levels of 2 and 3 are applied. During the survey, some evidence of erosion was observed under a cropping regime, however it was

New Acland Coal Mine Stage 3 Project – Environmental Impact Statement PAGE 4-20
not considered severe. Erosive effects could intensify under poorly managed cropping regimes based on the particular soil type.
Table 4-14 summarises the general ratings for grazing activities (QDPI, 1991). Cropping limitation ratings were developed using the DME (1995).
Table 4-14 Land Suitability for Grazing – Effects of Slopes
Limitation rating 1 2 3 4 5
Cracking clays <3% slope Slopes 3-6% Slopes 6-9% Slopes 9-15% >15%
Sodic rigid soils <1% slope Slopes 1-3% Slopes 3-6% Slopes 6-12% >12%
Source: DME, 1995
Nutrient deficiency (n) Nutrient limitations for grazing and rainfed cropping uses within the revised Project site were rated using the surface horizons analysis data collected from the survey (DME, 1995). Shields and Williams (1991) state that a major limiting factor to pasture production in northern Australia is reduced pasture quality as a result of deficiencies in nitrogen and phosphorus. Other elements which also play key roles are potassium and calcium. Most clay soils within the revised Project site are not significantly limited by nutrient deficiency for cropping or grazing. Accordingly, no soil has attracted a major fertility limitation level, with three being the highest estimate assessed.
Salinity (s) Salinity is described as the reduction in dry matter yield as a result of soluble salt in the soil profile. Salinity also contributes to reduced water availability limitation. Increasing salinity in the soil profile (below 50 cm) was evidenced across the old alluvial clay plains A1 to A4 and the upland brigalow soils of B3. Most other soil types have no limitation from elevated salinity within the root zone.
Soil Physical Factors (p) Physical factors refer to restrictions in the establishment and vigour of pastures as a result of soil surface condition and are typically related to size of surface aggregates which affects tendencies to seal and hardset. Only the hardsetting A4 soil has any significant limitation with respect to this limiting factor.
Agricultural Suitability Classes Cropping lands in suitability classes 1 to 3 are considered well suited to that particular use as the benefits should outweigh the inputs required to initiate and maintain production. Suitability class 4 is marginal for crops based on the extent of inputs required to initiate production. Suitability class 5 has severe limitations based on the inputs required and therefore would not justify a cropping use.
Suitability classes 1 to 3 for grazing are considered suitable for significant pasture improvement. While suitability class 4 offers marginal potential for pasture improvement, suitability class 5 is not suitable for improvement and is therefore restricted to grazing of native pastures with low productivity. Table 4-15 shows the suitability classification for non-irrigated crops and grazing for each soil type within the revised Project site.
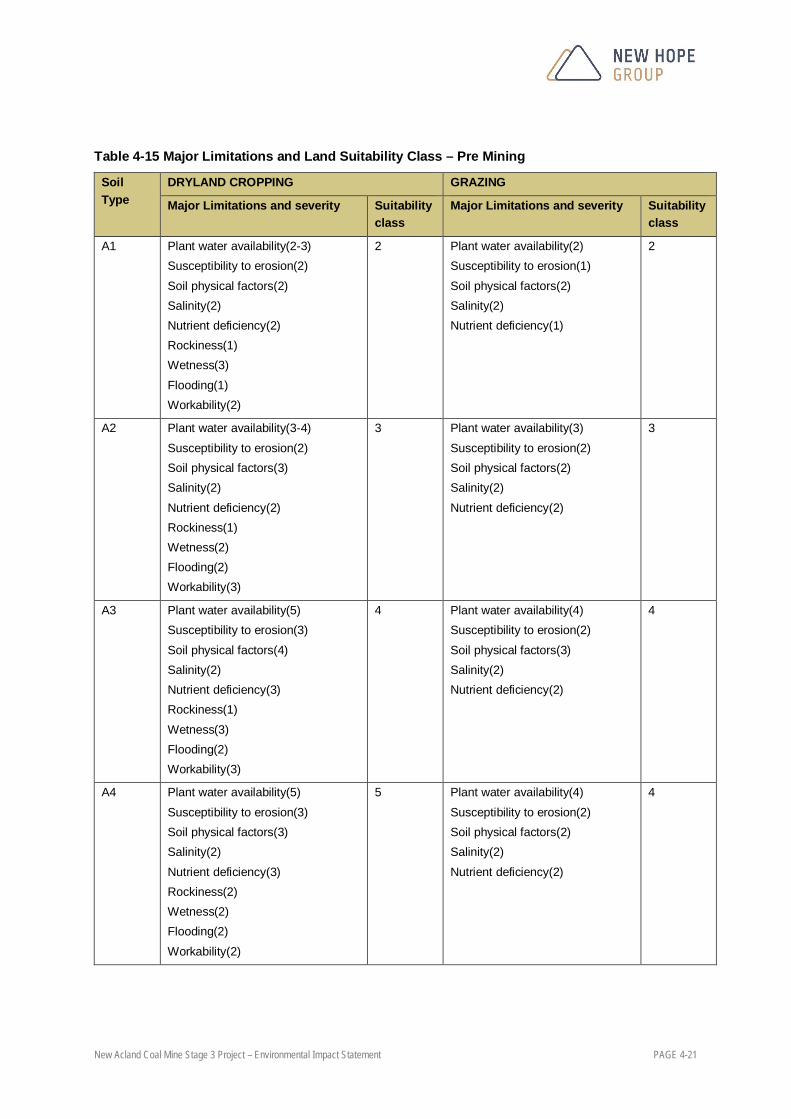
New Acland Coal Mine Stage 3 Project – Environmental Impact Statement PAGE 4-21
Table 4-15 Major Limitations and Land Suitability Class – Pre Mining
Soil Type
DRYLAND CROPPING GRAZING
Major Limitations and severity Suitability class
Major Limitations and severity Suitability class
A1 Plant water availability(2-3) Susceptibility to erosion(2) Soil physical factors(2) Salinity(2) Nutrient deficiency(2) Rockiness(1) Wetness(3) Flooding(1) Workability(2)
2 Plant water availability(2) Susceptibility to erosion(1) Soil physical factors(2) Salinity(2) Nutrient deficiency(1)
2
A2 Plant water availability(3-4) Susceptibility to erosion(2) Soil physical factors(3) Salinity(2) Nutrient deficiency(2) Rockiness(1) Wetness(2) Flooding(2) Workability(3)
3 Plant water availability(3) Susceptibility to erosion(2) Soil physical factors(2) Salinity(2) Nutrient deficiency(2)
3
A3 Plant water availability(5) Susceptibility to erosion(3) Soil physical factors(4) Salinity(2) Nutrient deficiency(3) Rockiness(1) Wetness(3) Flooding(2) Workability(3)
4 Plant water availability(4) Susceptibility to erosion(2) Soil physical factors(3) Salinity(2) Nutrient deficiency(2)
4
A4 Plant water availability(5) Susceptibility to erosion(3) Soil physical factors(3) Salinity(2) Nutrient deficiency(3) Rockiness(2) Wetness(2) Flooding(2) Workability(2)
5 Plant water availability(4) Susceptibility to erosion(2) Soil physical factors(2) Salinity(2) Nutrient deficiency(2)
4

New Acland Coal Mine Stage 3 Project – Environmental Impact Statement PAGE 4-22
Soil Type
DRYLAND CROPPING GRAZING
Major Limitations and severity Suitability class
Major Limitations and severity Suitability class
A5 Plant water availability(2) Topography(5) Susceptibility to erosion(2) Soil physical factors(1) Salinity(1) Nutrient deficiency(1) Wetness(4) Flooding(4) Workability(2)
5 Plant water availability(1) Susceptibility to erosion(2) Soil physical factors(1) Salinity(1) Nutrient deficiency(1)
2
B1 B1v (steeper & shallow variants)
Plant water availability(2) Susceptibility to erosion(2-3) Soil physical factors(1) Salinity(1) Nutrient deficiency(1) Rockiness(1) Wetness(1) Flooding(1) Workability(1)
B1 – 2 B1v - 3
Plant water availability(1) Susceptibility to erosion(2) Soil physical factors(1) Salinity(1) Nutrient deficiency(1)
2
B2 Plant water availability(2) Susceptibility to erosion(2) Soil physical factors(1) Salinity(1) Nutrient deficiency(1) Rockiness(1) Wetness(1) Flooding(1) Workability(1)
2 Plant water availability(1) Susceptibility to erosion(1) Soil physical factors(1) Salinity(1) Nutrient deficiency(1)
1
B3 Plant water availability(4) Susceptibility to erosion(3) Soil physical factors(2) Salinity(3) Nutrient deficiency(2) Rockiness(1) Wetness(1) Flooding(1) Workability(1)
4 Plant water availability(2) Susceptibility to erosion(2) Soil physical factors(1) Salinity(1) Nutrient deficiency(1)
2

New Acland Coal Mine Stage 3 Project – Environmental Impact Statement PAGE 4-23
Soil Type
DRYLAND CROPPING GRAZING
Major Limitations and severity Suitability class
Major Limitations and severity Suitability class
B4 Plant water availability(4) Susceptibility to erosion(4) Soil physical factors(3) Salinity(2) Nutrient deficiency(2) Rockiness(1) Wetness(1) Flooding(1) Workability(1)
4 Plant water availability(3) Susceptibility to erosion(3) Soil physical factors(2) Salinity(1) Nutrient deficiency(1)
3
BA1 Plant water availability(1) Susceptibility to erosion(3) Soil physical factors(2) Salinity(2) Nutrient deficiency(1) Rockiness(1) Wetness(1) Flooding(1) Workability(1)
3 Plant water availability(1) Susceptibility to erosion(2) Soil physical factors(1) Salinity(1) Nutrient deficiency(1)
2
BA2 Plant water availability(2) Susceptibility to erosion(2) Soil physical factors(2) Salinity(1) Nutrient efficiency(1) Rockiness(2) Wetness(1) Flooding(1) Workability(1)
2 Plant water availability(1) Susceptibility to erosion(1) Soil physical factors(1) Salinity(1) Nutrient deficiency(1)
1
BA3 Plant water availability(5) Susceptibility to erosion(4) Soil physical factors(4) Salinity(1) Nutrient deficiency(2) Rockiness(3) Wetness(2) Flooding(1) Workability(5)
5 Plant water availability(3) Susceptibility to erosion(4) Soil physical factors(2) Salinity(1) Nutrient deficiency(1)
4
Pre-mine land suitability for dryland cropping is displayed in Figure 4-7 and Figure 4-8, respectively. Pre-mine land suitability for grazing activities is displayed in Figure 4-7 and Figure 4-8, respectively.
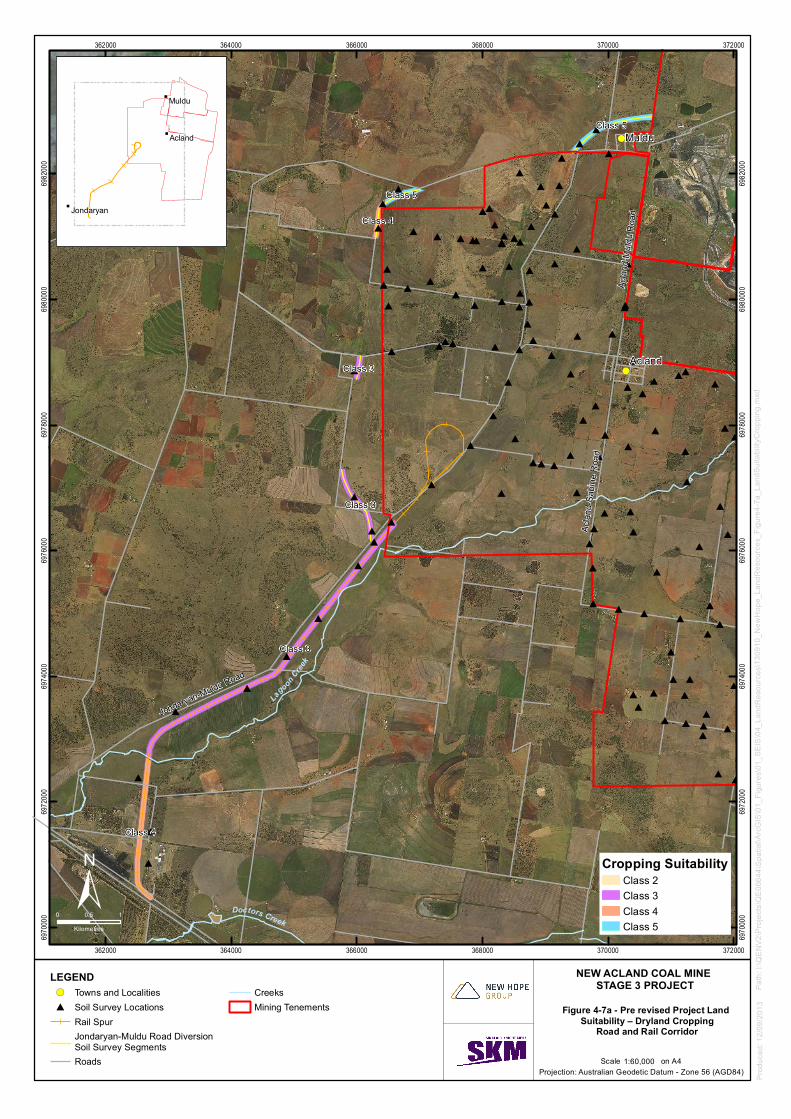
#
#
#
#
#
#
#
#
##
#
#
#
#
#
#
#
##
#
#####
##
## ##
# #
#
##
# ### ##
##
#####
## #
## #
# #
##### ###
# ## # ###
###
# ## ### #
### ### ## # # #
#
### ## ### ### #
## # # # #
### #### ## ## ##
####
# ##
# #
!(
!(
Class 3
Class 4
Class 5
Class 3
Class 5
Class 4
Class 3
Muldu
Acland
Jondaryan-Muldu Road
Acla
nd-S
abin
e R
oad
Acla
nd-M
u ldu
Roa
d
Lagoon
Cre
ek
Doctors Creek
362000
362000
364000
364000
366000
366000
368000
368000
370000
370000
372000
372000
6970
000
6970
000
6972
000
6972
000
6974
000
6974
000
6976
000
6976
000
6978
000
6978
000
6980
000
6980
000
6982
000
6982
000
Pro
duce
d: 1
2/09
/201
3
NEW ACLAND COAL MINE STAGE 3 PROJECT
Figure 4-7a - Pre revised Project Land Suitability – Dryland Cropping
Road and Rail Corridor
0 0.5 1
Kilometres
Projection: Australian Geodetic Datum - Zone 56 (AGD84)1:60,000Scale on A4
Pat
h: I:
\QE
NV
2\P
roje
cts\
QE
0664
4\S
patia
l\Arc
GIS
\01_
Figu
res\
01_S
EIS
\04_
Land
Res
ourc
es\1
3091
0_N
ewH
ope_
Land
Res
ourc
es_F
igur
e4-7
a_La
ndS
uita
bilit
yCro
ppin
g.m
xd
"
"
"
Jondaryan
Acland
Muldu
±LEGEND!( Towns and Localities# Soil Survey Locations
Rail SpurJondaryan-Muldu Road Diversion Soil Survey SegmentsRoads
CreeksMining Tenements
Cropping SuitabilityClass 2Class 3Class 4Class 5

#
#
#
##
#
#
#
#
#
#
#
## #
#### ##### ## ##
## ## # ## ##
# ###
#
# ## #### ### ### # #
####
##### # ## ###
## # ## #
# ### # #
# # ###### #### ## ### # ## # # ## ## # ####
## ## ## #
## #### ### ## # # #
#
### ## ### ### #
## # # # #
### #### ## ## #####
#
# ##
# #
!(
!(
Class 3
Class 5
Class 3
Class 5
Class 4
Class 3
Muldu
Acland
Oake
y-Coo
yar R
oad
Jondaryan-Muldu R
oad
Aclan
d-Sab
ine R
oad
Aclan
d-Muld
u Roa
d
Lagoon Creek
Sp ring Creek
Acland-Silverleigh Road
Pechey-Maclagan Road
366000
366000
368000
368000
370000
370000
372000
372000
374000
374000
697200
0
697200
0
697400
0
697400
0
697600
0
697600
0
697800
0
697800
0
698000
0
698000
0
698200
0
698200
0
698400
0
698400
0Pr
oduc
ed: 1
2/09/2
013
NEW ACLAND COAL MINE STAGE 3 PROJECT
Figure 4-7b - Pre revised Project Land Suitability – Dryland Cropping
Mining Area
0 0.5 1Kilometres
Projection: Australian Geodetic Datum - Zone 56 (AGD84)1:60,000Scale on A4
Path:
I:\QE
NV2\P
rojec
ts\QE
0664
4\Spa
tial\A
rcGIS
\01_F
igures
\01_S
EIS\
04_L
andR
esou
rces\1
3091
0_Ne
wHop
e_La
ndRe
sourc
es_F
igure4
-7b_L
andS
uitab
ilityC
ropp
ing.m
xd
"
"
"
Jondaryan
Acland
Muldu
±LEGEND!( Towns and Localities# Soil Survey Locations
Rail SpurJondaryan-Muldu Road Diversion Soil Survey SegmentsRoads
CreeksMining Tenements
Cropping SuitabilityClass 2Class 3Class 4Class 5
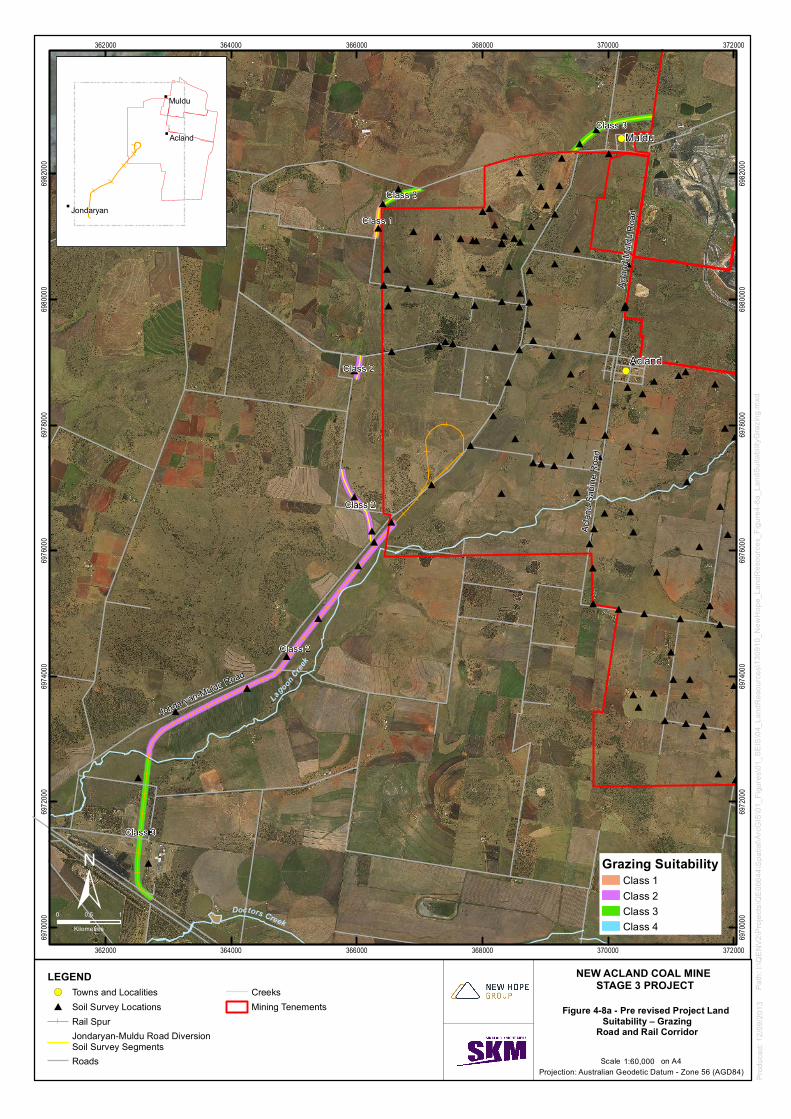
#
#
#
#
#
#
#
#
##
#
#
#
#
#
#
#
##
#
#####
##
## ##
# #
#
##
# ### ##
##
#####
## #
## #
# #
##### ###
# ## # ###
###
# ## ### #
### ### ## # # #
#
### ## ### ### #
## # # # #
### #### ## ## ##
####
# ##
# #
!(
!(
Class 2
Class 3
Class 3
Class 2
Class 3
Class 1
Class 2
Muldu
Acland
Jondaryan-Muldu Road
Acla
nd-S
abin
e R
oad
Acla
nd-M
u ldu
Roa
d
Lagoon
Cre
ek
Doctors Creek
362000
362000
364000
364000
366000
366000
368000
368000
370000
370000
372000
372000
6970
000
6970
000
6972
000
6972
000
6974
000
6974
000
6976
000
6976
000
6978
000
6978
000
6980
000
6980
000
6982
000
6982
000
Pro
duce
d: 1
2/09
/201
3
NEW ACLAND COAL MINE STAGE 3 PROJECT
Figure 4-8a - Pre revised Project Land Suitability – Grazing
Road and Rail Corridor
0 0.5 1
Kilometres
Projection: Australian Geodetic Datum - Zone 56 (AGD84)1:60,000Scale on A4
Pat
h: I:
\QE
NV
2\P
roje
cts\
QE
0664
4\S
patia
l\Arc
GIS
\01_
Figu
res\
01_S
EIS
\04_
Land
Res
ourc
es\1
3091
0_N
ewH
ope_
Land
Res
ourc
es_F
igur
e4-8
a_La
ndS
uita
bilit
yGra
zing
.mxd
"
"
"
Jondaryan
Acland
Muldu
±LEGEND!( Towns and Localities# Soil Survey Locations
Rail SpurJondaryan-Muldu Road Diversion Soil Survey SegmentsRoads
CreeksMining Tenements
Grazing SuitabilityClass 1Class 2Class 3Class 4

!(
!(
#
#
#
##
#
#
#
#
#
#
#
## #
#### ##### ## ##
## ## # ## ##
# ###
#
# ## #### ### ### # #
####
##### # ## ###
## # ## #
# ### # #
# # ###### #### ## ### # ## # # ## ## # ####
## ## ## #
## ##
## ### ## # # ##
### ## ### ### #
## # # # #
### #### ## ## ##
####
# ##
# #
Class 2
Class 3
Class 1
Muldu
Acland
Oak
ey-C
o oya
r Roa
d
Jondarya
n-Muldu R
oad
Acla
nd-S
abin
e R
oad
Acla
nd-M
u ldu
Roa
d
Lagoon Creek
Spr ing Creek
Acland-Silverleigh Road
Pechey-Maclagan Road
366000
366000
368000
368000
370000
370000
372000
372000
374000
374000
6972
000
6972
000
6974
000
6974
000
6976
000
6976
000
6978
000
6978
000
6980
000
6980
000
6982
000
6982
000
6984
000
6984
000
Pro
duce
d: 1
2/09
/201
3
NEW ACLAND COAL MINE STAGE 3 PROJECT
Figure 4-8b - Pre revised Project Land Suitability – Grazing
Mining Area
0 0.5 1
Kilometres
Projection: Australian Geodetic Datum - Zone 56 (AGD84)1:60,000Scale on A4
Pat
h: I:
\QE
NV
2\P
roje
cts\
QE
0664
4\S
patia
l\Arc
GIS
\01_
Figu
res\
01_S
EIS
\04_
Land
Res
ourc
es\1
3091
0_N
ewH
ope_
Land
Res
ourc
es_F
igur
e4-8
b_La
ndS
uita
bilit
yGra
zing
.mxd
"
"
"
Jondaryan
Acland
Muldu
±LEGEND!( Towns and Localities# Soil Survey Locations
Rail SpurJondaryan-Muldu Road Diversion Soil Survey SegmentsRoads
CreeksMining Tenements
Grazing SuitabilityClass 1Class 2Class 3Class 4

New Acland Coal Mine Stage 3 Project – Environmental Impact Statement PAGE 4-28
Road and Rail Corridor As described previously, the evaluation of major limiting factors for the dryland cropping and grazing was based on the requirements of the Land Resources Branch (1989) Guidelines for Agricultural Land Suitability in Queensland which are the basis for DME (1995) guidelines for use in the mining industry. The following information was utilised in the evaluation.
Plant Available Water Capacity (m) In the survey of the Road and Rail Corridor PAWC for SMUs were assessed from site specific chemistry and morphology using effective rooting depth estimations developed in accordance with guidelines of Harris (1999). Field morphology observations and chemical data used included presence of hardpans, bleaching, soil texture, barriers to root growth such as high sodium, gravel, poor soil structure, high electrical conductivity and chloride. The presence of saline subsoil was a major attribute in effective soil depth determination for three of the four SMUs in the Road and Road Corridor.
Estimated PAWC and limitation levels for soils in Road and Rail Corridor are summarised in Table 4-16, and indicates that the soils of A1 have high PAWC.
Table 4-16 Estimated PAWC and Limitation Levels (DME 1995)
Soil Type Est. effective rooting depth (cm)
PAWC (mm)
Available plant moisture limitation (m)
Dryland cropping Beef cattle grazing
A1 0.6 – 0.9 (average 0.8) 95 - 120 3 2 B1 0.5 – 0.8 75 - 100 4 3
Ba2 0.8 – 1.0 110 - 140 2 1 Ba3 0.3 – 0.4 40 - 60 5 4
On a PAWC basis soil of the A1 unit offers potential for dryland cropping. Pasture production to achieve maximum production for grazing occurs in a shallower root zone than cropping systems (Shields and Williams, 1991). Limitation levels for grazing are also shown in Table 4-16.
Salinity (s) This refers to the reduction in dry matter yield as a result of soluble salt in the soil profile. It also contributes to reduced water availability limitation. Increasing salinity in the soil profile (generally below 0.5 cm) was evidenced across the old alluvial clay plains A1 and the upland brigalow B1 soils. The major effect of salinity is in restricting effective rooting depth.
Susceptibility to Water erosion (e) The risk of soil loss from water erosion magnifies with increased water velocity when land is devoid of vegetation for cropping. In the undulating softwood scrub and basaltic uplands soils, this risk has been assessed as low to moderate with limitation levels of 2 - 3 applied. Erosive effects could intensify under poorly managed cropping.
Nutrient deficiency (n) Nutrient limitations for grazing and rainfed cropping uses were rated using DME (1995) from soil analysis data of surface horizons. Clay soils in this survey were not significantly limited by nutrient

New Acland Coal Mine Stage 3 Project – Environmental Impact Statement PAGE 4-29
deficiency for cropping or grazing. In addition, low fertility can be readily rectified with use of fertiliser so no soil has attracted a major fertility limitation level.
Soil Physical Factors (p) Physical factors refer to restrictions in the establishment and vigour of pastures as a result of soil surface condition and are typically related to size of surface aggregates which affects tendencies to seal and hardset. No SMU were assessed with any significant limitation in this aspect.
Agricultural Suitability Classes Table 4-17 shows the severity of major limiting factors and overall land suitability classification for rainfed agricultural cash crops and grazing for each SMU. Lands in classes 1 to 3 are considered well suited to cropping as the benefits should outweigh the inputs required to initiate and maintain production. Class 4 is marginal for the specified use and the economic long term suitability is doubtful from the extent of inputs required. Class 5 has limitations so severe that inputs required would not justify that use.
Class 1 to 3 grazing lands are considered suitable for significant pasture improvement, Class 4 offers marginal potential for pasture improvement, and Class 5 is not suitable for improvement and restricted to grazing of native pastures with low productivity.
Table 4-17 Major Limitations and Land Suitability Classes
SMU DRYLAND CROPPING GRAZING
Major Limitations and severity
Suitability class
Major Limitations and severity Suitability class
A1 Plant water availability 3 Susceptibility to erosion 2 Salinity 2 Nutrient deficiency 2 Rockiness 1 Wetness 2
3 Plant water availability 2 Susceptibility to erosion 1 Salinity 2 Nutrient deficiency 1
2
B1
Plant water availability 4 Susceptibility to erosion 2 Salinity 1 Nutrient deficiency 1 Rockiness 1 Wetness 1
4
Plant water availability 3 Susceptibility to erosion 2 Salinity 1 Nutrient deficiency 1
3
BA2 Plant water availability 2 Susceptibility to erosion 2 Salinity 1 Nutrient deficiency 1 Rockiness 2
2 Plant water availability 1 Susceptibility to erosion 1 Salinity 1 Nutrient deficiency 1
1
BA3 Plant water availability 5 Susceptibility to erosion 4 Salinity 1 Nutrient deficiency 2 Rockiness 3
5 Plant water availability 3 Susceptibility to erosion 3 Salinity 1 Nutrient deficiency 1
3

New Acland Coal Mine Stage 3 Project – Environmental Impact Statement PAGE 4-30
The soils of the B1 mapping unit vary in depth to salinity and sodicity, properties which limit land suitability for cropping and grazing. The land suitability assessment for soils in the road and rail corridor (and therefore our GQAL assessment) was inferred from laboratory data for each site belonging to a mapping unit and not just the representative site for the SMU.
4.5.3. Good Quality Agricultural Land
The TRC Planning Scheme shows that the revised Project site is GQAL. GQAL has been identified on the land within the revised Project site and it is therefore subject to SPP 1/92, although this SPP has recently expired. The Planning Guidelines: The Identification of GQAL (DLGP and DPI, 1993) has established four classes of agricultural land for Queensland as described in Table 4-18.
Table 4-18 Agricultural Land Classification
Class Description
Class A Crop land Land suitable for current and potential crops with limitations to production which range from non to moderate levels.
Class B Limited Crop Land Land that is marginal for current and potential crops due to severe limitations; and suitable for pastures. Engineering and/or agronomic improvements may be required before the land is considered suitable for cropping.
Class C Pasture Land Land suitable only for improved or native pastures due to limitations, which preclude continuous cultivation for crop production; but some areas, may tolerate a short period of ground disturbance for pasture establishment. Sub categories are as follows: C1 Land suitable for improved pastures. In some circumstances may be
considered as good quality agricultural land. C2 Land suitable for native pastures. C3 Land suitable for limited grazing of native pastures.
Class D Non-agricultural Land Land not suitable for agricultural uses due to extreme limitations. This may be undisturbed land with significant habitat, conservation and/or catchment values or land that may be unsuitable because of very steep slopes, shallow soils, rock outcrop or poor drainage.
Source: DLGP and DPI, 1993
Mining Area Approximately 54% of the revised Project site lies within Class A, 34% within Class B, and 12% within Class C. The revised Project will impact on Class A GQAL with existing cropping use. Class B GQAL will be impacted upon. However, Class B GQAL is considered to be marginal at best for cropping and more suited to grazing use. It should be noted that the scale of existing GQAL mapping is coarse. Therefore, in line with The Planning Guidelines (DLGP and DPI, 1993), the higher intensity information of this assessment has formed the basis for more detailed GQAL assessments for each soil type. These assessments are shown in Table 4-19.
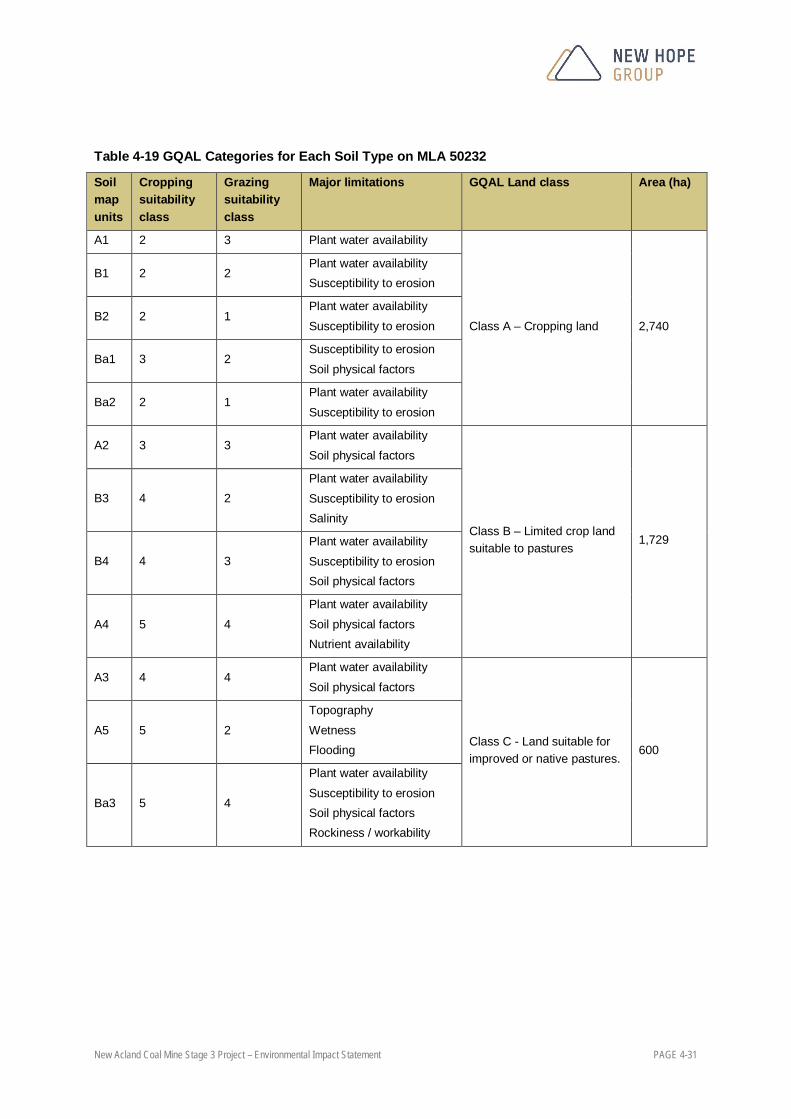
New Acland Coal Mine Stage 3 Project – Environmental Impact Statement PAGE 4-31
Table 4-19 GQAL Categories for Each Soil Type on MLA 50232
Soil map units
Cropping suitability class
Grazing suitability class
Major limitations GQAL Land class Area (ha)
A1 2 3 Plant water availability
Class A – Cropping land 2,740
B1 2 2 Plant water availability Susceptibility to erosion
B2 2 1 Plant water availability Susceptibility to erosion
Ba1 3 2 Susceptibility to erosion Soil physical factors
Ba2 2 1 Plant water availability Susceptibility to erosion
A2 3 3 Plant water availability Soil physical factors
Class B – Limited crop land suitable to pastures
1,729
B3 4 2 Plant water availability Susceptibility to erosion Salinity
B4 4 3 Plant water availability Susceptibility to erosion Soil physical factors
A4 5 4 Plant water availability Soil physical factors Nutrient availability
A3 4 4 Plant water availability Soil physical factors
Class C - Land suitable for improved or native pastures.
600 A5 5 2
Topography Wetness Flooding
Ba3 5 4
Plant water availability Susceptibility to erosion Soil physical factors Rockiness / workability

New Acland Coal Mine Stage 3 Project – Environmental Impact Statement PAGE 4-32
Road and Rail Corridor Table 4-20 shows the GQAL Land Classes for each SMU and the area along the Road and Rail Corridor.
Table 4-20 GQAL Categories for Each Soil Type
Soil map units
Cropping Suitability class
Grazing Suitability class
Important Limitations GQAL Land Classification
Area (ha)
A1 3 2 Plant water availability Class A – Cropping land 46
Ba2 2 1 Plant water availability Class A – Cropping land
B1 4 3 Susceptibility to erosion Plant water availability
Class B – Limited crop land suitable to pastures
14
Ba3 5 3 Plant water availability Susceptibility to erosion
Class C2 – Land suitable for native pastures
12
Note: Area estimation assumes a corridor width of 60 m
4.5.4. Post-Mine Land Use Suitability
Factors influencing changes in land suitability include changed physical, chemical and biological properties of soil, changes in the slope and slope length, changes in soil depth and the quality of the underlying spoil. Given that the revised Project will involve open cut mining, the potential to affect land suitability is significant. However, a return to grazing is feasible providing final landforms and surface treatments align with such uses sufficient for a sustainable basis and the designated post-mining land use option.
Based on a conservative assessment and noting the proposed return to grazing it is anticipated that there will be net reduction in the land suitability rating as a result of the revised Project. The underlying objectives of the revised Project’s rehabilitation program are aimed at ensuring:
a beneficial post-mining land use; stable landforms; and the preservation of downstream water quality.
Design of Final Landforms As an important component of the planning phase for the revised Project, NAC has developed a feasible mining methodology to eliminate unusable post-mined land for the revised Project. The main driver for this approach was to ensure the final out-of-pit dumps (elevated landforms) and final voids (depressed landforms) are battered down to a safe and stable angle to allow the sustainable application of the revised Project’s proposed final land use. A conceptual final land use plan for the revised Project is presented in Figure 4-9.
.
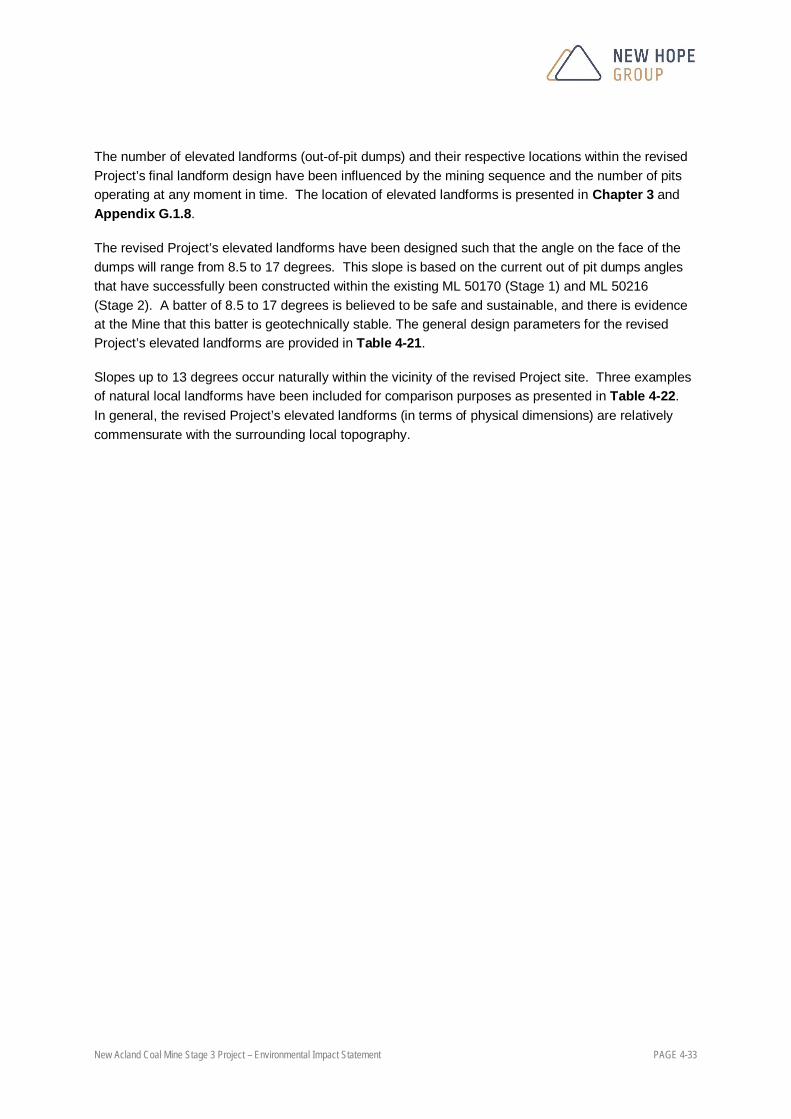
New Acland Coal Mine Stage 3 Project – Environmental Impact Statement PAGE 4-33
The number of elevated landforms (out-of-pit dumps) and their respective locations within the revised Project’s final landform design have been influenced by the mining sequence and the number of pits operating at any moment in time. The location of elevated landforms is presented in Chapter 3 and Appendix G.1.8.
The revised Project’s elevated landforms have been designed such that the angle on the face of the dumps will range from 8.5 to 17 degrees. This slope is based on the current out of pit dumps angles that have successfully been constructed within the existing ML 50170 (Stage 1) and ML 50216 (Stage 2). A batter of 8.5 to 17 degrees is believed to be safe and sustainable, and there is evidence at the Mine that this batter is geotechnically stable. The general design parameters for the revised Project’s elevated landforms are provided in Table 4-21.
Slopes up to 13 degrees occur naturally within the vicinity of the revised Project site. Three examples of natural local landforms have been included for comparison purposes as presented in Table 4-22. In general, the revised Project’s elevated landforms (in terms of physical dimensions) are relatively commensurate with the surrounding local topography.

!(
!(
ML5
0170
ML5
0216
MLA
5023
2
ML5
0216
Muldu
Acland
Lagoo
n Cre
ek
Doctors Creek
Sprin g Creek
Oakey Creek
Warrego Highway
365000
365000
370000
370000
375000
375000
6970
000
6970
000
6975
000
6975
000
6980
000
6980
000
6985
000
6985
000
Pro
duce
d: 1
6/09
/201
3
NEW ACLAND COAL MINE STAGE 3 PROJECT
Figure 4-9 - Conceptual Final Land Use Plan
0 1 2 3 4
Kilometres
Projection: Australian Geodetic Datum – Zone 56 (AGD84)1:80,000Scale on A4
Pat
h: I:
\QE
NV
2\P
roje
cts\
QE
0664
4\S
patia
l\Arc
GIS
\01_
Figu
res\
01_S
EIS
\04_
Land
Res
ourc
es\1
3090
6_N
ewH
ope_
Land
Res
ourc
es_F
igur
e4-9
_Fin
alLa
ndU
se.m
xd
±LEGEND!( Towns and Localities
HighwayJondaryan-Muldu Road DiversionCreeksMining TenementsBluegrass Offset Area
Conceptual Final Land UseExtension of current Tree Plantings - tree screening + habitatGrazing - Open Woodland with a mix of Native and Improved Pasture SpeciesRegrowth (No plantings)Conservation Zone

New Acland Coal Mine Stage 3 Project – Environmental Impact Statement PAGE 4-35
Table 4-21 General Design Parameters for Elevated Landforms
Elevated landforms Height (m)
Volume (Mm3)
Area (footprint) (ha)
Proposed slope (degrees)
Longest slope length (m)
Manning Vale East Pit 45 23.4 67 8.5-17 300
Manning Vale West Pit 45 25.6 155 8.5-17 300
Willeroo Pit 45 23.5 1291 8.5-17 300
Note: Willeroo pit has 102 ha on ML 50216 and 26 ha on MLA 50232
Table 4-22 Local Topographic Features in the Study area
Local topographic features
Height (m)
Area (footprint) (Ha)
Slope (degrees) Longest Slope Length (m)
Bottle Tree Hill 56 150 11 700
Radar Hill 65+ 450+ 7 1000
Surrounding Ridgeline 80+ NA >20 >2000
The revised Project’s elevated landforms will be rehabilitated to a safe, stable and non-polluting landform that is able to support the proposed final land use of grazing in a sustainable manner. The Final Landform Technical Report for the revised Project is presented in Appendix G.1.8 and outlines the design parameters for the final landform in detail.
The vegetation rehabilitation success criteria for the revised Project’s depressed and elevated landforms are defined in the Final Land Use and Rehabilitation Management Plan (FLURP). The FLURP is presented in Appendix J.2. The vegetation rehabilitation success criteria are based on a comparison with an analogue site in the Acland area that possesses similar biophysical features. For the revised Project’s elevated landforms, NAC will expand its current monitoring programs and grazing trials to incorporate the applicable rehabilitation success criteria to guide its rehabilitation management and to collect the necessary data to demonstrate:
the geotechnical stability of the constructed landform; the successful establishment of a suitable vegetative cover to support the final land use and
minimise the potential for erosion; and the productivity of the vegetative cover for grazing (beef production).
NAC will be required to demonstrate compliance with the legislative requirements associated with the the Project’s rehabilitation before the surrender of mining leases and associated EA. In addition, NAC will consult with government and community on a regular basis over the life of the revised Project to report on the progress of rehabilitation and other matters.
NAC’s rehabilitation program is administered through a Plan of Operations and various supporting documentation (i.e. FLURP and Topsoil Management Plan). Importantly, NAC is required as part of the revised Project’s EA to maintain a financial assurance with the State government in accordance

New Acland Coal Mine Stage 3 Project – Environmental Impact Statement PAGE 4-36
with the requirement of the EP Act. NAC as part of its Environmental Management System (EMS) also conducts internal and third party audits to assess environmental management (including rehabilitation) for continuous improvement purposes and ensures that environmental management responsibilities are clearly defined on the mine site. NAC is committed to maximising the revised Project’s rehabilitation success to ensure the APC can function as a competitive agribusiness. NAC will also continue to draw on the APC’s expertise to assist and enhance rehabilitation management.
Rainfed Cropping Large areas considered suitable for sustainable rainfed cropping were identified within the revised Project site. The pre and post mining areas of land suitability for cropping are shown in Table 4-23 for the Project site.
Table 4-23 Pre and Post Mine Land Suitability – Rainfed Cropping
Land Suitability Class
Area within revised Project site (ha)
% of revised Project site
Area within Disturbance Footprint (ha)*
% of Disturbance Area
Pre-mining
Post- Mining
Pre-mining
Post- Mining
Pre-mining
Post- Mining
Pre-mining
Post- Mining
1 0 0 0% 0% 0 0 0% 0%
2 1558 757 30% 15% 801 0 52% 0%
3 1225 921 24% 18% 304 0 20% 0%
4 1746 2281 34% 44% 346 881 23% 57%
5 613 1183 12% 23% 86 656 6% 43%
Total 5142 5142 - - 1537 1537 - -
Notes: 1. *The disturbance footprint comprises the mining and infrastructure areas within the revised Project site. 2. For the purpose of reporting pre and post mine land suitability it has been assumed that the road diversions are Class 5 post-mining.
Post mine land suitability for dryland cropping activities is shown in Figure 4-10a and Figure 4-10b (i.e. for the road and rail corridor and mine area, respectively).
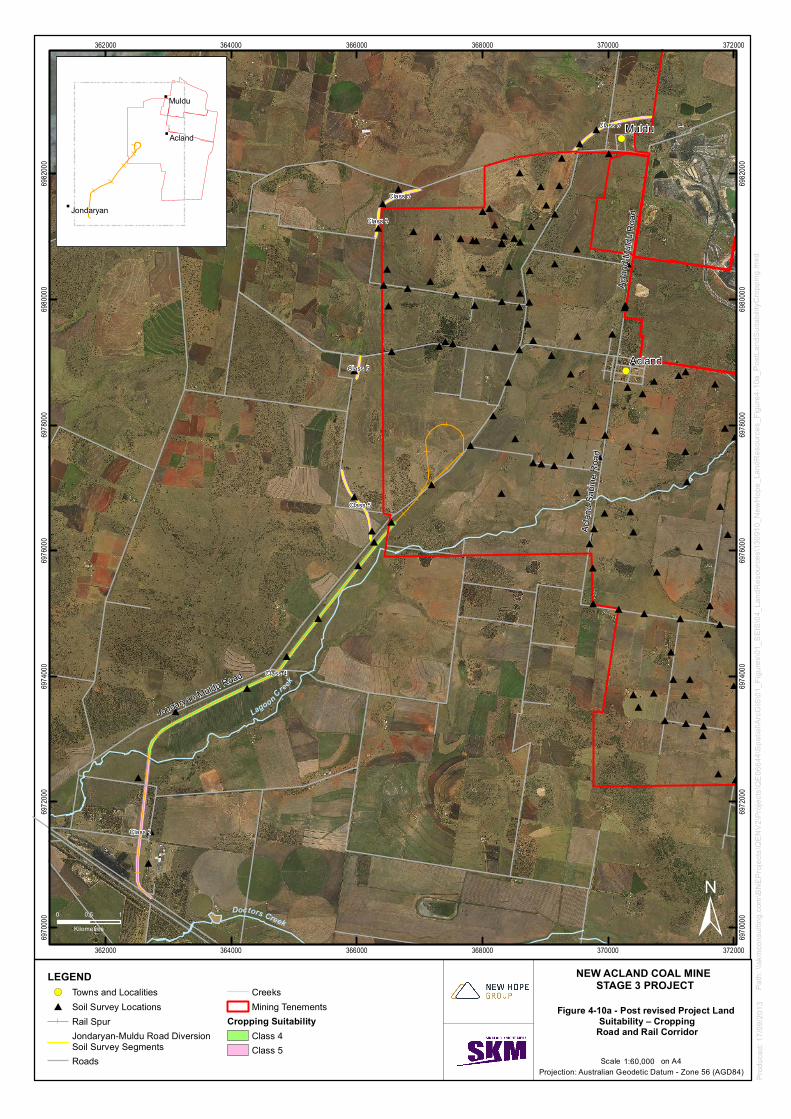
#
#
#
#
#
#
#
#
##
#
#
#
#
#
#
#
##
#
#####
##
## ##
# #
#
##
# ### ##
##
#####
## #
## #
# #
##### ###
# ## # ###
###
# ## ### #
### ### ## # # #
#
### ## ### ### #
## # # # #
### #### ## ## ##
####
# ##
# #
!(
!(
Class 4
Class 5
Class 5
Class 5
Class 5
Class 5
Class 5
Muldu
Acland
Jondaryan-Muldu Road
Acla
nd-S
abin
e R
oad
Acla
nd-M
u ldu
Roa
d
Lagoon C
reek
Doctors Creek
362000
362000
364000
364000
366000
366000
368000
368000
370000
370000
372000
372000
6970
000
6970
000
6972
000
6972
000
6974
000
6974
000
6976
000
6976
000
6978
000
6978
000
6980
000
6980
000
6982
000
6982
000
Pro
duce
d: 1
7/09
/201
3
NEW ACLAND COAL MINE STAGE 3 PROJECT
Figure 4-10a - Post revised Project Land Suitability – Cropping
Road and Rail Corridor
0 0.5 1
Kilometres
Projection: Australian Geodetic Datum - Zone 56 (AGD84)1:60,000Scale on A4
Pat
h: \\
skm
cons
ultin
g.co
m\B
NE
Pro
ject
s\Q
EN
V2\
Pro
ject
s\Q
E06
644\
Spa
tial\A
rcG
IS\0
1_Fi
gure
s\01
_SE
IS\0
4_La
ndR
esou
rces
\130
910_
New
Hop
e_La
ndR
esou
rces
_Fig
ure4
-10a
_Pos
tLan
dSui
tabi
lityC
ropp
ing.
mxd
"
"
"
Jondaryan
Acland
Muldu
±LEGEND!( Towns and Localities# Soil Survey Locations
Rail SpurJondaryan-Muldu Road Diversion Soil Survey SegmentsRoads
CreeksMining Tenements
Cropping SuitabilityClass 4Class 5

!(
!(
#
#
#
##
#
#
#
#
#
#
#
## #
#### ##### ## ##
## ## # ## ##
# ###
#
# ## #### ### ### # #
####
##### # ## ###
## # ## #
# ### # #
# # ###### #### ## ### # ## # # ## ## # ####
## ## ## #
## ##
## ### ## # # ##
### ## ### ### #
## # # # #
### #### ## ## ##
####
# ##
# #
Class 4
Class 5
Class 5
Class 5
Class 5
Class 5
Muldu
Acland
Oak
ey-C
o oya
r Roa
d
Jondarya
n-Muldu R
oad
Acla
nd-S
abin
e R
oad
Acla
nd-M
u ldu
Roa
d
Lagoon Creek
Spr ing Creek
Acland-Silverleigh Road
Pechey-Maclagan Road
366000
366000
368000
368000
370000
370000
372000
372000
374000
374000
6972
000
6972
000
6974
000
6974
000
6976
000
6976
000
6978
000
6978
000
6980
000
6980
000
6982
000
6982
000
6984
000
6984
000
Pro
duce
d: 1
9/09
/201
3
NEW ACLAND COAL MINE STAGE 3 PROJECT
Figure 4-10b -Post revised Project Land Suitability – Cropping
Mining Area
0 0.5 1
Kilometres
Projection: Australian Geodetic Datum - Zone 56 (AGD84)1:60,000Scale on A4
Pat
h: I:
\QE
NV
2\P
roje
cts\
QE
0664
4\S
patia
l\Arc
GIS
\01_
Figu
res\
01_S
EIS
\04_
Land
Res
ourc
es\1
3091
0_N
ewH
ope_
Land
Res
ourc
es_F
igur
e4-1
0b_P
ostL
andS
uita
bilit
yCro
ppin
g.m
xd
"
"
"
Jondaryan
Acland
Muldu
±LEGEND!( Towns and Localities# Soil Survey Locations
Rail SpurJondaryan-Muldu Road Diversion Soil Survey SegmentsRoads
CreeksMining Tenements
Cropping SuitabilityClass 4Class 5

New Acland Coal Mine Stage 3 Project – Environmental Impact Statement PAGE 4-39
Grazing A return to grazing should be feasible for a majority of the revised Project site post-mining and would include most of the spoil areas and also the infrastructure areas. As indicated above some limitations are expected on elevated features such as elevated landforms, depressed landforms and tailings dams. The pre and post mining areas of land suitability for grazing for the Project site is shown in Table 4-24.
Table 4-24 Pre and Post Mine Land Suitability – Grazing
Land Suitability Class
Area within Project site (ha)
% of Project site Area within Disturbance Footprint (ha)*
% of Total Disturbance Area
Pre-mining
Post- Mining
Pre-mining
Post- Mining
Pre-mining
Post- Mining
Pre-mining
Post- Mining
1 418 179 8% 3% 239 0 16% 0%
2 3084 1908 60% 37% 1176 0 77% 0%
3 1190 1997 23% 39% 74 881 5% 57%
4 449 1033 9% 20% 47 630 3% 41%
5 0 26 0% 1% 0 26 0% 2%
Total 5142 5142 - - 1537 1537 - -
Notes: 1. *The disturbance footprint comprises the mining and infrastructure areas within the revised Project site. 2. For the purpose of reporting pre and post mine land suitability it has been assumed that the road diversions are Class 5 post-mining.
Post mine land suitability for grazing activities is shown in Figure 4-11a and Figure 4-11b (i.e. for the road and rail corridor and mine area, respectively).

#
#
#
#
#
#
#
#
##
#
#
#
#
#
#
#
##
#
#####
##
## ##
# #
#
##
# ### ##
##
#####
## #
## #
# #
##### ###
# ## # ###
###
# ## ### #
### ### ## # # #
#
### ## ### ### #
## # # # #
### #### ## ## ##
####
# ##
# #
!(
!(
Class 3
Class 4
Class 5
Class 5
Class 5
Class 5
Class 5
Muldu
Acland
Jondaryan-Muldu Road
Acla
nd-S
abin
e R
oad
Acla
nd-M
u ldu
Roa
d
Lagoon C
reek
Doctors Creek
362000
362000
364000
364000
366000
366000
368000
368000
370000
370000
372000
372000
6970
000
6970
000
6972
000
6972
000
6974
000
6974
000
6976
000
6976
000
6978
000
6978
000
6980
000
6980
000
6982
000
6982
000
Pro
duce
d: 1
7/09
/201
3
NEW ACLAND COAL MINE STAGE 3 PROJECT
Figure 4-11a - Post revised Project Land Suitability – Grazing
Road and Rail Corridor
0 0.5 1
Kilometres
Projection: Australian Geodetic Datum - Zone 56 (AGD84)1:60,000Scale on A4
Pat
h: \\
skm
cons
ultin
g.co
m\B
NE
Pro
ject
s\Q
EN
V2\
Pro
ject
s\Q
E06
644\
Spa
tial\A
rcG
IS\0
1_Fi
gure
s\01
_SE
IS\0
4_La
ndR
esou
rces
\130
910_
New
Hop
e_La
ndR
esou
rces
_Fig
ure4
-11a
_Pos
tLan
dSui
tabi
lityG
razi
ng.m
xd
"
"
"
Jondaryan
Acland
Muldu
±LEGEND!( Towns and Localities# Soil Survey Locations
Rail SpurJondaryan-Muldu Road Diversion Soil Survey SegmentsRoads
CreeksMining Tenements
Grazing SuitabilitySuitability Class 3Suitability Class 4Suitability Class 5
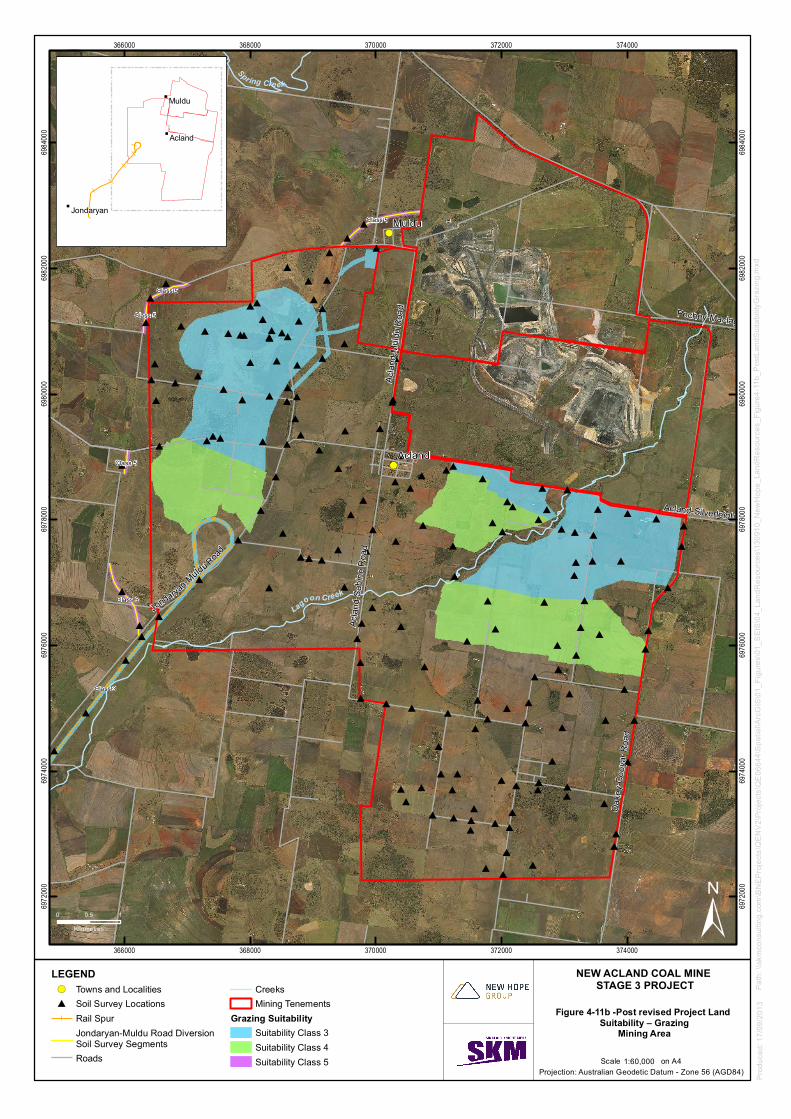
!(
!(
#
#
#
##
#
#
#
#
#
#
#
## #
#### ##### ## ##
## ## # ## ##
# ###
#
# ## #### ### ### # #
####
##### # ## ###
## # ## #
# ### # #
# # ###### #### ## ### # ## # # ## ## # ####
## ## ## #
## ##
## ### ## # # ##
### ## ### ### #
## # # # #
### #### ## ## ##
####
# ##
# #
Class 3
Class 5
Class 5
Class 5
Class 5
Class 5
Muldu
Acland
Oak
ey-C
o oya
r Roa
d
Jondarya
n-Muldu R
oad
Acla
nd-S
abin
e R
oad
Acla
nd-M
u ldu
Roa
d
Lagoon Creek
Spr ing Creek
Acland-Silverleigh Road
Pechey-Maclagan Road
366000
366000
368000
368000
370000
370000
372000
372000
374000
374000
6972
000
6972
000
6974
000
6974
000
6976
000
6976
000
6978
000
6978
000
6980
000
6980
000
6982
000
6982
000
6984
000
6984
000
Pro
duce
d: 1
7/09
/201
3
NEW ACLAND COAL MINE STAGE 3 PROJECT
Figure 4-11b -Post revised Project Land Suitability – Grazing
Mining Area
0 0.5 1
Kilometres
Projection: Australian Geodetic Datum - Zone 56 (AGD84)1:60,000Scale on A4
Pat
h: \\
skm
cons
ultin
g.co
m\B
NE
Pro
ject
s\Q
EN
V2\
Pro
ject
s\Q
E06
644\
Spa
tial\A
rcG
IS\0
1_Fi
gure
s\01
_SE
IS\0
4_La
ndR
esou
rces
\130
910_
New
Hop
e_La
ndR
esou
rces
_Fig
ure4
-11b
_Pos
tLan
dSui
tabi
lityG
razi
ng.m
xd
"
"
"
Jondaryan
Acland
Muldu
±LEGEND!( Towns and Localities# Soil Survey Locations
Rail SpurJondaryan-Muldu Road Diversion Soil Survey SegmentsRoads
CreeksMining Tenements
Grazing SuitabilitySuitability Class 3Suitability Class 4Suitability Class 5

New Acland Coal Mine Stage 3 Project – Environmental Impact Statement PAGE 4-42
Bushland Use Extensive clearing for grazing and cropping purposes has occurred over many years within the Study area. The existing conservation zone along Lagoon Creek will be extended into the area of the revised Project site. The Conservation Zone Management Plan for the revised Project is presented in Appendix J.6. In addition, the Bluegrass Offset Management Plan is located in Appendix J.8.
4.5.5. Adjacent Land Suitability
The adjacent land to the revised Project site is predominately used for dryland cropping and grazing purposes. As discussed in Section 4.2.1, the main focus of APC’s activities is to manage agricultural activities on company land both ahead of and behind the revised Project’s mine path. APC holds the majority of land adjacent to the revised Project site. Therefore, to minimise impacts on existing adjacent land use and future adjacent land use, NAC’s rehabilitation strategy is designed to allow a majority of the revised Project site to be re-incorporated into APC’s agricultural activities. As discussed in Section 4.8.3, in general, there will be a loss of land capability as a result of mining across the revised Project site. However, following successful rehabilitation, agricultural production will remain possible post mining in the form of grazing. This beneficial outcome has been demonstrated at the Mine and other NHG mine sites. The return of the revised Project land to grazing is consistent with the current land uses practised within the region and is considered a long term sustainable outcome for the revised Project.
Therefore environmental harm caused by the revised Project on adjacent land used for agricultural purposes is expected to be minimal in the long term. Future developments within the impact area and region are not expected to be negatively impacted or constrained by the revised Project’s post mine land use and/or final landform design.
Broadly, the main components of the revised Project which relate to incompatible land uses are mining and the associated infrastructure. There will be a temporary restriction on grazing activities as a result of the construction and operation of the mine and its associated infrastructure. However, as discussed in Section 4.8 a comprehensive rehabilitation strategy has been prepared for the revised Project in order to achieve to the post mine land use of grazing. The land disturbed by the revised Project will not be suitable for the purposes of conducting other agricultural activities such as cropping. Laydown areas for the revised Project’s associated infrastructure, which may be situated on adjacent land, will be rehabilitated appropriately in line with regulatory requirements.
4.6. Site Contamination
4.6.1. Potential for Contamination
The Study area has been extensively used for grazing and cropping activities for many years. During the Stage 2 EIS process, discussions were held with local landholders, the then QDPI and the former Rosalie Shire Council regarding the extent of known contaminated sites with the Study area. At the time, it was reported that there were no plunge animal dips present within the Study area as it had been free of ticks for decades.
The remains of the old underground coal mines at Acland and Balgowan are unlikely to be significantly contaminated as coal was hand sorted with no major coal washing facilities available at the time (Ison,
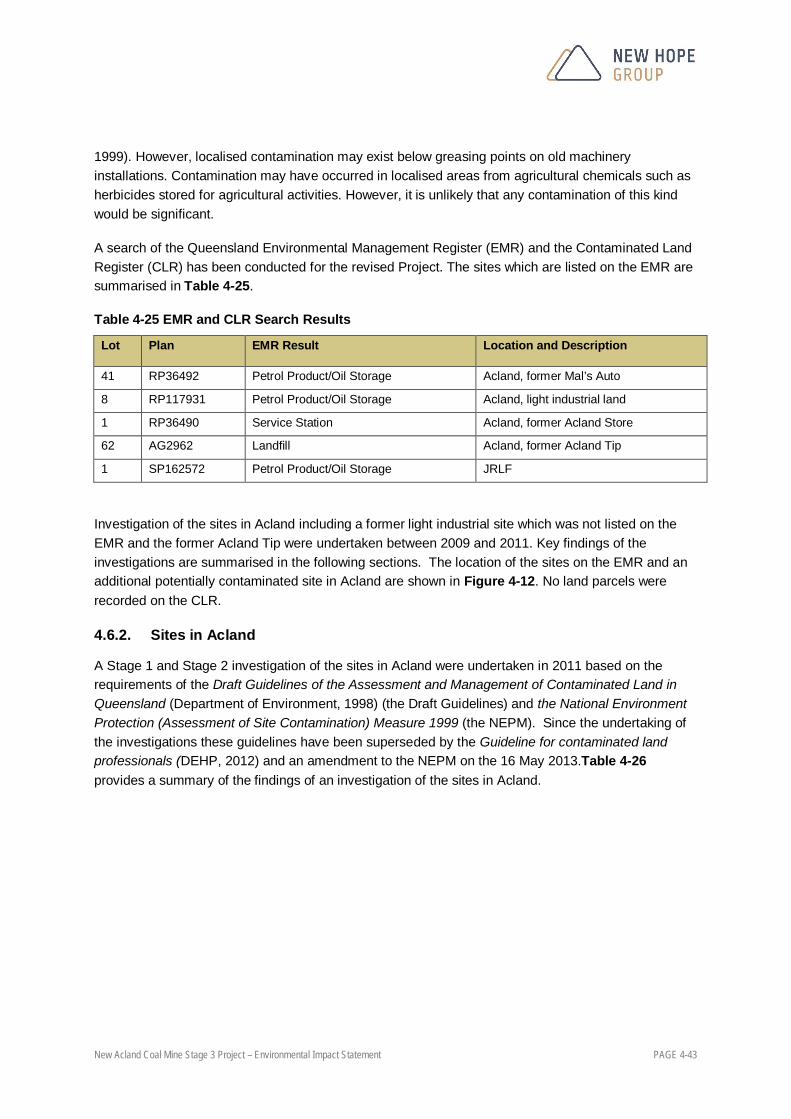
New Acland Coal Mine Stage 3 Project – Environmental Impact Statement PAGE 4-43
1999). However, localised contamination may exist below greasing points on old machinery installations. Contamination may have occurred in localised areas from agricultural chemicals such as herbicides stored for agricultural activities. However, it is unlikely that any contamination of this kind would be significant.
A search of the Queensland Environmental Management Register (EMR) and the Contaminated Land Register (CLR) has been conducted for the revised Project. The sites which are listed on the EMR are summarised in Table 4-25.
Table 4-25 EMR and CLR Search Results
Lot Plan EMR Result Location and Description
41 RP36492 Petrol Product/Oil Storage Acland, former Mal’s Auto
8 RP117931 Petrol Product/Oil Storage Acland, light industrial land
1 RP36490 Service Station Acland, former Acland Store
62 AG2962 Landfill Acland, former Acland Tip
1 SP162572 Petrol Product/Oil Storage JRLF
Investigation of the sites in Acland including a former light industrial site which was not listed on the EMR and the former Acland Tip were undertaken between 2009 and 2011. Key findings of the investigations are summarised in the following sections. The location of the sites on the EMR and an additional potentially contaminated site in Acland are shown in Figure 4-12. No land parcels were recorded on the CLR.
4.6.2. Sites in Acland
A Stage 1 and Stage 2 investigation of the sites in Acland were undertaken in 2011 based on the requirements of the Draft Guidelines of the Assessment and Management of Contaminated Land in Queensland (Department of Environment, 1998) (the Draft Guidelines) and the National Environment Protection (Assessment of Site Contamination) Measure 1999 (the NEPM). Since the undertaking of the investigations these guidelines have been superseded by the Guideline for contaminated land professionals (DEHP, 2012) and an amendment to the NEPM on the 16 May 2013.Table 4-26 provides a summary of the findings of an investigation of the sites in Acland.
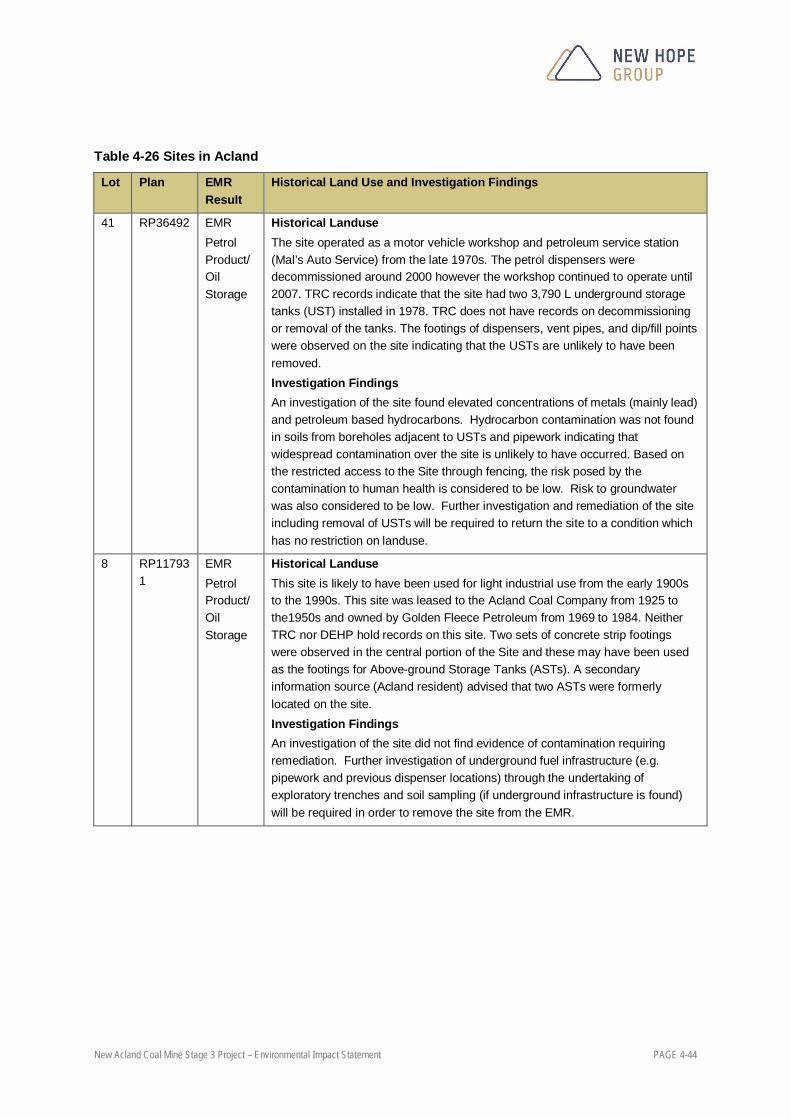
New Acland Coal Mine Stage 3 Project – Environmental Impact Statement PAGE 4-44
Table 4-26 Sites in Acland
Lot Plan EMR Result
Historical Land Use and Investigation Findings
41 RP36492 EMR Petrol Product/Oil Storage
Historical Landuse The site operated as a motor vehicle workshop and petroleum service station (Mal’s Auto Service) from the late 1970s. The petrol dispensers were decommissioned around 2000 however the workshop continued to operate until 2007. TRC records indicate that the site had two 3,790 L underground storage tanks (UST) installed in 1978. TRC does not have records on decommissioning or removal of the tanks. The footings of dispensers, vent pipes, and dip/fill points were observed on the site indicating that the USTs are unlikely to have been removed. Investigation Findings An investigation of the site found elevated concentrations of metals (mainly lead) and petroleum based hydrocarbons. Hydrocarbon contamination was not found in soils from boreholes adjacent to USTs and pipework indicating that widespread contamination over the site is unlikely to have occurred. Based on the restricted access to the Site through fencing, the risk posed by the contamination to human health is considered to be low. Risk to groundwater was also considered to be low. Further investigation and remediation of the site including removal of USTs will be required to return the site to a condition which has no restriction on landuse.
8 RP117931
EMR Petrol Product/Oil Storage
Historical Landuse This site is likely to have been used for light industrial use from the early 1900s to the 1990s. This site was leased to the Acland Coal Company from 1925 to the1950s and owned by Golden Fleece Petroleum from 1969 to 1984. Neither TRC nor DEHP hold records on this site. Two sets of concrete strip footings were observed in the central portion of the Site and these may have been used as the footings for Above-ground Storage Tanks (ASTs). A secondary information source (Acland resident) advised that two ASTs were formerly located on the site. Investigation Findings An investigation of the site did not find evidence of contamination requiring remediation. Further investigation of underground fuel infrastructure (e.g. pipework and previous dispenser locations) through the undertaking of exploratory trenches and soil sampling (if underground infrastructure is found) will be required in order to remove the site from the EMR.
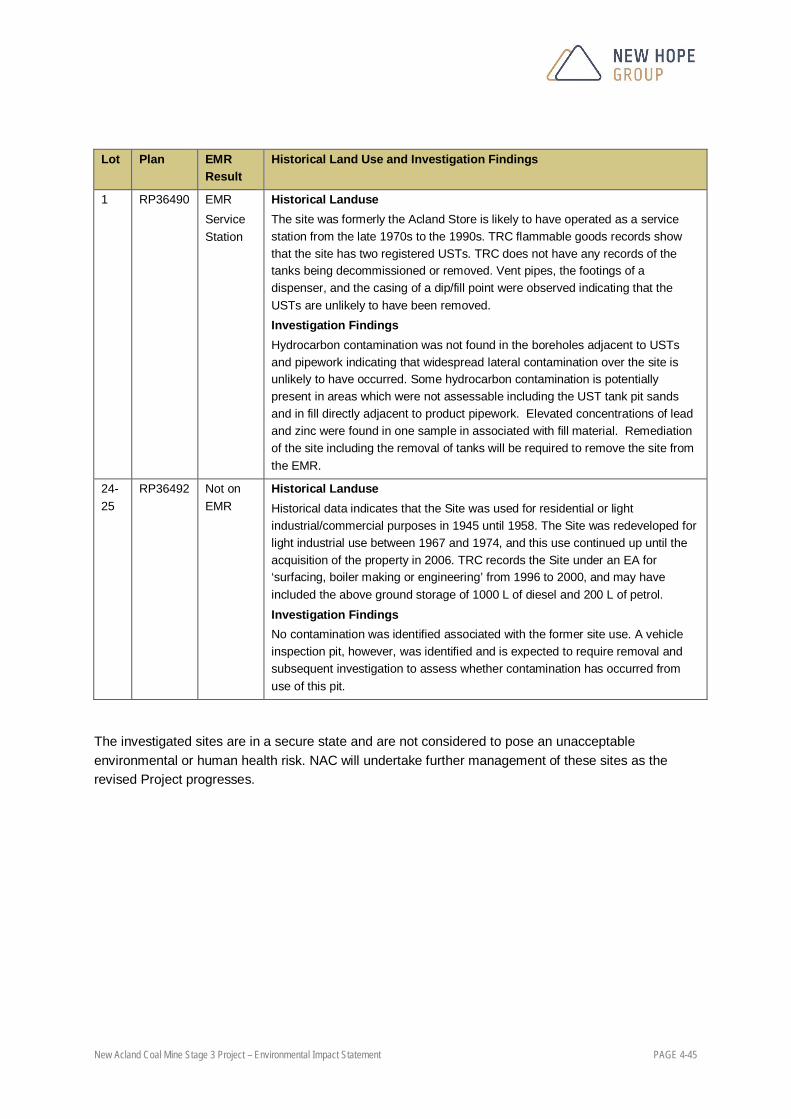
New Acland Coal Mine Stage 3 Project – Environmental Impact Statement PAGE 4-45
Lot Plan EMR Result
Historical Land Use and Investigation Findings
1 RP36490 EMR Service Station
Historical Landuse The site was formerly the Acland Store is likely to have operated as a service station from the late 1970s to the 1990s. TRC flammable goods records show that the site has two registered USTs. TRC does not have any records of the tanks being decommissioned or removed. Vent pipes, the footings of a dispenser, and the casing of a dip/fill point were observed indicating that the USTs are unlikely to have been removed. Investigation Findings Hydrocarbon contamination was not found in the boreholes adjacent to USTs and pipework indicating that widespread lateral contamination over the site is unlikely to have occurred. Some hydrocarbon contamination is potentially present in areas which were not assessable including the UST tank pit sands and in fill directly adjacent to product pipework. Elevated concentrations of lead and zinc were found in one sample in associated with fill material. Remediation of the site including the removal of tanks will be required to remove the site from the EMR.
24-25
RP36492 Not on EMR
Historical Landuse Historical data indicates that the Site was used for residential or light industrial/commercial purposes in 1945 until 1958. The Site was redeveloped for light industrial use between 1967 and 1974, and this use continued up until the acquisition of the property in 2006. TRC records the Site under an EA for ‘surfacing, boiler making or engineering’ from 1996 to 2000, and may have included the above ground storage of 1000 L of diesel and 200 L of petrol. Investigation Findings No contamination was identified associated with the former site use. A vehicle inspection pit, however, was identified and is expected to require removal and subsequent investigation to assess whether contamination has occurred from use of this pit.
The investigated sites are in a secure state and are not considered to pose an unacceptable environmental or human health risk. NAC will undertake further management of these sites as the revised Project progresses.

!(
62AG2962
Aclan
d-Sab
ine R
oad
Aclan
d Muld
u Roa
d
Acland
370500
370500
371000
371000
371500
371500
372000
372000
6978
500
6978
500
6979
000
6979
000
6979
500
6979
500
NEW ACLAND COAL MINE STAGE 3 PROJECT
Figure 4-12 - Potentially Contaminated Sites
Projection: Australian Geodetic Datum – Zone 56 (AGD84)
Prod
uced
: 18/0
9/201
3Pa
th: I:\
QENV
2\Proj
ects\
QE06
644\S
patia
l\ArcG
IS\01
_Figu
res\01
_SEI
S\04
_Lan
dRes
ource
s\130
909_
NewH
ope_
Land
Reso
urces
_Figu
re4-12
_Pote
ntialC
ontam
inated
Sites
.mxd
1:8,000Scale on A4
LEGEND!( Towns and Localities
RoadsCadastrePotentially Contaminated Site
±0 200 400Meters
!(
1SP162572
Jondaryan

New Acland Coal Mine Stage 3 Project – Environmental Impact Statement PAGE 4-47
4.6.3. Acland Tip
The former Acland Tip (the Tip) is located approximately 1.5 km east of Acland near the intersection of Acland Road and Wileroo Mine Road and is displayed in Photograph 4-2. The Tip is now owned and managed by TRC.
Photograph 4-2 Acland Tip
TRC has advised that the site was used as a tip from 1977 to 2008 and the majority of wastes disposed were non-putrescible, mainly comprising building waste and domestic waste. Wastes were disposed in pits which were excavated at the Tip on an as required basis. As wastes were disposed, they were progressively compacted and covered with soil.
An intrusive ground investigation of the Tip was undertaken in 2009. The purpose of the investigation was to:
estimate the volume of material in the Tip; gain an understanding of the likely composition of the material in the Tip; and develop a strategy for the relocation and management of the Tip.
The investigation comprised 15 trial trenches excavated in the waste material and six trial pits excavated around the perimeter of the Tip to confirm the horizontal extent of the waste material.
New Acland Coal Mine Stage 3 Project – Environmental Impact Statement PAGE 4-48
Figure 4-13 shows the location of the trial trenches and pits and the approximate horizontal extent of the waste material.
Based on the investigation, it has been estimated that the Tip contains approximately 61 500 m3 of soil and waste material. Wastes observed were found to be mainly comprised of solid general waste such as plastics, glass, metal, textiles, construction/demolition waste (e.g. brick, wood, and concrete), and domestic waste. Regulated waste were observed infrequently and included asbestos cement sheeting, disused pesticide containers, empty fuel cans, tyres, and oily substances. Groundwater and leachate was not encountered on the site during the investigation. Samples of cover material, soil and waste material and underlying natural ground were collected. The majority of samples had low concentrations of potential contaminants such as metals, petroleum based hydrocarbons, and pesticides.
In order to mine the resource beneath the Tip, the material will need to be relocated to an appropriate waste disposal facility. The preferred strategy for the remediation of the Tip is to relocate the soil and waste material to an engineered containment cell within one of the existing mine pits. If this strategy is not feasible, the soil and waste material will be disposed at an appropriate landfill facility.

"J "J
"J
"J
"J"J #7 #7
#7
#7
#7#7
#7
#7#7
#7#7
#7
#7
#7
#7
TP1
TP2
TP3TP4
TP6
TP7
TP5TP9TP8
TP15
TP16
TP12TP18
TP19TP20
TP21
TP10TP11
TP14
TP13TP17
372000
372000
Pro
duce
d: 1
3/09
/201
3
NEW ACLAND COAL MINE STAGE 3 PROJECT
Figure 4-13 - Acland Tip Trial Trenches
0 0.1 0.2
Kilometres
Projection: Australian Geodetic Datum - Zone 56 (AGD84)1:4,000Scale on A4
Pat
h: \\
skm
cons
ultin
g.co
m\B
NE
Pro
ject
s\Q
EN
V2\
Pro
ject
s\Q
E06
644\
Spa
tial\A
rcG
IS\0
1_Fi
gure
s\01
_SE
IS\0
4_La
ndR
esou
rces
\130
910_
New
Hop
e_La
ndR
esou
rces
_Fig
ure4
-13_
Acl
andT
ipTr
ialT
renc
hes.
mxd
"
"
Acland
Muldu
±LEGEND!( Towns and Localities
"J Trial Pit on Tip Perimeter
#7 Trial Trench in TipRail SpurRoadsCreeks
CadastreMining TenementsAcland Tip Boundary (approximate)Acland Tip Site Boundary (approximate)

New Acland Coal Mine Stage 3 Project – Environmental Impact Statement PAGE 4-50
4.6.4. Contamination Prevention and Control
The principle risks of land contamination for the revised Project arise from hydrocarbon spills and from the potential for acid, neutral, saline and metalliferousdrainage (AMD). The management of mine waste for AMD control is discussed in Section 4.7.5. The revised Project is expected to pose a minimal risk of AMD based on the results and experiences from the existing mining operations.
The mine workshop and fuel storage areas are recognised as having the potential to contaminate land through hydrocarbon spills. Potential for land contamination from the spilling of hydrocarbons will be minimised through the use of the existing standard operating procedures for the transport, handling and storage of hydrocarbons. All hydrocarbons will be stored and handled in accordance with the bunding requirements (Section 5.8 Bunds and Compounds) of AS 1940:2004: ‘The Storage and handling of combustible and flammable liquids’. Chemical storage areas will be suitably bunded and constructed to minimise the potential for leaks to occur. All chemicals will be stored, handled and used according to provisions in their Material Safety Data Sheet (MSDS).
To minimise the risk associated with fuel oil leaking during tanker unloading, the following measures will be implemented:
a program of regular equipment inspection and testing will be implemented to ensure reliable performance;
operators will be trained in the safe operation of the system and emergency procedures in the event of fuel oil leakage;
spill containment equipment will be available at the unloading pad for use in the event of spillage; a sump will be provided to collect any spillage and allow recovery; ignition sources will be strictly controlled and limited to avoid a fire; appropriate fire fighting materials and equipment will be available to suppress fires; and an approved fire protection system will be installed around hydrocarbon storage areas.
The following measures will be taken to minimise the potential for the leakage of fuel oil from storage tanks:
adequate bunding will be constructed to contain potential spills, in accordance with AS 1940:2004; tank level indicators will be installed on fuel oil tanks for monitoring of fuel oil levels; maintenance of fuel oil tanks will be undertaken, to ensure safe and effective operation of all
components; and tanks will be designed in accordance with AS 1692:2006: ‘Steel tanks for flammable and
combustible liquids’ to minimise the potential for failure.

New Acland Coal Mine Stage 3 Project – Environmental Impact Statement PAGE 4-51
4.7. Mine Waste Characterisation and Management
This Section provides an assessment of the geochemical characteristics of the revised Projects mine waste including overburden, interburden, coal floor, coal roof, coal partings and reject coal. Processed mine waste includes fine and coarse coal washery rejects.
The objective of the geochemical assessment is to determine the:
potential for acid drainage; potential for neutral pH / saline drainage; concentrations of trace metals in the mine waste; and feasibility of using the mine waste for site rehabilitation.
Most coal mines in Queensland do not typically produce drainage that has elevated concentrations of acid, metals or salts and this is due to the way in which the coal deposits were formed. The environmental impacts from coal mines can however include drainage that has neutral pH, and that may have low to moderate concentrations of salts such as sodium, chloride and sulphate.
Whereas the results resented in this section of the report have determined that some of the waste may be potentially acid forming surface water quality monitoring data from 10 years of mining at the Mine has not identified acid or metalliferous mine drainage. This finding is consistent with the geology (depositional history) of the Walloon Coal Measures, which constitutes the Mine’s current reserves and the revised Project’s new resource areas. The alkaline nature of some of the overburden and interburden also provides a significant neutralising effect against any potentially acid forming waste rock material. For the purposes of this Section, the Study area includes all land within MLA 50232.
4.7.1. Study Area Stratigraphy
The regional and local geology for the revised Project site is provided in Section 4.3 and Chapter 6 provides a comprehensive assessment of the geological constraints for the revised Project.
The major coal bearing unit within the revised Project site is known as the Acland/Sabine Sequence and is characterised by coal seam and interburden discontinuity. Discontinuity of coal seams, intra seam partings and seam interburden is a feature of the Walloon Coal Measures and can be demonstrated in the highwalls of the open cut coal mines, such as New Acland, Ebenezer and Jeebropilly, which all operate in the Walloon Coal Measures. Table 4-27 provides a stratigraphic description of the Walloon Coal Measures, as they occur within the revised Project site.
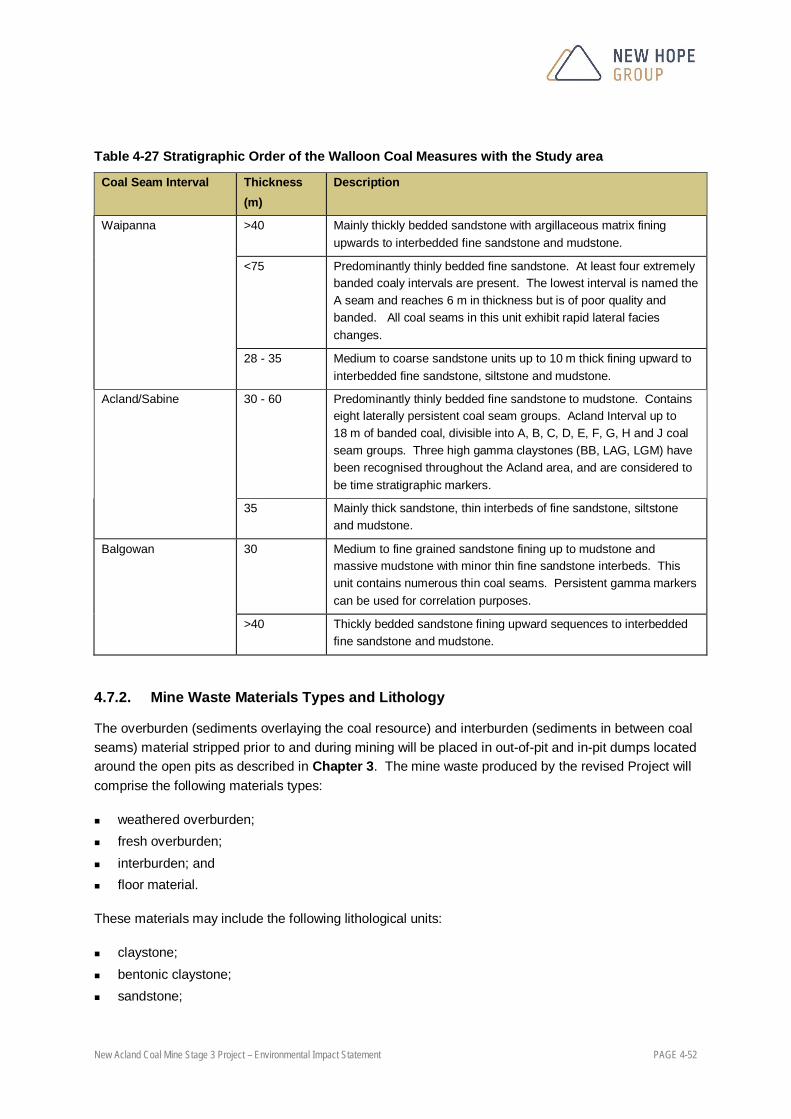
New Acland Coal Mine Stage 3 Project – Environmental Impact Statement PAGE 4-52
Table 4-27 Stratigraphic Order of the Walloon Coal Measures with the Study area
Coal Seam Interval Thickness (m)
Description
Waipanna >40 Mainly thickly bedded sandstone with argillaceous matrix fining upwards to interbedded fine sandstone and mudstone.
<75 Predominantly thinly bedded fine sandstone. At least four extremely banded coaly intervals are present. The lowest interval is named the A seam and reaches 6 m in thickness but is of poor quality and banded. All coal seams in this unit exhibit rapid lateral facies changes.
28 - 35 Medium to coarse sandstone units up to 10 m thick fining upward to interbedded fine sandstone, siltstone and mudstone.
Acland/Sabine 30 - 60 Predominantly thinly bedded fine sandstone to mudstone. Contains eight laterally persistent coal seam groups. Acland Interval up to 18 m of banded coal, divisible into A, B, C, D, E, F, G, H and J coal seam groups. Three high gamma claystones (BB, LAG, LGM) have been recognised throughout the Acland area, and are considered to be time stratigraphic markers.
35 Mainly thick sandstone, thin interbeds of fine sandstone, siltstone and mudstone.
Balgowan 30 Medium to fine grained sandstone fining up to mudstone and massive mudstone with minor thin fine sandstone interbeds. This unit contains numerous thin coal seams. Persistent gamma markers can be used for correlation purposes.
>40 Thickly bedded sandstone fining upward sequences to interbedded fine sandstone and mudstone.
4.7.2. Mine Waste Materials Types and Lithology
The overburden (sediments overlaying the coal resource) and interburden (sediments in between coal seams) material stripped prior to and during mining will be placed in out-of-pit and in-pit dumps located around the open pits as described in Chapter 3. The mine waste produced by the revised Project will comprise the following materials types:
weathered overburden; fresh overburden; interburden; and floor material.
These materials may include the following lithological units:
claystone; bentonic claystone; sandstone;

New Acland Coal Mine Stage 3 Project – Environmental Impact Statement PAGE 4-53
mudstone; carbonaceous mudstone; ironstone bands; siderite; and shale.
The floor material close to the coal beds, which has been characterised in this assessment, is considered to be representative of the future tailings and coarse rejects material that will be generated following the coal processing. Tailings will be disposed of in in-pit tailings disposal facilities. Coarse rejects will be disposed of within the in-pit mine waste dumps. Chapter 3 provides additional information on tailings management. This assessment provides a summary of the tailings potential for generating acidic conditions and mitigation measures to prevent or minimise environmental harm.
4.7.3. Geochemical Sampling Programmes
In 1999, Land Reclamation Services produced a geochemical assessment report to identify potential acid drainage, salinity, sodicity and metal leaching issues that may be associated with the waste rock dumps or exposed pit wall/floor resulting from development of the initial Project. The study area included the Mine and the proposed expansion area. The purpose of the assessment was to determine the nature of wastes generated by mining and to develop disposal strategies.
The samples were obtained from three primary sources:
chip samples of full profiles and of weathered profiles where coring began; crushed interburden samples; and core samples of lower weathered strata and interburden taken from cores that had been
previously sampled for coal. The 1999 analysis of mine waste samples included: 171 analyses for pH and electrical conductivity (EC); 49 samples for acid neutralising capacity (ANC) and net acid producing potential (NAPP); 36 for Net Acid Generating (NAG) testing; 38 samples for chemical and physical analysis; and 18 samples were analysed for 43 elemental concentrations of major, minor and trace elements.
During mid-2007, NAC undertook a supplementary drilling and mine waste sampling program which was conducted in conjunction with the groundwater investigations for the revised Project. A total of 11 drill holes were completed during 5 March 2007 to 1 April 2007, which comprised eight holes within the Manning Vale resource area, two holes within the Sabine resource area, and one hole within the Willaroo resource area. Figure 4-14 displays the location data for the 11 drill holes.
Chip samples were collected and composited over representative drill depths and combined into each of the major waste types sampled within each of the revised Project’s resources areas. This methodology was used to provide a general assessment of the geochemical status of each major waste type across the Study area rather than from each individual drill hole within a specific resource area. The methodology applied is based on a ‘low risk’ acid generating geochemical environment

New Acland Coal Mine Stage 3 Project – Environmental Impact Statement PAGE 4-54
occurring within the overburden. This methodology also allowed for re-analysis of a particular lithological split on an individual drill hole basis, if a problem was identified by the results.
In total, 26 composite samples representing 12 major waste types were collated for geochemical analysis, comprising 17 samples from the Manning Vale resource area, four samples from the Sabine area, and five samples from the Willaroo resource area.
The 2007 analysis of mine waste samples included:
26 analyses for pH and EC; 26 samples for ANC and NAPP; 26 for NAG testing; 26 samples for chemical and physical analysis; and 26 samples were analysed for 43 elemental concentrations of major, minor and trace elements.
The combined analyses in 1999 and 2007 include the following sample numbers.
197 analyses for pH and EC; 75 samples for ANC and NAPP; 62 for NAG testing; 62 samples for chemical and physical analysis; and 44 samples were analysed for 43 elemental concentrations of major, minor and trace elements.

"
##
#
#
#
# #
#
#
#
#
!(
!(
ML5
0170
ML5
0 216
MLA
502 3
2
ML5
0216
Manning Vale West Pit
Willeroo Pit
Manning Vale East Pit
122 123
113
124
117
112 111
126
119
125
110
Warrego Highway
Jond
arya
n-Muld
u Road
Acland-Silverleigh Road
Pechey-Maclagan Road
Acland-Sabine Road
Oak
ey-C
ooya
r Roa
d
Oakey-Cooyar Road
Acla
nd-M
u ldu
Roa
d
Cain Creek
Spring Creek
Doctors Creek
Lagoon
Cre ek
Acland
Muldu
365000
365000
370000
370000
375000
375000
6970
000
6970
000
6975
000
6975
000
6980
000
6980
000
6985
000
6985
000
Pro
duce
d: 1
6/09
/201
3
NEW ACLAND COAL MINE STAGE 3 PROJECT
Figure 4-14 - Geochemical Investigation Sties
0 1 2 3 4
Kilometres
Projection: Australian Geodetic Datum – Zone 56 (AGD84)1:85,000Scale on A4
Pat
h: I:
\QE
NV
2\P
roje
cts\
QE
0664
4\S
patia
l\Arc
GIS
\01_
Figu
res\
01_S
EIS
\04_
Land
Res
ourc
es\1
3091
6_N
ewH
ope_
Land
Res
ourc
es_F
igur
e4-1
4_G
eoch
emic
alIn
vest
igat
ionS
ites.
mxd
±LEGEND!( Towns and Localities# Geochemical Sample Site
" Train Loadout FacilityRail SpurJondaryan-Muldu Road DiversionRoadsCreeks
Mining TenementsStage 3 Pit AreasCHPP PrecinctMaterial Handling FacilityMine Industrial Area
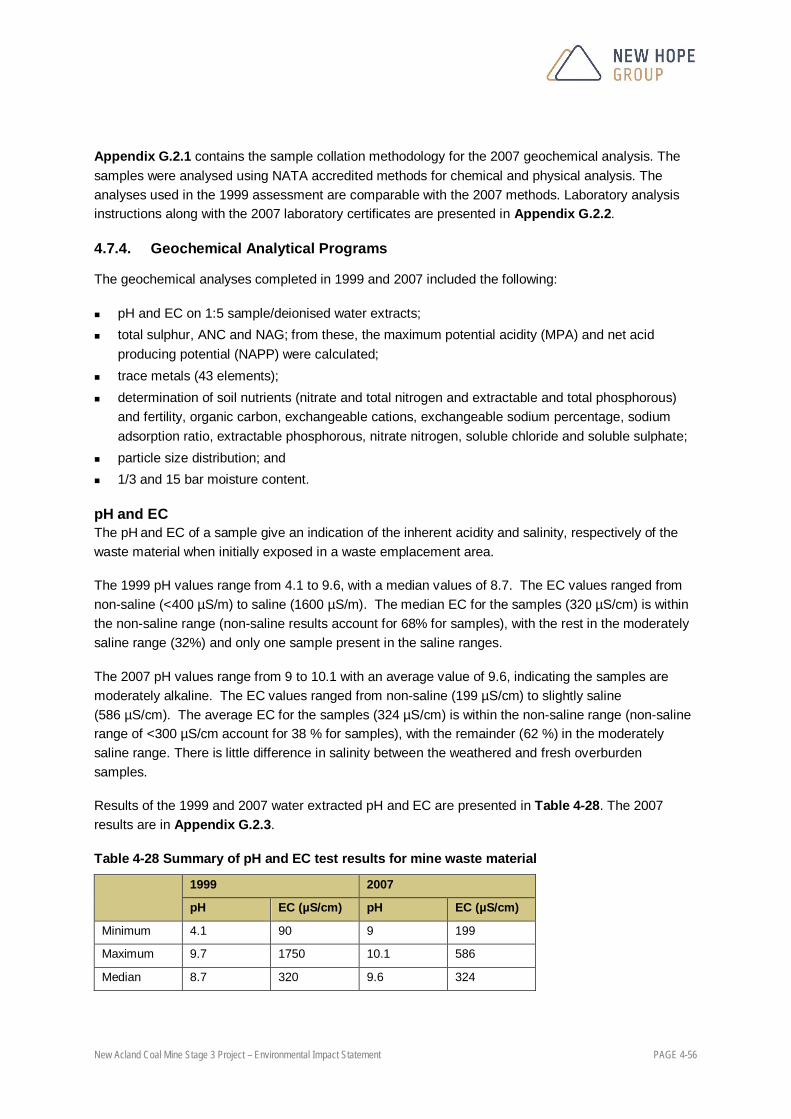
New Acland Coal Mine Stage 3 Project – Environmental Impact Statement PAGE 4-56
Appendix G.2.1 contains the sample collation methodology for the 2007 geochemical analysis. The samples were analysed using NATA accredited methods for chemical and physical analysis. The analyses used in the 1999 assessment are comparable with the 2007 methods. Laboratory analysis instructions along with the 2007 laboratory certificates are presented in Appendix G.2.2.
4.7.4. Geochemical Analytical Programs
The geochemical analyses completed in 1999 and 2007 included the following:
pH and EC on 1:5 sample/deionised water extracts; total sulphur, ANC and NAG; from these, the maximum potential acidity (MPA) and net acid
producing potential (NAPP) were calculated; trace metals (43 elements); determination of soil nutrients (nitrate and total nitrogen and extractable and total phosphorous)
and fertility, organic carbon, exchangeable cations, exchangeable sodium percentage, sodium adsorption ratio, extractable phosphorous, nitrate nitrogen, soluble chloride and soluble sulphate;
particle size distribution; and 1/3 and 15 bar moisture content.
pH and EC The pH and EC of a sample give an indication of the inherent acidity and salinity, respectively of the waste material when initially exposed in a waste emplacement area.
The 1999 pH values range from 4.1 to 9.6, with a median values of 8.7. The EC values ranged from non-saline (<400 µS/m) to saline (1600 µS/m). The median EC for the samples (320 µS/cm) is within the non-saline range (non-saline results account for 68% for samples), with the rest in the moderately saline range (32%) and only one sample present in the saline ranges.
The 2007 pH values range from 9 to 10.1 with an average value of 9.6, indicating the samples are moderately alkaline. The EC values ranged from non-saline (199 µS/cm) to slightly saline (586 µS/cm). The average EC for the samples (324 µS/cm) is within the non-saline range (non-saline range of <300 µS/cm account for 38 % for samples), with the remainder (62 %) in the moderately saline range. There is little difference in salinity between the weathered and fresh overburden samples.
Results of the 1999 and 2007 water extracted pH and EC are presented in Table 4-28. The 2007 results are in Appendix G.2.3.
Table 4-28 Summary of pH and EC test results for mine waste material
1999 2007
pH EC (µS/cm) pH EC (µS/cm)
Minimum 4.1 90 9 199
Maximum 9.7 1750 10.1 586
Median 8.7 320 9.6 324

New Acland Coal Mine Stage 3 Project – Environmental Impact Statement PAGE 4-57
Net Acid Producing Potential It is standard practice to use the total sulphur concentration to calculate the MPA of a sample. The use of total sulphur is a conservative approach and assumes that all sulphur is present as acid producing sulphide minerals. The ANC of a rock is the inherent ability of a rock to neutralise the acidity, due to the minerals it contains. Carbonates provide an excellent neutralisation capacity, other materials such as silicates and clays may also provide some ANC. The NAPP value is a qualitative measure of the difference between the capacity of a sample to generate acid (MPA) and its capacity to neutralise acid (ANC). If the MPA value is less than the ANC, then the NAPP is negative, indicating the sample may have sufficient ANC to prevent acid generation. Conversely if MPA is greater than the ANC, then the NAPP is positive, indicating that the material may be acid generating. Where the NAPP is between -10 and +10 kg/t H2SO4, these samples are in the ‘uncertain’ range and further (kinetic) testing may be required to determine the likelihood for acid generation. A key indicator of AMD risk is the abundance of sulphide materials in the rocks that are exposed to air and water. The total sulphur analysis provides a method of screening samples that may comprise acid-producing material in the form of pyrite sulphur. Generally when total sulphur is less than 0.2 % there is a negligible risk of acid generation (CoA, 1997).
The total sulphur content within the 1999 samples was <0.1 % to 0.3 %, with 63 % of the samples having a sulphur concentration of less than 0.1 %. The total sulphur content within the 2007 samples was 0.01 % to 0.22 %, with 12 % (3 samples) of the samples having a sulphur concentration of less than 0.03 %. Two samples have sulphur concentrations greater than 0.1 % (Samples 13 and 25). These samples were sourced from the interburden material (B and C split). All NAPP values for the samples were negative, although seven samples (27 %) are within the -10 to +10 kg/t H2SO4 range indicating a level of uncertainty in its classification. Five of these are from the B, C and D splits (interburden). NAPP values within the mid-layers of the interburden (Splits B, C and D) were generally negative, therefore having a higher acid production potential than the weathered and fresh overburden and the floor material. Total sulphur, ANC, NAPP and NAG results are presented in Appendix G.2.3. A summary of the results are shown in Table 4-29 and Table 4-30.
NAG The NAG test is used in association with the NAPP to classify the acid generating potential of a sample. A NAG pH of less than 4.5 indicates that the sample is net acid-generating (CoA, 2007). Two of the samples (samples 13 and 25, from the B and C splits, respectively) had NAG pH below 4.5, indicating the potential for acid generation. NAG results are presented in Appendix G.2.3. A summary of the results are shown in Table 4-29 and Table 4-30.
The NAG method is known to have limitations in measuring acid producing potential in coal mine waste when there is carbonaceous material present. This is because the hydrogen peroxide used in the NAG test can oxidise organic carbon and produce organic acid (not acid drainage associated with sulphide minerals).

New Acland Coal Mine Stage 3 Project – Environmental Impact Statement PAGE 4-58
Table 4-29 Summary of acid forming characteristic test results for waste rock material from 1999
Number of Samples Total S (%)
ANC (kg H2SO4/t)
NAPP (kg H2SO4/t)
NAG (kg H2SO4/t)
NAG pHOx
Minimum 49
<0.1 -2 -83 <1 5.5
Maximum 0.3 83 11 2 8.3
Median <0.1 6 -5 <1
Table 4-30 Summary of acid forming characteristic test results for waste rock material from 2007
Number of Samples Total S (%)
ANC (kg H2SO4/t)
NAPP (kg H2SO4/t)
NAG (kg H2SO4/t)
NAG pHOx
Minimum
26
0.01 3 -137 <0.1 2.8
Maximum 0.22 138 -0.9 78 9.6
Median 0.1 29 -27.1
4.7.5. Geochemical Mine Waste Classification
Individually, while the NAPP and NAG tests have limitations, a combination of these test results greatly increases the accuracy of AMD predictions. Based on these tests, the samples were further classified as Non-Acid forming (NAF), Potentially Acid Forming (PAF), PAF – Low Capacity (LC) and Acid Consuming Material (ACM). The classification criteria are based on the guideline Managing Acid and Metalliferous Drainage, Commonwealth of Australia (2007) and is summarised in Table 4-31.
Table 4-31 Geochemical Classification based on NAPP and NAG test data
NAPP (kg H2SO4/t) NAG pH
Potentially Acid Forming (PAF) >10 <4.5
Potentially Acid Forming – Low Capacity (PAF-LC) 0 to 10 <4.5
Non-Acid Forming (NAF) Negative 4.5
Acid Consuming (ACM) Less than -100 4.5
Uncertain Positive 4.5
Negative <4.5
Positive <4.5
Source: CoA (2007)
The 1999 samples were classified as Non-Acid Forming (NAF) and Potentially Acid Forming (PAF). PAF samples that have only low acid generating capacity were further classified as Potentially Acid Forming-Lower Capacity (PAF-LC). PAF-LC materials may be amenable to blending with acid consuming waste rock materials or treatment by incorporation of agricultural lime to reduce or eliminate the potential for acid production.

New Acland Coal Mine Stage 3 Project – Environmental Impact Statement PAGE 4-59
The 2007 results are in Appendix G.2.4. The results show that all samples, except samples 13 and 25 are NAF. Samples 13 and 25 have been classified as ‘Uncertain’, indicating there may be a potential for these rocks to generate acid, and a precautionary approach should be taken until further testing confirms or negates this potential. These samples, which are from the interburden material, have low NAG pH values and relatively high total sulphur concentrations of 0.22 % and 0.12 %. They also have NAPP values very close to 0 kg H2SO4/t and therefore based on Table 4-31, are very close to the PAF-LC category as described in Appendix G.2.4. These samples may require measures to reduce or eliminate the potential for acid production. One of the samples from the fresh overburden (sample 3), was classified as acid consuming, indicating this material may be amenable to blending with PAF and PAF-LC materials. A summary of the number of samples within each of the main waste types is in Table 4-32.
Table 4-32 Mine Waste Summary by Waste Type
Number of Samples 1999
Number of Samples 2007
Potentially Acid Forming (PAF) 3
Potentially Acid Forming – Low Capacity (PAF-LC) 19
Non-Acid Forming (NAF) 78 24
Uncertain 2
Elemental Enrichment In 1999, 18 samples were selected for multi-element testing of solids and water extracts to obtain more information on the relative elemental enrichment and solubilities of materials. Results of multi-element scans for the 18 selected solids were compared to the median soil abundance to highlight enriched elements. Results show that in addition to S, there is some enrichment of As, Bi, Cd and Se, with some slight enrichment of Hg and Zn in isolated strata.
In 2007, 26 samples were subjected to multi-element testing of solids to assess relative elemental enrichment and to identify the presence of any elements at concentrations of environmental significance. Concentrations are compared with average crustal abundances (Bowen, 1979) by comparing them to the applicable soil guideline. Results of multi-element analysis of waste rock sample solids are presented in Appendix G.2.5. Results compared against the average crustal abundance show that in addition to S, there is some enrichment of Ag, As, Bi, Cd, Cs, Ga, Li, Pb, Sb, W and Zn in many samples, although values are not significantly above the averages. All samples tested have metal concentrations in solids well below the EPA (1998) and NEPC (1999) guideline criteria for soils, with the exception of Mn. The concentrations of Mn were above the EPA (1998) guidelines in 9 of the 26 samples, which are sourced from the weathered and fresh overburden, the E4 split interburden and two of the floor samples.
Nutrients Nutritionally, the materials are low in calcium, magnesium and potassium, while nitrate levels are variable (between 0.5 mg/kg to 259 mg/kg), with generally higher concentrations found in the interburden and fresh overburden. Sulphate levels are moderate to high, with higher concentrations

New Acland Coal Mine Stage 3 Project – Environmental Impact Statement PAGE 4-60
found in the interburden and fresh overburden (compared with the weathered overburden). Levels of extractable phosphorous are low in all samples (<2 mg/kg) except for two samples in the fresh overburden (Samples 19 and 23) as described in Appendix G.2.6.
The cation exchange capacity (CEC) is an indicator of a soil’s fertility, as it measures a soil's ability to supply three important plant nutrients: calcium, magnesium and potassium. Cations are held on the surface of charged soil minerals, organic matter and within the crystalline framework of clay minerals. The ratio of individual cations (calcium, magnesium, potassium and sodium) to the potential CEC is particularly important in the overall geochemical analysis. An imbalance of these ratios is linked to poor soil properties and low fertility, which can have implications for rehabilitation of mined land. The samples have moderate CEC values ranging from 15 meq/100g to 38 meq/100g.
Particle size analysis varies depending on the sedimentary strata encountered, however most strata have relatively high silt contents. The weathered and fresh overburden samples have slightly higher clay percentages than the interburden and floor samples as described in Appendix G.2.7.
Sodicity and Dispersion Exchangeable sodium (Na) tests were carried out on samples in 1999 and 2007 to provide a preliminary indication of any sodicity and dispersion issues associated with the waste rock materials. Results from 2007 are presented in full in Appendix G.2.6.
The exchangeable sodium percentage (ESP) is a measure of exchangeable Na as a percentage of the total effective cation exchange capacity, and is also an indicator of soil fertility and suitability for pasture. The ESP can be used to classify samples according to sodicity as follows:
ESP < 6% - Non-Sodic; ESP 6-15% - Sodic; ESP 15-30% - Strongly Sodic; and ESP >30% - Very Strongly Sodic.
Sodicity levels within the 1999 samples are generally moderate. ESP’s varied from non-sodic (<6%) to sodic (6-15%), with a maximum value of 27%. One sample tested was strongly sodic (>15%). A large proportion of the samples tested (12 of the 38 total) had non-sodic ESP values. There were twenty-six samples with a sodic ESP.
Sodicity levels within the 2007 samples range from 3.6 % (non-sodic) to 30.1 % (very strongly sodic), however the majority of the samples (77 %) have ESP values less than 15 %. The samples with the highest ESP values are from the floor material (Samples 17, 9 and 21), although three samples are also from the fresh overburden and interburden material (CD6 split and E4 split). These samples are considered sodic soils and it is unlikely that these materials will be suitable for rehabilitation without treatment or topsoil, as there is a higher risk of dispersion. Sodic materials also tend to form low permeability soil horizons, accelerating erosion and inhibiting plant growth. Sodic soils should not be used as construction materials since they are prone to tunnelling and collapse.
The Sodium Adsorption Ratio (SAR) is a measure of the comparative concentration of sodium to calcium and magnesium. It is another tool in characterising salt affected soils. The samples with high

New Acland Coal Mine Stage 3 Project – Environmental Impact Statement PAGE 4-61
ESP, also have a high SAR (above 12), as do samples 1, 2, 19, 5, 7, 15 and 8, which are sourced from the overburden and interburden horizons. These rocks should be managed in the same way rocks with elevated sodicity values.
Summary of Results The results from the 1999 and 2007 geochemical reports state that the:
weathered mine waste could be considered to be saline; non-weathered mine waste will have low salinity; most of the samples analysed have neutral to mildly alkaline pH, however some samples of PFA
and PAF-LC waste including carbonaceous shale may have slightly acid pH; potential for sodicity is generally moderate and does not reach the extremely high levels in the
Bowen Basin (Shell Coal, 1999); the majority of samples analysed are considered to be NAF; there are a smaller number of samples that were classified as PAF and PAF-LC and there have
been no incidences of acid drainage at the Mine since operations commenced; NAG method that was used is not suitable to characterise materials with high organic carbon
content ; and there is some minor enrichment of metals and metalloids, but this is not apparent in water quality
data.
4.7.6. Mine Waste Management
Approximately 396 Mbcm of mine waste material will be disposed of in-pit (below pit crest) and approximately 50 Mbcm will be placed external to the mine pits. The revised Project’s out-of-pit dumps will be constructed using 10 m lifts on external dump faces, with a maximum working dump lift height of 30 m. The landform will be recontoured from angle of repose slopes to a slope angle of 8.5 degrees to 17 degrees. Rehabilitation methods are included in Section 4.8.
Based on historic site information and the available geochemical assessments from 1999 and 2007 the mine waste types that will be disturbed by the revised Project are considered to present negligible risk in terms of acid generation. The outcome of the studies completed in 1999 and 2007 indicate that 26 of the 124 samples contained low concentrations acid producing minerals; however the NAPP and NAG tests suggest that overall the in-situ acid neutralising capacity of the mine waste will be sufficient to neutralise all acid that is produced. This would result in seepage from these materials having neutral pH and, potentially, elevated concentrations of some salts (e.g. sodium, chloride and sulphate).
Although the overall indication is that little to no acid generation will occur from the oxidation of sulphide minerals contained within the mine waste, this material will be evaluated regularly during mining operations to assess its acid generating capacity. The revised Project’s surface water monitoring program will continue to be used to help identify occurrences of acid generation. The following measures will be implemented to manage mine waste. Low capacity PAF (PAF-LC) and PAF mine waste will be:

New Acland Coal Mine Stage 3 Project – Environmental Impact Statement PAGE 4-62
progressively backfilled into pit voids and placed below the pre-mining groundwater level; and co-mingled with non-acid forming (NAF) materials in out of pit dumps during construction.
Mine waste has been successfully rehabilitated since the commencement of the Mine. To date, there has been no observed impact from the use of mine waste for rehabilitation purposes in terms of sodicity or acid production. However, a portion of samples taken for the assessments in 1999 (31% of the samples) and 2007 (23% of the samples) indicate that there is potential for dispersion of the soil. Placement of these sodic/dispersive materials at the surface and within the plant root zone should be avoided due to their tendency to form low permeability soil horizons, accelerating erosion and inhibiting plant growth. In this case, the waste materials should not be used for construction purposes (unless treated for example with gypsum) since they may be prone to tunnelling and collapse. In this regard, erosion and sedimentation controls will therefore be an important management tool. The high sodicity is the most significant concern regarding the revegetation of the spoil dumps. Highly sodic soils have a tendency to lose aggregation and to develop clay dispersion, impermeable layers, surface crusting, and poor aeration (Baker and Eldershaw, 1993). To minimise these effects, ex-pit mine waste dumps will be managed by:
stripping topsoil ahead of mining operations and directly placing topsoil on rehabilitation where possible, otherwise the topsoil will be stockpiled for later use;
application of fertilisers and other soil treatments as required; and monitoring the rehabilitation to demonstrate success and identify areas requiring maintenance.
It may be necessary to treat surfaces of waste spoil dumps to ensure that negative revegetation impacts do not occur: this could include incorporating rock mulch into the final surface of the rehabilitated landforms to increase surface roughness and protect the surface from excessive erosion. Further information on topsoil stockpiling, storage and rehabilitation is found in Section 4.8.
4.7.7. Mine Water Quality
At green field sites the ability to assess and predict water quality typically requires data from kinetic leach tests. At the Project site there is more than 10 years of water quality data that can be used to evaluate potential for AMD from mine and processed waste at the Mine and qualify changes in water quality from the proposed site expansion. Due to the availability of site data there was no requirement to undertake kinetic leach testing.
There are currently a range of operational controls in place to reduce the risk of mine impacted water having an adverse effect on the receiving environment including the use of sediment dams and environment dams to control water flow and provide opportunities to monitor water quality and direct if for environmental discharge or diversion to internal water storage areas (e.g. pits). In Section 5.13.4 there is an extensive discussion of the current and proposed:
mine water management strategy; mine water balance modelling; and mine and environmental water quality assessments.

New Acland Coal Mine Stage 3 Project – Environmental Impact Statement PAGE 4-63
The mine water quality assessments produced in Section 5.13.4 are derived from revised Project water quality data (Table 4-31) and data from other revised Project sites.
Table 4-33 Measured and Modelled Salinity from Waste Types
Source Range of Salinity Results (µs/cm) 1999 results
Range of Salinity Results (µs/cm) 2007 results
Modelled Salinity (µS/cm)
Undisturbed Catchments 400
Spoil Dumps and Industrial Areas
Weathered overburden 70 to 1060 232 to 505
500 Fresh overburden 160 to 200 232 to 586
Interburden 160 to 380 199 to 402
Coal waste 359 to 463
Raw water 250
Receiving water 400
Pit water 2720 and 3030 from in-pit samples analysed in March 20121
4,000
4.7.8. Conclusion
The geochemical sampling and analytical methods and approaches undertaken in 1999 and 2007 are consistent with Queensland regulatory and global industry geochemical sampling and analytical programmes as both studies included analysis of:
materials based on lithology and material classification that is in-line with the mining schedule; acid base accounting and NAG methods (including kinetic NAG analyses) to characterise the
potential for acid and neutral pH drainage; soluble and exchangeable cation methods to characterise the potential for mine waste to be saline
and or sodic and dispersive; and nutrient content to understand whether there may be constraints to use the various material types
for vegetation.
These sampling and analytical methods are consistent with the:
1995 guideline - The Assessment and Management of Acid Drainage guideline of the Technical Guidelines for the Environmental Management of Exploration and Mining in Queensland series (Department of Minerals and Energy 1995a); and
2013 guideline - The International Network of Acid Prevention (INAP) Global Acid Rock Drainage Guide (GARD Guide).
1 Data provided by NCA from water samples collected in 2012 and 2013 from pit voids and a silt dam

New Acland Coal Mine Stage 3 Project – Environmental Impact Statement PAGE 4-64
The mine waste associated with the revised Project consists of weathered and fresh overburden having slightly higher clay content than the interburden and floor material. This material is generally geochemically benign, with negligible acid generation potential. Particle size analysis varies depending on the sedimentary strata encountered. However, most strata have relatively high silt content. During the initial phases of operation, and continuing routinely throughout the life of the revised Project, it is proposed to carry out analysis of overburden and tailings material to confirm its geochemical characteristics, and if necessary, implement a series of mitigation measures as outlined above.
Overall, the mine waste material tested is likely to be suitable for revegetation. Topsoil will also be used as a surface treatment prior to revegetation to minimise any effects from sodic spoil. Additionally and as required, consideration may be given to incorporating calcium into the surface horizon of the final spoil dump to reduce issues related to high sodicity. Taking this action may assist in maintaining the structure of the soil and help to prevent erosion of the underlying sodic material.
The water quality modelling results (Section 5.13.4) coupled with the site data and the current and planned waste and water management strategies suggest that water quality in the receiving environment is unlikely to be adversely affected during operations or into future closure.
Further investigation may be required to model and assess likely water quality in final voids and how this water may affect the receiving environment.
4.8. Rehabilitation
4.8.1. Post Mining Land Use
The overriding principle for the rehabilitation program for the revised Project is to ensure the disturbed land is returned to a post-mine condition that is stable, self-sustaining and requires minimal maintenance. It is proposed the main post-mine land use at the revised Project will be grazing based on a self-sustaining vegetation community using appropriate pasture grasses and scattered plantings of native tree and shrub species. A discrete area of the revised Project site will be dedicated for conversation purposes and will involve enhancing Lagoon Creek’s riparian zone using the appropriate native plant species. It is expected that the attainment of these land uses will stabilise the landform, protect the downstream water quality and ensure a long term sustainable outcome for the revised Project.
4.8.2. Post Mine Land Form
The primary design objective is the creation of stable final landforms that is compatible with the surrounding landscape and the proposed final land use. NAC will use experience gained at the Mine and other mines in Queensland to meet this objective.
Stable landforms will be established following mining, using soils capable of supporting vegetation communities adapted to the local environment. The stability of the post-mine landform will be achieved by applying sound rehabilitation practices. The disturbed land will be rehabilitated to a condition that is self-sustaining or to a condition where the maintenance requirements are consistent with the post-mining land use.

New Acland Coal Mine Stage 3 Project – Environmental Impact Statement PAGE 4-65
The proposed final landform will require rehabilitation of the following main disturbance areas:
out-of-pit waste rock dumps at the Manning Vale West, Manning Vale East and Willeroo mine pits; in-pit waste rock dumps at the Manning Vale West, Manning Vale East and Willeroo mine pits; final voids associated with the Manning Vale West, Manning Vale East and Willeroo mine pits; dams not required by the relevant landowner; road and rail infrastructure areas not required by the relevant landowner; and mine infrastructure areas not required by the relevant landowner.
There will be three final voids remaining at the cessation of mining activities. The South Pit will be completely backfilled over the life of the revised Project with spoil material from the Manning Vale East mine pit and coarse reject material. Other voids created during Stage 1 and 2 of the Mine (55 ha) will be filled in as a result of the revised Project. The remaining final voids created during the revised Project will be rehabilitated to depressed landforms by battering down the high walls and low walls to a lesser slope of 8.5 to 17 degrees. The depressed landforms will be geotechnically stable and due to the rehabilitated slope angles are expected to support sustainable grazing practices. The Final Landform Technical Report for the revised Project is presented in Appendix G.1.8.
The total disturbance area for each final void will increase as a result of construction requirements associated with each of the depressed landforms. While the total disturbance area will increase, the final landform for the revised Project is expected to support the post mine land use and ensure an improved environmental outcome by removing a non-beneficial landform. The revised Project’s final void and eventual depressed landform areas are presented in Table 4-34.
Table 4-34 Final Void and Depressed Landform Area
Mine Pit Void Area 2029 (ha) Depressed Landform Area (ha)
Manning Vale West 124 184
Manning Vale East 111 130
Willeroo 222 307
TOTAL 457 621
Note: Depressed Landform area is the area of the void after reshaping has occurred.
A key objective for creating the post mine landform is to maximise in-pit dumping and minimise out-of-pit dumping. Approximately 396 Mbcm of waste rock material will be disposed of in-pit (below pit crest) and approximately 50 Mbcm will be placed external to the mine pits.
The revised Project’s out-of-pit dumps will be constructed using 10 m lifts on external dump faces, with a maximum working dump lift height of 30 m. The landform will be recontoured from angle of repose slopes to a slope angle of 8.5 degrees to 17 degrees.
Contour banks will be constructed after profiling of the final landform to control run-off. The contour banks will be designed and constructed to control the run-off from a 1:20 year ARI ‘time-of-concentration’ flow from the catchment. Run-off will be conveyed along the contour banks to engineered designed rock-lined waterways and then to sedimentation basins or dams. Landforms

New Acland Coal Mine Stage 3 Project – Environmental Impact Statement PAGE 4-66
should be designed so that surface water run-off from all disturbed areas should pass through sedimentation basins or dams to reduce the levels of suspended solids. Where possible, sedimentation dams will discharge to an environmental dam before eventual discharge off-site. Water in the environmental dams will preferentially be recycled to minimise the potential for off-site discharge. Diversion bunds will be strategically constructed around each depressed landform to prevent the ingress of surface water from either overland flow during significant rainfall events or flooding within the Lagoon Creek floodplain.
4.8.3. Rehabilitation Strategy
This Section overviews NAC’s rehabilitation strategy for the revised Project, which as a minimum is designed to create a final landform that is stable, self-sustaining, not impacting on the downstream receiving environment, possesses maintenance requirements commensurate with the final land use, and longer term achieves statutory compliance for eventual surrender of the associated mining tenure.
The revised Project’s general rehabilitation areas comprise the greater part of the active mining areas, the out-of-pit dumps and the final voids (future elevated landforms and depressed landforms, respectively). The general rehabilitation areas have been designated to be returned to a final land use of grazing with scattered areas of native tree species for shade, aesthetic and ecological purposes.
The management requirements for general rehabilitation areas within the Mine (Stages 1 & 2) are specified within NAC’s original FLURP (SKM, 2008). This plan was accepted by the DEHP during 2008 and is administered as an accompanying document to the Mine’s current Plan of Operations. NAC has updated the current FLURP to include the revised Project and its intrinsic requirements. The updated FLURP is provided in Appendix J.2.
The FLURP is a comprehensive planning document that details rehabilitation matters, such as rehabilitation goals/objectives, progressive rehabilitation, topsoil management, revegetation techniques, maintenance, decommissioning, rehabilitation acceptance criteria (development & application), monitoring and reporting. In addition, NAC is also exploring the possibility of trialling native grass species within the general rehabilitation areas.
To support its rehabilitation strategy, NAC has produced a Topsoil Management Plan as a leading practice initiative to ensure the efficient use of this valuable resource and to improve the revised Project’s rehabilitation performance. The Topsoil Management Plan is located in Appendix J.3.
NAC’s rehabilitation strategy will allow a majority of the revised Project site to be re-incorporated into APC’s agricultural activities. The return of the revised Project land to grazing is consistent with the current land uses practised within the region and is considered a long term sustainable outcome for the revised Project.
In general, there will be a loss of land capability as a result of mining across the revised Project site. However, following successful rehabilitation, agricultural production will remain possible post mining in the form of grazing. This beneficial outcome has been demonstrated at the Mine and other NHG mine sites. NAC and APC will ensure that a suitable management regime is developed for the rehabilitated

New Acland Coal Mine Stage 3 Project – Environmental Impact Statement PAGE 4-67
mined land. Site-specific grazing trials and long term monitoring against approved rehabilitation acceptance criteria to demonstrate rehabilitation success has already commenced at the Mine.
NAC’s rehabilitation strategy for the revised Project is based on:
expanding and updating the existing rehabilitation strategy for the Mine’s general disturbance areas; and
implementing a range of specialised revegetation management practices for the revised Project’s designated conservation zones and environmental offset areas.
In addition, the strategies and methods presented for progressive and final rehabilitation of disturbed areas for the revised Project have considered the objectives of A Policy Framework to Encourage Progressive Rehabilitation of Large Mines (EPA, 2004).
Disturbance areas NAC is proposing to disturb a total of approximately 2,030 ha over the life of the revised Project. Table 4-35 outlines the expected disturbance for each of the revised Project’s main disturbance types – mining areas, elevated landforms, depressed landforms and mining infrastructure.
Table 4-35 Total disturbance over the life of the revised Project
Type of Disturbance Disturbance Area (Ha)
Mining Areas 921
Elevated Landforms 314
Depressed Landforms 621
Mine Infrastructure 174
Total 2,030
A majority of the disturbance areas will be dynamic over the life of the revised Project and as is currently practiced, will be progressively rehabilitated as they become operationally available. Other disturbance areas, such as infrastructure (such as haul roads, rail, CHPP), remain relatively static over the life of the revised Project and will be rehabilitated as part of the mine closure process. Chapter 3 provides general details on the revised Project’s main disturbance types, a summary of the revised Project’s mining sequence and outlines the revised Project’s main elements that will influence rehabilitation requirements.
Significant Vegetation A comprehensive flora assessment for the revised Project has been completed and is detailed in Chapter 7. The flora assessment identified the following significant remnant vegetation.
‘Threatened Species and Communities’ under the Commonwealth’s EPBC Act; ‘Endangered Regional Ecosystems’ under Queensland’s VM Act; and ‘Protected Species’ under Queensland’s NC Act.

New Acland Coal Mine Stage 3 Project – Environmental Impact Statement PAGE 4-68
In relation to the revised Project’s Regional Ecosystems and Threatened Communities, Table 4-36 outlines the actual areas of potential loss of remnant vegetation. A total of 67.4 ha of remnant vegetation will require specific management actions under Queensland and Commonwealth legislation, respectively.
Table 4-36 Remnant Regional Ecosystem/Threatened Communities within the revised Project’s boundaries
State
Ecosystem Dominant Species Ecosystem Designation1 Area (ha)
Acacia harpophylla 11.9.10; 11.3.1, 11.9.5 28.7
Eucalyptus populnea 11.3.2; 11.3.7 10.3
Eucalyptus orgadophila2 11.8.5; 11.8.5a 60.3
Eucalyptus moluccana 11.9.13 3.6
Total: 102.9
Commonwealth
Ecosystem Dominant Species Ecosystem Designation1
Brigalow 11.3.1, 11.9.5 24.6
Bluegrass Dominant Grassland 11.3.21, 11.8.11 40.1
Total: 64.7
Note 1: The ecosystem designations are defined under the VM Act. Note 2: Currently, E. orgadophila is ‘Least Concern’ under the VM Act.
Commonwealth and State Offset Policies Since 2011, the Commonwealth and State governments have released a range of approved offset policies which provide the principles and guidelines for developing and applying vegetation or biodiversity offsets to significant vegetation issues associated with project development. The current policies applicable to the revised Project are as follows:
Policy guiding the use of environmental offsets under the Environmental Protection and Biodiversity Conservation Act 1999 (SEWPaC 2012).
Queensland Government Environmental Offsets Policy (EPA 2008a). Queensland Government Policy for Biodiversity Offsets – (DEHP 2011).
The revised Project’s Offset Strategy for the Commonwealth and State is presented in Chapter 7 and Appendix I.
Rehabilitation – Commonwealth Significant Vegetation (Threatened Communities) The revised Project will clear a total of 64.7 ha of Dichanthium sericeum (Queensland Bluegrass) grassland community and Acacia harpophylla (Brigalow), which are classified as significant vegetation communities by the Commonwealth and State governments. The majority of the remnant Dichanthium sericeum grassland community is located within the Manning Vale West mine pit and along Lagoon Creek.

New Acland Coal Mine Stage 3 Project – Environmental Impact Statement PAGE 4-69
As a result, NAC has prepared an offset strategy for the remnant Dichanthium sericeum grassland community. The revised Project’s Offset Strategy for the Commonwealth and State is presented in Chapter 7 and Appendix I. NAC’s proposed biodiversity offset will involve establishing a new area of Dichanthium sericeum grassland community within several parcels of land adjacent the revised Project site.
NAC has prepared a Bluegrass Offset Management Plan (BOMP) which outlines the methodology for establishing and managing a Dichanthium sericeum based grassland community. Key aspects of the BOMP include the revegetation and management goals/objectives, offset area details, planned revegetation techniques, rehabilitation acceptance criteria, a monitoring and reporting regime, a maintenance regime for weeds and poor establishment and a comprehensive long term management regime. The BOMP is provided in Appendix J.8. NAC will establish a suitable legal mechanism connected to the underlying land title to protect the Dichanthium sericeum based grassland offset in perpetuity. This legal agreement will also include a long term management plan for preservation of the Dichanthium sericeum based grassland offset.
The use of land adjacent to the revised Project controlled by APC is suitable for offset establishment for the following reasons.
The APC owned land offers security of tenure and improved access arrangements. There is a positive cost-benefit outcome for NAC using company land. For example, third party
costs would be significantly reduced and as a result, third party cost savings could be directed to offset establishment activities.
APC’s involvement provides added advantages, particularly in terms of activities such as offset management.
APC’s ownership of the land ensures an easier and more cost effective process for establishing legal protection of the offset.
NAC has engaged the services of Earthtrade (Offset Broker) to identify a third party option to offset Brigalow TEC. Earthtrade has identified three possible offset options for NAC’s consideration. Further work is required to confirm the most appropriate option. This offset area will be used to also offset the impacted Brigalow REs that are classified under the VM Act.
Rehabilitation – State Significant Vegetation (Remnant Regional Ecosystems) The revised Project will clear 42.6 ha of remnant ‘Endangered’ and ‘Of Concern’ Regional Ecosystems, comprising 28.7 ha dominated by Acacia harpophylla (Brigalow), 10.3 ha dominated by Eucalyptus populnea (Poplar Box) and 3.6 ha of Eucalyptus moluccana (Grey Box). The revised Project will also clear 60.3 ha of a remnant ‘Not of Concern’ Regional Ecosystem comprising Eucalyptus orgadophila (Mountain Coolibah).
NAC has engaged the services of Earthtrade (Offset Broker) to identify a third party option to offset the Endangered Regional Ecosystems dominated by Acacia harpophylla (Brigalow) and dominated by Eucalyptus populnea (Poplar Box). Earthtrade has identified three possible offset options for NAC’s consideration. Further work is required to confirm the most appropriate option.

New Acland Coal Mine Stage 3 Project – Environmental Impact Statement PAGE 4-70
Rehabilitation – Commonwealth and State Significant Vegetation (Threatened/Protected Species) The revised Project’s mining activities will disturb a number of scattered patches of the threatened/protected species, Homopholis belsonii (Belson’s Grass), Digitaria porrecta (Finger Panic Grass) and Bothriochloa biloba (Lobed Blue-grass) which are mainly located within road reserves. NAC intends to transplant all threatened/protected species endangered by the revised Project’s activities. This approach will require detailed planning and preparation and as minimum involve:
pre-disturbance surveys to identify all threatened/protected species that may be impacted by the revised Project’s activities;
identification of suitable locations for the recovered plants; collection of propagules prior to transplanting for propagation to protect against genetic loss from
potential establishment failure; and implementation of the Threatened Species Relocation Management Plan (TSRMP).
The TSRMP will include the transplantation and management goals/objectives, site details, a propagule collection and propagation strategy, planned transplantation techniques, transplantation success criteria, a monitoring and reporting regime, a maintenance regime for weeds and poor establishment and a comprehensive long term management regime. The TSRMP will require Commonwealth and State approvals under the EPBC Act and the EP Act, respectively. The TSRMP for the revised Project is provided in Appendix J.7.
It is envisaged that the recovered plants will be located off the revised Project site on APC land. The location site for the recovered plants will be to the south of the revised Project site within the proposed offset area.
The transplant strategy has been selected to significantly reduce the need to use propagation and revegetation techniques for the revised Project’s threatened/protected species, which are plant species with poorly understood life cycles. The planning and preparation will be a key factor in significantly reducing the risk of failure. To-date, using a similar transplant methodology, NAC has experienced good success with Belson’s Grass relocation along the WWRF pipeline route.
4.8.4. Progressive Rehabilitation
A progressive rehabilitation program will be implemented throughout the mine life and reported in each Plan of Operations and will commence when areas become available within the operational land. In addition, the FLURP located Appendix J.2 outlines the key management actions for the progressive rehabilitation program.
The main features of the progressive rehabilitation process are:
construction of waste dumps in 10 m lifts on external dump faces, with a maximum working dump lift height of 30 m. Angle of repose slopes will be recontoured to a slope angle of 8.5 degrees to 17 degrees with drainage contours being constructed as required;
use of suitable topsoil, which will either be stockpiled until suitable recontoured areas are available, or respread immediately across available recontoured areas;

New Acland Coal Mine Stage 3 Project – Environmental Impact Statement PAGE 4-71
contour ripping as an erosion control measure; seeding with an appropriate seed mix (grass, shrub and tree species) prior to the commencement
of the wet season to maximise the benefits of subsequent rainfall; and application of appropriate fertiliser for plant establishment if required.
The projected progression of mining activities and the conceptual final topography will be further defined by the on-going planning process for the revised Project. This information will further guide proposed rehabilitation activities. Indicative rehabilitation targets for the revised Project are shown in Table 4-37. The progressive rehabilitation of the mined areas is presented in Figure 3-9 to Figure 3-15 of Chapter 3. The timetable for rehabilitation activities will be outlined in the Plan of Operations. Changes and updates to the mine plan and rehabilitation schedule will be made to the Plan of Operations at the appropriate times.
Table 4-37 Indicative Rehabilitation Targets
Production Year Rehabilitated Area (ha) Cumulative Area Rehabilitated (ha)1
2018-19 226 226
2020-21 241 467
2022-23 233 700
2024-25 146 846
2026-27 156 1002
2028-29 142 1,144
>2030 886 2,030
4.8.5. Rehabilitation Success Criteria
The site-specific criteria for achieving a self-sustaining vegetation community will be developed during the operation based on current practices and the monitoring of progressive rehabilitation. Rehabilitated areas will be monitored using the selected parameters (as described below) and trends tracked to demonstrate establishment. The experience at the Mine has shown that pasture establishment on the elevated landform is successful.
Rehabilitated land is currently monitored on an annual basis and will continue to be for the revised Project until monitoring data confirms successful achievement of the agreed rehabilitation performance criteria. Rehabilitated areas that do not reach a sufficient growth density of vegetation will be reseeded. In addition, supplementary sowing of seed may be used to increase species diversity.
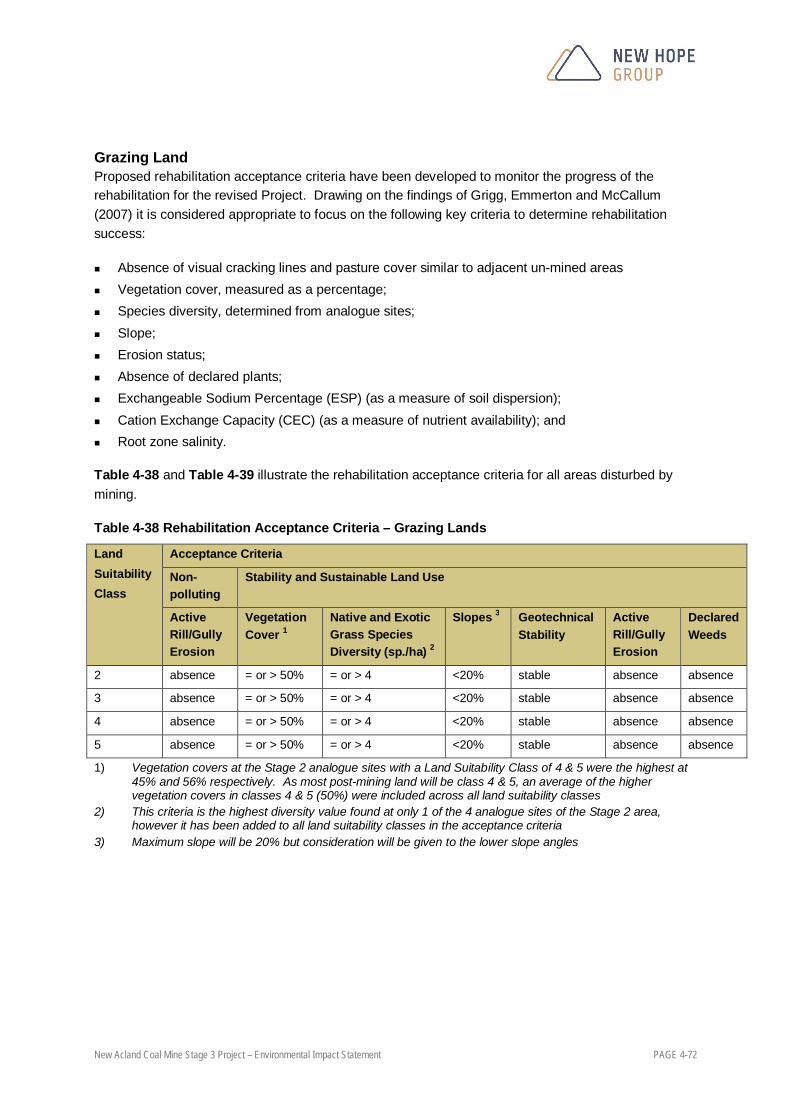
New Acland Coal Mine Stage 3 Project – Environmental Impact Statement PAGE 4-72
Grazing Land Proposed rehabilitation acceptance criteria have been developed to monitor the progress of the rehabilitation for the revised Project. Drawing on the findings of Grigg, Emmerton and McCallum (2007) it is considered appropriate to focus on the following key criteria to determine rehabilitation success:
Absence of visual cracking lines and pasture cover similar to adjacent un-mined areas Vegetation cover, measured as a percentage; Species diversity, determined from analogue sites; Slope; Erosion status; Absence of declared plants; Exchangeable Sodium Percentage (ESP) (as a measure of soil dispersion); Cation Exchange Capacity (CEC) (as a measure of nutrient availability); and Root zone salinity.
Table 4-38 and Table 4-39 illustrate the rehabilitation acceptance criteria for all areas disturbed by mining.
Table 4-38 Rehabilitation Acceptance Criteria – Grazing Lands
Land Suitability Class
Acceptance Criteria
Non-polluting
Stability and Sustainable Land Use
Active Rill/Gully Erosion
Vegetation Cover 1
Native and Exotic Grass Species Diversity (sp./ha) 2
Slopes 3 Geotechnical Stability
Active Rill/Gully Erosion
Declared Weeds
2 absence = or > 50% = or > 4 <20% stable absence absence
3 absence = or > 50% = or > 4 <20% stable absence absence
4 absence = or > 50% = or > 4 <20% stable absence absence
5 absence = or > 50% = or > 4 <20% stable absence absence
1) Vegetation covers at the Stage 2 analogue sites with a Land Suitability Class of 4 & 5 were the highest at 45% and 56% respectively. As most post-mining land will be class 4 & 5, an average of the higher vegetation covers in classes 4 & 5 (50%) were included across all land suitability classes
2) This criteria is the highest diversity value found at only 1 of the 4 analogue sites of the Stage 2 area, however it has been added to all land suitability classes in the acceptance criteria
3) Maximum slope will be 20% but consideration will be given to the lower slope angles

New Acland Coal Mine Stage 3 Project – Environmental Impact Statement PAGE 4-73
Table 4-39 Rehabilitation Acceptance Criteria – Treed Areas (generally <5%)
Land Suitability Class
Acceptance Criteria
Non-polluting
Stability and Sustainable Land Use
Active Rill/Gully Erosion
Vegetation Cover (inc. tree/shrub canopy) 1
Native Tree/shrub & Native/Exotic Grass Species Diversity (sp./ha) 2
Slopes 3 Geotechnical Stability
Active Rill/Gully Erosion
Declared Weeds
2-5 absence = or > 50% Eucalyptus sp. = or >2
Acacia sp. = or >2
Other tree/shrub sp. = or >2
Grass = or > 3
<20% stable absence absence
1) This criteria is an average from analogue sites of the Stage 2 area. 2) The majority of the rehabilitated land will be returned to grazing with exotic pastures established. Where
pockets of trees/shrubs have been established the diversity criteria will apply taking into account the limited diversity of some remnant communities near the mine.
3) Maximum slope will be 20% but consideration will be given to the lower slope angles
Grazing Trial NAC is currently undertaking a formal long term grazing trial within a rehabilitated area of the North Pit’s Elevated Landform on ML 50170 at the Mine. This grazing trial includes sloped areas and will involve a comparison process with an analogue site in the vicinity of the Mine. The grazing trial program is being managed by the APC and will involve a formal study and report by a professional third party agricultural consultancy and local university. This grazing trial program will be a continuous process with new areas progressively added to the original trial area each year. The grazing trial program will be expanded to include the revised Project’s rehabilitation areas designated for grazing. NAC believes the grazing trial program will be a critical assessment tool for demonstrating long term success of its grazing based rehabilitation for the revised Project’s future mine closure and mining lease relinquishment requirements.
From an operational perspective, NAC will use the grazing trial:
to assess the success of the current rehabilitated area in relation to the performance of cattle growth (beef production);
to evaluate current rehabilitation practices from a final land use perspective; and as required, to develop new rehabilitation strategies to improve rehabilitation and long term
grazing performance.
Longer term, the APC will also use this information to develop appropriate land management plans for NAC’s former mined land within both the current Mine and the revised Project site. NAC is confident from the current grazing trial process and the grazing activities conducted at the NHG’s West Moreton mining operation that it can demonstrate with full scientific rigor that the revised Project’s constructed landforms will be able to support grazing (beef production) as the proposed final land use in a long term sustainable manner.

New Acland Coal Mine Stage 3 Project – Environmental Impact Statement PAGE 4-74
Native Vegetation A useful way of evaluating the progress of a revegetated site is to compare the monitoring results with (i) baseline data (describing the condition of a site before the revegetation was established) and (ii) with data from surveys of one or more reference sites (i.e., sites representing the ‘target condition’, such as remnant forests of the type that may have occurred on a site prior to clearing).
Comparison with baseline data will show how much a site has changed following revegetation, while comparison with forest reference (benchmark) site(s) can show whether the revegetated site has achieved the target condition, and if not, what attributes need further development. Comparisons with reference sites are particularly useful because many structural attributes vary between different forest types and regions (Webb et al. 1976).
This Section presents information, protocols and proformas for monitoring ‘basic indicators’ at revegetated sites. Basic indicators include various aspects of forest structure which have been selected for survey as they:
provide information on important stages of development of a revegetation project; can be measured relatively easily and rapidly, without specialist knowledge; and are correlated with the use of sites by wildlife.
Rehabilitation Acceptance Criteria for Native Vegetation is displayed in Table 4-40.
Table 4-40 Rehabilitation Acceptance Criteria for Native Vegetation
Site Based Condition Attributes
Acceptance Criteria
Recruitment of Woody Perennial Species
Recruitment or regeneration is essential to the sustainability of any ecosystem. Some land management practices, such as burning or grazing and natural processes, such as drought, can degrade the ability of natural regeneration processes to take place. Regeneration is therefore an important component in assessing the health or condition of each zone. The recruitment attribute will be used to assess the presence of recruitment of the dominant overstorey species. For ease and reliability of assessment, assessment of recruitment will be restricted to the dominant woody perennial species within the tree layer, due to the seasonal and therefore ephemeral nature of the lower layers. Recruitment will be assessed as the proportion of overstorey species present at a site that are regenerating (<5 cm diameter at breast height (dbh)), e.g. if four overstorey species occur at the site, but only two of these species are present as regeneration, then the proportion is 50%.
Native Plant Species
To simplify assessment, native plant species richness will be estimated for five life-forms: trees, shrubs, grass, forbs and other. Assessment will be based on the number of native species observed in the 50 x 10 m plot for each life form group. A total score for native plant species richness will be derived by adding together the scores derived for each of the five life-form groups, and dividing by 5.

New Acland Coal Mine Stage 3 Project – Environmental Impact Statement PAGE 4-75
Site Based Condition Attributes
Acceptance Criteria
Tree Canopy Cover
Canopy cover equates to crown cover as defined by Walker and Hopkins (1990). The vertical projection of the tree canopy over a 100 m transect will be recorded. The total length of the projected canopy will then be divided by the total length of the tape to give an estimate of percentage canopy cover, which will be compared with the benchmark data. The tree canopy cover attribute score will be qualified by the health of the canopy of the trees assessed along the 100 m transect. Trees assessed along the transect with canopies that fit into health categories 3, 4 and 5 have lower scores than those with scores of 1 or 2.
Tree Canopy Height
Tree canopy height refers to the median canopy height in metres, estimated for the tree layer within the 100 m x 50 m assessment area. The median canopy height is the height that has 50% of canopy trees larger and smaller than it. This is generally synonymous with average height except when there are some trees that are substantially higher or lower than the median (Neldner et al. 2005).
Shrub Cover
Shrub canopy cover refers to the estimate of the percentage cover of native shrubs recorded along the 100 m transect (similar to the estimation of tree canopy cover using a vertical projection downwards).
Ground Cover
There is one ground layer, which may contain graminoids, forbs, sprawling vines and other plants that are short in stature and overlap in height with the grasses. Seedlings of trees and shrubs will be included in this layer, if not already allocated to a separate shrub layer. The ground layer most frequently extends from 0 cm to 100 cm (Neldner et al. 2005). The ground cover is measured by a vertical projection downwards of the living plant material. Three components of the ground cover will be scored: Perennial grass species cover; Perennial herb and forb (non-grass) species cover and; annual grass, herb and forb species cover. Perennial ground cover species will be scored as a separate attribute from annual ground cover species.
Large Trees Large trees are an important resource within forest and woodland ecosystems. They provide greater leaf material, nectar and bark-surface area for foraging purposes, and are more likely to contain hollows and crevices for nesting and sheltering purposes. Large trees are defined as the number of large living trees per hectare. These will be counted within the 100 x 50 m assessment area to give a density per hectare. This number can then be compared with the RE benchmark, and placed in the appropriate category. Any large trees located during the assessment will also be assessed regarding its habitat value for hollow-dependent wildlife. If a large tree also contains an observable hollow with an opening > 10 cm diameter, then a higher score is given.

New Acland Coal Mine Stage 3 Project – Environmental Impact Statement PAGE 4-76
Site Based Condition Attributes
Acceptance Criteria
Fallen Woody Material
Fallen woody material is an important component in many aspects of ecosystem functioning (see Woldendorp et al. 2002; Mackensen et al. 2003). It is primarily measured as a habitat surrogate for ground dwelling fauna (Butts and McComb 2000; MacNally and Horrocks 2002), but can also be used as a variable in the estimate of carbon biomass, and as an indicator of fire disturbance. Fallen woody material refers to coarse woody debris or dead timber on the ground > 10 cm diameter and > 0.5 m in length. Assessment will be conducted by counting the number of fallen woody logs and other debris that are found within the 50 m x 10 m plot. To be counted as in, 50% or greater of the log will have to be located within the plot.
Weed Cover
Weed cover refers to the percentage cover of non-native plant species, assessed within the 50 m x 10 m sub-plot. Where there are weeds present in more than one layer, e.g. a grass in the ground layer and shrub in the shrub layer then the percentage in each layer are added together to give a percentage weed cover for the site. The benchmark for weed cover is zero.
Organic Litter
Organic Litter includes both fine and coarse organic material such as fallen leaves, twigs and branches < 10 cm diameter. Organic litter cover refers to the average percentage cover assessed within each of the five 1 m x 1 m quadrats. Within a quadrat, the sum of the native ground cover, weed ground cover, organic litter (including any coarse woody material) and bare ground/rock cover must equal 100%.
Conservation Zone The conservation zone for the revised Project will comprise the riparian zone of Lagoon Creek, Bottle Tree Hill and proposed offset areas. The conservation zone is to be expanded to include the full length of Lagoon Creek within the Study area with a buffer distance of 50 m either side of the channel. This will enhance local habitat and create connectivity for the movement of wildlife within the Study area. A proposed condition regarding the buffer zone has been incorporated into the proposed EA conditions for the revised Project and is presented in Appendix J.19. In addition, it is expected that over time this approach will help sustain the local Koala population. The Conversation Zone Management Plan for the revised Project is presented in Appendix J.6.
The Rehabilitation Acceptance Criteria for the enhancement of the conservation zone is shown in Table 4-41.

New Acland Coal Mine Stage 3 Project – Environmental Impact Statement PAGE 4-77
Table 4-41 Conservation Zone Rehabilitation Targets
Site Based Condition Attributes Conservation Zone Rehabilitation Targets Target Values (after 10 years)
Recruitment of woody perennial species
100% of overstorey species present as regeneration 3 species present
Native plant species richness 35% of benchmark species 6 species present
Tree canopy cover (%) 30% of benchmark canopy cover 10.5 %
Tree canopy height 25% of tree canopy height 5 m
Shrub layer cover (%) 30% of benchmark shrub cover 3%
Native perennial grass cover (%) 40% of benchmark perennial grass cover 26%
Native perennial forb and non-grass cover (%)
50% of benchmark perennial forb cover 7.5%
Native annual grass, forb and non-grass cover (%)
50% of benchmark annual grass, forb and non-grass cover
2.5%
Large trees 50% of benchmark number of large trees (comprised of species which will eventually become large trees)
17 large trees
Weed cover Similar to benchmark weed cover <20% weed cover
Mine Infrastructure The rehabilitation strategies for each of the four domains of solid waste disposal areas (i.e., coarse reject disposal areas within in-pit dumps), tailings dams, mine infrastructure areas and linear infrastructure (i.e., road and rail infrastructure) at the revised Project site can be summarised in Table 4-42. For example, tailings emplacements will be capped with coarse rejects and mine spoil then, topsoiled and seeded. Once the tailings areas are capped with mine spoil they will receive a similar treatment to other areas of mine spoil/waste dumps. Mine infrastructure areas will generally not require spoil placement or capping but will receive topsoil and seeding treatments similar to the solid waste disposal and capped tailings dams. Waste removal and recycling, dismantling of structures and other similar activities will be associated with the decommissioning of Mine infrastructure areas. As a result, drainage within these rehabilitated areas will be re-established with a level of design that ensures long term stability. As discussed above, decommissioning and rehabilitation of infrastructure areas will be managed by the mine closure planning process and will encompass contaminated land management matters.

New Acland Coal Mine Stage 3 Project – Environmental Impact Statement PAGE 4-78
Table 4-42 Rehabilitation Acceptance Criteria for Mine Infrastructure
Domain Rehabilitation Goals
Safe Non-Polluting Stable landform Sustains Agreed Land Use
Solid Waste Disposal
Structurally safe, no hazardous materials
Runoff and seepage unlikely to affect known environmental values. Environmental dams in place
Place wastes above and below original ground level with moderate slopes <20%
Return to previous use (grazing)
Tailings Dams Structurally safe, adequate capping
Runoff and seepage of good quality. Adequately capped
Stored both in pits below natural surface level and in dams above natural surface. Vegetation cover established.
Return to previous use (grazing)
Mine Infrastructure areas
Hazardous materials removed
Remediate contamination so that runoff and seepage are of good quality.
Remove infrastructure or allow continued use of useful infrastructure, reshape and revegetate.
Return to previous use (grazing)
Linear Infrastructure
Structurally safe Runoff and seepage of good quality.
Remove infrastructure rip, reshape and revegetate. or allow continued use of useful infrastructure
Return to previous use (grazing)
4.8.6. Rehabilitation Maintenance
Currently, rehabilitated areas are monitored on an annual basis to identify where retreatment or maintenance is required such as areas where scouring or pasture development is inadequate and to assess rehabilitation success. Supplementary plantings or seeding may be used to increase species diversity and/or groundcover. Maintenance work will be performed to repair any areas exhibiting excessive soil erosion. If problem areas occur, they will be investigated to determine the reason for substandard rehabilitation and to identify appropriate methods for repair.
4.8.7. Revegetation
The main revegetation methods for all types of disturbed land at the revised Project will typically consist of the following:
re-spreading stockpiled or freshly stripped topsoil; contour ripping; application of appropriate fertiliser for plant establishment if required; and seeding with an appropriate seed mix (or possible tube stock in the case of tree establishment).

New Acland Coal Mine Stage 3 Project – Environmental Impact Statement PAGE 4-79
A seed mix containing pasture grass and local native shrub and tree species will be used to establish a sustainable vegetation cover in a one-pass operation. Example seed mixes for the Grazing Lands and Treed Areas are included in Table 4-43 and Table 4-44. The seed mixes will be modified over time as species suitability/success and seeding rates are monitored and assessed. The species list for the dedicated native vegetation rehabilitation associated with the conservation zone will be based on a suitable analogue site(s).
Table 4-43 Example Seed Mix – Grazing Lands
Botanical Name Common Name Seeding rate (kg/ha)
Cynodon dactylon Green Couch 2.0
Chloris gayana Katambora Rhodes Grass 5.0
Echinochloa utilus Japanese Millet 3.0
Panicum coloratum Bambatsii Panic 3.0
Panium maximum Gatton Panic 4.0
Table 4-44 Example Seed Mix – Treed Areas
Botanical Name Common Name Seeding rate (kg/ha)
Angophora costata spp costata Smoothbark Apple 0.3
Allocasuarina littoralis Black She-Oak 0.3
Casuarina cristata Belah 0.3
Eucalyptus crebra Narrow Leaf Ironbark 0.3
Eucalyptus melanophloia Silver-leaf Ironbark 0.3
Eucalyptus orgadophylla Mountain Coolabah 0.3
Alphitonia excelsa Red Ash 0.2
Geijera parviflora Wilga 0.3
Acacia leiocalyx Black Wattle 0.2
Acacia salicina Sally Wattle 0.2
Acacia stenophylla River Cooba 0.2
Acacia harpophylla Brigalow 0.2
Senna artemisiodes Silver Cassia 0.2
Dodonaea viscosa Sticky-hop Bush 0.2
Cynodon dactylon Green Couch 1.0
Bothriochloa decepiens Pitted Blue Grass 2.0
Bothriochloa bladhii Forest Blue Grass 2.0
Dicanthium sericeum Qld Blue Grass 2.0
Echinochloa utilus Jap Millet 2.0

New Acland Coal Mine Stage 3 Project – Environmental Impact Statement PAGE 4-80
Competent materials such as basalt will be placed on steeper slopes, for example, batters of out-of-pit dumps to aid geotechnical stability. Contour ripping will be used as an erosion control measure immediately after surface preparation and before revegetation. The revegetation of mined areas will normally occur prior to the commencement of the wet season (October to December) to maximise the benefits of subsequent rainfall. For treed areas, local plant species will predominantly be used to restore elements of the pre-mining communities to the rehabilitation assemblages. These species will be similar to those currently used at the Mine where native species are used in rehabilitation, and as required, supplemented by key dominant species from the revised Project site.
At the commencement of rehabilitation works in a new area, permanent photograph points will be established and delineated with a star picket or similar. The geographic location and bearing of the photograph will be recorded using GPS. This point will form the start of a permanent monitoring site.
Revegetation monitoring, conducted by a competent person, will occur every year after initial seeding activities dependent on rainfall, seedling establishment and seasonal factors.
The rehabilitation areas will be monitored every year until success has been achieved. During this monitoring the revegetation will be compared against the specific success criteria. The following information will be collected for rehabilitation areas during the annual monitoring visits:
photographs of the new rehabilitation areas from permanent photographic points; record to treatments used, including seeding rates, soil treatment, topsoil source; botanical description of the rehabilitation site, including percentage cover and species diversity; measure ESP, CEC and root zone salinity; presence of weed species; landform monitoring i.e., slope angle, contour bank spacing, waterways, presence/absence of
active rill/gully erosion; and any failure of rehabilitation works. Remedial works may be required at a number of stages during the rehabilitation process, including
the following: soil remediation may be required prior to the seeding/planting of rehabilitation areas; failure to achieve desired levels of vegetation cover and species diversity will require further
seeding or planting; and weed infestation will require treatment to an appropriate standard.
4.8.8. Topsoil Management
Suitable topsoil will be stripped for use in the rehabilitation program. The topsoil will either be stockpiled until suitable re-contoured areas are available, or directly returned immediately across the areas to be rehabilitated. The Topsoil Management Plan for the revised Project is located in Appendix J.3.
Topsoil Stripping Depth and Volumes There is a sufficient volume of topsoil available for rehabilitation activities at the revised Project site. Topsoil stripping is necessary wherever land is to be mined, required for out-of-pit dumps or required

New Acland Coal Mine Stage 3 Project – Environmental Impact Statement PAGE 4-81
for infrastructure such as haul roads, hardstands and/or access roads. The topsoil volume required for salvage is dependent on the quality and depth of the resource and the intended final land use of the rehabilitated areas. The actual depth of stripping is dependent on the particular soil types within a given area, and is set out in the Topsoil Management Plan presented in Appendix J.3.
The basic principle in determining useable depths of topsoil for rehabilitation is its quality in comparison to the spoil requiring rehabilitation. In general, the quality of the topsoil must exceed that of the spoil. While this may seem obvious, there are situations where additional problems have been created with the inappropriate use of topsoil. In addition, spoil can be expected to improve with years of exposure, leaching and plant colonisation and in some cases may provide better coverage than poor topsoil after an appropriate time span.
From a large bulk of soils data compiled for the revised Project site, it is apparent that some soils become sodic and are saline at depth. The depth to the salt accumulation layer (or salt bulge) is variable. However, in most cases it is greater than 40 cm. This assessment specifically evaluated subsoil conditions and found evidence of inhibitive salinity in certain soil types. The most severe salinity was found in all alluvial soil types below 0.5 m depth as well as the B3 profile. These soils have the potential for contamination if stripping is too deep and incorporates the subsoil. The basaltic soils were found to be non-saline to the bedrock.
Overall, the revised Project site includes large reserves of topsoil that may be used in mine rehabilitation programs. Table 4-45 provides summary of the soil types present on the revised Project site and their topsoil strip depth. In general, all soils used in rehabilitation should be applied to no less than 250 mm. This measure provides sufficient depth for re-ripping, should follow-up maintenance work be required.
Table 4-45 Topsoil Stripping Summary
Soil Type
Description Recommendations and Comments Typical Topsoil Strip depth
A1 Old Alluvial Plains of dark grey brown deep well-structured cracking clays over dark grey brown heavy clay subsoil
These soils are heavy with good fertility. Stripping depth may extend to 70 cm however most sites show increasing salt by 60 cm depth. Magnesium dominates calcium in the cation exchange and ESP’s are usually in the slightly to moderately dispersive range so they are not suited to application on sloping sites due to a high erosion potential. However these soils have very high moisture storage potential and readily germinate and support both grasses and native trees.
50 cm
A2 Deep Grey brown uniform clay over hard yellowish brown alkaline subsoils
These soils are lighter clays than A1 with greater proportions of silt and fine sand. Fertility is quite good and the medium clay will facilitate good water holding capacity. As with A1, high salinity occurs after 50 cm depth, magnesium dominates the cations, sodic dispersion potential is high and
40 cm

New Acland Coal Mine Stage 3 Project – Environmental Impact Statement PAGE 4-82
Soil Type
Description Recommendations and Comments Typical Topsoil Strip depth
mechanical dispersion tests (R1) suggest structural problems. Stripping depth should not exceed 50 cm and they are not suited to application on sloping sites due to a high erosion potential. These soils can benefit rehabilitation works if used such that erosion potential is minimised.
A3 Old thin sandy alluvial plain on alkaline coarse structured dark brown subsoil.
Similar to A2 but with better physical conditions as calcium dominates the exchange capacity over magnesium. Also clay content is higher but ESP is considered ‘dispersive’. As with other alluvial soils, its use in rehabilitation should be confined to lower sloping areas to avoid excessive erosion.
40 cm
A4 Fine thin dark brown sandy loam over hard reddish brown clay subsoil.
Poor soil with a restricted reuse potential on rehabilitation. The hard setting fine sandy loam A horizon has reuse potential but the high fine sand content in addition to 23 % clay will cause sealing, low infiltration leading to water shedding. The soil also has low fertility. The clayey subsoil is very poorly structured and highly dispersive and should be avoided completely. Care should be taken not to include the B horizon into stripped topsoil. It is recommended that stripping of this soil be avoided in favour of deeper stripping on other better soils if possible.
10 – 15 cm
A5 Recent brown alluvia on Lagoon Creek
Minor unit but can be stripped to at least 40 cm to a possible maximum of 60 cm.
50 cm
B1 and variants
Deep, dark grey brown well structured, self-mulching and cracking softwood scrub soils on undulating plains.
These soils are very well structured medium clays with no real problems to 90 cm depth (or parent rock encountered). The entire profile is non-saline or sodic, calcium dominated cation exchange and desirable pH range. Fertility is high and particle size distribution is such that good infiltration and water holding capacity will occur. Stripping depth can exceed 70 cm up to a maximum of 100 cm. These soils are high quality suited to all areas of minesite rehabilitation.
70 - 90 cm
B2 Dark brown cracking self-mulching Brigalow and Belah clays over firm red brown clay sub soils
These soils are similar to B1 in that they are good quality and highly productive. The main difference is elevated salt in the red clay B horizon and, depending on the depth to this horizon; they may be saline below 40 cm depth. The surface layer is very well structured sandy medium clay with no significant physical problems. Fertility is high and
40 cm

New Acland Coal Mine Stage 3 Project – Environmental Impact Statement PAGE 4-83
Soil Type
Description Recommendations and Comments Typical Topsoil Strip depth
particle size distribution is such that good infiltration and water holding capacity will occur. Stripping depth should not exceed 40 cm unless further conductivity tests indicate otherwise. The surface 40 cm are high quality suited to all areas of minesite rehabilitation.
B3 Thin dark cracking and duplex dark grey soils over hard yellowish brown alkaline subsoils on sandstone.
These soils can be managed in an identical manner to B2 in that the surface 40 cm is high quality clay but increasing salinity and dispersion potential occurs below this depth. The surface layer is a light sandy medium clay with only minor significant physical problems and fertility is quite good. Stripping depth should not exceed 40 cm unless further conductivity tests indicate otherwise. The surface 40 cm is suited to all areas of minesite rehabilitation.
40 cm
B4 Thin red brown sandy clay loam or light clays on hard alkaline red brown clay subsoil on mixed sediments.
These soils may have a tendency to set hard and seal (due to high fine sand content in association with moderate clay content) and fairly low fertility. Soils are non-saline or sodic throughout showing strong basaltic influence. When used on rehabilitation, consideration to the sealing tendency and high erosion potential on sloping land should be considered.
40 cm
BA1 Fine brown light clay over well-structured red brown medium clays over hard brown clay or weathered basalt
Highly productive good quality soil. The whole soil profile to weathered basalt may be used in rehabilitation programs. The lighter textured surface horizon would be better suited to more sloping areas of rehabilitation than heavier clays such as BA2.
70 – 90 cm
BA2 Thick black cracking and mulching medium clay on fresh and weathered basalt
As for BA1 except clay content is higher in the upper soil layer. May be stripped to the basalt bedrock if necessary.
60 – 70 cm
BA3 Shallow generally basaltic rocky upland areas
Any soil that can be physically stripped is suitable however quantities are low and usually very rocky.
0 – 10 cm

New Acland Coal Mine Stage 3 Project – Environmental Impact Statement PAGE 4-84
Topsoil Stockpiles Stockpiling of topsoil will be necessary at the commencement of each box cut and will be required until there is sufficient out-of-pit dump area available for topsoil application. Rehabilitation will not begin until the out-of-pit dumps are being constructed and in-pit backfilled spoil reaches pre-existing surface ground levels and is no longer required for dumping.
As the mine pits expand, there will be more opportunity to strip topsoil and apply it directly to re-contoured areas, thus avoiding topsoil stockpiling. Freshly stripped and placed topsoil retains more viable seed, micro-organisms and nutrients than stockpiled soil. Vegetation establishment is generally improved by the direct return of topsoil and is considered ‘best practice’ topsoil management.
Stockpiles will be managed so that: storage time is minimised; soil types with significantly different properties will be stockpiled separately; locations are recorded using GPS and data recorded relating to the soil type and volume; storage sites are clearly identified and away from heavy vehicle routes; and stockpile surfaces are ripped and seeded (if natural revegetation does not provide adequate
cover).
4.8.9. Erosion Potential and Control
Erosion Hazard Open cut mining activities involve land disturbance that can pre-dispose an area to erosion risks. Typical mining activities that require use of erosion mitigation strategies include:
topsoil stripping ahead of mining development and for infrastructure development such as haul roads, hard stands and access tracks;
drainage line crossings for pipes and roads; spoil dump placement, as spoil is a fractured mix of earthen fines that has a considerable erosion
potential; and topsoil stockpiles.
Erosion Control Progressive rehabilitation will be undertaken to stabilise disturbed areas as quickly as practical and to limit erosion. Erosion and sediment control measures will be employed, which are consistent with the practices described in the then Department of Minerals and Energy’s, Technical Guidelines for the Environmental Management of Exploration and Mining in Queensland, (DME, 1995). A number of variables are included such as time of concentration, rainfall intensity, erosivity, gradient, scour velocities and flow estimations.
The erosion control measures to be employed throughout the life of the revised Project are summarised in Table 4-46. In addition, NAC will employ these controls to minimise the potential for runoff from the revised Project site across neighbouring properties. These controls will also minines the potential for erosion to occur on adjacent neighbouring properties.

New Acland Coal Mine Stage 3 Project – Environmental Impact Statement PAGE 4-85
Table 4-46 Erosion Causes and Control
Area Control Measure
Cleared Land restrict clearing to areas essential for the works windrow vegetation debris along the contour minimise length of time soil is exposed divert run-off from undisturbed areas away from the works direct run-off from cleared areas to sediment dam
Exposed Subsoils minimise length of time subsoil is exposed direct run-off from exposed areas to sediment dam(s)
Active Pit divert run-off from undisturbed areas away from mine pits pump rainfall run-off from pit only to the environmental dams for future water recycling
purposes or use directly from a sump for dust suppression purposes
Active Waste Rock dump
direct all run-off from dumps to sediment dams or basins avoid placement of sodic waste material on final external batters control surface drainage to minimise the formation of active gullies
Rehabilitation recontour waste rock dumps progressively to landform criteria install drainage control works replace topsoil, rip on the contour and seed direct run-off from rehabilitated areas to sediment dams
Infrastructure provide protection in drains (e.g. rip rap, grass) where water velocity may cause scouring
confine traffic to maintained tracks and roads install sediment traps, silt fences and or hay bales where necessary to control
sediment runoff rehabilitate disturbed areas around construction sites promptly
4.8.10. Fossils
Due to the nature of open cut mining operations, limitations to the identification of significant fossil finds (such as of dinosaurs or their tracks) exist, however NAC will take all reasonable and practical measures to identify and prevent impacts to significant fossil specimens during the construction and operational phase of the revised Project. In the event of a significant fossil find, NAC will liaise with the Queensland Museum about strategies to protect the find.
4.8.11. Decommissioning
A Life of Mine (LoM) Plan has been developed for the revised Project. This LoM Plan helps to inform the mine closure planning process and establishes a basis for final landform design and management. Over the life of the revised Project, this LoM Plan will be continuously revised based on economic, geological and engineering factors. In addition, this LoM Plan will be used to guide the day-to-day operational activities for the revised Project. As a result of this continuous planning process a competent Mine Closure Plan will be prepared towards the end of the revised Project’s life. This approach is consistent with industry leading practice.

New Acland Coal Mine Stage 3 Project – Environmental Impact Statement PAGE 4-86
This Mine Closure Plan will be submitted to the DEHP at least five years prior to the surrender of the EA. The decommissioning and final rehabilitation of the Project will occur on a staged basis over several years.
On the completion of mining, infrastructure will be treated as follows:
mine roads will be left behind for use as farm roads or rehabilitated if not required; water dams will remain if required by the relevant landowner and approved by regulators;
otherwise they will be rehabilitated; buildings, plant and equipment will be removed and the surface rehabilitated, including the CHPP,
workshop, offices, storage tanks and coal handling facilities; concrete pads will be covered with benign waste rock, topsoiled and revegetated or removed and
disposed to the nearest landfill; installation of a final cover system to the all TSFs; and the final voids remaining at the end of the mine life will be battered down to form depressed
landforms. The revised Project’s Final Landform Technical Report is presented in Appendix G.1.8.
4.9. Road Diversions
Once completed, road diversions will remain permanently in place as a public asset.
4.10. Rail Corridor
Decommissioning and rehabilitation of disturbance associated with the Rail Corridor will initially involve a decision on the value of retaining the asset for the future benefit of the community. Should it be considered preferable for the rail line to be removed and rehabilitated then the overall rehabilitation objective will be the return of the rail corridor to a land use which supports grazing where practicable.
Initially, the removal of infrastructure would be required with clearance verified for any ground contamination. Following reinstatement of a suitable soil profile, important attributes would include confirmation of suitable soil profile morphology and chemistry such that sufficient effective soil depth, fertility and water holding capacities are returned. Similarly, landforms should be returned which are stable and non-polluting.
Topsoil Stripping The soils of the A1, B1 and BA2 mapping units vary in depth for salinity and sodicity which may limit topsoil and subsoil stripping depths. These SMUs comprise most of the Rail Corridor and are deep medium to heavy clays of over 1.0 m in depth with high CEC ratings, and neutral to alkaline pH levels. Some areas (particularly A1) have been identified as saline and possibly sodic below 0.5 m depth. The stripping depths recommended for the Rail Corridor are based on laboratory data for the soils of each soil mapping unit (not just the representative site for the soil mapping unit).
A summary of recommended topsoil stripping information is presented below in Table 4-47.

New Acland Coal Mine Stage 3 Project – Environmental Impact Statement PAGE 4-87
Table 4-47 Recommended Topsoil Stripping Depths
Soil Mapping Unit
Topsoil Strip Depth (m)
Subsoil strip depth (m)
Comment
A1 0 - 0.3 0.3 – 0.5 Moderate to high risk of inclusion of saline and sodic material below 0.5 m B1 0 - 0.2 0.2 – 0.5
Ba2 0 - 0.2 0.2 – 0.8 All soil material to weathered basalt could be used Subsoils are saline and sodic below 0.8 m
Ba3 0 - 0.3/0.4 (variable) nil Rocky parent material presents gravel opportunity
Soil Stripping Management Measures The following soil handling techniques will be employed in stripping and handling of topsoil resources before land is cleared or disturbed:
All topsoil will be stripped as per conditions set out in the permit to disturb issued for the clearing Earthmoving plant operators will be trained and/or supervised to ensure that stripping operations
are conducted in accordance with stripping plans and in situ soil conditions. This will ensure that all suitable topsoil and subsoil material resources are salvaged and that the quality of the stripped soil is not reduced through contamination with unsuitable soils; and
Care will be taken to ensure soil moisture conditions are appropriate, i.e. neither too wet or dry, during stripping, stockpiling, and re-spreading to ensure that structural degradation of the soil is avoided and that excessive compaction does not occur during placement or through stockpiling.
Stockpiling topsoil and subsoil The following techniques will be employed for the stockpiling of topsoil and subsoil resources:
Stripped soil shall be stored in stockpiles until it is used. Separate stockpiles will be retained for topsoil (0-0.4 m depth) and subsoil (>0.4 m depth).
Soil material stockpiles will be located in areas that are outside the construction footprint area and away from drainage lines.
Drainage from higher areas will be diverted around stockpiles to prevent erosion. Sediment control (Sediment dams, basins, hay bales or sediment traps) will be installed
downstream of the stockpiles to collect any washed sediment. Topsoil stockpiles will be formed in low mounds up to a maximum height of 3 m and subsoil
stockpiles up to a maximum height of approximately 6 m, consistent with the storage area available. Long term stockpiles, not used for over 6 months will be deep ripped and sown with local grass seed-stock and legumes in order to keep the soil healthy and maintain biological activity.
Soil stockpiles will be clearly sign-posted for easy identification and to avoid any inadvertent losses.
Establishment of weeds on the stockpiles will also be monitored and controlled. An inventory of available material, including soil types, will be maintained to ensure adequate
materials are available for planned rehabilitation activities.
New Acland Coal Mine Stage 3 Project – Environmental Impact Statement PAGE 4-88
Re-spreading Rehabilitation planning will include topsoil and subsoil material re-spreading considerations including:
Balancing required rehabilitation topsoil and subsoil quantities against stored stockpile inventories; and
Selective placement of more erodible soil materials on flatter areas, to minimise erosion.
The re-spreading process will result in some mixing of the upper and lower sections of the stockpiles, promoting the spread of the seed stock and microfauna through the lower sections of the stockpile. Soil material will be re-spread in even layers at a thickness appropriate for the area to be rehabilitated and volume of soil available. The rehabilitation strategy will include the following measures that are designed to minimise the loss of soil material re-spread on rehabilitated areas:
Contour ripping to encourage rainfall infiltration and minimise runoff; Reseeding soon after re-spreading to establish a vegetation cover as early as possible; Installation of slope drainage control to limit slope lengths and runoff velocities; and Installation of collection drains and catches dams to collect runoff and remove suspended
sediment.
4.11. Conclusion
The revised Project site has a history of grazing and small lot cropping. Allotment and paddock sizes are relatively small and access is generally restricted by a mosaic of boundary and paddock fencing. Within the Study area the former Rosalie Shire Council identified two proposed Key Resources Areas (KRAs), which are very close to the KRA that covers the current mining operations on ML 50216 and ML 50170. Of the existing ML’s within the Study area, ML 50170 was granted in 2001, while ML 50216 was granted in 2006. Nearby land uses include pig farming, dairying, grain storage and various rural homestead properties. Predominant land use patterns of the revised Project site have remained cash and forage cropping in addition to grazing of improved pastures. Much of the revised Project site has long been cleared of its original vegetation due to agricultural production, although localised areas of original remnant vegetation remain alongside Lagoon Creek, relic alluvial plains and upland low hills. The revised Project site has been subject to long periods of continued dry years and unreliable rainfall since the early 1990’s.
The land parcels contained within the revised Project site are predominantly freehold and leasehold tenures held by APC. NAC has conducted an extensive Native Title analysis of all land tenure within the area of MLA 50232 and the proposed rail spur. This analysis indicated that Native Title has been extinguished over these areas. The revised Project site is located within the Lagoon Creek catchment. The majority of the terrain within the catchment is undulating and land use is predominantly grazing. Lagoon Creek is grazed and cultivated up to and within the creek channel. In the upper reaches of the catchment, the terrain becomes steeper and possesses tracts of remnant vegetation. Higher, localised peaks in the Lagoon Creek catchment are also vegetated with trees.
A range of soil types exist on the gently undulating topography of the Study area in which climate, topographical position and old sedimentary periods with more recent volcanic activity have played an important role in the formation of the soil mass. Most prominent soil types are the deep, heavy clay
New Acland Coal Mine Stage 3 Project – Environmental Impact Statement PAGE 4-89
alluvia, lighter clay ‘scrub soils’ and well-structured texture contrast soils which occur on undulating plains. Areas of sandy non cracking clays and sandy duplex soils also occur.
The soil survey identified a total of 12 soil types within the Study area which include two variants. The variants in this survey are for the high quality agricultural soil B1 and cover situations of reduced soil depth (shallow variant) or areas of increasing slope (upland variant). These variants are of minor occurrence but are noted as they have slightly reduced agricultural suitability.
All soils are considered to be suitable for grazing on improved pastures with the exception of some on the upper slopes where steeper soil types exist. Harris et al (1999) described the revised Project site as having a range of fertile soils with a desirable climate which is capable of growing a wide variety of crops and producing quality livestock.
The Study area supports grazing industries for beef and dairy production. Grazing is predominately based on native pastures and also occurs on mixed farming enterprises combining grain and fodder production. A number of other minor industries including piggeries, horticulture and animal studs are present within the Study area due to the diversity of soils, proximity to markets and a favorable climate. Cropping for grain production is one of the largest agricultural land uses and industries within the Study area with cultivation for cropping and/or sown pasture carried out to some extent.
Pasture lands occur throughout the Study area and mainly occur in soil types A3, A4, A5, B3 and B4. Most of these areas carry native or sown grasses supporting grazing livestock. These pasture lands are (or were) the basis for a number of beef enterprises and to a lesser extent, dairy enterprises of the Study area.
Based on a conservative assessment, it is anticipated that there will be a significant net reduction in the land suitability rating as a result of the revised Project. The suitability of post-mine features for cropping and grazing purposes is constrained by the slope angle, the nature of soil cover and altered moisture profile and waste material quality. These constraints would increase the risk of erosion significantly if cropping or grazing were undertaken on these areas. A return to grazing is entirely feasible for much of the revised Project site post-mining.
The TRC Scheme shows that the revised Project site overlies GQAL. Approximately 54 % of the revised Project site lies within Class A, 34 % within Class B and 12 % within Class C. The revised Project will disturb 1,108 ha of Class A GQAL with existing cropping use, while 343 ha of Class B GQAL will be impacted upon. However, Class B GQAL is considered to be marginal at best for cropping and more suited to grazing use.
As the revised Project site is located within the SCL Southern Protection Area and may result in a permanent impact on SCL, an SCL Protection decision is required as part of the approvals process and for the issuing of an EA for MLA 50232. NAC may undertake further survey of soils within MLA 50232 in areas which have been mapped as Potential SCL and are to be disturbed by the revised Project to confirm the extent of SCL and mitigation requirements. An assessment of areas to be disturbed by the revised Project against the provisions of the SCL Act will be made following the completion of the further soil survey.

New Acland Coal Mine Stage 3 Project – Environmental Impact Statement PAGE 4-90
A search of the CLR and the EMR has been conducted. No land parcels were recorded on the CLR. The search revealed that five sites are listed on the EMR. One of those sites is the former Acland Tip. It has been estimated that the Tip contains approximately 61,500 m3 of soil and waste material. Chemical analysis has been undertaken of samples of soil and waste material collected from the Tip. Based on the results of the chemical analysis, it has been concluded that the majority of the waste material can be classified as general waste and as such does not require any specialised management. The preferred strategy to manage the waste is to relocate the material to an engineered containment cell within one of the revised Project’s mine pits.
The spoil associated with the revised Project consists of weathered and fresh overburden having slightly higher clay content than the interburden and floor material. This material is generally geochemically benign, with negligible acid generation potential. During the initial phases of operation, and continuing throughout life of mine, it is proposed to carry out analysis of overburden and tailings material to confirm its geochemical characteristics, and if necessary, implement a series of mitigation measures as outlined above. Overall, the material tested is likely to be suitable for revegetation. Topsoil will also be used as a surface treatment prior to revegetation to minimise any effects from sodic spoil.
The overriding principle for the rehabilitation program at the revised Project is to ensure the disturbed land is returned to a post-mine condition that is stable, self-sustaining and requires minimal maintenance. The main post-mine land use at the revised Project will be grazing based on a self-sustaining vegetation community using appropriate pasture grasses and scattered plantings of native tree and shrub species. A conservation zone will be established along the riparian zone of Lagoon Creek and will also cover bottle tree hill.
The revised Project’s general rehabilitation areas comprise the greater part of the active mining areas, the out-of-pit dumps, the final voids and mine infrastructure. The general rehabilitation areas equate to approximately 2,030 ha and have been designated to be returned to a final land use of ‘grazing with scattered areas of native tree species for shade, ecological and aesthetic purposes’. The rehabilitation strategy will allow a majority of the former revised Project site to be re-incorporated into APC’s agricultural activities. The return of the revised Project land to grazing is consistent with the current land uses practised within the region and is considered a long term sustainable outcome for the revised Project.
A progressive rehabilitation program will be implemented throughout the mine life and reported in each Plan of Operations and will commence when areas become available within the operational land.
Rehabilitated land will be monitored on an annual basis until monitoring data confirms successful achievement of the agreed rehabilitation performance criteria. The experience at the Mine has shown that pasture establishment on elevated landforms is successful. Grazing trials will continue to confirm productivity and inform a long term management strategy for the rehabilitated land. Rehabilitated areas that have not reached a sufficient growth density of vegetation will be reseeded. Supplementary sowing of seed may be used to increase species diversity.

New Acland Coal Mine Stage 3 Project – Environmental Impact Statement PAGE 4-91
A Mine Closure Plan will be submitted to the DEHP at least five years prior to the surrender of the EA. The decommissioning and final rehabilitation of the revised Project will occur on a staged basis over several years.
4.12. Summary of Mitigations Measures and Commitments
The revised Projects mitigations measures and commitments for land resources are presented in Table 4-34.
Table 4-48 Summary of Mitigation Measure and Commitments
Activity Mitigation Measure/Commitment
Stock Routes NAC will consult with the DEHP in relation to the realignment of the Jondaryan-Muldu Road and will ensure continuity and operability of the stock route.
Road Openings and Closures NAC will liaise with the DEHP and other relevant government agencies including TRC as required, to gain all relevant approvals in relation to the opening and closing of roads (including roads which are stock routes) and in land dealings relating to changes in land tenure.
Fire Breaks and Maintenance Programs
NAC will liaise with landowners and local authorities with respect to fire breaks and on-going maintenance programs.
Off Site Water Discharges An assessment of the likelihood of offsite water discharges during the revised Project’s operation is provided in Chapter 5. The findings of this assessment demonstrate that the risk of discharge from the revised Project is low. NAC will continue to evaluate and manage this risk over the life of the revised Project.
Land Management and Monitoring Programs
NAC will expand its current monitoring programs and grazing trials to incorporate the applicable rehabilitation success criteria to guide its rehabilitation management and to collect the necessary data to demonstrate: o the geotechnical stability of the constructed landform; o the successful establishment of a suitable vegetative cover to support
the final land use and minimise the potential for erosion; and o the productivity of the vegetative cover for grazing (beef production).
Rehabilitation NAC will demonstrate in a scientifically rigorous manner the success of the revised Project’s rehabilitation to allow future surrender of the associated mining leases.
NAC will consult with government and community on a regular basis over the life of the revised Project to report on the progress of rehabilitation and other matters.
NAC is committed to maximising the revised Project’s rehabilitation success to ensure the APC can function as a competitive agribusiness. NAC will also continue to draw on the APC’s expertise to assist and enhance rehabilitation management.
NAC will use experience gained at the Mine and other mines in Queensland to meet its stable landform objective. Stable landforms will be established following mining, using soils capable of supporting vegetation

New Acland Coal Mine Stage 3 Project – Environmental Impact Statement PAGE 4-92
Activity Mitigation Measure/Commitment communities adapted to the local environment. The stability of the post-mine landform will be achieved by applying sound rehabilitation practices. The disturbed land will be rehabilitated to a condition that is self-sustaining or to a condition where the maintenance requirements are consistent with the post-mining land use.
NAC will continue and extend the existing grazing trial: o to assess the success of the current rehabilitated area in relation to the
performance of cattle growth (beef production); o to evaluate current rehabilitation practices from a final land use
perspective; and o as required, to develop new rehabilitation strategies to improve
rehabilitation and long term grazing performance. Longer term, the APC will also use this information to develop appropriate
land management plans for NAC’s former mined land within both the current Mine and the revised Project site.
Contaminated Sites NAC will undertake further management of these contaminated sites as the revised Project progresses.
Mineral Waste NAC will evaluate the acid generation potential regularly during mining operations to assess its acid generating capacity.
The following measures will be implemented to manage mine waste. Low capacity PAF (PAF-LC) and PAF mine waste will be: o progressively backfilled into pit voids and placed below the pre-mining
groundwater level; and o co-mingled with non-acid forming (NAF) materials in out of pit dumps
during construction.
Offset Strategy NAC will establish a suitable legal mechanism connected to the underlying land title to protect the Dichanthium sericeum based grassland offset. This legal agreement will also include a long term management plan for preservation of the Dichanthium sericeum based grassland offset. Similar arrangements will be in place for other off-set areas associated with the revised Project.
Fossils NAC will take all reasonable and practical measures to identify and prevent impacts to significant fossil specimens during the construction and operational phase of the revised Project. In the event of a significant fossil find, NAC will liaise with the Queensland Museum about strategies to protect the find.
Environmental Management Plans relevant to Land Resources
NAC will implement the: o ITSF Management Plan (Appendix J.1). o Final Land Use and Management Plan (Appendix J.2). o Topsoil Management Plan (Appendix J.3). o Conservation Zone Management Plan (Appendix J.6). o Threatened Species Relocation Management Plan (Appendix J.7). o Bluegrass Offset Management Plan (Appendix J.8). o Pest and Weed Management Plan (Appendix J.9).