Neural network implementation of a three phase model of respiratory rhythm generation
11
Biol. Cybern. 63, 143-153 (1990) Biological Cybernetics Springer-Verlag 1990 Neural Network Implementation of a Three-Phase Model of Respiratory Rhythm Generation S. M. Botros and E. N. Bruce Department of Biomedical Engineering, Case Western Reserve University, Cleveland, OH 44106 USA Received November 28, 1988/Accepted in revised form January 18, 1990 Abstract. A mathematical model of the central neural mechanisms of respiratory rhythm generation is devel- oped. This model assumes that the respiratory cycle consists of three phases: inspiration, post-inspiration, and expiration. Five respiratory neuronal groups are included: inspiratory, late-inspiratory, post-inspiratory, expiratory, and early-inspiratory neurons. Proposed in- terconnections among these groups are based substan- tially on previous physiological findings. The model produces a stable limit cycle and generally reproduces the features of the firing patterns of the 5 neuronal groups. When simulated feedback from pulmonary stretch receptors is made to excite late-inspiratory neu- rons and inhibit early-inspiratory neurons, the model quantitatively reproduces previous observations of the expiratory-prolonging effects of pulses and steps of vagal afferent activity presented in expiration. In addi- tion the model reproduces expected respiratory cycle timing and amplitude responses to change of chemical drive both in the absence and in the presence of simu- lated stretch receptor feedback. These results demon- strate the feasibility of generating the respiratory rhythm with a simple neural network based on ob- served respiratory neuronal groups. Other neuronal groups not included in the model may be more impor- tant for shaping the waveforms than for generating the basic oscillation. 1 Introduction The mammalian respiratory rhythm is generated by neural mechanisms located in the brainstem. There are two possible general mechanisms for the generation of this rhythm: pacemaker cells which have spontaneous oscillatory behavior (Onimaru and Homma 1987; Smith and Feldman 1987), or a neural network which oscillates by virtue of the connections between its com- ponents (Bradley et al. 1975; Feldman and Cowan 1965a, b; German and Miller 1976; Rubio 1972). The published qualitative and quantitative models of the respiratory central pattern generator (RCPG) typically have assumed that the respiratory rhythm is generated by a neural network. Due to the complex connectivi- ties between the known respiratory related (RR) neu- ronal populations, however, qualitative models alone are not adequate to examine the "emergent properties" of the neural networks and to provide an experimen- tal framework to test these models and assess their validity. On the other hand, many previous quantitative models (Bradley et al. 1975; Feldman and Cowan 1965b; German and Miller 1976; Rubio 1972) of the RCPG had a symmetry between the inspiratory and the expiratory neural groups and their connections which, because of the diversity of respiratory related neurons, does not seem realistic. Furthermore subse- quent studies have demonstrated additional types of RR neurons in the medulla (e.g., early inspiratory, post inspiratory) (Euler 1983, 1986; Feldman 1986; Long and Duffin 1984; Richter 1982; Richter et al. 1986), and the roles that these groups of neurons may have in basic respiratory rhythm generation and in mediating the effects of afferent inputs often were not considered. The objective of this paper is to describe a new mathematical model to represent the respiratory central pattern generator. This model is based substantially on a previously published qualitative model which assumes that the RCPG is formed of a neural network and that the respiratory cycle comprises three phases- inspira- tion, post-inspiration and expiration (Richter 1982; Richter et al. 1986). The objectives of evaluating quan- titatively the behavior of this model are: - To determine whether a unique model with fixed parameters can quantitatively reproduce a range of behaviors attributed to the qualitative model; - To propose how afferent inputs from respiratory central chemoreceptors for CO2/H + (Bruce and Cher- niack 1987) and from slowly adapting pulmonary stretch receptors may be processed by the respiratory neurons in the brainstem based on model simulations;
-
Upload
independent -
Category
Documents
-
view
0 -
download
0
Transcript of Neural network implementation of a three phase model of respiratory rhythm generation
Biol. Cybern. 63, 143-153 (1990) Biological Cybernetics �9 Springer-Verlag 1990
Neural Network Implementation of a Three-Phase Model of Respiratory Rhythm Generation S. M. Botros and E. N. Bruce
Department of Biomedical Engineering, Case Western Reserve University, Cleveland, OH 44106 USA
Received November 28, 1988/Accepted in revised form January 18, 1990
Abstract. A mathematical model of the central neural mechanisms of respiratory rhythm generation is devel- oped. This model assumes that the respiratory cycle consists of three phases: inspiration, post-inspiration, and expiration. Five respiratory neuronal groups are included: inspiratory, late-inspiratory, post-inspiratory, expiratory, and early-inspiratory neurons. Proposed in- terconnections among these groups are based substan- tially on previous physiological findings. The model produces a stable limit cycle and generally reproduces the features of the firing patterns of the 5 neuronal groups. When simulated feedback from pulmonary stretch receptors is made to excite late-inspiratory neu- rons and inhibit early-inspiratory neurons, the model quantitatively reproduces previous observations of the expiratory-prolonging effects of pulses and steps of vagal afferent activity presented in expiration. In addi- tion the model reproduces expected respiratory cycle timing and amplitude responses to change of chemical drive both in the absence and in the presence of simu- lated stretch receptor feedback. These results demon- strate the feasibility of generating the respiratory rhythm with a simple neural network based on ob- served respiratory neuronal groups. Other neuronal groups not included in the model may be more impor- tant for shaping the waveforms than for generating the basic oscillation.
1 Introduction
The mammalian respiratory rhythm is generated by neural mechanisms located in the brainstem. There are two possible general mechanisms for the generation of this rhythm: pacemaker cells which have spontaneous oscillatory behavior (Onimaru and Homma 1987; Smith and Feldman 1987), or a neural network which oscillates by virtue of the connections between its com- ponents (Bradley et al. 1975; Feldman and Cowan 1965a, b; German and Miller 1976; Rubio 1972). The
published qualitative and quantitative models of the respiratory central pattern generator (RCPG) typically have assumed that the respiratory rhythm is generated by a neural network. Due to the complex connectivi- ties between the known respiratory related (RR) neu- ronal populations, however, qualitative models alone are not adequate to examine the "emergent properties" of the neural networks and to provide an experimen- tal framework to test these models and assess their validity. On the other hand, many previous quantitative models (Bradley et al. 1975; Feldman and Cowan 1965b; German and Miller 1976; Rubio 1972) of the RCPG had a symmetry between the inspiratory and the expiratory neural groups and their connections which, because of the diversity of respiratory related neurons, does not seem realistic. Furthermore subse- quent studies have demonstrated additional types of RR neurons in the medulla (e.g., early inspiratory, post inspiratory) (Euler 1983, 1986; Feldman 1986; Long and Duffin 1984; Richter 1982; Richter et al. 1986), and the roles that these groups of neurons may have in basic respiratory rhythm generation and in mediating the effects of afferent inputs often were not considered.
The objective of this paper is to describe a new mathematical model to represent the respiratory central pattern generator. This model is based substantially on a previously published qualitative model which assumes that the RCPG is formed of a neural network and that the respiratory cycle comprises three phases - inspira- tion, post-inspiration and expiration (Richter 1982; Richter et al. 1986). The objectives of evaluating quan- titatively the behavior of this model are:
- To determine whether a unique model with fixed parameters can quantitatively reproduce a range of behaviors attributed to the qualitative model;
- To propose how afferent inputs from respiratory central chemoreceptors for C O 2 / H + (Bruce and Cher- niack 1987) and from slowly adapting pulmonary stretch receptors may be processed by the respiratory neurons in the brainstem based on model simulations;
144
- To suggest changes in the qualitative hypotheses based on discrepancies between model predictions and experimental results.
2 The Model
2.1 Model Structure
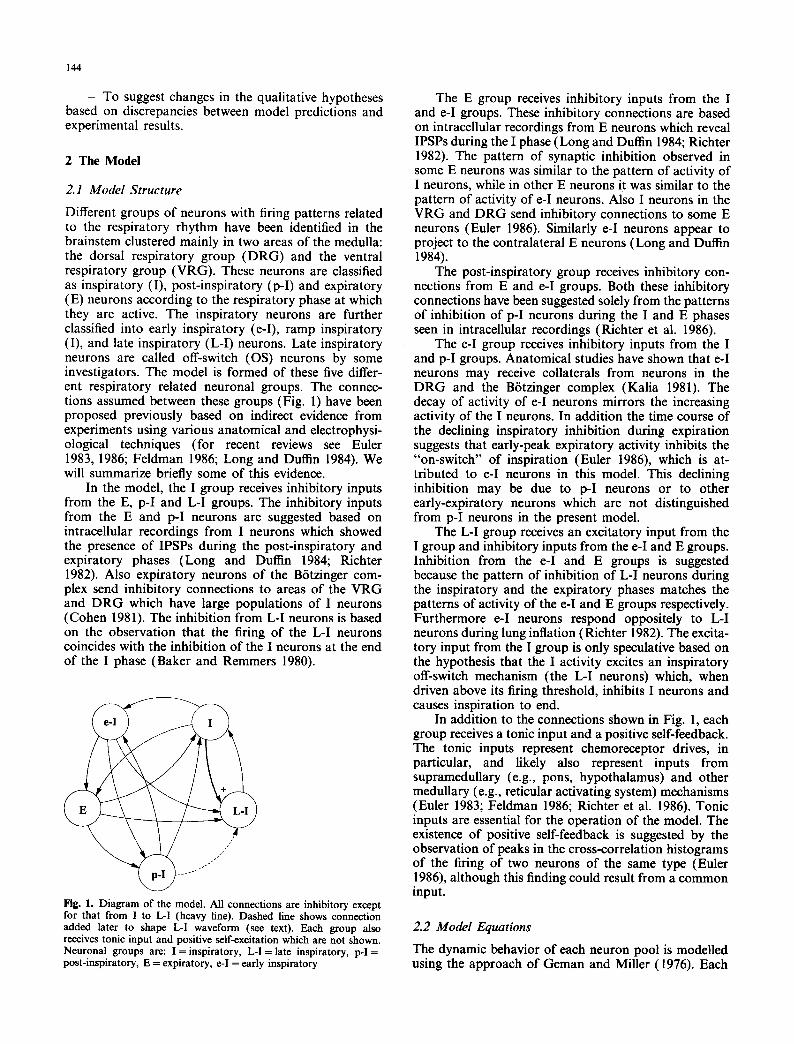
Different groups of neurons with firing patterns related to the respiratory rhythm have been identified in the brainstem clustered mainly in two areas of the medulla: the dorsal respiratory group (DRG) and the ventral respiratory group (VRG). These neurons are classified as inspiratory (I), post-inspiratory (p-I) and expiratory (E) neurons according to the respiratory phase at which they are active. The inspiratory neurons are further classified into early inspiratory (e-l), ramp inspiratory (I), and late inspiratory (L-I) neurons. Late inspiratory neurons are called off-switch (OS) neurons by some investigators. The model is formed of these five differ- ent respiratory related neuronal groups. The connec- tions assumed between these groups (Fig. 1) have been proposed previously based on indirect evidence from experiments using various anatomical and electrophysi- ological techniques (for recent reviews see Euler 1983, 1986; Feldman 1986; Long and Duffin 1984). We will summarize briefly some of this evidence.
In the model, the I group receives inhibitory inputs from the E, p-I and L-I groups. The inhibitory inputs from the E and p-I neurons are suggested based on intracellular recordings from I neurons which showed the presence of IPSPs during the post-inspiratory and expiratory phases (Long and Duffin 1984; Richter 1982). Also expiratory neurons of the Brtzinger com- plex send inhibitory connections to areas of the VRG and D R G which have large populations of I neurons (Cohen 1981). The inhibition from L-I neurons is based on the observation that the firing of the L-I neurons coincides with the inhibition of the I neurons at the end of the I phase (Baker and Remmers 1980).
Fig. 1. Diagram of the model. All connections are inhibitory except for that from I to L-I (heavy line). Dashed line shows connection added later to shape L-I waveform (see text). Each group also receives tonic input and positive self-excitation which are not shown. Neuronal groups are: I = inspiratory, L-I = late inspiratory, p-I = post-inspiratory, E = expiratory, e-I = early inspiratory
The E group receives inhibitory inputs from the I and e-I groups. These inhibitory connections are based on intraceUular recordings from E neurons which reveal IPSPs during the I phase (Long and Duffin 1984; Richter 1982). The pattern of synaptic inhibition observed in some E neurons was similar to the pattern of activity of I neurons, while in other E neurons it was similar to the pattern of activity of e-I neurons. Also I neurons in the VRG and D R G send inhibitory connections to some E neurons (Euler 1986). Similarly e-I neurons appear to project to the contralateral E neurons (Long and Duffin 1984).
The post-inspiratory group receives inhibitory con- nections from E and e-I groups. Both these inhibitory connections have been suggested solely from the patterns of inhibition of p-I neurons during the I and E phases seen in intracellular recordings (Richter et al. 1986).
The e-I group receives inhibitory inputs from the I and p-I groups. Anatomical studies have shown that e-I neurons may receive collaterals from neurons in the D R G and the Brtzinger complex (Kalia 1981). The decay of activity of e-I neurons mirrors the increasing activity of the I neurons. In addition the time course of the declining inspiratory inhibition during expiration suggests that early-peak expiratory activity inhibits the "on-switch" of inspiration (Euler 1986), which is at- tributed to e-I neurons in this model. This declining inhibition may be due to p-I neurons or to other early-expiratory neurons which are not distinguished from p-I neurons in the present model.
The L-I group receives an excitatory input from the I group and inhibitory inputs from the e-I and E groups. Inhibition from the e-I and E groups is suggested because the pattern of inhibition of L-I neurons during the inspiratory and the expiratory phases matches the patterns of activity of the e-I and E groups respectively. Furthermore e-I neurons respond oppositely to L-I neurons during lung inflation (Richter 1982). The excita- tory input from the I group is only speculative based on the hypothesis that the I activity excites an inspiratory off-switch mechanism (the L-I neurons) which, when driven above its firing threshold, inhibits I neurons and causes inspiration to end.
In addition to the connections shown in Fig. 1, each group receives a tonic input and a positive self-feedback. The tonic inputs represent chemoreceptor drives, in particular, and likely also represent inputs from supramedullary (e.g., pons, hypothalamus) and other medullary (e.g., reticular activating system) mechanisms (Euler 1983; Feldman 1986; Richter et al. 1986). Tonic inputs are essential for the operation of the model. The existence of positive self-feedback is suggested by the observation of peaks in the cross-correlation histograms of the firing of two neurons of the same type (Euler 1986), although this finding could result from a common input.
2.2 Model Equations
The dynamic behavior of each neuron pool is modelled using the approach of Geman and Miller (1976). Each
145
group of neurons is considered as a single unit, receiv- ing common inputs and having the same output. The output of each group represents the average potential of the neurons in the group. The synaptic weights between the groups represent the average synaptic con- nec t iv i ty - that is, the relative tendency of neurons of one group to project to and influence the potential of neurons of another group. The rate of change of the activity of one neural group is equal to a weighted sum of: (i) the activities of the other groups (each transformed by a sigmoidal function), 00 a tonic in- put, (iii) a positive self-feedback, and (iv) a decay term proportional to the output of the group. This can be expressed mathematically by the following differential Eq.:
dXi 5 - - = - a ~ . X i - ~ Wji . S ( X j ) + W• . S (X~) + Bi d t j = ~, ~
where:
Xi represents the output of one of the 5 neuronal groups - i.e., I (inspiratory), E (expiratory), e t c . . .
Wji is the coupling parameter from the j - th group to the i-th group,
a; is a measure of the rate of decay of the activity of the i-th group if no input is present,
B,. represents the tonic input to the i-th group. This input includes physical inputs from different neural structures, as mentioned previously, and may also rep- resent relative differences in excitability between the different groups,
S( �9 ) is a sigmoidal function relating the frequency of firing of one group to its activity. This function is of the form:
s ( x ) = K . ~ + (1 - K ) �9 I~
~(X)={min (X , 4) x<0X~>0
4 /~(X) - 1 + e - 1.75-(x- 2)
where K is a constant with a value between zero and one which determines the degree of "smoothness" of S ( X ) . The sigmoidal function S ( X ) is similar to the one used by Engeman and Swanson (1979) and by Dooren and Vis (1982). In the present study K = 0.6.
Combining the mathematical representation of each neural group with the proposed connections be- tween the different respiratory groups (Fig. 1) results in the following system of ordinary nonlinear differen- tial equations (Eq. set 1):
dI - - = - a l " I - Wet" S(E) - Wel" S(P) d t
-- Wt-z" S(L) + WI," S(I) + Bz
dL
dt - at. �9 L + Wit- �9 S ( I ) - Wet . " S ( E )
- w R , �9 s ( R ) + wt- t - �9 s ( L ) + Bt-
d P
d t
d E
d t
- a e ' P - W E e " S ( E ) - W R p " S ( R )
- W e e �9 S ( P ) + B e
- a e ' E - W t E ' S ( I ) - W R e ' S ( R )
- W e e " S ( E ) + B e
d R - - = - a R " R - WtR " S ( I ) -- WpR " S ( P ) d t
- WRR " S ( R ) + BR
where P, R, and L represent p-I, e-I, and L-I neurons respectively.
2.3 Es t ima t ion o f the M o d e l P a r a m e t e r s
Since the solution to the system of equations describing the model is bounded (because of the saturation func- tion and the decay time constant), choosing the parameters of the system such that no stable equi- librium points exist will result in oscillatory behavior (Poincare-Bendixon theorem). The objective is to find the best set of parameters (having the minimum sum of squared errors) which simulate as closely as possible the known patterns of activity of the different neural groups. Because of the limited data available
8 4
0
-4
-8
4 L- I
0
-4
-8
4 p-I
0
-4
-8
8 E
4
0
-4
8 e-I
4
0
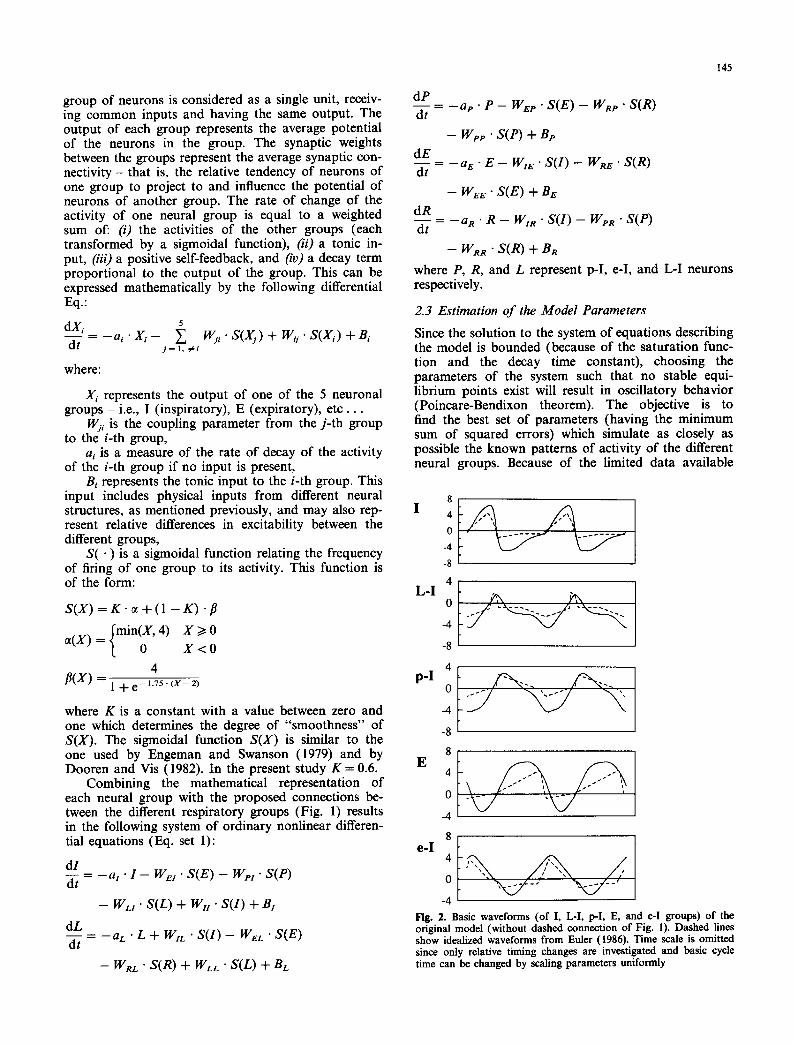
-4 Fig. 2. Basic waveforms (of I, L-I, p-I, E, and e-I groups) of the original model (without dashed connection of Fig. 1). Dashed lines show idealized waveforms from Euler (1986). Time scale is omitted since only relative timing changes are investigated and basic cycle time can be changed by scaling parameters uniformly
146
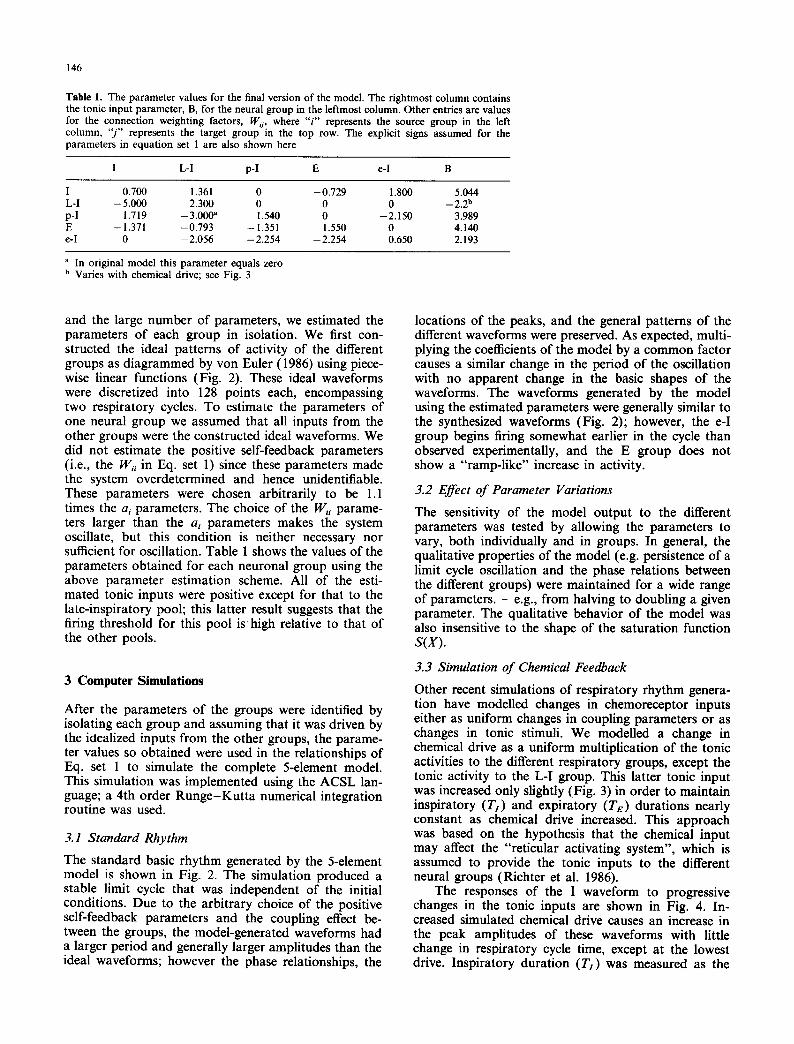
Table 1. The parameter values for the final version of the model. The rightmost column contains the tonic input parameter, B, for the neural group in the leftmost column. Other entries are values for the connection weighting factors, Wij , where " i " represents the source group in the left column, " j " represents the target group in the top row. The explicit signs assumed for the parameters in equation set 1 are also shown here
I L-I p-I E e-I B
I 0.700 1.361 0 -0 .729 - 1.800 5.044 L-I - 5.000 2.300 0 0 0 - 2.2 b p-I - 1 .719 - 3 . 0 0 0 a 1.540 0 -2 .150 3.989 E -- 1.371 -0 .793 - 1.351 1.550 0 4.140 e-I 0 -- 2.056 - 2.254 - 2.254 0.650 2.193
a In original model this parameter equals zero b Varies with chemical drive; see Fig. 3
and the large number of parameters, we estimated the parameters of each group in isolation. We first con- structed the ideal patterns of activity of the different groups as diagrammed by von Euler (1986) using piece- wise linear functions (Fig. 2). These ideal waveforms were discretized into 128 points each, encompassing two respiratory cycles. To estimate the parameters of one neural group we assumed that all inputs from the other groups were the constructed ideal waveforms. We did not estimate the positive self-feedback parameters (i.e., the W,-i in Eq. set 1) since these parameters made the system overdetermined and hence unidentifiable. These parameters were chosen arbitrarily to be 1.1 times the ai parameters. The choice of the W;i parame- ters larger than the ai parameters makes the system oscillate, but this condition is neither necessary nor sufficient for oscillation. Table 1 shows the values of the parameters obtained for each neuronal group using the above parameter estimation scheme. All of the esti- mated tonic inputs were positive except for that to the late-inspiratory pool; this latter result suggests that the firing threshold for this pool is high relative to that of the other pools.
3 Computer Simulations
After the parameters of the groups were identified by isolating each group and assuming that it was driven by the iOealized inputs from the other groups, the parame- ter values so obtained were used in the relationships of Eq. set 1 to simulate the complete 5-element model. This simulation was implemented using the ACSL lan- guage; a 4th order Runge-Kutta numerical integration routine was used.
3.1 Standard Rhythm
The standard basic rhythm generated by the 5-element model is shown in Fig. 2. The simulation produced a stable limit cycle that was independent of the initial conditions. Due to the arbitrary choice of the positive self-feedback parameters and the coupling effect be- tween the groups, the model-generated waveforms had a larger period and generally larger amplitudes than the ideal waveforms; however the phase relationships, the
locations of the peaks, and the general patterns of the different waveforms were preserved. As expected, multi- plying the coefficients of the model by a common factor causes a similar change in the period of the oscillation with no apparent change in the basic shapes of the waveforms. The waveforms generated by the model using the estimated parameters were generally similar to the synthesized waveforms (Fig. 2); however, the e-I group begins firing somewhat earlier in the cycle than observed experimentally, and the E group does not show a "ramp-like" increase in activity.
3.2 Effect of Parameter Variations
The sensitivity of the model output to the different parameters was tested by allowing the parameters to vary, both individually and in groups. In general, the qualitative properties of the model (e.g. persistence of a limit cycle oscillation and the phase relations between the different groups) were maintained for a wide range of parameters. - e.g., from halving to doubling a given parameter. The qualitative behavior of the model was also insensitive to the shape of the saturation function S(S).
3.3 Simulation of Chemical Feedback
Other recent simulations of respiratory rhythm genera- tion have modelled changes in chemoreceptor inputs either as uniform changes in coupling parameters or as changes in tonic stimuli. We modelled a change in chemical drive as a uniform multiplication of the tonic activities to the different respiratory groups, except the tonic activity to the L-I group. This latter tonic input was increased only slightly (Fig. 3) in order to maintain inspiratory (T~) and expiratory (Te) durations nearly constant as chemical drive increased. This approach was based on the hypothesis that the chemical input may affect the "reticular activating system", which is assumed to provide the tonic inputs to the different neural groups (Richter et al. 1986).
The responses of the I waveform to progressive changes in the tonic inputs are shown in Fig. 4. In- creased simulated chemical drive causes an increase in the peak amplitudes of these waveforms with little change in respiratory cycle time, except at the lowest drive. Inspiratory duration (Tz) was measured as the
147
-2.6 I- - - a
-2.4 z O -2.2 Z
O -2.0
-1.8 Z
'"' -1.6
" ~ - 1.4 0 , I J �9 , . ' .
0.2 014 0.6 0.8 RELATIVE CHEMICAL DRIVE
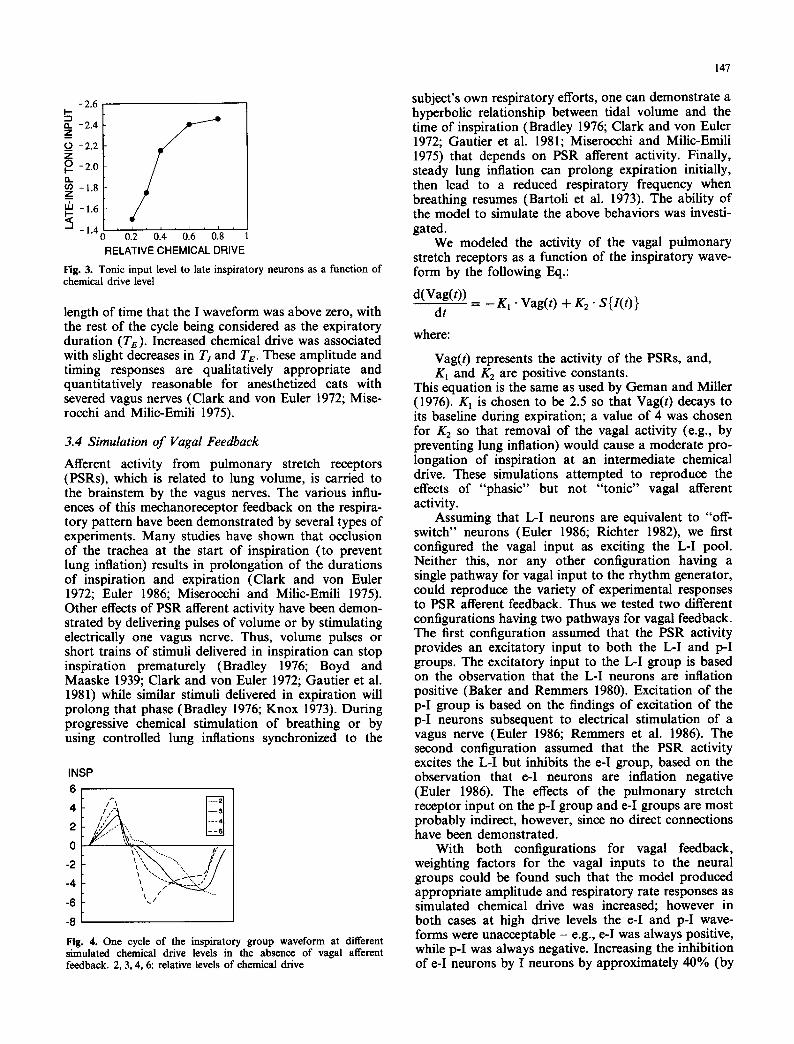
Fig. 3. Tonic input level to late inspiratory neurons as a function of chemical drive level
length of time that the I waveform was above zero, with the rest of the cycle being considered as the expiratory duration (Te). Increased chemical drive was associated with slight decreases in Tt and Te. These amplitude and timing responses are qualitatively appropriate and quantitatively reasonable for anesthetized cats with severed vagus nerves (Clark and von Euler 1972; Mise- rocchi and Milic-Emili 1975).
3.4 Simulation of Vagal Feedback
Afferent activity from pulmonary stretch receptors (PSRs), which is related to lung volume, is carried to the brainstem by the vagus nerves. The various influ- ences of this mechanoreceptor feedback on the respira- tory pattern have been demonstrated by several types of experiments. Many studies have shown that occlusion of the trachea at the start of inspiration (to prevent lung inflation) results in prolongation of the durations of inspiration and expiration (Clark and yon Euler 1972; Euler 1986; Miserocchi and Milic-Emili 1975). Other effects of PSR afferent activity have been demon- strated by delivering pulses of volume or by stimulating electrically one vagus nerve. Thus, volume pulses or short trains of stimuli delivered in inspiration can stop inspiration prematurely (Bradley 1976; Boyd and Maaske 1939; Clark and von Euler 1972; Gautier et al. 1981) while similar stimuli delivered in expiration will prolong that phase (Bradley 1976; Knox 1973). During progressive chemical stimulation of breathing or by using controlled lung inflations synchronized to the
INSP
6
0
-2
-4
-6
-8
/I/," / , / ...
Fig. 4. One cycle of the inspiratory group waveform at different simulated chemical drive levels in the absence of vagal afferent feedback. 2, 3, 4, 6: relative levels of chemical drive
subject's own respiratory efforts, one can demonstrate a hyperbolic relationship between tidal volume and the time of inspiration (Bradley 1976; Clark and von Euler 1972; Gautier et al. 1981; Miserocchi and Milic-Emili 1975) that depends on PSR afferent activity. Finally, steady lung inflation can prolong expiration initially, then lead to a reduced respiratory frequency when breathing resumes (Bartoli et al. 1973). The ability of the model to simulate the above behaviors was investi- gated.
We modeled the activity of the vagal pulmonary stretch receptors as a function of the inspiratory wave- form by the following Eq.:
d(Vag(t)) _ KI" Vag(t) + K2" S{I(t)}
dt
where:
Vag(t) represents the activity of the PSRs, and, K1 and K2 are positive constants.
This equation is the same as used by Geman and Miller (1976). K, is chosen to be 2.5 so that Vag(t) decays to its baseline during expiration; a value of 4 was chosen for K2 so that removal of the vagal activity (e.g., by preventing lung inflation) would cause a moderate pro- longation of inspiration at an intermediate chemical drive. These simulations attempted to reproduce the effects of "phasic" but not "tonic" vagal afferent activity.
Assuming that L-I neurons are equivalent to "off- switch" neurons (Euler 1986; Richter 1982), we first configured the vagal input as exciting the L-I pool. Neither this, nor any other configuration having a single pathway for vagal input to the rhythm generator, could reproduce the variety of experimental responses to PSR afferent feedback. Thus we tested two different configurations having two pathways for vagal feedback. The first configuration assumed that the PSR activity provides an excitatory input to both the L-I and p-I groups. The excitatory input to the L-I group is based on the observation that the L-I neurons are inflation positive (Baker and Remmers 1980). Excitation of the p-I group is based on the findings of excitation of the p-I neurons subsequent to electrical stimulation of a vagus nerve (Euler 1986; Remmers et al. 1986). The second configuration assumed that the PSR activity excites the L-I but inhibits the e-I group, based on the observation that e-I neurons are inflation negative (Euler 1986). The effects of the pulmonary stretch receptor input on the p-I group and e-I groups are most probably indirect, however, since no direct connections have been demonstrated.
With both configurations for vagal feedback, weighting factors for the vagal inputs to the neural groups could be found such that the model produced appropriate amplitude and respiratory rate responses as simulated chemical drive was increased; however in both cases at high drive levels the e-I and p-I wave- forms were unacceptable - e.g., e-I was always positive, while p-I was always negative. Increasing the inhibition of e-I neurons by I neurons by approximately 40% (by
148
increasing W l f 1 from 1.3 to 1.8) corrected both wave- forms with little alteration of the behavior of the model in the absence of vagal feedback. A second modification was deemed desirable, however, to increase the rate of decay of L-I activity from its positive peak early in expiration, because this activity persisted until the middle of expiration. We assumed that p-I neurons inhibit L-I neurons also (Richter et al. 1987), using a coupling factor ( W m o s = 3.0) which provided enough inhibition to reduce the duration of positive L-I activity to about one-half of what it had been. The model with these two revisions was used to investigate responses to simulated vagal feedback from pulmonary stretch re- ceptors.
For both configurations of vagal feedback, increas- ing simulated chemical drive resulted in a decrease in/'1 due to excitation of L-! neurons by vagal activity. The concomitant change in Te depends on two factors: (i) a shortening resulting from a coupling of /'1 and Te through the basic oscillator, and; (~0 a lengthening resulting from the inhibition of e-I neurons, either directly or via the excitation of p-I neurons. To achieve a degree of shortening of TE that is quantitatively consistent with experimental data from anesthetized animals, the weighting factor for vagal input to L-I neurons had to be on the order of 10 times that for the vagal input to p-I or e-I neurons. Both configurations for vagal feedback thus produced qualitatively appro- priate changes in the I waveform- i.e., increased am- plitude and decreased 7"1 (e.g., Clark and yon Euler 1972)- and shortening of expiration, as simulated chemical drive was increased.
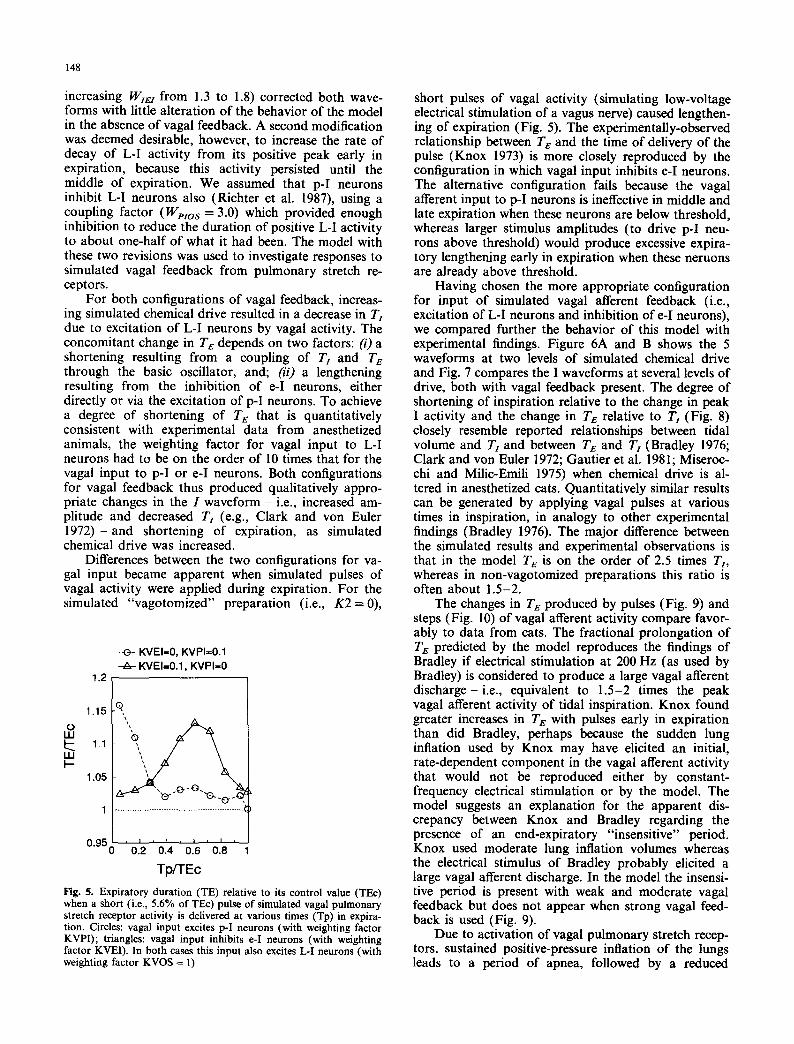
Differences between the two configurations for va- gal input became apparent when simulated pulses of vagal activity were applied during expiration. For the simulated "vagotomized" preparation (i.e., K2=0) ,
- ~ - KVEI=0, KVPI=0.1 - ~ - KVEI=0.1, KVPI=0 12 IQ '
1.15 ,
w ~ 1.1
1 . 0 5
1 .....................................................
9 5 0 ' , , , . , , , , 0. 0.2 0.4 0.6 0.8
T p / T E c
Fig. 5. Expiratory duration (TE) relative to its control value (TEc) when a short (i.e., 5.6% of TEc) pulse of simulated vagal pulmonary stretch receptor activity is delivered at various times (Tp) in expira- tion. Circles: vagal input excites p-I neurons (with weighting factor KVPI); triangles: vagal input inhibits e-I neurons (with weighting factor KVEI). In both cases this input also excites L-I neurons (with weighting factor KVOS = 1)
short pulses of vagal activity (simulating low-voltage electrical stimulation of a vagus nerve) caused lengthen- ing of expiration (Fig. 5). The experimentally-observed relationship between Te and the time of delivery of the pulse (Knox 1973) is more closely reproduced by the configuration in which vagal input inhibits e-I neurons. The alternative configuration fails because the vagal afferent input to p-I neurons is ineffective in middle and late expiration when these neurons are below threshold, whereas larger stimulus amplitudes (to drive p-I neu- rons above threshold) would produce excessive expira- tory lengthening early in expiration when these neruons are already above threshold.
Having chosen the more appropriate configuration for input of simulated vagal afferent feedback (i.e., excitation of L-I neurons and inhibition of e-I neurons), we compared further the behavior of this model with experimental findings. Figure 6A and B shows the 5 waveforms at two levels of simulated chemical drive and Fig. 7 compares the I waveforms at several levels of drive, both with vagal feedback present. The degree of shortening of inspiration relative to the change in peak I activity and the change in TE relative to Tt (Fig. 8) closely resemble reported relationships between tidal volume and 7"1 and between Te and Tt (Bradley 1976; Clark and von Euler 1972; Gautier et al. 1981; Miseroc- chi and Milic-Emili 1975) when chemical drive is al- tered in anesthetized cats. Quantitatively similar results can be generated by applying vagal pulses at various times in inspiration, in analogy to other experimental findings (Bradley 1976). The major difference between the simulated results and experimental observations is that in the model T e is on the order of 2.5 times /'i, whereas in non-vagotomized preparations this ratio is often about 1.5-2.
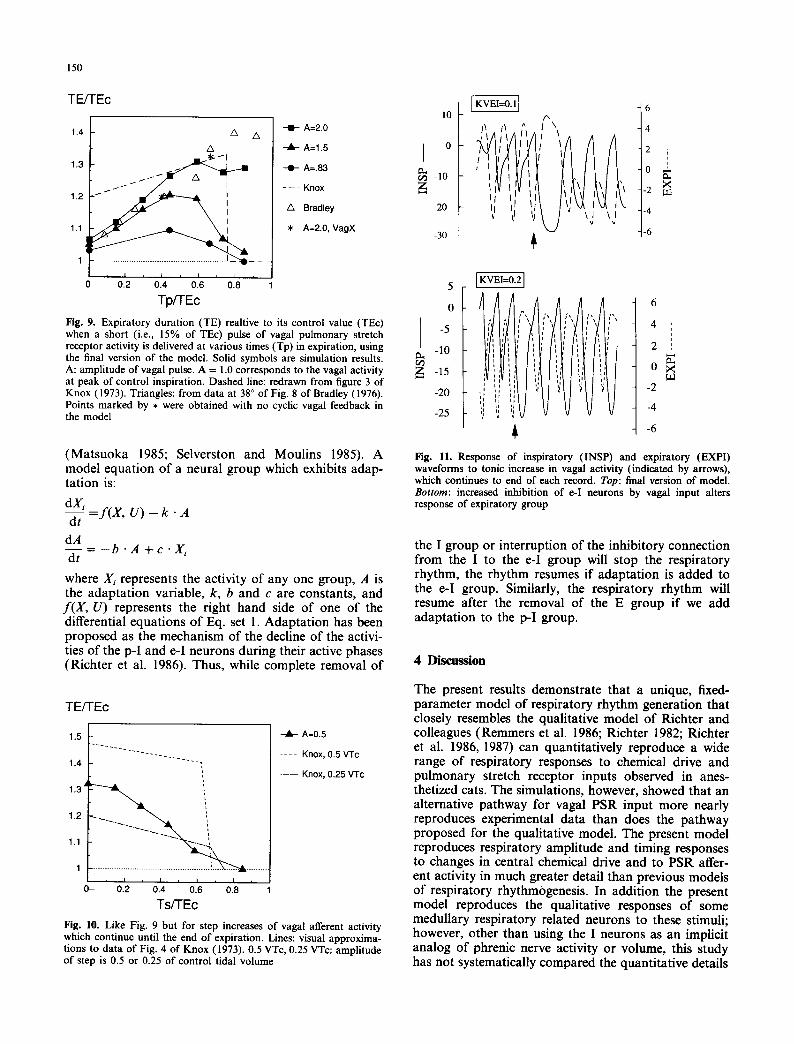
The changes in TE produced by pulses (Fig. 9) and steps (Fig. 10) of vagal afferent activity compare favor- ably to data from cats. The fractional prolongation of T e predicted by the model reproduces the findings of Bradley if electrical stimulation at 200 Hz (as used by Bradley) is considered to produce a large vagal afferent discharge- i.e., equivalent to 1.5-2 times the peak vagal afferent activity of tidal inspiration. Knox found greater increases in T e with pulses early in expiration than did Bradley, perhaps because the sudden lung inflation used by Knox may have elicited an initial, rate-dependent component in the vagal afferent activity that would not be reproduced either by constant- frequency electrical stimulation or by the model. The model suggests an explanation for the apparent dis- crepancy between Knox and Bradley regarding the presence of an end-expiratory "insensitive" period. Knox used moderate lung inflation volumes whereas the electrical stimulus of Bradley probably elicited a large vagal afferent discharge. In the model the insensi- tive period is present with weak and moderate vagal feedback but does not appear when strong vagal feed- back is used (Fig. 9).
Due to activation of vagal pulmonary stretch recep- tors, sustained positive-pressure inflation of the lungs leads to a period of apnea, followed by a reduced
149
61 6
p-I .o
-5 ~"
5 E 3
-1 -3 -5
e-I 4 3
-I (a)
-
L-I 6 3
0
-3
-6
2 p-I o
-2
-4
-6
E 6 4 2 0
-2 I -4
6 e-I 4
2
0
-2 (b)
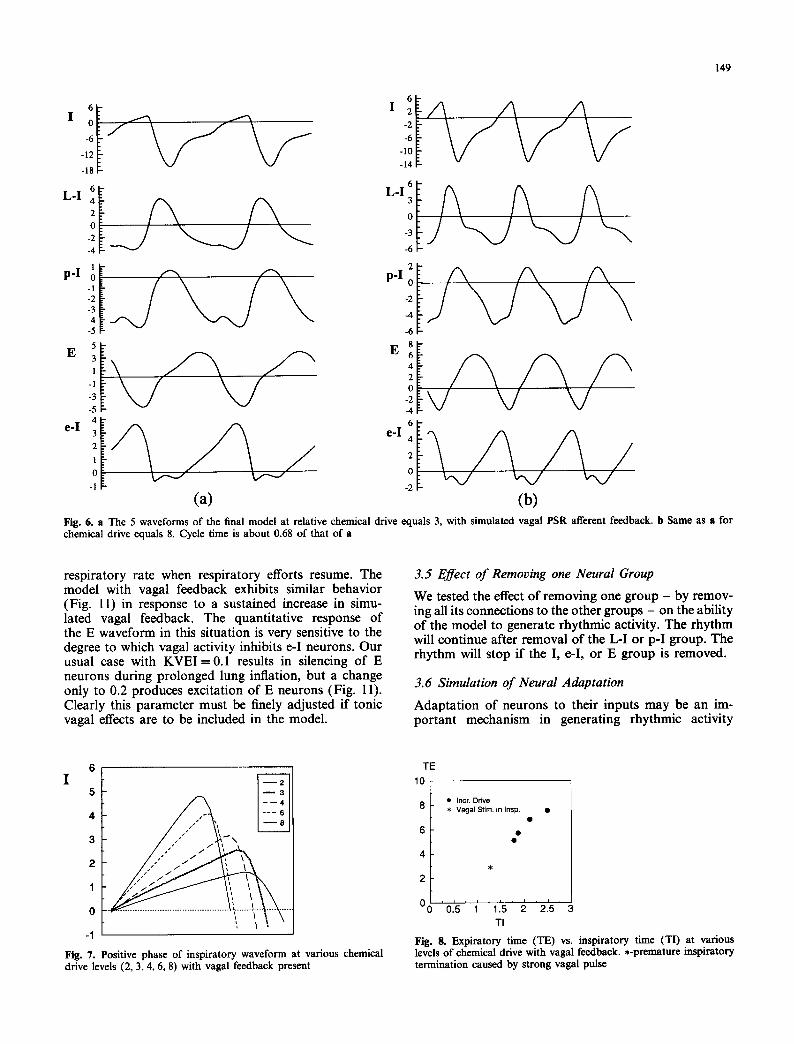
Fig. 6. a The 5 waveforms of the final model at relative chemical drive equals 3, with simulated vagal PSR afferent feedback, b Same as a for chemical drive equals 8. Cycle time is about 0.68 of that of a
respiratory rate when respiratory efforts resume. The model with vagal feedback exhibits similar behavior (Fig. 11) in response to a sustained increase in simu- lated vagal feedback. The quantitative response of the E waveform in this situation is very sensitive to the degree to which vagal activity inhibits e-I neurons. Our usual case with KVEI = 0.1 results in silencing of E neurons during prolonged lung inflation, but a change only to 0.2 produces excitation of E neurons (Fig. 11). Clearly this parameter must be finely adjusted if tonic vagal effects are to be included in the model.
3.5 Effect of Removing one Neural Group
We tested the effect of removing one group - by remov- ing all its connections to the other groups - on the ability of the model to generate rhythmic activity. The rhythm will continue after removal of the L-I or p-I group. The rhythm will stop if the I, e-I, or E group is removed.
3.6 Simulation of Neural Adaptation
Adaptation of neurons to their inputs may be an im- portant mechanism in generating rhythmic activity
6
3 \ \~
]
0 . . . .
-1
Fig. 7. Positive phase of iuspiratory waveform at various chemical drive levels (2, 3, 4, 6, 8) with vagal feedback present
TE 10
8
6
4
2
0 0
�9 Incr. Drive * Vagal Stirn. in Insp. �9
' 11 ' , 'o.'5 '215 3 TI
Fig. 8. Expiratory time (TE) vs. inspiratory time (TI) at various levels o f chemical drive with vagal feedback. ,-premature inspiratory termination caused by strong vagal pulse
150
TE/TEc
- I - A=2.0 1.4 /k /k /k -A- A=1.5
1.3 ~ --0- A=.83
I I ---- Knox 1.2 / I
I ~ Bradley
1.1 * A=2.0, VagX
0 ' 0.q2 014 ' 0.i6 ' 0.=8 '
Tp/rEc
Fig. 9. Expiratory duration (TE) realtive to its control value (TEc) when a short (i.e., 15% of TEc) pulse of vagal pulmonary stretch receptor activity is delivered at various times (Tp) in expiration, using the final version of the model. Solid symbols are simulation results. A: amplitude of vagal pulse. A = 1.0 corresponds to the vagal activity at peak of control inspiration. Dashed line: redrawn from figure 3 of Knox (1973). Triangles: from data at 38 ~ of Fig. 8 of Bradley (1976). Points marked by * were obtained with no cyclic vagal feedback in the model
(Matsuoka 1985; Selverston and Moulins 1985). A model equation of a neural group which exhibits adap- tation is:
dX~ - f ( X , U) - - k . A
dt
dA - b ' A + c . X i
dt
where Xg represents the activity of any one group, A is the adaptation variable, k, b and c are constants, and f ( X , U) represents the right hand side of one of the differential equations of Eq. set 1. Adaptation has been proposed as the mechanism of the decline of the activi- ties of the p-I and e-I neurons during their active phases (Richter et al. 1986). Thus, while complete removal of
TE/TEc
1.5 L -~ - A=0.5
r . . . . . . . . . . . . . . . . . . . . . . . . . . . Knox, 0.5 VTc 1 , 4
. . . . Knox, 0.25 v-rc
1 " 3 ~ ~
1.2
1.1 . . . . .~
1 . . . . . . . . . .
f f 0.12 0.4 0.16 0.8 Ts/TEc
Fig. 10. Like Fig. 9 but for step increases of vagal afferent activity which continue until the end of expiration. Lines: visual approxima- tions to data of Fig. 4 of Knox (1973). 0.5 VTc, 0.25 VTc: amplitude of step is 0.5 or 0.25 of control tidal volume
10
I ~ -10
-20
-30
I ~ I~ i~
, l l / ~
II i I
r
\ \1 J
2 i i
-2
-6
0
-5
-10
Z -15
-20
-25
I i r I i I i ~ p
i i i I i
I i
i 1 I h ; i ' " ,,
I I I I L r t l h
6
4
2
-2
-4
-6
Fig. 11. Response of inspiratory (INSP) and expiratory (EXPI) waveforms to tonic increase in vagal activity (indicated by arrows), which continues to end of each record. Top: final version of model. Bottom: increased inhibition of e-I neurons by vagal input alters response of expiratory group
the I group or interruption of the inhibitory connection from the I to the e-I group will stop the respiratory rhythm, the rhythm resumes if adaptation is added to the e-I group. Similarly, the respiratory rhythm will resume after the removal of the E group if we add adaptation to the p-I group.
4 D i s c u s s i o n
The present results demonstrate that a unique, fixed- parameter model of respiratory rhythm generation that closely resembles the qualitative model of Richter and colleagues (Remmers et al. 1986; Richter 1982; Richter et al. 1986, 1987) can quantitatively reproduce a wide range of respiratory responses to chemical drive and pulmonary stretch receptor inputs observed in anes- thetized cats. The simulations, however, showed that an alternative pathway for vagal PSR input more nearly reproduces experimental data than does the pathway proposed for the qualitative model. The present model reproduces respiratory amplitude and timing responses to changes in central chemical drive and to PSR affer- ent activity in much greater detail than previous models of respiratory rhythmogenesis. In addition the present model reproduces the qualitative responses of some medullary respiratory related neurons to these stimuli; however, other than using the I neurons as an implicit analog of phrenic nerve activity or volume, this study has not systematically compared the quantitative details
of these neuronal activity patterns with experimental findings.
The present neural network model oscillates mainly by virtue of inhibitory connections between neuronal pools. It has long been appreciated that oscillations in neural networks could evolve from inhibitory interac- tions between neurons (Anderson and Rudjord 1964; Friesen and Stent 1977; Kling and Szekely 1968; Mat- suoka 1985) and inhibitory interactions are thought to be important, for example, in generation of the leech heartbeat rhythm, in the lobster pyloric system, and in the leech swimming rhythm (Friesen and Stent 1977; Selverston and Moulins 1985; Stent 1983). As in the Tritonia swimming oscillator (Getting 1983), excitation also plays an important role in rhythm generation in the present model.
Differences between the proposals of Richter and colleagues and the final structure of the model may be more important to correctly shaping the time course of the neuronal activity patterns than to the generation of the rhythm itself. Separation of the p-I neurons into two pools (Euler 1986; Richter et al. 1987) may be important only for identifying the source of post- inspiratory drive to respiratory motoneurons. Further- more it was proposed (Richter 1982) that the decline of discharge of p-I and e-I neurons is due to adaptation. While oscillation will occur if adaptation replaces the inhibitory inputs to these two groups, the behavior of the model becomes too inflexible to reproduce the necessary variety of respiratory responses. Finally be- cause the firing pattern of early expiratory neurons is so similar to that of the p-I neurons, and because its connections are entirely speculative, this group was omitted from the model. These neurons, with their declining firing pattern, may provide inhibition of in- spiratory neurons early in expiration. Since this role is attributed to expiratory neurons in the model, addition of an early-expiratory group likely would allow the expiratory group to exhibit a more desireable "ramp- like" increase in activity.
Although the simulated patterns of activity were similar in general to typical experimentally recorded patterns, the e-I group commenced firing earlier in expiration than physiological e-I neurons. In the model it was necessary for these neurons to begin firing in the late middle part of expiration if they are assumed to be the primary expiratory "off-switch". The waveform of e-I activity can be made more physiologically realistic, without significantly affecting the other waveforms, if a mechanism is added which would increase the self- excitation of e-I neurons at the onset of their firing. The model equations do not incorporate a fast "post- inhibitory rebound" which would have this effect. This behavior is probably a property of individual cells but could be simulated by making the self-excitation a function of the rate of change of e-I activity. With this addition one could increase the inhibition of e-I neu- rons by p-I neurons and thereby delay the onset of e-I activity. Furthermore the e-I group in the model might represent both medullary early-inspiratory neurons and pontine phase-spanning neurons.
151
The model connections were based mainly on indi- rect evidence drawn from a variety of experiments. These connections are not proven and their roles in respiratory rhythm generation have not been estab- lished experimentally. Some of the connections in the model may not represent physical synapses between neurons, but rather may only imply dependence of the activity of one group on the activity of another group - mediated for example by changes in the extracellular environment correlated with the activity of one group of respiratory related neurons (Euler 1986). In this case, the function relating the connections between the two groups could be different from the assumed sigmoidal function which describes synaptic connections. Also, we assumed that the effects of the different connections and the tonic input were linearly additive; nonlinear interac- tions such as presynaptic inhibition and gating of the input during part of the respiratory cycle may have an important role in rhythm generation or in processing afferent inputs.
Waveforms in the model sometimes exhibited much greater negative-going peaks than positive-going ones. Positive peaks were limited in amplitude because the S(X) function was made to saturate at a value of 4. If this arbitrary value were increased, the coupling co- efficients would need to be reduced by the same factor and the positive peaks would increase in amplitude. In addition, with strong inhibitory synaptic inputs neurons might exhibit nonlinear behavior which could limit the negative swings in potential.
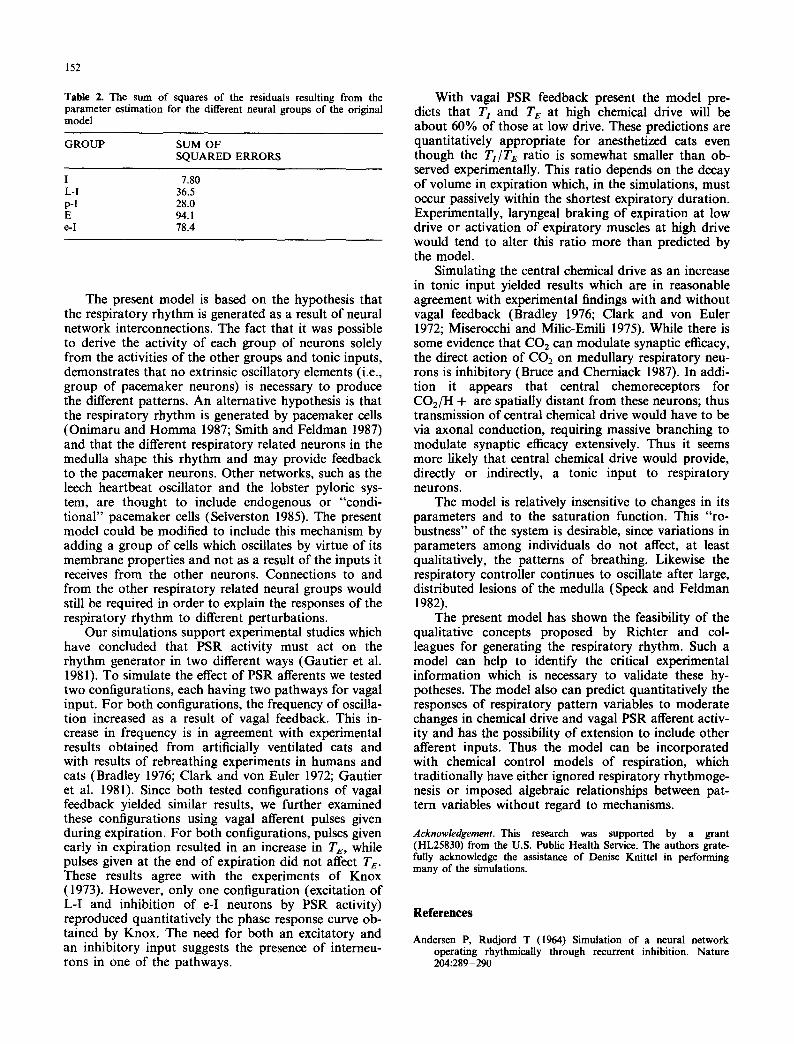
The parameter estimation scheme allowed us to find a set of parameters which could reproduce the activity pattern of each group separately. By estimating the parameters and the residual errors separately, we ob- tained a measure of how well the assumed connections to each group and the mathematical expression of these connections explain the pattern of activity of the group. The sum of squares of the residual errors for the waveforms of the different groups of the original model are shown in Table 2. This error measure was the smallest for the I waveform, which suggests that the pattern of activity of this group can be explained read- ily by the model. This measure was large for the e-I and E groups, suggesting that other mechanisms not in- cluded in the model (such as postinhibitory rebound) may be involved in the generation of these waveforms. Among the disadvantages of the parameter estimation scheme is that the residual error from each group will affect the behavior of the connected model. However the magnitude of the error is not so important since the exact quantitative waveforms of the different groups are not known. Moreover, this error introduced by cou- pling was reduced by the sigmoidal coupling function because it had regions of many-to-one mapping which attenuate the error. Another disadvantage is that parameters which may have similar effects on the be- havior of the model (i.e., redundant) are not easily detected. On the other hand a certain redundancy in connections probably exists in the respiratory central pattern generator, as revealed by lesion experiments (Speck and Feldman 1982).
152
Table 2. The sum of squares of the residuals resulting from the parameter estimation for the different neural groups of the original model
GROUP SUM OF SQUARED ERRORS
I 7.80 L-I 36.5 p-I 28.0 E 94.1 e-I 78.4
The present model is based on the hypothesis that the respiratory rhythm is generated as a result of neural network interconnections. The fact that it was possible to derive the activity of each group of neurons solely from the activities of the other groups and tonic inputs, demonstrates that no extrinsic oscillatory elements (i.e., group of pacemaker neurons) is necessary to produce the different patterns. An alternative hypothesis is that the respiratory rhythm is generated by pacemaker cells (Onimaru and Homma 1987; Smith and Feldman 1987) and that the different respiratory related neurons in the medulla shape this rhythm and may provide feedback to the pacemaker neurons. Other networks, such as the leech heartbeat oscillator and the lobster pyloric sys- tem, are thought to include endogenous or "condi- tional" pacemaker cells (Selverston 1985). The present model could be modified to include this mechanism by adding a group of cells which oscillates by virtue of its membrane properties and not as a result of the inputs it receives from the other neurons. Connections to and from the other respiratory related neural groups would still be required in order to explain the responses of the respiratory rhythm to different perturbations.
Our simulations support experimental studies which have concluded that PSR activity must act on the rhythm generator in two different ways (Gautier et al. 1981). To simulate the effect of PSR afferents we tested two configurations, each having two pathways for vagal input. For both configurations, the frequency of oscilla- tion increased as a result of vagal feedback. This in- crease in frequency is in agreement with experimental results obtained from artificially ventilated cats and with results of rebreathing experiments in humans and cats (Bradley 1976; Clark and von Euler 1972; Gautier et al. 1981). Since both tested configurations of vagal feedback yielded similar results, we further examined these configurations using vagal afferent pulses given during expiration. For both configurations, pulses given early in expiration resulted in an increase in Te, while pulses given at the end of expiration did not affect TE. These results agree with the experiments of Knox (1973). However, only one configuration (excitation of L-I and inhibition of e-I neurons by PSR activity) reproduced quantitatively the phase response curve ob- tained by Knox. The need for both an excitatory and an inhibitory input suggests the presence of interneu- rons in one of the pathways.
With vagal PSR feedback present the model pre- dicts that /'1 and Te at high chemical drive will be about 60% of those at low drive. These predictions are quantitatively appropriate for anesthetized cats even though the TI/Te ratio is somewhat smaller than ob- served experimentally. This ratio depends on the decay of volume in expiration which, in the simulations, must occur passively within the shortest expiratory duration. Experimentally, laryngeal braking of expiration at low drive or activation of expiratory muscles at high drive would tend to alter this ratio more than predicted by the model.
Simulating the central chemical drive as an increase in tonic input yielded results which are in reasonable agreement with experimental findings with and without vagal feedback (Bradley 1976; Clark and von Euler 1972; Miserocchi and Milic-Emili 1975). While there is some evidence that C O 2 c a n modulate synaptic efficacy, the direct action of CO2 on medullary respiratory neu- rons is inhibitory (Bruce and Cherniack 1987). In addi- tion it appears that central chemoreceptors for CO2/H + are spatially distant from these neurons; thus transmission of central chemical drive would have to be via axonal conduction, requiring massive branching to modulate synaptic efficacy extensively. Thus it seems more likely that central chemical drive would provide, directly or indirectly, a tonic input to respiratory neurons.
The model is relatively insensitive to changes in its parameters and to the saturation function. This "ro- bustness" of the system is desirable, since variations in parameters among individuals do not affect, at least qualitatively, the patterns of breathing. Likewise the respiratory controller continues to oscillate after large, distributed lesions of the medulla (Speck and Feldman 1982).
The present model has shown the feasibility of the qualitative concepts proposed by Richter and col- leagues for generating the respiratory rhythm. Such a model can help to identify the critical experimental information which is necessary to validate these hy- potheses. The model also can predict quantitatively the responses of respiratory pattern variables to moderate changes in chemical drive and vagal PSR afferent activ- ity and has the possibility of extension to include other afferent inputs. Thus the model can be incorporated with chemical control models of respiration, which traditionally have either ignored respiratory rhythmoge- nesis or imposed algebraic relationships between pat- tern variables without regard to mechanisms.
Acknowledgement. This research was supported by a grant (HL25830) from the U.S. Public Health Service. The authors grate- fully acknowledge the assistance of Denise Knittel in performing many of the simulations.
References
Andersen P, Rudjord T (1964) Simulation of a neural network operating rhythmically through recurrent inhibition. Nature 204:289-290
Baker JP, Remmers JE (1980) Temporal correlation of graded re- versible inspiratory inhibition with discharge patterns of late inspiratory neurons located in the dorsal respiratory group in cats. Brain Res 200:331-340
Bartoli A, Bystrzycka E, Guz A, Jain SK, Noble MIM, Trenchard D (1973) Studies of the pulmonary vagal control of central respira- tory rhythm in the absence of breathing movements. J Physiol 230:449-465
Boyd TE, Maaske CA (1939) Vagal inhibition of inspiration and accompanying changes of respiratory rhythm. J Neurophysiol 2:533-542
Bradley GW (1976) The effect of CO 2, body temperature and anaes- thesia on the response to vagal stimulation. In: Duron B (ed) Respiratory centers and afferent systems. INSERM, Paris, pp 139-154
Bradley GW, Euler CV, Martilla I, Roos, B (1975) A model of the central and reflex inhibition of inspiration in the cat. Biol Cybern 19:105-116
Bruce EN, Cherniack NS (1987) Central chemoreceptors. J Appl Physiol 62:389-402
Clark FJ, Euler C yon (1972) On the regulation of depth and rate of breathing. J Physiol 222:267-295
Cohen MI (1981) Central determinants of respiratory rhythm. Ann Rev Physiol 43:91-104
Dooren JAHQ von, Vis A (1982) A re-investigation of the Geman- Miller respiratory oscillator model. Biol Cybern 44:205-210
Engeman RM, Swanson GD (1979) Transient response of the Geman-Miller respiratory oscillator model. J Appl Physiol 46:1191-1195
Euler C yon (1983) On the central pattern generator for the basic breathing rhythmicity. J Appl Physiol 55:1647-1659
Euler C yon (1986) Brainstem mechanisms for generation and control of breathing pattern. In: Handbook of physiology. The respira- tory system II. American Physiological Society, Washington, pp 1-67
Feidman JL (1986) Neurophysiology of breathing in mammals. In: Handbook of physiology. The nervous system IV. American Physiological Society, Washington, pp 463-524
Feldman JL, Cowan JD (1965a) Large scale activity in neural nets I: Theory with application to motoneuron pool responses. Biol Cybern 17:29-38
Feldman JL, Cowan JD (1965b) Large scale activity in neural nets II: A model for the brainstem respiratory oscillator. Biol Cybern 17:39-51
Friesen WO, Stent GS (1977) Generation of a locomotory rhythm by a neural network with recurrent cyclic inhibition. Biol Cybern 28:27-40
Geman S, Miller M (1976) Computer simulation of brainstem res- piratory activity. J Appl Physiol 41:931-938
Gautier H, Bonora M, Gaudy JH (1981) Breuer-Hering inflation reflex and breathing pattern in anesthetized humans and cats. J Appl Physiol 51: l 162-1168
153
Getting PA (1983) Mechanisms of pattern generation underlying swimming in Tritonia. II. Network reconstruction. J Neurophys- iol 46:64-79
Kalia M (1981) Anatomical organization of central respiratory neu- rons. Ann Rev Physiol 43:105-120
Kling V, Szekely G (1968) Simulation of rhythmic nervous activities. I. Function of networks with cyclic inhibitions. Kybernetik 5:89- 103
Knox CK (1973) Characteristics of inflation and deflation reflexes during expiration in the cat. J Neurophysiol 36:284-295
Long SE, Duflin J (1984) The medullary respiratory neurons: a review. Can J Physiol Pharmacol 62:161-182
Matsuoka K (1985) Sustained oscillations generated by mutually inhibiting neurons with adaptation. Biol Cybern 52:367-376
Miserocchi G, Milic-Emili J (1975) Contribution of hyperapnic stim- uli and of vagal afferents to the timing of breathing in anes- thetized cats. Resp Physiol 25:71-88
Onimaru H, Homma I (1987) Respiratory rhythm generator neurons in medulla of brainstem-spinal cord preparation from newborn rat. Brain Res 403:380-385
Remmers JE, Richter DW, Ballantyne D, Bainton CR, Klein JP (1986) Reflex prolongation of stage I of expiration. Pfliigers Arch 407:190-198
Richter DW (1982) Generation and maintenance of the respiratory rhythm. J Exp Biol 100:93-107
Richter DW, Ballantyne D, Remmers JE (1986) How is the respira- tory rhythm generated? NIPS 1:109-112
Richter DW, Ballantyne D, Remmers JE (1987) The differential organization of medullary post-inspiratory activities. Pfliigers Arch 410:420-427
Rubio JE (1972) A new mathematical model of the respiratory center. Bull Math Biophys 34:467-481
Selverston AI, Moulins M (1985) Oscillatory neural networks. Ann Rev Physiol 47:29-48
Smith J, Feldman JL (1987) Central respiratory pattern generation studied in an in vitro mammaliam brainstem-spinal cord prepa- ration. In: Respiratory muscles and their neuromotor control. Liss, New York, pp 27-36
Speck DF, Feldman JL (1982) The effects of microstimulation and microlesions in the dorsal and ventral respiratory groups in medulla of cat. J Neurosci 2:744-757
Stent GS (1983) Rhythm generator circuits in a simple nervous system. Prog Brain Res 58:147-155
Prof. Eugene N. Bruce Case Western Reserve University Case Institute of Technology
and School of Medicine Department of Biomedical Engineering Wickenden Building Cleveland, OH 44106 USA