Neural correlates of inference-driven attention in perceptual and symbolic tasks: An event-related...
55
Inference-driven attention: event-related potentials 1 Author’s copy of an article published in Neuroimage. Please cite this work as follows: Vallesi A., Mapelli D., Cherubini P. (2009). Neural correlates of inference-driven attention in perceptual and symbolic tasks: an Event-related Potential study. Quarterly Journal of Experimental Psychology. Vol 62 (9), pp. 1805–1831. DOI:10.1080/17470210802596783. ISSN: 1747–0218 This material is presented to ensure timely dissemination of scholarly and technical work. Copyright and all rights therein are retained by authors or by other copyright holders. All persons copying this information are expected to adhere to the terms and constraints invoked by each author's copyright. In most cases, these works may not be reposted without the explicit permission of the copyright holder. Running Head: Inference-driven attention: event-related potentials Neural correlates of inference-driven attention in perceptual and symbolic tasks: An Event-related Potential study Antonino Vallesi $° , Daniela Mapelli $ , Paolo Cherubini § $ Dipartimento di Psicologia Generale, Universitá degli studi di Padova, Italy ° Now at Rotman Research Institute at Baycrest, Toronto, Canada § Dipartimento di Psicologia, Università di Milano-Bicocca, Milano, Italy Corresponding author is PC: Department of Psychology, University of Milano-Bicocca, 1, Piazza dell’Ateneo Nuovo, 20126 Milano (Italy) Tel: +39 02 6448 3811 Facsimile: +39 02 6448 3706 E-mail: [email protected]
-
Upload
independent -
Category
Documents
-
view
2 -
download
0
Transcript of Neural correlates of inference-driven attention in perceptual and symbolic tasks: An event-related...

Inference-driven attention: event-related potentials 1
Author’s copy of an article published in Neuroimage. Please cite this work as follows: Vallesi A., Mapelli D., Cherubini P. (2009). Neural correlates of inference-driven attention in perceptual and symbolic tasks: an Event-related Pot ential study. Quarterly Journal of Experimental Psychology. Vol 62 (9), pp. 1805–1831. DOI:10.1080/17470210802596783. ISSN: 1747–0218 This material is presented to ensure timely dissemination of scholarly and technical work. Copyright and all rights therein are retained by authors or by other copyright holders. All persons copying this information are expected to adhere to the terms and constraints invoked by each author's copyright. In most cases, these works may not be reposted without the explicit permission of the copyright holder.
Running Head: Inference-driven attention: event-related potentials
Neural correlates of inference-driven attention in perceptual and
symbolic tasks: An Event-related Potential study
Antonino Vallesi$°, Daniela Mapelli$, Paolo Cherubini§
$Dipartimento di Psicologia Generale, Universitá degli studi di Padova, Italy
° Now at Rotman Research Institute at Baycrest, Toronto, Canada
§Dipartimento di Psicologia, Università di Milano-Bicocca, Milano, Italy
Corresponding author is PC:
Department of Psychology, University of Milano-Bicocca,
1, Piazza dell’Ateneo Nuovo, 20126 Milano (Italy)
Tel: +39 02 6448 3811
Facsimile: +39 02 6448 3706
E-mail: [email protected]

Inference-driven attention: event-related potentials 2
Abstract
The inferential system anticipates the external environment by building up internal
representations of its regularities. To that purpose, two sources of information are especially
important and attract attentional resources: expected and unexpected events, which are useful
for checking the accuracy of internal representations. In the present study, we investigated the
behavioural properties and the neural mechanisms underlying the strategic allocation of
attention triggered by those events. To that end, Event-related Potentials (ERPs) were
recorded during the performance of two tasks requiring detection of predictable and
unpredictable response events embedded in a visuo-spatial or numeric sequence. The
behavioural results in the two tasks mirror each other, suggesting the recruitment of similar
attentional allocation processes between the two domains. The ERPs showed partially similar
effects. In both tasks, a P3a-like component signalled the capture of attention by events
clashing with previous expectations, whilst a P3b-like component marked the focussing of
attention on predicted events, and its redistribution among all possible response events
occurring after the detection of an unexpected event.
Keywords: Attention, Inferential processes, Expectations, Surprise, Event-related Potentials.

Inference-driven attention: event-related potentials 3
The cognitive system as an adaptive anticipatory system
Following John Holland’s (1995) definition, internal models are representations of the
environment that complex adaptive systems, such as living beings, use in order to anticipate
future states. Internal models can be tacit and strictly reactive, when they prescribe a current
action under the implicit prediction, built-in by evolution, of an advantageous future state
(e.g., a bacterium swimming up a glucose gradient). Or, they can be overt anticipatory
systems, allowing “lookaheads”, that is the explicit, internal explorations of alternatives. In
this view, human and higher mammals’ cognitive systems are, essentially, a sophisticated
way for building overt internal models. Evolution endowed some animals with the ability to
build models that involve the explicit representation of some environmental features beyond
the scope of sensorial experience. The processes mediating lookaheads are the inferential
processes, encompassing both the associative, mostly automatic ones, and the rule-based,
mostly voluntary ones, commonly called “reasoning” (Holyoak & Spellman, 1993; Sloman,
1996). Internal models serve their adaptive function only as long as they preserve a certain
degree of isomorphism to the environment (Newell, 1990). Inferential processes try to
preserve the isomorphism by means of a feedback knowledge-revision cycle: environmental
data and previous inductive knowledge gathered from past experience allow for predictions
that can be later confirmed or disconfirmed via environmental input. When confirmed,
previous inductive knowledge is strengthened. Conversely, if anticipations go unfulfilled, the
previous knowledge that endorsed them is – or should be – weakened and/or revised (e.g.,
Anderson & Lebiere, 1998; Rosenbloom, Laird, Newell, & McCarl, 1991; Holland, Holyoak,
Nisbett, Thagard, 1986; Neisser, 1976). Accordingly, fulfilled and unfulfilled expectations
are of paramount importance for knowledge revision and, consequently, adaptation.
Expectation-related events as critical triggers for attentional deployment

Inference-driven attention: event-related potentials 4
Being so important for adaptation, events which confirm or falsify an expectation should
have evolved into critical triggers for the deployment of attention (Horstmann & Becker, in
press; Horstmann & Ansorge, 2006; Horstmann, 2006 a and b, 2005, 2002; Cherubini,
Burigo, & Bricolo, 2006), that is the cognitive resource that allows enhanced information
processing. Many previous studies showed that attention is biased towards unexpected and
expected events (for the former, see the studies about abrupt onsets, e.g., Hillstrom & Yantis,
1994; Rauschenberger &Yantis, 2001; or the studies about the capture of attention by
unexpected, surprising singletons, e.g., Horstmann & Becker, in press; Horstmann &
Ansorge, 2006; Horstmann, 2006 a and b, 2005, 2002; for the processing advantage for
expected events, e.g., Biederman, Mezzanotte, & Rabinowitz, 1982; Jacoby & Dallas, 1981).
That is, expected and unexpected events are rapidly detected and efficiently processed.
However – if seen as signals concerning the adequacy of the internal representation of the
environment – they have different meaning. Expected events confirm that the cognitive
system is adequately anticipating the environment, knowledge needs not to be revised, and
anticipations can adequately drive behaviour. Conversely, unexpected events signal that the
isomorphism between the internal representations and the environment is not perfect,
triggering knowledge revision: the scope of attention should be widened in order to
encompass all possible relevant events, to increase the chances of appropriately reacting to
other unexpected occurrences. For example, a soldier expecting that an enemy is in some
specific location will focus her attention on that location: but, if she later discovers that the
enemy is not where she believed (unexpected event), she will be better off by redistributing
attention, striving to detect any possible relevant clue that can suggest the actual position of
the enemy.
Even though the previous example deals with spatial attention, this triggering mechanism
could be quite general. Even in science, the unexpected empirical falsification of a theoretical

Inference-driven attention: event-related potentials 5
prediction leads to widening the scope of attention to detect what went wrong, either in the
theory, or in the drawing of the prediction, or in the gathering of the empirical data. By using
sequences of either visuo-spatial or symbolic stimuli embedded in a continuous flow of
events, Cherubini et al. (2006) found behavioural evidence corroborating the hypothesis that
the triggering of attention by expectations works in a functionally identical way
independently of the specific stimulus domain. Disregarding whether expectations are about
the likely continuation of a visual trajectory, or the likely continuation of an arithmetic series,
attention is focused on expected events; if those expectations are later disconfirmed by
unexpected occurrences, attention is rapidly redistributed in order to encompass all relevant
events in the local environment (the authors termed this redistribution of attention triggered
by a surprising stimuli “surprise effect”). The allocation of attention is at a loss – as shown by
critically impaired performance in reacting to all critical events – in “random” environments,
that is those environments where, for lack of regularities, inferential processes cannot build
any plausible expectation at all.
Neurophysiological bases of inference-driven attentional deployment
The functional identity of some attentional processes in perceptual and symbolic tasks
does not imply that the underlying neural mechanisms are the same (Cherubini, Mazzocco, &
Minelli, 2007; Cherubini et al., 2006): convergence is common in nature, that is a
functionally identical, adaptively good solution can be attained in very different ways by
different systems adapting to structurally similar features of their environments (e.g.,
Holland, 1995; see also the principles of rational analysis by Anderson, 1990, where the
structure of the environment determines the shape of the cognitive processes that deal with
it). However, it could also be the case that the functional identity of the inferential triggering
of attention in perceptual and symbolic tasks is at least partly grounded on the activity of a
common neural network underlying domain-independent strategic properties of attentional

Inference-driven attention: event-related potentials 6
deployment. The first aim of this study is to find further support for the inference-driven
pattern of attention allocation (for details of the model, and analytic comparisons of its
predictions with the preditions of 4 alternative models of spatial attention, please refer to
Cherubini et al. 2006), by focusing on a known electrophysiological marker of attention
allocation and level of expectancies – namely, the P3b type of the P300 complex (e.g., Polich,
2004). The second purpose is to investigate whether functional similarities between
perceptual and symbolic tasks at the behavioural level are mirrored by similar temporal
dynamics of the processes involved as revealed by their electrophysiological correlates. To
this end, we recorded event-related potentials (ERPs) elicited by perceptual (Experiment 1)
and symbolic (Experiment 2) tasks.
Experiment 1: perceptual task
In this experiment we used a slightly modified version of the “clock task” employed in the
third experiment by Cherubini et al. (2006), while recording ERPs (Figure 1).
--- Insert Figure 1 about here ---
The participants tracked a simulated clock hand moving inside a circular frame (the clock
face), and had to respond to two events: when the hand reached a specified position (e.g., 12
o’clock), or when the hand appeared twice consecutively in the same position (e.g., a hand
appearing at 2 o’clock twice consecutively). The hand could behave in three different ways:
a) it could follow a regular trajectory that progressively approached the position of the target
hour (regular series); b) it could begin moving regularly toward the target, but – just before
reaching it – it unpredictably jumped to some other position (interrupted series); finally, c) it
could continuously jump randomly to different positions (random series). The previous study

Inference-driven attention: event-related potentials 7
(Cherubini et al., 2006) showed that regular series allow building an expectation concerning
when the hand will reach the target hour: if it actually gets there, processing of the event is
enhanced, whereas if unexpectedly the repeated-hour event occurs before the target hour is
reached, responses to it are very slow. In the interrupted series – which are identical to
regular series up to the position next to the target-hour position – participants build
expectations concerning the occurrence of the target event that are abruptly disconfirmed by
the jump of the hand to an unpredictable position. After detection of the discrepant event,
participants redistribute attention in order to encompass both possible response events, thus
responding slower to ensuing target-hour events and faster to ensuing repeated-hour events,
with respect to the regular series trials. In the random series condition, no expectations
concerning response events are either built up or broken, and participants respond slowly to
both target events and repeated-hour events. The corresponding predictions for response
times (RTs) in the present experiment are:
a) Regular series: target-hour responses < repeated-hour responses;
b) Interrupted series:
1. target-hour > target-hour in regular series
2. repeated-hour < repeated-hour in regular series
c) Random series:
1. target-hour > target-hour in interrupted and regular series
2. repeated-hour > repeated-hour in interrupted series
Previous ERP literature allows some specific electrophysiological predictions to be made.
It is believed that two distinct components may occur within the time-window of the P300, a
positive-going waveform peaking at about 300 ms after stimulus presentation (Polich, 2004;
2007). One of them, the P3b or “target P300”, is a centro-parietal component elicited by
target stimuli in a sequence, that the participant actively expects and is instructed to attend

Inference-driven attention: event-related potentials 8
(e.g., Rosenfeld, Biroschak, Kleschen, & Smith, 2005). This component is modulated by the
amount of attentional resources dedicated to a stimulus, and by the level of expectancy (e.g.,
Sommer, Matt, & Leuthold, 1990). The more a stimulus is expected, the higher is the P3b
amplitude elicited by that stimulus (Rosenfeld et al., 2005; see also Näätänen, 1990).
Accordingly, the imperative stimuli, namely the stimuli requiring a response (from now on,
Sn), should elicit a P3b-like wave with a centro-parietal component proportional to the
amount of allocated attention in this experiment. Consistent with this view, we expect that the
amplitude of this component should comply with the following predictions:
a) Regular series: target-hour events > repeated-hour events;
b) Interrupted series:
1. target-hour < target-hour in regular series
2. repeated-hour > repeated-hour in regular series
c) Random series:
1. target-hour events < target-hour events in interrupted and regular series;
2. Repeated-hour < repeated-hour in interrupted series.
We also recorded potentials associated with the stimulus that directly preceded the
imperative stimulus (from now on, Sn-1). In the random series, Sn-1 is indistinguishable from
previous stimuli. In the regular series it is the stimulus immediately next to the target
position, but otherwise it is not different from any other previous stimulus in regular and
interrupted series. In the interrupted series it is different from previous stimuli, because it is
the deviant stimulus that abruptly breaks off the trajectory, disconfirming previous
expectations concerning the target event, and thus causing defocusing from the target event
and redistribution of attention to both possible response events. Consequently, the most
general prediction is that ERPs elicited by the Sn-1 in the interrupted series should be different
from ERPs evoked by that stimulus in other series. Some more specific predictions can be

Inference-driven attention: event-related potentials 9
derived from literature. The other P300 component – called the P3a – refers to a typical
fronto-central component evoked by rare, new and unexpected events. The P3a has primarily
been associated with the orienting response (Donchin, 1981; Friedman, Cycowicz, & Gaeta,
2001; Knight & Nakada, 1998; Polich and Criado, 2006), a rapid physiological response to
unexpected stimuli which works as a detector of novelty (Sokolov, 1963; see also Luria,
1973; Pavlov, 1927). The P3a, also called novel or distractor P3, has been associated to
attentional capture by deviant stimuli (Sawaki and Katayama, 2008). Donchin and colleagues
(see Donchin, 1981; Donchin & Coles, 1988; for reviews), although they did not make an
explicit distinction between P3a and P3b, report data consistent with the view that the events
likely to modulate the P300 are those that require a revision of an internal model (context-
updating process), that is when “the model is revised by building novel representations
through the incorporation of incoming data into schema based on long-term memory data”
(Donchin, 1981, page 508). Moreover, Näätänen (1990) interprets the anterior P3a as an
index of attentional orienting produced by the mismatch between a presented stimulus and
the neuronal trace formed from the previous stimuli (i.e., expectancy disconfirmation).
Consistently with this view, detection of Sn-1 in the interrupted series should be associated
with a P3a component with higher amplitude than in the regular and random series.
Furthermore, our model assumes that detection of the deviant stimulus in the trial n-1 in the
interrupted series elicits redistribution of attention to both possible response events.
Accordingly, the P3a component is expected to be followed, in the trial n, by a different
modulation of the P300 from those occurring in regular and random series (where
redistribution of attention does not occur), reflecting the fact that attention is re-distributed
between different possible response events in this condition.
An earlier and usually smaller negative deflection, called N2, is commonly observed
before the P300 complex, which in the visual modality peaks around 180 ms (e.g., Squires,

Inference-driven attention: event-related potentials 10
Wickens, Squires, & Donchin, 1976). At least two dissociable negative sub-components have
been described in the literature in this time range: an anterior N2, which is more pronounced
for non-targets, and a posterior one, that is instead sensitive to target detection (see Folstein
& Van Petten, 2008, and Pritchard, Shappell, & Brandt, 1991, for reviews). Accordingly, we
also analysed this component, that has previously shown modulations from visual attention.
Method
Participants
Twelve adults (9 females) participated in the experiment. Mean age was 25 years (range:
20-31), and all were right-handed. Participants received either 10 euros or university credits
as rewards for their participation. No participant reported a history of neurological or
psychiatric disorders.
Apparatus and materials
Each participant was tested individually in a silent and dimly lit room. The experiment
was implemented by using the E-primeTM software, and was run on a personal computer with
a 17” monitor. Subjects sat at a distance of 60 cm from the monitor, using a chin-rest. During
the task, the EEG was continuously recorded through Micromed System Plus (Micromed,
Mogliano Veneto, Italy) from a pre-cabled elastic cap with 19 Ag/AgCl electrodes positioned
in standard locations according to the international 10/20 system (American
Electroencephalographic Society, 1994). The ground was Fpz; the reference was provided by
two earlobe electrodes shorted together. Two electrodes were placed on the outer cantus and
under the left eye, respectively, to record horizontal and vertical electro-oculogram (hEOG
and vEOG, respectively). Impedance of each electrode was kept lower than 5 kΩ. Each
channel had its own analogical-to-digital converter; signals were digitally filtered in the 0.03–

Inference-driven attention: event-related potentials 11
30 Hz range. The EEG signals were digitalized online; the sampling frequency was 512 Hz
and the conversion resolution was 0.19 µV/digit.
Procedure, task and design
A light-grey static circle outline (“clock face”; diameter, 4.8° of visual angle) with a light-
grey small fixation dot in the centre was present on the middle of the display throughout the
task; the circle had one small placeholder corresponding to 6 or 12 o’clock (balanced across
blocks). Participants were required to maintain fixation on the dot at the centre of the clock
face and to respond to two response events by pressing one of two keys (“D” and “L” keys on
an international keyboard, appropriately labeled): “target-hour” responses, required when the
clock hand indicated a specific hour (12 or 6 o’clock, balanced across blocks), and “repeated-
hour” responses, required when the hand indicated the same hour twice consecutively. A
short segment intermittently flashed within the circle, orthogonal to its circumference (“clock
hand”; length, 0.8°; width, 0.1°; duration, 700 ms; ISI, 300 ms), in the positions
corresponding to the 12 hours. Response deadline was 1 s from the onset of the clock hand,
that is responses had to be given before the ensuing clock hand appeared. Correctness and
latencies of the responses were collected. There were two experimental blocks, one per each
target position (6 vs 12), balanced within participants. Each block comprised 216 trials and
lasted about 30 minutes. Of the total 432 trials, 192 required a target-hour response, 192 a
repeated-hour response, and 48 (approximately 11%) were catch trials which required no
response whatsoever. Each trial consisted of the clock hand appearing in eight positions. In
the regular series condition, the eight positions were arranged so as to form a regular
trajectory (clockwise or counterclockwise) up to the position next to the target hour. After
that, in non-catch trials half of the times it moved on to the target hour (regular series
requiring a target hour response), and then continued on in a regular fashion (for example, a
series of 8 clock hands aiming at 7, 8, 9, 10, 11, 12 [target hour response], 1, 2 [end of the

Inference-driven attention: event-related potentials 12
series]). In the other half of the trials (that is, regular series requiring a repeated-hour
response) the clock hand re-appeared in the position next to the target hour instead of moving
on to the target hour; after that, it reprised its movement from the hour following the target
hour (for example, a series of 8 hands pointing at 7, 8, 9, 10, 11, 11 [repeated hour response],
1, 2 [end of series]). In regular catch trials, requiring no responses, the series skipped the
target hour (for example, 7, 8, 9, 10, 11, 1, 2, 3 [end of series], with the target hour at 12). In
the interrupted series, the clock hand approached the target-hour as regularly as in the regular
series condition but, after reaching the hour next to the target hour, it jumped to a different
position, at least four hours away. After that, in non-catch trials half of the times the hand
jumped back to the target hour (interrupted series requiring a target hour response), and then
continued on in a regular fashion (for example, a series of 8 clock hands aiming at 7, 8, 9,
10, 11, 8 [discrepant hand], 12 [target hour response], 1 [end of the series]). In the other half
of the trials (interrupted series requiring a repeated-hour response) the clock hand repeated
itself in the position where it had jumped; after that, it normally reprised its regular
movement either clockwise or counterclockwise (for example, a series of 8 hands pointing at
7, 8, 9, 10, 3 [discrepant hand], 3 [repeated hour response], 2, 1 [end of series]). In
interrupted catch trials, requiring no responses, after the hand had jumped it reprised its
regular movement (for example, 7, 8, 9, 10, 11, 8 [discrepant hand], 9, 10 [end of series]). In
the random condition, the series of 8 positions was determined pseudo-randomly (taking care
to avoid position repetitions before the response event) (Figure 1). Thus, besides catch trials –
requiring no responses – we obtained 6 experimental conditions by crossing two orthogonal
factors, type of response (target-hour vs repeated-hour) and the type of series (regular,
interrupted, random).
The target-hour event and the repeated-hour event could occur equiprobably on one of the
last 4 items of each series. Thus, there were from 4 to 7 previous positions of the clock hand

Inference-driven attention: event-related potentials 13
which could be used to build up expectations (and subsequently disconfirm them, for the
interrupted series) before the response event. In the regular and interrupted series the
response events occurred either immediately after the clock hand had appeared next to the
target hour (in regular series), or immediately after the displaced clock hand (in interrupted
series). Accordingly, in the regular series target-hour events were the expected continuation
of a trajectory, whereas repeated-hour events were unexpected; in the interrupted series, the
expectation of the target-hour event was built, but was later disconfirmed by the displaced
hand, causing redistribution of attention on both response events. There were no discrete
interruptions between trials: All trials were presented one after the other as a continuous flow
on the screen, so that participants could not distinctly tell when one trial ended and another
began (actually, they were never told that the experiment was divided into “trials”).
Participants experienced a clock hand appearing and disappearing continuously, sometimes
forming regular trajectories, and some other times jumping at random. They had to remain
alert for two possible events requiring different responses. For the appropriateness of this
“continuous flow” technique in studying the role of the inferential processes in the
deployment of attention, see Cherubini et al. (2006, p. 604). Because the imperative hands
were in one of the last four positions of the series, when two consecutive trials required a
response the distance between the two response events ranged unpredictably from 5 to 11
hands. Considering that 11% of the trials did not require responses, variability in the cyclic
occurrence of response events was even higher: The only distinctive rhythm was that after a
response event, no other response event was to be expected too soon (the actual minimal
distance between response events was 5 hands, but no participants reported such a precise
estimation of it in the debriefing session). Furthermore, no predictive statistical association
between type of series and type of responses was present. The n-1 stimuli in regular series
(the hands next to the target hour) and in interrupted series (the hands that interrupted the

Inference-driven attention: event-related potentials 14
series) were recognizable statistical predictors, because they correctly signalled that a
response event was forthcoming in 89% of the trials, but nothing could be anticipated about
which response was likely to be required: either a target-hour response, or a repeated-hour
response. Therefore, anticipations of target-hour responses in the regular series were based
exclusively on predicting the future course of a trajectory, and did not have a statistical
ground. Similarly, since the interrupted and regular series were identical in their initial
pattern, in those trials a hand next to the target hour – if present – was a recognizable
statistical predictor: half of the times it pertained to a regular series, thus resulting – after
discounting the catch trials (11% of 50%) – in a probability of 44.5% that a response event
was incoming (half of the response events [22.25%] being target events, and the other half
repeated-hour events). However, in the other half of the trials it pertained to an interrupted
series, thus allowing to predict that a displaced hand was likely (50%) to occur and – after
that (that is, two hands after the hand next to the target) – there were 89% chances of an
incoming response event (44.5% target hour events, and 44.5% repeated hour events; the
remaining 11% were the catch trials in interrupted series). That is, what could be statistically
anticipated after seeing an hand next to the target hour was only the likely occurrence of a
response event within the next two hands (either at the first one [44.5%], or at the second one
[44.5%]); there was no statistical clue whatsoever for anticipating which response event was
to occur (if any). With these parameters, the hand next to the target position and the
interrupting hand have nearly the same strength if they are used as cues for correctly
anticipating a response (p=.407 for the former, p=.408 for the latter). Accordingly, the raw
higher probability of a response event after an interrupting hand – in absence of any clue to
which event is incoming – should not cause faster absolute response times in interrupted
series (e.g., Castellan, 1977). In random series, there was no statistical predictor whatsoever.
The hands preceding imperative hands were indistinguishable from all other hands in the

Inference-driven attention: event-related potentials 15
series, as far as their statistical association to the occurrence of response events was
concerned.
Results and Analyses
Response latencies
Latencies of the correct responses are reported in Table 1. RTs were analyzed by means of
a 3x2 repeated measures ANOVA with series (regular, interrupted, random) and event (target
vs repeated) as within-subject factors. Subsequent two-tailed t-tests were used in order to find
the sources of significant effects. Critically, the predicted event by series interaction was
significant [F(2, 22) = 18.9, p < .001]. In the regular series, RTs to target-hour events were
shorter than those to the non-anticipated repeated-hour events [t(11)=8, p < .001]. In the
interrupted series, RTs for the two events were not significantly different (p = .28). Most
importantly, responses to target events were faster in the regular series than in the interrupted
series [t(11)=3.3, p < .01], whilst responses to repeated events were faster in the interrupted
series than in the regular series [t(11)=2.3, p < .01]. Performance deteriorated in the random
series. Responses to target events were slower in the random series than in the regular series
[t(11)=6.4, p < .001], and responses to repeated events were slower in the random series than
in the interrupted series [t(11)=2.8, p < .05].
--- Insert Table 1 about here ---
Besides the critical interaction, there was a significant main effect of the series [F(2, 22) =
11.1, p < .001], with pairwise comparisons showing faster responses in the regular series than
in random ones [t(11)=6.3, p < .001], and a reliable main effect of response event type [F(1,
Inference-driven attention: event-related potentials 16
11) = 73.3, p < .001], showing that responses to target-hour events were faster than
responses to repeated-hour events.
Accuracy
Error data are shown in Table 2. Responses were classified as incorrect if participant
responded by pressing the wrong key, “miss responses” if no response was given to a
imperative stimulus (target or repeated), and “false alarms” if participants responded before
the onset of a response event. Percentages of false alarms were computed collapsing the
response event factor (given that they were produced either before the target event in non-
catch trials, or in catch trials).
--- Insert Table 2 about here ---
Errors were analysed with non-parametric Wilcoxon signed rank exact tests. There were
significantly more misses to repeated-hour events than to target events (Z = 2.04, p = .04).
False alarms were more frequent in the regular series than in the random series (Z = 2.84, p =
.004), and in the interrupted series than in the random series (Z = 2.98, p = .003).
Processing of EEG data
Trials with erroneous or anticipated responses (RT < 150 ms), trials with no responses,
and those with artefacts (EOG variations exceeding ±50 µV, or variations of any scalp
electrode exceeding ±100 µV) were excluded from further ERP analyses. EEG and EOG
signals were averaged off-line in the interval starting 100 ms prior to the stimulus onset and
ending 900 ms after it. Baseline correction was applied using the 100 ms pre-stimulus sample
points. The critical stimuli were Sn (where a response event occurred) and Sn-1 (immediately

Inference-driven attention: event-related potentials 17
preceding Sn). ERPs were averaged accordingly, locked to the Sn-1 and to the Sn in each trial.
The number of artifact- and error-free trials per condition obtained from the subjects in the
whole study for ERP averaging ranged from 20 to 60. Nine electrodes (F3, Fz, F4, C3, Cz,
C4, P3, Pz, and P4) were selected from the measured head space for analysis of the spatial
scalp topography of the ERP effects. They were classified according to their topographical
coordinates: 3 laterality (left, medial, right) × 3 regions (frontal, central, parietal).
ERPs at Sn
The ERPs triggered by the Sn were modulated, especially by the anticipated target event
after regular series, in the 160-200 ms and in the 350-450 ms time-windows (see Figures 2
and 3 and Table 3).
--- Insert Figures 2 and 3 about here ---
--- Insert Table 3 about here ---
The N2 was analyzed collapsing the mean amplitude in the 3 parietal sites (P3, Pz, P4),
since preliminary analyses showed that this component peaked in those sites. These data were
submitted to a 3x2 repeated measures ANOVA with type of series (regular, regular, random),
and type of response event (target vs repeated event) as factors. There was a significant effect
of series [F(2, 22) = 4.3, p < .05]. Subsequent t-tests showed that this was due to the N2 being
less pronounced for interrupted series than for regular ones [t(11)=2.5, p < .05], and for
interrupted series than for random ones as a trend [t(11)=1.9, p = .08]. No other effects were
significant.
The mean amplitude in the 350-450 ms latency-window was analyzed by means of a
3x3x2 repeated measures ANOVA factoring region (frontal, central, parietal), series (regular,

Inference-driven attention: event-related potentials 18
regular, random), and response event (target vs repeated event). Preliminary analyses did not
show any relevant laterality effect. Laterality was therefore collapsed across regions.
The crucial finding was the significant series by response interaction [F(2, 22) = 18.9, p <
.001]. Subsequent pairwise comparisons indicated that in the regular series, mean amplitude
was more positive for target events than for repeated ones [t(11)=6.2, p < .001]. In the
interrupted series, positivity for the target event decreases (6.1 µV), whilst positivity for the
repeated event increases (7.2 µV), with no difference among the two events (p = .3). This is
consistent with the hypothesis that in those series attention is redeployed, and reallocated to
both response events. In random series, positivity was at its lowest (again with no difference
among the two events (p = .23). The significant response by series by region 3-way
interaction [F(4, 44) = 5.0, p < .01, means in Table 4] indicates that the ERP amplitude
progressively increases in the antero-posterior direction, particularly for the target events
after regular series [parietal vs. central, t(11)=8.7, p < .001; central vs. frontal, t(11)=7.9, p <
.001]. This is consistent with the hypothesis that this is a centro-parietal P3b component of
the P300.
Other findings, already embedded in the above described interactions, are the main effect
of series [F(2, 22) = 16.3, p < .001] and region [F(2,22) = 46, p < .001], and the region by
response interaction [F(2, 22) = 8.4, p <.01].
ERPs at Sn-1
Visual inspection of the grand average in Figure 4 suggests that the ERPs triggered by the
Sn-1 show four subsequent modulations: an early parietal negativity (N2), a subsequent fronto-
central positivity, a parietal positivity and a final negative frontal component. Accordingly,
we focus the analyses of Sn-1 on mean amplitudes of ERPs in four consecutive latency
windows: 160-200, 200-350, 350-420 and 420-650 ms (Table 4).

Inference-driven attention: event-related potentials 19
--- Insert Figure 4 about here ---
--- Insert Table 4 about here ---
As for Sn, the N2 was analyzed by collapsing the mean amplitude in the 3 parietal sites
(P3, Pz, P4). These data were submitted to a univariate ANOVA with type of series (regular,
interrupted, random) as the only factor. This analysis showed a significant effect of series
[F(2, 22) = 16.4, p < .001]. N2 was more pronounced for regular series than for interrupted
[t(11)=4.9, p < .001] and random ones [t(11)=4.2, p < .01].
For the other three components, after preliminary analyses showing no substantial findings
related to lateralization, we collapsed data over the laterality factor, and analysed the mean
ERP amplitude for Sn-1, separately for each latency-window, by means of 3x3 repeated
measures ANOVAs, factoring region (frontal, central, parietal) and series (regular,
interrupted, random). In the 200-350 ms latency-window there was a reliable main effect of
series [F(2, 22) = 71.5, p < .001], showing that the interruption of a previously regular series
elicits the highest positive potential [interrupted vs. regular, t(11)=10.1, p < .001; interrupted
vs. random, t(11)=7.3, p < .001]. The effect is more pronounced in the central region, as
shown by the significant series by region interaction [F(4,44) = 3.7, p <.05]. For the
interrupted series mean amplitude was more pronounced in the central than in the frontal sites
[t(11)=11, p < .001] and in the central than in the parietal sites [t(11)=2, p = .05]. This can be
taken as support that this is a P3a component of the P300, associated to the detection of the
deviant stimulus.
In the following time-window (350-420 ms), there were main effects of region [F(2,22) =
21.8, p < .001], and series [F(2,22) = 35.6, p < .001], which were better explained by a
significant region by series interaction [F(4,44) = 25.4, p <.001, see Table 4]. This interaction
Inference-driven attention: event-related potentials 20
indicated that positivity was highest for interrupted series in the centro-parietal regions
[central vs. frontal, t(11)=5.7, p < .001, parietal vs. frontal, t(11)=6.2, p < .001]. This P3b
component could correspond to the reallocation of attention following the disconfirmation of
previous expectations.
In the last latency-window assessed (420-650 ms), the pattern reverts to a negative fronto-
central wave, mostly elicited by the interrupted series. There were main effects of region
[F(2,22)=25.3, p < .001] and series [F(2,22) = 10.7, p < .01], that converged in a significant
region by series interaction [F(4,44) = 7.1, p < .001, see Table 4], indicating that this wave
for interrupted series had an anterior scalp distribution [frontal vs. central, t(11)=4.3, p < .01;
central vs. parietal, t(11)=4.7, p < .001; frontal vs. parietal, t(11)=5.1, p < .001].
Discussion
Behavioural findings replicate previous results by Cherubini et al. (2006), showing that
attention is focused on expected events (as shown by shorter RTs for target events after
regular series), and after detection of an abrupt disconfirmation of an expectation it is
reallocated to both possible response events. This is demonstrated by the longer RTs for
target events in interrupted series than in regular series, matched by shorter RTs for repeated
events in the interrupted series than in the regular series. In random environments, where no
expectations can be developed, performance is impaired, as shown by responses to target
events being slower than those in all other series, and by responses to repeated events being
slower than those occurring in interrupted series. These behavioural patterns cannot be fully
accounted for by most current theories of spatial attention (Cherubini et al., 2006, p. 604-
605), nor can they be accounted for by motor preparation of the responses (Cherubini et al.,
2006, Experiment 3).

Inference-driven attention: event-related potentials 21
The critical ERP findings at Sn fit with the predictions, showing a mostly parietal P300
with an amplitude reflecting the amount of attention allocated to the response events
embedded in the different series. This is demonstrated by the reliable region by series by
response 3-way interaction. This result is consistent with what is known of the parietal P3b,
an ERP component with an amplitude proportional to the amount of expectation (Donchin &
Coles, 1988; Sommer et al., 1990; Rosenfeld et al., 2005) and attention (Wickens, Kramer,
Vanasse, & Donchin, 1983) associated to the stimuli. A caveat derives from the possibility
that differences in the amplitude of this condition may partly derive from across condition
differences in the amount of intra-trial latency jitter for this component. However, low
variability is also an index of efficiency in cognitive processing (e.g., Stuss, Murphy, Binns,
& Alexander, 2003). Therefore, whether these differences derive from consistently higher
P300 amplitude for target Sn following a regular series than for the other conditions, or from
less inter-trial variability in the P300 peak latency, this finding suggests that events that
confirm a pre-existing mental representation are processed more efficiently.
A modulation in the posterior N2 was also observed, in that this earlier component was
less pronounced for interrupted series than for the other two series, suggesting that detection
of either response event is less efficient in interrupted series. However, the critical prediction
of our model concerned the response event by series interaction: this interaction was not
significant, hinting at the possibility that the N2 waveform is less involved than the P300 in
the mechanism of strategic deployment of attention that we are investigating.
Ancillary ERP findings, related to the Sn-1, show a negative component in the N2 range,
followed by a positive biphasic wave for the interrupted series. The posterior N2 was more
pronounced in the regular series than in the other two series. This finding is in keeping with
visual ERP literature showing that posterior negativities in the N2 time range are more
pronounced for expected events (Folstein & Van Petten, 2008).

Inference-driven attention: event-related potentials 22
The positive wave was more pronounced for interrupted series than for the other two
series. This component was initially (200-350 ms) mostly central and then (350-420 ms) it
appeared in parietal regions. The finding is suggestive of a P3a component, associated to the
processing of the deviant stimulus, followed by a P3b component, associated to the ensuing
reallocation of attention (e.g., Friedman, Cycowicz, & Gaeta, 2001). However, a third,
unexpected modulation occurred. After being positively modulated from 200 to 420 ms after
the event, the waveform reverts to a negative component, reliably more pronounced for the
interrupted series. Similar components, although with different scalp distributions, have been
also described for deviations from expectancies using semantic material (Kutas & Hillyard,
1980, 1984; Holcomb & Neville, 1990), pictures (Barrett & Rugg, 1990), emotional faces
(Balconi & Pozzoli, 2005), non-linguistic special symbols (Hoen & Dominey, 2000),
olfactory material in relation with pictures (Sarfarazi, Cave, Richardson, Behan, & Sedgwick,
1999) and words related to musical stimuli (Koelsch, Kasper, Sammler, Schulze, Gunter &
Friederici, 2004). Thus, irrespective of the input code, a negativity around 300-500 ms is
typically related to re-processing of information at odds with the previous context.
Experiment 2: Symbolic task
Experiment 1 found electrophysiological evidence supporting the model of inference-
driven allocation of attention in tracking a visual trajectory. Behaviourally, the same pattern
of response latencies observed in tracking a visual trajectory can be observed in the symbolic
domain, when tracking simple arithmetic series. In this experiment we tested whether the
behavioural similarities between these perceptual and symbolic tasks extend to the
electrophysiological domain. To that end, we used a numeric task similar to that used in
Cherubini and colleagues’ (2006) experiments 2 and 3, while recording ERPs from a new
group of participants. Predictions at Sn are the same as in the previous experiment (see the

Inference-driven attention: event-related potentials 23
introduction to Experiment 1). Even the predictions at Sn-1 remain the same, namely a
biphasic P300 should be observed for interrupted series, with a P3a component associated
with detection of the deviant stimulus and a P3b component associated with reallocation of
attentional resources. As far as the unexpected N400 component observed in Experiment 1 is
concerned, we do not have a priori theoretical reasons for predicting it. Furthermore, in
similar studies, when participants were presented with consecutive series of numbers (e.g., 2,
4, 6, 8…), a stimulus discordant with the expected completion of the series elicited a large
P300, with both visual (Polich, 1985) and auditory (Lang & Kotchoubey, 2002) modalities
but it did not elicit a N400 modulation.
Method
Participants
A total of 13 young adults (10 females) volunteered for the experiment. They were 24
years old on average (range: 20-27), and were all right-handed (writing hand). Each of them
was paid 10 euros or received credits for a university psychological course. The ERP results
of 2 female participants were not available for technical reasons (too many EEG artefacts and
triggering failure, respectively). No participant reported a history of neurological or
psychiatric disorders.
Apparatus, procedure, and task
The apparatus and design was the same as in Experiment 1. The procedure was similar,
but was adapted to numerical series. Each trial was composed of 8 three-digit numbers (see
Figure 1), each one appearing at the centre of the screen with a black background (Courier
New 18-point white characters, average dimension: 2.2° x 0.95°) and remaining on the screen
for 700 ms; the ISI between two subsequent numbers was 300 ms. Participants were

Inference-driven attention: event-related potentials 24
instructed to pay attention to the series and respond to two events. They had to press a key
whenever a specific target number was presented (target-number responses), and a different
key whenever any number appeared twice consecutively (repeated-number responses). The
series could be regular – either increasing or decreasing by twos – when the number
progressively approached the target number, inducing its expectation. Interrupted series
began as regular series, but after the number preceding the anticipated target number a
deviant number appeared, abruptly breaking the series and disconfirming previous
expectations.
Finally, response events could be embedded in pseudo-random series (see examples in
Figure 1). Accordingly, there were six experimental conditions requiring responses,
according to a 3 x 2 orthogonal design factoring the required responses (target-number vs
repeated-number) and the type of series (regular, interrupted, random). Of the total 432 trials,
192 required a target-number response, 192 a repeated-number response, and 48
(approximately 11%) were catch trials which required no response whatsoever. In non-catch
trials, target numbers always occurred within the last 4 numbers in the series, so that
participants had 4 to 7 numbers prior to the imperative stimulus. The structure of the trials
was the same as in Experiment 1. No statistical associations allowed to predict which
response event was likely to occur in a given trial. Other perceivable predictive statistical
associations – concerning exclusively the likely occurrence of response events, and not their
type – were the same as described in Experiment 1. The experiment was divided into two
blocks of trials. A different target number was used for each of the two blocks. Target
numbers were also counterbalanced across participants.
Results and Analyses
Response latencies

Inference-driven attention: event-related potentials 25
Latencies of the correct responses are shown in Table 1. RTs were analysed by means of a
repeated-measures ANOVA factoring type of series and type of response, and paired two-tail
t-tests were used to find the source of significant effects. The main effect of series was
significant [F(2, 24) = 20.4, p < .001]. Responses to the regular series were faster than those
to the interrupted series [t(12)=3.4, p < .01], and responses to the interrupted series were
faster than those to the random series [t(12)=3.3, p < .01]. More relevant for the present
purposes, the predicted response by series interaction was significant [F(2, 24) = 21.2, p <
.001; see Table 1]. In the regular series, responses to anticipated target numbers were faster
than those to the unexpected repeated numbers [t(12)=4.65, p < .001]. Responses to the target
numbers were slower in the interrupted series than in the regular series [t(12)=4.6, p < .001],
whilst responses to repeated numbers became faster in the interrupted series than in regular
series [t(12)=2.2, p < .05]. Latencies of the two response types were not reliably different
from each other in the interrupted series. In the random series performance decayed, as
shown by the main effect of series; nonetheless, responses to repeated events were faster in
the random series than in the regular series [t(12)=2.8, p < .05], where they clashed with the
expectation of the target number [random vs. regular, t(12)=6.2, p < .001, random vs.
interrupted, t(12)=3.3, p < .01].
Accuracy
Table 2 reports the overall percentage of errors. Errors were analysed with non-parametric
Wilcoxon signed rank exact tests. The rate of incorrect responses was generally low. Misses
were more frequent for repeated-number events than for target events [Z = 3.2, p = .001].
Frequency of misses was not different among the series. There were more false alarms in the
regular series than in the random one [Z = 2.8, p = .005], and in the interrupted series than in
the random ones [Z = 3.4, p = .002].

Inference-driven attention: event-related potentials 26
Electrophysiological effects at Sn
EEG data were pre-processed as in Experiment 1. Because preliminary analyses showed
no interesting laterality effects, the side factor was collapsed. The resulting Grand Means for
the target-number events and the repeated-number events are reported in Figure 5 and 6,
respectively, and the mean amplitudes in Table 3 (referring to the 350-450 ms latency-
window).
--- Insert Figure 5 and 6 about here ---
As for experiment 1, the N2 was analyzed after averaging together the mean amplitude in
the 3 parietal sites (P3, Pz, P4), which were those where the component was at its highest
amplitude. N2 mean amplitude was submitted to a 3x2 repeated measures ANOVA with
series (regular, interrupted, random), and response event (target vs repeated event) as factors.
No effect was significant, even though there was a trend for a main effect of Series [F(2, 20)
= 2.7, p = .088]. Similarly to Experiment 1, N2 tended to be less pronounced for interrupted
series than for regular and for random ones.
Mean amplitudes in the 350-450 ms latency-window were analyzed by means of a 3x3x2
repeated measures ANOVA, factoring region (frontal, central, parietal), type of series
(regular, interrupted, random), and type of response event (target-number vs repeated-
number). Replicating Experiment 1, the most important finding is the reliable series by
response interaction [F(2, 20) = 10.5, p < .01]. It shows that, in a regular series, this
component was more positive for the target-number events than for the repeated-number
events [t(10)=5.9, p < .001] whereas, in interrupted series, there was no difference among the
two response events: positivity increased for repeated events, and decreased for target events,

Inference-driven attention: event-related potentials 27
with respect to regular seires. These results are consistent with the idea that attention is
focused on the target number in the regular series, but – in the interruptede series – after
detection of the deviant number attention is redeployed to both response events. Positivity is
at its lowest point in random series where, for target-number events, amplitude is
significantly lower with respect to interrupted series [t(10)=3, p < .05] and to regular series
[t(10)=5, p < .001]. Also in this case, this pattern fits the observed response latencies. The
ERP amplitude progressively increases in the antero-posterior direction, and mostly so for the
target events after regular series, as shown by the significant response by series by region 3-
way interaction [F(4, 40) = 4.9, p < .01, means in Table 3]. This pattern suggests that the
observed component is likely to be a P3b component.
Other findings, embedded in the effects reported above, are the main effect of region [F(2,
20) = 10.9, p < .01], series [F(2, 20) = 5.9, p <.05] and response [F(1, 10) = 20.1, p < .01].
Electrophysiological effects at Sn-1
The grand means of ERPs evoked by Sn-1 are shown in Figure 7. Visual inspection
suggests two differences with respect to Experiment 1: here, there is no N400 modulation and
the positive modulation begins at an earlier time and lasts longer. Yet, similarly to
Experiment 1, there is a posterior N2, and the P300 shows a late peak mostly in the centro-
parietal regions, even though waveforms had different temporal durations from the previous
experiment. For the analyses we selected three latency-windows: 160-200, 200-300 ms, and
300-600 ms.
For the N2, mean amplitude in the 3 parietal sites averaged together (P3, Pz, P4) was
submitted to a univariate ANOVA factoring type of series (regular, regular, random). The
effect of series was significant [F(2, 20) = 8.6, p < .01]. N2 was more pronounced for regular
series than for interrupted [t(10)=3.6, p < .01] and random ones [t(10)=2.5, p < .05], even if

Inference-driven attention: event-related potentials 28
in the latter case the difference was of only 0.4 µV. The interrupted series was significantly
less pronounced than the random one (t(10)=2.5, p < .05).
For the other two components, mean amplitudes were analyzed by means of a repeated-
measures ANOVA factoring region (frontal, central, parietal) and series (regular, interrupted,
random). Preliminary analyses showed no substantial findings related to lateralization.
Accordingly, also for these time-windows the laterality factor was collapsed across regions.
--- Insert Figure 7 about here ---
Amplitudes in the two latency-windows are shown in Table 4. In the earlier window, the
only reliable effect was the main effect of series [F(2, 20) = 19.2, p < .001], showing that the
interrupted series (those where Sn-1 was deviant) were associated with a more positive
waveform than the other two series [interrupted vs. regular, t(10)=5.6, p < .001; interrupted
vs. random, t(10)=4.7, p < .001]. In the later latency-window, there was a main effect of
region [F(2, 20) = 24.1, p < .001], showing that activity increased progressing in the anterior-
posterior direction [frontal vs. central, t(10)=5.1, p < .001; central vs. parietal, t(10)=4, p <
.01]. The main effect of series was also significant [F(2, 20) = 14.8, p < .001], again showing
that the interrupted series elicited the most pronounced potentials [interrupted vs. regular,
t(10)=4.4, p < .001; interrupted vs. random, t(10)=3.9, p < .01].
Discussion
Behavioral findings replicate previous results by Cherubini et al. (2006). As in Experiment
1, ERPs at Sn corroborate the pattern of allocation of attention predicted by the inference-
driven view of attentional deployment. A mostly parietal P300 is observed. This P3b
component is sensitive to the amount of expectations/resources allocated to incoming

Inference-driven attention: event-related potentials 29
response events. As predicted, in regular series it is more pronounced for target-numbers than
for repeated numbers; positivity associated to target-numbers become less pronounced in
interrupted series, whereas ERPs to repeated numbers have a higher amplitude, with respect
to regular series. Finally, ERP waves to both events are less pronounced in the random series
than in interrupted series. Despite some differences from Experiment 1, mostly in the
absolute amplitudes of potentials (which were higher in the perceptual task), the observed
statistically reliable effects in the P3b are the same as in Experiment 1. A pattern similar to
Experiment 1 is also observed in the N2 component, even if only as a trend. However, as in
Experiment 1, the lack of a Series x Response interaction modulating the N2 amplitude
suggests that the N2 – contrary to the P300 – is not sensitive to the inference-driven
mechanism of strategic deployment of attention.
The positive P3 complex for Sn-1 has an earlier onset and lasts longer than in Experiment 1.
Despite these differences, it bears a structural resemblance to that observed in Experiment 1:
it is biphasic, with the later component mostly parietal, suggestive of a two-stage process
where, first the deviant stimulus is detected, and then disengagement and reallocation of
attention for the incoming response event is undertook. The N2 for Sn-1 was also modulated in
a similar fashion as in Experiment 1, in that this component was more pronounced for regular
series than for the other two series. No N400-like component was found.
Cross-experimental results
We tested whether the RTs and the ERP components found in the two experiments
showed a similar pattern by submitting these measures to mixed ANOVAs. For the RTs, a
2x3x2 mixed ANOVA was performed with experiment (perceptual vs. symbolic) as the
between subjects factor, and series and response event as the within subject factors. The 3-
way interaction Experiment x Series x Response event was not significant, showing that the

Inference-driven attention: event-related potentials 30
critical Series x Response interactions were not reliably different in the two experiments. The
only significant effect involving experiment was the interaction with the response event type
[F(1, 23) = 9.9, p < .01]: in the perceptual task, responses to target events were globally faster
than responses to repeated events ( t(11) = 6.6. p < .001), whereas the two responses were
not different in the symbolic task (p = .22). Faster responses to target events were observed in
Cherubini et al. (2006): together with the increased number of errors for the repeated events,
they point to the fact that responses to target events are generally easier, a result of no
consequence for the experimental hypotheses. All the more, this trend not reaching
significance in the present Experiment 2 is not of concern for the main results of this study.
There was a trend for a main effect of experiment [F(1, 23) = 4.1, p = .054], suggesting that
responses in the perceptual experiment were faster than those in the symbolic experiment.
Even this trend is consistent with previous results of the 2006 study, where responses to
perceptual tasks were reliably faster than responses to symbolic tasks. No other effect
involving task reached significance.
For the ERP analysis, all the components were evaluated through mixed ANOVAs with
experiment as the between factor, with the exception of the late frontal negativity associated
to Sn-1 in the perceptual experiment, since this component did not appear in the symbolic
experiment. Preliminary analyses indicated that absolute amplitude of ERPs was much
greater in the perceptual task than in the symbolic one. To focus on the effects of
experimental manipulations on ERPs independently of differences in absolute magnitude of
ERP amplitudes, we first standardized mean amplitudes using z-scores. For each condition
and experiment, z-scores were obtained by subtracting the mean amplitude from each
subject’s amplitude value and dividing this difference value by the standard deviation. As a
result of this transformation, the amplitude data from both experiments were centered to the
zero value, thus cancelling out the absolute differences between the two experiments.

Inference-driven attention: event-related potentials 31
The mean amplitude z-scores of the N2 elicited by Sn was evaluated through 2x3x2 mixed
ANOVA with experiment as the between subjects factor, and series and response event as the
within subject factors. This analysis yielded a main effect of series only [F(2, 42)=5.8, p =
.01], which strengthens results from the separate ANOVAs by showing that N2 was less
pronounced for interrupted series than for the other two series in both experiments. The mean
amplitude z-scores of the P3b elicited by Sn was submitted to a 2x3x3x2 mixed ANOVA with
Experiment as the between subjects factor, and region, series and response event as the within
subject factors. Besides the significant effects confirming results from ANOVAs carried out
separately for each experiment, no effect involving the factor experiment was found.
The mean amplitude of the N2 elicited by Sn-1 was submitted to a 2x3 mixed ANOVA
with experiment as the between subjects factor, and series as the within subject factor. This
analysis yielded a significant main effect of series only [F(2, 42) = 23.2, p < .001]. As in the
separate ANOVAs, this effect mainly indicates that N2 for was more pronounced for regular
series than for the other two series in both experiments.
The mean amplitudes of the P3a and P3b elicited by Sn-1 were submitted to a 2x3x3 mixed
ANOVAs with experiment as the between subjects factor, and region and series as the within
subject factor. For the P3a, the only effect involving the experiment was an experiment by
series interaction [F(2, 42) = 6.6, p < .01]. It is noteworthy that this was not a cross-over
interaction, and was instead due to the fact that the difference between P3a amplitudes for
interrupted and target series was larger in the perceptual task than in the symbolic task,
although for both tasks this difference was significant, as confirmed by subsequent t-tests [for
the perceptual task: t(11) = 10.1, p < .001; for the symbolic task: t(10) = 5.6, p < .001].
For the P3b, there was a region by series by experiment interaction [F(4, 84) = 7, p <
.001]. This interaction was mainly due to differences in the topography of the components.
As already shown in the separate ANOVAs, and also corroborated by planned comparisons

Inference-driven attention: event-related potentials 32
here, the difference between the interrupted and the regular series was strongest in the
parietal region and smallest in the frontal region for the perceptual task (planned comparison
F(1, 21) = 19, p < .001), whereas this difference was equally distributed across the scalp in
the symbolic task (planned comparison F(1, 21) = 2.3, p = .14). Notably, the series by
experiment interaction was not significant (p = .6), a result that suggests that the three way
interaction was mainly due to differences in the scalp topography of an otherwise similar
modulation.
General Discussion
The present study investigated the electrophysiological correlates of inference-driven
attention, that is the strategic control of attention driven by expectations and by their
disconfirmations. Events confirming or contrasting with an expectation are critically
important for the revision of our internal models of the environment. Both classes of events
are rapidly and efficiently detected and processed (e.g., Horstmann & Becker, in press;
Horstmann & Ansorge, 2006; Horstmann, 2006 a,b, 2005, 2002). However, as shown by
Cherubini et al. (2006), expected and unexpected events trigger different patterns of
attentional deployment. Specifically, when a set of regularities in the previous stimuli induce
the expectation of a specific response event, attention is focused on it. If that event later
occurs (as it happened for the target events in the regular conditions of the present
experiments), its processing is enhanced, whereas if a different, unexpected response event
occurs (as it happened for repeated events in regular series), its processing is hindered. After
an unexpected event occurs in a previously regular context (e.g., interrupted series
conditions), attention is redeployed and distributed among the two possible response events.
Finally, lack of regularities impedes the building of expectations, and thus it impedes
inference-driven attentional orienting, resulting in poor performance for both response events.
These patterns of attentional deployment work similarly for some perceptual tasks (tracking

Inference-driven attention: event-related potentials 33
of perceptual trajectories) and for a symbolic task (tracking of simple arithmetic series). The
behavioral results of the present experiments consistently replicate the findings of Cherubini
et al. (2006).
In this study, by capitalizing on the notion that a centro-parietal component of the P300,
namely the P3b, is likely modulated by the amount of allocated attention (Sommer et al.,
1990; Wickens et al. 1983), and by the amount of expectancies toward an incoming response
event (Rosenfeld et al., 2005; Näätänen, 1990), we directly checked the electrophysiological
correlates of the inference-driven attention model. In two tracking tasks, one using visual
trajectories (perceptual task, experiment 1) and the other using arithmetic series (symbolic
task, experiment 2), we actually found a P3b component associated with the response events,
which was modulated as predicted by the inference-driven model of attention. In regular
trajectories, its amplitude was higher for anticipated target events than for unpredictable
repeated events. By contrast, after an abrupt interruption of a trajectory the P3b for target
events was less pronounced than in regular series, and the P3b for repeated events was more
pronounced than in regular series, reflecting the redistribution of attention following the
detection of an abrupt disconfirmation of previous expectancies. Finally, in random
trajectories, the amplitude of the P3b associated to both response events was similar, and less
pronounced than in the interrupted trajectories, reflecting the lack of a consistent attentional
deployment strategy in those conditions. These electrophysiological findings corroborate the
hypothesis that the behavioral differences observed in response latencies are indeed the result
of a mechanism of attentional deployment..
A second purpose of the study was to check whether behavioral similarities in the pattern
of distribution of attention in perceptual and symbolic tasks were matched by
electrophysiological similarities. In this way we test whether behavioral similarities between
the two tasks are caused by “convergent evolution” of different, domain-specific neural

Inference-driven attention: event-related potentials 34
mechanisms of attentional orienting acting in different domains, or can be at least partly
caused by a common, non-specific neural mechanism concerned with the high-level control
of attentional deployment in different domains. Results suggest the latter possibility. Despite
differences in the absolute amplitudes and in the time course of the P3b, the patterns of the
potentials related to the response events (Sn) were very similar in the two experiments. Cross-
experimental analyses showed that the series by response interaction, critically important for
the theoretical predictions, was not reliably different in the perceptual task (Experiment 1)
and in the symbolic task (Experiment 2). This finding suggests that the P3b is at least partly
modulated by the activity of a neural substrate concerned with attentional orienting in a
general, cross-domain way. The other electrophysiological attentional marker that we
checked was the N2, a posterior component which reflects visual selective attention (Folstein
& Van Petten, 2008). It reliably showed the lowest modulation after an interrupted series in
both task (although only as a trend in the symbolic task), suggesting that the early stages of
detection of a response event are hindered after an abrupt disconfirmation of expectancies.
However, this main effect of the type of series did not interact with the type of response
events, thus showing that the N2 waveform – contrary to the P3b – is probably not affected
by the high-level mechanism of attentional redeployment that we are investigating.
Trials immediately preceding response events were also assessed. In one condition of our
experiments, those events were stimuli that abruptly deviated from a previously regular
trajectory/series. According to the inference-driven model of attention, after a deviant event is
detected, the scope of attention is widened in order to better explore the “surprising”
environment (in the artificial environments used in our experiments, this amounts to
redistributing attention to the internal representations of both possible response events). In
both experiments we found biphasic ERPs, including an anterior P3a component, marking the
detection of the deviant stimulus, and a later parietal P3b component, reflecting the

Inference-driven attention: event-related potentials 35
reallocation of attention. Even though both P3a and P3b can be elicited by deviant events and
they usually show spatial and temporal overlap, previous studies using principal component
analysis (Dien, Spencer, & Donchin, 2003) and independent component analysis (Debener,
Makeig, Delorme, & Engel, 2005) have shown that they reflect two distinct components (see
also Friedman et al., 2001). Moreover, source analysis has suggested two different
anatomical sources for P3a and P3b, namely anterior cingulate and temporal parietal junction,
respectively (Dien, et al., 2003). The interrupted series elicited an earlier P3a-like component
that was central in the Experiment 1, and diffused across the scalp in Experiment 2, followed
by a late P3b-like component, that was mainly parietal in both experiments. This pattern is in
line with the existence of an attentional system, involving prefrontal and temporo-parietal
regions, that is specialized for the detection of behaviorally relevant stimuli, mainly when
they are unexpected and salient (Corbetta & Shulman, 2002), and the strategic redistribution
of attentions that occurs after it.
The critical stimulus in the interrupted series eliciting a P3a, not only was deviant, but also
conveyed task-related information, because after that stimulus subjects were alerted that the
two response events were equally likely to occur, whereas they previously focused on only
one of those events. Recent work on the P3a has shown that this component is modulated
more by the amount of task-related information that the eliciting stimulus provides, than by
other factors such as its novelty and probability of occurrence per se (Barcelo, Escera, Corral,
& Perianez, 2006).
Another earlier potential was also sensitive to the series which the Sn-1 belonged to. The
posterior N2 was more pronounced for the regular series than in the other two series in both
experiments. This finding corroborates previous studies showing that posterior negativities in
a similar time window as the one analysed here for the N2 (around 180 ms) are more
pronounced for expected events such as targets (Folstein & Van Petten, 2008; Pritchard et al.,

Inference-driven attention: event-related potentials 36
1991) in both spatial (e.g., Luck & Hillyard, 1994a & b) and non-spatial (e.g., Eimer, 1997)
selective attention paradigms. In both tasks, the lowest N2 was present to interrupted series, a
finding that suggests that early selective attention was less focused on deviant stimuli.
However, beyond the many similarities in the electrophysiological patterns in the two
Experiments, some differences were also observed between the two tasks. One reliable
difference was observed in the topography of the P3a orienting component between
experiments 1 and 2 (central vs. diffused, respectively). This finding suggests that more
neural areas are recruited when detecting deviant numbers in a numerical string than when
detecting deviant positions in a spatial trajectory, possibly because the former require
attendance to semantic properties (even though quite simple, in our task), whereas the latter is
grounded on spatial attention.
The second important ERP difference between the two experiments is a frontal negativity
waveform associated to the deviant stimulus in the perceptual task in a similar time-window
as the N400, which was not observed in the symbolic task. While the absence of this late
negativity from arithmetic tasks is consistent with previous literature (Polich, 1985; Lang &
Kotchoubey, 2002), its presence in the visual tracking task was unpredicted, because the
N400 is mostly associated to semantic incongruencies, even though there are examples of
N400 observed in non-semantic tasks in previous literature (Barrett & Rugg, 1990;
Niedeggen & Rösler, 1999; Balconi & Pozzoli, 2005; Hoen & Dominey, 2000; Sarfarazi et
al., 1999). It is more likely that, given also differences in scalp distribution (frontal here vs.
parietal in the case of the N400), this component corresponds instead to a re-orienting
negativity (RON), a negativity developing at around 400-600 ms that follows a P3a in
paradigms using irrelevant distractor stimuli. This component has been described both in the
auditory domain (Schröger & Wolff, 1998) and, under certain circumstances, in the visual
domain (Berti & Schröger, 2001). RON is usually interpreted as an index of attentional

Inference-driven attention: event-related potentials 37
reorienting towards the task-relevant stimulus features. In the case of deviant clock hands, it
could indicate a reorienting of attention towards the positions where the hand could possibly
appear next (same position or target position). It is possible that RON is sensitive exclusively
to perceptual deviations from the attended stimulus, rather than to symbolic ones, as
suggested by the fact that this component was absent in the number task, thus marking
another difference between the reorienting mechanism involved in the two tasks.
However, further data would be required in order for us to interpret the meaning of these
differences in the ERPs in terms of information-processing stages. We acknowledge that their
presence suggests that some of the neural networks and mechanisms underlying the two tasks
were different and domain-specific. This conclusion is not mutually exclusive with the
previous one based on the similarities of ERPs elicited by the response event, which
suggested the existence of a non-specific, cross-domain structure in charge of strategic,
inferential-driven allocation of attentional resources.
Finally, it should be noted that all the expectations concerning the type of incoming
response event used in this study were not statistically grounded: in all series, the target event
and the repeated event were equally likely. Of course, statistical regularities are an important
class of inferential expectations, but they are not the only ones: the inferential system
generates expectations by using its own regularity detection strategies, which – even though
they often emulate a statistical processor (e.g., Cosmides & Tooby, 1996) – in many instances
deviate from it (for example, see the literature about the perception of randomness, e.g., the
review by Nickerson, 2002; or the studies on illusory correlations, e.g., the model by Garcia-
Marques, Hamilton, & Maddox, 2002). The present results show that inferential expectations
and their violations affect deployment of attention in a structured, cross-domain way, even
when they are not based on valid statistical regularities.

Inference-driven attention: event-related potentials 38
Acknowledgments
We wish to thank Elena Castelvecchio for her valuable help in data collection, Sandra
Moses for kindly proofreading the manuscript, Gernot Horstmann and two anonymous
reviewers of a previous draft of this paper for their useful comments and suggestions. This
research was partially supported by a grant from Italian Ministero dell’Università e della
Ricerca (MIUR) to PC and DM.

Inference-driven attention: event-related potentials 39
References
Anderson, J. R., & Lebiere, C. (1998). The atomic components of thought. Mahwah, NJ:
Lawrence Erlbaum Associates, Inc.
Anderson, J.R. (1990). The adaptive character of thought. Hillsdale, NJ: Erlbaum
Balconi, M., & Pozzoli, U. (2005). Morphed facial expressions elicited a N400 ERP effect: a
domain-specific semantic module? Scand. J Psychol, 46, 467-474.
Barcelo, F., Escera, C., Corral, M. J., & Perianez, J. A. (2006). Task switching and novelty
processing activate a common neural network for cognitive control. Journal of Cognitive
Neuroscience 18, 1734-1748.
Barrett, S. E., & Rugg, M. D. (1990). Event-related potentials and the semantic matching of
pictures. Brain Cogn, 14, 201-212.
Behavioral and Brain Sciences, 11, 357-427
behavioral and event-related indices. Cognitive Brain Research, 11, 265-273.
Berti, S., & Schröger, E. (2001). A comparison of auditory and visual distraction effects:
Biederman, I., Mezzanotte, R. J., & Rabinowitz, J. (1982). Scene perception: Detecting and
judging objects undergoing relational violations. Cognitive Psychology, 14, 143–177.
Castellan, N. J., Jr. (1977). Decision making with multiple probabilistic cues. In N. J. Castellan,
Jr., D. B. Pisoni, & G.R. Potts (eds), Cognitive theory, Vol II (pp. 117-147). New Jersey: L.
Erlbaum.
Cherubini, P., Burigo, M., & Bricolo, E. (2006). Inference-driven attention in symbolic and
perceptual tasks: biases toward expected and unexpected inputs. Quarterly Journal of
Experimental Psychology, 59, 597-624.
Cherubini, P., Mazzocco, A., & Minelli, S. (2007). Facilitation and inhibition caused by the
orienting of attention in propositional reasoning tasks. Quarterly Journal of Experimental
Psychology, 60, 1496-1523.
Corbetta, M. & Shulman, G. L. (2002). Control of goal-directed and stimulus-driven attention in
the brain. Nat.Rev.Neurosci, 3, 201-215.
Cosmides, L., & Tooby, J. (1996). Are humans good intuitive statisticians after all? Rethinking
some conclusions from the literature on judgment under uncertainty. Cognition, 58, 1-73.
Debener, S., Makeig, S., Delorme, A., & Engel , A.K. (2005). What is novel in the novelty
oddball paradigm? Functional significance of the novelty P3 event-related potential as
revealed by independent component analysis. Cognitive Brain Research, 22, 309-321.

Inference-driven attention: event-related potentials 40
Dien, J., Spencer, K.M., & Donchin, E. (2003). Localization of the event-related potential
novelty response as defined by principal components analysis. Cognitive Brain Research, 17,
637-650.
Donchin, E. (1981) Surprise!… Surprise? Psychophysiology, 18, 493–513.
Donchin, E., & Coles, M.G. (1988). Is the P300 component a manifestation of context updating?
Eimer, M. (1997). Uninformative symbolic cues may bias visual-spatial attention: behavioral and
electrophysiological evidence. Biological Psychology, 46, 67-71.
Folstein, J.R., & Van Petten, C. (2008). Influence of cognitive control and mismatch on the N2
component of the ERP: A review. Psychophysiology, 45, 152–170.
Friedman, D., Cycowicz, Y. M., & Gaeta, H. (2001). The novelty P3: an event-related brain
potential (ERP) sign of the brain's evaluation of novelty. Neurosci Biobehav.Rev., 25, 355-
373.
Garcia-Marques, L., Hamilton, D.L., & Maddox, K.B. (2002). Exhaustive and Heuristic
Retrieval Processes in Person Cognition: Further Tests of the TRAP Model. Journal of
Personality and Social Psychology, 82, 193–207.
Hillstrom, A.P., & Yantis, S. (1994). Visual motion and attentional capture. Perception &
psychophysics, 55, 399–411.
Hoen, M. & Dominey, P. F. (2000). ERP analysis of cognitive sequencing: a left anterior
negativity related to structural transformation processing. Neuroreport, 11, 3187-3191.
Holcomb, P. J. & Neville, H. J. (1990). Semantic priming in visual and auditory lexical decision:
A between modality comparison. Language and Cognitive Processes, 5, 281-312.
Holland, J. H., Holyoak, K. J., Nisbett, R. E., & Thagard, P. R. (1986). Induction: Processes of
inference, learning, and discovery. Cambridge, MA: MIT Press.
Holland, J.H. (1995). Hidden order. : New York: Perseus.
Holyoak, K. J. & Spellman, B. A. (1993). Thinking. Annual Review of Psychology, 44, 265-315.
Horstmann, G. & Becker, S. (in press). Effects of stimulus onset asynchrony and display duration
on implicit and explicit measures of attentional capture by a surprising singleton. Visual
Cognition.
Horstmann, G. (2002). Evidence for attentional capture by a surprising color singleton in visual
search. Psychological Science, 13, 499-505.
Horstmann, G. (2005). Attentional capture by an unannounced color singleton depends on
expectation discrepancy. Journal of Experimental Psychology: Human Perception and
Performance, 31, 1039-1060.

Inference-driven attention: event-related potentials 41
Horstmann, G. (2006). Latency and duration of the action interruption in surprise. Cognition &
Emotion, 20, 242-273.
Horstmann, G. (2006). Time course of intended and unintended allocation of attention.
Psychological Research Psychologische Forschung, 70, 13-25.
Horstmann, G., & Ansorge, U (2006). Attentional capture by rare singletons. Visual Cognition,
14, 295-325.
Jacoby, L. L., & Dallas, M. (1981). On the relationship between autobiographical memory and
perceptual learning. Journal of Experimental Psychology: General, 110, 306–340.
Knight, R. T. & Nakada, T. (1998). Cortico-limbic circuits and novelty: a review of EEG and
blood flow data. Rev.Neurosci, 9, 57-70.
Koelsch, S., Kasper, E., Sammler, D., Schulze, K., Gunter, T., & Friederici, A. D. (2004). Music,
language and meaning: brain signatures of semantic processing. Nat.Neurosci, 7, 302-307.
Kutas, M. & Hillyard, S. A. (1980). Reading senseless sentences: brain potentials reflect
semantic incongruity. Science, 207, 203-205.
Kutas, M. & Hillyard, S. A. (1984). Brain potentials during reading reflect word expectancy and
semantic association. Nature, 307, 161-163.
Lang, S. & Kotchoubey, B. (2002). Brain responses to number sequences with and without active
task requirement. Clin Neurophysiol., 113, 1734-1741.
Luck, S. J., & Hillyard, S. A. (1994a). Spatial filtering during visual search: Evidence from
human electrophysiology. Journal of Experimental Psychology: Human Perception and
Performance, 20, 1000-1014.
Luck, S. J., & Hillyard, S. A. (1994b). Electrophysiological correlates of feature analysis during
visual search. Psychophysiology, 31, 291-308.
Luria, A. R. (1973). The Working Brain. New York: Basic Books.
Näätänen, R. (1990). The role of attention in auditory information processing as revealed by
event-related potentials and other brain measures of cognitive function. Behavioral and Brain
Sciences, 13, 201-287.
Neisser, U. (1976). Cognition and reality. San Francisco: Freeman.
Newell, A. (1990). Unified theories of cognition. Cambridge, MA: Harvard University Press.
Nickerson, R.S. (2002). The production and perception of randomness. Psychological review,
109, 330-357.
Niedeggen, M., & Rösler, F. (1999) N400 Effects Reflect Activation Spread During Retrieval of
Arithmetic Facts. Psychological Science, 10, 271–276
Pavlov, I. P. (1927). Conditioned reflexes. Oxford: Oxford University Press.

Inference-driven attention: event-related potentials 42
Polich J. (1985). N400s from sentences, semantic categories, number and letter strings? Bull
Psychon Soc. 23, 361–364.
Polich, J. (2004). Neuropsychology of P3a and P3b: a theoretical overview. In N.C. Moore & K.
Arikan (Eds.), Brainwaves and mind: Recent developments (15-29). Wheaton, IL: Kjellberg
Inc.
Polich, J. (2007). Updating P300: an integrative theory of P3a and P3b. Clin Neurophysiol. 118,
2128-2148.
Polich, J., & Criado, J.R. (2006). Neuropsychology and neuropharmacology of P3a and P3b.
International Journal of Psychophysiology, 60, 172-185.
Pritchard, W. S., Shappell, S. A., & Brandt, M. E. (1991). Psychophysiology of N200/N400: A
review and classification scheme. In J. R. Jennings, P. K. Ackles, & M. G. H. Coles (Eds.),
Advances in psychophysiology, vol. 4 (pp. 43-106). Greenwich, CT: JAI Press.
Rauschenberger, R., & Yantis, S. (2001). Attentional capture by globally defined objects.
Perception & Psychophysics, 63, 1250–1261.
Rosenbloom, P.S., Laird, J.E., Newell, A., McCarl, R. (1991). A preliminary analysis of the Soar
architectureas a basis for general intelligence. Artificial Intelligence, 47, 289-325.
Rosenfeld, J. P., Biroschak, J. R., Kleschen, M. J., & Smith, K. M. (2005). Subjective and
objective probability effects on P300 amplitude revisited. Psychophysiology, 42, 356-359.
Sarfarazi, M., Cave, B., Richardson, A., Behan, J., & Sedgwick, E. M. (1999). Visual event
related potentials modulated by contextually relevant and irrelevant olfactory primes.
Chem.Senses, 24, 145-154.
Sawaki, R., & Katayama, J. (2008). Distractor P3 is associated with attentional capture by
stimulus deviance. Clinical Neurophysiology, 119, 1300-1309.
Schröger, E., & Wolff, C. (1998). Behavioral and electrophysiological effects of task irrelevant
sound change: a new distraction paradigm. Cognitive Brain Research, 7, 71-87.
Sloman, S. (1996). The empirical case for two systems of reasoning. Psychological Bulletin, 119,
3-22.
Sokolov, E. N. (1963). Perception and the conditioned reflex. New York: Macmillan.
Sommer, W., Matt, J., & Leuthold, H. (1990). Consciousness of attention and expectancy as
reflected in event-related potentials and reaction times. J Exp Psychol Learn.Mem.Cogn, 16,
902-915.
Squires, K.C., Wickens, C., Squires, N.K., & Donchin, E. (1976). The effect of stimulus
sequence on the waveform of the cortical event-related potential. Science, 193, 1142-1146.

Inference-driven attention: event-related potentials 43
Stuss, D.T., Murphy, K.J., Binns, M.A., & Alexander, M.P. (2003). Staying on the job: the
frontal lobes control individual performance variability. Brain, 126, 2363-2380.
Wickens, C., Kramer, A., Vanasse, L., & Donchin, E. (1983). Performance of concurrent tasks: a
psychophysiological analysis of the reciprocity of information-processing resources. Science,
221, 1080-1082.

Inference-driven attention: event-related potentials 44
Table 1. Mean Response Times (and standard errors) of correct responses in Experiments 1
and 2, in milliseconds.
Series
Response Regular Interrupted Random
Experiment 1
Target 482 (24) 568 (22) 589 (19)
Repeated 627 (19) 587 (19) 628 (19)
Experiment 2
Target 656 (74) 745 (68) 798 (82)
Repeated 771 (73) 737 (75) 752 (74)

Inference-driven attention: event-related potentials 45
Table 2. Mean percentages of errors (and standard errors) in Experiments 1 and 2.
Series
Response Error Type Regular Interrupted Random
Experiment 1
Target Wrong 2.0 (0.9) 0.8 (0.5) 0.9 (0.4)
Miss 3.0 (1.3) 2.7 (1.1) 2.7 (1.2)
Repeated Wrong 1.2 (0.5) 2.3 (0.7) 1.3 (0.6)
Miss 6.4 (1.3) 8.9 (2.5) 5.7 (1.5)
False Alarm 5.9 (1.1) 5.5 (0.8) 1.8 (0.6)
Experiment 2
Target Wrong 0.7 (0.3) 0.1 (0.1) 1.0 (0.4)
Miss 4.3 (1.1) 4.6 (0.6) 5.3 (1.5)
Repeated Wrong 1.4 (0.3) 0.5 (0.2) 1.1 (0.5)
Miss 16.8 (3.0) 19.2 (3.0) 20.3 (2.9)
False Alarm 3.0 (0.8) 3.8 (0.9) 0.8 (0.3)

Inference-driven attention: event-related potentials 46
Table 3. Mean ERP amplitude (and standard error) at Sn, according to series, response types,
time-windows and scalp regions in Experiments 1 and 2, in micro-volts.
Series
Region Response Regular Interrupted Random
Experiment 1, latency-window 160-200 ms
Parietal Target event -0.6 (.7) 1.3 (0.9) 0.04 (0.9)
Repeated event -0.2 (0.7) 0.1 (0.7) -0.04 (0.44)
Experiment 1, latency-window 350-450 ms
Frontal Target event 7.0 (0.9) 3.5 (1.1) 3.6 (0.9)
Repeated event 4.2 (1.1) 4.9 (1.2) 2.6 (1.3)
Central Target event 11.1 (0.9) 6.2 (1.4) 6.0 (0.9)
Repeated event 6.5 (1.1) 7.5 (1.2) 5.3 (1.2)
Parietal Target event 13.2 (.8) 8.5 (1.4) 8.4 (1.0)
Repeated event 7.7 (1.1) 9.3 (1.3) 7.4 (1.1)
Experiment 2, latency-window 160-200 ms
Parietal Target event 4.8 (0.7) 4.7 (0.6) 3.5 (0.7)
Repeated event 3.6 (0.7) 4.7 (0.9) 3.8 (0.6)
Experiment 2, latency-window 350-450 ms
Frontal Target event 3.5 (0.6) 3.3 (0.7) 0.6 (0.6)
Repeated event 1.2 (0.5) 2.1 (0.7) 0.4 (0.5)
Central Target event 5.2 (0.9) 3.9 (0.9) 1.5 (0.6)
Repeated event 1.5 (0.5) 2.7 (1.2) 1.2 (0.5)
Parietal Target event 7.0 (1.2) 5.1 (1.1) 3.0 (0.9)
Repeated event 2.7 (0.6) 4.4 (1.2) 3.1 (0.6)

Inference-driven attention: event-related potentials 47
Table 4. Mean ERP amplitude (and standard error) at Sn-1, organized according to the three
series, the three scalp regions, and the different latency-windows in Experiments 1 and 2 (in
micro-volts).
Series
Latency window Region Regular Interrupted Random
Experiment 1
160-200 ms Parietal -1.4 (0.5) 1.3 (0.6) -0.4 (0.6)
200-350 ms
Frontal 2.5 (0.4) 8.4 (1.1) 4.7 (0.8)
Central 2.7 (0.5) 10.1 (1.1) 5.3 (0.7)
Parietal 2.5 (0.4) 8.8 (0.8) 4.9 (0.5)
350-420 ms
Frontal 1.8 (0.8) 5.2 (0.7) 1.8 (0.9)
Central 2.8 (0.8) 8.5 (0.9) 3.4 (0.8)
Parietal 3.5 (0.8) 9.8 (1.0) 4.4 (0.7)
420-650 ms
Frontal -1.3 (0.5) -4.6 (0.3) -2.3 (0.4)
Central -0.4 (0.4) -2.8 (0.7) -1.1 (0.3)
Parietal 0.2 (0.3) -1.6 (0.6) -0.4 (0.3)
Experiment 2
160-200 ms Parietal 2.6 (0.4) 3.9 (0.5) 3 (0.4)
200-300 ms
Frontal 3.7 (0.4) 5.5 (0.5) 3.4 (0.5)
Central 4.2 (0.4) 6.0 (0.5) 4.0 (0.4)
Parietal 4.3 (0.4) 5.8 (0.5) 4.3 (0.4)
300-600 ms
Frontal -1.1 (0.5) 1.4 (0.6) -0.8 (0.5)
Central 0.1 (0.5) 2.5 (0.6) 0.1 (0.4)
Parietal 1.3 (0.6) 3.1 (0.6) 0.8 (0.5)

Inference-driven attention: event-related potentials 48
Figure Captions
Figure 1. Some examples of (a) regular, (b) interrupted, and (c) random series, in
Experiments 1 (visual trajectories) and 2 (arithmetic series) (for the visual trajectories,
the regular-repeated and random-repeated conditions are not exemplified). In the
experiments each series was equally associated with target-event responses and repeated-
event responses. The small numbers near the clock hands in Experiment 1 were not
present in the real task: they are displayed here to show the sequential order of
presentation of the hands. In Experiment 2, all the numbers appeared at the center of the
screen.
Figure 2. Grand Averages of the ERPs elicited by a target event at the imperative stimulus
(Sn), as a function of Series, in Experiment 1 (visual trajectories task). Analysed
electrodes only are displayed. F is frontal, C is central, P is parietal; electrodes numbered
3 are on the left hemisphere, 4 on the right one, and z are on the midline. Amplitude (in
microvolts) is plotted in the y-axis, and latency (in milliseconds) in the x-axis.
Figure 3. Grand Averages of the ERPs evoked by a repeated event at Sn, as a function of
Series in the Experiment 1 (visual trajectories task). See figure 1 for details.
Figure 4. Grand Averages of ERPs for the Sn-1 as a function of Series, in Experiment 1.
Figure 5. Grand Averages of the ERPs evoked by a target event at Sn, as a function of Series,
in Experiment 2 (arithmetic task). See figure 1 for details.
Figure 6. Grand Averages of the ERPs elicited by a repeated event at Sn, as a function of
Series, in Experiment 2. See figure 1 for details.
Figure 7. Grand Averages of the ERPs at Sn-1, as a function of Series, in Experiment 2. See
figure 1 for details.

Inference-driven attention: event-related potentials 49
Figure 1.

Inference-driven attention: event-related potentials 50
Figure 2.

Inference-driven attention: event-related potentials 51
Figure 3.

Inference-driven attention: event-related potentials 52
Figure 4.
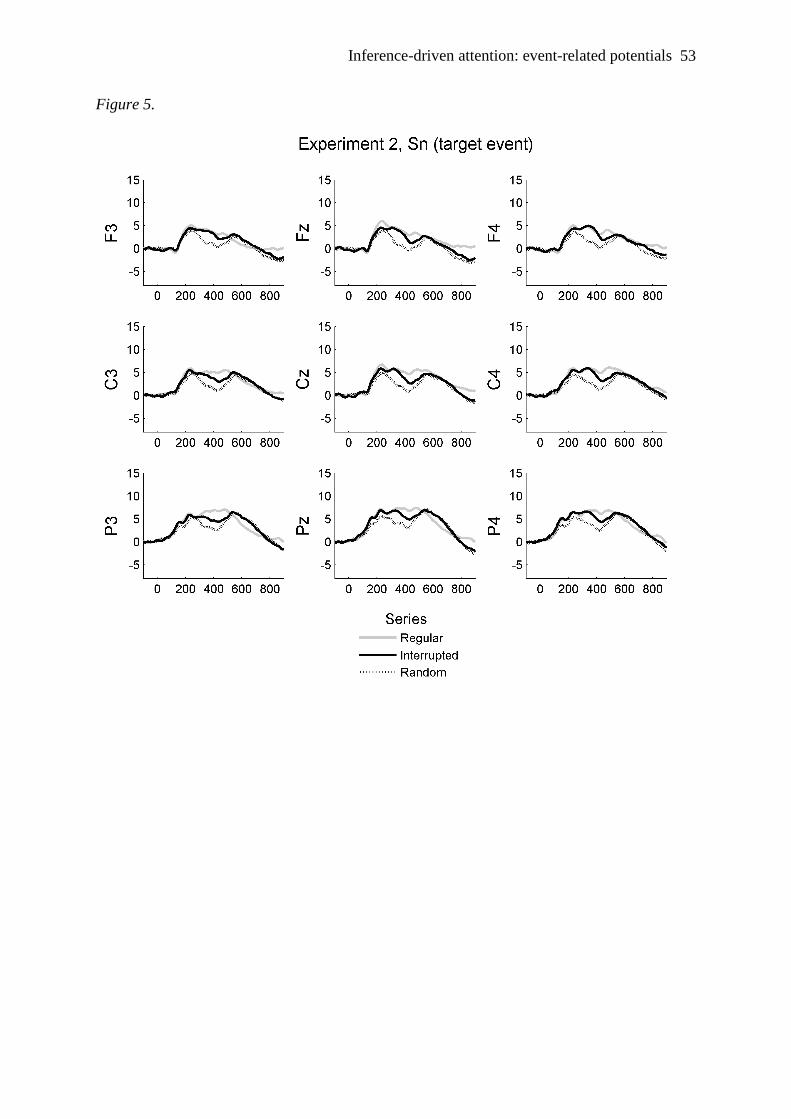
Inference-driven attention: event-related potentials 53
Figure 5.

Inference-driven attention: event-related potentials 54
Figure 6.

Inference-driven attention: event-related potentials 55
Figure 7.