Network motif-based identification of transcription factor-target gene relationships by integrating...
18
BioMed Central Page 1 of 18 (page number not for citation purposes) BMC Bioinformatics Open Access Research article Network motif-based identification of transcription factor-target gene relationships by integrating multi-source biological data Yuji Zhang 1,2 , Jianhua Xuan 2 , Benildo G de los Reyes 3 , Robert Clarke 1 and Habtom W Ressom* 2 Address: 1 Lombardi Comprehensive Cancer Center, Georgetown University, 4000 Reservoir Rd, Washington, DC, USA, 2 Department of Electrical and Computer Engineering, Virginia Polytechnic Institute and State University, 4300 Wilson Blvd., Arlington, VA, USA and 3 School of Biology and Ecology, University of Maine, Orono, ME 04469, USA Email: Yuji Zhang - [email protected]; Jianhua Xuan - [email protected]; Benildo G de los Reyes - [email protected]; Robert Clarke - [email protected]; Habtom W Ressom* - [email protected] * Corresponding author Abstract Background: Integrating data from multiple global assays and curated databases is essential to understand the spatio- temporal interactions within cells. Different experiments measure cellular processes at various widths and depths, while databases contain biological information based on established facts or published data. Integrating these complementary datasets helps infer a mutually consistent transcriptional regulatory network (TRN) with strong similarity to the structure of the underlying genetic regulatory modules. Decomposing the TRN into a small set of recurring regulatory patterns, called network motifs (NM), facilitates the inference. Identifying NMs defined by specific transcription factors (TF) establishes the framework structure of a TRN and allows the inference of TF-target gene relationship. This paper introduces a computational framework for utilizing data from multiple sources to infer TF-target gene relationships on the basis of NMs. The data include time course gene expression profiles, genome-wide location analysis data, binding sequence data, and gene ontology (GO) information. Results: The proposed computational framework was tested using gene expression data associated with cell cycle progression in yeast. Among 800 cell cycle related genes, 85 were identified as candidate TFs and classified into four previously defined NMs. The NMs for a subset of TFs are obtained from literature. Support vector machine (SVM) classifiers were used to estimate NMs for the remaining TFs. The potential downstream target genes for the TFs were clustered into 34 biologically significant groups. The relationships between TFs and potential target gene clusters were examined by training recurrent neural networks whose topologies mimic the NMs to which the TFs are classified. The identified relationships between TFs and gene clusters were evaluated using the following biological validation and statistical analyses: (1) Gene set enrichment analysis (GSEA) to evaluate the clustering results; (2) Leave-one-out cross- validation (LOOCV) to ensure that the SVM classifiers assign TFs to NM categories with high confidence; (3) Binding site enrichment analysis (BSEA) to determine enrichment of the gene clusters for the cognate binding sites of their predicted TFs; (4) Comparison with previously reported results in the literatures to confirm the inferred regulations. Conclusion: The major contribution of this study is the development of a computational framework to assist the inference of TRN by integrating heterogeneous data from multiple sources and by decomposing a TRN into NM-based modules. The inference capability of the proposed framework is verified statistically (e.g., LOOCV) and biologically (e.g., GSEA, BSEA, and literature validation). The proposed framework is useful for inferring small NM-based modules of TF- target gene relationships that can serve as a basis for generating new testable hypotheses. Published: 21 April 2008 BMC Bioinformatics 2008, 9:203 doi:10.1186/1471-2105-9-203 Received: 11 December 2007 Accepted: 21 April 2008 This article is available from: http://www.biomedcentral.com/1471-2105/9/203 © 2008 Zhang et al; licensee BioMed Central Ltd. This is an Open Access article distributed under the terms of the Creative Commons Attribution License (http://creativecommons.org/licenses/by/2.0 ), which permits unrestricted use, distribution, and reproduction in any medium, provided the original work is properly cited.
Transcript of Network motif-based identification of transcription factor-target gene relationships by integrating...
BioMed CentralBMC Bioinformatics
ss
Open AcceResearch articleNetwork motif-based identification of transcription factor-target gene relationships by integrating multi-source biological dataYuji Zhang1,2, Jianhua Xuan2, Benildo G de los Reyes3, Robert Clarke1 and Habtom W Ressom*2Address: 1Lombardi Comprehensive Cancer Center, Georgetown University, 4000 Reservoir Rd, Washington, DC, USA, 2Department of Electrical and Computer Engineering, Virginia Polytechnic Institute and State University, 4300 Wilson Blvd., Arlington, VA, USA and 3School of Biology and Ecology, University of Maine, Orono, ME 04469, USA
Email: Yuji Zhang - [email protected]; Jianhua Xuan - [email protected]; Benildo G de los Reyes - [email protected]; Robert Clarke - [email protected]; Habtom W Ressom* - [email protected]
* Corresponding author
AbstractBackground: Integrating data from multiple global assays and curated databases is essential to understand the spatio-temporal interactions within cells. Different experiments measure cellular processes at various widths and depths, whiledatabases contain biological information based on established facts or published data. Integrating these complementarydatasets helps infer a mutually consistent transcriptional regulatory network (TRN) with strong similarity to thestructure of the underlying genetic regulatory modules. Decomposing the TRN into a small set of recurring regulatorypatterns, called network motifs (NM), facilitates the inference. Identifying NMs defined by specific transcription factors(TF) establishes the framework structure of a TRN and allows the inference of TF-target gene relationship. This paperintroduces a computational framework for utilizing data from multiple sources to infer TF-target gene relationships onthe basis of NMs. The data include time course gene expression profiles, genome-wide location analysis data, bindingsequence data, and gene ontology (GO) information.
Results: The proposed computational framework was tested using gene expression data associated with cell cycleprogression in yeast. Among 800 cell cycle related genes, 85 were identified as candidate TFs and classified into fourpreviously defined NMs. The NMs for a subset of TFs are obtained from literature. Support vector machine (SVM)classifiers were used to estimate NMs for the remaining TFs. The potential downstream target genes for the TFs wereclustered into 34 biologically significant groups. The relationships between TFs and potential target gene clusters wereexamined by training recurrent neural networks whose topologies mimic the NMs to which the TFs are classified. Theidentified relationships between TFs and gene clusters were evaluated using the following biological validation andstatistical analyses: (1) Gene set enrichment analysis (GSEA) to evaluate the clustering results; (2) Leave-one-out cross-validation (LOOCV) to ensure that the SVM classifiers assign TFs to NM categories with high confidence; (3) Binding siteenrichment analysis (BSEA) to determine enrichment of the gene clusters for the cognate binding sites of their predictedTFs; (4) Comparison with previously reported results in the literatures to confirm the inferred regulations.
Conclusion: The major contribution of this study is the development of a computational framework to assist theinference of TRN by integrating heterogeneous data from multiple sources and by decomposing a TRN into NM-basedmodules. The inference capability of the proposed framework is verified statistically (e.g., LOOCV) and biologically (e.g.,GSEA, BSEA, and literature validation). The proposed framework is useful for inferring small NM-based modules of TF-target gene relationships that can serve as a basis for generating new testable hypotheses.
Published: 21 April 2008
BMC Bioinformatics 2008, 9:203 doi:10.1186/1471-2105-9-203
Received: 11 December 2007Accepted: 21 April 2008
This article is available from: http://www.biomedcentral.com/1471-2105/9/203
© 2008 Zhang et al; licensee BioMed Central Ltd. This is an Open Access article distributed under the terms of the Creative Commons Attribution License (http://creativecommons.org/licenses/by/2.0), which permits unrestricted use, distribution, and reproduction in any medium, provided the original work is properly cited.
Page 1 of 18(page number not for citation purposes)

BMC Bioinformatics 2008, 9:203 http://www.biomedcentral.com/1471-2105/9/203
BackgroundEnormous amount of data has been generated by the useof high-throughput analytical methods in biology duringthe last two decades. However, the inherited properties ofthese data create significant problems in their analysis andinterpretation. Standard statistical approaches are notpowerful enough to dissect data with thousands of varia-bles (i.e., semi-global or global gene expression data) andlimited sample sizes (i.e., several to hundred samples inone experiment). These properties are typical in microar-ray and proteomic datasets [1] as well as other highdimensional data where a comparison is made to biolog-
ical samples that tend to be limited in number, thus suf-fering from curse of dimensionality [2].
One approach to address the curse of dimensionality is tointegrate multiple large data sets with prior biologicalknowledge. This approach offers a solution to tackle thechallenging task of inferring transcriptional regulatorynetworks (TRN). Transcriptional regulation is a processthat needs to be understood at multiple levels of descrip-tion [3,4] (Figure 1) including (1) the factor-target geneinteraction, in which transcription factors (TF) activatedunder certain conditions interact with their conserved
The gene transcriptional regulatory programFigure 1The gene transcriptional regulatory program. The gene transcriptional regulatory program can be simplified in two lev-els. At the factor-gene binding level, the "activated" TFs bind to their specific conserved sequence motifs, called transcription factor binding sites (TFBS). When the binding process is completed, the regulation mechanism instructs the gene transcription from transcriptional start site (TSS) (DNA to mRNA); first part of the central dogma in molecular biology.
TF1
TFBS1 E1
TSS
……… .E2 E3I1 I2 I3TATAbox
Factor -gene binding level Transcriptional regulation level
TF2
TFBS2 E1 ……… ..E2I1 I2TATAbox
TSS
TFn
TFBSn E1 ……… ..E2I1 I2TATAbox
TSS
E3
Page 2 of 18(page number not for citation purposes)

BMC Bioinformatics 2008, 9:203 http://www.biomedcentral.com/1471-2105/9/203
binding site sequences; and (2) transcriptional regulation,which explains how the bindings of TFs to their uniquerecognition sites regulate the expression of specific genes.A single source of information such as gene expressiondata is aimed at only one level of description (transcrip-tional regulation level), thus it is limited in its ability toobtain a full understanding of the entire regulatory proc-ess. Other types of information such as TF – binding sitesequence relationships revealed by genome-wide locationanalysis [5] provide complementary constraints on themodels of regulatory processes. By integrating limited butcomplementary data sources, we can realize a mutuallyconsistent hypothesis bearing stronger similarity to theunderlying causal structures [4]. Among the various typesof high-throughput biological data available nowadays,time course gene expression profiles and genomic analysisdata are two complementary sets of information that canbe used to infer regulatory components. Time course geneexpression data are advantageous over typical staticexpression profiles as time can be used to disambiguatecausal interactions. Binding site sequence data based onthe analysis of genomic loci, on the other hand, providehigh-throughput quantitative information about in vivobinding of transcriptional activators to the target regula-tory regions of the DNA. Prior biological knowledge gen-erated by geneticists will help guide inference from theabove data sets and integration of multiple data sourcesoffers insights into the cellular system at different levels.
A number of researches have explored the integration ofmultiple data sources (e.g., time course expression dataand sequence motifs) for TRN inference [6-9]. A typicalapproach for exploiting two or more data sources uses onetype of data to validate the results generated independ-ently from the other (i.e., without data fusion). For exam-ple, cluster analysis of gene expression data followed bythe identification of consensus sequence motifs in thepromoters of genes within each cluster [8]. The underlyingassumption behind this approach is that genes co-expressed under varying experimental conditions arelikely to be co-regulated by the same TF or sets of TFs. Hol-mes et al. [10] constructed a joint likelihood score basedon consensus sequence motif and gene expression dataand used this score to perform clustering. Segal et al. [11]built relational probabilistic models by incorporatinggene expression and functional category information asinput variables. Gene expression data and gene ontology(GO) data were combined for TRN discovery in B cell[12]. Computational methodologies that allow systematicintegration of data from multiple resources are needed tofully utilize the complementary information available inthose resources.
Another way to reduce the complexity of the TRN infer-ence problem is to decompose it into simple units of com-
monly used network structures. TRN is a network ofinteractions between TFs and the genes they regulate, gov-erning many of the biological activities in cells. Breakingdown the TRN into simplest units of commonly used net-work architectures helps in understanding complex bio-logical networks. Such patterns of local interconnectionsare called network motifs (NM) [13]. Since the establish-ment of the first NM in Escherichia coli [14], similar NMshave also been found in eukaryotes including yeast [15],plants, and animals [16-18], suggesting that the generalstructure of NMs are evolutionarily conserved. One wellknown family of NMs is the feed-forward loop (FFL) [19],which appears in hundreds of gene systems in E. coli[14,20] and yeast [15,21], as well as in other organisms[13,16-18,22,23]. A comprehensive review on NM theoryand experimental approaches is currently available [24].Knowledge of the NMs to which a given TF belongs facili-tates the identification of downstream target gene clusters.In yeast, a genome-wide location analysis was carried outfor 106 TFs and five NMs were considered significant:autoregulation, FFL, single input module, multi-inputmodule and regulator cascade. The first four NMs are tran-scriptionally related, while the last one reflects the signal-ling pathway activities beyond transcriptional regulation.
In this study, we developed a computational frameworkthat integrates information from time course gene expres-sion experiment, genomic location analysis, binding sitesequence, and GO category information to infer the rela-tionship between TFs and their potential target genesbased on known and predicted NMs. This was accom-plished through a three-step approach outlined in the fol-lowing. First, we applied cluster analysis of time coursegene expression profiles to reduce dimensionality and usethe GO category information to determine biologicallymeaningful clusters, upon which a model of the regula-tory module is built. This step enables us to address thescalability problem that is faced by researchers in inferringTRNs from time course gene expression data with limitedtime points. Second, we trained support vector machines(SVMs) to classify TFs into different NMs based on theirtime course gene expression profiles, location analysisdata, and target binding site sequences. The resulting SVMclassifiers were utilized to predict NMs for TFs withunknown NMs. Finally, we used recurrent neural network(RNN) models that mimic the topology of NMs to iden-tify gene clusters that may be regulated by a TF, therebyinferring the regulatory relationships between the TFs andgene clusters. A hybrid of genetic algorithm and particleswarm optimization (GA-PSO) methods was applied totrain the RNN models. We tested the proposed computa-tional framework using changes in gene expression asso-ciated with cell cycle progression in yeast [8], genomiclocation data [15], binding site sequences [25], and corre-sponding GO category information [26].
Page 3 of 18(page number not for citation purposes)
BMC Bioinformatics 2008, 9:203 http://www.biomedcentral.com/1471-2105/9/203
ResultsClustering genes into groups with enrichment for biological functionsWe selected 800 cell cycle-regulated genes and groupedthem into clusters by fuzzy c-means (FCM), where geneswith similar expression profiles are represented by a genecluster or a metagene. The optimal cluster number isdetermined by the mutual information between geneclusters and their GO annotations (Figure 2). We com-pared the performance of FCM clustering with two differ-ent m values and the k-means clustering (Figure 2). Thehighest z-score (the maximal mutual informationbetween gene clusters and their GO annotations) wasobtained when the number of clusters is 34 by FCM clus-tering with m = 1.1573. We evaluated the resulting clus-ters through the gene set enrichment analysis (GSEA)method. Table 1 presents the 34 clusters and their corre-sponding enriched GO categories. All clusters except 10,18, 21, 22, 25 and 26 are enriched in some GO categories.Details of all clusters are provided in Additional file 1. Weused these clusters as metagenes in our subsequent analy-ses to reduce the search space for TF-target gene relation-ship inference.
Predicting NMs for TFs203 proteins were identified as DNA-binding transcrip-tional regulators in the yeast genome [27]. A genome-wide location analysis was carried out for 106 TFs and fiveNMs were considered significant (auto regulation, feed-forward, single input, multi-input, and regulator cascade).The first four NMs are transcriptionally related (shown inFigure 3, left panel), while the last one reflects the signal-ing pathway activities beyond transcriptional regulation(not shown). The 106 TFs include about 52% of theknown TFs in the yeast genome.
Among the 800 cell cycle related genes, 85 have beenidentified to have TF-related functions based on their GOannotation. Out of these, 14 TFs have known NMs. A listof 85 TFs is presented in Additional file 2. We used datafrom 106 TFs to train SVM classifiers with time coursegene expression profile and binding site sequence data asinputs to classify the TFs into four NMs. We retrieved thebinding site sequence data for the TFs from the TRANS-FAC database [28]. For TFs with unknown binding sitesequences, we used the discovered binding site sequencesdescribed by Harbison et al. [27].
The trained SVM classifiers were evaluated and optimizedusing the LOOCV method. The final SVM classifiers wereutilized to predict the NMs for 71 TFs with unknownNMs. Through the LOOCV method, we evaluated if bothgene expression profile and binding site sequence infor-mation are needed in assigning TFs to NM categories.When we used gene expression profile alone as input to
SVM, the average test error was 23.6%. After incorporatingbinding sequence data into the input data, the test errorwas reduced to 15.8% (Table 2). The increased perform-ance implies that the encoded binding site sequence infor-mation is useful in predicting the critical TFs.
Inferring TF-target gene relationships in yeastRecurrent neural network (RNN) models that mimic thetopology of the known/predicted NMs were constructedto identify the relationships between TFs and putativegene clusters. The RNN models were trained to select forall 85 TFs the downstream targets from the 34 gene clus-ters.
Table 3 presents experimental results obtained for variousnumbers of generations that GA was used. The PSO gener-ation for RNN is set to 1000 [29]. As illustrated in thetable, the minimum value of RMSE decreases as thenumber of generations increases. The minimum RMSE forGA generations 600 and 800 are 0.077 and 0.075 respec-tively. In this study, we chose 600 for generations of GA.Our inference method mapped all 85 TFs to the targetgene clusters and inferred the most likely NMs.
We evaluated the predicted TF-target gene relationshipsfor the following eight well known cell cycle related TFs:SWI4, SWI5, FKH1, NDD1, ACE2, KAR4, MET28 andRAP1. Among these, the first five have NM assignments,while the last three were assigned to different NMs by theSVM classifiers. Since the "true" gene regulatory networkwas not available, the accuracy of putative regulatory rela-tionship was determined by searching known gene con-nections in databases. Based on the results of the NMmodule prediction, we collected literature evidences fromSGD [30] and BIND [31] databases. We examined theinferred relationships for each of the eight TFs. An inferredrelationship is assumed to be biologically significant if theTFs are correlated with the biological functions associatedwith the critical downstream cluster(s). Figure 3 lists thesignificant relationships; the eight TFs yielded an averageprecision of 82.9%. We calculated the precision as TP/(TP+FP), where TP and FP denote true positive and falsepositive, respectively. Network motifs for four of these TFswere identified in Chiang et al. [32] together with otherfour TFs. The eight TFs in [32] yielded an average precisionof 80.1%.
DiscussionThe main goal of this study was to infer the componentsand underlying mechanism of gene regulation in yeastbased on the combined constraints from multiple infor-mation sources. Our method effectively utilizes genomiclocation analysis for the establishment of NM for each TF.Target genes are grouped into biologically meaningfulclusters and are represented by the average expression pro-
Page 4 of 18(page number not for citation purposes)

BMC Bioinformatics 2008, 9:203 http://www.biomedcentral.com/1471-2105/9/203
Table 1: Gene set enrichment analysis (GSEA) for clusters generated by FCM with the optimal fuzziness value.
Cluster ID # of genes in cluster
Enriched Functional Category Total Genes in the category Clustered Genes P value
1 10 nucleosome 10 9 1.8E-27DNA binding 229 9 7.2E-13
2 25 steroid metabolic process 43 5 4.9E-07steroid biosynthetic process 32 4 5.8E-06
3 5 cytokinesis, completion of separation 11 5 4.9E-15cell separation during cytokinesis 13 5 1.4E-14
4 33 kinetochore 54 5 6.6E-06mitotic cell cycle 271 8 0.000047
5 16 cellular bud 150 6 9.2E-07cytoskeletal part 180 6 2.7E-06
6 29 dolichyl-phosphate-mannose-protein mannosyltransferase activity
7 3 2.8E-06
protein amino acid O-linked glycosylation 16 3 0.0000437 28 transporter activity 338 8 0.000063
primary active transmembrane transporter activity 53 4 0.0000718 37 microtubule 35 4 0.000042
cytoplasmic microtubule 14 3 0.000069 11 cellular bud neck 115 5 6.9E-07
site of polarized growth 152 5 2.7E-0610 44 N/A N/A N/A N/A11 37 DNA helicase activity 75 14 1.1E-18
mitotic recombination 41 7 2.1E-0912 16 ribonucleoside-diphosphate reductase activity 4 2 0.000034
cell cycle process 440 7 0.00004313 28 plasma membrane 261 9 8.6E-07
transmembrane transporter activity 246 7 0.00006314 31 leading strand elongation 14 3 0.000035
DNA replication 131 8 9.1E-08DNA metabolic process 710 15 1.1E-07
16 22 L-serine ammonia-lyase activity 3 2 0.00003317 32 microtubule-based process 101 12 1.9E-14
microtubule cytoskeleton 94 11 3.3E-1318 15 N/A N/A N/A N/A19 20 cellular bud 150 6 4.1E-06
site of polarized growth 152 5 0.00007820 10 cell wall 114 7 5E-11
glucanosyltransferase activity 6 2 0.00003221 6 N/A N/A N/A N/A22 28 N/A N/A N/A N/A23 29 pentose transmembrane transporter activity 4 3 3.2E-07
fructose transmembrane transporter activity 15 3 0.00003524 35 chromosome 231 12 1.3E-09
mitotic sister chromatid cohesion 22 5 8.4E-08DNA replication 131 8 3.4E-07
25 30 N/A N/A N/A N/A26 5 N/A N/A N/A N/A27 8 response to pheromone 94 7 8.6E-13
conjugation with cellular fusion 119 7 4.7E-1228 24 amine transmembrane transporter activity 16 4 2.6E-07
polyamine transmembrane transporter activity 10 3 5.3E-0629 17 sulfur metabolic process 67 11 7.3E-19
methionine metabolic process 24 7 7E-1430 30 cytoskeletal part 180 9 7E-08
spindle 80 6 1.4E-0631 14 energy reserve metabolic process 36 3 0.000055
cellular carbohydrate metabolic process 213 5 0.00005832 15 MCM complex 6 5 1.9E-13
pre-replicative complex 15 6 2.4E-13DNA replication preinitiation complex 21 6 2.6E-12
Page 5 of 18(page number not for citation purposes)

BMC Bioinformatics 2008, 9:203 http://www.biomedcentral.com/1471-2105/9/203
files of the genes in the cluster. Cluster analysis coupledwith the idea of categorizing TFs into pre-defined NMsincreased the robustness of our analysis not only in termsof obtaining meaningful modules, but also in terms ofaddressing the scalability problem. Some genes are veryimportant in biological processes, thus are regulated
through multiple pathways as shown by the presence ofseveral distinct binding site sequences. Our proposedmethod allows the representation of a gene in differentregulatory NMs since a TF can be assigned to more thanone NM. This is different from previous approaches whereonly a single model is used for TRN inference [33,34].
Clustering results using k-means and FCMFigure 2Clustering results using k-means and FCM. The cluster results from different cluster methods are compared using z-score, a measurement based on the mutual information between cluster membership and known gene attributes. Three clus-tering results are plotted: k-means clustering and FCM clustering with two m values (m is the fuzziness parameter): default value (m = 2) and optimal value (m = 1.1573). K-means outperforms FCM with default m value, whereas FCM with the optimal m value yields the highest z-score for cluster numbers ranging from 2 to 100. This demonstrates that FCM clustering with opti-mal m value has the potential to detect the underlying data structure with biological significance.
33 6 cell wall 114 5 9.2E-09structural constituent of cell wall 19 3 4.3E-07
34 22 DNA-dependent DNA replication 97 10 5.8E-14replisome 15 5 4.8E-10
To evaluate whether the gene clusters are enriched in some known biological function or process, we performed GSEA for gene clusters generated from FCM clustering with m = 1.1573 and c = 34. The cut off P-value is 0.0001. The enriched function(s) are listed in the table. Significant function(s) are correlated with all gene clusters except cluster 10, 18, 21, 21, 25 and 26.
Table 1: Gene set enrichment analysis (GSEA) for clusters generated by FCM with the optimal fuzziness value. (Continued)
Page 6 of 18(page number not for citation purposes)

BMC Bioinformatics 2008, 9:203 http://www.biomedcentral.com/1471-2105/9/203
Page 7 of 18(page number not for citation purposes)
Table 2: Performance of SVM classifiers evaluated via LOOCV.
Input data Auto regulation Feed-forward loop Single input Multiple input Average error
Gene expression data 3.7 48.1 17.6 24.8 23.6Gene expression data and binding site sequence information 3.5 30.3 10.8 18.6 15.8
To evaluate the performance of the SVM classifiers, LOOCV was performed. To examine whether both gene expression data and binding site sequence information are needed in classifying TFs into different NM categories, we built SVM classifiers using only gene expression data. If only gene expression data are considered as input data, the average test error is 23.6%. After incorporating binding sequence data into the input data, test error has been reduced 15.8%. The increased performance implies that the encoded binding site sequence information is useful in predicting the biological roles TFs play.
Predicted NM from eight known cell cycle dependent TFsFigure 3Predicted NM from eight known cell cycle dependent TFs. The left panel presents the four transcriptionally related NMs considered in this study. The right panel depicts inferred TF-target gene relationships for eight known cell cycle depend-ent TFs.
Multi-input module
Single input module
Feed-forward module
Auto-regulation module
Predicted NetworksRegulatory module
Multi-input module
Single input module
Feed-forward module
Auto-regulation module
Predicted NetworksRegulatory module
C19
SWI4 NDD1
C28
MET4 MET28
C10
SWI5 GAT3
C19
SWI4 NDD1
C19C19
SWI4SWI4 NDD1NDD1
C28
MET4 MET28
C28C28
MET4MET4 MET28MET28
C10
SWI5 GAT3
C10C10
SWI5SWI5 GAT3GAT3
C10
SWI4
C5 C21 C33 C12
FKH1
C7 C29 C33
C7
KAR4
C6 C16 C17C10
SWI5
C7 C18 C32
C10
SWI4
C5 C21 C33C10C10
SWI4SWI4
C5C5 C21C21 C33C33 C12
FKH1
C7 C29 C33C12C12
FKH1FKH1
C7C7 C29C29 C33C33
C7
KAR4
C6 C16 C17C7C7
KAR4KAR4
C6C6 C16C16 C17C17C10
SWI5
C7 C18 C32C10C10
SWI5SWI5
C7C7 C18C18 C32C32
C18
SWI4
C10
SWI5
C28
MET28
C16
MET32
C18
SWI4
C10
SWI5
C18C18
SWI4SWI4
C10C10
SWI5SWI5
C28
MET28
C16
MET32
C28C28
MET28MET28
C16C16
MET32MET32
C10
SWI4
C10
SWI4
C7
RAP1
C7
RAP1
C28
MET28
C28
MET28

BMC Bioinformatics 2008, 9:203 http://www.biomedcentral.com/1471-2105/9/203
Compared to previous methods that aimed at globalTRN inference, the TF-target gene relationships inferredin this study are expected to correspond more closely tobiologically meaningful regulatory systems and natu-rally lend themselves to optimum experimental designmethods. For example, the results presented in Figure 3can be verified from previous biological evidences. Forexample, FKH1 is a gene whose protein product is a forkhead family protein with a role in the expression of G2/M phase genes. It negatively regulates transcriptionalelongation, and regulates donor preference duringswitching. To further investigate the possibilities that thepredicted downstream gene clusters are truly regulatedby FKH1, we applied the motif discovery tool, WebMO-TIFS [35] to find shared motifs in these gene clusters. Theresults revealed that a motif called Fork_head,GTAAACAA, is identified as the most significant motifamong these gene clusters [36]. This finding stronglysupports our NM inference results. The details of thebinding site enrichment analysis (BSEA) results areshown in Additional file 3. Another example is the FFLinvolving SWI5, GAT3 and Gene Cluster 10. SWI5 hasbeen identified as the upstream regulator of GAT3[7,15,27]. Genes in cluster 10 are mostly involved inDNA helicase activity and mitotic recombination, bothof which are important biological steps in the regulationof cell cycle. Although no biological evidences haveshown that SWI5 and GAT3 are involved in these proc-esses, there are significant numbers of genes in cluster 10which are characterized (according to yeastract.com) asgenes regulated by both TFs (24 for GAT3 and 23 forSWI5 out of 44 genes in cluster 10, respectively).
Compared to Chiang et al. [32], the first improvement ofour approach is that instead of predicting the TF and indi-vidual downstream genes, we group genes into biologi-cally functional clusters and discover the relationshipsbetween TFs and gene clusters. Through clustering, wewere able to integrate the GO information, reduce thecomputational complexity, and established insights intonew interactions. If a gene cluster is involved in the NM ofone TF, and most genes have evidence that they are regu-
lated by this TF, it is most likely that the genes left in thiscluster are under the regulatory control of the TF. Further-more, the intermediate result analysis such as GSEA andmotif discovery analysis employed in our method ensurethat every step in the data integration contributes to thefinal NM inference.
ConclusionReconstruction of TRNs is one of the major challengesin post genomic era. The study presented here addressedtwo important issues in TRN inference: (1) the develop-ment of analysis methods that utilizes multiple types ofdata and (2) network analysis on the NM level. A dataintegration approach is proposed to effectively infer theunderlying mechanism and pattern of gene regulationusing yeast as model on the basis of combined con-straints arising from multiple biological data sources,including time course gene expression data, locationanalysis data, binding site sequence data and GO cate-gory information. This computational frameworkallows us to fully exploit the partial constraints that canbe inferred from each data source. First, to reduce theinference dimensionalities, the genes are grouped intoclusters by FCM, where the optimal fuzziness value isdetermined by statistical properties of gene expressiondata and the optimal cluster number is identified byintegrating the GO category information. Then, theknown NM information from location data analysistogether with the binding site information is used totrain SVM classifiers. TFs without NM assignment arepredicted by the classifiers. LOOCV is used to build theSVM classifiers with high confidence. Once the NM(s)for a TF is identified, the hybrid GA-PSO algorithm isapplied to search for target gene clusters that may be reg-ulated by the TF. This search is guided by the successfultraining of a RNN model that mimics the regulatoryNM(s) assigned to the TF. This has been demonstratedon eight well-studied yeast cell cycle dependent TFs. Theupstream BSEA indicates that the proposed method hasthe potential to identify the underlying regulatory rela-tionships between TFs and their downstream genes onthe NM level. We conducted a thorough evaluation ofour approach by applying it to a well studied process inyeast (regulation of cell cycle progression). Although welimited our analysis to gene regulatory program at thetranscriptional level, we believe that our model isexpandable to other biological network inference asmore types of high-through data become available suchas protein-protein interaction data (yeast two-hybrid)and in vivo (yeast one-hybrid) and in vitro (chromatinimmunoprecipitation) protein-DNA interaction data.We anticipate that this approach will serve as a novelmethod for analyzing multi-source data on the NMlevel.
Table 3: The experimental results of GA-PSO with RNN.
GA generations Average RMSE Minimum RMSE
100 1.27 0.78200 0.84 0.40400 0.62 0.12600 0.35 0.077800 0.31 0.075
The average and least root mean square errors (RMSEs) obtained between the output of RNN and the measured expression profile for the gene clusters are shown as the number of GA generation is varied from 100 to 800.
Page 8 of 18(page number not for citation purposes)

BMC Bioinformatics 2008, 9:203 http://www.biomedcentral.com/1471-2105/9/203
MethodsApproach overviewThe data sources used in this study involve two informa-tion levels: (1) The location analysis data, binding sitesequences, and GO category information characterize thephysical interactions at factor-gene binding level; (2) Thetime course expression data characterize the functionalinteractions at transcriptional regulation level. The goal isto discern dependencies between the gene expression pro-files and the physical (molecular interaction) mecha-nisms revealed by complementary data sources (e.g.,location data and binding site sequences).
The genome-wide location analysis is a genomic scaleassay [5] measuring the in vivo abundance of TFs that bindto intergenic regions of the DNA. Unlike the expressiondata, location analysis provides direct evidence about thephysical processes underlying gene regulation. Availabledata from location analysis experiments of 106 TFs, repre-senting ~52% of the total TFs encoded by yeast genomewere used in this study to determine transcriptional NMs.
The DNA sequence motifs that define transcription factorbinding sites (TFBSs), were extracted from TRANSFACdatabase [28]. Additional information for other TFs wereobtained from recent data as described by Harbison et al.[27].
GO information was used as the source of gene annota-tions from already validated biological evidences [26].Three GO categories (biological process, molecular func-tion, and cellular component) were used as a basis todetermine/evaluate the optimal number of gene clusters.
Gene expression profiling represents a high-throughputdata source, where expression levels for thousands ofgenes are measured simultaneously. Models such as Baye-sian networks [37] or probabilistic relational models [11]have been used to capture the interactions among themeasured expression levels. The limited number of timepoints and the large number of genes present a challengein inferring TRNs from time course gene expression data.The yeast (S. cerevisiae) cell cycle data are based on thechanges in gene expression in terms of transcript abun-dance at six stages (cln3, clb2, alpha, cdc15, cdc28, andelu) [8]. A total of 800 genes were identified as cell cycle-regulated based on cluster analysis [8]. In this study, wechose the cdc15 expression data set for 800 genes, becausethis set has the largest number of time points (24).
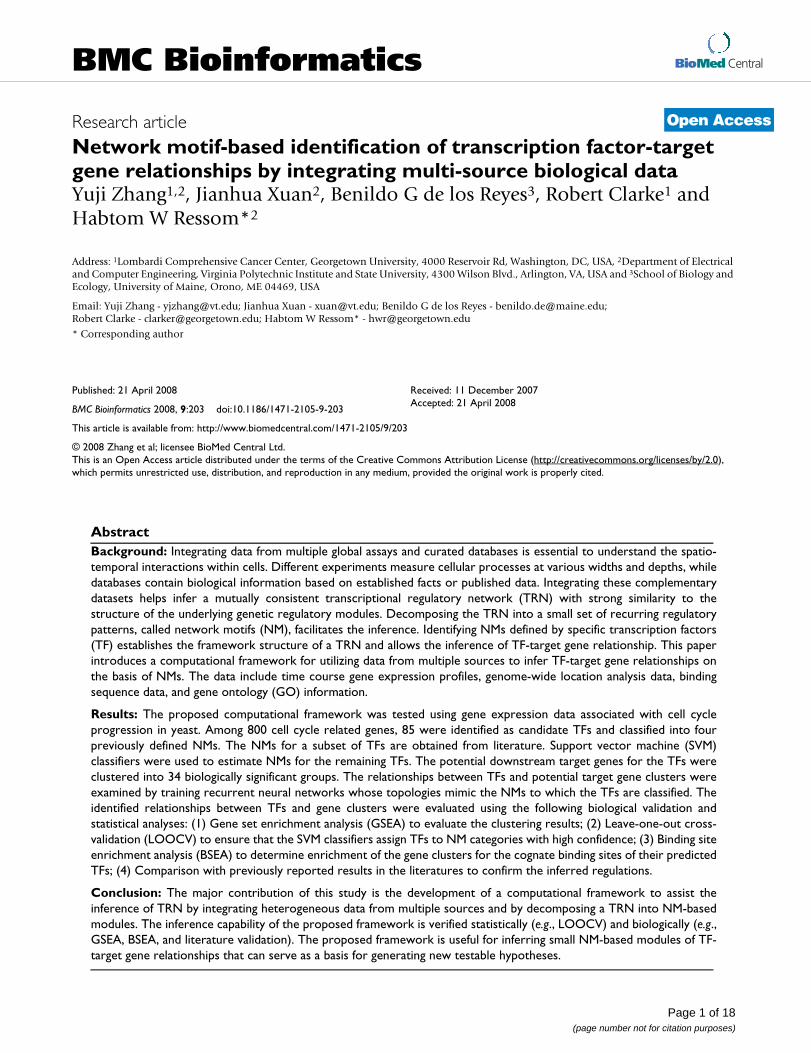
Our proposed computational framework is illustrated inFigure 4. Besides data pre-processing, there are three suc-cessive steps involved in this framework. The first step isgene clustering, where features with similar profiles aregrouped together as a metagene (a gene cluster) to address
the scalability problem [38]. The basic assumption is thata cluster of co-regulated genes share common TFs [39]. Toevaluate the clustering performance, GO categories areutilized to determine the number of clusters and annotategene clusters. Since each cluster mainly represents onefunction or process category (evaluated by FuncAssociate[40]), the regulation network between a TF and a genecluster implies that the TF can regulate a group of geneswith similar or related functions [41]. In the second step,an NM is assigned to a TF, wherein NMs are used insteadof global TRN inference to reduce the complexity of theinference problem by building SVM classifiers that assignNM(s) to each TF. TFs with known NMs are used as atraining set [15]. The trained SVM classifiers are applied topredict NMs for TFs with unknown NMs. To evaluate theclassifier performance, leave-one-out cross-validation(LOOCV) is applied. In the third step, for each TF witheither known or predicted NM(s), GA generates candidategene clusters that may be regulated by the TF according tothe NM. A RNN is trained to mimic the known or pre-dicted NM. PSO optimizes the parameters of the RNN tominimize the root mean squared error (RMSE) betweenthe output of the RNN and the target gene cluster's averageexpression profiles. The RMSE is returned to GA to pro-duce the next generation of candidate gene clusters. Theoptimization is continued until a pre-specified maximumnumber of iterations or a pre-specified minimum RMSE isreached. The above procedure is repeated for all TFs.Known biological knowledge from databases is used toevaluate the predicted results.
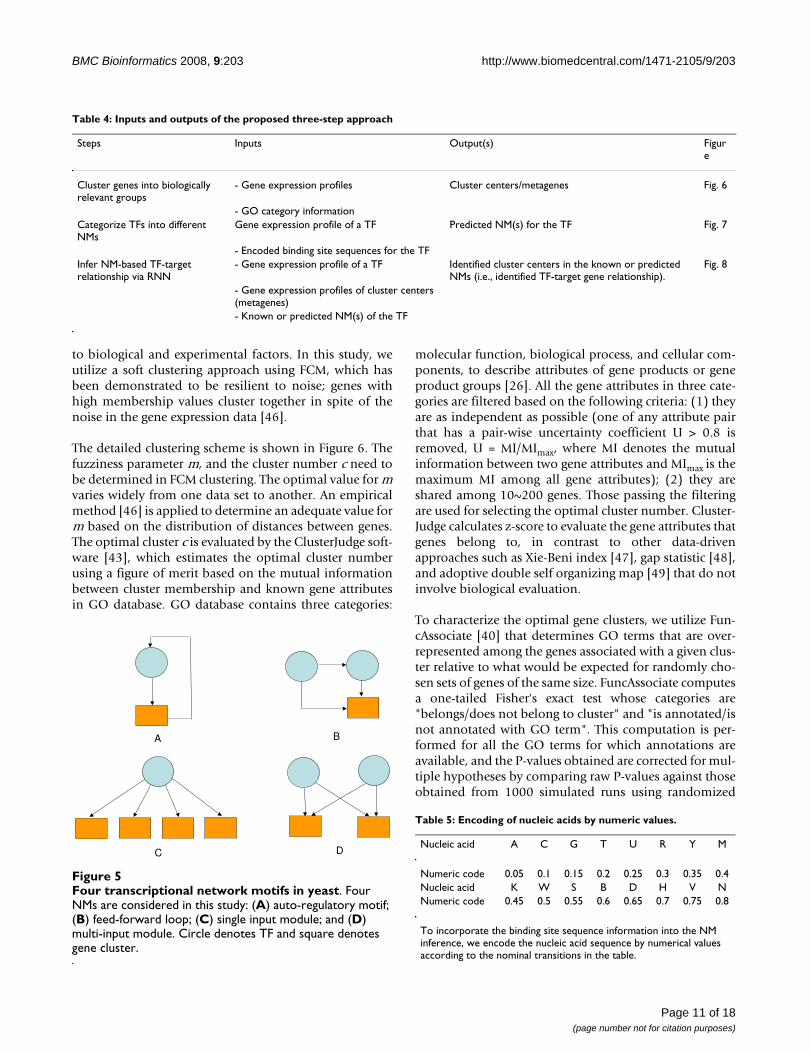
Table 4 summarizes the inputs and outputs of each stepinvolved in our proposed computational framework. Thesteps are elaborated in more details in the following sub-sections.
Data preprocessingFrom the time course gene expression data, 800 genes areidentified as being cell cycle-regulated based on an analy-sis that combines a Fourier algorithm and a correlationalgorithm [8]. These genes are functionally annotatedbased on information from GO. Missing values in the dataare imputed using K nearest neighbour (KNN) imputa-tion [42]. Following that, the expression profile of eachgene was standardized between 0 and 1.
Known NMs are extracted from location analysis data[15]. By specifying a threshold value (e.g. P-value < 0.001)that represents the confidence that a given factor binds tothe corresponding intergenic region, the location data canbe viewed as a combination of four NMs (Figure 5).Nucleic acids are encoded into numeric values (Table 5)so that the binding site sequence information derivedfrom TRANSFAC database can be used as input to SVMclassifiers for NM prediction. Although the numerical val-
Page 9 of 18(page number not for citation purposes)

BMC Bioinformatics 2008, 9:203 http://www.biomedcentral.com/1471-2105/9/203
ues assigned to nucleic acids do not carry any biologicalmeaning, they were used in our analysis for the purpose ofimplementing the SVM classifier.
Cluster genes into biologically relevant groupsWe use cluster analysis to assign genes into functionalgroups and use the resulting cluster nodes as metagenes.Clustering is a widely used technique in microarray data
analysis. An underlying assumption is that genes withsimilar expression profiles are more likely to have similarbiological functions [43]. Common clustering algorithmssuch as hierarchical clustering, k-means clustering, andself-organized maps have been used to analyze geneexpression data [9,44,45]. These are called hard clusteringbecause each gene is assigned to exactly one cluster.Microarray data involve substantial amount of noise due
The proposed computational frameworkFigure 4The proposed computational framework. The framework of the proposed method is composed of three parts. First, gene expression profiles are clustered into biologically meaningful groups by FCM; GO category information of genes is used to determine the optimal cluster number. To evaluate the gene clusters, gene set enrichment analysis (GSEA) is performed on the optimal clusters. This analysis revealed that 28 out of 34 optimal clusters were enriched in certain biological categories (P-value < 0.001) (Table 1). In NM assignment part, SVM classifiers are built to classify TFs into known NM categories. For a given TF, its time course gene expression profile and binding site sequences are used as inputs to SVM classifiers to predict its corre-sponding NM(s). Positive training data sets include TFs with known NMs from location data analysis. Negative training data sets include TFs randomly chosen from TF pools (same size as positive ones). After the gene clusters are formed and TFs are assigned to NM categories, the relationships between TFs and gene clusters are inferred by training recurrent neural networks (RNNs) that mimic the topologies of the NMs that TFs are assigned to. Since the NM inference only includes small number of TFs and gene clusters, the computational complexity is reduced compared to the global TRN inference problem (inferring TRN on gene level by including all genes in one data set). Finally, the inferred TF-target gene relationships are validated by BSEA and literature results.
Preprocess expression data and select genesPreprocess data
Time-Course Gene Expression
Design an SVM Classifier
Binding Site Sequences
Encode bindingsite sequences
Assign TFs to known network motifs or predicted by SVM
Determine network motifs for TFs
Genome-Wide Location Analysis
Assign gene clusters to biological functions
Gene Ontology
Cluster genes using FCMand GO information
Determine optimal RNN parameters
Cluster genes
Construct network motifs
Assign network motifs to TFs
Hypotheses & validation of inferred regulatory modules
Generate candidate gene clusters using GA
Stopping criteria met?
No
Select a TF with assigned network motif
All TFstested?
No
Yes
Yes
Select an RNN structure
Page 10 of 18(page number not for citation purposes)
BMC Bioinformatics 2008, 9:203 http://www.biomedcentral.com/1471-2105/9/203
to biological and experimental factors. In this study, weutilize a soft clustering approach using FCM, which hasbeen demonstrated to be resilient to noise; genes withhigh membership values cluster together in spite of thenoise in the gene expression data [46].
The detailed clustering scheme is shown in Figure 6. Thefuzziness parameter m, and the cluster number c need tobe determined in FCM clustering. The optimal value for mvaries widely from one data set to another. An empiricalmethod [46] is applied to determine an adequate value form based on the distribution of distances between genes.The optimal cluster c is evaluated by the ClusterJudge soft-ware [43], which estimates the optimal cluster numberusing a figure of merit based on the mutual informationbetween cluster membership and known gene attributesin GO database. GO database contains three categories:
molecular function, biological process, and cellular com-ponents, to describe attributes of gene products or geneproduct groups [26]. All the gene attributes in three cate-gories are filtered based on the following criteria: (1) theyare as independent as possible (one of any attribute pairthat has a pair-wise uncertainty coefficient U > 0.8 isremoved, U = MI/MImax, where MI denotes the mutualinformation between two gene attributes and MImax is themaximum MI among all gene attributes); (2) they areshared among 10~200 genes. Those passing the filteringare used for selecting the optimal cluster number. Cluster-Judge calculates z-score to evaluate the gene attributes thatgenes belong to, in contrast to other data-drivenapproaches such as Xie-Beni index [47], gap statistic [48],and adoptive double self organizing map [49] that do notinvolve biological evaluation.
To characterize the optimal gene clusters, we utilize Fun-cAssociate [40] that determines GO terms that are over-represented among the genes associated with a given clus-ter relative to what would be expected for randomly cho-sen sets of genes of the same size. FuncAssociate computesa one-tailed Fisher's exact test whose categories are"belongs/does not belong to cluster" and "is annotated/isnot annotated with GO term". This computation is per-formed for all the GO terms for which annotations areavailable, and the P-values obtained are corrected for mul-tiple hypotheses by comparing raw P-values against thoseobtained from 1000 simulated runs using randomized
Table 5: Encoding of nucleic acids by numeric values.
Nucleic acid A C G T U R Y M
Numeric code 0.05 0.1 0.15 0.2 0.25 0.3 0.35 0.4Nucleic acid K W S B D H V NNumeric code 0.45 0.5 0.55 0.6 0.65 0.7 0.75 0.8
To incorporate the binding site sequence information into the NM inference, we encode the nucleic acid sequence by numerical values according to the nominal transitions in the table.
Table 4: Inputs and outputs of the proposed three-step approach
Steps Inputs Output(s) Figure
Cluster genes into biologically relevant groups
- Gene expression profiles Cluster centers/metagenes Fig. 6
- GO category informationCategorize TFs into different NMs
Gene expression profile of a TF Predicted NM(s) for the TF Fig. 7
- Encoded binding site sequences for the TFInfer NM-based TF-target relationship via RNN
- Gene expression profile of a TF Identified cluster centers in the known or predicted NMs (i.e., identified TF-target gene relationship).
Fig. 8
- Gene expression profiles of cluster centers (metagenes)- Known or predicted NM(s) of the TF
Four transcriptional network motifs in yeastFigure 5Four transcriptional network motifs in yeast. Four NMs are considered in this study: (A) auto-regulatory motif; (B) feed-forward loop; (C) single input module; and (D) multi-input module. Circle denotes TF and square denotes gene cluster.
A
DC
B
Page 11 of 18(page number not for citation purposes)
BMC Bioinformatics 2008, 9:203 http://www.biomedcentral.com/1471-2105/9/203
queries (resampling), as described in detail in Berriz et al.[40]. The definition of the 'universe' of all genes used byFuncAssociate corresponds to the set of all genes used inFCM clustering. Once the cluster analysis is completed, aset of genes in a cluster is considered as a metagene in thesubsequent analyses.
Categorize TFs into different NMsSince GO has the most detailed gene annotation, we firstsearch for genes with GO functional annotation termsrelated to transcription such as "transcriptional regulatoractivity", "DNA binding", etc. These genes are treated aspotential TFs and also verified by comparison with theTRANSFAC database. The TF list in TRANSFAC only con-tains known TFs. The detailed annotation of GO providesa larger list containing not only the confirmed but also thepotential TFs. These TFs are assigned to different kinds ofmotifs by their characteristic of regulation functions. Thisis based on the assumption that some TFs play crucialroles in some specific motifs. Unlike to most previousTRN inference approaches, where a single large network issought, our method focuses on inferring target clustergene(s) regulated by a particular TF. This is accomplishedby assigning likely NM(s) to each TF based on prior bio-logical knowledge collected from literatures that report onresults from traditional experiments or large-scalegenomic location analysis data [15].
Since only a fraction of TFs have known NMs, we buildSVMs to map the relationship among a gene expressionprofile of a TF, its binding site sequence data, and itsNM(s). The nucleic acids in the binding site sequence dataare encoded into numeric values (Table 5) before present-ing them to the SVM classifiers. Figures 7A and 7B depictthe SVM training and operation phases, respectively. Inthe training phase, a data set that consists of expressionprofile and binding site sequences is constructed for eachclassifier. The data set has positives (TFs with knownNMs) and negatives (TFs to which randomly chosen NMsare assigned) with equal proportions. This data set is usedto train the SVM classifiers. The classifiers are evaluatedthrough the LOOCV approach to estimate their predictionerrors. In the operation phase, the expression profile andthe binding site sequence of a TF with unknown NMassignments are used as inputs to the trained SVM classifi-ers to predict the NM(s) for the TF. The figures show fourNM modules that are used in this study (auto regulation,feed-forward, single input, and multi-input). Since a TFcan be assigned to more than one NM, a binary SVM thatcan handle only two cases is not sufficient. Thus, as illus-trated in figures, we use multiple binary SVM classifiers,each responsible for one NM. Each SVM is trained todetermine whether a TF can be assigned to the NM. Weinput the expression profile and binding site sequenceinto each of the four trained SVM classifiers to obtain a yes
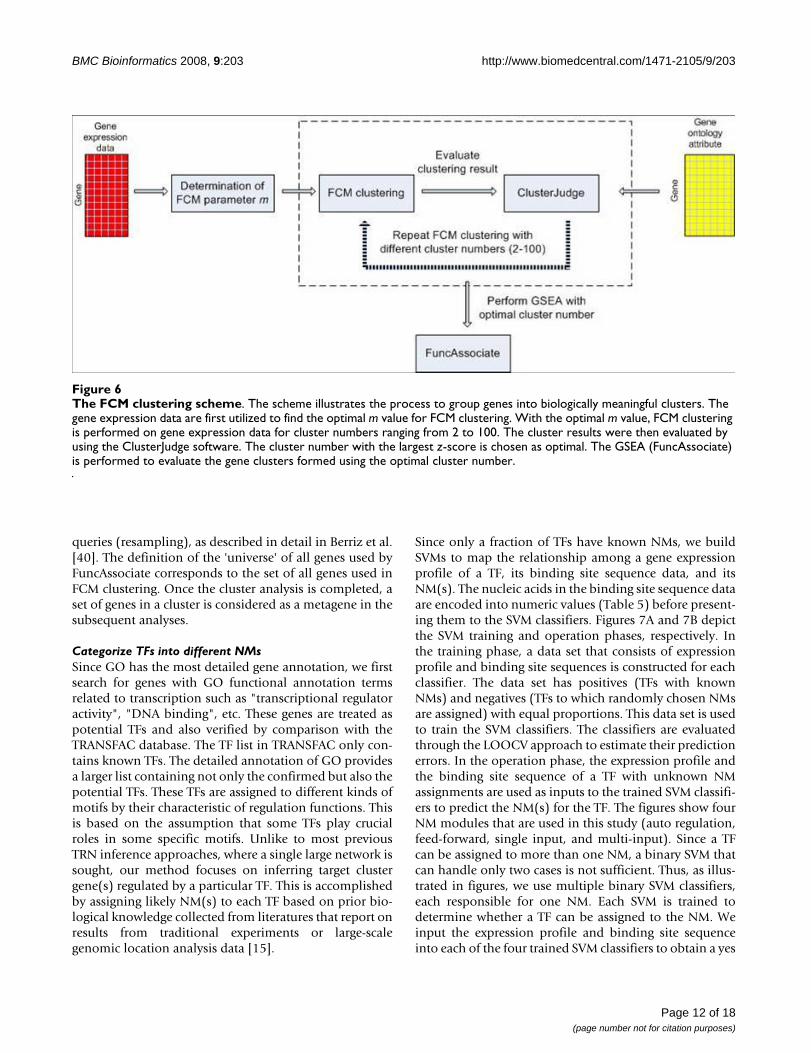
The FCM clustering schemeFigure 6The FCM clustering scheme. The scheme illustrates the process to group genes into biologically meaningful clusters. The gene expression data are first utilized to find the optimal m value for FCM clustering. With the optimal m value, FCM clustering is performed on gene expression data for cluster numbers ranging from 2 to 100. The cluster results were then evaluated by using the ClusterJudge software. The cluster number with the largest z-score is chosen as optimal. The GSEA (FuncAssociate) is performed to evaluate the gene clusters formed using the optimal cluster number.
Page 12 of 18(page number not for citation purposes)

BMC Bioinformatics 2008, 9:203 http://www.biomedcentral.com/1471-2105/9/203
or no answer. The classifiers are evaluated using LOOCV.We outline below the steps involved:
1. Assemble positive set from genome-wide location data.Sample n TFs randomly from the whole TF set to constructthe negative set (n = number of TFs in positive set).
2. Leave the first TF out as a test TF; the remaining TFsserve as a training set.
3. Build SVM classifiers using the training set.
4. Use trained SVM classifiers to determine the NM(s) forthe TF left out in Step 2.
SVM classifiers that predict the network motif for a TF on the basis of its binding site sequence and its time course gene expression profileFigure 7SVM classifiers that predict the network motif for a TF on the basis of its binding site sequence and its time course gene expression profile. The figure shows the scheme for classifying TFs into four NMs. Since one TF can be assigned to more than one NM, one SVM classifier is built for each NM assignment (four classifiers in the SVM classifier block). We illuatrate the process in: (A) training phase, where the TFs with known NMs are used to train SVM classifiers, (B) opera-tion phase, where unknown NMs are predicted by the trained SVM classifiers based on expression profile and binding site of a TF. In the training phase (A), a data set that consists of expression profile and binding site sequences is constructed for each classifier. The data set has positives (TFs with known NMs), and negatives are TFs to which randomly chosen NMs are assigned (equal in size to the positive set). The data set is used to suit the SVM classifiers. The classifiers are evaluated through the LOOCV approach (dashed box) to estimate their prediction errors. In the operation phase (B), the expression profile and binding site of a TF with unknown NM assignments are used as inputs to the SVM classifiers trained in (A). The classifiers pre-dict the NM(s) for the TF.
A
B
Page 13 of 18(page number not for citation purposes)

BMC Bioinformatics 2008, 9:203 http://www.biomedcentral.com/1471-2105/9/203
5. Replace the left out TF and leave the next TF out as a testTF.
6. Repeat Steps 3–5 until each TF is used as a test TF.
7. Summarize the prediction error for the left out TFs.
8. Repeat steps 1–7 100 times.
9. Calculate the mean of the predicted error in 100 runs.
The final SVM classifiers are trained by using all TFs withknown NMs as a positive set and an equal number of ran-domly selected TFs as a negative set. The NM(s) for a TFwith unknown NM(s) is determined using these classifi-ers.
Infer NM-based TF-target relationship via RNNAfter deciding the NM(s) for all TFs, we construct a modelof the NM for each TF via a RNN, whose topology mimicsthe NM that the TF is known or predicted to exhibit. Dueto its capability to capture the nonlinear properties anddynamic relationships, RNNs have been previouslyapplied for GRN inference [33,50,51]. For each of the fourNMs in Figure 5, a suitable RNN can be built (Figure 8).As shown in Figure 8C, each RNN has an architectural lay-out that mimics the corresponding NM. The rationale forusing RNNs to model gene NMs emanates from their abil-ity to learn from data and to simulate gene regulationthrough the formulation shown in Eq. (1) [52,53]:
where xi is the gene expression level of the ith gene (1 ≤ i≤ N, N is the number of genes in the model), φ(.) is a acti-vation function introduces nonlinearity to the model (e.g.sigmoid function), wijrepresents the effect of jth gene onthe ith gene, bi denotes the bias for the ith term, and τ isthe decay rate parameter. A negative value of wij representsthe inhibition of the jth gene on the ith gene, whereas apositive value of wij represents the activation control of thejth gene on the ith gene. If wij is zero, then it means that jthgene has no influence on the ith gene.
The discrete form of Eq. (1) can written as
Figures 8A and 8B show the architecture of a RNN that cansimulate the mathematical relationship in Eq. (2). Asillustrated in Figures 8A and 8B, the output of each neu-ron is fed back to its input after a unit delay and is con-nected to other neurons [51]. It can be used as a simpleform of a NM, where each entity (e.g. TF or gene cluster)in the network is considered as a neuron. The RNN canmodel not only the interactions between entities but alsoentity self-regulation. In this study, we consider four RNNmodels (Figure 8C), each of which has an architecturallayout that mimics the corresponding NM in Figure 5.
Training the RNNs involves determining the optimalweights wij and bias bi. As a cost function, we use the RMSEbetween the expected output and the network outputacross time (from the initial time point 0 to the final timepoint T) and across neurons in the network. The cost func-tion can be written as:
where xi(t) and are the true and predicted values
(expression levels) for the ith neuron (entity) at time t.The goal is to determine the structure and weights of aRNN that minimize this cost function.
A hybrid of GA and PSO methods (GA-PSO) is applied todetermine the gene clusters that may be regulated by eachTF. GA generates candidate gene clusters, while the PSOalgorithm determines the parameters of a given RNN rep-
resented by a weight vector . The RMSE between theRNN output and the measured expression profile isreturned to GA as a fitness function and to guide the selec-tion of target genes through reproduction, cross-over, andmutation over hundreds of generations. The stopping cri-teria are pre-specified minimum RMSE and maximumnumber of generations. The GA-PSO algorithm is run foreach TF to train a RNN that has the architecture mimick-ing the known NM(s) for the TF or the NM(s) predicted bythe SVMs. Thus, f or a given TF (input), the following stepsare carried out to identify its likely downstream gene clus-ters (output) based on known or predicted NM(s):
1. Assign the NM to the TF it belongs to. If the NM isunknown, use SVM to predict the NM(s).
2. Use the following GA-PSO algorithm to build a RNNmodel that mimics the NM to identify the downstreamgene clusters.
dxi tdt
x t w x t bi ij j i
j
N( )
( ) ( )= − + +⎛
⎝
⎜⎜
⎞
⎠
⎟⎟
=∑t j
1
(1)
x t t t x t t w x t bi i ij j i
j
N
( ) ( ) ( ) ( )+ = − + +⎛
⎝
⎜⎜
⎞
⎠
⎟⎟
=∑Δ Δ Δ1
1
t j
(2)
E wTN
x t x ti i
i
N
t
T
( ) ( ) ( )r
= −⎡⎣ ⎤⎦==∑∑1 2
10
(3)
ˆ ( )x ti
rw
Page 14 of 18(page number not for citation purposes)

BMC Bioinformatics 2008, 9:203 http://www.biomedcentral.com/1471-2105/9/203
Page 15 of 18(page number not for citation purposes)
The RNN models for NMsFigure 8The RNN models for NMs. A: RNN model, where the output of each neuron is fed back to its input after a unit delay and is connected to other neurons. B: Details of a single recurrent neuron. C: RNN models mimicking the topologies of the four NMs shown in Figure 5. Z-1 denotes a unit delay and Φ(.) is a logistic sigmoid activation function.

BMC Bioinformatics 2008, 9:203 http://www.biomedcentral.com/1471-2105/9/203
2.1. Generate combinations of M gene clusters to repre-sent the target genes that may be regulated by the TF. Eachcombination is a vector/chromosome. The initial set ofcombinations is composed of the initial population ofchromosomes.
2.2. Use the PSO algorithm to train a RNN model for eachchromosome, where the input is the TF and the outputsare gene clusters. The goal is to determine the optimizedparameters of the RNN that maps the measured expres-sion profiles of the TF to the gene clusters.
2.3. For each chromosome, calculate the RMSE betweenthe predicted output of the RNN and measured expressionprofiles for the target gene clusters.
2.4. Apply GA operators (reproduction, cross-over, muta-tion) based on the RMSE calculated in Step 2.3 as a fitnessvalue. This will generate new vectors/chromosomes alter-ing the choice of output gene cluster combinations.
2.5. Repeat steps 2.1 – 2.4 until stop criteria are met. Thestopping criteria are numbers of generations or minimumRMSE, depending on which one is met first.
2.6. Repeat Steps 2.1 – 2.5 for each NM the TF is assignedto.
3. Repeat Steps 1 and 2 for each TF.
When the process is completed, regulatory NMs are con-structed between TFs and their regulated gene clusters.
We used the OSU SVM Support Vector Machine Toolbox[54] for implementation of SVMs. The Genetic Algorithmand Direct Search Toolbox (Mathworks, Natick, MA) andthe PSOt Toolbox [55] were utilized for implementationof GA and PSO, respectively. The parameter settings of GAand PSO are shown in Table 6.
List of abbreviationsTranscriptional regulatory network: TRN; network motif:NM; transcription factor: TF; fuzzy c-means: FCM; gene setenrichment analysis: GSEA; binding site enrichment anal-
ysis: BSEA; support vector machine: SVM; leave-one-outcross-validation: LOOCV; recurrent neural network: RNN;genetic algorithm: GA; particle swarm optimization: PSO;gene ontology: GO; root mean squared error: RMSE; feed-forward loop: FFL; transcription factor binding site: TFBS;transcriptional start site: TSS.
Authors' contributionsYZ and HWR designed the computational approach,wrote the code, analyzed the experimental results anddrafted the manuscript. All authors read and approved thefinal manuscript.
Additional material
Additional file 1Gene clusters obtained by using the FCM clustering algorithm. The data provided present the cluster membership for each of the 800 genes consid-ered in this study.Click here for file[http://www.biomedcentral.com/content/supplementary/1471-2105-9-203-S1.pdf]
Additional file 2Potential TFs among yeast cell cycle related genes. The data provided present TFs we identified from 800 cell cycle related genes based on their GO annotations. The genes annotated with terms related to transcription activities and DNA binding are considered as potential TFs.Click here for file[http://www.biomedcentral.com/content/supplementary/1471-2105-9-203-S2.pdf]
Additional file 3Predicted motifs for gene clusters. The data provided present the top three enriched motifs for each gene cluster identified in this study. The motifs are predicted through promoter sequence analysis of the gene clusters using WebMOTIFS http://fraenkel.mit.edu/webmotifs/. This information helps in the validation of the NM prediction results. For example, the pre-dicted downstream gene clusters of FKH1 all have a motif called Fork_head, GTAAACAA, in their promoter regions. This suggests that our NM inference strategy has the capability to identify the downstream target genes for TFs based on their NM assignment. The motif is annotated in Pfam database http://pfam.sanger.ac.uk/.Click here for file[http://www.biomedcentral.com/content/supplementary/1471-2105-9-203-S3.pdf]
Table 6: GA and PSO parameter settings. The table presents the GA and PSO parameter settings used in this study.
PSO GA
Parameter Value Parameter Value
Search space range [-5,5] Crossover One pointAcceleration constants c1 2.05 Mutation rate 0.05, randomAcceleration constants c2 2.05 Selection Roulette Wheel
Size of swarm 50–150 Population size 50–150
Page 16 of 18(page number not for citation purposes)

BMC Bioinformatics 2008, 9:203 http://www.biomedcentral.com/1471-2105/9/203
References1. Bubitzky W, Granzow M, Berrar DP: Fundamentals of Data Min-
ing in Genomics and Proteomics. New York, Springer; 2007. 2. Wit E, McClure J: Statistics for Microarrays: Design, Analysis
and Inference. John Wiley & Sons; 2006. 3. Walhout AJ: Unraveling transcription regulatory networks by
protein-DNA and protein-protein interaction mapping.Genome Res 2006, 16(12):1445-1454.
4. Blais A, Dynlacht BD: Constructing transcriptional regulatorynetworks. Genes Dev 2005, 19(13):1499-1511.
5. Ren B, Robert F, Wyrick JJ, Aparicio O, Jennings EG, Simon I, Zeitlin-ger J, Schreiber J, Hannett N, Kanin E, Volkert TL, Wilson CJ, Bell SP,Young RA: Genome-wide location and function of DNA bind-ing proteins. Science 2000, 290(5500):2306-2309.
6. Hartemink AJ, Gifford DK, Jaakkola TS, Young RA: Combininglocation and expression data for principled discovery ofgenetic regulatory network models. Pac Symp Biocomput2002:437-449.
7. Simon I, Barnett J, Hannett N, Harbison CT, Rinaldi NJ, Volkert TL,Wyrick JJ, Zeitlinger J, Gifford DK, Jaakkola TS, Young RA: Serialregulation of transcriptional regulators in the yeast cellcycle. Cell 2001, 106(6):697-708.
8. Spellman PT, Sherlock G, Zhang MQ, Iyer VR, Anders K, Eisen MB,Brown PO, Botstein D, Futcher B: Comprehensive identificationof cell cycle-regulated genes of the yeast Saccharomyces cer-evisiae by microarray hybridization. Mol Biol Cell 1998,9(12):3273-3297.
9. Tavazoie S, Hughes JD, Campbell MJ, Cho RJ, Church GM: System-atic determination of genetic network architecture. NatGenet 1999, 22(3):281-285.
10. Holmes I, Bruno WJ: Evolutionary HMMs: a Bayesian approachto multiple alignment. Bioinformatics 2001, 17(9):803-820.
11. Segal E, Taskar B, Gasch A, Friedman N, Koller D: Rich probabilis-tic models for gene expression. Bioinformatics 2001, 17 Suppl1:S243-52.
12. Tuncay K, Ensman L, Sun J, Haidar AA, Stanley F, Trelinski M, Ortol-eva P: Transcriptional regulatory networks via gene ontologyand expression data. In Silico Biol 2007, 7(1):21-34.
13. Milo R, Itzkovitz S, Kashtan N, Levitt R, Shen-Orr S, Ayzenshtat I,Sheffer M, Alon U: Superfamilies of evolved and designed net-works. Science 2004, 303(5663):1538-1542.
14. Shen-Orr SS, Milo R, Mangan S, Alon U: Network motifs in thetranscriptional regulation network of Escherichia coli. NatGenet 2002, 31(1):64-68.
15. Lee TI, Rinaldi NJ, Robert F, Odom DT, Bar-Joseph Z, Gerber GK,Hannett NM, Harbison CT, Thompson CM, Simon I, Zeitlinger J, Jen-nings EG, Murray HL, Gordon DB, Ren B, Wyrick JJ, Tagne JB, VolkertTL, Fraenkel E, Gifford DK, Young RA: Transcriptional regulatorynetworks in Saccharomyces cerevisiae. Science 2002,298(5594):799-804.
16. Odom DT, Zizlsperger N, Gordon DB, Bell GW, Rinaldi NJ, MurrayHL, Volkert TL, Schreiber J, Rolfe PA, Gifford DK, Fraenkel E, Bell GI,Young RA: Control of pancreas and liver gene expression byHNF transcription factors. Science 2004, 303(5662):1378-1381.
17. Boyer LA, Lee TI, Cole MF, Johnstone SE, Levine SS, Zucker JP, Guen-ther MG, Kumar RM, Murray HL, Jenner RG, Gifford DK, Melton DA,Jaenisch R, Young RA: Core transcriptional regulatory circuitryin human embryonic stem cells. Cell 2005, 122(6):947-956.
18. Swiers G, Patient R, Loose M: Genetic regulatory networks pro-gramming hematopoietic stem cells and erythroid lineagespecification. Dev Biol 2006, 294(2):525-540.
19. Mangan S, Alon U: Structure and function of the feed-forwardloop network motif. Proc Natl Acad Sci U S A 2003,100(21):11980-11985.
20. Mangan S, Zaslaver A, Alon U: The coherent feedforward loopserves as a sign-sensitive delay element in transcription net-works. J Mol Biol 2003, 334(2):197-204.
21. Milo R, Shen-Orr S, Itzkovitz S, Kashtan N, Chklovskii D, Alon U:Network motifs: simple building blocks of complex net-works. Science 2002, 298(5594):824-827.
22. Saddic LA, Huvermann B, Bezhani S, Su Y, Winter CM, Kwon CS, Col-lum RP, Wagner D: The LEAFY target LMI1 is a meristemidentity regulator and acts together with LEAFY to regulateexpression of CAULIFLOWER. Development 2006,133(9):1673-1682.
23. Iranfar N, Fuller D, Loomis WF: Transcriptional regulation ofpost-aggregation genes in Dictyostelium by a feed-forwardloop involving GBF and LagC. Dev Biol 2006, 290(2):460-469.
24. Alon U: Network motifs: theory and experimentalapproaches. Nat Rev Genet 2007, 8(6):450-461.
25. Matys V, Fricke E, Geffers R, Gossling E, Haubrock M, Hehl R, Hor-nischer K, Karas D, Kel AE, Kel-Margoulis OV, Kloos DU, Land S,Lewicki-Potapov B, Michael H, Munch R, Reuter I, Rotert S, Saxel H,Scheer M, Thiele S, Wingender E: TRANSFAC: transcriptionalregulation, from patterns to profiles. Nucleic Acids Res 2003,31(1):374-378.
26. Ashburner M, Ball CA, Blake JA, Botstein D, Butler H, Cherry JM,Davis AP, Dolinski K, Dwight SS, Eppig JT, Harris MA, Hill DP, Issel-Tarver L, Kasarskis A, Lewis S, Matese JC, Richardson JE, Ringwald M,Rubin GM, Sherlock G: Gene ontology: tool for the unificationof biology. The Gene Ontology Consortium. Nat Genet 2000,25(1):25-29.
27. Harbison CT, Gordon DB, Lee TI, Rinaldi NJ, Macisaac KD, DanfordTW, Hannett NM, Tagne JB, Reynolds DB, Yoo J, Jennings EG, Zei-tlinger J, Pokholok DK, Kellis M, Rolfe PA, Takusagawa KT, Lander ES,Gifford DK, Fraenkel E, Young RA: Transcriptional regulatorycode of a eukaryotic genome. Nature 2004, 431(7004):99-104.
28. Wingender E, Chen X, Fricke E, Geffers R, Hehl R, Liebich I, Krull M,Matys V, Michael H, Ohnhauser R, Pruss M, Schacherer F, Thiele S,Urbach S: The TRANSFAC system on gene expression regu-lation. Nucleic Acids Res 2001, 29(1):281-283.
29. Ressom HW, Zhang Y, Xuan J, Wang J, Clarke R: Inferring networkinteractions using recurrent neural networks and swarmintelligence. In Proceedings of the 28th IEEE Engineering in Medicineand Biology Society Annual International Conference, New York City, NYNew York City, NY , IEEE; 2006:4241-4244.
30. Cherry JM, Ball C, Weng S, Juvik G, Schmidt R, Adler C, Dunn B,Dwight S, Riles L, Mortimer RK, Botstein D: Genetic and physicalmaps of Saccharomyces cerevisiae. Nature 1997, 387(6632Suppl):67-73.
31. Bader GD, Betel D, Hogue CW: BIND: the Biomolecular Inter-action Network Database. Nucleic Acids Res 2003, 31(1):248-250.
32. Chiang JH, Chao SY: Modeling human cancer-related regula-tory modules by GA-RNN hybrid algorithms. BMC Bioinformat-ics 2007, 8:91.
33. Keedwell E, Narayanan A: Discovering gene networks with aneural-genetic hybrid. IEEE/ACM Trans Comput Biol Bioinform 2005,2(3):231-242.
34. Weaver DC, Workman CT, Stormo GD: Modeling regulatorynetworks with weight matrices. Pac Symp Biocomput1999:112-123.
35. Romer KA, Kayombya GR, Fraenkel E: WebMOTIFS: automateddiscovery, filtering and scoring of DNA sequence motifsusing multiple programs and Bayesian approaches. NucleicAcids Res 2007, 35(Web Server issue):W217-20.
36. Weigel D, Jackle H: The fork head domain: a novel DNA bind-ing motif of eukaryotic transcription factors? Cell 1990,63(3):455-456.
37. Friedman N, Linial M, Nachman I, Pe'er D: Using Bayesian net-works to analyze expression data. J Comput Biol 2000, 7:601-620.
38. Ressom H, Reynolds R, Varghese RS: Increasing the efficiency offuzzy logic-based gene expression data analysis. Physiol Genom-ics 2003, 13(2):107-117.
39. Yeung KY, Medvedovic M, Bumgarner RE: From co-expression toco-regulation: how many microarray experiments do weneed? Genome Biol 2004, 5(7):R48.
40. Berriz GF, King OD, Bryant B, Sander C, Roth FP: Characterizinggene sets with FuncAssociate. Bioinformatics 2003,19(18):2502-2504.
41. De Hoon MJ, Imoto S, Miyano S: Statistical analysis of a small setof time-ordered gene expression data using linear splines.Bioinformatics 2002, 18(11):1477-1485.
42. Troyanskaya O, Cantor M, Sherlock G, Brown P, Hastie T, TibshiraniR, Botstein D, Altman RB: Missing value estimation methods forDNA microarrays. Bioinformatics 2001, 17(6):520-525.
43. Gibbons FD, Roth FP: Judging the quality of gene expression-based clustering methods using gene annotation. Genome Res2002, 12(10):1574-1581.
44. Eisen MB, Spellman PT, Brown PO, Botstein D: Cluster analysisand display of genome-wide expression patterns. Proc NatlAcad Sci U S A 1998, 95(25):14863-14868.
Page 17 of 18(page number not for citation purposes)
http://www.ncbi.nlm.nih.gov/entrez/query.fcgi?cmd=Retrieve&db=PubMed&dopt=Abstract&list_uids=9843569
http://www.ncbi.nlm.nih.gov/entrez/query.fcgi?cmd=Retrieve&db=PubMed&dopt=Abstract&list_uids=9843569
http://www.ncbi.nlm.nih.gov/entrez/query.fcgi?cmd=Retrieve&db=PubMed&dopt=Abstract&list_uids=9843569
http://www.ncbi.nlm.nih.gov/entrez/query.fcgi?cmd=Retrieve&db=PubMed&dopt=Abstract&list_uids=9169866
http://www.ncbi.nlm.nih.gov/entrez/query.fcgi?cmd=Retrieve&db=PubMed&dopt=Abstract&list_uids=9169866
http://www.ncbi.nlm.nih.gov/entrez/query.fcgi?cmd=Retrieve&db=PubMed&dopt=Abstract&list_uids=2225060
http://www.ncbi.nlm.nih.gov/entrez/query.fcgi?cmd=Retrieve&db=PubMed&dopt=Abstract&list_uids=2225060
BMC Bioinformatics 2008, 9:203 http://www.biomedcentral.com/1471-2105/9/203
Publish with BioMed Central and every scientist can read your work free of charge
"BioMed Central will be the most significant development for disseminating the results of biomedical research in our lifetime."
Sir Paul Nurse, Cancer Research UK
Your research papers will be:
available free of charge to the entire biomedical community
peer reviewed and published immediately upon acceptance
cited in PubMed and archived on PubMed Central
yours — you keep the copyright
Submit your manuscript here:http://www.biomedcentral.com/info/publishing_adv.asp
BioMedcentral
45. Toronen P, Kolehmainen M, Wong G, Castren E: Analysis of geneexpression data using self-organizing maps. FEBS Lett 1999,451(2):142-146.
46. Dembele D, Kastner P: Fuzzy C-means method for clusteringmicroarray data. Bioinformatics 2003, 19(8):973-980.
47. Xie XL, Beni G: A Validity Measure for Fuzzy Clustering. IEEETransactions on Pattern Analysis and Machine Intelligence 1991,13(8):841-847.
48. Tibshirani R, Walther G, Hastie T: Estimating the number ofclusters in a data set via the gap statistic. J Royal Statist Soc B2001, 63:411-423.
49. Ressom H, Wang D, Natarajan P: Adaptive double self-organiz-ing maps for clustering gene expression profiles. Neural Netw2003, 16(5-6):633-640.
50. Ressom HW, Zhang Y, Xuan J, Wang Y, Clarke R: Inferring Net-work Interactions using Recurrent Neural Networks andSwarm Intelligence. Conf Proc IEEE Eng Med Biol Soc 2006,1:4241-4244.
51. Xu R, Wunsch DC: Gene regulatory networks inference withrecurrent neural network models: 31 July-4 Aug. 2005,1:286-291.
52. D'Haeseleer P, Wen X, Fuhrman S, Somogyi R: Linear modeling ofmRNA expression levels during CNS development andinjury. Pac Symp Biocomput 1999:41-52.
53. Wahde M, Hertz J: Modeling genetic regulatory dynamics inneural development. J Comput Biol 2001, 8(4):429-442.
54. Ma J, Zhao Y, Ahalt S: OSU SVM Classifier Matlab Toolbox.2002.
55. Birge B: PSOt - a particle swarm optimization toolbox for usewith Matlab. 2003:182-186.
Page 18 of 18(page number not for citation purposes)