High field BOLD response to forepaw stimulation in the mouse
Upload
independentCategory
view
1download
0
Negative Covariation between Task-related Responses in Alpha/Beta-Band Activity and BOLD in Human Sensorimotor Cortex: anEEG and fMRI Study of Motor Imagery and Movements
Han Yuan1, Tao Liu3, Rebecca Szarkowski1, Cristina Rios1, James Ashe2,3, and Bin He1,2,*1 Department of Biomedical Engineering, University of Minnesota2 Department of Neuroscience, University of Minnesota3 Brain Sciences Center, Veterans Affairs Medical Center, Minneapolis, MN
AbstractSimilar to the occipital alpha rhythm, electroencephalographic (EEG) signals in the alpha- and beta-frequency bands can be suppressed by movement or motor imagery and have thus been thought torepresent the “idling state” of the sensorimotor cortex. A negative correlation between spontaneousalpha EEG and blood-oxygen-level-dependent (BOLD) signals has been reported in combined EEGand fMRI (functional Magnetic Resonance Imaging) experiments when subjects stayed at the restingstate or alternated between the resting state and a task. However, the precise nature of the task-inducedalpha modulation remains elusive. It was not clear whether alpha/beta rhythm suppressions may co-vary with BOLD when conducting tasks involving varying activations of the cortex. Here, wequantified the task-evoked responses of BOLD and alpha/beta-band power of EEG directly in thecortical source domain, by using source imaging technology, and examined their covariation acrosstask conditions in a mixed block and event-related design. In this study, 13 subjects performed tasksof right hand, right foot or left hand movement and motor imagery when EEG and fMRI data wereseparately collected. Task-induced increase of BOLD signal and decrease of EEG amplitudes inalpha and beta bands were shown to be co-localized at the somatotopic sensorimotor cortex. At thecorresponding regions, the reciprocal changes of the two signals co-varied in the magnitudes acrossimagination and movement conditions. The spatial correspondence and negative covariation betweenthe two measurements was further shown to exist at somatotopic brain regions associated withdifferent body parts. These results suggest an inverse functional coupling between task-inducedchanges of BOLD and low-frequency EEG signals.
KeywordsEEG; BOLD; source imaging; desynchronization; spectral change
*Correspondence: Bin He, Ph.D., University of Minnesota, Department of Biomedical Engineering, 7-105 NHH, 312 Church Street, SE,Minneapolis, MN 55455, USA, [email protected], Phone: 612-626-1115, Fax: 612-626-1114.Publisher's Disclaimer: This is a PDF file of an unedited manuscript that has been accepted for publication. As a service to our customerswe are providing this early version of the manuscript. The manuscript will undergo copyediting, typesetting, and review of the resultingproof before it is published in its final citable form. Please note that during the production process errors may be discovered which couldaffect the content, and all legal disclaimers that apply to the journal pertain.
NIH Public AccessAuthor ManuscriptNeuroimage. Author manuscript; available in PMC 2011 February 1.
Published in final edited form as:Neuroimage. 2010 February 1; 49(3): 2596. doi:10.1016/j.neuroimage.2009.10.028.
NIH
-PA Author Manuscript
NIH
-PA Author Manuscript
NIH
-PA Author Manuscript
IntroductionOscillatory activity has been a hallmark of human electroencephalographic (EEG) signals eversince Berger first reported a surge of scalp potential in the alpha (8 – 12 Hz) band when subjectsclosed their eyes (Berger, 1929). Such spontaneous oscillations can also be modulated bysensory, motor and cognitive tasks. A suppression of alpha and beta (13 – 30 Hz) activitydetected at the central region of the scalp has been shown to be associated with movementsand motor imagery (for review, see Pfurtscheller and Lopes da Silva, 1999). These task-relatedchanges measured by EEG or magnetoencephalography (MEG), have been interpreted to beinduced by the changes in synchrony of the underlying neuronal populations and are usuallytermed Event-related Desynchronization (ERD) or Event-related Synchronization (ERS)(Pfurtscheller and Lopes da Silva, 1999). However, the precise nature of the task-inducedchanges in neural oscillations is still poorly understood.
Combined EEG/MEG and fMRI (functional Magnetic Resonance Imaging) experiments havebeen conducted to investigate the physiological correlates of alpha activity (Fox et al., 2007;He and Liu, 2008). Through the neurovascular coupling, the blood-oxygen-level-dependent(BOLD)-fMRI signal is related to the composite neural activity with a complex organizationin time and frequency. A tight positive correlation between the BOLD signal and synapticactivity reflected in gamma-band (40 – 130 Hz) local field potentials (LFP) has been suggestedin simultaneously measured electrophysiological recordings and MR signals (Logothetis et al.,2001). On the contrary, an inverse correlation was demonstrated in a study that compared theLFP in low frequency bands (5 – 15 Hz) and the hemodynamic response to continuous auditorystimuli (Mukamel et al., 2005). Such negative correlation was corroborated in several studiescomparing the EEG alpha rhythm and simultaneously measured hemodynamic signals whensubjects closed their eyes and they demonstrated that the spontaneous modulations during theresting state were coupled (Goldman et al., 2002; Moosmann et al., 2003). A negativecorrelation of resting-state alpha activity with BOLD signals suggests that there may also bea negative correlation between task-induced responses of BOLD and EEG rhythm. In thisregard, similar correlation between the two modalities in a task-on-task-off manner wasobserved in the visual area (Feige et al., 2005) and the sensorimotor area (Ritter et al., 2009)when subjects alternated between the resting state and one task. It was suggested that alpharhythm and BOLD are a pair of antagonistic indicators for the neural activation, which can becombined as a very promising imaging approach for probing the brain function in high spatialand temporal resolution. However, the interpretation of the coupling was influenced by thefinding that the spontaneous fluctuations during the resting state and task-evoked activity inBOLD signals can be linearly superimposed (Fox et al., 2006). Therefore, it is possible that anegative correlation with resting-state signal could override the correlation with task-relatedchanges, if any.
These observations lead to an important question: are task-related changes in this pair ofantagonistic indicators co-varied when conducting multiple tasks involving varying levels ofactivations of the same cortex? Specifically, we are interested in EEG alpha/beta suppressionsand BOLD activations modulated by multiple tasks, which is different compared with previousstudy on resting conditions or alteration between resting conditions and one task. Given theirinverse temporal correlation, there are two hypothesized relationships across task levels: (1)one signal remains proportional to task intensity while the other varies only in an on-off fashion;(2) the two signals show co-varied, proportional changes. Recent EEG/MEG/fMRI studiesinvestigated the locations of alpha/beta decrease induced by cognitive (Singh et al., 2002) andmotor tasks (Babiloni et al., 1999; Taniguchi et al., 2000; Winterer et al., 2007). They showedthat movement-related EEG/MEG changes and BOLD increases overlapped spatially, whereasthere was no correlation in the variable magnitudes across subjects within one condition(Winterer et al., 2007). However, a recent study reported that in the areas of the default mode
Yuan et al. Page 2
Neuroimage. Author manuscript; available in PMC 2011 February 1.
NIH
-PA Author Manuscript
NIH
-PA Author Manuscript
NIH
-PA Author Manuscript
network, including the visual/occipital cortex, the BOLD modulation was associated withdifferent EEG-vigilance stages (Olbrich et al., 2009). In addition to the negative temporalcorrelation, decrease of BOLD signals was found to be related with increase of EEG alphapower when comparing the high vigilance stage with the low stage. This study suggested thelatter hypothesized coupling relationship - a negative covariance across conditions betweenEEG alpha power and BOLD; however, the EEG alpha power suppressions in the sensorimotorareas co-varying with different levels of neural activations as reflected by BOLD signals needto be directly evidenced.
In addition, current available calculations of temporal correlation among EEG and BOLDusually compare the BOLD time course with the convolution of a kernel function (e.g. a doublegamma function, Friston et al., 1998) and EEG power derived from one or a few electrodesplaced at the scalp. Regarding this approach, there are at least two questionable limitations: 1)how to choose convolution kernel functions, which are used to unify the temporal scales ofEEG (millisecond level) and BOLD signals (second level) and vary significantly due to manyreasons, particularly in the case of alpha rhythm; 2) how to choose temporal waveforms ofEEG to be convoluted with the kernel function since surface EEGs are possibly contributed bymany sources originating from different neural substrates. Although some studies haveimplemented different spatial or temporal de-convolution technologies (Ritter et al., 2009; deMunck et al., 2009), they are not able to fundamentally overcome these two limitations.Towards this end, there is a need to develop an approach co-registering the disparate spatialand temporal scales of EEG and BOLD when investigating their coupling relationship.
Here we propose to investigate the relationship between task-related changes in alpha/betaEEG and BOLD responses during motor imagery and movement. We developed a mixed blockand event-related design to facilitate the analysis of fMRI and EEG signals at different temporalscales. EEG and fMRI data were collected in separate sessions but under identical stimuli. Wethen employed source analysis in the frequency domain to compare the task-evoked changesin EEG with the BOLD responses in target cortical areas. In the present study, we addressedthe following questions:
1. Are task-related alpha/beta changes co-localized with BOLD responses?
2. If so, do alpha/beta changes co-vary with BOLD responses across task conditions?
3. If so, does the relationship exist at different cortical areas specific to different bodyparts?
Materials and MethodsSubjects
Thirteen healthy subjects (ages 19 – 45 years, 24.2 ±8.0 years, six males) participated in thestudy with written consent according to a protocol approved by the Institutional Review Boardof the University of Minnesota. Twelve subjects were right-handed and one subject wasambidextrous as measured by the Edinburgh Handedness Inventory (Oldfield, 1971).
Experimental DesignA mixed block and event-related design was developed to accommodate the EEG and fMRIrecordings, as shown in Fig. 1. The blocks of task conditions were interleaved with rest blocks.Each block lasted for 20 s. Within a task block, there were six events during which subjectsperformed the appropriate task for 2 s (imagination or movement execution) interleaved withinter-trial intervals of varying durations from 1 s to 2 s. The same tasks were performed withina block and the sequence of block types was randomized and balanced across runs and subjects.
Yuan et al. Page 3
Neuroimage. Author manuscript; available in PMC 2011 February 1.
NIH
-PA Author Manuscript
NIH
-PA Author Manuscript
NIH
-PA Author Manuscript
There were four motor imagery conditions (left hand, right hand, right foot and tongue) andfour conditions during which subjects performed the actual movements. Results regardingtongue imagination and movement were not significantly identified and thus not included here.Visual cues were presented to indicate the conditions of events. During the movementconditions (designated as Move Right, Move Left and Move Foot), subjects repeatedly fullyclenched their left or right hand or toes at a pace of 3 Hz. For the imagery conditions (designatedas Imagine Right, Imagine Left and Imagine Foot), subjects were instructed to imagine thatthey were clenching their left or right hand or toes at the same pace. A metronome beating at3 Hz was constantly active during the entire run to pace the movements and imaginations.Subjects kept their eyes open for all sessions.
In order to control the absence of movement during the imagination tasks, substantial trainingand monitoring were conducted for the EEG and fMRI recordings. For each subject, the EEGexperiments were performed before the fMRI sessions. In EEG sessions, subjects went throughsufficient training before data recording till they can appropriately perform the instructed tasks,while their movements were monitored by the online inspection of EMG signals and also visualinspection by researchers. In fMRI sessions, training was conducted again prior to subjectsentering the scanner.
Data AcquisitionEEG signals and fMRI images were collected during separate sessions. EEG activity wasrecorded from 62 electrodes positioned according to the international 10–20 system (BrainCap,Brain Products GmbH, Germany) when subjects sat in a comfortable armchair in an electricallyshielded room. The signals were referenced to a point at the vertex at position FCz and acquiredusing a BrainAmp MR amplifier (BrainProducts GmbH, Germany) with an analog 200 Hzlow-pass/0.1 Hz high-pass filter at a sampling frequency of 1000 Hz. The physical landmarks(nasion and left, right preauricular points) and electrode positions were digitized using aPolhemus Fastrak digitizer (Polhemus, Colchester, VT) and 3DSpace software from the SCANsoftware package (NeuroScan Labs, TX). Electromyogram (EMG) activity was also recordedin the EEG sessions to monitor muscle movement by a Synaps2 amplifier (NeuroScan Labs,TX) at a sampling frequency of 2000 Hz. Three pairs of bi-polar EMG channels were used tocapture the movements of left hand, right hand and right foot. The hand EMG channels wereplaced at the ventral side of each forearm approximately two inches from the wrist. And thefoot EMG channels were placed at the dorsal middle surface of the right foot approximatelythree inches from the roots of toes. For all three channels, bursts of EMG signals were clearlyidentified to be associated with each movement while no EMG bursts were present duringimagination periods.
Each individual anatomical MRI data set consisted of 176 contiguous sagittal slices with 1 mmslice thickness (matrix size: 256 * 256; FOV: 256 mm * 256 mm; TR/TE=20 ms/3.3 ms) on a3T MRI system (Siemens Trio, Siemens, Erlangen, Germany). Whole-brain functional imageswith BOLD contrast were acquired using gradient echo planar imaging sequence (32 axial 3-mm thick interleaved slices with 0.3-mm gap; TR/TE = 2000 ms/30 ms; flip angle = 90°; matrixsize: 64 * 64; FOV: 192 mm * 192 mm). Each functional run started with a rest block andcontained 330 volumes. Three runs were collected for each subject.
EEG AnalysisEEG recordings were band-pass filtered from 1 – 30 Hz using a zero-phase FIR filter andsegmented into epochs from −1 s to 2.5 s with respect to the onset of visual cues for tasks.Then, each epoch was baseline corrected and detrended. Epochs with eye movements werevisually identified and excluded from further analysis. The artifact-free signals were down-
Yuan et al. Page 4
Neuroimage. Author manuscript; available in PMC 2011 February 1.
NIH
-PA Author Manuscript
NIH
-PA Author Manuscript
NIH
-PA Author Manuscript
sampled to 200 Hz. The EMG recordings were high-pass filtered at 10 Hz, rectified, andsegmented along with the EEG signals.
The time-frequency representations (TFR) of single-trial EEG signals were calculated usingComplex Morlet’s wavelet. The EEG signal, x(t), was first convoluted by wavelets,
, with A = (σtπ1/2)−1/2, σt = 1/(2πσf), and σf = f/7. The trade-off ratio (f/σf) was chosen as 7 to create a wavelet family (Tallon-Baudry et al., 1997; Qin etal., 2004). For each time t and frequency f, the power of the EEG signal, P(t,f), is the squarednorm of the convolution: P(t, f)=|ω(t, f)*x(t)|2. The normalized time-varying power of EEGwas computed for visualization. It was characterized in t statistic by contrasting the power ateach time-frequency pair to the power at the same frequency before the task (from −150 ms to−50 ms) using an unpaired t test. The group time-frequency changes of all subjects wascalculated using a random-effect model (one-sample Student’s t-test) and thresholded withp<0.05 (|t|>2.18), as illustrated in Fig. 2. The group TFR plots were used to identify the timeand frequency windows for the source analysis explained below. The task period was selectedto be from 0.3 s to 1.9 s with respect to the onset of the event, during which steady decreasewas observed in the group time-frequency changes. Meanwhile, the baseline period was from−1 s to −0.1 s, during which little change was present. In addition to the time-frequency plots,the scalp topology of relative changes between task and baseline were also visualized. Thetime-varying power from the wavelet analysis was averaged in the alpha or beta frequencybands, and averaged in the time windows of task and baseline periods, respectively. The relativechanges induced by tasks, i.e. the power difference between task and baseline conditions andnormalized by the baseline power, were plotted according to their channel locations over thescalp.
The EEG source power was calculated using the Minimum Norm Estimate in FrequencyDomain method (Yuan et al., 2008). The EEG sources were modeled as many dipolesdistributed on the cortical surface and oriented perpendicular to the surface, as shown in thefollowing linear equation:
(1)
where Φ is a matrix of the measured EEG, S is the unknown matrix of amplitudes of the dipoles,and N is the additive noise. A is the transfer matrix, which relates between dipole sources andscalp potentials. The cortical surface reconstructed from individual subject’s MRIs was usedto restrict the source locations and orientations (Dale and Sereno, 1993). The minimum-normestimate of sources, S′, was obtained by applying a linear operator to the EEG measurements,using the following equation:
(2)
and
(3)
where SNR is the signal to noise ratio, C and R are covariance matrices of the noise and sources,respectively (Yuan et al., 2008). In order to estimate the sources in the alpha and beta frequencybands, single-trial EEG epochs were first converted into the frequency domain using Fourier
Yuan et al. Page 5
Neuroimage. Author manuscript; available in PMC 2011 February 1.
NIH
-PA Author Manuscript
NIH
-PA Author Manuscript
NIH
-PA Author Manuscript
transformation. The real and imaginary parts were subjected to source estimation. The sourcepower was obtained by selectively summing up the estimates in the frequency bins of thetargeted bands. After the source estimates for task and baseline periods were separatelycalculated, we compared the distributions of source power for each task condition with thepooled baseline conditions. The task-related spectral changes of EEG source activity werequantified as the event-related increase or decrease relative to the baseline (i.e. the powerdifference between task and baseline conditions) and normalized by the baseline power.
All dipoles from each individual were then projected onto a reference brain by aligning eachsubject’s sulcal-gyral patterns using BrainVoyager QX (Fischl et al., 1999; Goebel et al.,2006; Brain Innovation, Maastricht). The spectral changes were used to make a random-effectstatistical map (one-sample Student’s t-test) of the differential neural activity on the corticalsurface. The group average maps were thresholded by p < 0.001 (|t| > 4.32, p uncorrected formultiple-comparison) for both imagery and movement.
fMRI AnalysisMRI data were analyzed using BrainVoyager (Brain Innovation, Maastricht). EPI images werecoregistered with T1 anatomy and then transformed into the Talairach space. The preprocessingof functional data included motion correction, slice time correction, spatial smoothing using aGaussian kernel of FWHM = 6 mm and temporal high pass filtering. The signal time courseof each subject was modeled with a boxcar function convolved with a double-gammahemodynamic response function (Friston et al., 1998). Independent regressors were set fordifferent task conditions. The individual task-related activity was evaluated using a generallinear model (GLM) (Friston et al., 1995). The resulting set of voxel values for each comparisonconstituted the map of beta weight of each regressor (task vs. baseline) and the statisticalsignificance associated with each regressor. The magnitudes of beta values were proportionalto the signal change between activation and baseline, which represented the magnitude of theBOLD response. GLM group-level analysis (random effect analysis, one-sample Student’s t-test)) was performed based on the beta values from individual analysis. t statistic maps werethresholded by p < 0.001 (p uncorrected for multiple-comparison).
Region of Interest AnalysisRegion of Interest (ROI) analysis was performed to investigate the cross-modal relationshipbetween the EEG and fMRI responses across two experimental conditions (imagination andmovement) and across subjects. Anatomical masks were created according to the Talairachatlas database (Lancaster et al., 2000), including the precentral, postcentral, and paracentralgyrus, all of which were shown to be activated by imagination and movement (Ehrsson et al.,2003). ROIs for imagination or movement of each body part were created based on thethresholded group maps of EEG and fMRI (task vs. baseline, p<0.001) that intersected withthe anatomical masks. From the defined ROIs, the mean and individual percentage changes ofEEG in alpha/beta band and the beta values of the GLM analysis were extracted (all p<0.05,after small-volume correction for multiple-comparison). For each subject, the EEG percentageswere normalized by the maximum absolute change across all conditions. The BOLD betavalues were normalized similarly as well. The normalized quantities associated withimagination and movement of the same body part was pooled and linear regression wasconducted to assess the relation between EEG and BOLD responses. Separate regressionanalysis was performed for different EEG bands and at different areas specific to the bodyparts.
Yuan et al. Page 6
Neuroimage. Author manuscript; available in PMC 2011 February 1.
NIH
-PA Author Manuscript
NIH
-PA Author Manuscript
NIH
-PA Author Manuscript
ResultsThe experimental paradigm and analysis stream were illustrated in Fig. 1. EEG and fMRI datawere separately collected in the same group of subjects using the same paradigm. The task-induced changes of EEG and BOLD signals were quantified as relative change and beta valuesrespectively and later compared to examine their covariation relations. An example of single-trial EEG traces was included in Fig. 1. The traces after filtering from 8 Hz to 12 Hz were alsoshown, demonstrating a profile of decreasing power accompanying the task period. Such time-varying change was visualized by time-frequency representations in Fig. 2(A–C). For trials ofimagination tasks, the EMG during task period (0.3 s ~ 1.9 s) were compared to the EMGbaseline activity (−1 s ~ −0.1 s). For all subjects, no significant EMG activities were detectedduring the imagination (all p>0.05, paired Student’s t test). Significant EMG activities werepresent corresponding to the tasks of movement.
Spatial Correspondence between EEG Power and fMRI BOLD ChangesFig. 2(A–C) shows the event-related spectral changes of EEG signals recorded from the C3,C4, and Cz electrode over the central region of the brain using wavelet analysis. A steadychange was found from 0.3 s to 1.9 s during the task period and the source power was estimatedfrom this window. Meanwhile, the baseline was selected from −1 s to −0.1 s. The scalpdistributions of relative change in the beta frequency band were shown in Fig. 2(D). For leftor right hand task, the electrodes contralateral to the task side show a dominant suppression ofpower in the alpha (8 Hz – 12 Hz) and beta (13 Hz – 28 Hz) bands during the imagery andmovement conditions. There was a significant decrease in alpha and beta power at the ipsilateralelectrode during movement as well, but of a smaller magnitude compared to the contralateralelectrode. For the foot task, a decrease was mainly observed at the Cz electrode accompanyingboth imagination and movement. The topological difference between tasks associated withleft, right hand, and foot can be mainly observed at C3, C4 and Cz electrodes. Similar topologyof EEG changes in the alpha band was included as Fig. 3 in the supplemental materials. Nosignificant alpha change was found for the task of foot imagination.
Fig. 3(A–F) shows the task-related BOLD changes as well as EEG source changes in alphaand beta bands displayed on an inflated cortical surface for the imagination and movement ofright hand. The decreases in EEG alpha and beta bands were depicted over the contralateralsensorimotor areas across the central sulcus. A more focused increase in BOLD was co-localized at the contralateral sensorimotor area around the motor-hand area (Yousry et al.,1997). For the maps of EEG changes during right hand movement, ipsilateral decrease wasfound at the approximately mirrored sensorimotor areas.
Similarly, for the imagination and movement of right foot, the areas with decrease of EEG betaactivity largely overlapped with those with BOLD increase at the medial part of primarysensorimotor cortex (Fig 4, A–D). The changes of EEG alpha activity during movement ofright foot were shown in Supplemental Fig. 3 (A–B), with decrease of alpha and increase ofBOLD at the medial sensorimotor cortex. No significant changes in EEG alpha activity wasidentified at the threshold of p<0.001 (|t| > 4.32, uncorrected) or p<0.05 (|t| > 2.18, uncorrected).
The EEG and BOLD maps for imagination and movement of left hand were shown inSupplemental Fig. 1. Bilateral ERDs in the alpha and beta frequency bands were observedduring the left hand movement. During the imagination of left hand, a dominant contralateraldecrease of EEG alpha or beta activity was also found at the sensorimotor area. However, nosignificant activation of BOLD was identified for the imagination of left hand at thecorresponding area at the threshold of p<0.001 (uncorrected). But at the threshold of p<0.05(uncorrected), an overlapping but smaller region was identified in the BOLD map than the area
Yuan et al. Page 7
Neuroimage. Author manuscript; available in PMC 2011 February 1.
NIH
-PA Author Manuscript
NIH
-PA Author Manuscript
NIH
-PA Author Manuscript
of EEG change. The ipsilateral ERD induced by left-hand imagination was found only presentin the beta frequency band but not in the alpha band.
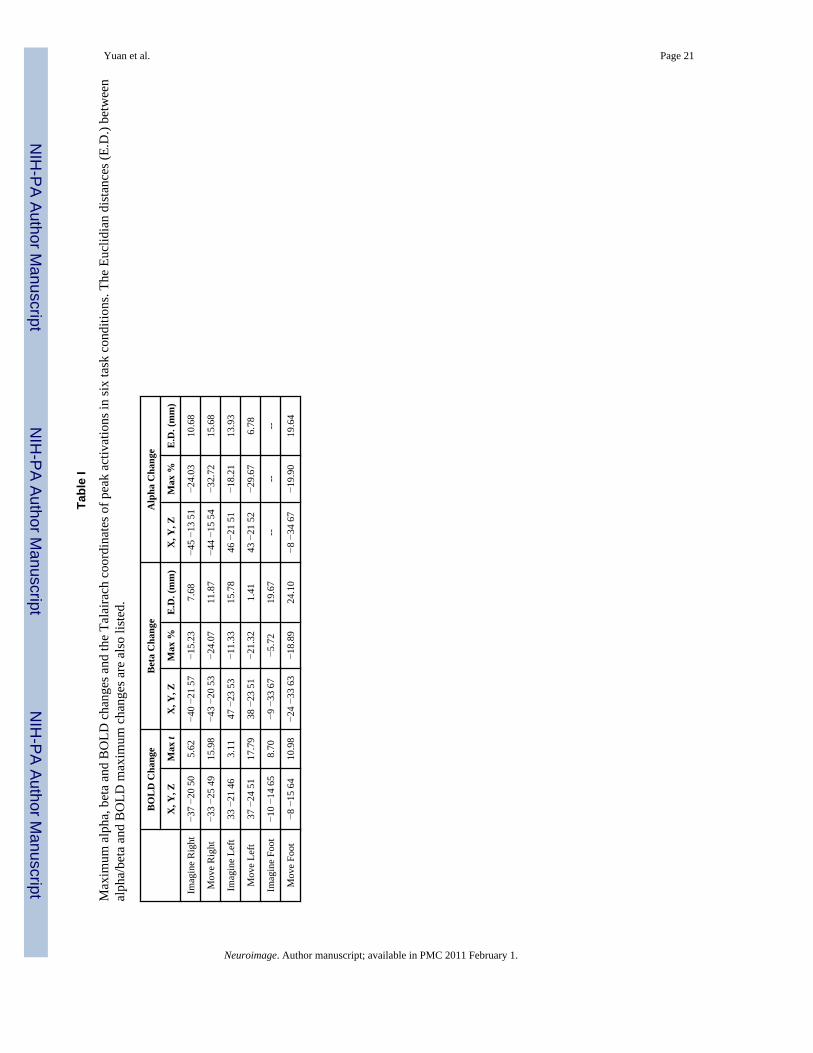
The peak locations of EEG alpha, beta and BOLD changes are shown in Fig. 6. The maximumchanges and corresponding coordinates are listed in Table-1. The peaks of BOLD, EEG alphaand beta changes were all located close to the central sulcus. The BOLD peaks for imaginationwere more anterior than those associated with movements. The average distances betweenalpha/beta changes and BOLD changes were 13.26±4.76 mm/13.33±8.15 mm for imaginationand movement, respectively. Tables of all activated regions identified from EEG and fMRImaps were listed in the supplemental materials, including the supplemental motor area (SMA).
Negative Covariation between EEG Power and fMRI BOLD ChangesFig. 3(G–H) shows the relationship between EEG alpha/beta changes and BOLD changes fromthe contralateral ROI defined from thresholded group-maps during imagination and movementof right hand. A negative covariation relationship between EEG and BOLD changes was foundusing Pearson’s correlation (p < 0.0004 for BOLD and EEG beta, and p < 0.005 for BOLDand EEG alpha). At the foot-specific area of sensorimotor cortex, the EEG beta changes werealso negatively covaried with BOLD changes (p < 1e-5, Fig. 4(E)).
The average changes of alpha, beta and BOLD across all conditions are shown in Fig. 5. Resultsshowed decreased alpha or beta changes were associated with increased BOLD responses whencomparing the movement condition with the imagination at each somatotopic region. Nosignificant regions associated with imagination of left hand were identified in BOLD maps.And no areas were found for imagination of foot in EEG alpha maps. Therefore, it was notfeasible to pool the quantities of imagination and movement between EEG alpha and BOLDat the region of foot, or between EEG alpha/beta and BOLD at the region of left hand. Theregression from only one task condition was largely dependent on the inter-subject variationrather than across-task variation and was not significant (Supplemental Fig 1 (F–G) andSupplemental Fig 2 (C)).
The quantified changes of different body parts were also pooled together to test the hypothesisthat the changes associated with movement were different from those with imaginations. Theresults showed that the changes in both EEG and BOLD associated with movement were largerin magnitude than those associated with imagery (p = 3e-5 for alpha changes, p = 2e-11 forbeta changes, and p = 1e-11 for BOLD changes, paired one-side t test).
DiscussionThe primary aim of the current study was to enhance our understanding of the biophysicalrelationship between task-related EEG changes and hemodynamic responses, particularly toexamine the covariation of EEG and fMRI responses across multiple task conditions. Wecollected EEG and fMRI data in separate sessions using a mixed block and event-related designto investigate the alpha/beta EEG and BOLD responses during motor imagery and movement.Our results showed that: (1) the contralateral decrease of alpha/beta EEG is co-localized withan increase of BOLD in the primary sensorimotor cortex; (2) across different task levels, themagnitudes of EEG changes co-varied with BOLD responses; and (3) the spatialcorrespondence and negative covariation existed at different somatotopic cortical areasassociated with different body parts.
Co-variation of Task-related Changes of EEG and BOLD ResponsesRecent studies have demonstrated the coupling between hemodynamic signals and low-frequency neurophysiologic oscillations, in the spontaneous resting state (Goldman et al.,
Yuan et al. Page 8
Neuroimage. Author manuscript; available in PMC 2011 February 1.
NIH
-PA Author Manuscript
NIH
-PA Author Manuscript
NIH
-PA Author Manuscript
2002; Moosmann et al., 2003) and in an alternation between the resting state and one task(Feige et al., 2005; Ritter et al., 2009). However, the temporal correlation in a task-on-task-offmanner is not necessarily the same as the covariation of responses across multiple task levels.Our results for the first time demonstrated the coupling covariation between the two imagingmodalities, which is of critical importance to prove that the alpha/beta suppression also containsthe rich information about the strength of cortical activity induced by tasks. This study extendsthe previous event-related de-synchronization (ERD) research as most of them focused onlocalization. While the increase of BOLD and decrease of alpha/beta-band amplitudes wereco-localized, our results showed that their magnitudes of changes were proportional across taskconditions and across subjects. Decreased alpha or beta changes were associated with increasedBOLD responses when comparing the movement condition with the imagination at thesensorimotor cortex. Interestingly, this finding is corroborated with a parallel study by Olbrichet al. in the visual/occipital area about the BOLD and EEG response to different vigilancestages (2009). They reported a more decreased BOLD signals associated with increased alphaactivity between low and high vigilance conditions, on top of their inverse correlation. Theseresults imply that both occipital and sensorimotor alpha/beta rhythms are functionally coupledwith the BOLD signals, possibly through a common mechanism. Furthermore, our resultsdemonstrated that the spatial correspondence of reciprocal changes and negative covariationwas found to be located at somatotopic regions specific to the performing limb in the primarysensorimotor area, which further suggests the functional coupling relationship.
In our method, we integrated EEG source imaging technology together with the covariationinvestigation study between EEG and BOLD signals. Compared with other studies whichcorrelated the BOLD time course with a convolution of a kernel function and the EEG fromone or a few electrodes, we directly used EEG source power from EEG source imaging results,which solved the mismatch of spatial scales. Since we quantified both the BOLD and alpharesponses as the relative changes (task vs. baseline) and it was based on our unique mixeddesign of block and event-related tasks, we avoided to address the large temporal scaledifference between EEG and BOLD. Through co-registering the spatial and temporal scalesof alpha and BOLD signals, our study is believed to accurately capture the relationship betweentask-induced responses.
Our current results are in line with the findings at the primary visual/auditory cortex where theincrease of gamma-band amplitudes was shown to be positively correlated with the increaseof BOLD signals under multiple stimulus conditions (Logothetis et al., 2001; Hall et al.,2005), which coincided with the positive temporal correlation during stimulus (Logothetis etal., 2001; Mukamel et al., 2005). Interestingly, the decrease of alpha power was co-localizedwith BOLD response and gamma power increase in a visual stimulation paradigm (Brooks etal., 2005). In another comparison of BOLD response and MEG oscillations in a motor task,Winterer et al. found that a complicated pattern of increase or decrease at several frequencybands accompanying BOLD responses can be found at the same cortical areas (Winterer et al.,2007). Taken together, these data suggest that the hemodynamic response can be linked tovarious aspects of the changes in neural activity reflected at different frequency bands.Particularly, since it is easier and more accurate to detect EEG alpha rhythm, as compared withgamma rhythm, it is promising to have more applications in imaging the brain functions usingEEG or combined EEG-fMRI modalities.
Localization of Task-related Decrease of EEG in Alpha- and Beta-frequency BandsOur results demonstrated a somatotopic co-localization between decrease in EEG alpha/betaactivity and increase of BOLD in imagination and movement of right hand, right foot and lefthand. In particular, our results for the first time reported the EEG source results regarding footimagery and movement and its co-localization with fMRI maps. Motor imagery has been
Yuan et al. Page 9
Neuroimage. Author manuscript; available in PMC 2011 February 1.
NIH
-PA Author Manuscript
NIH
-PA Author Manuscript
NIH
-PA Author Manuscript

widely used in human Brain-Computer Interface (BCI) studies as a mental strategy forprosthetic control (Wolpaw and McFarland, 2004). The Rolandic alpha rhythm at the centralregions (also known as mu rhythm) and beta rhythms can be intentionally modulated by motorimagery (Pfurtscheller and Lopes da Silva, 1999). Previous studies have investigated the EEGsources underlying the changes in the alpha- and beta-frequency bands during motor imageryalone (Kamousi et al., 2005; Kamousi et al., 2007; Qin et al., 2004) and with feedback derivedfrom online classification of imagery tasks (Yuan et al., 2008). The primary sensorimotor areawas found to be the neural origin of the event-related decrease associated with motor imagery,which is consistent with our present results. Furthermore, we demonstrate here that ahemodynamic response likely driven by neural synaptic activity is correlated with themodulation of EEG rhythms, which indicates a neurophysiologic basis for the BCI control.
At the sensorimotor areas, the imagination of left hand was found to be associated with bilateraldecrease of EEG power in the beta frequency band. Bilateral ERD in the beta band was alsoshown accompanying the movement of left/right hand. Furthermore, the bilateral differencein the beta band during the imagination of left hand was not significantly different with thatduring movement of left hand (p>0.05). However, in the alpha band, only contralateral ERDwas identified for the imagination of left hand, whereas bilateral alpha ERD was present forthe left-hand movement, which indicates that alpha ERD shows stronger lateral dominanceduring left-hand imagination. The increase of alpha activity (ERS) was found only in a fewsubjects for the imagination tasks, which however, was not significant at the group level(random-effect analysis, p>0.05 in Supplemental Fig. 3, p>0.001 in Fig. 3 and SupplementalFig. 1). This is consistent with the study of ERD/ERS in nine human subjects by Pfurtschelleret al., who reported large subject variability on the alpha ERS associated with imaginationswhereas the ERD patterns appeared to be more consistent among subjects (2006).
The co-localization of alpha/beta EEG decrease with BOLD increase during movement isconsistent with previous EEG/MEG studies in which a decrease of alpha and beta rhythm waslocated in the vicinity of the central sulcus during voluntary movement (Salmelin et al.,1995; Babiloni et al., 1999; Taniguchi et al., 2000; Jurkiewicz et al., 2006) and tactilestimulation (Gaetz and Cheyne, 2006). Electrocorticographic recordings from epilepticpatients undergoing pre-surgical monitoring have also shown a decrease of power in alpha andbeta bands at electrodes placed over the contralateral peri-central gyri (Crone et al., 1998b;Miller et al., 2007). In addition to the sensorimotor areas, our results found significantactivation of SMA in fMRI maps associated with both imagination and movement taskconditions, except the imagination of left hand. EEG maps also showed significant decreaseat SMA in a few conditions, which overlapped with the fMRI activated regions. These findingspoint in the same direction as several previous MEG/fMRI studies which reported that adecrease of EEG rhythms was accompanied by positive BOLD responses during visual tasks(Brookes et al., 2005), visuomotor discrimination tasks (Winterer et al., 2007), and cognitivetasks (Singh et al., 2002). It is worth noting that an increase in the high frequency gamma rangeaccompanying a decrease in low frequency (alpha/beta) activity was found in the contralateralsensorimotor cortex during ECoG recordings (Crone et al., 1998a; Miller et al., 2007). Ananalogous result was also reported to occur in the visual cortex where BOLD increase was co-localized with a decrease in alpha and an increase in gamma in response to visual stimuli(Brookes et al., 2005; Muthukumaraswamy and Singh, 2009). These results imply that high-and low-frequency band changes might arise from different physiological phenomena. Theyalso suggest that the increase of BOLD signal, the decrease of EEG/ECoG (and otherelectrophysiological signals sampling the common sources) in low-frequency band, and theincrease of EEG/ECoG in high-frequency band can be related in the same context of task-evoked responses.
Yuan et al. Page 10
Neuroimage. Author manuscript; available in PMC 2011 February 1.
NIH
-PA Author Manuscript
NIH
-PA Author Manuscript
NIH
-PA Author Manuscript
Functional Interpretation for Task-related EEG ChangesBOLD signals depend on CBF, CBV and metabolic consumption of oxygen that are closelyrelated to neuronal activities. Coupling between electrophysiological and hemodynamicchanges allows for high-resolution functional mapping as well as inferences about brainfunction. A linear correlation between BOLD signals and neuronal activity was demonstratedby Logothetis et al. who simultaneously acquired intra-cortical electrophysiological and fMRIdata in a monkey’s visual cortex (Logothetis et al., 2001). Their results showed that synapticallygenerated local field potentials and multi-unit activity were reliable predictors of BOLDresponse, indicating that the stimulus-evoked increase of the BOLD signal represents increasedneuronal activity. Local field potentials are thought to reflect the weighted average of thesynchronized dendrosomatic components of pyramidal synaptic signals and share a commonsource with synchronized electromagnetic signals recorded from the scalp (EEG/MEG)(Hamalainen et al., 1993; Logothetis and Wandell, 2004). Similarly, a correlation with thepositive BOLD response was also reported from scalp electromagnetic recordings, includingsurface-negative slow cortical potentials (Hinterberger et al., 2003; Nagai et al., 2004) andevent-related potentials (ERP) through phase-locked averaging (Huettel et al., 2004; Mulert etal., 2004; Schulz et al., 2004; Babiloni et al., 2005; Liu and He, 2008) – all of which aregenerated by synchronized neuronal populations.
However, our results demonstrated an inverse relationship between the BOLD response andtask-evoked changes in the alpha frequency band, which is thought to arise fromsynchronization of postsynaptic potentials across cortical neuronal populations (Nunez et al.,2001; Pfurtscheller and Lopes da Silva, 1999). Such negative correlations imply that the task-induced changes of low-frequency band EEG and ERP reflecting phase-locked activity mayarise from different physiological phenomena, whereas it is not clear how the synaptic activityof neuronal populations would change in relation to task-related changes in oscillation, andhence a hemodynamic change. Previous studies found that synaptic networks of neurons inisolated slices of neocortex may generate and maintain synchronized oscillations in the alphafrequency band (Silva et al., 1991), which were also demonstrated in the visual cortex of dogusing intracortical recordings (Lopes da Silva and Storm van Leeuwen, 1977). In response tocertain tasks, neuronal activation may change the cortico- and/or thalamo-cortical interactionsbetween neuronal populations that control the frequency components of the ongoingoscillations, and thus lead to the change of EEG alpha/beta activity or the hemodynamicresponse through the interplay of neurovascular coupling, as suggested by our results. Thefinding of the inverse correlation is also compatible with the notion that low-frequencyelectrophysiological signals indicate an “idling state” of brain activity, as decrease of alphaactivity is linked to neural activation suggested by BOLD response. The decrease in alpha/betaactivity may be due to a decrease in the synchrony of the underlying neural populations. Inparticular, our results suggest that the degree of desynchronization may be quantitativelyrelated with increased neuronal activity, as reflected in the increased BOLD signal.
Supplementary MaterialRefer to Web version on PubMed Central for supplementary material.
AcknowledgmentsThe authors would like to thank Dr. Zhongming Liu, Christopher Wilke and Audrey Royer for helpful discussions,and Megan Savage for assistance in collecting the experimental data in the subjects. The authors are also grateful toanonymous reviewers for their constructive comments. This work was supported in part by NIH RO1EB007920, NIHRO1EB006433, and NSF CBET-0933067. H.Y. was supported in part by an NIH Neuro-Physical-ComputationalSciences Fellowship R90 DK070106. The 3T MRI scanner was partially supported by NIH P41RR008079 andP30NS057091.
Yuan et al. Page 11
Neuroimage. Author manuscript; available in PMC 2011 February 1.
NIH
-PA Author Manuscript
NIH
-PA Author Manuscript
NIH
-PA Author Manuscript
ReferencesBerger H. Uber das Elektroenkephalogramm des Menschen. Arch Psychiatr Nervenkr 1929;87:527–570.Brookes MJ, Gibson AM, Hall SD, Furlong PL, Barnes GR, Hillebrand A, Singh KD, Holliday IE, Francis
ST, Morris PG. GLM-beamformer method demonstrates stationary field, alpha ERD and gamma ERSco-localisation with fMRI BOLD response in visual cortex. NeuroImage 2005;26:302–308. [PubMed:15862231]
Babiloni C, Carducci F, Cincotti F, Rossini PM, Neuper C, Pfurtscheller G, Babiloni F. Humanmovement-related potentials vs desynchronization of EEG alpha rhythm: a high-resolution EEG study.Neuroimage 1999;10:658–665. [PubMed: 10600411]
Babiloni F, Cincotti F, Babiloni C, Carducci F, Mattia D, Astolfi L, Basilisco A, Rossini PM, Ding L,Ni Y, Cheng J, Christine K, Sweeney J, He B. Estimation of the cortical functional connectivity withthe multimodal integration of high-resolution EEG and fMRI data by directed transfer function.Neuroimage 2005;24:118–131. [PubMed: 15588603]
Crone NE, Miglioretti DL, Gordon B, Lesser RP. Functional mapping of human sensorimotor cortex withelectrocorticographic spectral analysis. II. event-related synchronization in the gamma band. Brain1998a;121:2301–2315. [PubMed: 9874481]
Crone NE, Miglioretti DL, Gordon B, Sieracki JM, Wilson MT, Uematsu S, Lesser RP. Functionalmapping of human sensorimotor cortex with electrocorticographic spectral analysis. I. alpha and betaevent-related desynchronization. Brain 1998b;121:2271–2299. [PubMed: 9874480]
Dale AM, Sereno MI. Improved localization of cortical activity by combining EEG and MEG with MRIcortical surface reconstruction: a linear approach. Journal of Cognitive Neuroscience 1993;5:162–176.
de Munck JC, Gonçalves SI, Mammoliti R, Heethaar RM, Lopes da Silva FH. Interactions betweendifferent EEG frequency bands and their effect on alpha-fMRI correlations. NeuroImage 2009;47:69–76. [PubMed: 19376236]
Ehrsson HH, Geyer S, Naito E. Imagery of voluntary movement of fingers, toes, and tongue activatescorresponding body-part-specific motor representations. Journal of Neurophysiology 2003;90:3304–3316. [PubMed: 14615433]
Feige B, Scheffler K, Esposito F, Di Salle F, Hennig J, Seifritz E. Cortical and subcortical correlates ofelectroencephalographic alpha rhythm modulation. Journal of Neurophysiology 2005;93:2864–2872. [PubMed: 15601739]
Fischl B, Sereno MI, Tootell RB, Dale AM. High-resolution intersubject averaging and a coordinatesystem for the cortical surface. Human Brain Mapping 1999;8:272–284. [PubMed: 10619420]
Fox MD, Raichle ME. Spontaneous fluctuations in brain activity observed with functional magneticresonance imaging. Nature Reviews. Neuroscience 2007;8:700–711. [PubMed: 17704812]
Fox MD, Snyder AZ, Zacks JM, Raichle ME. Coherent spontaneous activity accounts for trial-to-trialvariability in human evoked brain responses. Nature Neuroscience 2006;9:23–25.
Friston KJ, Holmes AP, Worsley KJ, Poline J, Frith CD, Frackowiak RSJ. Statistical parametric maps infunctional imaging: A general linear approach. Human Brain Mapping 1995;2:189–210.
Friston KJ, Fletcher P, Josephs O, Holmes A, Rugg MD, Turner R. Event-related fMRI: Characterizingdifferential responses. NeuroImage 1998;7:30–40. [PubMed: 9500830]
Gaetz W, Cheyne D. Localization of sensorimotor cortical rhythms induced by tactile stimulation usingspatially filtered MEG. NeuroImage 2006;30:899–908. [PubMed: 16326116]
Goebel R, Esposito F, Formisano E. Analysis of functional image analysis contest (FIAC) data withbrainvoyager QX: From single-subject to cortically aligned group general linear model analysis andself-organizing group independent component analysis. Human Brain Mapping 2006;27:392–401.[PubMed: 16596654]
Goldman RI, Stern JM, Engel J Jr, Cohen MS. Simultaneous EEG and fMRI of the alpha rhythm.Neuroreport 2002;13:2487–2492. [PubMed: 12499854]
Hall SD, Holliday IE, Hillebrand A, Singh KD, Furlong PL, Hadjipapas A, Barnes GR. The missing link:analogous human and primate cortical gamma oscillations. NeuroImage 2005;26:13–17. [PubMed:15862200]
Yuan et al. Page 12
Neuroimage. Author manuscript; available in PMC 2011 February 1.
NIH
-PA Author Manuscript
NIH
-PA Author Manuscript
NIH
-PA Author Manuscript

Hamalainen MS, Hari R, Ilmoniemi RJ, Knuutila J, Lounasmaa OV. Magnetoencephalography – theory,instrumetation, and applications to noninvasive studies of the working human brain. Reviews ofModern Physics 1993;65:413–497.
He B, Liu Z. Multimodal Functional Neuroimaging: Integrating Functional MRI and EEG/MEG. IEEEReviews in Biomedical Engineering 2008;1:23–40.
Hinterberger T, Veit R, Strehl U, Trevorrow T, Erb M, Kotchoubey B, Flor H, Birbaumer N. Brain areasactivated in fMRI during self-regulation of slow cortical potentials (SCPs). Experimental BrainResearch 2003;152:113–122.
Huettel SA, McKeown MJ, Song AW, Hart S, Spencer DD, Allison T, McCarthy G. Linkinghemodynamic and electrophysiological measures of brain activity: Evidence from functional MRIand intracranial field potentials. Cerebral Cortex 2004;14:165–173. [PubMed: 14704213]
Jurkiewicz MT, Gaetz WC, Bostan AC, Cheyne D. Post-movement beta rebound is generated in motorcortex: Evidence from neuromagnetic recordings. NeuroImage 2006;32:1281–1289. [PubMed:16863693]
Kamousi B, Amini AN, He B. Classification of motor imagery by means of cortical current densityestimation and von neumann entropy. Journal of Neural Engineering 2007;4:17–25. [PubMed:17409476]
Kamousi B, Liu Z, He B. Classification of motor imagery tasks for brain-computer interface applicationsby means of two equivalent dipoles analysis. IEEE Transactions on Neural Systems andRehabilitation Engineering 2005;13:166–171. [PubMed: 16003895]
Lancaster JL, Woldorff MG, Parsons LM, Liotti M, Freitas CS, Rainey L, Kochunov PV, Nickerson D,Mikiten SA, Fox PT. Automated Talairach Atlas labels for functional brain mapping. Human BrainMapping 2000;10:120–131. [PubMed: 10912591]
Liu Z, He B. fMRI-EEG integrated cortical source imaging by use of time-variant spatial constraints.Neuroimage 2008;39:1198–1214. [PubMed: 18036833]
Logothetis NK. What we can do and what we cannot do with fMRI. Nature 2008;453:869–878. [PubMed:18548064]
Logothetis NK, Wandell BA. Interpreting the BOLD signal. Annual Review of Physiology 2004;66:735–769.
Logothetis NK, Pauls J, Augath M, Trinath T, Oeltermann A. Neurophysiological investigation of thebasis of the fMRI signal. Nature 2001;412:150–157. [PubMed: 11449264]
Lopes da Silva FH, Storm van Leeuwen W. The Cortical source of the alpha rhythm. Neuroscience Letters1977;6:237–241. [PubMed: 19605058]
Miller KJ, Leuthardt EC, Schalk G, Rao RP, Anderson NR, Moran DW, Miller JW, Ojemann JG. Spectralchanges in cortical surface potentials during motor movement. Journal of Neuroscience2007;27:2424–2432. [PubMed: 17329441]
Moosmann M, Ritter P, Krastel I, Brink A, Thees S, Blankenburg F, Taskin B, Obrig H, Villringer A.Correlates of alpha rhythm in functional magnetic resonance imaging and near infrared spectroscopy.NeuroImage 2003;20:145–158. [PubMed: 14527577]
Mukamel R, Gelbard H, Arieli A, Hasson U, Fried I, Malach R. Coupling between neuronal firing, fieldpotentials, and FMRI in human auditory cortex. Science 2005;309:951–954. [PubMed: 16081741]
Mulert C, Jager L, Schmitt R, Bussfeld P, Pogarell O, Moller HJ, Juckel G, Hegerl U. Integration of fMRIand simultaneous EEG: Towards a comprehensive understanding of localization and time-course ofbrain activity in target detection. NeuroImage 2004;22:83–94. [PubMed: 15109999]
Muthukumaraswamy SD, Singh KD. Functional decoupling of BOLD and gamma-band amplitudes inhuman primary visual cortex. Human Brain Mapping 2009;30:2000–2007. [PubMed: 18729078]
Nagai Y, Critchley HD, Featherstone E, Fenwick PB, Trimble MR, Dolan RJ. Brain activity relating tothe contingent negative variation: An fMRI investigation. NeuroImage 2004;21:1232–1241.[PubMed: 15050551]
Nunez PL, Wingeier BM, Silberstein RB. Spatial-temporal structures of human alpha rhythms: Theory,microcurrent sources, multiscale measurements, and global binding of local networks. Human BrainMapping 2001;13:125–164. [PubMed: 11376500]
Oldfield RC. The assessment and analysis of handedness: the Edinburgh inventory. Neuropsychologia1971;9:97–113. [PubMed: 5146491]
Yuan et al. Page 13
Neuroimage. Author manuscript; available in PMC 2011 February 1.
NIH
-PA Author Manuscript
NIH
-PA Author Manuscript
NIH
-PA Author Manuscript
Pfurtscheller G, Lopes da Silva FH. Event-related EEG/MEG synchronization and desynchronization:Basic principles. Clinical Neurophysiology 1999;110:1842–1857. [PubMed: 10576479]
Qin L, Ding L, He B. Motor imagery classification by means of source analysis for brain-computerinterface applications. Journal of Neural Engineering 2004;1:135–141. [PubMed: 15876632]
Olbrich S, Mulert C, Karch S, Trenner M, Leicht G, Pogarell O, Hegerl U. EEG-vigilance and BOLDeffect during simultaneous EEG/fMRI measurement. Neuroimage 2009;45:319–332. [PubMed:19110062]
Ritter P, Moosmann M, Villringer A. Rolandic alpha and beta EEG rhythms’ strengths are inverselyrelated to fMRI-BOLD signal in primary somatosensory and motor cortex. Human Brain Mapping2009;30:1168–1187. [PubMed: 18465747]
Salmelin R, Hamalainen M, Kajola M, Hari R. Functional segregation of movement-related rhythmicactivity in the human brain. NeuroImage 1995;2:237–243. [PubMed: 9343608]
Schulz M, Chau W, Graham SJ, McIntosh AR, Ross B, Ishii R, Pantev C. An integrative MEG-fMRIstudy of the primary somatosensory cortex using cross-modal correspondence analysis. NeuroImage2004;22:120–133. [PubMed: 15110002]
Singh KD, Barnes GR, Hillebrand A, Forde EM, Williams AL. Task-related changes in corticalsynchronization are spatially coincident with the hemodynamic response. NeuroImage 2002;16:103–114. [PubMed: 11969322]
Silva LR, Amitai Y, Connors BW. Intrinsic oscillations of neocortex generated by layer 5 pyramidalneurons. Science 1991;251:432–435. [PubMed: 1824881]
Taniguchi M, Kato A, Fujita N, Hirata M, Tanaka H, Kihara T, Ninomiya H, Hirabuki N, Nakamura H,Robinson SE, Cheyne D, Yoshimine T. Movement-related desynchronization of the cerebral cortexstudied with spatially filtered magnetoencephalography. NeuroImage 2000;12:298–306. [PubMed:10944412]
Tallon-Baudry C, Bertrand O, Delpuech C, Permier J. Oscillatory gamma-band (30–70 Hz) activityinduced by a visual search task in humans. Journal of Neuroscience 1997;17:722–734. [PubMed:8987794]
Winterer G, Carver FW, Musso F, Mattay V, Weinberger DR, Coppola R. Complex relationship betweenBOLD signal and synchronization/desynchronization of human brain MEG oscillations. HumanBrain Mapping 2007;28:805–816. [PubMed: 17133396]
Wolpaw JR, McFarland DJ. Control of a two-dimensional movement signal by a noninvasive brain-computer interface in humans. Proceedings of the National Academy of Sciences of the United Statesof America 2004;101:17849–17854. [PubMed: 15585584]
Yousry TA, Schmid UD, Alkadhi H, Schmidt D, Peraud A, Buettner A, Winkler P. Localization of themotor hand area to a knob on the precentral gyrus. A new landmark. Brain 1997;120 (Pt 1):141–157.[PubMed: 9055804]
Yuan H, Doud A, Gururajan A, He B. Cortical imaging of event-related (de)synchronization during onlinecontrol of brain-computer interface using minimum-norm estimates in frequency domain. IEEETransactions on Neural Systems and Rehabilitation Engineering 2008;16:425–431. [PubMed:18990646]
Yuan et al. Page 14
Neuroimage. Author manuscript; available in PMC 2011 February 1.
NIH
-PA Author Manuscript
NIH
-PA Author Manuscript
NIH
-PA Author Manuscript

Figure 1.Schematic illustration of experimental paradigm and data analysis. An example of single-trialEEG activity from the imagination of right hand and its filtered traces (8 Hz – 12 Hz) wereshown.
Yuan et al. Page 15
Neuroimage. Author manuscript; available in PMC 2011 February 1.
NIH
-PA Author Manuscript
NIH
-PA Author Manuscript
NIH
-PA Author Manuscript
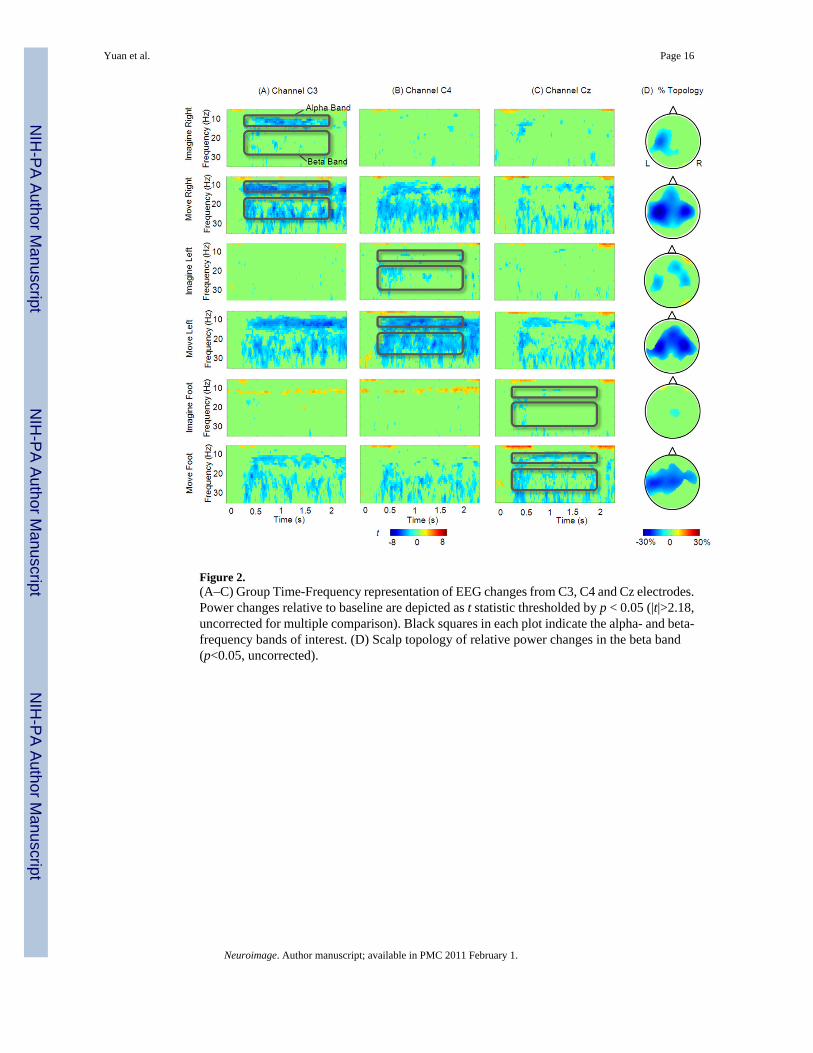
Figure 2.(A–C) Group Time-Frequency representation of EEG changes from C3, C4 and Cz electrodes.Power changes relative to baseline are depicted as t statistic thresholded by p < 0.05 (|t|>2.18,uncorrected for multiple comparison). Black squares in each plot indicate the alpha- and beta-frequency bands of interest. (D) Scalp topology of relative power changes in the beta band(p<0.05, uncorrected).
Yuan et al. Page 16
Neuroimage. Author manuscript; available in PMC 2011 February 1.
NIH
-PA Author Manuscript
NIH
-PA Author Manuscript
NIH
-PA Author Manuscript
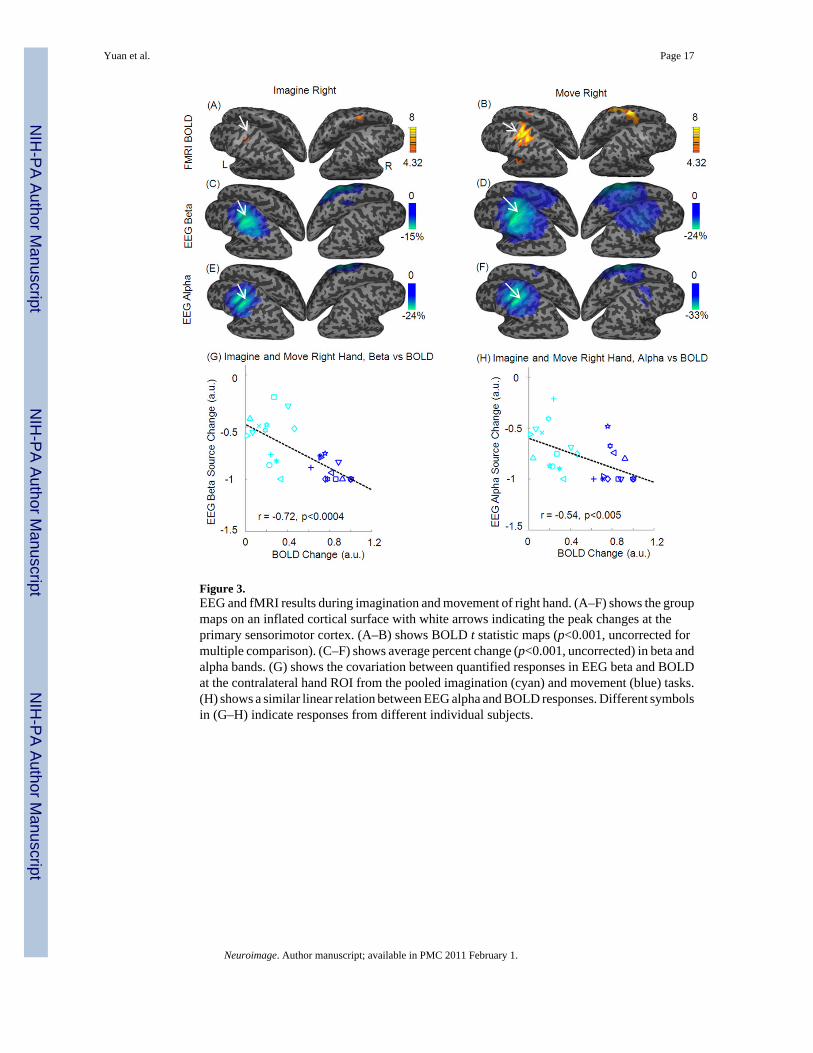
Figure 3.EEG and fMRI results during imagination and movement of right hand. (A–F) shows the groupmaps on an inflated cortical surface with white arrows indicating the peak changes at theprimary sensorimotor cortex. (A–B) shows BOLD t statistic maps (p<0.001, uncorrected formultiple comparison). (C–F) shows average percent change (p<0.001, uncorrected) in beta andalpha bands. (G) shows the covariation between quantified responses in EEG beta and BOLDat the contralateral hand ROI from the pooled imagination (cyan) and movement (blue) tasks.(H) shows a similar linear relation between EEG alpha and BOLD responses. Different symbolsin (G–H) indicate responses from different individual subjects.
Yuan et al. Page 17
Neuroimage. Author manuscript; available in PMC 2011 February 1.
NIH
-PA Author Manuscript
NIH
-PA Author Manuscript
NIH
-PA Author Manuscript
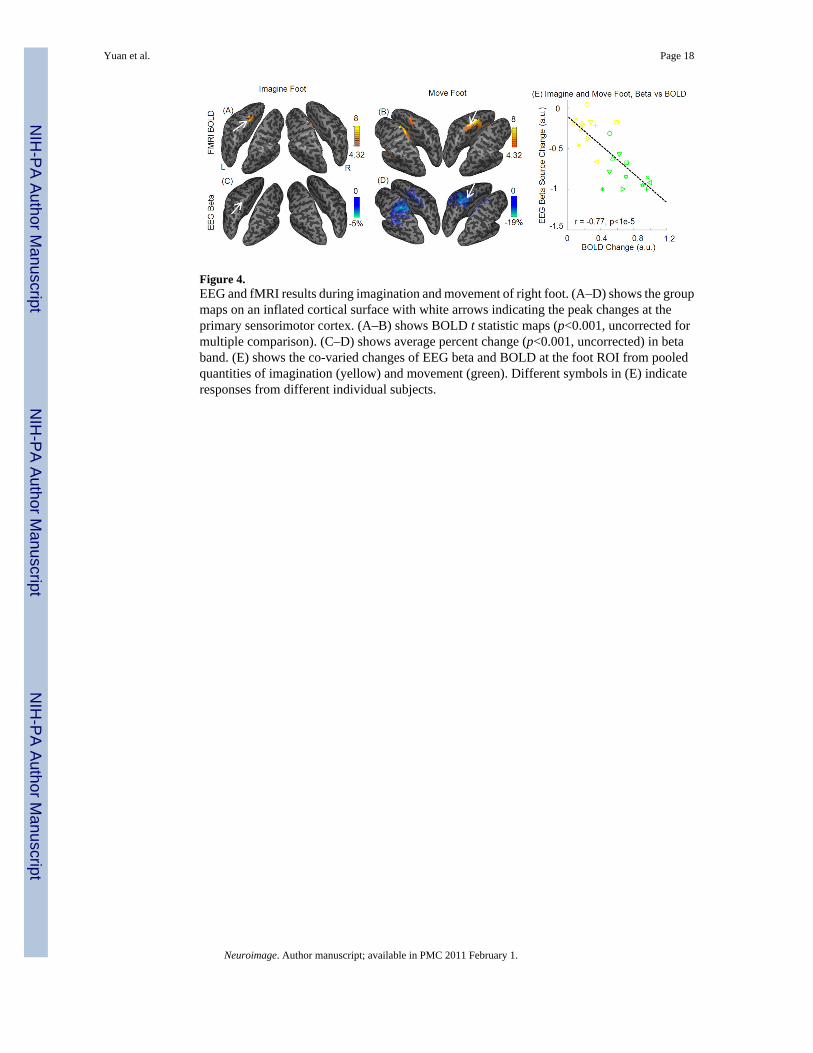
Figure 4.EEG and fMRI results during imagination and movement of right foot. (A–D) shows the groupmaps on an inflated cortical surface with white arrows indicating the peak changes at theprimary sensorimotor cortex. (A–B) shows BOLD t statistic maps (p<0.001, uncorrected formultiple comparison). (C–D) shows average percent change (p<0.001, uncorrected) in betaband. (E) shows the co-varied changes of EEG beta and BOLD at the foot ROI from pooledquantities of imagination (yellow) and movement (green). Different symbols in (E) indicateresponses from different individual subjects.
Yuan et al. Page 18
Neuroimage. Author manuscript; available in PMC 2011 February 1.
NIH
-PA Author Manuscript
NIH
-PA Author Manuscript
NIH
-PA Author Manuscript
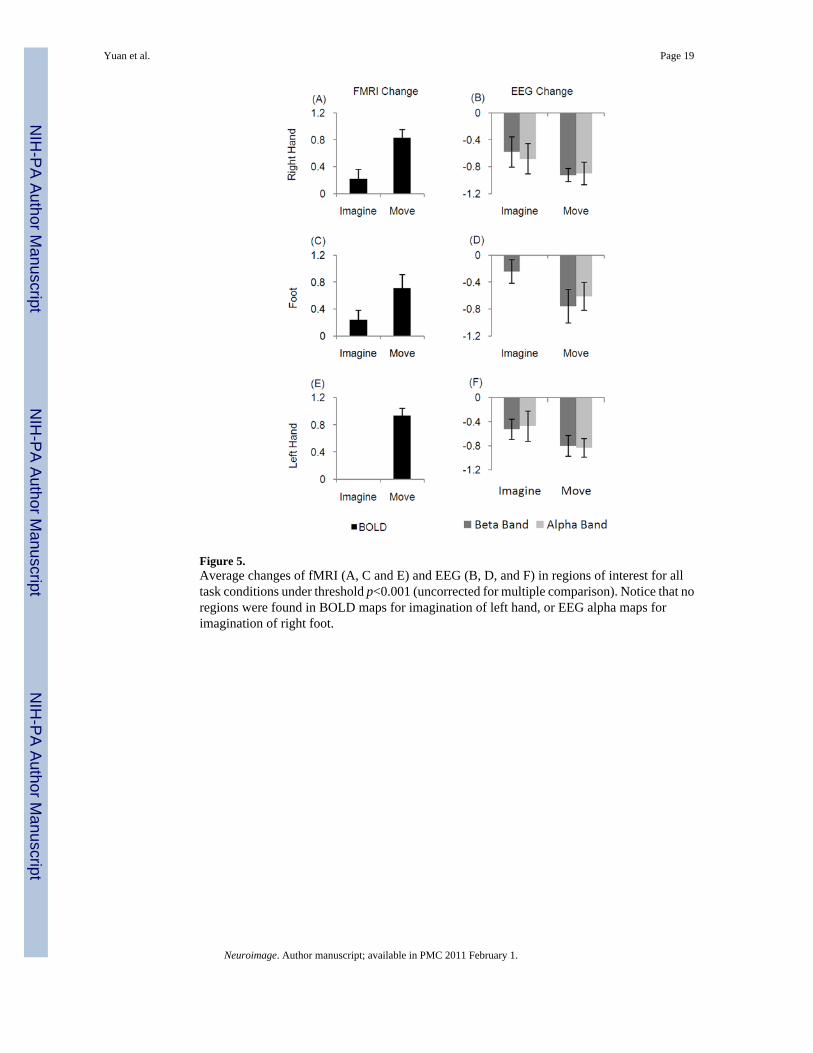
Figure 5.Average changes of fMRI (A, C and E) and EEG (B, D, and F) in regions of interest for alltask conditions under threshold p<0.001 (uncorrected for multiple comparison). Notice that noregions were found in BOLD maps for imagination of left hand, or EEG alpha maps forimagination of right foot.
Yuan et al. Page 19
Neuroimage. Author manuscript; available in PMC 2011 February 1.
NIH
-PA Author Manuscript
NIH
-PA Author Manuscript
NIH
-PA Author Manuscript
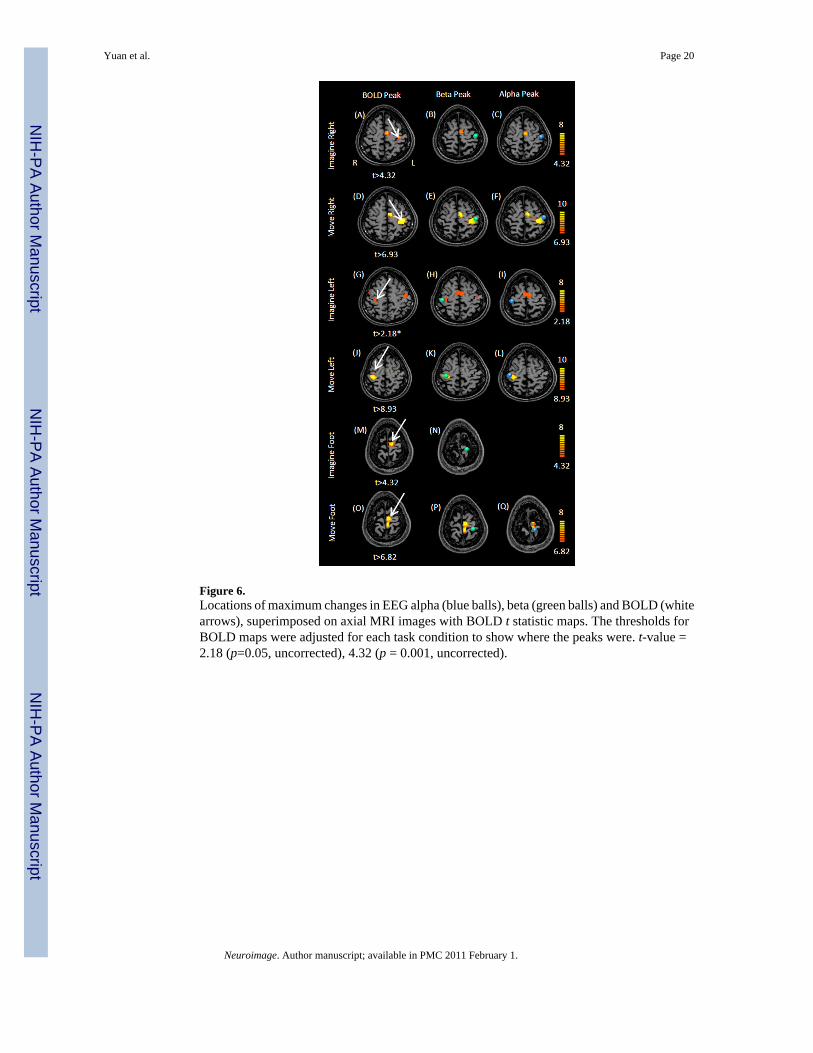
Figure 6.Locations of maximum changes in EEG alpha (blue balls), beta (green balls) and BOLD (whitearrows), superimposed on axial MRI images with BOLD t statistic maps. The thresholds forBOLD maps were adjusted for each task condition to show where the peaks were. t-value =2.18 (p=0.05, uncorrected), 4.32 (p = 0.001, uncorrected).
Yuan et al. Page 20
Neuroimage. Author manuscript; available in PMC 2011 February 1.
NIH
-PA Author Manuscript
NIH
-PA Author Manuscript
NIH
-PA Author Manuscript
NIH
-PA Author Manuscript
NIH
-PA Author Manuscript
NIH
-PA Author Manuscript
Yuan et al. Page 21
Tabl
e I
Max
imum
alp
ha, b
eta
and
BO
LD c
hang
es a
nd th
e Ta
laira
ch c
oord
inat
es o
f pea
k ac
tivat
ions
in si
x ta
sk c
ondi
tions
. The
Euc
lidia
n di
stan
ces (
E.D
.) be
twee
nal
pha/
beta
and
BO
LD m
axim
um c
hang
es a
re a
lso
liste
d.
BO
LD
Cha
nge
Bet
a C
hang
eA
lpha
Cha
nge
X, Y
, ZM
ax t
X, Y
, ZM
ax %
E.D
. (m
m)
X, Y
, ZM
ax %
E.D
. (m
m)
Imag
ine
Rig
ht−3
7 −2
0 50
5.62
−40 −2
1 57
−15.
237.
68−4
5 −1
3 51
−24.
0310
.68
Mov
e R
ight
−33 −2
5 49
15.9
8−4
3 −2
0 53
−24.
0711
.87
−44 −1
5 54
−32.
7215
.68
Imag
ine
Left
33 −
21 4
63.
1147
−23
53
−11.
3315
.78
46 −
21 5
1−1
8.21
13.9
3
Mov
e Le
ft37
−24
51
17.7
938
−23
51
−21.
321.
4143
−21
52
−29.
676.
78
Imag
ine
Foot
−10 −1
4 65
8.70
−9 −
33 6
7−5
.72
19.6
7--
----
Mov
e Fo
ot−8
−15
64
10.9
8−2
4 −3
3 63
−18.
8924
.10
−8 −
34 6
7−1
9.90
19.6
4
Neuroimage. Author manuscript; available in PMC 2011 February 1.
Copyright © 2022 FDOKUMEN