National Rural Health Mission Health and Family Welfare Department Government of Gujarat
73
National Rural Health Mission Health and Family Welfare Department Government of Gujarat
-
Upload
independent -
Category
Documents
-
view
1 -
download
0
Transcript of National Rural Health Mission Health and Family Welfare Department Government of Gujarat

National Rural Health Mission
Health and Family Welfare Department Government of Gujarat

2
The Paradigm Shift under NRHM• Decentralised planning• Outputs and Outcome based• Pro-Poor Focus: Equitable systems• Quality of Care and the IPHS norms
• Rights based service delivery• Pre stated entitlements at all levels• Inputs computed as function of the entitlements and
estimated patient load• Judicious mix of dedicated budget lines - untied funds• Monitor quality
• Community Participation

3
The Paradigm Shift under NRHM• Bringing the public back into public health
• At hamlet level : ASHA, VHSC, SHGs, Panchayats.• At the facility level: RKS• At the management level : health societies
• Governance reform• Manpower, Logistics & Procurement processes.• Decision making processes• Institutional design, Accountability framework
• Convergence• Water and sanitation• Nutrition• Education

• Reduce maternal and child mortality - address malnutrition
• Address adverse sex ratio
• Stabilize population
• Effectively implement the national health Programmes
• Enhance equity, quality, access, cost-effectiveness and satisfaction with health services
• Provide state of the art health and medical education relevant to local needs
• Provide an environment in which the health team blossoms fully to lead a fulfilling life and effectively achieves the above goals
Our Goals

Current Status
Indicator India Gujarat
Maternal Mortality Ratio 301 172
Infant Mortality Rate 57 50
Maternal Deaths in one year 81000 2000
Infant Deaths in one year 1539000 60000

Objectives ( by 2010):
Universalize coverage of antenatal care (100%)
Increase the deliveries attended by SBAs
90%
Increase institutional deliveries by 80%
increase access to Emergency Obstetric Care for complicated deliveries
Increase coverage of Post Natal Care (90%)
Increase access to Early & Safe Abortion services
Improve access to RTI/ STI services
Introduce AFHS in all PHC/ CHCs.
Maternal Health

100136
389
172202
0
100
200
300
400
500
1989 1999-01 2001-03 2007-08 2010
Mat
erna
l Dea
lth
Target
SRS Maternal Mortality in India:1997-2003
Maternal Mortality (per lakh
live births) in Gujarat

Broad Issues
• Non - availability of O & G specialists• Accessibility of services-Tribal and urban
slums• Poor utilization of services-
Low felt need of health & medical services
Lack of user friendly & quality public health services
Costly private health and medical services
No health insurance coverage

Strategies• Chiranjeevi
Yojana• Extended Chiranjeevi
Yojana
• Janani Suraksha Yojana
• Operationalising FRUs/B/CEmOCs/, training of MOs in LSAS and training of SBA.
• Appointment of staff nurses at PHCs for safe delivery & specialists on call basis.
• Monitoring of each pregnant mother as per EDD and birth micro plan prepared & Involving EMRI.
• Incentive to the staff in govt. for the better performance (state govt. initiative)
• Outreach Primary health care through MAMTA Abhiyan


Trend in deliveries
53.21
67.6377.83 80.58
48.57 46.79 42.9736.76 32.37
22.17 18.95
51.4357.03
63.2455.87
44.13
0.0010.0020.0030.0040.0050.0060.0070.0080.0090.00
2001-02
2002-03
2003-04
2004-05
2005-06
2006-07
2007-08
2008-09
(avgas on
Oct 08)
Institutional deliveries % Home %
DLHS-III (2007 -
08): 56.5%
NFHS-III (2005 -
06): 55%
CRS (2007): 63.3%
MICS (2008): 67.2%
Source: Form No 9 State report

Our Achievement: 54 poor performing talukas (having less than 70% institutional delivery rate) reduced to 39
as on (Oct 2008)
OCT 07 OCT 08
Above 80%60 – 79.99 %Below 59.99 %

Effect of Chiranjivi on Institutional Delivery (Pilot District)
45.1
46.0
36.5
53.3
62.6
88.4
79.8
69.5
88.9
88.7
0 10 20 30 40 50 60 70 80 90 100
Sabarkantha
Banaskantha
Panchmahals
Dahod
Kutchh
% Institutional Delivery- Current Status
% Institutional Deliveryat the time of Initiationof Chiranjivi

Chiranjeevi Performance (Month wise): 2007-08 & 2008-09
63877453 7540
8924
1084611475
1050711465 11628
1068711404
6857
85479351
112031125611404 1187012727
11331
0
2000
4000
6000
8000
10000
12000
14000
April MayJu
ne July
AugSep
t
Oct Nov
Dec Jan
FebMarc
h
2007-08 2008-09
Chiranjeevi
Yojana
contributes on an average 14-16% to Institutional deliveries in the state every month 2008 -
09

Total Deliveries
under Chiranjeevi
scheme
Expect
ed
Matern
al
Death
Maternal death
reported under
Chiranje
evi
scheme
Mothers saved under
Chiranje
evi
scheme
Expected New born
death
New born death
reported under
Chiranjee
vi
scheme
New born
saved
258361 1033 50 983 9818 1028 8790
Outcome of Chiranjeevi Scheme:
Mothers & New Born babies saved ( Up to Nov-08)
•Normal Deliveries: 226538•C-Section: 15857 (6.14%)•Complicated Deliveries: 15966 (6.18%)•Private specialist enrolled: 869/2000

88.7 88.9
79.7 79.888.4
83.076.0
83.0
70.178.3
93.4
25.530.2
14.710.0
44.1
20.1
7.211.9
22.0
7.2 8.6
18.0
40.4
0.0
10.0
20.0
30.0
40.0
50.0
60.0
70.0
80.0
90.0
100.0
Sabark
anthaBan
askan
thaVad
odaraPan
chmahalDah
odBharuchNarm
ada
Surat Tapi
Valsad
Navsa
riDan
gs
% of Institutional delivery % of CY deliveries against institutional delivery
Tribal districts
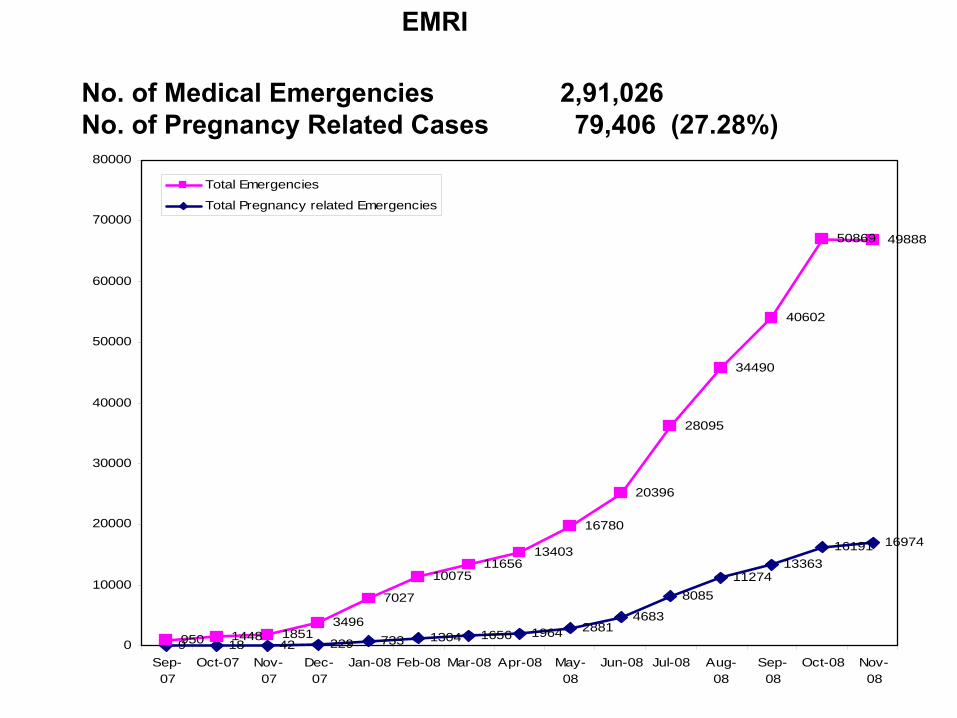
9 18 42 229 733 1304 1656 1964 28814683
808511274
1336316191 16974
950 1448 18513496
7027
1007511656
13403
16780
20396
28095
34490
40602
50869 49888
0
10000
20000
30000
40000
50000
60000
70000
80000
Sep-07
Oct-07 Nov-07
Dec-07
Jan-08 Feb-08 Mar-08 Apr-08 May-08
Jun-08 Jul-08 Aug-08
Sep-08
Oct-08 Nov-08
Total Emergencies
Total Pregnancy related Emergencies
No. of Medical Emergencies
2,91,026 No. of Pregnancy Related Cases 79,406 (27.28%)
EMRI

Objective• To reduce Neonatal mortality and Infant mortality • To ensure IYCF practices.• Growth monitoring and Nutrition practices. • To ensure full immunization. • To reduce morbidity & mortality among children due to
Diahorreal & ARI diseases.• To reduce the Low birth weight babies & malnutrition
among child.
Child Health
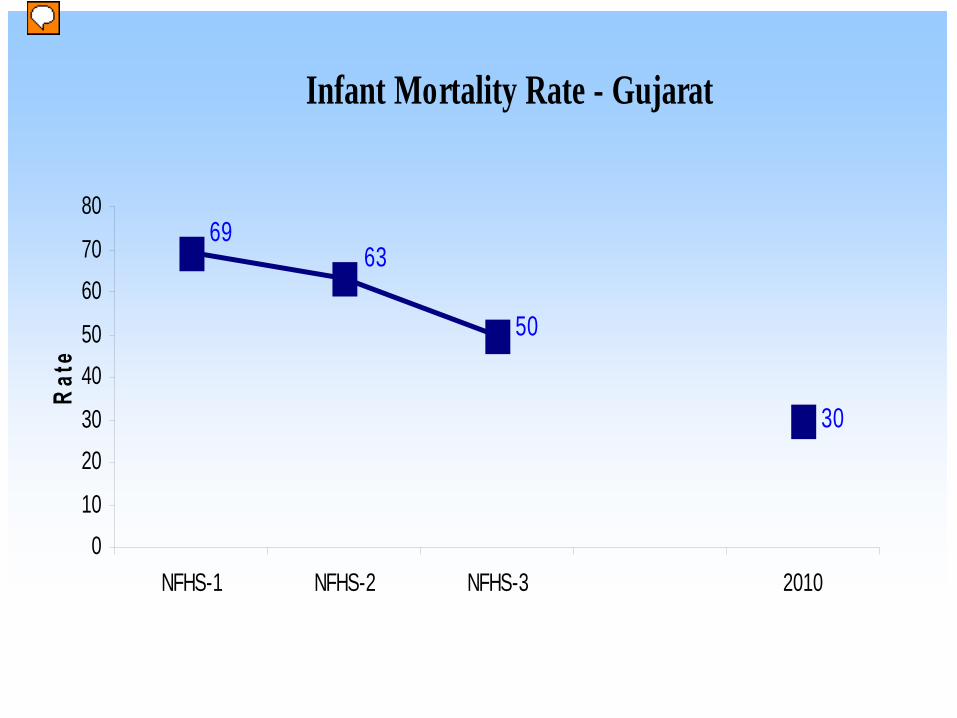
Infant Mortality Rate - Gujarat
30
50
6369
010
2030
4050
6070
80
NFHS-1 NFHS-2 NFHS-3 2010
Rat
e
Presenter
Presentation Notes
Excellent. Let’s have separate parts for anemia; Neo natal health and child health

Strategies : Child Health
• Implementation of IMNCI/ENBC in 18 districts, started in 2006
• Mamta Abhiyan (Divas,Mulakat, Nondh, Sandarbh) implementation & convergence of Health with ICDS. Started in 2006
• Training of health workers in Immunization; Cold chain handler’s training• Immunization strengthening: RIMS, fully operational as from 2007
• Upgrading skills of MBBS doctors in Emergency Newborn Care
• Strengthening Government facilities for newborn care (new born corner, Sick baby corners & neonatal care units )
• “The Bal Sakha Yojana” PPP for newborn care under process
• Pediatrician on call scheme is launched in the entire state.
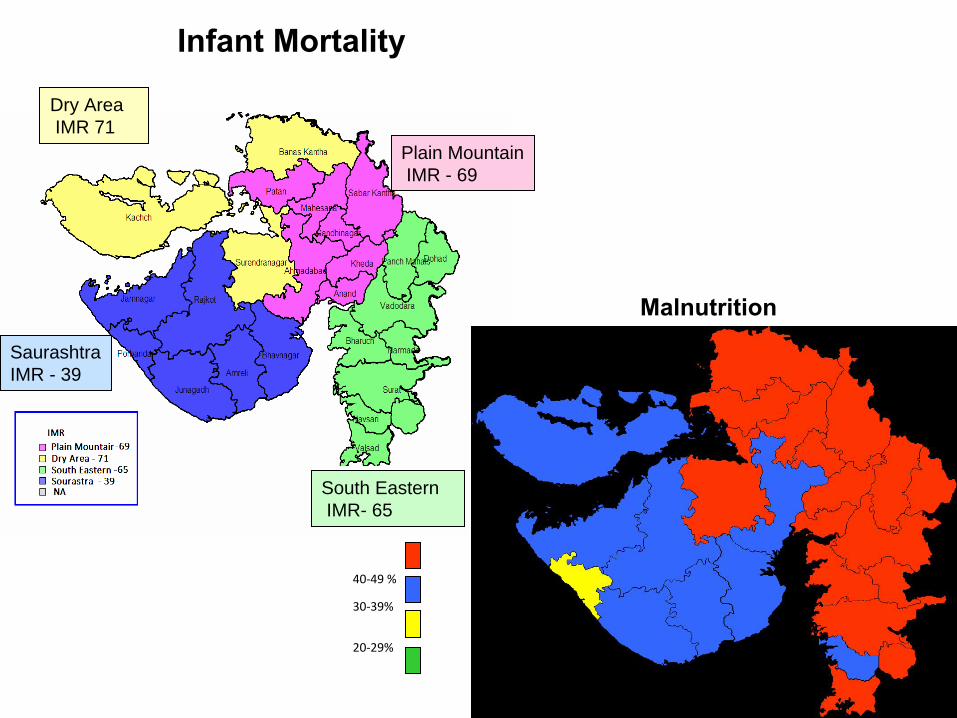
30‐39%
20‐29%
40‐49 %
South EasternIMR- 65
Plain MountainIMR - 69
Dry AreaIMR 71
SaurashtraIMR - 39
Infant Mortality
Malnutrition
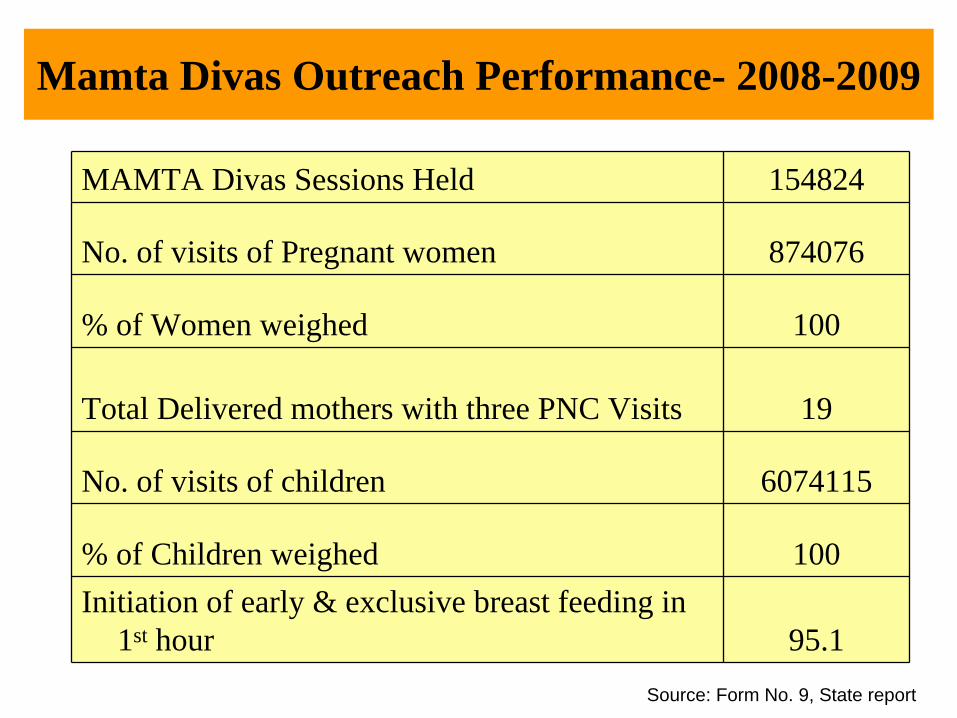
Mamta Divas Outreach Performance- 2008-2009
MAMTA Divas Sessions Held 154824
No. of visits of Pregnant women 874076
% of Women weighed 100
Total Delivered mothers with three PNC Visits 19
No. of visits of children 6074115
% of Children weighed 100Initiation of early & exclusive breast feeding in
1st hour 95.1Source: Form No. 9, State report

MAMTA ABHIYAN

AWW weighing a newborn within 1 hour of birth
AWW checking child with diarrhoea
for dehydration
Training Completed by Nov 08
25391
Medical Officers trained 1252
FHW trained 4052
AWW trained 17963
ICDS Supervisors 604
IMNCI Training & Implementation

22.1
80.3
0
10
20
30
40
50
60
70
80
90
% lbw % LBW given kangroo care
% low birth weight babies given Kangroo care(Apr-Nov-08)(Souce:-- form-9 )
NFHS-III reported –
47.4 lbw

Full immunization independent evaluation by Taleem
96.8
94.2
89.586.7
86.085.9
85.8
85.4
85.285.184.8
82.8
82.5
79.0
78.5
73.972.8
72.2
62.8
40.1
0 10 20 30 40 50 60 70 80 90 100
PERCENT
Navsari
Rajkot
Bhavnagar
Patan
Surat
Porbandar
The Dangs
Kachchh
Valsad
Kheda
Vadodara
Mahesana
TOTAL GUJARAT
Ahmedabad
Tapi
Jamnagar
Narmada
Banaskantha
Dahod
NFHS-3 (Rural)

Routine Immunization Monitoring System (RIMS)
Data Uploaded
As on Nov 2008
Source: www.rimsindia.org
Gujarat is the only state with all 25 districts reporting in RIMS.

Sept’08
Ahmedabad Region
NovNov’’0808
June’08

Growth monitoring MAMTA AbhiyanMicronutrient Supplementation ( IFA, Vit. A, Calcium)
Distribution of iodized saltDe worming twice/ year
Growth, development and nutrition counseling
State Nutrition Cell
COMMUNITY
REGION
DISTRICT
BLOCK
STATE
Child Development & Nutrition Centres(Referral through Mamta Divas)
Nutrition Support Units(Supervision, monitoring and
training)Inter sectoral coordination
Tertiary care nutrition rehabilitation centres (Teaching hospitals)
Malnutrition management pyramid

Child Development and Nutrition Centers
Districts Name of CDNCOperational Status of CDNC
No of Children admitted & Patients
CounseledNo of grade 3 children
admittedNo of grade 4
children admitted
Valsad Dharmpur Functional 12 12 0
Kaprada Functional 28 16 12
Dang Vaghai Functional 112 109 3
District Hospital Functional 19 10 9
Banaskantha Danta Functional 3 3 0
Amirgadh Functional 16 11 5
Narmada Sagbara Functional 0 0 0
Dediapara Functional 0 0 0
Dahod Garbada Functional 0 0 0
DahodFunctional
6 0 6
Panchmahal Lunavada Functional 10 10 0
Halol no 0 0 0
Vadodara Savli
Functional
98 96 2
* Chota UdepurFunctional
44 40 4
Total 348 307 41

Bal Sakha Scheme – 1 for Chiranjivi Beneficiaries [BPL]
Proposed charge to be paid to the pediatrician for 100 children
1. Additional charge to the CY doctor for keeping the mother and neonate for 2 more days (@ Rs. 300*100)
Rs. 30,000
2. Consultation fees for the pediatrician for 100 children at CY clinic (@ Rs. 300*100)
Rs. 30,000
3. 20 cases to be transported to the pediatric clinic, transportation charges @ Rs. 100*20)
Rs. 2000*
4. Treatment fees for 20 children at the pediatrician’s clinic (@ Rs. 5000*20)
Rs. 1,00,000
5. Transportation of 5 critically ill children to the medical college under care of the pediatrician (@ Rs. 1000*5)
Rs. 5,000*
Total:->> Rs. 1,67,000* To be paid only if EMRI vehicle not available
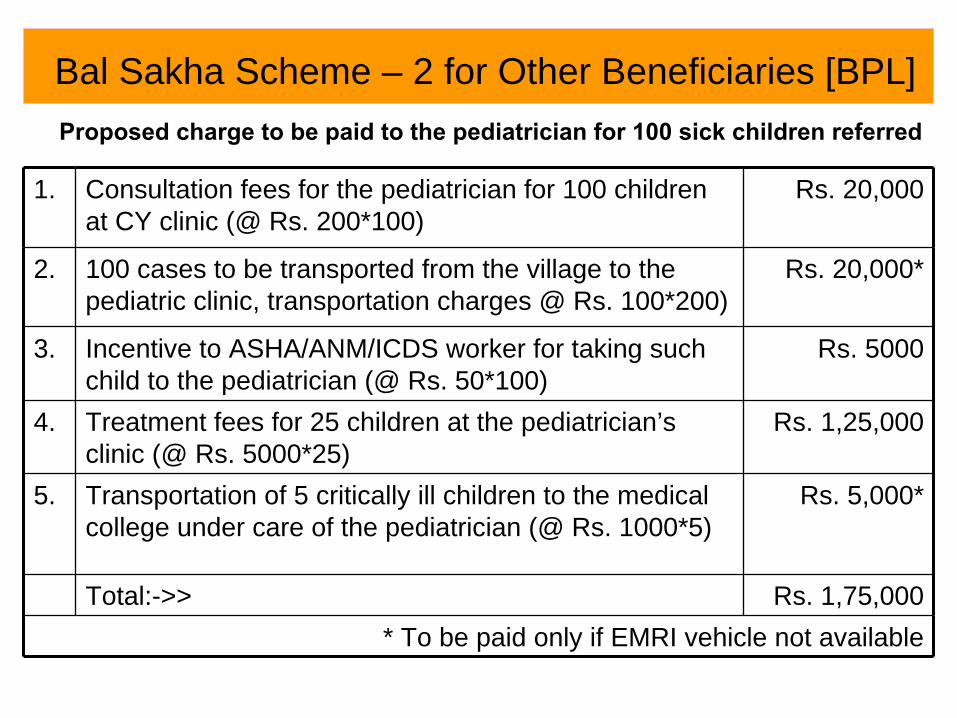
Bal Sakha Scheme – 2 for Other Beneficiaries [BPL]Proposed charge to be paid to the pediatrician for 100 sick children referred
1. Consultation fees for the pediatrician for 100 children at CY clinic (@ Rs. 200*100)
Rs. 20,000
2. 100 cases to be transported from the village to the pediatric clinic, transportation charges @ Rs. 100*200)
Rs. 20,000*
3. Incentive to ASHA/ANM/ICDS worker for taking such child to the pediatrician (@ Rs. 50*100)
Rs. 5000
4. Treatment fees for 25 children at the pediatrician’s clinic (@ Rs. 5000*25)
Rs. 1,25,000
5. Transportation of 5 critically ill children to the medical college under care of the pediatrician (@ Rs. 1000*5)
Rs. 5,000*
Total:->> Rs. 1,75,000* To be paid only if EMRI vehicle not available

Objective• Reduce TFR up to 2.1• Increase the couple protection rate • Quality assurance in Family planning
services• Provision of safe abortion services• Ensure Male participation.
Family Planning Program

Trend in Total Fertility Rate - Gujarat
2.1
2.42.72
2.99
0
1.5
3
4.5
NFHS-1 NFHS-2 NFHS-3 2010
Rat
e

Trend in CBR of Diffrent States as per SRS Data
34.533.0
26.725.0
23.7 23.5 2326.0
24.2
21.019.1 18.7
24.5
19.018.1
27.529.9
31.7
18.9
29.028.5
26.2
18.520.7
10.0
15.0
20.0
25.0
30.0
35.0
40.0
GUJ 34.5 33.0 27.5 26.7 25.0 23.7 23.5 23AP 31.7 29.9 26.0 24.2 21.0 19.1 18.9 18.7MH 28.5 29.0 26.2 24.5 20.7 19.0 18.5 18.1
1981 1985 1991 1995 2001 2005 2006 2007

Ongoing Strategies• Training of surgeons for NSV/Laparoscopic TL:
– 150 surgeons trained in NSV and within 2007-08 state is going to have 250 trained surgeons
– 770 surgeons trained and certified for laparoscopic TL surgery
• Training of doctors and FHW in IUD: project initiated in all district
• Contraceptive update to FHW
• IEC/BCC campaigning and distribution of pills and condoms
• Block wise analysis of FP data and action
• Kalyan Chab CBD outlet for condoms, IFA tablets, ORS, Choroquine etc.

0
20
40
60
80
100
120
140
160
180
200
Di st r i c t
Num
ber T
rain
ed
IUD Training 2008

Sterilizations Total
Sterilization
257335242364
254904
267549
310064
0
50000
100000
150000
200000
250000
300000
350000
1991-92 1997-98 2001-02 2006-07 2007-08
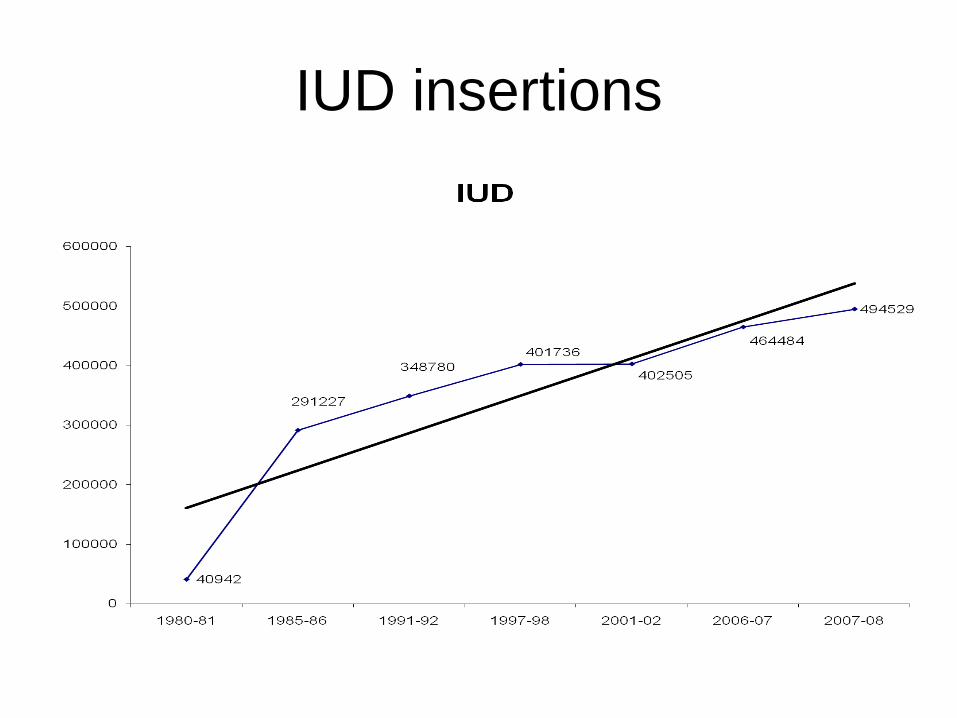
IUD insertions

116629
129692
110000
115000
120000
125000
130000
135000
Sterilisation
Nov 2007-08Nov. 2008-09
Family Planning Performance
304414
339655
280000
290000
300000
310000
320000
330000
340000
350000
IUD
Nov 2007-08Nov. 2008-09

% 3 & 3+ Birth order (CRS)
27.5
26.7
31.7
26.4
25.2
25.3
23.1
29.2
20.9
27.9
23.5
22.2
22.0
22.6
21.4
19.2
19.1
28.9
20.5
0.0
5.0
10.0
15.0
20.0
25.0
30.0
35.0
Pat
an
Pan
chm
ahal
s
Doh
ad
Sab
arka
ntha
The
Dan
gs
Bha
vnag
ar
Ban
aska
ntha
Kut
ch
Mah
esan
a
Sure
ndra
naga
r
Juna
gadh
Gan
dhin
agar
Amre
li
Anan
d
Khe
da
Por
band
ar
Raj
kot
Nar
mad
a
Bha
ruch
3+ BO

% of 3 & 3+ Births to total births
16.9
13.5 14.4 14.712.6 12.4
31.7 32.631.4 32.1
33.230.9
2927.9
26.424.4 25.2
22.2
0
5
10
15
20
25
30
35
AP 16.9 13.5 14.4 14.7 12.6 12.4GUJ 31.7 32.6 31.4 32.1 33.2 30.9MHA 29 27.9 26.4 24.4 25.2 22.2
2001 2002 2003 2004 2005 2006
Source: SRS
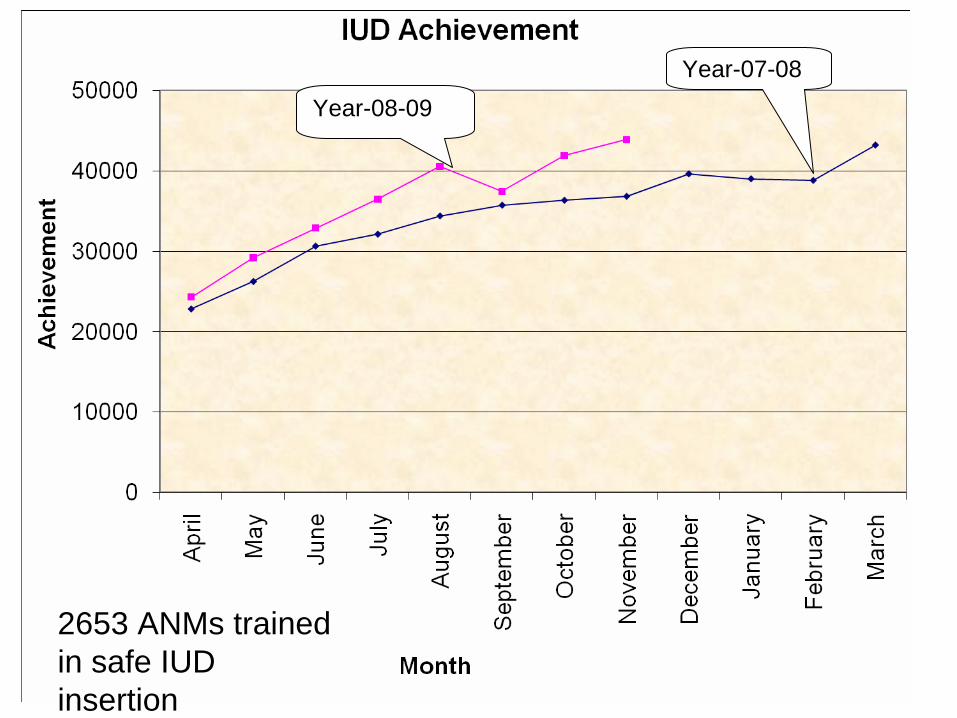
Year-08-09Year-07-08
2653 ANMs trained in safe IUD insertion
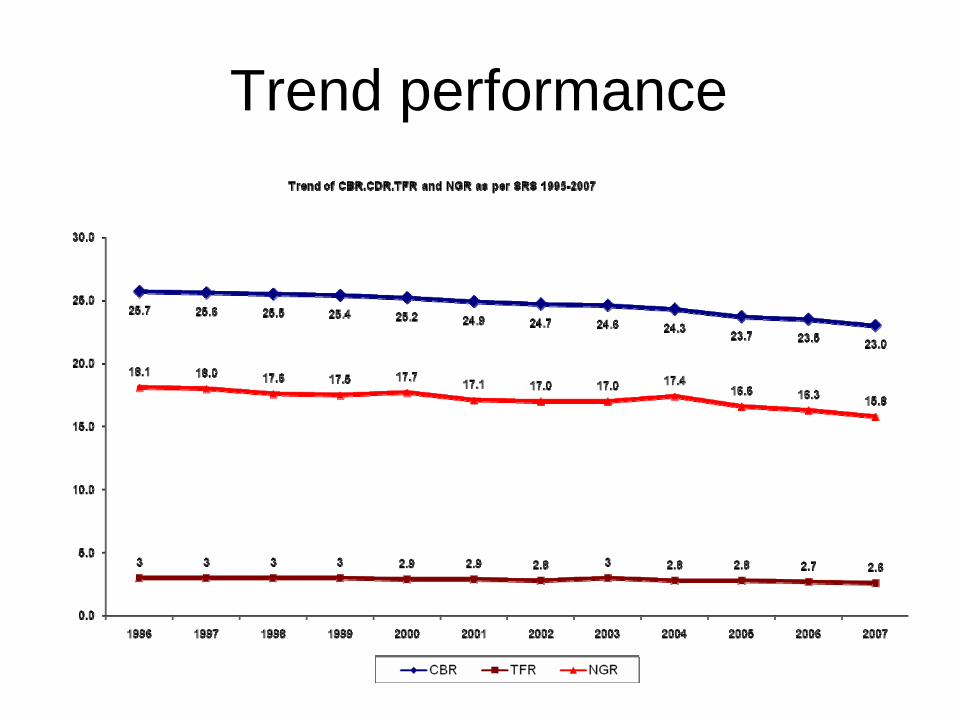
Trend performance
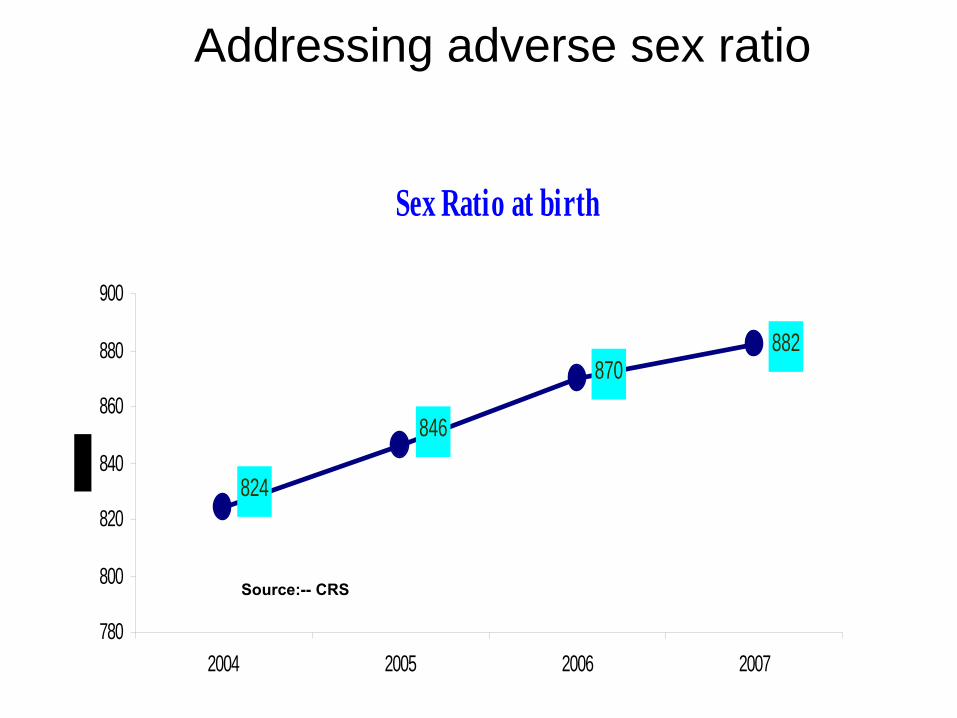
Sex Ratio at birth
882870
846
824
780
800
820
840
860
880
900
2004 2005 2006 2007
Source:--
CRS
Addressing adverse sex ratio

Average 3 yrs (2005-07)
Sex Ratio at Birth

District Wise Average Sex Ratio of 3 years (2005-2007)
968956 953
934925 924
885 885 883 882 879
867 866 866 864 864 860 857 856846 844 843
833 830819
700
750
800
850
900
950
1000Th
e D
angs
Val
sad
Nav
sari
Nar
mad
a
Kac
hchh
Bha
ruch
Juna
gadh
Por
band
ar
Khe
da
Vad
odar
a
Ban
as K
anth
a
Pat
an
Jam
naga
r
Pan
ch M
ahal
s
Sur
endr
anag
ar
Ana
nd
Ahm
adab
ad
Gan
dhin
agar
Doh
ad
Bha
vnag
ar
Am
reli
Mah
esan
a
Raj
kot
Sab
ar K
anth
a
Sur
at

Average Sex Ratio of 3 years of Poor Performing Talukas (2005-07)
753 76
0 767
769
784
785 79
779
8 801 81
181
181
181
281
281
381
4 817
817
819
821 82
682
782
782
983
0 835
835 84
084
384
584
684
784
9
700
720
740
760
780
800
820
840
860
Um
rala
Talo
d
Gon
dal
Man
sa
Vija
pur
Kuk
avav
Vad
ia
Sur
at C
ity
Kot
ada
San
gani
Unj
ha
Det
roj -
Ram
pura
Pat
an Idar
Bha
vnag
ar
Raj
kot
Mah
esan
a
Juna
gadh
Ana
nd
Vis
naga
r
Gan
dhin
agar
Pal
anpu
r
Kal
ol
Cha
nasm
a
Jetp
ur
Pra
ntij
Am
reli
Jam
kand
orna
Him
atna
gar
Bag
asar
a
Nad
iad
Ahm
edab
ad-C
ity
Dho
raji
Upl
eta
Sid
hpur

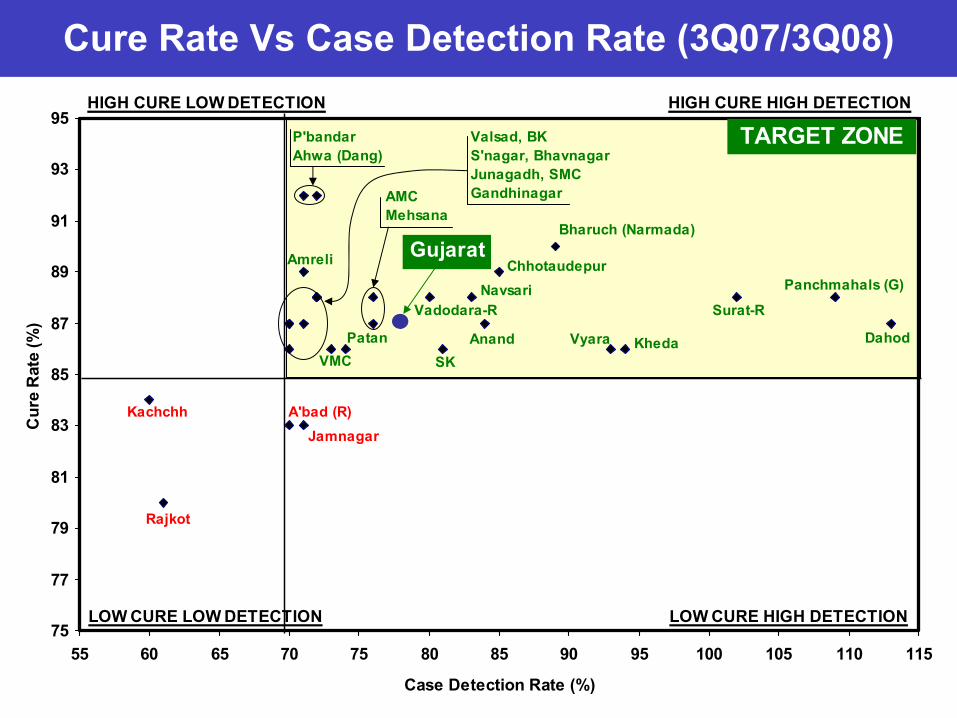
• Gujarat state has been in the target zone, consecutively in last eleven quarters
• 25 / 29 (86%) reporting units are in the target zone• 100/130 (77%) TB Units are in the target zone • NSP Case Detection Rate - 3q08 : 78%• NSP Cure Rate - 3q07 : 87%• NSP Conversion Rate - 2q08 : 91%• Total TB patients put on treatment : 19,961• NSP Cases put on treatment : 8805• Gujarat State has achieved 3rd
place in NSP case detection rate & cure rate during 2Q08 (As per National Performance report 2Q08)
Since the inception of RNTCP up to 30-9-08– Total TB Patients put on DOTS treatment, :
6,07,062– New Smear Positive patients put on treatment :
2,46,212– Total lives saved : 1,09,271
Revised National Tuberculosis Control Programme Achievements of Gujarat

Annualized New Smear Positive Case Detection Rate and Treatment Success Rate in DOTS areas of Gujarat, 2000-3Q08
•Population projected from 2001 census•Estimated no. of NSP cases - 80/100,000 population per year (based on recent ARTI report)
40%
50%
60%
70%
80%
90%
100%
1st Q
00
2nd
Q 0
03r
d Q
00
4th
Q 0
01s
t Q 0
12n
d Q
01
3rd
Q 0
14t
h Q
01
1st Q
02
2nd
Q 0
23r
d Q
02
4th
Q 0
21s
t Q 0
32n
d Q
03
3rd
Q 0
34t
h Q
03
1st Q
04
2nd
Q 0
43r
d Q
04
4th
Q 0
41s
t Q 0
52n
d Q
05
3rd
Q 0
54t
h Q
05
1st Q
06
2nd
Q 0
63r
d Q
06
4th
Q 0
61s
t Q 0
72n
d Q
07
3rd
Q 0
74t
h Q
07
1st Q
08
2nd
Q 0
83r
d Q
08
Annualised New S+ve CDR Success rate
Cure Rate Vs Case Detection Rate (2Q05/2Q06)
75
77
79
81
83
85
87
89
91
93
95
55 60 65 70 75 80 85 90 95 100 105 110 115
Case Detection Rate (%)
Cur
e R
ate
(%)
Panchmahals (G)
Dahod
Bharuch (Narmada)Gujarat
P'bandarAhwa (Dang)
A'bad (R)
HIGH CURE HIGH DETECTIONHIGH CURE LOW DETECTION
LOW CURE LOW DETECTION LOW CURE HIGH DETECTION
TARGET ZONE
Surat-R
ChhotaudepurNavsari
Vyara
AMCMehsana
Kachchh
Rajkot
Anand
Jamnagar
Kheda
Valsad, BKS'nagar, BhavnagarJunagadh, SMCGandhinagar
SKPatan
Vadodara-R
VMC
Amreli
Cure Rate Vs Case Detection Rate (3Q07/3Q08)

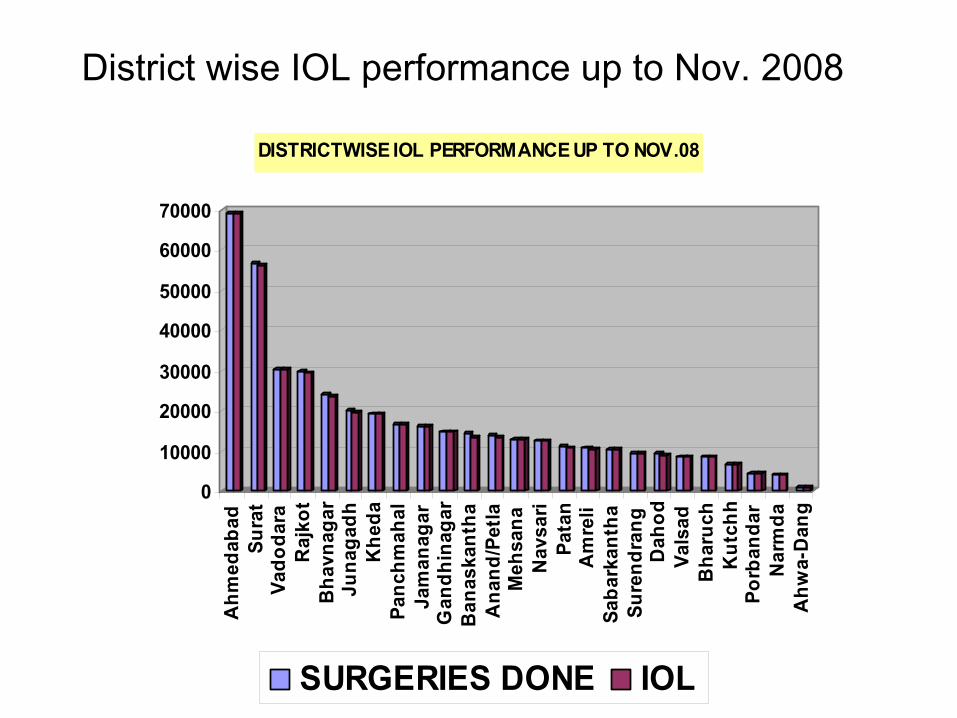
PHYSICAL PERFORMANCE 2008-09 (UP TO NOVEMBER.)82.31
79.22
68.21 67.73 67.1865.11 64.13 64.12 63.54 63.03 62.71
59.7957.10 55.49 55.28 53.86
51.72 50.57 49.70 48.8745.78
42.86 41.2436.72
33.16
0.00
10.00
20.00
30.00
40.00
50.00
60.00
70.00
80.00
90.00
National Programme for Control of Blindness
0
10000
20000
30000
40000
50000
60000
70000A
hmed
abad
Sura
tVa
doda
raR
ajko
tB
havn
agar
Juna
gadh
Khe
daPa
nchm
ahal
Jam
anag
arG
andh
inag
arB
anas
kant
haA
nand
/Pet
laM
ehsa
naN
avsa
riPa
tan
Am
reli
Saba
rkan
tha
Sure
ndra
ngD
ahod
Vals
adB
haru
chK
utch
hPo
rban
dar
Nar
mda
Ahw
a-D
ang
DISTRICTWISE IOL PERFORMANCE UP TO NOV.08
SURGERIES DONE IOL
District wise IOL performance up to Nov. 2008

4558
5
3957
4
8298
9
2705
64398
0
3829
7
7586
2
1916
5
0
20000
40000
60000
80000
100000
120000
Children Examined Children Detected with RE Free Spects Provided
Children Examined 4681583 4645530 5188638 1273053Children Detected with RE 45585 39574 82989 27056Free Spects Provided 43980 38297 75862 19165
2005-06 2006-07 2007-08 2008-09
4681
58
4645
53
5188
63
1273
053
SES ACTIVITY UP TO NOVEMBER 2008.

EYE DONATION ACTIVITIES (UP TO NOVENBER-2008)
• No of Eyes Collected :3861
• No of Eyes Utilized :2918
• No of Eyes sent to other Eye Banks : 943

Integrated Disease Surveillance Project Progress :
• Reporting units – 1544
• 99% Reporting every week.
• Feed-back provided through weekly alert.
• Concerned authority informed to take actions for
increasing trend in disease in respective reporting unit.
Microbiologist are appointed at General Hospital
Gandhinagar & General Hospital Sola Ahmedabad.
Interview of Entomologist, Microbiologist & Epidemiologist
was held on Dt.21-22 November-08 by NHSRC.

IDSP Major Outbreaks Investigated Jan. to Nov.- 08
Progressive
Disease No. of Outbreak Cases Death
Jaundice 5 295 1
Dia-Vomiting 16 829 5
Food Poisoning 20 1187 3
Diarrhoea 3 667 0
Measles 12 227 0
Cholera 3 6 0
Typhoid 2 23 0
Total 61 3234 9

Weekwise Information about Cases of Acute Watery Diarrhoea under IDSP Year - 2007-2008(upto Wk-48)
0
5000
10000
15000
20000
25000
Wk1
Wk3
Wk5
Wk7
Wk9
Wk11
Wk13
Wk15
Wk17
Wk19
Wk21
Wk23
Wk25
Wk27
Wk29
Wk31
Wk33
Wk35
Wk37
Wk39
Wk41
Wk43
Wk45
Wk47
Wk49
Wk51
Wk1
Wk3
Wk5
Wk7
Wk9
Wk11
Wk13
Wk15
Wk17
Wk19
Wk21
Wk23
Wk25
Wk27
Wk29
Wk31
Wk33
Wk35
Wk37
Wk39
Wk41
Wk43
Wk45
Wk47
Year 2007
Year 2008

Year wise comparision of malaria incidence from 2004 to 2007
222807
177936
93071
7129666440
3119919570 18406
0
50000
100000
150000
200000
250000
2004' 2005' 2006' 2007'
Mal
aria
posi
tive
and
P.F.
case
s
Malaria Situation of Gujarat state till March-08
6020
1834
3937
1179
0
1000
2000
3000
4000
5000
6000
7000
Malaria Case P.F.cases
Mal
aria
and
P.F
. cas
e
Constant decline in malaria incidenceAnnual Parasitic Incidence declined from 4.1 in 2004 to 1.2 in 2007
National Vector Born Disease Control Programme
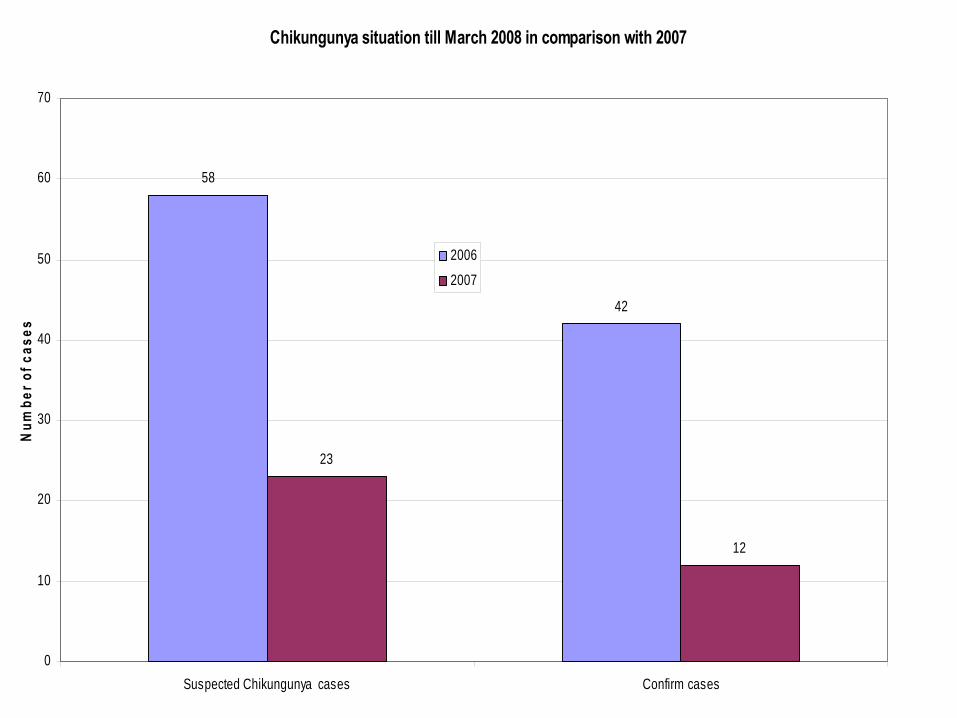
Chikungunya situation till March 2008 in comparison with 2007
58
42
23
12
0
10
20
30
40
50
60
70
Suspected Chikungunya cases Confirm cases
Num
ber o
f cas
es
2006
2007

Overall work done through Sickle Cell Anemia Control Project. during Feb 2006 to March-08.
Screened by Total DTT
Sickle Gene
Sickle Sickle Sickle Beta
Β
Thal.
Sickle Test
Positive Trait Disease Thalesse
mia
Trait
Valsad Raktdan Kendra & Other NGOs
30380 4285 4046 236 2 2
Govt. Medical Collage, Surat
11229 1838 1572 248 18 41
PHCs/CHCs 45382 4607 1762 319 1 0
Civil Hospital, Navsari, Valsad, Dang
6616 366 266 15 0 0
Comprehensive Sickle Cell Clinic Chikhli & Valsad
6404 2777 2329 385 63 101
Total 100011 **13873 *9975 *1203 **84 144
Percentage 13.87 % 8.84 % 1.20 % 0.08 % 0.14 %
** Differentiation of sickle Disease and Trait by HB electrophoresis was not possible in initial phases at CHC, PHC and General Hospital hence only 11,262 samples were further tested out of 13,873 Sickle positive Samples.
Work done through NGOs : 36.8 %
Work Done through Government institutes : 63.2 %

Iodized Salt Sample Tested
0
100000
200000
300000
400000
500000
600000
700000
800000
2001 2002 2003 2004 2005 2006 7-Sep
Year
Num
ber
Total No of samples tested Samples with Nil iodine Samples with < 15 ppm iodine Samples with > 15 ppm iodine
Analysis of Iodized Salt Samples tested with STK
Six regional IDDCP monitoring Laboratories have been developed
National Iodine Disorder Deficiency Control Programme

New Case Detection
72287652
6399
1155410949
10232
6900
0
2000
4000
6000
8000
10000
12000
14000
2001-02 2002-03 2003-04 2004-05 2005-06 2006-07 2007-08
National Leprosy Elimination Programme
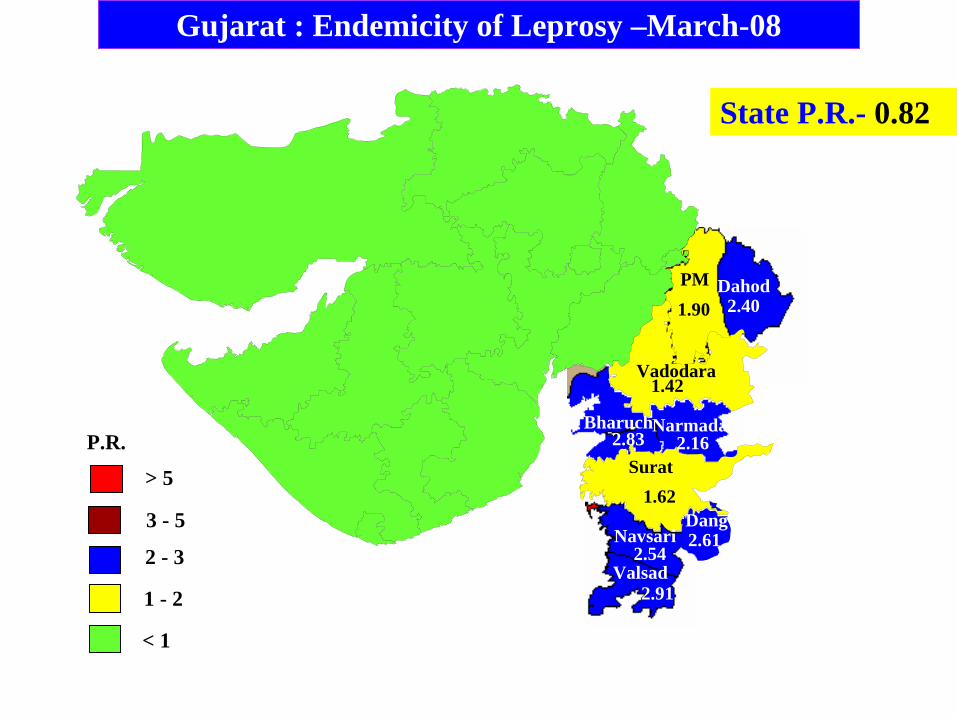
Gujarat : Endemicity of Leprosy –March-08
State P.R.- 0.82
> 5
2 - 3
1 - 2
< 1
P.R.
3 - 5
PM Dahod
Vadodara
BharuchNarmada
Surat
DangNavsari
Valsad
1.90 2.40
1.42
2.83 2.16
1.62
2.612.54
2.91

Present status as on March-2008
Sr.No Indicators 2006-07 2007-08
1 NCD 7652 7228
2 ANCDR 1.34 1.24
3 MB Rate 46.1 (3528) 46.8 (3382)
4 Child Rate 11.34 (868) 10.21 (738)
5 Deformity Rate 2.72 (208) 2.71 (196)
6 Female Rate 44.64 (3416) 44.54 (3219)
7 Pts. on Treatment 4332 4752
8 Prevalence Rate 0.76 0.82


Declining Trend of crude death rate
7.6 7.6
7.9 7.9
7.5
7.8
7.7
7.6
6.9
7.1
7.3
7.1
6.4
6.6
6.8
7.0
7.2
7.4
7.6
7.8
8.0
1996 1997 1998 1999 2000 2001 2002 2003 2004 2005 2006 2007
CDR

‐
6
‐
4
Risk Categorization of Districts 2006
0
20
40
60
80
100
120
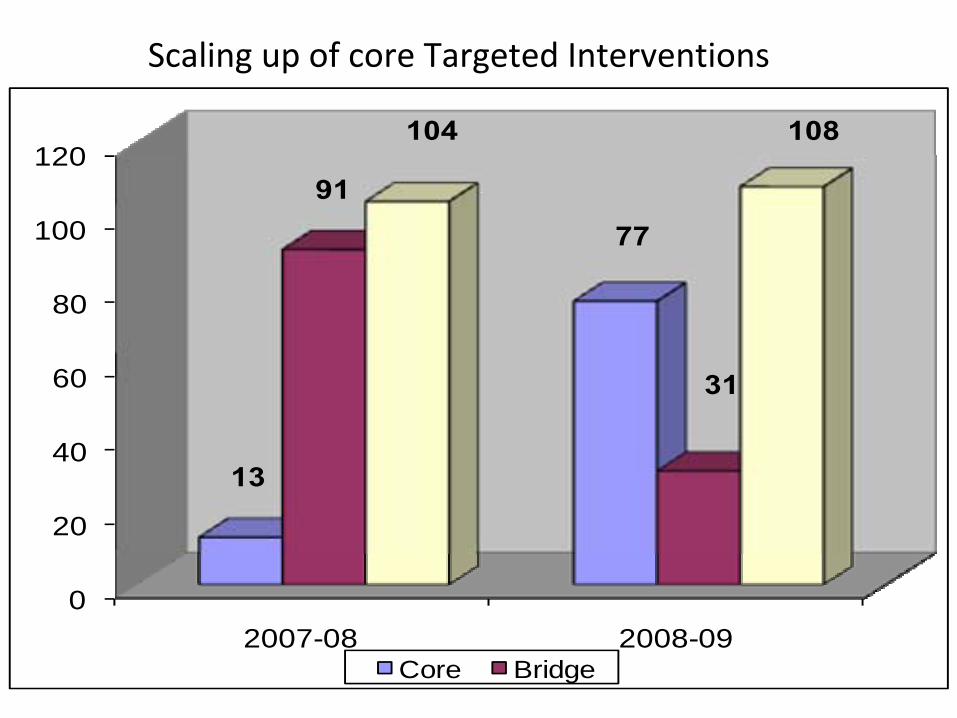
2007-08 2008-09
13
77
91
31
104 108
Core Bridge
Scaling up of core Targeted Interventions
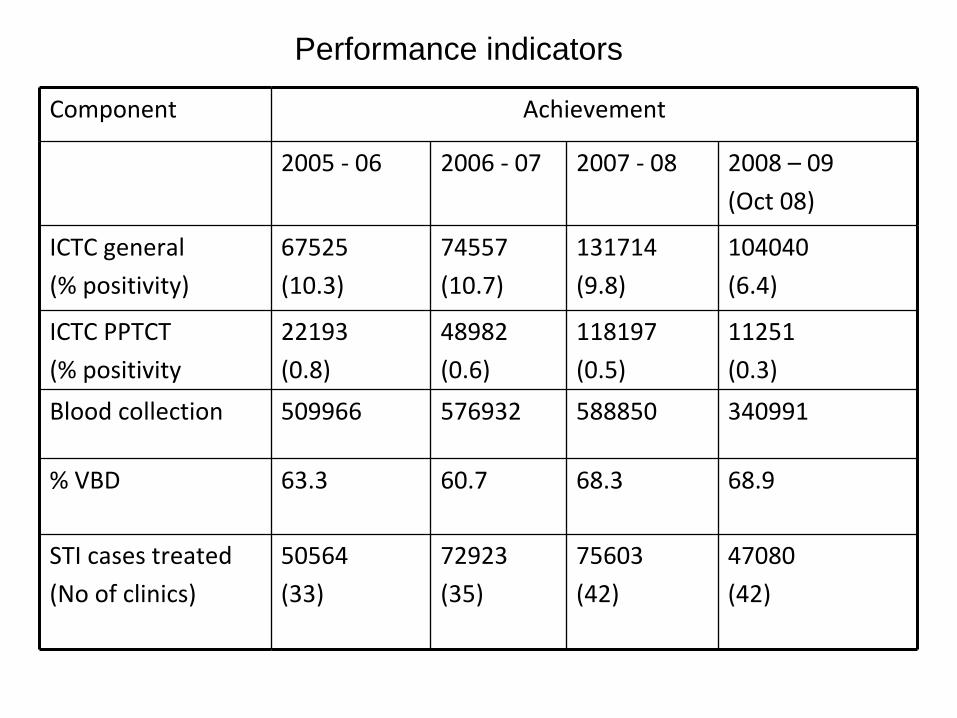
Component Achievement
2005 ‐
06 2006 ‐
07 2007 ‐
08 2008 – 09
(Oct 08)
ICTC general
(% positivity)
67525
(10.3)
74557
(10.7)
131714
(9.8)
104040
(6.4)
ICTC PPTCT
(% positivity
22193
(0.8)
48982
(0.6)
118197
(0.5)
11251
(0.3)
Blood collection 509966 576932 588850 340991
% VBD 63.3 60.7 68.3 68.9
STI cases treated
(No of clinics)
50564
(33)
72923
(35)
75603
(42)
47080
(42)
Performance indicators

IEC, Mainstreaming & Social Mobilization
PPP with Divya Bhaskar
Hon Health Minister addressing WAD 2008
at Surat
also attended by Ms. Prachi
Desai
& Mr. Snehal
Dabbhi
film & TV artists.

Victorious Journey of RRE in Gujarat

Care, support & Treatment (CS & T)
7000 patients are being treated through
• Nodal ART Centers 6 (3 proposed) & LAC 14 (2
proposed)
Operationalization of DAPCU
• 11 districts & Surat city,
• Staff appointed including 5 HIV positives