National Integration in Indonesia - ScholarSpace
381
-
Upload
khangminh22 -
Category
Documents
-
view
0 -
download
0
Transcript of National Integration in Indonesia - ScholarSpace


National Integration inIndonesia

NationalIntegration in
IndonesiaPATTERNS AND POLICIES
Christine Drake
Open Access edition funded by the NationalEndowment for the Humanities / Andrew W.Mellon Foundation Humanities Open BookProgram.
Licensed under the terms of Creative CommonsAttribution-NonCommercial-NoDerivatives 4.0 In-
ternational (CC BY-NC-ND 4.0), which permits readers to freelydownload and share the work in print or electronic format fornon-commercial purposes, so long as credit is given to theauthor. Derivative works and commercial uses require per-mission from the publisher. For details, seehttps://creativecommons.org/licenses/by-nc-nd/4.0/. The Cre-ative Commons license described above does not apply to anymaterial that is separately copyrighted.
Open Access ISBNs:9780824882136 (PDF)9780824882129 (EPUB)This version created: 17 May, 2019
Please visit www.hawaiiopen.org for more Open Access worksfrom University of Hawai‘i Press.
© 1989 University of Hawaii PressAll rights reserved

Contents
Figures vTables ixPreface xiAcknowledgments xiv
1. Introduction 12. The Uneven Effect of Historical and Political
Experiences 163. The Sociocultural Dimension 644. The Interaction Dimension 1015. The Economic Dimension 1366. Spatial Patterns 1717. Government Response to the Need for National
Integration 2128. Retrospect and Prospect 247
Appendixes 264Appendix 1. Provincial Data for the Sociocultural
Dimension 266Appendix 2. Provincial Data for the Interaction
Dimension 268Appendix 3. Provincial Data for the Economic
Dimension 270Notes 272Glossary 313Bibliography 325About the Author 361
iv

Figures
The Provinces of Indonesia1.1. Population density in Indonesia, 1980 81.2. Features of the Indonesian archipelago 112.1. Modern Indonesia and surrounding states 182.2. The extent of the kingdoms of Sri Vijaya and
Majapahit 202.3. The expansion of Dutch authority in the former
Dutch East Indies 313.1. Percentage of the population able to speak the
national language, Indonesian, 1980 673.2. Percentage of the population speaking Indonesian at
home, 1980 693.3. Percentage of the population classified as Muslim,
1980 713.4. Percentage of the population classified as Christian
(both Protestant and Catholic), 1980 723.5. Percentage of the population ten years of age and
over who have completed primary school, 1980 763.6. Percentage of seven to twelve year olds in primary
school, 1980 763.7. Percentage of the population ten years of age and
over who are classified as literate, 1980 783.8. Indonesia’s national symbol: the garuda 793.9. Number of members of agricultural cooperatives per
100 population, 1979–1980 (average) 823.10. Number of Scouts per 100 population, 1981 833.11. Percentage belonging to a social organization in the
three months preceding a survey, 1981 843.12. Number of foreigners claiming Asian citizenship
per 1,000 population, 1981 873.13. Number of people watching an Indonesian-made
movie per 100 population, 1981 89
v

3.14. Percentage of households owning a radio, 1980 893.15. Percentage of the population ten years of age and
over who listened to the radio in the weekpreceding a survey, 1981 90
3.16. Percentage of households owning a television set,1980 91
3.17. Percentage of the population ten years of age andover who watched television in the week precedinga survey, 1981 91
3.18. Number of hospital beds per 10,000 population,1980 93
3.19. Percentage of the population classified as urban,1980 97
3.20. Location and population size of Indonesia’s thirtylargest cities, 1980 98
4.1. Location of railroads in Indonesia, 1980 1044.2. Length of roads of all types and conditions in
kilometers per 1,000 square kilometers, 1982 1064.3. Length of paved roads in kilometers per 1,000
square kilometers, 1982 1064.4. Number of registered vehicles per kilometer of road,
1982 1074.5. Number of registered vehicles per 1,000 population,
1982 1084.6. Income generated by the ports in each province in
rupiahs per capita, 1981–1982 1124.7. Number of air passengers recorded on domestic
flights per 1,000 population, 1981 1144.8. Number of telephone licenses issued per 1,000
population, 1981 1164.9. Number of minutes of telephone conversation within
Indonesia per 100 population, 1980 1174.10. Number of telegrams sent to domestic destinations
per 1,000 population, 1981 1194.11. Percentage of the population who read a newspaper
or magazine in the week preceding a survey,1981 119
4.12. Percentage of the population in each province whohave lived previously in another province, 1980 121
4.13. Province of last previous residence ofinterprovincial migrants, 1980 122
4.14. International and domestic exports: cargoes loadedin tons per 100 population, 1982 130
Figures
vi

4.15. International exports: cargoes loaded in tons per100 population, 1982 132
4.16. Value of imports received from international tradein U.S. dollars per capita, 1982 132
4.17. Interprovincial exports: cargoes loaded in tons per100 population, 1982 135
4.18. Interprovincial imports: cargoes unloaded in tonsper 100 population, 1981–1982 (average) 135
5.1. Regional gross domestic product per capita inthousands of rupiahs per capita, at current marketprices, without oil, 1980 146
5.2. Consumer price index in the capital city of eachprovince, 1981 148
5.3. Percentage of the population living below thepoverty line, 1980 149
5.4. Percentage of the population living in deprivation,1980 150
5.5. Percentage of households owning a sideboard,1980 151
5.6. Percentage of households using electricity forlighting, 1980 152
5.7. Percentage of households using kerosene, gas, orelectricity for cooking, 1980 153
5.8. Provincial tax contributions to the centralgovernment in thousands of rupiahs per capita,1980–1981 155
5.9. Provincial government expenditures (operating anddevelopment) in thousands of rupiahs per capita,1980–1981 155
5.10. Central government support for provincialdevelopment programs in thousands of rupiahs percapita, 1980–1981 156
5.11. Average annual percentage growth rate of regionalgross domestic product at constant 1975 marketprices, 1976–1980 158
5.12. Approved domestic investment projects, excludingthe oil, insurance, and banking sectors, inthousands of rupiahs per capita, 1968–1982 162
5.13. Approved foreign investment projects in U.S.dollars per capita, 1967–1982 162
5.14. Percentage of the labor force employed inagriculture, forestry, fishing, and hunting, 1980 169
6.1. Factor scores of sociocultural factor 1 (urban/media) 182
Figures
vii

6.2. Factor scores of sociocultural factor 2 (religion) 1836.3. Factor scores of sociocultural factor 3 (literacy/
language) 1836.4. Factor scores of sociocultural factor 4 (cooperative
membership/Asian citizens) 1846.5. Factor scores of interaction factor 1
(urban-related) 1896.6. Factor scores of interaction factor 2 (sea
transportation/road density) 1906.7. Factor scores of economic factor 1 (economic
development) 1966.8. Factor scores of economic factor 2
(modernization) 1976.9. Factor scores of economic factor 3 (growth/
investment) 1976.10. Provinces grouped according to their common
characteristics, 1980 2067.1. Development regions and growth centers in
Indonesia 229
Figures
viii

Tables
1.1. Area, population, population density, and percentageurban by province, 1980 9
3.1. Percentage urban by province, 1961, 1971, and1980 95
3.2. Size and growth rates of Indonesia’s thirty largestcities, 1971–1980 99
4.1. Major ports of Indonesia ranked by income recorded,1981–1982 113
4.2. Migration to Jakarta 1234.3. Number of government-sponsored transmigrants,
1969–1983 1255.1. Relative importance of mining and agriculture in
each province’s regional gross domestic product,1979 144
5.2. Per-capita regional gross domestic product (RGDP)and RGDP growth rates by province 160
6.1. Correlation matrix of selected socioculturalvariables 0
6.2. Rotated factor loadings in the socioculturaldimension 178
6.3. Eigenvalues and percentages of the variance in thesociocultural dimension 179
6.4. Communalities in the sociocultural dimension 1806.5. Factor scores of the sociocultural factors 1816.6. Correlation matrix of selected interaction
variables 1856.7. Rotated factor loadings in the interaction
dimension 1866.8. Eigenvalues and percentages of the variance in the
interaction dimension 1876.9. Communalities in the interaction dimension 1876.10. Factor scores of the interaction factors 188
ix

6.11. Correlation matrix of selected economicvariables 191
6.12. Rotated factor loadings in the economicdimension 193
6.13. Eigenvalues and percentages of the variance in theeconomic dimension 193
6.14. Communalities in the economic dimension 1946.15. Factor scores of the economic factors 1956.16. Correlation coefficients of the nine factors
extracted in the analysis of the sociocultural,interaction, and economic dimensions of nationalintegration 199
6.17. Ranks of the provinces based on the factor scoresof the six most pertinent factors 204
Tables
x

Preface
ONE of the most important problems confronting developingcountries is how to promote national integration—how to bindtogether the various regions and diverse peoples of a countryinto a well-functioning and interdependent whole. Cohesiveforces are essential not only to ensure the continued existenceof the nation-state as one political entity and give political sta-bility, but also to enable economic development to take place.For without some measure of integration, both human andmaterial resources that are needed to raise living standardsmust be diverted instead toward coping with the centrifugalforces of regional disaffection or rebellion.
National integration is particularly important in Indonesiabecause of its great size and the enormous diversity of itspeoples. Indonesia stretches almost 5,000 kilometers from westto east and consists of about 6,000 inhabited islands. Its popu-lation of over 175 million (the fifth largest in the world) is veryunevenly distributed, with almost two-thirds of the people livingon the less than 7 percent of the land area that makes up theisland of Java. In addition, the levels of economic developmentand participation in the life of the nation vary considerably inthe different regions.
This study analyzes the four basic dimensions of national in-tegration in Indonesia, the historical, sociocultural, interaction(transportation and communications), and economic, as theymanifest themselves in the country’s twenty-seven provinces.Each dimension incorporates a large variety of specific charac-teristics, the most important of which are analyzed separatelyin terms of their value in promoting the integration of theprovinces into the nation-state. The spatial patterns of thevarious characteristics in each dimension are then examinedthrough statistical analysis and the extent to which these rein-force one another is considered. This part of the study is based
xi

on the 1980 census and other recent materials that provide dataat the provincial level. Finally, government policies that relateto national integration are examined and evaluated and theproblems that continue to confront the country as it attempts toincrease both national cohesion and economic development arediscussed.
This book was inspired by my undergraduate work at Oxfordand graduate work at Rutgers, and by the opportunity to spendfive years in the early 1970s living and working in the “pe-ripheral” Indonesian province of North Sulawesi. During thosefive years I traveled in almost half of Indonesia’s provinces andexperienced first hand many of the challenges facing the nation-state. The contrast between Java and the Outer Islands was verystriking in terms of infrastructure, accessibility, and the avail-ability of commodities. Yet the plight of ordinary peasants every-where seemed remarkably similar as they struggled to survive,to provide for their families, and to improve their standard ofliving. A return visit in 1985 revealed the considerable progressthat had been made in many aspects of development and na-tional integration, thanks to the increased oil revenues gen-erated during the 1973–1983 petroleum decade. However, lifefor the ordinary Indonesian remains hard: the currency hasbeen devalued several times, and wages for most workersremain below $1 per day. Resistance to integration, thoughmuted, continues in Irian Java and East Timor. But overall, thecountry has made remarkable strides in attaining greater co-hesion and is probably more fully integrated now than at anytime in its history. Significant improvements have been made inall the major dimensions of integration. These are discussed indetail in the book.
The spatial patterns of the characteristics of each dimensionof national integration, calculated on a per-capita or per-unit-area basis for each province, are illustrated in a number ofmaps. On each map the provinces have been divided into fivecategories by ranking their data on the characteristic underconsideration and using the natural breaks in the data to de-lineate the categories. Technically, Jakarta, Aceh, and Yo-gyakarta are not provinces, although they are considered assuch in this book. Jakarta is officially known as Daerah KhususIstimewa (D.K.I. Jakarta: the Very Special Region of Jakarta),and Aceh and Yogyakarta are Daerah Istimewa (D.I. Aceh andD.I. Yogyakarta: Special Regions of Aceh and Yogyakarta).However, for convenience these special designations have beenomitted in the text and tables.
Preface
xii

Places are described using their official names at the periodof history being discussed. The island known in Dutch colonialtimes as Celebes is referred to in the post-independence periodby its authentic and official name, Sulawesi. The term Borneo isused to refer to the whole island, with the Indonesian part beingreferred to by its older, now official name, Kalimantan. The partof western New Guinea that is an official province of the Re-public of Indonesia, known in the past as West Irian or IrianBarat, had its name changed officially in 1972 to Irian Jaya.The Spice Islands are known both by their Indonesian name,Maluku, and by their English equivalent, the Moluccas. Finally,the islands commonly known in English as the Lesser Sunda Is-lands are referred to by their Indonesian name, Nusatenggara.The names of provinces have been capitalized, for example WestJava and North Sumatra, to distinguish them from the geo-graphical areas of western Java and northern Sumatra, whichare not coterminous.
For the sake of consistency, all Indonesian terms (includingplace names) are written in their modern forms, with spellingchanged to correspond to the new spelling (ejaan baru) an-nounced by President Suharto in 1972. Thus:
dj becomes j (as in Djakarta, now officially Jakarta);j becomes y (wajang is now officially wayang);tj becomes c (Pantja Sila is now officially Panca Sila, with the
c pronounced as in the English ch);c becomes k (Macassar is now officially Makassar);sj becomes sy (Sjariat is now officially Syariat, with the sy
pronounced as in the English sh).
Similarly, the old Dutch spelling, oe, as in Soekarno, waschanged officially in 1947 to the modern form, u (pronouncedoo), as in Sukarno (although traditional spelling is still widelyused in proper names).
Preface
xiii

Acknowledgments
I am profoundly grateful to all who have aided in this study.Those who have contributed to the thoughts and ideas in thisbook include Arthur Getis, John E. Brush, Salah El Shakhs,Shanti Tangri, Karl J. Pelzer, Benedict R. Anderson, HildredGeertz, Julian Wolpert, Robert G. Gilpin, Michael R. Greenberg,Guido G. Weigend, A. Peter Vayda, Briavel Holcomb, J. KennethMitchell, Bonham C. Richardson, Josef Silverstein, Phyllis M.Frakt, Ernest L. Fogg, Ron Foresta, George W. Carey, andCharles Ogrosky. My deep appreciation is due especially tothose in Indonesia, including the following who have sharedwith me their understanding and perspectives: Willi Toisuta,Nico Kana, John Ihalau, Sutarno, Arief Budiman, John Titaley,John Lengkong, Lieke Palenewen, Jantje and Bea Pandeirot,Bert Supit, William and Patmah Langi, and Boetje Pitna. Manyothers through valuable conversations have also given me a farfuller insight than they can realize into their national heritageand ideals. Gratitude is due also to several of the Indonesiangovernment departments whose publications and correspon-dence have furnished much of the basic statistical material.Among the libraries I have used, three have been particularlyvaluable: I wish to thank the professional staff at Cornell Uni-versity Library, the Library of Congress, and the Hughes Libraryat Old Dominion University. Inevitably, because of my extensiveresearch and reading I may have seen and perhaps cited infor-mation whose source I no longer remember. I express appreci-ation to those who may have been quoted inadvertently withoutacknowledgment and hope that their forgiveness will be gen-erous.
xiv

I am grateful to the College of Arts and Letters at Old Do-minion University for research leave that enabled me to returnto Indonesia to complete my research in the spring of 1985, andfor two research grants that helped to defray some of the costsof producing the manuscript.
Thanks are also extended to Susan Cooke Hoebeke who ex-ecuted the maps; to Norris Stowe and Garland White for helpwith the statistical analysis; to Van Buggs, Cathy Neprud, andEmily Pickering for their help with the typing of the manuscript;and to the two anonymous readers who made many helpful com-ments and suggestions.
Finally, my deepest thanks go to my husband, Frank, forhis constant and invaluable support, ideas, involvement, andediting skills in the preparation of this book. Both his help andthe forbearance and love of our children, David and Jenny, con-tributed so much. Of course, I remain responsible for any inac-curacies, mistakes, and errors, of which I hope there are few.
Acknowledgments
xv

National Integration inIndonesia

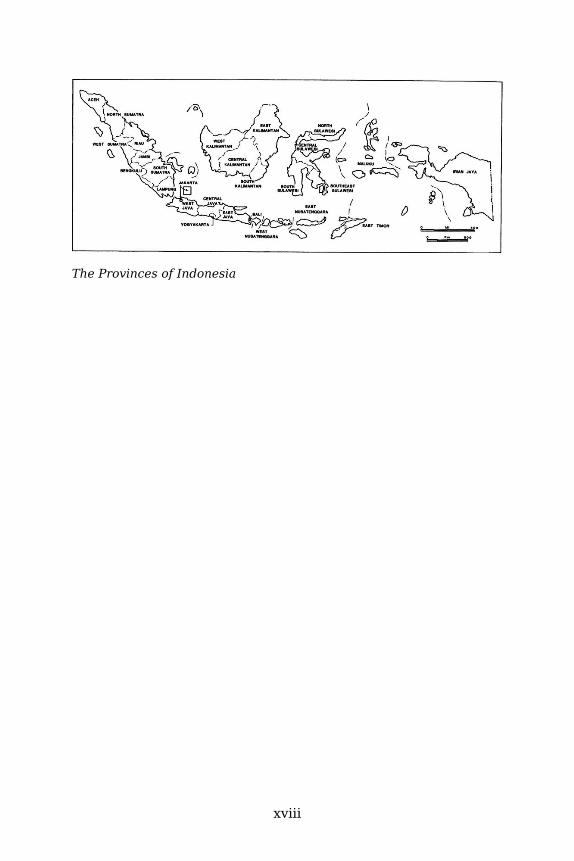
The Provinces of Indonesia
xviii

1Introduction
WHAT is it that holds a nation-state together? Why do somecountries suffer from internal conflicts that lead to regionalrebellions, civil war, or even the permanent breakup of thestate? Conversely, why do other countries remain united, able tocontain and benefit from diversity, with strong integrative links?What are the critical elements that bind the disparate parts of acountry together and nurture a common sense of unity? 1
As with so many issues, it is easier to ask questions than tosupply answers. Yet an analysis of states that have split up, suchas Pakistan, the British West Indies, the Federation of Rhodesiaand Nyasaland, and French West and Equatorial Africa, and anexamination of countries that have undergone civil war, such asNigeria, Chad, Lebanon, and the Republic of the Sudan, suggestthat certain elements are crucial to maintaining the unity of anation-state. Essential elements exist in the historical and po-litical, sociocultural, interaction (transportation and communi-cations), and economic dimensions, all of which will be exploredin detail in this book.
Almost all countries are deeply concerned about national in-tegration—the need to bind together the various regions anddiverse peoples of a country into a functioning and interde-pendent whole. But integration is especially important in theThird World, where national boundaries were superimposed bythe colonial powers without considering the wishes of the inhab-itants, and where there has been insufficient time and oppor-tunity for countries to break down the geographical and culturalbarriers dividing different ethnic groups within the country.The problems are especially great in large developing coun-tries, where greater diversity and greater distances accentuatethe problem of achieving national unity. Such is the situation
1

in Indonesia, a physically fragmented country extending morethan 5,000 kilometers from west to east and containing extraor-dinary geographical and cultural diversity.
Cohesive forces are vital both to ensure the continued exis-tence of the nation-state as one political entity and give politicalstability, and to enable economic development to take place.For without some measure of integration, both human and ma-terial resources that are needed to raise living standards mustbe diverted instead toward coping with the centrifugal forcesof regional disaffection or rebellion. The success of a country’seconomic development also depends to a considerable extenton the strength of its integrative, cohesive bonds, so that thealmost inevitably uneven spatial impact of development doesnot unduly exacerbate regional differences and tensions andlead to disintegration. An understanding of the spatial patternsof national integration is therefore essential in economic devel-opment planning.
National integration is a multidimensional, complex, and dy-namic concept, involving a great variety of interlocking ele-ments that operate separately to some extent but yet are alsointeracting, cumulative, and generally mutually reinforcing.Indeed, integration is a holistic concept in which the totality ofthe separate aspects is greater than the sum of the differentparts.
National integration incorporates a number of different di-mensions. Four stand out as particularly important. First,common, integrative, historical experiences obviously act as acohesive force. These range from shared suffering to commonachievements and include a great variety of historical and po-litical experiences, both major and minor, that have becomepart of the common heritage of a country.
Second, shared sociocultural attributes can help give anation-state its identity, distinguish it from surrounding states,and enable its citizens to feel a sense of unity. Shared charac-teristics that enhance a feeling of nationhood include a commonlanguage, common cultural features associated with religiouspractice as well as other cultural elements, and opportunitiesto belong to nationwide organizations and share in common na-tionwide activities.
Third, interaction among the diverse peoples within anation-state promotes integration, especially among those whoshare various sociocultural attributes. Thus, all kinds of
Introduction
2

movement and communication among provinces are important,including land, sea, and air transportation links, radio, tele-vision, and telephone communications, migration, and trade.
Fourth, regional economic interdependence and somemeasure of regional balance in economic development are fun-damental to national integration. A perception that standards ofliving are improving and that there is some measure of equity inthe location of new industrial growth and development schemesmay be of more importance to national integration than eco-nomic growth per se. Indeed, geographically unbalanced eco-nomic development, by which one area of the country or onegroup of people is seen to benefit disproportionately, can be de-cisively disintegrative.
National integration depends upon a fundamental balanceamong these four major historical-political, sociocultural, inter-action, and economic components—a dynamic equilibrium. Ifone component is neglected or becomes out of balance, disinte-grative forces may emerge that can threaten a state’s stabilityor even its continued existence.
National integration is also highly complex. Part of the com-plexity arises from the way that the factors of integration op-erate at different levels; indeed, increased integration at onelevel may result in less cohesion at another. For example, anintegrated network of extended family members with the typ-ically deep kinship ties, expectations, and obligations found inFar Eastern cultures contrasts with hostility among major pow-erful families. Similarly, rural life may be integrative at the locallevel, with mutual help groups functioning to strengthen bondsamong neighbors; but these groupings may at the same time ac-centuate the fact that certain people are excluded. Rural areasmay seem less integrated into the whole than urban areas, es-pecially when contact among rural communities is minimal; yetwhere people are brought into closer proximity and greatercontact with one another in urban surroundings, disintegrativefactors such as ethnic and social differences may be accen-tuated. Heightened ethnic awareness frequently occurs as dif-ferent ethnic groups live close together in urban areas, 2 whilecontrasts between rich and poor, also brought into sharp reliefin an urban context, can easily trigger dissatisfaction, anotherdisintegrative force. The political implications of this dissatis-faction help to explain the greater attention characteristicallygiven in development plans to urban centers. A disproportionateamount of investment designed to relieve disruptive, disinte-grative political pressures, especially in the capital cities of de-
National Integration in Indonesia
3

veloping countries, however, serves to attract greater migrationand, through the process of cumulative causation, to increasethe degree of primacy and the vulnerability of the city and itsgovernment to political pressure. In addition, the gap betweencity and countryside is also widened. One of the concerns,therefore, of developing countries is to increase the degreeof integration between city and countryside, between regionalcapitals and their hinterlands, and to improve the integrativefunction of a network of urban places. Economic development isstrongly related to the degree of integration at this level. 3
Other sociocultural elements can be integrative at one levelbut disintegrative at another. For example, Hinduism acts asa cohesive force among the Balinese but distinguishes themclearly from most other Indonesians, who are Muslim. Anothercomplication is that “paradoxically aspects of integration anddisintegration can both occur at the same time, and may evenbe causally related.” 4 The situation of the Chinese in Indonesiaillustrates this point well. Their trading network and close cul-tural ties throughout the Indonesian archipelago make theman integrative force in one respect. But their conspicuous cul-tural differences and economic wealth and power distinguishthem from the rest of Indonesian society. Yet even this disinte-grative element has an ironic integrative twist, for, by being ob-viously different, they become a common target for the hostility,resentment, and frustration of other Indonesian citizens—thusbinding these non-Chinese Indonesians more closely togetherthan they would otherwise be.
Similarly, other seemingly integrative forces may have para-doxical effects. For example, increased commonality in one so-ciocultural element, such as the ability to speak a commonlanguage, may throw into relief other differences such as re-ligion, way of life, or social status. Even such key commonalitiesas religion, language, and culture may vary in importance indifferent national contexts. Thus, linguistic differences create abarrier to national unity in Belgium but not in Switzerland, inIndia but not in Tanzania. Religious differences cause few ten-sions in the United States, but are a potent disintegrative forcein Northern Ireland and Lebanon. Furthermore, socioculturalfeatures may not necessarily be critical in and of themselves,but may assume disproportionate importance when they rein-force other differences such as the actual or perceived distrib-ution of power or economic disparities.
Introduction
4

Any analysis of national integration, therefore, must be at-tempted with extreme care. In any given situation, individualcohesive characteristics have to be considered separately interms of their importance, their integrative roles, and their in-teraction with other elements.
Integration is also a dynamic concept. The subdivisions ofa national entity may change in their level of integration intothe national whole over time. Once integrated does not meanalways integrated, as the Scottish and Welsh nationalist move-ments within the United Kingdom have clearly demonstrated.The degree of integration reflects clearly the political lead-ership and its priorities. For example, the special treatment af-forded by the Dutch to the Indonesian regency (kabupaten) ofMinahasa in North Sulawesi was not continued by the Javanese-dominated regime after independence; this led to anti-Javaneserevolts there. Concern for national integration has resulted po-litically in suppression and increased domination by the centralgovernment and, under Sukarno, in the use of contrived ex-ternal enemies to stimulate nationalistic emotions and deflectattention from internal regional tensions. The costs, however,of these policies have been considerable, in terms both of lostopportunities for economic development and of the actual costsin people and materiel. Integration needs careful nurturing toensure that constructive, centripetal, integrative forces consis-tently prevail over destructive, centrifugal, divisive ones.
Yet does integration mean the extension of control by thecentral government into all regions and levels of society, the “in-creasing dominance of the core over the periphery in a spatialsystem,” as Friedmann has expressed it? 5 Or is it shared power,fair representation, and participation by people from every partof the country in every aspect of the national life and gov-ernment?
Certainly at the structural level in Indonesia, the centralgovernment has control over the entire area of the statethrough the channels and hierarchies of a unified framework.There are five levels of government, which extend to everytiny island, paralleled by a five-tier military command structure.Structurally, the central government has control over the po-litical life and the educational, health, communications, andother facilities. Functionally, however, integration depends onmore than just control by the central government and verticalresponse to it. It involves the mutual interdependence of re-gions and regional participation in national affairs. This dis-tinction is comparable to the difference between national inte-
National Integration in Indonesia
5

gration and nationalism. Nationalism is concerned with evokingpatriotic, nationalistic emotions, feelings that are important inovercoming local regionalisms and particularisms, and empha-sizes vertical links to the center. National integration, by con-trast, is a much broader and more inclusive concept, concernedwith lateral as well as vertical linkages. It focuses on the func-tioning interaction and mutual interdependence of the diverseparts of the state, ties that continue largely independently ofthe strength of nationalistic emotion. Obviously this is a muchstronger type of relationship than the one nationalism createson its own. It is interesting to note that the collapse of the WestIndies Federation has been attributed precisely to the lack ofthese lateral linkages among the islands. 6
Many studies on national integration in the past have dealtwith the topic sectorally, from the perspective of the politicalscientist, sociologist, anthropologist, or economist. 7 In thisbook, the focus is upon the spatial aspects of national inte-gration. This includes an evaluation of historical experiences:the extent to which these have been integrative and shared byall parts of the country, an analysis of the spatial distribution ofsociocultural commonalities and the degree to which these areinterdigitated or concentrated in particular regions, a consider-ation of the degree to which interaction takes place among thediverse areas and peoples of the state, and a study of the extentto which all parts of the country share in economic growth anddevelopment. These different dimensions of integration are thensynthesized in an analysis of common spatial patterns of na-tional integration.
Obviously the level of national integration does not de-termine the political stability of a country. Yet it does have aprofound effect upon the way a country withstands the politicalstresses and strains imposed upon it from both outside andinside the country. It comprises the stage upon which the po-litical actors play out their roles. As Deutsch has put it:
A basic survey of geographical patterns, settlement, transport,areas of different language dialects, cultures, etc., would notgive us an answer about the future success or failure of politicalunity. The final decision would come from the realm of politics—aleader, a movement, or a political party—but the surveys wouldhelp us to start out with a more detailed and realistic picture ofthe very uneven world in which politics must function. 8
Introduction
6

National integration is a matter of particular concern in In-donesia because of the great diversity of both its geographicalenvironments and its peoples. Indonesia consists of over 13,000islands (about 6,000 of which are inhabited) with a 1988 popu-lation of over 175 million, the fifth largest in the world, which in-corporates enormous ethnic and cultural diversity. In addition,people range in their levels of development and sophisticationfrom the Stone Age inhabitants in the inland mountainous areasof Irian Java to the most modern and cosmopolitan urbandwellers of the major cities.
One of the most significant geographical facts about In-donesia is its uneven population distribution. As can be seenfrom both Figure 1.1 and Table 1.1, the contrast is betweenJava and Madura, where in 1980 over 91 million people, oralmost two-thirds of the Indonesian population, lived on lessthan 7 percent of the land area, and where average populationdensities in 1980 were 690 persons per square kilometer (withneighboring Bali having a slightly lower but also relatively highpopulation density of 444 persons per square kilometer); andthe Outer Islands, where average population density nowhereexceeded 139 persons per square kilometer. By way of strikingexample, in 1980 the entire population of Kalimantan (6.7million) was only slightly larger than that of the capital city ofJakarta (6.5 million).
This demographic contrast underlies many of the problemsand tensions of the Indonesian nation-state. It has also givenrise to the general acceptance of a core-periphery model thatconsiders Java and Bali as a congested nuclear core and theOuter Islands as an underdeveloped, sparsely populated pe-riphery. Although this core-Outer Islands dichotomy may appearsimplistic in a country with the size and diversity of Indonesia,it is well established in the literature. 9
The physical features of the Indonesian archipelago havehad a strong impact upon the population distribution and thelevels of development within the country. There is a clear dis-tinction between the larger islands of Sumatra, Borneo, Java,and New Guinea, which rest at least in part on two fairly ex-tensive continental shelves (the Sunda and Sahul shelves) andhave extensive coastal lowlands fringing shallow seas; and theislands to the east of Bali and Borneo and west of New Guinea,which rise abruptly from great ocean depths and have virtuallyno coastal plain at all (see Figure 1.2). 10 The great coral reefsoff the west coast of Sumatra and especially along the edge ofthe Sunda shelf in the Makassar Straits and Flores Sea have
National Integration in Indonesia
7

Figure 1.1. Population density in Indonesia, 1980. Based on data fromthe 1980 population census in Biro Pusat Statistik, Statistik Indonesia1983‚ Buku Saku‚ Table II.1.3
played an important part in deflecting shipping routes whereverpossible to the generally coral-free sea covering the Sunda shelfbetween Sumatra, the Malay Peninsula, Java, and Borneo. In theeastern part of the archipelago, coral reefs and frequently swiftocean currents combine to make navigation more hazardous.
This geological background has had many effects on thegeographical environment of the archipelago. It is responsiblefor the accessibility of much of the land area and has enabledthe sea to become a common link among coastal dwellers whodepend upon it for their source of livelihood, both for food andfor commerce. It has led to the development of vast swampsalong the edges of the islands on the continental shelf, partic-ularly in eastern Sumatra, western and southern Borneo, andsouthwestern New Guinea. It has affected the topography andthe types of soil found in the different islands and consequentlytheir different potential for agriculture. And it has determinedthe location of mineral resources found beneath the soil: pe-troleum and natural gas, coal, tin, nickel, copper, and otherores.
These physical differences underlie the uneven developmentof the islands. Java compares favorably with many of the otherislands in the archipelago in a number of ways. Its relativelycentral location within Indonesia, its smaller size and elongatedshape, and its general freedom from coastal swamps affordgreater access than that which exists in Sumatra (with its pre-cipitous western highlands and eastern swamplands and silted
Introduction
8
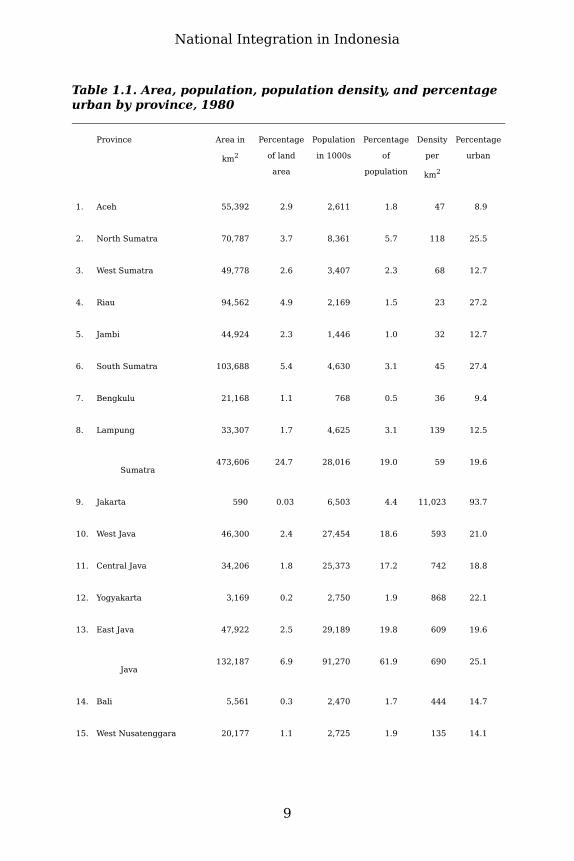
Table 1.1. Area, population, population density, and percentageurban by province‚ 1980
Province Area in
km2
Percentage
of land
area
Population
in 1000s
Percentage
of
population
Density
per
km2
Percentage
urban
1. Aceh 55,392 2.9 2,611 1.8 47 8.9
2. North Sumatra 70,787 3.7 8,361 5.7 118 25.5
3. West Sumatra 49,778 2.6 3,407 2.3 68 12.7
4. Riau 94,562 4.9 2,169 1.5 23 27.2
5. Jambi 44,924 2.3 1,446 1.0 32 12.7
6. South Sumatra 103,688 5.4 4,630 3.1 45 27.4
7. Bengkulu 21,168 1.1 768 0.5 36 9.4
8. Lampung 33,307 1.7 4,625 3.1 139 12.5
Sumatra473,606 24.7 28,016 19.0 59 19.6
9. Jakarta 590 0.03 6,503 4.4 11,023 93.7
10. West Java 46‚300 2.4 27‚454 18.6 593 21.0
11. Central Java 34‚206 1.8 25,373 17.2 742 18.8
12. Yogyakarta 3,169 0.2 2,750 1.9 868 22.1
13. East Java 47‚922 2.5 29,189 19.8 609 19.6
Java132,187 6.9 91,270 61.9 690 25.1
14. Bali 5,561 0.3 2,470 1.7 444 14.7
15. West Nusatenggara 20,177 1.1 2,725 1.9 135 14.1
National Integration in Indonesia
9

16. East Nusatenggara 47,876 2.5 2,737 1.9 57 7.5
17. East Timor 14,874 0.8 555 0.4 37 n.a.
Nusatenggara88,488 4.6 8,487 5.8 96 12.0
18. West Kalimantan 146,760 7.7 2,486 1.7 17 16.8
19. Central Kalimantan 152,600 8.0 954 0.7 6 10.3
20. South Kalimantan 37,660 2.0 2,065 1.4 55 21.4
21. East Kalimantan 202,440 10.6 1,218 0.8 6 40.0
Kalimantan539,460 28.1 6,723 4.6 12 21.5
22. North Sulawesi 19,023 1.0 2,115 1.4 111 16.8
23. Central Sulawesi 69,726 3.6 1,290 0.9 18 9.0
24. South Sulawesi 72,781 3.8 6,062 4.1 83 18.1
25. Southeast Sulawesi 27,686 1.4 942 0.6 34 9.4
Sulawesi189,216 9.9 10,410 7.1 55 15.9
26. Maluku 74,505 3.9 1,411 1.0 19 10.9
27. Irian Jaya 421,981 22.0 1,174 0.8 3 21.4
Maluku &
Irian Jaya
496,486 25.9 2,585 1.8 5 15.5
Indonesia1,919,443 100.0 147,490 100.0 77 22.4
n.a.: not available
Introduction
10

Figure 1.2. Features of the Indonesian archipelago.
rivers), Kalimantan (with its fairly short coastline, poordrainage, and lack of natural harbors), Sulawesi (with its frac-tured and fragmented mountainous interior), and Irian Java(with its rugged terrain in the north, swampland in the south,and location away from the main trading routes).
Java is endowed with many volcanoes, which are more activeand provide more chemically basic ejecta than those in mostother parts of the archipelago (particularly in Sumatra wherethe volcanoes are less active and produce more acidic ash andlava). The absence of volcanoes in other parts of the islandchain means that soils have developed from very differentparent rocks, which are often deficient in plant nutrients. Thevolcanic ejecta in Java generally produce more fertile soils thatare renewed at a rate faster than the leaching process. 11 Sim-ilarly, the enormous amount of sediment carried by Indonesia’srivers provides valuable plant nutrients in the case of Java, sincemuch of it is derived from the volcanic interior. Java’s relief pro-vides another advantage in that its scattered volcanic peaks areseparated by gently sloping, interconnected valleys that facil-itate terracing and the efficient use and reuse of nutrient-ladenwater.
Climatically, there is considerable variation in both theamount and the seasonality of the rainfall, and the ubiquitouslyhot sea-level temperatures (Indonesia is bisected by theequator) are modified by altitude and aspect. Although manylocalized dry seasons occur as a result of the topography inrelation to the direction of the prevailing monsoon winds, the
National Integration in Indonesia
11

major climatic contrast is between much of the archipelago,which experiences constant, year-round rainfall, and the south-eastern area, which experiences a marked dry season that in-creases in duration with proximity to the Australian continentand the influence of its high-pressure system in the months ofApril to September. This leads to more open deciduous forestand even to savanna vegetation in the eastern part ofNusatenggara and to reduced leaching, but increased vari-ability in the rainfall results also in wind erosion and difficultperiods of drought that affect the double-or triple-cropping po-tential of the land for agriculture. Java occupies an intermediateposition between the continually wet lands of Sumatra and Kali-mantan and the marked seasonal droughts that characterizeNusatenggara. 12
It is, thus, easy to see that Java possesses a unique com-bination of favorable climate, soils, drainage, and accessibility,which underlies and helps to explain Java’s greater potential fordevelopment and the decision of the Dutch colonial power tofocus its attention on that island.
Physical factors contribute also to the two very differentagricultural systems that are found in Indonesia: the swidden(shifting) cultivation system, which involves the use of unirri-gated fields (ladang) and is typical of the Outer Islands; and theintensive wet-rice cultivation system (sawah), found predomi-nantly in Java (and Madura and Bali).
Physical diversity in Indonesia is matched by cultural andeconomic variety. Scattered among the islands of Indonesia arenumerous tribal and ethnic groups that vary on almost everypossible index. In kinship systems, some are patrilineal (suchas the Balinese), some matrilineal (such as the Minangkabau),and others bilateral (such as the Acehnese). In location and eco-nomic activity, some inhabit isolated villages in remote, moun-tainous interiors where they practice shifting cultivation or relyprimarily on hunting and food gathering; others live along thecoasts and depend mainly on fishing; many are wet-rice farmerslocated in broad river valleys and extensive lowland areas; mil-lions more are city dwellers. Some (particularly in Java and Balibut also in pockets of the Outer Islands such as parts of Mi-nahasa and the area around Ujung Pandang in Sulawesi) liveat extremely high population densities while others inhabit vastjungle areas at very low densities. Some societies have hada long history of communication and contact with the outsideworld; others are just now being settled in villages and broughtinto contact with people from other parts of Indonesia. Although
Introduction
12

22 percent of Indonesia’s population was classified as urban in1980, there are considerable differences in the degree of so-phistication of both the urban and rural masses. The peoplevary, too, in their religious adherence, both in terms of thereligion they follow (nearly all of the world’s major religionsare represented, including Islam, Christianity, Hinduism, Bud-dhism, and Confucianism) and in terms of the degree of theircommitment and the purity of their faith. Each ethnic group hasits own language or dialect, customs, and culture; each varies inits degree of involvement and participation in national events.
Gross correlations have been observed between sociocul-tural patterns and ecological-economic divisions, and broadcomplexes of peoples have been distinguished. Hildred Geertzhas recognized three major groups: 13 the coastal Malays, iden-tified by their Islamic, maritime lifestyle and culture, which ismore egalitarian and individualistic; the great variety of the in-terior tribespeople who are mainly swidden cultivators, oftenanimistic, and relatively isolated; and the Hinduized (and nowlargely Islamic) wet-rice cultivators found primarily in Java andBali, with their distinct, very highly developed, and symbolicallyelaborate artistic culture and hierarchical, stratified societies.However, there is no simple correlation between religion andecology, for wet-rice agriculture is practiced by Christian,Hindu, and Muslim societies, although animistic traits are gen-erally more pronounced among swidden groups.
There are many peoples in Indonesia, however, such as theBataks, Ambonese, Minahasans, and Chinese, who do not fitinto any one of the three main classificatory groups of Geertz,but rather combine characteristics of each. Herein lies oneof the strengths of pluralistic Indonesia, as compared withMalaysia, the Sudan, or Canada, for in these latter, more di-chotomized societies, differences in one sociocultural elementare reinforced by contrasts in other elements and thus are moredivisive. In Indonesia, cultural and social variations are inter-digitated and form complex crisscross patterns, so that no onelarge group is totally divided from others by all features. 14
A basic awareness and acceptance of others’ differences is ev-ident in the common maxim, lain desa, lain adat (different vil-lages have different customary rules); or, more expressively, lainpadang, lain belalang; lain lubuk, lain ikannya (different fieldshave different locusts; other pools have other fish). 15 This tol-erance is part of Indonesia’s strength and durability.
National Integration in Indonesia
13

In the face of this enormous diversity within Indonesia,building national integration is of tremendous importance.What is it that holds the country together? What bonds of in-tegration have emerged as a result of common historical ex-periences? What patterns of integration exist among the socio-cultural, interaction, and economic components of integration?What synthesis is it possible to obtain on the overall strengthof integration and in its spatial patterns in the nation-state ofIndonesia? And finally, what has the government response beento these uneven patterns of internal cohesion; how have In-donesia’s independent governments attempted to promote na-tional integration?
The purpose of this book is to provide tentative answersto these questions. Most of the data and information used inthis study comes from the 1980 census and other materialsavailable in the early 1980s. The areal unit chosen for studyis the province, of which there are presently twenty-seven inIndonesia (including the special districts of Aceh, Jakarta, andYogyakarta). The province is a logical unit for comparison forseveral reasons. It is the most likely unit to be able to secedeand become an independent unit, because of its size. A typicalIndonesian province is as large as any of a number of smallerAfrican states that exist on their own and larger than many in-dependent island states. On a practical level, the province hasbeen selected as the unit for consideration because most sta-tistical data are available only at this (or at the national) level.Unfortunately, intraprovincial differences, though known to beimportant, are masked when data are summarized for a wholeprovince. Provinces vary considerably in size both in area (rang-ing from 590 square kilometers for Jakarta to 422,000 squarekilometers for Irian Jaya) and in population (from 555,000 inEast Timor and 768,000 in Bengkulu in southern Sumatra to29,189,000 in East Java). Thus, all data in the quantitativesection have been standardized to either a per-unit-area or aper-capita basis and are given in the appendixes. This study (asmost geographical studies) is inevitably scale specific: the useof the province as the unit of area has a major effect upon theresults of the analysis.
Warnings are also in order about the availability and qualityof the data. As with most developing countries, data are notalways complete or consistent, and in places their accuracy isquestionable. In the past, interregional data have not alwaysbeen highly valued, especially when containing politicallyvolatile information; the government in the 1950s implicitly rec-
Introduction
14

ognized the inflammatoriness of interregional economic datawhen it closed a leading newspaper for printing information onthe differences among the provinces in terms of export earningsand government expenditures. 16 However, a lot of data isavailable on Indonesia thanks to the Biro Pusat Statistik (theCentral Bureau of Statistics, whose publications include thecomparatively detailed 1980 population census) and the work ofeconomists both within Indonesia and at the Australian NationalUniversity.
National Integration in Indonesia
15

2The Uneven Effect of
Historical and PoliticalExperiences
NATIONAL integration involves the way people in different areasof a country and of different ethnic, sociocultural, and economicbackgrounds feel themselves to be united and function as onenation. One important component in promoting this sense ofunity and national identity is that of common historical andpolitical experiences. For it is in this historical heritage thatthe roots of culture and national social structures are found.In addition, feelings of oneness, of shared glory and ignominy,triumph and suffering, achievements and struggles, all help todeepen national awareness and national pride, which are basicto building national integration.
Historical experiences can be evaluated in two principalways: first, an analysis of the extent to which particular his-torical events have been integrative; and second, a consider-ation of how much the different regions of the country haveparticipated in those national events that have both shaped thegeographical configuration of the present state and created anawareness of national identity. This chapter evaluates the inte-grative effect and the spatial impact of significant historical andpolitical events on the nation-state of Indonesia.
Indonesia’s history can be divided into four major time pe-riods, each of which has had its own distinctive effect in formingthe modern state and giving it its unique national character: theancient empires, the experience of growing Western influenceand colonial control, the Japanese occupation and subsequentstruggle for independence, and the period of independence.
16

THE ANCIENT EMPIRESIn prehistory and very early historical times, there was nothingto distinguish those islands later to become the state of In-donesia from the surrounding areas of the present-day coun-tries of Malaysia, the Philippines, and Papua New Guinea (seeFigure 2.1). Certainly the racial mix and early settlement pat-terns were similar to those of the Malay Peninsula. The first mi-gration into the archipelago, probably 1.5 to 2 million years ago,1 consisted of Australoid peoples, possibly represented today byNegritoes such as the Arafura in parts of the Lesser Sunda andMoluccan islands. 2 Later came the great waves of immigrantsfrom southern China, including the basically Caucasoid Proto-Malays, who brought their Neolithic culture to the islands ofBorneo and Sumatra and later to Java and Sulawesi. They dis-possessed earlier immigrant groups, absorbing them or forcingthem into marginal habitats. 3 Their stock is best representedtoday by the various Batak and Dyak ethnic groups of interiorSumatra and Borneo. Further to the southeast, in the Moluccasand Lesser Sundas, the Proto-Malays (and their descendants)were modified by Papuans and Melanesians who were alreadyentrenched there; but in New Guinea the Proto-Malays wereunable to penetrate beyond the coast because of the hostility oftribal warriors.
The Deutero-Malays, who were more Mongoloid in feature,brought their Bronze Age civilization particularly to the coastaldistricts of the large western islands, displacing those who hadsettled there previously. Their coastal settlements eventuallybecame the nuclei of trading kingdoms, while the interior set-tlements of the Proto-Malays became centers of agriculture.4 Ethnic groups typifying the Deutero-Malays include the Ja-vanese (in East and Central Java), Sundanese (in West Java), Mi-nangkabau (in West Sumatra), and Balinese.
Although a similar pattern prevailed on many islands, es-pecially in the Greater Sundas—of later arrivals of more so-phisticated peoples settling on the coast, absorbing previousgroups or forcing them inland to displace still earlier peopleinto the mountainous interiors—this pattern was not uniqueto Indonesia. It was as true for the non-Indonesian areas ofthe Malay Peninsula and northern Borneo as it was for the In-donesian islands. Indeed, there is more affinity between theinhabitants of the western islands of Indonesia and those ofthe Malay Peninsula than there is between the peoples of thewestern and eastern islands within the Indonesian archipelago.
National Integration in Indonesia
17
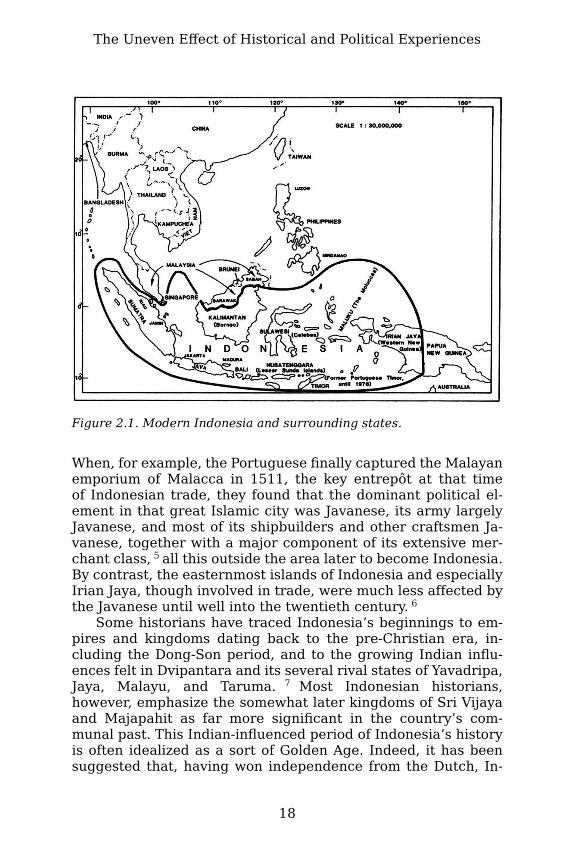
Figure 2.1. Modern Indonesia and surrounding states.
When, for example, the Portuguese finally captured the Malayanemporium of Malacca in 1511, the key entrepôt at that timeof Indonesian trade, they found that the dominant political el-ement in that great Islamic city was Javanese, its army largelyJavanese, and most of its shipbuilders and other craftsmen Ja-vanese, together with a major component of its extensive mer-chant class, 5 all this outside the area later to become Indonesia.By contrast, the easternmost islands of Indonesia and especiallyIrian Jaya, though involved in trade, were much less affected bythe Javanese until well into the twentieth century. 6
Some historians have traced Indonesia’s beginnings to em-pires and kingdoms dating back to the pre-Christian era, in-cluding the Dong-Son period, and to the growing Indian influ-ences felt in Dvipantara and its several rival states of Yavadripa,Jaya, Malayu, and Taruma. 7 Most Indonesian historians,however, emphasize the somewhat later kingdoms of Sri Vijayaand Majapahit as far more significant in the country’s com-munal past. This Indian-influenced period of Indonesia’s historyis often idealized as a sort of Golden Age. Indeed, it has beensuggested that, having won independence from the Dutch, In-
The Uneven Effect of Historical and Political Experiences
18

donesia probably would have called itself by some old Indian orHindu-Javanese name such as Dvipantara or Nusantara if thesedesignations had originally been of sufficient geographicalscope. 8 But these early second-to fifth-century principalitiesseem to have had only local extent and influence. Much of In-donesia’s early history is still shrouded in obscurity. 9
It remains to be shown to what extent historical myth andhistorical reality correspond. However, even a minimal corre-spondence would not invalidate the sense of corporate historyand national identity so strongly expounded by Sukarno in hisefforts to strengthen the concept of Indonesian unity:
The national state is only Indonesia in its entirety, which existedin the time of Shrivijaya and Majapahit, and which now too wemust set up together. 10
The kingdoms of Sri Vijaya and Majapahit were only twoof the many kingdoms and petty states that arose, expanded,and declined during the millennium before Western influencebegan to penetrate the area. They epitomize, however, the twomajor types of state that came into existence—the sea-basedempires dependent upon control of trade and shipping, of whichSri Vijaya, based on its monopolistic control of the importantMalacca Straits, is the prime example; and the inland, agricul-tural, and especially sawah (wet-rice)-based kingdoms such asMataram and Majapahit. Sri Vijaya and other maritime princi-palities, which were dependent upon international trade routes,were cosmopolitan in character and had a high degree of socialequality and tolerance. By contrast, the Hindu-Javanese inlandkingdoms were complex, hierarchical structures, aristocraticand military in character and buttressed by magico-religiouspowers. 11
Careful historical analysis suggests that the thalassocraticstate of Sri Vijaya, from its center near present-day Palembangin Sumatra (and secondary node of Kedah on the MalayPeninsula), included only limited parts of western Indonesia andincorporated much of the Malay Peninsula (see Figure 2.2), 12
with possible colonies in the southern Philippines as well. 13
But its commercial links with the Spice Islands (Maluku) andother parts of the archipelago lend some credence to its claimof drawing the far-flung islands into one economic unit. SriVijaya’s power lay in its ability, from the fifth century on, tocontrol the Malacca Straits and enforce customs duties and portdues from ships using the prevailing monsoonal winds in their
National Integration in Indonesia
19

Figure 2.2. The extent of the kingdoms of Sri Vijaya (ca. A.D. 1000)and Majapahit (ca. A.D. 1350), according to Prapanca and C. C. Berg.Based on maps by Paul Wheatley, The Golden Khersonese , p. 299; andJon M. Reinhardt, Foreign Policy and National Integration‚ p. 17 (usedwith permission).
voyages from Arabia, Persia, India, and Ceylon to the Spice Is-lands and China. 14 Through levying tolls and providing outletsfor their products, the Sri Vijayan empire transformed whatwould otherwise have remained small, subsistence villages into“glittering jewels strung along the thin gold thread of interna-tional trade.” 15 The centrifugal forces of isolation and desiredautonomy of the vassal states threatened constantly to causethe breakup of this loosely linked coastal empire. But thesewere counterbalanced with varying degrees of success by thewealth and prestige of the Sri Vijayan ruler, whose authoritywas also derived in part from generally accepted Buddhist sanc-tions.
Trade and the trade routes undoubtedly drew the people ofthe region together and helped to determine the course of theirdevelopment and their exposure to foreign culture, techniques,skills, and ways of life. 16
The kingdom of Sri Vijaya fluctuated in its fortunes from itsinception sometime in the fifth century until its decline duringthe twelfth. Toward the end of the eighth century, the Sailandradynasty united this Sumatran empire with Mataram, one of the
The Uneven Effect of Historical and Political Experiences
20

earliest land-based kingdoms in Java. It was during this periodthat the great Mahayana Buddhist temple of Borobudur wasbuilt, in whose glory and magnificence all Indonesians are en-couraged to take pride. After the Sailandra empire split into twocomponents in the late ninth century, the Javanese kingdom re-turned to Brahmanistic Shiva worship and built the Prambanantemple complex, while in Sumatra the Sri Vijayan empire grewto new heights, especially in the early eleventh century throughits monopoly of the growing spice trade. By the time Marco Polovisited the area in 1292, however, the once-powerful kingdomof Sri Vijaya had disintegrated into eight Sumatran kingdoms,each with its crowned king, and the center of power had movednorth from Palembang to Malayu (near present-day Jambi). Itseems that technological improvements in shipbuilding and nav-igation, fluctuations in trade, and international politics all con-tributed to undermining the strategic locational advantage ofSri Vijaya as an entrepôt. Because it had no agricultural base orother industries, a decline in its trading preeminence led almostinevitably to the empire’s demise.
Yet the commercial empires based on the Straits of Malacca,though leaving little in the way of material remains, contributedmore to present-day Indonesia than mere historic memories.Malay was used as the lingua franca of trade among the prin-cipal ports of the Sri Vijayan empire. It was this lingua francathat was later adopted as the national language of Indonesia,itself recognized as one of the strongest unifying forces in thearchipelago (although not unique to it).
The other type of kingdom was the land-oriented, agrarian-based variety, found primarily in Java. The first of these, eighth-century Mataram in central Java, coexisted with Sri Vijaya andfor many Javanese has more historical and inspirational signifi-cance than the latter. 17 Indeed, Legge argues that even duringSri Vijaya’s period of preeminence the political center of gravityin Indonesia was really to be found for the most part on theisland of Java, where
a series of major kingdoms, at first in Central Java and then in theeastern part of the island, marked the growth of a sophisticatedmaterial culture and of a political strength which, after fluctua-tions and divisions, reached its apex with the rise of the kingdomof Majapahit in the thirteenth century. 18
National Integration in Indonesia
21

The early kingdom of Mataram (to be distinguished from thelater kingdom of Mataram of the seventeenth century) shiftedits center from central to eastern Java in the mid-ninth centuryand gradually expanded its agricultural base by becoming in-volved in maritime trade. It also promoted a resurgence ofindigenous elements in art, literature, and politics. Later itwas superseded by several other kingdoms, including Janggala,Kediri, and Singhasari. After Sri Vijaya’s decline, Java gained apredominant position in the archipelago that has not since beeneclipsed. Though its kingdoms have been rivaled at varioustimes, most notably by the Islamic commercial empire ofMalacca in the fifteenth century, the island has remained thecenter of political influence and the balancer of fluctuating ri-valries in the area. 19
However, the most extensive kingdom that Sukarno claimedas the foundation of present-day independent Indonesia is Ma-japahit. This consisted at first of a number of individual entitiesheld together through a variety of coercive and manipulativetechniques on the part of early Majapahit rulers. 20 But later itestablished itself not only as a coordinated, agriculturally basedland power but also as a commercial empire. It attained itszenith in the fourteenth century, under the premiership of GajahMada, that architect of pan-Indonesia policies who is memori-alized as the great unifier of Indonesia in its first university, es-tablished at the kraton (palace) in Yogyakarta. Almost inevitablythere is controversy over the actual extent of this powerful andimpressive kingdom. The Javanese court poet, Prapanca, in hislong, narrative poem composed in 1365, Nagarakertagama, in-serted a list of vassal states of Majapahit (see Figure 2.2). Itincluded nearly all the coastal districts of Indonesia, western,eastern, and northern Sumatra, Brunei and parts of southernand western Kalimantan, Bali, the Sundas, parts of Sulawesiand Maluku, 21 and eventually the kingdom of Sunda in west-ern Java, 22 as well as the fifteen dependencies of Majapahit inPahang, the name by which the whole of the southern half ofthe Malay Peninsula was known. Several historians have arguedthat at the height of its power Majapahit’s territory was at leastcoextensive with that of the modern Republic of Indonesia andincluded parts of present-day Malaysia as well. But many In-donesian as well as other intellectuals consider these claimsvastly exaggerated. Indeed, according to Wheatley, the Dutchscholar C. C. Berg considers the impressive catalogue of Ma-japahit’s conquests as reflecting nothing more than the geo-graphic knowledge available in Prapanca’s time. 23 The state
The Uneven Effect of Historical and Political Experiences
22

of Majapahit at its maximum extent, he believes, comprisedlittle more than eastern Java, Madura, and Bali (see Figure2.2). It seems more probable, though, that there may havebeen a loose, temporary linkage between Java and many of thesmall coastal states mentioned earlier. Certainly the unknownauthor of the early Javanese chronicle Pararaton (Book of Kings)portrayed Kertanagara (king of Singhasari) and Gajah Mada(chief administrator of Majapahit at its zenith) as leaders whohad endeavored to suppress the evil forces of division and tostrengthen the mystic forces of unity. 24
In any case, whatever the historic truth, the myths havebeen enormously important, for the kingdoms of Sri Vijaya andMajapahit have been a powerful source of inspiration and na-tional pride for a great number of Indonesians. They thusfunction as an integrating force. A belief in the inherent unityof the nation, interrupted by periods of chaos and then restoredagain to unity, provided a tradition by which Sukarno couldclaim to be following in the footsteps of Airlangga (the tenth-century restorer of unity), Ken Angrok (the Just Prince of thetwelfth century who founded the dynasty of Singhasari), 25
Hayam Wuruk (the king of Majapahit in the fourteenth century),and Gajah Mada (Hayam Wuruk’s prime minister from 1331 to1364, who was hailed as the last man until Sukarno to unite “In-donesia” under a single ruler). 26 Certainly Gajah Mada’s unifiedadministration and codified laws and customs lasted until thenineteenth century in essentially the same form as they hadduring his premiership in the fourteenth.
It was in the days of Majapahit that Indonesian sculpture,architecture, religion, and philosophy departed most markedlyfrom the Indian prototypes from which they had developedand assumed distinctive characteristics of their own. It is littlewonder, therefore, that modern Indonesians regard Majapahitas a national and historical symbol, pointing in the direction ofIndonesian unification. 27
Thus, looking back over the history of the ancient empires,one may argue that the perception and interpretation of historymay indeed be as important as the historical truth, as least forthe purpose of integrating the nation. The idea that Indonesia,with approximately its present boundaries, existed and func-tioned as one entity at various times in the past is a powerfulconcept for a young country, especially one seeking to unite itsvery different peoples into one nation and establish its unique
National Integration in Indonesia
23

identity and place in the world. Equally important are the com-munal pride engendered in acknowledging this glorious inheri-tance, and the feeling of shared greatness.
Certainly some of this pride is justifiable. Indisputably, an-cient empires did arise and cast their influence over many of theislands of present-day Indonesia; and the impressive heritage ofBorobudur, Prambanan, and the many other temples, statues,and monuments that testify to the artistic heights reached bythese Indianized kingdoms is a legitimate source of nationalself-esteem.
Yet, from a more objective viewpoint, it is highly ques-tionable whether these kingdoms did in any sense integratetheir disparate parts. Rather, they imposed a vassal or sub-ordinate status on the many parts of their empires, a statusbitterly disputed and fought over at different times. The Sun-danese of western Java, for example, still retain historical mem-ories of the ruthlessness of Gajah Mada. And it may well be thatthe splendor of Majapahit, appealed to by nationalist leadersas a source of inspiration and unity for all Indonesians, has ac-tually deepened the divisions between the Javanese inheritorsof these treasures and the “inheritors-by-extension” from theother islands. Certainly the feelings of superiority that the Ja-vanese display toward the Outer Islanders do not help the causeof integration. 28 As Bujung Saleh, one of Indonesia’s owncritics, expressed it:
The illusionary greatness of Majapahit cannot form a strong bondof unity for all our people at this time. On the contrary, it evenharms national unity, for people from other regions will feel thatthe greatness of their own regional history is being denigrated. 29
Finally, although the myth that the present territory of In-donesia was defined by the independent ancient empires ofthe past (particularly Majapahit) is immensely appealing, thecold reality is that it was the Dutch colonialists who gave In-donesia the shape it has today, with the one exception of formerPortuguese (East) Timor, which was annexed in May 1976 tobecome Indonesia’s twenty-seventh province.
The Uneven Effect of Historical and Political Experiences
24

THE EXPERIENCE OF GROWING WESTERNINFLUENCE AND CONTROL
The effect of European traders and colonialists, first the Por-tuguese, then the Dutch (with a brief British interregnum from1811 to 1816), was ambivalent. On the one hand, the domi-nation of the whole area by one European power gave the areaa unity not experienced before. The islands were linked moresystematically in terms of administration, law, and communica-tions into at least a nominal functional entity. Dutch colonialrule also provided exposure to Western European culture, edu-cation, values, and ways of economic development. Commoncolonial control in turn provided a focus for the nationalist in-dependence movement in the twentieth century, a cause thattemporarily superseded deep feelings of diversity and division.Dutch hegemony provided the rationale for adopting the bound-aries of the Netherlands East Indies as the limits of the newindependent Republic, and the Dutch administrative system,based upon the existing autochthonous regions of different eth-nic groups within the archipelago, was taken over and sub-stantially kept intact by the new Indonesian government atindependence.
On the other hand, however, Dutch control was uneven.Not only did the Dutch preserve existing differences amongthe already diverse peoples and kingdoms in the archipelago,but by their unequal treatment of different areas and ethnicgroups they exacerbated old rivalries and created new, deepercleavages. They focused most of their attention on Java andlater on certain select areas of Sumatra, Kalimantan, North Su-lawesi, and the southern Moluccas, while ignoring vast areasof the Outer Islands. They not only treated different Indonesianethnic groups differently, but they also encouraged and madeuse of the entrepreneurial skills of the Chinese immigrants andtheir descendants as middlemen. They even set up separatejudicial systems for Europeans, Chinese, and “natives‚” thuslegally preserving the differences among the different ethnicgroups rather than helping them to be assimilated into onesocial fabric. In addition they increased the disparity betweenrich and poor in both rural and urban areas.
Thus, while at the macro level the European influence canbe construed as generally integrative, at the micro level itseffect was often divisive.
National Integration in Indonesia
25

Dutch intentions in the first hundred years of their influencein the archipelago, as with the Portuguese before them, were togain a monopoly of trade rather than to carve out an empire.30 Only slowly did the Dutch East India Company (VereenigdeOost- Indische Compagnie, formed in 1602) gain control of thesea lanes and then turn to protect them by becoming more in-volved in the internal affairs of the islands. At first, the Dutchconcluded alliances with several independent kingdoms andSultanates in the archipelago, including Ambon, Bali, andTernate, and contended with hostility from others, such asMadura and Aceh. Later, they began to intervene in internaldisputes, manipulating them to their own advantage, exactingadherence to Dutch trading monopolies, and collecting tributeand later “forced deliveries and consignments” as the priceof Dutch help and protection. The Compagnie thus graduallychanged from being a purely trading enterprise to being theruler of a territorial empire. By the mid-seventeenth century,the Dutch were firmly established in western Indonesia (atBatavia, Banten, and Gresik in Java), on the Malay Peninsula(at Malacca, Patani, and Johore), and in eastern Indonesia (atBanda and Ternate). The local empire of Mataram on Java grad-ually extended its control over the eastern part of that islandand Madura and as far as Banjarmasin in Kalimantan. But al-though the historians of the period who wrote Babad TanahDjawi and other histories saw Mataram as the legitimate suc-cessor to all preceding states and in particular to Majapahit, inreality its territorial extent was very limited, and it too fell tothe Dutch as a result of internal disagreements. 31
Only very slowly were the islands of the future Indonesia es-tablished as part of the Dutch colonial territory, partly throughbattles won against other European nations—at sea, throughintrigue, or through diplomatic channels back in Europe. ThePortuguese, once their naval power declined, were graduallyconfined to eastern Timor (in the 1680s), although their in-fluence lingered far longer in places such as Flores, Ambon, andwestern Timor. The Spanish were limited to the Philippines andthe Sulu archipelago (in 1663), and the British eventually tothe Malay Peninsula and the northern part of Borneo. The Brit-ish, however, controlled an outpost in Bengkulen for 150 yearsafter they were driven from the western Javanese kingdom ofBantam in 1689, before they exchanged it for previously Dutch-controlled Malacca in the Malay Peninsula (in 1824); 32 and theycontinued to guarantee the independence of the kingdom ofAceh until 1871.
The Uneven Effect of Historical and Political Experiences
26

The last half of the seventeenth century saw the loss of in-dependence and the disintegration of all the remaining majorIndonesian states—Ternate, Makassar, and Bantam, as well asMataram—both in the face of superior Dutch naval power andin the transition of the role of the Compagnie from a purelymercantile organization to a budding colonial power. But theimposed internal peace did little to unify or integrate the sep-arate kingdoms; they remained mutually hostile, linked only intheir shared resentment of the common vassal status they heldunder the Dutch, as demonstrated by their constant uprisingsand struggles to regain their independence. It has been claimedthat the Dutch deliberately preserved the differences among thedifferent areas under their control in pursuit of their policy of“divide and rule.” 33
By the mid-eighteenth century, three distinct areas ofWestern influence could be distinguished as a result of uneventreatment by the Dutch.
In parts of eastern Indonesia Dutch influence was intensiveand oppressive. By regulating and destroying the means of pro-duction and prosperity of the islanders (by cutting down unau-thorized clove and nutmeg trees to maintain high prices inEurope, and by improving their monopoly on trade), the Dutchsucceeded not only in breaking the power of the previouslyproud and independent kingdoms of the Moluccas (such asTernate and Tidore), but also in decimating their populationsand reducing the survivors to bondage and poverty. 34 In otherparts of eastern Indonesia, Dutch influence ranged from nonex-istent (such as in western New Guinea and many of the LesserSunda islands) to warmly welcomed (in northern Celebes) to bit-terly resented (in southwestern Celebes around the Dutch-de-stroyed town of Makassar).
In much of western Indonesia (Sumatra and Kalimantan),Western influence hardly penetrated at all beyond a fewstrategic fortress settlements along the coast (and Padang inWest Sumatra) until the development of plantations and minesand the extension of Dutch authority to more parts of Sumatraduring the mid-to late nineteenth and early twentieth centuries.35 Sumatra (and particularly Aceh) was more affected than Kali-mantan by Dutch monopolistic trading policies, yet these wereless stringently enforced than in the Moluccas, partly becauseof the presence of the British in Bengkulen and the proximityof the Asian continent (which made unauthorized trading moredifficult to control), and partly because the source of peppersand other trading commodities produced in western Indonesia
National Integration in Indonesia
27

was not so restricted geographically. Kalimantan was culturallyand economically less developed than Sumatra. There, with theexceptions of the sultanates of Banjarmasin and Sambas, thefew Dutch settlements established earlier were abandoned bythe end of the eighteenth century because trade was not suf-ficiently valuable to justify the expense of manning and de-fending such settlements. 36 Also, the Dutch could not competewith the highly successful Chinese traders already entrenchedthere. Thus, in many of the Outer Islands petty states, principal-ities, chieftainships, and tribal societies flourished undisturbedby the Compagnie. 37
It was in Java, however, that the influence of Western domi-nation was the greatest. The Dutch set up their headquarters inJakarta (which they renamed Batavia) in 1619 and soon eclipsedthe power of the Western Javanese sultanate of Bantam. Theygradually extended their control over the island, despite threewars of independence (1705–1755), as the last and greatest ofthe Javanese states, Mataram, succumbed to Dutch pressure.They increasingly penetrated the traditional way of life of theinhabitants and encouraged Chinese immigration and entrepre-neurship, and the development of a plural, nonintegrated so-ciety in which the Dutch were on the top, the Chinese in themiddle, and the indigenous Javanese at the bottom. 38 The mas-sacre of thousands of Chinese by Javanese in 1740, along withlater legal restrictions, testifies to the nonassimilation of theChinese into Indonesian society. 39
In their fear of the potentially unifying force of Islam, theDutch colonial government (which replaced the Dutch EastIndia Company at the end of the eighteenth century when thelatter went bankrupt and had its assets and liabilities takenover by the Dutch government) consistently supported the adatrulers (those who administered traditional, customary law)against the Islamic leaders. 40 They also played off rival king-doms against one another. They systematically reduced thepower and influence of the Javanese rulers and aristocracyuntil, by the end of the Java War (1825–1830), they had reducedvirtually all of the principalities to the status of puppet domainsin the Dutch East Indian Empire. 41 Dutch emphasis on Java,first with the contingents and forced delivery system, and laterthrough the Cultuurstelsel (Cultivation System, introduced in1830), 42 led to enormous differences between Java and theother islands, especially in economic development, because onlya tiny proportion of the large land area of the Outer Islandswas under effective Dutch control during the period of the Cul-
The Uneven Effect of Historical and Political Experiences
28
tivation System in Java. Much of the Dutch effort outside Javawas limited to punitive expeditions against piracy. Only laterwith the great economic expansion between 1870 and 1930 wasthere a change in the Dutch focus on Java and in the char-acter and emphasis of Dutch trade and interest in Indonesia.As the more traditional exports of coffee, sugar, and tobacco(grown in Java), and spices (mace, cloves, and nutmeg from theeastern islands) gave way in importance to the more industrialproducts of rubber, oil, and tin (primarily in Sumatra), copra(in Celebes and the Moluccas), and coal (in eastern and south-eastern Kalimantan), attention shifted to the establishment offirmer administrative control in the Outer Islands. 43 Planta-tions, concentrated primarily in Java and northern Sumatra,were developed as corporate enterprises to produce industrialrather than garden products. 44 Although Dutch influence wasmotivated primarily by economic considerations and hence didnot work to achieve the integration of peoples in the Indonesianislands, some recent observers nevertheless consider that theNetherlands’ expansion from Java to the Outer Islands repre-sented, in fact, the creation of modern Indonesia: this allowedthe imposition of an effective unity, greater political and ad-ministrative control, the laying of the foundations of a moderneconomy, and the radical alteration of traditional social pat-terns. 45
Yet despite the growing incorporation of the Outer Islandsinto Indonesia, contrasts between Java and the Outer Islands,as well as among the Outer Islands themselves, continued togrow. Direct rule in Java contrasted with a greater degree of in-direct rule in the Outer Islands. 46 Contrasts between Java andthe Outer Islands widened in terms of population size, growth,and density as health and sanitation measures were introducedinto Java. Disparities increased also in the development of in-frastructure, as communications and transportation networkswere developed in Java to a much greater extent.
Thus the imprint of the Dutch was uneven both historicallyin terms of the length of colonial administration and politicallyin the impact colonialism made in the different parts of the arch-ipelago. Some areas experienced 350 years of Dutch influenceor control, while for others it was a matter of only a few decades(see Figure 2.3). Indeed, it was not until 1901 that the Dutchfinally crushed the last independent state, Aceh (although spo-radic outbreaks of rebellion continued until 1908). Only afterthe turn of the present century, then, was Dutch rule effectivelyextended over all the islands of the Dutch East Indies.
National Integration in Indonesia
29

When the Europeans defined the territory and delimitedthe boundaries of the Dutch East Indies colony, they took littleor no notice of ethnic loyalties or historical relationships. Aswith colonies in Africa and other parts of Asia, decisions weremade largely in Europe. The Johore-Riau empire was dismem-bered and the Riau-Lingga archipelago cut off from the MalayPeninsula. The Minangkabau on the peninsula came underBritish control, while those in western Sumatra became partof the Dutch East Indies. 47 The Bugis (from southern Celebes)were expelled from their eighteenth-century position of domi-nance in Kedah on the Malay Peninsula. 48 It took decades foragreement to be reached on the precise boundaries delimitingthe colonial spheres of influence. Only in 1905 did Dutch nego-tiations with the Germans and the British determine the fron-tiers in the island of New Guinea. It was not until 1907 that theBritish finally withdrew from Sumatra and 1915 that the Britishand Dutch finally agreed in detail on the present Malaysian-In-donesian border in Borneo. It is ironic that the Netherlands EastIndies took on almost the exact shape of the future Republic ofIndonesia precisely when the first stirrings of nationalism beganto be felt at the beginning of the twentieth century. As Grant putit:
It is as if the invader, having laboriously established the outline ofhis territorial possessions in the East Indies, provided the peoplefor the first time with a definite area by which to assert theirrights to national independence. 49
Not that the struggle for independence was new. The historyof the 350 years of Dutch influence and control in the arch-ipelago is filled with revolts and insurrections against them,as individual kingdoms and sultanates fought to maintain orreestablish their independence and integrity. 50 These revolts,however, were largely isolated and uncoordinated; the unityclaimed by later Indonesian historians in this “common resis-tance to the Dutch,” at least at this stage, was experiencedmore in retrospect than consciously at the time. It was notuntil the twentieth century that these rebellions took on morethan a local flavor, and Indonesians began to develop nationalawareness and a feeling of national unity. As the Dutch per-sisted in their efforts to weld Indonesia into one centrally gov-erned administrative unit, and as the traditional authorities de-clined in public estimation, a new elite came into prominence—asmall group of educated, upper-class Indonesians, who became
The Uneven Effect of Historical and Political Experiences
30

Figure 2.3. The expansion of Dutch authority in the former Dutch EastIndies. Based on a map from Soedjatmoko et al., An Introduction to In-donesian Historiography‚ p.358 (reprinted from Royal Dutch Geo-graphical Society, Atlas van Tropisch Nederland) (used withpermission).
aware more of the basic similarities among their countrymenthan of the differences dividing them; and more aware also oftheir common colonial experiences and hope for a shared inde-pendent future.
These feelings of unity were encouraged by several factors:one was the worldwide rise of nationalism and national con-sciousness in the early twentieth century, which became in-creasingly apparent in other Asian countries; a second was theexposure elite Indonesians had to ideas and information aboutother countries through meeting people of different origins inthe hajj (the pilgrimage to Mecca); 51 a third was the growingappreciation among Indonesians of similarities underlying re-gional differences, as contrasts with the intensified self-con-ciousness of both Dutch and Chinese became increasingly ap-parent; 52 and a fourth was increased education, encouragedby the Ethical Policy of the Dutch beginning in 1901. This lastfactor led to a recognition of Indonesia’s own historic glories, afamiliarity with the Netherlands’ struggle against Spain (whosevictory and independence the Indonesians ironically were madeto celebrate), an awareness of the common suffering and op-pression experienced by Indonesians at Dutch and Chinesehands, and increased consciousness of the discrimination facingIndonesians socially and in the job market. They became in-creasingly aware, too, of the disruption of village social patterns
National Integration in Indonesia
31

and the undermining of many of the village’s customary cer-tainties, caused by the new economic developments and in-creased penetration of Indonesian society by the government.53 In addition, the limited number of schools, all on Java forhigher education, brought together in a creative atmospherestudents (and potential leaders) from different islands, whothere became detached to a large extent from the framework oftheir own tradition and adopted a new urban culture where indi-vidual ethnic loyalties were less important. 54 Their associationalso fostered discussion of revolutionary ideas about a future in-dependent Indonesia.
The Ethical Policy was a recognition that the Netherlands,having profited for 300 years by exploiting Indonesia, shouldnow do something in return. 55 Thus, a welfare-type programwas introduced, theoretically aimed at economic, social, and po-litical progress, including agriculture, irrigation, public works,village sanitation, personal hygiene, and a very limited edu-cation for the indigenous people. However, because there werevery few jobs for educated Indonesians except in the civilservice, and because the Dutch did not want to create an intel-lectual proletariat to agitate for further reforms, the numberseducated were very few. 56 Exploration and surveying were in-tensified, railways and roads built, and interisland shipping ex-panded. But by its very acknowledgment that a colony shouldbe governed for the sake of its inhabitants, the Ethical Policyopened the door to the inevitable, logical corollary of the prin-ciple of self-government.
The early twentieth century, therefore, witnessed the flow-ering of many nationalist organizations with more than justlocal appeal: some were cultural organizations, some massmovements, and others expressions of political nationalism. Allserved to increase national consciousness. Budi Utomo (Glo-rious Endeavor Society) was founded in 1908 with the dual as-piration of helping the common Javanese people and creating amovement to embrace the whole archipelago. 57 Its goals werecultural and thus appealed to the educated rather than to themass of society. 58 The Muhammadiyah, founded in Yogyakartain 1912 and supported both by Javanese and by Muslims inSumatra, became the largest and most strongly organizedmovement in colonial Indonesia from the 1920s on. Modernistin inspiration, it was devoted primarily to teaching and socialwork. It too spread throughout Java and many of the Outer Is-lands.
The Uneven Effect of Historical and Political Experiences
32

Indonesian student organizations were also active in the na-tionalist movement. Soon after the foundation of Budi Utomo,Indonesian students in the Netherlands formed the IndischeVereeniging (the Indies Association), which took increasing in-terest in politics. In 1918 it espoused Indonesian nationalismopenly and called for full parliamentary government in the arch-ipelago. Indonesian students in the Netherlands later foundedthe Indonesische Vereeniging (the Indonesian Association),which in 1925 adopted the Indonesian form of its title, Perhim-punan Indo nesia. In 1924 this organization began publishinga militant journal entitled Indonesia Merdeka (Independent In-donesia), which not only justified the name Indonesia for theNetherlands East Indies but also gave it political content. Themembers of Perhimpunan Indonesia, drawn from all parts ofthe archipelago, argued for the unity of the emerging politicalparties and the formation of a single front to attract masssupport on a national basis and thus extract concessions fromthe colonial government. 59 National youth congresses, held in1926 and 1928, proclaimed Indonesia to be “one nation, onelanguage, one motherland” (“satu bangsa, satu bahasa, satutanah air”). They adopted a national anthem, renamed thelingua franca (hitherto called Malay) Indonesian and pro-claimed it to be the national language, and chose the red andwhite colors of the Majapahit kingdom as the colors of the na-tional flag. The motto, Bhin neka Tunggal Ika, was taken fromSutasoma, a Javanese poem also of the Majapahit period; thenational emblem chosen, the Garuda, was the legendary mountof the Hindu god Vishnu and had also been used as a symbol ofMajapahit. 60 They also adopted the original name of Jakarta forBatavia.
The growth of mass movements in the period of 1911–1927was linked also to two growing world ideologies, pan-Islam andinternational communism. Sarekat Islam (the Islamic Union)was founded in 1911 by the new, Western-educated, nationalistelite, who were able for a brief period to establish enoughcontact with the peasantry in Java to create the first and onlypeasant-based nationalist organization during the entire periodof colonial rule. 61 It had tremendous appeal among the massesand was greatly affected by the increasing numbers of haji. Itreflected the growing resentment toward the Dutch colonialistsand disillusionment with employment opportunities in the gov-ernment civil service. This movement grew so fast, enrollingthe support of more than two million members not only in Javabut also in Sumatra, Kalimantan, Bali, and Celebes, that the
National Integration in Indonesia
33

Dutch became thoroughly alarmed and began severely to re-strict contact between the Indonesian nationalist leaders andthe peasantry. The government severed the ties between thecentral and local branches of Sarekat Islam, recognizing thebranches but refusing to recognize the organization’s centralheadquarters. 62 Indeed, repression by the colonial authoritiesso limited the political activities of the nationalist leaders thatnever again during the period of Netherlands rule were theyable to develop the contacts with the peasantry that had beenbasic to the burgeoning of Sarekat Islam. 63
However, it was the Indo-European party, many of whosemembers were Eurasians living in the large cities of Java, thatdeveloped the earliest yearnings for independence. And it is in-teresting to note that just as the concept of independence wasfirst encouraged by a Eurasian, Douwes Dekker, communismwas brought to Indonesia by a Dutchman, Sneevliet. From itsintroduction in 1914 until the Communist party’s ill-conceivedrevolt in 1926, Marxism attracted those increasingly awareof the contrast in living standards between Javanese and for-eigners, especially in the growing urban areas. But from 1920,when the Perserikatan Komunis Indonesia (the Indonesian Com-munist Union) broke off from Sarekat Islam and used the term“Indonesia” in its name, it emphasized awareness of nationalidentity as one of its main planks.
Perhaps one of the most significant political institutions ofthe early twentieth century in the Indonesian islands was theVolksraad, established in 1918 as an advisory body to thegovernor-general. 64 Its importance lay not so much in its power,which was strictly limited, but in its existence as the colony’sfirst popular representative organization, a symbol of nationalunity, and a forum for Indonesian opinion. Although the systemof indirect elections to the Volksraad resulted in the return oflower government officials rather than the emerging politicalleaders of the Indonesian community, it did provide an oppor-tunity for people from different parts of the country to work to-gether and to give expression to their common grievances andaspirations. It thus provided some valuable political experiencefor a small number of Indonesians, even though the mainstreamof nationalist feeling and nationalist organization passed it by.65
Gradually throughout the 1920s the term “Indonesia”became filled with content and extended its appeal to more andmore of the inhabitants of the archipelago. Secular nationalistgroups arose following the disintegration of the mass move-
The Uneven Effect of Historical and Political Experiences
34

ments. The most important of these was the party founded bySukarno in 1927—the Perserikatan Nasional Indone sia (the In-donesian National Union)—which became the Partai NasionalIndonesia (PNI) in 1928. This had as its ultimate objective anindependent Indonesia and was a name and symbol that “servedto transform ‘Indonesia’ from a concept of a few intellectualsinto a living idea shared by a whole people.” 66 The PNI grewrapidly in size and took the initiative in attempting to drawother nationalist societies into one organization. However, theresulting loose federation of parties (the PPPKI, PermufakatanPerhimpunan Politiek Kebangsaan Indonesia—Union of In-donesian Political Organizations) lacked real coherence and lostmomentum, particularly after the banning of the PNI and thearrest of Sukarno in 1929. 67 Indeed, as Legge suggests, thehistory of organized nationalism in Indonesia was a record of amultiplicity of societies, able to enter loose alliances from timeto time, but more frequently drawing apart from each other,splitting, and regrouping. 68 Division and rivalry characterizedmuch of Indonesian nationalism, partly because of the char-acter of Dutch rule and the nature of the Netherlands’ attitudeto the nationalist movement. The Indies Government alternatedbetween tolerance and repression, becoming increasingly re-pressive as nationalist criticism became more radical, yet nevertrying to crush the nationalist movement totally But the indeci-siveness and inconsistency of government action in turn seemsto have reduced the need for a tightly knit, focused nation-alist organization, instead permitting, and possibly even encour-aging, a variety of organizations to compete with one another.69 Part of the disunity and rivalry can be attributed also to theelitist character of the nationalist leadership and the gap be-tween the leaders and their mass following.
By 1930, however, the “day of Indonesia” had dawned. In-donesian party, youth, and women’s congresses were held. Mostassociations founded after that included the almost magic wordIndonesia in their titles.
The 1930s were also a period of growing confrontation be-tween the Dutch colonialists and Indonesian nationalists. TheDutch, who were affected by the stock market crash and theworldwide depression, felt the need to extract ever more wealthfrom the colonies and therefore sought to suppress vigorouslyall the nationalist aspirations of the Indonesians (which manyin the Netherlands erroneously regarded as limited to a handfulof revolutionaries). As Dutch attitudes hardened and a policestate was imposed, the nationalist movement once again frag-
National Integration in Indonesia
35
mented, as Indonesian leaders disagreed among themselvesabout the means they should follow to attain their common goalof independence. Some advocated working within the system,pushing for self-government through an enlarged Volksraad;some wanted the gradual mobilization of the people; some thetraining of self-reliant, well-informed leaders; and some moredirect confrontation. Many of the leaders, including Sukarno,Hatta, and Sjahrir, were jailed or exiled.
It was not until 1939 that the different Indonesian politicalassociations formed a new union to improve the coordinationof their activities. The Gabungan Politik Indonesia (Gapi, theUnion of Indonesian Political Associations) had representativesfrom ninety different regional and nationalist organizations, in-cluding even such traditionally pro-Dutch organizations as theAmbon and Minahasa leagues and the Indonesian CatholicParty. Gapi launched an intensive campaign for an Indonesianparliament and national self-government, and officially adoptedthe Indonesian language, flag, and anthem. In an attempt todiffuse these demands, the Dutch instead encouraged the estab-lishment of provincial councils, convinced that if a responsiblesystem of government were created in the provinces, aspira-tions for centralized self-government could be channeled off. 70
The rift between Indonesian nationalists and the colonial gov-ernment widened further.
Thus, by the beginning of the Second World War in Europeand the subsequent Japanese occupation of Indonesia, genuinenationalist consciousness had spread across much of the archi-pelago. Nationalist sentiment was much stronger in Java than inthe Outer Islands, but members of many different Outer Islandgroups, especially those living in Java, participated actively inthe various nationalist activities and through their ties withtheir areas of origin expanded nationalist sentiment there too.However, internal dissensions and ideological disputes amongnationalist, Muslim, and socialist currents of opinion, along witha lack of mass support, weakened the nationalist movement asa whole. It has been estimated that of a total population in 1940of about sixty million, the number of politically organized In-donesians totaled only about 80,700, while only around 200,000(less than 0.5 percent) were politically or socially conscious. 71
Yet despite these small numbers, Indonesian nationalist aspira-tions were remarkably strong.
The Uneven Effect of Historical and Political Experiences
36

THE JAPANESE OCCUPATION AND ITSAFTERMATH
The Japanese occupation (1942–1945) had a predominantly di-visive effect on Indonesia, although there were certain coun-teracting unifying elements. The Japanese brutally subjugatedthe Indonesian people, disrupted trade and communicationsamong them through strict censorship and attempts to makeeach regency self-sufficient, and encouraged division amongthe national leaders. The actions of the Japanese evoked anallied blockade that further isolated the different parts of thearchipelago. From being welcomed enthusiastically as liber-ators from hated colonial rule on their arrival in 1942, theJapanese took barely four weeks to alienate almost the entirepopulation. Instead of liberating and “restoring the indepen-dence of Asian peoples,” as their propaganda claimed, theywere more repressive than the Dutch had been even at theheight of their anti-nationalist campaign. All nationalist move-ments were suppressed, political assemblies and demonstra-tions forbidden, display of the Indonesian flag prohibited, andany discussion, speculation, or propaganda regarding the po-litical organization or administration of the country outlawed. 72
Punishment was ruthless. Further aspects of Japanese rule thatparticularly offended the Indonesians included the degradingpunishment of flogging; Japanese emperor worship, whichobliged the population to perform the ceremonial bow (saikerei)in the direction of the imperial palace in Tokyo (which deeplyupset Muslims, whose prayerful bow was toward Mecca in theopposite direction); and the shaving of students’ heads. 73
But both in the intensity of their actions and in the durationof their presence, the Japanese occupation was uneven. As withthe Dutch before them, the Japanese focused their attention onJava (and particularly on Jakarta), exploiting both its raw mate-rials and labor resources. In their administrative organization ofthe country, the Japanese divided Indonesia into three separatecommands, with little interaction among them: Java and Madurawere under the Sixteenth Army based in Jakarta; Sumatra wasadministered from Singapore by the Twenty-fifth Army; andeastern Indonesia was controlled by the Navy, whose secondfleet was headquartered in Makassar (southern Celebes). 74
The entrenched rivalry between the Japanese army and navywas also transferred to Indonesia. The army was more brutaland ruthless in its methods than the navy, although it gaveconsiderable latitude for the Indonesian nationalist movement
National Integration in Indonesia
37

to develop (allowing, for example, the long-exiled nationalistleaders substantial freedom of movement and contact with theIndonesian masses). The navy, though less brutal, followed aseverely repressive policy, discouraging any kind of indigenouspolitical organization. 75 The divisiveness of the Japanese impactthus reinforced differences between the western and easternparts of the country. In terms of the length of Japanese in-fluence, although most of the country experienced a full threeand one-half years of occupation, some of the eastern islandswere liberated and reoccupied by allied forces more than a yearbefore the rest of the country.
Yet the Japanese occupation was not without its unifyingelements. The brutal treatment inflicted by the Japanese pro-voked deep and bitter opposition and caused common sufferingthat afterwards at least was recognized as a shared experience.Almost all parts of the country had their economies and waysof life disrupted, although not everywhere to the same extent.A shortage of labor, caused by conscription, resulted in neglectof estate production and irrigation works and a consequent de-crease in food production; hardship and suffering thereby in-creased.
On the more positive side, the efficient Japanese adminis-trative and communications networks reached down to almostevery village and increased contact among the ordinary people.The Japanese organized neighborhood associations (tonarigumi), the concept of which still survives today in the rukuntetangga. 76 Similarly, the Japanese ordered the Indonesians toestablish kumiai in every tonari gumi and village, a form ofcooperative society imposed from above that survived in mod-ified form in the koperasi (cooperatives) of the later GuidedDemocracy period. In some ways Japanese policy also consol-idated nationalist feeling by creating an all-embracing Muslimorganization, the Masjumi (Majelis Sjuro Muslimin Indonesia),comprising the Muhammadiyah, Nahdatul Ulama, and othergroups. This was intended to provide more effective control ofMuslim feeling, but in practical terms it laid the foundation forunited Muslim political activity, which was to carry over intothe early years of independence. 77 The Japanese propagandasystem was used in disguise by the nationalists to raise vil-lagers’ political consciousness. In addition, although requiringall Indonesians to learn the Japanese language (and prohibitingthe use of Dutch), the Japanese were forced in the interim to
The Uneven Effect of Historical and Political Experiences
38

rely on the national language, bahasa Indonesia, to disseminatetheir propaganda: by so doing they unwittingly promoted andspread knowledge of Indonesian.
Further, expediency obliged the Japanese to push througha virtual social revolution as they mobilized the population andpressed everyone into their service—Muslim leaders, nation-alists, princely families, and common people—without regardfor their local particularisms or traditional social barriers. 78
They promoted Indonesians to many of the administrative andtechnical positions previously held by the Dutch. This increasedopportunities for upward socioeconomic mobility among the na-tionalist elite, Muslim leaders, and even the old nobility and un-dermined the stability of society (as well as one of the mostimportant sources of support for the Dutch regime). Old valueswere questioned and former social relationships were invertedand destroyed; the Japanese lost no opportunity to humiliate theformer colonial masters in the eyes of the Indonesians. This in-spired a new and powerful sense of self-reliance and authorityamong Indonesians, who found themselves both capable andcompetent to perform duties previously regarded as beyondtheir ability by the Dutch. 79 It also developed a determinationamong them to preserve what had already been gained.
The Japanese also set up, in 1943, what the Dutch hadalways resisted, an auxiliary, volunteer army, Sukarela PembelaTanah Air (Peta), which was composed mainly of members ofMuslim organizations. This numbered some 120,000 men by1945. It was this Japanese-trained but Indonesian-officered mil-itary that was to provide the principal military force behind therevolution, both in its early stages, when ironically it turned onthe Japanese forces and fought them, and later, when it foughtthe British and subsequently Dutch forces. In addition, the Japa-nese gave very limited military training (but no arms) and thefunction of security guards to a considerable number of villageand urban youth; when the Peta later expanded its ranks as arevolutionary army, it was able to draw on this source. 80
On the Indonesian side, although opposition to the Japaneseoccupation intensified, there was no unanimity on how to re-spond. Some nationalist leaders, like Sukarno and Hatta, osten-sibly collaborated with the Japanese while surreptitiously usingthe opportunities afforded them to rally support for nationalistideas. Other leaders, like Sjahrir, organized underground re-sistance. Even the organizations established by the Japanesedivided Indonesian opinion. At first many nationalist leadersthought they could achieve their goals by working through Japa-
National Integration in Indonesia
39

nese-approved institutions, such as the commission to study In-donesian customary law (adat), the Empat Serangkai (literallyFour-leaved Clover, referring to the four Indonesian leaders:Sukarno, Hatta, Mansur, and Ki Hadjar Dewantoro), the PusatTenaga Rakyat (Center of People’s Power, Putera), and the TjuoSangi-In (Central Advisory Committee). Unlike the Volksraad(People’s Council), where the majority had never actively sup-ported the nationalists’ goal of independence, the Tjuo Sangi-Inconsisted exclusively, apart from the ubiquitous Japanese ob-servers, of deputies who were of one mind in desiring indepen-dence. 81 But the perceived cooperation of nationalist leaderswith the hated Japanese was itself divisive, as most of theMuslim groups and many regional leaders regarded them astraitors and accomplices in increasing the suffering of the In-donesian people.
The Japanese attitude toward the nationalist leaders wasnot consistent. Having tried at first to mobilize the populationfor the war effort without the help of acknowledged Indonesianleaders, the Japanese soon realized that the only way to gettheir economic program carried out was by using establishedleaders. They thus incorporated nationalist leaders in thePutera, which had a central bureau in Jakarta (the Japanese hadadopted the native name for Batavia since the end of 1942) andbranches in most provinces, and in the Tjuo Sangi-In, set up inJakarta in 1943 with similar bodies (sangi-kai) in the provinces.Later, the Japanese replaced the Putera with the Jawa Hokokai(Javanese People’s Loyalty Movement) to mobilize and controlbetter the priyayi (gentry), particularly the lesser priyayi or, asthey were now more often called, the pamong praja (adminis-trative corps). 82 The Indonesian nationalists, although retainingkey positions in the new movement, were incensed by the cre-ation of Jawa Hokokai, partly because it deprived them of theorganizational independence they had enjoyed in the time ofthe Putera, partly because this Japanese-titled organization re-flected only too clearly the occupiers’ policy of Nipponization,and partly because they were sandwiched between the militaryand the priyayi, neither of whom were interested in encour-aging ideas of independence among the masses. 83
Furthermore, the Japanese were not consistent in their at-titude toward independence for Indonesia. At first they held outthe possibility of independence (1942), but quickly changed thisto membership in a Greater East Asian Co-Prosperity Sphere(March 1943), then incorporation into the Japanese empire(May 1943), followed by permission to “cooperate in gov-
The Uneven Effect of Historical and Political Experiences
40
ernment” (June 1943), and finally, after growing Nipponization,a deceptive promise of independence (September 1944). Yet de-spite the disappointment and frustration of gradual annexationand Nipponization, and despite the denial of future indepen-dence, nationalist sentiment grew and the nationalist leaders,particularly in Java, never lost their fervor nor stopped puttingpressure on the occupation regime for self-government and in-dependence. As Hatta put it in 1943:
It was perhaps necessary for strategic reasons to divide Indonesiainto separate areas of military administration, but Indonesianswill not give up the desire and determination they have shownover the past forty years to unite these territories into one glo-rious nation. 84
Thus, tremendous changes took place during the brief threeand one-half years of Japanese occupation, out of all proportionto the pace of developments earlier in the century. Not onlywas political consciousness raised on a wide scale, but also,especially toward the end of the occupation, plans were madeand organizations created to prepare for forthcoming indepen-dence.
Although the first nationalist organizations under theJapanese were limited to the Java-Madura command only, theywere not restricted to those living only on Java. There weremany active nationalist leaders from different ethnic groupsthroughout the archipelago. Although nationalism wasstrongest in Java and most of the organized movements andresistance to the Japanese took place there, nationalism haddeveloped a pan-Indonesian appeal. There were frequent rebel-lions against Japanese rule in the Outer Islands that were oftenhard to suppress. Although people from Java predominated inthe councils and organizations that pressed for a share in gov-ernment, the Outer Islands had similar advisory committees andprovincial municipal councils, beginning in 1944. Sumatra, forexample, had a single council set up in March 1945 at BukitTinggi consisting of Acehnese and representatives of western,eastern, and southern Sumatra. 85
It was not until May 1945, however, that a nationwide com-mittee was established to deal with the problems of indepen-dence (and not until August that Indonesian nationalists fromthe navy-administered areas were permitted to come to Javato consult with Javanese and Sumatran leaders). 86 This wasthe Badan Penyelidikan Kemerdekaan Indone sia (the BPKI,
National Integration in Indonesia
41

the Committee for the Investigation of Independence for In-donesia), which consisted of sixty-three nominated membersfrom all classes of the population and all shades of opinion inthe nationalist movement, and included Outer Islanders livingin Java. Nationalists, federalists, unitarians—all had differentideas about the size, shape, partitioning, and administeringof the new country-to-be. 87 It was at the first session of theBPKI that Sukarno proposed the Panca Sila (Five Principles ofState) as the basic ideology of the future state: belief in oneGod, nationalism, humanitarianism, social justice, and popularsovereignty. It is probable that this national philosophy, withits fusion of ideologies in keeping with the ancient Javanesetradition of syncretism, met with acceptance only because ofthe strength of outside pressures—the approaching end of theJapanese occupation and the possibility of independence. Itpapered over deeply rooted differences rather than resolvingthem.
The BPKI adopted a republican form of government anddrafted a constitution based in theory on the Indonesian demo-cratic principles of consultation (musyawarah), consensus (mu-fakat), and cooperation (gotong royong). Sovereignty was toreside in the Majelis Rakyat Indonesia (the Indonesian People’sCongress), which was to consist of the Dewan PerwakilanRakyat (DPR, a parliament chosen by direct vote) together withadditional deputies who were to represent provinces andgroups in proportion to their population and size. The Congresswas to elect a president and vice-president by simple majorityfor a five-year term and a Dewan Pertimbangan Agung (Ad-visory Council of State). Ironically, however, the whole consti-tution reflected more the authoritarian principles of Dutch andJapanese rule that had been so violently criticized than the moreflexible consultation and consensus processes regarded as more“Indonesian.” 88
Considerable disagreement arose over the precise shape ofthe future independent state. Hatta wanted to limit Indonesia tothe former Dutch East Indies but without New Guinea, thoughpossibly including Malaya. Yamin, supported by Sukarno, de-manded the whole of New Guinea, Portuguese Timor, the Britishpossessions in Borneo, and Malaya as far as the frontier withThailand. A third group, consisting mostly of former civil ser-vants, wanted the territory of the Dutch East Indies precisely asit stood. Interestingly, in the voting Yamin’s Greater Indonesiawon an overwhelming majority, 89 illustrating again how unsolid-ified the concept of Indonesia still was in 1945. It was not until
The Uneven Effect of Historical and Political Experiences
42

later that year, when the Indonesian Independence PreparatoryCommittee was constituted, with eight of its twenty represen-tatives coming from the Outer Islands, 90 that the decision wasmade to confine the new independent country to the territoryof the former Dutch East Indies. Independence was declared onAugust 17, 1945, and took only hours to be relayed throughoutthe archipelago and abroad.
In Jakarta, the Komite Nasional Indonesia Pusat (KNIP, theCentral Indonesian National Committee) was set up, with 135members chosen by Sukarno and Hatta to represent the chiefethnic, religious, social, and economic groups in Indonesia; 91
while in the eight provinces established by the PreparatoryCommittee (West, Central, and East Java; Sumatra; Kalimantan;Sulawesi; Maluku; and the Lesser Sunda Islands) arrangementswere made for local national committees. A governor was ap-pointed for each province by Sukarno; the KNIP appointed adelegate to assist each governor. Thus in the six weeks betweenthe Japanese surrender and the Allied arrival, the Indonesianshad established a fledgling republican government with its owncivil service and with extensive militant support among the In-donesian people. The Indonesian flag was flown, the black capor peci (originally a Muslim symbol but extended by Sukarnoto have national significance) was worn, and Radio RepublikIndonesia went on the air. The nationalists, led by the Peta(Indonesian army) and students, first struggled for control ofJapanese weapons and for key cities in both Java and Sumatraand then wrestled with the British occupational forces. Onlyafter this did they begin their major conflict, with the returningDutch, who were unable to comprehend either the extent ordepth of nationalist feeling that had so intensified in their brieffour-year absence.
The next four years of struggle against the Dutch, from 1945to 1949, were a time of growing solidarity and psychologicalunity for many Indonesians in their demand for a united andfully independent Indonesia. Differences of opinion inevitablyarose that temporarily distracted the people and created di-visive tensions, such as that between the youth and the olderleaders both inside and outside the army, and by the com-munists (who attempted to lead a revolt against Sukarno andHatta in Madiun in 1948), but the momentum of the nationalistmovement and resistance both to the Dutch “Pacification Ex-ercises” and to the imprisonment of Indonesian leadersstrengthened national resistance and provided a strong inte-grative force.
National Integration in Indonesia
43

Yet, as with nationalist consciousness, revolutionary fervorwas by no means uniformly felt throughout the country. Supportfor the newly independent Republic centered in central andeastern Java, Jakarta, and parts of Sumatra. By contrast, therewas no strong or active Indonesian nationalist organization ineastern Indonesia, where the Japanese had not permitted In-donesian nationalists to organize or to form militias. 92 Much ofthis area was occupied up to a year before the Japanese sur-render by the Allied forces (Australian) and was returned easilyto Dutch civil administration after the war. Most of Java andSumatra, by contrast, remained part of the revolutionary Re-public. The Ambonese continued to support the Dutch and evenfought against their fellow countrymen’s revolutionary strugglefor independence. Inevitably by so doing, they aroused bitter re-sentment. Indeed, so strong was their anti-Republic sentimentthat after the Round Table Conference in 1949, southernMaluku withstood considerable pressure to merge with the Re-public of Indonesia in a unitary state as the other “federalstates” did. It preferred instead to transfer its leaders (and40,000 of its population who were mainly former members ofthe Dutch colonial army [KNIL] and their families, and formerofficials in the Dutch administration) to the Netherlands andform a government-in-exile there, waiting for the opportunity toreestablish an independent entity in those islands. (The 1975 in-cidents of the ambushed train and the attack on the Indonesianembassy in the Netherlands, and the 1977 school takeover andtrain hijacking illustrate the survival of this hope a generationlater.)
Anti-Republic sentiment was also expressed by the DarulIslam movement focused in West Java, Aceh, and later in SouthSulawesi and Kalimantan. This aimed at establishing an Islamicstate in Indonesia and as such opposed both the Republic andDutch domination. It supported its claim with guerrilla warfare,which lasted from 1950 to 1962.
Part of the Dutch strategy to regain control of the arch-ipelago was to accentuate differences among Indonesians indifferent parts of the country. They attempted to isolate the self-proclaimed Republic from other areas of Indonesia in the hopeof creating a federal order wherein pro-Republican elementswould be outnumbered by Dutch-controlled component states.93 The other part of Dutch strategy was to destroy the Republicby military means. They abrogated a number of agreements (in-cluding the Linggadjati and Renville Agreements) made withthe Republic over the 1946–1949 period and ultimately forced
The Uneven Effect of Historical and Political Experiences
44

on the revolutionary Republic’s leaders a federal state in whichfifteen of the sixteen member states were of Dutch creation. 94
Each of these was far smaller in size and significance than theRepublic, which by 1949 comprised approximately half of Javaand three-quarters of Sumatra (and a population of more thanthirty-one million).
Among Indonesia’s leaders there remained wide differencesof opinion as to the future form and orientation of the country.Pro-Dutch, pro-Islamic state, and pro-Panca Sila (revolutionaryRepublic) nationalist sentiments existed in different parts of thearchipelago. The experiences of the isolation of different areasunder the Japanese and the four years of revolution againstthe Dutch during which the separate regions acted as highlyautonomous units further hindered the growth of unity. How-ever, counterbalancing these centrifugal forces were the psy-chological unity created by the goal of a united and fully in-dependent Indonesia, an increasing sense of national identity,the consciousness of a common political purpose, and the com-mitment to a common revolutionary struggle against the Dutch.Yet in these strong centripetal forces and psychological bondsof unity lay the seeds of weakness. For once independence hadbeen fully attained, the powerful negative dynamic of oppo-sition to colonial rule was no longer applicable, and Indonesiannationalism lost much of its strength as a force for nationalcohesion. In the absence of strong outside pressures, ethnicand regional differences that had been submerged to someextent in the common struggle for independence soon reap-peared to challenge the concept of national unity. Indeed, it hasbeen claimed that the very success of the Indonesian revolutionagainst the Dutch not only strengthened national political con-sciousness, but above all awakened regional pride based on an-cient ethnic particularisms. 95
Also, belief that independence would be a panacea for all dif-ficulties, economic, social, and political, turned quickly to dis-illusionment as expectations for a better life remained largelyunfulfilled (and the standard of living in Java continued to de-cline). In addition, appreciation of the centripetal power createdby opposition to a common enemy contributed to the adoptionof adventuristic policies in the new Republic, such as the con-tinued cries to perpetuate the revolution (“against the enemiesof imperialism, capitalism, liberalism, and individualism” 96 ),the growing confrontation with the Dutch over the status ofWest Irian, and the Konfrontasi with Malaysia of the early andmid-1960s. 97
National Integration in Indonesia
45

THE PERIOD OF INDEPENDENCEThe period of independence has been marked by deep divisions,regional rebellions, and even a short period of civil war (in1958), but also by growing integration and the centralization ofpower. The country has survived as one political entity, unlikemany other areas of the world that had also been united andkept together forcibly by colonial rule but that broke up afterindependence, such as the British West Indies, French West andEquatorial Africa, the Federation of Rhodesia and Nyasaland,and even the former unitary state of Pakistan. Part of the reasonfor Indonesia’s survival has been its shared history along withcertain common cultural underpinnings. Part has to do withthe growing power and widening control of the military Part,too, has been strong leadership, including the charismatic typeof leadership exercised by Sukarno, and his political skill inkeeping the country one 98 and in balancing the various forcesof the nationalists, religious leaders, communists, and military.One way he preserved national unity was by changing the po-litical system from the original federal to a unitary type of statein 1950, and from experimentation with parliamentary democ-racy in 1950–1957 to Guided Democracy (or martial law) in1957–1965. However, the price for such unity under Sukarnowas extremely high, because his concern for solidarity and na-tional unity largely ignored both legitimate regional concernsand the basic economic foundations upon which all statesdepend. As economic decline, inflation, and falling standards ofliving intensified, tensions increased that ultimately helped toprecipitate Sukarno’s downfall, the murder of hundreds of thou-sands of Javanese and Balinese in the aftermath of the abortivecoup of 1965, and the imposition of military rule under the pres-idency of General Suharto.
The change from a weak federal system to the stronger,more centralized unitary state in 1950 was one deliberate steptoward consolidating the fragile unity of the Republic.Sukarno’s emphasis on keeping up the revolutionary spirit andmomentum, on infusing the diverse peoples throughout thearchipelago with a common national symbolism, on reinter-preting history to foster national pride, and on obtaining world-wide recognition contributed to national integration in one re-spect. Indonesia hosted the Asian Games and the celebratedBandung Conference of Third World leaders in 1955. Sukarnosuccessfully repudiated the debt imposed on Indonesia as theprice of independence by the Netherlands in 1949. He nation-
The Uneven Effect of Historical and Political Experiences
46

alized Dutch economic interests and repatriated many Dutchand Chinese, and he succeeded in attaining the transfer of WestIrian to Indonesian control. He inspired and demanded loyaltyand nurtured a sense of national unity.
But these achievements, though integrative in their intentand in many of their aspects, were not without both disinte-grative elements and serious costs. With the removal of thepowerful unifying struggle for independence, regionalismsreemerged and threatened at times to dismember the state.Indeed, Indonesia experienced twenty-one regional rebellionsand revolts within its first twenty years of independence—ampleevidence of the lack of integration within the country. 99
Sukarno’s emphasis on perpetuating the revolution through“symbol-wielding” conflicted with the goals of the “adminis-trators” or liberals, based more in the Outer Islands, whosought to promote integration through rationalized economicdevelopment and efficiency. 100 Important divisions arose alsobetween rival ideologies; among and within political parties, themilitary establishment, and government leaders; and perhapsmost important of all, between Java and the Outer Islands,which itself is a key constituent of these other divisions.
The first national elections, in 1955, though designed to en-courage participation in a national event and though shared inby the population throughout the country, were also a source ofdivision. This was partly because of the two years of intensiveand often bitter campaigns, accompanied by the growth of cor-ruption; partly because the election campaign clarified and em-phasized the divisions existing in society and forced a choiceupon the people; and partly because of the frustration thatensued when the prosperity and progress the elections hadpromised did not materialize. The central issue of the campaignitself was deeply divisive: whether the state should continue tobe based on the Panca Sila or become a state based on Islam.The voting pattern demonstrated both the strength and natureof regional divisions and the depth of divisions among the dif-ferent groups in society, particularly among the nationalist, so-cialist, and religious elements. 101 The Nationalists (PNI), theCommunists (PKI), and the Muslim Scholars’ Association (Nah-datul Ulama, representing the more traditional Muslims) wereall heavily supported in densely populated Java, but gleaned fewvotes in the Outer Islands. By contrast, the Masjumi (the re-formist Islamic party) emerged as by far the largest party of theOuter Islands. 102
National Integration in Indonesia
47

Even the Asian Games and the Bandung Conference pro-voked division, in that these took place on Java and accentuatedthe Java-Outer Islands dichotomy that had been growing overthe years.
This basic division between Java and the Outer Islands hasbeen traced back to the old rivalries existing in the times ofthe ancient empires, between the sea-based, trade-oriented,Outer Island-centered empire of Sri Vijaya, and the land-based,agricultural, Java-centered Majapahit. But other historians seeits roots as much older, going back to differences betweenthe ladang (swidden) cultivation typical of the Outer Islands,and the sawah (wet rice) culture of Java, which dates backto Neolithic times. Sawah cultivation implies a rigid ecologicaltechnique: communal control over land, water supply, and cul-tivation systems is reflected in the highly formalized and hier-archical pattern of the intervillage social relations of Javaneserural society. Communal solidarity, a sensitivity to adat (cus-tomary law), and suffusion with a magico-religious cosmologythat stresses harmony, continuity, order, and the unity of theland, people, and food cultivated, are all features of this lifeorientation. 103 Different strands of opinion represented by thepriyayi (aristocracy) of the kraton (palace) and the abangan(traditional Muslims) of the village are thus held together ina harmonious, communal whole by the common ceremonies,superstitions, and mutual cooperation of traditional Javaneseculture. Javanese society has also a highly absorptive character.Out of this ethos came the Panca Sila.
By contrast, the ladang system of shifting cultivation, whichis much more common in the Outer Islands, has encouragedegalitarian social structures and a more individualistic, entre-preneurial spirit. The purer Muslim tradition found in manyparts of the Outer Islands had little in common with the syn-cretic Javanese current of thought. It opposed the all-embracingPanca Sila philosophy with its lack of distinction betweensecular and sacred, and opposed colonialism through a cru-sading zeal against the infidel. Within this Muslim traditionwere the modernists (who were prepared to combine moderntechnological and scientific ways with a distinctively Muslimoutlook on life), the orthodox (who were able more easily to ac-commodate to the conservative, older generations, particularlyin the rural areas), and the militants (who advocated the estab-lishment of an Islamic state and were willing to back up thisdesire with force).
The Uneven Effect of Historical and Political Experiences
48

Whatever its origin, the Java-Outer Islands dichotomy wasa division to which the Dutch added a further dimension by fo-cusing their attention on Java. Java benefited from certain as-pects of Western tradition such as health measures, sanitation,education, enforced peace between rival groups, more scientificmethods of agriculture, better transportation and communica-tions networks, and so on; but it also suffered the problems ofgreater exploitation and foreign control. The Outer Islands, bycontrast, retained more independence in their traditional waysof life, trading patterns, and indigenous retail and distributiveoperations. They were able to respond positively to new eco-nomic opportunities, including the cultivation of export cropsand improved trading opportunities, and developed increasedpolitical consciousness and regional and ethnic pride. 104
As a result of this differential treatment by the colonialpower, Java’s population grew explosively, from 18 millionpeople in 1875 to 35 million in 1920, and 49 million in 1940. (Ex-plosive population growth continued after independence, withpopulation increasing to 63 million in 1961, 76 million in 1971,91 million in 1980, and an estimated 106 million in 1988.) 105
This growth in population on Java altered the established eco-nomic pattern of Javanese domination of the export economy.Whereas Java had been a rice-producing and rice-exportingarea, producing 82 percent of Indonesia’s total exports as lateas 1892, Java’s increase in population soon outstripped rice pro-duction, with the result that Java became a net rice-importingarea. By 1955 Java contributed only 12 percent of Indonesia’sexports. 106 Because 88 percent of Indonesia’s foreign exchangeearnings thus originated in the Outer Islands (71 percent fromSumatra alone), it is easy to understand the growing re-sentment aroused especially in the productive areas of theOuter Islands against the perceived parasitism of Java, whenover 80 percent of Indonesia’s foreign earnings was being spenton goods and services for the population in Java. 107 In addition,the regions outside Java became intensely dissatisfied with thegovernment’s failure to encourage their economic developmentor even to provide sufficient administrative and fiscal decentral-ization to allow them to undertake this themselves. 108
Economic disparity and Javacentric economic policies,therefore, were one source of friction between Java and theOuter Islands. Others were fear of Javanese imperialism anddomination of politics and culture, resentment of “Javanese ar-rogance and feudal class-consciousness,” 109 growing discontentwith the centralized administrative control exercised from
National Integration in Indonesia
49
Jakarta, inadequate communications within and among theOuter Islands and between them and Java (heightened after thetake-over of Dutch concerns in 1957 as the West Irian campaignbackfired and the Dutch withdrew their interisland shippingfleet), and the almost inevitable inefficiency of a newly createdbureaucracy. The coalition of divergent interests symbolizedby the Javanese syncretic, symbol-wielding, politically orientedPresident Sukarno and the Sumatran, economics-minded ad-ministrator, Vice-President Mohammed Hatta, came under moreand more strain, until it culminated in Hatta’s resignation inDecember 1956 and the unilateral imposition of GuidedDemocracy by Sukarno the following year.
These sources of dissatisfaction, together with fear of thegrowing influence of communism, contributed to the PRRI-Per-mesta rebellion of 1958–1961, the most serious threat to theterritorial integrity of Indonesia since independence. This cen-tered in West Sumatra and North Sulawesi and dramaticallyhighlighted the intensity of regional feelings. 110 Yet the lackof widely expected support from other regions and the over-whelming defeat of the rebellion demonstrated the strength ofIndonesian cohesion. As a result of the rebellion, the centralizedgovernment’s control over the provinces was tightened and thegovernment became increasingly authoritarian. From speechesextolling national unity, Sukarno turned to demanding that allIndonesians give their loyalty exclusively to his government.He insisted that their devotion to national goals set by himshould supersede whatever personal commitments they mighthave to local, ethnic, or religious communities, to professionalstandards, and even to humanitarian values. 111
Sukarno relied increasingly on political and symbolic meansof attaining national unity: he tried to inspire nationalisticfeelings through the use of oratory and appeals to patriotism,slogans, and ceremony. The Political Manifesto of 1959 (Ma-nipol USDEK) was rich in symbolism, from the mystical numberof five (as in Panca Sila) to the major ideas themselves in theacronym USDEK: the 1945 constitution (Undang-undang dasar1945), Indonesian socialism (Sosialisme Indonesia), GuidedDemocracy (Demokrasi terpimpin), Guided Economy (Ekonomiter pimpin), and Indonesian identity (Kepribadian Indonesia).Nasakom, the title of the national front formed in 1961, derivingfrom the initial syllables of the words for nationalism (nasion-alisme), religion (agama), and communism (komunisme), wasanother example of Sukarno’s love of acronyms and synthe-sizing symbolism. 112 Sukarno’s oratory was superb, and
The Uneven Effect of Historical and Political Experiences
50

through this, his consistent concern with national unity and sol-idarity, and his warmth and patriotism he won tremendous re-spect and affection from a vast number of Indonesian citizens.113
Guided Democracy (1957–1965), however, was accompaniedby continued insensitivity to regional needs, bureaucratic in-efficiencies, and deteriorating economic conditions. Even theEight-Year National Plan, put forward in 1960, was significantmore for its symbolism (it had seventeen parts, eight chapters,and 1,945 paragraphs, commemorating the declaration of inde-pendence on 17 August 1945) and wishful thinking than for itsrealistic approach to development. 114 Sukarno spent much ofthe country’s resources on huge, unproductive national monu-ments and extravagant world tours, while inflation soared andtension increased among the major political groupings—the na-tionalists, Muslims, communists, and the army. Tensions finallyerupted in the pro-communist abortive coup of September 30,1965 (Gestapu: Gerakan September Tigapuluh, the September30 Movement). The ensuing bloodbath, in which hundreds ofthousands of communist supporters were massacred and innu-merable personal scores settled, revealed the depth and bit-terness of the hostilities that had built up over the years,particularly during the “imposed consensus” of the GuidedDemocracy period. 115 Bloodletting was greatest in syncreticMuslim Java, but was by no means confined there: Hindu Balialso witnessed extensive killings, as did North Sumatra, al-though far fewer deaths occurred in the Outer Islands.
The New Order (Orde Baru), ushered in by Sukarno’s suc-cessor, General Suharto, has rejected the Sukarno model of at-taining national unity and integration by symbol-wielding andrevolution in favor of consistent emphasis on political stability,order, and economic development, even at the price of the lim-itation of democracy and the imposition of military rule (albeitwith civilian technocrats incorporated into the government).Indeed, the army has presented itself as a truly national forceidentified with the interests of the community as a whole andtherefore most fitted to rule. 116 At a seminar in 1965, the armyproduced the doctrine of the Dwi Fungsi (Dual Function) of thearmed forces, justifying their dual role as both a military forceand a social-political force (covering the “ideological, political,social, economic, cultural, and religious fields”). Since then thearmy has justified its continued domination of the state on thegrounds that civilians still need the strong leadership that onlythe army can provide. 117 Since 1965 the army has expanded
National Integration in Indonesia
51

its role in politics and administration; many military leadershold positions as governors, ambassadors, secretaries-generalof government departments, and managing directors of statefirms at both the national and regional levels. 118
Indeed, the military has been increasing its political rolein the country ever since 1945, when the youths who took uparms were motivated less by the desire for a military careerthan by patriotism and support for the Republic proclaimedby Indonesia’s nationalist leaders. 119 After independence wasattained, the army continued its political involvement, at firstin an essentially guardian role, but later as a full participantin the affairs of state. The weak hierarchical structure andsharp rivalries among groups of officers curbed the army’s ef-fectiveness as a political force in its early days. But graduallyarmy leaders were able to take advantage of the various na-tional crises (generated in part by politically oriented dissidentgroups within the army) and the weaknesses of successive po-litical systems to take wider powers. After the introduction ofmartial law in 1957, the armed forces, and particularly thearmy, became deeply involved in politics, civil administration,and economic management, and thus became a key part of thegovernment coalition under Guided Democracy. 120 The armygained in strength and unity also as a result of its role in puttingdown the rebellions of 1958–1961.
After 1957 (the imposition of Guided Democracy), and par-ticularly after 1965 (the abortive communist coup and the be-ginning of the military government under President Suharto),the army rapidly expanded its role in the economy, as well as itspolitical power. This took place at two levels. First, the militarysought to supplement the limited funds they were allocated bythe government by establishing various enterprises and con-trolling certain elements of the economy such as the state oilcorporation (Pertamina), the national food trading agency, andthe general trading corporation. 121 Similar arrangements weremade also in the Outer Islands, where military officers becameinvolved in a wide range of business activities. By obtainingfunds and foreign exchange directly from Pertamina and otherenterprises controlled by the military, the army sought to freeitself from domestic criticism, bureaucratic controls, andforeign pressure by creating the impression that military expen-diture was less than it really was. Indeed, by the mid-1970s,at least half the army’s operating funds derived from extragov-ernment sources. 122
The Uneven Effect of Historical and Political Experiences
52

Second, army officers developed their own private economicinterests, establishing business partnerships with Chinese andforeign businessmen, and arranging contracts, credits, and li-censes for colleagues, friends, or relations, or in exchange forcommissions. Indeed, Crouch has suggested that many officersfelt much more at home dealing with Chinese and foreign busi-nessmen than commanding troops in the field. 123 The militarythus acquired a stake in the regime and in defending the ex-isting social order.
The military was also very concerned after 1965 not just toconsolidate its own power but to provide the political stabilitynecessary for economic development to flourish. Specifically,the military leaders incorporated civilian technocrats into thegovernment, hoping that they would create a favorable eco-nomic climate for Western and Japanese investment capital andso provide lucrative economic opportunities for the military-dominated elite. 124 The rapid expansion of the economy throughthe influx of foreign aid and private capital not only enabled thearmy to raise funds for its own operations and provided officerswith material satisfaction from their own private activities, butalso, by providing greater revenues, enabled the governmentto raise salaries substantially for civil servants throughout thecountry, thus helping to create a broader civilian base ofsupport for the regime.
The role of the military has had both positive and negativeeffects in terms of the overall integration of the nation-state. Onthe positive side, the New Order military government with itscivilian technocrats has established a large measure of politicalstability and continuity, which in turn has restored investmentconfidence and led to real progress in economic development.Loans from the World Bank and loans and aid from the coun-tries in the Inter-Governmental Group on Indonesia (IGGI), aswell as investment by private investors, have all contributed tothe country’s economic growth. The post-1965 period has beencharacterized by the rehabilitation of the much-neglected trans-portation system and great achievements in the developmentof new microwave and satellite communications systems, theend of the chronic inflation of the mid-1960s, improvement inproduction levels, a spectacular increase in export earnings,and a succession of four five-year economic development plans.There has been a slow but appreciable increase in the generalstandard of living for many people.
National Integration in Indonesia
53

Yet not all the effects of the New Order or even of the im-proved economic situation have been integrative, either eco-nomically or politically. Economically, the emphasis on effi-ciency in development has resulted in greater and increasinglyapparent inequalities between the military and civilians, be-tween urban and rural areas, between landowners and localgovernment officials on the one hand and the mass of peasantryon the other, and between Java (where most developmentmonies have been invested) and the Outer Islands, inequalitiesthat have provoked widespread resentment against the gov-ernment. The army’s conception of economic development hasbeen primarily oriented toward the interests of the elite andwhite-collar middle class, and toward the modern sector of theeconomy, at the expense of indigenous entrepreneurs and thenational good. Indeed, Crouch claims that the entire system isdesigned primarily to serve the interests of the military eliteand the civilian bureaucratic and business groups closely linkedwith it. 125 Only in the last two five-year development plans, Re-pelita III (1979–1984) and Repelita IV (1984–1989), has the em-phasis shifted to the goals of greater equality in developmentand the more even distribution of the fruits of devel-opment—and there are questions as to how far these goals arebeing implemented.
Politically, despite the elaborate facade of democratic elec-tions in 1971, 1977, 1982, and 1987, the military retains controlof the country. Political parties have been forcibly amalgamatedand streamlined, and support has been coerced for thegovernment-sponsored party, Golkar (Golongan Karya, Union ofFunctional Groups). Many of the political channels previouslyavailable as outlets for criticism and as safety valves for feelingsof resentment against the regime are now severely limited;unacceptable political opposition is suppressed. The press ismore strictly controlled and muzzled and student criticism moremuted than before. Until late 1977, when thousands were re-leased, more political prisoners were in custody than at anytime in the past. In contrast to Sukarno’s mobilization of thepeasant population for various patriotic causes, the New Orderhas encouraged political passivity. Fear of arrest and of the pow-erful secret police (Kopkamtib, the Operational Command forthe Restoration of Security and Order, established in 1965), aswell as of the army-controlled State Intelligence CoordinatingBody (Bakin, founded in 1967), has further discouraged political
The Uneven Effect of Historical and Political Experiences
54

activity. It remains to be seen whether such lack of meaningfulpolitical participation can be extended indefinitely, especially inthe face of blatant corruption and mismanagement.
Greater streamlining of the bureaucracy and strongercontrol in government, although leading perhaps to greater na-tional coordination, have resulted also in increased Javanesecontrol over Indonesian life. 126 This can be seen in the growingproportion of Javanese in the government (especially in thecabinet) and in the military leadership. This preponderanceof Javanese officers occurred originally because most of thefighting during the revolution took place in Java. But it becameeven more pronounced when many non-Javanese lost their po-sitions because of their involvement in the 1958 rebellion. Be-cause of Indonesia’s uneven population distribution, it is to beexpected that the Javanese should make up between 60 and65 percent of the national leadership in proportion to theirnumerical strength. But this proportionate representation isnot easily reconciled with the need to grant representation onthe basis of territorial extent or ethnic balance. And in anycase Javanese domination of government offices and army lead-ership exceeds their proportional makeup of the population ofIndonesia and has increased significantly since 1956. 127 Bythe 1960s about 70 percent of army officers were Javanese.In addition, the carefully worked-out balance in the highestleadership positions, by which the president (Sukarno) was aJavanese and the vice-president (Hatta) a Sumatran, a repre-sentative of the Outer Islands, was upset for more than twentyyears after Hatta’s resignation in 1956; the position of vice-president was first abolished and then, after the position wasrestored in 1965, filled by Hamengko Buwono IX, the Sultanof Yogyakarta, a Javanese, until Adam Malik, a Sumatran, waselected in 1978. From 1983 to 1988, however, the vice-pres-ident was from West Java, retired General Umar Wira-hadikusumah. In 1988, another Javanese, Soedharmono, waselected vice-president. Javanese domination of the military andgovernment has changed somewhat since the mid-1970s asthe 1945 (mainly Javanese) generation has begun to reach re-tirement. They are being replaced by the so-called Magelanggeneration (trained at the Indonesian Armed Forces Academy[Akabri] in Magelang), which includes officers from all parts ofIndonesia. This group includes a greater proportion of officersdedicated to greater regularization and reform. 128
National Integration in Indonesia
55

The growing centralization of authority within the militaryhas been another cause for concern. After the PRRI-Permestarebellion, which ended in 1961, the central army leadership im-proved its position vis-à-vis the Outer Islands. It garrisoned theOuter Islands with forces from Java (thus in effect establishing amilitary occupation of the Outer Islands by Java’s “central gov-ernment” forces in the name of national unity); it reduced theauthority of the regional military commanders; and it created apara-commando regiment under direct central control. 129 Sincethe 1965 abortive coup power has been so much further cen-tralized and concentrated among the Javanese that some OuterIslanders claim that they have exchanged Dutch colonialism forJavanese colonialism and “colonelism.” 130 In addition, Suhartohas also consolidated authority within the armed forces them-selves. Up until 1965 Sukarno had manipulated interservicerivalries and undermined the cohesion of the armed forces, ex-pecting the air force, navy, and police to balance the powerof the army. 131 After 1965 Suharto reduced the power of theother three branches and ended open factionalism within thearmy through the transfer of commanders. He also halted in-terservice rivalry with a reorganization and integration of thearmed forces under a single command.
Finally, the army’s integrative political power has been ex-ercised partly through its “territorial” organization. Alongsideits fighting units the army developed a network of territorialunits concerned with internal security and generally watchingover civilian activities. Thus, the army sought to integrate itselfwith the people through its territorial units, which more or lessparalleled the civilian administration at every level. Martial lawhad been administered through these territorial units between1957 and 1963; later in the 1960s, after emergency regulationswere abolished, local commanders continued to carry out in-ternal security functions as agents of Kopkamtib. Through thisterritorial organization and the power of the armed forces, theIndonesian government has had at least a fair level of effectivecontrol over the whole of its national territory, unlike several ofits Southeast Asian neighbors. It can, perhaps, be argued thatwithout military force it is entirely possible that the fragile stateof Indonesia would have fractured.
However, this raises the question of the extent to which In-donesia’s unity is coerced or free and genuine, and whethera measure of coerced unity is really the same thing as inte-gration. Undoubtedly there is considerable pressure from thecentral government to maintain Indonesia’s territorial integrity
The Uneven Effect of Historical and Political Experiences
56

and achieve political stability through both coercion and thedistribution of patronage. But in addition, a variety of govern-ment policies throughout Indonesia’s period of independencehas consistently sought to promote national integration withinthe country (although the methods of reaching this goal havechanged over time).
In this brief survey of Indonesia’s recent history, a majorunderlying theme has been the tension between Java and theOuter Islands as it has affected the political, sociocultural, eco-nomic, and military spheres of the national life. Even potentiallyintegrative events and structures have been undermined bythis division. Yet the dichotomy between Java and the Outer Is-lands is not the only source of division within the country. Asmight be expected in a nation as large and diverse as Indonesia,the situation is much more complex. This complexity, whichstrongly modifies any rigid distinction between Java and theOuter Islands, is more integrative than the situation existing,for example, within neighboring Malaysia, where historical de-velopments have reinforced more clear-cut, ethnically based di-visions. Within Java there are deeply felt divisions among theSundanese of western Java, the Madurese, and the ethnic Ja-vanese of central and eastern Java, in cultural as well as politi-cal orientation. In the Outer Islands there is considerably morediversity, not only among sukubangsa (major tribal groups) suchas the Batak and Minangkabau or Ambonese and Dyak, butalso among suku (subtribal groups) such as the Karo, Toba, andMandailing Batak. The Acehnese are well known for their hos-tility to any outside control, be it Dutch or Indonesian. Andresentment has been felt historically by the peoples of SouthSulawesi against the Minahasans (of North Sulawesi) as well asagainst the Javanese. These examples highlight one of the keyproblems of Indonesian unity: in many areas, ethnic loyalty stillrivals national loyalty in importance.
At the same time, certain areas outside Java have partici-pated disproportionately in the national life of the country, bothin terms of their areal involvement in the various integrativeexperiences of Indonesia’s history and also in the number ofleaders originating from them. Three or four ethnic groupsstand out for their more entrepreneurial and dynamic rolesin national affairs—the Batak and Minangkabau in Sumatraand the Minahasans and (to a lesser extent) the Ambonese ineastern Indonesia. These have provided national leaders far out
National Integration in Indonesia
57

of proportion to their numbers, and the trading network createdby the Bugis and Makassarese (and, of course, the Chinese) haslikewise been disproportionately influential.
Within ethnic groups there have been divisions between re-ligious and traditional (adat) leaders. Furthermore, there havefrequently been broader differences between coastal and in-terior dwellers within a single island than among coastalpeoples in different islands separated by hundreds of miles.Thus, an affinity created by a similar life style (such as depen-dence on the sea for fishing and for communications) and by anetwork of trading connections has often enabled the sea to bean integrative rather than a divisive force.
The history of Indonesia, therefore, consists of a mosaicof experiences, both integrative and divisive, which have beenshared to greatly varying extents by different parts of the In-donesian archipelago. Although it can be argued that manyof the experiences have been uneven and even ambiguous intheir effect, the cumulative impact of the past has been gen-erally integrative. The shared history of the ancient empiresand kingdoms, Dutch colonialism, the Japanese occupation, thestruggle for independence, and over four decades of functioningas an independent nation-state, together with the country’s an-cient roots, both mythical and historical, and its existence asone political entity with basically the same political boundariesfor almost four centuries, have served to provide an importantcommon heritage for the vast majority of Indonesia’s inhabi-tants. Most people consider themselves to be Indonesians andhave a genuine sense of national pride and identity.
However, two provinces have not shared to anything likethe same extent in most of the historical experiences discussedthus far: Irian Jaya, because of its geographical location at theeastern extremity of the country, its different ethnic and culturalcomposition, its relative neglect by the Dutch, and its somewhatlater full incorporation into the nation-state of Indonesia; andEast Timor, which was a Portuguese colony until 1976, when itwas annexed by the Indonesians. They therefore merit separateconsideration.
The Uneven Effect of Historical and Political Experiences
58

THE EXCEPTIONAL PROVINCES: IRIAN JAYA ANDEAST TIMOR
The problems posed by Irian Jaya and its continued incorpo-ration into Indonesia remain considerable. The indigenous Iri-anese are ethnically and culturally quite different from theother peoples of Indonesia, yet their history has been bound up,albeit loosely, with that country for over 300 years and perhapsmuch longer. Indonesian nationalists claim that Irian Jaya waspart of the great thirteenth-and fourteenth-century kingdom ofMajapahit. The recorded history of Irian Jaya dates back to1660, when Tidore, which had nominal jurisdiction over thearea, became a dependency of the Dutch East India Company.This nominal rule of Tidore over Irian Jaya formed the basis ofthe Netherlands East Indies’ boundary agreement with GreatBritain in 1885 and with Germany in 1910. But an effectiveDutch presence in Irian Jaya did not begin until 1898, and eventhen, apart from being used for camps for exiled Indonesiannationalists, Irian Jaya was basically neglected. Not until afterthe Second World War, in an attempt to ward off claims by In-donesian leaders that Irian Jaya was inherently a part of theirnewly proclaimed independent country, did the Dutch establishfor the first time a permanent administration for the territory.When the Dutch finally conceded independence to Indonesia in1949, therefore, Irian Jaya was not included. 132
This policy led to an intensified confrontation between In-donesia and the Netherlands, which was not settled until 1962when Irian Jaya was transferred to United Nations auspices.In 1969 an “Act of Free Choice” was conducted in which rep-resentatives of the Irianese voted in a referendum on whetherthey wanted to remain with Indonesia or become a separate,autonomous state. However, since this referendum was takenunder Indonesian supervision and control, with few safeguardsto ensure that the Irianese would be given a fair opportunityto exercise their choice, charges of Indonesian rigging of this“Act of Free Choice” abound. Irianese nationalists, determinedto fight for an independent Irian Jaya, formed in 1963 the Or-ganisasi Papua Merdeka (the OPM or Free Papua Movement).During the early 1970s sporadic armed clashes occurredthroughout Irian Jaya between the Indonesian authorities andWest Papuan freedom fighters. These escalated into more sig-nificant local uprisings in 1977 and 1978, coinciding with thenational elections and associated with Melanesian resistanceto pressures to vote for the ruling Golkar party. They drew re-
National Integration in Indonesia
59

newed attention to the demand for Irianese separatism, andIndonesia’s handling of the situation elicited widespread sym-pathy for the Irianese, especially among Irian Jaya’s Melanesianneighbors. 133
The OPM continues to operate, partly from outside thecountry, with political and propaganda activities organized frombases in the Netherlands, Senegal, and Papua New Guinea, andpartly as a guerrilla force throughout Irian Jaya and particularlyin the region near the Papua New Guinea-Irian Jaya border. Al-though the leaders claim to have 35,000 freedom fighters, mostreliable sources accept an estimate of 400–600 guerrillas withan extensive network of supporters. 134 Despite numerous at-tempts to eradicate them, the OPM continues to grow stronger,claiming wider international recognition. Its strategy includesthreatening vital oil, gas, and mineral facilities in Irian Jaya,causing a diversion of scarce resources to maintain security.The OPM’ s resistance to the Indonesian government is basedon several grievances: forced territorial incorporation into In-donesia, cultural imperialism, loss of identity, alienation of land,and political repression.
Indeed, there appears to be considerable evidence tosupport Irianese claims that Irian Jaya’s wealth of natural re-sources—petroleum, natural gas, hard minerals (especiallycopper), and timber—is being exploited by U.S., Japanese, andSouth African firms for the benefit primarily of the Indonesiancentral government in Jakarta, the military establishment,foreign investors, and local (often non-Irianese) officials. Few ifany benefits accrue to the Irianese people; to the contrary, suchinvestments have frequently caused havoc in the lives of the Iri-anese by uprooting them and undermining their way of life.
Nevertheless, the Indonesian government is determined toconsolidate Indonesian control over Irian Jaya and integrate thearea into the national whole, and not just for economic reasons.There are symbolic and security reasons as well. For if IrianJaya were allowed to secede, a chain reaction of other dissat-isfied regionally based minorities could follow.
Consequently, the Indonesian government has taken anumber of steps to ensure the continued integration of theprovince. It has moved, or encouraged to move, thousands ofnon-Irianese from Java, Maluku, and Sulawesi to resettlementsites in Irian Jaya. By the early 1980s, over 250,000 non-Iri-anese had been added to Irian Jaya’s 750,000 indigenouspeople. The newcomers dominate the urban areas, and increas-ingly the economic activities of the province. The transmi-
The Uneven Effect of Historical and Political Experiences
60

gration (resettlement) plan for 1984–1989 anticipated themovement of a further one million people to Irian Jaya, thusthreatening to reduce the Irianese to a minority in their ownprovince (although that goal has not been reached). As criticshave complained, the transmigration policy goes “in tandemwith a systematic policy of Indonesianization (and even Java-nization) and Islamization of Irian Jaya,” the inevitable loss ofindigenous land, and political repression that is part of the costof “pacifying” the province. 135
Other steps taken by the Indonesian government to inte-grate the province include efforts to assimilate the local pop-ulace by bringing Irianese at the local level into the provincialadministration, the police, and the armed forces. A massive ed-ucational program has been designed to “induct the Irianeseinto the cultural mainstream.” 136 This includes increasing theirknowledge of the Indonesian language and providing opportu-nities for tertiary study and training in Java and overseas. TheTrans-Irian Jaya Highway is being built along the length of theborder with Papua New Guinea in an attempt to cut off the OPMfrom its support source in Papua New Guinea. It remains to beseen how successful these measures will be.
The situation in East Timor poses less of a threat than doesthat in Irian Jaya to the continued integrity of Indonesia, de-spite its very different colonial history, partly because of its lo-cation and the much greater inherent poverty of the province.But the damage done in the past decade has been proportion-ately greater.
Despite centuries of historical contacts, both trading andpolitical, between the great Hindu empires and succeedingMuslim kingdoms in Java on the one hand and the eastern partof Timor on the other, the Indonesians made no attempt to in-corporate East Timor into the country until 1975. Indeed, fewIndonesian nationalists ever viewed East Timor as part of In-donesia. But in 1975, uncertainty about the nature of Portugal’srevolution and its consequences for its small Portuguese colonyin Southeast Asia, and fear that a nominally independent EastTimor could lead to a leftist (possibly Chinese-dominated) sub-versive government as well as possibly serve as a model forother minor but smoldering secessionist movements in easternIndonesia led the Indonesian government to annex the territory.137
National Integration in Indonesia
61

Indonesia’s invasion of East Timor in December 1975 wasfollowed by an “Act of Free Choice,” arranged by an Indonesiangovernment that ignored the fact that more than two-thirds ofthe population of the territory was behind rebel (Fretilin) lines.138 The ensuing massacres, atrocities, and looting, and the re-sulting misery, suffering, and humiliation of the Timorese, aswell as the famine and resulting starvation and outbreaks ofdisease, combined to reduce East Timor’s population from anestimated 688,770 in 1974 to 329,270 in 1979, according toRoman Catholic Church officials. 139 Even if the 1980 officialcensus figures of 550,000 are accepted as accurate and not in-flated, this still represents a decline of over 130,000 from thepopulation size on the eve of Indonesia’s invasion. With popu-lation growing normally at about 2 percent per year, however,the population should have been around 750,000 in 1980. Whenfinally in 1979 aid workers from the International Red Crossand Catholic Relief Services were allowed into East Timor, theywere shocked at the extent and depth of the human misery: be-tween one-tenth and one-third of the population had perishedand over 300,000 were in the resettlement camps, debilitated,demoralized, and deeply alienated. 140
Despite ten years of repression and deplorable conditions,some 800–1,000 Fretilin guerrillas are still active in East Timor,against whom the Indonesian government has reportedly sentsome twenty army battalions with around 15,000 men (despitethe claim of General Benny Murdani, commander of Indonesia’sarmed forces, that only fourteen battalions with about 7,000men were confronting 500–700 guerrillas). 141
The Indonesian government claims that much has been doneto integrate the province into the nation-state of Indonesia andto raise the standard of living of the people. Journalists havereported improvements in the living conditions of many, withbetter housing and water supplies and plans for a governmentsugar plantation and sugar mill. 142 However, persistent reportscontinue of ongoing dissatisfaction with the resettlementcamps, which are termed no better than internment camps. Thisis because they are located so far from the inhabitants’ fields,they greatly restrict people’s freedom of movement, and theydemand an unacceptable change in lifestyle from that of the tra-ditional hamlets. Moreover, most of the worthwhile enterprisesof East Timor have been taken over by army officers, and theeconomy has been generally mismanaged. 143
The Uneven Effect of Historical and Political Experiences
62

The greatest challenge now for the Indonesian governmentis to win the hearts of the deeply alienated population and to re-place unwilling submission to Indonesia’s rule with nationalismand Indonesian patriotism.
Integration is a dynamic concept, one that has to be con-stantly nurtured and its component dimensions kept in balance.The history of many countries demonstrates that changing real-ities can raise dangerous tensions among regions, even in well-integrated nation-states. Even more in Indonesia, a diverse andwidely dispersed archipelagic state, there is no room for com-placency in the ongoing struggle to strengthen national inte-gration.
National Integration in Indonesia
63
3The Sociocultural Dimension
JUST as integration depends upon shared historical experiencesand participation in one national political system, so also it de-pends upon the degree to which people within that politicalentity share certain sociocultural characteristics and feel them-selves to be one nation. It is important, therefore, both to ex-amine the integrative nature of the dominant sociocultural fea-tures of the population and to analyze the extent to whichthese characteristics are shared by peoples in each province ofthe nation-state of Indonesia. Important shared characteristicsinclude use of a common language, adherence to a commonreligion (or at least to shared cultural features that have areligious basis), and participation in a “national culture” inthe sense of shared national values, customs, organizations,and institutions that transcend local and ethnic boundaries,extend nationwide, and promote national consciousness and in-terregional contact. A shared culture also includes exposure tocommon radio and television shows and nationally producedmovies, and access to other nationwide services and amenitiessuch as health care and nationally organized education.
The tremendous diversity of Indonesia’s population has al-ready been discussed. Yet underlying this mosaic of differencesin Indonesian society are certain unifying features. From ananthropological perspective, these common characteristics in-clude aspects of food, dress, sports, and attitudes toward pets,disease, and sexual roles. 1 To these can be added common at-titudes toward time, the elderly, and the family, an almost ubiq-uitous belief in spirits, a general acceptance of authority, and anappreciation of the value of symbols.
Promoting national integration, a consistent goal of all na-tionalists and independent Indonesian governments, has meanttrying to increase and strengthen these and other shared na-tional characteristics, to make Indonesia’s motto (Bhinneka
64

Tunggal Ika, Unity in Diversity) a reality. The aim has been toredirect local primordial bonds and ethnic and regional loyaltiestoward the larger nation-state, toward national consciousness,loyalty, and interests; and to encourage participation in a na-tionwide culture and way of life. Data for this chapter are tabu-lated in Appendix 1.
LANGUAGEA common national language has long been recognized as oneof the strongest integrating forces within a nation. Its use isobvious in permitting interregional communication and thegrowth of mutual understanding and a common identity. Lan-guage is also a major vehicle for culture.
Yet although Indonesian is spoken by many, especially in thecoastal areas of most of the islands of the archipelago, it is thesecond or third language for the vast majority. Most Indone-sians speak one of the more than 250 mutually incomprehen-sible languages belonging to the Malayo-Polynesian languagefamily. Also represented are Papuan tongues in Nusatenggara,Melanesian speech in parts of Irian Jaya, and a distinctivenorthern Halmaheran language group in northern Maluku. 2
However, as a result of a history of extensive commercialties among many of the islands in Indonesia as well as withthe Malay Peninsula and northern Borneo, a common trade lan-guage developed, bahasa Melayu pasar (market Malay), incor-porating Sanskrit, Hindi, Arabic, and a wide range of words ofother origins. It was this language that was used widely in SriVijayan days and was the vehicle not only for trade but also forthe spread of Islam, which was brought by Indian merchants inthe fourteenth century. In 1928 the Second National Youth Con-gress adopted Malay as the country’s one national language andrenamed it Indonesian. This and other events, like the launchingof a literary magazine, the Pujangga Baru, in 1932 and the firstIndonesian Language Congress, Kongres Bahasa Indonesia, inSurakarta in 1938, all increased acceptance of the national lan-guage and had far-reaching effects on the growth of unity in thecountry, for they symbolized the growing nationalist movementand helped to stimulate a new national consciousness. 3
The choice of Indonesian as the national language was offundamental importance for several other reasons. Not only wasit spoken over a much wider area than any other language, butits adoption avoided the overtones of domination by the major
National Integration in Indonesia
65

ethnic group, the Javanese, in a united republic. Indonesia,by using this politically neutral language, was thus able toavoid the internal conflict over language experienced by suchcountries as India, Burma, and Belgium. Further advantagesof Indonesian over Javanese lie in its simplicity and egalitariancharacter. The Indonesian language has high status in modernIndonesian society partly because of the prestige and great au-thority of the elite groups who used it increasingly both amongthemselves in place of Dutch and in their capacities as adminis-trators, functionaries, and so on. 4
At the time of its official adoption as the national languageof Indonesia in 1928, bahasa Indonesia was the mother tongueof only about six million of the estimated sixty million Indone-sians, those living primarily in eastern Sumatra. By contrast,at that time there were well over twenty million people in In-donesia who spoke Javanese as their mother tongue. Even todayonly 11.9 percent of the population reportedly use Indonesianas their first language. 5
Use of Indonesian has been and still is being actively pro-moted, partly by a permanent language commission (func-tioning as part of the Linguistic and Cultural Institute of theFaculty of Literature and Philosophy at the University of In-donesia) that continues to develop the language, decide onnew terms, and establish modern scientific and technical vo-cabularies; and partly by the expanding communications linksthroughout the archipelago that have served to extendknowledge of Indonesian. Indonesian is currently used in allgovernment departments, on all official occasions, in education,and for all nationwide communications. The number of peoplespeaking Indonesian has been increasing rapidly: in 1971, ac-cording to the census, only 40.5 percent of the population spokeIndonesian, 6 but by 1980 this figure had reached 60.8 percent7 (although these figures, as all census data, should be handledcautiously). However, Anwar claimed that much earlier a farhigher percentage, a “very great majority,” knew the languageand that practically everyone had some knowledge of it. 8
The proportion of people speaking the national language ineach province varies widely (from 33 percent in East Timorto almost 100 percent in Jakarta), as Figure 3.1 illustrates. 9
Whether Indonesian is used as a lingua franca depends on twomajor factors: first upon whether there is a sizable numberof homogeneous people in a limited area who have a strong
The Sociocultural Dimension
66
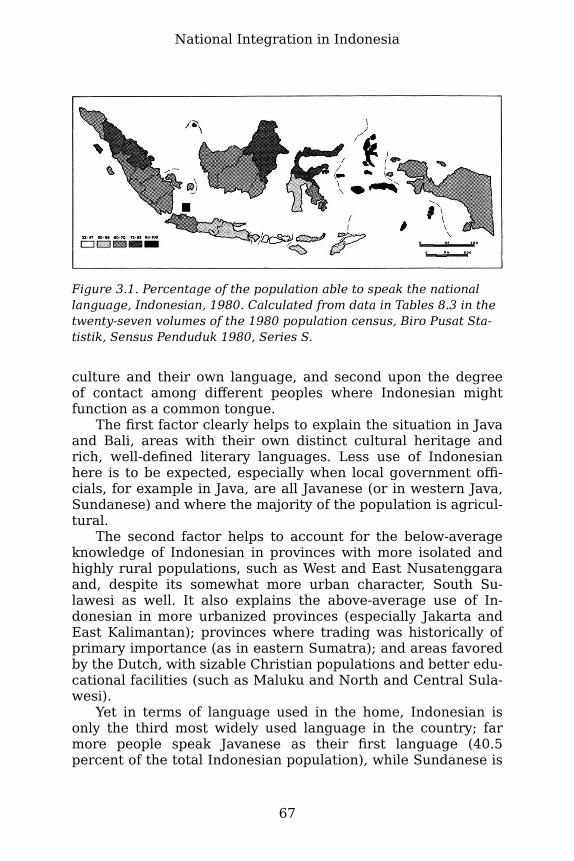
Figure 3.1. Percentage of the population able to speak the nationallanguage, Indonesian, 1980. Calculated from data in Tables 8.3 in thetwenty-seven volumes of the 1980 population census, Biro Pusat Sta-tistik, Sensus Penduduk 1980, Series S.
culture and their own language, and second upon the degreeof contact among different peoples where Indonesian mightfunction as a common tongue.
The first factor clearly helps to explain the situation in Javaand Bali, areas with their own distinct cultural heritage andrich, well-defined literary languages. Less use of Indonesianhere is to be expected, especially when local government offi-cials, for example in Java, are all Javanese (or in western Java,Sundanese) and where the majority of the population is agricul-tural.
The second factor helps to account for the below-averageknowledge of Indonesian in provinces with more isolated andhighly rural populations, such as West and East Nusatenggaraand, despite its somewhat more urban character, South Su-lawesi as well. It also explains the above-average use of In-donesian in more urbanized provinces (especially Jakarta andEast Kalimantan); provinces where trading was historically ofprimary importance (as in eastern Sumatra); and areas favoredby the Dutch, with sizable Christian populations and better edu-cational facilities (such as Maluku and North and Central Sula-wesi).
Yet in terms of language used in the home, Indonesian isonly the third most widely used language in the country; farmore people speak Javanese as their first language (40.5percent of the total Indonesian population), while Sundanese is
National Integration in Indonesia
67
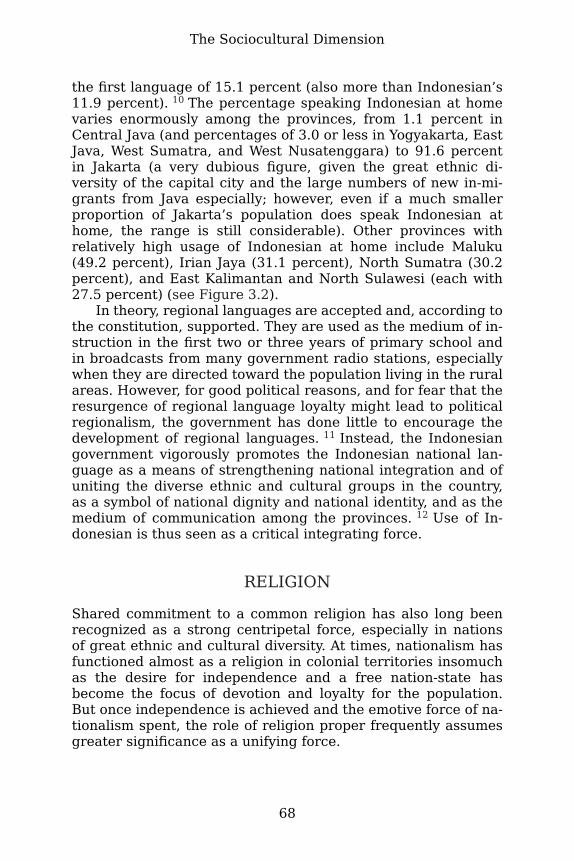
the first language of 15.1 percent (also more than Indonesian’s11.9 percent). 10 The percentage speaking Indonesian at homevaries enormously among the provinces, from 1.1 percent inCentral Java (and percentages of 3.0 or less in Yogyakarta, EastJava, West Sumatra, and West Nusatenggara) to 91.6 percentin Jakarta (a very dubious figure, given the great ethnic di-versity of the capital city and the large numbers of new in-mi-grants from Java especially; however, even if a much smallerproportion of Jakarta’s population does speak Indonesian athome, the range is still considerable). Other provinces withrelatively high usage of Indonesian at home include Maluku(49.2 percent), Irian Jaya (31.1 percent), North Sumatra (30.2percent), and East Kalimantan and North Sulawesi (each with27.5 percent) (see Figure 3.2).
In theory, regional languages are accepted and, according tothe constitution, supported. They are used as the medium of in-struction in the first two or three years of primary school andin broadcasts from many government radio stations, especiallywhen they are directed toward the population living in the ruralareas. However, for good political reasons, and for fear that theresurgence of regional language loyalty might lead to politicalregionalism, the government has done little to encourage thedevelopment of regional languages. 11 Instead, the Indonesiangovernment vigorously promotes the Indonesian national lan-guage as a means of strengthening national integration and ofuniting the diverse ethnic and cultural groups in the country,as a symbol of national dignity and national identity, and as themedium of communication among the provinces. 12 Use of In-donesian is thus seen as a critical integrating force.
RELIGIONShared commitment to a common religion has also long beenrecognized as a strong centripetal force, especially in nationsof great ethnic and cultural diversity. At times, nationalism hasfunctioned almost as a religion in colonial territories insomuchas the desire for independence and a free nation-state hasbecome the focus of devotion and loyalty for the population.But once independence is achieved and the emotive force of na-tionalism spent, the role of religion proper frequently assumesgreater significance as a unifying force.
The Sociocultural Dimension
68

Figure 3.2. Percentage of the population speaking Indonesian athome, 1980. Calculated from data in Table 14.3 in Biro Pusat Statistik,Sensus Penduduk 1980, Series S, no. 2.
The strength of religion as an integrative bond has beendemonstrated in many countries, including Thailand, Ireland,and such countries in the Middle East and North Africa asOman, the United Arab Emirates, Algeria, and Tunisia. Butwithin Indonesia its role is more ambiguous. As to be expectedin a nation as large and diverse as Indonesia, no single religionclaims the loyalties of the entire population; indeed nearly allthe world’s major religions are represented here. And evenwithin the religion acknowledged by the great majority (88.2percent were classified as Muslim in 1980) there are deep dif-ferences in belief and practice.
Islam had already reached Indonesia before any Europeansarrived, but it spread more rapidly after the arrival of the Por-tuguese. Their capture of Malacca in 1511 caused the diffusionof Muslim traders from that major trading center, and tradingrivalries further stimulated Islam’s expansion. For as the Por-tuguese sought to concentrate all trade on Malacca, Muslimtraders set up rival trading areas, first in Aceh (1515–1641),then in Banten (1526–1687) and Makassar in southern Celebes(1540–1667), and later in Banjarmasin in Kalimantan (from1667 onwards). 13 As the Portuguese, and later the Dutch,moved further east, attempting to consolidate their strongholdsalong the trade routes and to monopolize the spice trade, so didIslam, which became a rallying point for those who opposed theintruders. As local Indonesian kingdoms confronted competitionfrom European traders, their rulers called on Indian and Arab
National Integration in Indonesia
69

help with their trading; in exchange, they opened their princi-palities to Islam. By the end of the fifteenth century more thantwenty Muslim kingdoms existed, scattered over Java, Sumatra,Madura, Kalimantan, Celebes, the Moluccas, the Philippines,and the Malay Peninsula. 14
The Dutch were well aware of the potentially unifying threatof Islam. In every regional dispute they allied themselves withthe adat leaders or traditional chiefs of a kingdom against thereligious leaders of Islam (who used religion as a symbol of op-position to the Dutch, as, for example, in the Paderi War of WestSumatra, 1821–1837, the Java War of 1825–1830, and the AcehWar of 1873–1903).
Islam was important in the development of the nationalistmovement. The first organization to extend its appeal outsideJava was based on adherence to Islam: the Sarekat Islam (theIslamic Union), founded in 1911. This Union had considerablesuccess in binding together the disparate population of theIndies through the solidarity feelings of those who identifiedthemselves as Muslims. Indeed, Islam was an integrative,emotive force among many of the economic and politicalprotagonists of nationalism. It is still a powerful integratingforce, at least at the macro level and particularly in provinceshaving an overwhelming Muslim majority (see Figure 3.3).
However, at the micro level there are wide divergenceswithin Islam. The major difference is between the coastalMuslims with their characteristically purer, simpler faith andthe interior Muslims, particularly in Java, who practice a tra-ditionalist syncretic faith, an Islam mixed with beliefs carriedover from a past of animism and ancestor worship or Hindu be-liefs, an Islam suffused with magico-religious elements. In Javathis dichotomy is expressed in the contrast between the santri,those who hold the purer, more orthodox beliefs and adhere tothe strict Muslim laws, and the abangan, who are more affectedby their strong pre-Islamic heritage and their ancestral tradi-tions. 15
Yet this syncretism forms a bond among peoples with dif-ferent religions in the country, for the superstitions and beliefscarried over from an animistic or Hinduistic past, includingbelief in the spirits of the ancestors, the efficacy of cursing,and the power of the dukun (traditional shaman), have pen-etrated Christianity, Buddhism, and Confucianism, as well asIslam. Indeed, it can be argued that it is these cultural featuresof religious practice that are far more important as integratingelements than religious dogma, which is frequently divisive.
The Sociocultural Dimension
70

Figure 3.3. Percentage of the population classified as Muslim, 1980.Calculated from data in Table IV.4.1 in Biro Pusat Statistik, Statis tikIndonesia 1982.
More than 17 million non-Muslims live in Indonesia: Christians,Hindus, Buddhists, and Confucianists. Confucianists and Bud-dhists in the past have been scattered throughout the archi-pelago primarily among the Chinese, but adherents of the otherreligions tend to be concentrated in particular areas: Hindus inBali, Catholics in East Timor and East Nusatenggara (especiallyFlores) and to some extent in West Kalimantan, and Protestantsin parts of North Sulawesi, North Sumatra, and Maluku (seeFigure 3.4).
Relationships among the adherents of the different religionsvary greatly. In certain areas there is genuine tolerance; inothers, especially where the Muslim community feels itselfthreatened (for example, by the growing numbers of Christiansor by the economic power of Buddhists), tolerance is replacedby bitter hostility, which breaks out from time to time in theburning of churches and even occasional killings. Yet far moreblood has been spilt among the different strands of Islam: inthe aftermath of the abortive 1965 coup it was largely santriagainst abangan. It is also interesting to notice in recent yearsa growing official emphasis not just on a passive toleransi (tol-erance) toward adherents of the different religions, but uponthe more positive kerukunan (social harmony). 16
Lack of adherence to Islam, though a source of tension atone level, is not necessarily disintegrative at the national level.For Christians have shown a disproportionately large degree ofleadership in the nationalist movement as well as in the eco-
National Integration in Indonesia
71

Figure 3.4. Percentage of the population classified as Christian (bothProtestant and Catholic), 1980. Calculated from data in Table IV.4.1 inBiro Pusat Statistik, Statistik Indonesia 1982.
nomic development of the country, especially in the navy, inbusiness, and in interisland shipping. On the other hand, Bud-dhism and Confucianism among the Chinese in the past haveserved to reinforce their cultural isolation, although this is nowbreaking down as many Chinese have converted to Christianityand Islam. Nowhere is this more apparent than in West Kali-mantan, where the 1971 census recorded almost 40 percent ofits population as Buddhist, Confucianist, or other; in 1980 thesegroups made up less than 3 percent of the total (and the per-centage of Muslims rose from 43 to 62 percent, while the per-centage of Christians increased from 18 to 35 percent). 17
Despite its large majority of Muslims, Indonesia remains astate based on the Panca Sila, the first principle of which af-firms the belief in one Supreme Being. Indeed five religionsare officially recognized in the country: Islam, Protestantism,Catholicism, Hinduism, and Buddhism. Yet one of the major po-litical struggles is between those who want to make Indonesiainto an Islamic state and those who want to keep it tolerantof all belief in God. Obviously in a country with the religiousdiversity of Indonesia, a Panca Sila state would be, at leasttheoretically, far more integrative and inclusive than an Islamicstate, which would discriminate in a more divisive way againstall non-Muslims.
Notwithstanding the differences between the orthodox andthe traditionalists, between those in favor of an Islamic stateand those in favor of a Panca Sila state, Islam as the pre-
The Sociocultural Dimension
72

dominant religion still has a significant integrative role, partlythrough the hajj, which brings Muslims together from all overthe archipelago in an awareness of their common nationalityand religion, and partly through an increasing identificationwith and pride in being Muslim in the post-1973 OPEC era.This recent intensification of Islam has been characterized bya great increase in attendance at the rapidly growing numberof mosques, in the popularity of the morning lecture on Islamon the radio, in the number of readers of Islamic journals andbooks, in the widespread occurrence of religious instruction ac-tivities, and in the higher percentage of people who pay theirzakat (religious tax). 18
However, the integrative role of Islam is modified by im-portant spatial differences in the distribution of Muslimsthroughout the country. Adherence to Islam ranges from lessthan 1 percent in East Timor and 5.2 percent in Bali to 98.5percent in Jambi and Bengkulu. In twelve of Indonesia’s twenty-seven provinces Muslims make up over 96 percent of the pop-ulation. Only in five is the proportion under 50 percent: Bali,where 93 percent of the population is Hindu; and East Timor,East Nusatenggara, Irian Jaya, and North Sulawesi, where 99,91, 88, and 54 percent, respectively, are Christian. Maluku,West Kalimantan, and North Sumatra also have sizableChristian populations. Overall, Christians (Protestants out-number Catholics approximately two to one) make up 8.8percent of the population, Hindus 2.1 percent, and Buddhistsjust under 1 percent.
Religion, therefore, is a complex sociocultural feature withboth integrative and disintegrative characteristics. But it is avery important issue because of the strong emotional responsesit evokes. It is probably one of the least predictable elementsof sociocultural integration because of the wide diversity of in-tensity and tolerance among its greatly varying adherents.
EDUCATION AND LITERACYParticipation in a national culture and the sharing of nationalcustoms and values are obviously important components of na-tional integration. One way of encouraging such participationis through education and literacy programs. In contrast to thecolonial days, when the Dutch educated very few Indonesians,the Indonesian government from the very beginning has placedmajor emphasis on education at all levels. A national educa-
National Integration in Indonesia
73

tional system was introduced in 1945 and has been used tostrengthen national integration and unity as well as to aid na-tional development. Common curricula and textbooks haveserved as vehicles for expanding national consciousness, pro-moting the Indonesian language, and encouraging nationalpride.
Education is therefore an important integrative force, par-ticularly at the elementary level, when children are at theirmost impressionable age. Children in grades one through sixnationwide learn national slogans and national history; sing na-tional songs; learn about national heroes, values, and principlesof state; and take part in national events and celebrations. Bylearning to read and write, they open themselves to nationalliterature, newspapers, and magazines, all of which are poten-tially integrative forces.
Yet the proportion of the population completing primaryschool remains small. In 1980 only 43.4 percent of the pop-ulation ten years of age and over had completed elementaryschool, although far more had at one time been enrolled andsubsequently dropped out; yet this represents a great im-provement over the 1971 figure of 26.3 percent. This 17-percentincrease reflects the government’s commitment to expandingand improving education.
In an effort to increase the educational opportunitiesavailable in the provinces, the government has invested majorresources in education, increasing the number of primaryschools by 65 percent between 1970 and 1980, junior highschools by 62 percent, and senior high schools by 53 percent.Indeed the percentage of seven to twelve year olds in schoolwas reported to have risen since the 1978–1979 school yearfrom 79.1 percent to 97.2 percent by 1983–1984 (involving ajump from 22.4 million to 28.9 million students). 19
Because of the clearly integrative role education plays inIndonesia, however, it is important to note the very unevenpattern revealed by the educational data. The proportion of thepopulation ten years of age and over who had completed the sixyears of primary education in 1980 ranged from 30.8 percentin West Kalimantan to 65.9 percent in Jakarta (see Figure 3.5).Outside Jakarta, Yogyakarta stands out as a cultural and educa-tional center (with its 57.4 percent primary school completionrate). The provinces that have had a high level of Christianmissionary activity over several generations (North and CentralSulawesi and Maluku) still reflect that heritage in the propor-tions of the population who have completed secondary school.
The Sociocultural Dimension
74

At the elementary educational level, however, other provinces,such as East Kalimantan, North Sumatra, Irian Jaya, Aceh, andBali have now joined the more Christian provinces in theireducational achievement levels. At the other extreme are theprovinces of West Kalimantan, Lampung, Bengkulu, Jambi,Central Java, and South Kalimantan.
Similarly, school participation rates of seven to twelve yearolds have risen dramatically between 1971 and 1980, partic-ularly in West and Central Java (by 26.8 and 27.2 percentagepoints), Riau (by 27.1 percentage points), Bali (by 27.8 per-centage points), and West Nusatenggara (by 30.2 percentagepoints). One result of this is that the provinces are indeed muchmore similar in their educational levels in 1980 than they werein 1971 (in 1980 the spread was 24.5 percentage points from66.9 percent in Irian Jaya and West Kalimantan to 91.6 and 91.4percent in Yogyakarta and Jakarta respectively, compared witha range in 1971 of 35.6 percentage points, from 42.3 percentin West Nusatenggara to 78.0 percent in North Sulawesi) (seeFigure 3.6). Impressive gains have also been made in the olderage groups, and the differences among the provinces have nar-rowed. It is interesting to note, too, the closing gap betweeneducation of males and females. Overall, 28.2 percent of maleswere attending school in 1980 compared with 23.8 percent offemales, but there are striking differences at the different agelevels. Among five to eight year olds a higher percentage of girlsthan boys attend school, but the reverse is true for nine yearolds upward, with the gap increasing (a 1.5-percent gap at ageten, a 10-percent gap at age fourteen, and a 14-percent gapat ages seventeen and eighteen). 20 Urban-rural differentials inprimary education participation are high.
Literacy rates are a further index of integration, becausethey measure the ability of the population of a province to par-ticipate in national events as these are expressed in writing. Aliterate population is exposed in a far fuller way than a nonlit-erate one to the potentially integrating forces of books, news-papers, magazines, and government communications. Indeed,in a country with strict censorship laws, literacy may be re-garded as particularly integrative, because only government-ap-proved materials reach the citizens. Any critical comments inthe world press relating to Indonesia (as well as unseemly mate-rials and anything written in Chinese characters) are regularlycensored from overseas-produced newspapers and magazines,and internally produced written materials are also subject tocensorship, especially newspaper articles regarded as inflam-
National Integration in Indonesia
75

Figure 3.5. Percentage of the population ten years of age and overwho have completed primary school, 1980. Calculated from data inTables 6.9 in the twenty-seven volumes of Biro Pusat Statistik, SensusPenduduk 1980, Series S.
Figure 3.6. Percentage of seven to twelve year olds in primary school,1980. Based on data in Biro Pusat Statistik, Sensus Penduduk 1980,Series S, no. 2.
matory or critical. On several occasions newspaper and mag-azine offices have been shut down and editors jailed for injudi-ciously publishing unacceptable materials.
Literacy rates have increased impressively since indepen-dence, from an estimated 10 percent literate in 1941 21 to 61percent in 1971 and 71 percent in 1980 (see Figure 3.7). 22
As expected, literacy rates vary considerably, from 21 percentin East Timor and 52 percent in Irian Jaya to 91 percent in
The Sociocultural Dimension
76

North Sulawesi. At the extremes, literacy rates reflect educa-tional achievement: two of the provinces with the lowest educa-tional standards also have among the lowest literacy rates, WestNusatenggara (55 percent) and West Kalimantan (58 percent),but the correlation is not always strong. Adult literacy programsmay help to explain this anomaly. The highest literacy ratesoccur in the urban metropolis of Jakarta (88 percent) and inother provinces historically favored in education, notably NorthSulawesi, North, West, and South Sumatra, Central Sulawesi,and Maluku, all of which have literacy rates of over 80 percent.
NATIONAL SYMBOLISMIndonesian culture is rich in symbolism, and national symbolismhas been used as a powerful tool to promote national unity.23 Symbols have an important integrative role, especially in anation as riven with internal contrasts as Indonesia, for theyserve as a focus and expression of national as opposed toparochial feelings. Symbolism played an especially importantrole in the early days of the nationalist movement and in theSukarno era. Sukarno, the great unifier and solidarity maker,took every conceivable opportunity to instill national pridethrough the intensive use of symbols. His government engagedin a tremendous amount of symbolic activity—gestures, cere-monies, rituals, propaganda, monuments, prestigious projects,slogans, movements, and demonstrations. Yet the integrativeeffect of all this activity has been disputed. Certainly it en-couraged national pride, provided a sort of national anchorduring times of disruptive social change, and helped to legit-imize Sukarno’s government. But the frenetic crescendo of sym-bolic activity that reached a pitch of almost hysterical intensityin the early 1960s corresponds closely to the growing eco-nomic decline and disintegration of that period. Excessive useof symbols lowered administrative and economic efficiency, notonly in the amount of time and money spent on ceremonies andsymbolism, but also in creating an atmosphere unfavorable tothe solving of practical problems by rational means. 24
Although used in excess by Sukarno, symbolism still has animportant role in binding the disparate parts of the countrytogether. Particularly meaningful symbols now in the post-Sukarno era, as before, are the Panca Sila, the national emblemand motto, the use of acronyms and names of Indonesian heroesnationwide, and the emphasis on common Indonesian values.
National Integration in Indonesia
77

Figure 3.7. Percentage of the population ten years of age and overwho are classified as literate, 1980. Based on data in Table 18.3 inBiro Pusat Statistik, Sensus Penduluk 1980, Series S, no. 2.
The Panca Sila (Five Principles) remains the basic phi-losophy of state. It was designed to appeal to Indonesians ofall persuasions and ideologies. The very number five is of sym-bolic importance (because of the five senses, the five obligationsof Islam, the five heroes in the Hindu epic Mahabharata, andso on). The symbols representing the five principles are em-bodied in the coat of arms on the garuda (a mythical birdrelated to the eagle and the phoenix), which is the nationalemblem of Indonesia. The five principles are as follows: beliefin one Supreme Being, symbolized by the star in the centerof the coat of arms; nationalism, symbolized by the reveredbanyan tree; internationalism or humanitarianism, emphasizingthe broad common basis of human values of all men and women,symbolized by a golden chain with alternate square and roundlinks; social justice, symbolized by a spray of cotton and astalk of rice, representing the basic necessities of life; andpopular sovereignty or democracy, symbolized by the head ofthe banteng or wild buffalo, an animal patient and hard torouse, yet when roused, prepared to fight to the death to protecthis herd. 25 As a national symbol, the garuda is portrayed ashaving seventeen wing feathers, eight tail feathers, and forty-five neck feathers, symbolizing the date of the proclamation ofindependence, August 17, 1945 (see Figure 3.8). In the claws ofthe golden garuda is a scroll inscribed with Indonesia’s motto,Bhinneka Tunggal Ika, a Sanskrit phrase meaning “Unity in Di-versity” or “they are many; they are one.”
The Sociocultural Dimension
78
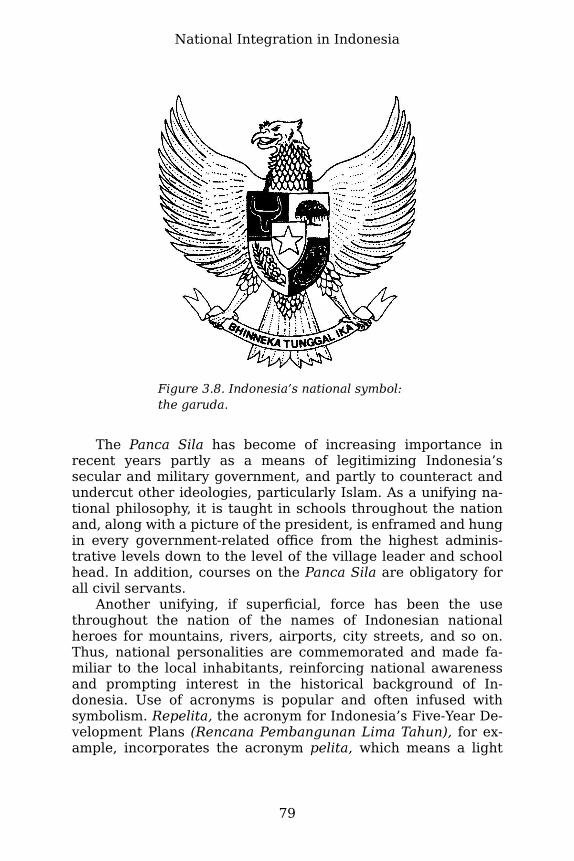
Figure 3.8. Indonesia’s national symbol:the garuda.
The Panca Sila has become of increasing importance inrecent years partly as a means of legitimizing Indonesia’ssecular and military government, and partly to counteract andundercut other ideologies, particularly Islam. As a unifying na-tional philosophy, it is taught in schools throughout the nationand, along with a picture of the president, is enframed and hungin every government-related office from the highest adminis-trative levels down to the level of the village leader and schoolhead. In addition, courses on the Panca Sila are obligatory forall civil servants.
Another unifying, if superficial, force has been the usethroughout the nation of the names of Indonesian nationalheroes for mountains, rivers, airports, city streets, and so on.Thus, national personalities are commemorated and made fa-miliar to the local inhabitants, reinforcing national awarenessand prompting interest in the historical background of In-donesia. Use of acronyms is popular and often infused withsymbolism. Repelita, the acronym for Indonesia’s Five-Year De-velopment Plans (Rencana Pembangunan Lima Tahun), for ex-ample, incorporates the acronym pelita, which means a light
National Integration in Indonesia
79

or lamp, itself of significance in the process of development.Indeed, Indonesians have created enough acronyms to fill a two-volume dictionary.
Finally, certain cultural norms characteristic of most In-donesians have been glorified and appealed to in the nameof national unity. Some of these common values include theidea of community interdependence and reciprocal obligation(gotong royong); the “Indonesian way” of reaching decisionsthrough musyawarah (consultation) and mufakat (consensus);and the emphasis placed upon harmony and unity, control ofthe emotions, status, order, conformity to group norms andexpectations, and the importance of face-saving devices. 26 Un-fortunately, no data exist on the spatial distribution and varyingintensity of the use of symbols throughout the archipelago.
THE LEGAL SYSTEMSince Dutch colonial days Indonesia has been linked in onenational legal system, although the influence of that systemdid not penetrate deeply into local Indonesian society. Beforethe Dutch, many different legal orders existed independentlywithin a wide variety of social and political systems. Socialcohesion depended not on written law but upon kinship oraristocratic status concepts in which authority was ascriptive,suffused with family and religious significance, and highly lo-calized. 27 Yet adat, though varying from society to society, hadcertain common elements: the preponderance of communalover individual interests, the close relationship between peopleand the soil, a pervasive magical and religious pattern ofthought, and a strongly family-oriented atmosphere in whichevery effort was made to resolve disputes through reconcilia-tion and mutual consideration. 28 In addition to customary law,orthodox Muslims followed Islamic law, especially in Java andSumatra, where religious courts functioned.
The Dutch established nationwide patterns of social andlegal transactions, but created a plural legal system in whicheach major social group had its own law, which was applied dif-ferentially by three distinct judicial hierarchies: the European,the Islamic (family courts), and the Indonesian (based on adat,which varied from area to area).
Since independence the legal system has been unified, mod-ified, and centralized. A hukum nasional (national law) and a na-tional judicial system have been established, where local institu-
The Sociocultural Dimension
80

tions and traditional courts have been replaced with pengadilannegeri (district courts). Religious courts, based on Islamic law(syariat) work side by side with the district courts; they dealprimarily with marital and inheritance cases, but their deci-sions must be approved by the corresponding district courts. 29
However, controversial efforts have been made to unify matri-monial law and to subordinate adat to nationally oriented legalconcepts and policy directives. But the traditional practice ofvillage-level arbitration, mediated by the village headman, stillprevails in most cases. Thus, adat, sometimes modified by Is-lamic influences, continues to govern the everyday life of vil-lagers and remains to a large extent the basis for maintainingharmony and stability at the village level. 30
Almost inevitably these efforts to unify Indonesian law havehad somewhat contradictory effects, with tension arising be-tween the momentum of local participation in national inte-gration on the one hand and claims that the imposition of anational legal system is nothing more than a cloak for the ex-pansion of the Javanese system on the other. At one level, thenational organization of the judiciary, public prosecution, thepolice, and the administrative civil service (pamong praja) pro-vides a force for integration and national unity; but at anotherthe local lower courts are more oriented toward the needs oftheir local clienteles than to the national perspective of theSupreme Court judges in Jakarta.
The law is still a weak institution and thus its integrativerole remains muted; other ways and values are available forsettling disputes and ordering society besides the formal legalchannels. However, the growth and increasing influence of na-tional law is strongly linked both to the growth of modern-ization, with its need for greater legal uniformity in suchmatters as property rights and inheritance, and to the growth ofa national orientation in the country’s social structure and eco-nomic behavior.
THE SPREAD OF NATIONAL ORGANIZATIONSOne measure of sociocultural integration is the degree to whichpeople in the various provinces participate in common, na-tionwide activities and organizations. National (as opposed toregional) organizations usually provide means of contact forleaders from different areas through national meetings, trainingsessions, and so on. They also provide for their members an
National Integration in Indonesia
81

Figure 3.9. Number of members of agricultural cooperatives per 100population (average of 1979 and 1980 figures). Calculated from datain Table VIII.3.2 in Biro Pusat Statistik, Statistik Indonesia 1983, BukuSaku.
integrative sense of belonging to a group that shares certaingoals or values with a nationwide community. Two organiza-tions that have more than a local or specialized appeal, andextend nationwide, are cooperatives and scouting (see Figures3.9 and 3.10). However, there seems to be no easy explanationfor the very different patterns of participation in these activitiesin 1980 compared with the patterns in 1971, when these na-tionwide organizations tended to have greater participationfrom people in the provinces in and near Java than in the remoteor less-developed provinces. In 1971, for example, 80 percentof all cooperative members were found in Java, whereas in1980 the figure was 68 percent, far closer to Java’s 62 percentshare of Indonesia’s population. Membership in a social orga-nization, as measured by a survey in 1981, likewise shows noclear pattern (see Figure 3.11). Not only are there no clearspatial patterns of participation, but also neither membershipin scouting nor membership in any social organization has asignificant correlation with any other variable, sociocultural,interaction, or economic (of the more than eighty examined).The only significant correlation between membership in any na-tional organization and any other sociocultural feature is thenegative relationship between membership in a cooperative andthe percentage of Asians in the population.
The Sociocultural Dimension
82

Figure 3.10. Number of Scouts per 100 population, 1981. Calculatedfrom data in Table IV.1.14 in Biro Pusat Statistik, Statistik Indo nesia1983.
THE CHINESEThe presence of any culturally distinct and economically pow-erful ethnic group needs to be considered in a study of nationalintegration: in Indonesia the Chinese form that minority. Incertain respects they constitute an integrative force becausethey provide a common target for the hostility and frustration ofIndonesians from all over the archipelago and at times serve ascapegoat function. In addition, their ethnic solidarity and com-mercial ties throughout the country have created a nationwidenetwork of business and trade connections. 31 But their interre-gional links are not restricted to Indonesia’s boundaries; theyextend also to Singapore, Malaysia, Hong Kong, the Philippines,Taiwan, and the People’s Republic of China. They have thusbeen seen to pose a threat to the national security as well as tothe integration of the nation.
Yet the Chinese community itself is by no means homoge-neous. It is composed of many diverse subgroups that differfrom one another by reason of the length of time they haveresided in Indonesia; the different ethnic groups in China fromwhich they have come; and the differences in their occupations,political outlook, and degree of loyalty to mainland China. 32
Chinese have immigrated to Indonesia from the seventhcentury onward. The vast majority of early arrivals were singlemen who usually married local Indonesian women and were as-similated into the local culture. It was only in the late nine-
National Integration in Indonesia
83

Figure 3.11 Percentage belonging to a social organization in the threemonths preceding a survey, 1981. Based on data in Table III.1.9 inBiro Pusat Statistik, Statistik Indonesia 1983, Buku Saku.
teenth and early twentieth centuries that substantial immi-gration of both Chinese men and women took place in responseto the demand for manpower in the sugarcane industry of Javaand the gold mines of West Kalimantan. 33 Assimilation intothe local community slowed down, and separate communitiesdeveloped. The Chinese gradually took over the tax-collectingfunction of the colonial government and increasingly monop-olized trade. Dutch colonial policies deliberately kept theChinese separate, especially in Java, by creating a plural societywith themselves at the top, the Chinese in the middle, andthe indigenous inhabitants on the bottom. 34 Upward mobilityfor the Chinese, therefore, meant movement away from theindigenous Javanese society toward the European elite. TheChinese thus formed a middle class predominantly of businessentrepreneurs. The Dutch, seeking partly to protect the in-digenous population, but also for administrative, economic, andpolitical reasons, restricted the Chinese both in their movement(limiting their contact with interior communities) and in theirplace of residence (to urban centers), prohibited the alienationof land by all non-Indonesians, and legally reinforced a plural-istic society.
Since independence the Chinese have been subjected toconsiderable harassment both in their economic activities andin their personal lives. For example, Chinese communal associ-ations have been severely curtailed, Chinese-language schoolsoutlawed, and import of Chinese-language video cassettes pro-
The Sociocultural Dimension
84

hibited. There is also continual criticism of the so-called AliBaba partnership of cukong (Chinese businessmen) in leaguewith politically powerful Indonesians, whereby Chinese busi-nessmen use indigenous Indonesian businesses as a front tocircumvent official government policy that gives preference toindigenous entrepreneurs. 35
A broad distinction can be made between those Chineseborn in Indonesia (the peranakan) and those who have migratedto Indonesia in this generation (the totok). Many of the per-anakan, who make up about 70 percent of the total Chinese pop-ulation of approximately three and a half million in Indonesia,are much more willing to assimilate than the Indonesian societyis ready to receive them. Many have adopted Indonesian namesand Indonesian cultural habits, although they are still discrim-inated against in a society that is very conscious of Chineseidentity, whether peranakan or totok. For example, in 1979 theState Prosecutor’s Office conducted a nationwide registration ofeveryone of Chinese descent, an action that was particularly of-fensive to the peranakan who hold Indonesian citizenship. 36
The totok, by contrast, form typically insular, culturally dis-tinct communities, held together by a powerfully integratedkinship system and separate cultural traditions. 37 However,since 1980 there has been pressure on these alien Chineseto become Indonesian citizens. In 1984 the commander of thearmed forces called on his fellow countrymen to stop using whathe called the divisive terms pribumi (indigenous Indonesians)and non-pribumi (referring primarily to the Chinese, naturalizedor otherwise). The government subsequently has resorted tothe more neutral expression orang Indonesia asli (native In-donesian), which purportedly includes Chinese who have al-ready assimilated. 38
The distinction between peranakan and totok in the pastprobably corresponded approximately to that between thoseChinese who adopted Indonesian citizenship and those whohave retained Chinese citizenship. It is interesting to noticethat in both the 1971 and 1980 censuses no questions wereasked about ethnic origin (a reflection of the sensitive and po-tentially inflammatory nature of such questions). Thus, in 1971the presence of approximately 2,500,000 (mainly peranakan)Chinese was not noted; data on language, literacy, and evenreligion similarly fail to reveal their existence. By contrast,the presence of the approximately one million Chinese citizenswas extremely accurately defined: even at the subdistrict (ke-camatan) level citizenship along with age and sex is known.
National Integration in Indonesia
85

This provides an indication of how sensitive an issue citizenshipis in a country concerned about national integration and secu-rity. Statistik Indonesia 1982 gives data about the number offoreigners by province and continent of origin without specifi-cally mentioning the Chinese population, but it is known that 95percent of all foreigners in Indonesia are Asians and the vastmajority of these are in fact Chinese. 39
Although not revealed by the census, the spatial distributionof peranakan and totok has been quite different. 40 In Java,Madura, and Kalimantan most adult Chinese were born in In-donesia, with only about 30 percent born elsewhere. In Sumatraand other areas the totok are in the majority (80 percent ofChinese over thirty years of age in Sumatra were born outsidethe country).
In terms of citizenship, by 1981 no province had less than97 percent of its population Indonesian citizens, and in eighteenof the twenty-five provinces for which data are available (ex-cluding Bengkulu and Southeast Sulawesi), the figure is over99 percent. On a per-capita basis, Chinese citizens are concen-trated in West Kalimantan, Jakarta, South Sumatra, East Kali-mantan, and Riau (see Figure 3.12).
In the past, the Chinese, therefore, have formed a generallynonassimilated and thus disintegrative force in Indonesian so-ciety, with their cultural differences, their connections tomainland China, their economic power, and their network ofbusiness contacts that extends beyond the boundaries of In-donesia; but serious attempts are being made to assimilate thisethnically and culturally distinct minority.
ACCESS TO AMENITIESAccess to amenities provides another measure of socioculturalintegration, since many of these are organized on a nationalbasis in Indonesia and extend nationwide. In the entertainmentindustry there is a national film distribution network, and al-though the provision of cinemas also reflects comparative eco-nomic affluence and the existence of adequate electricity, thenumber of viewers of Indonesian-made movies (which make upapproximately one-third of all movies viewed in the country)41 is an index at least to some extent of general exposure toa “national culture.” The number of people who attended atleast one Indonesian-made movie in 1981 ranged from 10.0 per100 population in East Nusatenggara to 157.1 in East Kali-
The Sociocultural Dimension
86

Figure 3.12. Number of foreigners claiming Asian citizenship per1,000 population, 1981. Calculated from data in Table III.1.11 in BiroPusat Statistik, Statistik Indonesia 1982.
mantan. 42 The viewing of Indonesian-made movies is dispropor-tionately high in Jakarta, but the rest of Java ranks surprisinglylow in light of the fact that most Indonesian movies are filmedthere. However, this may be a reflection of Java’s own richculture, where the wayang kulit (shadow puppet play) is a morepopular, traditional, and less expensive form of entertainment.In addition to Java and East Nusatenggara, low attendance atIndonesian-made movies is recorded for West Nusatenggara,Lampung, Bali, and Southeast Sulawesi. Riau in Sumatra andall the provinces of Kalimantan stand out for their consistentlyabove-average rate of viewing Indonesian-made movies (seeFigure 3.13).
Exposure to nationally controlled radio programs is anotherindex of national integration. All radio transmitters, nongov-ernment as well as government-owned, are required by lawto broadcast certain Radio Republik Indonesia programs andthus, at least theoretically, have an integrating role. In devel-oping countries broadcast media are widely expected to makea positive contribution to national integration, as well as to so-cioeconomic modernization and cultural creativity. 43 Radios arerelatively inexpensive and require no skills (such as educationor literacy) of their audience.
The percentage of households owning a radio in 1980ranged from 13.9 percent in East Nusatenggara to 66.0 percentin Jakarta, with an average of 40.7 percent (see Figure 3.14).As might be expected, in general the pattern reflects relative
National Integration in Indonesia
87

wealth and urbanization. However, perhaps more indicative ofexposure to radio programming are the results of a survey un-dertaken in 1981 to ascertain the percentage of the populationten years of age and over engaging in various social and cul-tural activities. This shows that 75.2 percent of Indonesianshad listened to the radio at least once during the precedingweek. By province, the figures ranged from 37.5 percent in EastNusatenggara and 46.1 percent in Maluku to 87.4 percent in Yo-gyakarta and 86.3 percent in West Java (see Figure 3.15). Butone has to question the validity of the results of this survey,partly because there is a fairly low correlation between radioownership and those listening to the radio, and partly becausesome of the figures seem unrealistic. For example, in IrianJaya only 17.7 percent of households owned a radio, but anamazing (and unlikely) 70.8 percent of the population ten yearsof age and older said they had listened to the radio in the pre-ceding week (a difference of 53.1 percentage points). Othercomparatively high contrasts occurred in West Nusatenggara (a45.6 percentage point difference), West Java (44.4 percentagepoints), Central Sulawesi (44.3), Central Java (41.3), and SouthSulawesi (40.7). At the other extreme are East Kalimantan,where although 54.3 percent of households owned radios, only60 percent tuned in the previous week, Maluku (with 38.1 and46.1 percent, respectively), and Jakarta (with 66.0 and 76.3percent, respectively). The data on radio ownership are thusconsidered to be a more accurate indicator overall of exposureto radio programs.
In contrast to radio listenership, a far smaller proportion ofthe population both owns and watches television. For Indonesiaas a whole only 9.8 percent of households own a televisionset, although television service is now available throughoutthe archipelago. Ownership of a television set again reflectswealth and urbanization, and accounts for the range of tele-vision ownership from lows of 1.7 percent of households inEast Nusatenggara and 2.7 percent in West Nusatenggara tohighs of 45.5 percent in Jakarta (a dubiously high figure) and23.0 percent in East Kalimantan (see Figure 3.16). Approxi-mately 50.3 percent of the population sample surveyed in 1981claimed to have watched television during the preceding week,a figure that incorporated a range from 14.3 percent in EastNusatenggara and 21.0 percent in Maluku to 87.5 percent inJakarta and 66.1 percent in South Kalimantan. Again the corre-lation is not very close, as illustrated by the situation in IrianJaya where only 3.2 percent of households owned a television
The Sociocultural Dimension
88

Figure 3.13. Number of people watching an Indonesian-made movieper 100 population, 1981. Calculated from data in Table 4 in BiroPusat Statistik, Statistik Bioskop Indonesia 1981 dan 1982.
Figure 3.14. Percentage of households owning a radio, 1980. Based ondata in Table 66.3 in Biro Pusat Statistik, Sensus Penduduk 1980,Series S, no. 2.
set but where 63.8 percent of the population ten years oldand over claimed that they had watched television sometimeduring the previous week (a very unlikely figure, and the samepercentage as Riau with its comparatively high 17.2 percentrate of television ownership). By contrast, two provinces withapproximately the same percentage of television ownership,7.5 percent in Central Kalimantan and 7.7 percent in Maluku,had very different proportions of their provincial populations
National Integration in Indonesia
89

Figure 3.15. Percentage of the population ten years of age and overwho listened to the radio in the week preceding a survey, 1981. Basedon data in Table III.1.9 in Biro Pusat Statistik, Statistik Indonesia1983, Buku Saku.
watching television: 51 percent in the case of Central Kali-mantan but only 21 percent in the case of Maluku (see Figure3.17). 44
Newspapers and magazines play a far less important rolein national integration. Only 4.6 percent of Indonesia’s popu-lation regularly takes a newspaper, and only 18 percent on av-erage had read a newspaper or magazine in the previous week,according to the 1981 survey, a figure that ranged from 8.6percent in West Nusatenggara to 48.9 percent in Jakarta. 45
Access to health care is another reflection of nationwideorganization, for medical personnel are civil servants and arethereby integrated into a national network. Indeed, doctors anddentists are assigned by the government to their initial job fortwo years (in rural and more needy areas). On a per-capitabasis, however, most doctors and dentists are found in the ur-banized provinces of Jakarta, East Kalimantan, and Yogyakarta,and in the Protestant provinces of North Sulawesi and NorthSumatra. Similarly, the provinces with the best provision ofhospital beds are those with either large Christian populations(with the exceptions of East Nusatenggara and East Timor) orrelatively high urbanization (see Figure 3.18). The least-servedprovinces are West Nusatenggara, Bengkulu, Lampung, andJambi. Although Java’s population in general is no better sup-plied with health facilities than that of many other provinces ona per-capita basis, from a spatial perspective a far larger pro-
The Sociocultural Dimension
90

Figure 3.16. Percentage of households owning a television set, 1980.Based on data in Table 66.3 in Biro Pusat Statistik, Sensus Penduduk1980, Series S, no. 2.
Figure 3.17. Percentage of the population ten years of age and overwho watched television in the week preceding a survey, 1981. Basedon data in Table III.1.9 in Biro Pusat Statistik, Statistik Indonesia1983, Buku Saku.
portion of Java’s inhabitants is within a reasonable distance ofhealth facilities than is the case in the Outer Islands because ofJava’s much higher population density. This difference is accen-tuated by the superior transportation system in Java, which alsoprovides greater physical access to health care.
As with education, the government has invested major re-sources in improving health care throughout the country. Evi-dence for this can be seen in the great increase in the number
National Integration in Indonesia
91

of public health-care centers and mother and baby clinics, inthe emphasis on family planning, and in the increasing access topiped drinking water and proper sanitation. The results can beseen in the 25 percent decline in the infant mortality rate duringthe 1970s and the increase in life expectancy. However, health-care facilities remain very inadequate, as the 1980 figures ofseven hospital beds per 10,000 population and 31,000 personsper health center indicate. 46
URBANIZATIONThe level of urbanization existing in each province is relevantto the theme of sociocultural integration because urban popula-tions participate in an urban culture that transcends provincial(and even national) boundaries. Opportunities for cross-culturaland cross-ethnic contacts exist in an urban environment in away not found in more rural surroundings. There is also greaterexposure to national symbols, values, and mores in an urbanmilieu than in more isolated rural environments. The correlationwith knowledge of the Indonesian language has already beennoted.
However, growth in the rate of urbanization does not neces-sarily mean increased integration. First, urbanization is knownto correlate with economic development, which may or may notbe integrative. 47 In other words, increasing urbanization mayreflect an increase in a dualistic economy rather than in an inte-grated one. Second, urbanization unaccompanied by other inte-grative forces may be separatist in character, because an urbanenvironment may provide an opportunity for greater contactamong people with similar needs and goals, which may be re-gionalist rather than nationalist in orientation. Third, urban-ization per se is an inaccurate index of integration, unless em-ployment opportunities are commensurate with urban growth.Unemployment, as well as an unbalanced employment structurewith an inflated tertiary sector, is unstable and thus potentiallydisintegrative in character.
Thus, the role of urbanization in national integration is notall positive: increased physical proximity may accentuate socialdistance and provoke hostility and resentment, especially wheneconomic or political differences coincide with ethnic or othercultural differences. Questions also arise as to the extent towhich each urban node is enclaval in nature and how much ofan integrative role each exerts upon its hinterland and in the
The Sociocultural Dimension
92

Figure 3.18. Number of hospital beds (government and private) per10,000 population, 1980. Calculated from Table IV.2.1 in Biro PusatStatistik, Statistik Indonesia 1982.
urban network. Only when balanced with positive, nationwideeconomic development and reinforced by other integrative fea-tures is increasing urbanization a positive force.
In 1980, 22.4 percent of Indonesia’s population was con-sidered to be urban. 48 The level of urbanization of eachprovince ranged from 93.7 percent for Jakarta and 39.9 percentin East Kalimantan to a low of 7.5 percent in East Nusatenggara(see Table 3.1 and Figure 3.19). Java, with 25.1 percent of itspopulation classified as urban, is the most urbanized islandin Indonesia, followed by Kalimantan and Sumatra. This rep-resents a dramatic change from the situation in 1971, whenKalimantan was comparatively more urbanized than Java, andreflects both the changes in the definition of urban in the1971–1980 intercensal period and the strong growth of Java’scities over the past decade. Only four of the Outer Islandprovinces were more urbanized than Java in 1980, comparedwith eight in 1971.
The proportion of the population living in urban areas hasbeen increasing steadily, from 14.8 percent in 1961 to 17.3percent in 1971 to 22.4 percent in 1980. 49 However, cities havebeen growing at very different rates. 50 In general, the citiesthat have experienced the greatest growth (Jakarta, Surabaya,Tanjung Karang, Jambi, Samarinda, and Balikpapan) have beenthe “metropoles,” 51 those cities that are more cosmopolitan andnation-oriented than the “provincial” cities, which are more ori-ented to serving the provinces in which they are located, such
National Integration in Indonesia
93

as Yogyakarta, Cirebon, Kediri, Pematang Siantar, and Sura-karta. Between 1971 and 1980, the fastest growing cities wereAmbon, Padang, Medan, Balikpapan, and Samarinda, all citiesin the Outer Islands (see Table 3.2 and Figure 3.20).
One integrative aspect of urbanization in Indonesia is itshierarchy of urban places. Unlike many developing countries,and especially those in Southeast Asia that have a primate citydominating the entire nation (such as Bangkok in Thailand,Rangoon in Burma, and Manila in the Philippines), Indonesiahas an extensive network of towns and cities of different sizesdistributed throughout the country, thanks partly to the Dutchadministrative system, partly to the growth of small transportnodes, and partly to the development of trade and small indus-trial centers. Such an urban network encourages integration bypermitting the filtering down of national values, ideas, and con-cepts, and can also be used to distribute the process and ef-fects of development and promote widespread integrated devel-opment. 52 However, Jakarta’s primacy ratio has been steadilyincreasing, from 1.20 in 1961 to 1.34 in 1971 to 1.44 in 1980.53 This reflects centralizing trends in government and in the di-rection of economic growth. The attraction of Jakarta is suchthat it is drawing many of the best-educated people of the otherprovinces in a classic “brain-drain” situation, depleting the out-lying areas of the ingenuity and creativity they need for devel-opment. In the decade of the 1970s over half a million OuterIslanders migrated to Jakarta. Although this may leave the out-lying regions more malleable and docile, it does not encouragestrong regional participation in development or a dynamic formof integration.
The government, through its various Five-Year DevelopmentPlans (beginning in the second), has aimed at rectifying theproblem of Jakarta’s increasing growth and overwhelming dom-inance (it grew from 2,907,000 in 1961 to 4,576,000 in 1971to 6,503,449 in 1980) by the assignment of major growth-polefunctions to three of the largest urban centers—Medan,Surabaya, and Ujung Pandang. Seven other cities in addition tothese three have been selected as centers for regional devel-opment, and seventeen others throughout the country havebeen designated as minor growth centers. Thus, there is a delib-erate realization of the integrative role of an urban network andan attempt to use urbanization to promote national integration.
The Sociocultural Dimension
94

Table 3.1. Percentage urban by province, 1961,1971, and 1980
Province 1961 1971 1980
1. Aceh 7.7 8.4 8.9
2. North Sumatra 16.9 17.1 25.5
3. West Sumatra 14.1 17.2 12.7
4. Riau 9.7 13.3 27.2
5. Jambi 21.6 29.1 12.7
6. South Sumatra 37.0 27.4
7. Bengkulu 18.6 11.7 9.4
8. Lampung 9.8 12.5
Sumatra 17.8 19.6
9. Jakarta 87.2 100.0 93.7
10. West Java 11.9 12.4 21.0
11. Central Java 10.2 10.7 18.8
12. Yogyakarta 16.4 16.3 22.1
13. East Java 12.8 14.5 19.6
Java 18.0 25.1
14. Bali 8.8 9.8 14.7
15. West Nusatenggara 5.6 8.1 14.1
16. East Nusatenggara 5.4 5.6 7.5
National Integration in Indonesia
95

17. East Timor n.a. n.a. n.a.
Nusatenggara 12.0
18. West Kalimantan 13.2 11.0 16.8
19. Central Kalimantan 14.1 12.4 10.3
20. South Kalimantan 22.7 26.7 21.4
21. East Kalimantan 32.8 39.2 40.0
Kalimantan 21.8 21.5
22. North Sulawesi 19.5 16.8
23. Central Sulawesi14.9
5.7 9.0
24. South Sulawesi 18.2 18.1
25. Southeast Sulawesi15.9
6.3 9.4
Sulawesi 16.4 15.9
26. Maluku 20.7 13.3 10.9
27. Irian Jaya n.a. 16.3 21.4
Maluku & Irian Jaya 9.4 15.5
Indonesia 14.8 22.4 22.4
n.a.: not available
Many important sociocultural features, therefore, havehelped to integrate the distinct and diverse peoples of In-donesia. Perhaps most important are the use of the commonnational language; participation in the national culture throughcommon educational experiences; exposure to common liter-ature and news magazines, radio and television programs, and
The Sociocultural Dimension
96

Figure 3.19. Percentage of the population classified as urban, 1980.Calculated from data in Tables 1 in the twenty-seven volumes of BiroPusat Statistik, Sensus Penduduk 1980, Series S.
Indonesian-made movies; the impact of powerful national sym-bolism; involvement in national sociocultural and economic or-ganizations; and increasing participation in a common urbanculture and environment.
National Integration in Indonesia
97

Figure 3.20. Location and population size of Indonesia’s thirty largestcities, 1980. Based on a map by Sukanto Reksohadiprodjo in Prisma 6(1981), p. 16 (used with permission); and data in Biro Pusat Statistik,Sensus Penduduk 1980, Series S.
The Sociocultural Dimension
98

Table 3.2. Size and growth rate of Indonesia’s thirty largestcities, 1971–1980
City Size(1980)
Rankin 1971
Size(1971)
Growth rate(1971–1980)
Jakarta 6,503,449 1 4,579,303 3.9
Surabaya 2,027,913 2 1,556,255 2.9
Bandung 1,462,637 3 1,200,380 2.2
Medan 1,378,955 5 635,562 8.5
Semarang 1,026,671 4 646,590 5.2
Palembang 787,187 6 582,961 3.4
Ujung Pandang 709,038 7 434,766 5.5
Malang 511,780 8 422,428 2.1
Padang 480,922 14 196,339 10.3
Surakarta 469,888 9 414,285 1.4
Yogyakarta 398,727 10 314,629 1.7
Banjarmasin 381,286 11 281,673 3.4
Pontianak 304,778 12 217,555 3.8
Tanjung Karang 284,275 13 198,986 4.0
Balikpapan 280,675 22 137,340 8.2
Samarinda 264,718 21 137,782 7.4
Bogor 247,409 15 195,873 2.6
Jambi 230,373 19 158,559 4.2
National Integration in Indonesia
99

Cirebon 223,776 17 178,529 2.5
Kediri 221,830 16 178,865 2.4
Manado 217,159 18 170,181 2.7
Ambon 208,893 31 79,636 11.6
Pakan Baru 186,262 20 145,030 2.8
Madiun 150,562 23 136,147 1.1
Pematang Siantar 150,376 24 129,232 1.7
Pekalongan 132,558 25 111,201 1.9
Tegal 131,728 27 105,752 2.4
Magelang 123,484 26 110,308 1.2
Sukabumi 109,994 28 96,242 1.5
Probolinggo 100,296 30 82,008 2.2
Source: Biro Pusat Statistik
The Sociocultural Dimension
100

4The Interaction Dimension
INTERACTION among the many diverse peoples within a nation-state is part of the very essence of national integration, for iso-lation and interaction are antithetical by definition. Interactionincludes all forms of transportation and communications thatbring peoples from different geographical areas of the countryinto contact with one another. The focus in this chapter is uponinterprovincial interaction, both structural linkages and func-tional flows (of peoples, goods, messages, and information). Be-cause interaction data on functional integration are limited,estimates of the degree of integration of the various provinceshave to be based largely upon structural information andreached from an analysis of the various transportation and com-munications networks within each province.
Inevitably, analysis of data at the provincial level concealshuge intraprovincial contrasts. In reality, the term transport ac-cessibility refers only to those areas within about nine milesof major transportation nodes (such as seaports and cities) orarteries (such as navigable rivers, railroads, and major pavedroads). 1 Wide contrasts therefore exist between the few areasof continuous accessibility (such as broad river valleys) and thecomparatively dense transportation networks around provincialcapitals on the one hand, and the vast areas of limited or ex-tremely difficult accessibility on the other. These contrasts areparticularly marked in the Outer Islands, whereas Java has amuch greater density of transportation and communicationsnetworks.
Present networks are the result of long historical devel-opment, whereby areas of greatest accessibility (broad rivervalleys and areas of protected, indented coastlines) became in-digenous core areas. The transportation accessibility of theseearly core areas was reinforced by the colonial establishmentfirst of trading posts and later of administrative networks.
101

Transportation infrastructure remains largely that inheritedfrom the colonial period, which was geared more to the ex-traction of estate agricultural products and mineral wealth forthe colonial homeland than to the needs of Indonesia as anation. Short road or rail links from the estates or mines tothe nearest port, together with some interisland shipping fordomestic trade and administrative purposes, sufficed. An esti-mated 90 percent of Indonesia’s land area was ignored by theDutch.
Thus, independent Indonesia inherited an inadequate anduneven infrastructure, one that served only about 10 percentof the national territory and concentrated overwhelmingly uponJava and a few other port hinterlands, mainly in Sumatra. Evenwhat infrastructure there was deteriorated badly during theSecond World War and the subsequent struggle for indepen-dence. In the 1950s and early 1960s, problems such as regionalrevolts, the lack of finance and skilled manpower, and the gov-ernment’s tendency to give priority to directly productiveinvestment projects as well as to noneconomic ventures con-tributed further to the neglect of basic infrastructure. Asidefrom a few limited projects, no major effort to rehabilitate andexpand the economic infrastructure was made until the be-ginning of the New Order under Suharto in 1967.
Several difficulties arise in trying to analyze the integrationof provinces into the nation-state on the basis of their structurallinkages. Structural networks do not distinguish between inter-and intraprovincial communications. In addition, the provincesvary considerably in their orientation to land and sea forms oftransport. Within Java most transportation takes place by land(by rail and road), whereas in Maluku the multi-island compo-sition of the province dictates sea transportation as the pre-dominant mode. In parts of Kalimantan river transportation isvital. Within and between many of the Outer Island provinces,sea and air links provide the only means of physical interaction,whereas in Sumatra all modes of transportation exist, althoughwith differing combinations of usage in each province.
TRANSPORTATIONLack of detailed data on passenger flows between provincesnecessitates the use of surrogates. An examination of the railnetwork and the numbers of passengers carried in eachprovince gives some indication of population mobility, itself a
The Interaction Dimension
102

prerequisite to population interaction. Similarly, analysis ofroad networks and numbers of vehicles in each province pro-vides a general picture of comparative mobility (as well as of thelevel of economic development). Examination of shipping andshipping routes gives some indication of the degree of inter-provincial movement, and consideration of airline traffic gives ameasure of the connections among major cities. Data given, aselsewhere in the book, should be handled cautiously. It is nec-essary to focus on the overall picture and trends rather thanassuming that the reported figures are precise. Data for thischapter are tabulated in Appendix 2.
The railroad system in Indonesia is limited to Java andMadura, and to three unconnected areas of Sumatra: Acehand North Sumatra, West Sumatra, and southern Sumatra (seeFigure 4.1). Thus, only in Java and to a limited extent innorthern and southern Sumatra do railroad connections playany part in interprovincial transportation. In Sumatra the rail-roads were built to connect agricultural estates or tin and coalmines with ports on the coast, with the exception of that inAceh, which was constructed originally to enable Dutch militaryoperations to put down the Acehnese revolt in the late nine-teenth century.
Most of the railroad track (71 percent) is in Java. The totallength of track has decreased from over 7,360 kilometers in1939 to about 6,700 kilometers in 1982 (4,700 kilometers onJava and Madura and 2,000 kilometers on Sumatra). 2 Passengertraffic declined during the 1961 to 1977 period, with thenumber of passengers falling from 144 million during 1961 toonly twenty-three million in 1977, despite an increase in pop-ulation of over thirty million during that time period. This waspartly a response to improved road conditions and an increasein bus and truck transportation, and partly a result of the in-adequate maintenance and renewal of railroad lines, bridges,and equipment. But since 1977 the number of passengers hasincreased consistently, to forty-four million by 1982. 3 The shortlength of the average journey in 1982 (139 kilometers for pas-sengers in Java, 141 kilometers in North Sumatra, 260 kilo-meters in South Sumatra, and thirty-four kilometers in WestSumatra) suggests that most travel is intraprovincial ratherthan interprovincial. This factor, together with the limited areasserved by the railroads, indicates that railroads have a compar-atively small integrative role on a nationwide scale in Indonesia,
National Integration in Indonesia
103

Figure 4.1. Location of railroads in Indonesia, 1980.
with the limited exception of Java. However, much interactiontakes place on the trains, because people tend to conversefreely with strangers and share ideas, perceptions, and news.
In an analysis of road transportation as a measure of in-tegration, two factors need to be considered. First, the arch-ipelagic character of Indonesia dictates that sea (and, to alesser extent, air) and not road links will be more crucial amongthe hundreds of small islands and in the provinces consistingmostly of smaller islands. Second, the difficult terrain, densevegetation, and low level of development of much of the largerislands of Kalimantan, Sulawesi, and Irian Jaya necessitate con-siderable use of small sailing craft along the coast or riversystems for interprovincial passenger and freight movement.
However, between provinces in Java, increasingly inSumatra, and in limited areas of other provinces in the OuterIslands, road transportation is predominant. The road networkis much denser in Java, and the quality of the paved roads thereis much superior to that found in most of the Outer Islands.Indeed, Java, with only 6.9 percent of the total land area of In-donesia, has 27 percent of all the roads in the country and 48percent of its paved highways. 4 In terms of total road density(in kilometers of all types of roads per 1,000 square kilometers)Java has an average of 347 compared to an average in the OuterIslands of sixty-eight (and a range from eight in Irian Jaya to266 in North Sulawesi). Sulawesi and Sumatra have higher roaddensities than Kalimantan, Maluku, and Irian Jaya (see Figure4.2).
The Interaction Dimension
104

The contrast between Java and the Outer Islands in roaddensity is far greater when only paved roads are considered.Java has a far denser network of paved roads (249 kilometersper 1,000 square kilometers compared to thirty-six in Sulawesi,forty-one in Sumatra, and six in Kalimantan) and has a farhigher percentage of its roads paved (72 percent comparedto 37 percent in Sumatra, 24 percent in Kalimantan, and 23percent in Sulawesi). There is a distinct decrease in the densityof paved roads with increasing distance eastward from Java(with East Nusatenggara having 23.8 kilometers of paved roadsper 1,000 square kilometers, Maluku 9.1, and Irian Jaya 1.5),although Central and East Kalimantan also rank among thelowest, with 2.0 and 3.4, respectively. Contrasts betweenprovinces within the major islands are also enormous (seeFigure 4.3).
Within the past ten years a comprehensive program of roadimprovement has been undertaken: a network of 18,000 kilo-meters of high-priority road links throughout the archipelago. 5
Indeed, some of the results can already be seen in the signif-icant increase in total road length, from 95,463 kilometers in1972 to 168,028 kilometers in 1982, and in the more than dou-bling of paved roads from 25,068 kilometers in 1972 to 69,209kilometers in 1982 (a change from 26 percent paved in 1972 to41 percent paved in 1982). 6
Vehicle density has likewise increased enormously over thepast decade and, as expected, ranges widely among theprovinces, in relation both to the length of roads and to the sizeof provincial populations. In terms of the number of vehicles perkilometer of road, the Javanese provinces stand out as by farthe best served (see Figure 4.4), with an average of more thanthree times as many as any other island group and more thanseven times as many as Nusatenggara, Maluku, and Irian Jaya.Apart from all the Javanese provinces, only North Sumatra ex-ceeds the national average of 32 vehicles per kilometer of road.
Perhaps a more meaningful measure of vehicle density is thenumber of registered vehicles per 1,000 population (see Figure4.5). As might be expected, some of the more highly urbanizedand developed provinces, Jakarta, East Kalimantan, Bali, andNorth Sumatra, have a disproportionate share of vehicles (155,sixty-eight, fifty-three, and fifty-three vehicles per 1,000 pop-ulation, respectively), and East and West Nusatenggara andMaluku have the fewest (eight, thirteen, and thirteen, respec-tively, compared with a national average of thirty-six). Java had65 percent of the total 5,347,716 registered vehicles in the
National Integration in Indonesia
105

Figure 4.2. Length of roads of all types and conditions in kilometersper 1,000 square kilometers, 1982. Calculated from data in TableVII.1.3 in Biro Pusat Statistik, Statistik Indonesia 1983, Buku Saku.
Figure 4.3. Length of paved roads in kilometers per 1,000 square kilo-meters, 1982. Calculated from data in Table VII.1.3 in Biro Pusat Sta-tistik , Statistik Indonesia 1983, Buku Saku.
country in 1982, a proportion fairly consistent with Java’s shareof the overall population (62 percent), but highly out of balancewhen land area is considered and when Java’s rail network istaken into account. East Nusatenggara ranks lowest on both ve-hicular indices.
Despite the relatively small number of vehicles per 1,000population, mobility is growing, as evidenced by the impressiveincrease in the number of vehicles since 1970. In that year thetotal number of registered vehicles was only 805,000 for a pop-
The Interaction Dimension
106

Figure 4.4. Number of registered vehicles of all types per kilometer ofroad, 1982. Calculated from data in Table VII.2.3 in Biro Pusat Sta-tistik, Statistik Indonesia 1983, Buku Saku.
ulation of around 115 million (an average of one vehicle per 143people). By 1974 this number had increased by 67 percent to1,342,000 and by 1982 had reached an amazing 5,347,716 ve-hicles (for a population of around 155 million, an average of onevehicle per twenty-nine people), a 664 percent increase over the1970 figure. The increase took place particularly in the numberof motorcycles, which make up 70 percent of all the vehicles inthe country, compared with 15 percent for passenger cars, 12percent for trucks, and 3 percent for buses. 7 Once again oneneeds to note the considerable amount of interaction that takesplace on buses and on trucks used to transport people, espe-cially on long-distance trips.
Because of Indonesia’s geographical configuration whereby84 percent of the territory under its jurisdiction consists ofsea, shipping has historically been the prime means of linkingthe thousands of islands and is second only to roads in im-portance. Interisland shipping was well organized and regularunder the Dutch colonial administration, although it served onlya limited number of ports. It was provided not only for economicreasons but for governmental purposes of integrating the far-flung empire, with profitable lines subsidizing other non-eco-nomic but administratively important routes. The Dutch-ownedfleet continued to serve interisland shipping needs after inde-pendence until its withdrawal in 1957; after that the situationdeteriorated badly and only began to improve again at the be-ginning of the 1970s.
National Integration in Indonesia
107
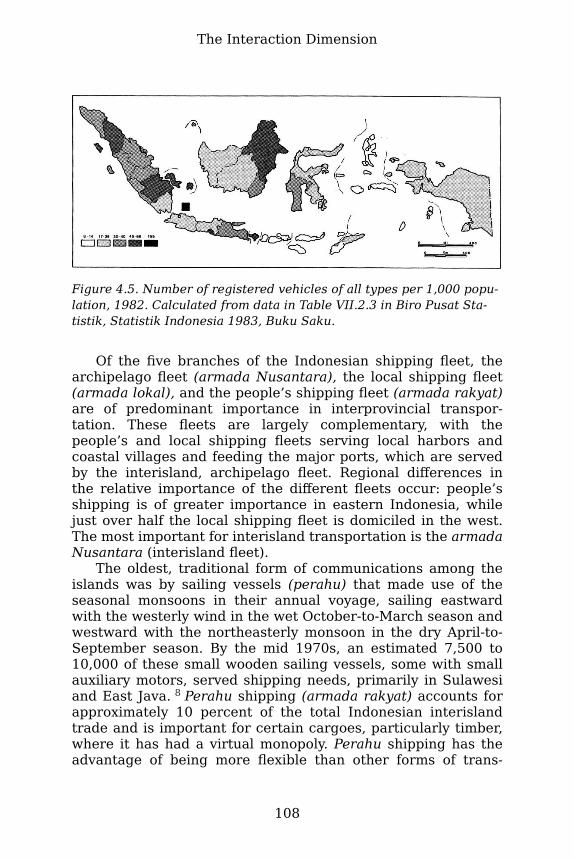
Figure 4.5. Number of registered vehicles of all types per 1,000 popu-lation, 1982. Calculated from data in Table VII.2.3 in Biro Pusat Sta-tistik, Statistik Indonesia 1983, Buku Saku.
Of the five branches of the Indonesian shipping fleet, thearchipelago fleet (armada Nusantara), the local shipping fleet(armada lokal), and the people’s shipping fleet (armada rakyat)are of predominant importance in interprovincial transpor-tation. These fleets are largely complementary, with thepeople’s and local shipping fleets serving local harbors andcoastal villages and feeding the major ports, which are servedby the interisland, archipelago fleet. Regional differences inthe relative importance of the different fleets occur: people’sshipping is of greater importance in eastern Indonesia, whilejust over half the local shipping fleet is domiciled in the west.The most important for interisland transportation is the armadaNusantara (interisland fleet).
The oldest, traditional form of communications among theislands was by sailing vessels (perahu) that made use of theseasonal monsoons in their annual voyage, sailing eastwardwith the westerly wind in the wet October-to-March season andwestward with the northeasterly monsoon in the dry April-to-September season. By the mid 1970s, an estimated 7,500 to10,000 of these small wooden sailing vessels, some with smallauxiliary motors, served shipping needs, primarily in Sulawesiand East Java. 8 Perahu shipping (armada rakyat) accounts forapproximately 10 percent of the total Indonesian interislandtrade and is important for certain cargoes, particularly timber,where it has had a virtual monopoly. Perahu shipping has theadvantage of being more flexible than other forms of trans-
The Interaction Dimension
108

portation; the sailing vessels are virtually independent of im-ported materials and spare parts; they place few demands onthe infrastructure of ports and dockyard services, and they arenot handicapped by burdensome, bureaucratic controls. Theyare thus self-sufficient, labor-intensive, and, in the past espe-cially, mostly unregulated, able to respond quickly to changes intrading needs. For these reasons, perahu shipping historicallyhas been strong in periods of economic decline (such as in thelate 1950s to 1960s) but has suffered increasing competitionfrom the local shipping fleet as the economy has improved andas infrastructure and capital have been concentrated on servingthe needs of the local and interisland shipping fleets.
Perahu shipping thus plays a minor though significant rolein interisland trade and communications. Its importance variesconsiderably from area to area, partly for historical reasonsand partly too because only certain routes are suitable for theperahu because of wind patterns. But in ports such as Banjar-masin, Semarang, and Cirebon, perahu shipping predominates;and in linking many of the smaller, isolated villages and harbors,perahu shipping has a vital role.
The armada lokal involves wooden-and steel-hulled motorvessels used for freight, with capacities of between 100 and500 cubic meters, which provide feeder services to the majorports within a radius of approximately 200 miles. 9 This sectorhas increased its share of shipping considerably since the es-tablishment of the New Order in 1967, and by the mid-1970saccounted for approximately 18 percent (1.9 million tons perannum) of total interisland trade. Local shipping is frequentlyin the hands of Chinese, who have better access to finance andcargoes, especially of consumer goods, which are so importantin the outward trade from Java. Most is domiciled in Sumatra(25 percent in Riau alone), compared with only 29 percent inJava.
However, the interisland fleet of primary importance inlinking all the provinces and serving the major ports for bothpassengers and freight is the armada Nusantara. Because of itsrecognized integrative role as well as its economic role in pro-moting development and regional trade, this fleet has been themain focus of attention in a nation concerned with the problemsof national integration and development.
In colonial days, interisland transportation was provided bythe Koninklijke Paketvaart Maatschappij (K.P.M., the Dutch in-terisland shipping company), supplemented by the vessels ofthe Kapal-Kapal Armada Pemerintah (government fleet) to facil-
National Integration in Indonesia
109

itate government administration and fill local transport needs.The K.P.M. continued to operate after independence until 1957,when it was withdrawn as a consequence of Indonesia’s at-tempted nationalization of the fleet, which was part of its effortto wrest West Irian from the Dutch. As a result, interislandtransportation declined drastically: by 1968 it was estimatedthat the size of the Indonesian fleet was only 30 percent ofthat of the K.P.M. fleet in 1957. By 1972, 48 percent of the in-terisland fleet of 389 ships was over fifteen years of age, andonly 187 of the 275 ships licensed to operate on the RegularLiner Service routes were operative. Service was irregular andproductivity low, with port time consuming 70–80 percent oftotal operating time. 10 Since 1972, however, great improve-ments have been made to rehabilitate seaworthy vessels; tomodernize, expand, and improve the efficiency of the interislandfleet; and to improve shipyard and dock facilities. Cargo shippedby interisland shipping, for example, increased from 2.3 milliontons in 1973, to 3.5 million tons in 1976, and to 4.4 million tonsin 1980.
In 1980 the interisland fleet totaled 374 vessels, with a com-bined capacity of 379,000 deadweight tons. 11 This network wassupplemented by a number of vessels designed to carry ho-mogeneous bulk cargoes and meet overflow seasonal shippingneeds. (By 1980 two-thirds of the total cargo fleet was used forthe transportation of petroleum and liquified natural gas alone.)The relative importance of each province in interisland shippingcan be seen in the income generated by each port, aggregatedby province. The income from ports in Java (33.5 percent ofthe total for Indonesia) just exceeds that from Sumatra (33.3percent), compared with Kalimantan’s 21.7 percent, Sulawesi’s6.3 percent, Irian Jaya and Maluku’s combined total of 4.1percent, and Nusatenggara’s 1.2 percent. However, on aprovincial basis Jakarta predominates, with over 1,294 millionrupiahs in income generated by its port of Tanjung Priok (17.2percent of the total for Indonesia), followed by East Kalimantanwith 1,104 million rupiahs from its five major ports (14.6percent), and Riau with 835 million rupiahs from its majorport of Dumai (11.1 percent). 12 On a per-capita basis, however,East Kalimantan’s ports generate almost twice as much as thesecond ranking province of Riau (1,013.5 and 538.2 rupiahsper capita, respectively), with Jakarta, Irian Jaya, and Acehalso each generating more than three times the national av-erage of 51.1 rupiahs per capita (see Figure 4.6). Provinces with
The Interaction Dimension
110

the lowest port-generated income per capita include all the Ja-vanese provinces apart from Jakarta, as well as Bali, the twoNusatenggara provinces, and Bengkulu.
Attention has also been given to integrating especially iso-lated parts of Indonesia (the daerah-daerah lemah) by providingregular service with thirty-one special vessels (the armada per-intis [pioneer fleet]). The motivation for this is both politicaland economic: to integrate and to involve those areas in main-stream Indonesian life; and to develop, by guaranteeing regulartransportation, any cash crops that can be produced, as well asto raise living standards by bringing in imported goods. Areasserved include the Riau archipelago, West Sumatra, West andEast Nusatenggara, Sangihe and Talaud (in North Sulawesi),Maluku, and Irian Jaya. Traffic on these lines grew by over 31percent a year between 1976 and 1980. 13
Of the 319 registered ports, the seventeen largest (eachrecording an income of at least 100 million rupiahs in1981–1982) accounted for 70 percent of the total shippingincome (see Table 4.1). 14 The government has been active inrehabilitating these ports and stimulating the shipping industrythrough a number of regulations and construction projects.These include requiring goods purchased or sold by officialagencies or enterprises to be transported on Indonesian linersand reducing berthing fees for domestic liners. In a more con-troversial move, the government is forcing shipowners to scrapall vessels over twenty-five years old (regardless of their sea-worthiness) and sell the scrap to the state-owned KrakatauSteel (at prices well below those on the international market).Shipowners are then required to purchase standard, locallybuilt ships from the state-owned shipbuilding company in Sura-baya, which, critics claim, are being built with high-cost localmaterials and an inexperienced work force, thus costing farmore than the preferred secondhand foreign-built vessels previ-ously bought. 15
Air transportation has increased enormously over the pasttwo decades, a measure of both the increasing integration par-ticularly of urban areas and the improving standard of livingin Indonesia. Just between 1968 and 1971 the number of pas-sengers flying on domestic flights increased from 382,000 to993,000, an increase of 260 percent. 16 By 1974 the numbershad increased to a reported 2,229,000 passengers, 17 and by1981 to 6,512,902, a 656 percent increase over just ten years.
National Integration in Indonesia
111

Figure 4.6. Income generated by the ports in each province in rupiahsper capita, 1981–1982. Calculated from data in Republik Indonesia,Departemen Perhubungan Laut, Direktorat Perkapalan dan PelayaranSubDit. Kebandaran dan Awak Kapal, Seksi P.U., File No. TH 1981/82.
18 The amount of freight carried by the airlines is still small butincreased at an annual rate of 23 percent between 1969 and1982. 19
The number of domestic air passengers passing throughthe sixty-six provincial airports gives some idea of the com-parative importance of air traffic relative to population size ineach province and reflects economic prosperity as well as pop-ulation mobility. As Figure 4.7 shows, Jakarta and East Kali-mantan dominate in per-capita air travel, while provinces withthe least domestic air traffic in relation to their populationsare West, Central, and East Java, Aceh, Lampung, and the rel-atively isolated and less developed provinces of East and WestNusatenggara and Southeast Sulawesi.
Much progress has been made in increasing the number ofaircraft and the number of flights on already established routes,as well as in constructing new airports and air strips, thusimproving communications among previously isolated areas.Several commercial airlines serve domestic routes, and thereare several special charter airlines as well. In 1983, the primarygovernment-owned national airline, Garuda IndonesianAirways, operated seventy-seven aircraft with a combinedseating capacity of 11,400, and Merpati Nusantara, incorpo-rated into Garuda in 1978 but still run as a separate entity,operated thirty-eight aircraft. 20 Other commercial domestic air-
The Interaction Dimension
112

Table 4.1. Major ports of Indonesia ranked by income recorded,1981–1982
Port Rupiahs(millions)
1. Tanjung Priok (Jakarta) 1,294,006
2. Dumai (Riau) 835,426
3. Surabaya (East Java) 534,500
4. Lhokseumawe (Aceh) 339,252
5. Kuala Semboja (East Kalimantan) 286,826
6. Balikpapan (East Kalimantan) 272,765
7. Belawan (North Sumatra) 267,239
8. Bontang (East Kalimantan) 227,739
9. Palembang (South Sumatra) 181,168
10. Tanjung Santan (East Kalimantan) 161,254
11. Samarinda (East Kalimantan) 155,381
12. Manado/Bitung (North Sulawesi) 136,340
13. Banjarmasin (South Kalimantan) 133,244
14. Semarang (Central Java) 128,132
15. Sorong (Irian Jaya) 118,354
16. Ujung Pandang (South Sulawesi) 116,590
17. Cirebon (West Java) 101,784
Source: Republik Indonesia, Departemen Perhubungan Laut,Direktorat Perkapalan dan Pelayaran SubDit, Kebandaran danAwak Kapal, Seksi P.U., File No. TH 1981/82
lines, such as Mandala and Bouraq, further strengthen air trans-portation services in the country and help to link populationcenters throughout the archipelago.
National Integration in Indonesia
113

Figure 4.7. Number of air passengers recorded on domestic flightsper 1,000 population, 1981. Calculated from data in Table 9 in BiroPusat Statistik, Statistik Angkutan Udara 1981.
COMMUNICATIONSMass communications are vital to integrating a nation in termsof both area and people. This has been recognized by manygovernments of developing countries, which have sought to im-prove all forms of communications. Radio and television, tele-phone and telegraph, mail service and the press all play a vitalrole in national communications. Telecommunications facilitieshave expanded tremendously since 1970 with the completionof the domestic satellite network consisting of two communica-tions satellites (Palapa) and forty earth stations.
Of all the forms of mass-media communications consideredin a 1972 sample survey of the best way to disseminate infor-mation and reach people, radio was found to be most effective(compared with the press, television, and films). 21 This is partlybecause of the widespread availability and relative low cost ofradios and partly because a radio requires no skills of its au-dience. Use of traditional media (such as shadow puppet plays[wayang]) was also valued because of its ready acceptance bythe people (in those areas such as Java where it is a traditionallyaccepted part of the culture).
The importance of exposure to national and nationwideradio broadcasts and television programs has already been con-sidered under the sociocultural dimension of integration. Animpressive doubling in the number of radio receivers wasrecorded between 1964 and 1971 (from 1.5 million to three
The Interaction Dimension
114

million), and by 1980 12.3 million households reported owninga radio/cassette recorder. 22 Television accessibility throughoutthe country has expanded even more rapidly. By 1980,2,940,000 households reported owning a television set, up froman estimated 10,000 in 1962. In 1973 only about 3.8 percentof the land area of Indonesia received television signals: ap-proximately 26 percent of Java, and parts of southern Sumatra,eastern Kalimantan, and southern Sulawesi. 23 Indeed, in 197393 percent of all television sets were found in Java. Since then,television has become available in every province, thanks to thePalapa satellites. Despite the fact that television is only one-way communication, television programs are seen as a partic-ularly effective medium for strengthening national integrationand preserving and developing Indonesia’s national culture, aswell as for promoting rural development. 24
Telephone communications have also been aided by the de-velopment of the satellite communications system. But eventhough telephone density has risen from 1.8 per 1,000 popu-lation in 1971 to 4.0 in 1981, telephone linkages remain rela-tively poorly developed in Indonesia. This is a reflection partlyof the low level of development, but partly too it reflects the dif-ficulties and high cost of providing telephone facilities in sucha physically fragmented country. The satellite system is supple-mented by microwave facilities linking Jakarta to southernSumatra, Bali, and parts of Nusatenggara, and other high-fre-quency radio and high-altitude systems link the remotest is-lands. 25 Telephone communication is limited largely to urbanareas and thus correlates closely with the proportion of thepopulation of each province that is urban and with the levelof development. As expected, telephone density is far higherin Jakarta (32.8 telephones per 1,000 population) than in anyother province, with East Kalimantan a poor second at 8.5. 26
Other provinces with relatively high telephone densities areNorth Sumatra, Bali, and Irian Jaya, while exceptionally lowper-capita telephone ownership exists in Southeast Sulawesi,East Nusatenggara, Lampung, West and Central Kalimantan,and Central Sulawesi (see Figure 4.8). As with other forms ofcommunications, there has been a rapid expansion of telephonecommunications in recent years: the number of telephones hasincreased from 60,000 in 1968 to 263,000 in 1973 to 584,181 in1981 and 741,322 in 1983.
Analysis of the number of minutes of telephone conversationper capita in 1980 portrays a pattern generally similar to that oftelephone ownership, with Irian Jaya, East Kalimantan, Jakarta,
National Integration in Indonesia
115

Figure 4.8 Number of telephone licenses issued per 1,000 population,1981. Calculated from data in Table VII.5.3 in Biro Pusat Statistik,Statistik Indonesia 1983, Buku Saku.
and Bali having the highest telephone usage on a per-capitabasis, and West Kalimantan, East Nusatenggara, Lampung, andJambi the lowest (see Figure 4.9). Some interesting changeshave occurred over the past decade, however, because of thedevelopment of the multichannel microwave system and thenew domestic satellite communications system: whereas in1973 Java recorded 94 percent of all telephone conversationswhen measured by number of minutes spoken, by 1980 thatfigure had fallen to 62.8 percent, approximately equal to Java’sshare of the total Indonesian population. The two provinces ofIrian Jaya and Maluku together had far more telephone com-munication per capita per annum than any other group ofprovinces (77.1 minutes per 100 people, compared with 44.1 forJava, 43.4 for Nusatenggara [including Bali], 42.0 for Sumatra,41.5 for Kalimantan, and 37.6 for Sulawesi). 27
Even more than with the use of telephones, eastern In-donesia’s use of telegrams for domestic communication is farhigher than that of Java and Sumatra. The number of telegramssent to domestic destinations was greatest by far in Irian Jayaand Maluku (270.6 and 231.9 per 1,000 population, comparedwith a national average of 46.9). Other provinces with a highuse of telegrams were East Kalimantan, Central and North Su-lawesi, Riau, and Jakarta; those with lowest use were Lampung,North Sumatra, West, Central, and East Java, and West Kali-mantan (see Figure 4.10). 28
The Interaction Dimension
116

Figure 4.9. Number of minutes of telephone conversation within In-donesia per 100 population, 1980. Calculated from data in Table 13 inBiro Pusat Statistik, Statistik Kommunikasi 1980.
The provinces that stand out as having the fewest com-munication links with other provinces, in terms of both tele-phones and telegrams, on a per-capita basis, are West Kali-mantan and Lampung. Telegraph communications from otherisolated provinces, such as Southeast and Central Sulawesiand East Nusatenggara, are surprisingly high. For twenty-fourprovinces telegrams addressed to domestic destinations consti-tuted over 95 percent of all telegrams sent. In Jakarta this figuredropped to 89 percent, a reflection of the capital’s internationalstatus, and in Bali it fell to 92 percent, because of its tourism.
Interprovincial flows of mail form another index of inter-regional communication and thus of functional integration.However, inadequate data make detailed cross-provincial com-parisons impossible.
The press, which plays such an important role in dissemi-nating information and integrating peoples in more developedsocieties, has a very limited role in Indonesia. It serves a small,mainly urban clientele focused in Jakarta and a few otherprovincial capitals, and provides incomplete coverage of na-tional activities. Historically, the fortunes of the press have fluc-tuated widely: they flowered in the mid-1950s, but underwenta spectacular decline in the period of Sukarno’s GuidedDemocracy. After the abortive coup in 1965 the press again ex-panded, and in 1966 circulation rose to a peak of about twomillion, but then declined to under 900,000 by the end of 1967(for a population of over 110 million). 29 It has since increased
National Integration in Indonesia
117
substantially. As in many developing countries, each copy of anewspaper is read by far more people than a comparable issuein a developed country.
Yet newspapers reach only a small segment of the popu-lation. On average only 18 percent of Indonesia’s population tenyears of age or over reported having read a newspaper or mag-azine in the week preceding a survey in 1981. As expected, per-centages vary widely, from a high of 48.9 percent in Jakarta, andbetween 25 and 28 percent in North and West Sumatra, NorthSulawesi, and Irian Jaya, to less than 12 percent in West andEast Nusatenggara, Bengkulu, Jambi, Bali, and East Java (seeFigure 4.11). 30
Government control and interference have also varied inintensity over the years. In the late 1960s experts rated In-donesian newspapers as among the freest in Southeast Asia, butthere has been considerable growth in the power and influenceof the military since then and increased censorship. Several in-fluential army-controlled dailies based in Jakarta have expandedtheir circulation and established affiliated branch editions in anumber of provincial towns. But some provincial newspapersand news magazines that provide news locally have at timesbeen banned from being mailed to other parts of Indonesia,thereby reducing their potential integrative effect. Pressfreedom was sharply curtailed following the Jakarta riots inJanuary 1974 31 and has fluctuated since. A fair amount of veiledcriticism is currently permitted, although there are definitelimits. Indeed, a leading newspaper, Sinar Harapan, was closeddown in 1986 for being too outspoken. Censorship, which the-oretically may help integration by curbing inflammatory criti-cism, in practice may also lead to a repressive rather than anintegrated society and may restrict development.
MIGRATIONAnalysis of migration data as recorded in the 1971 and 1980censuses reveals much about the degree of interaction amongpeople from the various provinces of Indonesia, although itshould be noted that the census records only a small subsetof all the population movement that occurs within the country:that which crosses provincial borders and is of at least sixmonths’ duration. It thus fails to take note of the consider-able amount of intraprovincial movement as well as temporarymigration. Other complicating factors in comparing inter-
The Interaction Dimension
118

Figure 4.10. Number of telegrams sent to domestic destinations per1,000 population, 1981. Calculated from data in Table VIII.5.5 in BiroPusat Statistik, Statistik Indonesia 1982.
Figure 4.11. Percentage of the population who read a newspaper ormagazine in the week preceding a survey, 1981. Based on data inTable III.1.9 in Biro Pusat Statistik, Statistik Indonesia 1983, BukuSaku.
provincial migration are the tremendous variation in the geo-graphical size of the provinces and the physical proximity ofother provinces. For example, Irian Jaya has an area of 422,000square kilometers, whereas Jakarta has less than 1,000 squarekilometers. A person can therefore travel only a short distanceon Java by land, cross a provincial border, and be classified as
National Integration in Indonesia
119

a migrant, but in Irian Jaya “migration” under this definition re-quires journeys of hundreds of kilometers and travel by sea orair.
In terms of long-term interprovincial migration, the popu-lation of Indonesia as a whole is relatively immobile. In 1980only 7.8 percent of the total population (11.4 million people outof 146.8 million) had resided in a province other than that inwhich they were presently located, and only 7.0 percent wereliving in a different province from the one where they wereborn. 32 Over one-third of those who had lived elsewhere (4.5million or 39 percent) were residing either in Jakarta or inLampung in southern Sumatra, a major destination for transmi-grants from Java. In general there is considerably more inter-provincial mixing in Sumatra, Kalimantan, Maluku, and IrianJaya than there is in Nusatenggara, Java (with the exceptionof Jakarta), and Sulawesi. Very little intermixing takes place inthe eight provinces where less than 5 percent of the populationhas ever lived in another province. This group includes both thedensely populated provinces of East, Central, and West Java andBali, and the more isolated and less developed provinces of Eastand West Nusatenggara and West Kalimantan, as well as SouthSulawesi (see Figure 4.12).
Analysis of the generally small percentage of eachprovince’s population that has previously lived outside thatprovince shows that in fourteen provinces over half of the im-migrants came from just one or two other provinces, generallyfrom their nearest neighbors (with the exceptions of theprovinces attracting transmigrants from Java and Bali, suchas North Sumatra, Jambi, South Sumatra, Bengkulu, Lampung,and West Kalimantan) (see Figure 4.13). Other provinces,however, such as East Nusatenggara and South and North Su-lawesi, have immigrants from a wide diversity of otherprovinces, with no one province contributing more than 17percent. In comparison with the migration data in the 1971census, it is interesting to note that the source areas for in-terprovincial migrants have broadened as transportation andcommunications facilities have improved.
Although the percentages of people who have lived outsidetheir present province of residence remain small, they concealthe substantial numbers involved, particularly in the case ofJava. For example, although only 2.3 percent of Central Java’sand 2.1 percent of East Java’s population have lived previouslyin another province, these percentages represent 579,000 and623,000 people respectively, significantly higher numbers than
The Interaction Dimension
120

Figure 4.12. Percentage of the population in each province who havelived previously in another province, 1980. Calculated from data inTable 7.3 in Biro Pusat Statistik, Sensus Penduduk 1980, Series S, no.2.
the 57,500 in-migrants in East Nusatenggara and the 69,500in West Nusatenggara (which also constitute only 2.1 and 2.6percent of their respective populations), or even the 150,000in Central Kalimantan, which make up a much more significant15.7 percent of its total population of 954,000. 33
Three major migration flows can be identified from the 1980census materials: first, that to Jakarta, where just over 40percent of that special district’s population formerly residedin another province. Jakarta’s attractions are obvious: it is thecenter of government and commerce and has greater em-ployment and education opportunities than any other province.
Over 75 percent of the in-migrants in Jakarta in 1980 hadcome from Java, with the highest proportions, as might be ex-pected, from West and Central Java (33.5 and 32.3 percent, re-spectively) (see Table 4.2). Significant numbers had come alsofrom North, West, and South Sumatra, West Kalimantan, andSouth and North Sulawesi. Indeed, Jakarta was the prime desti-nation for migrants from North, West, and South Sumatra, Westand Central Java, Yogyakarta, West Nusatenggara, and WestKalimantan. The considerable amount of interchange betweenJakarta and West Java is also striking: over half the out-mi-grants from Jakarta live in West Java, from where a considerablenumber commute or engage in circular migration to Jakarta.
National Integration in Indonesia
121

Figure 4.13. Province of last previous residence of interprovincial mi-grants, 1980. Calculated from data in Table 7.3 in Biro Pusat Statistik,Sensus Penduduk 1980, Series S, no.2.
The second major migration flow is the movement from Javato Lampung, South and North Sumatra, and to a lesser extentJambi and Riau, stimulated largely by the government’s trans-migration (resettlement) program (see Table 4.3). In Lampung39 percent of the population had migrated from other provinces(two-thirds of them from Central and East Java), while Southand North Sumatra each had over 350,000 migrants from Java.Also increasingly affected by the government’s transmigrationprogram in the 1970s have been the provinces of South, West,and East Kalimantan, Central and Southeast Sulawesi, and,most recently, Irian Jaya. In addition to government-sponsoredmigration there has always been a considerably larger flow ofspontaneous migration in the same direction.
The government’s stated goals in its transmigrationprogram are to provide land for the landless from Java, Bali,and Lombok (in West Nusatenggara); to improve the distrib-ution of population; and at the same time to provide manpowerfor labor-scarce areas outside Java, Bali, and Lombok, so thatthe latter areas can develop as new centers of production. Theprogram is also seen as a vehicle to promote “national stabilityand integration.” 34
The Interaction Dimension
122

Table 4.2. Migration to Jakarta
Place of previous residenceof Jakarta’s population in1980
In-migrantsto Jakarta
Percentage of Jakarta’sin-migrant population in
1 980a
Aceh 12,635 0.4
North Sumatra 149,513 5.8
West Sumatra 131,198 5.1
Riau 17,011 0.7
Jambi 6,576 0.2
South Sumatra 89,831 3.4
Bengkulu 3,420 0.1
Lampung 11,394 0.4
Jakarta [3,842,898]b —
West Java 859,979 33.5
Central Java 828,947 32.3
Yogyakarta 62,208 2.4
East Java 211,530 8.2
Bali 7,411 0.3
West Nusatenggara 8,039 0.3
East Nusatenggara 9,009 0.4
East Timor 1,313 0.1
West Kalimantan 47,349 1.8
Central Kalimantan 2,507 0.1
South Kalimantan 12,795 0.5
East Kalimantan 6,279 0.2
National Integration in Indonesia
123
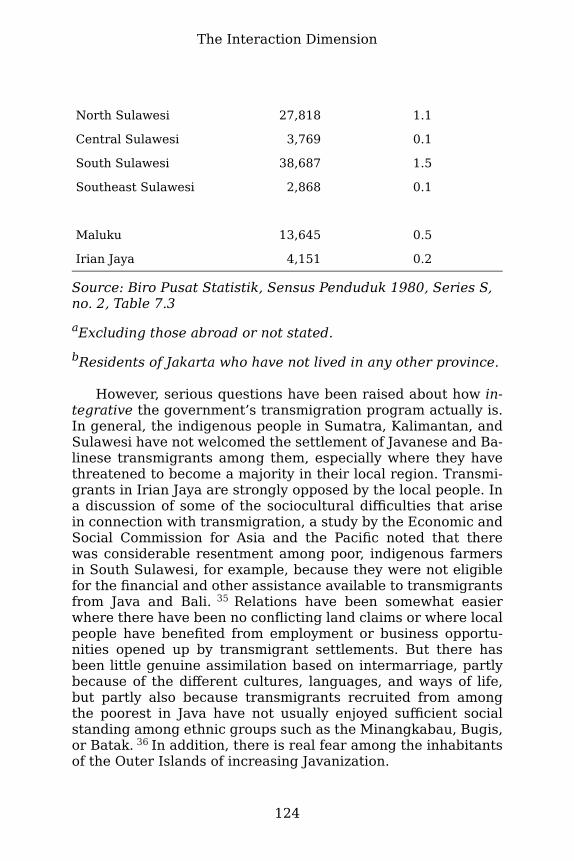
North Sulawesi 27,818 1.1
Central Sulawesi 3,769 0.1
South Sulawesi 38,687 1.5
Southeast Sulawesi 2,868 0.1
Maluku 13,645 0.5
Irian Jaya 4,151 0.2
Source: Biro Pusat Statistik, Sensus Penduduk 1980, Series S,no. 2, Table 7.3aExcluding those abroad or not stated.bResidents of Jakarta who have not lived in any other province.
However, serious questions have been raised about how in-tegrative the government’s transmigration program actually is.In general, the indigenous people in Sumatra, Kalimantan, andSulawesi have not welcomed the settlement of Javanese and Ba-linese transmigrants among them, especially where they havethreatened to become a majority in their local region. Transmi-grants in Irian Jaya are strongly opposed by the local people. Ina discussion of some of the sociocultural difficulties that arisein connection with transmigration, a study by the Economic andSocial Commission for Asia and the Pacific noted that therewas considerable resentment among poor, indigenous farmersin South Sulawesi, for example, because they were not eligiblefor the financial and other assistance available to transmigrantsfrom Java and Bali. 35 Relations have been somewhat easierwhere there have been no conflicting land claims or where localpeople have benefited from employment or business opportu-nities opened up by transmigrant settlements. But there hasbeen little genuine assimilation based on intermarriage, partlybecause of the different cultures, languages, and ways of life,but partly also because transmigrants recruited from amongthe poorest in Java have not usually enjoyed sufficient socialstanding among ethnic groups such as the Minangkabau, Bugis,or Batak. 36 In addition, there is real fear among the inhabitantsof the Outer Islands of increasing Javanization.
The Interaction Dimension
124

Table 4.3. Number of government- sponsored transmigrants,1969–1983
Province Number of settlers
Aceh 35,516
North Sumatra 13,955
West Sumatra 29,870
Riau 114,728
Jambi 131,554
South Sumatra 358,819
Bengkulu 61,252
Lampung 140,265
West Kalimantan 66,107
Central Kalimantan 41,348
South Kalimantan 81,560
East Kalimantan 49,039
North Sulawesi 21,852
Central Sulawesi 91,599
South Sulawesi 48,426
Southeast Sulawesi 78,643
Maluku 16,678
Irian Jaya 32,927
1,414,138a
Source: Republic of Indonesia, Department of TransmigrationaIn addition to official, government-sponsored transmigrants,there are at least twice as many spontaneous transmigrants,although their destinations differ widely from those of
National Integration in Indonesia
125

government-sponsored transmigrants. For example, thirteen toeighteen times as many spontaneous as official transmigrantsmoved to Lampung and North Sumatra between 1975 and1980. See H. W. Arndt, “Transmigration: Achievements,Problems, Prospects,” p. 71. North Sumatra in 1980 recorded617,115 people who had previously lived outside the province;in Lampung, the numbers were 1,813,900. See Biro PusatStatistik, Sensus Penduduk 1980, Series S, no. 2, Table 7.3.
Third, there is the movement to some of the provinces withhigher gross domestic product (GDP) per capita or above-av-erage rates of economic growth: East Kalimantan (where 25percent of the population previously resided in anotherprovince), Jambi (21 percent), Riau (17 percent), Bengkulu (17percent), Central Kalimantan (16 percent), and Central Su-lawesi (16 percent). 37 In terms of actual numbers, North andSouth Sumatra had the largest flows by 1980, with over 600,000in-migrants each. West Sumatra, Bali, East Nusatenggara,North and South Sulawesi, and South Kalimantan, as well asmost of Java, registered more out-migration than in-migrationin the decades preceding both 1971 and 1980.
Despite generally low interprovincial migration rates, acomparison of 1971 and 1980 census data indicates growingmobility among the population. Almost twice as many peoplehad previously resided in another province in 1980 as in 1971(11.4 million compared with 5.8 million). In addition, studies byHugo, Jellinik, and others have shown a substantial upswing inall kinds of other mobility, especially commuting, seasonal mi-gration, and circular movements, with generally shortened pe-riodicity and longer distances involved than before. 38 Othershave discussed both the great increase in commuting in con-nection with the improvements and expansion in transport inthe 1970s, and the proclivity of certain ethnic groups (particu-larly the Minangkabau, West Javanese, Batak, Banjarese, Bugis,and others) to engage in circular migrations (merantau). 39 Inrecent years the pattern of such circular migration has changedalmost entirely to one of urban destinations and the taking upof occupations quite unlike those in the area of origin. 40 Suchcirculation between the city and the countryside not only re-lieves the strain on the urban infrastructure and services, butincreases the dissemination of new ideas and, it can be argued,fosters understanding and integration. But, on the other hand,circulation reflects the spatial unevenness of development and
The Interaction Dimension
126
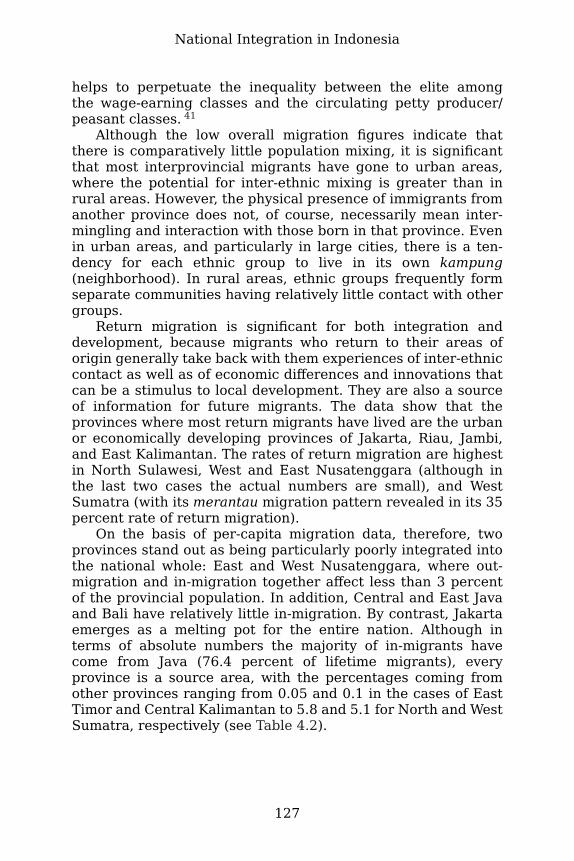
helps to perpetuate the inequality between the elite amongthe wage-earning classes and the circulating petty producer/peasant classes. 41
Although the low overall migration figures indicate thatthere is comparatively little population mixing, it is significantthat most interprovincial migrants have gone to urban areas,where the potential for inter-ethnic mixing is greater than inrural areas. However, the physical presence of immigrants fromanother province does not, of course, necessarily mean inter-mingling and interaction with those born in that province. Evenin urban areas, and particularly in large cities, there is a ten-dency for each ethnic group to live in its own kampung(neighborhood). In rural areas, ethnic groups frequently formseparate communities having relatively little contact with othergroups.
Return migration is significant for both integration anddevelopment, because migrants who return to their areas oforigin generally take back with them experiences of inter-ethniccontact as well as of economic differences and innovations thatcan be a stimulus to local development. They are also a sourceof information for future migrants. The data show that theprovinces where most return migrants have lived are the urbanor economically developing provinces of Jakarta, Riau, Jambi,and East Kalimantan. The rates of return migration are highestin North Sulawesi, West and East Nusatenggara (although inthe last two cases the actual numbers are small), and WestSumatra (with its merantau migration pattern revealed in its 35percent rate of return migration).
On the basis of per-capita migration data, therefore, twoprovinces stand out as being particularly poorly integrated intothe national whole: East and West Nusatenggara, where out-migration and in-migration together affect less than 3 percentof the provincial population. In addition, Central and East Javaand Bali have relatively little in-migration. By contrast, Jakartaemerges as a melting pot for the entire nation. Although interms of absolute numbers the majority of in-migrants havecome from Java (76.4 percent of lifetime migrants), everyprovince is a source area, with the percentages coming fromother provinces ranging from 0.05 and 0.1 in the cases of EastTimor and Central Kalimantan to 5.8 and 5.1 for North and WestSumatra, respectively (see Table 4.2).
National Integration in Indonesia
127

TRADEAnother measure of national integration is the amount of tradethat takes place among the various regions within a nation.An analysis of trade data reveals those provinces that par-ticipate only minimally in the integrative trading experience,either by having very low levels of trade with other provincesin the country, or by maintaining stronger trading relationshipswith places outside the national boundaries than with otherprovinces within the country, or both.
It has been claimed that the Indonesian archipelago wasprobably more integrated in the seventeenth and eighteenthcenturies than it was when colonial domination reoriented trademore directly to overseas markets in the nineteenth and twen-tieth centuries. 42 Increasingly, a separation of the different eco-nomic regions of Indonesia took place, along with a growing,dramatic split between Java and the Outer Islands in terms ofproduction factors, income levels, and demand. This situationbegan to change only after 1930, in the period during and fol-lowing the depression, when Java shifted from export to do-mestic production as a result of the slump in the sugar marketand as the government began to encourage self-sufficiency inrice production, an increase in domestic manufactures, and in-terregional trade. Regional specialization increased and inter-island trade grew. However, these trends were interrupted andreversed by the Second World War and by the Japanese occu-pation, which emphasized both subsistence and regional self-sufficiency and disrupted both interregional transportation andthe established capital-intensive sector.
Even after independence was attained, government policyand the deep-rooted problems inherited from the past combinedto reinforce economic fragmentation. A decline in prices re-duced per-capita incomes and thus the market incentive for Ja-vanese manufactured goods. Java shifted more of its resourcesinto food production to meet the needs of its own rapidlygrowing population. 43 Trade tended to revert to the pattern ofeach island exporting and importing directly from overseas andtrading within its own shores rather than with other islands,while Java used increased amounts of the revenues generatedby Outer Island export earnings for its own imports of raw ma-terial and capital goods for the Javanese market.
Regional markets grew slowly. This was a function of pooragricultural growth and low per-capita incomes, together withforeign exchange policies that restricted foreign consumer im-
The Interaction Dimension
128

ports and froze export proceeds while domestic prices rose.Interisland trade was thus subjected, at least from the view-point of the Outer Islands, to progressively poorer economicterms. Some local manufactures began to grow, particularly inSumatra. But serious deterioration in transportation facilitiesin the late 1950s and early 1960s contributed to the furtherweakening of interregional trade, as did growing economicmismanagement. The distribution network remained disorga-nized and decentralized.
Both domestic and foreign trade have increased consid-erably under the new economic order in the post-1966 period.Government intervention in domestic trade has increased to“ensure the adequate supply of essential goods to Indonesianconsumers, to diversify the economy in accordance with devel-opment plans, and to convert a colonial economy into a nationaleconomy.” 44 This has met with mixed results: some measureof quality control of exports and the protection of certain com-modities, an insistence on control of private enterprise by “In-donesian citizens,” but also some inflation and speculation, anda massive, centralized bureaucracy.
In an analysis of the overall national trading pattern of In-donesia it is important to consider the disproportionate partici-pation of the different provinces in terms of both the productionof exports and the consumption of imports. The foreign tradefigures for 1982 show the great importance of Sumatra, and,to a lesser extent, Kalimantan, in generating exports (primarilypetroleum, liquified natural gas, and timber). Sumatra accountsfor 59.1 percent of the total volume and 50.6 percent of thetotal value of Indonesia’s exports; Kalimantan contributes 20.5percent of the volume and 24.1 percent of the value. Java’s ex-ports, by contrast, make up only 16 percent of the total volumeand 20.2 percent of the value of the whole country’s exports.45 Per-capita data on export tonnage for international and do-mestic destinations, presented in Figure 4.14, show a similarpattern.
Moreover, when data on cargo loaded for overseas trade areexamined, Sumatra’s dominant role becomes much more ap-parent: 80.9 percent of Indonesia’s cargo by weight originatesin Sumatra, primarily in Riau (50.7 percent of all Indonesia’scargo) and Aceh (24.3 percent). 46 Java’s cargoes loaded forinternational destinations constitute only 4.0 percent of In-donesia’s total, a smaller proportion than that originating in
National Integration in Indonesia
129

Figure 4.14. International and domestic exports: cargoes loaded intons per 100 population, 1982. Calculated from data in Table VII.4.2in Biro Pusat Statistik, Statistik Indonesia 1983, Buku Saku.
both Kalimantan, where 7.8 percent of Indonesia’s cargo des-tined for foreign ports is loaded, and Irian Jaya, with its 4.4percent share.
On a per-capita basis, disparities in terms of exports areeven more striking. Only seven of Indonesia’s twenty-sevenprovinces export more than the national average of 38.9 tonsper 100 population. Riau stands out with its 1,340.6 tons, Acehis a distant second with 533.5 tons, and Irian Jaya third with214.0 tons, all reflecting the mineral wealth of these areas. Bycontrast, per-capita figures of below one ton per 100 populationoccur in West Java, Bali, West and East Nusatenggara, and EastTimor, and below five tons in Central and East Java and Southand North Sulawesi (see Figure 4.15).
Imports, by contrast, flow predominantly to Java andoverwhelmingly to Jakarta: 68.8 percent of imports by valueenter Java, including 38.4 percent to Jakarta alone. 47 Sumatrareceives 20.6 percent and Kalimantan 7.3 percent; Irian Jayaand Maluku together get 0.8 percent. These figures, however,are not greatly out of line with each island’s share of the totalpopulation (Java, 62 percent; Sumatra, 19 percent; Kalimantan,5 percent; and Irian Jaya and Maluku, less than 2 percent). Ona per-capita basis, the contrasts, though wide, are not as ex-treme as they are for exports. Kalimantan on average receivesthe greatest value of imports on a per-capita basis ($182 percapita); Java’s per-capita figure ($127) is only slightly higherthan that of Sumatra ($124). The poor, underdeveloped islandsof Nusatenggara receive least ($15), a figure that would be
The Interaction Dimension
130

lower still if the relatively higher per-capita import level of Baliwere not included. Jakarta’s imports are more than eight timesthe national average on a per-capita basis ($996 compared witha national average of $114), but it is not clear from the datawhat proportion of imports entering Jakarta is destined for re-distribution to other provinces in Java or the Outer Islands. IfJakarta’s imports are averaged with West Java’s, the per-capitafigure falls dramatically to $227 per person, substantially lowerthan East Kalimantan’s astounding $908 and Riau’s high $387.Provinces with exceptionally low per-capita import figures areEast Nusatenggara (3 cents), Bengkulu (20 cents), and WestNusatenggara and Southeast Sulawesi ($2 each) (see Figure4.16).
In a comparison of export and import data, therefore, it isclear which islands benefit most from their incorporation intothe country of Indonesia. Java obviously benefits enormously:its imports ($11,599 million or $127 per capita) far exceed itsexports ($4,511 million or $49 per capita). Similar situationsexist in Bali and Nusatenggara (which together have imports of$118 million or $15 per capita, but exports of only $22 millionor $3 per capita), and, to a lesser extent, in Sulawesi (whichhas imports of $313 million or $30 per capita and exports of$244 million or $23 per capita). The reverse is true for Sumatra,where exports ($11,303 million or $403 per capita) exceed im-ports considerably ($3,474 million or $124 per capita); for Kali-mantan (exports of $3,263 million or $485 per capita and im-ports of $1,225 million or $182 per capita); and for Maluku andIrian Jaya (exports of $868 million or $336 per capita, but im-ports of only $130 million or $50 per capita). One has to wonderabout the integrative effect of this imbalance, particularly forIrian Jaya and Maluku, which contribute so much more to thenational economy than they gain (although revenue generatedby drilling or mining accrues directly to the central governmentand so lessens the perceived disparity between contributionsto and benefits from the national economy). However, the datasuggest that the situation at the beginning of the 1980s wasslightly more balanced than it was in 1971. In that year 75percent of all Indonesia’s imports flowed to Java. Java had thehighest value of imports on a per-capita basis of any islandgroup, and Jakarta’s imports were more than sixteen times thenational average on a per-capita basis. 48 But Java obviouslystill consumes a disproportionate percentage of the nation’s im-ports, both in relation to its exports and in comparison withmost of the provinces in the eastern islands of Indonesia.
National Integration in Indonesia
131
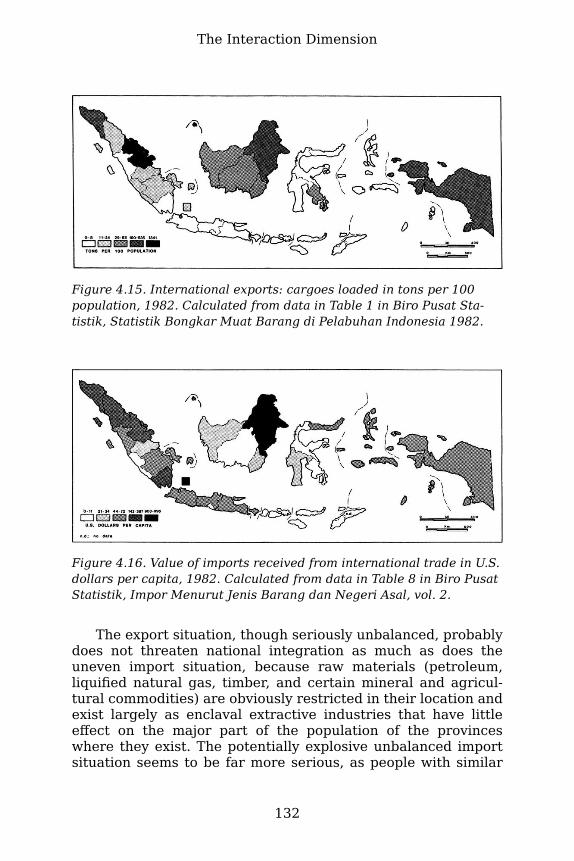
Figure 4.15. International exports: cargoes loaded in tons per 100population, 1982. Calculated from data in Table 1 in Biro Pusat Sta-tistik, Statistik Bongkar Muat Barang di Pelabuhan Indonesia 1982.
Figure 4.16. Value of imports received from international trade in U.S.dollars per capita, 1982. Calculated from data in Table 8 in Biro PusatStatistik, Impor Menurut Jenis Barang dan Negeri Asal, vol. 2.
The export situation, though seriously unbalanced, probablydoes not threaten national integration as much as does theuneven import situation, because raw materials (petroleum,liquified natural gas, timber, and certain mineral and agricul-tural commodities) are obviously restricted in their location andexist largely as enclaval extractive industries that have littleeffect on the major part of the population of the provinceswhere they exist. The potentially explosive unbalanced importsituation seems to be far more serious, as people with similar
The Interaction Dimension
132

needs receive disproportionate amounts, both absolutely and inrelation to what they produce for export. Differences in livingstandards in different parts of the archipelago are very obvious.Knowledge of where imported goods are more accessible andwhere higher standards of living consequently occur (in urbanJava and particularly in Jakarta) contributes to the attrac-tiveness of Jakarta and the consequent brain drain from theOuter Island provinces, as well as to some discontent in parts ofthe Outer Islands.
As might be expected, the contrasts among the provinces ininterprovincial trade are far smaller than those in internationaltrade, but show a similar pattern. The importance of Kalimantanand Sumatra in producing exports for domestic trade standsout both overall and on a per-capita basis (see Figure 4.17).Unfortunately, the value of exports in interprovincial trade isnot available, but on the basis of tonnage per capita East Kali-mantan and Riau produce far more than any of the otherprovinces (with 328 and 183 tons per 100 population, respec-tively). 49 By contrast, twelve of Indonesia’s twenty-sevenprovinces produce less than ten tons per 100 population. Aswith exports for overseas, Java and the Nusatenggara provinces(Bali, West and East Nusatenggara, and East Timor) stand outfor their low production of exports. However, one should notethat many of Java’s exports for domestic trade consist of lightermanufactured goods (as well as of cement, fertilizer, and otherheavy products), whereas most of the tonnage from the high-ex-porting provinces consists of heavy commodities such as oil andtimber.
Imports from interprovincial trade (averaged over the two-year period of 1981–1982) ranged from 14.4 tons per 100 pop-ulation in Nusatenggara to 574 tons in Kalimantan, withLampung and West Nusatenggara recording the lowest valuesfor individual provinces (8.0 and 8.7 tons, respectively) and EastKalimantan and Riau the highest (211.9 and 123.7 tons, respec-tively) (see Figure 4.18). Unlike the situation with imports fromoverseas, on a tonnage per-capita basis in interprovincial trade,Java imports far less than all the other island groups with theexception of Nusatenggara; but it still imports more than twiceas much as it exports (18.4 tons per 100 population comparedwith 7.8 tons), a ratio exceeded only by Nusatenggara’s 14.4and 4.3 figures.
There is more parity in interprovincial trade between ex-ports and imports on a tonnage basis, although Kalimantan andSumatra continue to export more than they import, unlike all
National Integration in Indonesia
133

the other island groups, where the reverse is true. The greatestcontrasts occur in Jakarta, South Sumatra, Bengkulu, Lampung,Bali, and East Nusatenggara, which import at least three and ahalf times more tonnage than they export.
An examination of interprovincial trading patterns indicateslimited commercial relationships and thus, one could argue,limited integration. In 1981 only Jakarta and East Java both im-ported and exported from every province in the country, whileseveral (notably Aceh, West Sumatra, Jambi, Bengkulu,Lampung, Central Kalimantan, Bali, and Central Sulawesi) hadsignificant trade (of more than 500 tons per year) with less thanhalf of the other provinces. 50
An interesting change from the situation in 1971 is the in-creased involvement in both international and interprovincialtrade of Maluku, Irian Jaya, and Southeast Sulawesi. Fromranking among the least integrated in this area, all three havemoved much closer to the national averages on most trade in-dices and actually exceed them in terms of domestic importsand on one of the export indices (interprovincial exports forSoutheast Sulawesi and Maluku, international exports for IrianJaya). Unlike these three provinces, West and EastNusatenggara remain at or close to the bottom on all of thetrade indices, demonstrating their less-developed and less-inte-grated status, with Central Kalimantan and Bengkulu recordingparticularly low figures on the import indices, which are morecritical than export indices for national integration. It is encour-aging to note the somewhat reduced dominance of Java in thetrading statistics, with a smaller percentage of imports flowinginto Java, and the fact that Sumatra and Kalimantan generallyimport more on a per-capita basis than Java does, a reversal ofthe situation in 1971.
Thus, overall Indonesia is moving toward greater inte-gration in this interaction dimension, although the situationamong the provinces remains noticeably uneven.
The Interaction Dimension
134

Figure 4.17. Interprovincial exports: cargoes loaded in tons per 100population, 1982. Calculated from data in Table 1 in Biro Pusat Sta-tistik, Statistik Bongkar Muat Barang di Pelabuhan Indonesia 1982.
Figure 4.18. Interprovincial imports: cargoes unloaded in tons per 100population, 1981–1982 (average). Calculated from data in TableVIII.4.3 in Biro Pusat Statistik, Statistik Indonesia 1982 (1981figures); and Table 1 in Biro Pusat Statistik, Statistik Bongkar MuatBarang di Pelabuhan Indonesia 1982 (1982 figures).
National Integration in Indonesia
135

5The Economic Dimension
ECONOMIC integration, both structurally and spatially, is ofcrucial importance to any country’s national cohesion and po-litical stability. In numerous developing countries (and in somedeveloped ones as well) regional dissatisfaction stems from theperception of economic inequalities. This was a major under-lying cause of the civil war in Sudan, and it had a definiterole in the breakup of Pakistan into Pakistan and Bangladesh.Within Indonesia, too, several of the regional rebellions experi-enced since independence have had economic grievances attheir root. Marked economic disparities are particularly disin-tegrative when exceptionally rich (or sometimes, poor) regionsare peripherally located or economically independent of the restof the country.
One of the major problems of economic development(whether in industry or agriculture) is that development almostinevitably exacerbates economic disparities among both regionsand peoples because it takes place only in certain specific areas,rather than being spread evenly throughout an entire country.The tendency for the rich to get richer and the poor pooreris well documented in the economic development literature.But, as the Indonesian government has recognized since theearly 1970s, economic growth has to be balanced with equity toattain national stability and integration.
For maximum economic integration, economic disparitiesamong different regions ideally should be minimal, especiallyin such aspects as standard of living and level of development.Also, existing economic disparities should be in the process ofdiminishing as all areas of the country participate in and benefitfrom development. In addition, there should be increasing eco-nomic interdependence among the different regions of thecountry.
136

However, analysis of a large number of economic indicatorsavailable at the provincial level in Indonesia in the early 1980sreveals that, despite considerable economic development par-ticularly since the early 1970s, Indonesia is still not very wellintegrated economically.
HISTORICAL BACKGROUNDSome level of economic disparity within a nation-state is un-avoidable because of the inevitably uneven natural resourcebase and because of differences in human response to variedopportunities. Thus, differences in the environment, such as intopography, climate, soil quality, and the availability of water,and also in the location and accessibility of minerals and energysources, such as petroleum or coal, create basic inequalitiesin the potential for development. Similarly, many differencesin the human environment—population distribution, historicaldevelopment, cultural values and openness to change, varyinglevels of skills and entrepreneurship, and efficiency of resourceuse and organization—contribute to unequal rates of economicgrowth.
At early stages of development it is normal for differencesto be exacerbated and disparities increased among the diverseregions within a state. 1 The colonial history of Indonesia wellexemplifies such polarized development. The Dutch took ad-vantage of the potential of the Javanese environment, its fertilesoils, moderate climate, and accessible location, to concentratetheir exploitative and developmental efforts there. A typicalcore-periphery situation developed between Java and the OuterIslands and lasted at least until the end of the nineteenth cen-tury. Java completely dominated the economic scene, producingmost of the exports of the country and experiencing markeddevelopment of its infrastructure. By contrast, the Outer Is-lands, apart from some mining operations and plantations andcertain privileged areas, were generally neglected and indiffer-ently treated.
In the early twentieth century, however, an interesting in-version of this core-periphery situation began to develop. Thishas been attributed partly to the world economic situation,where sugar prices dropped so dramatically. As a consequence,Indonesia shifted from dependence upon sugar as a majorexport crop (which had been grown almost entirely on Java)to rubber and coffee (which came from the Outer Islands, par-
National Integration in Indonesia
137

ticularly Sumatra). Indeed, in the first quarter of the twen-tieth century Java produced three-quarters of the value of In-donesia’s agricultural exports, but soon thereafter became anabsorber rather than an earner of foreign exchange. 2 But thisinversion resulted also from changes brought about directly byDutch colonialism. The Dutch influence upon Java, which in-cluded development of the infrastructure and transportationand communications links, unequal urban growth, education,and health measures, led to a population increase with whichproductivity failed to keep pace. Thus, in spite of continuedimprovements in crop production in Java, standards of livinghave remained static or even declined during the twentiethcentury. In the Outer Islands, by contrast, increasing produc-tivity outstripped population growth, and the economic dy-namism and growth impetus generally associated with the corewas transferred to selected areas of the Outer Islands, notablythe plantation areas of North and East Sumatra, and suchDutch-favored areas as North Sulawesi and parts of Maluku(particularly Ambon).
The 1930s witnessed an increase in the economic inte-gration of Indonesia, with a viable pattern of regional spe-cialization and trade emerging. Java concentrated upon food(especially rice) production and domestic industrialization, pro-viding manufactured goods for shipment to the Outer Islands inexchange for primary products produced there. 3 But this trendwas abruptly halted and reversed by the Japanese occupationand the subsequent struggle for independence.
Independent Indonesia, therefore, inherited a badlydamaged economy, partly because of war damage inflicted bythe Japanese and the returning Dutch and partly because ofIndonesia’s own scorched-earth policy during its struggle forindependence between 1945 and 1949. The dualistic colonialstructure of export-oriented, foreign-dominated enterprises inthe modern sector and peasant agriculture in the traditionalsector reasserted itself in the parliamentary democracy periodof 1950–1957. There was, however, a slow but steady rate ofeconomic growth and reasonable progress in restoring anexport economy, which occurred to a large extent independentlyof any central government action. 4 The subsequent period ofGuided Economy, with its “sosialisme à la Indonesia,” which fol-lowed the nationalization of all Dutch businesses in 1957–1958,was marked by aimlessness, accelerating hyper-inflation, andserious balance-of-payments deficits. These contributed to a
The Economic Dimension
138
growing gap between rich and poor, as well as to a decrease ininvestment and the lack of development of a firm economic basefor the future.
Since independence, Indonesia’s economic development hasdemonstrated the power of circular and cumulative causation:5 a better-developed physical and institutional infrastructure,a ready labor force, and a large local market, as well as im-portant political factors (of political control and local politicalpressures) all combined to perpetuate and accentuate the his-toric domination of Java over the rest of Indonesia. 6 By far thegreatest share of all investment and development (except forpurely exploitative mining, timber extraction, and some plan-tation agriculture) has been located there. Sukarno’s lack of at-tention to the economic dimension of national integration andthe imbalance he inherited in the country’s economy, by whichthe Outer Islands generated over 80 percent of Indonesia’sgross domestic product but received less than 20 percent inreturn, were primary causes of the regional unrest that led to anumber of rebellions in the 1950s and early 1960s.
It was not until 1967, after the abortive coup and the be-ginning of the New Order government of Suharto with its em-phasis on stability and fiscal balance, that any real attemptswere made at systematic economic planning and development.But by then problems of uneven development inherited from thecolonial past and the early period of independence had been ex-acerbated and become more entrenched. Stagnation in overallproduction had been matched by lack of progress in struc-tural transformation: in other words, there had been lack ofboth growth and development. Surplus rural populations werenot being absorbed by a growing industrial sector as in manycountries; rather, they were either absorbed by the agriculturalsector in a process of involution, 7 or they entered the servicesector or trade. Indeed, the numbers employed in manufac-turing declined absolutely in the 1931–1961 time period and de-clined further in the growing urban areas of Indonesia between1961 and 1971. 8 Problems were further compounded by thegreat increase in population, 9 which wiped out any incrementalgains in productivity that had occurred. It has been estimatedthat per-capita income in Java in 1969 was probably no higherin real terms than it had been thirty years previously. 10
As a result, by the early 1970s Indonesia’s economic situ-ation was highly unbalanced, both in terms of infrastructuraldevelopment, which was highly concentrated in Java, and in
National Integration in Indonesia
139

terms of revenue production, per-capita income, and standardof living, which were highest in certain areas of the Outer Is-lands, particularly in parts of Sumatra and Kalimantan.
The contrast between Java and the Outer Islands can beseen also in agriculture. Overall, only about 9 percent of In-donesia’s land area is cultivated, but this figure ranges widelyfrom region to region. Despite having less than 7 percent ofthe country’s total land area, Java reportedly accounts for 75percent of Indonesia’s corn production, 80 percent of itscassava, 90 percent of its soybeans, 50 percent of its rice, andall of its sugar. Seventy percent of Java is cultivated year round,a figure that contrasts dramatically with the 4 to 6 percent ofthe total land area in the Outer Islands used for agriculture atthe beginning of the 1980s. A similar contrast exists in the pro-vision of irrigation services: over 40 percent of Java’s sawahland is irrigated by modern facilities, whereas most of the landin the Outer Islands is in ladang (dry field) or swidden culti-vation. 11
Since 1967 the Indonesian economy has undergone pro-found change and experienced remarkable growth. This hasbeen partly because of the New Order government’s emphasison political stability and economic development, which has pro-moted domestic economic growth and attracted billions ofdollars of foreign investment. 12 It is also partly the result ofloans (at both concessional and market rates) from internationalfinancial institutions, especially the World Bank, 13 and billionsof dollars in aid and loans from the Inter-Governmental Groupon Indonesia. 14
The New Order government focused first (in its first Five-Year Development Plan, Repelita I, 1969–1974) upon stabilizing,rehabilitating, and developing the overall national economy,with little attention paid to regional economic differences. 15
The average annual rate of growth of the national gross do-mestic product (GDP) during those five years was 8.4 percent,thanks to major policy improvements (especially the control ofinflation); encouragement of private and foreign investment andaid; the beginning of the rehabilitation of the economy’s basicinfrastructure (especially in irrigation, power, transportation,and communications); progress in the extractive industries ofoil, natural gas, and timber; increased agricultural production(especially rice); and improved irrigation. 16 However, becausethese policies were pursued without great concern for theirimpact on different regions, many developments led to accen-tuated regional disparities.
The Economic Dimension
140

It was only with the formulation of the second Five-YearDevelopment Plan, Repelita II (1974–1979), that the balanceddevelopment of all regions became a primary objective: a mostimportant goal for the continued political as well as economicintegration of the nation. 17 In addition, Repelita II aimed at in-creasing the standard of living of the Indonesian people. Specif-ically, it sought to provide better food, clothing, and housing;to improve and expand infrastructure; to expand and distrib-ute social welfare benefits equitably; and to provide greateremployment opportunities. Real GDP rose at an average annualrate of 6.8 percent (4.7 percent for real per-capita GDP). 18
But neglect of balanced regional economic development in thepast had led to increasing economic disparities among the re-gions and made the task of achieving regionally balanced devel-opment much more difficult.
The third Five-Year Development Plan, Repelita III(1979–1984), continued to stress regional development byplacing the equitable distribution of development gains at thehead of its trilogy of development goals (equity, economicgrowth, and national stability). In the agricultural sector it em-phasized integrated rural development, and in the industrialsector it focused on the establishment of industries that createemployment opportunities or that fulfill basic domestic needs.19
The fourth Five-Year Development Plan, Repelita IV(1984–1989), continues to place more emphasis on equity in thesame trilogy of development goals, although it wants to ensurethat all three elements are in constant harmony and mutuallyreinforcing. 20 Like its predecessors, its overriding goal is to“raise the standards of living, intellectual abilities, and generalwelfare of the people.” However, plans are easier to formulatethan to implement, and regional inequalities inevitably persistand in some respects seem to be widening.
In the subsequent discussion of regional inequalities, trendsin regional economic disparities, and analysis of economic inte-gration, one needs to be aware of limitations in the reliabilityof the statistical data. First, there is always the possibility thatdata have been gathered inaccurately or distorted. In addition,because the provinces vary so tremendously in size both areallyand demographically, data are generally given in per-capitaterms. This has the advantage of stressing the comparability ofdata from the vastly diverse provinces, but removes the elementof size differentials from view. Finally, averaged figures for eachprovince camouflage important intraprovincial differences, be-
National Integration in Indonesia
141

cause many of the key economic activities form modern,foreign-oriented enclaves, especially in the Outer Islands, withrelatively few spread or backwash effects on the provincialeconomies. Data for this chapter are tabulated in Appendix 3.
REGIONAL INEQUALITIESThe magnitude of economic disparities among regions providessome indication of the degree of economic integration of anation-state, because in a highly integrated economy, disparitiesamong regions are relatively small. Through the migration ofthe factors of production, particularly capital and labor, largedifferences are evened out in an integrated economic system; ina less integrated economy, substantial differences in such fea-tures as per-capita regional GDP, commodity prices, and costof living are to be expected. Living standards, as measured byownership of certain household items and access to electricityand to fuel other than firewood for cooking, also reveal patternsof unequal economic development. And finally, taxation datagive an indication of regional differences, providing importantinformation as to both the source of national and provincialincome and the location of taxation revenue expenditures.
Perhaps the most comprehensive index of regional in-equality in Indonesia is the regional gross domestic product(RGDP). 21 This ranged in 1980 from approximately 5,874 billionrupiahs (Rp) in East Java to Rp 129 billion in Bengkulu.However, because this is partly a function of differences in thesize of provincial populations, a more meaningful index is RGDPper capita. Here, too, enormous variations exist, with East Kali-mantan having a per-capita income (Rp 2,846,290 per annum)more than twenty-seven times that of East Nusatenggara (Rp104,250). 22 These figures may be misleading, however, becausethey include royalties generated from oil, natural gas, and othermineral production that accrue directly to the national gov-ernment; and it can be argued that, as enclaval activities, theyhave relatively little impact on the overall welfare of theprovince in which they are located. But even when the pe-troleum and mining sectors are excluded from those fiveprovinces where they have such a significant impact on theprovincial RGDP (East Kalimantan, Riau, Irian Jaya, Aceh, andto a lesser extent South Sumatra), per-capita RGDP differencesvary by a factor of eight (from Rp 846,590 in East Kalimantan toRp 104,250 in East Nusatenggara) (see Figure 5.1). Table 5.1,
The Economic Dimension
142

which gives the relative importance of mining and agriculture inthe composition of the regional gross domestic product of eachprovince, demonstrates clearly those provinces with substantialmineral deposits (including petroleum, natural gas, and hardminerals). Riau produced more than twice as much in the valueof its petroleum products in 1979 as any other province, andmining accounted for 84.4 percent of its RGDP. 23 In addition, itexports logs, plywood, other timber products, bauxite, palm oil,and rubber.
East Kalimantan also depends heavily (for 62.8 percent ofits RGDP) on its petroleum and especially in recent years onits liquified natural gas (LNG) production (from the BontangLNG plant). But in addition it has major timber resources andthe largest capacity in Indonesia for producing plywood (which,together with other wood products, is Indonesia’s third mostvaluable export, after oil and natural gas). 24 Aceh’s productionof liquified natural gas (from its Arun field) has risen sharplyover the past fifteen years and helps to account for the high 61.1percent of its RGDP produced by mining. Irian Jaya likewise de-pends for over half of its RGDP on mining (including petroleum,natural gas, copper, and gold and silver from copper concen-trate).
South and North Sumatra derive a considerable amount ofrevenue from their mining activities, although these make upa much smaller percentage of their RGDPs. Both produce oiland natural gas, and South Sumatra has substantial coal pro-duction as well as tin (making Indonesia the second largest pro-ducer of tin in the world). 25 However, both North and SouthSumatra have more developed and diversified economies, withsubstantial rubber and palm oil plantations, plywood pro-duction, and food, wood, chemicals, and metal-goods pro-cessing. 26
By contrast, five provinces depended on agriculture for over50 percent of their RGDP in 1979, and a further eight for over40 percent. It is significant that the provinces most highly de-pendent upon agriculture have the lowest per-capita RGDPs inIndonesia (for example, East and West Nusatenggara, CentralSulawesi, and Bengkulu). Also among the poorest provinces interms of per-capita RGDP are the densely populated provincesof Central Java and Yogyakarta.
Price disparities among the provinces are inevitable becauseof such factors as differences in location and consequently dif-ferent transportation costs, in local conditions of supply anddemand, and in the concentration of private investment or gov-
National Integration in Indonesia
143

Table 5.1. Relative importance of mining and agriculture ineach province’s regional gross domestic product (RGDP), 1979(amounts given in constant 1975 market prices)
Province Amountproducedby miningin 1,000million
rupiahsa
Percentageof theRGDP
producedby miningb
Amountproduced
byagriculture
in 1,000million
rupiahsa
Percentageof the RGDP
producedby
agricultureb
Aceh 310.7 61.1 115.9 22.8
North Sumatra 150.9 15.0 373.3 37.0
West Sumatra 0.6 0.2 92.9 37.0
Riau
(with petroleum) 1,409.4 84.4 61.0 3.7
(withoutpetroleum)
14.2 6.7 61.0 28.8
Jambi 5.8 4.5 64.9
South Sumatra
(with petroleum) 134.0 17.7 148.0 19.5
(withoutpetroleum)
35.0 5.8 148.0 24.6
Bengkulu 0.5 1.0 23.9 46.0
Lampung 0.5 0.2 140.9 45.0
The Economic Dimension
144

Jakarta — — 26.4 1.7
West Java 218.4 9.4 704.3 30.4
Central Java 5.2 0.3 598.3 39.4
Yogyakarta 0.5 0.3 63.7 36.7
East Java 6.6 0.3 868.2 36.3
West Kalimantan 0.5 0.2 98.6 42.9
Central Kalimantan 0.4 0.3 49.7 46.6
South Kalimantan 0.6 0.3 76.9 38.0
East Kalimantan
(with petroleum) 654.0 62.8 85.7 8.2
(withoutpetroleum)
6.1 1.7 85.7 24.0
North Sulawesi 2.2 1.1 82.9 40.6
Central Sulawesi 0.6 0.8 43.8 53.4
South Sulawesi 3.3 0.6 254.2 50.3
Southeast Sulawesi 8.8 15.1 23.8 41.0
Bali 1.5 0.6 99.3 42.2
West Nusatenggara 3.9 3.0 68.6 52.0
National Integration in Indonesia
145

East Nusatenggara 0.2 0.2 84.3 63.8
East Timor n.a. n.a. n.a. n.a.
Maluku 10.6 7.6 68.4 48.7
Irian Jaya
(with mining) 142.4 52.9 67.8 25.2
(without mining) 0.4 0.3 67.8 53.4
n.a.: not availableaBiro Pusat Statistik, Pendapatan Regional Propinsi-propinsi diIndonesia 1976–80, Table II.A.9.bIbid., Table II.B.9.
Figure 5.1 Regional gross domestic product per capita in thousands ofrupiahs per capita, at current market prices, without oil, 1980. Basedon data in Table X.9 in Biro Pusat Statistik, Statistik Indonesia 1983,Buku Saku.
ernment expenditure. In addition, governmental interventionthrough taxation or trade restrictions has affected prices incertain areas. Yet price disparities, based on the consumer
The Economic Dimension
146

price index for food, clothing, housing, and miscellaneous andgeneral merchandise in the capital cities of each province in1981 (the only data available), are not great. The consumerprice index ranges from a low of 151.6 in Maluku to a highof 193.9 in South Sumatra (see Figure 5.2). No clear patternsemerge. Overall, prices are highest in South Sumatra andJambi, East Java, South Kalimantan, and North Sulawesi; andare lowest in Maluku, East and West Kalimantan, Irian Jaya,Jakarta, and South Sulawesi. It appears that higher prices forsome items are counterbalanced by lower prices for others.
However, when the retail price of rice in the provincialcapital cities is examined, the disparities are considerablywider. The lowest prices are found in Jakarta, East Java, andYogyakarta, prices that are over 60 percent lower than thosefound in Riau, East Nusatenggara, and Lampung.
Certainly, in comparison with conditions in the early 1970s,price disparities seem to have been significantly reduced. In1972 the price index for East Kalimantan was almost doublethat for West Nusatenggara. 27 Then, higher prices generallycorresponded to increasing distance from Java, or to the higherincomes in those provinces with oil, timber, and significantindustrial activity. The higher prices in low-income provinceswere of particular concern, especially when those provincesoccupied geographically peripheral positions in the country,where costs could have been reduced by more direct tradewith closer neighboring countries (such as North Sulawesi withthe Philippines and Aceh with Malaysia). But the patterns pre-vailing in the early 1970s seem to have changed substantially,according to data available for the early 1980s.
Contrasts among the provinces are also exemplified in thedata on the incidence of poverty and deprivation. Despite anaverage annual rate of economic growth of 7.3 percent duringthe 1970s and a decline in the incidence of poverty from a highof 57 percent in 1970, it is estimated that in 1980 approxi-mately 39 percent of Indonesia’s population (some 56,650,000people) still lived below the poverty line (an index constructedfrom per-capita food expenditures). 28 These proportions varydramatically from province to province (see Figure 5.3). IrianJaya, Jambi, and West Kalimantan record the lowest incidenceof poverty (less than 10 percent of their respective populations),but three of the Javanese provinces (Centred and East Javaand Yogyakarta) as well as East and West Nusatenggara haveover 50 percent of their populations living in poverty (withSoutheast Sulawesi close at 49 percent). Compared with Java
National Integration in Indonesia
147

Figure 5.2 Consumer price index in the capital city of each province,Average of food, housing, clothing, miscellaneous, and general mer-chandise, 1981. Calculated from data in Table VIII.4.4 in Biro PusatStatistik, Statistik Indonesia 1983, Buku Saku.
and the eastern islands (Bali, the Nusatenggaras, Maluku, andIrian Jaya), with 46.5 and 46.7 percent of their populations inpoverty, Kalimantan and Sumatra appear prosperous (with low11.5 and 20.4 percent figures), while Sulawesi matches the na-tional average (39.3 percent).
However, an index of deprivation (defined as the proportionof people whose food needs are not satisfied) reveals asomewhat different picture: Java, despite its high level ofpoverty, appears as the island with the lowest incidence ofdeprivation (0.7 percent), compared with Kalimantan (2.6percent), Sulawesi (3.6 percent), Sumatra (3.7 percent), and theeastern islands (with a disturbing 26.1 percent figure). 29 Thislow deprivation figure for Java reflects the impact of a wideseries of government social welfare programs in the 1970s,which have brought at least some improvement in living stan-dards throughout rural Java. Contrasts among individualprovinces are much greater, ranging from a low of 0.3 percentin West Java (and less than 1 percent in Central and East Java,Jakarta, and North Sulawesi) to an amazing high of 44.4 percentin East Nusatenggara (and relatively high figures of 20.9 and20.6 percent in West Nusatenggara and Bali, respectively, and13.5 percent in Maluku) (see Figure 5.4). 30
The Economic Dimension
148

Figure 5.3. Percentage of the population living below the poverty line(an index constructed from per-capita food expenditures), 1980.Based on data in Table 5 in the World Bank report, Indonesia: Se-lected Aspects of Spatial Development (used with permission).
The very high localized incidence of both poverty and depri-vation in East and West Nusatenggara, Bali, and Maluku under-scores the lack of true economic integration, for this and thehigh costs of transport impede the flow of food (as well as ofother commodities) there from food-surplus areas. 31
Standard of living can also be measured in other ways. Butdifferences in the size and condition of households and housingfrequently reveal more about the variety of cultural customs inthe country than they do about standard of living. Data on thenumber of rooms per household or persons per room cannotbe meaningfully compared when some people live in multiple-family longhouses (such as the Dyaks in Kalimantan) and othersin single-family dwellings (such as the typical Minahasan farmerin North Sulawesi). Different cultural values as well as the levelof urbanization may also affect the value placed upon such con-veniences as the availability of piped water, the type of toilet fa-cility, and the mechanism for garbage disposal.
However, several indices are available that give reasonablemeasures of provincial differences in living standards. These in-clude ownership of certain consumer items, the consumption ofelectricity, and the use of fuels other than wood or charcoal forcooking. Three measures are examined here: the percentage ofhouseholds owning a sideboard; the percentage of households
National Integration in Indonesia
149

Figure 5.4. Percentage of the population living in deprivation (definedas those whose food needs are not met), 1980. Based on data in Table5 in the World Bank report, Indonesia: Selected Aspects of Spatial De-velopment (used with permission).
using electricity for lighting; and the percentage of householdsusing kerosene, gas, or electricity for cooking. Some interestingpatterns emerge.
Ownership of a sideboard may be considered indicative ofa higher standard of living both because of the cost of pur-chasing (or making) one and because its main function is thestorage of other consumer items. Overall, 46 percent of house-holds in Indonesia reportedly own a sideboard. 32 The highestpercentage is recorded, as to be expected, in the most urbanprovince of Jakarta (69 percent), but surprisingly, South Kali-mantan ranks second (67 percent), with East Kalimantan third(62 percent). Other provinces with significantly above-averagefigures include North Sumatra, West Java, South and North Su-lawesi, and Central Kalimantan. By contrast, only 13 and 15percent of households in Irian Jaya and East Nusatenggara arerecorded as owning a sideboard, with other provinces such asWest Nusatenggara and Southeast Sulawesi also having propor-tions of less than 30 percent (see Figure 5.5).
Economic development levels are frequently measured byconsumption of electricity. It is instructive, therefore, to con-sider regional differences in electricity consumption. On av-erage, only 14 percent of Indonesia’s private households usedelectricity for lighting in 1980. As expected, there is a closecorrelation with urbanization, although this breaks down no-ticeably in the cases of Riau, Lampung, Central Java, Yo-
The Economic Dimension
150

Figure 5.5. Percentage of households owning a sideboard, 1980.Based on data in Table 66.3 in Biro Pusat Statistik, Sensus Penduduk1980, Series S, no. 2.
gyakarta, and Irian Jaya, where consumption of electricity isfar below the urban percentage of their populations (see Figure5.6). The greatest contrast is between Jakarta, with 47.8percent of its households recording the use of electricity forlighting, and East Nusatenggara, where only 4.3 percent ofhouseholds light their homes with electricity. Yet this is a signif-icant increase from the situation in 1971, when the range wasfrom 23.4 percent in Jakarta to 0.4 percent in Central Sulawesi.In 1980, the more developed provinces of Jakarta, East andSouth Kalimantan, North and South Sumatra, Riau, Bali, andNorth Sulawesi stand out in having above-average use of elec-tricity for lighting. By contrast, East and West Nusatenggara,Lampung, Central and Southeast Sulawesi, and Central Java arenoticeable for their lack of development in this respect.
Another index of differences in levels of development is thetype of fuel used for cooking. About 75 percent of all house-holds use wood or charcoal, but this proportion varies consid-erably among the provinces. Understandably, in the urbanizedprovince of Jakarta, wood is less available and kerosene, gas,or electricity provides the major source of fuel for a recorded96 percent of the population. But in other parts of Java, despitethe limited amount of firewood available and the increasingdistances families have to go to procure it (not to mentionsuch problems as resulting deforestation on steep slopes, soilerosion, and the choking of irrigation canals), there is a sur-prisingly high degree of dependence upon wood and charcoal
National Integration in Indonesia
151

Figure 5.6 Percentage of households using electricity for lighting,1980. Calculated from data in Table 63.3 in Biro Pusat Statistik,Sensus Penduduk 1980, Series S, no. 2.
for cooking. Less than 20 percent of the population in CentralJava and Yogyakarta and less than 25 percent in East Javause kerosene, gas, or electricity. However, percentages are farlower in most of the Outer Island provinces, especially those inthe less urbanized areas such as Nusatenggara, Central Kali-mantan, and Central and Southeast Sulawesi (see Figure 5.7).
Information about taxation and government expendituresprovides further indices of unequal regional resources and de-velopment. In 1982–1983, tax revenues made up about 27percent of the national budget (compared with 59 percent fromoil and gas production, 12 percent from foreign loans and otheraid, and 2 percent from non-tax revenues); but it is from thenational budget that most of the revenue used in the provincescomes. Central government funds are broken down into routineand development accounts.
Provincial governments obtain revenue for their programsfrom a variety of sources. Central government grants, whichaccount for a high and rising proportion of provincial govern-ments’ income (over 70 percent), include the Subsidi DaerahOtonomi (the SDO, autonomous region subsidy) and othergrants for routine expenditures, and grants for developmentmade through the various Inpres programs (Instruksi Presi denor presidential authorization). Second, the provinces are al-lowed by the central government to raise revenue from royaltieson such activities as gasoline sales, forestry, and mining. Third,provincial governments obtain revenue from provincial taxes,
The Economic Dimension
152

Figure 5.7. Percentage of households using kerosene, gas, or elec-tricity for cooking, 1980. Calculated from data in Table 63.3 in BiroPusat Statistik, Sensus Penduduk 1980, Series S, no. 2.
such as those on the ownership and transfer of motor vehiclesand on large houses. Many other local taxes and service chargesare also levied, but this income is primarily used at the kabu-paten (district) and kotamadya (city district) level.
In considering spatial inequalities in the generation and ex-penditure of revenue, three indices are particularly pertinent.The first is the amount of per-capita tax revenue generatedin the provinces. 33 This varies considerably, with East Kali-mantan and Jakarta raising far more than any of the otherprovinces (Rp 29,800 and Rp 20,600 per capita, respectively).The other provinces in Kalimantan as well as Central Sulawesi,Irian Jaya, Aceh, and Riau all generate above-average provincialtax revenues. Almost all are mineral-rich provinces. The prov-inces that raise least include both the less urbanized, less de-veloped provinces of the Nusatenggaras, Southeast Sulawesi,and Lampung, and the poor, overpopulated provinces of East,Central, and West Java and Yogyakarta (see Figure 5.8). As tobe expected, there is a strong correlation between per-capitaprovincially generated tax revenue and per-capita RGDP.
However, perhaps more important than local revenue gen-eration, from the perspective of regional satisfaction and na-tional integration, are regional government expenditures. Ob-viously these need to be related to some degree to provincialtax income to avert dissatisfaction in the richer, more economi-cally advanced, and thus potentially independent provinces; butthe considerable contrasts in per-capita regional expenditures,
National Integration in Indonesia
153

especially between Jakarta and West Java (Rp 24,100 and Rp6,800, respectively) or between East and West Kalimantan (Rp35,300 and Rp 12,000, respectively), can only be regarded asdisintegrative, particularly as improved interprovincial commu-nications bring more widespread awareness of such regionaldifferences. Expenditures do not seem to be related to anyminimum level of service or other gauge of equality. Indeed,central government grants that could help to even out the widedifferences in the amounts generated by non-grant revenuesinstead tend to reinforce them. Provinces with relatively highlocal resources in general receive higher routine and devel-opment grants from the central government than do provinceswith limited local resources. On a per-capita basis East Kali-mantan and Irian Jaya spend most (Rp 35,300 and Rp 33,300,respectively), with Central Kalimantan, Jakarta, and Central Su-lawesi ranking next with per-capita expenditures of over Rp20,000. By contrast, Lampung and the three major provinces ofJava have the lowest per-capita governmental expenditures (ofless than Rp 7,200) (see Figure 5.9).
A third interesting indicator of spatial inequities resultingfrom taxation is central government support for developmentprograms (see Figure 5.10). This has always varied consid-erably from province to province. 34 It seems that, once again,central government grants and transfers to the provinces inmost cases compound existing inequalities. Regional grants fre-quently seem to favor provinces with high per-capita incomes.East and Central Kalimantan, for example, receive more thannine times as much on a per-capita basis (Rp 20,800 and Rp16,900, respectively) as West and East Nusatenggara (Rp 1,790and Rp 1,850, respectively), but the contrasts with theprovinces in Java are greater still (East, West, and Central Javareceived only Rp 335, Rp 362, and Rp 386 per capita, respec-tively). Surprisingly, Jakarta received only a small per-capita al-location (Rp 818), although this is more than compensated forby locally generated tax revenues.
Not only did the per-capita rupiah amounts spent by thecentral government on development in the provinces in1980–1981 vary enormously (from Rp 8,250 in Central Javato Rp 52,800 in East Kalimantan), but the proportions of re-gional expenditures provided by the central and provincial gov-ernments varied considerably as well. In West Nusatenggaraand Bengkulu the provincial government contribution to devel-opment was just 1.2 percent, compared with an average of 10.4percent, and a high of 32.2 percent in East Kalimantan. It is
The Economic Dimension
154

Figure 5.8 Provincial tax contributions to the central government inthousands of rupiahs per capita, 1980–1981. Calculated from data inTable 1 in Biro Pusat Statistik, Statistik Keuangan Pemerintah Daerah,Daerah Tingkat I (Propinsi), 1975/76–1980/81.
Figure 5.9 Provincial government expenditures (operating and devel-opment) in thousands of rupiahs per capita, 1980–1981. Calculatedfrom data in Table VIII.1.5 in Biro Pusat Statistik, Statistik Indonesia1983 , Buku Saku.
surprising to note the relatively low provincial government con-tributions of some of the richer provinces such as Riau (6.8percent), Jambi (7.3 percent), and South Sumatra (9.2 percent).Total provincial expenditures on routine spending vary less on aper-capita basis (from Rp 7,030 in South Sumatra to the ratherexceptional Rp 27,200 in Irian Jaya), but the proportion con-tributed by the central government varies more, from a low of
National Integration in Indonesia
155

Figure 5.10. Central government support for provincial developmentprograms in thousands of rupiahs per capita, 1980–1981. Calculatedfrom data in Table 1 in Biro Pusat Statistik, Statistik Keuangan Pemer-intah Daerah, Daerah Tingkat I (Propinsi), 1975/76–1980/81.
40 percent in East Kalimantan to a high of 98 percent in IrianJaya (with an average of 80 percent). Thus, most provinces relyheavily, for 70–90 percent of their routine budgets, on centralgovernment subsidies.
Except for Jakarta and East Kalimantan, central governmentgrants form the major source of funds for provincial expendi-tures. But it is interesting to notice the significant correlationbetween per-capita non-grant income and per-capita Inpresgrants: the better-off provinces receive more, thus widening thegap between rich and poor.
However, it needs to be added that regional disparitiesmight be greater still were it not for the redistributing mech-anism of public finance. Most of the royalties obtained from oiland natural gas and from other minerals accrue to the centralgovernment and are derived mostly from the Outer Islands. Alarge proportion of this revenue is spent in Java, thus tendingtowards some measure of equalization of interregional incomedisparity at least on a per-capita basis. 35
TRENDS IN REGIONAL ECONOMIC DISPARITIESPerhaps even more important than analysis of the static con-ditions of regional economic inequality is an analysis of thetrends either reducing or exacerbating these differences. It has
The Economic Dimension
156

been argued that polarization is to be expected at early stagesof development as limited resources are concentrated in areasof greatest potential for national economic growth. 36 Indeed,virtually all ideologies and development theories agree in pre-dicting that in the process of a country’s transition to a moderneconomy, the overall distribution of income will become moreunequal and disparities will widen. 37 This is certainly what hashappened in Indonesia, both during the colonial period andafter. The evidence available suggests that income inequalityand regional disparities have continued to widen, despite the re-gional development and social justice emphases of the last threefive-year development plans. 38
Indices that demonstrate these trends of growing regionalinequality include comparative changes in regional income, dif-ferent regional economic growth rates, and changes in regionalallocations of new domestic and foreign investment. The growthof manufacturing industry in the country has also led to in-creased regional disparities.
As measured in absolute terms by per-capita RGDP, regionalinequalities have increased. Whereas in 1972 the gap betweenthe province with the lowest income (West Nusatenggara withRp 18,000 per capita) and that with the highest (East Kali-mantan with Rp 221,000) was Rp 203,000, by 1980 the incomedifferential had increased to Rp 742,340, with average per-capita RGDP of Rp 104,250 in East Nusatenggara and Rp846,590 in East Kalimantan, although one could argue that therelative gap had diminished. 39
Large differences have been recorded in the annual ratesof growth of the RGDP for the periods of both 1968–1972 and1976–1980. Between 1968 and 1972 these ranged from a neg-ative growth rate of 1.4 percent in North Sulawesi to a positiveannual growth rate of 24.9 percent in East Kalimantan. 40 The1976–1980 growth rates varied from 6.1 percent in Yogyakartato 31.4 percent in Aceh, a spread very similar to that recordedfor the years 1968–1972. In the past the richer provinces havegrown faster and the poorer regions more slowly, thereby in-creasing disparities, 41 but the 1980 figures exhibit no signif-icant correlation between RGDP per capita and growth rates.A spectacularly high growth rate took place only in Aceh (31.4percent), 42 although Bengkulu also grew fast (17.2 percent)and three other provinces (North Sulawesi and Central andSouth Kalimantan) grew at an average annual rate of 14 percentthrough the 1976–1980 time period (see Figure 5.11). Thegrowth rate in North Sulawesi is particularly significant (as-
National Integration in Indonesia
157

Figure 5.11. Average annual percentage growth rate of regional grossdomestic product at constant 1975 market prices, 1976–1980. Basedon data in Table 1.6 in Biro Pusat Statistik, Pendapatan RegionalPropinsi-propinsi di Indonesia 1976–80.
suming the data are accurate) because it was the only provincein the 1968–1972 period to record a negative growth rate, butboth South Kalimantan and Bengkulu also experienced greatimprovement over their earlier sluggish 1.8 percent and 2.3percent growth rates.
West Nusatenggara continued to experience a low averagerate of economic growth. Java also, with the exception only ofJakarta, grew at below-average rates, as did Lampung and, sur-prisingly, Riau and Jambi (all at less than 8.6 percent). It isencouraging, though, to note the new projects funded by theUnited Nations Development Program and World Bank for bothWest and East Nusatenggara, aimed at stimulating developmentand alleviating poverty in these two poorest provinces of thecountry. 43
Indonesia’s provinces can be divided basically into fourmajor groups, as Table 5.2 illustrates. The first consists of thosewith relatively high per-capita RGDP (over Rp 210,000) andhigh RGDP growth rates (of 10 percent or more) in the1976–1980 period. This group includes Jakarta and East Kali-mantan, as would be expected, but also the petroleum (andnatural gas) and mining provinces of Aceh, South Sumatra, andIrian Jaya. Central Kalimantan and North Sulawesi are also inthis category. The second group also has high per-capita RGDPbut lower rates of growth; this group includes the petroleum-producing provinces of North Sumatra, Riau, and Jambi, as
The Economic Dimension
158

well as West Kalimantan and Maluku. Third are those poorerprovinces that have a per-capita RGDP of less than Rp 210,000but relatively high growth rates of 10 percent or more; intothis category fall three of the four provinces of Sulawesi and,surprisingly, East Nusatenggara, with its very low RGDP percapita but relatively high 11.7 percent growth rate. Bengkulu,Bali, and South Kalimantan are also in this category. The fourthgroup comprises the provinces that are both poor and slowgrowing: the four provinces of Java (outside of Jakarta),Lampung (which shares many of Java’s characteristics), WestSumatra, and almost lowest on both indices, WestNusatenggara.
The richer provinces all have high export/RGDP ratios. It isno coincidence that Sumatra and Kalimantan, with their signif-icant production of rubber, timber, coffee, oil, and gas and theirhigher dependence on exports, have maintained their leadingposition in RGDP per capita, compared with islands that havefewer resources and produce little for export on a per-capitabasis, such as Java, Bali, Nusatenggara, and to a lesser extentSulawesi. Yet the fact that most provinces depend very heavilyon only one or two export commodities makes them vulnerableto price fluctuations and resulting instability.
There have been significant structural changes in the sec-toral composition of the RGDP over the past decade. Everyregion has experienced a decline in the share of agricultureand an increase in the shares of manufacturing, construction,and commerce. But Sulawesi and the eastern islands still obtainalmost half their RGDP (48.0 and 48.7 percent, respectively)from agriculture and a very small proportion from manufac-turing (2.6 and 5.8 percent, respectively). They also lag farbehind in commercial development. Java, by contrast, derives16 percent of its RGDP from manufacturing and a high 30percent from commerce. Sumatra and Kalimantan depend moston mining (22 and 27 percent, respectively). But it is interestingto note that there is no significant correlation between eco-nomic growth rates and the proportion of the population em-ployed in agriculture, although there is a significant (thoughfairly low) negative correlation between per-capita RGDP andemployment in agriculture.
The sector of the economy that has seen the most growthsince 1966 is natural resource production. For example, pe-troleum and natural gas exports have multiplied almost fiftyfoldin dollar terms since the mid-1960s and by over twenty times inreal purchasing power. Moreover, natural resource-based com-
National Integration in Indonesia
159
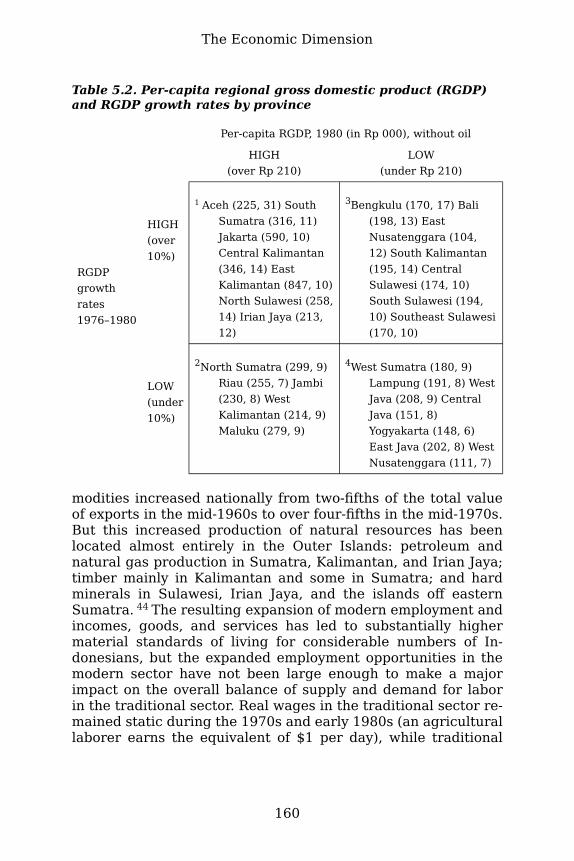
Table 5.2. Per-capita regional gross domestic product (RGDP)and RGDP growth rates by province
Per-capita RGDP, 1980 (in Rp 000), without oil
HIGH(over Rp 210)
LOW(under Rp 210)
HIGH(over10%)
1 Aceh (225, 31) SouthSumatra (316, 11)Jakarta (590, 10)Central Kalimantan(346, 14) EastKalimantan (847, 10)North Sulawesi (258,14) Irian Jaya (213,12)
3Bengkulu (170, 17) Bali(198, 13) EastNusatenggara (104,12) South Kalimantan(195, 14) CentralSulawesi (174, 10)South Sulawesi (194,10) Southeast Sulawesi(170, 10)
RGDPgrowthrates1976–1980
LOW(under10%)
2North Sumatra (299, 9)Riau (255, 7) Jambi(230, 8) WestKalimantan (214, 9)Maluku (279, 9)
4West Sumatra (180, 9)Lampung (191, 8) WestJava (208, 9) CentralJava (151, 8)Yogyakarta (148, 6)East Java (202, 8) WestNusatenggara (111, 7)
modities increased nationally from two-fifths of the total valueof exports in the mid-1960s to over four-fifths in the mid-1970s.But this increased production of natural resources has beenlocated almost entirely in the Outer Islands: petroleum andnatural gas production in Sumatra, Kalimantan, and Irian Jaya;timber mainly in Kalimantan and some in Sumatra; and hardminerals in Sulawesi, Irian Jaya, and the islands off easternSumatra. 44 The resulting expansion of modern employment andincomes, goods, and services has led to substantially highermaterial standards of living for considerable numbers of In-donesians, but the expanded employment opportunities in themodern sector have not been large enough to make a majorimpact on the overall balance of supply and demand for laborin the traditional sector. Real wages in the traditional sector re-mained static during the 1970s and early 1980s (an agriculturallaborer earns the equivalent of $1 per day), while traditional
The Economic Dimension
160

producers of cash crops for export received lower real incomesas a result of the resources boom. As a result there has been nooverall net gain for traditional producers. 45
Increasing disparities among provinces have occurred,partly because of differential rates of growth in sectors wherethere is a high degree of regional specialization. The greatestcontrast is between rapidly growing Jakarta (with its concen-tration of industry, services, and administration) and theresource-rich provinces on the one side, and on the other theslowly growing or stagnant provinces (such as WestNusatenggara), which are dependent largely upon agricultureand have little in the way of known mineral resources, manufac-turing, or other economic activities.
The regional allocation of new domestic and foreign in-vestment has also changed. Between 1967 and 1976 it tendedto confirm the pattern of unequal growth already discussed:71 percent of all investment project approvals were concen-trated in Java, with Jakarta and West Java receiving over 50percent of all investment projects in Indonesia (excluding oil).Expressed more dramatically, more investment projects werelocated in Jakarta alone (32 percent) than in the entire areaof Indonesia outside of Java (29 percent). 46 And if project ap-provals for agriculture and extractive industries (most of whichare enclaval investments) are excluded, the share of investmentapprovals for Jakarta rises to 60 percent for foreign-financedand 35 percent for domestic projects. 47 However, the situationhas changed somewhat since 1976, as the government has at-tempted to spread development more evenly: there has been arecent decline in the share of approvals for Java as more em-phasis has been placed on increased development in the OuterIslands. Cumulative investment-project approvals for Java be-tween 1968 and 1982 declined to 66 percent of the total forthe country. During the same time period Jakarta’s share ofinvestment projects fell to 25 percent and that of the areasoutside Java increased to 34 percent. 48
On a per-capita basis Java certainly absorbed less in foreigninvestment capital than Maluku and Irian Jaya, Sumatra, andKalimantan, although its domestic investment capital approxi-mated Sumatra’s amount (see Figure 5.12). With both foreignand domestic investment, Kalimantan and the Maluku and IrianJaya provinces received above-average amounts on a per-capitabasis, while Nusatenggara and Sulawesi received substantiallyless. As to be expected, contrasts among individual provincesare considerably larger. For foreign investment projects the per-
National Integration in Indonesia
161

Figure 5.12. Approved domestic investment projects, excluding theoil, insurance, and banking sectors, in thousands of rupiahs percapita, 1968–1982. Calculated from data in Table IV. 16b in Biro PusatStatistik, Indikator Ekonomi 1982.
Figure 5.13. Approved foreign investment projects in U.S. dollars percapita, 1967–1982. Calculated from data in Table 16d in Biro PusatStatistik, Indikator Ekonomi 1982.
capita figures range from highs of $323 and $234 in Aceh andIrian Jaya, respectively, to 73 cents and 98 cents, respectively,in West Nusatenggara and Yogyakarta (see Figure 5.13). 49 Con-trasts are almost as great for domestic investment, with EastKalimantan receiving Rp 615 and Jakarta Rp 395 per capitain comparison with East Nusatenggara’s Rp 4 and WestNusatenggara’s Rp 19 per capita. 50
The Economic Dimension
162
Industry in Indonesia has been slow to develop. Indeed, itwas not until 1967 with the beginning of economic planningunder the New Order that broad-based industrial growth reallybegan. But since then, manufacturing production has increasedenormously, making Indonesia the seventh largest producer ofmanufactured goods among developing countries (in terms ofshare of world manufacturing value added). Industrial growthaveraged an impressive 12.3 percent annual rate during the1970s, slowing down to 10.6 percent annually by the end ofthe decade as the easy stage of import substitution graduallycame to an end. Growth rates have been much lower since 1981because of the international recession and cuts in governmentexpenditures in response to the fall in oil revenues, althoughthe fourth Five-Year Development Plan assumes a 9.5 percentannual rate of growth in manufacturing for 1984–1989. 51 Man-ufacturing in 1984 grew by 24.4 percent, thanks to high growthrates in the liquified natural gas and oil refining subsectors,which grew at 53 and 30 percent, respectively. These two sub-sectors now account for more than half of manufacturing valueadded. The non-oil-and-gas component grew at only 4.7 percent.52 Manufacturing thus has the highest planned growth rate inRepelita IV. It is expected to be the leading growth sector and toplay a role in the creation of employment opportunities and theexpansion of non-oil exports.
Indonesia has greatly diversified the structure of its manu-facturing sector. Import substitution industries, including tex-tiles, electrical, and automobile assembly, dominated early de-velopment, to be joined later by electronics, cement, tires,chemicals, paper, and aluminum. There has been major growthin iron and steel, electrical machinery, transport equipment,rubber, wood, and fabricated metal products, but much slowergrowth in the traditional industries related to the agriculturalsector: food processing, beverages, tobacco, and textiles. Agradual shift from consumer goods has taken place in favorof intermediate and capital goods. However, it is significantthat the production of consumer goods in the traditional indus-tries is carried out mainly by private enterprises, whereas thenewer, more capital-intensive industries such as cement, fer-tilizer, automobiles, petrochemicals, and basic metal productsare primarily state-owned industrial enterprises, held either in-dependently or in joint ventures with foreign firms. 53
In terms of employment, in the early days cottage firmswere overwhelmingly important, even though added value perworker was estimated as forty times higher in medium and
National Integration in Indonesia
163

large firms. 54 In the mid-1970s 3.6 million people or 7 percentof the work force were employed in manufacturing activities,with large-and medium-sized firms (defined as those employingtwenty or more workers) accounting for one-fourth of thesejobs. By the beginning of the fourth Five-Year Development Planin 1984, the comparable figures were closer to five to six mil-lion or between 8 and 9 percent of the labor force. Employmentin large-and medium-scale manufacturing rose by an annual av-erage rate of only 7 percent during the 1970s, from 487,000 in1970 to 1,067,000 in 1982. 55 Yet this increase of 0.5 million jobsduring the decade corresponds to less than one-fourth of the av-erage annual increase in Indonesia’s labor force, and thus hasfailed to contribute significantly to the solution of Indonesia’semployment problems. Small-scale and household or cottageindustry, meanwhile, accounted for 80 percent of total manu-facturing employment in 1979. Growth in manufacturing em-ployment as a whole rose at an annual rate of only 5 percentduring the 1970s. But even if an annual 10-percent increase inemployment in industry could be attained, this would absorbonly a small proportion of the over 2.5 million added to the workforce each year.
Inevitably, spatial contrasts in industrialization are consid-erable, particularly those between Java and the Outer Islands.Indeed, at the beginning of the 1970s, 78 percent of all industryand 86 percent of total manufacturing employment were con-centrated in Java. 56 Java has substantially more workers (rel-ative to population size) in all three categories of firms—largeand medium, small, and cottage industries—than any of theOuter Islands. The greatest contrast, however, is in the largeand medium category, where in 1974–1975 Java had seventy-three manufacturing establishments per one million population,compared, for example, with only twenty-eight per million pop-ulation in Kalimantan. Indeed, the Outer Island provinces hadhardly any modern industry until very recently. 57 In mostprovinces just one or two agriculturally based industries dom-inated the industrial sector, such as rubber remilling andsawmilling in six of the eight provinces in Sumatra and in Kali-mantan, and vegetable oil production in Sulawesi. Only Java hadgreater diversity, with its traditional textile and tobacco indus-tries in the large-and medium-scale category, and bamboo andrattan weaving and coconut sugar production in the cottage in-dustry category. However, new, diverse, large industries have
The Economic Dimension
164

expanded rapidly within the past ten years, including steel, fer-tilizer, cement, crumb rubber, plywood, and paper manufacture(mostly in the state-owned sector).
Industries outside Java face more difficulties both in ob-taining inputs and in marketing, because of less reliable trans-portation services, high transportation operating costs, inad-equate port facilities and other infrastructure, and otherproblems with inefficiency, bureaucracy, and corruption.
But the regional disparities in per-capita income that mightbe expected because of this spatial imbalance in industrial lo-cation, as well as by the systematic income transfers from oiland other natural resources of the Outer Islands to Java, do notmaterialize, because of the large numbers of the poor in over-populated Java.
Despite the stated government goals of altering this regionalconcentration both by encouraging new industries to locate inrural areas and by providing incentives to invest in the OuterIslands, relatively little change in regional distribution of in-vestment has occurred so far. Jakarta and West Java remainparticularly favored provinces. The advantages of locating newfactories in already-established areas (and especially in or nearthe capital city) are common throughout developing countries:access to senior government officials to deal with complex bu-reaucratic problems, availability of better transportation andcommunications facilities and a major port, proximity to themain financial institutions and other industries, and the per-sonal preference of entrepreneurs for living in larger cities.
Industrial development, at least through the 1970s, has re-sulted in the broadening rather than the deepening of industrialstructure. Industries have expanded and grown more or less in-dependently rather than in a mutually reinforcing or integratingway. Interindustrial linkages in the past, both backward andforward, generally have not been strong. 58 However, recent de-velopment policies have focused on encouraging these linkages.
Although data are available only for interprovincial compar-isons, it can be argued that intraprovincial economic disparitiesmay be just as critical to political stability and thus to nationalintegration. It is frequently the highly visible contrasts betweenrich and poor, most obviously manifest in urban areas, thatprovoke most tension. Evidence from household expendituredata indicates that during the 1970s inequalities increased inurban Java, especially in Jakarta. 59 There is evidence to suggestthat the contrast between rich and poor has been increasing inrural areas also, as Green Revolution technology has benefited
National Integration in Indonesia
165

the wealthier farmers more than the poor, who cannot affordthe investments or the risks involved. A study on farm size, landuse, and the profitability of food crops in Indonesia in the early1980s found that the richest households earned fourteen timesas much as the poorest from the cultivation of food crops; afterallowing for the transfer of rents and crop shares, they earnedtwenty-four times as much. 60
In Java increasing fragmentation and decline in averagefarm size present major problems, as does the increase inlandless households. 61 But in contrast to many other developingcountries where tenant farming is more common, 75 percentof all farms are owner-operated. Changes in the structure andsocial organization of Javanese agriculture as it moves togreater use of high-yielding varieties of rice, however, are fun-damentally labor-displacing and lead to increased social andeconomic disparities. A greater central government presencewithin the rural sector has helped to enhance the position of themore privileged classes and likewise led to a widening gap be-tween rich and poor within the rural society. These findings areconsistent with the findings of other researchers who contendthat economic growth leads inevitably to a more unequal dis-tribution of wealth among social groups, and even to a signif-icant absolute decline in the economic and social position of thelowest income groups in developing countries. 62
ECONOMIC INTEGRATION AS DEPICTED BYSECTORAL AND REGIONAL ECONOMIC
INTERDEPENDENCEEconomic integration depends not only upon the factors alreadydiscussed, such as approximate equality in living standardsthroughout the country and a trend toward reduction of re-gional disparities, but also on the interdependence of thevarious parts of the national economy, both sectorally and re-gionally.
Regional specialization can be an indication of both devel-opment and national integration so long as it is accompaniedby interdependence among all the provinces, with each sup-plying the others with the specialized products of its regionand obtaining from the others its many and diverse needs. Forprovincial self-sufficiency is, by definition, the antithesis of eco-nomic integration. In Indonesia, however, instead of mutual in-terdependence there has grown up an autarkic core-periphery
The Economic Dimension
166

relationship, with Java supplying the manufactured goods formuch of the nation (supported by central government restric-tions on the Outer Islands’ ability to obtain similar economicgoods more easily and inexpensively from neighboring coun-tries) and drawing on the primary products of the Outer Islandprovinces. This has resulted in weak lateral links, as the earlieranalysis of trade links among the provinces of Indonesia hasdemonstrated (see chapter 4).
Regional specialization is only integrative when it is rein-forced by such integrating forces as the complementarity ofregional economies and good interregional trade facilities. Itthreatens national economic integration when one region’s spe-cialization is not integrated into the whole through the mech-anism of trade, when one province is economically independentof other parts of the country, or when it has more bilateral tradeor other linkages with other nations than it does with otherparts of its own national unit. Unfortunately, data are not availa-ble to compare the relative strength of extra-as opposed to in-tranational linkages, although it is possible that North Sumatra,for example, has stronger economic links with Singapore andMalaysia than it does with most other parts of Indonesia. Thedanger to national integration is obvious: such a region mayconsider it more economically advantageous to seek indepen-dence or to unite with its closer neighboring country than toremain within its historical national framework, particularlyif that neighboring state is more economically advanced thanother areas within the original nation-state.
The degree of regional specialization gives some indicationof the degree of concentration of economic activity and of thedegree of participation of the various provinces in the overallnational economy and their stages of economic development.As already discussed, data on the location of industry and em-ployment reveal a pattern of concentration of agriculture,mining, and extractive industry in the Outer Islands and of sec-ondary and tertiary industry in Java. But from the perspective ofemployment, few economic activities are overwhelmingly con-centrated. The most highly concentrated economic activities aremining and quarrying; the most widely distributed are agri-culture and community service.
However, the pattern of agricultural activity varies consid-erably, with certain provinces relying to a much greater extentthan others on agriculture. Bengkulu, West Kalimantan, EastNusatenggara, and Lampung all have over 75 percent of theirprovincial populations employed in agriculture (see Figure
National Integration in Indonesia
167

5.14). On average throughout the country, 56 percent of therecorded employed population in 1980 was involved in agri-culture, a figure that ranged from 48 percent in West Java andEast Kalimantan (excluding the 1.9 percent figure in Jakarta)to 80.4 percent in Bengkulu. 63 Java had the lowest populationpercentages employed in agriculture, with East Kalimantan,Bali, West Nusatenggara, and North Sulawesi the only otherprovinces with below-average employment in agriculture. Al-though agriculture’s share of the GDP was projected to drop (to26.4 percent in fiscal 1988–1989), agriculture was expected togrow by 3 percent annually and to continue to be the mainstayof Indonesia’s economy, employing (together with fishing andforestry) about 55 percent of the labor force. 64
Examination of the participation of each province in thenine major labor divisions (agriculture; mining and quarrying;manufacturing; electricity, gas, and water; construction; trade;transport and communications; financing and insurance; andcommunity services) shows the very low participation of certainprovinces in everything except agriculture and extractive in-dustries, the two economic activities most influenced by theenvironment. This is the situation particularly of some of theprovinces in the Outer Islands, such as Bengkulu, Lampung,West and Central Kalimantan, Central and Southeast Sulawesi,East Nusatenggara, and Maluku, indicating the low level oftheir economic integration. By contrast, all the provinces ofJava, together with those of South, West, and North Sumatra,Riau, Jambi, South and East Kalimantan, North and South Su-lawesi, and Bali have much greater involvement in all the na-tional economic sectors. 65
Serious questions arise over the integration of the In-donesian economy from a structural point of view, althoughthe situation has improved considerably in the past few yearswith the development of more forward and backward linkagesbetween the agricultural and nonagricultural sectors. 66 In thepast, agriculture has been undercapitalized, with governmentpolicies reflecting an urban bias in turning the terms of tradeagainst agriculture, while the urban-based industrializationstrategies have generated few linkages with the rural sector.Even now, one has to question the advisability of developing air-craft assembly and manufacturing, and the production of steel,oil tankers, patrol boats, and telecommunications equipment,which are both very costly and capital intensive, when thecountry badly needs more labor-absorbing industry. During the1970s the share of manufacturing output of consumer goods,
The Economic Dimension
168

Figure 5.14 Percentage of the labor force employed in agriculture,forestry, fishing, and hunting, 1980. Calculated from data in Table44.9 in Biro Pusat Statistik, Sensus Penduduk 1980, Series S, no. 2.
whose production techniques are generally more labor in-tensive and simpler, roughly halved, while that of intermediateand capital goods rose approximately threefold. 67
Unemployment and underemployment are major problems,claiming in 1983, according to Asian Business, a total of sev-enteen million people, with the figures swelled by a furthertwo million each year. 68 But the greatest problem, accordingto Arndt, is that of low productivity, for the great majorityof the poor work long hours for minimal returns. Indeed, hesuggests that emphasis should be placed on a productivity-oriented development strategy rather than an employment-ori-ented one, for modern technology is essential to attain thequality of products demanded in the export markets. 69 As heputs it, the crucial test of development performance is not em-ployment, but the rate of growth of income and the degree ofequity in its distribution.
Greater economic integration is hindered by a number offactors. One of the most influential is the high cost and difficultyof transportation within an archipelago consisting of over 6,000inhabited islands flung over a west-east distance of over 5,000kilometers. High port charges and high distribution costs be-cause of underdeveloped transportation facilities linking dockswith their hinterlands compound the problem. Traditionally,provincial customs duties were charged to provide vital revenuefor each province, but these served also to hinder the flow of in-terprovincial trade and were ultimately abolished. In addition,
National Integration in Indonesia
169

bureaucratic red tape, corruption, and poor provincial admin-istration and management have further limited economic inte-gration.
Yet compared to the old Federation of the West Indies or thepresent Caribbean Community, Caricom, Indonesia’s prospectsfor greater economic integration are bright. 70 There is moreregional specialization, standardization of telecommunicationsand transportation, and monetary integration within the In-donesian archipelago than there is among the members ofCaricom, which is the most similar geographically of all otherregional trading groups. Indonesia also has the advantages ofstrong, centralized political and administrative authority and acommon national language.
The pattern that emerges in Indonesia in the early 1980s,therefore, is one of significant economic disparities among theprovinces. These disparities are increasing in their magnitude,partly as a result of the normal power of circular and cumulativecausation, whereby initial locational advantages especially of in-frastructure are exploited first and become compounded, partlybecause of the growing centralization of power that has en-couraged centralization of economic activity, and partly becauseof policies concerned with reestablishing economic stability andpromoting rapid economic growth after the Sukarno era.However, there is current government commitment to spreaddevelopment and its benefits more evenly throughout thecountry and to increase economic interdependence among theregions, although this is limited partly by the high costs of trans-portation and partly by numerous administrative and bureau-cratic barriers.
The Economic Dimension
170
6Spatial Patterns
IN THE three previous chapters the various dimensions of inte-gration have been discussed and analyzed separately. Each di-mension has been shown to consist of a number of variableswith varying degrees of interrelationships, as a comparison ofthe various maps already presented clearly demonstrates. Inthis chapter, these interrelationships will now be consideredmore rigorously, through statistical analyses, to obtain a morecomplete, composite picture of national integration in In-donesia. Two types of analysis have been used: correlationanalysis, to consider the relationships between each pair of vari-ables; and factor analysis, to extract the common elements froma number of variables in each dimension of integration. The re-lationships among the factors thus extracted are also examined.Finally, factor scores for the provinces are analyzed and thespatial patterns of overall integration delineated.
The indices selected for inclusion in the statistical analysiswere the most significant and relevant ones for which completeand detailed data were available for the early 1980s. Obviouslythey are subject to certain limitations. They are aggregate data,a fact that masks important intra-provincial differences. Theyare also not completely accurate, but subject to the differentialhonesty and professionalism of the census takers and otherdata collectors, sorters, and editors, and to a certain amount ofpolitical manipulation (although in general Indonesian censusdata are regarded as remarkably accurate). Nor are the indiceschosen always ideal; for example, data on interprovincial move-ments of people would have been preferable to structural in-dices on road networks and vehicle numbers. But, given theseconstraints and caveats, one can still argue that the indicesselected do indeed have considerable validity, relevance, andreliability. The data point out serious disparities among the
171

provinces: certainly the government could have suppressed oraltered particularly embarrassing data to give a more rosypicture of Indonesia’s conditions had it so desired.
For the purposes of this analysis, moreover, all data werestandardized to accommodate the large differences in size ofboth area and population among the different provinces. 1 Formost of the sociocultural, interaction, and economic variables,the standardization was in terms of population (percent, per10,000, and so forth as appropriate) for each province, but fora few variables (such as road density) the standardization wasin terms of unit area. Such standardization, however, necessaryas it is for valid statistical comparison, also camouflages verybasic differences, particularly between Java and the Outer Is-lands, that are strikingly obvious to the observer; for the con-centration of infrastructure, the size and sophistication of urbancenters, and other signs of economic development in Java arediluted when averaged over the enormous population of Java(91.3 million in 1980). Logarithmic transformation of the datawas carried out on those variables that had one disproportion-ately high value, to avoid distortion of the mean and standarddeviation for that variable and increase the chances for linearrelationships between each pair of variables. 2
The correlation matrices for each dimension (using thePearson product-moment correlation coefficients) were scruti-nized to ascertain which indices were statistically significant.Indices with correlates of over 0.95 were judged to be mea-suring the same factor; the correlation matrix was thereforesimplified to include only one of the indices thus clusteringtogether. At the other end of the scale, indices that showedcorrelations of less than 0.50 with any other variable werelikewise excluded on the grounds of their confusing furtheranalysis with unnecessary noise.
In the factor analysis, the varimax orthogonal type of ro-tation was selected as being most valuable in this study becauseby this method of rotation the best fit vectors (factors) extractedare independent of one another.
Because of the large number of variables (over eighty wereconsidered) and the small number of provinces (twenty-fivewere included in the statistical analysis), it was impossible toachieve statistically valid results if the variables were all in-cluded in one factor analysis at the same time. 3 The three majordimensions of integration were therefore analyzed separately,and the common factors from each dimension were examinedsubsequently for their correlations. Factor scores were then ex-
Spatial Patterns
172

amined to ascertain the spatial patterns (of the degree of inte-gration obtaining in each province on each factor) so that theoverall patterns of integration of the different provinces into thenation-state of Indonesia could be determined.
Initial analysis of the three dimensions demonstrated thatthe inclusion of Jakarta distorted the results. Although eachprovince is unique in its combination of sociocultural, inter-action, and economic characteristics, Jakarta’s “uniqueness” isoverwhelming. This can be seen in most of the maps in theearlier chapters of the book. It is typified by Jakarta’s specialcharacter as an almost all-urban province in a country whoseaverage degree of urbanization is only 22.4 percent and as theprovince where economic and political power is concentrated.Jakarta almost consistently exhibited disproportionate indices.This confused the analysis by unduly affecting the size of themean and standard deviation for each variable and thus dis-torted the overall pattern for the other provinces. As a result,Jakarta was excluded from the statistical analysis. East Timorwas also omitted, because of its recent incorporation into In-donesia and the consequent lack of comparable data.
Only a proportion of the variation within the correlation ma-trices is accounted for by the factors extracted. This rangesfrom 76.3 percent for the interaction dimension, through 79.9percent for the economic, to 84.8 percent for the socioculturaldimension. This is to be expected, partly because not all thevariables that are relevant to the question of integration areavailable and partly because the variables selected are alsomeasures of forces other than integration. For each dimensionseveral computer runs were undertaken to obtain the matrixwith the most significant variables, where each variable had acommunality of above 0.49 and loaded specifically on one factor.This led at times to the exclusion of certain variables theoreti-cally considered relevant to the concept of national integration,such as the migration data.
Out of the wealth of information available in the socioculturaldimension of national integration, twelve key indices were se-lected for inclusion in the statistical analysis. These variablesand their Pearson product-moment correlation coefficients areshown in Table 6.1. Some interesting relationships emerge. Thelanguage variable measuring the percentage of the populationable to speak the Indonesian language correlates highly (0.74),as might be expected, with literacy rates, but surprisingly littlewith any of the education variables (0.20 with the percentage of
National Integration in Indonesia
173

the population ten years of age and over who have completedprimary school, 0.40 with the percentage who have completedsenior high school, and 0.22 with primary school participationrates). Likewise, the low correlation between literacy rates andthe education variables are unexpected (0.11 with primaryschool completion rates, 0.42 with secondary school completionrates); only with elementary school participation rates does lit-eracy correlate at a significant level of 0.68. 4 It was this last ed-ucation variable, therefore, that was chosen for inclusion in thestatistical analysis, both on the basis of its higher correlationwith literacy rates and on theoretical grounds that it best mea-sures basic educational opportunities among the provinces. 5 Itis interesting to note, however, that the correlations betweenlanguage and completion of primary school, and between lit-eracy and completion of primary school, were much higher in1971 (0.56 and 0.83, respectively) than in 1980. 6
Of the two religion variables considered, Islam correlatessignificantly (in a negative direction) only with Christianity,whereas Christianity (including both Protestantism andCatholicism) correlates both with the provision of hospital bedsand (negatively) with radio ownership. Among the various in-dices measuring participation in a cross-provincial, nationwideorganization (cooperatives, scouts, and membership in a socialorganization in the three months before a survey was takenin 1981), only cooperative membership correlates significantlywith any other variable, negatively with the presence of for-eigners claiming Asian citizenship. This latter variable, the per-centage of non-Indonesian-citizen Asians, correlates positivelywith viewers of Indonesian-made movies, while both these vari-ables correlate positively with television ownership and thepercentage urban. Both the Indonesian-movie viewing and tele-vision ownership indices also correlate strongly, as might be ex-pected, with a number of other nonsociocultural indices, partic-ularly those measuring economic development and communica-tions links.
These twelve variables were subjected to a principal compo-nents factor analysis with a varimax rotation, which condensedand ordered them into four orthogonal and thus statistically in-dependent factors. The first factor depicts the urban-and media-related characteristics of television ownership, the viewing ofIndonesian-made movies, radio ownership, and access to hos-pital facilities. The second factor depicts religion and the as-sociated variables of health-care facilities (as measured by theavailability of hospital beds) and, to a lesser extent, radio own-
Spatial Patterns
174

Table 6.1. Correlation matrix of selected sociocultural variables
Meanings of the variables selected and their sources:LANG (Language). Percentage of the population in 1980 able to
speak the Indonesian language. Source: Biro Pusat Statistik(B.P.S.), Sensus Penduduk 1980, Series S, Tables 8.3.
ISLAM (Adherents of Islam). Percentage of the population in1980 classified as Muslim in the 1980 census. Source:B.P.S., Statistik Indonesia 1982, Table IV.4.1.
CHRSTN (Christian). Percentage of the population in 1980 clas-sified as Christian (both Protestants and Catholics) in the1980 census. Source: B.P.S., Statistik Indonesia 1982, TableIV.4.1.
EDUCNP (Education participation). Percentage of seven totwelve year olds in school in 1980. Source: B.P.S., SensusPenduduk 1980, Series S, no. 2.
LITRCY (Literacy). Percentage of the population ten years of ageand over classified as literate in the 1980 census. Source:B.P.S., Sensus Penduduk 1980, Series S, no. 2, Table 18.3.
COOPMB (Cooperative membership). Number of members ofagricultural cooperatives per 100 population (average of1979 and 1980 figures). Source: B.P.S., Statistik Indonesia1983, Buku Saku, Table VIII.3.2.
ASIANS (Non-Indonesian Asian citizens). Number of foreignersclaiming Asian citizenship, 1981. Source: B.P.S., StatistikIndonesia 1982, Table III.1.11.
National Integration in Indonesia
175

INDFLM (Indonesian-film watchers). Number of people watchingan Indonesian-made movie in 1981 per 100 population.Source: B.P.S., Statistik Bioskop Indonesia 1981 dan 1982,Table 4.
RADIOW (Radio ownership). Percentage of households owning aradio, 1980. Source: B.P.S., Sensus Penduduk 1980, SeriesS, no. 2, Table 66.3.
HOSPBD (Availability of hospital beds). Number of hospital bedsper 10,000 population in 1980. Source: B.P.S., Statistik In-donesia 1982, Table IV.2.1.
TVOWNR (Television ownership). Percentage of householdsowning a television set, 1980. Source: B.P.S., Sensus Pen-duduk 1980, Series S, no. 2, Table 66.3.
URBAN (Urban population). Percentage of the population clas-sified as urban in the 1980 census. Source: B.P.S., SensusPenduduk 1980, Series S, Tables 1.
ership. It is interesting to note here the positive associationof radio ownership with Islam in contradistinction to the as-sociation of Christianity with health care (a reflection of pastChristian missionary activity). The third factor relates literacyto education and knowledge of the Indonesian language. Thefourth factor combines membership in a cooperative (a positiveintegrating measure) with the presence of non-Indonesian Asiancitizens (evaluated as a negative force). Cooperative mem-bership is also loosely linked to elementary school participationrates (see Table 6.2). Eigenvalues and the percentage of thevariance in each factor are given in Table 6.3, and communal-ities in Table 6.4.
The factor scores for these four factors reveal some im-portant spatial differences among the provinces, as Table 6.5demonstrates.
The first factor, dealing with urban-and media-related vari-ables, highlights the exceptional province of East Kalimantanwith its disproportionate scores, 7 but it also depicts clearlythe more urban provinces of North and South Sumatra, Riau,South Kalimantan, and Yogyakarta, all in the western part of thecountry (see Figure 6.1). Their more urbanized populations, asmight be expected, are more exposed to radio, television, and
Spatial Patterns
176

Indonesian-made films. The provinces with the lowest scores onthis factor are among the least urban and least developed: EastNusatenggara, Central and Southeast Sulawesi, and Lampung.
The second factor illustrates the contrasts associated withreligion and its related attributes (radio ownership with Islamand the provision of hospital beds with Christianity). The highlyChristian-influenced provinces of Irian Jaya and EastNusatenggara stand out with their extreme scores, and fairlyhigh scores are recorded for North Sulawesi, Maluku, andNorth Sumatra. In clear contrast are the highly Muslimprovinces in the rest of Sumatra, all of Java, and southern Su-lawesi, as well as South Kalimantan and West Nusatenggara(see Figure 6.2).
The third factor deals with the important integrative char-acteristics of literacy, knowledge of the Indonesian language,and education. It clearly depicts the most highly developedprovinces in this aspect: North Sulawesi, Maluku, and NorthSumatra (where former Christian missionary activity con-tributed much). However, not all predominantly Christianprovinces or provinces with a notable Christian presence ben-efited equally, as the very high negative scores for Irian Jayaand West Kalimantan demonstrate. Similarly, the relatively highscores of Central Sulawesi and particularly West Sumatracannot be attributed to a Christian presence (Central Sulawesi’spopulation is only 21 percent Christian, and that of WestSumatra is just 1.6 percent Christian). Yet the difference is verystriking in the two least-developed provinces of West and EastNusatenggara, where West Nusatenggara’s last place and highnegative score (and 0.4 percent Christian population) contrastswith East Nusatenggara’s more modest negative score (and its91 percent Christian population) (see Figure 6.3).
The fourth factor links the integrative variable of mem-bership in cooperatives with the disintegrative variable of thepresence of non-Indonesian-citizen Asians. It shows the moreintegrated provinces on this characteristic, Yogyakarta, NorthSulawesi, West Nusatenggara, Bali, and East Java, standing insharp contrast to three provinces that have disproportionatenumbers of non-Indonesian-citizen Asians (and low cooperativemembership), West Sumatra, Riau, and Jambi (see Figure 6.4).
The sociocultural dimension thus consists of four very dif-ferent strands, each with its own spatial patterns. Only EastNusatenggara has negative scores on all four factors, 8 whileWest Kalimantan, Central and Southeast Sulawesi, Maluku, andIrian Jaya have negative scores on three of the four factors.
National Integration in Indonesia
177

Table 6.2. Rotated factor loadings in the socioculturaldimension
Variable Factor 1 Factor 2 Factor 3 Factor 4
LANG 0.22 -0.31 0.76 0.40
ISLAM 0.10 0.86 0.10 -0.01
CHRSTN -0.12 -0.95 -0.04 0.16
EDUCNP 0.03 0.27 0.75 -0.53
LITRCY 0.09 0.13 0.96 0.09
COOPMB -0.14 0.05 -0.15 -0.86
ASIANS 0.53 0.01 -0.05 0.69
INDFLM 0.72 0.09 0.12 0.39
RADIOW 0.56 0.49 0.41 0.16
HOSPBD 0.65 -0.64 0.25 -0.15
TVOWNR 0.87 0.21 0.31 0.24
URBAN 0.93 0.01 -0.07 0.07
Note: Underlined numbers indicate the variables that have themost significant loadings on each factor; dashed lines indicatethose variables contributing somewhat less.
Statistical analysis of the interaction dimension of nationalintegration is particularly difficult because of the different land-sea orientation of different parts of archipelagic Indonesia.Some provinces consist predominantly of land areas on oneof the major islands of Sumatra, Java, and Kalimantan, whereoverland or river transportation is most important; otherprovinces are made up of a number of smaller islands, wherecoastal shipping is of greater significance. A further problemis that the same index may have widely differing implicationsin different areas: for example, the railroad in Java links the
Spatial Patterns
178

Table 6.3. Eigenvalues and percentages of thevariance in the sociocultural dimension
Factor Eigenvalue Percentage ofthe variance
Cumulativepercentage
1 4.40 36.7 36.7
2 2.67 22.2 58.9
3 1.91 15.9 74.8
4 1.20 10.0 84.8
different provinces, whereas in Sumatra the three sections ofrailroad are unconnected and thus serve predominantly local,not interprovincial, transportation needs. A further difficultyarises over standardizing for both the area and the populationof each province.
However, out of all the variables pertaining to the inter-action dimension, nine key variables (which correlated with atleast one other significant variable and for which there wererelatively accurate and detailed data) were selected for the sta-tistical analysis. It is interesting to note that theoretically im-portant indices of interaction, such as newspaper circulationand population mobility (including migration data), had to beexcluded because of their lack of significant correlation withany other interaction variables. The variables selected and theirPearson product-moment correlation coefficients are shown inTable 6.6. When subjected to a factor analysis with a varimaxrotation, these were condensed and ordered into a dichotomousfactor structure (see Table 6.7).
Interpretation of the factors is difficult. The first factor con-sists of loadings from variables associated with greater urban-ization and higher per-capita economic development: telephoneand vehicle ownership, passengers using air transportation,and the two trade variables measuring interisland and interna-tional imports. The second factor has two poles, one relatingsea transportation and telegram use, the other reflecting highroad density (which is associated with high population density).These two factors account for 76.3 percent of the variation inthe matrix. Eigenvalues and percentages of the variance in each
National Integration in Indonesia
179
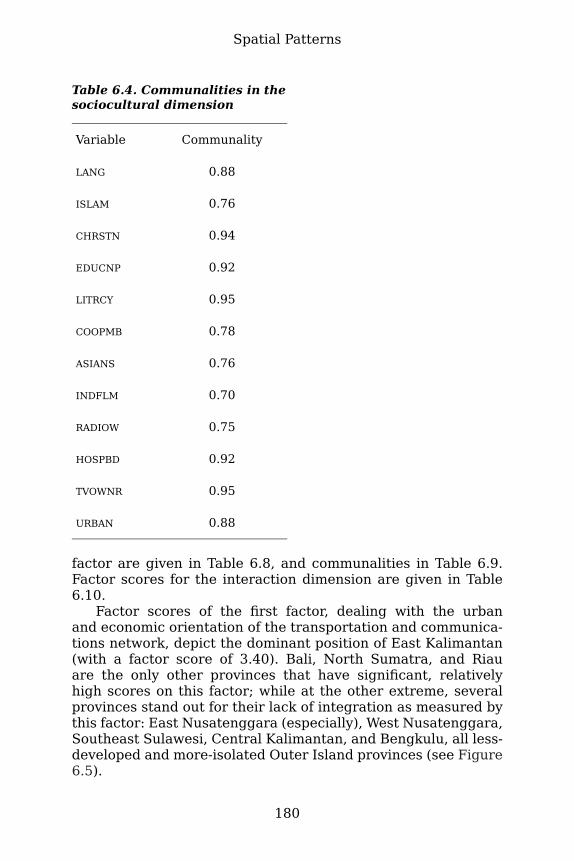
Table 6.4. Communalities in thesociocultural dimension
Variable Communality
LANG 0.88
ISLAM 0.76
CHRSTN 0.94
EDUCNP 0.92
LITRCY 0.95
COOPMB 0.78
ASIANS 0.76
INDFLM 0.70
RADIOW 0.75
HOSPBD 0.92
TVOWNR 0.95
URBAN 0.88
factor are given in Table 6.8, and communalities in Table 6.9.Factor scores for the interaction dimension are given in Table6.10.
Factor scores of the first factor, dealing with the urbanand economic orientation of the transportation and communica-tions network, depict the dominant position of East Kalimantan(with a factor score of 3.40). Bali, North Sumatra, and Riauare the only other provinces that have significant, relativelyhigh scores on this factor; while at the other extreme, severalprovinces stand out for their lack of integration as measured bythis factor: East Nusatenggara (especially), West Nusatenggara,Southeast Sulawesi, Central Kalimantan, and Bengkulu, all less-developed and more-isolated Outer Island provinces (see Figure6.5).
Spatial Patterns
180

Table 6.5. Factor scores of the sociocultural factors
Province Factor 1Urban/Media
Factor2
Religion
Factor 3Literacy/Language
Factor 4Coop
membership/Asians
Aceh -0.48 0.76 0.43 -0.16
North Sumatra 0.96 -0.96 1.27 -0.16
West Sumatra -0.17 0.48 0.88 -0.77
Riau 0.92 0.81 0.13 1.54
Jambi -0.65 0.94 0.29 1.37
South Sumatra 0.90 0.47 0.38 0.76
Bengkulu -0.79 0.85 0.18 -0.22
Lampung -1.14 0.74 0.45 0.79
West Java -0.15 0.79 -0.02 -0.10
Central Java -0.01 0.71 -0.60 -0.75
Yogyakarta 0.77 0.40 0.25 -1.82
East Java 0.14 0.68 -0.87 -1.06
Bali 0.14 -0.36 -0.63 -1.22
West Nusatenggara -0.51 0.52 -2.18 -1.31
East Nusatenggara -1.60 -2.06 -0.62 0.60
National Integration in Indonesia
181

West Kalimantan 0.48 -0.27 -1.57 2.32
Central Kalimantan -0.65 0.34 0.51 0.63
South Kalimantan 0.89 0.67 0.22 -0.53
East Kalimantan 3.23 -0.17 0.00 0.88
North Sulawesi 0.52 -1.74 1.80 -1.37
Central Sulawesi -1.19 -0.14 1.08 0.34
South Sulawesi 0.13 0.87 -1.13 -0.44
Southeast Sulawesi -1.11 0.34 -0.27 0.08
Maluku -0.74 -1.12 1.71 0.49
Irian Jaya 0.13 -2.78 -1.68 0.11
Figure 6.1. Factor scores of sociocultural factor 1 (urban/media).
On the second factor, however, the Javanese provinces,along with the most extreme case, Bali, cluster together at onepole, demonstrating their high population density and corre-
Spatial Patterns
182

Figure 6.2. Factor scores of sociocultural factor 2 (religion).
Figure 6.3. Factor scores of sociocultural factor 3 (literacy/language).
lated high road density and their difference from the rest of In-donesia. At the other pole, Irian Jaya, East Kalimantan, Riau,Maluku, and Central Kalimantan illustrate the importance ofsea travel and telegram communications (see Figure 6.6).
In the statistical analysis of the economic dimension, diffi-culties arise in trying to separate indices measuring economicintegration from those illustrating economic development. In-dices such as the ownership of a sideboard or consumption ofelectricity are measures as much of economic development asthey are of participation in and integration into the national eco-nomic life. Yet it can be argued that economic development isa necessary though not sufficient condition for economic inte-
National Integration in Indonesia
183

Figure 6.4. Factor scores of sociocultural factor 4 (cooperative mem-bership/Asian citizens)
gration and that the extent to which the different provinces areinvolved in economic development is an indication of their inte-gration into the nation-state.
Of all the variables relating to the economic dimension,eleven were selected for their particular relevance, the com-pleteness and consistency of their data, and their correlationwith other variables. These variables and their Pearson product-moment correlation coefficients are shown in Table 6.11. Whensubjected to factor analysis with a varimax rotation, these vari-ables were condensed and partitioned into three distinct factors(see Table 6.12). Eigenvalues and percentages of the variance ineach factor are given in Table 6.13, and communalities in Table6.14. Factor scores are shown in Table 6.15.
The first and most important factor, which accounts for47.4 percent of the variance, summarizes those variables con-tributing to national development (provincial income and do-mestic investment levels, provincial participation in the nationaleconomy through taxation, and the amount spent upon devel-opment by both central and provincial governments). Factorscores depict a pattern of striking contrasts between several ofthe economically dynamic provinces in the Outer Islands, domi-nated overwhelmingly by East Kalimantan but also includingCentral Kalimantan and Irian Jaya; and the provinces of innerIndonesia, with their negative per-capita contributions to thenational economy, particularly the provinces of Java but also
Spatial Patterns
184

Table 6.6. Correlation matrix of selected interaction variables
Meanings of the variables selected and their sources:ROADNS (Road density). Length of roads (of all types and condi-
tions) per 1,000 square kilometers, 1982. Source: BiroPusat Statistik (B.P.S.), Statistik Indonesia 1983, BukuSaku, Table VII.1.3.
VEHCLP (Vehicles per 1,000 population). Number of registeredvehicles of all types per 1,000 population, 1982. Source:B.P.S., Statistik Indonesia 1983, Buku Saku, Table VII.2.3.
LGSEAT (Sea-traffic-generated income, log-transformed).Income generated by sea traffic in the ports of eachprovince in rupiahs per capita (calculated from recordeddata for 285 ports, agglomerated by province), 1981–1982.Source: Republik Indonesia, Departemen PerhubunganLaut, Direktorat Perkapalan dan Pelayaran SubDit. Keban-daran dan Awak Kapal, Seksi P.U., File No. TH 1981/82.
AIRTRF (Air traffic). Number of domestic air travelers, recordedfor sixty-six airports and agglomerated by province, per1,000 population, 1981. Source: B.P.S., Statistik AngkutanUdara 1981, Table 9.
TELPHN (Telephone ownership). Number of telephone licensesissued per 1,000 population, 1981. Source: B.P.S., StatistikIndone sia 1983, Buku Saku, Table VII.5.3.
TELGRM (Telegrams). Number of telegrams sent to domesticdestinations per 1,000 population, 1981. Source: B.P.S.,Statistik Indonesia 1982, Table VIII.5.5.
National Integration in Indonesia
185

IMPDOM (Imports from domestic sources). Number of tons ofcargo unloaded in interprovincial trade per 100 population(average of 1981 and 1982 figures). Source: B.P.S., StatistikBongkar Muat Barang di Pelabuhan Indonesia 1982, Table1.
LGIMPI (Imports from overseas, log-transformed). Value of inter-national imports in U.S. dollars per capita, 1982. Source:B.P.S., Impor Menurut Jenis Barang dan Negeri Asal, vol. 2,Table 8.
LGPOPD (Population density, log-transformed). Populationdensity per square kilometer, 1980. Source: B.P.S., StatistikIndonesia 1983, Buku Saku, Table II.1.3.
Table 6.7. Rotated factor loadings in theinteraction dimension
Variable Factor 1 Factor 2
ROADNS 0.20 -0.84
VEHCLP 0.89 -0.23
LGSEAT 0.53 0.77
AIRTRF 0.82 0.34
TELPHN 0.94 0.11
TELGRM 0.24 0.72
IMPDOM 0.75 0.47
LGIMPI 0.70 0.04
LGPOPD -0.06 -0.93
Note: Underlined numbers indicate the variablesthat have the most significant loadings on eachfactor.
Spatial Patterns
186

Table 6.8. Eigenvalues and percentages of the variance in theinteraction dimension
Factor Eigenvalues Percentage ofthe variance
Cumulativepercentage
1 4.53 50.3 50.3
2 2.34 26.0 76.3
Table 6.9. Communalitiesin the interactiondimension
Variable Communality
ROADNS 0.74
VEHCLP 0.84
LGSEAT 0.87
AIRTRF 0.79
TELPHN 0.90
TELGRM 0.58
IMPDOM 0.79
LGIMPI 0.49
LGPOPD 0.87
Bali and the two Nusatenggara provinces (see Figure 6.7).These contrasts underscore the claim made earlier about the ex-ploitation of the Outer Islands for the benefit of Java.
The second factor, by contrast, highlights the more mod-ernizing forces of altered economic life-styles associated withchanges from agricultural to other forms of employment, whichinvolve greater personal interdependence. This factor is char-acterized by a relatively low percentage of the population em-
National Integration in Indonesia
187
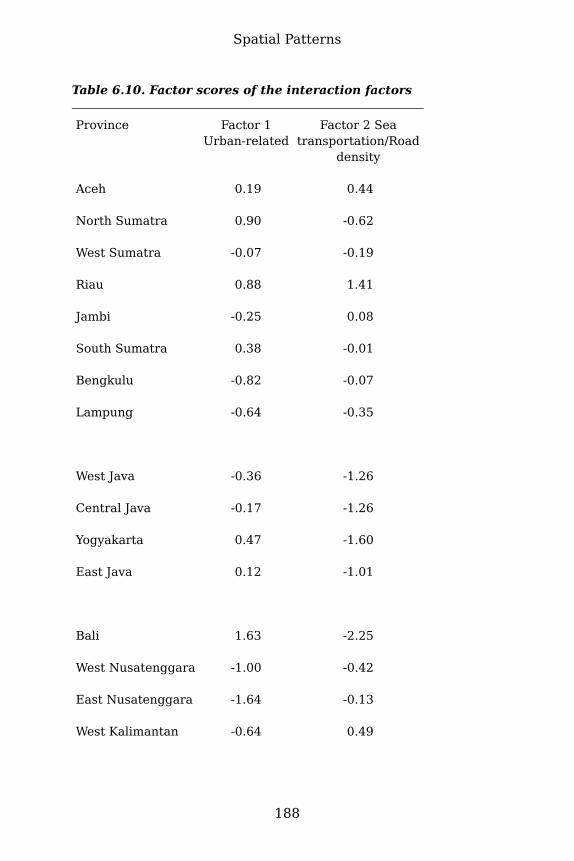
Table 6.10. Factor scores of the interaction factors
Province Factor 1Urban-related
Factor 2 Seatransportation/Road
density
Aceh 0.19 0.44
North Sumatra 0.90 -0.62
West Sumatra -0.07 -0.19
Riau 0.88 1.41
Jambi -0.25 0.08
South Sumatra 0.38 -0.01
Bengkulu -0.82 -0.07
Lampung -0.64 -0.35
West Java -0.36 -1.26
Central Java -0.17 -1.26
Yogyakarta 0.47 -1.60
East Java 0.12 -1.01
Bali 1.63 -2.25
West Nusatenggara -1.00 -0.42
East Nusatenggara -1.64 -0.13
West Kalimantan -0.64 0.49
Spatial Patterns
188

Central Kalimantan -0.82 1.04
South Kalimantan 0.13 0.22
East Kalimantan 3.40 1.43
North Sulawesi 0.23 0.05
Central Sulawesi -0.63 0.76
South Sulawesi 0.05 -0.38
Southeast Sulawesi -0.94 0.60
Maluku -0.56 1.28
Irian Jaya 0.14 1.75
Figure 6.5. Factor scores of interaction factor 1 (urban-related)
ployed in agriculture; a comparatively high use of kerosene,gas, or electricity as a fuel for cooking (in place of the tradi-tional firewood); a relatively high use of electricity for lighting;and a high rate of ownership of one of the symbols of devel-opment, a sideboard. 9 This household-modernizing economic
National Integration in Indonesia
189

Figure 6.6. Factor scores of interaction factor 2 (sea transportation/road density).
factor illustrates the differences between much of the easternpart of the country (the lowest factor scores recorded are forEast Nusatenggara, Irian Jaya, and Southeast and Central Su-lawesi) and the other parts of the country. East Kalimantanand West Java score highest on this factor, followed by SouthSumatra‚ Riau, and North Sumatra (see Figure 6.8).
The third factor focuses on the dynamic element of eco-nomic growth as measured by the average growth rate in RGDPbetween 1976 and 1980 and the associated variable of approvedforeign investment projects in the 1967–1982 period on a per-capita basis. Not surprisingly, given its first-place position onboth these individual variables (see chapter 5), Aceh’s factorscore totally dominates the factor score structure (4.14, com-pared with its nearest rival, North Sumatra, with a score of0.86). At the other extreme, Yogyakarta and West Nusatenggararecord both low economic growth and little foreign investment(see Figure 6.9). However, the provinces at both extremes onthis factor have changed since 1971, as a comparable studyusing early 1970s data demonstrates. 10 Then, East Kalimantan,Maluku, and Riau stood out along with Aceh as economicallydynamic provinces, contrasting especially with North Sulawesi,which was the only province to experience a negative economicgrowth rate during the 1968–1972 time period on which theearlier study was based. West Kalimantan and Bengkulu alsorecorded fairly high negative scores at that time.
Spatial Patterns
190

Table 6.11. Correlation matrix of selected economic variables
Meanings of the variables selected and their sources:REGGDP (Regional gross domestic product). RGDP in money
terms (excluding oil) in thousands of rupiahs per capita,1980. Source: Biro Pusat Statistik (B.P.S.), Statistik In-donesia 1983, Buku Saku, Table X.9.
SIDEBD (Sideboard ownership). Percentage of householdsowning a sideboard, 1980. Source: B.P.S., Sensus Penduduk1980, Series S, no. 2, Table 66.3.
FUELCM (Fuel consumption). Percentage of private householdsusing kerosene, gas, or electricity for cooking, 1980.Source: B.P.S., Sensus Penduduk 1980, Series S, no. 2,Table 63.3.
ELECCM (Electricity consumption). Percentage of private house-holds using electricity for lighting, 1980. Source: B.P.S.,Sensus Penduduk 1980, Series S, no. 2, Table 63.3.
REGEXP (Regional expenditure). Provincial government expendi-tures (operating and development) in thousands of rupiahsper capita, 1980–1981. Source: B.P.S., Statistik Indonesia1983, Buku Saku, Table VIII.1.5.
TAXGVT (Provincial tax contributions to the government). Lo-cally raised tax revenue in thousands of rupiahs per capita,1980–1981. Source: B.P.S., Statistik Keuangan PemerintahDaerah, Daerah Tingkat I (Propinsi), 1975/76–1980/81,Table 1.
CGVDVT (Central government support for development). Na-tional government support for development programs inthousands of rupiahs per capita, 1980–1981. Source: sameas above (TAXGVT).
National Integration in Indonesia
191

GROWTH (Growth rate of RGDP). Average annual growth rate ofRGDP 1976–1980 at constant 1975 market prices. Source:B.P.S., Pendapatan Regional Propinsi-propinsi di Indonesia,1976–80, Table 1.6.
AGREMP (Agricultural employment). Percentage of the popu-lation employed in agriculture, forestry, fishing, andhunting, 1980. Source: B.P.S., Sensus Penduduk 1980,Series S, no. 2, Table 44.9.
LGDINV (Domestic investment, log-transformed). Approved do-mestic investment projects excluding the oil, insurance, andbanking sectors, 1968–1982 in thousands of rupiahs percapita. Source: B.P.S., Indikator Ekonomi 1982, TableIV.16b.
INTINV (International investment). Approved foreign investmentprojects, 1967–1982, in U.S. dollars per capita. Source:B.P.S., Indikator Ekonomi 1982, Table IV.16d.
Significantly, only East Kalimantan has positive scores on allthree of these economic factors. Indeed, East Kalimantan is theonly province even to record positive scores on the first twomost significant factors, demonstrating again its predominantposition as Indonesia’s richest and most developed and devel-oping province on a per-capita basis. 11
At the other extreme, however, there are several provinceswith significant negative scores on all three factors: West andEast Nusatenggara and Lampung. This indicates their lack ofeconomic development and integration into the national whole.In addition, there are several provinces that have significantnegative scores on two of the factors: 12 West Sumatra, West,Central, and East Java, Yogyakarta, West Kalimantan, Central,South, and Southeast Sulawesi, and Maluku. Of this lattergroup, the Javanese provinces, together with West Sumatra andSouth Sulawesi, have positive scores on the second, modern-izing factor but negative scores on both the economic devel-opment and growth investment factors, while the others havepositive scores on the first, economic development, but negativescores on the other two factors.
However, as discussed earlier, it is almost impossible tomeasure economic integration without also measuring eco-nomic development. Although economic integration dependsupon some degree of development, economic development does
Spatial Patterns
192
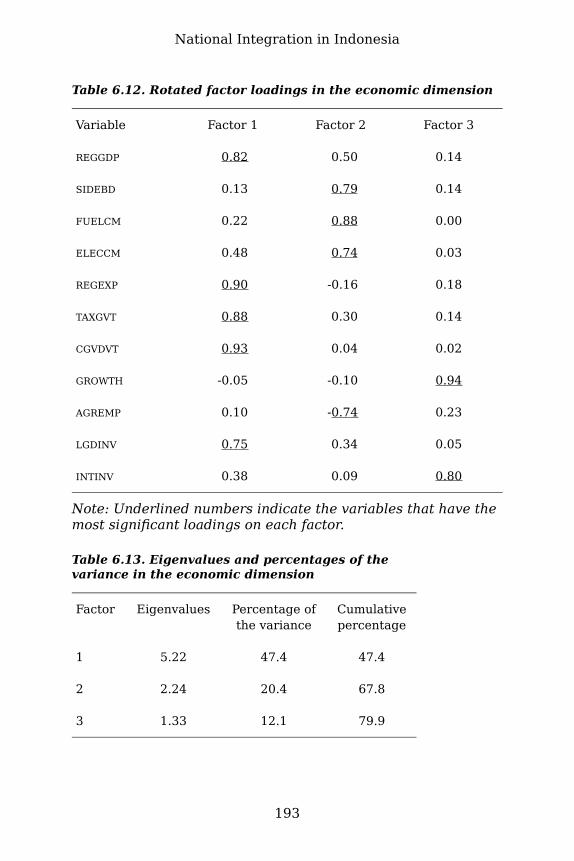
Table 6.12. Rotated factor loadings in the economic dimension
Variable Factor 1 Factor 2 Factor 3
REGGDP 0.82 0.50 0.14
SIDEBD 0.13 0.79 0.14
FUELCM 0.22 0.88 0.00
ELECCM 0.48 0.74 0.03
REGEXP 0.90 -0.16 0.18
TAXGVT 0.88 0.30 0.14
CGVDVT 0.93 0.04 0.02
GROWTH -0.05 -0.10 0.94
AGREMP 0.10 -0.74 0.23
LGDINV 0.75 0.34 0.05
INTINV 0.38 0.09 0.80
Note: Underlined numbers indicate the variables that have themost significant loadings on each factor.
Table 6.13. Eigenvalues and percentages of thevariance in the economic dimension
Factor Eigenvalues Percentage ofthe variance
Cumulativepercentage
1 5.22 47.4 47.4
2 2.24 20.4 67.8
3 1.33 12.1 79.9
National Integration in Indonesia
193

Table 6.14.Communalities in theeconomic dimension
Variable Communality
REGGDP 0.93
SIDEBD 0.66
FUELCM 0.82
ELECCM 0.78
REGEXP 0.87
TAXGVT 0.88
CGVDVT 0.87
GROWTH 0.89
AGREMP 0.61
LGDINV 0.69
INTINV 0.80
not necessarily lead to greater economic integration. It is dif-ficult, therefore, to be sure that Aceh’s seemingly greaterdegree of economic integration as measured by the indices se-lected here truly reflects increased integration and not whatis more likely, substantial investment and development. Simi-larly, it would seem that Lampung’s negative scores on all threefactors reflect its general poverty and lack of development asmuch as its lack of national integration.
The problem of promoting both economic development andeconomic integration remains a major one for the governmentand peoples of Indonesia. National economic growth cannotcontinue to be pursued at the cost of ever-widening disparitiesin economic well-being among the provinces. Nor, on the otherhand, can uncontrolled regional development be promotedwithout concern for its impact on the nation as a whole. Both
Spatial Patterns
194

Table 6.15. Factor scores of the economic factorsProvince Factor 1
Economicdevelopment
Factor 2Modernization
Factor 3Growth/Investment
Aceh -0.89 -0.17 4.14
North Sumatra -0.38 0.91 0.86
West Sumatra -0.38 0.18 -0.40
Riau -0.05 0.93 -0.55
Jambi 0.39 -0.09 -0.71
South Sumatra -0.05 1.07 -0.18
Bengkulu 0.05 -0.67 0.67
Lampung -0.50 -0.62 -0.39
West Java -0.83 1.60 -0.20
Central Java -0.80 -0.01 -0.67
Yogyakarta -0.55 0.00 -1.02
East Java -0.75 0.66 -0.53
Bali -0.71 0.73 -0.04
WestNusatenggara
-0.68 -0.47 -0.95
East Nusatenggara -0.67 -1.87 -0.12
National Integration in Indonesia
195

West Kalimantan 0.19 -0.55 -0.42
Central Kalimantan 1.78 -0.95 0.39
South Kalimantan -0.34 0.75 0.42
East Kalimantan 3.58 1.93 0.18
North Sulawesi -0.41 0.84 0.35
Central Sulawesi 0.51 -1.27 -0.48
South Sulawesi -0.54 0.56 -0.22
Southeast Sulawesi 0.20 -1.34 -0.44
Maluku 0.56 -0.48 -0.42
Irian Jaya 1.28 -1.67 0.73
Figure 6.7. Factor scores of economic factor 1 (economic devel-opment).
Spatial Patterns
196
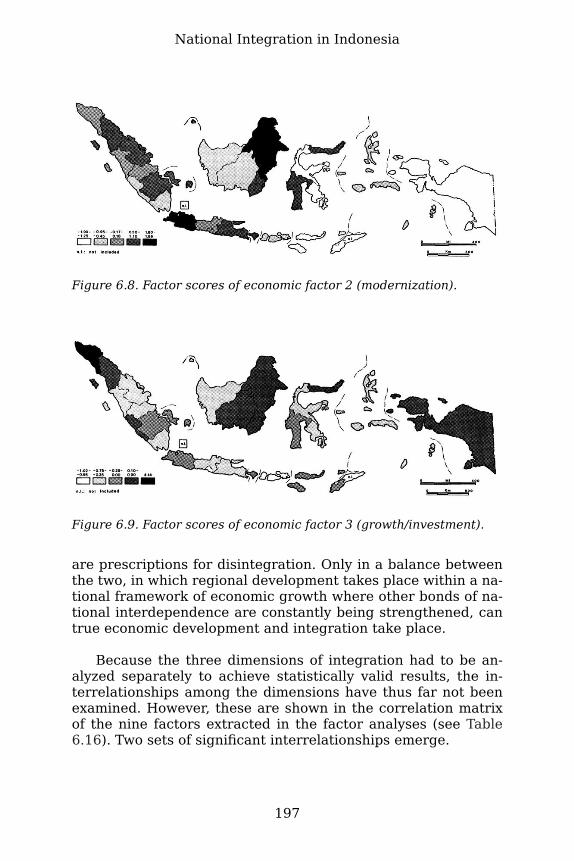
Figure 6.8. Factor scores of economic factor 2 (modernization).
Figure 6.9. Factor scores of economic factor 3 (growth/investment).
are prescriptions for disintegration. Only in a balance betweenthe two, in which regional development takes place within a na-tional framework of economic growth where other bonds of na-tional interdependence are constantly being strengthened, cantrue economic development and integration take place.
Because the three dimensions of integration had to be an-alyzed separately to achieve statistically valid results, the in-terrelationships among the dimensions have thus far not beenexamined. However, these are shown in the correlation matrixof the nine factors extracted in the factor analyses (see Table6.16). Two sets of significant interrelationships emerge.
National Integration in Indonesia
197

The first set, with the highest correlations, consists of theurban-related factors: the first sociocultural factor (which hadloadings from variables measuring television and radio own-ership, exposure to Indonesian-made movies, and access to hos-pital beds, as well as the percentage urban), the first interactionfactor (which had loadings from variables associated withgreater urban and per-capita economic development, includingtelephone and vehicle ownership and participation in air trans-portation and trade), and the second economic factor (whichwas labeled the modernizing factor because of its more urban-related characteristics of relatively low employment percen-tages in agriculture, relatively high household ownership of asideboard, and comparatively high consumption of electricityfor lighting and use of fuels other than firewood for cooking).
The second set, with somewhat lower correlations amongthe factors and less inherent meaning, links together the fourthsociocultural factor (with its positive loadings on the presenceof non-Indonesian-citizen Asians and its negative loadings onthe more integrative variable of cooperative membership) withthe second interaction factor (which had positive loadings fromsea travel and telegrams and negative loadings from populationdensity and road density). This second interaction factor alsocorrelates significantly with the first economic factor, that con-cerned with national development (with its positive loadingsfrom provincial income, domestic investment, provincial par-ticipation in the national economy through taxation, and theamount spent on development by both central and provincialgovernments).
The correlation matrix demonstrates also the very highdegree of independence of the remaining three factors: thesecond sociocultural factor (concerned primarily with religiousdifferences in the country), the third sociocultural factor (in-cluding literacy, language, and education), and the third eco-nomic factor (dealing with economic growth and foreign in-vestment); all of these had correlations of under 0.35 withany other factor. It thus appears that these are genuinely in-dependent factors, measuring separate aspects of the wholeconcept of national integration.
The factor analysis and the ranking of the provinces on thebasis of their factor scores demonstrate two distinct aspects ofnational integration within Indonesia.
On the one hand, factors such as the fourth socioculturalfactor (cooperative membership and Asian citizens), the secondinteraction factor (high population and road density and low
Spatial Patterns
198
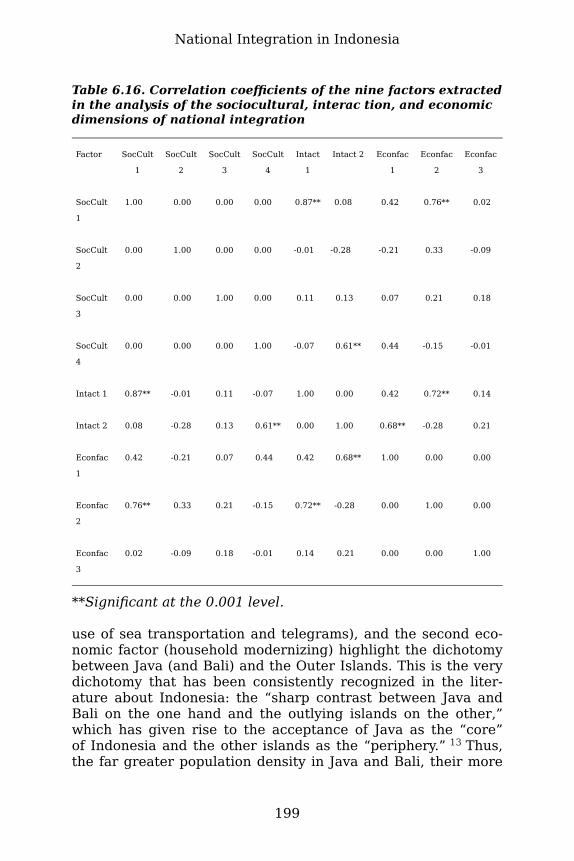
Table 6.16. Correlation coefficients of the nine factors extractedin the analysis of the sociocultural, interac tion, and economicdimensions of national integration
Factor SocCult
1
SocCult
2
SocCult
3
SocCult
4
Intact
1
Intact 2 Econfac
1
Econfac
2
Econfac
3
SocCult
1
1.00 0.00 0.00 0.00 0.87** 0.08 0.42 0.76** 0.02
SocCult
2
0.00 1.00 0.00 0.00 -0.01 -0.28 -0.21 0.33 -0.09
SocCult
3
0.00 0.00 1.00 0.00 0.11 0.13 0.07 0.21 0.18
SocCult
4
0.00 0.00 0.00 1.00 -0.07 0.61** 0.44 -0.15 -0.01
Intact 1 0.87** -0.01 0.11 -0.07 1.00 0.00 0.42 0.72** 0.14
Intact 2 0.08 -0.28 0.13 0.61** 0.00 1.00 0.68** -0.28 0.21
Econfac
1
0.42 -0.21 0.07 0.44 0.42 0.68** 1.00 0.00 0.00
Econfac
2
0.76** 0.33 0.21 -0.15 0.72** -0.28 0.00 1.00 0.00
Econfac
3
0.02 -0.09 0.18 -0.01 0.14 0.21 0.00 0.00 1.00
**Significant at the 0.001 level.
use of sea transportation and telegrams), and the second eco-nomic factor (household modernizing) highlight the dichotomybetween Java (and Bali) and the Outer Islands. This is the verydichotomy that has been consistently recognized in the liter-ature about Indonesia: the “sharp contrast between Java andBali on the one hand and the outlying islands on the other‚”which has given rise to the acceptance of Java as the “core”of Indonesia and the other islands as the “periphery.” 13 Thus,the far greater population density in Java and Bali, their more
National Integration in Indonesia
199
developed infrastructure (in terms of road density and vehicleconcentration), their greater participation in certain nationallyoriented organizations such as village social associations andcooperatives, and their greater exposure to modernizing influ-ences (as indicated in their higher levels of consumption ofelectricity and kerosene and their lower employment levels inprimary agricultural activities) contrast with conditions existingin the Outer Islands.
Yet on the other hand, a closer examination of the factorsand their spatial patterns reveals that in at least two differentways this “core-periphery dichotomy” conclusion is inadequate.First, the factors that demarcate Java as a distinct “core” arenot as crucial as those factors synthesizing other features. Inboth the sociocultural and interaction dimensions, the majorfactor extracted from the factor analysis fails to distinguish Javafrom the Outer Islands on a per-capita basis (see Figures 6.1and 6.5); in the economic dimension it is the second (householdmodernizing) factor that fails to make that distinction (seeFigure 6.8). Rather, the contrast is between certain of the OuterIsland provinces and other provinces also in the Outer Islands.In other words, the contrasts among the Outer Island provincesare greater and more significant than those between Java andthe Outer Islands, at least on a per-capita basis.
Second, the factor analysis shows that from a per-capita per-spective Java is not a true core, because in each dimension theJavanese provinces lack several of the key characteristics ex-pected of a national core.
In the sociocultural dimension, a higher proportion of thepopulation speaks the national language in most of the outlyingareas in the Outer Islands (such as North and Central Sulawesi,Maluku, all of Sumatra, and East Kalimantan) than in Java (seeFigure 6.3). Indeed, in Java less than 62 percent of the pop-ulation can speak Indonesian (with the exception of Jakarta).Yet widespread knowledge of a common, nationwide language isone of the most important integrating forces in any nation-stateand consequently should characterize the core of any coun-try. Literacy and educational levels are similarly below the na-tional average in most of Java. In terms of access to medicalfacilities and other amenities on a per-capita basis, the Ja-vanese have fewer hospital beds and mother-and-baby clinicsand less exposure to Indonesian-made movies than the popu-lation in many of the Outer Island provinces (especially EastKalimantan, North Sulawesi, and the provinces of Sumatra).Indeed, the provinces of Java outside Jakarta are not even the
Spatial Patterns
200

most urbanized on a per-capita basis. North and South Sumatra,Riau, and East Kalimantan all have a higher percentage of theirprovincial populations classified as urban than any of the fourprovinces in Java included in the statistical analysis.
On the interaction level, although Java has by far the mosthighly developed land transportation network (road, rail, andvehicular density), the comparative underdevelopment on a per-capita basis of its sea transportation system and other non-land-based interaction indices, as demonstrated by the non-land-ori-ented interaction factor, is striking in this sea-oriented islandnation (see Figure 6.6). Similarly in terms of population inter-action and mixing, on the basis of the 1980 migration data Javaemerges as a very homogeneous area: less than 4 percent ofits population (outside Jakarta) has lived in another province, acharacteristic hardly to be expected in a national core.
The same is true with the economic dimension. The nationaldevelopment economic factor distinguishes Java (along withprovinces in the Outer Islands such as West and EastNusatenggara and Aceh) as an economically underdevelopedarea on a per-capita basis, an area lacking the dynamic char-acteristics normally associated with a core region (see Figure6.7). Despite the fact that Java has received a disproportionatepercentage of both domestic and foreign investment, and isthe center of manufacturing industry in Indonesia, provincialincome levels and provincial contributions to the nationaleconomy are lower per capita than in most of the Outer Islandprovinces. This inverted core-periphery situation has been dis-cussed earlier (see chapter 5). 14 On a per-capita basistherefore, Java is a net economic drain on the national economy,not an economically dynamic, pulsating center from whichspread effects extend to an underdeveloped periphery.
Thus, it is obvious that Java (outside Jakarta) and Bali do notform the economically dynamic and heterogeneous heartland,containing truly national core characteristics. Only in its po-litical relationships, in its political domination of the periphery,can Java be considered a core. In other ways the Javaneseprovinces and Bali form a part of the periphery, albeit a very dis-tinctive part.
Only Jakarta, the national capital city, stands out with truecore characteristics. Only Jakarta has a highly urban character,a high economic growth rate, high income, and marked cos-mopolitan features (with the greatest heterogeneity of popu-lation of any province in Indonesia). Indeed, Jakarta has beenlabeled “the most, even the only truly Indone sian city, because
National Integration in Indonesia
201

of its function as one of the few crucibles in which the nation’sethnic groups interact in their daily lives.” 15 Jakarta alone isthe center of investment; the headquarters of finance, adminis-tration, and government; and the focus of most communicationsand transportation links in the country.
When only Jakarta is recognized as the national core ofIndonesia, the pattern of national integration appears signifi-cantly different from the dichotomous Java-Outer Islands modeltraditionally accepted in the literature about Indonesia. Com-parison of factor scores and the rankings of the six major factors(see Table 6.17), together with other elements discussed earlierin the book, suggests a fourfold classification of the levels ofintegration of the provinces in Indonesia based on per-capitacharacteristics (see Figure 6.10).
Of the nine factors that resulted from the factor analysis ofthe three major dimensions of integration, six are conceptuallymore important than the remaining three. In the socioculturaldimension the first and third factors are most significant: thefirst, accounting for 37 percent of the variance, links the urban-and media-related characteristics; and the third, accountingfor 16 percent of the variance, combines the important vari-ables of literacy, education, and knowledge of the Indonesianlanguage. The second factor, depicting religious differences,demonstrates the contrasts between the predominant religionof Islam and the minority Christianity; but, as discussed earlier,adherence to Islam cannot necessarily be construed as beingmore integrative, because Christians have contributed to na-tional development and integration disproportionately to theirnumbers. The fourth sociocultural factor is likewise ambiguousin meaning, for it combines the integrative cooperative mem-bership variable with the disintegrative presence of non-Indone-sian-citizen Asians.
Both interaction factors are inherently valuable becausethey measure different, positive aspects of interaction. With theeconomic dimension, however, the first two factors (measuringnational economic development and participation in the na-tional economy, and household modernizing forces of changingeconomic life-styles) are more significant than the third. Thislast factor, accounting for only 12 percent of the variance, isconcerned with economic growth during a rather limited timeperiod (1976–1980) and with approved foreign investment pro-jects from 1967 to 1982, and reflects the existence of eco-nomic wealth and potential rather than economic integration.
Spatial Patterns
202

The groupings of the provinces, therefore, are based on theirfactor scores on the six most important factors, two in eachmajor dimension.
First, the five provinces of West, Central, and East Java,Yogyakarta, and Bali form a fairly distinct group with similarscores on most of the factors, although it is interesting to noticethat they form a less uniform group than they did ten years ago.They rank below average on the literacy-education-language so-ciocultural factor, on the second interaction factor (which hashigh loadings on sea transportation and telegram use and neg-ative loadings on high road and population density), and onthe most important economic factor (that measuring economicdevelopment and contribution to the national economy on a per-capita basis). And they rank at or a little above average onthe other three major factors. As already suggested, Java andBali seem only partially integrated into the whole Indonesiannation-state. In some ways they constitute a nation-state of theirown, with their own distinct cultures symbolized in their rich artforms and language traditions, which are not those of the nationas a whole. They are attached politically (though frequently in acolonial-type relationship) to the other parts of the Indonesianarchipelago and are certainly economically dependent on themfor revenue generation; yet in other ways Java and Bali seemindependent, culturally aloof, and unwilling partners when itcomes to regional equality.
Second, five spatially separate provinces in the Outer Is-lands stand out as being the most economically developed andhighly integrated. These provinces, East Kalimantan, North andSouth Sumatra, Riau, and North Sulawesi, rank among the topseven on at least three of the major factors and have generallyabove-average scores on the others. They are provinces withcomparatively high levels of urbanization, each with a majorurban core. East Kalimantan stands out in its first position withits overwhelmingly high scores and first-place rankings on fourof the six major factors (and second place on a further one).Its only relatively low ranking (fifteenth) is on the literacy-education-language sociocultural factor.
Historically these five provinces consist of two differenttypes. The provinces of North and South Sumatra and NorthSulawesi, with their nuclear centers of Medan, Palembang, andManado, are old historic cores. 16 North Sumatra is the homeof the Bataks and the locus of important late-nineteenth-andtwentieth-century agricultural estates, and it has a favorableposition with regard to trade with the Malay Peninsula across
National Integration in Indonesia
203

Table 6.17. Ranks of the provinces based on the factor scores ofthe six most pertinent factors
Sociocultural Interaction Economic
Province Factor1
Factor3
Factor1
Factor2
Factor1
Factor2
Aceh 16 8 8 9 25 15
North Sumatra 2 3 3 20 13 5
West Sumatra 15 5 13 16 13 11
Riau 3 14 4 3 10 4
Jambi 18 10 15 11 6 14
South Sumatra 4 9 6 13 10 3
Bengkulu 21 13 21 14 9 20
Lampung 23 7 19 17 16 19
West Java 14 16 16 22 24 2
Central Java 13 18 14 22 23 13
Yogyakarta 6 11 5 24 18 12
East Java 9 21 11 21 22 9
Bali 9 20 2 25 21 8
WestNusatenggara
17 25 24 19 20 16
EastNusatenggara
25 19 25 15 19 25
Spatial Patterns
204

WestKalimantan
8 23 19 8 8 18
CentralKalimantan
18 6 21 5 2 21
SouthKalimantan
5 12 10 10 12 7
EastKalimantan
1 15 1 2 1 1
North Sulawesi 7 1 7 12 15 6
CentralSulawesi
24 4 18 6 5 22
South Sulawesi 11 22 12 18 17 10
SoutheastSulawesi
22 17 23 7 7 23
Maluku 20 2 17 4 4 17
Irian Jaya 11 24 9 1 3 24
the Straits of Malacca. South Sumatra traces its historic roots tothe Sri Vijaya empire of the seventh to the thirteenth centuriesand is the focus of a network of trading routes and connectionsextending through much of the archipelago. North Sulawesi de-veloped later as a core area and owes its comparatively highdegree of development to its favored position under the Dutch.This is reflected in its sociocultural tradition, with its Europeanemphases on literacy, education, Christianity, medical facilities,and so forth, and on its economic development as a centerfor the production of copra and certain of the spices (cloves,
National Integration in Indonesia
205

Figure 6.10. Provinces grouped according to their common character-istics, 1980.
nutmeg, mace, cinnamon, and vanilla). Its decline from a po-sition of preeminence among the Outer Islands has to be un-derstood in the light of the Javanese control of the economyafter independence, the Permesta rebellion, and the centralgovernment’s restrictions on trade (with the nearby Philippines)and regional development.
The second type of province, including East Kalimantan andRiau, reflects particularly, though not exclusively, the ex-ploitation of their economic resource base in the more recentpast, especially timber, petroleum, and natural gas. North andSouth Sumatra are also rich in natural resources.
Third, a group of ten provinces exhibits an average or less-than-average degree of overall integration. This group can besubdivided into three categories: first, those that are somewhatmore integrated and developed, that rank within the top tenprovinces on at least two of the factors and include one or twoother relatively high or average rankings: South Kalimantan,Aceh, and Jambi; second, those that are somewhat below av-erage in most of their rankings: South Sulawesi and WestSumatra; and third, those with great contrasts in their rankingson the different factors: Central Sulawesi, Irian Jaya, Maluku,and West and Central Kalimantan.
Central Sulawesi, Maluku, and Central Kalimantan all rankremarkably high (within the top six provinces) on the literacy-education-language sociocultural factor, the second interactionfactor (sea transportation-telegram use), and the first economicfactor (economic development and participation in the national
Spatial Patterns
206

economy), but have very low rankings (within the bottom eight)on the remaining three major factors. Irian Jaya and West Kali-mantan, by contrast, share very low rankings on the importantliteracy-education-language sociocultural factor, but rankhigher on the first (urban-and media-related) socioculturalfactor; they share similarly high rankings on the second interac-tion factor and first economic factor with the three otherprovinces in this subgroup. Irian Jaya stands out as having thegreatest contrasts in its rankings: first and third on two (thesecond interaction and first economic factors), but next to laston two others (the second sociocultural and second economicfactors). In other words, it is a province with considerable eco-nomic resources (particularly petroleum and copper) and hascomparatively high interaction by sea and telegrams on a per-capita basis, but it shares little in the cultural heritage (as rep-resented by the literacy-education-language factor) and in theeconomically modernizing forces of the country. Economic de-velopment here tends to be enclaval in nature, with greaterimpact on the towns and in the vicinities of resource extraction,and on its numerous in-migrants than on the indigenous inhabi-tants.
South Sulawesi’s low level of integration as measured bythe factor scores is somewhat surprising, given the role of itsprovincial capital, Ujung Pandang (formerly Makassar), as athriving port and metropolis, a major center for communica-tions, and the economic and administrative center for much ofeastern Indonesia. South Sulawesi’s population is more hetero-geneous than most, and in addition the Bugis trading networkis an important factor in integrating South Sulawesi into therest of Indonesia; 17 yet these traits are not reflected in any ofthe indices. The explanation for the anomalous position of SouthSulawesi may have to be sought both in its past developmentand in the size of its provincial population. Although historicallyan important center before its sacking by the Dutch in 1669,South Sulawesi developed slowly, partly because of a lack ofemphasis on education and training of the local population. 18
An important rice- and copra-producing region, South Sulawesiwas dominated for over 300 years by either Javanese or Minaha-sans (from North Sulawesi), until the 1958–1961 Permesta re-bellion when it threw off North Sulawesi’s control. The Dutchregarded South Sulawesi much as they did Aceh, as an area ofperennial unrest, even after they pacified it in 1905–1910. 19 Theimpression of Ujung Pandang as a thriving, bustling city andthe influence of the Bugis are diluted by the large size of the
National Integration in Indonesia
207

provincial population (6,062,000 in 1980, or over half the entirepopulation of the island of Sulawesi). 20 The province of SouthSulawesi includes some remote and isolated areas, and the con-trast between the city (kota) and the hinterland (hutan, lit-erally forest or jungle) is striking. But the designation of UjungPandang as a major growth center and regional capital for allof eastern Indonesia suggests that South Sulawesi will becomemore integrated and developed in the years ahead.
It is interesting to notice how much more developed and in-tegrated Aceh seems now than ten years ago. In a comparablestudy based on early 1970s data, Aceh seemed rather poorlyintegrated, with low rankings and negative scores on both theinteraction and economic dimensions. 21 Now, although it stillhas negative scores on both major economic factors, it haspositive scores on both interaction factors and, in addition,totally dominates the third economic factor, with its highest per-capita economic growth rate and foreign investment rate. Itappears that real progress has been made both in developingAceh’s economic resources and in integrating this province,with its peripheral position, its fanatical Muslim character, andits history of continuous rebellion against any outside power,whether Dutch or Javanese, into the national whole.
Fourth, five provinces stand out as least integrated andleast economically developed, having generally low rankingson almost all the major factors and ranking among the lowestsix on at least three of them. This group includes Bengkuluand Lampung in Sumatra, Southeast Sulawesi, and West andEast Nusatenggara. It is the last two provinces, however, thatemerge as by far the least integrated and developed in thecountry: they have negative scores on all six major factors;indeed, East Nusatenggara ranks last on one major factor ineach dimension. The two Nusatenggara provinces have thelowest regional gross domestic product per capita in thecountry by far and the fewest natural resources. In addition,East Nusatenggara is the least urbanized of all the provinces(with only 7.5 percent of its population being classified asurban). Together these two provinces stand out as the mostunderdeveloped and most neglected of all the provinces of In-donesia.
In addition to the four groups of provinces discussed thus farare two provinces excluded from the statistical analysis: EastTimor because of lack of comparable data and Jakarta becauseof its overwhelming primacy.
Spatial Patterns
208
East Timor was forcibly annexed by Indonesia in 1976 and,almost inevitably, is still poorly integrated into the nationalwhole. Problems of neglect and lack of development by theformer Portuguese colonial power are being attacked by In-donesian government investment in developing the infra-structure and economic base of the province, 22 but East Timoris poor in natural resources and will continue to be a drainon the national economy. As to be expected, residents of EastTimor have by far the lowest knowledge of the Indonesian lan-guage (33 percent) and the lowest literacy rate (21 percent)of any Indonesian province. East Timor therefore joins Westand East Nusatenggara as the least integrated and most un-derdeveloped of Indonesia’s provinces. In addition, continuedTimorese resistance to Indonesian control and the fact thata military presence is still required to control the provinceindicate lack of genuine integration, despite the efforts of theIndonesian government to incorporate East Timor more fullyinto the country through development and firmer structurallinkages.
In contrast to all the other provinces is the Special Districtof Jakarta (Daerah Khusus Istimewa). It is not technically aprovince, although it functions as a separate administrative unitcomparable to a province. As already discussed, Jakarta standsout as unique, with its dominant core characteristics.
As might be expected, no simple spatial pattern of nationalintegration in Indonesia emerges from the analysis. The mosthighly integrated and developed provinces on a per-capita basisare spatially separated both from one another, and from the na-tional capital of Jakarta. They include provinces in the northernand western parts of the archipelago, and on three of the fourlarger islands, Sumatra, Kalimantan, and Sulawesi. Theprovinces that stand out most obviously as a distinct, morehomogeneous group, those of Java and Bali, form a compactgeographical bloc. The least integrated and least developedprovinces of West and East Nusatenggara, Bengkulu, Lampung,and Southeast Sulawesi flank Java and Bali on the west andeast. Immediate proximity to the capital city, the true core of thecountry, seems to have little impact on the level of integration.Provinces closest to Jakarta—Lampung, Bengkulu, and Centraland South Kalimantan, as well as West and Central Java—arenot the most integrated and highly developed. Rather, they forma broken circle of less integrated provinces separating thoseprovinces that are most integrated and developed on a per-capita basis (North and South Sumatra, Riau, East Kalimantan,
National Integration in Indonesia
209

and North Sulawesi) from the national core of Jakarta. Distancefrom the core, however, may contribute to the feelings of re-moteness and estrangement experienced in Aceh, Irian Jaya,East Nusatenggara, and East Timor.
Indonesia’s pattern of integration, therefore, is uneven. Itdoes not show the more regular decline in cohesion with in-creasing distance from the core that is characteristic of mostdeveloping countries. Rather, the level of integration in In-donesia declines at first with distance from the core in theprovinces nearest to it, but then peaks in the more developedand prosperous provinces beyond the less integrated group,before declining again toward the remote boundaries of thecountry. The complexity of this pattern is not surprising, giventhe size and archipelagic character of Indonesia, with its geo-graphic, demographic, and economic diversity.
This refined understanding of the spatial pattern of nationalintegration in Indonesia has major implications for the country,both for its continued progress in integration as a nation-stateand for its direction in economic development.
The weak integrative links of some of the provinces detractfrom the overall strength of the country and pose a potentialthreat to the continued unity of the nation-state. This is partic-ularly so when such provinces have peripheral locations and/or greater economic strength than the nation as a whole. Aceh,Irian Jaya, and West Kalimantan are among those that seemmost vulnerable in this respect. Similarly, provinces that arepoorly developed from an economic perspective weaken theentire country’s economy. West and East Nusatenggara andEast Timor are obvious examples here.
For some provinces (such as Irian Jaya, East Java, and SouthSulawesi) the predominant need is for stronger socioculturalbonds through increased literacy, use of the Indonesian lan-guage, and basic education. For others (including West Sumatraand Central Kalimantan) the most important need is to increasespatial linkages or interaction, not only with the capital city butwith other provinces as well. Many provinces need increasedeconomic development. Several provinces need increased at-tention in two of the three major dimensions: West Kalimantan,Jambi, Bengkulu, and Southeast Sulawesi in both the sociocul-tural and interaction areas of integration; Lampung and CentralSulawesi in both the interaction and economic spheres; andBali in both the sociocultural and economic dimensions. Westand East Nusatenggara stand out as urgently requiring devel-opment in all three major dimensions.
Spatial Patterns
210

Indonesia’s leaders have long been aware of the challengesof the country’s size, complexity, and uneven development andhave sought in a variety of ways to weld the country into amore cohesive unit. The next chapter analyzes and attempts toevaluate the various policies that have been followed to meetthis goal.
National Integration in Indonesia
211
7Government Response to the
Need for NationalIntegration
THE problems of Indonesia’s great diversity and uneven devel-opment were recognized by Indonesia’s leaders long before thecountry proclaimed its independence in 1945. From the earlieststirrings of nationalism in preindependence days to the present,Indonesia’s leaders have sought continually to counteract thepotentially divisive threat of the differences existing within thefar-flung islands of the archipelago by seeking to bind togetherthe various regions and peoples into a better-functioning andmore mutually interdependent whole. Methods and emphaseshave changed over the years, but the goal has consistently beento promote greater national integration.
In preindependence Indonesia, it was not until the earlytwentieth century that Indonesians began to develop a nationalawareness and feeling of national unity. Although nationalismwas limited at first to a small group of educated upper-class In-donesians, it gradually spread throughout much of the archi-pelago, helped by various nationalist organizations such as BudiUtomo, the Muhammadiyah, and Perhimpunan Indonesia. Therole of the united youth congresses in 1926 and 1928 in pro-pounding the concept of one people and one country and ingaining acceptance for the idea of one national language, a na-tional flag, and a national anthem has already been discussed(see chapter 2).
Under Sukarno, during the Orde Lama days, governmentpolicies toward national integration varied. At first, during therevolutionary struggle against the Dutch (1945–1949), therewas an emphasis on symbolism and political solutions for theproblems caused by the lack of cohesion. In 1950 the politicalsystem was changed from a weak federal system to a stronger,more centralized unitary state. Then, between 1950 and 1957,during the period of parliamentary democracy, policies focused
212

more on promoting economic stabilization, internal consolida-tion, and rational development. Efforts were made to preservea balance among the different ideas of the various peoplesand political parties. However, after 1957 and the impositionof the authoritarian Guided Democracy political system, thegovernment pursued national integration particularly throughemotive political and sociocultural policies. Sukarno sought toraise nationalist, patriotic emotions through perpetuating therevolution against Indonesia’s perceived enemies of continuedimperialism and capitalism. 1 He believed that the cause of na-tional integration was best served by keeping up the revolu-tionary spirit and momentum, by infusing the whole people witha common national symbolism, by moving civil servants aroundwithin the country, by promoting “Indonesian” ways of doingthings, and by developing national pride and worldwide recog-nition through conspicuous foreign policy moves.
But through promoting national cohesion and unity at theemotional level, and in the political and sociocultural dimen-sions only, Sukarno ignored the reality of people’s other deeplyfelt needs and thus in some ways exacerbated divisions withinthe country. Some of the dissatisfaction found expression in thetwenty-one regional revolts that Indonesia experienced duringits first twenty years as an independent nation. 2 Needs notmet included those of economic development, improved stan-dards of living, increased infrastructure within, and interactionand trade among, the provinces, and the extension of socialbenefits to a larger proportion of the population. Valuable re-sources urgently needed for development were used instead onnoneconomic and prestige projects, on elaborate and expensivepresidential world tours, and on adventuristic foreign policyploys, such as the Konfrontasi policy against Malaysia.
The New Order government of President Suharto that cameto power after the abortive communist coup of 1965 thus in-herited a country with a low level of national integration. Sincethen, national integration, national stability, and economic de-velopment have been its major goals. The government has at-tempted to pay close attention to all the different essential di-mensions of national integration and to achieve a better balanceamong them. Many of the government’s efforts to promote na-tional integration have already been mentioned in the chaptersdealing with the separate dimensions of integration. Thepurpose of this chapter is to examine these in more detail andto evaluate them.
National Integration in Indonesia
213

POLICIES RELATING TO THE SOCIOCULTURALDIMENSION
In the sociocultural dimension, the Suharto government hassought to strengthen national identity and national unity by de-veloping a truly national and nationwide culture that both tran-scends and incorporates regional differences and overcomesthe disintegrative threats of modernization. 3
Major emphasis has been given to the promotion of the In-donesian language, bahasa Indonesia. 4 It is the sole official lan-guage of government, the medium of instruction beginning nolater than the third grade, and the dominant language of radioand television. The government has also actively promoted lit-eracy in Indonesian as a means of integrating the population.
The national education system, which was introduced in1945, has been carefully crafted to further national cohesion.All schools use centrally produced curricula and textbooks,written in Indonesian, that intentionally promote national prideand patriotism. To foster national unity, the curriculum at alllevels includes courses on the Panca Sila, Indonesia’s basic na-tional philosophy. Indeed, critics have charged that at timesinstruction on these matters tends toward indoctrination andthat the whole educational pattern in fact teaches intellectualconformity, requiring mostly memorization, despite a theo-retical commitment to the development of a scientific attitude,a critical ability, and a willingness to solve problems. Similarly,at the higher education level, despite official encouragement forstudents to engage in creative thinking and national dialogue,the government has taken a sharply repressive attitude towardpolitically oriented student activism and has attempted to re-strict student activities to scholarly societies. 5
The governments of Indonesia have consistently sought toexpand education at all levels throughout the archipelago andto reduce the regionally unequal educational opportunities in-herited from Dutch colonial days (when educational facilitieswere highly concentrated in Java). Universal education is re-garded as an end in itself as well as a means to improve livingstandards and the productivity of people and to unify the nation.Impressive steps have been taken to provide greater opportu-nities for education, particularly at the primary level, where at-tendance is now compulsory. Tens of thousands of new schoolsand classrooms have been built and hundreds of thousandsof new teachers trained, with the result that the governmentnow claims that almost every child of elementary school age
Government Response to the Need for National Integration
214

is enrolled in school. 6 Although the government’s estimatesare almost certainly overoptimistic, 7 it is clear that both thenumbers and the percentages of school-age children in ele-mentary school have increased substantially. This is also true atthe secondary level. 8 However, disparities among the regionsare still considerable, with much higher proportions of primary-school graduates able to find a place at lower secondary schoolsin Jakarta than in the Outer Islands (and especially in WestNusatenggara). Wide variations in test scores indicate also thata higher quality of education is available in Jakarta than ineastern Indonesia (where the average test scores in 1980 were44 percent lower on a test administered nationally to ninthgraders). 9
The geography of higher education is a simple extension ofthese disparities. Despite the establishment of government uni-versities in the capital city of every province, most of the publicuniversities and almost all private universities are in Java, andthe quality of teaching is higher there too.
But recently, major efforts have been made to increase boththe availability and quality of higher education. The percentageof nineteen to twenty-four year olds going on for higher edu-cation reportedly doubled between 1979–1980 and 1984–1985,from 2.5 percent to 5.1 percent. 10 In 1984 the government es-tablished an open university (Universitas Ter buka), with aninitial enrollment of 66,000 students, in a further attempt tospread higher education into the more inaccessible parts of thearchipelago, as well as to make it available to more of the over400,000 applicants for university (of whom only 70,000 were ac-cepted at the forty-three public universities in 1984). 11 The na-tionwide radio and television networks are also being used aspart of this outreach.
In another attempt to bring equity of access to qualityteachers to all regions of the country, especially the less-de-veloped areas, twelve universities in the eastern part of thecountry have been linked to the agricultural university in Bogorvia satellite in the new Indonesian Distance Education SatelliteSystem (Indess). 12 In an earlier overhaul of the universities,policies were adopted to raise standards, improve efficiency,and standardize the subject credit system so that students couldtransfer credits from one institution to another. 13 The tradi-tional system of university senates electing their own rectorsand deans was replaced by direct presidential appointments.Part of the purpose behind many of these reforms has been tointegrate as well as to upgrade the national education system.
National Integration in Indonesia
215

Official government policy toward the religious diversitywithin the country has been consciously integrative. Although88 percent of the population is at least nominally Muslim, thegovernment has tried assiduously to be inclusive rather than ex-clusive in its public policies. It has done this by stressing PancaSila as the state philosophy, thereby giving equal recognition toall the major religions and attempting to incorporate and unitepeoples of very different persuasions and cultures under thefirst sila, which affirms belief in one Supreme Being. Panca Silahas been emphasized also as a way of undercutting the strengthof Islamic organizations.
Since the overthrow and total discrediting of the Communistparty in 1965, the greatest perceived threat to the unity of thecountry has been from the more fanatical Muslim groups, es-pecially in the light of the recent resurgence of Islam in theMiddle East. The government has sought, therefore, to reducethe power and influence of Muslims within the country, and todepoliticize Islam by separating the political aspect of Islamfrom the religious and social, discouraging the former whileclaiming to encourage the latter. 14 It has strenuously resistedMuslim pressure for an Islamic state. Government checks onMuslim missionary activity (dakwah) have been imposed in aneffort to assuage feelings of anxiety among many religiouslyconcerned Protestants, Catholics, Hindus, and Buddhists, whofeel threatened by the very visible and much-felt dominance ofthe Islamic majority. 15 The traditional link between the longschool holidays and the annual Islamic fasting month of Ra-madan has been cut despite vigorous Muslim opposition. Andthe government (dominated as it is by Javanese Muslims whopractice a syncretic, Javanese spiritualism, based on earlierHindu-Buddhist beliefs, known as kebatinan) has redefined Ja-vanese mysticism as keper cayaan terhadap Tuhan yang MahaEsa (belief in One Supreme Being), thus qualifying it for in-clusion under the first sila of the Panca Sila. To practice ke-batinan is thus officially to uphold the Panca Sila. 16 Since 1974the government has encouraged a series of dialogues at localand national levels among leaders of all five official religions toreduce conflict among them. A Religious Consultative Body ofthe five official religions has been established to promote socialharmony (kerukunan) and tolerance both within and among thedifferent religions in this pluralistic society.
Yet the government has also made concessions to theMuslim community. It has restricted the missionary activityof other religious groups (particularly Christian) by requiring
Government Response to the Need for National Integration
216

that religious propagation be directed only at persons not al-ready professing faith in one of the five official religions. Ithas subsidized the building of mosques and religious schoolsand the establishment and operation of Muslim educational aswell as social organizations. 17 It has even pursued a deliberateIslamization policy in the provinces of Irian Jaya and East Timor,where the indigenous population is overwhelmingly Christian,by constructing mosques in the centers of all-Christian villages.In response to Muslim criticism, the government has alsobanned all gambling as mentally and morally destructive to so-ciety and contrary to the religious tenets included in the PancaSila. 18
Politically, Islam has been on the defensive in Indonesia eversince independence. In the wording of the constitution and itspreamble, Muslim pressure was rejected when the phrase “withthe obligation of Muslims to practice the shariah (Islamic law)”was omitted in the Jakarta Charter. More recently, during theNew Order regime, Muslims lost in their bid to revise the mar-riage laws to require all Muslims, including nominal ones, tobe married in Islamic ceremonies. In the simplification of thepolitical party system after the 1971 elections, the New Ordergovernment forced several Muslim political parties to mergeand become the Development Unity Party (Partai Persatuan Pembangunan, PPP), deliberately rejecting any reference to Islamin the PPP’s name. 19 In 1983 the government even went so faras to force this Muslim political party, as well as all other re-ligious, social, and political organizations, to accept the PancaSila as their sole ideological basis. This has been a particularlydifficult issue for Islamic groups, whose faith enjoins them toimplement their religion in their public as well as their privatelives. But in compliance with government demands, Islam isnow no longer openly the ideological foundation of the PPP; asa result, it has lost some of its attraction as a vehicle for chan-neling Indonesia’s Muslim aspirations. 20
This move has been seen by some as unnecessarilyprovocative and divisive, causing a growing cleavage betweeninstitutionalized Islam, led largely by well-to-do Muslims in thetowns and countryside, and the increasing numbers of moreradical Muslims, who regard the Panca Sila policy as blatantlyanti-Islamic and the regime as fundamentally hostile to Islam.The government has also been criticized for perpetuating thestatus quo by stressing unity and harmony over social changeand mobilization, and for concentrating too much power in
National Integration in Indonesia
217

the state bureaucracy, thus threatening the autonomy of socialorganizations and some personal freedoms. 21 Indeed, asAwanohara has expressed it:
The great stress on Pancasila underlines the government’s ex-treme concern for security and stability in a country where na-tional unity is still fragile. However, the irony is that the Pan-casila-as-the-single-principle policy, which is meant to consolidatenational unity by eliminating all conflicts based on ideological dif-ferences, because of the way it has been so forcibly pushed, runsthe risk of provoking a backlash that could threaten the very unityit has set out to achieve. 22
Friction has also arisen over the government’s banning ofthe kerudung (veil) and jilbab (women’s headdress) in state-runschools.
Despite government pressure and determination that Islamshould be developed and practiced only in the context of In-donesia’s national culture (and despite the spread of Chris-tianity in some areas, the government’s encouragement of Ja-vanese spiritualism, and the general wave of secularization ac-companying economic development), Islam as a religion hasbeen gaining strength. It has permeated the secular schools,government offices, and even the military. Nearly every majorbuilding has a prayer hall or prayer room, and mosques havesprung up everywhere. At universities mosques have becomecenters of Islamic activity, organizing both daily prayers andsocial work. Over 80,000 pilgrims a year make the hajj, andmore are paying the zakat tax for the benefit of the poor. 23 TheIslamic revival is reportedly creating groups of religious funda-mentalists and political radicals, although these are a small mi-nority; for there has always been considerable diversity withinIslam. Not only is there a difference between traditional,nominal abangan and devout santri, but there is a significantgap between fundamentalists and moderates, between thosewho believe it is impossible to separate religion from politicsor any other aspect of life, and those who support the depoliti-cization of Islam, believing that a pragmatic differentiation be-tween religion and politics is necessary for Indonesia to copewith the demands of modern times. 24
The Panca Sila, as the basic, integrative national philosophy,has been promoted increasingly in a variety of different gov-ernment strategies and policies. The government has estab-lished an institute to interpret and teach Panca Sila. In 1978 it
Government Response to the Need for National Integration
218
began a series of courses for all Indonesian citizens, beginningwith civil servants, known as the P-4 courses (a contractionof the Indonesian term Pedoman Penghayatan dan PengamalanPanca Sila, meaning a Guide to the Comprehension and Practiceof Panca Sila). Under this program, approved by the People’sConsultative Assembly (MPR), up to two million civil servants(including all below the rank of cabinet minister) have beenrequired to attend two-week upgrading courses, organizedthroughout the archipelago, whose purpose has been solely toexamine and understand Panca Sila within the framework ofthe New Order. As an official in the program expressed it, “thepurpose of the program is to unite the nation behind a soundideology that all will enthusiastically embrace.” 25 The courseshave since been extended to the universities and high schools,to religious leaders, and to other groups.
In the P-4 courses, Panca Sila has been explained as a tradi-tional philosophy of life, the articulation of the historical expe-rience of the Indonesian people, and something already existingwithin the people rather than imposed upon them from outside(in a deliberate attempt to dissociate the P-4 courses from theindoktrinasi that took place under Sukarno during the GuidedDemocracy period). It has emphasized the unity and cohesionof society rather than new directions or changes in the socialorder (and as such has been criticized for being an extraordi-narily static ideology, long on rhetoric and sentiment but shorton specific prescriptions). 26
Inevitably, the costs associated with the implementation ofthe P-4 courses have been considerable, both directly in pro-viding the facilities and instructors for the large numbers re-quired to attend and indirectly in the vast amount of timelost from carrying out regular government, teaching, or otherbusiness. Yet the fact that these costs are considered worth-while demonstrates the seriousness with which the New Ordergovernment sees P-4 as providing an important justification forits policies and its ongoing emphasis on national unity. 27
Besides language, education, religion, and philosophy ofstate, the Indonesian government has pursued integrativepolicies in other sociocultural fields as well. Yet its policy towardthe Chinese minority (which numbers about 3.8 million out ofa total of 165 million, about 2.3 percent of Indonesia’s popu-lation) has been somewhat ambiguous. On the one hand thegovernment has brought pressure to bear on the Chinese tobecome Indonesian citizens, change their names, and be assim-ilated. It has liberalized the nationalization law and reduced
National Integration in Indonesia
219

the waiting time for citizenship. In 1979, to “help develop In-donesian culture and nurture unity among the people,” 28 thegovernment banned the import, sale, and distribution of anyliterature printed in Chinese characters, although it has beensuggested that the read goal of the decree was for all ChineseIndonesians to lose their command of the Chinese language. 29
The government has also tried to protect Chinese enterprises,businesses, and people when anti-Chinese riots have brokenout, as they have periodically.
However, on the other hand, the Chinese continue to faceboth official and unofficial discrimination. In 1979 the ethnicChinese were required to be registered again and later wereissued identity cards marked by a special code to distinguishthem from pribumi (indigenous Indonesians). 30 A presidentialdecree (Keppres 14A/1980) provided for preferential treatmentfor economically weak pribumi firms and local businesses inthe selection of contractors for certain government projects, 31
and a number of additional stipulations were aimed at providingthe “economically weak groups” with more facilities to enablethem to compete with the “economically strong group” (i.e., theChinese). Even though Suharto argued that this policy of up-grading the economically weak groups was not a form of racialdiscrimination but was intended to achieve “equity in distrib-ution,” 32 it is dubious how many Chinese saw it as such. AsArndt has put it:
The problem in Indonesia has been how to strengthen the weakereconomic groups of pribumis vis-à-vis the Chinese with their su-perior business skills and resources, and how meanwhile to retainthe indispensable contribution of the Chinese to the nation’s com-mercial life while preventing communal tensions from eruptinginto open friction. 33
With ambivalent government support, the Chinese continueto be hated and resented, particularly by young, under- or un-employed pribumi. The Javanese have long held the view thatthe Chinese are culturally and economically arrogant. MostIndonesians feel especially bitter toward the Chinese busi-nessmen who finance and manage the business concerns ofthe pribumi government and military officials and amass unac-ceptably great wealth to the detriment of the ordinary citizensof the country. The close ties between the presidential familyand the wealthy Chinese tycoon, Liem Sioe Liong, are deeply re-sented.
Government Response to the Need for National Integration
220

In other policies relating to the sociocultural dimension ofintegration, the government has encouraged a variety of or-ganizations and programs to spread nationwide, transcendingregional and provincial boundaries. These include scouts, agri-cultural cooperatives, and village social associations. Major ef-forts have been made to expand both the availability and qualityof health care by increasing immunizations, building new com-munity health centers and subcenters, increasing the number ofhealth professionals including both doctors and paramedics, ex-panding the family planning program, and so on. In the arts, thegovernment has encouraged local artistic expression throughthe establishment of increasing numbers of art centers and tra-ditional arts groups and the documentation of regional intel-lectual and ceremonial traditions. The goal has been to create anew and vibrant Indonesian culture, incorporating diverse local,traditional elements while nurturing regional cultures and up-holding regional traditions. Policies have also been establishedto guide the national culture to cope with the “influence ofnegative foreign culture” while absorbing those positive alienvalues that are needed for development. 34 The government haseven set up an Institute for the Advancement of National Unity(Badan Pembina Kesatuan Bangsa).
Thus despite the difficulties, problems, and continued short-comings, much has been accomplished in the sociocultural di-mension of national integration in welding the very diverse andgeographically scattered peoples of the archipelago into onenation, and in giving them the sense of a shared historical her-itage and national pride, a feeling of participation in one na-tional culture, and a common Indonesian identity.
POLICIES RELATING TO THE INTERACTIONDIMENSION
Great efforts have been made, particularly since 1967, to im-prove the transportation network and communications systemsin an attempt to integrate the country more effectively. Theresults have been spectacular. As discussed in chapter 4, in-dependent Indonesia inherited an uneven and inadequate in-frastructure from the Dutch, one geared more to the needs ofa colonial regime than to those of a new nation-state. Eventhe limited infrastructure that existed was badly neglected inthe early years of independence, because of the Sukarno gov-ernment’s primary concern with symbolism and political inte-
National Integration in Indonesia
221

gration rather than with economic development. It was not until1967 that attention seriously began to be paid to the need to im-prove the transportation and communications systems.
In the light of this history, the New Order government hasmade impressive strides in improving and integrating thecountry’s transportation system. Thousands of kilometers of In-donesia’s roads have been rehabilitated and upgraded, and theroad network has been substantially expanded. A number ofWorld Bank loans and loans from the United States, Australia,and the Asian Development Bank have helped in the con-struction of the trans-Sumatra highway, the trans-Sulawesihighway, road projects in Kalimantan, and the beginning of anew trans-Irian highway parallel to the Irian Jaya-Papua NewGuinea border. Several new toll roads have been built and majorhighways in Java improved and repaired. Many bridges havebeen replaced and there has been a steady upgrading of ruraland rural-to-urban roads. City roads with heavy traffic are con-tinually being upgraded and new bypasses constructed, andferry crossings have been made more frequent and efficient.The intention has been to improve transportation while reduc-ing costs and to promote economic activity, as well as to im-prove the integration of areas thus linked together.
Some of the success of the improved road-building programcan be seen in the large increase in the number of vehiclesin the country. The number of buses increased from 20,000 to160,000 in the 1969–1983 period (an average annual growthrate of 16 percent), while passenger vehicles increased at an 11percent average annual rate, from 212,000 to 870,000, duringthe same period. 35 Particularly important, too, has been thegreat increase in the number of minibuses, pickups, and smalltrucks plying short-distance local routes, integrating villages,towns, and cities. Indeed, a virtual revolution seems to haveoccurred, at least in Java. For whereas fifteen years ago therewas still some substance in the stereotype of villagers who hadnever visited their neighboring town, now in many villages mostpeople under forty have spent at least some time working in thecity and have brought back with them a much more dynamicoutlook to the village when they returned. 36 The psychologicaldistance between village and city has been shortened dramati-cally. The improved and better-integrated transportation system(and particularly the quick, cheap, and frequent bus service be-tween cities) has led to greater labor mobility, with the resultthat workers now move much more freely and spontaneouslyfrom low-to high-wage employment; so much is this true that
Government Response to the Need for National Integration
222

there were signs in rural Java of an emerging labor shortagein early 1982 (despite a population of over ninety million inan area approximately the size of New York State) as villagersmoved to obtain higher-paying construction and other work incities both in Java and in the Outer Islands. And this increasein labor mobility is not restricted to Java, but is apparentthroughout the entire archipelago, extending even as far asIrian Java. 37
Railroad transportation also has been improved and mod-ernized. One of the goals of the fourth Five-Year DevelopmentPlan (Repelita IV) is to make rail travel inexpensive, fast, andsafe by improving management, rehabilitating and recon-structing railroad tracks and bridges, and adding and rehabili-tating passenger coaches, freight cars, and locomotives. Plansto upgrade and extend the rail network beyond the existing6,700 kilometers of rail track began to be carried out in 1981.38
Lake and river transportation has also been given attentionas an integral part of the surface transport network. Attemptshave been made to expand facilities and make them more effi-cient.
Improved transportation has also been achieved at sea.Major efforts have been made to modernize, expand, and im-prove the efficiency and capabilities of the interisland and localfleets, as well as to improve ferry crossings and shipyard, dock,and port facilities. 39 The capacities of both the national in-terisland merchant fleet and the local fleet increased by anaverage of 7 percent a year between 1969 and 1982, while ton-nage increased by 20 percent annually on ocean vessels and 6percent on local over the same time period. 40 Passenger trafficlikewise has risen enormously. Recent government efforts havefocused on increasing efficiency and productivity at the ports byreducing overregulation and corruption, by simplifying admin-istrative procedures, by rationalizing harbor handling and an-chorage fees, and by reforming the corruption-ridden customssystem. 41 An Inpres (Instruksi Presiden) Decree of April 1985abolished the protection previously received by domestic oceanshipping companies by opening up a large number of ports toforeign vessels. 42
Yet despite all the attention devoted by the governmentto interisland shipping, its performance still falls well belowthat of the early 1950s, when the Dutch-owned KoninklijkePaketvaart Maatschappij maintained very efficiently a compre-hensive network of services that was closely integrated through
National Integration in Indonesia
223

transshipment with the deep-sea lines. 43 Indeed, Dick arguesthat the improvements in interisland shipping have come aboutin spite of, rather than because of, government policies. Heclaims that it has been competition leading to better organi-zation in the use of space and in traffic flow rather than physicalupgrading that has led to improved shipping, and that gov-ernment regulations have tended not to promote but to retardthis process (as, for example, the compulsory scrapping of shipsmore than twenty-five years old and the restrictions on im-porting new and secondhand ships). 44 The regulatory systemhas tended also to discourage the more efficient firms from ex-panding, while helping the least efficient to stay in business.However, as Dick acknowledges, this is not entirely the faultof the government, as the Shipowners’ Association has consis-tently lobbied for the “rights” of the weak (generally pribumicompanies) while giving no support to the further expansion ofthe strong (often non-pribumi companies). 45
The fourth Five-Year Development Plan proposes improve-ments for four gateway ports (Jakarta, Surabaya, UjungPandang, and Belawan) to replace transshipment via Singapore,fourteen collector ports, and twenty-five distributor ports. Portfacilities are to be rehabilitated through the construction of newberths and storage facilities, the procurement of equipmentfor cargo handling and storage, dredging of the harbors, anddockyard rehabilitation. 46 The plan aims at increasing the totalcapacity of vessels in the interisland and local shipping fleets,the traditional sailing fleets, and the vessels serving remotecommunities and outlying islands.
The government continues to support and subsidize pioneertransport services to serve areas that are not attractive to com-mercial carriers. The pioneer fleet, which was designed to assistfarmers on isolated islands in marketing their produce and inbuying essential goods, serves about 175 small ports. 47
There has also been an impressive expansion of air traffic,particularly over the past eighteen years. Beginning with abroken-down fleet of thirty-five aircraft in 1968, the major gov-ernment airline, Garuda, has more than doubled and substan-tially upgraded the number and size of its aircraft, 48 and otherinternal airlines have expanded as well. New airports havebeen constructed and older airports and airstrips improved.Passenger and freight volume on domestic routes has increasedat annual average rates of 20 and 23 percent, respectively, be-
Government Response to the Need for National Integration
224
tween 1969 and 1982. 49 Pioneer routes to outlying regions thatoffer very few passengers are subsidized by the government inthe interests of national integration.
An enormous investment in the interisland communicationsnetwork has been made by a government very conscious of thevital role of mass communications in integrating a nation ofsuch great diversity and widespread geographical distribution.Perhaps most important has been the domestic satellite com-munications system, Palapa, first launched in 1976 and nowin its second generation of satellites (the Palapa B satellites).This has revolutionized Indonesia’s telex, radio, television, andfacsimile-and data-transmission services. Among other advan-tages, the system permits direct telephone dialing to any majorcity in Indonesia and has made telephone communication withisolated areas possible also. A multichannel microwave systemsupplements the domestic satellite communications system withits forty earth stations. Long-distance domestic telephone callsincreased at an annual rate of 6 percent between 1969 and1983, while local telephone calls increased at an astonishing 33percent annual rate. 50 During Repelita III‚ 232,000 automatictelephone lines were added to the system, and the number oftelephone lines available to business and residential users is ex-pected to double during Repelita IV as the state-owned tele-phone utility, Perumtel, installs some 750,000 additional lines.Modern digital switching exchanges, over 16,000 additionaltelex lines, and 100 small earth-satellite communication sta-tions are also planned for the 1984–1989 five-year developmentperiod. 51 Domestic telexes increased at a 35 percent annualrate between 1969 and 1983.
It has been especially through the expansion of television,however, that the government has sought to promote nationalunity; an understanding and appreciation of Indonesia’s diversecultures; and pride in its national cultural, economic, and ath-letic achievements. It has worked to develop a truly nationalculture, to integrate the entire archipelago, and to inspire andencourage national development. The geographical areacovered by television broadcasting more than quintupled be-tween 1975 and 1984, reaching an estimated audience ofninety-six million people in 1984 (up from forty million in 1975).52 In addition, the number of television sets increased from410,000 in 1975 to 5,343,000 in 1984, while the number oftransmission stations grew from twenty-three to 200 during the
National Integration in Indonesia
225

same time period. Thirty-eight thousand public television setshave been placed in villages in an attempt to achieve greaterevenness in information distribution. 53
Radio broadcasting by Radio Republik Indonesia haslikewise been extended both geographically, with the increasein the number of radio transmitters, and in the number ofbroadcast hours per day. One recent development has been thegreat increase in the use of ham radios (by an estimated onemillion amateur radio operators). In some provinces (such asBali), the number of transmitters is thought easily to exceedthe number of telephone lines. 54 The potential of radio broad-casting for increasing national integration and its effect on thenational identity could be enormous.
The value of the satellite communications system in inte-grating the country was demonstrated convincingly during the1982 elections, when television coverage from all over the arch-ipelago was able to “drive home to many Indonesians that theyhad just participated in a great national undertaking.” It alsoenabled the votes to be counted more quickly than in past elec-tions. 55
Postal services have been expanded to cover all of In-donesia’s regions, including remote villages and new transmi-gration settlements. Eight hundred new post offices are plannedto be established during Repelita IV, enabling 58,028 of thecountry’s 65,000 villages to benefit from regular postal service.
Thus, great progress has been and is being made to inte-grate the country in terms of improved transportation and com-munications systems.
POLICIES RELATING TO THE ECONOMICDIMENSION
It is probably in the economic field, however, that the greatestthreats to national integration occur. For it is the gap betweenthe rich and the poor, the problems of unemployment and un-deremployment particularly in the cities, the contrast betweencities and rural areas, and the unequal standards of living andinequality of opportunity among provinces that provoke thegreatest dissatisfaction and unrest. Even the ethnic problem be-tween the Chinese and pribumi Indonesians is largely an eco-nomic one.
Government Response to the Need for National Integration
226

Economic disparities among the provinces exist partly be-cause of the uneven spatial distribution of the resource base,but partly too because of very uneven treatment by the gov-ernment both during the colonial era and in the early years ofindependence. By the beginning of the Suharto era in the late1960s, therefore, there were already strong regional inequal-ities and contrasts among the provinces, as already demon-strated in the previous two chapters. Only then did attentionseriously begin to be paid to national economic planning anddevelopment. Indeed, it has been one of the major premisesof the Suharto government that economic development andgrowing prosperity promote national integration and bluntfriction among the different ethnic groups within the country. 56
Even though the Suharto government recognized these re-gional disparities as being important, the first Five-Year De-velopment Plan (1969–1974) focused upon the reestablishmentof political and economic stability. 57 It emphasized economicgrowth, rather than equality, to secure the main needs of societyand to reestablish the country’s economic credibility. An im-pressive 8.4 percent annual growth rate during Repelita I wasindeed attained, but the Plan’s stress was upon strictly sectoralplanning. 58 Consequently, the greatest growth occurred inthose provinces already well endowed with infrastructure oralready experiencing growth. In addition, economic protectiongiven to the modern sector, to medium-and large-scale enter-prises, resulted not in phasing out the dual structure of theeconomy, but instead in reinforcing the dichotomy betweenurban and rural labor markets. It also created a new dualismbetween the formal and informal sectors, particularly in urbanareas. 59 The cost of economic growth during the first Five-YearDevelopment Plan was, therefore, a further increase in the eco-nomic disparities among both peoples and regions.
Part of the purpose of Repelita II (1974–1979), 60 therefore,was to confront the unequal rates of development betweenrich and poor provinces, and to “raise the living standards ofthe whole people.” 61 This plan sought to widen opportunitiesfor employment and achieve a more equitable distribution ofincome. 62 It emphasized regional development and set out toachieve a balance between regional and sectoral growth by in-cluding regional targets in the planning activities of each ofthe central government’s sectoral ministries. It contained goalsin five basic areas: (1) to reap the highest possible benefitsfrom the potentials of the different regions, both from the na-tional development point of view and from that of the indi-
National Integration in Indonesia
227

vidual region; (2) to harmonize the rate of growth among theprovinces and to improve conditions in the poorest provincesby allocating at least a proportion of all development activity tothem; (3) to help provincial governments solve their large-scaleprovincial problems; (4) to encourage regional developmentthrough the establishment of provincial planning boards (BadanPerencanaan Pembangunan Daerah [Bappeda]); and (5) to inte-grate the Indonesian economy into one economic unit. 63
To achieve these goals, the country was divided into a hier-archy of development regions, each with its prospective growthcenters: four major regional metropolises, ten regional devel-opment centers, and eighty-eight smaller subcenters (seeFigure 7.1). 64
Theoretically, attention has been given all along to the goalof economic equity, from the earliest days of Indonesia’s in-dependence. The fifth sila of the Panca Sila speaks of socialjustice for all the people of Indonesia. It was not until the thirdFive-Year Development Plan (1979–1984), however, that equitywas placed first in the trilogy of Indonesia’s interrelated devel-opment goals: equity or spreading the benefits of development(pemerataan), a reasonably high economic growth rate, andhealthy and dynamic national stability. 65 Major emphasis wasplaced on attaining greater equality in eight areas of socioeco-nomic development: meeting basic needs; providing more equalopportunities in obtaining education and health care; obtainingmore equal distribution of income, with special attention to thelowest income groups; the creation of more employment oppor-tunities with high priority on employment-generating and labor-intensive projects; more equality in business opportunities, es-pecially for the economically weak groups; more equal opportu-nities to participate in the development process, especially foryouth and women; more equitable distribution of developmentactivities throughout all the regions of Indonesia; and moreequal opportunity of obtaining justice before the law. 66
The government’s commitment to greater equity in eco-nomic development has been constantly reiterated in officialpronouncements. In his 1981 Independence Day speech, Pres-ident Suharto stressed the New Order’s determination to “en-hance the material and spiritual wellbeing through efforts thatgive priority to the equitable distribution of development gainsleading towards the creation of social justice.” 67 The Broad Out-lines of State Policy (Garis-garis Besar Haluan Negara) adoptedby the People’s Consultative Assembly (MPR) in 1983 directedthat the overriding goal of the fourth Five-Year Development
Government Response to the Need for National Integration
228

Figure 7.1. Development regions and growth centers in Indonesia.
Plan (1984–1989) should be to raise the standards of living, in-tellectual abilities, and general welfare of all the people. Theyalso stated that Repelita IV should create an environment thatprovides every incentive and opportunity for all to participateand perform fully and harmoniously in the national developmenteffort; that more emphasis should be given to equity in the de-velopment trilogy, while at the same time ensuring that thethree elements of equity, economic growth, and national sta-bility are in constant harmony and mutually reinforcing. 68 Atthe fortieth anniversary celebrations of Indonesia’s indepen-dence in 1985, President Suharto again confirmed his com-mitment to distributional equity and recommended boosting thedevelopment of outlying regions, spreading around infrastruc-tural development projects, and stepping up transmigration. Asone critic put it, the government’s growing preoccupation withthe problem of equity stems from an awareness that stayingwithin the limits of tolerable inequities is a condition for main-taining the momentum of development as well as for staying inpower. 69
National Integration in Indonesia
229

Various strategies have been tried to fulfill governmentpromises of greater equity in the fruits of development and thushelp the poor achieve some benefits from the economic growthof the country. In the 1970s huge government subsidies on foodand fuel were established, and regulations were implemented tocontrol the prices of nine essential commodities (bahan pokok,including rice, sugar, salt, kerosene, and fertilizer).
Policies have been formulated to try to synchronize the paceof development in the regions. The relatively less-developed re-gions have been encouraged to achieve higher rates of growthin conformity with their potentialities, while equity has beenpromoted within each region itself by having both central andregional governments give special attention to isolated, lessfertile, and other problem areas. Efforts have been made to de-velop greater transportation and communications links betweenthese least-developed regions and other, more prosperousareas. Increased central government grants to the regionsthrough the Inpres (Instruksi Presiden) program have beenused for the development of infrastructure and the provision ofdrinking water, health facilities, elementary schools, irrigation,credit schemes to aid rural hawkers and others in the rural pop-ulation, and other social services. There has been an emphasison job-creating public works programs and labor-intensive en-terprises in both rural and urban areas. The government iscommitted to a further expansion in public spending, which isexpected to lead to an increase in the demand for consumergoods and in spending on labor-intensive programs. This in turnshould “directly improve the position of those sectors of thepopulation whose increases in income have lagged behind theaverage in recent years and whose standards of living have re-mained very low.” 70
But there is also recognition among government policy-makers that economic equity has to be balanced with economicgrowth, especially in a country with a fast-growing populationand in an era of rising expectations. In overall terms, Indonesiahas experienced an impressive rate of growth. Between 1969and 1980 the economy grew at an average rate of 7.4 percent.(Population grew during the same period at a rate of 2.3percent, leaving an actual annual increase in the gross domesticproduct of 5.1 percent.) 71 These solid gains resulted mainlyfrom increased OPEC oil prices and increased liquified naturalgas sales, but manufacturing production also rose impressivelyduring the 1970s, at an average rate of 12.3 percent. 72 Major ef-forts to boost rice production have met with enormous success:
Government Response to the Need for National Integration
230

Indonesia went from being the world’s largest importer of ricein 1975 to self-sufficiency by 1985. 73 New technologies in manysectors of the economy have raised productivity, as haveeconomies of scale (realized when larger factories producemore items at a lower unit cost). 74 Electricity production in-creased at an average annual rate of 17 percent between 1973and 1984 (from 2,494 million to 13,296 million kilowatt-hours).75 However, economic growth slowed in the early 1980s to lessthan 5 percent per annum, thanks to the world recession, per-sistent high interest rates, growing worldwide protectionism,drought in the countryside, and the falling price of petroleum(which still made up about 70 percent of Indonesia’s exportearnings at the beginning of 1985). 76
Manufacturing industry has been strongly encouraged by agovernment that wants to lessen its dependence upon oil andgas exports; indeed, government policies have met with consid-erable success. Manufactured goods have increased from a tiny2 percent of all exports at the beginning of the 1970s to an im-pressive 17 percent in 1984. 77
However, it has been in the more capital-intensive ratherthan in the labor-intensive industries that most growth hastaken place, even though it is the small-scale and householdor cottage industries that account for about 80 percent of thetotal manufacturing employment. 78 Yet it is this very dualitythat poses a dilemma for policy makers. Should effort and re-sources be directed to labor-intensive, small-scale, and cot-tage industries to increase employment and reduce poverty,or should they be concentrated on medium and large firms inthe modern sector where labor productivity is much higher, topromote greater economic growth? Unemployment and under-employment affected approximately 26 percent of the formallabor force in 1984. 79
Since 1969 there have been interesting changes in the gov-ernment’s objectives for industrial development. Repelita I em-phasized industries ancillary to agriculture; Repelita II empha-sized social objectives, particularly employment and the pro-tection of pribumi entrepreneurs. Broad-based industrial de-velopment based on domestic oil, mineral, timber, and othernatural resources, and labor-intensive manufactures for exportwere the focus of Repelita III; in the current plan, RepelitaIV, manufacturing is to take the place of the oil sector as themain focus of growth, to provide a stronger and more diversifiedbase for economic development. The plan aims at further ex-panding import substitution, increasing net foreign exchange
National Integration in Indonesia
231
earnings, and providing a substantial number of jobs for theestimated 9.3 million workers who are expected to enter thelabor force over the next five years. 80 The goal is to promotemachinery, machine-tool, and export industries, especially thosethat process raw materials into intermediate products withhigher value added. This, it is argued, would also help to correctthe regional imbalance of manufacturing industries, as mostof the raw materials are found in the Outer Islands (and sofar most of the manufacturing industries are in Java). Severalresource-based growth centers are thus expected to emergein the Outer Islands, based on oil and gas, wood, fertilizer,and aluminum-smelting industries in North Sumatra; oil andgas, coal, tin, forest, plantation products, petrochemicals, steel,and cement industries in South Sumatra; oil and gas, petro-chemicals, and forest-based industries in East Kalimantan; andiron, nickel, paper, cement, and shipping industries in SouthSulawesi. 81 Repelita IV also recognizes the need for better in-tegration of small, medium, and large industries, so that devel-opment of medium and large industries will directly acceleratethe development of small ones. In addition, it should assistsmall-scale industry in the Outer Islands to overcome problemssuch as low productivity, intermittent employment, inadequatefinancing, limited marketing, poor quality control, and othermanagement problems. 82
The recent rapid growth in manufactured exports illustratesthe government’s policy of export substitution in the plywoodand crumb-rubber industries (even though the net economicbenefits of this policy of regulated industrialization are small).83 This, as expected, has decreased exports of unprocessedtimber and rubber.
New technologies have flooded into many sectors of the In-donesian economy, raising productivity: Green-Revolution tech-nology, with its emphasis on improved hybrid seeds and use ofchemical fertilizers, pesticides, and irrigation, has affected ricecultivation especially. Improved transportation and communica-tions services, the increased availability of electric power, im-provements in management and the numbers of skilled people,and increased economies of scale have been other importantcomponents. 84
But the government has not been concerned just with eco-nomic growth. Rural development has been a major objectivesince the beginning of the third Five-Year Development Plan.It emphasized community participation in planning and imple-menting rural development programs, and better village ad-
Government Response to the Need for National Integration
232

ministration and coordination of development activities. An am-bitious ten-year program to increase the plantation sector’slevel of earnings has focused on small-holder plantation devel-opment, in keeping with the government’s priority of seeking awider geographical dispersion of development and a more equi-table distribution of income. 85 The government has shifted to afar greater reliance on incentives, extension, and local partici-pation in the area of rice production than in the past. 86 Somesquatter farmers and shifting cultivators have been given titleto land and helped to produce export crops through the Nu-cleus Estate Program, begun in 1977. Cooperatives have beenstrongly encouraged, not only to distribute fertilizer and rice,but to deal with all basic needs, including other small-holdercrops, kerosene, handicrafts, fisheries, shipping, and transport.87 Electricity facilities have been extended to rural areas toupgrade rural business enterprises and small-scale industries,agriculture, and education. 88
Urban development has focused on specific growth centers;small and medium-sized cities have been encouraged ratherthan the growth of large cities. Indeed, Repelita IV aims at ac-celerating the development of industrial growth centers and in-dustrial zones, and at establishing centers for small industriesthroughout the country to facilitate the growth of small-scalemanufacturing. Meanwhile a “Neighborhood ImprovementProgram” has been directed at improving the quality of life oflower-income groups in urban areas through the constructionof low-cost housing and the provision of social services suchas safe water supplies and health and educational services.89 Investment outside Java has been particularly encouragedthrough a mixture of incentive and disincentive measures as an-other means of evening out development.
Decentralization of the development budget has been oneof the government’s most important tools in its new policy em-phasis on equity. The Inpres Kabupaten scheme, inaugurated in1970, and the provision of earmarked grants to the provincesfirst began this trend of channeling development expendituresthrough local governments rather than through central gov-ernment departments. By the early 1980s there were eightInpres programs in operation: grants to provinces, kabupaten(districts), and villages; grants for the construction of primaryschool buildings, for health infrastructure, particularly clinics;for road rehabilitation; and for reafforestation/regreening. 90
Grants to the provinces in 1981–1982 ranged from Rp ten billioneach for provinces in Java to Rp 7.5 billion each for provinces
National Integration in Indonesia
233

outside Java. Kabupaten development grants for construction ofinfrastructure were based on population size; plans had to beapproved first by the provincial government, then by Bappenas(the National Development Planning Agency). But the use of thesubsidies to the villages (Rp one million per village, of which atleast Rp 200,000 were designated for women’s activities) had tobe approved only by kabupaten officials and not by any higherauthorities. The result has been that more projects have beenaccomplished more quickly, and regional government officialshave gained in both experience and skill.
Inpres grant procedures thus take account both of high pop-ulation densities through per-capita grants and of low densityand poor infrastructure through proportionately larger in-creases in provincial grants to provinces outside Java. 91 Re-gional officials now administer ten times as much revenue asthey did ten years ago. And, in an attempt to overcome the lackof technical skills at regional levels, detailed specifications, es-pecially for buildings, have been provided by the central gov-ernment. 92 Greater local participation in government contracts,in contrast to previous heavy reliance on large national con-tractors, has resulted from a series of regulations issued in1979 as presidential decrees (Keputusan Presiden or Keppres).Repelita IV promises a continuation of the Inpres funds to bemade available directly to provincial, district, and village au-thorities, thereby allowing these bodies to continue to exerciselocal judgment on development planning. It also calls for bettercoordination among the disparate projects in the region andamong government agencies and argues for the strengtheningof the regional development planning bodies (Bappeda).
Other evidence of the government’s commitment to pemer-ataan includes the establishment of a Directorate for RegionalDevelopment. This Directorate has undertaken programs inabout half of Indonesia’s provinces to reach the rural poorthrough credit, employment, industrial, and other activities; todevelop greater capability in planning and executing programsat the provincial and kabupaten level; and to increase the ca-pability of central government agencies to support the develop-ment of local government. 93 These programs concentrate onmore densely populated kecamatan (subdistricts) and can be di-rected toward any of a number of projects such as production,employment, infrastructure, or welfare. Direct grants have beenmade to the poor, and technical assistance and training pro-grams have been funded for provincial kabupaten and keca-matan planning units. 94
Government Response to the Need for National Integration
234

Recent experiments to enhance equity and encourage localinitiative through wide-ranging pilot projects have been un-dertaken through the Provincial Area Development Program(PDP). This program has focused on aiding underdeveloped dis-tricts and on assisting low-income people directly through nu-merous small projects rather than concentrating investments onstrategic growth poles and hoping that the benefits will trickledown to the masses. The PDP is seen as an important way to in-crease participation in development and bottom-up planning. 95
Government-financed credit programs have been made in-creasingly available for small businessmen, craftsmen, andtraders through the Bank Rakyat Indonesia, and at theprovincial level through regional development banks. At thekecamatan level, loans through the Badan Kredit Kecamatan(BKK, the subdistrict credit board) have been particularly ef-fective in channeling assistance to poor rural households. 96
The government’s transmigration (resettlement) programhas been expanded to a multi-objective program from itsoriginal purpose of moving people from overcrowded areas ofJava and Bali to the Outer Islands to achieve a more even dis-tribution of population in the country. It is also intended toprovide manpower for the labor-scarce areas outside Java, Bali,and Lombok, so that they can develop as centers of growth,particularly for agricultural production. It is hoped that thiswill both attract the spontaneous migration of landless peoples,thus improving their living conditions, 97 and increase regionaldevelopment. Transmigration is designed also to be “a vehicleto promote national stability and integration.” 98 However, asdiscussed earlier, it is also perceived as an attempt to extendcentral government control over, and achieve Javanization of,parts of the Outer Islands. 99
At least in theory, therefore, the government is committedto a trilogy of development goals that are regarded as mutuallyreinforcing and interdependent: equity (or the evening out ofinequalities, pemerataan), economic growth, and national sta-bility. 100 However, although the economic planners insist thatsuch goals are harmonious, critics have argued that the evi-dence suggests otherwise. Encouraging growth through greaterefficiency at Indonesia’s ports, for example, has led to morestreamlined operations and increased containerization; yet thecosts and fruit of this have been distributed very unevenly.One underlying cause of the riots in Tanjung Priok, Jakarta’sport, in 1984 was the poverty and increasing suffering of dockworkers negatively affected by these changes. Increased use
National Integration in Indonesia
235

of new hybrid, high-yielding varieties of rice has led to thegreater use of scythes in harvesting. But such harvesting needsfewer laborers (men) and thus eliminates a traditional source ofwomen’s income (harvesting with the traditional single-bladedknife, the ani-ani). 101 Meanwhile, stability has been purchasedby increased centralization of authority and repression ratherthan by greater participation and by seeking consensus on howto overcome the tensions created by growth and uneven devel-opment. The greater central government presence within therural sector has led to the decline of village self-governmentand traditional patterns of reciprocity and to the advancementof the more privileged local classes within rural society, withtheir greater access to government resources and their abilityto control them. Sociopolitical stratification has underminedthe goals, for example, of agricultural cooperatives and ruralbanks, for these have become dominated by local elites, whohave prevented many small farmer and lower-income house-holds from gaining access to the various benefits and servicesthat these institutions were designed to provide, such as agri-cultural credit, fertilizer, extension information, and marketingservices. Without basic structural reform at the village level toallow greater access to land and other productive resources, itis dubious how much real development and equity can be at-tained. 102
But overall, national economic growth and relative politicalstability have led to a general improvement in living standardsthroughout the country. According to a July 1980 public-opinionpoll conducted by the respected Indonesian newsweekly Tempo,a considerable majority of the population felt substantiallybetter off than they did ten to fifteen years earlier. 103 Certainly,the government assessment of the general level of popularwelfare is favorable. In his Independence Day speech in August1985, President Suharto stressed that the “various basic neces-sities for people, such as food, clothing, public housing, edu-cation, and health facilities, are increasingly better and moreevenly distributed.” 104 And improvements in transportation andcommunications and in the variety and availability of goodseven at the village level are striking to any returning visitor.
Yet critics have also been quick to point out that there isa wide gap between the impressive plans and theories of eco-nomic development espoused by the government and the im-plementation of these policies; and that although pemerataanis much talked about, uneven development has continued andeven been promoted by government policies, leading to growing
Government Response to the Need for National Integration
236

interregional disparities and an increasing gap between richand poor. Paauw claims that much of the income generated bythe upsurge in export earnings from extractive products (par-ticularly petroleum and natural gas) has been narrowly dis-tributed within the capital-intensive sector, with a large shareaccruing to the government and to individuals associated withlarge-scale government enterprise. Employment opportunitieshave not kept up with the growth of the labor force, so that in-creasing numbers are being forced into low-income agricultureand underemployment or unemployment in the urban sector.He suggests that the distribution of income, productive assets,and wealth have thus become more unequal during the pastdecade of Indonesia’s planned growth. 105 MacDougall chargesthat economic progress has failed to improve living standardsamong the bottom 30 percent of citizens and has not dealt withthe grave problems of unemployment; underemployment in low-paying, low-productivity jobs; severe disparities of income; andcorruption. 106 White found that inequality had increased signif-icantly in his village-level studies of employment and income insome of the poorer communities of rural Java; 107 and Hughesand Islam conclude that although there has probably been anoverall decline in rural inequality in Java, there has been an in-crease in rural inequality in the Outer Islands because of thegeneral decline there in rural expenditure levels relative to thenational level. 108 They also found that urban inequality hadrisen very sharply in Java and that there had been a large in-crease in urban-rural income disparity in Java as well. 109 Ingeneral, therefore, it appears that although the proportion ofthe population in poverty has dropped significantly, from 57percent of the population in 1970 to about 40 percent in 1980,absolute numbers of poor people have remained fairly stableover the past decade. 110
The plight of the poor thus remains very serious. A WorldBank Report in 1980 noted that “a significant portion of In-donesia’s population remains among the poorest in the world‚”and that the development process has not really had a favorableimpact on the welfare of rural poverty groups. 111 In 1976 theper-capita consumption of more than fifty million Indonesianswas less then $90 per annum; life expectancy at birth was alow forty-eight years, and 600,000 infants died each year belowthe age of one. Illiteracy rates were high, and over 100 millionpeople had no access to safe drinking water. Nearly half thepopulation received less than 85 percent of the recommendeddaily allowance of calories. 112 Since then, the rupiah has been
National Integration in Indonesia
237

devalued three times: in 1978 by 33 percent, in 1983 by 28percent, and in 1986 by a further 31 percent. 113 The subse-quent rise in prices has hurt particularly those at the bottom.Increased consciousness of their poverty and of the lifestylesof the wealthy has serious implications: a public-opinion pollin July 1981 showed that more than 50 percent of those ques-tioned considered the greatest danger to national unity to besocial disturbances between rich and poor. 114 The World Bank’s1984 restricted report states that the still very high magnitudeof poverty constitutes the major challenge the country faces. 115
Equality is easier to legislate than to implement. For ex-ample, when poverty in the rural areas results partly from theconcentration of land in the hands of a few individuals, whenup to 50 percent of the population in some villages do not ownland, and unemployment is high, it is still much easier to discussland reform than to bring it about. 116 Little has been done sincethe 1960s; and even when attempts at land reform have beenmade, these have not always been successful. Government land-reform policies promoted rural unrest in both 1978 and 1979,and the riot in Jenggawah in East Java apparently originatedfrom the unfair redistribution of land. It seems that many ofthe programs that have been aimed at the poor in fact havereached only limited numbers, and some government measuresthat were designed to achieve greater equality in economic de-velopment may actually have done the opposite. Even Suharto’sstrong support for increased rice production, on the groundsthat it is crucial for political stability as well as for successfuleconomic development, seems to have been biased in favor ofurban consumers and benefited farmers who produce surplusesrather than helping poorer subsistence farmers. 117
Similarly, the government subsidies on food and fuel (whichamounted to $2.4 billion in the 1981–1982 budget) 118 inpractice benefited those who purchased these commoditiesrather than those who lived at subsistence levels (and usedfirewood for fuel). It has been charged that the subsidy onkerosene especially in Java, though helping to preserve the eco-logical balance in an environment that is seriously threatenedby the cutting of firewood on steep slopes, encouraged over-consumption and waste. Domestic consumption of kerosene inthe late 1970s grew at 7 percent per annum, far faster thanthe 2.3 percent rate of population growth, while domestic con-sumption of all petroleum products grew at an annual rate of12 percent. 119 Oil was thus diverted from export purposes (andforeign-exchange earnings), while subsidies took an increasing
Government Response to the Need for National Integration
238

proportion of the budget that could otherwise have been usedfor further development projects. This was finally recognized in1983, when subsidies were cut substantially: the food subsidywas discontinued and the oil subsidy cut back, although the fer-tilizer subsidy was retained. 120 The government’s goal now isto have the prices of essential commodities reflect their marketvalue by the end of Repelita IV in 1989. 121
Questions have also been raised about whether the gov-ernment village-aid programs (Inpres) for the construction ofroads, bridges, and schools encourage local initiative and devel-opment efforts or instead kill local creativity and bolster depen-dence on the government; and whether the much-sought-after“participation” in development is instead actually perceived asa burden, as orders to be carried out. In many village “self-helpprojects” the poor frequently become passive observers ratherthan active participants. 122 Even cooperatives have not workedwell. They have been promoted by the government rather thangrowing from local community initiatives. Thus, they suffer fromlack of effective control by the members themselves and conse-quently are not trusted. 123 Indeed, critics have asked whetherthe government would even accept, let alone welcome, compe-tition from community-based initiatives.
Despite the government’s oft-repeated commitment togreater equality and to raising living standards through labor-intensive projects and small and middle-sized industry, muchhas been spent on large, highly capital-intensive enterprisesand on the import-intensive sectors of power generation, in-dustry, and mining. 124
Use of money on projects such as the Nurtanio aircraftplant is highly questionable. Between 1976 and 1985 over $500million was spent on Nurtanio’s development plan, and tens ofmillions more in state funds will be needed before the companyis able to stand on its own a decade from now. Yet Suharto’sprestige is intimately bound up with its success, because he uni-laterally initiated the program and has steadfastly supported itin his belief that it would help Indonesia take off industrially inthe mid-1990s. 125
In response to the slump in the world economy in the early1980s and the decline in oil prices in the mid-1980s, the gov-ernment decided to continue its level of investment in mostmajor industrial and “developmental” projects. Projects werethus kept going that created profits for the regime’s leaders(and foreign backers), while the three major devaluations of therupiah against the U.S. dollar and the reduction or abolition of
National Integration in Indonesia
239

subsidies on basic commodities increased the cost of living andthus disadvantaged the ordinary people. Retrenchments, cutsin wages and allowances, and shorter working weeks have alladded to people’s difficulties. 126
As oil revenues decline further and as more revenues haveto be generated from taxes on goods, services, and property andfrom taxes on international trade, lower-income people will beeven more seriously affected. Their share of the tax burden willincrease, because among lower-income groups the proportionof consumer expenditures used to buy the commodities most af-fected by excise taxes (kretek [clove] cigarettes, sugar, alcohol,and beverages) is quite large.
Meanwhile, the benefits from export revenues have accrueddisproportionately to the small section of the urban populationwith better education and access to government jobs. 127 Eventhough Garnaut argues that the accompanying expansion ofmodern employment and income has resulted in significantnumbers of Indonesians enjoying substantially higher materialstandards, the expanded employment opportunities in themodern sector have not been large enough to have a majorimpact on labor in the traditional sector. Real wages have notrisen, while unemployment and underemployment have. Andwhile employees in the traditional sector have gained little ornothing in higher wages, the traditional producers of cash cropsfor export have received lower real incomes as a result of theresources boom. 128
Although some of the huge increases in natural-resourcerevenues in the past have been used for subsidies and publicprojects such as rural facilities and schools, the great bulkof public expenditure has been concentrated in activities thathave provided few direct benefits to people in the traditionaleconomy. Meanwhile, much work remains to be done on ruralvillage infrastructure: roads and small bridges, irrigationcanals, small dams, rural water-supply projects, warehouses,markets, and so on. Booth and McCawley conclude that al-though the 1970s was the best decade in Indonesia’s recordedhistory for sustained economic growth, too many opportunitiesfor reform were missed as development efforts remained oil-de-pendent, capital-intensive, and Jakarta-centered. 129
Increases in protectionism between 1983 and 1985, seenin the growing list of goods that cannot be imported becausethey are produced locally, have also had mixed results, stim-ulating the production of domestic engineering and industrialproducts, but also creating inefficiencies and misallocation of
Government Response to the Need for National Integration
240

investment and hindering economic growth. A good example ofthis two-sided effect of protectionism is the import ban on newand secondhand ships: this has protected the domestic ship-building industry but has significantly raised costs for transpor-tation and thus prices for goods that are shipped. The ban isalso inconsistent with the objectives of the important Presi-dential Instruction (Inpres No. 4) of April 1985, which wereto reduce handling and transport costs for exports as well asto simplify the administrative procedures governing interislandand foreign trade. 130
It has been argued that the government with its overreg-ulation and bureaucracy seems more concerned with mea-surable, tangible results than with the process of developmentand changes in orientation and attitudes. Decentralization inthe system of planning, implementation, and supervision isneeded, so that the aspirations and potential of the commu-nity can be fully accommodated in programs developed “frombelow.”
Hendrata has commented that a major problem thwartingdevelopment is the traditional paternalistic bureaucracy whichhas
a much stronger orientation to above than below, an overly strictobservance of procedure even if it means sacrificing efficiency;an aversion (or perhaps an inability) to act as a creative and dy-namic manager taking calculated risks to achieve optimal resultsin line with sound business principles; an emphasis on appearingto be a “ruler” rather than a “servant” of the community; a pater-nalistic attitude toward the people and subordinates based on theconviction that “Father knows best”; plus a doubt as to the abilityof the people to find solutions for their own problems. 131
Meanwhile, the inequality between Java and the Outer Is-lands continues. Despite a theoretical commitment to theevening out of economic inequalities by encouraging economicdevelopment in the Outer Islands, most investment, both do-mestic and foreign, has been in Java. From 1967 through April1984, the government licensed 787 foreign investment projectsworth some U.S. $9,368 million. Of these, 560 (71.2 percent)were located in Java (with ninety-five projects worth $2,957million in Sumatra, fifty-eight projects involving $447 millionin Kalimantan, and eleven projects worth $274 million in Irian
National Integration in Indonesia
241

Java). 132 In addition, development funds from aid donors havebeen heavily concentrated in resource-rich or already relativelyindustrialized areas. 133
Arndt argues that the regional imbalance between Java andthe Outer Islands has been aggravated through the still furtherconcentration of industry, urban development, and decision-making power in Jakarta and through the relative neglect of theleast-developed regions, particularly in eastern Indonesia. 134
Even within Java there is considerable concentration of in-dustry. Despite the official goal of encouraging new industries inrural areas, over half of all the employees in large and medium-sized industries in the early 1970s were concentrated in justtwenty of Java’s eighty-two kabupaten‚ and that pattern seemsto have been continued. Despite a government commitment tothe growth of small and medium-sized cities, Jakarta has almosttripled its population over the past twenty-five years, from 2.97million in 1961 to 4.58 million in 1971 to an estimated 8.16million in 1986. 135
Meanwhile, within the Outer Island provinces, despite a gov-ernment commitment to rural and equal development, hugeindustrial enclaves have been created, such as the Asahan alu-minum project in North Sumatra and the natural-gas-based,large-scale industrial complex around Lhokseumawe in Aceh,that have few trickle-down effects on the regional economy.
Perhaps at the root of the problem is the controversy overthe underlying assumptions of Indonesia’s developmentprogram. The government’s position has been that a basic con-dition for reaching the targets of development is undisturbednational stability. This explains, at least according to somecritics, why the New Order government is actually pursuinga “trickle-down” strategy of development, despite its officialcommitment to pemerataan (the equitable distribution of de-velopment efforts and their benefits); for it is committed tomaintaining the social order without fundamental change. 136
Critics charge that the government has overemphasized se-curity, the fear of regional disintegration, and the threat of com-munism in efforts to hold on to its own power, thus curbingfreedom of thought and action, creativity, and basic humanrights. 137 They maintain that the increasingly centralistic andauthoritarian government has become rigid and is stifling localinitiative. 138 Even the Director of the National Institute for Eco-nomic and Social Research, Education, and Information notedthe existence of too much paternalistic government bureau-cracy, overregulation, and excessive supervision. 139 Despite of-
Government Response to the Need for National Integration
242
ficial recognition of the need to devolve authority for regionaldevelopment to the provinces themselves, power instead hasbeen increasingly centralized. Measures taken to promote eco-nomic integration have frequently backfired: in 1975, for ex-ample, provincial customs and export duties were prohibited inorder to promote greater economic integration of the countryand to stimulate interisland trade. But this move left theprovinces with no legal source of foreign exchange and thusfinancially weak. As power has become more concentrated inJakarta, a brain drain of the more able and better-trainedprovincial leaders to Jakarta has occurred. The effect has been,on the one hand, provocation of regional and local resentmentand, on the other, the further development of dependent atti-tudes among provincial administrators remaining in the daerah(regions). These attitudes have made local officials hesitantto take development initiatives and too accustomed to centralgovernment handouts to do anything but wait for anticipatedcentral government help and directives.
Currently, nearly 80 percent of total public expenditure inthe provinces is disbursed through the national budget and con-trolled by ministries and agencies headquartered in Jakarta,leaving only about 20 percent of the funds to be administeredby the provincial governments. Of this 20 percent, about halfcomes from Inpres funds; only half comes from locally raisedtaxes and levies, and these tax sources are strictly controlled bythe central government. There is a strong need for more decen-tralization and deconcentration to allow local governments andregional branches of national bodies headquartered in Jakartato make more decisions. 140
The government has also been unable to deal firmly with theincreasingly pervasive problem of corruption. Although periodicattempts are made to control corruption, only minor officialshave been apprehended, while flagrant abuse among seniorgovernment officials goes unheeded and is carefully covered up.Yet there is an awareness that the fall of a number of ThirdWorld governments has had its roots in corruption that riddledthe state; there is also a recognition that the experience andlessons of history had better not be ignored. 141 Editorials innewspapers and newsmagazines in Indonesia periodically focuson the corruption issue, recognizing the institutionalized cor-ruption in the country and calling for enforcement of the Anti-Corruption Law. Renewed government efforts to deal with theacknowledged widespread corruption in all government depart-ments, though, seem to have met with only limited success.
National Integration in Indonesia
243

Pauker, however, argues that corruption may not be asharmful to the economic system as is generally assumed. Cer-tainly the petty corruption that results from inadequately lowsalaries for civil servants delays and obstructs the economicprocess and is “a socially harmful form of indirect taxation.”But he argues that the much bigger form of corruption thatcomes from the “symbiotic relationship between political powerand economic entrepreneurship actually expedites economicgrowth.” Politically influential Indonesian military men andcivilians, who often lack business skills, help authentic entre-preneurs, who are often foreigners or ethnic Chinese, to im-plement projects that would otherwise be obstructed by thegraft-seeking lower bureaucracy. They also help to obtaincredits from official sources for those most capable of using themoney productively. 142 As Pauker sums it up, the harm done bycorruption in high places is not so much economic as sociopo-litical: it erodes the authority of the ruling elites, causes dis-trust in government, and lowers resistance to radicalism. 143 Ithas been suggested that such corruption is likely to lead eitherto destabilizing radical political upheavals or to the increasinglyharsh repression of its critics by the government, the latter ofwhich appears to be taking place.
However, the damage done to the economy is neverthelessconsiderable. Import and other monopolies in such majorsectors of the economy as steel, plastics, cement, insurance,and food restrict competition and thus lead to inefficiency andpermit mismanagement. In addition the companies controllingthese monopolies, which have links with Suharto’s family andfriends, provide enormous profits for their owners. It has been“conservatively estimated that the entire system of privilegegenerated hundreds of millions of dollars in revenue each yearfor the companies involved.” 144 Much of this profit supports ex-travagant lifestyles and is invested outside the country.
Indonesia’s economic policies came under heavy criticism inthe early 1980s from World Bank experts in a confidential draftdocument entitled “Selected Issues of Industrial Developmentand Trade Strategy.” The report charged the government withcreating policies that misallocated economic resources and thusthwarted Indonesia’s long-term economic and social devel-opment goals. Using the principle of comparative advantage asits underlying premise, the report advocated fewer governmentcontrols rather than better controls over economic activity. 145
Government Response to the Need for National Integration
244

Perhaps here is one of the clearest examples of culturalmisunderstanding and opposing social and political valuesystems. World Bank experts, with their emphasis on capitalism,growth, economic efficiency, and the free-market system, arenot culturally attuned to Indonesia’s priorities or fully cognizantof the importance of social and political constraints impingingon economic decision making in Indonesia. Granted, there isthe generally accepted need for economic reform through re-ducing licensing inefficiency and unwieldy bureaucracy, and forthe simplification and reduction of government regulations, butthe Bank’s recommendations for a shift toward a more outward-looking, export-oriented trade policy run counter, at least tosome extent, to the government’s officially accepted goal of pe-merataan (equitable distribution), which at least in the past im-plied domestic production and import substitution rather thanexport-oriented manufacturing for earning foreign exchange.Similarly, the Bank’s recommendation for a shift from “an ad-ministratively determined allocation system to a price-deter-mined one” is in direct opposition to Jakarta’s emphasis onencouraging pri- bumi (indigenous Indonesian) entrepreneursthrough preferential treatment. The free-market World Banktheories grated also against the Indonesian government’s in-herent distrust of an uncontrolled private sector, and the Bank’sdesire to open up the Indonesian economy to attract greaterWestern investment ran up against the Indonesians’ great sen-sitivity to economic domination by foreigners. 146 As one criticsummed up the situation, for Jakarta’s technocrats the WorldBank’s recommendations may have been theoretically neat, butthey were politically and historically inept. 147
But despite all the criticisms of the government’s economicpolicies, the assessment of Awanohara, Habir, and Handley ina recent overview of Indonesia is that economic progress hasbeen shared remarkably evenly throughout the vast Indonesianarchipelago, given the urgent needs and superior political cloutof the cities, the difficulties of transport and communications,the faltering bureaucracy, and the inclination of the military-dominated central government to concentrate power in Jakarta.Evidence can be seen in the consistent growth of rice outputover the past fifteen years; in the construction of roads, schools,and piped water; and in other new economic activitiesthroughout the archipelago, much of which would not havehappened without these government policies. 148 Certainly, thecountry’s agricultural sector has grown rapidly, industrialoutput has increased dramatically, average per-capita income
National Integration in Indonesia
245

has soared (from about $100 per annum in 1965 to $650 in1985), and a substantial middle class has developed since In-donesia declared its independence in 1945; and the disparateelements of commerce, industry, and agriculture have beenforged into a national economy with a considerable degree ofnational economic unity. 149
CONCLUSIONGovernment policies, therefore, have been of great importancein promoting and strengthening national integration. In the so-ciocultural field, diverse peoples from a great variety of ethnicand cultural backgrounds have been encouraged to emphasizetheir common sociocultural unity and identify more closely withone another as fellow Indonesians. Knowledge and use of thenational language have been strongly promoted, and, througha variety of educational, social, and cultural organizations,greater cohesion attained.
In the interaction dimension, great progress has been madein improving and expanding the transportation and communi-cations networks, thus reducing the former isolation of manypeoples and areas, especially in the Outer Islands. Mobility hasincreased significantly. And through the domestic satellite com-munications system especially, the different parts of the countryhave been brought into much closer and more effective commu-nication with one another.
In the economic dimension, government policies have beenimportant not only in encouraging and directing economicgrowth but also in attempting to ensure that the benefits of de-velopment are distributed more equitably than they would be ina free-market economy. Not all of the government’s economicpolicies have been successful, however, and progress towardthe goal of greater economic equity has been undermined alsoby corruption and bureaucratic mismanagement.
Inevitably, Indonesia still has a long way to go in creating afully integrated nation-state, but the distance the country hascome already is both impressive and encouraging.
Government Response to the Need for National Integration
246

8Retrospect and Prospect
AS THE earlier chapters have illustrated, national integrationis a vast, multifaceted, and enormously complicated concept.Not only does it consist of a number of major dimensions, eachwith a multitude of component parts, but these dimensionsare integrally intertwined, each affecting and being affected bythe others. Moreover, events or trends in each dimension canproduce integrative results at one level and disintegrative ef-fects at another. This book has attempted to draw together awide variety of material from many diverse sources in a com-prehensive study of the geographical aspects of national inte-gration. It has included an examination of the major dimensionsof integration, an analysis of their spatial patterns, and a con-sideration of the impact of government policies on the country’spatterns of cohesion. This chapter includes both an overviewand a discussion of some of the major problems confronting In-donesia’s national integration in the late 1980s.
The concept of national integration itself is remarkablycomplex. Obviously, this book is not a conclusive study: morecould be added to the discussion of the four major dimensionsthat have been considered here—historical and political, socio-cultural, interaction, and economic—as they relate to nationalintegration. And further work needs to be done in analyzingmore precisely the interrelationships of their many components.Inevitably, questions also remain about the best way to quantifythe dimensions once defined. The present analysis has beenlimited by the available data. The lack of data has both ne-cessitated the omission of significant aspects of the concept ofnational integration, such as the feelings, perceptions, and at-titudes of people in different parts of the country toward thenation-state, and at times forced the use of surrogates, suchas road density rather than the preferred numbers of inter-provincial travelers. In addition, some of the available data are
247

of dubious validity, meaning that both they and the statisticalanalysis based on them have to be regarded cautiously and crit-ically.
Another problem relates to the time element. Although inte-gration is a dynamic concept, and the historical chapter has ex-amined changes in the levels and processes of integration in thepast, the major part of this study has been concerned with theconditions of national integration as they exist at a cross sectionof history, during the limited time frame of the 1970s and early1980s.
The results of the analysis are also a reflection of the scaleselected. As discussed in chapter 1, the province has been usedas the unit of analysis mainly for practical reasons, as mostdata are available only at that level. However, the great con-trasts in both area and population size among the provincesnecessitated standardization of the data, leading inevitably tothe introduction of certain distortions, because no index canadequately encompass both population and area differences atthe same time. The use of the province as the areal unit ofanalysis has also camouflaged wide intraprovincial differences,which at times may be of more significance than interprovincialdifferences in assessing the strength of national integration.In particular, the role of the urban centers in their respectiveprovinces may have been distorted, because their data havebeen averaged with those of the entire population of the prov-ince in which they are located. This seems to have affected par-ticularly the status of South Sulawesi in the overall analysisof integration and may also have unduly accentuated Jakarta’spreeminence at the expense of West Java. The patterns of na-tional integration would be found to be much more intricateif a smaller unit of analysis, such as the kabupaten (district)had been used. 1 But even use of the kabupaten would havepresented difficulties, as it too is related more to areal thanto population size. 2 Indeed, no unit can be perfect in mea-suring differences in both population and area, especially whenthe geographic realities include such great contrasts in popu-lation distribution as exist in Indonesia (where Java contains 62percent of the population of the country but has less than 7percent of its land area).
However, despite the limitations caused by problems of ex-pressing the concept of national integration in Indonesia inmeasurable terms and of obtaining relevant, accurate, and suf-ficiently detailed data, the study depicts a very interesting,complex pattern of integration. In place of the Java-Outer Is-
Retrospect and Prospect
248
lands core-periphery model that has been used so widely in theliterature to describe Indonesia, the study demonstrates con-vincingly that a far more complicated pattern exists. In manyways, at least as far as per-capita characteristics are concerned,Java has been mislabeled as the core, for despite its high pop-ulation density and well-developed infrastructure, it does notexhibit many of the characteristics associated with a core, espe-cially in the sociocultural and economic dimensions of nationalintegration. Java generates less than a third of the country’sgross national product while consuming a disproportionateshare of the country’s revenue; meanwhile, almost three-quarters of Indonesia’s poor live in (mainly rural) Java. In re-ality, only Jakarta emerges as the national, dynamic, urban core,surrounded by a diverse periphery, with no obvious decline inthe level of integration associated with increasing distance fromthat core. The contrasts among the Outer Island provinces ona per-capita basis, particularly between some in Sumatra andKalimantan on the one hand and some in eastern Indonesia onthe other, are far more striking than any Java-Outer Islands di-chotomy. The poverty and underdeveloped character of Westand East Nusatenggara, even in comparison with Java, is espe-cially marked and contrasts sharply with conditions particularlyin East Kalimantan and North and South Sumatra.
If this new interpretation of the core and periphery is ac-cepted, it helps our understanding of the unequal developmentpatterns of the past and can affect regional planning and policydecisions for the future. As demonstrated in chapter 5, Jakartahas been the focus of a disproportionate amount of both do-mestic and overseas investment, largely because of its status asthe capital city and core of the country, with its cumulative ad-vantages of a more highly developed infrastructure, labor pool,local market, and center of decision making. The importancefor business and industry of physical proximity to this centerof economic and political power cannot be overemphasized ina country like Indonesia where telephone communications areless dependable and less effective than in the West, and wherepersonal contacts are so important in cutting through the mazeof bureaucracy.
Yet this excessive investment in and around Jakarta hasprovoked widespread resentment. As one of Indonesia’s owncritics, Alisjahbana, so expressively described it in the late1960s, Jakarta, as the source of all finance and decision making,
National Integration in Indonesia
249

has become the leech, sucking blood from the body of the fish,growing fatter while the fish (Indonesia), losing blood, getsthinner. 3
Jakarta’s location on Java and its domination by Javanesehave had widespread ramifications for the pattern of economicdevelopment in Indonesia as a whole. 4 Political pressure fromtens of thousands of poor Javanese and Sundanese migrants toJakarta (the great majority of whom come from West Java), andfrom the educated unemployed in the city, is obviously far moreimmediate than pleas for attention and investment from moreremote Outer Island provinces, especially the poor ones. In ad-dition, there is a natural tendency for Javanese leaders to favortheir own suku (people) before attending to others in the OuterIslands, whose different cultures and needs are both strange tothem and not clearly understood or respected. Thus, the amountof government revenue spent in Java, and especially in Jakartaand West Java, is out of proportion to its comparative land areaand even to its relative population size. 5 Furthermore, importsflow into Java far in excess both of its exports and of importsinto other parts of Indonesia.
Yet the government, aware of the need for greater spatialequality in development, has made pemerataan (the evening outof development) a top priority in its interrelated trilogy of de-velopment goals—spreading the benefits of development, eco-nomic growth, and national stability—and has made efforts todisperse investment and government projects to all areas of thecountry. But policies designed to attain a better balance in eco-nomic development among the different regions of the countryrun into an almost insoluble dilemma. Obviously, for the sakeof regional development and spatial economic equity, it is nec-essary to restrict uncontrolled economic growth in Java andencourage manufacturing activities in the Outer Islands; yet ef-ficiency and growth considerations, not to mention the severeproblems of poverty, unemployment, and underemployment onJava, underscore the essential need for increased investmentthere.
Thus, the problems Indonesia faces in terms of both nationalintegration and national development remain enormous. Popu-lation pressure continues to rise inexorably. The 1980 censusrevealed that population had grown in the previous intercensalperiod (1971–1980) at an annual rate of 2.34 percent, despitevigorous government support of family planning. 6 This figure
Retrospect and Prospect
250

translates into a population increase of twenty-eight million be-tween 1971 and 1980 and an estimated further growth of sev-enteen million between 1980 and 1985. 7
Meanwhile, population distribution has become increasinglyuneven, in real even though not in percentage terms, despitegovernment commitment to the transmigration program, whichrelocates landless people primarily from Java and Bali to moresparsely populated areas in the Outer Islands. Indeed, the trans-migration program is able to resettle only a small proportion ofthe annual population increase of Java, and at enormous cost.8 The disparity in population densities between Java and theOuter Islands has increased significantly over the past twentyyears. From an average density in 1961 of 476 per square kilo-meter in Java and nineteen in the Outer Islands, average den-sities increased to 690 and thirty-one, respectively, by 1980. 9
Obviously, these figures camouflage the even greater contrastsexisting among individual provinces (for example, betweenCentral Java, the province with the highest population density[outside Jakarta and Yogyakarta], with 742 per square kilometeron the one hand, and the province with the lowest density, IrianJaya, with three per square kilometer on the other). The gapbetween Java and the Outer Islands thus grows ever wider, atleast as far as population numbers and density are concerned.And the over half a million Outer Islanders who have movedto Java over the past fifteen years have partly counteractedthe government’s transmigration efforts, both by adding to thenumbers already in the urban areas of Java and by drainingsome of the most creative and dynamic talent from the Outer Is-lands.
The pressure on land resources in Java is immense. Of Java’sestimated 100.5 million people in 1985, over thirty-five millionwere landless, and these numbers are increasing yearly. An-other estimated forty million do not own enough land to liveon, as the average size of land holdings continues to decline. 10
One unfortunate result of Green Revolution technology, whichhas boosted rice production and helped to make Indonesia self-sufficient in rice, has been the growing gap between rich andpoor farmers. Only richer farmers can afford both the addedcosts of hybrid seeds, fertilizer, pesticides, and so on, and theelement of risk involved. In consequence, cultivated land hasbecome increasingly concentrated in the hands of the few. By1980, 60–70 percent of the cultivated land in Java was owned
National Integration in Indonesia
251

by just 10 percent of the population, 11 and the percentage ofsmall farmers having less than half a hectare rose from 46 to 63percent between 1973 and 1980. 12
Rural-to-urban migration is another major problem, becausenot only do the new urban migrants swell the numbers of theunemployed and underemployed, but they also put great strainon the existing social fabric as well as on already inadequatephysical facilities (water supply, fuel, sanitation, housing, andso on). Although the rates of urban growth have been relativelylow (Indonesia is considered only 22.4 percent urban now, com-pared with 17.2 percent in 1971, and the growth is due partlyto a change in both the definition of urban and the location ofurban boundaries), the sheer numbers of new urban dwellersare staggering: 12.3 million in less than ten years. Nowhereis the problem of rapid urbanization more clearly seen than inJakarta, which has increased its population by over three anda half million people in just the past fifteen years. 13 Its popu-lation in 1986 totaled an estimated 8.2 million (more than theentire population of Kalimantan’s four provinces) and probablyis considerably higher than these official estimates, as thou-sands live in West Java, outside Jakarta’s official boundaries,and commute to work or take up short-term residence in the cityand so are not counted as permanent residents. It is estimatedthat more than 70 percent of Jakarta’s population live below thepoverty line (earning less than $22.50 per month), inhabitingslum dwellings with almost no potable water, sanitation facil-ities, or medical services. 14
To avert growing dissatisfaction, particularly among theyoung unemployed, the government has located investmentdisproportionately in the cities, rather than focusing it in therural areas in an attempt to keep people there, assure rea-sonably full employment, increase rural incomes, and thusreduce rural-to-urban migration. The gap between urban andrural areas has thus widened over the past twenty years.Indeed, it has been suggested that Java might do well to em-ulate the South Korean and Taiwanese experience of village de-velopment; in these two countries villages are both 100 percentliterate and 100 percent electrified. Locating small-scale indus-tries in the villages of South Korea and Taiwan has also ensurednot only an extra source of income for farm families but vir-tually no rural unemployment as well. In contrast, at the be-ginning of the 1980s Java’s 35,000 villages were only about 65percent literate and less than 10 percent electrified. As a surveyin 1979 indicated, better irrigation, better roads, more schools,
Retrospect and Prospect
252

more credit for small-scale industries and workshops, and moretechnical training were objectives Javanese villagers sought. 15
It has also been argued that although rural development is nota sufficient condition for rapid economic growth, it is a majornecessary condition in the early stages of that growth. 16 Thewidening income gap between agricultural and nonagriculturalworkers also needs to be addressed. 17
Other major economic problems remain. Despite the factthat the World Bank upgraded Indonesia’s classification to thatof a lower middle-income country in 1982 (with an estimated av-erage gross national product per-capita figure of $560 in 1985),18 over fifty-seven million people remain extremely poor.
Part of the national economic problem arises from the de-pendence of Indonesia upon the petroleum sector for almost 70percent of its total budget, a reality that has left the countryvulnerable to price fluctuations. Plans based upon continuedprojected increases in oil prices had to be scaled back whenOPEC in the early 1980s reduced Indonesia’s production al-location in response to falling oil prices, the world recession,and an increase in non-OPEC-produced oil. By 1986 economicproblems caused by the major slump in world oil prices hadbegun to shake the country. These were accentuated and com-pounded by the reduced demand for some of Indonesia’s otherexports, such as tin, rubber, and palm oil; by decreased foreigninvestment in the country; and by growing protectionist senti-ments in the West against Indonesia’s increased export of man-ufactured goods. Further, continued spending on imports and asignificant problem with capital flight have caused difficulties inthe balance of payments and added to a steeply rising foreigndebt burden. 19 The grave drop in government income has ne-cessitated a cutback in government spending and a total re-vision of the country’s development plans. The question nowseems to be whether Indonesia will be able to meet the risingexpectations of its population (which have been brought aboutto some extent by the increase in both the interaction andeconomic aspects of national integration) or whether people’sgrowing discontent and frustration with economic austerity willspill over into political and social unrest. Government concernwith this problem, however, began long before the 1986 crisis:as early as April 1981 commercial advertising was banned fromnational television, in large part because it led to rising expec-tations that the government could not hope to fulfill. 20 But thesituation is much more critical now.
National Integration in Indonesia
253

Another major economic-related problem is the growing andincreasingly conspicuous gap between rich and poor, both be-tween the rural poor and urban rich and between the urbanelites and the extremely poor city dwellers. Partly because oftelevision coverage and improved communications, ordinary In-donesians are much more aware of the wealth of multimilli-onaire generals, government leaders, and relatives of the pres-ident, and of the luxurious life-style of the rich and powerfulin contrast to their own struggles to survive. They hear of howland formerly owned by poor transmigrants has become partof extensive, privately owned plantations; of the wealth of theChinese and other foreign traders with high government con-nections; and of the increased profits of middlemen even thoughcommodity prices do not change. They struggle with the higherprices they have to pay because of import monopolies, protec-tionist regulations, and government controls of the economy.They hear about the illicit fortunes amassed by the families ofdeposed presidents such as Duvalier in Haiti and Marcos in thePhilippines and have no trouble recognizing the analogy to theirown country.
In the political field the country faces similar dilemmas oftrying to balance national with regional needs, and the need forpolitical control and stability with that for political participation.
The political consensus in Indonesia has always been fragilebecause of the existence of ethnic, religious, cultural, and his-toric diversities and conflicts. Despite the considerable progressthat has been made in developing a feeling of “Indonesianidentity” among the widely differing peoples of the archipelago,deep-seated regionalisms and local ethnic pride continue tothwart full political as well as sociocultural integration. The po-litical problem centers on how much to allow these regional dif-ferences to be reflected in regional autonomy and how muchpower to retain in the central government. The newly inde-pendent government of Sukarno quickly discarded a federalform of government for a unitary system. And despite the ar-guments of former Vice-President Hatta that a devolution ofpolitical, administrative, and fiscal authority would be more re-sponsive to local needs and conditions, the New Order gov-ernment of Suharto has sought to centralize power and exertever-increasing control over the entire archipelago. This policyinevitably has met with resistance.
Serious regional discontent and unrest still fester in a fewareas of the country. In Aceh (northern Sumatra) the NationalLiberation Front of Aceh (NLF) is still active in its struggle for
Retrospect and Prospect
254

independence from Indonesia (which its separatist leaders pro-claimed at the end of 1976), and claims of large-scale militaryrepression have been made. 21 Simmering discontent survives inareas of Maluku, and in many other areas there is unhappinesswith the power and pervasiveness of the central government.
In East Timor there remains deep disenchantment with andresistance to Indonesia’s annexation of the territory in 1976.Reports from its Jakarta-appointed provincial assembly havecharged that corruption, brutality, and other abuses of power(including ignoring local customs and behaving as conquerors)by some in both the army and administration are causinggrowing fear and anti-government feeling as well as economichardship there. 22 Despite Jakarta’s financial assistance, it isclaimed that living conditions have worsened. 23 In addition,there is considerable resistance to and resentment of the gov-ernment’s much vaunted goal of asimilasi.
Irian Jaya remains the locus of further regional dissatis-faction and periodic unrest. Although the government has grad-ually and effectively consolidated its control over the province,and although the Organisasi Papua Mer deka (OPM, Free PapuaMovement) is officially banned, its followers continue to beactive, especially in the eastern border area, in their seces-sionist attempts to wrest Irian Jaya from the Indonesian gov-ernment and achieve independence. As in the other areas ofunrest within the country, much of the cause of the trouble isattributable to the presence of “outsiders,” predominantly Ja-vanese, who run the affairs of the province and who, with theirculturally superior attitudes and insensitivity to local customs,as well as their Islamic faith, offend the indigenous inhabitants.The transmigration of Javanese to all three areas is perceived bysome not as a “civilizing mission to promote their welfare andlagging economic development,” but as one of the “most blatantland robberies in history.” 24
Indeed, Javanese influence is a problem throughout theOuter Islands and is one dimension of the whole core-peripheryproblem, because the government is excessively controlled byJavanese. Not only has the government experienced increasedJavanization, but so too has the military. For example, by 1980all twelve territorial military commands in the Outer Islandswere in the hands of officers from Java (eleven Javanese andone Sundanese [from West Java]); thus not a single Outer Is-lands territorial command was held by a “native son‚” whereasthe commands in Central, West, and East Java were all heldby native sons. The overwhelming power of the Javanese in the
National Integration in Indonesia
255

high commands can be seen also in the officer corps; 89 percentof military officers were either Javanese (80 percent) or Sun-danese (9 percent). 25
The conflict between the need for political control and po-litical participation is also sharp. Suharto believes in strong po-litical control partly to ensure national stability, itself a basiccondition for development and integration. 26 Indeed, over thepast twenty years Indonesia has enjoyed a relatively high levelof political stability, unlike many developing countries. But esca-lating criticism has emerged, particularly in the last few years,that the Suharto government has become increasingly author-itarian and repressive as its support base has narrowed. 27
Notwithstanding Suharto’s appeal to the Panca Sila and the1945 Constitution, there have been serious signs of discontentamong some of the country’s former senior government leadersand politicians, discontent that has been firmly put down. Theresult is a growing isolation of the New Order’s hierarchy fromthe people, with only a few reaping the benefits of power. 28
Little has been done to develop the political and judicial in-stitutions that the country so badly needs. In addition, there isserious concern that Suharto is personally adapting the NewOrder concepts to preserve his own executive control over theelectoral process; that he has legitimized such extra-constitu-tional institutions as Kopkamtib (the Operational Command forthe Restoration of Security and Order); 29 and above all that heis attempting to become the personification of the Panca Silaand the Constitution of 1945, so that any criticism of him isinterpreted as being an attack on the basic institutions of thestate. Awanohara reports a vague but widely held notion thatSuharto is becoming more and more like a Javanese king andIndonesia like a traditional Javanese empire, feudalistic, stulti-fying, and unsuited to meeting the challenges of modern times.30
Discontent with poverty, social injustice, and abuses ofpower by the authorities in the rural areas is widespread.Perhaps at the root of the pervasive dissatisfaction is a generaldisillusionment about the New Order society and the gov-ernment’s ability to deal with the country’s many ills. Two mainissues stand out: the lack of real political participation despitethe veneer of democratic institutions, and a misguided eco-nomic development program that has fueled corruption on agrand scale and exacerbated the gap between rich and poor. 31
Retrospect and Prospect
256

Political participation is encouraged only during the elec-tions that take place under highly controlled conditions everyfive years. Elections are regarded by the Indonesian gov-ernment as an important demonstration of democracy (despitethe existence of a military-dominated administration), a legiti-mation of the regime, and an endorsement of the government’sdevelopment policies. However, elections are also to impressforeign democratic governments, particularly those of the Inter-Governmental Group on Indonesia, and to ensure their contin-ued support. However, only 39 percent of the 920 delegatesto the People’s Consultative Assembly (MPR, Majelis Per-musyawaratan Rakyat) are elected by popular vote and thenonly after careful screening of the candidates by government se-curity forces. 32
Fear that the strength of the political parties would un-dermine the power of the Suharto regime (as well as the offi-cially given reason that uncontrolled political parties and elec-tions would accentuate tensions and divisions among the pop-ulace as they did in 1955 during Sukarno’s time) led the NewOrder government to place severe constraints on the politicalprocess. Political parties have been restricted in their cam-paigning, and Golkar (Union of Functional Groups), an army-initiated and government-sponsored organization, has been ac-tively promoted as an alternative to the traditional parties.
After the 1971 elections, when nine major political partiescompeted, the government sought to streamline the processand create two weak parties that could easily be controlled andmanipulated. 33 It therefore forcibly consolidated the variousMuslim parties into one umbrella organization, the Partai Per-satuan Pembangunan (PPP, Development Unity Party), and theremaining five non-Muslim parties into the Partai DemokrasiIndonesia (PDI, Indonesian Democratic Party). These restruc-tured parties have suffered from destructive internal faction-alism, weak leadership, 34 and a series of government rules andregulations restricting political activity to the kabupaten (dis-trict) level and progressively decreasing the preelection cam-paign period (to sixty days in 1977, forty-five in 1982, andtwenty-five in 1987).
Meanwhile, although the government denies that Golkaris a party, it functions very much like one. Yet as an official,government-sponsored institution, it has a number of advan-tages over the political parties: for example, it has access togovernment facilities in finance, transportation, and communi-cations; it has greater freedom to campaign at all levels in In-
National Integration in Indonesia
257

donesian society; and it has been able to exert considerablepolitical pressure by coopting, coercing, and manipulating localvillage officials. 35
In addition, Golkar institutionalizes the army’s role in po-litical and civilian life. As Pye put it:
Golkar represents a remarkably effective organ for enforcing andlegitimizing the domination of the military in Indonesian politics.Hostility toward army rule is directed against Golkar, yet sinceGolkar represents all elements in Indonesian society through itsfunctional groups, it is hard to be hostile toward it. 36
The armed forces in each election have become actively in-volved on behalf of Golkar, despite the fact that they are rep-resented directly in the Dewan Perwakilan Rakyat (DPR, Houseof People’s Representatives) by 100 delegates (out of a total of460) selected by the president.
Unrest has focused both on the composition of the People’sConsultative Assembly (MPR) and on the continuing dominationof the military in the government. The Working Group of the Pe-tition of Fifty (an opposition group of former senior ministersand political leaders) has openly questioned whether the pres-ident should continue to appoint one-third of the Assembly,claiming that this arrangement was adopted in 1967 as a tem-porary measure only, with the idea that subsequently the wholebody would be elected. 37
Distinctly controversial also is the continuing and increasingrole of the military in government administration; for the mil-itary, who make up only 0.36 percent of the population, forma distinct ruling class, controlling all essential governmentalbodies and state-owned enterprises. 38 By 1982, active or retiredmilitary men occupied half the positions in the Indonesianhigher central bureaucracy; at the highest levels military pen-etration is nearly complete (the president and his principalimmediate aides) or has increased (coordinating ministers) overthe course of the New Order regime. 39 Military personnel dom-inate the affairs of every Cabinet department. Their involvementin almost every facet of public life is considered by the gov-ernment to be part of their dwi fungsi (two functions): the mil-itary’s role not just to protect the nation in wartime but also tohelp with nation building. Inevitably, however, there are thosewho would like to see the restoration of a fully civilian govern-ment and the return of the military to their barracks.
Retrospect and Prospect
258

The role of Indonesia’s economic development program inpromoting national integration has also come under attack ona number of counts. The government’s main expectation, thateconomic development would lead almost automatically togreater cohesion and political stability as more people were sat-isfied and had their needs met, is highly debatable; for eco-nomic development always leads to rising expectations, whichare all but impossible for a government to meet. In addition,economic development, by unleashing new forces in society,almost inevitably creates as many new problems as it solves.It has been argued that economic development leads to suchchanges as industrialization, urbanization, and increases in lit-eracy and mass-media exposure, which in turn expand politicalconsciousness, multiply political demands, and broaden thedesire for greater political participation on the one hand, butalso tend to undermine traditional sources of political authorityand traditional political institutions on the other. 40 The prob-lem, therefore, arises of how to adjust the political system soas both to preserve political stability and to allow for greaterpolitical participation and development. Oey argues that underthe New Order, political consciousness and demands for greaterparticipation have increased tremendously; yet these have notyet been absorbed constructively by new and strong institu-tions. 41 The MPR and DPR, which could channel at least someof this development, lack legitimacy because of their undemo-cratic basis. Golkar also is not in a position to act as a stronginstitution because it is government controlled and lacks thegenuine support of the masses at the grass-roots level. Oey con-cludes that the inevitable result will be an increase in politicalinstability and disorder in the years ahead. 42 The recent wavesof student demonstrations and bombings; the arbitrary arrest,intimidation, interrogation, beating, and imprisonment of op-position leaders and of anyone who dares to criticize the gov-ernment; the mysterious killings by the death squads; and themuzzling of the national press are but some of the evidence ofthis increasing authoritarianism and repression. 43
Critics of Indonesia’s economic development program pointalso to the increasing disparities in the income and developmentlevels in different parts of the country as demonstrated in thisstudy, disparities that result from uneven economic growth andgovernment policies that have frequently exacerbated ratherthan reduced them. In addition, they are concerned about thecollusion between government and big business and about howthe development program has affected corruption in the
National Integration in Indonesia
259

country. For the problem of corruption has grown enormouslyin magnitude in recent years, partly because of the increasedopportunities offered by a vast bureaucracy administering apervasive regulatory system of government controls over all as-pects of economic life and partly from the plethora of money en-tering the country from foreign governments, companies, andinternational organizations, and from oil and other revenues.As discussed in chapter 7, corruption now affects almost everypart of Indonesian life and society and may even have becomeaccepted as the norm by the younger generation upon whompower will devolve. Attempts to deal with corruption appear tohave been more symbolic than substantive.
Although almost all observers of the Indonesian scene agreeon the major problems, they vary considerably in their evalu-ations and judgments about them. On the more condemnatoryside are those who regard the system as so immensely corruptand incompetent, with its embedded nepotism and its con-spicuous luxury in a setting of extreme poverty, that the situ-ation is irretrievable and almost inevitably explosive. 44 On theother hand, other Indonesia watchers, while recognizing thecorruption and inefficiencies endemic in the system, concludethat the present Indonesian government has accomplished anenormous amount both in promoting economic developmentand in strengthening national integration. 45 Certainly therecould be much more corruption. More foreign exchangeearnings could be misused in extravagant modernization pro-jects or glamorous buildings (as they were in Sukarno’s day). 46
Funds currently used for development could be diverted for theacquisition of sophisticated new weaponry, as has happened ina number of other Third World countries.
These very different evaluations of Indonesia’s achieve-ments in nation building are comparable to the juxtaposition ofthe rather optimistic picture painted by the statistical section inthe earlier part of this book and the somewhat more pessimisticconclusions reached in this present chapter. The situation pre-sented in this chapter emphasizes the key problems facing In-donesia. These include the effects of population growth, distrib-ution, and pressure on the country’s resources; rural-urban con-trasts; problems arising from Indonesia’s economic overdepen-dence on the petroleum sector; rising expectations and growingunemployment; the growing gap between rich and poor; andpolitical problems arising primarily from Java’s dominant in-fluence, Suharto’s style of government (with its lack of mean-ingful participation), and the role of the military in government
Retrospect and Prospect
260

and commerce. Unquestionably, these issues represent a for-midable challenge to the New Order government in its publiccommitment to equity, economic growth, and national stability.They also present a threat to the country’s continued integrity,probably a more serious one than that presented by the condi-tions measured in the statistical analysis.
The statistical analysis of national integration based onprovincial per-capita characteristics, however, provides a dif-ferent perspective on the overall picture of national integration.It gives an objective insight into the geographical stage onwhich the political, economic, and historical events take place.As discussed in chapter 1, the geographical background (thespatial patterns of various integrative forces) does not de-termine the future of national integration in any country. But itdoes demonstrate the relative vulnerability of the country as awhole, and of certain areas in particular, to disintegrative forcesand events.
Many indices in the sociocultural, interaction, and economicdimensions show that integration among the provinces isgrowing. More people speak the national language, take partin the national educational system, receive better health care,belong to nationwide organizations that acknowledge (ifforcibly) the state ideology of Panca Sila as their sole basis,have access to national radio and television programs, and arelinked together through improved transportation and commu-nications networks and through increased interprovincial tradethan at any time in the past. Increasingly, Indonesians from allover the archipelago are being bound together into mutual websof common interests, financial and communication linkages, anda shared sense of nationhood and national unity. Overall stan-dards of living have risen for the majority of Indonesians (atleast until recently), 47 and even the poorest areas have expe-rienced some improvements as a result of the resources boomand economic development of the 1970s. 48 Despite its great di-versity, the country has also been progressively welded into onefunctioning political entity. 49
With the exceptions of the two areas most recently addedto the country, Irian Jaya and East Timor, widespread regionalunrest seems to be a phenomenon largely of the past. 50 Themajor threat to Indonesia’s continued national integrationcomes not so much from regional as from transregional eco-nomic and political sources, particularly the conspicuous andgrowing gap between the rich and the poor, populationpressure, the growing Javanization in government, and in-
National Integration in Indonesia
261

creasing repression in the political arena. But the statisticalanalysis demonstrates a growing (albeit uneven) level of inte-gration in Indonesia. 51
In spite of the differences in these two evaluations, however,there is no real incongruence between the picture discussed inthis chapter’s overview of problems confronting the country andthat drawn by the statistical analysis. Each of these approachesdeals with different facets of integration. Both describe aspectsof the reality of Indonesia. Both the integrative and the disin-tegrative aspects of Indonesia’s national integration are true atthe same time.
This is so for two major reasons. First, the generally inte-grative picture drawn by the statistical section is concernedwith provinces and their averaged per-capita characteristics,whereas the nonstatistical part deals more with national, in-traprovincial, rural-urban, and other scales and facets of in-tegration. Second, as discussed in the first chapter, nationalintegration is a multifaceted, highly complex, and at times par-adoxical concept, in which factors of integration operate at dif-ferent levels and indeed increased integration at one level mayresult in decreased integration at another. To have aspects ofintegration moving in opposite directions at the same time is tobe expected with such a complex and complicated phenomenon.Thus, the statistical sections are dealing to some extent with dif-ferent aspects and levels of integration than the nonstatisticalsections. From a structural point of view, Indonesia is indeed be-coming more integrated as greater unity is forged among the di-verse ethnic groups and greater interaction takes place amongpeople from its different areas. However, serious issues of in-adequate national integration as well as other economic, po-litical, and social problems also remain. But it is quite probablethat the country could have experienced far greater tensionsand unrest had it gone through the severe problems discussedin this chapter without the growing integration portrayed inthe statistical analysis, for the setting in which the problems ofIndonesia are occurring is more integrated and protective of na-tional unity than would have been the case even a decade ago.
This study has illustrated that continuing provincial dis-parities do exist and in some respects have been accentuatedby uneven development. However, it can be argued that thecurrent situation is considerably more stable because of thegovernment’s commitment to increasing national integration
Retrospect and Prospect
262

and ameliorating the greatest economic contrasts through itspolicy of pemerataan, the evening out of spatial inequalities indevelopment.
Indonesia thus remains a diverse and fascinating country,one in which great progress has been made toward the fullerintegration of its many islands and peoples, yet one whereenormous problems, particularly demographic, economic, andpolitical, remain. As the Indonesian government is aware, in-tegration is a dynamic concept, a condition that has to beconstantly nurtured, one where peoples of different social andcultural backgrounds and economic levels have to be bondedcontinually into a better functioning and more mutually inter-dependent whole. In this process much has been accomplished,but much yet remains to be done, as Indonesia pursues its goalof “Unity in Diversity.”
National Integration in Indonesia
263

Appendixes

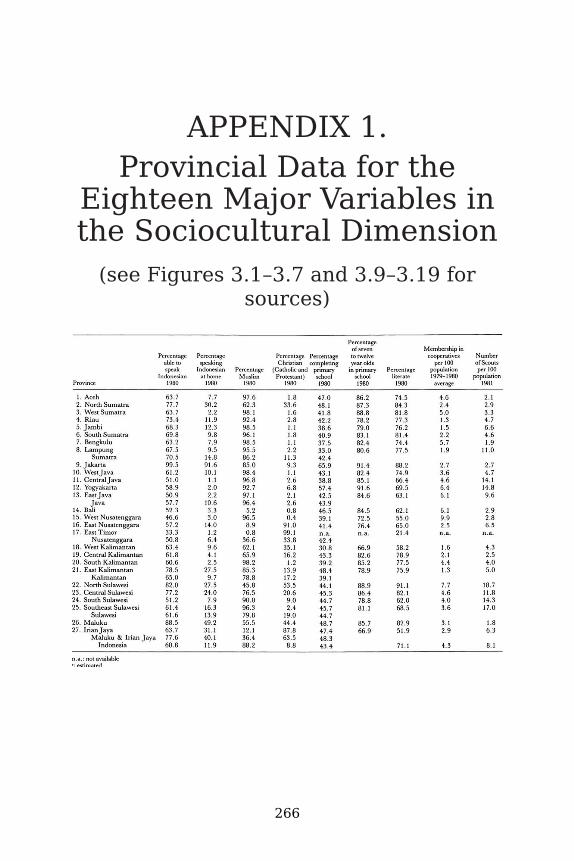
APPENDIX 1.Provincial Data for the
Eighteen Major Variables inthe Sociocultural Dimension
(see Figures 3.1–3.7 and 3.9–3.19 forsources)
266

APPENDIX 1.
267

APPENDIX 2.Provincial Data for the
Sixteen Major Variables inthe Interaction Dimension
(see Figures 4.2–4.12 and 4.14–4.18 forsources)
268

APPENDIX 2.
269

APPENDIX 3.Provincial Data for the
Fourteen Major Variables inthe Economic Dimension
(see figures 5.1–5.14 for sources)
270

APPENDIX 3.
271

Notes
1: INTRODUCTION
1. These questions have all been asked before. Political geo-graphers, as well as political scientists, have long been in-terested in the existence and functioning of the state. Forexample, Friedrich Ratzel recognized implicitly the need forinternal national integration when he described the state asan organic being and a complex system of interacting parts(see Harm de Blij, Systematic Political Geography, p. 140).Richard Hartshorne, in “The Functional Approach in Polit-ical Geography,” distinguished between centripetal forcesworking for national integration and political cohesion, andcentrifugal or divisive forces pulling the state apart. JeanGottmann focused on the major centripetal or cohesiveforces in his discussion of the “spirit” and iconography ofeach nation (“Geography and International Relations”).
2. G. William Skinner, ed., Local, Ethnic, and National Loy-alties in Village Indo nesia: A Symposium. However, Im-manuel Wallerstein, (“Ethnicity and National Integration inWest Africa,” pp. 665–670) found that ethnic loyalties facil-itate integration into urban communities.
272

3. Brian J. L. Berry, “Hierarchical Diffusion: The Basis of De-velopmental Filtering and Spread in a System of GrowthCenters”; Salah El Shakhs, “Development, Primacy, andSystems of Cities.”
4. Ernst B. Haas, “The Uniting of Europe and the Uniting ofLatin America,” p. 315.
5. John Friedmann, “A General Theory of Polarized Devel-opment,” p. 94.
6. W. A. Douglas Jackson and Edward J. F. Bergman, “On theOrganization of Political Space,” p. 155.
7. Karl Deutsch, for example, describes integration as “theattainment, within a territory, of a ‘sense of community’and of institutions and practices strong enough and wide-spread enough to assure, for a ‘long’ time, dependable ex-pectations of ‘peaceful change’ among its population.” KarlW. Deutsch et al., Political Community and the North At-lantic Area, p. 2. The Dimensionality of Nations programat Northwestern University and the Yale Political Data Pro-gram have been concerned with quantifying indices relatedto national integration and the political solvency of govern-ments. In a cross-national comparison, these programs haveexamined the national resources, administrative capabili-ties, and popular support for particular governments andtheir formal and informal commitments, but with little con-sideration of the spatial dimension. See Rudolph J. Rummel,“The Dimensionality of Nations Project”; and Karl W.Deutsch et al., “The Yale Political Data Program.” See alsoAmitai Etzioni, Political Unification: A Comparative Study ofLeaders and Forces; Philip E. Jacob and James V. Toscano(eds.), The Integration of Political Communities; Joseph S.Nye, “Comparative Regional Integration: Concept and Mea-surement”; Leon N. Lindberg, “Political Integration as aMultidimensional Phenomenon Requiring Multivariate Mea-surement”; Myron Weiner, “Political Integration and PoliticalDevelopment”; David E. Apter, The Politics of Modern-
Notes
273

ization; Fred M. Hayward, “Continuities and DiscontinuitiesBetween Studies of National and International Integration:Some Implications for Future Research Efforts”; Karl W.Deutsch and William J. Foltz (eds.), Nation-Building; andBela Balassa, The Theory of Economic Integration.
8. Karl W. Deutsch, Nationalism and Social Communication,pp. 63–64.
9. Clifford Geertz, for example, in Agricultural Involution: TheProcess of Ecologi cal Change in Indonesia, divided In-donesia into two ecological zones: Inner Indonesia, corre-sponding to Java and characterized by wet-rice agriculture,fertile volcanic soil, high agricultural productivity, and highpopulation density; and Outer Islands, centered uponswidden agriculture, alkaline soils, low agricultural produc-tivity, and low population density. Brian J. L. Berry, EdgarC. Conkling, and D. Michael Ray, in The Geography of Eco-nomic Systems, pp. 400–402 and 408, contrast the innerIndonesian heartland of Java, Madura, and Bali with theOuter Islands; the high-density, inner-Indonesian core witha set of sparsely populated, agriculturally oriented hinter-lands. Charles A. Fisher, in South-East Asia: A Social, Eco-nomic and Political Geography, pp. 377–381, writes of “Javaversus the Outer Territories”; and William A. Withington, inSoutheast Asia: Realm of Contrasts, of “Indonesia: InsularContrasts of the Java Core with the Outer Islands.”
10. Fisher, South-East Asia, p. 17.11. G. J. Missen, Viewpoint on Indonesia: A Geographical Study,
p. 23.12. Clifford Geertz, Agricultural Involution, p. 39.13. Hildred Geertz, “Indonesian Cultures and Communities,” p.
30.14. James L. Peacock, Indonesia: An Anthropological Per-
spective, p. 149.15. Hildred Geertz, “Indonesian Cultures and Communities,” p.
95.
Notes
274

16. Clifford Geertz, “The Integrative Revolution: PrimordialSentiments and Civil Politics in the New States,” p. 212.
2: THE UNEVEN EFFECT OF HISTORICAL ANDPOLITICAL EXPERIENCES
1. A. G. Thorne, “The Longest Link: Human Evolution inSoutheast Asia and the Settlement of Australia,” p. 35.
2. Peter Bellwood, “Plants, Climate and People: The Early Hor-ticultural Prehistory of Austronesia,” p. 57.
3. Wilfred T. Neill, Twentieth Century Indonesia, p. 208.4. Ibid., p. 210.5. George McT. Kahin, “Indonesia,” p. 474.6. There were, however, Javanese settlements dating from at
least the fifteenth century in Ternate, Hitu, and Ambon inthe Moluccas. D.J.M. Tate, The Making of Modern South-East Asia, vol. 1, The European Conquest, p. 29.
7. See Bernhard H. M. Vlekke, Nusantara: A History of In-donesia; and Neill, Twentieth Century Indonesia.
8. Neill, Twentieth Century Indonesia, p. 225. The name In-donesia itself is a recent creation. The British ethnologistG. R. Logan, in 1850, was probably the first to call theNetherlands East Indies “the Indonesian archipelago.” Theterm Indonesia was first used by Indonesian students in theNetherlands who formed their own Indonesisch Verbond vanStudeerenden in 1917. Its first use in a political contextwas by the Perserikatan Komunis Indonesia (the IndonesianCommunist Union) in 1920; it was then adopted by otherorganizations. The name gained acceptance partly throughSuprapto’s 1928 authorship of a national anthem for theinfant nationalist movement, called “Indonesia Raya‚” andpartly through its acceptance as the nation’s name duringthe Japanese occupation (1942–1945). In 1945, when the Re-public was proclaimed, Indonesia was its official name.
Notes
275

9. As is apparent in Gertrude J. Resink, Indonesia’s History Be-tween the Myths.
10. Bruce Grant, Indonesia, p. 25.11. John D. Legge, Indonesia, p. 29.12. Paul Wheatley, The Golden Khersonese: Studies in the His-
torical Geography of the Malay Peninsula Before A.D. 1500,p. 298.
13. Neill, Twentieth Century Indonesia, p. 244.14. Ailsa G. Zainu’ddin, A Short History of Indonesia, p. 42.15. Ibid., p. 44.16. Tate, The Making of Modern South-East Asia, vol. 1, The Eu-
ropean Conquest, pp. 10, 31.17. “Dari Dieng memantjarlah untuk pertama dari Indonesia
sinar kebudayaan Mataram-Kuna meliputi seluruh Nu-santara….” (“It was from Dieng [the location of the originalkingdom of Mataram in central Java] that the rays of theancient civilization of Mataram radiated for the first timefrom Indonesia, enfolding all of Nusantara….”), “BhinnekaTunggal Ika Terbabar,” p. 218. The early Mataram kingdomleft some of the earliest of Java’s temple remains on theDieng Plateau in central Java.
18. Legge, Indonesia, p. 28.19. Jon M. Reinhardt, Foreign Policy and National Integration:
The Case of Indo nesia, p. 14.20. Jeanne Blamey, “Ancient Indonesian Empires,” p. 29.21. Tate, The Making of Modern South-East Asia, vol. 1, The Eu-
ropean Conquest, p. 38.22. Formerly Pajajaran. See Vlekke, Nusantara, p. 70.23. Wheatley, The Golden Khersonese, pp. 302–303. Wheatley
refers to C. C. Berg’s article, “De sadeng-oorlog en de mythevan Groot-Majapahit.”
24. Vlekke, Nusantara, p. 84. For a further discussion of theproblem of the historicity of the events of this period seeLegge, Indonesia, pp. 20–41.
25. Legge, Indonesia, p. 30.
Notes
276

26. Grant, Indonesia, p. 7.27. Neill, Twentieth Century Indonesia, p. 247.28. See Resink, Indonesia’s History, p. 21.29. Quoted in Justus M. van der Kroef, “Indonesia: Centrifugal
Economies,” p. 214.30. Legge, Indonesia, p. 70.31. Vlekke, Nusantara, p. 148.32. Tate, The Making of Modern South-East Asia, vol. 1, The Eu-
ropean Conquest, p. 121.33. Zainu’ddin, A Short History of Indonesia, p. 112.34. Vlekke, Nusantara, pp. 159, 166, 203–204.35. Legge, Indonesia, p. 73.36. Zainu’ddin, A Short History of Indonesia, p. 107.37. Tate, The Making of Modern South-East Asia, vol. 1, The Eu-
ropean Conquest, p. 94.38. Neill, Twentieth Century Indonesia, p. 286.39. This characteristic was by no means unique to Indonesia,
however; it is typical of many Southeast Asian countries.40. This was true outside Java as well as in Java. For example, in
western Sumatra the Dutch supported the adat (traditional)leaders in the Padri Wars. Legge, Indonesia, p. 77.
41. Tate, The Making of Modern South-East Asia, vol. 1, The Eu-ropean Conquest, p. 83.
42. The Cultivation System entailed both the growing of com-mercial crops (such as sugar) on Javanese peasant land andthe establishment of vast, state-owned plantations of coffee,indigo, tea, tobacco, cotton, pepper, kapok, and quinine, cul-tivated by forced labor, to ease the Dutch financial crisisin the homeland. For over a century Dutch colonial activityconcentrated on Java, but spread to a few favored districtsin Sumatra, particularly western Sumatra.
43. Legge, Indonesia, pp. 79–80.44. Ibid., p. 82.45. Ibid., p. 81.46. Ibid., p. 85.
Notes
277
47. Tate, The Making of Modern South-East Asia, vol. 1, The Eu-ropean Conquest, p. 121.
48. By the British. Ibid., p. 104.49. Grant, Indonesia, p. 16.50. The Java War of 1825 and the struggle of western Sumatra
against the Dutch in the 1820s and 1830s are examples ofthese movements of resistance.
51. Bernhard Dahm, History of Indonesia in the TwentiethCentury, p. 41.
52. Zainu’ddin, A Short History of Indonesia, p. 169.53. Legge, Indonesia, p. 116.54. Ibid., p. 93.55. Neill, Twentieth Century Indonesia, p. 296.56. This is exemplified in the civil service figures for 1940,
where out of 3,039 civil service positions classified as“higher rank” only 221 were held by Indonesians. See Kahin,“Indonesia,” p. 491.
57. Dahm, History of Indonesia, p. 28.58. Legge, Indonesia, p. 128.59. Dahm, History of Indonesia, pp. 61–62.60. Fisher, South-East Asia, p. 368.61. Kahin, “Indonesia,” p. 483.62. Legge, Indonesia, pp. 129–130. Sarekat Islam (the Islamic
Union) claimed over 360,000 members in 1916: 277,277 inJava and Madura, 5,574 in Kalimantan, 75,859 in Sumatra,1,064 in Bali, and 599 in Celebes (Dahm, History of In-donesia, p. 275). It was thus the first mass political organi-zation in the Netherlands East Indies, but floundered ratherpurposelessly in a welter of religious, social, and economicideas (William J. O’Malley, “Second Thoughts on IndonesianNationalism,” p. 602).
63. Kahin, “Indonesia,” p. 483.64. After 1903 some provision was made for Indonesian par-
ticipation in local government, and this experiment was ex-tended in a more systematic fashion after 1922. Local
Notes
278

councils were established in regencies and in municipalities,and later at the provincial level, but these had very limitedpowers. Legge, Indo nesia, p. 123.
65. Legge, Indonesia, p. 124.66. Dahm, History of Indonesia, p. 65.67. Legge, Indonesia, p. 128.68. Ibid., p. 127.69. Ibid., p. 130.70. Dahm, History of Indonesia, p. 73.71. Ibid., p. 76.72. A. Arthur Schiller, The Formation of Federal Indonesia,
1945–1949, p. 80.73. Dahm, History of Indonesia, p. 83.74. Ibid., p. 84.75. Kahin, “Indonesia,” p. 494; Neill, Twentieth Century In-
donesia, p. 315.76. Khaidir Anwar, Indonesian: The Development and Use of a
National Language, p. 40.77. Legge, Indonesia, p. 132.78. Dahm, History of Indonesia, p. 93.79. Kahin, “Indonesia,” p. 495.80. Ibid., p. 496.81. Dahm, History of Indonesia, p. 91.82. Ibid., p. 92.83. Ibid., p. 93.84. Quoted in Dahm, History of Indonesia, p. 89.85. Dahm, History of Indonesia, p. 108.86. Kahin, “Indonesia,” p. 497.87. Neill, Twentieth Century Indonesia, p. 319.88. Dahm, History of Indonesia, p. 105.89. Ibid., p. 104.90. Three represented Sumatra (one each from Batak country
in northern Sumatra, western Sumatra, and Aceh) and fiveeastern Indonesia (one each from northern and southern Su-lawesi, Kalimantan, Bali, and Ambon).
Notes
279
91. Kahin, “Indonesia,” p. 503.92. Ibid., p. 498.93. Ibid., p. 499.94. Fisher, South-East Asia, p. 363.95. Van der Kroef, “Indonesia: Centrifugal Economies,” p. 212.96. Legge, Indonesia, pp. 156–157.97. Dahm, History of Indonesia, p. 145.98. It can also be argued, however, that Indonesia’s continued
unity has been forced, and its unitary type of governmentsuperimposed upon a number of unwilling parts.
99. Berry, Conkling, and Ray, The Geography of EconomicSystems, p. 418.
100. Herbert Feith, “Indonesia’s Political Symbols and TheirWielders.”
101. Zainu’ddin, A Short History of Indonesia, p. 253.102. Fisher, South-East Asia, p. 374.103. Van der Kroef, “Indonesia: Centrifugal Economies,” p. 199.104. Modern plantation development was started in certain
areas of Sumatra and Sulawesi in the nineteenth centuryby the colonial government. The east coast of northernSumatra, for example, was transformed from a swampy toa productive agricultural region through the introduction ofexport crops and the development of infrastructure.
105. Widjojo Nitisastro, Population Trends in Indonesia, pp. 5–6,126, 174; Biro Pusat Statistik, Statistik Indonesia: StatisticalPocketbook of Indonesia, 1970 and 1971, p. 23; Biro PusatStatistik, Sensus Penduduk 1980, Series L, no. 3.
106. Peter Lyon, War and Peace in South-East Asia, p. 65.107. Charles A. Fisher, “Indonesia—A Giant Astir,” p. 158.108. Kahin, “Indonesia,” p. 564.109. Zainu’ddin, A Short History of Indonesia, p. 247.110. For a more complete discussion of the reasons for the de-
tails of the PRRI-Permesta rebellion, see Barbara S. Harvey,Permesta: Half a Rebellion. PRRI-Permesta stands for Pe-
Notes
280

merintah Revolusioner Republik Indonesia/Perjuangan Se-mesta Alam (The Total Struggle of the Republic of In-donesia’s Revolutionary Government).
111. Herbert Feith, “Indonesia,” p. 240.112. Indeed, a glossary of acronyms and abbreviations published
in 1970 contained over 9,000 items. See A. Morzer Bruyns,Glossary of Abbreviations and Acronyms Used in Indonesia.
113. After his gradual removal from power between 1965 and1967, Sukarno was discredited for a while but has recentlybeen rehabilitated as a great, patriotic, nationalist leader.
114. Legge, Indonesia, p. 154.115. Estimates of the total number killed varied from 78,500,
suggested by a Fact-Finding Commission appointed by thepresident at the end of December 1965, to one million,based on an army-sponsored survey conducted by studentsfrom Bandung and Jakarta. The most commonly accepted es-timate is between 250,000 and 500,000. In 1976, the headof Kopkamtib (the Operational Command for the Restorationof Security and Order), Admiral Sudomo, estimated that be-tween 450,000 and 500,000 had been killed (Tempo, July 10,1976). A further estimated 200,000 people were arrested(Harian Kami, July 27, 1967). See Harold Crouch, The Armyand Politics in Indonesia, p. 155.
116. Crouch, The Army and Politics in Indonesia, p. 273.117. Ibid., pp. 344–345. However, this was significantly different
from the Middle Way, formulated by General Nasution afterthe introduction of Guided Democracy in 1957. This ideologypermitted army officers to participate actively in the affairsof government but not to seek a dominant position. By con-trast under the Dwi Fungsi doctrine, established in 1965, nolimitations were placed on the army’s political role; indeed,it justified the increasing military domination of the gov-ernment by stressing that the army was concerned with allfields of social life.
Notes
281

118. In 1966, twelve out of the twenty-four provincial governorswere army officers. By 1971, the number had increased totwenty (Crouch, The Army and Politics in Indonesia, p. 244).This was accompanied by a similar increase at the level ofbupati (head of a district or kabupaten) and mayor, where,by 1971, two-thirds were military personnel.
119. Crouch, The Army and Politics in Indonesia, p. 25.120. Ibid., p. 348.121. Ibid., p. 277.122. Ibid., p. 321.123. Ibid., p. 285.124. Ibid., p. 318.125. Ibid., p. 302.126. “Javanese” in this context includes all three of the major
ethnic groups living in Java: the Sundanese in West Java, theJavanese in Central and East Java, and the Madurese in EastJava and Madura.
127. See Akio Yasunaka, “Basic Data on Indonesian PoliticalLeaders”; and O. G. Roeder (compiler), Who’s Who in In-donesia: Biographies of Prominent Indone sian Personalitiesin All Fields. For details on the military elite see BenedictR. Anderson et al., “Data on the Current Military Elite”;Benedict R. Anderson et al., “Current Data on the In-donesian Army Elite”; Benedict R. Anderson and SusanHatch, “Current Data on the Indonesian Military Elite”(1973); ibid., (1974).
128. Crouch, The Army and Politics in Indonesia, p. 306.129. Ruth T. McVey, “The Post-Revolutionary Transformation of
the Indonesian Army, Part II,” p. 172.130. See Taufik Abdullah et al., “Current Data on the Indonesian
Military Elite after the Reorganization of 1969–1970.”131. Crouch, The Army and Politics in Indonesia, p. 237.132. Much of this section is based on the article by Ralph R.
Premdas, “The Organisasi Papua Merdeka in Irian Jaya.”
Notes
282

133. R. J. May, “Irian Jaya: West Papuan Nationalism in 1979,” p.721.
134. Premdas, “The Organisasi Papua Merdeka,” p. 1061.135. Ibid., p. 1062.136. Ibid., p. 1067.137. Peter Hastings, “Timor and West Irian: The Reasons Why,”
pp. 715–716.138. James Dunn, Timor: A People Betrayed, p. 299.139. Ibid., p. 321.140. Ibid., p. 329. See also U.S. House of Representatives,
“Famine Relief for East Timor.”141. Harold Crouch, “No Enemy in Sight,” p. 34.142. Steven Jones, “Fight for Timor Grows Quiet but Goes On.”
However, journalists who are allowed to visit East Timor arestrictly screened first and are limited in the areas they mayvisit.
143. Dunn, Timor, pp. 336–337.
3: THE SOCIOCULTURAL DIMENSION
1. Peacock, Indonesia: An Anthropological Perspective, p. 143.2. See William A. Foley, “History of Migrations in Indonesia as
Seen by a Linguist.”3. Anwar, Indonesian, p. 21.4. Ibid., p. 178.5. Biro Pusat Statistik, Sensus Penduduk 1980, Series S, no. 2,
Table 14.3.6. Biro Pusat Statistik, Sensus Penduduk 1971, Series E, Table
13.7. Biro Pusat Statistik, Sensus Penduduk 1980, Series S, no. 2,
Table 16.3.8. Anwar, Indonesian, p. 145.
Notes
283

9. Most of the maps in this and subsequent chapters are basedon published census data that should be accepted as approx-imations and illustrative of overall patterns rather than asprecise facts.
10. Biro Pusat Statistik, Sensus Penduduk 1980, Series S, no. 2,Table 14.3.
11. Anwar, Indonesian, p. 138.12. Ibid., p. 151.13. Zainu’ddin, A Short History of Indonesia, p. 61.14. Neill, Twentieth Century Indonesia, p. 252.15. See Clifford Geertz, The Religion of Java.16. Taufik Abdullah, “The Sociocultural Scene in Indonesia,” p.
66.17. However, the size of the change makes these figures seem
doubtful, although there is no reason to doubt the trend re-flected in the figures.
18. Abdullah, “The Sociocultural Scene in Indonesia,” p. 74.19. Republik Indonesia, Rencana Pembangunan Lima Tahun
Keempat, 1984/85– 1988/89, vol. 2, pp. 518–519. These per-centages again illustrate the scepticism with which the pub-lished data on Indonesia should be treated. A school partici-pation rate of over 97 percent is most unlikely!
20. Biro Pusat Statistik, Statistik Indonesia 1983, Buku Saku,Table III.1.1.
21. Frank W. Speed, Indonesia Today, p. 55.22. However, these figures may not be strictly comparable, be-
cause the figures in 1980 and 1971 are based on the pop-ulation ten years of age and over and not on the entirepopulation as presumably the earlier estimate was.
23. See Clifford Geertz, “Afterword: The Politics of Meaning,” p.321.
24. Feith, “Indonesia’s Political Symbols,” p. 86.25. Zainu’ddin, A Short History of Indonesia, p. 243.
Notes
284

26. For more details, see Ann Ruth Willner, “The NeotraditionalAccommodation to Political Independence: The Case of In-donesia.”
27. See Daniel S. Lev, “Judicial Institutions and Legal Culture inIndonesia.”
28. Sutan Takdir Alisjahbana, Indonesia: Social and CulturalRevolution, p. 71.
29. Frederica M. Bunge, ed., Indonesia: A Country Study, p.186.
30. Ibid.31. It has been estimated that the Chinese controlled about
70 percent of the monetized sector of the economy in thelate 1960s. See Business International Corporation, DoingBusiness in the New Indonesia, p. 4.
32. Victor Purcell, The Chinese in Southeast Asia, p. 385.33. J. S. Furnivall, Netherlands India: A Study of Plural
Economy, p. 47.34. G. William Skinner, “Change and Persistence in Chinese
Culture Overseas: A Comparison of Thailand and Java,” pp.401–404.
35. Charles A. Coppel, “China and the Ethnic Chinese in In-donesia,” pp. 731–732.
36. Ibid., p. 729.37. Nena Vreeland et al., Area Handbook for Indonesia, p. 103.
See also G. William Skinner, “The Chinese Minority,” pp.105–108.
38. Susumu Awanohara, “The Perennial Problem,” p. 26.39. Calculated from Table IV.1.15 in Biro Pusat Statistik, Sta-
tistik Indonesia 1982.40. Purcell, The Chinese in Southeast Asia, p. 387.41. Biro Pusat Statistik, Statistik Bioskop Indonesia 1981 dan
1982, Table 4.42. Biro Pusat Statistik, Statistik Indonesia 1983, p. 142.43. Elihu Katz and George Wedell, Broadcasting in the Third
World: Promise and Performance.
Notes
285

44. See Table 66.3 in Biro Pusat Statistik, Sensus Penduduk1980, Series S, no. 2; and Table III.1.9 in Biro Pusat Sta-tistik, Statistik Indonesia 1983, Buku Saku.
45. See Tables III.1.8 and III.1.9 in Biro Pusat Statistik, StatistikIndonesia 1983, Buku Saku for details.
46. Yet this is a big improvement over the 1972 figure of 50,000persons per health center.
47. Brian J. L. Berry, “City Size and Economic Development,Conceptual Synthesis and Policy Problems, with Special Ref-erence to South and Southeast Asia.”
48. The definition of urban includes all urban centers belongingto recognized administrative categories (kotamadya [munic-ipalities] and kota administratif [administrative cities]) andthose wards (kelurahan) or villages that contained popu-lation densities of 5,000 or more persons per square kilo-meter, had more than 25 percent of households directlydependent on individuals working outside the agriculturalsector, or had eight or more of sixteen designated “urban fa-cilities.” See Jeremy Evans, “The Growth of Urban Centresin Java Since 1961,” p. 54.
49. These figures are not strictly comparable because ofboundary and definition changes in the intercensal periods.See Evans, “The Growth of Urban Centres.”
50. Gavin Jones, “The Problem of Urbanization in Indonesia,” p.1.
51. Hildred Geertz, “Indonesian Cultures and Communities,”pp. 33–41.
52. Missen, Viewpoint on Indonesia, p. 315.53. Evans, “The Growth of Urban Centres,” p. 56.
4: THE INTERACTION DIMENSION
1. William A. Withington, “The Economic Infrastructure,” p.55.
2. Stephen B. Wickman, “The Economy,” p. 164.
Notes
286

3. Biro Pusat Statistik, Statistik Indonesia 1983, Buku Saku,Table VII.2.6.
4. Calculated from Table VII.1.3 in Biro Pusat Statistik, Sta-tistik Indonesia 1983, Buku Saku.
5. Asia Research Bulletin (October 1976), p. 254.6. Calculated from Table 2 in Biro Pusat Statistik, Statistik
Kendaraan Bermotor dan Panjang Jalan 1974; and TableVIII.1.4 in Biro Pusat Statistik, Statistik Indo nesia 1982.
7. Calculated from Table VII.2.3 in Biro Pusat Statistik, Sta-tistik Indonesia 1983, Buku Saku.
8. H. W. Dick, “Prahu Shipping in Eastern Indonesia,” July1975; and November 1975.
9. Dick, “Prahu Shipping in Eastern Indonesia,” July 1975, p.70.
10. Nena Vreeland et al., Area Handbook for Indonesia, p. 368.11. Wickman, “The Economy,” p. 164.12. Republik Indonesia, Departemen Perhubungan Laut, Di-
rektorat Perkapalan dan Pelayaran SubDit. Kebandaran danAwak Kapal, Seksi P.U., File No. TH 1981/82.
13. Wickman, “The Economy,” p. 164.14. Calculated from data in File No. TH 1981/82, Republik In-
donesia, Departemen Perhubungan Laut, Direktorat Perka-palan dan Pelayaran SubDit. Kebandaran dan Awak Kapal,Seksi P.U.
15. Susumu Awanohara, “Overboard on Ships,” p. 66.16. Indonesia, Prospek Perekonomian Indonesia, p. 95.17. Biro Pusat Statistik, Indikator Ekonomi, Table VII.14, “Lalu
Lintas di Indonesia.”18. Biro Pusat Statistik, Statistik Angkutan Udara 1981, Table
9.19. Peter McCawley, “Survey of Recent Developments” (1985),
p. 30.20. J. B. Sumarlin, Indonesia: Economic Update 1984, p. 96.
Notes
287

21. Indonesia, Departemen Penerangan, Proyek Penelitian danPengembangan, Hasil-hasil Polling Pendapat Umum PelitaTahun Ke-IV.
22. Biro Pusat Statistik, Sensus Penduduk 1980, Series S, no. 2,Table 66.3.
23. Asia Research Bulletin (August 1974), p. 2969.24. Republic of Indonesia, Department of Information, In-
donesia 1979: An Official Handbook, p. 273.25. Wickman, “The Economy,” p. 166.26. Biro Pusat Statistik, Statistik Indonesia 1983, Buku Saku,
Table VII.5.3.27. Biro Pusat Statistik, Statistik Kommunikasi 1980, Table 13.28. Biro Pusat Statistik, Statistik Indonesia 1982, Table VIII.5.5.29. Judith B. Agassi, “Mass Media in Indonesia.”30. Biro Pusat Statistik, Statistik Indonesia 1983, Buku Saku,
Table III.1.9.31. Asian Recorder (April 1975), p. 12540.32. Biro Pusat Statistik, Sensus Penduduk 1980, Series S, no. 2,
Tables 7.3 and 6.3.33. Ibid., Table 7.3.34. Republic of Indonesia, Bappenas (National Development
Planning Agency), Repelita IV, The Fourth Five-Year Devel-opment Plan of Indonesia, 1984/85– 1988/89: A Summary, p.47.
35. Economic and Social Commission for Asia and the Pacific,Migration, Urbanization and Development in Indonesia, AComparative Study on Migration, Urban ization and Devel-opment in the ESCAP Region. Country Reports III, p. 146.
36. H. W. Arndt, “Transmigration: Achievements, Problems,Prospects,” p. 64.
37. Biro Pusat Statistik, Sensus Penduduk 1980, Series S, no. 2,Table 7.3.
38. Graeme J. Hugo, “Road Transport, Population Mobility andDevelopment in Indonesia,” pp. 355–356.
Notes
288

39. Historically, merantau referred to the long-standing tra-ditional practice of the Minangkabau from West Sumatrato migrate temporarily “to another island for a relativelylong period but eventually return to the origin community.”Graeme J. Hugo, “Circular Migration in Indonesia,” p. 64.The term has been expanded by Dean Forbes and others toinclude circular migration by other groups. Merantau hasbeen defined by Mochtar Naim as “leaving one’s culturalterritory voluntarily, whether for a short or long time, withthe aim of earning a living or seeking further knowledge orexperience, normally with the intention of returning home.”Mochtar Naim, “Voluntary Migration in Indonesia,” p. 150.
40. Dean Forbes, “Mobility and Uneven Development in In-donesia: A Critique of Explanations of Migration and Cir-cular Migration,” p. 57.
41. Ibid., p. 70.42. Missen, Viewpoint on Indonesia, p. 224.43. Ibid., p. 280.44. Vreeland et al., Area Handbook for Indonesia, p. 381.45. Biro Pusat Statistik, Statistik Indonesia 1983, Buku Saku,
Tables VI.2.1 and VI.2.2.46. Biro Pusat Statistik, Statistik Indonesia 1982, Table VIII.4.3.47. Biro Pusat Statistik, Impor Menurut Jenis Barang dan
Negeri Asal, vol. 2, Table 8.48. Republik Indonesia, Departemen Perdagangan, Ikhtisar
Perkembangan Harga-harga dan Data Statistik Perda-gangan.
49. Calculated from data in Biro Pusat Statistik, StatistikBongkar Muat Barang di Pelabuhan Indonesia 1982, Table1.
50. Biro Pusat Statistik, Statistik Indonesia 1982, Table VIII.4.6.
5: THE ECONOMIC DIMENSION
1. Friedmann, “A General Theory of Polarized Development.”
Notes
289

2. Karl J. Pelzer, “The Agricultural Foundation,” p. 152.3. Douglas S. Paauw, “From Colonial to Guided Economy,” p.
163.4. J. A. C. Mackie, “The Indonesian Economy, 1950–1963,” p.
19.5. Gunnar Myrdal, Asian Drama: An Inquiry into the Poverty of
Nations, vol. 3, p. 1847.6. Hendra Esmara, “Regional Income Disparities,” p. 52.7. Clifford Geertz, Agricultural Involution.8. R. M. Sundrum, “Manufacturing Employment 1961–71,” p.
58.9. Java’s population increased from nine to sixty-three million
in the 100 years before 1961.10. Bruce Glassburner, “The Economy and Economic Policy:
General and Historical,” pp. 3–4.11. Achmad T. Birowo and Gary E. Hansen, “Agricultural and
Rural Development: An Overview,” p. 2.12. Between 1967 and 1981 the Japanese invested $3.3 billion
in 198 projects in Indonesia, and the Americans $570 millionin seventy-seven projects. Jean A. Briggs, “A Pint of Blood?Or $20?,” p. 96.
13. In addition to the World Bank, the Asian Development Bankand various United Nations programs contribute to In-donesia’s development.
14. Contributing countries (in order of descending magnitudefor the 1984–1985 fiscal year) are Japan, the United States,the Netherlands, Australia, West Germany, France, Canada,Italy, Belgium, the United Kingdom, Switzerland, and NewZealand. See Indonesia Development News 7 (June 1984), p.2.
15. Republic of Indonesia, Department of Information, The FirstFive-Year Development Plan, 1969/70–1973/74.
16. Esmara, “Regional Income Disparities,” p. 41. See alsoDouglas S. Paauw, “The Indonesian Economy in the 1980s.”
Notes
290

17. Republik Indonesia, Departemen Penerangan, RencanaPembangunan Lima Tahun Kedua, 1974/75–1978/79.
18. Indonesia Development News 6 (March 1983), pp. 6–7.19. Ibid. For a fuller discussion of the Third Five-Year Devel-
opment Plan, see Republic of Indonesia, Department of In-formation, Repelita III. The Third Five- Year DevelopmentPlan, 1979–84 (Summary).
20. Republic of Indonesia, Bappenas (National DevelopmentPlanning Agency), Repelita IV, The Fourth Five-Year Devel-opment Plan of Indonesia, 1984/85– 1988/89: A Summary,pp. 6–7. For the complete plan, see Republik Indonesia, De-partemen Penerangan, Rencana Pembangunan Lima TahunKeempat 1984/85– 1988/89.
21. H. W. Arndt, “Regional Income Estimates”; Esmara, “Re-gional Income Disparities.” They also warn of the weak-nesses in and problems of estimating the RGDP, includinglack of basic statistical data, and conceptual problems suchas how to allocate certain components and how to ascertainthe value added in each region.
22. In 1980 the rate of exchange was Rp 615 per U.S. $1.The contrast in RGDP per capita thus ranged from approxi-mately U.S. $1,377 in East Kalimantan to U.S. $170 in EastNusatenggara.
23. Biro Pusat Statistik, Pendapatan Regional Propinsi-propinsidi Indonesia 1976– 80, Table IIB.9.
24. Indonesia Development News 7 (May 1984), p. 2.25. Indonesia Development News 7 (August 1984), p. 6.26. Indonesia Development News 3 (April 1980), pp. 4–6.27. H. W. Arndt and R. M. Sundrum, “Regional Price Dispar-
ities.”28. World Bank, Indonesia: Selected Aspects of Spatial De-
velopment, p. 84, quoted with permission. However, thesefigures do not seem to include subsistence agriculture andappear somewhat questionable.
29. Ibid., p. 89.
Notes
291

30. East Nusatenggara suffers from a very dry climate withthe lowest and the most variable rainfall in Indonesia. It isunclear to what extent the droughts of the late 1970s areresponsible for its shockingly high deprivation figure. EastNusatenggara depends to a greater extent than any otherprovince on agriculture (including livestock raising) for itsRGDP; it is the main supplier of livestock for the nation. Ithas almost no minerals and is one of the least developedprovinces.
31. Birowo and Hansen, “Agricultural and Rural Development,”p. 7.
32. Biro Pusat Statistik, Sensus Penduduk 1980, Series S, no.2, Table 66.3. However, serious doubts emerge over the re-liability of the sample from which these results are extrapo-lated.
33. Biro Pusat Statistik, Statistik Keuangan Pemerintah Daerah,Daerah Tingkat I (Propinsi) 1975/76–1980/81, Table 1.
34. See Colin Rosser, “Training in Regional Development in In-donesia: A Report Prepared for the Regional DevelopmentDivision of Bappenas.” See also Robert van Leeuwan,“Central Government Subsidies for Regional Development:Notes.”
35. Esmara, “Regional Income Disparities,” p. 56.36. Friedmann, “A General Theory of Polarized Development.”37. Geoffrey B. Hainsworth, “Dilemmas of Development in In-
donesia,” p. 190.38. Gupta, for example, stated in 1975 that Indonesia “is
heading towards a more uneven income distribution, unlessgovernment intervention occurs.” S. Gupta, “Income Dis-tribution, Employment, and Growth: A Case Study of In-donesia,” p. 71.
39. Translated into U.S. dollar amounts, the gap in 1972 wasover twelvefold, from $45.80 in the poorest province to$562.34 in the richest (using the weighted exchange rate ofRp 393 per U.S. $1); in 1980, it was eightfold, from $169.59
Notes
292

to $1,376.59 (using the exchange rate of Rp 615 per U.S.$1). Data for 1972 from Esmara, “Regional Income Dispar-ities,” p. 48. Data for 1980 from Biro Pusat Statistik, Sta-tistik Indonesia 1983, Buku Saku, Table X.9.
40. The negative growth rate in North Sulawesi between 1968and 1972 has been attributed at least in part to the un-certain external market for copra, North Sulawesi’s primeexport. World Bank, Indonesia: Selected Aspects, p. 15,quoted with permission. East Kalimantan’s RGDP grew be-cause of the extraction of its timber, oil, and natural gasresources. East Kalimantan also has rich coal and recentlydiscovered tin deposits.
41. Esmara, “Regional Income Disparities,” p. 54.42. Aceh’s spectacular growth rate between 1976 and 1980
relates to the development of its extensive natural gas re-serves. Natural gas boosted Aceh’s RGDP from $353.2million in 1977 to $1.03 billion in 1980. Aceh has been therecipient of large amounts of foreign investment, not onlyfor the exploitation of its huge natural gas field at Arun, butalso for the development of the Lhokseumawe coastal area,20 miles north of Arun, into a twenty-square-kilometer portand industrial zone. This reputedly is the single largest con-centration of investment in Indonesia; by 1981 $4.1 billionhad been invested there. Indonesia Development News 5(August 1982), p. 4.
43. Investment proposals relate to the development of livestockand rain-fed agriculture, onshore marine fisheries, ex-pansion of commercial tree crops, watershed rehabilitation,irrigation development, improvements to infrastructure, andthe promotion of industry.
44. Ross Garnaut, “General Repercussions of the ResourcesBoom in the Segmented Indonesian Economy,” p. 415.
45. Ibid., pp. 419–420.46. Peter McCawley and Chris Manning, “Survey of Recent
Developments,” p. 36.
Notes
293

47. Ibid., p. 35.48. Biro Pusat Statistik, Indikator Ekonomi 1982, Tables IV.16b
and IV.16d.49. Ibid., Table 16d.50. Ibid., Table 16b.51. Torben M. Roepstorff, “Industrial Development in In-
donesia: Performance and Prospects,” pp. 32–44.52. Anwar Nasution, “Survey of Recent Developments,” p. 2.53. Indonesia Development News 8 (October 1984), p. 5.54. Peter McCawley, Industrialization in Indonesia: Devel-
opment and Prospects, p. 14.55. Roepstorff, “Industrial Development in Indonesia,” p. 43.56. Juergen B. Donges, Bernd Stecher, and Frank Wolter, Indus-
trial Develop ment Policies for Indonesia, p. 23.57. Peter McCawley, “The Growth of the Industrial Sector,” p.
77.58. R. B. Suhartono, “Industrial Development in Indonesia,” p.
4.59. H. W. Arndt, “Development and Equality: An Overview,” p.
48.60. Steven J. Keuning, “Farm Size, Land Use, and Profitability
of Food Crops in Indonesia,” p. 80.61. Birowo and Hansen, “Agricultural and Rural Development,”
p. 5.62. Irma Adelman and Cynthia Taft Morris, Economic Growth
and Social Equity in Developing Countries.63. Percentages calculated from Biro Pusat Statistik, Sensus
Penduduk 1980, Series S, no. 2, Table 44.9.64. Republic of Indonesia, Bappenas (National Development
Planning Agency), Repelita IV, The Fourth Five-Year Devel-opment Plan of Indonesia, 1984/85– 1988/89: A Summary, p.13.
65. The employment data upon which the conclusions in thissection are based must be handled with caution because oftheir questionable accuracy. For example, although the of-
Notes
294

ficial unemployment figures were as low as 2.2 percent in1971 (representing a reduction from 5.4 percent in 1961),these do not reflect the actual situation, partly becauseof the number of nonregistered unemployed and the highdegree of underemployment. The Federation of IndonesianLabor Unions (Sudono) estimated that only twelve million(or 30 percent) of the total of forty-four million officiallycounted as Indonesia’s labor force in 1971 were actuallyfully employed; thirty-two million, or around 70 percent,were either unemployed or underemployed, caught up in theprocess of agricultural or urban involution. This includedabout four million out of work, eleven million working half-time, and seventeen million working less than thirty-twohours a week (Asia Research Bulletin [December 1974], p.36). Any attempt to define unemployment is an exercisein ambiguity, partly because approximately 24 percent ofthe labor force consists of unpaid family workers. In ad-dition, employment figures depend on the month and seasonin which they are collected, because there is considerablemovement between agricultural employment and service in-dustries, especially at off-peak agricultural times.
66. Birowo and Hansen, “Agricultural and Rural Development,”pp. 24–25.
67. Hal Hill, “Survey of Recent Developments,” pp. 7–8.68. Asian Business (February 1984), p. 59.69. H. W. Arndt, “Employment, Unemployment, and
Underemployment,” p. 106.70. Bela Balassa, “Types of Economic Integration,” p. 11.
6: SPATIAL PATTERNS
1. See Rudolph J. Rummel, Applied Factor Analysis, p. 15.
Notes
295

2. Because factor analysis is based on the correlation matrix,which assumes a linear relationship between each pair ofvariables. See J. Goddard and A. Kirby, An Introduction toFactor Analysis, Concepts and Techniques in Modern Geography, no. 7, p. 17.
3. For statistically valid results in an R-type factor analysisit is necessary to have at least twice as many cases (orprovinces) as variables. The alternative Q-mode analysiswould have grouped cases (provinces) and not variables,and thus not shown the important relationships among thevariables.
4. “Correlates significantly” means at least at the 0.01 level ofsignificance.
5. Measuring educational achievement by those over ten yearsof age who have completed primary school omits the ten tothirteen year olds still in primary school, while those whohave completed high school is an index more of the elite (onaverage 3.1 percent of the population) than of broad-basededucational attainment.
6. See Christine Drake, The Geography of National Inte-gration: A Case Study of Indonesia, p. 570.
7. East Kalimantan is the most urbanized province afterJakarta and also by far the wealthiest on a per-capita basis.It is therefore not surprising that it ranks first on this factor,which incorporates television and radio ownership, andaccess to movie theatres and hospital facilities.
8. If the signs on the scores of the fourth factor are reversedto indicate the real meaning of this factor, that membershipin a cooperative is integrative while the presence of non-Indonesian-citizen Asians is a negative or disintegrativeforce.
Notes
296

9. Ownership of a sideboard probably indicates a higherincome level. However, because of cultural differencesamong the different ethnic groups in the country, it shouldbe viewed as only one representative measure of economicdevelopment.
10. See Drake, The Geography of National Integration, p. 622.11. As discussed in chapter 5, East Kalimantan is an extremely
resource-rich province, with large reserves of petroleum,natural gas, timber, and coal. Not only are these productsexported in their raw state, but the refining and manu-facturing of petroleum products (including fertilizers andchemicals), together with the production of liquified naturalgas at the Bontang LNG plant, increase East Kalimantan’swealth. In addition, East Kalimantan has the largest plywoodmanufacturing capacity of any province in Indonesia. See In-donesia Devel opment News 6 (December 1982), p. 3.
12. Of-0.20 or more.13. See note 9 in chapter 1.14. In 1955–1956, for example, only 12 percent of Indonesia’s
total foreign exchange earnings came from Java, whereasover 80 percent of these earnings were spent on consumerand capital goods for Java’s rapidly expanding population.Fisher, South-East Asia, p. 377.
15. Lance Castles, “The Ethnic Profile of Djakarta,” p. 153.16. Gavin Jones, “The Problem of Urbanization in Indonesia,” p.
3.17. Jacqueline Lineton, “Pasompe ‘Ugi’: Bugis Migrants and
Wanderers.”18. Harvey, Permesta: Half a Rebellion, p. 21.19. Barbara S. Harvey, “Tradition, Islam and Rebellion: South
Sulawesi: 1950–65,” p. 50.20. Ujung Pandang’s population in 1980 was only 709,038, less
than 12 percent of the province’s population.21. Drake, The Geography of National Integration, pp. 645–646.22. Indonesia Development News 3 (August 1980), pp. 6–7.
Notes
297

7: GOVERNMENT RESPONSE TO THE NEED FORNATIONAL INTEGRATION
1. Dahm, History of Indonesia, p. 145. See also Feith, “In-donesia’s Political Symbols.”
2. Berry, Conkling, and Ray, The Geography of EconomicSystems, p. 418.
3. Slamet Sutrisno, Sedikit Tentang Strategi Kebudayaan Na-sional Indonesia, p. 68.
4. This emphasis on one nationwide, national language beganbefore the Suharto era, in the early 1950s; it has been con-tinued and extended since then.
5. R. Murray Thomas, “Indonesian Education: CommunistStrategies (1950–65) and Government Counter Strategies(1966–80),” p. 389.
6. Republik Indonesia, Rencana Pembangunan Lima TahunKeempat 1984/85– 1988/89, vol. 2, p. 518.
7. An article in the Indonesian newspaper, Merdeka (July 20,1984), claimed that almost half of the school-age childrenwere still unable to attend school because of lack of financesor absence of opportunities.
8. The government claims that the percentage of thirteento fifteen year olds in school has risen from 28.4 percentin 1978–1979 to 44.0 percent in 1983–1984 and the per-centage of sixteen to eighteen year olds has increased from14.7 percent in 1978–1979 to 25.3 percent in 1983–1984.Republik Indonesia, Rencana Pembangunan Lima TahunKeempat 1984/85–1988/89, vol. 2, p. 520. However, thesepercentages again seem suspiciously high.
9. William K. Cummings, “Notes on Higher Education and In-donesian Society,” p. 29.
10. Republik Indonesia, Rencana Pembangunan Lima TahunKeempat 1984/85– 1988/89, vol. 2, p. 520.
11. “New University Aiding Indonesian Students,” p. 8A.12. Indonesia Development News 8 (December 1984), p. 7.
Notes
298

13. David Jenkins, “What Makes Daud Jusuf Run?,” p. 36.14. Susumu Awanohara, “The New Call to Prayer,” p. 26.15. Peter Rodgers, “Indonesia’s Faithful Flex Their Political
Muscle,” p. 38.16. Leo Suryadinata, “Indonesia in 1980: Continuity Rather
than Change,” p. 134.17. The government claims to have supported equally the other
official religions in the country in their building programs.See Republik Indonesia, Rencana Pembangunan Lima TahunKeempat 1984/85–1988/89, vol. 2, p. 476.
18. Guy Sacerdoti, “The Wheel of Fortune Stops.”19. Susumu Awanohara, “On the Defensive in the Pancasila
State.”20. Donald E. Weatherbee, “Indonesia in 1984: Pancasila, Pol-
itics, and Power,” p. 189.21. Susumu Awanohara, “A Matter of Principles,” p. 16.22. Susumu Awanohara, “A First Warning Shot,” p. 15.23. Awanohara, “The New Call to Prayer,” p. 28.24. Ibid.25. Thomas, “Indonesian Education,” p. 391.26. Michael Morfit, “Panca Sila: The Indonesian State Ideology
According to the New Order Government,” pp. 842–843.27. Ibid., p. 839.28. As stated by the Minister of Trade and Cooperatives, ac-
cording to Kom pas, January 3, 1979, quoted in Leo Suryad-inata, “Indonesia in 1979: Controlled Dissent,” p. 134.
29. Lincoln Kaye, “Fighting-trim Reforms,” p. 24.30. Ibid.31. Peter McCawley, “The Devaluation and Structural Change
in Indonesia,” p. 156.32. Kompas (June 16, 1979).33. H. W. Arndt, “Growth and Equity Objectives in Economic
Thought about Indonesia,” p. 432.34. Indonesian Ministry of Education and Culture, 1977.35. McCawley, “Survey of Recent Developments” (1985), p. 30.
Notes
299

36. H. W. Dick, “Survey of Recent Developments,” p. 35.37. Ibid.38. Indonesia Development News 8 (September 1984), pp. 4–5.39. H. W. Dick, “Interisland Shipping: Progress, Problems and
Prospects,” p. 111.40. McCawley, “Survey of Recent Developments” (1985), p. 30.41. Lincoln Kaye, “Anchored in Realism,” p. 59; and Indonesia
Development News 8 (April 1985), pp. 1–2.42. Nasution, “Survey of Recent Developments,” p. 13.43. Dick, “Interisland Shipping,” p. 95.44. Ibid., p. 96.45. Ibid., p. 113.46. Indonesia Development News 8 (September 1984), p. 5.47. Ibid., p. 8.48. Guy Sacerdoti, “Garuda’s Hidden Assets,” p. 38.49. McCawley, “Survey of Recent Developments” (1985), p. 30.50. Ibid.51. Indonesia Development News 7 (April 1984), p. 6.52. Republik Indonesia, Departemen Penerangan, Pidato Kene-
garaan Presiden Republik Indonesia Soeharto di depanSidang Dewan Perwakilan Rakyat 16 Augustus 1984 (pidatodan lampiran), p. 1203.
53. Ibid.54. Paul Handley, “Hamming up the Airways,” p. 50.55. Susumu Awanohara, “More of the Same,” p. 15.56. Susumu Awanohara, “Islam on the Hustings,” p. 24.57. Indonesia’s five-year development plans have all been de-
signed by predominantly United States (Berkeley)-trainedeconomists. In addition, international economic advisersfrom such organizations as the World Bank and the Inter-Governmental Group on Indonesia have helped to shape thedirection of Indonesian development.
58. Esmara, “Regional Income Disparities,” p. 41.59. Hidayat, “Peranan Sektor Informal dalam Perekonomian In-
donesia.”
Notes
300

60. Republik Indonesia, Departemen Penerangan, RencanaPembangunan Lima Tahun Kedua, 1974/75–1978/79.
61. Suharto, Report to the Nation: Address before the House ofthe People’s Representa tives on the 1975/76 State Budget.
62. It thus reflects the “basic needs” approach of internationaldevelopment agencies of the early 1970s.
63. Republic of Indonesia, Directorate of City and RegionalPlanning, “A Short Note on Area/Regional DevelopmentStudies in Indonesia.”
64. Soegijoko Sugijanto and Budhy T. Sugijanto, “Rural-UrbanMigration in Indonesia,” p. 53.
65. Republic of Indonesia, Department of Information, RepelitaIII. The Third Five-Year Development Plan, 1979–84(Summary), p. 4.
66. Ibid., pp. 4–5.67. Suharto, Address of State by His Excellency the President
of the Republic of Indo nesia, Soeharto before the House ofthe People’s Representatives on the Occasion of the 36th In-dependence Day, August 17th, 1981, p. 30.
68. Republic of Indonesia, Bappenas (National DevelopmentPlanning Agency), Repelita IV, The Fourth Five-Year Devel-opment Plan of Indonesia, 1984/85– 1988/89: A Summary,pp. 6–7.
69. Soejatmoko, “Some Thoughts on Higher Education.”70. Nasution, “Survey of Recent Developments,” p. 9.71. Indonesia Development News 5 (July 1982), p. 4.72. “Foreign Economic Trends and their Implications for the
U.S.,” p. 2. But Ruth Daroesman, in “Survey of Recent De-velopments,” p. 1, recognizes only a 7.1 percent growth inmanufacturing production during the years 1975–1980.
73. Production rose from 15.2 million metric tons in 1975 to25.8 million in 1984. Indeed, rice production has more thandoubled since 1969, when production was 12.2 millionmetric tons. Indonesia Development News 9 (No-vember/December 1985), p. 2.
Notes
301

74. McCawley, “Survey of Recent Developments” (1985), p. 29.75. Ibid., p. 30. During the first three five-year plans electricity
was extended to 747,000 new consumers. Repelita IV callsfor the extension of the electricity network to a further 1.6million consumers in 7,000 additional villages. Yet only 16.7percent of the population has access to electricity. IndonesiaDevelopment News 9 (November/December 1985), p. 4.
76. McCawley, “Survey of Recent Developments” (1985), p. 27.Nasution, “Survey of Recent Developments,” p. 1, statesthat the rate of growth of GDP at constant 1973 prices was 5percent in 1984, compared with 4.3 percent and 2.2 percentin the two previous years.
77. McCawley, “Survey of Recent Developments” (1985), p. 10.78. Roepstorff, “Industrial Development in Indonesia,” p. 34.79. Asian Business (February 1984), p. 59; and Bruce Glass-
burner and Mark Poffenberger, “Survey of Recent Develop-ments,” pp. 5–6.
80. Indonesia Development News 7 (April 1984), p. 1.81. Suhartono, “Industrial Development in Indonesia,” p. 19.82. Roepstorff, “Industrial Development in Indonesia,” p. 55.83. McCawley, “Survey of Recent Developments” (1985), p. 10.84. Ibid., pp. 29–31.85. Indonesia Development News 4 (October 1980), p. 5.
Indeed, coffee output has changed from 90 percent pro-duction on large estates before the Second World War toabout 92 percent production by the nation’s 1.5 millionsmall holders. Indonesia Development News 9 (March/April1986), p. 6.
86. Daroesman, “Survey of Recent Developments,” p. 27.87. Ibid., p. 12.88. Indonesia Development News 7 (July 1984), p. 6.89. Republic of Indonesia, Department of Information, Repelita
III. It is estimated that 70 percent of Indonesian householdscurrently live in low-quality housing.
90. Daroesman, “Survey of Recent Developments,” p. 11.
Notes
302

91. Ibid., p. 12.92. The major criticism of this program has been that little al-
lowance has been made for initiative either in the balanceamong projects or for innovative responses to local needs.
93. Daroesman, “Survey of Recent Developments,” p. 16.94. Ibid.95. Susumu Awanohara, Manggi Habir, and Paul Handley,
“Focus Indonesia ’85,” p. 45.96. Daroesman, “Survey of Recent Developments,” p. 17.97. “Widjojo Nitisastro: Clearing the Jungle,” p. 8.98. Awanohara, Habir, and Handley, “Focus Indonesia ’85,” p.
50.99. See chapter 4.
100. “Widjojo Nitisastro,” p. 7.101. Ann Stoler, “Class Structure and Female Autonomy in Rural
Java,” pp. 87–88.102. Gary E. Hansen, “Introduction,” pp. 177–178.103. Results reported by Guy J. Pauker, “Indonesia in 1980:
Regime Fatigue?,” p. 237.104. Indonesia Development News 8 (August 1985), p. 7.105. Paauw, “The Indonesian Economy in the 1980s,” p. 41.106. John A. MacDougall, “Indonesia 1980: Economic Modern-
ization and Political Discontent,” p. 339.107. Benjamin White, “Political Aspects of Poverty, Income Dis-
tribution, and their Measurement: Some Examples fromRural Java.”
108. G. A. Hughes and I. Islam, “Inequality in Indonesia: ADecomposition Analysis,” p. 60.
109. Ibid. See also R. M. Sundrum, “Income Distribution,1970–76.” Unbalanced growth, the rapid growth of the laborforce, displacement of some agricultural labor brought on bychanges in cultivation practices associated with the GreenRevolution, and erosion of traditional means of income
Notes
303

sharing have all contributed to a rising inequality of incomedistribution in rural areas. See Gustav F. Papanek, ed., TheIndonesian Economy, Part 1.
110. Guy Sacerdoti, “Running to Stand Still,” p. 79.111. Quoted in Pauker, “Indonesia in 1980,” p. 234.112. Daroesman, “Survey of Recent Developments,” p. 1.113. In addition, the drop in the price of oil (and, to a much
lesser extent, of other export commodities) has led to severecuts in the development budget; for example, by 22 percentin 1986.
114. Guy Sacerdoti, “Taking the Pulse,” p. 35.115. World Bank, Indonesia: Selected Aspects, p. 7, quoted with
permission.116. Leo Suryadinata and Sharon Siddique, eds., Trends in In-
donesia II, p. 4.117. Njoman Suwidjana, “Indonesia’s Rice Policy: Development
Patterns, Accomplishments, and Problems,” p. 157.118. Derek Healey, “Survey of Recent Developments,” pp. 9–10.119. Daroesman, “Survey of Recent Developments,” p. 29.120. Phyllis Rosendale, “Survey of Recent Developments,”
(1984), p. 13.121. Sid Astbury, “Positive Measures Are Needed to Stimulate a
Sagging Economy,” p. 56.122. Mohamed Sobary, “Participation in Practice.”123. Ibnoe Sujono, “Kebijaksanaan Koperasi: Beberapa Masalah
dan Pro-speknya.”124. Susumu Awanohara, “Jakarta at a Jog,” p. 98.125. “September 1985 Log,” p. 18.126. Max Lane, “Who’s Paying for the Recession?,” p. 12.127. Hla Myint, “Inward and Outward Looking Countries Re-
visited: The Case of Indonesia,” p. 40.128. Garnaut, “General Repercussions,” pp. 419–420.129. Anne Booth and Peter McCawley, “Conclusion: Looking to
the Future,” p. 321.130. Nasution, “Survey of Recent Developments,” p. 13.
Notes
304

131. Lukas Hendrata, “Bureaucracy, Participation and Distrib-ution in Indonesian Development,” p. 25.
132. Asia Research Bulletin 14 (October 1984), p. 1216.133. Awanohara, Habir, and Handley, “Focus Indonesia ’85,” p.
44.134. H. W. Arndt, “Prospects for the 1980s,” p. 51.135. Biro Pusat Statistik, Statistik Indonesia 1983, Buku Saku,
pp. 32–35.136. Morfit, “Panca Sila,” p. 846.137. Leo Suryadinata, “Indonesia in 1979: Controlled Dissent,”
p. 125. See also Justus M. van der Kroef, “‘Petrus’: Patternsof Prophylactic Murder in Indonesia.”
138. Imam Walujo, “Renewing National Consensus.” See alsoPeter McCawley, “Rural Dualism in Indonesia and China:New Technologies, Institutions, and Welfare,” p. 379.
139. Glen Williams, “Community Participation and the Role ofVoluntary Agencies in Indonesia,” p. 23.
140. Awanohara, Habir, and Handley, “Focus Indonesia ’85,” p.44.
141. Ulf Sundhaussen, “Regime Crisis in Indonesia: Facts,Fiction, Predictions,” p. 833.
142. Pauker, “Indonesia in 1980,” p. 236.143. Ibid.144. Steven Jones and Raphael Pura, “Suharto-Linked Monop-
olies Hobble Economy,” p. 8.145. Guy Sacerdoti, “Overdraft of Inefficiency,” p. 44.146. Even though the World Bank claims that more foreign
investment would create jobs and help pribumi entrepre-neurship, which are two major social aims of Repelita III.Guy Sacerdoti, “The Technocrats’ Success Story,” p. 49.
147. Ibid.148. Awanohara, Habir, and Handley, “Focus Indonesia ’85,” p.
43.149. Indonesia Development News 8 (August 1985), p. 6.
Notes
305

8: RETROSPECT AND PROSPECT
1. Such a study would probably identify greater similaritiesamong coastal areas throughout the archipelago andgreater contrasts with the more rugged inland areas of eachisland. In addition, people in coastal areas could be expectedto show far greater integration (through coastal traffic anda common way of life) than inhabitants of more inaccessible,remote, and mountainous interiors ever could.
2. Of the 246 kabupaten in the country in the early 1980s,only eighty-two (or 33 percent) were in Java, a marked con-trast with the proportion of the population living in Java (62percent).
3. Sutan Takdir Alisjahbana, “Jakarta, A Fat Leech Sucking onthe Head of a Fish,” quoted in Feith and Smith, “Indonesia,”p. 194.
4. In this chapter the term Javanese refers to all three majorethnic groups living in Java (the Sundanese in West Java,the Javanese in Central and East Java, and the Madurese inEast Java), but particularly to the ethnic Javanese and Sun-danese.
5. Between 1968 and 1982 Jakarta received 21 percent ofall domestic capital investment and West Java a further 22percent (and 19 and 20 percent, respectively, of the value ofall approved foreign investment projects). Percentages cal-culated from Tables IV.16b and IV.16d in Biro Pusat Statistik,Indikator Ekonomi 1982.
6. Even though there is evidence to suggest that the growthrate was higher during the first part of the decade than inthe latter half, demographers and planners were taken bysurprise at the extra millions.
7. Biro Pusat Statistik, Statistik Indonesia 1983, Buku Saku,Table II.1.1.
Notes
306

8. Between 1905 and 1977, 991,100 people had been movedunder the official government transmigration program; butduring this period the population of Java increased by thirty-five million. During Repelita II, 1974–1979, approximately75,380 people per year were resettled; during Repelita III,1979–1984, the numbers more than tripled to 292,000 peryear. Yet Java’s population continued to grow at a rate ofalmost two million a year. Costs have escalated: in 1977 thecost of moving a fully subsidized family of five, includingtransport, land, housing, materials, tools, seed, and initialfood supplies, was $1,200; by 1983–1984, the comparableexpense was estimated at $11,663. See Colin MacAndrews,“Transmigration in Indonesia: Prospects and Problems,” p.465; and Arndt, “Transmigration: Achievements, Problems,Prospects,” pp. 51,66.
9. Biro Pusat Statistik, Penduduk Indonesia 1980 MenurutPropinsi dan Kabupa ten/Kotamadya, Series L, pp. 1–22.
10. Sid Astbury, “Agonizing over Mechanization Down on the In-donesian Farm,” p. 85.
11. Beth Rose, An Overview of the Indonesian Rice Economy, p.5.
12. “June 1985 Log,” p. 6.13. In 1961 the population of Jakarta was 2.97 million, in 1971
4.58 million, in 1980 6.50 million, and in 1986 an estimated8.16 million. Biro Pusat Statistik, Statistik Indonesia 1983,Buku Saku, Table II.1.2 and Table II.1.1.
14. Barbara Crossette, “Street Vendors of Jakarta Are Sold onSelf-Help.”
15. “A Political Undertone to the Anti-Chinese Riots in Java,” p.780.
16. As the example of Sri Lanka illustrates. Alan M. Strout,“Pertumbuhan Pertanian, Tenaga Kerja dan Pembagian Pen-dapatan: Dilema bagi Repelita III.”
Notes
307

17. This widening gap, as well as that between rich and poor,illustrates the contention at the beginning of the book thatfactors of national integration operate at different levels.
18. Population Reference Bureau, 1985 World Population DataSheet.
19. Ross Muir, “Survey of Recent Developments,” p. 12.20. Sacerdoti, “The Wheel of Fortune Stops.”21. See, for example, Mohammed Thaib Hasan’s letter, “The
Plight of Aceh.”22. Michael Richardson, “Jakarta’s Can of Worms.”23. Dunn, Timor: A People Betrayed, pp. 336–337.24. Tengku di Tiro, “Indonesia or Java?,” p. 4.25. Benedict R. Anderson and Audrey Kahin, “Current Data on
the Indonesian Military Elite,” Indonesia 29, p. 157.26. Undoubtedly, a main motivation for his strong political
control is to ensure his own retention of power. In October1986 Suharto announced his readiness to serve a fifth con-secutive five-year term.
27. Harold Crouch, “Patrimonialism and Military Rule in In-donesia,” p. 586.
28. Guy Sacerdoti, “Consensus Conundrums,” p. 34.29. Some evidence of this can be seen in the appointment of
Benny Murdani, considered to be the most hawkish of theregime’s military in the suppression of opposition, dissent,and restlessness, to head the armed forces. The political ad-ministration has thus been handed over to the Indonesiansecurity and intelligence establishment (Kopkamtib),whereas previously Kopkamtib was under the control ofcareer defense-force officers rather than career security andintelligence officers. See Max Lane, “Climate of Fear: TheRise of General Benny Murdani,” p. 3.
30. Susumu Awanohara, “Suharto’s Kingdom,” p. 32.31. “Indonesia—A Sense of General Disillusionment,” p. 647.
Notes
308

32. For example, by October 1986, about sixty of the 800prospective candidates from Golkar, 250 of 800 from thePPP, and 259 of 629 from the PDI had been judged unfitto run in the April 1987 parliamentary elections. Shim JaeHoon, “Minority Political Parties Face Struggle for Votes,” p.48.
33. Although the official reason given was to reduce the com-plexity of the electoral system.
34. This weakness is deliberately encouraged by the gov-ernment as it thereby keeps the parties more amenable.
35. R. William Liddle, “Indonesia 1977: The New Order’sSecond Parliamentary Election,” p. 178.
36. Lucian W. Pye, Southeast Asia’s Political Systems, p. 61.37. Guy Sacerdoti, “A One-Man Consensus?,” p. 30.38. For example, even though only ten of the twenty-four inner
cabinet are military personnel, the military is in all thekey watchdog positions in the administration; in fact, one-third of the Indonesian army is in urban and administrativeduties. Over half of the provincial governors likewise aremilitary men. Ho Kwon Ping, “The Men on White HorsesNow Ride a Tiger,” p. 42.
39. John A. MacDougall, “Patterns of Military Control in the In-donesian Higher Central Bureaucracy,” p. 89.
40. Hong Lee Oey, Indonesia Facing the 1980’s: A PoliticalAnalysis, p. 369.
41. Ibid., p. 370.42. Ibid., p. 371.43. See Lane, “Climate of Fear‚” p. 3; Kieran Cooke, “Suharto
Tightens his Political Hold”; and Max Lane, “Suharto Inten-sifies Clamp-down on Dissent,” p. 3. A recent article in theFar Eastern Economic Review reported on a deep malaisethat has apparently set in, spurred on by the economicdownturns, but resulting more profoundly from a combi-nation of events including the continuous crackdowns onMuslim opponents; the closing down of the Sinar Harapan
Notes
309

newspaper; the failure to bring to justice the murderer ofDice Budimuljono, the mistress of a prominent person con-nected to the presidential palace; and the increasedawareness of the great wealth and corruption of membersof the presidential family, government leaders, and their as-sociates. See Shim Jae Hoon, “Breaking Old Ground,” pp.46–47.
44. Indeed, a Tempo poll in July 1981 found that over 50percent of those questioned considered “social disturbancesbetween rich and poor” to be the greatest danger to nationalunity. Sacerdoti, “Taking the Pulse.” See also various issuesof Indonesia Reports and Inside Indonesia.
45. See, for example, Guy J. Pauker, “Indonesia 1979: TheRecord of Three Decades,” pp. 124–127.
46. Although, according to one critic, the amount Sukarnospent is miniscule compared with the misappropriations offunds in recent years.
47. According to World Bank statistics, life expectancy rosefrom 43 to 52 years for men and from 45 to 55 years forwomen between 1965 and 1983; infant mortality ratesdropped from 138 to 101 per thousand live births, whilechild death rates (ages one to four years) declined fromtwenty to thirteen per thousand children over the sameperiod. World Bank, World Development Report 1985‚ Table23. Per-capita consumption of rice has also increased im-pressively, from 88 kilograms in 1954 to 107 kilograms in1970 to 146 kilograms in 1983. Leon A. Mears, “Rice andFood Self-Sufficiency in Indonesia,” p. 126. The recentdownturn in the economy because of the drop in oil priceswill almost inevitably be reflected in lower standards ofliving in the immediate future.
48. Yuli Ismartino reports slow but steady development over thepast eight years in East Nusatenggara. He claims that theeconomy has registered growth rates above the national av-erage, thanks to increases in coffee and sandalwood oil pro-
Notes
310

duction and the intensive greening campaign begun in 1979(in which sturdy, fast-growing lamtaro trees were plantedthroughout the province, which provide fodder for morethan 500,000 head of cattle). See Yuli Ismartono, “Letterfrom Kupang.”
49. In a world that has seen the increasing growth of region-alisms and local ethnic nationalisms in both developing anddeveloped countries (such as the Sikhs, the Eritreans, theKurds, the Basques, and the Quebecois), such integration isall the more remarkable.
50. Aceh also has experienced some unrest and rebellion in itsconsistent attempts to throw off all outside control, whetherDutch or Indonesian. However, the costs have been farhigher in East Timor and Irian Jaya. An estimated 100,000people (15 percent of the population) died in East Timorbetween 1974 and 1980 as a result of war, being forcedinto villages, disease, and famine. In Irian Jaya, thousandshave been killed and thousands more have fled across theborder to Papua New Guinea, according to local reports.See “West Papua: Asia or Melanesia? An Interview with RexRumakiek”; and Robin Osborne, “The Flag that Won’t GoAway.”
51. It is interesting to see that, partly as a result of the policiesof the New Order government of Suharto, which havesought to balance development in the sociocultural, inter-action, and economic dimensions in its attempts to builda “just and prosperous society,” several provinces havechanged their relative status in the country and becomemore integrated, from a per-capita perspective. In the in-teraction dimension particularly, Aceh has been drawn moreclosely into the nation-state over the past decade. Despiteits low integration in the economic dimension, it stands outfor its highest rate of recent economic growth and foreigninvestment. West Kalimantan also has experienced closerintegrative ties, particularly in the sociocultural and inter-
Notes
311

action dimensions. These two changes are important partlybecause of the peripheral locations of these two provincesand their proximity to Malaysia. Southeast Sulawesi hasalso become somewhat more integrated, as evidenced inits improved ranking on one of each of the interaction andeconomic factor scores. (See Christine Drake, “The SpatialPattern of National Integration in Indonesia,” p. 485.) Bycontrast, between 1971 and 1980 at least, West and espe-cially East Nusatenggara have slipped even further in theirstatus as least integrated and developed of all the provincesin the country, while the gap between them and the mosthighly developed and integrated provinces on many indiceshas widened. Bengkulu also declined in its relative level ofintegration. The provinces of Java, meanwhile, which stoodout as a much more uniform bloc with common character-istics in the early 1970s, have become less distinctively dif-ferent on a per-capita basis.
Notes
312

Glossary
abangan a Javanese of a heterodox religiousorientation; normally a Muslim who isgreatly influenced by pre-Islamic Hindu,Buddhist, and indigenous animistic beliefs.
ABRI Angkatan Bersenjata Republik Indonesia:Armed Forces of the Republic of Indonesia.
adat localized traditional law and custom; one ofthe major strands of contemporaryIndonesian law.
agama religion.Akabri Akademi ABRI: Indonesian Armed Forces
Academy in Magelang (Central Java).ani-ani single-bladed knife traditionally used for
cutting rice stalks.armada fleet; armada khusus: special fleet; armada
lokal: local fleet; armada Nusantara:archipelago fleet; armada perintis: pioneerfleet; armada rakyat: people’s fleet, madeup traditionally of wooden sailing vessels,some of which are now equipped withoutboard motors.
asimilasi assimilation.Badan PembinaKesatuanBangsa
Institute for the Advancement of NationalUnity.
bahan pokok basic commodity.bahasa language; bahasa Indonesia: the
Indonesian national language, derived fromMalay; bahasa Melayu pasar: marketMalay.
bangsa nation, a people.banteng wild buffalo.
313

Bappeda Badan Perencanaan Pembangunan Daerah:Regional Development Planning Board.Operates at the provincial level.
Bappenas Badan Perencanaan PembangunanNasional: the National DevelopmentPlanning Agency, established in 1965,which has overall responsibility foreconomic development plans.
BhinnekaTunggal Ika
Unity in Diversity. The motto of theRepublic of Indonesia (Sanskrit).
Biro PusatStatistik
Central Bureau of Statistics.
BKK Badan Kredit Kecamatan: subdistrict creditboard.
BPKI Badan Penyelidikan KemerdekaanIndonesia: the Committee for theInvestigation of Independence forIndonesia, formed in May 1945, whereSukarno proposed the Panca Sila.
Budi Utomo Glorious Endeavor Society. An earlynationalist organization, founded in 1908.
bupati district head. Chief officer of a kabupaten.cukong Chinese businessman. A term used to refer
particularly to those Chinese businessmenin collaboration with leading figures in thestate bureaucracy or military.
Cultuurstelsel Cultivation System, instituted by the Dutch,lasting from 1830 to 1860, in which thenatives were compelled to use part of theirland to grow crops in demand on theEuropean market.
daerah territory, region, environs, vicinity, area.daerah-daerahlemah
economically weak or isolated areas.
dakwah Muslim missionary activity.Demokrasiterpimpin
Guided Democracy. The type of governmentexercised under Sukarno from 1957 to1965.
desa village.DewanPertimbanganAgung
Advisory Council of State.
Glossary
314

DPR Dewan Perwakilan Rakyat: House ofPeople’s Representatives. One of the tworepresentative bodies provided for in theConstitution of 1945. Cf. MPR.
dukun shaman, traditional healer, magician,fortune-teller, or sorcerer.
Ekonomiterpimpin
Guided Economy.
Fretilin Frente Revolucionaria do Timor-LesteIndependente: Revolutionary Front for anIndependent East Timor. A guerrillamovement seeking the independence ofEast Timor.
Garis-garisBesar HaluanNegara
Broad Outlines of State Policy.
garuda eagle, mystical bird, carrier of the godVishnu; incorporated into the official seal ofthe Republic of Indonesia.
Gapi Gabungan Politik Indonesia: the Union ofIndonesian Political Associations.
Gestapu Gerakan September Tigapuluh: September30 Movement. Refers to the abortivepro-Communist coup of 1965 and, byinference, to the bloodshed that followed.
Golkar Golongan Karya: Union of FunctionalGroups. Groupings within society, such aspeasants, workers, and women, that arerepresented by delegates to the variousdeliberative bodies. Golkar functions as anarmy-instituted and government-supportedpolitical party, winning over 60 percent ofthe vote in each of the elections heldduring the Suharto era.
gotong royong mutual cooperation, mutual aid; thecustomary practices of labor and produceexchange as they exist particularly in theJavanese peasant village (based on thehard-headed calculation of expectedreciprocity).
Glossary
315
GuidedDemocracy
political system of the period 1957–1965 inwhich the focal point of political powershifted to the president and the DPR wastransformed into a nominated body ofrepresentatives of “functional” groups.
GuidedEconomy
economic policy in the period 1959–1965that emphasized state direction of theeconomy, state ownership of capital, andeconomic self-sufficiency.
haji one who has made the pilgrimage toMecca; a title prefixing the name of thehaji, commanding great respect amongsantri.
hajj the Muslim pilgrimage to Mecca, expectedof every devout Muslim having the meansto do so as one of the Five Pillars of Islam.
hukum nasional national law.hutan forest, woods, jungle.IGGI Inter-Governmental Group on Indonesia.
An informal association of Western andJapanese governmental lending agenciestogether with international developmentagencies such as the World Bank, theInternational Monetary Fund, and theUnited Nations Development Program,established in 1967 to aid Indonesia’srecovery and development. The IGGIincluded, in order of their total outstandingloan commitments at the end of 1980:Japan, the United States, the World Bank,West Germany, the Netherlands, France,the Asian Development Bank, Canada,Belgium, the United Kingdom, Switzerland,Italy, Denmark, Australia, New Zealand,and Austria. For contributing countries forfiscal year 1984–1985 see note 14 inchapter 5.
Indess Indonesian Distance Education SatelliteSystem.
IndischeVereeniging
the Indies Association, formed byIndonesian students in the Netherlands,originally promoting the common interests
Glossary
316

of Indonesian students in the mothercountry, but later becoming involved inIndonesian politics and nationalism.
indoktrinasi indoctrination.IndonesischeVereeniging
the Indonesian Association, founded in1922, which pioneered the Indonesianindependence movement in Europe. In1925 it adopted the Indonesian form of itstitle‚ Perhimpunan Indonesia.
Inpres Instruksi Presiden: presidential instruction.Program financed through specialpresidential instructions or authorizationfor infrastructural works at the local level.
kabupaten regency in the colonial administration,district since independence; theadministrative division below the propinsi(province), corresponding approximately toa county in the United States.
KalimatSyahadat
the credo of Islam, consisting of thestatement, “I testify that there is no Godbut Allah, and Muhammed is his prophet.”The only ineluctable requirement of Islam.
kampung village or part of a village; theadministrative ward of a city; aneighborhood in a city, often inhabited bymigrant villagers, especially one inhabitedby the lower classes.
kapal putih literally “white ships”; ships used by theDutch colonial government foradministrative purposes on noneconomicroutes.
kebatinan mysticism.kecamatan subdistrict; the administrative division
below the kabupaten (regency or district).kepercayaan belief; kepercayaan terhadap Tuhan yang
Maha Esa: belief in the One SupremeBeing, the first principle of the Panca Sila.
Keppres Keputusan Presiden: presidential decree.kepribadian individuality, personality, identity.
Kepribadian Indonesia: Indonesian identity.kerudung veil.kerukunan social harmony.kharisma term used to refer to the Muslim Sunday
lectures.
Glossary
317

komunisme communism.Konfrontasi Indonesian hostile confrontation against
the formation of Malaysia, involvingmilitary action mostly along the easternMalaysian borders from 1963 through1965.
Kopkamtib Komando Operasi Pemulihan Keamanandan Ketertiban: Operational Command forthe Restoration of Security and Order; thevery powerful military agency for domesticsecurity and intelligence created as anational security organization in the wakeof the abortive communist coup of 1965.
kota city.kotamadya municipality or city district; on the same
administrative level as the kabupaten.Kowilhan Komando Wilayah Pertahanan: Regional
Defense Command.K.P.M. Koninklijke Paketvaart Maatschappij (the
Royal Package Transport Company); theDutch interisland shipping company,formed in 1891, withdrawn from Indonesiain 1957.
kraton palace, court (of a Javanese ruler).KUD Koperasi Unit Desa: village cooperative.ladang unirrigated field. Generally associated with
swidden cultivation in Indonesia and to befound almost entirely in the Outer Islands.See swidden, sawah.
LSD Lembaga Sosial Desa: village socialassociation(s).
Majapahit the empire founded in 1293 on the easternpart of Java’s north coast, expanded underGajah Mada to include much of present-dayIndonesia, dissolved in the early sixteenthcentury when the courtiers fled to theinterior of Java and to Bali.
ManipolUSDEK
Manifesto Politik; the Political Manifesto ofthe Republic, as propounded by Sukarno onIndependence Day, 1959. It consisted offive ideas: Undang-undang dasar 1945, the1945 Constitution; Sosialisme Indonesia,socialism à la Indonesia; Demokrasi
Glossary
318

terpimpin, Guided Democracy; Ekon omiterpimpin, Guided Economy; KepribadianIndonesia, Indonesian identity.
merantau the circular migration pattern of theMinangkabau men (possibly to gainfreedom from a matriarchal society), oftento Jakarta but always implying a return totheir homeland.
merdeka free, independent; kemerdekaan: freedom,independence.
MPR Majelis Permusyawaratan Rakyat: People’sConsultative Assembly. One of the tworepresentative bodies provided for in theConstitution of 1945. Cf. DPR.
mufakat consensus; an agreement achieved by theprocess of musyawarah.
musyawarah discussion; search for a consensus throughcompromise and synthesis and thereconciling of opposing views.
Nasakom the national front formed in 1961, based onnasionalisme, agama, and komunisme:nationalism, religion, and communism.
negara state.OPEC Organization of Petroleum Exporting
Countries, the thirteen-member oil cartel,the majority of which are Muslim countries.The great rise in petroleum prices after1973 focused enormous wealth in theOPEC Muslim world. Indonesia, as amember of the cartel, has benefited fromthe increased economic and political poweralso experienced in the other Muslimcountries of OPEC.
orangIndonesia asli
native Indonesian(s).
Orde Baru New Order; term used by the Suhartoregime for post-Sukarno policies based onrealistic thinking and opposed to thepersonality cult and alleged lack ofconstitutionality of the Sukarno regime.
Orde Lama Old Order; term used by the Suhartoregime to refer to the policies of theSukarno era.
Glossary
319

Palapa Indonesia’s domestic satellitecommunications system, first launched inJuly 1976. Palapa also has symbolicmeaning, because Gajah Mada, PrimeMinister of the famous Majapahit kingdom,swore not to eat palapa (a cake made ofcoconut and palm sugar) until Indonesiawas united.
pamong praja civil service; regional administratorsappointed by the central government.
Panca Sila the five principles of the Indonesian State;the basic official ideology enunciated bySukarno and incorporated in the preambleto the 1945 Constitution. The fiveprinciples are belief in One Supreme Being,just and civilized humanity, nationalism,democracy, and social justice.
PDI Partai Demokrasi Indonesia: IndonesianDemocratic Party.
peci the small black velvet cap, originally a signof Islam, but now worn as the nationalheaddress by most Indonesian men.
PedomanPenghayatandanPengamalanPanca Sila
guide to the comprehension and practice ofPanca Sila.
Pelnas Persatuan Pengusaha Pelayaran NiagaSwasta: Union of owners of private tradingvessels.
Pelni Pelayaran Nasional Indonesia: NationalShipping Company.
pembangunan development, construction.pemerataan equality.pemerintah government.pengadilannegeri
court of the first instance (secular).
pengadilantinggi
court of the second instance (appeals).
Pepelra Persatuan Pengusaha Pelayaran Rakyat:Union of People’s Shipping Employers. Anorganization founded in 1971 to serve as a
Glossary
320

unifying force and communication channelfor perahu shipping owners (with thegovernment).
perahu sailing vessel, important especially ineastern Indonesia.
peranakan Indonesia-born Chinese, often of mixedancestry, who speak a non-Chineselanguage by preference, and who haveadopted some Indonesian customs andattitudes. The term derived fromPeranakan Tionghoa (Chinese children ofthe Indies). See totok.
PerhimpunanIndonesia
Indonesian Association, a nationalist youthorganization of Indonesian students in theNetherlands that promoted independencefor the archipelago and advised Indonesiannationalists in Indonesia on tactics.
Permesta Perjuangan Semesta Alam: Total Struggle(of the Republic of Indonesia’sRevolutionary Government); the mostserious regional rebellion against theSukarno administration, by people in WestSumatra and North Sulawesi, 1958–1961.
PerserikatanKomunisIndonesia
the Indonesian Communist Union.
Pertamina Perusahaan Negara Pertambangan Minyakdan Gas Bumi Na sional: the NationalPetroleum and Natural Gas Company(state-owned).
Perumtel the state-owned telephone utility.Peta Sukarela Pembela Tanah Air: Voluntary
Defenders of the Homeland. A volunteerarmy established by the Japanese in 1943.
PKI Partai Komunis Indonesia: the IndonesianCommunist Party.
PNI Partai Nasional Indonesia: the IndonesianNationalist Party.
PPP Partai Persatuan Pembangunan:Development Unity Party.
pribumi indigenous Indonesian.priyayi the entire complex of strongly Hinduized
aesthetic canons and theology forms; thepriyayi variant of the Javanese religion. The
Glossary
321

term priyayi originally referred to thegentry way of life (i.e., the courtiers andofficials of the king), but now it implies thewhole set of attitudes and moralcommitments adhered to by nearly everywhite-collar Javanese, whatever his socialorigin.
propinsi province(s). There are twenty-four trueprovinces (pro pinsi), two specialautonomous regions (Daerah Istimewa) ofAceh and Yogyakarta, and the specialcapital district of Jakarta (Daerah KhususIstimewa). In this book the term province isused for all three types.
PRRI Pemerintah Revolusioner RepublikIndonesia: Revolutionary Government ofthe Republic of Indonesia, proclaimed in1958.
Radio RepublikIndonesia
the national radio of the Republic ofIndonesia.
rakyat ordinary people.Repelita Rencana Pembangunan Lima Tahun:
Five-Year Development Plan. Repelita I: thefirst Five-Year Development Plan,1969–1974; Repelita II: the second,1974–1979; Repelita III: the third,1979–1984; Repelita IV: the fourth,1984–1989.
RGDP regional gross domestic product.rukun tetangga neighborhood association, the smallest
administrative unit in the Indonesiansystem of government.
rupiah (Rp) basic monetary unit of Indonesia. From1971 to 1978 Indonesia maintained anexchange rate of Rp 415 to the U.S. dollar.In November 1978 the rupiah was devaluedto an exchange rate of Rp 625 to the U.S.dollar. The rate floated slightly to Rp 670 in1982–1983. It was devalued again in March1983 to Rp 970 to the U.S. dollar and hasfloated since. In March 1985 the exchangerate was Rp 1,100 to the U.S. dollar.
Glossary
322
santri a devotee of a strongly Muslim and ratherArab style of life. The santri is faithful tothe Five Pillars of Islam: repeating thebasic creed (the Kalimat Syahadat), givingalms, praying five times a day, fastingduring the month of Ramadan, and makingthe pilgrimage to Mecca (hajj) if health andfinances permit. Used collectively, this termapplies also to the group of those havingthese characteristics.
Sarekat Islam the Islamic Union, which grew out of theSarekat Dagang Islam (Islamic TradingUnion), founded in 1911 to strengthenIndonesian batik manufacturers in Solo(Surakarta) against Chinese competition.The appeal of Sare kat Islam to thereligious bond between fellow Indonesianswas one of the first overt expressions ofearly nationalist feeling. Its aims werefourfold: promoting a commercial spiritamong Muslims, mutual assistance tomembers, encouraging spiritualdevelopment and general welfare, andopposition to misunderstanding aboutIslam.
sawah irrigated rice field; the method ofcultivating rice on irrigated land.
sosialisme socialism.statistik statistics.Subsidi DaerahOtonomi
autonomous region subsidy.
suku a tribal, or subtribal or ethnic group.sukubangsa ethnic group or tribe.Susenas Survey Sosioekonomi Nasional: national
socioeconomic survey.swidden shifting or slash-and-burn cultivation, in
which fields are cleared, farmed for one ormore years, and then allowed to return tobush for fallowing, usually to berecultivated at a later time.
Glossary
323

Syariat Islamic law based on scholarlyinterpretation of the Koran and the Hadith(codified Islamic tradition consisting of thesayings and actions of Muhammed asrelated by those who knew him personally).
tempo time; also the name of a weekly magazinesimilar to Time magazine in the UnitedStates.
toleransi tolerance.tonari gumi neighborhood associations organized by
the Japanese during their occupation ofIndonesia, 1942–1945.
totok ethnic Chinese in Indonesia, eitherChina-born or China-oriented, who speak aChinese language by preference. Seeperanakan.
transmigrasi transmigration. Government ruralresettlement program that seeks torelocate large numbers of Javanese (andsome from Bali and Nusatenggara) fromoverpopulated areas to areas of sparsepopulation in the Outer Islands.
Undang-undangdasar 1945
Constitution of 1945.
UniversitasTerbuka
Open University, established in 1984.
Volksraad People’s Council. A body created in 1918,composed of both elected and appointedmembers to advise the governor-generaland apprise him of public opinion. Althoughit had no real political power, it did serve asa forum for the more moderate ofpolitically active Indonesians in the 1920sand 1930s.
wayang shadow puppet; Javanese shadow puppetshow; any theatrical production basedtraditionally on the Hindu epics and othertraditional literature. Wayang kulit: shadowpuppet play with leather puppets. Wayangorang (wong): Javanese stage show featuringhuman dancers; puppets are replaced by liveactors whose acting and dancing areformalized in imitation of the puppets.
zakat religious tax.
Glossary
324

Bibliography
Abdullah, Taufik, “The Sociocultural Scene in Indonesia.” In Trends inIndone sia II, edited by Leo Suryadinata and Sharon Siddique, pp.65–76. Athens, Ohio: Ohio University Press, 1981.
Abdullah, Taufik, Shelly Errington, Peggy Lush, James Siegel, LindaWeinstein, and Elizabeth Witton. “Current Data on the IndonesianMilitary Elite after the Reorganization of 1969–1970.” Indonesia 10(October 1970): 195–208.
Adelman, Irma, and Cynthia Taft Morris. Economic Growth and SocialEquity in Developing Countries. Stanford: Stanford UniversityPress, 1973.
Agassi, Judith B. “Mass Media in Indonesia.” Cambridge: Massachu-setts Institute of Technology, 1969. Mimeographed.
Alfian. “Programming for Development in Indonesia.” Journal of Com-munication 30 (1980): 50–57.
Alisjahbana, Sutan Takdir. Indonesia: Social and Cultural Revolution.2d ed. Translated by Benedict R. Anderson. Kuala Lumpur: OxfordUniversity Press, 1966.
——. “Jakarta, A Fat Leach Sucking on the Head of a Fish.” In HerbertFeith and Alan Smith, “Indonesia,” pp. 193–196. In Southeast Asia:Doc uments of Political Development and Change, edited by RogerM. Smith, pp. 164–250. Ithaca: Cornell University Press, 1974.
Anderson, Benedict R. “Current Data on the Indonesian Military Elite.”Indo nesia 40 (October 1985): 131–162.
——. “Indonesia: Looking Back.” The Wilson Quarterly 5 (Spring 1981):113–125.
325

Anderson, Benedict R., Frederick Bunnell, Lance Castles, Ruth McVey,and James Siegel. “Data on the Current Military Elite.” Indonesia 3(April 1967): 205–216.
Anderson, Benedict R., Judith Ecklund, and Audrey Kahin. “CurrentData on the Indonesian Military Elite.” Indonesia 26 (October1978): 159–177.
Anderson, Benedict R., Elizabeth Graves, Filino Harahap, MildredWegemann, and Elizabeth Witton. “Current Data on the IndonesianArmy Elite.” Indonesia 7 (April 1969): 195–201.
Anderson, Benedict R., and Susan Hatch. “Current Data on the In-donesian Military Elite.” Indonesia 15 (April 1973): 187–197.
——. “Current Data on the Indonesian Military Elite.” Indonesia 18(October 1974): 153–167.
Anderson, Benedict R., and Audrey Kahin. “Current Data on the In-donesian Military Elite.” Indonesia 29 (April 1980): 155–175.
——. “Current Data on the Indonesian Military Elite.” Indonesia 33(April 1982): 129–148.
——. “Current Data on the Indonesian Military Elite.” Indonesia 36(October 1983): 99–134.
——. “Current Data on the Indonesian Military Elite.” Indonesia 37(April 1984): 145–169.
——. “Indonesia’s Territorial Commanders: 1950–March 1983.” In-donesia 35 (April 1983): 109–124.
Anderson, Michael H. “Transnational Advertising and Politics in In-donesia.” Asian Survey 20 (December 1980): 1253–1270.
Anwar, Khaidir. Indonesian: The Development and Use of a NationalLanguage. Yogyakarta: Gadjah Mada University Press, 1980.
Apter, David E. The Politics of Modernization. Chicago: University ofChicago Press, 1965.
Arief, Sritna. Indonesia: Dependency and Underdevelopment. KualaLumpur: Institute for Development Studies, Jakarta, 1981.
Bibliography
326

Arndt, H. W. “Development and Equality: An Overview.” In The In-donesian Economy: Collected Papers, edited by H. W. Arndt, pp.44–60. Singapore: Chopmen Publishers, 1984.
——. “Development and Equality: Themes in Economic Thought aboutIndonesia.” Journal of Southeast Asian Studies 12 (1981): 464–475.
——. “Employment, Unemployment, and Underemployment.” In TheIndo nesian Economy: Collected Papers, edited by H. W. Arndt, pp.93–107. Singapore: Chopmen Publishers, 1984.
——. “Growth and Equity Objectives in Economic Thought aboutIndonesia.” In Indonesia: Australian Perspectives, edited by JamesJ. Fox, Ross Garnaut, Peter McCawley, and J. A. C. Mackie. Vol. 2,Indonesia: Dualism, Growth and Poverty, edited by Ross Garnautand Peter McCawley, pp. 427–439. Canberra: Australian NationalUniversity Research School of Pacific Studies, 1980.
——. “The Impact of the International Economic Crisis on the In-donesian Economy.” Economic Bulletin for Asia and the Pacific 29(December 1978): 28–36.
——. “Prospects for the 1980s.” In The Indonesian Economy: CollectedPapers, edited by H. W. Arndt, pp. 39–52. Singapore: Chopmen Pub-lishers, 1984.
——. “Regional Income Estimates.” Bulletin of Indonesian EconomicStudies 9 (November 1973): 87–102.
——. “Survey of Recent Developments.” Bulletin of Indonesian Eco-nomic Stu dies 19 (August 1983): 1–26.
——. “Transmigration: Achievements, Problems, Prospects.” Bulletin ofIndonesian Economic Studies 19 (December 1983): 50–73.
——, ed. The Indonesian Economy: Collected Papers. Singapore:Chopmen Publishers, 1984.
Arndt, H. W., and R. M. Sundrum. “Regional Price Disparities.” Bulletinof Indonesian Economic Studies 11 (July 1975): 30–68.
Asian Business. Various issues.
Asian Research Bulletin. Various issues.
Bibliography
327

Astbury, Sid. “Agonizing Over Mechanization Down on the IndonesianFarm.” Asian Business 18 (May 1982): 85–88.
——. “Indonesia: Economic Report.” Asian Business 19 (May 1983):67–76.
——. “Indonesia: Economic Report.” Asian Business 20 (February1984): 55–71.
——. “Positive Measures Are Needed to Stimulate a Sagging Economy.”Asian Business 20 (February 1984): 56–59.
Aveling, Harry, ed. The Development of Indonesian Society. New York:St. Martin’s Press, 1980.
Awanohara, Susumu. “A First Warning Shot.” Far Eastern EconomicReview (September 27, 1984): 14–15.
——. “Islam on the Hustings.” Far Eastern Economic Review (April 23,1982): 24–29.
——. “Jakarta at a Jog.” Far Eastern Economic Review (May 17, 1984):94, 96–98.
——. “A Matter of Principles.” Far Eastern Economic Review (October25, 1984): 16–17.
——. “More of the Same.” Far Eastern Economic Review (May 14,1982): 15–16.
——. “The New Call to Prayer.” Far Eastern Economic Review (January24, 1985): 26–29.
——. “On the Defensive in the Pancasila State.” Far Eastern EconomicReview (January 24, 1985): 30–31.
——. “Overboard on Ships.” Far Eastern Economic Review (November8, 1984): 66–70.
——. “The Perennial Problem.” Far Eastern Economic Review (Sep-tember 6, 1984): 26–27.
——. “Points of Contention.” Far Eastern Economic Review (June 21,1984): 25–26.
Bibliography
328

——. “Suharto’s Kingdom.” Far Eastern Economic Review (August 9,1984): 32–36.
Awanohara, Susumu, Manggi Habir, and Paul Handley. “Focus In-donesia ’85.” Far Eastern Economic Review (February 7, 1985):43–62.
Bachtiar, Harsja W. The Indonesian Nation: Some Problems of Inte-gration and Disinte gration. Singapore: Institute of Southeast AsianStudies, 1974.
——. “Masalah Integrasi Nasional di Indonesia.” Prisma 5 (1976): 3–13.
Balassa, Bela. The Theory of Economic Integration. Homewood, Ill.:Richard D. Irwin, 1961.
——. “Types of Economic Integration.” World Bank Staff WorkingPaper, no. 185. Washington, D.C.: World Bank, 1974.
Bank Indonesia. Report for the Financial Year 1982/83. Jakarta: BankIndonesia, 1983.
Baried, S. B. “The World of Islam: Renewal and Reform in Indonesia.”Unesco Courier 8 (1981): 30–31.
Bee, Ooi Jin. The Petroleum Resources of Indonesia. Kuala Lumpur:Oxford University Press, 1982.
Bellwood, Peter. “Plants, Climate and People: The Early HorticulturalPrehistory of Austronesia.” In Indonesia: Australian Perspectives,edited by James J. Fox, Ross Garnaut, Peter McCawley, and J. A.C. Mackie. Vol. 1, Indonesia: The Making of a Culture, edited byJames J. Fox, pp. 57–74. Canberra: Australian National UniversityResearch School of Pacific Studies, 1980.
Berg, C. C. “De sadeng-oorlog en de mythe van Groot-Majapahit.” In-donesie 5 (1951): 385–422.
——. “The Javanese Picture of the Past.” In An Introduction to In-donesian His toriography, edited by Soedjatmoko et al., pp. 87–118.Ithaca: Cornell University Press, 1965.
Bibliography
329

Berry, Brian J. L. “City Size and Economic Development, ConceptualSynthesis and Policy Problems, with Special Reference to Southand Southeast Asia.” In Urbanization and National Development,edited by Leo Jakobson and Ved Prakash, pp. 111–156. BeverlyHills, Calif.: Sage Publications, 1971.
——. “Hierarchical Diffusion: The Basis of Developmental Filtering andSpread in a System of Growth Centers.” In Growth Centers in Re-gional Eco nomic Development, edited by Niles M. Hansen, pp.108–138. New York: The Free Press, 1972.
Berry, Brian J. L., Edgar C. Conkling, and D. Michael Ray. The Geog-raphy of Economic Systems. Englewood Cliffs, N.J.: Prentice-Hall,1976.
“Bhinneka Tunggal Ika Terbabar.” Jakarta: Badan Penerbitan CVSabdopalon, n.d.
Bibliografi Surat Kabar dan Majalah di Indonesia. Jakarta: YayasanInayu, October 1972.
Biro Pusat Statistik. Impor Menurut Jenis Barang dan Negeri Asal. Vol.2. Jakarta: Biro Pusat Statistik, 1983.
——. Indikator Ekonomi. Jakarta: Biro Pusat Statistik, 1976.
——. Indikator Ekonomi I982. Jakarta: Biro Pusat Statistik, 1983.
——. Indikator Ekonomi 1984. Jakarta: Biro Pusat Statistik, 1984.
——. Indikator Sosial 1974. Jakarta: Biro Pusat Statistik, 1974.
——. Indikator Sosial 1982. Jakarta: Biro Pusat Statistik, 1982.
——. National Income of Indonesia 1975 –80. Jakarta: Biro Pusat Sta-tistik, 1981.
——. Pendapatan Regional Propinsi-propinsi di Indonesia 1976 –80.Jakarta: Biro Pusat Statistik, 1981.
——. Penduduk Indonesia 1980 Menurut Propinsi dan Kabupaten/Kota-madya. Series L. Jakarta: Biro Pusat Statistik, 1981.
——. Perpindahan Penduduk Antar Propinsi di Indonesia. Hasil SensusPenduduk 1980. Jakarta: Biro Pusat Statistik, 1984.
Bibliography
330

——. Sensus Industri 1974/75. Jakarta: Biro Pusat Statistik, 1977.
——. Sensus Penduduk 1971. Series D.Jakarta: Biro Pusat Statistik,1974.
——. Sensus Penduduk 1971. Series E. 26 vols. Jakarta: Biro Pusat Sta-tistik, 1974–1975.
——. Sensus Penduduk 1971. Series F. 2 vols. Jakarta: Biro Pusat Sta-tistik, 1975.
——. Sensus Penduduk 1980. Series L. Jakarta: Biro Pusat Statistik,1983.
——. Sensus Penduduk 1980. Series S. 27 vols. Jakarta: Biro Pusat Sta-tistik, 1981.
——. Statistik Angkutan Udara 1981. Jakarta: Biro Pusat Statistik,1981.
——. Statistik Bioskop Indonesia 1981 dan 1982. Jakarta: Biro PusatStatistik, 1983.
——. Statistik Bongkar Muat Barang di Pelabuhan Indonesia 1982.Jakarta: Biro Pusat Statistik, 1983.
——. Statistik Indonesia: Statistical Pocketbook of Indonesia, 1970 and1971. Jakarta: Biro Pusat Statistik, 1972.
——. Statistik Indonesia 1982. Jakarta: Biro Pusat Statistik, 1983.
——. Statistik Indonesia 1983. Jakarta: Biro Pusat Statistik, 1984.
——. Statistik Indonesia 1983, Buku Saku. Jakarta: Biro Pusat Statistik,1984.
——. Statistik Industri 1973. Jakarta: Biro Pusat Statistik, 1975.
——. Statistik Kendaraan Bermotor dan Panjang Jalan 1974. Jakarta:Biro Pusat Statistik, 1974.
——. Statistik Keuangan Pemerintah Daerah 1973/74. Jakarta: BiroPusat Statistik, 1975.
——. Statistik Keuangan Pemerintah Daerah. Daerah Tingkat I(Propinsi) 1975/76– 1980/81. Jakarta: Biro Pusat Statistik, n.d.
Bibliography
331

——. Statistik Keuangan 1981/82 dan 1982/83. Jakarta: Biro Pusat Sta-tistik, 1984.
——. Statistik Kommunikasi. Jakarta: Biro Pusat Statistik, 1973 and1976.
——. Statistik Kommunikasi 1980. Jakarta: Biro Pusat Statistik, 1981.
——. Statistik Pengangkutan Kereta Api 1961–73. Jakarta: Biro PusatStatistik, 1975.
Birowo, Achmad T., and Gary E. Hansen. “Agricultural and RuralDevelopment: An Overview.” In Agricultural and Rural Devel-opment in Indonesia, edited by Gary E. Hansen, pp. 1–27. WestviewSpecial Studies in Social, Political, and Economic Development.Boulder, Colo.: Westview Press, 1981.
Blamey, Jeanne. “Ancient Indonesian Empires.” Princeton University,1975. Xeroxed.
Boediono. “Survey of Recent Developments.” Bulletin of IndonesianEconomic Studies 16 (July 1980): 1–30.
Boileau, Julian M. Golkar: Functional Group Politics in Indonesia.Jakarta: Yayasan Proklamasi, 1983.
Boothe, Anne. “Survey of Recent Developments.” Bulletin of In-donesian Eco nomic Studies 20 (December 1984): 1–35.
Booth, Anne, and Peter McCawley. “Conclusion: Looking to theFuture.” In The Indonesian Economy During the Soeharto Era,edited by Anne Booth and Peter McCawley, pp. 315–322. East AsianSocial Science Monographs. Kuala Lumpur: Oxford UniversityPress, 1981.
——, eds. The Indonesian Economy During the Soeharto Era. EastAsian Social Science Monographs. Kuala Lumpur: Oxford Uni-versity Press, 1981.
Briggs, Jean A. “A Pint of Blood? Or $20?” Forbes (October 12, 1981):91–98.
Bruner, Edward M., and Judith O. Becker, eds. Art, Ritual and Societyin Indone sia. Athens, Ohio: Ohio University Press, 1979.
Bibliography
332

Bruyns, A. Morzer. Glossary of Abbreviations and Acronyms Used in In-donesia. Jakarta: Penerbit Ichtiar, 1970.
Bunge, Frederica M., ed. Indonesia: A Country Study. 4th ed. AreaHandbook Series. Washington, D.C.: U.S. Government PrintingOffice, 1983.
Bunton, John A. W. Building Indonesia: A Market Survey. New York:Construction Press, 1983.
Business International Corporation. Doing Business in the New In-donesia. New York: Business International Corporation, 1968.
Castles, Lance. “The Ethnic Profile of Djakarta.” Indonesia 3 (April1967): 153–204.
Chernichovsky, Dov, and Oey Astra Meesook. Poverty in Indonesia: AProfile. World Bank Staff Working Paper, no. 671. Washington, D.C.:World Bank, 1984.
Coleman, James S., ed. Political Parties and National Integration inTropical Africa. Berkeley: University of California Press, 1964.
Constandse, William. Inside Indonesia: A Practical Guide for Busi-nessmen. New York: Hippociene Books, 1983.
Conway, G. R., and P. S. McCawley. “Third World Development—Intens-ifying Tropical Agriculture: The Indonesian Experience.” Nature302 (1983): 288–289.
Cooke, Kieran. “Suharto Tightens His Political Hold.” Christian ScienceMonitor (February 7, 1986): 9.
Coppel, Charles A. “China and the Ethnic Chinese in Indonesia.” InIndonesia: Australian Perspectives, edited by James J. Fox, RossGarnaut, Peter McCawley, and J. A. C. Mackie. Vol. 3, Indonesia:The Making of a Nation, edited by J. A. C. Mackie, pp. 729–734.Canberra: Australian National University Research School of Pa-cific Studies, 1980.
Cribb, Robert. “Elections in Jakarta.” Asian Survey 24 (February 1984):655–664.
Crossette, Barbara. “Street Vendors of Jakarta Are Sold on Self-Help.”New York Times (July 23, 1985): 2.
Bibliography
333

Crouch, Harold. The Army and Politics in Indonesia. Ithaca: CornellUniversity Press, 1978.
——. “The New Order: the Prospect for Political Stability.” In Indonesia:Australian Perspectives, edited by James J. Fox, Ross Garnaut,Peter McCawley, and J. A. C. Mackie. Vol. 3, Indonesia: The Makingof a Nation, edited by J. A. C. Mackie, pp. 657–668. Canberra:Australian National University Research School of Pacific Studies,1980.
——. “No Enemy in Sight.” Far Eastern Economic Review (February 14,1985): 32–34.
——. “Patrimonialism and Military Rule in Indonesia.” World Politics 31(July 1979): 571–587.
——. “The People’s Army.” Far Eastern Economic Review (February 14,1985): 32–33.
Cummings, William K. “Notes on Higher Education and Indonesian So-ciety.” Prisma 21 (June 1981): 16–39.
Dahm, Bernhard. History of Indonesia in the Twentieth Century. Trans-lated by P. S. Falla. New York: Praeger, 1971.
Dapice, David. “Notes. Income Distribution 1970–77: A Comment.” Bul-letin of Indonesian Economic Studies 16 (March 1980): 86–91.
Daroesman, Ruth. “Survey of Recent Developments.” Bulletin of In-donesian Economic Studies 17 (July 1981): 1–41.
De Blij, Harm. Systematic Political Geography. New York: John Wiley &Sons, 1967.
Deutsch, Karl W. Nationalism and Social Communication. Cambridge:MIT Press, 1965.
Deutsch, Karl W., Sidney A. Burrell, Robert A. Kann, Maurice Lee, Jr.,Martin Lichterman, Raymond E. Lindgren, Francis L. Loewenheim,and Richard W. Van Wagenen. Political Community and the NorthAtlantic Area. Princeton: Princeton University Press, 1957.
Deutsch, Karl W., and William J. Foltz, eds. Nation-Building. New York:Atherton Press, 1963.
Bibliography
334

Deutsch, Karl W., Harold D. Lasswell, Richard L. Merritt, and Bruce M.Russett. “The Yale Political Data Program.” In Comparing Nations:The Use of Quantitative Data in Cross-National Research, edited byRichard L. Merritt and Stein Rokkan, pp. 81–108. New Haven, Ct.:Yale University Press, 1966.
Deutsch, Karl W., and Richard L. Merritt. Nationalism and National De-velopment. Cambridge: MIT Press, 1970.
Dick, H. W. “Interisland Shipping: Progress, Problems and Prospects.”Bulle tin of Indonesian Economic Studies 21 (August 1985):95–114.
——. “Prahu Shipping in Eastern Indonesia.” Bulletin of IndonesianEconomic Studies 11 (July 1975): 69–107.
——. “Prahu Shipping in Eastern Indonesia.” Bulletin of IndonesianEconomic Studies 11 (November 1975): 81–103.
——. “Survey of Recent Developments.” Bulletin of Indonesian Eco-nomic Stu dies 18 (March 1982): 1–38.
di Tiro, Tengku. “Indonesia or Java?” Far Eastern Economic Review(January 10, 1985): 4–5.
Donges, Juergen B., Bernd Stecher, and Frank Wolter. Industrial Devel-opment Policies for Indonesia. Tubingen: J. C. B. Mohr, 1974.
Drake, Christine. The Geography of National Integration: A Case Studyof Indonesia. Ann Arbor, Mich.: University Microfilms, 1977.
——. “National Integration and Public Policies in Indonesia.” Studies inComparative International Development 15 (Winter 1980): 59–84.
——. “The Sociocultural Dimension of National Integration in In-donesia.” Tijdschrift voor Economische en Sociale Geografie 72(1981): 334–346.
——. “The Spatial Pattern of National Integration in Indonesia.”Transac tions, Institute of British Geographers, n.s. 6 (1981):471–490.
Dunn, James. Timor: A People Betrayed. Milton, Australia: JacarandaPress, 1983.
Bibliography
335

Dutt, Ashok K., ed. Southeast Asia: Realm of Contrasts. Dubuque, Iowa:Kendall/Hunt Publishing Co., 1974.
Economic and Social Commission for Asia and the Pacific. Migration,Urbaniza tion and Development in Indonesia, A Comparative Studyon Migration, Urbaniza tion and Development in the ESCAPRegion. Country Reports III. New York: United Nations, 1981.
Ekonomi dan Keuangan Indonesia. Various issues.
Emmerson, Donald K. “Indonesia in 1983: Plus Ca Change….” AsianSurvey 24 (1984): 135–148.
——. “Understanding the New Order: Bureaucratic Pluralism inIndonesia.” Asian Survey 23 (November 1983): 1220–1241.
Esmara, Hendra. “Regional Income Disparities.” Bulletin of IndonesianEconomic Studies 11 (March 1975): 41–57.
Etzioni, Amitai. Political Unification: A Comparative Study of Leadersand Forces. New York: Holt, Rinehart & Winston, 1965.
Evans, Jeremy. “The Growth of Urban Centres in Java Since 1961.” Bul-letin of Indonesian Economic Studies 20 (April 1984): 44–58.
Feith, Herbert. “Indonesia.” In Government and Politics of SoutheastAsia, edited by George McT. Kahin, pp. 183–278. 2d ed. Ithaca:Cornell University Press, 1964.
——. “Indonesia’s Political Symbols and Their Wielders.” World Politics16 (October 1963): 79–97.
Feith, Herbert, and Alan Smith. “Indonesia.” In Southeast Asia: Doc-uments of Political Development and Change, edited by Roger M.Smith, pp. 165–250. Ithaca: Cornell University Press, 1974.
Fisher, Charles A. “Indonesia—A Giant Astir.” Geographical Journal 138(June 1972): 154–165.
——. South-East Asia: A Social, Economic and Political Geography.London: Methuen, 1964.
Foley, William A. “History of Migrations in Indonesia as Seen by a Lin-guist.” In Indonesia: Australian Perspectives, edited by James J.Fox, Ross Garnaut, Peter McCawley, and J. A. C. Mackie. Vol. 1,
Bibliography
336
Indonesia: The Making of a Culture, edited by James J. Fox, pp.75–94. Canberra: Australian National University Research Schoolof Pacific Studies, 1980.
Forbes, Dean. “Mobility and Uneven Development in Indonesia: A Cri-tique of Explanations of Migration and Circular Migration.” In Pop-ulation Mobility and Development: Southeast Asia and the Pacific,edited by G. W. Jones and H. V. Richter, pp. 51–70. DevelopmentStudies Centre Monograph no. 27. Canberra: Australian NationalUniversity, 1981.
“Foreign Economic Trends and Their Implications for the U.S.” Jakarta:U.S. Embassy, Economic Section/Foreign Commercial Service, De-cember 1981.
Fox, James J. “The ‘Movement of the Spirit’ in the Timor Area: ChristianTraditions and Ethnic Identities.” In Indonesia: Australian Perspec-tives, edited by James J. Fox, Ross Garnaut, Peter McCawley, andJ. A. C. Mackie. Vol. 1, Indonesia: The Making of a Culture, editedby James J. Fox, pp. 235–246. Canberra: Australian National Uni-versity Research School of Pacific Studies, 1980.
——, ed. Indonesia: The Making of a Culture. Vol. 1 of Indonesia: Aus-tralian Per spectives, edited by James J. Fox, Ross Garnaut, PeterMcCawley, and J. A. C. Mackie. Canberra: Australian National Uni-versity Research School of Pacific Studies, 1980.
Fox, James J., Ross Garnaut, Peter McCawley, and J. A. C. Mackie, eds.Indonesia: Australian Perspectives. Vol. 1, Indonesia: The Makingof a Culture, edited by James J. Fox. Vol. 2, Indonesia: Dualism,Growth and Poverty, edited by Ross Garnaut and Peter McCawley.Vol. 3, Indonesia: The Mak ing of a Nation, edited by J. A. C.Mackie. Canberra: Australian National University Research Schoolof Pacific Studies, 1980.
Friedmann, John. “A General Theory of Polarized Development.” InGrowth Centers in Regional Economic Development, edited byNiles M. Hansen, pp. 82–107. New York: The Free Press, 1972.
Furnivall, J. S. Netherlands India: A Study of Plural Economy. Cam-bridge: Cambridge University Press, 1939.
Garnaut, Ross. “General Repercussions of the Resources Boom in theSegmented Indonesian Economy.” In Indonesia: Australian Per-spectives, edited by James J. Fox, Ross Garnaut, Peter McCawley,and J. A. C. Mackie. Vol. 2, Indonesia: Dualism, Growth and Poverty,
Bibliography
337

edited by Ross Garnaut and Peter McCawley, pp. 413–423. Can-berra: Australian National University Research School of PacificStudies, 1980.
——. “Survey of Recent Developments.” Bulletin of Indonesian Eco-nomic Stu dies 15 (November 1979): 1–42.
Garnaut, Ross, and Peter McCawley, eds. Indonesia: Dualism, Growthand Pov erty. Vol. 2 of Indonesia: Australian Perspectives, edited byJames J. Fox, Ross Garnaut, Peter McCawley, and J. A. C. Mackie.Canberra: Australian National University Research School of Pa-cific Studies, 1980.
“Garuda Takes a Gamble.” Far Eastern Economic Review (February 6,1981): 66–67.
Geertz, Clifford. “Afterword: The Politics of Meaning.” In Culture andPolitics in Indonesia, edited by Claire Holt, pp. 319–335. Ithaca:Cornell University Press, 1972.
——. Agricultural Involution: The Process of Ecological Change in In-donesia. Berkeley: University of California Press for the Associ-ation of Asian Studies, 1963.
——. “The Integrative Revolution: Primordial Sentiments and Civil Pol-itics in the New States.” In Political Modernization: A Reader inComparative Polit ical Change. 2d ed., edited by Claude E. Welch,Jr., pp. 197–218. Belmont, Calif.: Wadsworth Publishing Co., 1971.
——. The Religion of Java. Glencoe, Ill.: The Free Press, 1960.
Geertz, Hildred. “Indonesian Cultures and Communities.” In Indonesia,edited by Ruth T. McVey, pp. 24–96. New Haven, Ct.: Human Rela-tions Area Files Press, 1963.
Glassburner, Bruce. “The Economy and Economic Policy: General andHistorical.” In The Economy of Indonesia: Selected Readings,edited by Bruce Glassburner, pp. 1–15. Ithaca: Cornell UniversityPress, 1971.
——, ed. The Economy of Indonesia: Selected Readings. Ithaca: CornellUniversity Press, 1971.
Glassburner, Bruce, and Mark Poffenberger. “The Indonesian Economy:A Review Essay.” Bulletin of Indonesian Economic Studies 17 (No-vember 1981): 94–107.
Bibliography
338

——. “Survey of Recent Developments.” Bulletin of Indonesian Eco-nomic Stu dies 19 (December 1983): 1–27.
Goddard, J., and A. Kirby. An Introduction to Factor Analysis, Conceptsand Tech- niques in Modern Geography, no. 7. Norwich: Geo Ab-stracts Ltd., University of East Anglia, 1976.
Goodland, R. Indonesia’s Environmental Progress in Economic Devel-opment. Bogor, Indonesia: Pusat Studi Pengelolaan Sumberdayadan Lingkungan, 1981.
Gottmann, Jean. “Geography and International Relations.” World Pol-itics 3 (January 1951): 153–173.
Grant, Bruce. Indonesia. 2d ed. Melbourne: Melbourne UniversityPress, 1966.
Grant, Ronald M. “Indonesia 1978: A Third Term for PresidentSuharto.” Asian Survey 19 (February 1979): 141–146.
Gray, C. S. “The Jakarta Telephone Connection Charge and FinancingIndonesian Telecommunication Development.” Bulletin of In-donesian Economic Studies 20 (August 1984): 139–150.
Gupta, S. “Income Distribution, Employment, and Growth: A CaseStudy of Indonesia.” World Bank Staff Working Paper, no. 212.Washington, D.C.: World Bank, August 1975.
Haas, Ernst B. “The Uniting of Europe and the Uniting of LatinAmerica.” Journal of Common Market Studies 5 (June 1967):315–343.
Habir, Manggi. “Ulamas Change Course.” Far Eastern EconomicReview (January 10, 1985): 37–39.
Hackenberg, Robert A. “New Patterns of Urbanization in South EastAsia: An Assessment.” Population and Development Review 6(1980): 391–419.
Hainsworth, Geoffrey B. “Dilemmas of Development in Indonesia.”Current History 79 (December 1980): 189–193, 197–198, 208.
——. “Indonesia: Bonanza Development Amidst Shared Poverty.”Current History 77 (December 1979): 199–200, 224, 227–230.
Bibliography
339

——. “The Political Economy of Pancasila in Indonesia.” CurrentHistory 82 (April 1983): 167–171, 178–179.
Handley, Paul. “Hamming up the Airways.” Far Eastern EconomicReview (May 16, 1985): 50–51.
Hansen, Gary E. “Introduction.” In Agricultural and Rural Developmentin Indone sia, edited by Gary E. Hansen, pp. 177–179. WestviewSpecial Studies in Social, Political, and Economic Development.Boulder, Colo.: Westview Press, 1981.
——, ed. Agricultural and Rural Development in Indonesia. WestviewSpecial Studies in Social, Political, and Economic Development.Boulder, Colo.: Westview Press, 1981.
Hardjono, J. M. “Assisted and Unassisted Transmigration in the Contextof Repelita III Targets.” Prisma 18 (September 1980): 3–16.
——. Transmigration in Indonesia. Kuala Lumpur: Oxford UniversityPress, 1977.
Hartshorne, Richard. “The Functional Approach in Political Geog-raphy.” Annals of the Association of American Geographers 40(June 1950): 95–130.
Harvey, Barbara S. Permesta: Half a Rebellion. Monograph Series no.57. Ithaca: Cornell Modern Indonesia Project, 1977.
——. “Tradition, Islam, and Rebellion: South Sulawesi: 1950–65.” Ph.D.diss., Cornell University, 1974.
Hasan, Mohammed Thaib. “The Plight of Aceh.” Far Eastern EconomicReview (August 21, 1981): 3.
Hastings, Peter. “Timor and West Irian: The Reasons Why.” In In-donesia: Aus tralian Perspectives, edited by James J. Fox, RossGarnaut, Peter McCawley, and J. A. C. Mackie. Vol. 3, Indonesia:The Making of a Nation, edited by J. A. C. Mackie, pp. 713–719.Canberra: Australian National University Research School of Pa-cific Studies, 1980.
Hayward, Fred M. “Continuities and Discontinuities Between Studiesof National and International Integration: Some Implications forFuture Research Efforts.” International Organization 24 (Autumn1970): 917–941.
Bibliography
340
Healey, Derek. “Survey of Recent Developments.” Bulletin of In-donesian Eco nomic Studies 17 (March 1981): 1–35.
Hein, Gordon R. “Indonesia in 1981: Countdown to the General Elec-tions.” Asian Survey 22 (February 1982): 200–211.
——. “Indonesia in 1982: Electoral Victory and Economic Adjustmentfor the New Order.” Asian Survey 23 (February 1983): 178–190.
Hendrata, Lukas. “Bureaucracy, Participation and Distribution in In-donesian Development.” Prisma 28 (June 1983): 21–32.
Hidayat. “Peranan Sektor Informal dalam Perekonomian Indonesia.”Ekonomi dan Keuangan Indonesia 26 (December 1978).
Hill, Hal. “Survey of Recent Developments.” Bulletin of IndonesianEconomic Studies 20 (August 1984): 1–38.
Hoon, Shim Jae. “Breaking Old Ground.” Far Eastern Economic Review(November 20, 1986): 45–47.
——. “Minority Political Parties Face Struggle for Votes.” Far EasternEco nomic Review (November 20, 1986): 48–49.
Hughes, G. A., and I. Islam. “Inequality in Indonesia: A DecompositionAnalysis.” Bulletin of Indonesian Economic Studies 17 (July 1981):42–71.
Hugo, Graeme J. “Circular Migration in Indonesia.” Population and De-velopment Review 8 (March 1982): 59–83.
——. “Levels, Trends, and Patterns of Urbanization.” In Migration,Urban ization and Development in Indonesia, A Comparative Studyon Migration, Urban ization and Development in the ESCAPRegion. Country Reports III, pp. 57–80. Economic and Social Com-mission for Asia and the Pacific. New York: United Nations, 1981.
——. “Patterns of Interprovincial Migration.” In Migration, Urban-ization and Development in Indonesia, A Comparative Study onMigration, Urbanization and Development in the ESC AP Region.Country Reports III, pp. 81–110. Economic and Social Commissionfor Asia and the Pacific. New York: United Nations, 1981.
——. Population Mobility in West Java. Yogyakarta: Gadjah Mada Uni-versity Press, 1978.
Bibliography
341

——. “Road Transport, Population Mobility and Development in Indone-sia.” In Population Mobility and Development: Southeast Asia andthe Pacific, edited by G. W. Jones and H. V. Richter, pp. 355–386. De-velopment Studies Centre Monograph no. 27. Canberra: AustralianNational University, 1981.
Hugo, Graeme J., Terence H. Hull, Valerie J. Hull, and Gavin W. Jones.The Demographic Dimension in Indonesian Development. Sin-gapore: Oxford University Press, 1987.
Ibrahim, A. Majid, and H. Benjamin Fisher. “Regional DevelopmentStudies and Planning in Indonesia.” Bulletin of Indonesian Eco-nomic Studies 15 (July l979): 113–127.
Ihromi, T. O. “Population and Culture in Indonesia.” In The CulturalConse quences of Population Change: Report on a Seminar Held inBucharest, Romania, August 14–17, 1974. Washington, D.C.: Smith-sonian Institution Center for the Study of Man, April 1975. Mimeo-graphed.
“Indonesia—A Sense of General Disillusionment.” Asia Research Bul-letin 9 (January 31, 1980): 647–649.
Indonesia Development News. Republic of Indonesia: National Devel-opment Information Office. Various issues.
Indonesia Reports. College Park, Md.: Indonesia Publications,1984–1986. Various issues.
“Indonesia. The Awaking Giant.” Euromoney 37 (January 1979): 1–37,supplement.
“Indonesia. Trade and Investment Survey.” Journal of Commerce 357(August 1983): 1c–6c.
Inside Indonesia. Bulletin of the Indonesia Resources and InformationProgram (IRIP). Canberra, Australia, 1984–1985. Various issues.
Ismartono, Yuli. “Letter from Kupang.” Far Eastern Economic Review(November 20, 1986): 110.
Jackson, W. A. Douglas, and Edward J. F. Bergman. “On the Orga-nization of Political Space.” Geographica Polonica 31 (1975):149–161.
Bibliography
342

Jacob, Philip E., and James V. Toscano, eds. The Integration of PoliticalCommuni ties. Philadelphia: Lippincott, 1964.
Jenkins, David. “The Aging of the New Order.” Far Eastern EconomicReview (June 27, 1980): 22–24.
——. “Death of a Dream of Freedom: Officials Tackle East Timor’sDaunting Economic and Social Problems.” Far Eastern EconomicReview (May 23, 1980): 30–32.
——. “What Makes Daud Jusuf Run?” Far Eastern Economic Review(October 10, 1980): 36–39.
Johnstone, John, and Jiyono. “Out of School Factors and EducationalAchievement in Indonesia.” Comparative Education Review 27(1983): 278–295.
Jones, Gavin W. “Population Growth in Java.” In Indonesia: AustralianPerspec tives, edited by James J. Fox, Ross Garnaut, Peter Mc-Cawley, and J. A. C. Mackie. Vol. 2, Indonesia: Dualism, Growth andPoverty, edited by Ross Garnaut and Peter McCawley, pp. 515–538.Canberra: Australian National University Research School of Pa-cific Studies, 1980.
——. “The Problem of Urbanization in Indonesia.” Jakarta: LembagaDemografi, Fakultas Ekonomi, Universitas Indonesia, 1975.Mimeographed.
Jones, Gavin W., and H. V. Richter, eds. Population Mobility and De-velopment: Southeast Asia and the Pacific. Development StudiesCentre Monograph no. 27. Canberra: Australian National Uni-versity, 1981.
Jones, Gavin W., and R. Gerard Ward. “Rural Labour Shortages inSoutheast Asia and the Pacific: A review of the Evidence.” In Pop-ulation Mobility and Development: Southeast Asia and the Pacific,edited by Gavin W. Jones and H. V. Richter, pp. 387–405. Devel-opment Studies Centre Monograph no. 27. Canberra: AustralianNational University, 1981.
Jones, Steven. “Fight for Timor Grows Quiet but Goes On.” Wall StreetJournal (March 20, 1985).
Jones, Steven, and Raphael Pura. “Suharto-Linked Monopolies HobbleEconomy.” Asian Wall Street Journal (November 24, 1986): 1 and8.
Bibliography
343

“June 1985 Log.” Indonesia Reports 9 (July 1985).
Kahin, Audrey, ed. Regional Dynamics of the Indonesian Revolution:Unity from Diversity. Honolulu: University of Hawaii Press, 1985.
Kahin, George McT. “Indonesia.” In Major Governments of Asia, editedby George McT. Kahin, pp. 471–592. Ithaca: Cornell UniversityPress, 1958.
——. Nationalism and Revolution in Indonesia. Ithaca: Cornell Uni-versity Press, 1952.
——, ed. Governments and Politics of Southeast Asia. 2d ed. Ithaca:Cornell University Press, 1964.
——. Major Governments of Asia. Ithaca: Cornell University Press,1958.
Kamal, Salih. “Urban Dilemmas in Southeast Asia.” Singapore Journalof Tropi cal Geography 3 (1982): 147–161.
Katz, Elihu, and George Wedell. Broadcasting in the Third World:Promise and Per formance. Cambridge: Harvard University Press,1977.
Kaye, Lincoln. “Anchored in Realism.” Far Eastern Economic Review(July 11, 1985): 58–60.
——. “A Change of Customs.” Far Eastern Economic Review (April 25,1985): 118–120.
——. “Fighting-trim Reforms.” Far Eastern Economic Review (October24, 1985): 23–26.
——. “Happy Father’s Day.” Far Eastern Economic Review (August 29,1985): 25.
——. “Legislating Harmony.” Far Eastern Economic Review (June 13,1985): 14–16.
Kearney, Robert N., ed. Politics and Modernization in South andSoutheast Asia. New York: John Wiley & Sons, 1975.
Keuning, Steven J. “Farm Size, Land Use, and Profitability of FoodCrops in Indonesia.” Bulletin of Indonesian Economic Studies 20(April 1984): 58–82.
Bibliography
344

Kirchbach, Friedrich von. “Transnational Corporations in the AsianRegion.” Economic Bulletin for Asia and the Pacific 33 (June 1982):16–19.
Kompas. Various issues.
Kronholz, June. “Mass Migration: Indonesia Pushes Plans for MovingMillions off the Island of Java; Resettling on Other Islands Aims toEase Crowding.” Wall Street Journal 202 (1983): 1 and 56.
Lagerberg, Kees. West Irian and Jakarta Imperialism. New York: St.Martin’s Press, 1979.
Lane, Max. “Climate of Fear: The Rise of General Benny Murdani.”Inside Indonesia 1 (November 1983): 2–5.
——. “Suharto Intensifies Clamp-down on Dissent.” Inside Indonesia 2(May 1984): 3–5.
——. “Who’s Paying for the Recession?” Inside Indonesia 1 (November1983): 12–19.
Lee, Khoon Choy. Indonesia, Between Myth and Reality. London: Nile& Mackenzie, 1976.
Legge, John D. Indonesia. Englewood Cliffs, N.J.: Prentice-Hall, 1964.
Leinbach, T. R. “Transport Evaluation in Rural Development: AnIndonesian Case-Study.” Third World Planning Review 5 (1983):23–35.
Leng, Lee Yong. “Southeast Asia: The Political Geography of EconomicImbalance.” Tijdschrift voor Economische en Sociale Geografie 70(1979): 339–349.
Lev, Daniel S. “Judicial Institutions and Legal Culture in Indonesia.”In Cul ture and Politics in Indonesia, edited by Claire Holt, pp.246–318. Ithaca: Cornell University Press, 1972.
Liddle, R. William. Ethnicity, Party and National Integration: An In-donesian Case Study. New Haven, Ct.: Yale University Press, 1970.
——. “Indonesia 1977: The New Order’s Second ParliamentaryElection.” Asian Survey 18 (1978): 175–185.
Bibliography
345

——. “The Politics of Ekonomi Pancasila: Some Reflections on a RecentDebate.” Bulletin of Indonesian Economic Studies 18 (March1982): 96–101.
Lindberg, Leon N. “Political Integration as a Multidimensional Phe-nomenon Requiring Multivariate Measurement.” International Or-ganization 24 (Autumn 1970): 649–731.
Lineton, Jacqueline. “Pasompe ‘Ugi’: Bugis Migrants and Wanderers.”Archi pel 10 (1975): 181–201.
Lyon, Peter. War and Peace in South-East Asia. London: Oxford Uni-versity Press, 1969.
MacAndrews, Colin. “Transmigration in Indonesia: Prospects andProblems.” Asian Survey 18 (June 1978): 458–472.
McCawley, Peter. “The Devaluation and Structural Change in In-donesia.” In Southeast Asian Affairs 1980, edited by Leo Suryad-inata, pp. 145–157. Singapore: Institute of Southeast AsianStudies, 1980.
——. “The Economics of Ekonomi Pancasila.” Bulletin of IndonesianEconomic Studies 18 (March 1982): 102–109.
——. “The Growth of the Industrial Sector.” In The Indonesian EconomyDur ing the Soeharto Era, edited by Anne Booth and Peter Mc-Cawley, pp. 62–101. East Asian Social Science Monographs. KualaLumpur: Oxford University Press, 1981.
——. Industrialization in Indonesia: Development and Prospects. Devel-opment Studies Centre, Occasional Paper no. 13. Canberra: Aus-tralian National University, 1979.
——. “Rural Dualism in Indonesia and China: New Technologies,Institutions, and Welfare.” In Indonesia: Australian Perspectives,edited by James J. Fox, Ross Garnaut, Peter McCawley, and J. A.C. Mackie. Vol. 2, Indonesia: Dualism, Growth and Poverty, editedby Ross Garnaut and Peter McCawley, pp. 373–397. Canberra:Australian National University Research School of Pacific Studies,1980.
——. “A Slowdown in Industrial Growth?” Bulletin of Indonesian Eco-nomic Studies 20 (December 1984): 158–174.
——. “Survey of Recent Developments.” Bulletin of Indonesian Eco-nomic Stu dies 19 (April 1983): 1–31.
Bibliography
346

——. “Survey of Recent Developments.” Bulletin of Indonesian Eco-nomic Stu dies 21 (April 1985): 1–31.
McCawley, Peter, and Chris Manning. “Survey of Recent Develop-ments.” Bulletin of Indonesian Economic Studies 12 (November1976): 1–49.
MacDougall, John A. “Indonesia: Economic Growth and PoliticalOrder.” Current History 85 (April 1986): 172–175, 178–179.
——. “Indonesia 1980: Economic Modernization and Political Dis-content.” Asian Thought and Society: An International Review 5(December 1980): 339–341.
——. “Patterns of Military Control in the Indonesian Higher Central Bu-reaucracy.” Indonesia 33 (April 1982): 89–121.
Mackie, J. A. C. “The Indonesian Economy, 1950–1963.” In TheEconomy of Indonesia: Selected Readings, edited by Bruce Glass-burner, pp. 16–69. Ithaca: Cornell University Press, 1971.
——. “Integrating and Centrifugal Forces in Indonesian Politics Since1945.” In Indonesia: Australian Perspectives, edited by James J.Fox, Ross Garnaut, Peter McCawley, and J. A. C. Mackie. Vol. 3,Indonesia: The Making of a Nation, edited by J. A. C. Mackie,pp. 669–684. Canberra: Australian National University ResearchSchool of Pacific Studies, 1980.
——, ed. Indonesia: The Making of a Nation. Vol. 3 of Indonesia: Aus-tralian Per spectives, edited by James J. Fox, Ross Garnaut, PeterMcCawley, and J. A. C. Mackie. Canberra: Australian National Uni-versity Research School of Pacific Studies, 1980.
McNicoll, G. “Recent Demographic Trends in Indonesia.” Populationand Development Review 8 (1982): 811–819.
McVey, Ruth T. “The Post-Revolutionary Transformation of the In-donesian Army, Part II.” Indonesia 13 (April 1972): 147–181.
——, ed. Indonesia. New Haven, Ct.: Human Relations Area Files Press,1963.
May, R. J. “Irian Jaya: West Papuan Nationalism in 1979.” In Indonesia:Aus tralian Perspectives, edited by James J. Fox, Ross Garnaut,Peter McCawley, and J. A. C. Mackie. Vol. 3, Indonesia: The Making
Bibliography
347

of a Nation, edited by J. A. C. Mackie, pp. 721–728. Canberra:Australian National University Research School of Pacific Studies,1980.
Mears, Leon A. “Rice and Food Self-Sufficiency in Indonesia.” Bulletinof Indo nesian Economic Studies 20 (August 1984): 122–138.
Merritt, Richard L., and Stein Rokkan, eds. Comparing Nations: TheUse of Quantitative Data in Cross-National Research. New Haven,Ct.: Yale University Press, 1966.
Missen, G. J. Viewpoint on Indonesia: A Geographical Study. Mel-bourne: Thomas Nelson, 1972.
Montgomery, Roger D. “Migration, Employment, and Unemployment inJava: Changes from 1961 to 1971 with Particular Reference to theGreen Revolution.” Asian Survey 15 (March 1975): 221–233.
Montgomery, Roger D., and Sugito Toto. “Changes in the Structure ofFarms and Farming in Indonesia Between Censuses, 1963–1973:The Issues of Inequality and Near-landlessness.” Journal ofSoutheast Asian Studies 11 (September 1980): 348–365.
Morfit, Michael. “Panca Sila: The Indonesian State Ideology Accordingto the New Order Government.” Asian Survey 21 (August 1981):838–851.
Moritz, Frederic A. “Indonesia—Will the Volcano Erupt?” ChristianScience Monitor (May 3, 1979): 1 and 9.
Mubyarto. “Prospek Perekonomian Indonesia dalam Pelita III.” Prisma(January 1979).
Muir, Ross. “Survey of Recent Developments.” Bulletin of IndonesianEconomic Studies 22 (August 1986): 1–27.
Murai, Y. “The Bima Program and Agricultural Labor in Indonesia.” De-velop ing Economies 18 (1980): 23–44.
Myint, Hla. “Inward and Outward Looking Countries Revisited: TheCase of Indonesia.” Bulletin of Indonesian Economic Studies 20(August 1984): 39–52.
Myrdal, Gunnar. Asian Drama: An Inquiry into the Poverty of Nations.Vol. 3. New York: Twentieth Century Fund, 1968.
Bibliography
348
Naim, Mochtar. “Merantau: Causes and Effects of Minangkabau Vol-untary Migration.” Institute of Southeast Asian Studies OccasionalPapers, no. 5. Singapore: Institute of Southeast Asian Studies,1971.
——. “Voluntary Migration in Indonesia.” In Internal Migration: TheNew World and the Third World, edited by A. H. Richmond and D.Kubat, pp. 148–183. London: Sage, 1976.
Nasution, Anwar. “Survey of Recent Developments.” Bulletin of In-donesian Eco nomic Studies 21 (August 1985): 1–23.
Nawawi, M. A. “The Regions and National Development under theNew Order.” In Indonesia: Australian Perspectives, edited by JamesJ. Fox, Ross Garnaut, Peter McCawley, and J. A. C. Mackie. Vol.3, Indonesia: The Making of a Nation, edited by J. A. C. Mackie,pp. 685–698. Canberra: Australian National University ResearchSchool of Pacific Studies, 1980.
Neill, Wilfred T. Twentieth Century Indonesia. New York: ColumbiaUniversity Press, 1973.
“New University Aiding Indonesian Students.” The Evening Post(Charleston, S.C.) (September 24, 1984): 8A.
Nitisastro, Widjojo. Population Trends in Indonesia. Ithaca: CornellUniversity Press, 1970.
Noer, Deliar. “Islam as a Political Force in Indonesia.” In Indonesia:Australian Perspectives, edited by James J. Fox, Ross Garnaut,Peter McCawley, and J. A. C. Mackie. Vol. 3, Indonesia: The Makingof a Nation, edited by J. A. C. Mackie, pp. 633–645. Canberra:Australian National University Research School of Pacific Studies,1980.
Nye, Joseph S. “Comparative Regional Integration: Concept andMeasurement.” International Organization 22 (Autumn 1968):856–858.
Oey, Hong Lee. Indonesia Facing the 1980’s: A Political Analysis. Hull,England: Europress for South-East Asia Research Group, 1979.
O’Malley, William J. “Second Thoughts on Indonesian Nationalism.” InIndo nesia: Australian Perspectives, edited by James J. Fox, RossGarnaut, Peter McCawley, and J. A. C. Mackie. Vol. 3, Indonesia:
Bibliography
349

The Making of a Nation, edited by J. A. C. Mackie, pp. 601–614.Canberra: Australian National University Research School of Pa-cific Studies, 1980.
Osborne, Robin. “The Flag that Won’t Go Away.” Inside Indonesia 4(March 1985): 28–31.
Oya, Kenji. “Environmental Dimensions of Rural Regional Devel-opment: A Report of a Study in Three Asian Countries (India,Thailand and Indonesia).” Regional Development Dialogue 3(Spring 1982): 72–116.
Paauw, Douglas S. “Economic Growth, Employment, and Productivity:Prospects for Indonesia.” The Singapore Economic Review 29(1984): 111–125.
——. “From Colonial to Guided Economy.” In Indonesia, edited by RuthT. McVey, pp. 155–247. New Haven, Ct.: Human Relations AreaFiles Press, 1963.
——. “The Indonesian Economy in the 1980s.” Economic Bulletin forAsia and the Pacific 31 (December 1980): 31–53.
——. “Recent Economic Trends in Indonesia.” Journal of SoutheastAsian Stud ies 14 (1983): 248–249.
Panglaykim, J. “Indonesia: Economic Dimensions and Resilience.” AsiaPacific Community 15 (1982): 76–82.
Papanek, Gustav F., ed. The Indonesian Economy. New York: Praeger,1980.
Pauker, Guy J. “Indonesia 1979: The Record of Three Decades.” AsianSurvey 20 (February 1980): 123–134.
——. “Indonesia in 1980: Regime Fatigue?” Asian Survey 21 (February1981): 232–244.
Peacock, James L. Indonesia: An Anthropological Perspective. PacificPalisades, Calif.: Goodyear Publishing, 1973.
Pelzer, Karl J. “The Agricultural Foundation.” In Indonesia, edited byRuth T. McVey, pp. 118–154. New Haven, Ct.: Human RelationsArea Files Press, 1963.
Bibliography
350

Ping, Ho Kwon. “The Men on White Horses Now Ride a Tiger.” FarEastern Economic Review (April 11, 1980): 34–48.
“A Political Undertone to the Anti-Chinese Riots in Java.” Asia ResearchBulle tin 10 (February 28, 1981): 778–780.
Population Reference Bureau. 1985 World Population Data Sheet.Washington, D.C.: Population Reference Bureau, Inc., 1985.
Prapanca, Rakawi. The Nagara-Kertagama, translated and edited byTheodore G. Th. Pigeaud. In Java in the Fourteenth Century: AStudy of Cultural His tory, pp. 219–250. The Hague: Martinus Ni-jhoff, 1962.
Premdas, Ralph R. “The Organisasi Papua Merdeka in Irian Jaya.”Asian Sur vey 25 (October 1985): 1055–1074.
Pryor, Robin J. “The Migrant to the City in Southeast Asia: Can andShould We Generalize?” Asian Profile 5 (1977): 63–89.
——. Migration and Development in Southeast Asia: A DemographicPerspective. Kuala Lumpur: Oxford University Press, 1979.
Purcell, Victor. The Chinese in Southeast Asia. 2d ed. London: OxfordUniversity Press, 1965.
Pye, Lucian W. Southeast Asia’s Political Systems. Englewood Cliffs,N.J.: Prentice-Hall, 1974.
Race, Jeffrey. “The Political Economy of New Order Indonesia in aComparative Regional Perspective.” In Indonesia: Australian Per-spectives, edited by James J. Fox, Ross Garnaut, Peter McCawley,and J. A. C. Mackie. Vol. 3, Indonesia: The Making of a Nation,edited by J. A. C. Mackie, pp. 699–709. Canberra: Australian Na-tional University Research School of Pacific Studies, 1980.
Reinhardt, Jon M. Foreign Policy and National Integration: The Case ofIndonesia. Southeast Asia Studies Monograph Series, no. 17. NewHaven, Ct.: Yale University Press, 1971.
Reksohadiprodjo, Sukanto. “Oil and Other Energy Resources forDevelopment: The Indonesian Case.” Journal of Energy and Devel-opment 5 (1980): 289–325.
——. “Tata Guna Tanah dan Pengembangan Perkotaan.” Prisma 16(1984): 14–18.
Bibliography
351

Republic of Indonesia, Bappenas (National Development PlanningAgency). Repelita IV, The Fourth Five-Year Development Plan ofIndonesia 1984/85– 1988/89: A Summary. Policies and Prospectsfor Sustained Development under Challenging Conditions. Jakarta:National Development Planning Agency, 1984.
Republic of Indonesia, Department of Information. The First Five-YearDevel opment Plan, 1969/70 –1973/74. Jakarta: Department of In-formation, 1969.
——. Indonesia 1979: An Official Handbook. Jakarta: Department ofInformation, 1980.
——. Repelita III. The Third Five-Year Development Plan, 1979 –84(Summary). Jakarta: Department of Information, n.d.
Republic of Indonesia, Directorate of City and Regional Planning. “AShort Note on Area/Regional Development Studies in Indonesia.”Jakarta: Directorate of City and Regional Planning, 1978.
Republik Indonesia, Departemen Penerangan, Proyek Penelitian danPengembangan. Hasil-hasil Polling Pendapat Umum Pelita TahunKe-IV. Jakarta: Departemen Penerangan, 1972.
——. Pidato Kenegaraan Presiden Republik Indonesia Soeharto didepan Sidang Dewan Perwakilan Rakyat 16 Agustus 1984 (pidatodan lampiran). Jakarta: Departemen Penerangan, 1984.
——. Rencana Pembangunan Lima Tahun Kedua, 1974/75–1978/79.Jakarta: Departemen Penerangan, 1973.
——. Rencana Pembangunan Lima Tahun Keempat 1984/85 –1988/89.4 vols. Jakarta: Departemen Penerangan, 1984.
Republik Indonesia, Departemen Perdagangan. Ikhtisar PerkembanganHarga- harga dan Data Statistik Perdagangan. Jakarta: De-partemen Perdagangan, 1974.
Republik Indonesia, Departemen Perhubungan Laut. Direktorat Perka-palan dan Pelayaran SubDit. Kebandaran dan Awak Kapal, SeksiP.U. File No. TH 1981/82. 2 vols. Jakarta: Departemen Per-hubungan Laut, 1983.
Republik Indonesia, Direktorat Jenderal Perhubungan Udara. “AirportTraffic Statistics, Domestic and International.” Jakarta: DirektoratJenderal Perhubungan Udara, 1977. Mimeographed.
Bibliography
352

Republik Indonesia, Perusahaan Negara PELNI. Facts and Figures ofP.N. PELNI. Jakarta: Perusahaan Negara PELNI, 1971.
Republik Indonesia. Prospek Perekonomian Indonesia. Jakarta, 1973.
Resink, Gertrude J. Indonesia’s History Between the Myths. TheHague: W. van Hoeve, 1968.
Richardson, Michael. “Jakarta’s Can of Worms.” Far Eastern EconomicReview (January 1, 1982): 26.
Robison, Richard. Indonesia: The Rise of Capital. Asian Studies Associ-ation of Australia, Southeast Asia Publications Series no. 13. NorthSydney: Allen & Unwin, 1987.
Rodgers, Peter. “Indonesia’s Faithful Flex Their Political Muscle.” FarEastern Economic Review (November 28, 1980): 37–39.
Roeder, O. G., comp. Who’s Who in Indonesia: Biographies ofProminent Indonesian Personalities in All Fields. Jakarta: GunungAgung, 1971.
Roepstorff, Torben M. “Industrial Development in Indonesia: Perfor-mance and Prospects.” Bulletin of Indonesian Economic Studies 21(April 1985): 32–62.
Rose, Beth. An Overview of the Indonesian Rice Economy. Ithaca:Cornell International Agricultural Economics Study, 1982.
Rosendale, Phyllis. “Survey of Recent Developments.” Bulletin of In-donesian Economic Studies 16 (March 1980): 1–33.
——. “Survey of Recent Developments.” Bulletin of Indonesian Eco-nomic Stu dies 20 (April 1984): 1–31.
Rosser, Colin. “The Evolving Role of a National Agency for Housing andUrban Development in Indonesia.” Habitat International 7 (1983):137– 149.
——. “Training in Regional Development in Indonesia: A Report Pre-pared for the Regional Development Division of Bappenas.”Jakarta, 1974. Mimeographed.
Royal Dutch Geographical Society. Atlas van Tropisch Nederland. TheHague: Royal Dutch Geographical Society, 1938.
Bibliography
353
Rummel, Rudolph J. Applied Factor Analysis. Evanston: NorthwesternUniversity Press, 1970.
——. “The Dimensionality of Nations Project.” In Comparing Nations:The Use of Quantitative Data in Cross-National Research, editedby Richard L. Merritt and Stein Rokkan, pp. 109–130. New Haven,Ct.: Yale University Press, 1966.
——. Dimensions of Nations Series. Vol. 3, National Attributes and Be-havior. Beverly Hills, Calif.: Sage Publications, 1979.
Sacerdoti, Guy. “Consensus Conundrums.” Far Eastern EconomicReview (August 21, 1981): 34–35.
——. “Garuda’s Hidden Assets.” Far Eastern Economic Review (May 1,1981): 38–40.
——. “A One-Man Consensus?” Far Eastern Economic Review (May 22,1981): 30–31.
——. “Overdraft of Inefficiency.” Far Eastern Economic Review (May29, 1981): 41–47.
——. “Running to Stand Still.” Far Eastern Economic Review (August28, 1981): 78–79.
——. “Taking the Pulse.” Far Eastern Economic Review (August 28,1981): 34–35.
——. “The Technocrats’ Success Story.” Far Eastern Economic Review(May 29, 1981): 8–49.
——. “The Wheel of Fortune Stops.” Far Eastern Economic Review(January 16, 1981): 14.
Salim, Emil. “Trends in the Indonesian Economy.” In Trends in In-donesia II, edited by Leo Suryadinata and Sharon Siddique, pp.101–116. Athens, Ohio: Ohio University Press, 1981.
Schiller, A. Arthur. The Formation of Federal Indonesia, 1945 –1949.The Hague: W. van Hoeve, 1955.
Seda, Frans. “The Progress of Economic Integration During TwoDecades.” Prisma 4 (November 1976): 7–26.
“September 1985 Log.” Indonesia Reports 12 (October 1985).
Bibliography
354

Sethuraman, S. V. Jakarta: Urban Development and Employment.Geneva: International Labor Organization, 1976.
Shakhs, Salah El. “Development, Primacy, and Systems of Cities.”Journal of Developing Areas 7 (October 1972): 11–36.
Sharif, M. N., and V. Sundararayan. “Assessment of TechnologicalAppropriateness: The Case of Indonesian Rural Development.”Technological Fore casting and Social Change 25 (1984): 225–237.
Siddique, S., and L. Suryadinata. “Bumiputra and Pribumi: EconomicNationalism (indiginism) in Malaysia and Indonesia.” Pacific Affairs54 (1981): 662–687.
Skinner, G. William. “Change and Persistence in Chinese CultureOverseas: A Comparison of Thailand and Java.” In Southeast Asia:The Politics of National Integration, edited by John T. McAlister, Jr.,pp. 339–415. New York: Random House, 1973.
——. “The Chinese Minority.” In Indonesia, edited by Ruth T. McVey, pp.97–117. New Haven, Ct.: Human Relations Area Files Press, 1963.
——, ed. Local, Ethnic, and National Loyalties in Village Indonesia:A Symposium. Yale University Cultural Report Series, no. 8. NewHaven, Ct.: Yale University Southeast Asia Studies, 1959.
Smith, Roger M., ed. Southeast Asia: Documents of Political Devel-opment and Change. Ithaca: Cornell University Press, 1974.
Sobary, Mohamed. “Participation in Practice.” Kompas (February 4,1981).
Soedjatmoko. “Some Thoughts on Higher Education.” Prisma 2 (No-vember 1978).
Soedjatmoko, Mohammed Ali, G. J. Resink, and G. McT. Kahin. AnIntroduc tion to Indonesian Historiography. Ithaca: Cornell Uni-versity Press, 1965.
Soemarwoto, Otto. “Interrelations among Population, Resources,Environment and Development.” Economic Bulletin for Asia andthe Pacific 32 (June 1981): 1–33.
Bibliography
355

Speare, Alden J. “Rural and Urban Migration: A National Overview.” InAgricultural and Rural Development in Indonesia, edited by Gary E.Hansen, pp. 202–235. Westview Special Studies in Social, Political,and Economic Development. Boulder, Colo.: Westview Press, 1981.
Speed, Frank W. Indonesia Today. Sydney: Angus & Robertson, 1971.
Stoler, Ann. “Class Structure and Female Autonomy in Rural Java.” InWomen and National Development: The Complexities of Change,edited by the Wellesley Editorial Committee, pp. 74–89. Chicago:University of Chicago Press, 1977.
Strout, Alan M. “Pertumbuhan Pertanian, Tenaga Kerja dan PembagianPendapatan: Dilema bagi Repelita III.” Ekonomi dan Keuangan In-donesia 25 (December 1977).
——. “Some Comments on the 1969 Input-Output Table for Indonesia.”Ekonomi dan Keuangan Indonesia 21 (1973): 51–61.
Sudarsono, Juwono. “Political Changes and Developments in In-donesia.” In Trends in Indonesia II, edited by Leo Suryadinata andSharon Siddique, pp. 55–64. Athens, Ohio: Ohio University Press,1981.
Sugijanto, Soegijoko, and Budhy T. Sugijanto. Rural-Urban Migrationin Indone sia. Monograph Series. Jakarta: LEKNAS-LIPI, 1976.
Suharso, Alden Speare, Han R. Redmana, and Imron Husin. Rural-Urban Mi gration in Indonesia. Monograph Series. Jakarta:LEKNAS-LIPI, 1972.
Suharto. Address of State by His Excellency the President of the Re-public of Indonesia, Soeharto, Before the House of the People’sRepresentatives on the Occasion of the 36th Independence Day,August 17th, 1981. Jakarta: Department of Information, 1981.
——. Report to the Nation: Address Before the House of the People’sRepresentatives on the 1975/76 State Budget. Jakarta: Departmentof Information, 1975.
Suhartono, R. B. “Industrial Development in Indonesia.” The In-donesian Quar terly 8 (January 1980): 3–20.
Sujono, Ibnoe. “Kebijaksanaan Koperasi: Beberapa Masalah danProspeknya.” Prisma 6 (July 1977): 3–16.
Bibliography
356

Sumarlin, J. B. Indonesia: Economic Update 1984. Jakarta: NationalDevelopment Economic Office, 1984.
Sundhaussen, Ulf. “Regime Crisis in Indonesia: Facts, Fiction, Predic-tions.” Asian Survey 21 (August 1981): 815–837.
Sundrum, R. M. “Income Distribution, 1970–76.” Bulletin of IndonesianEco nomic Studies 15 (March 1979): 137–141.
——. “Manufacturing Employment 1961–71.” Bulletin of IndonesianEconomic Studies 11 (March 1975): 58–65.
Suparlan, Parsudi, and Harianto Sigit. The Case of Indonesia. Farn-borough, U.K.: Gower, 1980.
Suryadinata, Leo. “Indonesia in 1979: Controlled Dissent.” InSoutheast Asian Affairs 1980, edited by Leo Suryadinata, pp.121–144. Singapore: Institute of Southeast Asian Studies, 1980.
——. “Indonesia in 1980: Continuity Rather than Change.” In SoutheastAsian Affairs 1981, edited by Leo Suryadinata, pp. 129–145. Sin-gapore: Institute of Southeast Asian Studies, 1981.
Suryadinata, Leo, and Sharon Siddique, eds. Trends in Indonesia II.Athens, Ohio: Ohio University Press, 1981.
Sutrisno, Slamet. Sedikit Tentang Strategi Kebudayaan Nasional In-donesia. Yogyakarta: Liberty, 1983.
Suwidjana, Njoman. “Indonesia’s Rice Policy: Development Patterns,Accomplishments, and Problems.” In Southeast Asian Affairs 1981,edited by Leo Suryadinata, pp. 146–157. Singapore: Institute ofSoutheast Asian Studies, 1981.
Syamaprased, Gupta. A Model for Income Distribution, Employmentand Growth: A Case Study of Indonesia. Baltimore: Johns HopkinsUniversity Press, 1977.
Tate, D. J. M. The Making of Modern South-East Asia. Vol. 1, The Eu-ropean Con quest. Kuala Lumpur: Oxford University Press, 1971.
Taylor, Peter J. Quantitative Methods in Geography: An Introduction toSpatial Analy sis. Boston: Houghton Mifflin Co., 1977.
Bibliography
357

Thomas, R. Murray. “Indonesian Education: Communist Strategies(1950–65) and Government Counter Strategies (1966–80).” AsianSurvey 21 (March 1981): 369–392.
Thorne, A. G. “Indonesia: Cultural Pluralism and Education.” Educa-tional Research Quarterly 6 (1981): 75–85.
——. “The Longest Link: Human Evolution in Southeast Asia and theSettlement of Australia.” In Indonesia: Australian Perspectives,edited by James J. Fox, Ross Garnaut, Peter McCawley, and J. A.C. Mackie. Vol. 1, Indonesia: The Making of a Culture, edited byJames J. Fox, pp. 35–43. Canberra: Australian National UniversityResearch School of Pacific Studies, 1980.
Tinker, Irene, and Milledge Walker. “Planning for Regional Devel-opment in Indonesia.” Asian Survey 13 (December 1973):1102–1120.
U.S. House of Representatives. “Famine Relief for East Timor.”Hearings before the Subcommittee on Asian and Pacific Affairs ofthe Committee on Foreign Affairs, House of Representatives, 96thCongress. December 4, 1979, pp. 12–30. Washington, D.C.: Houseof Representatives, 1979.
van der Kroef, Justus M. “Indonesia: Centrifugal Economies.” InForeign Aid Reexamined, edited by James W. Wiggins and HelmutSchoeck, pp. 197–220. Washington, D.C.: Public Affairs Press,1958.
——. “‘Petrus’: Patterns of Prophylactic Murder in Indonesia.” AsianSur vey 25 (July 1985): 745–759.
Van Leeuwan, Robert. “Central Government Subsidies for RegionalDevelopment: Notes.” Bulletin of Indonesian Economic Studies 11(March 1975): 66–75.
Vlekke, Bernhard H. M. Nusantara: A History of Indonesia. The Hague:W. van Hoeve, 1965.
Vreeland, Nena, Peter Just, Kenneth W. Martindale, Philip W. Moeller,and Rinn-Sup Shinn. Area Handbook for Indonesia. 3d ed. ForeignArea Studies Series. Washington, D.C.: U.S. Government PrintingOffice, 1975.
Waldack, Albert C. “Dwi-Fungsi: The Indonesian Army in Civil Affairs.”Mil itary Review 61 (Spring 1981): 13–19.
Bibliography
358

Wallerstein, Immanuel. “Ethnicity and National Integration in WestAfrica.” In Comparative Politics, edited by Harry Eckstein andDavid Apter, pp. 665–670. Glencoe, Ill.: The Free Press, 1963.
Walujo, Imam. “Renewing National Consensus.” Kompas (March 9,1981).
Weatherbee, Donald E. “Indonesia in 1984: Pancasila, Politics, andPower.” Asian Survey 25 (February 1985): 187–197.
Weiner, Myron. “Political Integration and Political Development.” In Po-litical Modernization: A Reader in Comparative Political Change.2d ed., edited by Claude E. Welch, Jr., pp. 180–196. Belmont, Calif.:Wadsworth Publishing Co., 1971.
“West Papua: Asia or Melanesia? An Interview with Rex Rumakiek.”Inside Indonesia 4 (March 1985): 22–26.
Wheatley, Paul. The Golden Khersonese: Studies in the Historical Ge-ography of the Malay Peninsula Before A.D. 1500. Kuala Lumpur:University of Malaya Press, 1966.
White, Benjamin. “Agricultural Involution and Its Critics: Twenty YearsAfter.” Bulletin of Concerned Asian Scholars 15 (1983): 18–31.
——. “Political Aspects of Poverty, Income Distribution, and Their Mea-surement: Some Examples from Rural Java.” Development andChange 10 (January 1979): 91–114.
——. “Population, Involution, and Employment in Rural Java.” InAgricul tural and Rural Development in Indonesia, edited by GaryE. Hansen, pp. 130–146. Westview Special Studies in Social, Po-litical, and Economic Development. Boulder, Colo.: Westview Press,1981.
Wickman, Stephen B. “The Economy.” In Indonesia: A Country Study.4th ed., edited by Frederica M. Bunge, pp. 119–174. AreaHandbook Series. Washington, D.C.: U.S. Government PrintingOffice, 1983.
Widjaja, Albert. “Impact of Multinational Corporations on Social andPolitical Conditions in Indonesia.” Asia Pacific Community 8(1980): 44–57.
——. “Worker Participation in Socio-Economic Development.” Prisma16 (March 1980): 79–90.
Bibliography
359

“Widjojo Nitisastro: Clearing the Jungle.” Euromoney (January 1979):7–10.
Wijarso. “National Energy Planning in Indonesia.” Energy 6 (1981):737–744.
Williams, Glen. “Community Participation and the Role of VoluntaryAgencies in Indonesia.” Prisma 16 (March 1980): 11–31.
Willner, Ann Ruth. “The Neotraditional Accommodation to PoliticalIndependence: The Case of Indonesia.” In Southeast Asia: The Pol-itics of National Integration, edited by John T. McAlister, Jr., pp.517–541. New York: Random House, 1973.
——. “Repetition in Change: Cyclical Movement and IndonesianDevelopment.” Economic Development and Cultural Change 29(1981): 409–417.
Withington, William A. “The Economic Infrastructure.” In SoutheastAsia: Realm of Contrasts, edited by Ashok K. Dutt, pp. 55–70.Dubuque, Iowa: Kendall/Hunt Publishing Co., 1974.
——. “Indonesia: Insular Contrasts of the Java Core with the OuterIslands.” In Southeast Asia: Realm of Contrasts, edited by AshokK. Dutt, pp. 97–111. Dubuque, Iowa: Kendall/Hunt Publishing Co.,1974.
World Bank. “Current Economic Position and Prospects of Indonesia.”Report no. AS-143a. Washington, D.C.: World Bank, October 1,1968.
——. Indonesia: Selected Aspects of Spatial Development. Washington,D.C.: World Bank, 1984. Restricted circulation.
——. World Development Report 1985. New York: Oxford UniversityPress, 1985.
World Bank Country Study. Indonesia: Employment and Income Distri-bution in Indo nesia. Washington, D.C.: World Bank, 1978.
Yasunaka, Akio. “Basic Data on Indonesian Political Leaders.” In-donesia 10 (October 1970): 107–142.
Zainu’ddin, Ailsa G. A Short History of Indonesia. Melbourne: Cassell,1968.
Bibliography
360

About the Author
Christine Drake was educated at Walthamstow Hall andOxford University. She received her doctorate from RutgersUniversity and is currently an associate professor at Old Do-minion University, Norfolk, Virginia. Professor Drake has broadand longstanding experience in the Third World: she has taughtin Khartoum, Sudan and North Sulawesi, Indonesia; and fieldresearch has taken her to Côte d’Ivoire and Tanzania in Africa,to the United Arab Emirates, Oman, and North Yemen in theMiddle East, and to Indonesia. Among her publications are arti-cles on Indonesia, Oman, Third World women, educating forresponsible global citizenship, and coastal land use.

Production Notes
This book was designed by Roger Eggers. Composition andpaging were done on the Quadex Composing System and type-setting on the Compugraphic 8400 by the design and pro-duction staff of University of Hawaii Press.
The text typeface is Baskerville and the display typeface isCaslon Bold.
Offset presswork and binding were done by Vail-Ballou Press,Inc. Text paper is Writers RR Offset, basis 50.