Nat Immunol 2004 - Long-range intrachromosomal interactions in the T helper type 2 cytokine locus.
11
Long-range intrachromosomal interactions in the T helper type 2 cytokine locus Charalampos G Spilianakis 1 & Richard A Flavell 1,2 The T helper type 2 (T H 2) locus control region is important in the regulation of the genes encoding the cytokines interleukins 4, 5 and 13. Using the chromosome conformation capture technique, we found that in T cells, natural killer cells, B cells and fibroblasts, the promoters for the genes encoding T H 2 cytokines are located in close spatial proximity, forming an initial chromatin core configuration. In CD4 + T cells and natural killer cells, but not B cells and fibroblasts, the T H 2 locus control region participates in this configuration. The transcription factors GATA3 and STAT6 are essential for the establishment and/or maintenance of these interactions. Intrachromosomal interactions in the T H 2 cytokine locus may form the basis for the coordinated transcriptional regulation of cytokine-encoding genes by the T H 2 locus control region. Il4, the gene encoding interleukin 4 (IL-4), is in the T helper type 2 (T H 2) cytokine locus, located on mouse chromosome 11. The genomic region of the T H 2 cytokine locus covers more than 120 kilobases (kb) and also includes two other T H 2 cytokine–encoding genes, Il5 and Il13. These three cytokine-encoding genes are coordi- nately expressed in T H 2 cells, but little is known about the molecular mechanisms that underlie this coordinate transcriptional regulation. After transgenic methods were used to introduce different genomic fragments of the T H 2 cytokine locus, a region consisting of 25 kb at the 3¢ end of Rad50 (a constitutively expressed DNA repair gene) was identified that acts as a locus control region (LCR) for the expression of cytokine-encoding genes in this locus 1 . An LCR is a DNA element that supports high-level tissue-specific expression in linked genes regardless of any flanking suppressive sequences 2 . Before the identification of the T H 2 LCR, most studies of Il4 transcriptional regulation concentrated on the identification and function of DNase I–hypersensitive sites in the Il4 locus 3,4 . The identification of specific sites on DNA that are cleaved by very low concentrations of DNase I is usually indicative of the presence of regulatory elements such as promoters, enhancers, LCRs, silencers, insulators or matrix attachment regions 5 . In the IL-4 locus, two such hypersensitive sites, HSS3 (ref. 3) and HS-IV (ref. 4), are present in all T helper cell types. Additional DNase I–hypersensitive sites are present in differentiating and mature T H 2 cells. Conserved region I (CNS-I) 6 , comprising the sites HSS2 and HSS1, is located between Il4 and Il13; HS-I is located at the Il4 promoter; HS-II and HS-III are located in the second Il4 intron; and sites V A and V are located ‘downstream’ of Il4 (ref. 7). Extensive analysis throughout the T H 2 cytokine locus has demonstrated the existence of seven additional hypersensitive sites, four of which (RHS4–RHS7) are located in the T H 2 LCR at the 3¢ of Rad50 (data not shown). The discovery of a LCR in the b-globin locus and the characteriza- tion of other LCRs in various systems, such as the T H 2 cytokine locus, suggest that tissue-specific developmentally regulated gene transcrip- tion relies not only on gene-proximal elements (promoters, enhancers and silencers) but also on long-range interactions of various cis- regulatory elements and complex secondary chromatin configura- tions 8 . Although chromatin rearrangement and its function in transcriptional gene regulation have been extensively studied in detail at the nucleosome level, less is known about higher orders of chromatin organization. Two techniques have been developed to identify long-range chromosomal interactions and to characterize the higher-order folding of chromatin in the regulation of genes encoding b-globin by an LCR 9,10 . The looping of large chromosomal regions that do not participate in active transcriptional networks can explain how gene-regulatory elements like LCRs, despite being at a great distance from their target, can nonetheless confer regulatory effects on the target genes 11 . The looping out of large intervening sequences between two regulatory elements has been suggested 12 . The looping model proposes that parts of an LCR act together as a ‘holocomplex’ to interact directly with individual genes. This type of interaction is influenced by the distance between the LCR and its target genes and the availability of specific transcription factors, which affect the interaction of the LCR with more distant genes 13 . The b-globin LCR activates only one gene at a time 14 . Using the chromosome conformation capture technique 10 , we show here that the T H 2 cytokine gene loci form an initial core complex, after which the T H 2 LCR can confer its activatory effects. In the activation of these genes spanning a genomic distance of more than 120 kb, at least two levels of regulation occur. A cell-specific conformational change elicits interaction of the individual cytokine-encoding gene loci with the T H 2 LCR in cell types of the T cell lineage, regardless of expression of genes Published online 19 September 2004; doi:10.1038/ni1115 1 Section of Immunobiology, Yale University School of Medicine and 2 The Howard Hughes Medical Institute, New Haven, Connecticut 06520, USA. Correspondence should be addressed to R.A.F. (richard.fl[email protected]). NATURE IMMUNOLOGY VOLUME 5 NUMBER 10 OCTOBER 2004 1017 ARTICLES © 2004 Nature Publishing Group http://www.nature.com/natureimmunology
-
Upload
independent -
Category
Documents
-
view
0 -
download
0
Transcript of Nat Immunol 2004 - Long-range intrachromosomal interactions in the T helper type 2 cytokine locus.

Long-range intrachromosomal interactions in theT helper type 2 cytokine locus
Charalampos G Spilianakis1 & Richard A Flavell1,2
The T helper type 2 (TH2) locus control region is important in the regulation of the genes encoding the cytokines interleukins 4,
5 and 13. Using the chromosome conformation capture technique, we found that in T cells, natural killer cells, B cells and
fibroblasts, the promoters for the genes encoding TH2 cytokines are located in close spatial proximity, forming an initial
chromatin core configuration. In CD4+ T cells and natural killer cells, but not B cells and fibroblasts, the TH2 locus control
region participates in this configuration. The transcription factors GATA3 and STAT6 are essential for the establishment
and/or maintenance of these interactions. Intrachromosomal interactions in the TH2 cytokine locus may form the basis for
the coordinated transcriptional regulation of cytokine-encoding genes by the TH2 locus control region.
Il4, the gene encoding interleukin 4 (IL-4), is in the T helper type 2(TH2) cytokine locus, located on mouse chromosome 11. Thegenomic region of the TH2 cytokine locus covers more than 120kilobases (kb) and also includes two other TH2 cytokine–encodinggenes, Il5 and Il13. These three cytokine-encoding genes are coordi-nately expressed in TH2 cells, but little is known about the molecularmechanisms that underlie this coordinate transcriptional regulation.After transgenic methods were used to introduce different genomicfragments of the TH2 cytokine locus, a region consisting of 25 kb atthe 3¢ end of Rad50 (a constitutively expressed DNA repair gene) wasidentified that acts as a locus control region (LCR) for the expressionof cytokine-encoding genes in this locus1. An LCR is a DNA elementthat supports high-level tissue-specific expression in linked genesregardless of any flanking suppressive sequences2.
Before the identification of the TH2 LCR, most studies of Il4transcriptional regulation concentrated on the identification andfunction of DNase I–hypersensitive sites in the Il4 locus3,4. Theidentification of specific sites on DNA that are cleaved by very lowconcentrations of DNase I is usually indicative of the presence ofregulatory elements such as promoters, enhancers, LCRs, silencers,insulators or matrix attachment regions5. In the IL-4 locus, two suchhypersensitive sites, HSS3 (ref. 3) and HS-IV (ref. 4), are present in allT helper cell types. Additional DNase I–hypersensitive sites are presentin differentiating and mature TH2 cells. Conserved region I (CNS-I)6,comprising the sites HSS2 and HSS1, is located between Il4 and Il13;HS-I is located at the Il4 promoter; HS-II and HS-III are located in thesecond Il4 intron; and sites VA and V are located ‘downstream’ of Il4(ref. 7). Extensive analysis throughout the TH2 cytokine locus hasdemonstrated the existence of seven additional hypersensitive sites,four of which (RHS4–RHS7) are located in the TH2 LCR at the 3¢ ofRad50 (data not shown).
The discovery of a LCR in the b-globin locus and the characteriza-tion of other LCRs in various systems, such as the TH2 cytokine locus,suggest that tissue-specific developmentally regulated gene transcrip-tion relies not only on gene-proximal elements (promoters, enhancersand silencers) but also on long-range interactions of various cis-regulatory elements and complex secondary chromatin configura-tions8. Although chromatin rearrangement and its function intranscriptional gene regulation have been extensively studied in detailat the nucleosome level, less is known about higher orders ofchromatin organization. Two techniques have been developed toidentify long-range chromosomal interactions and to characterizethe higher-order folding of chromatin in the regulation of genesencoding b-globin by an LCR9,10. The looping of large chromosomalregions that do not participate in active transcriptional networks canexplain how gene-regulatory elements like LCRs, despite being at agreat distance from their target, can nonetheless confer regulatoryeffects on the target genes11. The looping out of large interveningsequences between two regulatory elements has been suggested12. Thelooping model proposes that parts of an LCR act together as a‘holocomplex’ to interact directly with individual genes. This type ofinteraction is influenced by the distance between the LCR and itstarget genes and the availability of specific transcription factors, whichaffect the interaction of the LCR with more distant genes13.
The b-globin LCR activates only one gene at a time14. Using thechromosome conformation capture technique10, we show here thatthe TH2 cytokine gene loci form an initial core complex, after whichthe TH2 LCR can confer its activatory effects. In the activation of thesegenes spanning a genomic distance of more than 120 kb, at least twolevels of regulation occur. A cell-specific conformational change elicitsinteraction of the individual cytokine-encoding gene loci with the TH2LCR in cell types of the T cell lineage, regardless of expression of genes
Published online 19 September 2004; doi:10.1038/ni1115
1Section of Immunobiology, Yale University School of Medicine and 2The Howard Hughes Medical Institute, New Haven, Connecticut 06520, USA. Correspondence shouldbe addressed to R.A.F. ([email protected]).
NATURE IMMUNOLOGY VOLUME 5 NUMBER 10 OCTOBER 2004 1017
ART I C L E S©
2004
Nat
ure
Pub
lishi
ng G
roup
ht
tp://
ww
w.n
atur
e.co
m/n
atur
eim
mun
olog
y

Figure 1 Chromosome conformation capture
assay of the TH2 cytokine locus. (a) TH2 cytokine
locus genes spanning a region of 120 kb.
Counting on the TH2 locus starts at �7,287 bp
from the start site of Il5. Downward arrows above
diagram indicate DNase I–hypersensitive sites
characterized here (RHS) and elsewhere (HIS-III,
HS-III, CNS-1, HS-I, HS-II, HS-III, HS-IV, HS-VA
and HS-V). Below, BglII restriction fragments
(A–Q) used in the chromosome conformation
capture analysis assay. The arrows above and
below each fragment indicate primers used for
each. (b) For each fragment of interest, a pair of
primers was designed and used for PCR reactions
in paired combinations (i). The signal of each
reaction was measured to calculate the relative
crosslinking frequency. ii, titration of the initial
quantity of the template used in chromosome
conformation capture assay derived from TH2
cells and analyzed with two different sets of
primers. Top, primers designed for fragments
I and M (RHS7 site and Il4 promoter (Il4P)
fragments); bottom, primers designed for
fragments J and M (Il13 promoter and Il4
promoter fragments). Similar titrations were done
for every template used in the chromosome
conformation capture to determine the initialquantity of the template to be used so the
product would be in the exponential phase of
amplification. iii, titrations for the randomly
ligated control templates, similar to those for
the crosslinked templates; in this example, with
primers for fragments I and M (RHS7 site and
Il4 promoter fragments). (c) Control experiment
with primer pairs for fragments M (Il4 promoter)
and J (Il13 promoter) to detect ligation products
on various templates. Lane 1, DNA marker (M);
lane 2, control template (Ctrl). Lanes 3–9
(– Ligase), no ligation step; no PCR product.
Lanes 10–12, purified mouse genomic DNA
treated with formaldehyde (HCHO) and then
digested with BglII, diluted in a DNA
concentration of 2.8 ng/ml and ligated; no ligation
product formation. Lanes 13–16, nuclei: no
random intermolecular ligation products withoutformaldehyde crosslinking (lane 13); ligation
product formation increases linearly with
formaldehyde concentration (lanes 14–16). All
subsequent chromosome conformation capture
experiments used 2% formaldehyde. (d) PCR
products obtained with primer pairs designed for
fragments I (RHS7 site) and M (Il4 promoter) of
the TH2 cytokine locus with different templates
(top). Primer pair for fragment B of the Gapd
locus combined with any other primer pair
designed for every fragment of the TH2 cytokine
locus results in no product (middle). Gapd
products obtained with primer pairs for fragments
A and B of the Gapd locus, being 559 bp apart,
are used for normalizing signals. Tnaive, naive
T cells. (e) Gapd locus. B, BglII restriction
enzyme sites. Fragments A and B, 559 bp apart,
are analyzed by chromosome conformationcapture assay. Numbered arrows indicate sites of
the primers used for this locus. (f) Equation to calculate the relative crosslinking frequency between two fragments of the TH2 locus (XTH2 locus). STH2 locus is
the signal obtained with primer pairs for two different restriction enzyme fragments calculated for different cell types (TH1, TH2, 3T3 and so on) or for the
control template (random ligated DNA). SGapd is the signal obtained with primer pairs for the Gapd locus fragments A and B, calculated for any cell type and
the control template. This calculation gives a relative ligation crosslinking frequency for each cell type used, as it corrects for any differences in PCR
amplification efficiencies, crosslinking and ligation efficiencies, the amounts of the template initially used, as well as the size of the PCR products.
a
b
c
d
e
f
i
ii
iii
1018 VOLUME 5 NUMBER 10 OCTOBER 2004 NATURE IMMUNOLOGY
A R T I C L E S©
2004
Nat
ure
Pub
lishi
ng G
roup
ht
tp://
ww
w.n
atur
e.co
m/n
atur
eim
mun
olog
y

encoding cytokines. In contrast, this change does not occur in B cellsand fibroblasts. Further recruitment of cell type–specific transcriptionfactors enables rapid activation of selective genes because these genesare present in a ‘poised’, preformed chromatin complex. Two TH2-specific transcription factors, STAT6 and GATA3, are responsible forthe formation and/or maintenance of the chromatin conformationchanges in the TH2 cytokine locus. Expression of GATA3 in fibroblasts,which lack the LCR–gene locus interaction, was sufficient to create thisinteraction. Furthermore, the in vivo binding of GATA3 occurs atdiscrete binding sites located in the RHS7 site of the TH2 LCR.
Our data presented here provide a potential explanation in mole-cular terms for the coordinate expression of the TH2 cytokine–encoding genes Il4, Il13 and Il5. The TH2 LCR can thus coactivatethe three cytokine-encoding genes participating in a preformedchromatin configuration without affecting the constitutively expressedRad50, which is looped out of the active chromatin hub.
RESULTS
Chromosome conformation capture analysis
The chromosome conformation capture technique15 enabled us todetect the frequency with which two different gene loci interact in thesteady state in a given nucleus. To detect long-range interactions in theTH2 cytokine locus, we used the same technique modified andadapted for mammalian systems10. In this technique, cells are collectedand proteins are crosslinked to proteins and DNA with formaldehyde.The nuclei are isolated and, after removal of proteins not crosslinkedto DNA, the chromatin is digested by restriction enzymes, followed byligation at a very low DNA concentrations. In such conditions, ligation
of intermolecular crosslinked restriction enzyme fragments is favoredover ligation of random fragments15. After ligation, the protein-DNAcrosslinks are reversed and all possible ligation products are detectedby PCR with primer pairs designed at the 5¢ and 3¢ ends of eachrestriction enzyme site of interest. The crosslinking frequency of tworestriction enzyme fragments, as measured by the quantitation of thePCR signals of a ligation product, is dependent on the relativeproximity of the two fragments to each other captured at any timepoint. Thus, the chromosome conformation capture technique is apowerful tool for the identification of the spatial organization of alocus at a given time point in vivo.
The spatial organization of the TH2 cytokine locus is presented inFigure 1a. A transgenic mouse reporter gene assay was used to identifya 25-kb region at the 3¢ of Rad50 with LCR activity1. Furthercharacterization of this region identified seven new DNase I–hyper-sensitive sites, RHS1–RHS7, in the LCR (data not shown). Wecompiled all known DNase I–hypersensitive sites in the TH2 cytokinelocus into one diagram (Fig. 1a).
We used BglII to generate fragments for further analysis with thechromosome conformation capture assay. The BglII restriction frag-ments used for the analysis encompass either the promoter regions ofthe genes located in the TH2 locus (fragments B, C, J and M; Fig. 1a)or (all of) the DNase I–hypersensitive sites in the locus (fragments D,F, G, I, K, L, N, O and P; Fig. 1a). We used regions with no functionalactivity as controls (fragments A, E and Q; Fig. 1a).
After preparing a template to be used in the chromosome con-formation capture assay, we checked the efficiency of the restrictionenzyme digestion by Southern blot and PCR to ensure that all
a
b c d
e f g
h i j
k
Relative position on TH2 cytokine locus
Rel
ativ
e cr
ossl
inki
ng fr
eque
ncy
Figure 2 Poised chromatin conformation of the
TH2 cytokine gene loci and the TH2 LCR in
T cells and NK cells but not in fibroblasts.
(a) Relative organization of the TH2 cytokine
locus genes with all characterized DNase I–
hypersensitive sites. Gray arrows above indicate
interactions of the Il4 promoter fragment
with other regions in the locus in TH2 cells.(b–j) Relative crosslinking frequencies between
stable fragment M (Il4 promoter fragment) and
the rest of the locus. (b–d) Different templates
have been used for the analysis of naive T cells
(b) and naive CD4+ T mouse primary cells
differentiated for 5 d with plate-bound anti-CD3
and anti-CD28 in TH1 conditions (c) and TH2
conditions (d). (e–j) Analysis of templates from
the AE7 cell line (TH1 phenotype; e), D10 cell
line (TH2 phenotype; f), 3T3 cell line (mouse
fibroblasts; g), primary fibroblasts (h), NK cells (i)
and B cells (j). Horizontal axes, position in the
locus (1–150 kb); vertical axes, relative
crosslinking frequency of fragment M (Il4
promoter fragment) with all the other fragments
of the locus. Gray bars, position of the Il4
promoter (fragment M). For all similar graphs
(Figs. 2–6): the relative crosslinking frequency
with a value of 1 arbitrarily corresponds to therelative crosslinking frequency between the two
neighboring fragments A and B of the Gapd
locus, with fragments analyzed being 559 bp
apart. The scaling on the vertical axes (1–7)
allows direct comparison of all graphs. (b) RT-
PCR showing the relative expression Rad50 in
T cells and fibroblasts. Cell cultures are the same
used for the chromosome conformation capture
analysis. Hprt, control.
NATURE IMMUNOLOGY VOLUME 5 NUMBER 10 OCTOBER 2004 1019
A R T I C L E S©
2004
Nat
ure
Pub
lishi
ng G
roup
ht
tp://
ww
w.n
atur
e.co
m/n
atur
eim
mun
olog
y

restriction enzyme sites were digested effectively to the same extentand without any ‘preference’ (data not shown). For quantitative aswell as qualitative analysis, we ‘titrated’ all templates in PCR reactionsusing different primer pairs and quantified PCR products. We useda quantity of initial template such that the PCR product was in theexponential phase of amplification (Fig. 1b). We used the samequantitative titrations for PCR reactions for the control templatesgenerated from digestion and random ligation of all possible frag-ments generated from a bacterial artificial chromosome clone contain-ing the TH2 cytokine locus (Fig. 1b) and then mixed these fragmentswith digested and ligated genomic DNA. In the control templates, allpossible ligation products were present in equimolar amounts.To analyze the crosslinking efficiency of two specific restrictionfragments, we used primers in paired combinations for PCR(Fig. 1b). For the formaldehyde crosslinking reactions, we usedmany controls to identify the optimal concentration of formaldehyde(Fig. 1c). We also used templates from different cell types and usedvarious primer pairs in the PCR amplifications (Fig. 1d). As a controlin this analysis, we used Gapd, a gene constitutively expressed in all celltypes used without any known secondary chromatin conformation. Inthe Gapd locus, we used two BglII restriction fragments (A and B) thatare near to each other (559 base pairs (bp) apart) in chromosome
conformation capture analyses with primers2, 3, 4 and 5. When we combined primerpairs for any fragment of the TH2 cytokinelocus (located in chromosome 11) with pri-mers for the two BglII restriction fragments(A and B; Fig. 1e) of the Gapd locus (locatedin chromosome 2) no PCR product wasdetected. We measured the crosslinking andligation efficiencies for each cell type used forthe TH2 cytokine locus and the Gapd locus.By normalizing each crosslinking frequencyin the TH2 cytokine locus to the crosslinkingfrequency of Gapd DNA, for a certain celltype, we corrected for differences in thequality and quantity of the template used.Also, by normalizing the crosslinking fre-quency between two different TH2 cytokinelocus fragments to that for the Gapd frag-ments, we corrected for differences in theamount of control templates between experi-ments. We calculated the relative crosslinkingfrequencies between two given fragments(equation, Fig. 1f). We arbitrarily set therelative crosslinking frequency with a valueof 1 for the crosslinking frequency of the twoGapd fragments.
‘Pre-poised’ TH2 chromatin conformations
We prepared crosslinked templates fromsorted naive CD4+ T cells and naive CD4+
T cells differentiated for 5 d in TH1 or TH2conditions, and from two T cell clones,D10.G4.1 (TH2 phenotype) and AE7(TH1 phenotype). We also used non–T celltypes to prepare crosslinked templates (nat-ural killer (NK) cells, B cells, primary fibro-blasts and a mouse fibroblast cell line (3T3))for comparison with the T cells. We com-bined the primer pair for the Il4 promoter
BglII restriction fragment with primer pairs for every other restrictionenzyme fragment in the TH2 cytokine locus and measured relativecrosslinking frequencies.
We tested primary fibroblasts, 3T3 fibroblasts and B cells, none ofwhich expresses the TH2 specific cytokine-encoding genes or is of a Tcell lineage, for relative crosslinking frequencies of the Il4 promoterfragment with all the other fragments of the locus and found that theIl4 promoter comes in close proximity with the Il5 and Il13 promotersbut not with the TH2 LCR (Fig. 2). The crosslinking frequency of zerodid not reflect impaired annealing of primers due to cell linepolymorphisms (for example, fibroblasts), because when we usedsaturated amounts of template we were able to detect all the signals.But in these stringent quantitative experimental conditions, we coulddetect only the specific signals that were described.
In naive T cells, we found that the crosslinking frequency of the Il4promoter with the Il5 and Il13 promoters was twice that of nearbyfragments in the control Gapd locus (Fig. 2b). Thus, even if thecytokine-encoding genes are not actively transcribed in naive T cells,the promoters are in a close proximity at the chromatin level.In contrast, the Il4 promoter did not interact with the promoter ofthe constitutively expressed Rad50. We found the same positiveinteraction of the Il4 promoter with the cytokine gene promoters
a
b c d
e f g
h i
Relative position on TH2 cytokine locus
Rel
ativ
e cr
ossl
inki
ng fr
eque
ncy
.
Figure 3 The RHS7 site of the TH2 LCR interacts with other hypersensitive sites of the locus and the
promoters of the cytokine-encoding genes in T cells but not in fibroblasts. (a) Relative organization of
TH2 cytokine locus; arrows above indicate interactions of the RHS7 site of the TH2 LCR with otherregions in the locus in TH2 cells. (b–i) Relative crosslinking frequencies in templates from primary
cultures of naive T cells (b), TH1 (c), TH2 (d), fibroblasts (g), NK cells (h) and B cells (i), as well
as from cell lines D10 (e) and AE7 (f). Fragment I (RHS7 site) was used as a stable fragment and
was combined with the fragments of the rest of the locus. Data represent standard errors of the
mean values.
1020 VOLUME 5 NUMBER 10 OCTOBER 2004 NATURE IMMUNOLOGY
A R T I C L E S©
2004
Nat
ure
Pub
lishi
ng G
roup
ht
tp://
ww
w.n
atur
e.co
m/n
atur
eim
mun
olog
y
plus the TH2 LCR in TH1 cells, NK cells and TH2 cells (Fig. 2),although the relative crosslinking efficiencies were much higher ineffector cells than in naive T cells (two- to three-fold increase ininteractions of the Il4 promoter with the Il5 and Il13 promoters).Thus, the promoters of the TH2 cytokine–encoding genes interactwith each other in T cells, NK, B cells and fibroblasts.
Additionally, in naive T cells, the Il4 promoter fragment, as judgedfrom the relative crosslinking frequencies, seemed to be in closeproximity to the TH2 LCR and the Il4 3¢ end DNase I–hypersensitivesites, known to have a regulatory function for the expression of Il4(Fig. 2b). Also, the Il4 promoter seemed to interact with the DNaseI–hypersensitive site RHS3 in TH2 cells and NK cells but not in naiveT cells and TH1 cells. The same conclusions drawn for TH1 and TH2cells can be extrapolated from our analysis of the T cell clones AE7(Fig. 2e) and D10 (Fig. 2f). The constitutively expressed Rad50 wasexpressed in all cell types examined, naive T cells, TH1, TH2 cells andfibroblasts, regardless of the interaction of the TH2 LCR with the TH2cytokine promoters (Fig. 2k). The TH2 LCR comes in close proximityto the TH2 cytokine–encoding gene promoters both in TH2 cytokine–expressing and TH2 cytokine–nonexpressing T cell types and NK cellsbut not in fibroblasts and B cells.
The fact that almost the same qualitativeinteractions, albeit to a lesser magnitude,were detected in naive T cells as well as ineffector cells might suggest that such interac-tions were due to the presence of contam-inating effector cells in naive T cell cultures.We excluded this possibility by negativelyselecting CD4+ T cells using antibody-bound magnetic beads and subsequentlysorting the CD4+ T cell population andselecting for CD4+CD44�CD62L+ cells,which are specific markers for CD4+ naiveT cells. We used this pure population of naiveT cells in subsequent analyses to ensure thatthe interactions detected were characteristicof naive T cells and were not due to con-tamination of effector TH1 and TH2 cells(data not shown).
Thus, chromatin in the TH2 cytokine locushas a ‘pre-poised’ conformation in all the celltypes we examined, in which the promotersof the TH2 cytokine–encoding genes (Il4, Il5and Il13) come in close proximity forming aninitial core chromatin structure. In addition,specific interaction between the TH2 LCRwith the TH2 cytokine gene promoters is sus-tained in T cells and NK cells, whether or notthey express the TH2 cytokine–encodinggenes, a configuration that we characterizehere as ‘poised’.
Cell-specific LCR-promoter interactions
The Il4 promoter interacted with the TH2LCR in T cells and NK cells but not in B cellsand fibroblasts. We sought to confirm thesedata by determining the interaction of theDNase I–hypersensitive site RHS7 of the LCR(which showed the strongest interaction withthe Il4 promoter) using all the other restric-tion enzyme fragments of the TH2 locus. We
prepared templates for the chromosome conformation capture assayfrom primary cultures and cell lines and measured the relative cross-linking frequencies of RHS7 with every other fragment in the locus. Innaive CD4+ T cells, TH1 cells and the TH1 clone AE7 cells as well as NKcells, the RHS7 site interacted with the promoters of Il13 and Il4 as wellas with DNase I–hypersensitive sites located in Il13 (HS-III) and theDNase I–hypersensitive sites HS-II, HS-III and HS-IV, near Il4. Indifferentiated TH1 cells and the cloned TH1 AE7 T cell line, the RHS7site also interacted with the DNase I–hypersensitive sites RHS3 andRHS4 in introns of Rad50 (Fig. 3). We obtained similar results byanalysis of TH2 primary cultures and the TH2 clone D10.G4.1 (Fig. 3).Stable interactions were formed between the RHS7 site and differentDNase I–hypersensitive sites of the LCR in addition to DNase I–hypersensitive sites located both within and 3¢ of Il4. In contrast, nosubstantial interaction of RHS7 with any element tested was detected,indicating that the TH2 LCR does not form any secondary chromatinconfiguration in fibroblasts and B cells (Fig. 3g,i).
Therefore, the initial long-range interactions between the cytokinegene promoters in the TH2 locus occurred in CD4+ cells and also inNK, B cells and fibroblasts, a phenomenon that was not cell lineagespecific. These initial interactions were strengthened in CD4+ T cells
a b c
d e f
g h i
j k l
Relative position on TH2 cytokine locus
Rel
ativ
e cr
ossl
inki
ng fr
eque
ncy
.
.
.
.
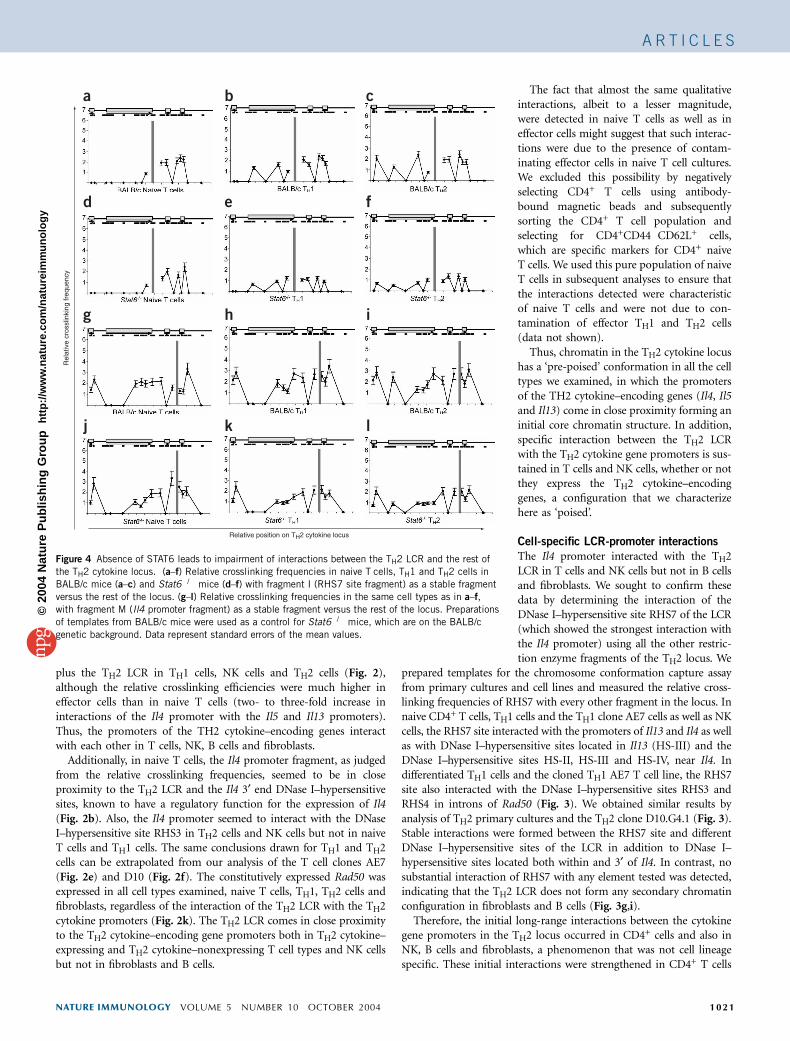
Figure 4 Absence of STAT6 leads to impairment of interactions between the TH2 LCR and the rest of
the TH2 cytokine locus. (a–f) Relative crosslinking frequencies in naive T cells, TH1 and TH2 cells in
BALB/c mice (a–c) and Stat6�/� mice (d–f) with fragment I (RHS7 site fragment) as a stable fragment
versus the rest of the locus. (g–l) Relative crosslinking frequencies in the same cell types as in a–f,
with fragment M (Il4 promoter fragment) as a stable fragment versus the rest of the locus. Preparations
of templates from BALB/c mice were used as a control for Stat6�/� mice, which are on the BALB/c
genetic background. Data represent standard errors of the mean values.
NATURE IMMUNOLOGY VOLUME 5 NUMBER 10 OCTOBER 2004 1021
A R T I C L E S©
2004
Nat
ure
Pub
lishi
ng G
roup
ht
tp://
ww
w.n
atur
e.co
m/n
atur
eim
mun
olog
y

and NK cells by the interaction of the TH2 LCR with this initiallyformed complex, a phenomenon that did not occur in fibroblasts andB cells.
Impaired interactions in the absence of STAT6
Because the TH2 LCR participates in a secondary chromatin con-formation with the promoters of the cytokine gene loci and otherimportant DNase I–hypersensitive sites, we sought to determine thefunction of STAT6 in the establishment of this conformation. For thisanalysis, we prepared templates from Stat6�/� primary cultures ofsorted naive CD4+ T cells and differentiated TH1 and TH2 cells. All theprevious templates presented so far were prepared from C57BL/6mice. Because Stat6�/� mice are on a BALB/c background, we alsoprepared primary cultures from wild-type BALB/c mice. We measuredthe crosslinking frequencies of the RHS7 fragment with all the otherfragments in the TH2 cytokine locus. We found no substantialdifferences for the crosslinking frequencies in naive, TH1 and TH2CD4+ T cells derived from wild-type BALB/c mice (Fig. 4) and thecrosslinking frequencies measured for the same cell types of C57BL/6mice (Fig. 2).
For templates prepared from TH1 and TH2 cells from Stat6�/� mice(Fig. 4e,f, respectively), all the crosslinking frequencies measured forthe RHS7 site and all the other fragments were substantially decreased
(all values being close to or less than 1). Avalue of 1 is characteristic of very closelylocated restriction fragments of the genomeand is considered background for the analy-sis. This phenomenon was most salient ineffector TH1 and TH2 cells, whereas in thenaive T cells the influence was minor.
We analyzed the same cell types to measurethe crosslinking efficiencies of the Il4 promo-ter fragment with the rest of the TH2 locus(Fig. 4g–l). In the Stat6�/� cells, although thecore conformation of the cytokine promoterswas maintained, the interaction of the TH2LCR with the ‘pre-poised’ core configurationwas impaired. Thus, the TH2 cell–specificfactor STAT6 is important for the interactionof the TH2 LCR with the cytokine gene loci inboth TH1 and TH2 cells.
Gene-specific interactions with the
TH2 LCR
To confirm the data obtained for the cross-linking frequencies of the Il4 promoter or theRHS7 site with every other fragment in theTH2 cytokine locus, we measured the cross-linking frequencies of the Il13 promoter frag-ment with the fragments in the rest of thelocus. The crosslinking frequencies of the Il13promoter with other fragments derived fromcells of the T cell lineage indicated that theIl13 promoter interacts with the Il4 promoter,the TH2 LCR and the Il4-proximal DNase I–hypersensitive sites (CNS-1, HS-II, HS-III,HS-IV, HS-VA and HS-V). In templates pre-pared from B cells and fibroblasts, the Il13promoter interacted with the Il4 promoterand the hypersensitive sites around the Il4locus but did not interact with the TH2 LCR.
Thus, the TH2 LCR interacts only with the cytokine promoters inT cells, not in fibroblasts (Fig. 5).
We next measured the crosslinking frequencies of the Il5 promoterfragment to the TH2 cytokine locus. The crosslinking frequencies weresimilar in quality, with minor differences in the strength of interactionamong all T cell types. In naive T cells, TH1 cells, TH2 cells, AE7 cellsand D10.G4.1 cells (Supplementary Fig. 1 online), the Il5 promoterfragment interacted mainly with the Il4 promoter, CNS-1, and HS-VA
and HS-V. In fibroblasts, the Il5 promoter interacted with theIl4 promoter but not with any other cis element (SupplementaryFig. 1 online).Rad50 is a constitutively expressed DNA repair gene with no
known common transcriptional regulation with the cytokine-encod-ing genes in the TH2 locus. We measured the crosslinking frequenciesof the Rad50 promoter with all the other restriction fragments in thelocus (Supplementary Fig. 2 online). In all the cell types for whichwe measured the crosslinking frequencies for Rad50, no interaction ofthe Rad50 promoter with any other region of the TH2 locus wasdetected. The crosslinking frequency measured (a value of 2–3)for fragment D (RHS3) simply reflects the fact that the two fragments(of the Rad50 promoter and RHS3) analyzed were in a very closephysical proximity in a linear configuration (Supplementary Fig. 2online). The conditions for all the PCR for this analysis were extremely
a
b c d
e f g
h
Relative position on TH2 cytokine locus
Rel
ativ
e cr
ossl
inki
ng fr
eque
ncy
Figure 5 The Il13 promoter interacts with the Il4 promoter and several DNase I–hypersensitive sites
on the TH2 cytokine locus. (a) Relative organization of the TH2 cytokine locus; arrows above indicate
interactions of the Il13 promoter fragment with other regions in the locus in TH2 cells. (b–h) Relative
crosslinking frequencies in templates from primary cultures of naive T cells (b), TH1 (c), TH2 (d) and
fibroblasts (h) as well as from cell lines AE7 (e), D10 (f) and 3T3 (g). Fragment J (Il13 promoter
fragment) was used as a stable fragment and was combined with the fragments of the rest of the locus.
Data represent standard errors of the mean values.
1022 VOLUME 5 NUMBER 10 OCTOBER 2004 NATURE IMMUNOLOGY
A R T I C L E S©
2004
Nat
ure
Pub
lishi
ng G
roup
ht
tp://
ww
w.n
atur
e.co
m/n
atur
eim
mun
olog
y

stringent to minimize the background PCR amplification and allowedus to detect only the specific interactions in the locus. Thus, these datasupport in molecular terms the hypothesis that Rad50 is indepen-dently transcriptionally regulated in the TH2 locus (also supportedby Fig. 2b).
To augment further the data presented so far, we next examined thecrosslinking frequencies of the DNase I–hypersensitive sites CNS-1,HS-VA and HS-V (Supplementary Fig. 3 online). We confirmed thatCNS-I, HS-VA and HS-V interact with the promoters of the TH2cytokine–encoding genes in naive T cells and TH2 cells as well as withvarious other DNase I–hypersensitive sites in the locus, but not withthe TH2 LCR. Thus, the TH2 LCR specifically interacts with thepromoters of the TH2 cytokine–encoding genes, conferring its positiveregulatory effects. It does not interact with the Rad50 promoter, where
another regulatory mechanism may be responsible for the constitutiveexpression of this gene.
GATA3 and calcium-induced chromatin reorganization
We hypothesized that expression of GATA3, a highly expressed T celltranscription factor with direct chromatin-remodeling activities,would support the interaction of the TH2 LCR with the ‘pre-poised’chromatin conformation in which the TH2 cytokine–encoding genesparticipate. We used ionomycin to induce the calcineurin-regulatedtranscription factors, including nuclear factor of activated T cells(NFAT) proteins. NFATc1 cooperates with and binds to GATA3 atthe DNase I–hypersensitive site HS-VA at the 3¢ end of Il4 (ref. 7).
We transfected 3T3 fibroblasts with a retrovirus vector consisting ofGATA3, green fluorescent protein (GFP) and an internal ribosomal
Rel
ativ
e cr
ossl
inki
ng fr
eque
ncy
Relative position on TH2 cytokine locus
a b c
d e f
g
h
.
Figure 6 Calcium mobilization in 3T3 fibroblasts
expressing GATA3 gain a secondary chromatin
conformation in the TH2 locus. (a–f) Relative
crosslinking frequencies in templates from 3T3
cells transfected with a retrovirus vector (a) or
a retrovirus vector expressing GATA3 (b) and
treated for 3 h with 1 mM ionomycin (e and f).
Controls, templates from 3T3 cells treated withdimethyl sulfoxide (DMSO; c) or ionomycin (d)
only. Fragment I (RHS7 site) was used as a
stable fragment and was combined with the
fragments of the rest of the locus. Data represent
standard errors of the mean values. (g) Left, RT-
PCR showing the relative expression of mouse
Gata3 in primary naive T cells (lane 1) or naive
CD4+ T cells differentiated for 5 d in TH1
conditions (lane 2) or TH2 conditions (lane 3), or
of mouse Gata3 in 3T3 mouse fibroblasts (lane
4). Right, chromatin immunoprecipitation with
an agarose-conjugated mouse monoclonal anti-
GATA3. Soluble chromatin solution (20 mg) was
immunoprecipitated from TH1, TH2 cells and
3T3 fibroblasts. Here, 10% of the material
immunoprecipitated with anti-GATA3 was used
for PCR and 2% of the total soluble chromatin
solution was used for PCR as input. Primer pairs
were designed for the amplification of a coreregion of the RHS7 DNase I–hypersensitive site
and for the Rad50 promoter. Vector-iono, vector
plus ionomycin; GATA3-iono, GATA3 plus
ionomycin. Bottom right, relative positions of the
two consensus GATA3 binding sites in the RHS7
site and the positions of the primers used for the
PCR reactions. The GATA3 binding sites are in
bold; consensus sites are underlined. Above,
TH2 locus. In gray boxes are the genes present
in the locus; arrows indicate positions of
DNAseI–hypersensitive sites. (h) EMSAs with
oligonucleotides containing two consensus GATA3
binding sites (GATA3.1/2), a GATA3 binding site
at the 3¢ end of the RHS7 site (GATA3.3/4) and
a GATA3 binding site at the 5¢ end of RHS7 site
(GATA3.5/6); 5 mg of nuclear TH2 cell extracts
were used. Competition experiments used excess
nonradiolabeled oligonucleotide (above lanes)as a competitor of either wild-type oligonucleo-
tides or mutated oligonucleotides. NS,
nonspecific band.
NATURE IMMUNOLOGY VOLUME 5 NUMBER 10 OCTOBER 2004 1023
A R T I C L E S©
2004
Nat
ure
Pub
lishi
ng G
roup
ht
tp://
ww
w.n
atur
e.co
m/n
atur
eim
mun
olog
y
entry site and sorted for GFP+ cells. We calculated the crosslinkingefficiencies for the RHS7 site fragment of the TH2 LCR with all theother fragments of the locus. Interaction of the RHS7 site with otherfragments was induced in 3T3 cells by treatment with Gata3 plusionomycin but not in any of the other conditions, including Gata3 orionomycin alone. In this template, the RHS7 fragment of the TH2 LCRwas induced to interact with RHS3, RHS6, the Il13 promoter frag-ment, the Il4 promoter and HS-II and HS-III of Il4 (Fig. 6a–f). Thus,GATA3 is important for sustaining interactions of one DNase I–hypersensitive site (RHS7) of the TH2 LCR with other elements in theTH2 cytokine locus. Although GATA3 participates in sustaining suchinteractions, it did not support the expression of the TH2 cytokine–encoding genes, as no TH2 cytokines were detectable in the super-natants of the 3T3 cell cultures (Supplementary Fig. 4 online).
We next assessed the relative abundance of Gata3 mRNA indifferent cell types. Consistent with previous reports16–19, Gata3 wasrarely expressed in naive T cells and even less so in differentiatedTH1 cells, but had much higher expression in TH2 cells (Fig. 6g,left). The abundance of Gata3 mRNA in fibroblasts was even lowerthan that in all other cell types examined (Fig. 6g left). As GATA3 isresponsible for driving interactions of RHS7 with other regions in theTH2 cytokine locus, we next examined the potential binding ofGATA3 in the genomic region comprising the RHS7 site. The DNAsequence of the RHS7 DNase I–hypersensitive site is highly conservedbetween mouse and human, which contains two consensus GATA3binding sites in the 5¢ and 3¢ segments of this region (Fig. 6g, right).We did chromatin immunoprecipitation assays using an agarose-conjugated mouse monoclonal antibody to GATA3 (anti-GATA3) ontemplates from differentiated TH1 and TH2 cells as well as 3T3fibroblasts. The primers used for the amplification of the immuno-precipitated genomic fragments were located in the RHS7 site flankedby the two consensus GATA3 binding sites. GATA3 bound to thegenomic region covered by the DNase I–hypersensitive site RHS7 ofthe TH2 LCR in TH2 cells, but much less so in TH1 cells (Fig. 6g,right). There was no detectable binding in fibroblasts unless they weretransduced with a retrovirus encoding GATA3 (Fig. 6g). We alsoanalyzed the anti-GATA3 immunoprecipitates by PCR with primers inthe Rad50 promoter region but detected no signals, indicating thatGATA3 did not bind to this chromatin region.
To further support the3 idea that GATA3 is responsible for conferringchromatin reorganization in the TH2 locus, we examined its ability tobind in designated sites within the RHS7 site. Within the RHS7 sitethere were two potential GATA3 binding sites separated by 400 bp ofDNA (Fig. 6g). To identify which site bound GATA3, we did electro-phoretic mobility-shift assays (EMSAs) using nuclear extracts preparedfrom TH2 cells and double-stranded oligonucleotides for the twoGATA3 binding sites (Fig. 6g, lanes 4–6 and 7–9). We also used acommercially available oligonucleotide with two tandemly linked con-sensus GATA3 binding sites not in the context of the TH2 locus (Fig. 6h,lanes 1–3). Using the oligonucleotide for the GATA3 site at the 3¢ end ofRHS7 (GATA3.3/4) and a mouse monoclonal antibody specific forGATA3, we did not detect a complex with altered mobility. The bindingof the protein complex to the designated site was reduced by theaddition of this antibody, indicating the presence of GATA3 in thiscomplex (Fig. 6h, lane 7 versus lane 8). Also, when the GATA3binding site in the oligonucleotide GATA3.G3/4 was mutated, themutated oligonucleotide (mG3/4) could no longer compete for thebinding of GATA3 in the wild-type GATA3.G3/4 oligonucleotide(Fig. 6h, lane 11 versus lanes 12–15). As indicated by the EMSAexperiments, GATA3 bound the site at the 3¢ end of RHS7. Thus,binding of GATA3 in RHS7 site is important for the participation of the
TH2 LCR in forming a secondary chromatin conformation in the TH2cytokine locus.
DISCUSSION
A key idea to emerge from analysis of the differentiation of naive CD4+
T cells into TH1 and TH2 cells has been epigenetic changes in thechromatin of the loci of cytokine-encoding genes such as Ifng, Il4, Il5and Il13. In the nucleosomal structure of chromatin, post-translationalmodifications of histone tails have been well characterized, and hyper-acetylation of histones in the vicinity of promoter regions as well as thebinding of T cell–specific factors have been identified as key mechan-isms regulating expression of the TH2 cytokine–encoding genes20–23.Although description of epigenetic chromatin changes has enhancedthe understanding of T cell differentiation, it does not explain how thecoordinated regulation and expression of the TH2 cytokine–encodinggenes occurs, in terms of a common molecular mechanism.
Although LCRs are characterized mainly as DNA elements withstrong enhancer function for transcription of the genes they regulate,the exact mechanism whereby LCRs act at a distance and in achromatin environment is not clearly understood. At least twodifferent groups using two different experimental approaches havepresented data supporting the idea of a looping model for the actionof the b-globin LCR9,10,24. On the basis of those findings, a loopingmodel for the mode of action of the TH2 LCR and the coordinatedregulation of the TH2 cytokine–encoding genes has been proposed25.
We aimed to elucidate how the TH2 LCR can act over long distancesand coordinately regulate the expression of the TH2 cytokine–encoding genes Il4, Il13 and Il5. We have used the chromosomeconformation capture technique10,15 to identify long-range intrachro-mosomal interactions in the TH2 cytokine locus. We found that thepromoters of the TH2 cytokine–encoding genes come into close spatialproximity and form a ‘pre-poised’ core chromatin configuration incells of the T cell lineage that either express (TH2, D10.4G.10) or donot express (naive T cells, TH1, AE7) these cytokine-encoding genes.This configuration was present in NK cells, B cells and fibroblasts. Theinteractions were stronger in effector cells than in naive T cells,perhaps because of the expression of lineage-specific factors thatstabilize these interactions. In this core complex in cells of the T celland NK cell lineages, the LCR contributes further to this higher-orderchromatin conformation to generate a ‘poised’ conformation. Theexpression of TH2-specific factors may be responsible for directingspecific expression of the TH2 cytokine–encoding genes from thischromatin configuration as the intrachromosomal interactions werealso detected in nonexpressing cells. The poised conformation ofpreassembled protein complexes on nontranscribing gene promotershas been described for several genes for which RNA polymerase II isbound to the promoter but elongation does not occur because ofinsufficient phosphorylation of the C-terminal domain of RNApolymerase II (refs. 26–31). Although a poised conformation oftranscription complexes has been proposed for promoters, no evi-dence so far has supported such a hypothesis for the mode of action ofan LCR. The b-globin LCR acquires such a conformation, interactingwith other DNase I–hypersensitive sites in the locus, in erythroidprogenitors that do not express the b-globin genes24. However thesituation is much different in the TH2 cytokine gene cluster because ofthe regulation of its coordinated expression.
The phenomenon in which a locus is heritably poised for geneexpression even when it is transcriptionally inactive may be a uniquefeature of genes that require rapid transcriptional induction inresponse to a stimulus32. Indeed, the long-range chromatin conforma-tion we detected even in naive T cells that did not express the TH2
1024 VOLUME 5 NUMBER 10 OCTOBER 2004 NATURE IMMUNOLOGY
A R T I C L E S©
2004
Nat
ure
Pub
lishi
ng G
roup
ht
tp://
ww
w.n
atur
e.co
m/n
atur
eim
mun
olog
y

cytokines equips these cell types for rapid production of lineage-specific cytokines after stimulation. Polarized TH1 or TH2 cells,cultured in opposing conditions (TH1 cells cultured in TH2 conditionsor TH2 cells cultured in TH1 conditions), still retain the potential toproduce cytokines of their original phenotype33,34, which is consistentwith our data showing a preformed configuration in the TH2 cytokinelocus in TH1 and TH2 cells. In primary TH1 cells or the TH1 cloneAE7, the RHS5 site of the TH2 LCR does not interact with the Il4promoter fragment. The DNase I–hypersensitive site RHS5 is TH2specific, and thus the protein complexes that bind to this site may notbe expressed in TH1 cells. The same hypothesis could hold for theTH2-specific interaction of the Il13 promoter fragment with RHS4 siteof the LCR. CD4+ naive T cells, TH1 and TH2 cells initially have thepotential to express TH2 cytokines because of their ‘poised’ chromatinconformation, but additional cell-specific factors and post-transla-tional histone modifications of chromatin determine whether a givenevent occurs.
CD4+ naive T cells produce IL-4 in a STAT6-independent way33,with peak mRNA production occurring 2 h after stimulation. Givenour results here, we hypothesize that in naive T cells the chromatinconfiguration, as detected by the chromosome conformation captureassays, may support early expression of the TH2 cytokines, but in alater developmental stage, such as in effector polarized cells, STAT6 isimportant for the maintenance of a higher-order chromatin structure.Additional factors may be needed to sustain memory epigeneticchromatin modifications that are not present in the Stat6�/� T cells.All interactions were shown by chromosome conformation captureanalysis to be impaired in Stat6�/� effector cells, although theinteractions between the cytokine promoters were sustained but notthose with the TH2 LCR. These data emphasize the importance ofSTAT6 for the formation of a secondary chromatin conformation andsuggest that other factors are required to generate the ‘pre-poised’conformation found in earlier developmental stages.
Another downstream effector of STAT6 is GATA3, a factor impor-tant for the expression of the TH2 cytokines and for the formationand/or maintenance of interactions between the TH2 LCR and thepromoters of the genes encoding TH2 cytokines. Increased expressionof GATA3 in CD4+ T cells causes TH2 cytokine gene expression indeveloping TH1 cells, in committed TH1 cells and in the TH1 cloneHDK1 (refs. 17,34,35). Furthermore, ectopic expression of GATA3 inTH1 cells or in a nonlymphoid, non-IL-5-producing cell line activatesthe Il5 promoter19. We also analyzed the relative crosslinking frequen-cies of various fragments in the TH2 cytokine locus in cell types thatexpress GATA3, such as T helper cells and NK cells36,37. GATA3 mightcoordinately affect the expression of all three cytokine-encoding genes,Il4, IL5 and Il13, in the TH2 cytokine locus through effects imposed onan already preformed, ‘pre-poised’ chromatin configuration. Also, asGATA3 has direct chromatin-remodeling activities38, it may assist theinduction of the interaction of the TH2 LCR with the promoters of theTH2 cytokine–encoding genes.
Calcium mobilization leads to the rapid dephosphorylation ofNFAT proteins and their translocation to the nucleus with increasedaffinity for DNA39. There are four members of the NFAT family oftranscription factors, NFATc1–NFATc4, that are regulated by calciumand have important immune cell functions39,40. Protein complexeswith transcriptional activity are composed by NFAT dimers orthrough cooperation of NFAT with transcription factors of theGATA family. NFATc1 and GATA3 bind to enhancer regions at the3¢ end of Il4 in T cells41. In our studies, calcium mobilization inGata3-transfected 3T3 fibroblasts induced activation of NFAT factors;this cooperation of NFAT with GATA3 may induce a higher-order
chromatin conformation in the TH2 cytokine locus. GATA3 bound toa GATA3 consensus binding site in the RHS7 site of the TH2 LCR.Furthermore, chromatin immunoprecipitation experiments con-firmed the binding of GATA3 protein to native chromatin. Also, directbinding of GATA3 to its target sites in a cell line (3T3) in which it isnormally not expressed seemed to confer the regulatory effects of thisfactor in non–T cells. GATA3 binding sites are dispersed along theentire TH2 cytokine locus (data not shown), providing the potentialfor GATA3 binding to exert its regulatory function. Although GATA3confers spatial reorganization of the TH2 cytokine locus, it does nothave the ability, even in cooperation with calcium-induced factors, todrive TH2 cytokine transcription in fibroblasts.
In summary, we have identified two different long-range intrachro-mosomal interactions in the TH2 cytokine gene locus. In fibroblasts, Bcells, NK cells and CD4+ T cells, the promoters of all cytokine-encoding genes interact, forming a ‘pre-poised’, initial core chromatinconfiguration. In cells of the T cell lineage that express or do notexpress the TH2 cytokines, the TH2 LCR interacts with this initial core.A ‘poised’ chromatin conformation is created, and TH2 cell–specifictranscription factors can rapidly exert their activating effects throughpositive transcriptional regulation of the TH2 cytokine–encodinggenes in TH2-polarized cells. STAT6 and GATA3 are two importantfactors that mediate the generation and/or maintenance of thischromatin configuration. Experiments in which specific regulatorygenomic fragments are removed will demonstrate the importance ofeach regulatory domain in the formation of chromatin structures andthe positive regulation of expression. Characterization of the proteincomplexes bound to the TH2 LCR and identification of proteincomplexes with specific remodeling activity acting at a long distancein chromatin rather than at promoter and enhancer elements arealso needed.
METHODSMice and cell cultures. C57BL/6, BALB/c and Stat6�/� mice were all purchased
from Jackson Laboratories. The D10.G4.1 conalbumin-specific TH2 line derived
from the AKR/J mouse was obtained from American Type Culture Collection.
The AE7 cell line (TH1 phenotype) was maintained in Bruff ’s media with 5%
FBS, 2 mM L-glutamate, 30 mg/ml of IL-2 (R&D Systems), 50 U/ml of
penicillin and 50 mg/ml of streptomycin. Every 10 d, 1�105 cells were
stimulated with 5 � 105 irradiated antigen-presenting cells and antigen
(0.5 mg/ml of cyto-1 peptide)42. The 3T3 cells were transfected using the
Lipofectamine-2000 system (Invitrogen) with an empty GFP–internal riboso-
mal entry site retrovirus vector or the same vector expressing mouse Gata3
cDNA (gifts from K. Murphy, Washington University School of Medicine, St.
Louis, Missouri). Cells were collected after 48 h and sorted for GFP expression.
GFP+ cells were used for the chromosome conformation capture assay.
Isolation and differentiation of naive CD4+ T cells. Usually, 10–20 spleens
from 4- to 6-week-old BALB/c or C57BL/6 mice were used to make single-cell
suspensions. Isolation and differentiation of naive CD4+ T cells was done as
described20. Naive CD4+ T cells (1 � 106 cells/ml) were stimulated with plate-
bound mouse anti-CD3 (145-2C11; American Type Culture Collection) and
anti-CD28 (Pharmingen) and were collected 5 d later. The chromosome
conformation capture assays used 1 � 107 cells of each type; 0.2 � 106 cells
were restimulated for 24 h with plate-bound anti-CD3 (2C11, American Type
Culture Collection) and cytokine in supernatants was measured by enzyme-
linked immunosorbent assay. NK cells were negatively selected with anti-CD8
(TIB105; American Type Culture Collection), anti-CD4 (GK1.5; American
Type Culture Collection) and anti–major histocompatibility complex class II
(m5114; American Type Culture Collection) and then were sorted for the
population of NK cells after staining with anti–CD49b/Pan-NKCells (DX5;
Pharmingen) and anti-TCRa3 (H57-597; Pharmingen). B cells were positively
selected with a biotin-conjugated anti–mouse CD45R/B220 (01122D;
Pharmingen) and MACS columns (Miltenyl Biotech) and were sorted
NATURE IMMUNOLOGY VOLUME 5 NUMBER 10 OCTOBER 2004 1025
A R T I C L E S©
2004
Nat
ure
Pub
lishi
ng G
roup
ht
tp://
ww
w.n
atur
e.co
m/n
atur
eim
mun
olog
y

after being stained with anti-CD19 (1D3; Pharmingen) and anti-B220
(RA3-6B2; Pharmingen).
Chromosome conformation capture assay. We used a chromosome confor-
mation capture assay initially developed for yeast cells15, which was modified
and adapted for mammalian cells10. BglII (NEB) was used to generate the
restriction fragments in the TH2 locus. For all control templates, PCR products
were digested with the appropriate restriction enzyme to check for the existence
of the restriction enzyme site on the fragment. The size of all BglII restriction
fragments on the TH2 cytokine locus was, on average, 5 kb. The control
template for the chromosome conformation capture assay, for the TH2 locus,
was prepared with a bacterial artificial chromosome clone spanning the entire
TH2 cytokine locus (clone B182; Genome Systems). The bacterial artificial
chromosome clone (30 mg) was digested with 300 U BglII overnight at 37 1C.
DNA was extracted with phenol and chloroform and was precipitated with
ethanol. DNA fragments were ligated with T4 DNA ligase (NEB) at a DNA
concentration of 300 ng/ml. A bacterial artificial chromosome clone was used to
prepare the control template, and all possible restriction fragments after BglII
digestion were present in equimolar amounts and after ligation at a high DNA
concentration, all possible ligation products were present in the sample. For
preparation of the control template for the Gapd locus, PCR products spanning
the BglII restriction sites of interest were gel-purified and the DNA concentra-
tion was determined. Equimolar amounts of the different PCR products were
mixed and digested with BglII. DNA was precipitated after phenol-chloroform
extraction and was ligated at a high DNA concentration using T4 DNA ligase.
For preparation of the mixed control template for the Gapd and TH2 loci, the
same procedure was used, with digestion and ligation of equimolar amounts of
all BglII restriction fragments from the bacterial artificial chromosome–TH2
clone and the Gapd PCR fragments.
PCR analysis of the ligation products. The linear range of PCR amplification
was determined for the control and crosslinked DNA templates of the Gapd
locus, the TH2 locus and the combined Gapd with TH2 loci. By comparing the
PCR signals of the crosslinked templates versus the PCR signals of the control
templates, we corrected for differences in amplification efficiency between
primer sets and also for differences in signal intensities due to the size of PCR
products (all of the primers were designed to give PCR products of 80–180 bp).
All the primers were designed to have an annealing temperature of 56–58 1C,
and they all yielded a product when used with the control templates. PCR
cycles were as follows: an initial denaturing step for 3 min at 94 1C; 36 cycles of
30 s at 94 1C, 20 s at 56 1C and 15 s at 72 1C; followed by a final step of 2 min at
72 1C. For a 20-ml PCR reaction, 20–60 ng of each crosslinked template was
used with 1� PCR buffer, 2.5 mM MgCl2, 0.25 mM dNTPs, 0.5 pmol of each
primer, 1.5 U Tsg DNA polymerase (Centaur) and 2.5% dimethyl sulfoxide
(Sigma). PCR products were separated by 2% agarose gel electrophoresis and
specific products were quantified with the AlphaInnotech Fluorchem 8800
image analyzer and ScionImage analysis software. The templates were prepared
two to three times in independent experiments and the whole set of PCR
reactions for the analysis of interaction of one restriction fragment with all
other fragments was repeated at least three times, for a maximum of seven
times. Data presented are the average of results for all PCR reactions, with no
substantial differences between experiments. Crosslinking frequencies were
calculated with the equation in Figure 1f. All PCR products with signals that
were considered positive were isolated, gel-extracted (Qiaquick; Qiagen),
cloned in a TA vector (TA cloning Kit; Invitrogen) and sequenced to confirm
the presence of the sequences of two different restriction enzyme fragments
ligated in a BglII site. Primers used are in Supplementary Figure 5 online.
Chromatin immunoprecipitation. TH1 and TH2 primary cells as well as 3T3
cells (1.2 � 107 cells) were used to prepare soluble chromatin solutions as
described26. Chromatin immunoprecipitation used 20 mg soluble chromatin
solution and 20 ml agarose-conjugated mouse monoclonal anti-GATA3 (HG3-
31; sc-268AC; Santa Cruz Biotechnology). The sequences of the primers used
for the PCR analysis of the immunoprecipitated chromatin were as follows:
RHS7.S, 5¢-TCACTCATAGCCGATACCTCA-3¢; RHS7.A, 5¢-AGTGAGGGG-
AATAACACTACC-3¢; Rad50P.S, 5¢-CAGAGCTAGACCCGATCTCA-3¢; and
Rad50P.A, 5¢-CGAGCCAGCAACCGTAAG-3¢.
EMSA. These experiments used 5 mg of TH2 cell nuclear extracts bound on 2 ng
double-stranded DNA oligonucleotide. The binding reactions proceeded for
20 min in a buffer containing 50 mg/ml of poly(dI:dC), 200 mg/ml of BSA,
10 mM HEPES, pH 7.9, 1 mM EDTA, 1 mM dithiothreitol, 1 mM MgCl2,
50 mM NaCl, 10% glycerol and protease inhibitors. The samples were loaded
on a native 5% polyacrylamide gel (0.5� Tris–boric acid–EDTA buffer and 2%
glycerol) and were separated by electrophoresis for 2 h at 200 V. Gels were dried
and exposed to X-ray film. For competition assays, a 100-fold excess of a cold
competitor was included or otherwise as indicated (Fig. 6, lanes 12,13,15). In
supershift experiments, 2 mg of mouse monoclonal anti-GATA3 (HG3-31;
sc-268X; Santa Cruz Biotechnology) was preincubated for 30 min on ice with
the extracts before the addition of the probe.
The sequences of the two strands of the oligonucleotides used were as
follows (consensus GATA3 binding site sequences in bold.): GATA3.1, 5¢-GATCCACTTGATAACAGAAAGTGATAACTCT-3¢; GATA3.2, 5¢-GATCA-
GAGTTATCACTTTCTGTTATCAAGTG-3¢; GATA3.3, 5¢-GATCTGTGGGAG-
GAGATAGGACTCTTAC-3¢; GATA3.4, 5¢-GATCGTAAGAGTCCTATCTCCT-
CCCACA-3¢; GATA3.5, 5¢-GATCCCGGGCAAGTGATAAACAAGTTTG-3¢;GATA3.6, 5¢-GATCCAAACTTGTTTATCACTTGCCCGG-3¢. The sequences of
the two strands of the oligonucleotides with the mutated consensus GATA3
binding sites were as follows (mutated nucleotides in bold): mG1, 5¢-CACTTCTTAACAGAAAGTCTTAACTCT-3¢, and mG2, 5¢-AGAGTTAA-
GACTTTCTGTTAAGAAGTG-3¢. The sequences of the two strands for the
oligonucleotide GATA3. 3/4 with the mutated GATA3 binding site were as
follows (point mutations in bold): mG3/4.sense, 5¢-GATCTGTGGGAGGACT-
TAGGACTCTTAC-3¢, and mG3/4.antisense, 5¢-GATCGTAAGAGTCCTAAGT-
CCTCCCACA-3¢.
RNA preparation and reverse transcription. RNA was prepared with TRIzol
reagent (GibcoBRL) following the manufacturer’s instructions. Reverse tran-
scription used 2 mg of RNA, oligo(dT) primer and SuperScript II RNase H�
Reverse transcriptase (Invitrogen). PCR reactions used 5% of the cDNA
produced. The sequences of the primers used were as follows: Hprt.S, 5¢-GTTGGATACAGGCCAGACTTTGTTG-3¢; Hprt.A, 5¢-GAGGGTAGGCTGGC-
CTATAGGCT-3¢; Rad50.S, 5¢-CCGGATCGAAAAGATGAGCATT-3¢; Rad50.A,
5¢-GGGCCCGCACGTCTGTTTC-3¢; and Gata3.S, 5¢-CAAGGCAACCACGT-
CCCGTCC-3¢; and Gata3.A, 5¢-AGCAGAGGCGGGCGGCATAC-3¢.
Note: Supplementary information is available on the Nature Immunology website.
ACKNOWLEDGMENTSWe thank F. Manzo for assistance with manuscript preparation; C. Hughes fortechnical assistance; P.E. Fields, G.R. Lee, S.T. Kim and L. Jones for discussions;F. Grosveld and W. de Laat for protocols on chromosome conformationcapture technique and for suggestions on improving the manuscript; andWyeth Laboratories for the donation of IL-12. Experiments in this study wereapproved by the Yale University Institutional Animal Care and Use Committee.Supported with a Cancer Research Institute fellowship (C.S.) and HowardHughes Medical Institute (R.A.F.).
COMPETING INTERESTS STATEMENTThe authors declare that they have no competing financial interests.
Received 10 May; accepted 18 August 2004
Published online at http://www.nature.com/natureimmunology/
1. Lee, G.R., Fields, P.E., Griffin, T.J. IV, & Flavell, R.A. Regulation of the TH2 cytokinelocus by a locus control region. Immunity 19, 145–153 (2003).
2. Grosveld, F., van Assendelft, G.B., Greaves, D.R. & Kollias, G. Position-independent,high level expression of the human b-globin gene in transgenic mice. Cell 51, 975–985(1987).
3. Takemoto, N. et al. TH2-specific DNase I-hypersensitive sites in the murine IL-13 andIL-4 intergenic region. Int. Immunol. 10, 1981–1985 (1998).
4. Agarwal, S. & Rao, A. Modulation of chromatin structure regulates cytokine geneexpression during T cell differentiation. Immunity 9, 765–775 (1998).
5. Carey, M. & Smale, S. Transcriptional regulation in eukaryotes: concepts, strategies,and techniques. (Cold Spring Harbor Laboratory Press, Cold Spring Harbor, New York,2000).
6. Loots, G.G. et al. Identification of a coordinate regulator of interleukins-4,13 and 5 bycross-species sequence comparisons. Science 288, 136–140 (2000).
1026 VOLUME 5 NUMBER 10 OCTOBER 2004 NATURE IMMUNOLOGY
A R T I C L E S©
2004
Nat
ure
Pub
lishi
ng G
roup
ht
tp://
ww
w.n
atur
e.co
m/n
atur
eim
mun
olog
y

7. Agarwal, S., Avni, O. & Rao, A. Cell-type-restricted binding of the transcription factorNFAT to a distal IL-4 enhancer in vivo. Immunity 12, 643–652 (2000).
8. Li, Q., Peterson, K.R., Fang, X. & Stamatoyannopoulos, G. Locus control regions. Blood100, 3077–3086 (2002).
9. Carter, D., Chakalova, L., Osborne, C., Dai, Y.-F. & Fraser, P. Long-range chromatinregulatory interactions in vivo. Nat. Genet. 32, 1–4 (2002).
10. Tolhuis, B., Palstra, R.-J., Splinter, E., Grosveld, F. & de Laat, W. Looping andinteraction between hypersensitive sites in the active b-globin locus. Mol. Cell 10,1453–1465 (2002).
11. Dekker, J. A closer look at long-range chromosomal interactions. Trends Biochem. Sci.28, 277–280 (2003).
12. Choi, O. & Engel, J.D. Developmental regulation of b-globin gene switching. Cell 55,17–26 (1988).
13. Dillon, N., Trimborn, T., Strouboulis, J., Fraser, P. & Grosveld, F. The effect of distanceon long-range chromatin interactions. Mol. Cell 1, 131–139 (1997).
14. Wijgerde, M., Grosveld, F. & Fraser, P. Transcription complex stability and chromatindynamics in vivo. Nature 377, 209–213 (1995).
15. Dekker, J., Rippe, K., Dekker, M. & Kleckner, N. Capturing chromosome conformation.Science 295, 1306–1311 (2002).
16. Zhu, J., Guo, L., Watson, C.J., Hu-Li, J. & Paul, W.E. STAT6 is necessary and sufficientfor IL-4’s role in TH2 differentiation and cell expansion. J. Immunol. 166, 7276–7281(2001).
17. Zheng, W.P. & Flavell, R.A. The transcription factor GATA-3 is necessary and sufficientfor TH2 cytokine gene expression in CD4 T cells. Cell 89, 587–596 (1997).
18. Zhang, D.-H., Cohn, L., Ray, P., Bottomly, K. & Ray, A. Transcription factor GATA-3is differentially expressed in murine TH1 and TH2 cells and controls TH2-specificexpression of the interleukin-5 gene. J. Biol. Chem. 272, 21597–21603 (1997).
19. Gorelik, L., Fields, P.E. & Flavell, R.A. Cutting edge: TGF-b inhibits TH type 2development through inhibition of GATA-3 expression. J. Immunol. 165, 4773–4777 (2000).
20. Fields, P.E., Kim, S.T. & Flavell, R.A. Cutting edge: changes in histone acetylation atthe IL-4 and IFN-g loci accompany TH1/TH2 differentiation. J. Immunol. 169, 647–650 (2002).
21. Avni, O. et al. TH cell differentiation is accompanied by dynamic changes in histoneacetylation of cytokine genes. Nat. Immunol. 3, 643–651 (2002).
22. Messi, M. et al. Memory and flexibility of cytokine gene expression as separableproperties of human TH1 and TH2 lymphocytes. Nat. Immunol. 4, 78–86 (2002).
23. Guo, L. et al. In TH2 cells the IL-4 gene has a series of accessibility states associatedwith distinctive probabilities of IL-4 production. Proc. Natl. Acad. Sci. USA 99,10623–10628 (2002).
24. Palstra, R.-J. et al. The b-globin nuclear compartment in development and erythroiddifferentiation. Nat. Genet. 35, 190–194 (2003).
25. Ansel, K.M., Lee, D.U. & Rao, A. An epigenetic view of helper Tcell differentiation. Nat.Immunol. 4, 616–623 (2003).
26. Spilianakis, C. et al. CIITA regulates transcription onset via Ser5-phosphorylation ofRNA Pol II. EMBO J. 22, 5125–5136 (2003).
27. Boehm, A.K., Saunders, A., Werner, J. & Lis, J.T. Transcription factor and polymeraserecruitment, modification, and movement on dHSP70 in vivo in the minutes followingheat shock. Mol. Cell. Biol. 23, 7628–7637 (2003).
28. Gilmour, D.S. & Lis, J.T. RNA polymerase II interacts with the promoter region of thenoninduced HSP70 gene in Drosophila melanogaster cells. Mol. Cell. Biol. 6, 3984–3989 (1986).
29. Graunke, D.M., Fornace A.J. Jr, & Pieper, R.O. Presetting of chromatin structure andtranscription factor binding poise the human GADD45 gene for rapid transcriptionalup-regulation. Nucleic Acids Res. 27, 3881–3890 (1999).
30. Wang, X.Y., Kolb, A., Cannon, W. & Buck, M. Nucleoprotein complex formation by theenhancer binding protein NifA. Nucleic Acids Res. 25, 3478–3485 (1997).
31. Ljungman, M. & Hanawalt, P.C. Presence of negative torsional tension in the promoterregion of the transcriptionally poised dihydrofolate reductase gene in vivo. NucleicAcids Res. 23, 1782–1789 (1995).
32. Smale, S.T. & Fisher, A.G. Chromatin structure and gene regulation in the immunesystem. Annu. Rev. Immunol. 20, 427–462 (2002).
33. Grogan, J.L. et al. Early transcription and silencing of cytokine genes underliepolarization of T helper cell subsets. Immunity 14, 205–215 (2001).
34. Lee, B.H. et al. GATA-3 induces T helper cell type 2 (TH2) cytokine expression andchromatin remodeling in committed TH1 cells. J. Exp. Med. 192, 105–115 (2000).
35. Ouyang, W. et al. Inhibition of TH1 development mediated by GATA-3 through an IL-4-independent mechanism. Immunity 9, 745–755 (1998).
36. Rosmaraki, E.E. et al. Identification of committed NK cell progenitors in adult murinebone marrow. Eur. J. Immunol. 31, 1900–1909 (2001).
37. Samson, S.I. et al. GATA-3 promotes maturation, IFN-g production, and liver-specifichoming of NK cells. Immunity 19, 701–711 (2003).
38. Takemoto, N., Arai, K. & Miyatake, S. Cutting edge: the differential involvement of theN-finger of GATA-3 in chromatin remodeling and transactivation during TH2 develop-ment. J. Immunol. 169, 4103–4107 (2002).
39. Rao, A., Luo, C. & Hogan, P.G. Transcription factors of the NFAT family: regulation andfunction. Annu. Rev. Immunol. 15, 707–747 (1997).
40. Feske, S., Giltrane, J., Dolmetsch, R., Staudt, L. & Rao, A. Gene regulation mediated bycalcium signals in T lymphocytes. Nat. Immunol. 2, 316–324 (2001).
41. Okamura, H. & Rao, A. Transcriptional regulation in lymphocytes. Curr. Opin. Cell Biol.13, 239–243 (2001).
42. Kovac, Z. & Schwartz, R. The molecular basis of the requirement for antigen processingof pigeon cytochrome c prior to T cell activation. J. Immunol. 134, 3233–3240(1985).
NATURE IMMUNOLOGY VOLUME 5 NUMBER 10 OCTOBER 2004 1027
A R T I C L E S©
2004
Nat
ure
Pub
lishi
ng G
roup
ht
tp://
ww
w.n
atur
e.co
m/n
atur
eim
mun
olog
y