Men’s Physical Strength Moderates Conceptualizations of Prospective Foes in Two Disparate Societies
Journal of Strength and Conditioning Research Publish Ahead of PrintDOI: 10.1519/JSC.0000000000000530
Title
THE TIME INTERVAL MODERATES THE RELATIONSHIP BETWEEN PSYCHING-UP
AND ACTUAL SPRINT PERFORMANCE
Authors
Sarra Hammoudi-Nassib1,2, Moktar Chtara1,2, Sabri Nassib1,2, Walid Briki3, Sabra Hammoudi-
Riahi4, David Tod5, Karim Chamari6.
Affiliations
1Tunisian Research Laboratory Sports Performance Optimization National Center of
Medicine and Science in Sports (CNMSS), Tunis, Tunisia.
2University of Manouba, ISSEP Ksar Saîd, Tunis, Tunisia.
3University of French West Indies and Guyana, Department of Sport Sciences, Laboratory
ACTES (EA 3596), Pointe-à-Pitre, Guadeloupe, France.
4High Institute of Language of Tunisia.
5Department of Sport and Exercise Science, Aberystwyth University, Aberystwyth.
6Aspetar, Research and Education Centre, Aspetar, Qatar Orthopedic and Sports Medicine
Hospital.
Corresponding author
Walid Briki
University of French West Indies and Guyana, Department of Sport Sciences, Laboratory
ACTES (EA 3596), Campus Fouillole, BP 250, 97157, Pointe-à-Pitre, Guadeloupe, France
Tel: +590 690 70 84 74
E-mail: [email protected] / [email protected]
ACCEPTED
Copyright � Lippincott Williams & Wilkins. All rights reserved.
4
Abstract 5
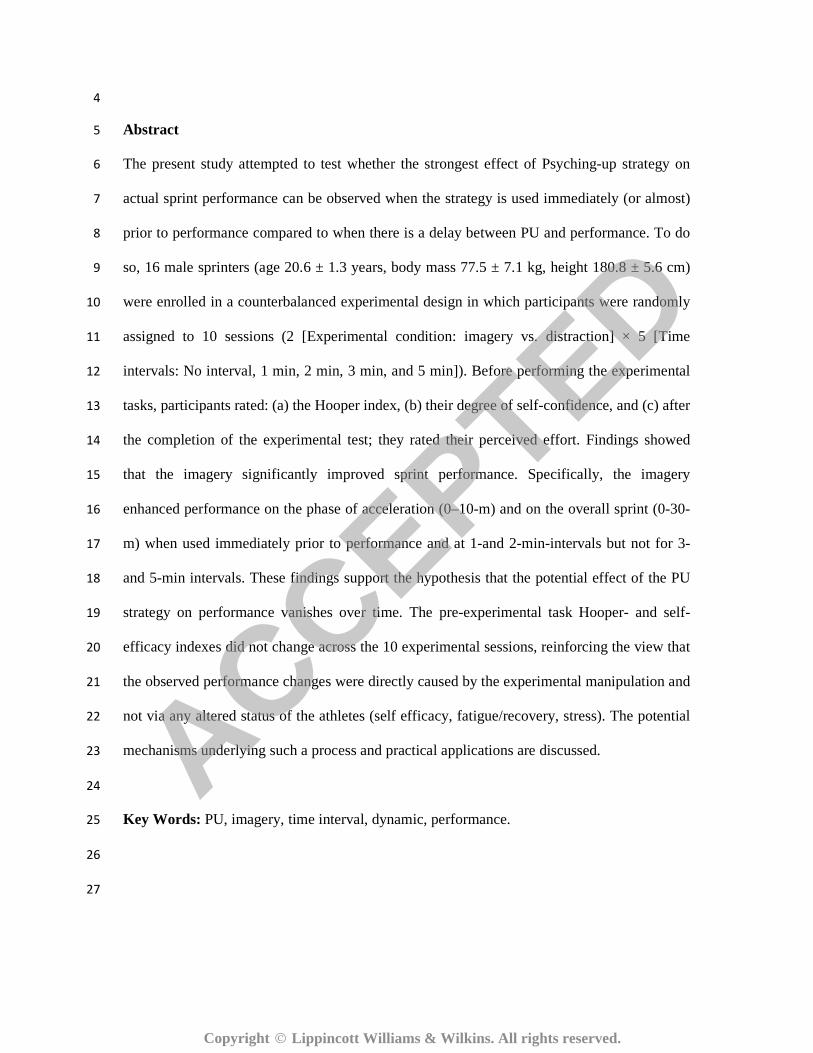
The present study attempted to test whether the strongest effect of Psyching-up strategy on 6
actual sprint performance can be observed when the strategy is used immediately (or almost) 7
prior to performance compared to when there is a delay between PU and performance. To do 8
so, 16 male sprinters (age 20.6 ± 1.3 years, body mass 77.5 ± 7.1 kg, height 180.8 ± 5.6 cm) 9
were enrolled in a counterbalanced experimental design in which participants were randomly 10
assigned to 10 sessions (2 [Experimental condition: imagery vs. distraction] × 5 [Time 11
intervals: No interval, 1 min, 2 min, 3 min, and 5 min]). Before performing the experimental 12
tasks, participants rated: (a) the Hooper index, (b) their degree of self-confidence, and (c) after 13
the completion of the experimental test; they rated their perceived effort. Findings showed 14
that the imagery significantly improved sprint performance. Specifically, the imagery 15
enhanced performance on the phase of acceleration (0–10-m) and on the overall sprint (0-30-16
m) when used immediately prior to performance and at 1-and 2-min-intervals but not for 3-17
and 5-min intervals. These findings support the hypothesis that the potential effect of the PU 18
strategy on performance vanishes over time. The pre-experimental task Hooper- and self-19
efficacy indexes did not change across the 10 experimental sessions, reinforcing the view that 20
the observed performance changes were directly caused by the experimental manipulation and 21
not via any altered status of the athletes (self efficacy, fatigue/recovery, stress). The potential 22
mechanisms underlying such a process and practical applications are discussed. 23
24
Key Words: PU, imagery, time interval, dynamic, performance. 25
26
27
ACCEPTED
Copyright � Lippincott Williams & Wilkins. All rights reserved.
28
INTRODUCTION 29
Athletic performance can be boosted by the use of certain psychological strategies (8, 12, 38, 30
44). Some authors revealed that successful athletes use patterns of thoughts or specific 31
cognitive strategies such as psyching-up (PU). PU has been used as a technical term in 32
scientific literature to describe self-or athlete-directed cognitive strategies used prior to 33
or during motor skill execution design to enhance force production (8, 12, 16, 32, 38, 42-34
44). Reviews of experimental research that meet the definition of PU, and examined its 35
effects on muscular force production, have found that such cognitive strategies enhanced 36
motor skill execution (34, 36). Typical strategies that were subsumed under the label of 37
PU included preparatory arousal, imagery, self-talk, attentional focus, and setting a 38
goal. 39
In fact, changes in psychological states have been postulated as the major reason 40
why psych-up strategies may enhance force production (4, 20). Specifically, increased 41
force production may result from increased arousal, enhanced self-efficacy and focused 42
attention (4, 7, 20). Moreover, Weinberg et al.(1980) (42) suggested that arousal may be 43
the major mediating variable between PU strategies and motor performance. It has been 44
also suggested also that "PU" may act as a cognitive stimuli which increases arousal 45
(42). In the same context, it has been predicted that higher levels of arousal are needed 46
to produce maximum performance on simple strength and endurance tasks (27, 30) 47
.Additionally, in the study conducted by Brody et al.(7), participants perceived that they 48
had higher levels of arousal and attention when they psyched-up. 49
From a neurophysiological perspective, Brody et al.(7) Suggested that PU might 50
lead to changes in motor unit recruitment within the muscle. Specifically, it was 51
hypothesized that there could be an increase in motor unit activation in the agonists and 52
ACCEPTED
Copyright � Lippincott Williams & Wilkins. All rights reserved.
a decrease in motor unit activation in the antagonist’ muscle. In that regard, it is of 53
interest to remember that the force produced during a voluntary contraction of skeletal 54
muscle is determined by a series of factors beginning with input from the higher motor 55
centers and terminating with the energy-dependent interaction of actin and myosin (21). 56
These factors may be classified as central, peripheral, and influences (21). 57
Central components include motor unit recruitment, synchronization and firing rate 58
(13, 15). The increase in force production resulting from PU may be determined by 59
changes in the factors mentioned above. 60
Researches revealed that these strategies increased force produced during the tasks 61
such as bench press, hand grip, weight-lifting, leg extension (4, 11, 32, 35, 38, 42, 44), 62
muscular endurance (8), power (31), and sprint (8, 10-11, 16, 19)0]. The common belief 63
among many athletes is that the use of these strategies will enable them to lift heavier 64
loads (34). In that regard, Tod et al. (2003) (34) estimated that PU leads to a 12% 65
increase in strength compared with control conditions. 66
Many athletes in strength-based sports, such as powerlifting and weightlifting, 67
‘‘psych-up’’ immediately prior to performance, both in training and competition. 68
Previous researches with trained individuals (32, 38), including a recent study which has 69
measured the force produced during the bench press exercise, found that PU resulted in 70
greater peak force than cognitive distraction and an ‘’attention-placebo condition’’ in 71
participants with a minimum of one year of weight training experience (35). 72
However, it is quite surprising in this context, that the mental preparation-force 73
production relationship has received limited empirical attention given the value that 74
athletes place on their mental preparation immediately prior to competition. In fact, the 75
majority of the research studies have examined the effectiveness of PU strategies using 76
different interval rests between the end of the PU and the start of the task. Some 77
ACCEPTED
Copyright � Lippincott Williams & Wilkins. All rights reserved.
researchers have asked participants to use the PU strategy immediately before performance in 78
tasks such as sprinting (19), hand-grip test (12), strength performance (7, 16, 29, 33, 35), and 79
muscular endurance (24). Although the majority of the researches (8, 12, 16, 32, 38, 42-44) 80
generally support the hypothesis that PU enhances strength prior performance, the 81
question of whether the time period between PU and performing influences performance 82
outcomes or not has not been examined yet. Another question that was neglected and 83
that should be dealt with is: does the effectiveness of a PU strategy decrease as the time 84
period between its use and performance increases? Therefore, firm conclusions are not 85
possible because various interval rests were used and no explanation, for why the length 86
interval between PU and actual performance may influence force production, has any 87
substantive support. This may be a particularly important area of research because 88
athletes need to produce strength in a short time period (1), and the fact that the rest 89
interval time taken after PU may influence the relationship between effectiveness of PU 90
and force production. Therefore, further research studies are required to determine 91
which interval rest leads to optimized gains in strength performance. 92
Hence, the importance of the present study lies in further understanding the 93
duration's effects of the length interval between PU and actual performance. Evenly, it 94
will help to further understand which intervals of rest period produced a better 95
performance and which ones may be misleading in terms of PU effects. In this respect, we 96
argue that immediacy is a characteristic of the PU strategy, so that its strongest effect on 97
actual performance, such as sprint performance, should be observed when the PU strategy is 98
directly followed by performance. 99
Outside the domain of PU strategies per se, Briki et al. (5) showed that when an 100
experience of momentum was interrupted during a game, the feeling that everything goes 101
smoothly was lowered. This suggests that a psychological impulse can dispel over time if not 102
ACCEPTED
Copyright � Lippincott Williams & Wilkins. All rights reserved.
sustained, therefore its potential impact on the actual performance could also decrease over 103
time. In this context, we hypothesized that the strongest effect of a PU strategy on actual 104
performance, such as sprint performance, should be observed when the PU strategy is directly 105
followed by performance. In other words, the higher the time spent between the PU strategy 106
and the task, the lesser its impact on performance should be observed. Specifically, the 107
purpose of the study was to assess the efficacy of PU on sprint performance across a range of 108
time delays between being able to psych-up and sprinting (i.e., 0, 1, 2, 3, 4, 5 min), and it was 109
expected that that PU would be associated with enhanced sprint performance only in the 110
short-term delay conditions. 111
Experimental Approach to the Problem 112
Based on the view that psychological impulses vanish over time (6), it was expected 113
that the strongest effect of the PU strategy on actual sprint performance should be observed 114
when the PU strategy is used immediately prior to the actual sprint. In addition, it was 115
expected that the effects of PU strategies on the actual performance decrease over time. 116
Because of imagery strategy, was found to increase physical performance in many studies (8, 117
12, 16, 19, 24, 38, 40, 44), a within- participant design protocol was used to examine the 118
moderating effect of time interval on the relationship between imagery psych-up and sprint 119
performance. 120
METHOD 121
Participants 122
Sixteen male sprinters (age 20.6 ± 1.3 years, body mass 77.5 ± 7.1 kg, height 180.8 ± 123
5.6 cm) were recruited for this study. They had at least 7 years of sprint training experience. 124
They were sports science students pursuing degrees in Exercise Science and Physical 125
Education at the University of Manouba, Tunis (Tunisia). They were randomly assigned to 126
the counterbalanced experimental design, 2 (Experimental condition) × 5 (Time interval). 127
ACCEPTED
Copyright � Lippincott Williams & Wilkins. All rights reserved.
Thus, each participant completed the 10 test sessions of the study by being tested in 10 128
different days. 129
Experimental Design 130
Before starting it, the present experiment received the approval from the Scientific 131
Research Committee and the Ethic Committee of the National Centre of Medicine and 132
Science of Sports of Tunisia. The aim of the study was to test whether the moderating 133
effect of time interval impacts the relationship between PU (imagery) and control 134
condition (distraction) on actual sprint performance. Accordingly, a randomized within-135
participants experimental design was used. So, athletes were instructed to perform imagery or 136
distraction prior sprint according to the different interval rest during every session. To do so, a 137
counterbalanced experimental design was employed: 2 (Experimental conditions: Imagery vs. 138
Control) × 5 (Time intervals: No interval [immediately], 1 min, 2 min, 3 min, and 5 min) to 139
which participants were randomly assigned (see Figure 1). 140
141
Experimental conditions. Two kinds of experimental conditions were used: PU 142
(imagery) condition and control (distraction) condition. In Imagery condition, participants had 143
to imagine that they were performing sprints as best they could, for example in some studies 144
(19), participants were given the following instructions: 145
You have 30 s during which I would like you to visualize yourself performing sprints 146
as best you can. Please, close your eyes and imagine yourself doing sprint as fast as possible. 147
Visualize yourself setting a new personal best on each sprint. 148
In control condition, participants were asked to engage in a mental task that prevented 149
them from PU (19). Specifically, participants were asked to count backwards: 150
You have 30 s during which I would like you to count backward out loud from 151
1,000 in groups of 7; for example, 1,000; 993; 986; 979…. and so on. 152
ACCEPTED
Copyright � Lippincott Williams & Wilkins. All rights reserved.
Time intervals. The time intervals represent the amount of time that separates a PU 153
strategy from the moment of performing the sprint. Five time intervals conditions were 154
included in the protocol: (a) no interval (the participant spent few seconds to get ready on the 155
starting line and immediately sprinting), (b) 1-min-, (c) 2-min-, (d) 3-min-, and (e) 5-min-156
intervals. For all conditions, except for the no-interval condition, participants were asked to 157
gather, drink water if they wished, and freely talk to each other to prevent them from PU. 158
In order to increase the methodological control of the protocol, some precautions had 159
been taken. First the experimental sessions were spaced out by 48 hours to avoid any order 160
effect to avoid participants experiencing fatigue. Second, no participants had ever 161
consciously performed imagery in order to improve performance before engaging in the 162
protocol. This has been checked by individual interview. Third, participants had to wear the 163
same shoes during each session, to abstain from having hard training-sessions on the day 164
before each testing-session, and to maintain a consistent dietary intake on each testing day. 165
Fourth, no information about the purposes of the study was provided to participants until after 166
they fully completed the experiment. 167
Procedure 168
Contact session. Before the experiment per se, participants were invited to a session 169
in which they were informed about: the protocol design which was composed of 10 testing-170
sessions, the necessity to conform to specific constraints and the way their sprint performance 171
was going to be measured (photocell beams). Then, the psychological measures used in the 172
study were presented and explained to them. During this session, neither the imagery- nor the 173
control- conditions were mentioned. After receiving all instructions, participants were assured 174
that both of their performance data and their answers to the psychological items would remain 175
confidential, and that they were able to withdraw from the study at any time without any 176
penalty. All participants gave their consent to participate in the present study by signing a 177
ACCEPTED
Copyright � Lippincott Williams & Wilkins. All rights reserved.
consent form. Afterwards, participants had to warm-up and to perform a maximal intensity 178
30-m control sprint 179
Experimental sessions. Before each experimental session, the Hooper Index was used 180
to monitor the participants’ feeling for quality of sleep of the previous night, the perceived 181
quantity of stress, delayed onset muscle soreness and fatigue (23). During the experimental 182
sessions per se, participants started by completing a specific standardized warming-up, which 183
is characterized by 3 parts (37). First, participants performed a 5 min self-paced jog/run 184
general warm-up followed by 4 minutes of active rest, which consisted of walking on the 185
track. Second, participants completed the dynamic stretching warming-up during 15 min. 186
Third, participants performed incremental intermittent sprints during 5 min. 187
After the warming-up, participants performed two baseline (pre-intervention) test 188
measures of 30-m sprints on an indoor track as base-line measure before the experimental test. 189
After completing the general and specific warm-up and the sprint base-line measures, 190
participants had to rate their degree of self-confidence (explained below). Then, participants 191
received the instructions delivered according to the assigned experimental condition (i.e., 192
Imagery- or control- condition), and they were asked to achieve as best as they could for the 193
post-intervention sprints 30-m. Just after the completion of the sprint test (within 10 sec of the 194
end of the sprint), the RPE scale (14) was used to rate the participants’ perceived effort. As 195
participants were French Speaking, the validated version of the CR-10 Foster RPE Scale was 196
used (17). 197
The same experimenters were present throughout the experimental sessions and did 198
provide consistent encouragements to the participants while they were sprinting, 199
independently of the experimental condition to which the participants were allocated. To 200
account for diurnal variation, participants were assessed at the same time of the day (between 201
9.30 am and 11.00 am). Temperature and relative humidity were 22°C (±1°C) and 43% 202
ACCEPTED
Copyright � Lippincott Williams & Wilkins. All rights reserved.
(±1%), respectively. No medical problem appeared during the study. After the completion of 203
all the Testing Sessions of the whole study, participants were debriefed on the interventions 204
and received feedback regarding their individual performances. 205
Measures 206
Preliminary measures. Two kinds of pre-test measures were used in order to control 207
the psychological status of participants before performing the experimental task: The index of 208
Hooper (23) and self-efficacy index (3). First, participants had to record subjective rating of 209
stress, fatigue, delayed onset muscles soreness (DOMS), and last-night’s sleep on a 7-Likert 210
point ranging from : “very very low” (1) to “very very high” (7), with a midpoint “average” 211
(4) for stress, fatigue, and muscles soreness; and from “very very good” (1) to “very very bad” 212
(7), with a midpoint “average” (4) for last-night’s sleep. Indeed, despite the randomization of 213
the 4 conditions, one of these could have been biased by a different status of ‘’fatigue’’ or 214
‘’stress’’. Thus, the Hooper index was used to monitor the participants’ feeling for quality of 215
sleep of the previous night, and the perceived quantity stress, delayed onset muscle 216
soreness, and fatigue. Second, participants had to rate their degree of self-efficacy on a 9-217
unit interval scale ranging from “cannot do” (0) to “highly certain can do” (100), with a 218
midpoint “moderately certain can do” (50). The present study protocol monitored this 219
psychological status to make sure that the eventual effects on the dependent variable were 220
caused by the intervention itself and not by any status of fatigue or change in the participants’ 221
feeling of self-efficacy. 222
Sprint performance. Straight running sprint was assessed using photocell beams 223
(Brower Timing Systems, Salt Lake City, UT; accuracy of 0.01 seconds) set at 50 cm height 224
at 0, 10, 20, and 30-m from the starting line. The subjects started when they felt ready after 225
having obtained from the experimenter a period of at maximum 5sec to start, whenever they 226
felt free for doing so. Subjects began from a standing-start position 0.5-m behind the first 227
ACCEPTED
Copyright � Lippincott Williams & Wilkins. All rights reserved.
timing gate, thus avoiding triggering the electronic gate prematurely with any move of the 228
lower or upper limbs. The start of the sprint was taken in a consistent order and at the sound 229
of the experimenters. Acceleration was assessed for a distance of 10-m, with the players 230
beginning in a stationary position. Maximal velocity was recorded for the last 20-m of the 30-231
m sprint. Total 30-m performance was also considered. 232
Rating perceived effort (RPE). After the completion of the experimental test, the 233
RPE scale (14) was used to rate the participants’ perceived effort. A rating of 0 corresponded 234
to “no perceived effort” (i.e., rest), while a rating of 10 corresponded to “maximal perceived 235
effort” (i.e., the most stressful exercise ever performed). 236
Statistical Analyses 237
Means ± standard deviations (SD) were used to describe variables. Before using 238
parametric tests, the condition of normal variation was verified using the Kolmogorov-239
Smirnov test. Reliability of the measures (10, 20, and 30-m sprint times) was assessed with a 240
Cronbach model interclass correlation coefficient (ICC) via 1-way ANOVA, with a value of 241
0.7–0.8 being questionable and 0.9 indicating high reliability (39). A 1-way ANOVA with 242
repeated measures was used to examine the difference between scales' scores before each 243
intervention (Fatigue, Sleep, Stress, Muscle Soreness, RPE, and SES). The effect size was 244
calculated for all ANOVAs with the use of a partial eta-squared (9). In addition to the 245
comparison analyses, Cohen’s d, smallest worthwhile change (SWC), and likelihood of 246
clinical meaningfulness were calculated for 10, 20, and 30-m sprint distances (25). The 247
Cohen’s d is calculated from the mean change divided by the SD of the data; thresholds for 248
qualitative descriptors of Cohen’s d were set at, <0.20 as "trivial," 0.20–<0.50 as "small," 249
0.50–<0.80 as "moderate," and ≥0.80 as ‘‘large’’ (9). The smallest change to be considered 250
worthwhile (SWC) was thus calculated from 0.20 of the standard deviation of the data. The 251
threshold of a clinical meaningful effect was set at 75% (25). The quantitative chances of 252
ACCEPTED
Copyright � Lippincott Williams & Wilkins. All rights reserved.
beneficial effects were assessed qualitatively as follows: <1% almost certainly not, 1-<5% 253
very unlikely, 5-<25% unlikely, 25-<75% possible, 75-<95% likely, 95-<99 very likely, and 254
≥99% almost certain. The results are expressed as means ± SD and 95 % confidence 255
intervals. A significance level of p ≤ .05 was selected. 256
RESULTS 257
Measures 258
Concerning the psychological and perception variables (fatigue, sleep, stress, muscle 259
soreness, RPE, and self-efficacy), repeated-measure ANOVA’s results revealed no significant 260
difference between scales' scores before each intervention (p > 0.05). 261
Performance-Related Results 262
The Interclass Correlation Coefficient (ICC), and 95% confidence intervals (95% CIs) 263
values for all baseline measures demonstrated “high reliability” of the measure: for overall 264
sprint (ICC = 0.96, 95% CI 0.93-0.98), acceleration (ICC = 0.90, 95% CI 0.83-0.96), and 265
maximal velocity (ICC = 0.93, 95% CI 0.87-0.97). Furthermore, a repeated-measure ANOVA 266
showed no significant differences between the scores recorded during the pre-session sprints 267
mean baseline measures for all phases of sprint (overall sprint: F(1,15) =1.16; p = 0.34; η2 = 268
.07, acceleration: F(1,15) = 0.56; p = 0.74; η2 = .04, maximal velocity: F(1,15) =1.58; p = 0.13; η2 269
= .09). 270
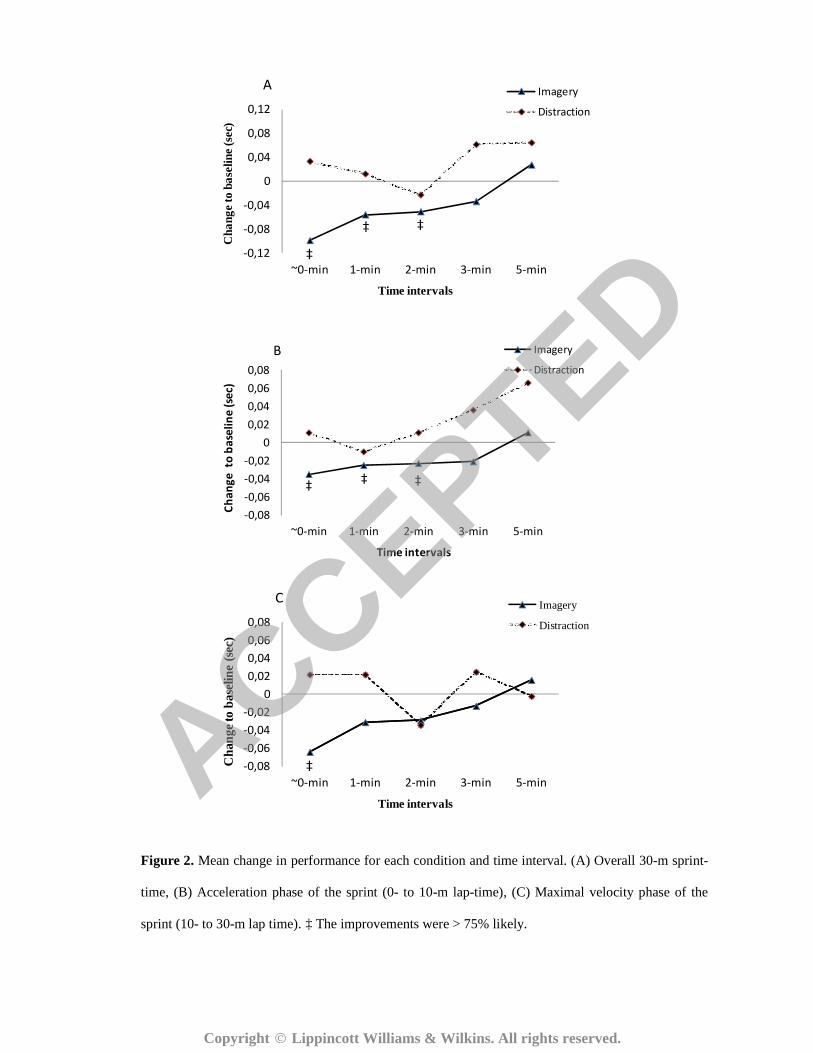
Magnitude-based inferences for each time interval. The imagery condition elicited a 271
substantial likelihood of potentiating overall 30-m sprint time and acceleration, with a 272
substantial amount (i.e., had a > 75% of exceeding a small Cohen’s d (9)). This substantial 273
likelihood is observed immediately, 1-min and 2-min after the use of the PU strategy (Table 274
1-3). For the maximal velocity, imagery also elicited changes that had > 75% likelihood of 275
exceeding the smallest worthwhile change (SWC) which was only observed immediately after 276
the intervention (0 min interval, Table 3). 277
ACCEPTED
Copyright � Lippincott Williams & Wilkins. All rights reserved.
Magnitude-based inferences for each peak of performance. The imagery improved both 278
the peak of performance in the 30-m overall sprint and the acceleration (first 10-m of sprint) 279
as compared to the distraction condition (85.24% and 91.29% likelihood of exceeding the 280
SWC, respectively), (Figure 2). The peak of the maximal velocity (i.e., last 20-m of sprint) 281
was unaffected by the imagery; indeed, the imagery did not elicit a 75% likelihood of 282
exceeding the SWC compared to the distraction condition (Table 4). 283
*** Insert table 4 about here *** 284
*** Insert figure 2 about here *** 285
Individual responses. Table 5 presents the number of participants who ran faster and did 286
succeed in making a better performance at each sprint phase in either the imagery or 287
distraction condition compared with the baseline condition. Across the three performance 288
measures (30 m, 20 m, 10 m), the number of participants who were quicker in imagery 289
condition was lower as the time between PU and performance increased. There was a great 290
consistency between the results of the different phases of sprint, with patterns emerging on the 291
responders and non-responders to the PU protocols. For overall 30-m sprint, most of 292
participants responded positively after the imagery condition versus distraction 293
condition. Such a finding was observed for the time conditions: ‘’immediately’’, 1-min, 2-294
min, and 3-min. The number of participants who performed a better sprint performance 295
after Imagery than after the distraction condition across different time intervals comes as 296
follows (6, 4, 2, 4, for the different time intervals mentioned above, respectively). Whereas, 4 297
participants responded positively after the distraction condition in 5-min interval compared 298
with the imagery condition. Additionally, most of the participants performed better after 299
the imagery condition compared to the distraction condition in all phases of the sprint (in the 300
acceleration phase, maximal velocity as well overall sprint). 301
*** Insert table 5 about here *** 302
ACCEPTED
Copyright � Lippincott Williams & Wilkins. All rights reserved.
DISCUSSION 303
The present study aimed to test whether the interval time duration between a PU 304
strategy and actual sprint performance may reduce the impact of the former on the latter. To 305
do so, the impact of the imagery on the actual sprint performance was examined (19). 306
Globally, the data supported the hypothesis with post-psych-up long durations (3 and 5 min) 307
being too long to maintain the positive effects of imagery on short distance sprint 308
performance. 309
The imagery condition improved the sprint performance (on the acceleration phase [0–310
10-m], on the overall sprint [0-30m], and to a lesser extent the maximal velocity [10-30m]), 311
supporting Hammoudi-Nassib et al. (19) findings. Possibly PU strategies might generate 312
psychological impulses that may produce positive dynamics in affects, cognitions, motivation, 313
physiology, and behaviors (4, 7, 20)]. Potentially, a change in cognitions (e.g., imagining 314
oneself in success), caused by a PU strategy (e.g., imagery), would produce changes in 315
arousal (e.g., related increase of heart rate), cognitions (e.g., anticipation of success, self-316
efficacy), and affects (e.g., eagerness), thereby leading to positive behavioral changes with a 317
related increase in actual performance. 318
Additionally, the present study’s findings showed that the greater the post-psych-up 319
time interval lasted, the lesser the impact of the imagery on performance was. Specifically, the 320
imagery condition impacted the sprint performance (a) immediately, and at 1- and 2-min-321
intervals (b) but not at 3- and 5-min-intervals. Similarly to past researches, this confirms that 322
imagery enhances performance (26, 28), nevertheless, this extends the previous research’ 323
findings by revealing that only imagery which is used immediately or shortly prior to 324
competition improves performance, with any delay of 3-min or more leading to vanished 325
effects. 326
ACCEPTED
Copyright � Lippincott Williams & Wilkins. All rights reserved.
Thus, the present study’s findings suggest that the potential psychological and 327
physiological dynamic, generated by a PU strategy, is fragile (i.e., sensitive to post-task 328
elapsed time), and then its potential effects on performance do actually vanish over time. This 329
is compatible with the general view that the psychological impulses are inherently dependent 330
on situational events and global context (5-6).The Hooper index―monitoring levels of some 331
determinants of performance (e.g., fatigue, stress, etc.)―and self-efficacy performing the 332
experimental task revealed no change across the 10 experimental sessions, reinforcing the 333
view that changes observed in performance were directly caused by the experimental 334
manipulation and not via some altered status of the athletes (motivation, fatigue/recovery, 335
stress). Thus, this supports the assumption that the imagery used immediately prior to 336
competition has the most important impact on performance. Accordingly, the goal of mental 337
Imagery is to increase the athletic experience so well that athletes feel as if they are actually 338
performing their own sport (18, 22). 339
Athletes should therefore avoid performing their psych-up routines too early before 340
their sprinting tasks. 341
The present study represents the first attempt consisting to examining the dynamical 342
properties of PU. It demonstrated that short-distance sprints’ performance (up to 30-m) was 343
positively altered when it was preceded by PU strategy immediately- or no more than 2 min- 344
before it. A limitation of this study is that it did not examine the mechanisms underlying such 345
a process. However, exploring such mechanisms would have generated time intervals (for 346
testing explanatory variables), thus leading to biasing the protocol design and therefore the 347
findings. Because this study showed that 1- and 2-min post-psych-up intervals could alter 348
performance, further studies should focus on finding a way to examine psychological and 349
physiological explanatory mechanisms during such time intervals. 350
351
ACCEPTED
Copyright � Lippincott Williams & Wilkins. All rights reserved.
Practical Application 352
From an applied standpoint, the present study’s findings suggest that the imagery used 353
prior to sprinting enhances sprint for initial acceleration (0–10-m) and overall sprint (0-30m) 354
when it is performed ‘’immediately’’, 1min and 2 min before sprinting but not when the post-355
PU interval is extended to 3 min and 5min for which the PU positive effect vanishes. 356
Correspondingly, the last 20-m of the sprint was improved for the ‘’immediate condition’’ but 357
was unchanged regarding the 1-min, 2-min, 3-min, and 5-min intervals. Therefore, the current 358
findings have important practical implications for athletes because sprint performance is 359
fundamental to success in several sports (2). 360
As a result, elite athletes could use Imagery to improve strength and probably 361
individual athlete’s arousal level by combining Imagery with physical training. The results of 362
this investigation do not only provide evidence demonstrating the importance of mental 363
preparation techniques in strength performance but also show the need for coaches and 364
athletes to manage the use of PU strategies in such a way that they can benefit from the 365
psychological impulse for their performance. They, therefore, have to consider reserving the 366
last moments just before sprinting to a moment dedicated to imagery. More generally, 367
regardless of their age or skill level, athletes should consider integrating the imagery strategy 368
as a systematic routine into their sport practice (16, 41). 369
In conclusion, the present study’s findings suggest that PU was beneficial to 370
performance predominantly requiring speed. 371 ACCEPTED
Copyright � Lippincott Williams & Wilkins. All rights reserved.
References 372
373
1. Abernethy P WG, Logan P. Strength and power assessment: issues, controversies and 374
challenges. Sports Med 19: 401-417, 1995. 375
2. Baker D and Nance S. The relationship between running speed and measures of strength and 376
power in professional rugby league players. J Strength Cond Res 13: 230-235, 1999. 377
3. Bandura AE. Self-efficacy in changing societies. New York: Cambridge University Press, 1995. 378
4. Biddle S. Mental preparation, mental practice and strength tasks: a need for clarification. J 379
Sports Sci 3: 67-74, 1985. 380
5. Briki W. Dynamique du momentum psychologique. Le pouvoir de l’élan [Dynamics of 381
psychological momentum: The power of impetus]. Presses Académiques Francophones, 382
2013. 383
6. Briki W, Doron, J., Markman, K. D., Den Hartigh, R. J. R., & Gernigon, C. Differential reactions 384
of actors and observers to the triggering and interruption of psychological 385
momentum.Motivation and Emotion. in press. 386
7. Brody EB HB, Spalding TW, et al. The effect of a psych-ing strategy on neuromuscular 387
activation and force production in strength-trained men. Res Q Exerc Sport 71: 162-170, 388
2000. 389
8. Caudill D, R W, and Allen J. Psyching-up and Track Athletes: A Preliminary Investigation. 390
Journal of sport psychology 5: 231-235, 1983. 391
9. Cohen J. Statistical power analysis for the behavioural sciences. LE Associates, ed. Hillside, NJ, 392
1988, pp 23-97. 393
10. Cunniffe B, Proctor, W, Baker, JS, and Davies, B. An evaluation of the physiological demands 394
of elite rugby union using global positioning system tracking software. J Strength Cond Res 395
23: 1195-1203, 2009. 396
ACCEPTED
Copyright � Lippincott Williams & Wilkins. All rights reserved.
11. Duthie G, Pyne, DB, Marsh, DJ, and Hooper, SL. Sprint patterns in rugby union players during 397
competition. J Strength Cond Res 20: 208-214, 2006. 398
12. Elko K and Ostrow. AC. The effects of three mental preparation strategies on strength 399
performance of young and older adults. J Sport Behav 15: 34–41, 1992. 400
13. Enoka R. Neuromechanical basis of kinesiology. Champaign (IL):Human Kinetics, 1994. 401
14. Foster C, Daines E, Hector L, Snyder A, and Welsh R. Athletic performance in relation to 402
training load. Wisconsin Medical Journal 95 370-374, 1996. 403
15. Geiger PC, Cody MJ, and Sieck GC. Force-calcium relationship depends on myosin heavy chain 404
and troponin isoforms in rat diaphragm muscle fibers. J ApplPhysiol 87: 1894-1900, 1999. 405
16. Gould D, R W, and Allen J. Mental Preparation Strategies, Cognitions, and Strength 406
Performance. J of sport psychology 2: 329-339, 1980. 407
17. Haddad. M AC, C. Castagna, O. Hue, D.P. Wonge, M. Tabben, D.G. Behm ,K. Chamari. 408
Validity and psychometric evaluation of the French version of RPE scale in young fit males 409
when monitoring training loads. Science & sports 28: 29-35, 2013. 410
18. Hale B. Imagery training: A guide for sports coaches and performers. Leeds, UK National 411
Coaching Foundation, 1998. 412
19. Hammoudi-Nassib S NS, Chtara M, Briki W, Chaouachi A, Tod D, Chamari K. Effects of 413
psyching-up on sprint performance. J Strength Cond Res, 2014. 414
20. Hardy L JG, Gould D. Understanding psychological preparation for sport: theory and practice 415
of elite performers. Chichester: John Wiley & Sons, 1996. 416
21. HJ G. What do tests measure? In: MacDougall JD, Wenger HA, Green HJ, editors. Physiological 417
testing of the high-per-formance athlete. Champaign (IL): Human Kinetics, 1991. 418
22. Holmes PS CD. The PETTLEP approach to motor Imagery: a functional equivalence model for 419
sport psychologists. Journal of Applied Sport Psychology 13: 60-83, 2001 420
ACCEPTED
Copyright � Lippincott Williams & Wilkins. All rights reserved.
23. Hooper S, L. M, L., T. H, A., Gordon RD, and Bachmann AW. Markers for monitoring 421
overtraining and recovery. Medicine and Science in Sports and Exercise 27(1): 106_/112, 422
1995. 423
24. Lee C. Psyching Up for a Muscular EnduranceTask: Effects of Image Contenton Performance 424
and Mood State. Journal of sport psychology 12: 66-73, 1990. 425
25. Liow D and Hopkins W. Velocity specificity of weight training for kayak sprint performance. 426
Med Sci Sports Exerc 35: 1232–1237, 2003. 427
26. Mamassis G, & Doganis, G. Effects of a mental training program on juniors pre-competitive 428
anxiety, self-confidence, and tennis performance. Journal of Applied Sport Psychology 16: 429
118-137, 2004. 430
27. Martens R. Sport competition anxiety test.Champaign, IL: Human Kinetics. 1977. 431
28. Martin K, Moritz, S., & Hall, C. Imagery use in sport: A literature review and applied model. 432
The Sport Psychologist 13: 245-268, 1999. 433
29. McGuigan Michael R JGDT. Maximal strength and cortisol responses to psyching-up during 434
the squat exercise. Journal of sport science 23: 687-692, 2005. 435
30. Oxendine JB. Emotional arousal and motorperformance. Quest Monograph 13: 23-32, 1970. 436
31. R.S. W, Jackson A, and Seaboune T. The effects of specific vs nonspecific mental preparation 437
strategies on strength and endurance performance. J Sport Beh 8: 175 – 180, 1985. 438
32. Shelton TO and Michael JM. The Content and Effect of "Psyching-Up" Strategies in Weight 439
Lifters. Cognitive Therapy and Research 2: 275-284, 1978. 440
33. Theodorakis Y, Weinberg. R, Natsis. P, Douma. I, and Kazakas. P. The effects of motivational 441
versus instructional self-talk on improving motor performance. Sport Psychol 14: 253- 272 442
2000. 443
34. Tod D, Iredale F, and Gill N. Psyching-Up and Muscular Force Production. Sports Med 33: 47-444
58, 2003. 445
ACCEPTED
Copyright � Lippincott Williams & Wilkins. All rights reserved.
35. Tod D, Iredale. KF, Michael R, Mcguigan D, Strange. EO, and Nicholas G. Psyching-up 446
enhances force production During the bench press exercise. J Strength Cond Res 19 599-603, 447
2005. 448
36. Tod D and McGuigan. M. The efficacy of psyching-up on strength performance, in Focus on 449
exercise and health research , T.B. Selkirk. Nova Science: New York, 2006. 450
37. Turki O, Chaouachi A, Behm DG, Chtara H, Chtara M, Bishop D, Chamari K, and Amri M. The 451
effect of warm-ups incorporating different volumes of dynamic stretching on 10- and 20-m 452
sprint performance in highly trained male athletes. J Strength Cond Res 26: 63-72, 2012. 453
38. Tynes LL and Mcfatter. RM. The efficacy of psyching strategies on a weight-lifting task. Cogn 454
Ther Res 11: 327– 336, 1987. 455
39. Vincent W. Statistics in Kinesiology. Champaign, IL: Human Kinetics, 2005. 456
40. Weinberg RS. The relationship between mental preparation strategies and motor 457
performance .A review and critique.Quest. 33: 195-213, 1982. 458
41. Weinberg RS, & Gould, D, ed. Psychologie du sport et de l’activité physique. Paris: Éditions 459
Vigot, 1997. 460
42. Weinberg RS, Daniel G, and Allen J. Effect of Psyching-Up Strategies on Three Motor Tasks 461
Cognition and Motor Performance. Cognitive Therapy and Research 4, 1980. 462
43. Weinberg RS, Jackson A, and Seaboune T. The effects of specific vs nonspecific mental 463
preparation strategies on strength and endurance performance. J Sport Beh 8: 175 – 180, 464
1985. 465
44. Whelan JP, Epkins. CC, and Meyers. AW. Arousal interventions for athletic performance: 466
Influence of mental preparation and competitive experience. Anxiety Res 2: 293–307, 1990. 467
468
469
ACCEPTED
Copyright � Lippincott Williams & Wilkins. All rights reserved.

Table 1. The effect of different conditions and time intervals on 30-m sprint performance.
95% Confidence limits Likelihood of exceeding smallest worthwhile
change (%) Condition Mean
difference Lower Upper
Cohen’s d
Higher Trivial Detrimental
No. of participants whose performances were better than the
control session
Imagery -0.099* -0.040 -0.157 0.61 98.56 1.43 0.01 14 30 m Immediately Distraction 0.033 0.112 -0.046 0.19 4.31 47.62 48.07 4
Imagery -0.056* 0.002 -0.114 0.40 83.91 15.73 0.36 13 30 m 1’ Distraction 0.012 0.048 -0.025 0.08 1.37 83.19 15.44 6
Imagery -0.051* -0.014 -0.088 0.30 83.07 16.92 0.01 12 30 m 2’ Distraction -0.023 0.079 -0.125 0.14 42.19 44.77 13.04 7
Imagery -0.034 0.033 -0.101 0.20 49.54 48.11 2.35 7 30 m 3’ Distraction 0.061 0.112 0.010 0.34 0.05 15.09 84.85 5
Imagery 0.027 0.086 -0.032 0.16 2.08 58.71 39.22 5 30 m 5’ Distraction 0.064 0.126 0.001 0.40 0.26 14.54 85.20 4
* The improvements were > 75% likely
ACCEPTED
Copyright � Lippincott Williams & Wilkins. All rights reserved.
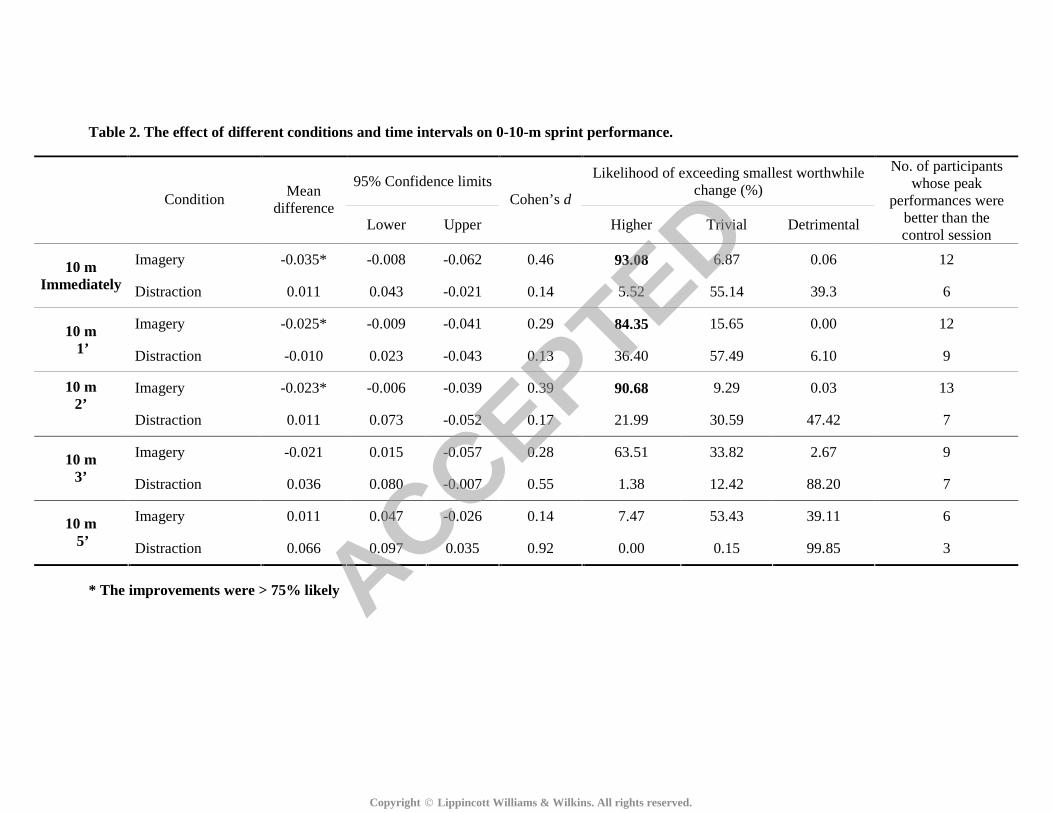
Table 2. The effect of different conditions and time intervals on 0-10-m sprint performance.
95% Confidence limits Likelihood of exceeding smallest worthwhile
change (%) Condition
Mean difference
Lower Upper
Cohen’s d
Higher Trivial Detrimental
No. of participants whose peak
performances were better than the control session
Imagery -0.035* -0.008 -0.062 0.46 93.08 6.87 0.06 12 10 m Immediately Distraction 0.011 0.043 -0.021 0.14 5.52 55.14 39.3 6
Imagery -0.025* -0.009 -0.041 0.29 84.35 15.65 0.00 12 10 m 1’ Distraction -0.010 0.023 -0.043 0.13 36.40 57.49 6.10 9
Imagery -0.023* -0.006 -0.039 0.39 90.68 9.29 0.03 13 10 m 2’ Distraction 0.011 0.073 -0.052 0.17 21.99 30.59 47.42 7
Imagery -0.021 0.015 -0.057 0.28 63.51 33.82 2.67 9 10 m 3’ Distraction 0.036 0.080 -0.007 0.55 1.38 12.42 88.20 7
Imagery 0.011 0.047 -0.026 0.14 7.47 53.43 39.11 6 10 m 5’ Distraction 0.066 0.097 0.035 0.92 0.00 0.15 99.85 3
* The improvements were > 75% likely
ACCEPTED
Copyright � Lippincott Williams & Wilkins. All rights reserved.
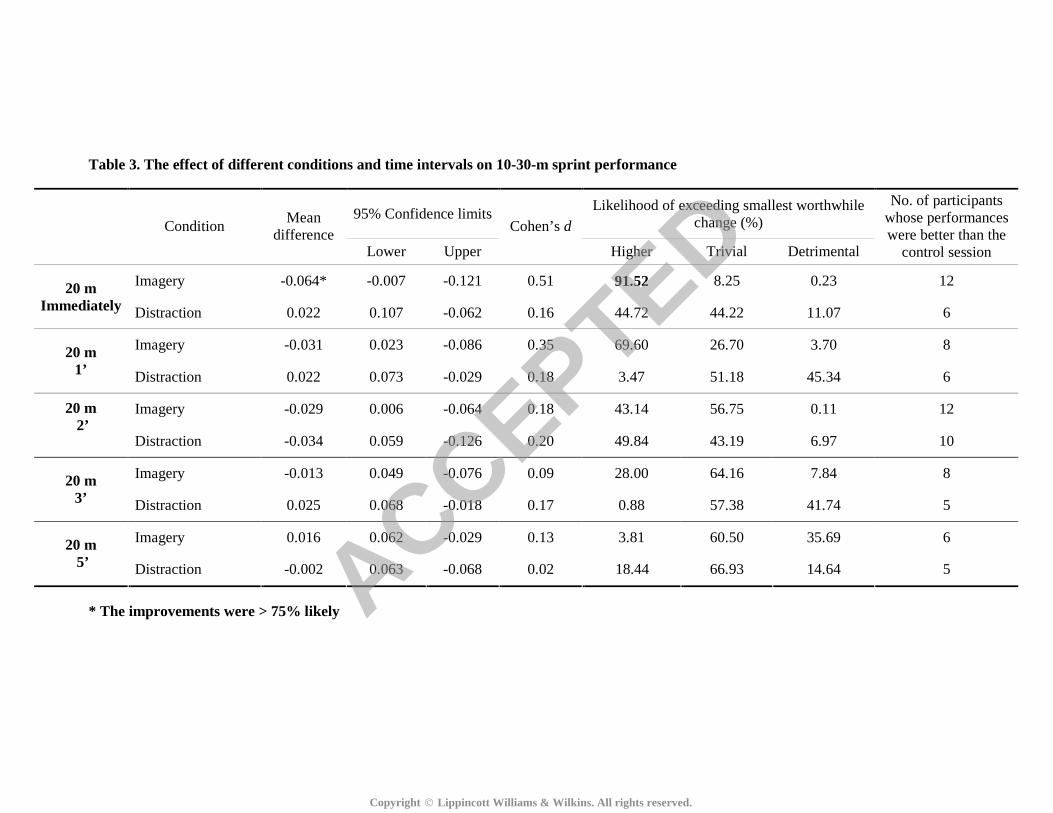
Table 3. The effect of different conditions and time intervals on 10-30-m sprint performance
95% Confidence limits Likelihood of exceeding smallest worthwhile
change (%) Condition Mean
difference Lower Upper
Cohen’s d
Higher Trivial Detrimental
No. of participants whose performances were better than the
control session
Imagery -0.064* -0.007 -0.121 0.51 91.52 8.25 0.23 12 20 m Immediately Distraction 0.022 0.107 -0.062 0.16 44.72 44.22 11.07 6
Imagery -0.031 0.023 -0.086 0.35 69.60 26.70 3.70 8 20 m 1’ Distraction 0.022 0.073 -0.029 0.18 3.47 51.18 45.34 6
Imagery -0.029 0.006 -0.064 0.18 43.14 56.75 0.11 12 20 m 2’ Distraction -0.034 0.059 -0.126 0.20 49.84 43.19 6.97 10
Imagery -0.013 0.049 -0.076 0.09 28.00 64.16 7.84 8 20 m 3’ Distraction 0.025 0.068 -0.018 0.17 0.88 57.38 41.74 5
Imagery 0.016 0.062 -0.029 0.13 3.81 60.50 35.69 6 20 m 5’ Distraction -0.002 0.063 -0.068 0.02 18.44 66.93 14.64 5
* The improvements were > 75% likely
ACCEPTED
Copyright � Lippincott Williams & Wilkins. All rights reserved.
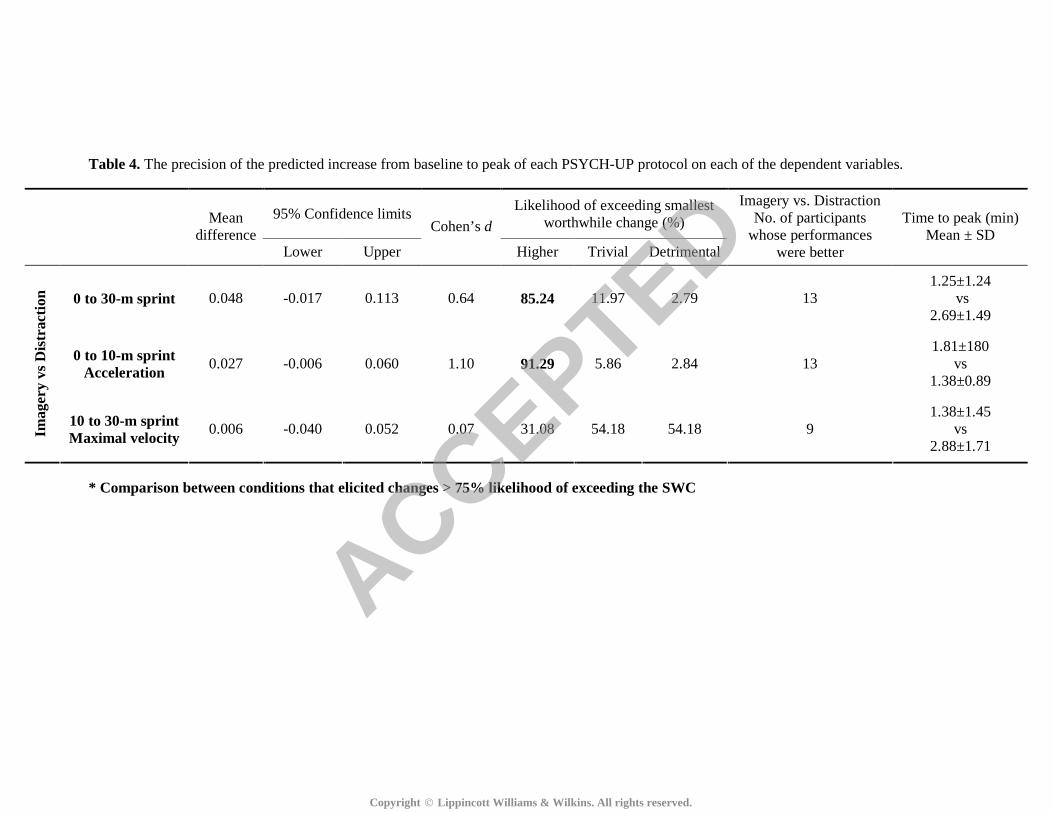
Table 4. The precision of the predicted increase from baseline to peak of each PSYCH-UP protocol on each of the dependent variables.
95% Confidence limits Likelihood of exceeding smallest
worthwhile change (%)
Mean
difference Lower Upper
Cohen’s d
Higher Trivial Detrimental
Imagery vs. Distraction No. of participants
whose performances were better
Time to peak (min) Mean ± SD
0 to 30-m sprint 0.048 -0.017 0.113 0.64 85.24 11.97 2.79 13 1.25±1.24
vs 2.69±1.49
0 to 10-m sprint Acceleration
0.027 -0.006 0.060 1.10 91.29 5.86 2.84 13 1.81±180
vs 1.38±0.89
Imag
ery
vs D
istr
actio
n
10 to 30-m sprint Maximal velocity
0.006 -0.040 0.052 0.07 31.08 54.18 54.18 9 1.38±1.45
vs 2.88±1.71
* Comparison between conditions that elicited changes > 75% likelihood of exceeding the SWC
ACCEPTED
Copyright � Lippincott Williams & Wilkins. All rights reserved.
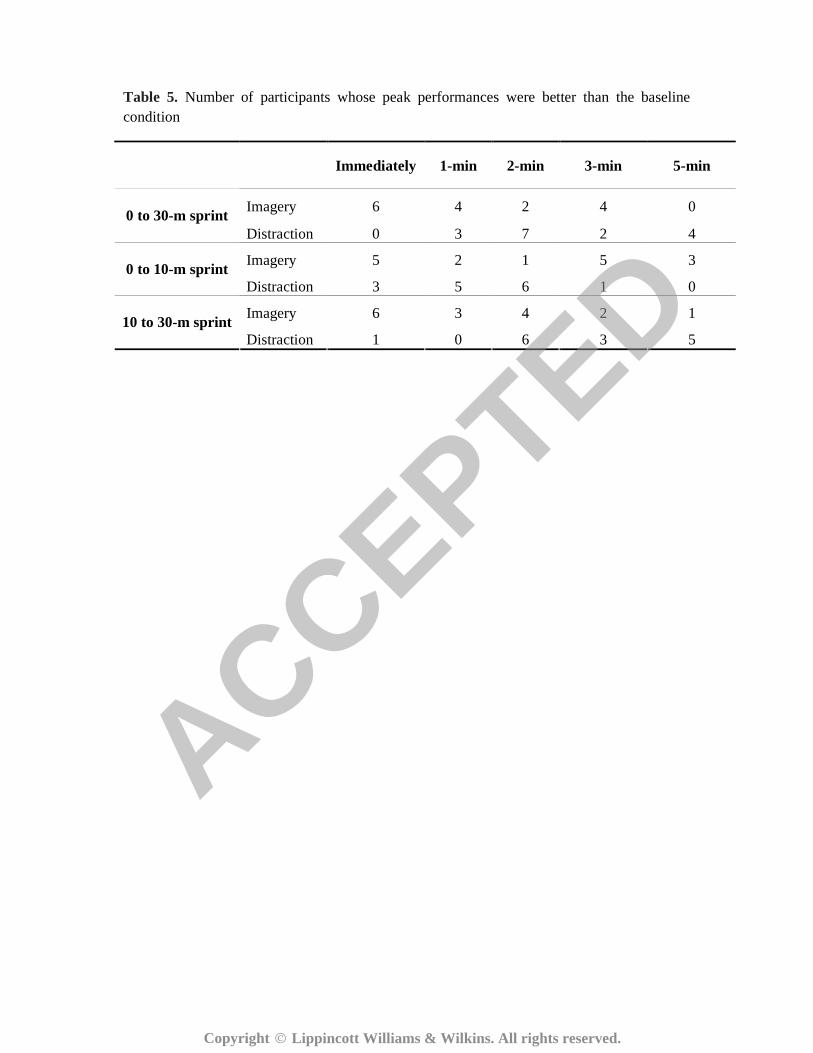
Table 5. Number of participants whose peak performances were better than the baseline condition
Immediately 1-min 2-min 3-min 5-min
Imagery 6 4 2 4 0 0 to 30-m sprint
Distraction 0 3 7 2 4
Imagery 5 2 1 5 3 0 to 10-m sprint
Distraction 3 5 6 1 0
Imagery 6 3 4 2 1 10 to 30-m sprint
Distraction 1 0 6 3 5
ACCEPTED
Copyright � Lippincott Williams & Wilkins. All rights reserved.
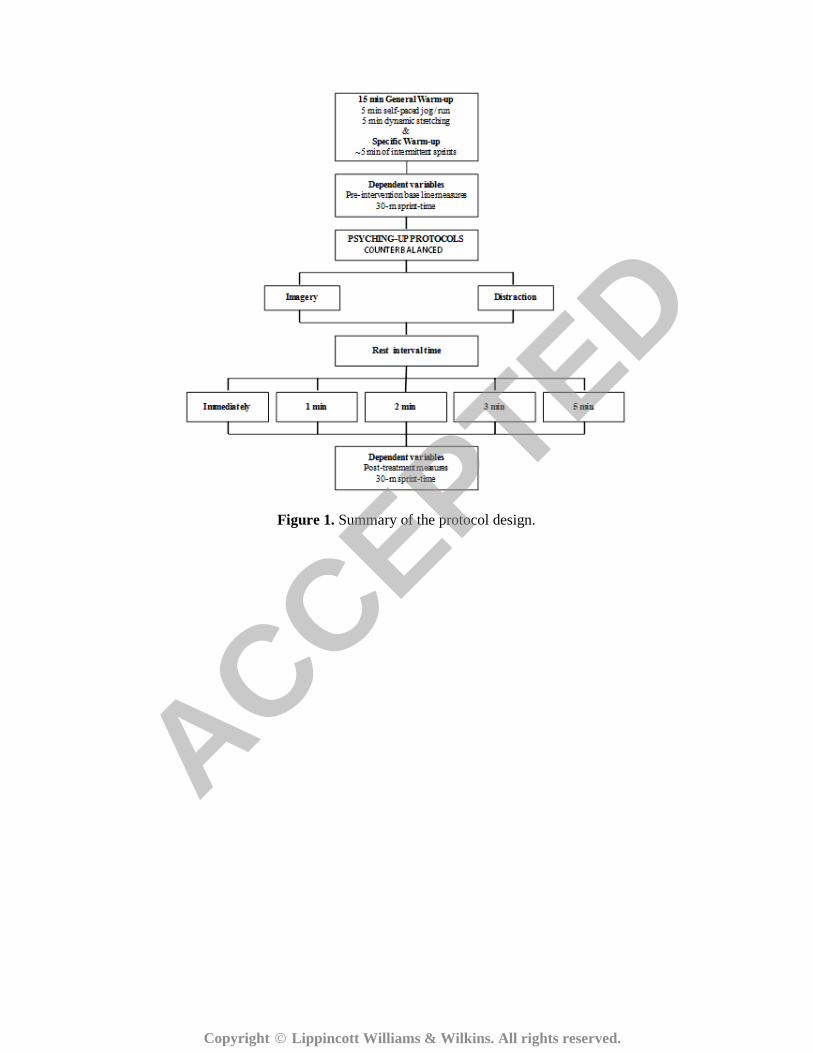
Figure 1. Summary of the protocol design.
ACCEPTED
Copyright � Lippincott Williams & Wilkins. All rights reserved.
‡-0,12
-0,08
-0,04
0
0,04
0,08
0,12
~0-min 1-min 2-min 3-min 5-min
Cha
nge
to b
asel
ine
(sec
)
Time intervals
Imagery
Distraction
A
‡ ‡
-0,08
-0,06
-0,04
-0,02
0
0,02
0,04
0,06
0,08
~0-min 1-min 2-min 3-min 5-min
Ch
an
ge
to
ba
seli
ne
(se
c)
Time intervals
Imagery
Distraction
‡‡ ‡
B
‡
C
-0,08
-0,06
-0,04
-0,02
0
0,02
0,04
0,06
0,08
~0-min 1-min 2-min 3-min 5-min
Cha
nge
to b
asel
ine
(sec
)
Time intervals
Imagery
Distraction
Figure 2. Mean change in performance for each condition and time interval. (A) Overall 30-m sprint-
time, (B) Acceleration phase of the sprint (0- to 10-m lap-time), (C) Maximal velocity phase of the
sprint (10- to 30-m lap time). ‡ The improvements were > 75% likely.
ACCEPTED
Copyright � Lippincott Williams & Wilkins. All rights reserved.
Copyright © 2022 FDOKUMEN