
Narrative Functional Description - Major Projects
393
Quantem (Terminals Pty Ltd) Air Quality Impact Assessment Report 45 Friendship Road, Port Botany NSW 2036 11 February 2021
-
Upload
khangminh22 -
Category
Documents
-
view
0 -
download
0
Transcript of Narrative Functional Description - Major Projects

Quantem (Terminals Pty Ltd)
Air Quality Impact Assessment Report
45 Friendship Road, Port Botany NSW 2036
11 February 2021

Authors:
Primary Author: Mr Tom Abbott, Consultant
Supporting Authors: Mr Nathan Williams, Senior Consultant
Distribution Record:
Recipient Date Issued Number of Copies Revision
Mr Trent Gearside
Project Manager
QUANTEM Bulk Liquid Storage & Handling
11 February 2021 1 (electronic) Rev 03
Peter J Ramsay & Associates Internal Copy

TABLE OF CONTENTS
1. INTRODUCTION ............................................................................................................................... 1
2. METHODOLOGY .............................................................................................................................. 1
3. REGULATIONS AND GUIDELINES ................................................................................................. 4 3.1 Protection of the Environment Operations Act 1997 4 3.2 Approved Methods for the Modelling and Assessment of Air Pollutants 4
3.2.1 Air Quality Impact Assessment 5
4. SITE DESCRIPTION AND OPERATIONS ....................................................................................... 6 4.1 Site Location and Surrounding Land Use 6 4.2 Zoning 6 4.3 Topography 6 4.4 Meteorology 6 4.5 Description of Site Operations 7
4.5.1 Site Emissions Limits 9 4.5.2 Maximum Instantaneous Emissions 10
5. AIR QUALITY IMPACT ASSESSMENT ......................................................................................... 11 5.1 Previous Assessments 11 5.2 Sensitive Receptors 11 5.3 Emissions Inventory 13
5.3.1 Sources of Air Emissions 13 5.3.2 Estimation of Air Emissions 14
5.4 Air Dispersion Modelling 16 5.4.1 Model Selection 16 5.4.2 Modelling Domain 17 5.4.3 Dispersion 17 5.4.4 Model Input Parameters 17 5.4.5 Source Input Parameters 19 5.4.6 Results of AERMOD Simulations and Interpretations 19
6. CONCLUSIONS .............................................................................................................................. 27
7. REFERENCES ................................................................................................................................ 28
LIST OF TABLES Table 1 Summary of last five years of emissions from Site 9
Table 2 Summary of maximum emission concentrations from EPL 10
Table 3 Sensitive Receptors 12
Table 4 Source Emission Rates 13
Table 5 Summary of inputs to calculated emission rates 14
Table 6 Sampled Emission Rates from DP4 in Emission Testing Reports 15
Table 7 Summary of AERMOD Input Parameters 18
Table 8 Summary of Source Input Parameters for Dispersion Modelling Simulations 19
Table 9 100th Percentile predicted benzene concentrations at sensitive receptors 20
Table 10 100th Percentile predicted SO2 concentrations at sensitive receptors 21
Table 11 100th Percentile predicted CO concentrations at sensitive receptors 22
Table 12 100th Percentile predicted NO2 concentrations at sensitive receptors 23
Table 13 100th Percentile predicted PM10 concentrations at sensitive receptors 24
Table 14 Other VOCs from CEC calculated emissions 25

USE OF REPORT
The preparation of this report has been undertaken for the purpose of providing the results of a Level 1
Air Quality Impact Assessment of the emissions from the proposed thermal oxidiser for the bulk liquid
storage facility located at 45 Friendship Road, Port Botany NSW.
This report is prepared solely for the benefit of Terminals Pty Ltd (Quantem). This report is provided on
the condition that it or any part of it, will not be made available to, or relied upon by any other party for
any purpose except with the prior written consent of Peter J Ramsay & Associates Pty Ltd (which
consent may or may not be given at its discretion). Peter J Ramsay & Associates Pty Ltd consents to
Quantem making this report available to other parties for the purpose of showing the scope of, and the
recommendations provided in, this report, however those third parties cannot rely on the contents of this
report.
DISCLAIMER
This report is provided on the condition that Peter J Ramsay & Associates Pty Ltd disclaims all liability to
any person other than Quantem in respect of the actions, errors or omissions of any such person in
reliance, whether in whole or in part, upon the contents of this report.
LIMITATIONS
Peter J Ramsay & Associates Pty Ltd has undertaken this assessment in accordance with New South
Wales Environmental Protection Authority Approved Method for the Modelling and Assessment of Air
Pollutants in New South Wales. The nature of the assessment is influenced by factors such as
professional judgement, emission factors from sources from the site and the reliability of the information
relating to the site which was obtained by the methodology described in this report. Reasonable care has
been taken to verify the accuracy of the data and information available to Peter J Ramsay & Associates
Pty Ltd.
The findings presented in this report are based on the information available during this assessment and
some of those findings could vary if the information upon which they are based is determined to be false,
inaccurate, or incomplete. Peter J Ramsay & Associates Pty Ltd disclaims all liability to any person for
events taking place after the time during which the assessment was undertaken.

LIST OF UNITS Adelaide, South Australia
°C degrees Celsius
µg/m3 microgram per metre cubed
g/s grams/second
m Metres
m/s metres per second
m3/s metres cubed per second
mg/m3 milligrams per metre cubed

1
1. INTRODUCTION
Peter J Ramsay & Associates (PJRA) was engaged on 6 November 2020 by Terminals Pty Ltd
(Quantem) to conduct a Level 1 Air Quality Impact Assessment for the operation of a proposed thermal
oxidiser at Quantem’s Port Botany facility.
Quantem operates a bulk liquid storage facility at 45 Friendship Road, Port Botany NSW (the Site) and
the predominant activity at the site is the storage of petroleum products, liquefied petroleum gas (LPG)
and liquid chemicals. There is an existing oxidiser on the site and Quantem is proposing to install an
additional oxidiser.
The proposed thermal oxidiser is a control device that will reduce the impact of air emissions from the
operations at the Site. The existing oxidiser utilises natural gas to thermally combust (oxidise) volatile
organics that exist as a vapour within the airspace of tanks which must be vented during filling of tanks.
There will be minor residual emissions to air, and the oxidiser will unavoidably generate some
combustion products, such as nitrogen dioxide (NO2), sulphur dioxide (SO2), carbon monoxide (CO) and
particulate matter (PM).
The proposed oxidiser is to be utilised when the existing oxidiser at the area referred to as Site A within
the Site is offline and also in conjunction with the existing oxidiser when peak loads are experienced at
the facility. Quantem also proposes to use the new thermal oxidiser for disposal of liquid waste slops and
as additional capacity for control of vapour emissions.
This assessment was undertaken to assess the predicted impacts on local air quality surrounding the
site due to the changes in operation at the site.
2. METHODOLOGY
The objective is to assess the impact of emissions from the proposed thermal oxidiser, referred to in this
report as TO-2. The cumulative impact of the emissions from this oxidiser is considered with the existing
air emissions from the Site.
The Site is the subject of an Environment Protection Licence number 1048 (the EPL) issued by the NSW
Environment Protection Authority (EPA). It is expected that the air emissions from TO-2 will be added to
the discharge points listed on the EPL. The proposed maximum instantaneous emission limits are 20
mg/m3 of total VOCs, 1 mg/m3 of benzene, and 350 mg/m3 of nitrogen dioxide. These equal the limits
provided as standards of concentration for Group 6 equipment for afterburners, flares and vapour

2
recovery units at scheduled premises, as per Schedule 2 of the Protection of the Environment
Operations (Clean Air) Regulations 2010.
The increase in emissions due to the proposed oxidiser are considered in relation to the load limits for
the operations at the Site. The expected destruction efficiency is 99.99% for the new thermal oxidiser, as
stated by CEC Engineering; the engineering consultant engaged by Quantem. This is in accordance with
the operation of the existing thermal oxidiser which was installed in 2013 and was reported to have a
destruction efficiency of 99.998% during commissioning. The commissioning report is provided in
Appendix A. The assessment is detailed in Section 4.5.1.
The impact of emissions on local air quality was assessed based on the maximum instantaneous
emission rates for the proposed oxidiser TO-2, simultaneously with all emissions from discharge points
from the EPL. The dispersion of these emissions was modelled to assess the maximum predicted
ground level concentrations against relevant assessment criteria.
In order to assess the worst-case scenario, it was assumed that all emission rates are at the allowed
maximum concentration under the EPL. The volumetric flow rate at each location was assessed at the
maximum expected. For the emission from the existing and proposed oxidiser the flow rate was
calculated by CEC engineering. Peak flow rate from the vapour recovery equipment was based on the
maximum possible filling rate, that is each truck filling point operating simultaneously.
Licence limits are not provided for some combustion products, sulfur dioxide. particulate matter, and
carbon monoxide. The emission rate for sulfur dioxide was calculated by CEC based on the sulfur
content of material sent to the oxidiser. This emission rate has been adopted for the purpose of
assessing worst case emission. The emission rate of other combustion products is calculated on the
expected emission rate based on the peak gas flow rate. These emission rates are calculated from
emission factors published by the National Pollutant Inventory (NPI). The calculation of the maximum
emission rates is discussed in Section 4.5.2.
A previous air quality assessment was performed for emissions from the Site. The report is Botany PMB
and CRMB Project Air Quality Assessment, which was prepared by GHD and dated 14 October 2020
(Appendix B). Emissions described in this report are also included and modelled to make sure that they
are considered in the cumulative impact. The predicted ground level concentrations at and beyond the
facility boundary were modelled in accordance with the Approved Methods for Modelling and
Assessment of Air Pollutants (‘Approved Methods) with the exception that AERMOD was used instead of
AUSPLUME. The NSW Environment Protection Authority was consulted regarding the choice of the
dispersion model and the advice was that AERMOD can be used in place of AUSPLUME provided the
use can be justified as the more appropriate selection.

3
The dispersion modelling has been used to identify the potential air quality impacts in the vicinity of the
site with additional focus on the nearest residential locations. The predicted maximum concentrations
from the dispersion modelling have been used to assess potential impacts. The maximum benzene
concentrations were also assessed at the fence-line of the Site to assess potential for off-site impacts.

4
3. REGULATIONS AND GUIDELINES
3.1 Protection of the Environment Operations Act 1997
The Protection of the Environment Operations Act 1997 (POEO) is a key piece of the environment
protection legislation in New South Wales (NSW), which is administered by the NSW Environmental
Protection Authority (NSW EPA).
Within the POEO, air pollution is a term defined as the emission into the air of any air impurity. The
POEO provides the statutory framework for managing air emissions in NSW and requires that all
necessary practicable means are used to prevent or minimise air pollution (NSW EPA 2014). Also, in
accordance with the POEO, EPA-licenced activities must not emit offensive odour. Further, there are
general provisions that apply to all premises which make it an offence for any person to undertake an
activity that emits air pollution (including offensive odour) if the emission is caused by a failure to
maintain or operate plant, or deal with materials in a proper and efficient manner.
3.2 Approved Methods for the Modelling and Assessment of Air Pollutants
The Approved Methods for the Modelling and Assessment of Air Pollutants in New South Wales (2016)
(‘Approved Methods’) lists the statutory methods for modelling and assessing emission of air pollutants
from stationary sources. The Approved Methods was released by the New South Wales Environment
Protection Authority through the Department of Environment and Conservation. As this is a regulatory
document, all stationary sources in NSW must be evaluated in accordance with the methods and criteria
set forth in the Approved Methods.
Impact assessment criteria for individual toxic and odorous air pollutants have been extracted from
section 7.2 of the Approved Methods. The criteria shown are based on the breakdown of emission
estimates from both oxidisers that have been provided to PJRA.
The principal toxic air pollutants are defined on the basis whether they are carcinogenic, mutagenic,
teratogenic, highly toxic or highly persistent in the environment. Benzene is listed as a principal toxic air
pollutant.
It is stated in the Approved Methods that principal toxic air pollutants must be minimised to the maximum
extent achievable through the application of best-practice process design and/or emission controls.
Decisions with respect to achievability will have regard to technical, logistical and financial
considerations. The control of benzene in air emissions will not change as a result of the proposed
changes. The use of thermal oxidation for destruction of benzene from air emissions achieves control to
the maximum extent achievable.

5
3.2.1 Air Quality Impact Assessment
There are two levels of impact assessment outlined in the Approved Methods.
• Level 1 – screening-level dispersion modelling technique using worst case input data
• Level 2 – refined dispersion modelling technique using site specific input data
The impact assessment levels are designed so that the impact estimates from the second level should
be more accurate than the first. This means that, for a given facility, the result of a Level 1 impact
assessment would be more conservative and less specific than the result of a Level 2 assessment.

6
4. SITE DESCRIPTION AND OPERATIONS
4.1 Site Location and Surrounding Land Use
The site is located in Port Botany which is approximately 11 km south of the Sydney’s CBD, as shown in
Figure F1. The site forms part of the Port Botany industrial area and is surrounded by heavy industrial
uses. The nearest residential areas are located approximately 1.4 km south east of the site.
4.2 Zoning
The site is predominantly zoned industrial for Major Development (MD).
4.3 Topography
The topography of the site and the surrounding area is essentially flat and is situated at sea level. The
topography of the site was interpreted from the Shuttle Radar Topography Mission, 1-second data file.
4.4 Meteorology
Data were obtained from the Bureau of Meteorology station 066037 (Sydney Airport) as it was the
weather station nearest to the site. In accordance with the Approved Methods, the data were for a single
year with over 90% of complete data, which in this case was 2017. Dispersion modelling was performed
using meteorological data from observations at Sydney Airport for the 2017 year. The 2017 year was
selected as it provided the most complete data set from the five most recent years available.
Wind roses produced from the meteorological data indicate that the predominant winds in Botany Bay
are typically from the north west, north east and south. During winter winds are generally come from the
west while summer tends to bring winds from the north east and south. The annual wind rose is
displayed in Figure 1. The report entitled AERMOD ready Meteorological data files for Port Botany –
NSW is provided in Appendix C and also provides wind roses to show seasonal variation.
It is noted that the predominant winds directions observed in the meteorological data are from the south,
northwest and northeast. This is consistent with the predominant wind directions observed in the data
provided from 1997 which were used in the assessment attached in Appendix B. Historic wind roses for
observations from the weather station operated by the Bureau of Meteorology at Sydney Airport from
April 1939 to August 2020 are provided as Appendix D. The morning (9am) and afternoon (3pm) show
the same pattern for predominant wind directions as is observed in the meteorology for 1997 and from
2017. The wind speeds and directions used in this modelling appear to be consistent with historic
observations.

7
4.5 Description of Site Operations
The Site is operated under the Environment Protection Licence number 1048 (the EPL) issued by the
New South Wales Environment Protection Authority (EPA). The operations at the Site typically involve
the receival of product from seaborne tankers, bulk storage, and subsequent unloading to road tankers
for distribution. However, some products including solvent mixtures of benzene, toluene and xylenes are
received by road tanker for seaborne export. The Site is used for storage and distribution of hydrocarbon
products.
Emissions from the operations at the Site result from storage in tanks and from truck loading. Emissions
from the facility occur from the actions described. There are emissions from tank vents due to diurnal
temperature changes from fixed roof tanks, referred as Standing Losses. There are emissions when
vapour is displaced from the air in storage tank headspace during filling of a fixed roof vessel, referred to
as Working Losses. There are also fugitive losses arising from leaks in the rim and deck of floating roof
tanks. Truck loading generates vapour losses due to displacement of vapour from the headspace within
the tanker trucks during filling.
There are three separate areas that constitute the Site as shown on Figure F2, attached. The three
areas are located close to together but do not have a contiguous boundary. The three areas are referred
to as Site A, Site B and Site C. Each section is used for the storage of different types of products. Site A
is used for storage of bulk hydrocarbon chemicals, Site B is used for storage of bitumen and Site C is
Figure 1 Wind Rose Plot

8
used for storage of bulk fuels. All three areas of the Site are subject to the EPL and similar operations
are performed at each of the areas of the Site.
To minimise the impact of residual emissions, the following control devices are in use at the Site:
• Site A
o Thermal oxidiser which receives vapour from solvent tanks containing benzene,
toluene, xylenes, and some other products such as methanol, ethanol; and
o A carbon adsorption bed for handling truck loading and the remaining storage tank
emissions.
• Site B
o Bitumen combustor, a thermal oxidiser to treat vapours from storage and process
vessels and for treatment of vapours from truck loading.
• Site C
o Floating roof tanks are used for storage of unleaded petrol to eliminate Standing
Losses; and
o Vapour Recovery Unit (VRU) is used to capture emissions from truck loading.
A second thermal oxidiser is proposed to be installed at Site A to provide backup capacity for vapour
control and for the disposal of liquid waste from the Site. The existing thermal oxidiser at Site A is
sometimes referred to as the benzene combustor, as that was the original purpose for its installation.
However, it is also used for control of emissions of chemicals such as, hexane, hexene and methanol.
The thermal oxidiser oxidises hydrocarbon chemicals, converting potentially harmful chemicals into
carbon dioxide and water vapour. However, as the oxidation process involves combustion, there will be
some generation of combustion products such as nitrogen dioxide (NO2), sulphur dioxide (SO2), carbon
monoxide (CO), and particulate matter (PM).
The emissions from Site A which may contain benzene are treated by the existing thermal oxidiser.
Therefore, there are no emissions of benzene from the carbon adsorption bed at Site A. There are some
emissions of total VOCs from this location.
The carbon adsorption bed at Site A discharges from the Discharge Point (DP) which is described as
DP2 on the EPL. The thermal oxidiser at Site A discharges emissions to air from DP4 as described in the
EPL. The thermal oxidiser from Site B discharges from DP7 as described in the EPL. The VRU at Site C
discharges emissions to air from DP9 as described in the EPL.

9
4.5.1 Site Emissions Limits
The operations at the site are undertaken in accordance with the EPL. The EPL provides a load limit for
total emissions of benzene and total VOCs from the Site. These load limits are 3,000 kg of benzene and
25,000 kg of total VOCs per annum. Emissions are monitored and reported to EPA annually through the
annual return. Emissions are also reported annually to the National Pollutant Inventory (NPI).
Emissions from the proposed thermal oxidiser will be counted in emissions from the site and will be
included in the calculation of the load limit in the EPL and will be reported in emissions to the NPI.
It is estimated that an additional 700 tonnes of total VOCs will be added to the combined load of the
existing and proposed thermal oxidisers at Site A. The expected destruction efficiency is for 99.99%
removal of VOCs. Therefore, there is an expected increase of 70 kg per annum of total VOCs.
The liquid waste proposed to be sent to the new thermal oxidiser will not typically contain benzene. The
benzene tanks do not collect slops for disposal. However, in the event of a tank inspection then some
benzene waste may be generated due to the need to completely empty the tank for physical inspection.
This occurs approximately every ten years and would be expected to generate up to 50 tonnes of
benzene waste. The expected destruction efficiency is 99.99%, therefore a tank inspection would result
in emission of an additional 5 kg of benzene.
The annual emissions for the most recent five years of operation are provided in Table 1. This shows
that the addition of 70 kg of total VOCs and up to 5 kg of benzene emissions would not have had a
material impact on the total emissions from the Site for the last five reporting periods.
The operation of the proposed thermal oxidiser will not result in a material increase in emissions of either
benzene or total VOCs. Therefore, no change is proposed to the existing load limits in the EPL for the
operation of the Site.
Table 1 Summary of last five years of emissions from Site
Year Benzene Total VOCs
Load Limit: 3,000 kg 25,000 kg
2015-16 9.4 kg 2,139 kg
2016-17 133.2 kg 4,327 kg
2017-18 7.8 kg 2,833 kg
2018-19 26.6 kg 15,751 kg
2019-20 26 kg 10,239 kg

10
4.5.2 Maximum Instantaneous Emissions
The EPL also contains emission limits for the maximum allowable concentrations that may be
discharged from certain locations, referred to as discharge points (DPs) in the EPL. These are
summarised in Table 2.
It is assumed that the proposed thermal oxidiser will be subject to the same concentration limits as the
existing thermal oxidiser at Site A. To determine whether this could be expected to have an impact of the
local air quality, an air quality impact assessment is provided in Section 5. This assessment assesses
whether the maximum instantaneous discharge from the Site could adversely impact on local air quality.
Table 2 Summary of maximum emission concentrations from EPL
Discharge Point Description EPL Limits
DP2 Vent from the carbon adsorption bed in use at Site A
None
DP4 Discharge from the existing thermal oxidiser at Site A
350 mg/m3 of NO2
20 mg/m3 of total VOC
1 mg/m3 of benzene
DP7 Discharge from the bitumen plant combustor at the bitumen plant at Site B
350 mg/m3 of NO2
40 mg/m3 of total VOC
DP9 Discharge from the vapour recovery unit at Site C
10 mg/L of total VOCs as n-propane*
* It is noted that a limit of 20 g/s is present in the current EPL. It is acknowledged that the lower limit described in note b) of licence condition L3.1 of the EPL should apply.

11
5. AIR QUALITY IMPACT ASSESSMENT
5.1 Previous Assessments
A previous air dispersion report was available regarding Quantem’s facilities at Port Botany. The report
was prepared by GHD and was titled Report for Terminals Australia – Terminals Fuel Project 21/25548
(the GHD Report). An assessment of the cumulative impact of emissions assessed in the GHD Report in
addition to the impacts modelled from the operation of the oxidisers is provided in Section 5.3.6.7 of this
report.
An air quality impact assessment was performed for emissions from the bitumen plant combustor. This is
Botany PMB and CRMB Project Air Quality Assessment, prepared by GHD dated 14 October 2020
(Appendix B).
The commissioning report for the thermal oxidiser at Site A (Appendix A) reported a destruction
efficiency of 99.998%.
5.2 Sensitive Receptors
Sixteen sensitive receptors were taken into consideration in the modelling. These receptors were the
closest existing receptors identified from a review of Nearmap Pty Ltd (Nearmap) aerial photography.
The locations of these sensitive receptors are shown in Figure F2. The nearest sensitive receptor to the
site is identified as an existing residence and is located approximately 1.36 km south east. Table 3
displays the type of each receptor and its distance from the Site.
Fence line receptors were also situated around the property boundaries of Site A, Site B and Site C.

12
Table 3 Sensitive Receptors
Receptor Number Receptor Type Distance from site (km) Direction
R01 Existing Residence 1.36 South East
R02 Council Building 1.48 South East
R03 Existing Residence 1.52 South East
R04 Existing Residence 1.52 North East
R05 Existing Residence 1.56 North East
R06 Existing Residence 1.69 North
R07 Existing Residence 1.71 North
R08 Existing Resident 1.79 North East
R09 Existing Residence 2.03 East
R10 Existing Residence 1.91 East
R11 Existing Residence 1.60 North East
R12 Public Sports Facility 1.87 East
R13 Existing Residence 1.88 East
R14 Existing Residence 1.93 East
R15 Existing Residence 2.02 North
R16 Existing Residence 2.29 North

13
5.3 Emissions Inventory
The sources of emissions from the Site are the two thermal oxidisers, DP4 and TO-2 (proposed) located
on Site A, DP7 located on Site B and DP9 which is located on Site C. Emissions at that the licence limits
for the existing benzene oxidiser have been assumed to apply to the new oxidiser and emissions have
been modelled at the concentrations in the licence. It is noted that the emission rate calculated from the
licence limit is approximately an order of magnitude greater than the maximum calculated emission from
CEC Engineering, which is attached as Appendix E. It is also noted that the maximum calculated
emission rates from CEC for the existing oxidiser exceed the emission rate measured in stack testing
performed to demonstrate compliance with the existing Environment Protection Licence for the
operations at the Site.
Emissions from the vapour recovery unit were considered based on the maximum operational rate, four
trucks loading simultaneously each at the maximum rate of 2,200 litres per minute, with vapour
discharge at the EPL limit of 10 mg per litre. As a worst case situation it was assumed that all trucks
were filled with vapour from unleaded petrol (ULP). The benzene fraction of the vapour was estimated
from the ratio of benzene to total VOCs in the NPI EET Manual for Fuel and Organic Liquid Storage,
Version 3.3 dated May 2012. According to Figure F.1 in NSW benzene can be expected to account for
0.4% of total VOCs in vapour from ULP. It was assumed that total VOC emissions are at the EPL limit.
Fugitive losses from the storage and transfer of material at the Site were assessed in the report, Botany
Stage 5B Expansion, Air Quality Assessment, August 2013. The conclusion of this report is that these
emissions have a negligible potential to impact on local air quality. Therefore, the impact of such
emissions has not been considered in this assessment.
5.3.1 Sources of Air Emissions
The sources of emission are the stack emissions from the VOC treatment system which consists of the
existing thermal oxidiser on the site (DP4) and the proposed thermal oxidiser (TO-2) the
bitumen combustor (DP7) and VRU (DP9).
Table 4 Source Emission Rates
DP 4
(g/s)
TO-2
(g/s) DP7 (g/s)
DP9 (g/s)
Benzene 0.01484 0.02516 0 0
Carbon Monoxide 0.162 0.242 0.18 0
Nitrogen Dioxide 5.194 8.806 0.12 0
PM10 0.00142 0.021 0.016 0
Sulphur Dioxide 4.133 4.4 0.002 0

14
The basis for the calculated emission rates is shown in Table 5. The emission rates have been
calculated either based on the calculated concentration at the maximum emission rate, or have been
calculated based on the maximum gas usage rate with the emission factors from the NPI EET.
Table 5 Summary of inputs to calculated emission rates
5.3.2 Estimation of Air Emissions
The estimation of air emissions from the combustion system was undertaken by CEC Engineers from
process data which were provided by Quantem. The data were calculated assuming worst case vapour
loading to the thermal oxidisers. Data used for the bitumen combustor were taken from the GHD PMB
and CRMB Air Quality Assessment Report and VRU data were supplied by Quantem.
Based on the process data provided by CEC Engineers, benzene and sulphur dioxide were the only
pollutants with concentrations that exceeded the assessment criteria. Other pollutants were below the
DP 4 Proposed Oxidiser DP7 (g/s) DP9
Flow Rate 14.84 m3/hr 25.16 m3/hr 14.18 m3/hr 0.1467 m3/hr
Flow Rate Source CEC Calculation CEC Calculation GHD Assessment
Calculated based on worst case of four
trucks loading simultaneously at 2,200 lpm each.
Benzene Concentration
EPL limit 20 mg/m3
Concentration
POEO (Clean Air) Limit of 20 mg/m3
GHD Assessment
Concentration
EPL limit of 10 mg/l
0.4% benzene concentration in
vapour
Carbon Monoxide
Emission rate
NPI EET
based on maximum instantaneous gas
consumption of 400 Nm3/hr
Emission rate
NPI EET
Based on maximum instantaneous gas
consumption of 598 Nm3/hr
GHD Assessment Not present – no
combustion.
Nitrogen Dioxide Concentration
EPL limit 350 mg/m3
Concentration
POEO (Clean Air) Limit of 350 mg/m3
GHD Assessment Not present – no
combustion.
PM10
Emission rate
NPI EET
based on maximum instantaneous gas
consumption of 400 Nm3/hr
Emission rate
NPI EET
Based on maximum instantaneous gas
consumption of 598 Nm3/hr
GHD Assessment Not present – no
combustion.
Sulphur Dioxide Concentration
CEC Calculation
Concentration
CEC Calculation GHD Assessment
Not present – no combustion.

15
ambient assessment criteria within the oxidiser emissions. The impact of other pollutants is negligible
because the in-stack concentrations are lower than the assessment criteria, therefore the dispersion of
emissions of these other compounds were not modelled.
Additionally, dispersion of CO and PM10 were modelled at the request of Quantem. The natural gas
maximum usage rate was used to estimate the emission rates from the combustion system. Using these
peak rates of gas consumption, the National Pollution Inventory (NPI) emission factors were applied to
estimate the emission rates of CO and PM10.
The emission factors were obtained from the NPI Emission Estimation Technique Manual for
Combustion in Boilers, Version 3.6, 2011 (NPI Manual) for 30 MW or less, combustion system for natural
gas. Using the NPI manual, the predicted emission rates for DP4 and TO-2 were then calculated using
the following equation.
𝐸(𝑆) = 𝐴 × 𝐸𝐹(𝑠) × (1 − 𝐶𝐸)Annual
Table 6 Sampled Emission Rates from DP4 in Emission Testing Reports
Sample Date Benzene
Emission Rate (g/s)
Sulfur Dioxode Emission Rate
(g/s)
Carbon Monoxide Emission Rate
(g/s)
Nitrogen Dioxide Emission Rate
(g/s)
April 2013 <0.00018 2.6 0.19 1.1
August 2013 <0.0005 0.12 < 0.01 0.11
July 2013 <0.0005 0.065 < 0.01 0.08
May 2014 Not Detected 0.04 0.01 0.07
July 2015 Not Detected 0.128 0.02 0.11
December 2015 Not Detected 0.065 0.02 0.08
August 2016 <0.00017 Not Analysed Not Analysed 0.32
May 2017 <0.00005 Not Analysed 0.003 0.08
April 2018 0.000075 Not Analysed 0.06 0.06
May 2019 <0.00008 Not Analysed 0.004 0.1
Modelled Emission Rate
0.01484 4.133 0.162 5.194
Calculation Notes for modelled emission rate
Calculated from CEC flow rate, with
the outflow concentration at the EPL Limit of
1 mg/m3
Calculated by CEC.
NPI Emission Estimation to give mass flow rate based on peak
gas consumption.
Calculated from CEC flow rate, with the
outflow concentration at the EPL Limit of
350 mg/m3

16
It is noted that the emission rates modelled at the worst case scenarios provide a large over-estimate of
the emissions that have been observed in analysis of samples from DP4. Therefore, the modelled
emissions are considered to provide a conservative-high estimate of the emissions that are likely to be
observed during normal operation of the Site.
5.4 Air Dispersion Modelling
Dispersion modelling was undertaken in accordance with the Approved Methods to predict the impact of
discharges to air while DP4 and TO-2 are operating simultaneously with the DP7 and DP9 under local
meteorological conditions.
5.4.1 Model Selection
The modelling has been undertaken in accordance with the Approved Methods with the exception that
AERMOD was used instead of AUSPLUME. The NSW Environment Protection Authority was consulted
regarding the choice of the dispersion model and the advice was that AERMOD can be used in place of
AUSPLUME provided the use can be justified as the more appropriate selection.
The modelling prepared using AERMOD is better able to account for terrain factors and is recommended
by the United States Environmental Protection Agency (USEPA) in place of the older AUSPLUME
model. The AUSPLUME model was developed by the Environment Protection Authority Victoria,
however it is no longer supported as the regulatory model in Victoria and the software is no longer
updated. The use of AERMOD allows for consideration of terrain effects and provides an improvement
over AUSPLUME for assessing potential impacts for small-scale, near-field dispersion modelling such as
is the case in this situation.
The site is essentially at sea level and the topography surrounding the site is relatively flat. Examination
of meteorological data indicated that calms occur less than 5% of the time. Based on these
considerations, it was considered appropriate to use the regulatory approved AERMOD dispersion
model version 9.9.0.
A comparison of three modelling programs, AUSPLUME, AERMOD, and TAPM demonstrated that
AERMOD is preferable to AUSPLUME (Hurley, 2006). Although both AUSPLUME and AERMOD have
some limitations with modelling in coastal scenarios, AERMOD was found to provide more accurate
results than AUSPLUME. This was especially the case when looking at measuring the upper estimates
of contaminant concentrations.
The use of a more complicated model such as TAPM or CALPUFF would provide more accurate results,
however the margin of error using AERMOD is in the range of ~20%, compared to ~50% for

17
AUSPLUME. As a margin of error of 20% to the modelled maximum concentrations would not make a
material difference to the outcome of the assessment, the use of TAPM or CALPUFF is not considered
necessary.
5.4.2 Modelling Domain
A 9 km x 9 km grid was used with receptors placed 300 m apart and the centre of the grid located at the
centre point of the site. Discrete receptors were also placed at existing residential receptors as described
in Section 4.1 of this report. Fence line receptors were also positioned at property boundaries
surrounding the processing equipment on Site A, B and C.
An additional 600m x 600m grid with receptors placed 30m apart was applied to the same centre point
for the site. This was provided to assess whether there would be any impacts in close proximity to the
site.
Topography was incorporated into the model using a digital elevation model with approximately 30 m
resolution which has been gap filled. Since the terrain is relatively flat surrounding the site, the
topographical resolution of the terrain was considered appropriate.
5.4.3 Dispersion
5.4.3.1 Climate Data
The nearest weather station operated by the Bureau of Meteorology (BOM) is at Sydney Airport, site
number 066037. The station has been operated by BOM since 1929 and is located approximately 5 km
north west of the site.
Daily 9 am and 3 pm weather data from the Sydney Airport BOM station were used to characterise the
climate in the vicinity of the subject land. Wind roses produced from the meteorological data used for
the dispersion modelling indicate that the winds are typically from the north west and north east.
5.4.3.2 Meteorological Input Files
The data file used for the AERMOD modelling was prepared by pDs Consultancy based on the
observational data taken from weather stations operated by the BOM.
5.4.4 Model Input Parameters
In accordance with the Approved Methods the one-hour average concentrations were modelled so the
results were consistent with the principal and individual toxic air pollutants assessment criteria.

18
Table 7 Summary of AERMOD Input Parameters
Model Input Parameters
Meteorological Data Obtained from Bureau of Meteorology at station 066037
Pollutant Benzene, SO2, CO, NO2, PM10
Deposition None
Depletion None
Dispersion Rural
Averaging time Hourly
Terrain Flat & elevated
Gridded Receptors 9 km x 9km, 300m spacing
600m x 600m, 30m spacing
Discrete Receptors
14 houses located to the north, east and south
1 public sporting facility
1 council building
16 Fence line receptors (50m spacing) surrounding Site A
13 Fence line receptors (50m spacing) surrounding Site B
18 Fence line receptors (50m spacing) surrounding Site C

19
5.4.5 Source Input Parameters
A full listing of source input parameters used in the AERMOD simulations is provided in Table 8. The
estimation of the emission rates utilised in the model was discussed in Section 4.2.2.
Table 8 Summary of Source Input Parameters for Dispersion Modelling Simulations
5.4.6 Results of AERMOD Simulations and Interpretations
In accordance with the Approved Methods, the emissions must be assessed against the assessment
criteria. The impact assessment criteria for a 1-hour average period for benzene, sulphur dioxide, carbon
monoxide and nitrogen dioxide are provided below as per the Approved Methods. The PM10 criterion is
provided as a 24-hour average period.
• Benzene 0.029 mg/m3 (Victorian Governments Gazette, 2001)
• Sulphur Dioxide 570 µg/m3 (NHMRC, 1996)
• Carbon Monoxide 30 mg/m3 (WHO, 2000)
• Nitrogen Dioxide 246 µg/m3 (NEPC, 1998)
• PM10 50 µg/m3 (DoE, 2016)
DP4 Thermal Oxidiser 2
(TO-2) DP7 DP9
Source Type Point Point Point Point
Source Height (m) 17.5 17.5 17.3 5.0
Inside Diameter 1 1.25 0.95 0.15
X co-ordinate (m) 335242 335239 335432 335652.
Y co-ordinate (m) 6239157 6239155 6238948 6239315
Exit Temperature (°C) 980 980 825 22
Gas Exit Velocity (m/s) 18.9 20.5 20.0 8.3
Gas Exit Flow Rate (m3/s)
14.84 25.16 14.18 0.15

20
5.4.6.1 Benzene
Table 9 100th Percentile predicted benzene concentrations at sensitive receptors
The results of the dispersion modelling show there are no exceedances of the impact assessment
criterion for benzene at any receptor. The highest concentration of benzene was 0.000165 mg/m3 at
Receptor 13, and this is 0.6% of the benzene impact assessment criterion of 0.029 mg/m3.
For principal air toxics, impact assessment criteria should be applied at and beyond the boundary of the
premises. Therefore, receptors at the facility boundary were added to the model inputs to predict
benzene concentration at the facility boundary. The highest estimated concentration at the facility
boundary was 0.013476 mg/m3 at the northern boundary at Site C.
Receptor GLC (mg/m3) % of Criterion Location
Elevation (m) Easting Northing
R01 0.000153 0.5% 336600.77 6238834.97 15.84
R02 0.000110 0.4% 336586.90 6238481.55 17.74
R03 0.000108 0.4% 336632.12 6238499.78 17.24
R04 0.000125 0.4% 336342.33 6240219.80 15.50
R05 0.000117 0.4% 336190.89 6240393.45 16.32
R06 0.000127 0.4% 336018.25 6240670.08 11.27
R07 0.000117 0.4% 335958.68 6240705.42 10.51
R08 0.000139 0.5% 336817.93 6240016.59 24.76
R09 0.000110 0.4% 336977.39 6240187.57 18.33
R10 0.000137 0.5% 337077.67 6239774.93 28.96
R11 0.000129 0.4% 336541.84 6240114.49 16.18
R12 0.000153 0.5% 337156.16 6239436.87 21.88
R13 0.000165 0.6% 337153.68 6239115.58 16.57
R14 0.000108 0.4% 337164.39 6238909.43 20.12
R15 0.000093 0.3% 334375.19 6240986.80 4.18
R16 0.000072 0.2% 334102.67 6241129.35 4.98

21
5.4.6.2 Sulphur Dioxide
Table 10 100th Percentile predicted SO2 concentrations at sensitive receptors
The predicted SO2 peak concentration levels at each off-site receptor are shown in Table 10. There are
no exceedances of the impact assessment criterion of 570 µg/m3 for sulphur dioxide at any of the
receptors.
For a level 1 assessment, the existing background concentration of sulphur dioxide should be included.
In accordance with the Approved Methods, the maximum background concentration of the pollutant is to
be added to peak concentration levels at the maximum exposed off-site receptor for 100th percentile
dispersion model prediction.
Ambient air quality data were obtained to determine the maximum background concentrations of sulphur
dioxide. The closest station to the site that records ambient sulphur dioxide is located at Randwick
approximately 7.5 km north of Quantem’s facility and is operated by NSW EPA. Hourly average data
were obtained for the 2017 calendar year and the maximum background concentration was determined
to be 75 µg/m3 for SO2.
Receptor Ground level
concentrations (µg/m3)
% of Criterion Location
Elevation (m) Easting Northing
R01 34.42 6.0% 336600.77 6238834.97 15.84
R02 23.52 4.1% 336586.90 6238481.55 17.74
R03 23.30 4.1% 336632.12 6238499.78 17.24
R04 24.31 4.3% 336342.33 6240219.80 15.50
R05 24.97 4.4% 336190.89 6240393.45 16.32
R06 27.72 4.9% 336018.25 6240670.08 11.27
R07 25.57 4.5% 335958.68 6240705.42 10.51
R08 21.32 3.7% 336817.93 6240016.59 24.76
R09 21.07 3.7% 336977.39 6240187.57 18.33
R10 19.07 3.3% 337077.67 6239774.93 28.96
R11 24.83 4.4% 336541.84 6240114.49 16.18
R12 31.75 5.6% 337156.16 6239436.87 21.88
R13 35.14 6.2% 337153.68 6239115.58 16.57
R14 23.51 4.1% 337164.39 6238909.43 20.12
R15 20.17 3.5% 334375.19 6240986.80 4.18
R16 14.90 2.6% 334102.67 6241129.35 4.98

22
Based on the results of the dispersion modelling, Receptor 13 is predicted to be the maximum exposed
off-site receptor. The maximum background concentration was then added to the dispersion model
prediction for Receptor 13, to give an impact of 110 µg/m3, which is 20% of the impact assessment
criterion of 570 µg/m3.
5.4.6.3 Carbon Monoxide
Based on the modelling results there is no exceedance of the impact assessment criterion for CO at any
receptor. As per the Approved Methods, background concentrations of CO must also be reported and
included for the maximum exposed off-site receptor. The nearest ambient air quality station that
measures background concentrations of CO is located in Chullora, NSW. Analysis of the data
determined that the maximum ambient concentration was 2.16 mg/m3.
Table 11 shows the predicted concentrations of CO at each off-site receptor. Based on the results,
Receptor 2 is predicted to be the maximum exposed off-site receptor. The maximum background
concentration was then added to the prediction to give an impact of 2.162 mg/m3 approximately 7.2% of
the impact assessment criterion of 30 mg/m3.
Table 11 100th Percentile predicted CO concentrations at sensitive receptors
Receptor Ground level
concentrations (mg/m3)
% of Criterion Location
Elevation (m)
Easting Northing
R01 0.00167 0.006% 336600.77 6238834.97 15.84
R02 0.00168 0.006% 336586.90 6238481.55 17.74
R03 0.00164 0.005% 336632.12 6238499.78 17.24
R04 0.00123 0.004% 336342.33 6240219.80 15.50
R05 0.00122 0.004% 336190.89 6240393.45 16.32
R06 0.00133 0.004% 336018.25 6240670.08 11.27
R07 0.00124 0.004% 335958.68 6240705.42 10.51
R08 0.00105 0.003% 336817.93 6240016.59 24.76
R09 0.00099 0.003% 336977.39 6240187.57 18.33
R10 0.00104 0.003% 337077.67 6239774.93 28.96
R11 0.00120 0.004% 336541.84 6240114.49 16.18
R12 0.00151 0.005% 337156.16 6239436.87 21.88
R13 0.00167 0.006% 337153.68 6239115.58 16.57
R14 0.00132 0.004% 337164.39 6238909.43 20.12
R15 0.00131 0.004% 334375.19 6240986.80 4.18
R16 0.00098 0.003% 334102.67 6241129.35 4.98

23
5.4.6.4 Nitrogen Dioxide
The predicted concentration levels at each off-site receptor are shown in Table 12. There are no
exceedances of the impact assessment criterion of 246 µg/m3 at any off-site receptor. Based on the
modelling results, Receptor 13 is expected to be the maximum exposed off-site receptor with a modelled
100th percentile concentration of 56.51 µg/m3.
Analysis of background concentrations was undertaken from data measured at Randwick and the
maximum ambient concentration of NO2 was determined to be 84.05 µg/m3. To predict the total impact
at Receptor 13, the highest background concentration was then added to the prediction at Receptor 13
to give an impact of 140.6 µg/m3, approximately 57% of the impact assessment criterion for NO2.
Table 12 100th Percentile predicted NO2 concentrations at sensitive receptors
Receptor Ground level
concentrations (µg/m3)
% of Criterion Location
Elevation (m) Easting Northing
R01 53.66 21.8% 336600.77 6238834.97 15.84
R02 38.41 15.6% 336586.90 6238481.55 17.74
R03 37.51 15.2% 336632.12 6238499.78 17.24
R04 38.73 15.7% 336342.33 6240219.80 15.50
R05 39.52 16.1% 336190.89 6240393.45 16.32
R06 44.30 18.0% 336018.25 6240670.08 11.27
R07 40.58 16.5% 335958.68 6240705.42 10.51
R08 33.64 13.7% 336817.93 6240016.59 24.76
R09 33.41 13.6% 336977.39 6240187.57 18.33
R10 30.02 12.2% 337077.67 6239774.93 28.96
R11 39.78 16.2% 336541.84 6240114.49 16.18
R12 51.14 20.8% 337156.16 6239436.87 21.88
R13 56.51 23.0% 337153.68 6239115.58 16.57
R14 38.05 15.5% 337164.39 6238909.43 20.12
R15 32.17 13.1% 334375.19 6240986.80 4.18
R16 24.51 10.0% 334102.67 6241129.35 4.98

24
5.4.6.5 PM10
There are no exceedances of the impact assessment criterion of 50 µg/m3 for PM10 at any of the
receptors. The predicted PM10 peak concentration levels at each off-site receptor are shown in Table 13.
Based on the modelling results, Receptor 7 is expected to be the maximum exposed off-site receptor
with a modelled 100th percentile concentration of 0.0426 µg/m3.
Ambient air quality data were obtained to determine the maximum background concentrations of PM10
from Randwick. 24-hour average data were obtained for the 2017 calendar year and the maximum
background concentration was determined to be 56.1 µg/m3 for PM10. The maximum ambient
concentration was then added to the highest predicted emission at Receptor 7 to gauge the total impact
of PM10 emissions. Based on the modelling results, it is considered that the predicted emission from both
oxidisers would have negligible impact on the ambient concentrations of PM10.
Table 13 100th Percentile predicted PM10 concentrations at sensitive receptors
Receptor Ground level
concentrations (µg/m3)
% of Criterion Location
Elevation (m) Easting Northing
R01 0.0271 0.05% 336600.77 6238834.97 15.84
R02 0.0253 0.05% 336586.90 6238481.55 17.74
R03 0.0234 0.05% 336632.12 6238499.78 17.24
R04 0.0255 0.05% 336342.33 6240219.80 15.50
R05 0.0333 0.07% 336190.89 6240393.45 16.32
R06 0.0421 0.08% 336018.25 6240670.08 11.27
R07 0.0426 0.09% 335958.68 6240705.42 10.51
R08 0.0231 0.05% 336817.93 6240016.59 24.76
R09 0.0197 0.04% 336977.39 6240187.57 18.33
R10 0.0234 0.05% 337077.67 6239774.93 28.96
R11 0.0229 0.05% 336541.84 6240114.49 16.18
R12 0.0238 0.05% 337156.16 6239436.87 21.88
R13 0.0279 0.06% 337153.68 6239115.58 16.57
R14 0.0195 0.04% 337164.39 6238909.43 20.12
R15 0.0217 0.04% 334375.19 6240986.80 4.18
R16 0.0192 0.04% 334102.67 6241129.35 4.98

25
5.4.6.6 Other VOCs
The emission calculations provided by CEC include calculated emissions of VOCs that can have an
odour impact. These include butyl acrylate, ethanol, methanol, methyl methacrylate, and styrene. It is
noted that the calculated concentrations in the stack under worst case operation do not exceed the
ground level assessment criteria from the Approved Methods.
Therefore, it is therefore not necessary to assess the dispersion of the emissions of these VOCs. These
emission concentrations are summarised in Table 14. The calculated concentrations are corrected to 1
atmosphere and 0°C.
Table 14 Other VOCs from CEC calculated emissions
These pollutants were below the ambient assessment criteria for odour impact within the oxidiser
emissions. The impact of these emissions is negligible because the in-stack concentrations are lower
than the assessment criteria at ground level. In view of this, the dispersion of emissions of these
compounds was not modelled.
5.4.6.7 Cumulative Impact
The Quantem facility is predominantly used for the bulk storage of liquid fuels. As evident from aerial
imagery, nearby industries are used for liquid storage purposes however the contents of the storage may
consist of other liquids other than fuels.
The GHD Report (GHD 2016) identified only two other sites in the Port Botany industrial area that are
both sources of emissions. The report estimated that the maximum predicted concentration of benzene
beyond the site boundary was only 19% of the impact assessment criterion. It is stated in the report that
other sites within the Port Botany industrial area would not be expected to add significant contribution of
levels of benzene to the predicted concentrations.
Compound Calculated DP4
mg/m3 Calculated TO-2
mg/m3 Assessment Criterion
mg/m3
Acetone 0.5357 0.3154 22
Ethanol 0.1320 0.0777 2.1
Methanol 0.5104 0.3005 3
Styrene 0.0005 0.0014 0.12
Methyl Methacrylate 0.0000 0.0000 0.12
Butyl Acrylates 0.0004 0.0011 0.1

26
The findings of this report support GHD’s view as the maximum predicted off-site concentration of
benzene is expected to be only 0.06% of the impact assessment criterion. Therefore, it is considered
that the operations at the Site will have a negligible contribution to off-site benzene concentration.

27
6. CONCLUSIONS
The dispersion of emissions of benzene, carbon monoxide, sulphur dioxide, nitrogen dioxide and PM10
were modelled using licence limits in EPA Licence 1048 and from the emission estimates provided by
CEC Engineers and Peter J Ramsay & Associates.
The predicted ground level concentrations from the dispersion modelling of emissions show that the
proposed addition of a second thermal oxidiser (TO-2) will not cause exceedances of the relevant impact
assessment criteria at any sensitive receptors. The assessment was undertaken assuming a worst-case
scenario of both thermal oxidisers, bitumen combustor and the VRU operating simultaneously, at
maximum capacity, and worst-case ambient background concentrations from the nearest monitoring
station.
Based on the predicted peak level concentrations, the maximum benzene concentration will be
experienced at Receptor 13, approximately 1.88 km east from the site. It was predicted that benzene will
peak at 0.000165 mg/m3 at Receptor 13 which is approximately 0.6% of the impact assessment criterion
when modelled at the licence limit. The cumulative benzene impact remains well below the assessment
criterion at the most impacted receptor.
For sulphur dioxide, the maximum predicted concentration will also be experienced at Receptor 13. The
predicted peak sulphur dioxide concentration is 110 µg/m3 which includes the addition of background
concentration which was obtained from NSW EPA ambient air quality data. The expected peak level
concentration is approximately 20% of the impact assessment criterion.
In addition, the predicted peak level concentrations for carbon monoxide, nitrogen dioxide and PM10 are
also at Receptor 13. As per the Approved Methods, the maximum ambient background concentration
was added to the modelling result at Receptor 13 to gauge the overall impact of the emissions from the
proposed combustion system. It is concluded that:
• The maximum carbon monoxide concentration will be experienced at Receptor 2 with a peak of
2.162 mg/m3 approximately 7.2% of the impact assessment criterion.
• The maximum nitrogen dioxide concentration will be experienced at Receptor 13 with a peak of
140.6 µg/m3, approximately 57% of the impact assessment criterion for NO2.
• Based on the modelling results, it was considered that the predicted emission from both
oxidisers would have negligible impact on the ambient concentrations of PM10.
Although the use of gaussian dispersion models such as AUSPLUME or AERMOD are generally not
preferred in coastal locations, the margin of error for the high concentration estimates is expected to be

28
around 20%. Given the modelled ground level concentrations this margin of error would not impact the
outcome of this assessment and further dispersion modelling is not necessary.
The use of AERMOD was found to be preferable to AUSPLUME for modelling of emissions at the Site.
The margin of error for assessing the predicted ground level concentrations AERMOD is around 20%
and is sufficiently accurate for the purposes of this impact assessment.
Emissions from the operation of the proposed thermal oxidiser, in addition to the existing air emissions
from the Site, will not have unacceptable impact on the local air quality in the vicinity the Site nor at the
nearest sensitive receptors.
The operation of the proposed thermal oxidiser will not cause a material increase to the total emissions
of benzene or total VOCs form the Site. Therefore, no change to the existing load limits in the EPL is
necessary.
7. REFERENCES
Hurley, 2006; An Evaluation and Inter-Comparison of AUSPPLUME, AERMOD, and TAPM for Seven
Field Datasets of Point Source Dispersion, Peter J Hurley, CSIRO Marine and Atmospheric Research,
Clean Air and Environmental Quality, 40, 45-50, 2006.

Figures

Air Quality Impact Assessment
45 Friednship Road, Port Botany NSW
Project:Date:Revision:Designed:Drawn:Reviewed:
LOCALITY MAP
1033.105/02/2021Rev01TAADNW/TA
Main Map Scale 1: 20,000 @ A4
Pet
er J
. Ram
say
& A
ssoc
iate
s do
es n
ot w
arra
nt th
e ac
cura
cy o
r co
mpl
eten
ess
of in
form
atio
n in
this
figu
re, a
nd a
ny p
erso
n us
ing
it do
es s
o at
thei
r ow
n ris
k. P
eter
J. R
amsa
y &
Ass
ocia
tes
shal
l bea
r no
liab
ility
for
any
erro
rs, f
aults
, def
ects
or
omis
sion
s in
the
info
rmat
ion.
File: P:\Projects\1033.1\Maps\Working\F1_Locality Map.qgz
F1Figure
Quantem Bulk Liquid Storage &Handling (Terminals Pty Ltd)
LEGENDSite Boundary
- Site A
- Site B
- Site C
Data SourcesCoordinates: WGS84 / Pseudo-Mercato Aerial Imagery - Nearmap Australia Ltd, photograph dated 26/09/2020.
Scale 1 : 200,000 @ A4
Inset Map 1
SITE

6983
560
6983
565
6983
570
6983
575
6983
580
6983
585
6983
590
498275 498280 498285 498290 498295
Air Quality Impact Assessment
45 Friendship Road, Port Botany NSW
Project:Date:Revision:Designed:Drawn:Reviewed:
AIR DISPERSION MODELLINGEMISSION SOURCES AND SENSITIVERECEPTORS
1033.111/02/2021Rev02 TAADNW/TA
Main Map Scale 1: 12,000 @ A4
Pet
er J
. Ram
say
& A
ssoc
iate
s do
es n
ot w
arra
nt th
e ac
cura
cy o
r co
mpl
eten
ess
of in
form
atio
n in
this
figu
re, a
nd a
ny p
erso
n us
ing
it do
es s
o at
thei
r ow
n ris
k. P
eter
J. R
amsa
y &
Ass
ocia
tes
shal
l bea
r no
liab
ility
for
any
erro
rs, f
aults
, def
ects
or
omis
sion
s in
the
info
rmat
ion.
File: P:\Projects\1033.1\Maps\Working\Working_20210211.qgz
F2Figure
Quantem Bulk Liquid Storage &Handling (Terminals Pty Ltd)
LEGENDFenceline
- Site A
- Site B
- Site C
Fenceline Receptors
Emission Sources
Sensi ve Receptors
Data SourcesCoordinates: GDA94 / MGA 56 Aerial Imagery - Nearmap Australia Ltd, photograph dated 26/09/2020

6237
500
6238
000
6238
500
6239
000
6239
500
6240
000
6240
500
6241
000
6241
500
334000 334500 335000 335500 336000 336500 337000
Air Quality Impact Assessment
45 Friendship Road, Port BotanyNSW 2036
Project:Date:Revision:Designed:Drawn:Reviewed:
EMISSION CONCENTRATIONCONTOUR - BENZENE
1033.111/02/2021Rev03TAADNW/TA
Main Map Scale 1: 20,000@ A4
Pet
er J
. Ram
say
& A
ssoc
iate
s do
es n
ot w
arra
nt th
e ac
cura
cy o
r co
mpl
eten
ess
of in
form
atio
n in
this
figu
re, a
nd a
ny p
erso
n us
ing
it do
es s
o at
thei
r ow
n ris
k. P
eter
J. R
amsa
y &
Ass
ocia
tes
shal
l bea
r no
liab
ility
for
any
erro
rs, f
aults
, def
ects
or
omis
sion
s in
the
info
rmat
ion.
File: P:\Projects\1033.1\Maps\Working\Working_20210211.qgz
F3Figure
Quantem Bulk Liquid Storage &Handling (Terminals Pty Ltd)
LEGENDEmission Sources
Sensi ve Receptors
Fenceline
Fenceline Receptors
Coordinates: GDA94 / MGA z56
PLOT FILE OF HIGH 1ST HIGH 1-HR VALUES FOR SOURCE GROUP: ALL Sources:4 Receptors:1512 Output Type: Concentra on Modelling Date: 10/02/2021
Benzene Concentra on1.03.06.0
Data sources:Aerial Imagery - Nearmap Australia Ltd, photographdated 26/09/2020.
Comments:Benzene Criterion = 0.029 mg/m3 (1 hour averaging period) as per theApproved Methods.The contour lines that are displayed represent apercentage of the impact assessment criteria.These percentages are as follows:6.0 ug/m3 = 20%3.0 ug/m3 = 10%1.0 ug/m3 = 3%

6237
500
6238
000
6238
500
6239
000
6239
500
6240
000
6240
500
6241
000
6241
500
334000 334500 335000 335500 336000 336500 337000
Air Quality Impact Assessment
45 Friendship Road, Port BotanyNSW 2036
Project:Date:Revision:Designed:Drawn:Reviewed:
EMISSION CONCENTRATIONCONTOUR - CARBON MONOXIDE
1033.111/02/2021Rev02TAADNW/TA
Main Map Scale 1: 20,000@ A4
Pet
er J
. Ram
say
& A
ssoc
iate
s do
es n
ot w
arra
nt th
e ac
cura
cy o
r co
mpl
eten
ess
of in
form
atio
n in
this
figu
re, a
nd a
ny p
erso
n us
ing
it do
es s
o at
thei
r ow
n ris
k. P
eter
J. R
amsa
y &
Ass
ocia
tes
shal
l bea
r no
liab
ility
for
any
erro
rs, f
aults
, def
ects
or
omis
sion
s in
the
info
rmat
ion.
File: P:\Projects\1033.1\Maps\Working\Working_20210211.qgz
F4Figure
Quantem Bulk Liquid Storage &Handling (Terminals Pty Ltd)
LEGENDEmission Sources
Sensi ve Receptors
Fenceline
Fenceline Receptors
Coordinates: GDA94 / MGA z56
PLOT FILE OF HIGH 1ST HIGH 1-HR VALUES FOR SOURCE GROUP: ALL Sources:4 Receptors:1512 Output Type: Concentra on Modelling Date: 10/02/2021
CO Concentra on3.06.015.0
Data sources:Aerial Imagery - Nearmap Australia Ltd, photographdated 26/09/2020.
Comments:CO Criterion = 30 mg/m3 (1 hour averaging period) as per the ApprovedMethods. The contour lines that are displayed represent a percentage ofthe impact assessment criteria.These percentages are as follows:15 ug/m3 = 0.05%6 ug/m3 = 0.02%3 ug/m3 = 0.01%

6237
500
6238
000
6238
500
6239
000
6239
500
6240
000
6240
500
6241
000
6241
500
334000 334500 335000 335500 336000 336500 337000
Air Quality Impact Assessment
45 Friendship Road, Port BotanyNSW 2036
Project:Date:Revision:Designed:Drawn:Reviewed:
EMISSION CONCENTRATIONCONTOUR - NITROGEN DIOXIDE
1033.111/02/2021Rev02TAADNW/TA
Main Map Scale 1: 20,000@ A4
Pet
er J
. Ram
say
& A
ssoc
iate
s do
es n
ot w
arra
nt th
e ac
cura
cy o
r co
mpl
eten
ess
of in
form
atio
n in
this
figu
re, a
nd a
ny p
erso
n us
ing
it do
es s
o at
thei
r ow
n ris
k. P
eter
J. R
amsa
y &
Ass
ocia
tes
shal
l bea
r no
liab
ility
for
any
erro
rs, f
aults
, def
ects
or
omis
sion
s in
the
info
rmat
ion.
File: P:\Projects\1033.1\Maps\Working\Working_20210211.qgz
F5Figure
Quantem Bulk Liquid Storage &Handling (Terminals Pty Ltd)
LEGENDEmission Sources
Sensi ve Receptors
Fenceline
Fenceline Receptors
Coordinates: GDA94 / MGA z56
PLOT FILE OF HIGH 1ST HIGH 1-HR VALUES FOR SOURCE GROUP: ALL Sources:4 Receptors:1512 Output Type: Concentra on Modelling Date: 10/02/2021
NO2 concentra on62123246
Data sources:Aerial Imagery - Nearmap Australia Ltd, photographdated 26/09/2020.
Comments:NO2 Criterion = 246 ug/m3 (1 hour averaging period) as per the ApprovedMethods.The contour lines that are displayed represent a percentage ofthe impact assessment criteria.These percentages are as follows:246 ug/m3 = 100%123 ug/m3 = 50%62 ug/m3 = 25%

6237
500
6238
000
6238
500
6239
000
6239
500
6240
000
6240
500
6241
000
6241
500
334000 334500 335000 335500 336000 336500 337000
Air Quality Impact Assessment
45 Friendship Road, Port BotanyNSW 2036
Project:Date:Revision:Designed:Drawn:Reviewed:
EMISSION CONCENTRATIONCONTOUR - PM10
1033.111/02/2021Rev02 TAADNW/TA
Main Map Scale 1: 20,000@ A4
Pet
er J
. Ram
say
& A
ssoc
iate
s do
es n
ot w
arra
nt th
e ac
cura
cy o
r co
mpl
eten
ess
of in
form
atio
n in
this
figu
re, a
nd a
ny p
erso
n us
ing
it do
es s
o at
thei
r ow
n ris
k. P
eter
J. R
amsa
y &
Ass
ocia
tes
shal
l bea
r no
liab
ility
for
any
erro
rs, f
aults
, def
ects
or
omis
sion
s in
the
info
rmat
ion.
File: P:\Projects\1033.1\Maps\Working\Working_20210211.qgz
F6Figure
Quantem Bulk Liquid Storage &Handling (Terminals Pty Ltd)
LEGENDEmission Sources
Sensi ve Receptors
Fenceline
Fenceline Receptors
Coordinates: GDA94 / MGA z56
PLOT FILE OF HIGH 1ST HIGH 24-HR VALUES FOR SOURCE GROUP: ALL Sources:4 Receptors:1512 Output Type: Concentra on Modelling Date: 10/02/2021
PM10 Concentra on0.050.150.25
Data sources:Aerial Imagery - Nearmap Australia Ltd, photographdated 26/09/2020.
Comments:PM10 Criterion = 50 ug/m3 (24 hour averaging period) as per theApproved Methods.The contour lines that are displayed represent apercentage of the impact assessment criteria.These percentages are as follows:0.25 ug/m3 = 0.5%0.15 ug/m3 = 0.3%0.05 ug/m3 = 0.1%

6237
500
6238
000
6238
500
6239
000
6239
500
6240
000
6240
500
6241
000
6241
500
334000 334500 335000 335500 336000 336500 337000
Air Quality Impact Assessment
45 Friendship Road, Port BotanyNSW 2036
Project:Date:Revision:Designed:Drawn:Reviewed:
EMISSION CONCENTRATIONCONTOUR - SULFUR DIOXIDE
1033.111/02/2021Rev02TAADNW/TA
Main Map Scale 1: 20,000@ A4
Pet
er J
. Ram
say
& A
ssoc
iate
s do
es n
ot w
arra
nt th
e ac
cura
cy o
r co
mpl
eten
ess
of in
form
atio
n in
this
figu
re, a
nd a
ny p
erso
n us
ing
it do
es s
o at
thei
r ow
n ris
k. P
eter
J. R
amsa
y &
Ass
ocia
tes
shal
l bea
r no
liab
ility
for
any
erro
rs, f
aults
, def
ects
or
omis
sion
s in
the
info
rmat
ion.
File: P:\Projects\1033.1\Maps\Working\Working_20210211.qgz
F7Figure
Quantem Bulk Liquid Storage &Handling (Terminals Pty Ltd)
LEGENDEmission Sources
Sensi ve Receptors
Fenceline
Fenceline Receptors
Coordinates: GDA94 / MGA z56
PLOT FILE OF HIGH 1ST HIGH 1-HR VALUES FOR SOURCE GROUP: ALL Sources:4 Receptors:1512 Output Type: Concentra on Modelling Date: 10/02/2021
SO2 Concentra on57114171
Data sources:Aerial Imagery - Nearmap Australia Ltd, photographdated 26/09/2020.
Comments:SO2 Criterion = 570 ug/m3 (1 hour averaging period) as per the ApprovedMethods.The contour lines that are displayed represent a percentage ofthe impact assessment criteria.These percentages are as follows:171 ug/m3 = 30%114 ug/m3 = 20%57 ug/m3 = 10%

Appendix A
Commissioning Report for existing Thermal Oxidiser


Appendix B
Botany PMB and CRMB Project Air Quality Assessment, prepared by GHD14 October 2020

Puma Energy Australia Botany PMB and CRMB Project
Air Quality Assessment
October 2020

GHD | Report for Puma Energy Australia - Botany PMB and CRMB Project, 12533800 | i
Table of contents 1. Introduction .................................................................................................................................... 1
1.1 Overview .............................................................................................................................. 1
1.2 Project description ............................................................................................................... 1
1.3 Scope ................................................................................................................................... 2
1.4 Limitations ............................................................................................................................ 2
1.5 Assumptions ........................................................................................................................ 3
2. Existing environment ...................................................................................................................... 4
2.1 Location ............................................................................................................................... 4
2.2 Sensitive receptors .............................................................................................................. 4
2.3 Background pollutant concentrations ................................................................................... 6
3. Air quality criteria ............................................................................................................................ 8
3.1 Criteria overview .................................................................................................................. 8
3.2 Pollutant assessment criteria ............................................................................................... 8
3.3 Odour assessment criteria ................................................................................................... 9
4. Emissions inventory ..................................................................................................................... 11
4.1 Emissions overview ........................................................................................................... 11
4.2 Puma emission rates summary ......................................................................................... 11
4.3 Terminals emission rate summary ..................................................................................... 12
4.4 Ranking of emission constituents with respect to compliance .......................................... 15
5. Meteorology ................................................................................................................................. 17
5.1 Meteorology overview ........................................................................................................ 17
5.2 All hours wind rose ............................................................................................................. 19
5.3 All hours stability rose ........................................................................................................ 19
5.4 Seasonal meteorology ....................................................................................................... 19
6. Air quality assessment ................................................................................................................. 22
6.1 Assessment overview ........................................................................................................ 22
6.2 Dispersion modelling.......................................................................................................... 22
6.3 Model Configuration ........................................................................................................... 22
6.4 Emissions source configuration ......................................................................................... 23
7. Predicted impacts ......................................................................................................................... 24
7.1 Overview ............................................................................................................................ 24
7.2 Odour ................................................................................................................................. 24
7.1 Sulfur dioxide ..................................................................................................................... 24
7.2 Benzene ............................................................................................................................. 25
7.3 Other toxics ........................................................................................................................ 25
7.4 Nitrogen dioxide ................................................................................................................. 26
7.5 Other constituents .............................................................................................................. 27

GHD | Report for Puma Energy Australia - Botany PMB and CRMB Project, 12533800 | ii
8. Conclusion and recommendations ............................................................................................... 33
Table index Table 2-1 Sensitive receptor location and description ......................................................................... 4
Table 2-2 Background pollutant concentration analysis ...................................................................... 6
Table 2-3 Adopted background pollutant concentrations .................................................................... 7
Table 3-1 Summary of air quality criteria in NSW (EPA, 2016) ........................................................... 8
Table 3-2 Odour criteria for the assessment of odour (EPA, 2016) ..................................................... 9
Table 4-1 Emission rates – PMB/CRMB and mixing tank headspace, tanks and road
tankers headspace, and oxidation column emissions vented via combustor with
99% removal ...................................................................................................................... 14
Table 4-2 Emission rates – Combustion emissions from the burners in the hot oil heaters
and combustor ................................................................................................................... 15
Table 4-3 Ranking of pollutants (PMB/CRMB and mixing tank headspace/ship and tanker
unloading/road tanker loading) .......................................................................................... 15
Table 4-4 Ranking of pollutants (combustion products from hot oil heaters and combustor) ........... 16
Table 6-1 Model source parameters .................................................................................................. 23
Table 7-1 Predicted odour concentrations (99th percentile, 1 second averaged) .............................. 24
Table 7-2 Predicted sulfur dioxide concentrations ............................................................................. 25
Table 7-3 Predicted Benzene concentrations .................................................................................... 25
Table 7-4 Toxic pollutant concentrations (99.9th percentile, 1 hour averaged) .................................. 26
Table 7-5 Predicted nitrogen dioxide concentrations (100th percentile, 1 hour averaged) ................ 26
Table 7-6 Peak on and off-site constituent pollutant concentrations ................................................. 27
Figure index
Figure 2-1 Site location ......................................................................................................................... 5
Figure 5-1 Wind rose for Sydney Airport, all hours ............................................................................. 18
Figure 5-2 Stability rose for Sydney Airport, all hours ......................................................................... 18
Figure 5-3 Seasonal wind roses, Sydney Airport ................................................................................ 20
Figure 5-4 Seasonal stability roses, Sydney Airport ........................................................................... 21
Figure 7-1 Predicted incremental odour impact (1 second averaged, OU) ........................................ 28
Figure 7-2 Predicted incremental sulfur dioxide impact (10 minute averaged, µg/m3) ....................... 29
Figure 7-3 Predicted incremental sulfur dioxide impact (1 hour averaged, µg/m3) ............................. 30
Figure 7-4 Predicted incremental benzene impact (1 hour averaged, µg/m3) .................................... 31
Figure 7-5 Predicted incremental nitrogen dioxide impact (1 hour averaged, µg/m3) ......................... 32

GHD | Report for Puma Energy Australia - Botany PMB and CRMB Project, 12533800 | iii
Appendices Appendix A – Proposal narrative functional description and process flow diagram
Appendix B – ETC sampling report
Appendix C – Air Noise Environment sampling report
Appendix D – newEQ report
Appendix E – Chemical odour level calculations
Appendix F – Bulwer experimental run data
Appendix G – Meteorological analysis

GHD | Report for Puma Energy Australia - Botany PMB and CRMB Project, 12533800 | 1
1. Introduction 1.1 Overview
Puma Energy Australia (Puma Energy) propose to commission a new Polymer Modified
Bitumen (PMB) and Crumbed Rubber Modified Bitumen (CRMB) production facility at the
existing Terminals Pty Ltd (Terminals) facility located in Botany Bay (‘the proposal’).
Puma Energy have engaged GHD Pty Ltd (GHD) to undertake an assessment of cumulative
operational air quality impacts associated with the proposal. This report provides an updated air
quality assessment of the site, which includes the existing Terminals bitumen import and
dispatch facility and additional emission sources associated with the proposal.
1.2 Project description
Puma Energy currently operates a bitumen import, storage and distribution facility located within
Port Botany in New South Wales. The bitumen facility primarily stores and loads out C170 and
C320 grades of bitumen and has the capability to oxidise these grades to higher viscosities as
required.
Puma Energy purchased the BP bitumen business including formulas for the Olexobit range of
PMB for which Puma has now found a ready market. In order to meet the PMB market (a
significant quantity of which is centred on NSW) a new PMB manufacturing facility is required in
NSW. The proposal aims to meet this PMB demand.
A narrative functional description and process flow diagram which provides a detailed
description of proposal operations is attached as Appendix A.
An overview of the intended operation and key functions of the proposal is summarised below:
Receipt, storage, handling and transfer of polymer binder or other solid bitumen modifiers
Blending of polymer/modifiers, C170 bitumen and Extract Oil to produce PMB
Blending of crumbed rubber, C170 Bitumen
PMB sampling and storage
CRMB sampling and storage
Transfer of PMB/CRMB between tanks
Load out of PMB/CRMB to the existing road gantry.
The proposal comprises of the following main systems and equipment:
1 x 50T heated/insulated blend tank including high sheer mixer/shredder for the
manufacture of all PMB/CRMB grades
2 x 100T heated and insulated storage tanks complete with mixers to hold finished
PMB/CRMB
1 x 50T heated and insulated Extract oil storage tank
1 x 100T heated and insulated buffer tank for the storage of C170 grade bitumen – this
tank is required to cover periods when bitumen from the existing facility is not available
(e.g. during tank ship discharges). Base grade C170 bitumen will be transferred from the
main facility using the existing transfer pumps and heat exchangers
Heating for the PMB facility – The existing site hot oil heaters are rated at 2 x 3000 KW –
the PMB plant heating required is relatively small therefore utilizing the existing heaters

GHD | Report for Puma Energy Australia - Botany PMB and CRMB Project, 12533800 | 2
should be possible. Heat metering will be required to enable additional gas usage to be
monitored
Hot oil circulation for both tank heating and tracing in the PMB area will utilise the existing
pumps
Venturi and hopper system to facilitate the controlled additional of material into the
flowing stream of bitumen
Loading and transfer pumps
Homogeniser – 1 x 60T/hr capacity
PMB loading capability – Propose to use existing gantry and loading arms with product
line tie in located as close to the loading arm as possible
Sour gas system linked to all tanks. A vapour incinerator already exists which generally
runs well below its design capacity as the existing plant normally generates much lower
gas volumes. The vapour combustor is capable of handling the additional vapour flow
generated by the PMB plant but may require production scheduling at times when the
existing blowing plant is producing maximum vapour flow.
1.3 Scope
The scope of the air quality assessment included the following tasks:
Desktop review of site plans, aerial photography, proposed operations and sensitive
receptors within the study area
Review of available ambient air quality monitoring data, to gain an understanding of
existing air quality in the vicinity of the proposal. Ambient pollutant levels were sourced
from data recorded at Department of Planning, Industry and Environment ambient
monitoring stations located in the local area.
Preparation of an emissions inventory to estimate operational air quality emissions from
the proposal and neighbouring Terminals site
Calculation of a concentration/design criterion metric to rank air quality emissions
constituents based on source
Preparation of a meteorological data file (using meteorology from Sydney Airport AWS) for
use in dispersion modelling
Dispersion modelling using the AUSPLUME model to predict worst-case impacts from the
proposal
Preparation of this report
1.4 Limitations
This report: has been prepared by GHD for Puma Energy Australia and may only be used and relied on by Puma Energy Australia for the purpose agreed between GHD and the Puma Energy Australia as set out in section 1.3 of this report.
GHD otherwise disclaims responsibility to any person other than Puma Energy Australia arising in connection with this report. GHD also excludes implied warranties and conditions, to the extent legally permissible.
The services undertaken by GHD in connection with preparing this report were limited to those specifically detailed in the report and are subject to the scope limitations set out in the report.

GHD | Report for Puma Energy Australia - Botany PMB and CRMB Project, 12533800 | 3
The opinions, conclusions and any recommendations in this report are based on conditions encountered and information reviewed at the date of preparation of the report. GHD has no responsibility or obligation to update this report to account for events or changes occurring subsequent to the date that the report was prepared.
The opinions, conclusions and any recommendations in this report are based on assumptions made by GHD described in this report (refer section(s) 1.5 of this report). GHD disclaims liability arising from any of the assumptions being incorrect.
GHD has prepared this report on the basis of information provided by Puma Energy Australia and others who provided information to GHD (including Government authorities)], which GHD has not independently verified or checked beyond the agreed scope of work. GHD does not accept liability in connection with such unverified information, including errors and omissions in the report which were caused by errors or omissions in that information.
1.5 Assumptions
The following major assumptions were used in this assessment:
Details of all operational activities likely to produce air quality emissions were provided by
Puma Energy
Tank dimensions (diameter, height, capacity), layout, and bitumen flowrates were
provided by Puma Energy
The rate of sulfur addition during PMB batch mixing and the corresponding hydrogen
sulphide production rate was provided by Puma Energy
Emissions to air were estimated based on measurements taken at similar facilities scaled
to the production rates of the proposal.

GHD | Report for Puma Energy Australia - Botany PMB and CRMB Project, 12533800 | 4
2. Existing environment 2.1 Location
The site is located within the Port Botany Industrial area, along Simblist Road and will be an
extension of the existing Terminals Site B. Other industries surrounding the site include Origin
Energy, Qenos and Tyne Container Services. The site location (shown in yellow) and the
existing Terminals site (shown in blue) is depicted in Figure 2-1.
The nearest residential receptors potentially affected by air quality emissions from the site are
the residential dwelling approximately 1.7 km to the east across Yarra bay.
2.2 Sensitive receptors
Sensitive receptors were selected based off examination of aerial photography. The location
and approximate distance of each sensitive receptor from the proposal is provided in Table 2-1.
Table 2-1 Sensitive receptor location and description
Receptor Approximate distance from
the proposal (m)
X Coordinate (m) Y Coordinate (m)
Philip bay residential
area
1,700 336637 6238499
Yarra Bay Bicentennial
Park
1,500 336464 6238600
Yarra Recreation
reserve
1,700 336665 6238646
Botany cemetery 1,250 336042 6239209
Matraville residential
area
2,000 336552 6240093
Botany residential area 2,150 334344 6240977

!(
!(
!(
!(!(
!(
Botanyresidentialarea
Matravilleresidentialarea
Phillip Bayresidentialarea
YarraBay BicentennialPark
Yarra RecreationReserve
BotanyCemetery
© Land and Property Information 2015
Figure 2-1
Job Number
Revision A
21-27357
\\ghdnet\ghd\AU\Sydney\Projects\21\27357\GIS\Maps\Deliverables\21_27357_Z001_SiteLocation.mxd
Map Projection: Transverse Mercator
Horizontal Datum: GDA 1994
Grid: GDA 1994 MGA Zone 56
0 125 250 375 50062.5
Metres
LEGEND
o© 2018. Whilst every care has been taken to prepare this map, GHD (and DATA CUSTODIAN) make no representations or warranties about its accuracy, reliability, completeness or suitability for any particular purpose and cannot accept liability and responsibility of any kind
(whether in contract, tort or otherwise) for any expenses, losses, damages and/or costs (including indirect or consequential damage) which are or may be incurred by any party as a result of the map being inaccurate, incomplete or unsuitable in any way and for any reason.
Date 23 Aug 2018
Puma Energy Australia
Botany PMB Project
Site location and sensitive areas
Data source: Aerial Imagery: Sixmaps Created by:ppandey
Level 15, 133 Castlereagh Street Sydney NSW 2000 T 61 2 9239 7100 F 61 2 9239 7199 E [email protected] W www.ghd.com.au
Paper Size A4
Terminal Site B
Puma Energy Site
!( Sensitive receivers

GHD | Report for Puma Energy Australia - Botany PMB and CRMB Project, 12533800 | 6
2.3 Background pollutant concentrations
The Department of Planning, Industry and Environment (DPIE) operate ambient air quality
monitoring stations in selected areas around NSW. The nearest stations to the site are the
Randwick and Earlwood monitoring stations.
An analysis of background pollutant concentration at both stations for the last five complete
calendar years (2015 – 2019) is provided in Table 2-2. It should be noted that background PM10
is considered high and exceeds the assessment criteria for most years (refer Section 3 for
details regarding assessment criteria). Further discussion regarding selection of background
PM10 concentrations is provided below.
Table 2-2 Background pollutant concentration analysis
Pollutant Averaging period
Randwick monitoring station Earlwood monitoring station
2015 2016 2017 2018 2019 2015 2016 2017 2018 2019
SO2 (µg/m3)
1 hour maximum
81.2 89.1 76.0 55.0 76.0 - - - - -
24 hour maximum
10.5 7.9 21.0 10.5 13.1 - - - - -
Annual average
2.4 2.3 2.7 2.7 2.6 - - - - -
NO2 (µg/m3)
1 hour maximum
80.8 82.7 77.1 75.2 95.9 99.6 80.8 126.0 94.0 114.7
Annual average
15.9 15.1 12.8 12.4 12.2 14.8 18.1 20.3 19.2 19.3
CO (mg/m3)
1 hour maximum
- - - - - 1495.0 - - - -
PM10 (µg/m3)
24 hour maximum
77.4 44.1 56.1 95.5 127.7 66.5 42.9 59.8 86.5 129.4
Annual average
18.6 18.0 19.2 21.2 24.1 17.2 17.6 18.0 19.8 23.0
Note: ‘-‘ indicates that the pollutant was not monitored at that station during that year
To conservative assess potential worst-case cumulative pollutant concentrations, the maximum
recorded pollutant concentration from both Randwick and Earlwood monitoring stations was
adopted as the background concentration for use in this assessment with the exception of PM10.
Background 24 hour PM10 concentrations exceed the assessment criteria (refer Section 3 for
details regarding assessment criteria) at both monitoring stations for years 2015, 2017, 2018
and 2019. The only year where recorded background concentrations comply with the
assessment criteria is 2016. Therefore to provide a meaningful cumulative assessment (where
criteria exceedances are not sorely due to high background concentrations) background PM10
concentrations were selected from the worst case monitoring station for 2016.
The adopted background pollutant concentration used in this assessment are provided in Table
2-3.

GHD | Report for Puma Energy Australia - Botany PMB and CRMB Project, 12533800 | 7
Table 2-3 Adopted background pollutant concentrations
Pollutant Averaging period Adopted background concentration
Percentage of assessment criteria (%)
SO2 (µg/m3) 1 hour maximum 89.1 15.6%
24 hour maximum 21.0 9.2%
Annual average 2.7 4.5%
NO2 (µg/m3) 1 hour maximum 126.0 51.2%
Annual average 20.3 32.8%
CO (mg/m3) 1 hour maximum 1495.0 5.0%
PM10 (µg/m3) 24 hour maximum 44.1 88.2%
Annual average 18.0 71.8%

GHD | Report for Puma Energy Australia - Botany PMB and CRMB Project, 12533800 | 8
3. Air quality criteria 3.1 Criteria overview
To determine the compliance status of the proposal, individual air pollutants were assessed
against the impact assessment criteria at the site boundary and at sensitive receptors where
appropriate.
3.2 Pollutant assessment criteria
Impact assessment criteria was taken from the Approved Methods for the Modelling and
Assessment of Air Pollutants in NSW (EPA, 2016) (the Approved Methods) and is summarised
in Table 3-1.
Sulfur dioxide (SO2) emissions were assessed at the nearest sensitive receptor in accordance
with the Approved Methods. All other air quality pollutants were assessed at and beyond the site
boundary using the relevant averaging period and respective assessment criteria percentile.
Compliance with the impact assessment criteria at the site boundary would also result in
compliance at the nearest sensitive receptors.
Table 3-1 Summary of air quality criteria in NSW (EPA, 2016)
Pollutant Averaging period Percentile Concentration (µg/m3)1
PM10 24 hour 100th 50
Annual 100th 25
Carbon monoxide (CO) 1 hour 100th 30000
8 hour 100th 10000
Nitrogen dioxide (NO2) 1 hour 100th 246
Annual 100th 62
Sulfur dioxide (SO2) 10 minutes 100th 712
1 hour 100th 570
24 hour 100th 228
Annual 100th 60
Benzene 1-hour 99.9th 29
Toluene 1-hour 99.9th 360
Xylene 1-hour 99.9th 190
Trimethyl-benzene 1-hour 99.9th 2200
Total PAH (as
benzo[a]pyrene)
1-hour 99.9th 0.4
1 The assessment criteria for some pollutants was converted from milligrams per metre cubed (mg/m3) to micrograms per metre cubed (µg/m3)

GHD | Report for Puma Energy Australia - Botany PMB and CRMB Project, 12533800 | 9
Pollutant Averaging period Percentile Concentration (µg/m3)1
Chloromethane 1-hour 99.9th 1900
Acetone 1-hour 99.9th 22000
Ethyl Benzene 1-hour 99.9th 8000
3.3 Odour assessment criteria
The Approved Methods defines odour assessment criteria and specifies how they should be
applied in dispersion modelling to assess the likelihood of nuisance impact arising from the
emission of odour.
Odour impact is a subjective experience and has been found to depend on many factors, the
most important of which are the:
Frequency of the exposure
Intensity of the odour
Duration of the odour episodes
Offensiveness of the odour
Location of the source.
These factors are often referred to as the FIDOL factors.
The odour assessment criteria is defined to take account of two of these factors (F is set at 99th
percentile; I is set at from 2 to 7 odour units (OU)). The choice of assessment criteria has also
been made to be dependent on the population of the affected area, and to some extent it could
be said that population is a surrogate for location – so that the L factor has also been
considered. The relationship between the criteria odour level C to affected population P is given
below:
C log P-4.5 -0.6 equation 1
Table 3-2 lists the values of C for various values of affected populations as obtained using
equation 1.
Table 3-2 Odour criteria for the assessment of odour (EPA, 2016)
Population of affected community Odour performance criteria (nose response odour certainty units at 99th percentile2)
Single Residence (≤ ~2) 7
~ 10 6
~ 30 5
~ 125 4
~ 500 3
Urban (≥~2,000) 2
The criteria assumes that 7 OU at the 99th percentile would be acceptable to the average
person, but as the number of exposed people increases there is a chance that sensitive
2 This is a prediction of the odour level that may occur 1% of the time, or one hour in one hundred. Odour performance criteria are designed to be precautionary, so that impacts on sensitive receivers can be minimised.

GHD | Report for Puma Energy Australia - Botany PMB and CRMB Project, 12533800 | 10
individuals would be encountered. The criteria of 2 OU at the 99th percentile is considered to be
acceptable for large populations (more than 2,000 people).
The criteria have also been specified at an averaging time of nominally 1 second. The choice of
the short averaging time recognises that the human nose has a response time of less than 1
second, so that modelling of odour impact should allow for the short-term concentration
fluctuations in an odour plume due to turbulence.
As the AUSPLUME dispersion model (used in this assessment) cannot predict concentrations
for a 1 second average, a ratio between the 1 second peak concentration and 60 minute
average concentration has been applied. This is known as the peak to mean ratio (PM60).
PM60 is a function of source type, stability category and range (that is, near or far-field), and
values are tabulated in the Approved Methods.
3.3.1 Adopted odour assessment criteria
The most stringent project specific odour assessment criteria of 2 OU was selected for the
assessment.

GHD | Report for Puma Energy Australia - Botany PMB and CRMB Project, 12533800 | 11
4. Emissions inventory 4.1 Emissions overview
The following section outlines the emission sources and emission rates of the Puma Energy
proposal used in this assessment. Emissions from the nearby Terminals bitumen storage facility
were included to provide a cumulative assessment of potential worst-case air quality impacts.
4.2 Puma emission rates summary
Emissions to air from the Puma site arise from several operations to be conducted at the facility,
namely:
Bitumen transfers to and from storage/mix tanks – Inflowing bitumen displaces tank
headspace vapour (headspace vapour contains air pollutants including Volatile Organic
Compounds (VOCs) and Polycyclic Aromatic Hydrocarbons (PAHs)) which is then ducted
and treated in an existing purpose-built combustor unit operated by Terminals
Sulfur addition during PMB batching mixing – Foul air exhaust from the mixer containing
higher hydrogen sulphide (H2S) concentrations will be ducted to the combustor.
Emission rates
Emission rates from bitumen transfers to and from storage/mix tanks were calculated based on
measured pollutant concentrations within the headspace of bitumen tanks at similar facilities
and Puma Energy’s maximum proposed bitumen flowrates. The pollutant headspace samples
were analysed for odour, VOCs and PAHs.
Emissions from PMB tanks was estimated based on sampling of tank headspace concentrations
undertaken by Emission Testing Consultants (ETC, 2006) at two similar facilities (sampling
report attached as Appendix B). Emissions from CRMB tanks was estimated based on sampling
of CRMB tank headspace undertaken by Air Noise Environment (2020) at Puma Energy’s
Pinkenba facility (sampling report attached as Appendix C).
As the bitumen storage tanks may be used for both PMB or CRMB, the maximum emission rate
for PMB and CRMB was adopted for all tanks (refer Table 4-1). This is a conservative approach
to predict maximum potential impacts.
Puma Energy advised that a maximum bitumen transfer rate of 80 m3/h from storage to mixing
tanks would occur during operation. This maximum value was adopted for use in this
assessment.
During PMB batch mixing, sulfur is added resulting in exhaust air from the mixer containing
significantly higher hydrogen sulphide concentrations. Hydrogen sulphide is a highly odorous
gas with potential to cause adverse odour impacts. To reduce odour emissions, the exhaust gas
is ducted to the combustor for treatment prior to release. During combustion, hydrogen sulphide
is converted into sulfur dioxide based on the following equation:
2 𝐻 𝑆 3 𝑂 → 2 𝑆𝑂 2 𝐻 𝑂
For modelling purposes, a 100% conversion rate of hydrogen sulphide into sulfur dioxide has
been assumed.
Sulfur dioxide emissions from the combustor were calculated based on hydrogen sulphide
flowrate data from an experimental run undertaken at Bulwer provided by Puma (provided in
Appendix F). The Bulwer charts were for 25 T batches, as Puma are intending to run 50 T
batches the measured flowrates were double. To predict the maximum 10 minute averaged
sulfur dioxide concentration the maximum 1 minute hydrogen sulphide flowrate (2 x 7.85 kg/h)

GHD | Report for Puma Energy Australia - Botany PMB and CRMB Project, 12533800 | 12
for the Bulwer plant was modelled as a constant 24 hour emission rate. To predict the maximum
1 hour average sulfur dioxide concentration, the 1 hour averaged hydrogen sulphide flowrate (2
x 6.08 kg/h) was modelled as a constant 24 hour emission rate.
The Bulwer charts shows the measured hydrogen sulphide production rate immediately after
sulfur was added during the mixing process. This addition of sulfur significantly increases the
hydrogen sulphide production rate for approximately an hour. The maximum onsite hydrogen
sulphide production rate occurs during this period. It is understood that a maximum of four
mixing loads (additions of sulfur) will occur per day. Sulfur dioxide emissions were modelled to
occur 24 hours a day, 7 days a week despite only occurring a maximum of four hours per day.
This accounts for worst case sulfur dioxide dispersion. Consequently, the sulfur dioxide
emission rate used to predict ground level concentrations will only occur a maximum of four
hour per day resulting in a conservative sulfur dioxide assessment.
The combustor is assumed to achieve a 99% emissions removal of all pollutants. Emissions
rates from combustor (PMB/CRMB storage and mixing tank headspace) are provided in Table
4-1.
It should be noted that sulfur is not added during CRMB batch mixing and therefore hydrogen
sulphide production and corresponding sulfur dioxide emissions during CRMB batch mixing are
significantly lower than those during PMB batch mixing.
However it was conservatively assumed that worst case sulfur dioxide emissions (that would
only occur PMB batch mixing) occurred from both PMB and CRMB tanks.
4.3 Terminals emission rate summary
Emissions to air from the Terminals site arise from several operations at the facility, namely:
Ship unloading to the main storage tanks – displaced headspace vapour is ducted and
treated in the purpose-built combustor unit
Road tanker loading from the day tanks – displaced headspace vapour is directed to the
combustor
Foul air exhaust from the oxidation columns is highly odorous; and mitigation is achieved
by ducting it to the combustor, and
Products of combustion from one natural gas fired hot oil heaters and the combustor. The
system can only handle one hot oil heater in operation during the ship unloading. This is
the period where air borne emissions are maximised.
Emission rates
A maximum ship unloading rate of 400 m3/h and a road tanker loading rate of 2x80 m3/h (160
m3/h) has been used with the ETC analysis of bitumen headspace pollutant concentration
(provided in Appendix B) to determine the maximum constituent emission rates.
The measured flow rate and constituent concentrations given in the newEQ report (provided in
Appendix D) were used to determine the constituent emission rates from the oxidation column
exhausts that is input to the combustor. Odour was not sampled, however the inferred
’chemical’ odour level was determined as shown in Appendix E.
Emissions from combustion within the combustor and the hot oil heaters were calculated using
the National Pollutant Inventory Emissions Estimation Technique Manual for Combustion in
Boilers (2011). Combustor and hot oil heater energy usage was provided by Terminals. It was
assumed that the combustor operated at its maximum design capacity (16.6 GJ/hr).

GHD | Report for Puma Energy Australia - Botany PMB and CRMB Project, 12533800 | 13
The sulfur dioxide emissions rate were conservatively calculated from the hydrogen sulphide
flowrate assuming 100% conversion of hydrogen sulphide to sulfur dioxide. Sulfur dioxide is
also an odorous gas and has been assessed against its ground level concentration criteria. 1%
of the hydrogen sulphide has been assumed to contribute to odour from this source as per the
next paragraph.
The combustor is assumed to achieve a 99% emission removal of all pollutants, but it is more
likely up to 99.9% or higher. Emissions rates from combustor (ship unloading and road tanker
loading) are provided in Table 4-1. Emission rates from combustion products within the hot oil
heaters and combustor are provided in Table 4-2.

GHD | Report for Puma Energy Australia - Botany PMB and CRMB Project, 12533800 | 14
Table 4-1 Emission rates – PMB/CRMB and mixing tank headspace, tanks and road tankers headspace, and oxidation column emissions vented via combustor with 99% removal
a. Emission rate calculated from Appendix B constituent concentration and maximum expected ship unloading and road tanker loading rate (0.022 m3/s) b. Emission rate calculated from Appendix B constituent concentration and maximum expected ship unloading and road tanker loading rate (0.16 m3/s) c. Calculated from 1 minute maximum hydrogen sulphide flowrate (4.4 g/s) (Used to predict 10 minute averaged Sulphur dioxide concentration) d. Emission rates calculated from Appendix D e. Odour level was determined as per Appendix E f. Emission rate calculated from Appendix C constituent concentration and maximum expected ship unloading and road tanker loading rate (0.022 m3/s) g. Below detection limit
Emission source Odour
Emission
ratea
(OUm3/s)
Total PAH
(Bap equi.)
(g/s)
Trimethyl –
benzenea
(g/s)
Xylene (g/s) Toluene
(g/s)
Benzene
(g/s)
Chlorometh
ane (g/s)
Acetone
(g/s)
Ethyl
Benzene
(g/s)
Sulfur
Dioxide
(g/s)
Puma
PMB and mixing
tank headspace
39a 0.0000000016a 0.000019a 0.000017a 0.000015a 0.000014a 8.19c
CRMB and mixing
tank headspacef
47 0g 0.0000012 0.000039 0.0000073 0.0000015 0.0000015 0.00052
Adopted maximum
for Puma Site
47 0.0000000016 0.000019 0.000039 0.000015 0.000014 0.0000015 8.19
Terminals
Tank and road
tanker headspaceb
273 0.000000011 0.00014 0.00012 0.00011 0.00010 0.013
Oxidation columnd 3470e 0.0000015 0.0000022 0.00000 0.0000020 0.0000018 0.00044 0.00000050 0.083

GHD | Report for Puma Energy Australia - Botany PMB and CRMB Project, 12533800 | 15
Table 4-2 Emission rates – Combustion emissions from the burners in the hot oil heaters and combustor
Pollutant Emissions Factor
(kg/GJ)
Terminals combustor
emission rateb (g/s)
Hot oil heater
emission ratec (g/s)
Carbon Monoxide 0.041 0.18 0.15
Nitrogen Dioxidea 0.027 0.12 0.10
PM10 0.0036 0.016 0.014
PAHs 0.00000031 0.0000014 0.0000012
Sulfur Dioxide 0.00054 0.0024 0.0020
a. Assuming 20% of NOx is NO2 b. Combustor energy usage of 16 GJ/hr (maximum design capacity) c. Hot oil heater maximum energy usage of 13.5 GJ/hr
4.4 Ranking of emission constituents with respect to compliance
An emission metric was calculated for all constituents (except odour and sulfur dioxide) to
determine which pollutant constituent had the least margin of compliance from each source. The
metric was calculated for pollutants originating from tank headspace (mixing tank headspace,
ship and tanker unloading and road tanker loading, refer Table 4-3) and for pollutants
originating from combustion in the hot oil heater and combustor (refer Table 4-4).
The metric is calculated as the constituent emissions rate divided by the design criteria
multiplied by 100.
Table 4-3 Ranking of pollutants (PMB/CRMB and mixing tank headspace/ship and tanker unloading/road tanker loading)
Pollutant Mass Rate (g/s) Design Criteria
(mg/m3)
Metric Metric (% of
total)
Toluene 0.00012 0.36 0.035 6.6
Xylene 0.00016 0.19 0.085 16.3
Trimethyl-
benzene
0.00016 2.2 0.0071 1.4
Total PAH 0.000000012 0.0004 0.0031 0.6
Benzene 0.00011 0.029 0.39 74.8
Chloromethane 0.0000018 1.9 0.00010 0.02
Acetone 0.00044 22 0.0020 0.4
Ethyl Benzene 0.0000020 8 0.000025 0.005
Table 4-3 identifies benzene as the worst-case pollutant originating from tank headspace with
respect to potential non-compliance. Hence, provided the dispersion modelling of benzene
emissions show that compliance with assessment criteria is met, then all other constituents will
also comply with increased margins.

GHD | Report for Puma Energy Australia - Botany PMB and CRMB Project, 12533800 | 16
Table 4-4 Ranking of pollutants (combustion products from hot oil heaters and combustor)
Pollutant Mass Rate (g/s) Design Criteria
(mg/m3)
Metric Metric (% of total)
Carbon monoxide 0.34 100 0.3 0.2
Nitrogen dioxide 0.22 0.246 89.3 59.5
PM10 0.030 0.05 59.0 39.3
PAHs 0.0000025 0.0004 0.6 0.4
Sulfur dioxide 0.0044 0.57 0.8 0.5
Table 4-4 identifies nitrogen dioxide as the worst-case pollutant originating from combustion in
the hot oil heater and combustor with respect to potential non-compliance. Hence, provided the
dispersion modelling of nitrogen dioxide emissions show that compliance with assessment
criteria is met, then all other constituents will also comply with increased margins.

GHD | Report for Puma Energy Australia - Botany PMB and CRMB Project, 12533800 | 17
5. Meteorology 5.1 Meteorology overview
The complex interaction between synoptic scale and mesoscale meteorology determines the
general weather conditions in the NSW coastal region.
Westerly high-pressure regions are the primary synoptic scale influence in NSW, however
variation is apparent on a seasonal basis. These aforementioned high-pressure cells move
north during autumn and winter, from a typical location across southern NSW during summer,
resulting in predominantly westerly winds. These autumn and winter prevailing conditions
differing greatly to the easterlies experienced in the summer months; spring shows similar
atmospheric attributes to autumn and winter.
Mesoscale land-sea contrasts result in the generation of the afternoon sea breeze particularly
during the summer months, and nocturnal katabatic drainage flows are also apparent from
areas of higher topography particularly during cold and clear winter months (from the west in the
Botany Bay region). Other terrain-induced flows and land breeze events are also evident
dependent upon location, onset timing and overarching meteorological conditions.
Meteorological data from Sydney airport for 1997 was obtained previously by GHD and utilised
within this assessment. This file has been used extensively for this site (including approval as
part of an EIA) and others nearby for a number of years. Appendix G shows that hourly
averages for the wind speed and wind direction have been generated, which meets USEPA
guidelines. Appendix G also shows the seasonal variation in the mixing height which meets the
requirements of NSW Approved Methods.
With regards to inter-annual variability, EPA NSW Approved Methods, Section 4.2 states that at
least one year of site-specific meteorological data is used. Given Sydney Airport is located
approximately 5 km northwest of the facility this dataset is therefore considered to be site-
representative meteorology for the Port Botany site.
EPA Victoria generally require 5 years of meteorological data to be used, however they also
accept one year of modelling where site specific data has been used in the generation of the
met file (which is the case here). EPA Victoria have also relaxed to one year of data where the
worst case model result is less than 20% of assessment criterion (which is also the case here –
see Section 7).
Wind speed and atmospheric stability were examined with respect to flow direction to
investigate typical flow regimes and directions of poor dispersion.
The P/G stability category scheme is a six level categorisation of atmospheric stability, with
three unstable levels (A, B and C), one neutral level (D) and two stable levels (E and F).
Atmospheric stability is an important factor in the dispersion of emissions to air, and the
incidence of stable conditions (when dispersion is poor) will define the directions of maximum
toxicity impact.
Accordingly, the all hours wind and stability roses for the data set are illustrated below in Figure
5-1 and Figure 5-2.

GHD | Report for Puma Energy Australia - Botany PMB and CRMB Project, 12533800 | 18
Figure 5-1 Wind rose for Sydney Airport, all hours
Figure 5-2 Stability rose for Sydney Airport, all hours

GHD | Report for Puma Energy Australia - Botany PMB and CRMB Project, 12533800 | 19
5.2 All hours wind rose
The pattern of wind climate is readily shown by means of a wind rose. The annual average wind
rose formed from the Sydney Airport meteorological data is illustrated in Figure 5-1 and this is
considered representative of the site.
Three dominant wind regimes are evident: north-westerly, north-easterly and southerly. Wind
speeds are significantly higher in the north-easterly and southerly flows when compared to
north-westerly conditions. It is apparent that north-westerly wind speeds are predominantly
0.5 – 3.6 m/s whereas the remaining dominant flow regimes display values of predominantly
3.6 – 11.1 m/s.
As discussed earlier southerly and easterly component winds are dominant during the summer
months whereas the westerly flow components are more typical of winter conditions.
5.3 All hours stability rose
The pattern of atmospheric stability at the site is readily shown by means of a stability rose. The
annual average stability rose formed from the Sydney Airport meteorological data is illustrated in
Figure 5-2.
It is apparent that the dominant directions of poor dispersion (stability categories E and F) are
from the west and northwest. These directions reflect the nocturnal cool air drainage flows in the
Sydney basin. This directional dominance is similar to the wind rose whereby these westerly
azimuths were identified as the dominant wind flow regime during winter months.
It is therefore evident that stable westerly flows are the meteorological conditions representing
worst-case atmospheric (poor) dispersal. However, the quantity of sensitive receptors to the
east of the facility is reduced due to the proximity of the South Pacific Ocean and as such
potential large-scale impact in the region is tempered.
5.4 Seasonal meteorology
5.4.1 Seasonal wind patterns
It is apparent from Figure 5-3 that spring, autumn and winter show distinctive westerly flows;
with reduced frequency north-easterly and southerly winds in the case of spring and autumn.
This contrasts with summer where the westerlies present in the other three seasons are
reduced markedly in frequency together with an increase in frequency of the southerly and
north-easterly components.
Summer shows the highest mean wind speed (4.8 m/s) whereas the remaining seasons show a
value considerably lower (3.1 to 4.0 m/s).

GHD | Report for Puma Energy Australia - Botany PMB and CRMB Project, 12533800 | 20
Summer Autumn
Winter Spring
Figure 5-3 Seasonal wind roses, Sydney Airport
5.4.2 Seasonal stability patterns
It is apparent that the dominant directions of poor dispersion in Figure 5-4 (stability categories E
and F) display a seasonal variation. The dominant direction of poor dispersion drainage flows
during spring, autumn and winter is to the east and southeast (~10 to 15% occurrence), and this
is aligned with the predominantly westerly winds at such times of the year. A southerly and
north-easterly wind direction component showing stable conditions is also evident for spring and
autumn albeit of a reduced frequency – these directions indicating poor dispersion towards the
north and southwest.
Summer displays a reduced frequency of stable categories E and F (~7% occurrence) with
dominance from the south and northeast – this change in directional dominance reflecting the
increased number of easterlies.
It is evident that stable westerly flows are the meteorological conditions representing worst-case
atmospheric (poor) dispersal predominantly during the spring, summer and winter seasons.

GHD | Report for Puma Energy Australia - Botany PMB and CRMB Project, 12533800 | 21
Summer Autumn
Winter Spring
Figure 5-4 Seasonal stability roses, Sydney Airport

GHD | Report for Puma Energy Australia - Botany PMB and CRMB Project, 12533800 | 22
6. Air quality assessment 6.1 Assessment overview
Dispersion modelling was conducted in accordance with the Approved Methods to predict the
maximum ground level concentrations resulting from emissions to air from the proposal. The
predicted ground level concentrations were assessed against the air quality assessment criteria.
This section describes selection of the dispersion model, model input, air quality design criteria
and model scenarios.
6.2 Dispersion modelling
The plume dispersion model AUSPLUME (version 6.0) is the model approved by the Approved
Methods for predicting the effects of industrial emissions on air quality. This model is a steady-
state Gaussian plume model that can be used to predict off-site pollutant concentrations for a
wide variety of sources. Features of the model include: ability to model building downwash (the
effect of buildings in causing a plume to be brought down to ground level); area, line and
volume sources; plume rise as a function of downwind distance; arbitrary orientation of sources;
and terrain adjustment. AUSPLUME was selected as the appropriated dispersion model for use
in this assessment.
6.3 Model Configuration
AUSPLUME was configured to represent the sources in the proposed bitumen storage facility
and make best use of the measured emissions and meteorological data.
Emissions from the combustor stack and hot oil heater stack were modelled as point sources.
Building wake effects were included, with characteristic storage tank dimensions determined by
inspection of a plan of the site and the Building Profile Input Program (BPIP) module within the
AUSPLUME model was used to generate the characteristic dimensions for each 10-degree
wind-directional arc. For wind directions where the potential for building wake influences were
considered significant by AUSPLUME, the PRIME building wake algorithm is used to provide a
conservative estimate of ground level concentrations.
Key components of the model configurations are summarised below:
Ground level concentrations were predicted over a 2 km square Cartesian receptor grid,
centred over the site with a grid resolution of 50 m;
Averaging period of 1 hour was selected for all pollutants. An additional run using an
average period of 10 minute was conducted for sulfur dioxide;
Given that Port Botany is relatively flat and the model domain of interest is confined to the
near-field (eg. site boundary), the effects of terrain on dispersion were considered
negligible and were not included in this assessment;
Irwin’s “Urban” wind profile exponents were used;
Horizontal dispersion was parameterised according to equations for the Pasquill-Gifford
curves; and
A roughness height of 0.8 m was used to represent the site.
A peak to mean factor of 2.3 was applied to the one hour averaged predicted odour
concentrations to account for a one second averaged impact

GHD | Report for Puma Energy Australia - Botany PMB and CRMB Project, 12533800 | 23
6.4 Emissions source configuration
Dispersion model was undertaken to predict pollutant concentrations from the worst case
operational scenario. The scenario assumed all activities with potential to release emissions to
air would occur simultaneously. The scenario contained emissions from:
the unloading of bitumen from the ship
the transfer of bitumen into the PMB/CRMB mixing tanks (including the addition of sulfur
during PMB batch mixing and resulting emissions) and
the loading of bitumen into two road tankers.
The headspace emissions from the ship unloading and road tanker loading were ducted to the
Terminals combustor. The headspace emissions from the transfer of bitumen into the
PMB/CRMB mixing tanks and addition of sulfur were additionally ducted to the same Terminals
combustor. The hot oil heater was located near the Terminals combustor. The modelled source
parameters and location are presented in Table 6-1.
It is understood that the combustor is often operated below is maximum design capacity,
resulting in lower combustion product emissions (calculated in Table 4-2) and a lower exhaust
flowrate. To account for worst case operating conditions, pollutants have been modelled with
their corresponding worst case stack properties. Pollutants from tank and road tanker
headspace (emission rates shown in Table 4-1) have been model to exit the combustor stack at
a more realistic flowrate of 8 m3/s which results in a lower velocity and poorer dispersion.
Combustion products (emission rates shown in Table 4-2) have been modelled to occur at the
combustors maximum design capacity with a flowrate of 14 m3/s. This results in the maximum
production of combustion products.
Table 6-1 Model source parameters
Parameter Terminals
Source Combustor Hot oil heater
Co-ordinates (x,y) UTM (m) 335432, 6238948 335438, 6238959
Stack height (m) 17.3 10
Stack diameter (m) 0.95 0.7
Exhaust discharge velocity
(m/s)
11.3a 20b 15
Flow rate (m3/s) 8a 14b 5.8
Exhaust discharge
temperature (⁰C)
825 200
a. Flowrate and velocity used to model tank and road tanker headspace pollutants (corresponds with worst case measured minimum flows that may lead to maximum emissions)
b. Flowrate and velocity used to model combustion products from the combustor (corresponds with maximum design flows and worst case total emissions)

GHD | Report for Puma Energy Australia - Botany PMB and CRMB Project, 12533800 | 24
7. Predicted impacts 7.1 Overview
Dispersion modelling was conducted for the worst-case pollutants emitted from the Puma and
Terminals sites. The model was used to predicted ground level pollutant concentrations at each
of the sensitive receptors and the maximum on and off-site concentration (calculated via a
Cartesian receptor grid). Both incremental (concentrations predicted as a direct result of on-site
activities) and cumulative (predicted incremental concentration plus background concentration)
pollutant concentrations were calculated. The predicted ground level concentrations of each
pollutant was assessed against its impact assessment criteria. No incremental or cumulative
exceedances were predicted.
7.2 Odour
The peak on and off-site 99th percentile ground level odour concentration was 0.3 OU. Odour
results are presented in Table 7-1 and Figure 7-1.
Table 7-1 Predicted odour concentrations (99th percentile, 1 second averaged)
Pollutant Averaging
period
Predicted
concentration (99th
percentile, OU)
Assessment
criteria (OU)
Compliant Compliance
factor
Odour 1 second 0.34 2 Yes 5.9
1.1 Sulfur dioxide
The predicted 10 minute, 1 hour, 24 hour and annual averaged sulfur dioxide concentration
were modelled as it was identified as a key pollutant with significant emissions during PMB
batch mixing. It should be noted that sulfur addition (which causes higher sulfur dioxide
emissions) only occurs during PMB batch mixing and not during CRMB batch mixing. However
the higher sulfur dioxide emission was modelled to occur from all tanks to account for the worst
case scenario. It is understood that Puma intends to complete a maximum of four mixing loads
(additions of sulfur) per day. The predicted impacts were conservatively modelled assuming
constant 24 hourly emission rates. As a result, the predicted sulfur dioxide concentration
accounts for all possible worst case dispersion scenarios.
The predicted incremental and cumulative sulfur dioxide concentrations at all receptors are
presented in Table 7-2. Cumulative sulfur dioxide concentrations were calculated using the
adopted background concentrations discussed in Section 2.3. Background 10 minute averaged
sulfur dioxide concentrations were not available from the DPIE monitoring stations, therefore
background 1 hour data was used in the cumulative 10 minute assessment.
Contour plots of predicted increment sulfur dioxide concentrations are provided in Figure 7-2
and Figure 7-3 for 10 minute and 1 hourly averaging time periods respectively.

GHD | Report for Puma Energy Australia - Botany PMB and CRMB Project, 12533800 | 25
Table 7-2 Predicted sulfur dioxide concentrations
Receptor Predicted incremental SO2
concentration (100th percentile,
µg/m3)
Predicted cumulative SO2
concentration (100th percentile,
µg/m3)
Pollutant averaging period 10
minute
1 hour 24
hour
Annual 10
minute
1 hour 24
hour
Annual
Assessment criteria (µg/m3) 712 570 228 60 712 570 228 60
Philip bay residential area 83.6 47.9 14.7 3.5 172.7 136.9 35.6 6.3
Yarra Bay Bicentennial Park 83.1 47.4 16.2 3.7 172.2 136.5 37.2 6.4
Yarra Recreation reserve 73.6 44.7 12.8 3.1 162.6 133.7 33.8 5.9
Botany cemetery 72.5 40.5 13.3 1.6 161.5 129.5 34.3 4.3
Matraville residential area 67.1 40.6 9.3 0.9 156.2 129.7 30.3 3.6
Botany residential area 87.4 48.9 6.4 0.6 176.5 138.0 27.3 3.4
7.3 Benzene
Benzene was modelled as it was identified at the critical pollutant with the least margin of
compliance that originated from tank headspace (refer Section 4.4).
The maximum on and off-site 99.9th percentile 1 hour averaged benzene concentration is
presented in Table 7-3. Contour plots of predicted increment benzene concentrations are
provided in Figure 7-4.
Table 7-3 Predicted Benzene concentrations
Pollutant Averaging
period
Predicted
concentration
(99.9th percentile,
mg/m3)
Assessment
criteria (mg/m3)
Compliant Compliance
factor
Benzene 1 hour 0.000011 0.029 Yes 2,661
7.4 Other toxics
It should be noted that the other toxic pollutants identified were not separately modelled as the
emission metric for these constituents were low. The maximum on and off-site concentrations of
these other toxic pollutants was calculated based on benzene mass flowrate and predicted
benzene concentration.
Table 7-4 gives the predicted peak levels for each toxic pollutant. All toxic pollutants are
predicted to comply with the assessment criteria with significant compliance factors.

GHD | Report for Puma Energy Australia - Botany PMB and CRMB Project, 12533800 | 26
Table 7-4 Toxic pollutant concentrations (99.9th percentile, 1 hour averaged)
Pollutant Averaging
period
Predicted
concentration
(99.9th
percentile,
mg/m3)
Assessment
criteria (mg/m3)
Compliant Compliance
factor
Toluene 1 hour 0.000012 0.36 Yes 30,146
Xylene 1 hour 0.000016 0.19 Yes 12,221
Trimethyl-
benzene
1 hour 0.000015 2.2 Yes 146,871
Chloromethane 1 hour 0.00000018 1.9 Yes 10,804,718
Acetone 1 hour 0.000042 22 Yes 522,468
Ethyl Benzene 1 hour 0.00000019 8 Yes 42,361,376
7.5 Nitrogen dioxide
Nitrogen dioxide was modelled as it was identified at the critical pollutant with the least margin
of compliance that originated from combustion in the hot oil heater and combustor (refer Section
4.4).
The predicted incremental and cumulative 1 hour and annually averaged nitrogen dioxide
concentrations at each receptor are presented in Table 7-5. Cumulative nitrogen dioxide
concentrations were calculated using the adopted background concentrations discussed in
Section 2.3.
A contour plot presenting the incremental nitrogen dioxide concentration is provide in Figure
7-5.
Table 7-5 Predicted nitrogen dioxide concentrations (100th percentile, 1 hour averaged)
Receptor Predicted incremental
concentration (100th percentile,
µg/m3)
Predicted cumulative concentration
(100th percentile, µg/m3)
Pollutant averaging period 1 hour Annual 1 hour Annual
Assessment criteria (µg/m3) 246 62 246 62
Philip bay residential area 3.8 0.17 129.8 20.5
Yarra Bay Bicentennial Park 4.2 0.19 130.2 20.5
Yarra Recreation reserve 3.9 0.15 129.9 20.4
Botany cemetery 3.6 0.08 129.6 20.4
Matraville residential area 2.8 0.01 128.8 20.3
Botany residential area 2.9 0.02 128.9 20.3

GHD | Report for Puma Energy Australia - Botany PMB and CRMB Project, 12533800 | 27
7.6 Other constituents
It should be noted that other constituent pollutants identified were not separately modelled as
the emission metric for these constituents were low. The expected concentrations of these
constituent pollutants was estimated using the mass flowrate and predicted concentration of the
modelled pollutants (benzene and nitrogen dioxide). Constituent pollutant concentrations were
estimated using results for the averaging period and percentile that correspond to the
constituent pollutants assessment criteria.
Carbon monoxide and PM10 concentrations were estimated using the predicted nitrogen dioxide
concentration and mass flowrate. PAH emissions are present from both tank headspace and
combustion emissions sources. Consequently predicted PAH concentration calculations were
based off both benzene and NO2 flowrates and predicted concentrations.
Table 7-6 gives the predicted peak on and off-site concentrations for each pollutant. All
pollutants are predicted to comply with the assessment criteria.
The predicted cumulative 24 hour and annual PM10 has a low compliance factor. This is
primarily attributed to high PM10 background concentrations as background concentrations
account for 88.2% of the 24 hour PM10 criteria and 71.8% of the annual PM10 criteria.
Table 7-6 Peak on and off-site constituent pollutant concentrations
Pollutant Averaging
period and
percentile
Predicted concentration (µg/m3) Criteria
(µg/m3)
Compliant Compliance
factor Incremental Cumulative
Carbon
monoxide
1 hour,
100th
percentile
69.1 1564.1 30000 Yes 19.2
PM10 24 hour,
100th
percentile
3.0 45.9 50 Yes 1.1
Annual,
100th
percentile
0.4 18.0 25 Yes 1.4
PAHs 1 hour,
99.9th
percentile
0.0005 0.0005 0.4 Yes 783.3

!(
!(
!(
!(!(
!(
!
Site B
Botanyresidentialarea
Matravilleresidentialarea
Phillip Bayresidentialarea
YarraBay BicentennialPark
Yarra RecreationReserve
BotanyCemetery
© Department of Customer Service 2020
Figure 7-1
Job Number
Revision A
21-27357
N:\AU\Sydney\Projects\21\27357\GIS\Maps\Deliverables\21_27357_Z005_BSO2Contours_SMA.mxd
Map Projection: Transverse Mercator
Horizontal Datum: GDA 1994
Grid: GDA 1994 MGA Zone 56
0 100 200 300 400
Metres o© 2020. Whilst every care has been taken to prepare this map, GHD (and DATA CUSTODIAN) make no representations or warranties about its accuracy, reliability, completeness or suitability for any particular purpose and cannot accept liability and responsibility of any kind
(whether in contract, tort or otherwise) for any expenses, losses, damages and/or costs (including indirect or consequential damage) which are or may be incurred by any party as a result of the map being inaccurate, incomplete or unsuitable in any way and for any reason.
Date 15 Sep 2020
Puma Energy Australia
Botany PMB Project
Predicted incremental odour impact(1 second averaged, OU)
Data source: Aerial Imagery: Sixmaps Created by:kschroder-turner
Level 15, 133 Castlereagh Street Sydney NSW 2000 T 61 2 9239 7100 F 61 2 9239 7199 E [email protected] W www.ghd.com.au
Paper Size A4
DRAFT
LEGENDOdour Contours (OU)
0.1
0.2
0.3
!( Sensitive receivers
Puma Energy Site
Terminal Site B

!(
!(
!(
!(!(
!(
!
Site B
Botanyresidentialarea
Matravilleresidentialarea
Phillip Bayresidentialarea
YarraBay BicentennialPark
Yarra RecreationReserve
BotanyCemetery
Figure 7-2
Job Number
Revision A
21-27357
N:\AU\Sydney\Projects\21\27357\GIS\Maps\Deliverables\21_27357_Z005_BSO2Contours_SMA.mxd (SMA record: 2)
Map Projection: Transverse Mercator
Horizontal Datum: GDA 1994
Grid: GDA 1994 MGA Zone 56
0 100 200 300 400
Metres
LEGEND
o© 2018. Whilst every care has been taken to prepare this map, GHD (and DATA CUSTODIAN) make no representations or warranties about its accuracy, reliability, completeness or suitability for any particular purpose and cannot accept liability and responsibility of any kind
(whether in contract, tort or otherwise) for any expenses, losses, damages and/or costs (including indirect or consequential damage) which are or may be incurred by any party as a result of the map being inaccurate, incomplete or unsuitable in any way and for any reason.
Date 12 Oct 2018
Puma Energy Australia
Botany PMB Project
Predicted incremental sulfur dioxide impact (10 minute averaged, µg/m3)
Data source: Aerial Imagery: Sixmaps Created by:mweber
Level 15, 133 Castlereagh Street Sydney NSW 2000 T 61 2 9239 7100 F 61 2 9239 7199 E [email protected] W www.ghd.com.au
Paper Size A4
DRAFT
!( Sensitive receivers
Puma Energy Site
Terminal Site B
Sulfur Dioxide Contours (µg/m3 per Hour)250
500
712

!(
!(
!(
!(!(
!(
!
Site B
Botanyresidentialarea
Matravilleresidentialarea
Phillip Bayresidentialarea
YarraBay BicentennialPark
Yarra RecreationReserve
BotanyCemetery
Figure 7-3
Job Number
Revision A
21-27357
N:\AU\Sydney\Projects\21\27357\GIS\Maps\Deliverables\21_27357_Z005_BSO2Contours_SMA.mxd (SMA record: 3)
Map Projection: Transverse Mercator
Horizontal Datum: GDA 1994
Grid: GDA 1994 MGA Zone 56
0 100 200 300 400
Metres
LEGEND
o© 2018. Whilst every care has been taken to prepare this map, GHD (and DATA CUSTODIAN) make no representations or warranties about its accuracy, reliability, completeness or suitability for any particular purpose and cannot accept liability and responsibility of any kind
(whether in contract, tort or otherwise) for any expenses, losses, damages and/or costs (including indirect or consequential damage) which are or may be incurred by any party as a result of the map being inaccurate, incomplete or unsuitable in any way and for any reason.
Date 12 Oct 2018
Puma Energy Australia
Botany PMB Project
Predicted incremental sulfur dioxide impact (1 hour averaged, µg/m3)
Data source: Aerial Imagery: Sixmaps Created by:mweber
Level 15, 133 Castlereagh Street Sydney NSW 2000 T 61 2 9239 7100 F 61 2 9239 7199 E [email protected] W www.ghd.com.au
Paper Size A4
DRAFT
!( Sensitive receivers
Puma Energy Site
Terminal Site B
Sulfur Dioxide Contours (µg/m3 per Hour)250
570

!(
!(
!(
!(!(
!(
!
Site B
Botanyresidentialarea
Matravilleresidentialarea
Phillip Bayresidentialarea
YarraBay BicentennialPark
Yarra RecreationReserve
BotanyCemetery
Figure 7-4
Job Number
Revision A
21-27357
N:\AU\Sydney\Projects\21\27357\GIS\Maps\Deliverables\21_27357_Z005_BSO2Contours_SMA.mxd (SMA record: 4)
Map Projection: Transverse Mercator
Horizontal Datum: GDA 1994
Grid: GDA 1994 MGA Zone 56
0 100 200 300 400
Metres
LEGEND
o© 2018. Whilst every care has been taken to prepare this map, GHD (and DATA CUSTODIAN) make no representations or warranties about its accuracy, reliability, completeness or suitability for any particular purpose and cannot accept liability and responsibility of any kind
(whether in contract, tort or otherwise) for any expenses, losses, damages and/or costs (including indirect or consequential damage) which are or may be incurred by any party as a result of the map being inaccurate, incomplete or unsuitable in any way and for any reason.
Date 12 Oct 2018
Puma Energy Australia
Botany PMB Project
Predicted incremental benzene impact (1 hour averaged, µg/m3)
Data source: Aerial Imagery: Sixmaps Created by:mweber
Level 15, 133 Castlereagh Street Sydney NSW 2000 T 61 2 9239 7100 F 61 2 9239 7199 E [email protected] W www.ghd.com.au
Paper Size A4
DRAFT
!( Sensitive receivers
Puma Energy Site
Terminal Site B
Benzene Contours (µg/m3 per Hour)0.005
0.01

!(
!(
!(
!(!(
!(
!
Site B
Botanyresidentialarea
Matravilleresidentialarea
Phillip Bayresidentialarea
YarraBay BicentennialPark
Yarra RecreationReserve
BotanyCemetery
Figure 7-5
Job Number
Revision A
21-27357
N:\AU\Sydney\Projects\21\27357\GIS\Maps\Deliverables\21_27357_Z005_BSO2Contours_SMA.mxd (SMA record: 5)
Map Projection: Transverse Mercator
Horizontal Datum: GDA 1994
Grid: GDA 1994 MGA Zone 56
0 100 200 300 400
Metres
LEGEND
o© 2018. Whilst every care has been taken to prepare this map, GHD (and DATA CUSTODIAN) make no representations or warranties about its accuracy, reliability, completeness or suitability for any particular purpose and cannot accept liability and responsibility of any kind
(whether in contract, tort or otherwise) for any expenses, losses, damages and/or costs (including indirect or consequential damage) which are or may be incurred by any party as a result of the map being inaccurate, incomplete or unsuitable in any way and for any reason.
Date 12 Oct 2018
Puma Energy Australia
Botany PMB Project
Predicted incremental nitrogen dioxide impact (1 hour averaged, µg/m3)
Data source: Aerial Imagery: Sixmaps Created by:mweber
Level 15, 133 Castlereagh Street Sydney NSW 2000 T 61 2 9239 7100 F 61 2 9239 7199 E [email protected] W www.ghd.com.au
Paper Size A4
DRAFT
!( Sensitive receivers
Puma Energy Site
Terminal Site B
Nitrogen Dioxide Contours (µg/m3 per Hour)10
20
40

GHD | Report for Puma Energy Australia - Botany PMB and CRMB Project, 12533800 | 33
8. Conclusion and recommendations GHD conducted an air quality assessment for Puma Energy’s proposed PMB and CRMB
production facility at the existing Terminals site.
Emission rates used in the assessment were based on sampling of similar facilities in Australia.
Air quality dispersion modelling was undertaken in accordance with the Approved Methods to
predict pollutant concentrations at sensitive receptor locations and maximum on sampling grid
concentrations.
The modelling was undertaken using AUSPLUME for the critical pollutants (highest ranked
pollutants based on their emission rate with respect to compliance criteria). The critical
pollutants were found to be odour, sulfur dioxide, benzene and nitrogen dioxide.
The assessment identified that all pollutants were predicted to comply with their assessment
criteria with significant compliance factors.

GHD | Report for Puma Energy Australia - Botany PMB and CRMB Project, 12533800
Appendices

GHD | Report for Puma Energy Australia - Botany PMB and CRMB Project, 12533800 | 35
Appendix A – Proposal narrative functional description and process flow diagram

Puma Energy (Australia) Pty Ltd
UGL A.B.N. 17 114 888 201 Level 6, 1 Southbank Boulevard, Southbank, Australia, 3006 Internet: www.ugllimited.com Page 1 of 54
Specification
Document Number: PB2036-2000-ELE-FDE-001-A Title NARRATIVE FUNCTIONAL DESCRIPTION
Project Name: Sydney - Botany Bay Bitumen
Project Number: PB2036 Client: PUMA SYNOPSIS This specification outlines the minimum mandatory requirements for Engineering and Design of the work performed on Automation and Control Systems within the Sydney Terminal, for the Botany Bay Bitumen project.
B 15.05.2020 Re-issued for review J. Crombi M.Bhavsar A. Ghelichi
A 10.12.2019 Issued for Review M.Bhavsar A. Ghelichi B. Tahmaseby
REV DATE DESCRIPTION PREPARED REVIEWED APPROVED

Page 2 of 54
Narrative Functional Description
No.: PB2036-2000-ELE-FDE-001 Rev: B
Date: 15/05/2020
Table of Contents
GENERAL ............................................................................................ 4
1.1 Introduction ................................................................................................................. 4
1.2 Project Scope .............................................................................................................. 5
REFERENCE DOCUMENTS ............................................................... 6
EQUIPMENT DETAILS ........................................................................ 8
3.1 Major Equipment ......................................................................................................... 8
3.2 Instrumentation and Status ....................................................................................... 9
3.3 Motor Drives and interlocks .................................................................................... 12
3.4 Valves and Interlocks ............................................................................................... 14
EMERGENCY STOPS AND FAULTS ................................................17
STORAGE TANKS (T4000 & T4100) SYSTEM .................................18
5.1 System Description .................................................................................................. 18
5.2 Operational Sequences ............................................................................................ 20
MIX TANKS (T4200) SYSTEM ...........................................................22
6.1 System Description .................................................................................................. 22
6.2 Operational Sequences ............................................................................................ 24
6.3 Shredder Operation .................................................................................................. 28
6.4 Tank Heating ............................................................................................................. 37
STORAGE TANKS (T4600 & T4700) SYSTEM .................................37
7.1 System Description .................................................................................................. 37
7.2 Operational Sequences ............................................................................................ 39
PUMP (P4300 & P4400) TRANSFER/LOADOUT SYSTEM ..............39
8.1 System Description .................................................................................................. 39
8.2 Operational Sequences ............................................................................................ 42

Page 3 of 54
Narrative Functional Description
No.: PB2036-2000-ELE-FDE-001 Rev: B
Date: 15/05/2020
HOT OIL SYSTEM ..............................................................................45
9.1 System Description .................................................................................................. 45
9.2 Operational Sequences ............................................................................................ 45
SOUR GAS SYSTEM .........................................................................46
10.1 System Description .................................................................................................. 46
10.2 Operational Sequences ............................................................................................ 48
UTILITIES ...........................................................................................53
11.1 Air ............................................................................................................................... 53
11.2 Water .......................................................................................................................... 54
11.3 Lighting ...................................................................................................................... 54
APPENDICES .....................................................................................54

Page 4 of 54
Narrative Functional Description
No.: PB2036-2000-ELE-FDE-001 Rev: B
Date: 15/05/2020
GENERAL
1.1 Introduction
The purpose of this document is to describe the intended operation of the new Polymer Modified Bitumen (PMB) and Crumbed Rubber Modified Bitumen (CRMB) production facility being commissioned at the existing Puma Bitumen Import Facility at Port Botany in Sydney. The key functions of the new PMB/CRMB plant are:
• Receipt, storage, handling and transfer of polymer binder or other solid bitumen modifiers;
• Blending of polymer/modifiers, C170 bitumen and Extract Oil to produce PMB;
• Blending of crumbed rubber, C170 Bitumen;
• PMB sampling and storage;
• CRMB sampling and storage
• Transfer of PMB/CRMB between tanks;
• Load out of PMB/CRMB to the existing road gantry.
A separate Process Control System (PCS) shall be installed to operate the PMB manufacturing area. The PCS controls and monitors automation activities within the PMB plant, it also interfaces with the ESD system and the PCS for the existing Bitumen Import Facility.
An Emergency Shutdown (ESD) System will be provided to stop all product flow in the event of an emergency. The ESD is a separate hardwired system designed to shut down equipment in a safe mode.
A simplified SCADA (or other system) will be designed and installed to meet the control functions for the facility. Tank inventory management software (Entis or TankMaster) will be used to monitor tank levels and set alarms. This document is a guide to understanding the required functionality.
The SCADA will automate most of the PMB plant functions, with the exception of the solids material handling. This will be a manual operation with local control pendants provided to the Operator. Where possible, existing control configuration and functionality from the existing bitumen facility shall be replicated to the rest of the PMB plant where there are similarities in operation e.g. mixing, transfer, and load out activities. Replication of the controls at the user level and configuration level is desirable to provide consistency in the operation of the new and existing plant.
Reference should be made to the Functional Description documents for the Bitumen Import Facility to understand the control requirements of the PMB plant

Page 5 of 54
Narrative Functional Description
No.: PB2036-2000-ELE-FDE-001 Rev: B
Date: 15/05/2020
and how they can be best integrated into the existing control system. These documents are referenced in Section 3.0.
1.2 Project Scope
Puma currently operates a bitumen import, storage and distribution facility located within Port Botany in New South Wales. The bitumen facility primarily stores and loads out C170 and C320 grades of bitumen and has the capability to oxidise these grades to higher viscosities as required.
The purchase of the BP bitumen business included formulas for the Olexobit range of Polymer Modified Bitumen (PMB) for which Puma has now found a ready market. In order to meet the PMB market – a significant quantity of which is centred on NSW – a new PMB manufacturing facility is required in NSW. The new PMB plant comprises the following main systems and equipment:
• 1 x 50T heated/insulated blend tank including high sheer mixer/shredder for the manufacture of all PMB/CRMB grades .
• 2 x 100T heated and insulated storage tanks complete with mixers to hold finished PMB/CRMB
• 1 x 50T heated and insulated Extract oil storage tank
• 1 x 100T heated and insulated buffer tank for the storage of C170 grade bitumen – this tank is required to cover periods when bitumen from the existing facility is not available (e.g. during tank ship discharges). Base grade C170 bitumen will be transferred from the main facility using the existing transfer pumps and heat exchangers.
• Heating for the PMB facility – The existing site hot oil heaters are rated at 2 x 3000 KW – the PMB plant heating required is relatively small therefore utilizing the existing heaters should be possible. Heat metering will be required to enable additional gas usage to be monitored.
• Hot oil circulation for both tank heating and tracing in the PMB area will utilise the existing pumps.
• Bulk materials handling system for polymer, Buna, wax and sulphur loading into batch tank – conveyor type.
• Loading and transfer pumps
• Homogeniser – 1 x 60T/hr capacity
• PMB loading capability – Propose to use existing gantry and loading arms with product line tie in located as close to the loading arm as possible.
• Sour gas system linked to all tanks. A vapour incinerator already exists which generally runs well below its design capacity as the existing plant normally generates much lower gas volumes. The vapour combustor is capable of handling the additional vapour flow generated by the PMB

Page 6 of 54
Narrative Functional Description
No.: PB2036-2000-ELE-FDE-001 Rev: B
Date: 15/05/2020
plant but may require production scheduling at times when the existing blowing plant is producing maximum vapour flow.
Refer to Section 2 for a complete list of relevant drawings, P&IDs and Control Functionality Table.
1.3 Definitions
Abbreviations, acronyms, and other terminology used in this document are defined in the table below:
Abbreviation Definition
BLC Bay Load Controller
CRMB Crumbed Rubber Modified Bitumen
ESD Emergency Shutdown
MCC Motor Control Centre
MOC Management of Change
PCS Process Control System
PLC Programmable Logic Controller
PMB Polymer Modified Bitumen
SCADA Supervisory Control & Data Acquisition
TTLR Tanker Truck Loading Rack
VSD Variable Speed Drive
Reference Documents
The following documents are referenced by this report:
Document no. Document Title Rev
2036-R-0001 PFD – Botany Bay PMB Production Facility 0
2036-Q-0001 P&ID – Botany Bay PMB Production Facility Storage Tanks 0B
2036-Q-0002 P&ID – Botany Bay PMB Production Facility Mix Tanks 0C

Page 7 of 54
Narrative Functional Description
No.: PB2036-2000-ELE-FDE-001 Rev: B
Date: 15/05/2020
Document no. Document Title Rev
2036-Q-0003 P&ID – Botany Bay PMB Production Facility Tankfarm & Pump 0B
2036-Q-0005 P&ID – Botany Bay PMB Production Facility Tankfarm & Pump 0A
2036-Q-0006 P&ID – Botany Bay PMB Production Facility Gantry 0A
2036-Q-0007 P&ID – Botany Bay PMB Production Facility Hot Oil System 0A
2036-Q-0008 P&ID – Botany Bay PMB Production Facility Hot Oil System 0A
2036-Q-0010 see P&ID 218533-PI-19 below
2036-Q-0011 P&ID – Botany Bay PMB Production Facility Material Handling System
0A
2036-Q-0012 P&ID – Botany Bay PMB Production Facility High Temperature Heating Oil Loop refer 218533-PI-22 below
0
218533-PI-09 P&ID – Port Botany Bitumen Import Facility Day Tanks Manifold 4
218533-PI-10 P&ID – Port Botany Bitumen Import Facility Tanker Loading Bays
7
218533-PI-11 P&ID – Port Botany Bitumen Import Facility Batch Process Check Tank Manifold
7
218533-PI-12 P&ID – Port Botany Bitumen Import Facility T281 Batch Process Tank
2
218533-PI-13 P&ID – Port Botany Bitumen Import Facility T282 Batch Process Tank
2
218533-PI-19 P&ID – Port Botany Bitumen Import Facility Bitumen Vapour Combustion – Sheet 2
2
218533-PI-22 P&ID – Port Botany Bitumen Import Facility High Temperature Heating Oil Loop
2
218533-P-FD001 Narrative Functional Description Port Botany Bitumen Import Facility
4
218533-P-FD005 Combustor Vapour Ducting Narrative Functional Description
1
218533-P-FD100 Bitumen Facility Emergency Shutdown Sequences 0

Page 8 of 54
Narrative Functional Description
No.: PB2036-2000-ELE-FDE-001 Rev: B
Date: 15/05/2020
Equipment Details
This section lists the major equipment, instrumentation, motor drives and valves that will be installed as part of the PMB Production Facility. When reading the operational sequence descriptions that are described in the subsequent sections of this document, reference should be made back to these equipment details
3.1 Major Equipment
Equipment No. Equipment Type Function
T4000 Storage Tank Storage of Bitumen C170
T4100 Storage Tank Storage of Extract Oil
T4200 Batch Tank PMB/CRMB Batch Mixing Tank
T4600 Storage Tank PMB/CRMB Storage
T4700 Storage Tank PMB/CRMB Storage
P4000 Pump C170 Transfer Pump
P4100 Pump Extract Oil Unloading/Transfer Pump
P4200 Pump Transfer Pump
P4300 Gantry Pump Loadout PMB/CRMB from storage tank to Gantry Bay 1 or 2
P4400 Gantry Pump Loadout PMB/CRMB from storage tank to Gantry Bay 1 or 2
H4200 Homogeniser
M4200 Shredder
A4600 Mixer Mix contents of T4600
A4700 Mixer Mix contents of T4700
K4200/K4201 P4200 Strainer Capture foreign matter at P4200 suction
K4600/K4601 P4400 Strainer Capture foreign matter at P4400 suction
K4700/K4701 P4300 Strainer Capture foreign matter at P4300 suction

Page 9 of 54
Narrative Functional Description
No.: PB2036-2000-ELE-FDE-001 Rev: B
Date: 15/05/2020
SSB-4000 P4000 Strainer Capture foreign matter at P4000 suction
SSB-4100 P4100 Strainer Capture foreign matter at P4100 suction
SP4000 KO Pot Separate carryover liquid in vapour stream to combustor
SP4001 Venturi System For conveying solids
H4000 Hopper For storing solids
3.2 Instrumentation and Status
Instrument Description Low-Low
Alarm Low Alarm High Alarm
High-High
Alarm
Set Point
LIT-4000 T4000 Level (mm) 2197 Note 3
2297 Note 4
11875 Note 1
12315 Note 2
-
LIT-4001 T4000 Level (mm) 2197 Note 3
2297 Note 4
11875 Note 1
12315 Note 2
-
LIT-4100 T4100 Level (mm) 2143 Note 3
2243 Note 4
11056 Note 1
11970 Note 2 -
LIT-4101 T4100 Level (mm) 2143
Note 3 2243 Note 4
11056 Note 1
11970 Note 2
-
LIT-4200 T4200 Level (mm) 2217
Note 5 2317 Note 6
5130 Note 1
5415 Note 2
-
LIT-4201 T4200 Level (mm) 2217
Note 5 2317 Note 6
5130 Note 1
5415 Note 2
-
LIT-4600 T4600 Level (mm) 2197
Note 3 2297 Note 4
11875 Note 1
12315 Note 2
-
LIT-4601 T4600 Level (mm) 2197 Note 3
2297 Note 4
11875 Note 1
12315 Note 2
-
LIT-4700 T4700 Level (mm) 2197 Note 3
2297 Note 4
11875 Note 1
12315 Note 2
-
LIT-4701 T4700 Level (mm) 2197 Note 3
2297 Note 4
11875 Note 1
12315 Note 2
-
TIT-4000 T4000 Temperature 1 (°C) 170.0 180.0 195 200 190.0
TIT-4001 T4000 Temperature 2 (°C) 170.0 180.0 195 200 190.0
TIT-4002 C170 Feed Temperature (°C) 170.0 180.0 N/A N/A -

Page 10 of 54
Narrative Functional Description
No.: PB2036-2000-ELE-FDE-001 Rev: B
Date: 15/05/2020
Instrument Description Low-Low
Alarm Low Alarm High Alarm
High-High
Alarm
Set Point
TIT-4002 T4000 C170 Inlet Temperature (°C) 140 150
TIT-4003 C170 Feed Temperature (°C)
TIT-4100 T4100 Temperature 1 (°C) 80.0 90.0 120.0 130.0 110.0
TIT-4101 T4100 Temperature 2 (°C) 80.0 90.0 120.0 130.0 110.0
TIT-4102 Extract Oil Temperature (°C) 80.0 90.0 120.0 130.0 -
TIT-4200 T4200 Temperature 1 (°C) 170.0 180.0 195.0 200.0 190.0
TIT-4201 T4200 Temperature 2 (°C) 170.0 180.0 195 200 190.0
TIT-4600 T4600 Temperature 1 (°C) 170.0 180.0 195 200 190.0
TIT-4601 T4600 Temperature 2 (°C) 170.0 180.0 195 200 190.0
TIT-4700 T4700 Temperature 1 (°C) 170.0 180.0 195 200 190.0
TIT-4701 T4700 Temperature 2 (°C) 170.0 180.0 195 200 190.0
TIT-4800 Gantry Bay 2 Temperature (°C) N/A N/A 195 200 -
TIT-4801 Gantry Bay 1 Temperature (°C) N/A N/A 195 200 -
PIT-4000 P4000 Discharge Pressure (kPag) N/A N/A 750 800 450
DPIT-4000 P4000 Suction Strainer DP 0.0 0.0 20.0 25.0 -
PIT-4100 P4100 Discharge Pressure (kPag) N/A N/A 750 800 450
DPIT-4100 P4100 Suction Strainer DP 0.0 0.0 20.0 25.0 -
PIT-4201 P4200 Discharge Pressure (kPag) N/A N/A 900 1000.0 -
PIT-4202 P4200 Suction Pressure (kPag) -75 -70 N/A N/A -

Page 11 of 54
Narrative Functional Description
No.: PB2036-2000-ELE-FDE-001 Rev: B
Date: 15/05/2020
Instrument Description Low-Low
Alarm Low Alarm High Alarm
High-High
Alarm
Set Point
PIT-4203 H4200 Homogeniser Discharge
Pressure (kPag) N/A N/A 900 1000.0 -
PIT-4204 H4200 Homogeniser Suction
Pressure (kPag) -75 -70 N/A N/A -
DPIT-4200 P4200 Suction Strainer DP 0.0 00 20.0 25.0 -
PIT-4600 P4400 Discharge Pressure (kPag) 0.0 0.0 900.0 1000.0 -
DPIT-4600 P4400 Suction Strainer DP 0.0 0.0 20.0 25.0 -
PIT-4300 P4300 Discharge Pressure (kPag) 0.0 0.0 900.0 1000.0 -
DPIT-4300 P4300 Suction Strainer DP 0.0 0.0 20.0 25.0 -
FIT-4000 C170 Volume Flowrate (L/min)
FIT-4200 PMB Batch Tank Volume Flowrate
(L/min)
TT-4004 P4000 Motor Temperature (°C) 90 100
TT-4003 P4000 Hot Oil Jacket Temperature
(°C) 170 180 190 200
TT-4103 P4100 Motor Temperature (°C) 90 100
TT-4102 P4100 Hot Oil Jacket Temperature
(°C) 80 90
TT-4204 P4200 Motor Temperature (°C) 90 100
TT-4205 P4200 Hot Oil Jacket Temperature
(°C) 170 180
TT-4207 H4200 Motor Temperature (°C) 90 100
TT-4208 H4200 Hot Oil Jacket Temperature
(°C) 170 180
TT-4603 P4400 Motor Temperature (°C) 90 100
TT-4602 P4400 Hot Oil Jacket Temperature
(°C) 170 180

Page 12 of 54
Narrative Functional Description
No.: PB2036-2000-ELE-FDE-001 Rev: B
Date: 15/05/2020
Instrument Description Low-Low
Alarm Low Alarm High Alarm
High-High
Alarm
Set Point
TT-4301 P4300 Motor Temperature (°C) 90 100
TT-4302 P4300 Hot Oil Jacket Temperature
(°C) 170 180
TT-4604 A4600 Motor Temperature (°C) 90 100
TT-4702 A4700 Motor Temperature (°C) 90 100
SC-4200 P4200 VSD Speed (RPM)
LEL-4000 Sour Gas LEL Level (%) 0.0 0.0 20.0 >25.0 -
LEL-4001 Sour Gas LEL Level (%) 0.0 0.0 20.0 >25.0
AA-4000 H2S DETECTOR (PPM) >8
AA-4001 H2S DETECTOR (PPM) >8
AA-4002 H2S DETECTOR (PPM) >8
AA-4003 H2S DETECTOR (PPM) >8
AA-4004 H2S DETECTOR (PPM) >8
Notes: 1. 90% of total volume 2. 95% of total volume 3. 150mm above coil height 4. 250mm above coil height 5. 150mm above lower coil outlet 6. 250mm above lower coil outlet
3.3 Motor Drives and interlocks
Motor Number Equipment Name
Start Interlock Run Interlock
P4000 C170 Transfer Pump
T4000 Low Level High Motor Temp
High Oil Jacket Temp

Page 13 of 54
Narrative Functional Description
No.: PB2036-2000-ELE-FDE-001 Rev: B
Date: 15/05/2020
Motor Number Equipment Name
Start Interlock Run Interlock
P4100 Extract Oil Unloading/Transfer Pump
High Motor Temp
High Oil Jacket Temp High Discharge Pressure
Low Suction Pressure
P4200 Transfer Pump
T4200 Low Level High Motor Temp
High Oil Jacket Temp
High Discharge Pressure
Low Suction Pressure
P4400 PMB Loading Pump
T4600 / T4700 Low Level T4700 High Temp T4600 High Temp High Motor Temp
High Oil Jacket Temp
P4300 CRMB Loading Pump
T4600 / T4700 Low Level T4700 High Temp T4600 High Temp High Motor Temp High Oil Jacket Temp
M4200 Shredder T4200 Low Level T4200 High Temp High Motor Temp
A4600 Mixer T4600 Low Level T4600 High Temp High Motor Temp
A4700 Mixer
T4700 Low Level T4700 High Temp High Motor Temp
Note:
1. All Start Interlocks shall also act as Run Interlocks unless otherwise stated.
2. The table above does not include standard MCC permissive as these interlocks are assumed to apply to all drives. Similarly, Emergency Stops are not covered as they shall be hardwired into the control circuit.
3. Motor current interlocks shown above shall include appropriate time delays to filter out start up transients.
4. Low Pressure interlocks shown above shall include filters on VSD output plus time delay to filter out nuisance alarms and allow pump to reach running speed.

Page 14 of 54
Narrative Functional Description
No.: PB2036-2000-ELE-FDE-001 Rev: B
Date: 15/05/2020
5. High Pressure interlocks shown above shall include time delay to filter out nuisance alarms and allow pump to reach running speed.
6. All Run interlocks are required to latch to allow the Operator to determine the reason for the interlock trip. Common Reset for trips to be provided on each individual drive faceplate.
7. Control functions shall operate normally when the Emergency Stop circuit is healthy. Control functions shall fail safe when the Emergency Stop circuit is active.
8. Operators may select “Maintenance Mode” on any drive. When this mode is active, the drive shall turn off. This also disables any sequence from accessing this drive, such that the sequence will be interlocked.
3.4 Valves and Interlocks
Valve Number
Description Open Interlocks Normal
State Fail State
XV-4000 T4000 Outlet to P4000 LT-4001 Low; OR XV-4001 Open
Closed Closed
XV-4001 C170 Feed Line Valve to T4000
LT-4001 High; OR XV-4000 Open
XV-1004 Open; OR XV-1003 Open
Closed Closed
XV-4000 T4000 Vent to Combustor Open Closed
XV-4100 T4100 Outlet to P4100 LT-4101 Low Closed Closed
XV-4101 P4100 Discharge to Mix Tank T4200 XV-4010 Open Closed Closed
XV-4010 P4100 Discharge to Portable PMB/CRMB Unit XV-4101 Open Closed Closed
XV-4011 P4000 Discharge to Portable PMB/CRMB Unit XV-4002 Open Closed Closed
XV-4200 T4200 Outlet to P4200/H4200 LT-4201 Low; OR XV-4201 Open
Closed Closed
XV-4201 T4200 Inlet Valve
LT-4201 High; OR MOV-4202 Open; OR
XV-4205 Open; OR XV-4204 Open; OR
XV-4200 Open
Closed Closed

Page 15 of 54
Narrative Functional Description
No.: PB2036-2000-ELE-FDE-001 Rev: B
Date: 15/05/2020
Valve Number
Description Open Interlocks Normal
State Fail State
XV-4220 SP4000 Sour Gas Inlet Open closed
XV-4003 SP4000 Outlet to Combustor LS-4000 High; OR
Open Closed
XV-4200 T4200 Vent to Combustor Closed Closed
XV-4214 Inlet to Portable PMB/CRMB Unit TBA
XV-4215 Outlet from Portable PMB/CRMB Unit TBA
XV-4216 PMB/CRMB from P-PMB to Gantry TBA Closed Closed
XV-4217 PMB/CRMB from P-PMB to T4600/T4700 TBA Closed Closed
XV-4203 T4200 Outlet to P4200 LT-4201 Low; OR XV-4201 Open; OR XV-4205 Open; OR
Closed Closed
XV-4204 P4200 Recycle to T4200 XV-4601 Open; OR
XV-4701 Open; OR XV-4205 Open
Closed Closed
XV-4205 H4200 Recycle to T4200 XV-4601 Open; OR
XV-4701 Open; OR XV-4204 Open
Closed Closed
XV-4600 T4600 Outlet to P4400/P4300 LT-4601 Low; OR XV-4601 Open; OR
XV-4700 Open
Closed Closed
XV-4601 T4600 Inlet Valve
LT-4601 High; OR XV-4600 Open; OR XV-4701 Open; OR XV-4204 Open; OR
XV-4205 Open
Closed Closed
XV-4219
T4600 Recycle to T4200
Transfer to T4700
XV-4204 Open; OR XV-4701 NOT Open
XV-4701 Open; OR XV-4204 NOT Open;
Closed Closed

Page 16 of 54
Narrative Functional Description
No.: PB2036-2000-ELE-FDE-001 Rev: B
Date: 15/05/2020
Valve Number
Description Open Interlocks Normal
State Fail State
XV-4600 T4600 Vent to Combustor Open Closed
XV-4700 T4700 Outlet to P4400/P4300 LT-4701 Low; OR XV-4701 Open; OR
XV-4600 Open
Closed Closed
XV-4701 T4700 Inlet valve
LT-4701 High; OR XV-4700 Open; OR XV-4601 Open; OR XV-4204 Open; OR
XV-4205 Open
Closed Closed
XV-4702
T4700 Recycle to T4200
Transfer to T4600
XV-4204 Open; OR XV-4601 NOT Open
XV-4601 Open; OR XV-4204 NOT Open;
Closed Closed
XV-4700 T4700 Vent to Combustor Open Closed
XV-4451 PMB/CRMB from T4600 to Gantry Bay 1
XV-4453 Open; OR XV-4452 Open; OR
XV-4801 NOT Open; OR XV1001 Open; OR
XV-1906 NOT Open
Closed Closed
XV-4711 PMB/CRMB from T4700 to Gantry Bay 2
XV-4452 Open; OR XV-4453 Open; OR
XV-4800 NOT Open; OR XV-1002 Open; OR XV-1907 NOT Open
Closed Closed
XV-4800 ESD Valve in Gantry Bay 2 FV-1002 Open; OR |XV-1907 NOT Open
Closed Closed
XV-4801 ESD Valve in Gantry Bay 1 FV-1001 Open; OR XV-1906 NOT Open
Closed Closed
TCV-4000 T4000 Hot Oil Coils (Internal)
LIT-4001 Low; OR TIT-4000/4001 High; OR
T4000 in pump transfer sequence
Closed Closed
TCV-4100 T4100 Hot Oil Coils (Internal) LIT-4101 Low; OR
TIT-4100/4101 High; OR
T4100 in pump transfer sequence
Closed Closed
TCV-4200-1 T4200 Hot Oil Coils (External Coil 1) LIT-4201 Low; OR
TIT-4200/4201 High; OR
T4200 in pump transfer sequence
Closed Closed

Page 17 of 54
Narrative Functional Description
No.: PB2036-2000-ELE-FDE-001 Rev: B
Date: 15/05/2020
Valve Number
Description Open Interlocks Normal
State Fail State
TCV-4200-2 T4200 Hot Oil Coils (External Coil 2) LIT-4201 Low; OR
TIT-4200/4201 High; OR
T4200 in pump transfer sequence
Closed Closed
TCV-4600 T4600 Hot Oil Coils (Internal) LIT-4601 Low; OR
TIT-4600/4601 High; OR
T4600 in pump loadout/transfer sequence
Closed Closed
TCV-4700 T4700 Hot Oil Coils (Internal)
LIT-4701 Low; OR TIT-4700/4701 High; OR
T4700 in pump loadout/transfer sequence
Closed Closed
Notes: 1. Emergency Stops are not covered by the table above, as they shall be
hardwired into the control circuit. All valves to go to the fail-safe (de-energised) state when an ESD is active.
2. Operators may select “Maintenance Mode” on any valve. When this mode is active, the valve shall be forced to the de-energised state. This also disables any sequence from accessing this valve, such that the sequence will be interlocked.
3. Position switches on valves shall raise an alarm if a valve is out-of-position
Emergency Stops and Faults
Several Emergency Stop pushbuttons shall be provided in the PMB plant as per the table below. These pushbuttons shall be integrated into the existing site ESD system. Field Emergency Stop pushbuttons are to be latching type.
E-Stop Tag No. Location
ESD-1 Inside Switchroom on ESD-101 Door
ESD-2 Control Building ESD-102 Door
ESD-3 Hopper
ESD-4 Top Tank T4200
ESD-5 Pump Bank
ESD-6 External Switchroom
Each of these pushbuttons, when depressed, will shut off all pumps; stop any running sequences; de-energise all valves into the fail-safe position; and activate audible and visual alarms at the SCADA and in the field.

Page 18 of 54
Narrative Functional Description
No.: PB2036-2000-ELE-FDE-001 Rev: B
Date: 15/05/2020
Aside from the E-stops, local Off buttons will be available for the following equipment:
P4000, P4100, P4200, P4300, P4400 pump motors
M4200, H4200, A4600, A4700 and MOV-4202 motors
PMB material handling system motors (conveyors, vacuum block lifter and dust extraction filter)
The facility must also have another means to stop all PMB operations from an alternate location other than the local stop e.g. at the PLC. The PMB plant will be integrated into the existing systems for site power fault, plant air fault.
Storage Tanks (T4000 & T4100) System
5.1 System Description
5.1.1 Overview
T4000 is a vertical steel storage tank with nominal capacity of 100T. It has two DN50 heating coils and a DN200 free vent. The tank is insulated and clad on both the shell and roof. The design temperature is 200°C; and the design pressure is 35 kPag. T4000 acts as a buffer tank to cover periods when C170 is not available from the existing Bitumen Import Facility (during tank ship unloading).
Extract Oil is delivered by road tanker and unloaded to T4100 using pump P4100. T4100 is a vertical steel storage tank with nominal capacity of 50T. The design temperature is 200°C; and the design pressure is 35 kPag.
Bitumen is supplied from the existing facility. Bitumen Loading Pump #1 (P1001) that also supplies the two bay tanker truck loading rack (TTLR) is used to transfer bitumen to the PMB plant. The pump is not designed to supply the gantry and the PMB plant simultaneously. Route selection is manual and requires the operator to open the appropriate isolation valve.
Both Bitumen C170 and Extract Oil are stored at a temperature of approximately 190°C and 110°C respectively by passing hot oil through the heating coils. Two temperature probes are mounted in each of the tanks. The first probe is mounted below the low level mark but above the heating coils. The second probe is mounted at a higher elevation in the tank. The PMB operator can select either of the probes as the measured variable for the temperature control. The output from each controller drives a single On/Off valve that, when energised open, directs hot oil through the respective tank heating coils and when de-energised shuts off hot oil to the tank heating coils.
The levels in the tanks are monitored by a radar type level transmitters. The signal from each transmitter generates a high level alarm and a low level alarm.
An independent level transmitter is fitted to each tank with high, high-high and low, low-low alarms. For T4000 only; when the level in a tank reaches the

Page 19 of 54
Narrative Functional Description
No.: PB2036-2000-ELE-FDE-001 Rev: B
Date: 15/05/2020
high-high level the inlet isolation valve is tripped closed and an audible and visual alarm is raised. On low-low level the outlet isolation valve is tripped closed and tank heating is inhibited by forcing the thermal oil On/Off valve to the fully closed position. The levels in each tank as measured by the two transmitters are compared and a deviation alarm is generated if the results exceed a pre-set value.
T4000 tank only has a connection to a vapour extraction system. This system draws vapours from within the vapour space of the tank to prevent fugitive emissions to atmosphere as the tank fills and breathes.
5.1.2 Tank Status
The operator can mark T4000 or T4100 as “In Service” or “Out of Service”. When a tank is marked as “Out of Service”, control sequences cannot transfer into or out of it. T4000 cannot be put into “Out of Service” if a transfer sequence to/from the tank is already running.
5.1.3 Operator Controls
The SCADA screens shall provide the controls to the Operator to start, pause, or stop a transfer. The graphics shall provide an overview of the associated instrumentation.
The PLC shall allow an Operator to select the required mode by selecting the source tank, desired manifolds and pump. The PLC will then automatically align the appropriate valves and start the transfer pump. The transfer sequence will then transfer product until:
1. A High level is reached in the destination tank; OR
2. A Low level is reached in the source tank.
Extract Oil is supplied in isotainers and must unloaded manually from road tanker to tank T4100.
The following table lists the selections that shall be available to an Operator in order to use the pump transfer sequence.
P1001 Operator Controls
Description Selection
Select “From Tank” Select from the popup graphic
Select “To Tank” Select from the popup graphic
Start Transfer Press the “Transfer” button
Stop Transfer Press the “Stop” button

Page 20 of 54
Narrative Functional Description
No.: PB2036-2000-ELE-FDE-001 Rev: B
Date: 15/05/2020
5.1.4 Pump Speed Control
The speed of P1001 will be controlled by monitoring the flow of C170 being transferred (FQI-4000). If the flow reaches High (FAH-4000) the VSD will turn down the pump speed to maintain the desired flow or until the pump reaches a minimum speed at which point it will trip to prevent damage to the pump. An alarm is generated in SCADA (FALL-4000). If the bitumen C170 temperature reaches Low-Low (TALL-4002) the P1001 will also trip to protect the pump
P1001 can also be used to loadout to gantry (Bay 1 or Bay 2). However, this is not currently in operation (line to Bay 2 has a blind spool installed and line to Bay 1 has been isolated). P1001 has a design flowrate of 1500 LPM. It will not be used for simultaneous loadout to gantry as well as transfer to the PMB plant.
5.2 Operational Sequences
The following sections describe the intended operational sequences of T4000; and should be read in conjunction with the Equipment Details. The sequences should also be read in conjunction with the Cause & Effect Matrix in Appendix A.
1) Operator selects the required transfer from SCADA. The SCADA screen will display the available tanks (T281 or T282).
2) If satisfied with the information displayed, the Operator selects the “FROM TANK” button. Operator is prompted to enter the requested volume of C170. This will trigger the PLC to reset the FQI-4000 setpoint equal to the required volume of C170.
3) The PLC shall set TCV-4000 to automatically control to a set point of 150°C.
4) The PLC confirms that XV-4003 is in the open position using ZS-XV4003. The PMB plant shares a vapour extraction/combustion system with the existing Bitumen Import Facility and the combustor must be operational to enable PMB production.
5) Operator presses the “TRANSFER” button to initiate C170 transfer to T4000.
6) The PLC shall command XV-1140 or XV-1141 and XV-1201 or XV-1301 in the P1001 pump suction to open (depending upon the selected tank).
7) PLC shall command XV-4001 in the tank inlet to T4000 to open.
8) After confirming that XV-1140/XV-1141 and XV-1201/XV-1301 positions are open using ZSO-1140/1141 and ZSO-1201/1301; and that XV-4001 is open using ZS-XV4001, the PLC commands P1001 to start transfer of C170 at a nominal slow-fill rate of 500L/min (note this rate is subject to change at commissioning).

Page 21 of 54
Narrative Functional Description
No.: PB2036-2000-ELE-FDE-001 Rev: B
Date: 15/05/2020
9) Once T4000 level is above the tank low level, the PLC shall command P1001 to increase flowrate to a nominal fast-fill rate of 1200L/min (note this rate is subject to change at commissioning).
10) The PLC shall monitor the total volume of C170 into T4000 via FQI-4000 using the setpoint assigned in step 2). The PLC must subtract the dead volume between the location of FQI-4000 and T4000 inlet as this quantity has past the meter but will still be added to the transfer total.
11) The extraction system operates at a slight vacuum to draw bitumen vapours out of T4000 during tank filling instead of venting vapours to atmosphere. (This is mainly for odour control). The tank headspace pressure is controlled by throttling the vapour flow via FIT-4001 and FCV-4000.
12) As FQI-4000 approaches the setpoint volume, the PLC commands P1001 to reduce to slow-fill rate.
13) Once FQI-4000 setpoint volume has been achieved, the PLC commands XV-4001 to close and monitors position switch ZS-XV4001 to confirm the valve has closed.
14) Once XV-4001 is confirmed closed the PLC shall remove the run request to P1001.
15) PLC commands XV-1140 or XV-1141 and XV-1201 or XV-1301 in the P1001 pump suction to close. Transfer is complete.
5.2.1 Interlocks
The following Start and Running interlocks shall apply to the Transfer sequence:
Pre-Start Interlocks Running Interlocks
T4000/T281/T282 “Not in Service” T281/T282 source tank level is Low (Note 1)
P1001 Loading Pump Not Available T4000 destination tank level is High (Note 2)
T4000 Transfer sequence is Active
T281/T282 Transfer sequence (to T277/T278) is Active
T281/T282 source tank level is Low
T4000 destination tank level is High
T281/T282 source tank temperature is <180°C

Page 22 of 54
Narrative Functional Description
No.: PB2036-2000-ELE-FDE-001 Rev: B
Date: 15/05/2020
T4000 destination tank hot oil control valve NOT closed
Notes 1) If the source tank level becomes Low mid-sequence, this shall trip the transfer sequence and
stop the transfer pump. 2) If the destination tank level becomes High or High High mid-sequence, this shall trip the
transfer sequence and stop the transfer pump. 5.3 Tank Heating
Refer to Section 9 for details of the hot oil heating system for T4000
5.4 Pump (P4000 & P4100) Transfer System
The operation of transfer pumps P4000 and P4100 is included as part of the Mix Tank (T4200) System.
Mix Tank (T4200) System
6.1 System Description
6.1.1 Overview
T4200 is a vertical steel tank with nominal capacity of 50T that will be used for blending polymer, C170 bitumen & extract oil as well as other additives to produce specialty grade PMBs/CRMB. Once mixed and homogenised, the resultant PMB product is transferred to storage tank T4600 for quality testing and storage. T4600 serves as a dual-purpose check tank/storage tank while T4700 is the final product tank.
T4200 has two separate hot oil jackets to heat the contents to a temperature of approximately 190°C to assist in the melting/blending of modifiers into the base grade bitumen. Two temperature probes are mounted in the tank. The first probe is mounted below the low level mark. The second probe is mounted at a higher elevation in the tank. The operator can select either of the probes as the measured variable depending upon the batch recipe size. There are two control valves to modulate the supply of hot oil to the two jackets. The output from each controller drives a dedicated On/Off valve that, when open, directs hot oil through the respective external heating coil and when de-energised shuts off hot oil to that heating coil.
The level in the tank is monitored by a radar type level transmitter. The signal from the transmitter generates a high level alarm and a low level alarm.
An independent level transmitter is fitted with high, high-high and low, low-low alarms. When the level in T4200 reaches the high-high level the inlet isolation valve is tripped closed to prevent overfill. On low-low level the outlet isolation valve is tripped closed and tank heating is inhibited by forcing the hot oil On/Off valve to the fully closed position. The level in the tank as measured by the two transmitters is compared and a deviation alarm is generated if the results exceed a pre-set value.

Page 23 of 54
Narrative Functional Description
No.: PB2036-2000-ELE-FDE-001 Rev: B
Date: 15/05/2020
The tank has a bottom mounted shredder for chopping up Buna rubber blocks when added as the binder. The shredder has a variable speed drive controlled by the bitumen temperature in the tank and the motor temperature.
T4200 tank has a connection to a vapour extraction system. This system draws vapours from within the vapour space of the tank to prevent fugitive emissions to atmosphere as the tank fills and breathes
There will be a selection of pre-programmed “recipes” available to the Operator, which will automatically set the required batch volume, the required volumes of C170 and extract oil and polymer binder, and duration of mixing. These recipes cannot be modified without undergoing a formal Puma Management of Change (MOC) procedure.
C170 bitumen base grade is transferred from buffer tank T4000 to T4200 using pump P4000. Extract oil is stored in tank T4100 and transferred to mix tank T4200 (only used for SBS polymer type grades where required) by pump P4100. Pumps P4000/P4100 shall initially slow-fill C170/Extract Oil into T4200 until a minimum level in the tank has been reached. The pump flowrate will then increase to high-flow and continue to fill until the required volumes have been transferred based on the recipe selected.
The polymer binders such as Styrene Butadiene Styrene (SBS), Ethylene Vinyl Acetate (EVA) or Latex (Buna) are added to the mix tank by the materials handling system. Chemical modifiers such as sulphur and viscosity modifiers such as wax can also be added depending upon the recipe. Polymer should never be added into T4200 until the bitumen level in T4200 has exceeded the low level, to avoid excessive heating of binder by the external hot oil coils.
The mix tank contents can also be circulated through a homogeniser H4200 and back to the mix tank to ensure complete blending and achieve a uniform batch of PMB. Once mixing is complete the batch is pumped out to T4600 by P4200 for sampling and/or storage. The plant will also haver the option to transfer homogenised product to T4600, which ensures that 100% of the production batch is run through the homogeniser. This will shorten homogenisation times. Load out of a PMB batch from T4200 direct to gantry is not considered part of normal operation.
6.1.2 Tank Status
The operator can mark T4200 as “In Service” or “Out of Service”. When the tank is marked as “Out of Service”, control sequences cannot load into or out of it. T4200 cannot be put into “Out of Service” if a load out sequence from the tank is already running.
6.1.3 Operator Controls
The SCADA screens shall provide the controls to the Operator to select a recipe, start, pause, stop, or change the step of the manufacturing sequence. The graphics shall provide an overview of the associated instrumentation.
When a recipe is selected by an Operator, the relevant set points and batch quantities are loaded and displayed for the Operator to confirm. Once

Page 24 of 54
Narrative Functional Description
No.: PB2036-2000-ELE-FDE-001 Rev: B
Date: 15/05/2020
confirmed, the sequence will add ingredients, blend, and pump out as required.
Description Selection
Recipe Select from the drop down menu Confirm Batch Press the “CONFIRM BATCH” button Start Batch Press the “START” button Pause Batch Press the “PAUSE” button E-stop (reset batch) Press the “E-STOP” button Run M4200 despite Low Temp Press the “USE M4200” button Run H4200 to blend T4200 Press the “USE H4200” button Use P4200 to pump out T4200 Press the “P4200 LOADOUT” button Use H4200 to pump out T4200 Press the “H4200 LOADOUT” button Choose manifold and destination tank for pump out
Press the “H4200/P4200 SELECTION” button
Stop a pump out operation Press the “LOADOUT STOP” button
6.2 Operational Sequences
The following sections describe the operational sequences of T4200 and should be read in conjunction with the Equipment Details. The sequences should also be read in conjunction with the Cause & Effect Matrix in Appendix A
6.2.1 PMB / CRMB Production
1) Operator selects the required recipe from SCADA. The SCADA screen will display that recipe’s batch volume, required volume of C170, Extract Oil, required quantities of polymer, chemical & viscosity modifiers, and duration of mixing.
Note: For CRMB production extract oil and polymer binder are not required.
2) If satisfied with the information displayed, the Operator presses the “CONFIRM BATCH” button. This will trigger the PLC to set the FQI-4200 setpoint equal to the required volume of C170 displayed in step 1).
3) The PLC shall set TCV-4200-1 and/or TCV-4200-2 to automatically control to a set point of 195°C.
4) The PLC confirms that XV-4003 is in the open position using ZS-XV4003. The PMB plant shares a vapour extraction/combustion system with the existing Bitumen Import Facility and the combustor must be operational to enable PMB production.

Page 25 of 54
Narrative Functional Description
No.: PB2036-2000-ELE-FDE-001 Rev: B
Date: 15/05/2020
5) Operator presses the “START” button to initiate C170 transfer to T4200.
6) The PLC shall command XV-4002 and XV-4201 to open
7) After confirming that XV-4002 and XV-4201 positions are open using ZS-XV4002 and ZS-XV4201, the PLC commands P4000 to start transfer of C170 at a nominal slow-fill rate of 500L/min (note this rate is subject to change at commissioning).
8) Once T4200 level is above the tank low level, the PLC shall command P4000 to increase flowrate to a nominal fast-fill rate of 1200L/min (note this rate is subject to change at commissioning).
9) The PLC shall monitor the total volume of C170 into T4200 via FQI-4200 using the setpoint assigned in step 2). The PLC must subtract the dead volume between the location of FQI-4200 and T4200 inlet as this quantity has past the meter but will still be added to the batch total.
10) The extraction system operates at a slight vacuum to draw bitumen vapours out of T4200 during tank filling instead of venting vapours to atmosphere. (This is mainly for odour control). Operator shall monitor the tank headspace pressure via PIT-4201 and the vapour flow via FIT-4001 and FCV-4200.
11) As FQI-4200 approaches the setpoint volume, the PLC commands P4000 to reduce to slow-fill rate.
12) Once FQI-4200 setpoint volume has been achieved, the PLC commands XV-4201 to close and monitors position switch ZS-XV4201 to confirm the valve has closed.
13) Once XV-4201 is confirmed closed the PLC shall remove the run request to P4000.
14) Steps 5) through 13) are repeated for Extract Oil where this is required by the particular recipe. If Extract Oil is not required for the particular recipe the PLC shall skip steps 15) through 21) and set the sequence into the polymer binder addition stage.
Note: For CRMB production, extract oil is not required
15) The PLC resets the setpoint of FQI-4200 to equal the required volume of Extract Oil displayed in step 1). The PLC shall not reset the totalised flow (mass) of the batching flow meter. This can only be reset once the total quantity has been transferred.
16) Operator presses the “START” button to initiate Extract Oil transfer to T4200
17) The PLC shall command XV-4101 to open.
18) After confirming that XV-4101 position is open using ZS-XV4101, the PLC commands P4100 to start transfer of Extract Oil

Page 26 of 54
Narrative Functional Description
No.: PB2036-2000-ELE-FDE-001 Rev: B
Date: 15/05/2020
19) The PLC shall monitor the total volume of Extract Oil into T4200 via FQI-4200 using the setpoint assigned in step 1)
20) Once FQI-4200 setpoint volume has been achieved, the PLC commands XV-4101 to close and monitors position switch ZS-XV4101 to confirm the valve has closed
21) Once XV-4101 is confirmed closed the PLC shall remove the run request to P4100.
22) The PLC sets the sequence into the polymer binder addition stage and commands MOV-4202 to open.
23) The PLC shall display message “Polymer Modifier Add Stage” to notify the Operator that they must commence the solids transfer process. Polymer & modifier additions are semi-automated tasks that require the Operator to interact with the SCADA.
24) The PLC commands the shredder M4200 to start (only used for PDB polymer type grades where required by the recipe). An inhibit only allows this step to occur when the tank level has reached minimum level.
25) Operator commences sequence to add polymer and modifiers into T4200 (refer to Section XX). Note that some recipes call for addition of sulphur as a chemical modifier and that this results in evolution of hydrogen sulphide (H2S). The H2S should be drawn out by the vapour extraction system and levels are monitored by LEL-4001-S1 and LEL-4001-S2
26) Once transfer of solids is complete, the Operator resumes this sequence by confirming on the SCADA that the polymer binder addition stage is complete.
27) The PLC shall command MOV-4202 to close. The SCADA shall monitor position switch ZS-XV4202 to confirm the valve has closed.
28) Once the solids addition has been confirmed as complete, the PLC shall commence a blending timer to monitor the total mixing time of C170, Extract Oil and polymer. The required time is set by the recipe selected in 1).
29) Where a recipe requires to run the homogeniser, Operator to make selection by pressing “USE H4200”.
30) The PLC commands XV-4200 and XV-4205 to open.
31) After confirming that XV-4200 and XV-4205 positions are open using ZS-XV4200 and ZS-XV4205, the PLC commands H4200 to start at low speed. This step homogenises the batch contents to ensure complete blending.

Page 27 of 54
Narrative Functional Description
No.: PB2036-2000-ELE-FDE-001 Rev: B
Date: 15/05/2020
32) Once the total mixing/homogenising duration has elapsed, the PLC shall alert the Operator that the tank can be pumped out.
33) The PLC commands XV-4205 to close and monitors position switch ZS-XV4205 to confirm that valve has closed.
34) Once XV-4205 is confirmed closed the PLC shall remove the run request to H4200 and to M4200
35) PLC then runs the transfer/load out sequence to check/storage tank T4600/T4700.
36) Operator to make their selection by pressing the “H4200/P4200 SELECTION” for pump out by H4200 or P4200. A popup menu will prompt Operator to select the destination tank T4600 or T4700.
37) PLC shall command XV-4601 or XV-4701 to open depending upon the tank selected.
38) If “P4200 LOADOUT” is selected PLC commands XV-4203 to open and XV-4204 to close. If “H4200 LOADOUT” is selected PLC commands XV-4205 and XV-4203 to close.
39) After confirming that XV-4203/XV-4204 positions are open/close using ZS-XV4203/ZS-XV4204 OR XV-4205/XV-4203 positions are close using ZS-XV4205/ZS-XV4203, the PLC shall prompt Operator to start the pump out.
40) Operator to make their selection by pressing the “P4200 LOADOUT” or “H4200 LOADOUT” buttons.
41) PLC shall command P4200 or H4200 to start at nominal slow pump out rate of 500L/min (note this rate is subject to change at commissioning.
42) Once the destination tank level is above the tank low level, the PLC shall command H4200/P4200 to increase flowrate to a nominal fast-fill rate of 1200L/min (note this rate is subject to change at commissioning).
43) PLC shall monitor the pump out rate via LIT-4200/LIT-4201. When the tank Low level is reached pump out is complete. PLC shall command XV-4601 or XV-4701 to close and monitors position switch ZS-XV4601/ZS-XV4701 to confirm that valve has closed.
44) . Once XV-4601/XV-4701 is confirmed closed the PLC shall remove the run request to P4200 or H4200.
6.2.2 Interlocks
The PMB / CRMB production sequence shall be prevented from starting if the following conditions are true:

Page 28 of 54
Narrative Functional Description
No.: PB2036-2000-ELE-FDE-001 Rev: B
Date: 15/05/2020
Pre-Start Interlocks Running Interlocks
T4200 Loadout sequence is Active T4200 level is High
T4200 level is High T4200 temperature is High
T4200 temperature is Low T4200 pressure is Low or High
Homogeniser discharge pressure High High
Homogeniser suction pressure Low-Low
If during the sequence an interlock is activated, the sequence shall be put into a PAUSE state. From the PAUSE state, the Operator is required to fix the problem, reset the fault, and then “Restart” the sequence.
6.3 Shredder Operation
When in automatic control, M4200 will run continuously as long as the level in T4200 exceeds the Low level, and there are no interlocks active. If M4200 is out of service and unable to operate an alarm is to be raised in the PLC for Operator to check the shredder.
If M4200 motor temperature is High, this may indicate a higher-than-normal PMB viscosity. If Low, this may be indicative of a broken shaft.
6.3.1 Shredder Interlocks
The following run interlocks are built into the shredder operation
Shredder Pre-Start Interlocks Shredder Running Interlocks
T4200 Low level T4200 Low level
T4200 Low temperature
M4200 motor temperature is High
The PLC shall trip and turn off M4200 when any of the following occur:
1. An emergency stop alarm becomes active;
2. A power fault alarm becomes active.
When the trip reset is activated, the trip status on M4200 shall be cleared.

Page 29 of 54
Narrative Functional Description
No.: PB2036-2000-ELE-FDE-001 Rev: B
Date: 15/05/2020
6.4 Venturi & Materials Handling System
The venturi and materials handling system combine to allow addition of solid materials into a liquid bitumen stream.
6.4.1 Equipment
The equipment listed in the table below form part of the venturi manufacturing system.
Equipment Tag Description Size / Capacity
H4000 Main crumbed rubber hopper Single CR bag, 1m3(HOLD)
M4101 H4001 internal agitator motor
SP4001 Venturi 6000kg / hr material
LSHH-H4000 Hopper high-high level switch
LSLL-H4000 Hopper low-low level switch
LIT-H4000 Hopper level transmitter 0 – 1000mm
TE-H4000 Hopper surface temperature element Magnetic RTD
P4200 Bitumen pump for circulating through venturi 0 – 1500 l/min
MOV-4221 Solids gate control valve between H4000 and SP4001 venturi
6”
XV-4222 Venturi bitumen inlet valve 6”, 150lb
XV-4223 Venturi bitumen outlet valve 6”, 150lb
PCV-4200 Pressure control valve parallel with venturi 4”, 150lb
PIT-4205 Bitumen venturi inlet pressure transmitter 0 – 2000 kPa
PIT-4206 Venturi materials inlet pressure transmitter -100 – 100 kPa
PIT-4207 Bitumen venturi outlet pressure transmitter 0 – 2000 kPa
FIT-4201 Bitumen venturi inlet flow transmitter 0 – 2000 l/min
XV-4224 Solenoid valve controlling air into venturi
Venturi system and associated equipment details
6.4.2 Operation
6.4.2.1 Materials Handling System
Crumbed rubber is delivered to site in 1000kg bags which must be emptied into the materials handling system to allow controlled addition into the venturi.
The materials handling equipment consists of pneumatic bag lift attached to an overhead sliding beam crane. A single 1000kg bag sitting on a pallet is positioned under the bag lift using a forklift where it is attached to the rigging. Once the forklift has reversed, a protective gate is then closed triggering a safety interlock and allowing the bag lifting mechanism to function. The bag lift and crane controls allow the bag to be raised and positioned directly above the main hopper H4000.
With the bag positioned above hopper H4000 the operator lowers it down into a large opening where a bag spike pierces open the flexible woven bag material allowing the contents to fully empty. The empty bag is then raised and returned to the starting position where it is discarded.

Page 30 of 54
Narrative Functional Description
No.: PB2036-2000-ELE-FDE-001 Rev: B
Date: 15/05/2020
With the contents of the bag inside hopper H4000 an internal agitator driven by motor M4101 is activated to break up any clumped or compressed material that may have formed. Air sparges in the hopper also prevent clumps or compressed material. A sliding gate valve MOV-4221 with variable position allows control of the materials feed rate. Hopper H4000 has level switches for high-high and low-low indication, LSHH-H4000 and LSLL-H4000, as well as a level transmitter LIT-H4000. These instruments protect the hopper from running dry or overfilling and provide feedback of the material level in the hopper
6.4.2.2 Venturi System
The venturi mechanism is used to draw in or entrain material into a flowing stream of bitumen. The venturi is essentially an eductor the uses the change in pressure energy in the flowing liquid as it passes through a restriction to create an area of low pressure sufficient to pull material into the flowing stream.
The rate of material entrainment into the venturi is proportional to the bitumen flow rate with an approximate maximum of 1500 l/min corresponding to ~6000kg/h or 100kg/min of solid material.
On the bitumen inlet and outlet to the venturi, pressure transmitters PIT-4205 and PIT-4207 respectively provide protection from back pressure which could potentially cause bitumen to flow through the materials inlet. If high-high pressure trips are activated by either inlet or outlet pressures transmitters, the venturi will be shut-down and isolated. That is, the bitumen inlet actuated ball valve XV-4222 and outlet valve XV-4223 and slide gate MOV-4221 will close and pump P4200 will stop. Both actuated valves are pneumatic with fail close operation.
A pressure transmitter PIT-4206 mounted on the venturi (Throat pressure) between the materials inlet and sliding gate valve provides indication that the venturi has developed a slight vacuum and that solid material can be added.
A pneumatic pressure control valve PCV-4200 in parallel with the venturi and actuated ball valves allows fine adjustment of the pressure conditions through the venturi. Varying the pressure through the venturi will allow the rate of materials addition to also be varied such that the two streams are balanced.
Bitumen flow transmitter FIT-4201 meters product flowing from the discharge of P4200 before entering the venturi. A control loop between the P4200 variable speed drive and flow transmitter allows precise flow rates to be achieved enabling variable and repeatable venturi operation. The flow meter also provides batch transfer quantity tracking and slow filling rates at the start and end of batches.
6.4.2.3 Venturi Manufacturing During Transfer
The most efficient venturi operating method is to combine the bitumen transfer operation and venturi solids addition into one process. That is, to transfer bitumen from the C170 storage tank T4000 through the venturi and into tank T4200 whilst adding solid materials. The below steps provide a description of the process which assumes there is enough time to add the required solid materials during a single transfer pass.
1) The operator selects “Transfer” venturi method.

Page 31 of 54
Narrative Functional Description
No.: PB2036-2000-ELE-FDE-001 Rev: B
Date: 15/05/2020
2) PLC confirms tank T4200 is empty and is available for batch production.
3) The operator selects the required recipe, i.e. percentage of crumbed rubber.
4) The operator enters the batch quantity.
5) The required quantity of crumbed rubber is displayed.
6) The operator selects the source tank as T4000.
7) The operator selects the bitumen flow rate, range between 500l/min and 1500l/min.
8) The approximate crumbed rubber feed rate is shown allowing the operator to predict when to add additional bags into the hopper H4000.
9) The operator loads the hopper H4000 with the first 1000kg bag of crumbed rubber and then
10) The operator presses the “Batch Start” button.
11) The PLC confirms T4000 tank temperature is between 180°C and 200°C.
12) The PLC closes XV-4203, XV-4200, XV-4204, XV-4209, XV-4702, XV4101 and XV-4004 to ensure there are no other paths open to areas of the plant not involved in the venturi process.
13) The PLC opens T4000 outlet valve XV-4000.
14) The PLC opens T4200 inlet valve XV-4201.
15) The PLC opens PCV-4200 to 100%.
16) Pump P4200 starts and runs at slow speed. Control loop FIC-4200 adjusts the P4200 speed to 500l/min with feedback from FIT-4201.
17) The PLC monitors P4200 outlet pressure transmitter PIT-4201 to ensure it is within normal operating range. If the pressure is high, the batch will be stopped, and a warning raised on the SCADA. This may indicate a blockage or cold section of line.
18) After P4200 has run for 1 minute AND the discharge pressure is within normal limits the PLC opens venturi inlet and outlet valves XV-4222 and XV-4223.
19) Pump P4200 continues to run at slow speed. Control loop FIC-4200 adjusts the P4200 speed to 500l/min with feedback from FIT-4201.
20) The PLC starts the hopper agitator M4101.
21) As crumbed rubber material begins to fill the hopper H4000 it will eventually activate the low-low level switch LSLL-H4000 indicating that the minimum operating quantity is approaching.

Page 32 of 54
Narrative Functional Description
No.: PB2036-2000-ELE-FDE-001 Rev: B
Date: 15/05/2020
22) Pressure control valve PCV-4200 begins closing pushing more bitumen through the venturi.
23) Pressure transmitter PIT-4206 indicates correct vacuum level has developed at the venturi materials inlet nozzle.
24) The PLC opens slide gate MOV-4221 to 50%.
25) Pressure control valve PCV-4200 regulates its position such that the venturi inlet pressure PIT-4206 controls the feed rate of materials in the venturi.
26) When the tank T4200 level transmitter LIT-4200 indicates the product is >500mm, pump P4200 is ramped up to the full speed setpoint.
27) The PLC opens slide gate MOV-4221 to 100%.
28) The operator is required to monitor the level of crumbed rubber in the main hopper H4000 and add bags as required.
29) Flow meter FIT-4201 provides continuous monitoring of the flow rate and accumulated batch quantity transferred into tank T4200.
30) When T4200 tank level reaches the minimum required for shredder M4200 to operate the PLC will ramp it up to full speed.
31) When the accumulated batch quantity is 500 litres from completion, pump P4200 will ramp down to 500l/min.
32) The PLC will close slide gate MOV-4221 to 50%
33) When there are 50 litres remaining in the batch, the PLC will close slide gate MOV-4221 to 0%.
34) Pressure control valve PCV-4200 will be opened to 100%.
35) The PLC will close the venturi bitumen inlet and outlet valves XV-4222 and XV-4223.
36) The PLC will continue to run P4200 pushing straight bitumen into tank T4200 until the batch pre-set quantity.
37) The PLC then stops P4200.
38) The PLC opens the instrument air inlet to the venturi materials nozzle to provide positive pressure and prevent bitumen entering.
39) The PLC then closes the venturi and transfer line by shutting XV-4000 and PCV-4200.
40) The PLC opens the T4200 recirculation / homogeniser H4200 line by opening XV-4200, XV-4204 and XV-4201.
41) The PLC starts homogeniser H4200 and ramps it up to 100% whilst shredder M4200 continues running at 100%.

Page 33 of 54
Narrative Functional Description
No.: PB2036-2000-ELE-FDE-001 Rev: B
Date: 15/05/2020
42) Homogeniser and shredder continue to run for the pre-set time period as set from the SCADA production page.
43) When the homogeniser and shredder have finished operation, the batch is ready for sampling and release. The batch can be transferred to one of the finish tanks T4600 or T4700.
6.4.2.4 Venturi Manufacturing During Recirculation
An alternate venturi operating process requires a two staged approach. Firstly, the required bitumen batch quantity minus the solid material quantity is transferred into tank T4200 from tank T4000. Secondly, bitumen is recirculated using pump P4200 whilst solid materials are added. Whilst this process is less efficient and requires double handling of the bitumen, it does allow for slower addition of solid materials and allows the product in tank T4200 to be preheated. Additionally, this process may be combined with venturi transfer manufacturing in the case that the required quantity of solids could not be added during the transfer.
1) The operator selects “Recirculate” venturi method
2) PLC confirms tank T4200 is empty and is available for batch production.
3) The operator selects the required recipe, i.e. percentage of crumbed rubber.
4) The operator enters the batch quantity.
5) The PLC converts the batch quantity to a T4200 tank level in mm.
6) The required quantity of crumbed rubber is displayed.
7) The operator selects the source tank as T4000.
8) The operator selects the bitumen flow rate, range between 500l/min and 1500l/min.
9) The approximate crumbed rubber feed rate is shown allowing the operator to predict when to add additional bags into the hopper H4000.
10) The operator loads the hopper H4000 with the first 1000kg bag of crumbed rubber and then
11) The operator presses the “Batch Start” button.
12) The PLC opens the line from tank T4000 to T4200.
13) The PLC closes XV-4203, XV-4200, XV-4209, XV-4702, XV4101 and XV-4004 to ensure there are no other paths open to areas of the plant not involved in the venturi process.
14) The PLC opens T4000 outlet valve XV-4000.
15) The PLC opens XV-4204.

Page 34 of 54
Narrative Functional Description
No.: PB2036-2000-ELE-FDE-001 Rev: B
Date: 15/05/2020
16) The PLC opens T4200 inlet valve XV-4201.
17) Pump P4200 starts and runs at slow speed ~ 50% for 1 minute and then ramps up to 100%.
18) Pump P4200 continues to operate until the pre-calculated T4200 tank level has been reached.
19) The line from T4000 to T4200 is then closed by shutting XV-4000, XV-4204 and XV-4201.
20) If the T4200 tank temperature is not between 180°C and 200°C, the T4200 tank hot oil heating is turned to maximum and the shredder is run on high until this is achieved.
21) The PLC opens XV-4203 and XV-4201.
22) The PLC opens PCV-4200 to 100%.
23) Pump P4200 starts and runs at slow speed. Control loop FIC-4200 adjusts the P4200 speed to 500l/min with feedback from FIT-4201.
24) The PLC monitors P4200 outlet pressure transmitter PIT-4201 to ensure it is within normal operating range. If the pressure is high, the batch will be stopped, and a warning raised on the SCADA. This may indicate a blockage or cold section of line.
25) After P4200 has run for 1 minute AND the discharge pressure is within normal limits the PLC opens venturi inlet and outlet valves XV-4222 and XV-4223.
26) Pump P4200 continues to run at slow speed. Control loop FIC-4200 adjusts the P4200 speed to 500l/min with feedback from FIT-4201.
27) The PLC starts the hopper agitator M4101.
28) As crumbed rubber material begins to fill the hopper H4000 it will eventually activate the low-low level switch LSLL-H4000 indicating that the minimum operating quantity is approaching.
29) Pressure control valve PCV-4200 begins closing pushing more bitumen through the venturi.
30) Pressure transmitter PIT-4206 indicates correct vacuum level has developed at venturi materials inlet nozzle.
31) The PLC opens slide gate MOV-4221 to 100%.
32) Pressure control valve PCV-4200 regulates its position such that the venturi inlet pressure PIT-4206 controls the feed rate of materials in the venturi.
33) The operator is required to monitor the level of crumbed rubber in the hopper H4000 and add bags as required.
34) Flow meter FIT-4201 provides continuous monitoring of the flow rate.

Page 35 of 54
Narrative Functional Description
No.: PB2036-2000-ELE-FDE-001 Rev: B
Date: 15/05/2020
35) The PLC ramps up the shredder M4200 to full speed.
36) When the required quantity of crumbed rubber has been added, P4200 will ramp down to 500l/min.
37) The PLC will close slide gate MOV-4221 to 0%
38) Pressure control valve PCV-4200 will be opened to 100%.
39) The PLC will close the venturi inlet and outlet valves XV-4222 and XV-4223.
40) The PLC will continue to run P4200 pushing straight bitumen into tank T4200 for 1 minute.
41) The PLC then stops P4200.
42) The PLC opens the instrument air inlet to the venturi materials nozzle to provide positive pressure and prevent bitumen entering.
43) The PLC then closes the venturi and transfer line by shutting XV-4000 and PCV-4200.
44) The PLC opens the T4200 recirculation / homogeniser H4200 line by opening XV-4200, XV-4204 and XV-4201.
45) The PLC starts homogeniser H4200 and ramps it up to 100% whilst shredder M4200 continues running at 100%.
46) Homogeniser and shredder continue to run for the pre-set time period as set from the SCADA production page.
47) When the homogeniser and shredder have finished operation, the batch is ready for sampling and release. The batch can be transferred to one of the finish tanks T4600 or T4700.
6.4.3 Operator Controls
From the production mimic screen operators can initiate and setup the required batching parameters and monitor the entire process. The table below lists the venturi manufacturing parameters available to the operators allowing for varying production recipes, flow rates, quantities and temperatures.
Description Min Value Max Value Initial Value Security Level
Recipe Name Crumbed Rubber CR 2
Batch Recipe 10% 20% 15% 2
Batch Volume 5 tonnes 50 tonnes 25 tonnes 2
Venturi method Transfer Recirculate Transfer 2
Bitumen Source Tank T4000 / T4200 None 2

Page 36 of 54
Narrative Functional Description
No.: PB2036-2000-ELE-FDE-001 Rev: B
Date: 15/05/2020
Destination Tank T4200 T4200 2
Venturi flow rate 500 l/min 1500 l/min 500 l/min 2
Min T4200 temperature 170°C 200°C 180°C 2
Shredder run time 0 mins 120 mins 60 mins 2
Shredder Speed 0% 100% 0% 2
Homogeniser run time 0 mins 120 mins 0 mins 2
Homogeniser speed 40% 100% 75% 2
Finish tank T4600 T4700 2
Operator settings for CR manufacture using venturi
6.4.4 Interlocks
The following interlocks shall be in place before starting and whilst running the venturi system.
Tag Interlock Condition Action Override
P4200 PIT-4206 High-High Stop NO
MOV-4221
PIT-4206 High-High Stop NO
XV-4222 PIT-4206 High-High Close NO
XV-4223 PIT-4206 High-High Close NO
MOV-4221
LSHH-H4000 Tripped Close NO
XV-4222 LSHH-H4000 Tripped Close NO
XV-4223 LSHH-H4000 Tripped Close NO
P4200 LSHH-H4000 Tripped Stop NO
MOV-4221
LSLL-H4000 Low-Low Close YES
6.4.5 Alarms
The following alarm trip set-points shall be applied.
Equipment Tag Type Limit Condition Limit Access Consequence
PIT-4205 High-High >900kPa Engineer
PIT-4205 High >750kPa Supervisor
PIT-4207 High-High >900kPa Engineer
PIT-4207 High >750kPa Supervisor
PIT-4206 High High Vacuum (HOLD)
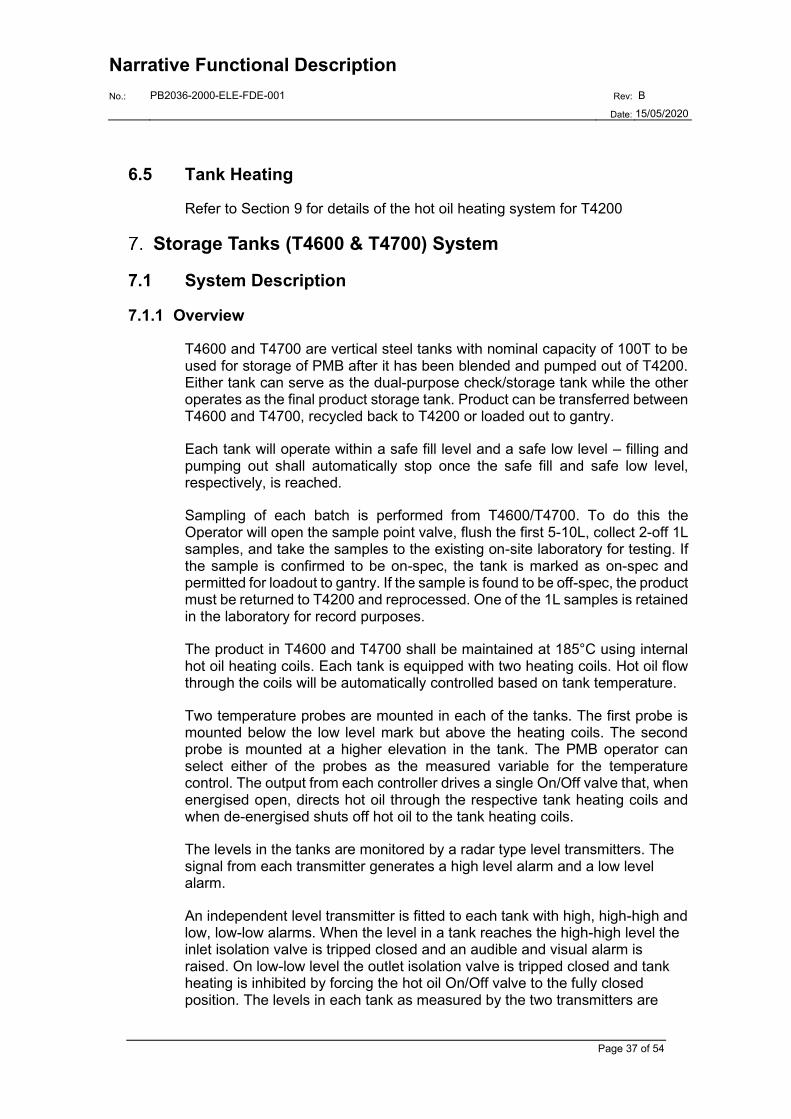
Page 37 of 54
Narrative Functional Description
No.: PB2036-2000-ELE-FDE-001 Rev: B
Date: 15/05/2020
6.5 Tank Heating
Refer to Section 9 for details of the hot oil heating system for T4200
Storage Tanks (T4600 & T4700) System
7.1 System Description
7.1.1 Overview
T4600 and T4700 are vertical steel tanks with nominal capacity of 100T to be used for storage of PMB after it has been blended and pumped out of T4200. Either tank can serve as the dual-purpose check/storage tank while the other operates as the final product storage tank. Product can be transferred between T4600 and T4700, recycled back to T4200 or loaded out to gantry.
Each tank will operate within a safe fill level and a safe low level – filling and pumping out shall automatically stop once the safe fill and safe low level, respectively, is reached.
Sampling of each batch is performed from T4600/T4700. To do this the Operator will open the sample point valve, flush the first 5-10L, collect 2-off 1L samples, and take the samples to the existing on-site laboratory for testing. If the sample is confirmed to be on-spec, the tank is marked as on-spec and permitted for loadout to gantry. If the sample is found to be off-spec, the product must be returned to T4200 and reprocessed. One of the 1L samples is retained in the laboratory for record purposes.
The product in T4600 and T4700 shall be maintained at 185°C using internal hot oil heating coils. Each tank is equipped with two heating coils. Hot oil flow through the coils will be automatically controlled based on tank temperature.
Two temperature probes are mounted in each of the tanks. The first probe is mounted below the low level mark but above the heating coils. The second probe is mounted at a higher elevation in the tank. The PMB operator can select either of the probes as the measured variable for the temperature control. The output from each controller drives a single On/Off valve that, when energised open, directs hot oil through the respective tank heating coils and when de-energised shuts off hot oil to the tank heating coils.
The levels in the tanks are monitored by a radar type level transmitters. The signal from each transmitter generates a high level alarm and a low level alarm.
An independent level transmitter is fitted to each tank with high, high-high and low, low-low alarms. When the level in a tank reaches the high-high level the inlet isolation valve is tripped closed and an audible and visual alarm is raised. On low-low level the outlet isolation valve is tripped closed and tank heating is inhibited by forcing the hot oil On/Off valve to the fully closed position. The levels in each tank as measured by the two transmitters are

Page 38 of 54
Narrative Functional Description
No.: PB2036-2000-ELE-FDE-001 Rev: B
Date: 15/05/2020
compared and a deviation alarm is generated if the results exceed a pre-set value.
T4600 and T4700 will each have a variable speed tank top mixer, A4600 and A4700, to mix the PMB so that it meets the requirements for product quality/uniformity. The mixer’s motor is designed to start and stop automatically at a certain minimum tank level.
The tanks have a connection to a vapour extraction system. This system draws vapours from within the vapour space of the tank to prevent fugitive emissions to atmosphere as the tank fills and breathes.
Under normal operation, filling and pumping out of the same tank simultaneously shall not be permitted.
7.1.2 Tank Safe Fill and Safe Low Levels
T4600 uses a safe fill level of 90% tank total volume and load out uses a safe low level of 150mm above the coil height on LIT-4600/4601.
T4700 uses a safe fill level of 90% of tank total volume and load out uses a safe low level of 150mm above coil height on LIT-4700/4701.
7.1.3 Tank Status
The Operator shall be able to mark each tank as “In Service” or “Out of Service”. When a tank is marked as “Out of Service”, sequences cannot load into or out of this tank. A tank cannot be put into “Out of Service” if a load out sequence from the tank is already running.
Operator must also be able to assign each tank as “Not Available for Sale” or “Available Ready for Sale” through a selection field on the SCADA screen. A second field displayed next to each tank on the SCADA shall allow the Operator to edit the PMB product name.
Operators will select “Not Available for Sale” if the tank does not contain PMB for sale, or is awaiting test results to confirm the product is on-spec. This is also the default status if the tank is empty, being emptied or being filled.
Operators will select “Available Ready for Sale” when the product has been confirmed on-spec. A batch number must be allocated for a particular tank before its status can be changed to “Available Ready for Sale”.
Sequences shall not be able to load out of a tank to the gantry unless a tank is marked as “Available Ready for Sale”. If both tanks contain the same PMB product and both are marked “Available Ready for Sale”, the PLC shall track which product was manufactured first and automatically assign this as the duty tank for load out to the gantry. Operators however shall have the ability to override this and set any tank as the duty tank. When the duty tank has been emptied during load out there shall be an automatic changeover by the PLC to the next available tank.

Page 39 of 54
Narrative Functional Description
No.: PB2036-2000-ELE-FDE-001 Rev: B
Date: 15/05/2020
7.2 Operational Sequences
The following sections describe the intended operational sequences of T4600 and T4700; and should be read in conjunction with the Equipment Details. The sequences should also be read in conjunction with the Cause & Effect Matrix in Appendix A.
7.2.1 Tank Mixing
When in automatic control, A4600 and A4700 will run continuously as long as the level in the respective tank exceeds the Low level, and there are no interlocks active.
If A4600/A4700 is out of service and unable to operate, or the mixer motor temperature is High, an alarm is to be raised in the PLC for Operator to check the mixer.
7.2.2 Interlocks
The PLC shall command A4600/A4700 to stop when any of the following conditions are true:
Pre-Start Interlocks Running Interlocks
T4600/T4700 level is Low
T4600/T4700 temperature is Low
A4600/A4700 motor temperature is High
The PLC shall trip and turn off A4600/A4700 when any of the following occur:
1. An emergency stop alarm becomes active;
2. A power fault alarm becomes active.
When the trip reset is activated, the trip status on A4600/A4700 shall be cleared
7.2.3 Tank Heating
Refer to Section 9 for details of the hot oil heating system for T4600/T4700.
Pump (P4300 & P4400) Transfer/Loadout System 8.1 System Description
8.1.1 Overview
Pumps P4300 and P4400 are identical, internal gear pumps with variable speed drive motors. These pumps will be used to transfer PMB between tanks or to load out to Bay 1 or Bay 2 at the road gantry. Each pump has its

Page 40 of 54
Narrative Functional Description
No.: PB2036-2000-ELE-FDE-001 Rev: B
Date: 15/05/2020
own dedicated suction manifold to T4600/T4700, and its own discharge manifold to the gantry. A crossover between the two suction manifolds provides flexibility to the Operator to use either pump for any combination of tank/gantry transfer. Either pump shall have the ability to be set to one of two modes via the SCADA:
a) Transfer Mode; or
b) Loadout Mode.
However, the intent is to primarily use P4300 for loadout to the gantry i.e. in Loadout Mode, and P4400 for transfer between tanks i.e. in Transfer Mode.
8.1.2 Transfer Mode
PMB product may be transferred between tanks in several ways, for example: Transferring a finished batch from T4600 to T4700 or vice versa;
Returning product from T4600 or T4700 to T4200 for reprocessing (for example, if off-spec). Only P4400 has a recycle line back to the mix tank T4200; which means that if T4700 tank is off-spec and must be returned to T4200 this transfer must be done with P4400. It means that simultaneous loadout from T4600 to gantry is not possible.
In rare cases, off-spec product may be returned from a truck to any of the two tanks for further testing or mixing.
Note that there may be occasions where an Operator wants to transfer only a fraction of a tank’s contents to another tank. The PLC shall provide the Operator the ability to transfer a part-batch.
8.1.3 Loadout Mode
PMB / CRMB shall be loaded out at a minimum temperature of 180°C from T4600 or T4700 to either gantry Bay 1 or 2. New pipework to the gantry will be installed dedicated to PMB / CRMB i.e. not shared with existing loadout lines. However; the gantry spear and connection to the vapour combustion system will be shared with the existing Bitumen Import Facility. The PMB pipework will tie-in close to the spear to minimise contamination from other products being loaded. From the spear, product will “gravity drop” into the road tanker.
Simultaneous loadout to gantry bay 1 and bay 2 using P4300 and P4400 pumps shall be permitted as there are dedicated pump discharge lines to the gantry. However; loadout to both bays simultaneously from the same tank and using the same pump shall not be configured.
The existing gantry is configured for driver-only loading using Accuload Bay Load Controllers (BLC) that enable the driver to initiate and control the loadout process without intervention required by an Operator. A driver’s room serves as the loading control point. The loadout of PMB / CRMB shall be incorporated into the existing control system so that it can also be loaded out by drivers independently of an Operator.

Page 41 of 54
Narrative Functional Description
No.: PB2036-2000-ELE-FDE-001 Rev: B
Date: 15/05/2020
8.1.4 Operator Controls
The PLC shall allow an Operator to select the required mode by selecting the source tank, destination (tank or gantry), desired manifolds and pump. The PLC will then automatically align the appropriate valves and start the correct transfer pump. The transfer sequence will then transfer product until:
3. The correct level is reached in the destination tank; OR
4. The correct volume has been transferred to the gantry; OR
5. A High level is reached in the destination tank/gantry; OR
6. A Low level is reached in the source tank.
SCADA graphics shall provide the controls to the Operator to start and stop transfers, as well as provide an overview of the associated instrumentation.
To initiate a transfer/loadout sequence the Operator will select the source tank, the source manifold, destination manifold, and the destination tank/gantry from the SCADA graphic.
Tank to tank transfers can only be initiated by an Operator in the control room. Load out to the gantry however can be initiated either by the Operator in the control room, or by an approved driver via the Accuload system at the gantry.
The following table lists the selections that shall be available to an Operator in order to use the pump transfer/loadout sequences.
P4600/P4700 Operator Controls
Description Selection
Select “From Tank” Select from the popup graphic
Select “Stop on Volume” Select from the popup graphic
Select “Transfer Volume” Select from the popup graphic
Select “To Tank / Gantry” Select from the popup graphic
Start Transfer Press the “Transfer” button
Stop Transfer Press the “Stop” button
8.1.5 Pump Speed Control
The speed of P4400 and P4300 is controlled by monitoring the pump motor temperature (TE-4600 /TE-4300). If the motor temperature reaches High (TT-4603 /TT-4301) or the pump jacket temperature reaches Low (TT-4602 /TT-4302) the VSD shall turn down the pump speed until the maximum temperature is maintained or the pump reaches minimum speed at which point the pump will trip to prevent damage to it. An alarm is generated in

Page 42 of 54
Narrative Functional Description
No.: PB2036-2000-ELE-FDE-001 Rev: B
Date: 15/05/2020
SCADA if motor temperature is High or jacket temperature is Low. A pump trip alarm on High-High or Low-Low temperature is also generated.
The pump’s discharge pressure (PIT-4600 /PIT-4300) is also constantly monitored but not used to control the pump’s VSD.
When loading out to the gantry, the flowrate is controlled by the Accuload based on the flowrate required (low-flow or high-flow). The Accuload will send the flow request to the PLC which will control the % opening of the control valve FCV-4800/4801. The backpressure created by the control valve % opening will affect TE-4606 /TE-4300 which will control the pump VSD.
The intent is to limit flow to the gantry to a maximum of 1000LPM if loading out to a single gantry bay, and a maximum of 1500LPM if loading out to two gantry bays (750LPM each). As the flowrates are viscosity-dependent, the appropriate % opening setting of FCV-4800/4801 for slow and fast fill will need to be determined during commissioning.
Currently, there are existing proximity sensors for the gantry spears which are connected to the PLC and indicate when the spear is lowered into the loading position. These sensors serve as an interlock for truck loading i.e. loading cannot start (or will be stopped if already loading) if this input is not active. The Bay 1 interlock shall prevent FCV-4801 from opening and the Bay 2 interlock shall prevent FCV-4800 from opening.
8.2 Operational Sequences
The following sections describe the intended operational sequences of pumps P4400 and P4300 and should be read in conjunction with the Equipment Details. The sequences should also be read in conjunction with the Cause and Effect Matrix in Appendix A.
8.2.1 Transfer Mode Sequence
1) Operator selects T4600 or T4700 in the “From Tank” popup depending on the required source tank.
2) The PLC must confirm that this tank passes all Status checks (i.e. tank is “In Service”) before allowing tank selection, otherwise returns an error message.
3) The PLC commands XV-4600 to open if Operator selects T4600 in the “From Tank” popup.
4) The PLC commands XV-4700 to open if Operator selects T4700 in the “From Tank” popup.
5) Operator selects T4600, T4700 or T4200 in the “To Tank/Gantry” popup depending on the required destination tank.
6) The PLC shall prompt the Operator to confirm the transfer volume. The PLC shall compare this with the available ullage in the destination tank and verify that there is sufficient volume in the destination tank.

Page 43 of 54
Narrative Functional Description
No.: PB2036-2000-ELE-FDE-001 Rev: B
Date: 15/05/2020
7) The PLC shall open/close actuated valves as required to line up the “From Tank” and “To Tank” pathway.
8) When all valves have been lined up, the PLC shall command the transfer pump P4400 to start the transfer
9) The PLC shall check that all tank unloading and loading permissives/interlocks are satisfied before permitting transfer pump to start. This includes confirming that the hot oil control valve (TCV-4600 or TCV-4700) is Closed on the source tank.
10) The PLC shall monitor and compare the change in volume/levels in the source tank and the destination tank to verify that product is not being inadvertently directed elsewhere.
11) If there is a discrepancy, the PLC shall raise a deviation alarm on the SCADA to alert the Operator as well as shutdown the transfer pump.
8.2.2 Interlocks
The following Start and Running interlocks shall apply to the Transfer sequence:
Pre-Start Interlocks Running Interlocks
T4600/T4700 “Not in Service” T4600/T4700 source tank level is Low (Note 1)
T4600/T4700 Transfer/Loadout sequence is Active
T4600/T4700 destination tank level is High (Note 2)
T4600/T4700 source tank level is Low
Loading to Bay 1 and the bay has a high alarm (LSH-1001)
T4600/T4700 destination tank level is High
Loading to Bay 2 and the bay has a high alarm (LSH-1002)
T4600/T4700 source tank temperature is <180°C
T4600/T4700 source tank hot oil control valve NOT closed
Notes 3) If the source tank level becomes Low mid-sequence, this shall trip the transfer sequence and
stop the transfer pump. 4) If the destination tank level becomes High or High High mid-sequence, this shall trip the
transfer sequence and stop the transfer pump. 8.2.3 Loadout Mode Sequence
Gantry load out of PMB shall replicate existing procedures for the Bitumen Import Facility. Generally, the procedure will be as follows:
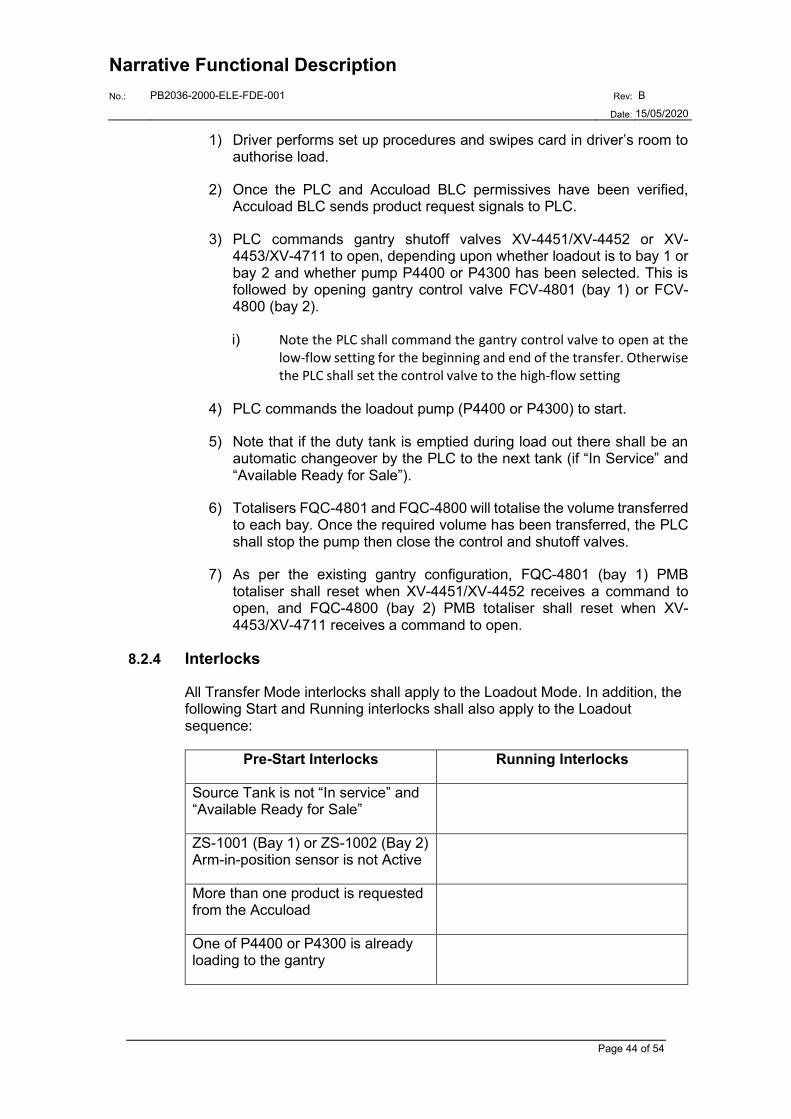
Page 44 of 54
Narrative Functional Description
No.: PB2036-2000-ELE-FDE-001 Rev: B
Date: 15/05/2020
1) Driver performs set up procedures and swipes card in driver’s room to authorise load.
2) Once the PLC and Accuload BLC permissives have been verified, Accuload BLC sends product request signals to PLC.
3) PLC commands gantry shutoff valves XV-4451/XV-4452 or XV-4453/XV-4711 to open, depending upon whether loadout is to bay 1 or bay 2 and whether pump P4400 or P4300 has been selected. This is followed by opening gantry control valve FCV-4801 (bay 1) or FCV-4800 (bay 2).
i) Note the PLC shall command the gantry control valve to open at the low-flow setting for the beginning and end of the transfer. Otherwise the PLC shall set the control valve to the high-flow setting
4) PLC commands the loadout pump (P4400 or P4300) to start.
5) Note that if the duty tank is emptied during load out there shall be an automatic changeover by the PLC to the next tank (if “In Service” and “Available Ready for Sale”).
6) Totalisers FQC-4801 and FQC-4800 will totalise the volume transferred to each bay. Once the required volume has been transferred, the PLC shall stop the pump then close the control and shutoff valves.
7) As per the existing gantry configuration, FQC-4801 (bay 1) PMB totaliser shall reset when XV-4451/XV-4452 receives a command to open, and FQC-4800 (bay 2) PMB totaliser shall reset when XV-4453/XV-4711 receives a command to open.
8.2.4 Interlocks
All Transfer Mode interlocks shall apply to the Loadout Mode. In addition, the following Start and Running interlocks shall also apply to the Loadout sequence:
Pre-Start Interlocks Running Interlocks
Source Tank is not “In service” and “Available Ready for Sale”
ZS-1001 (Bay 1) or ZS-1002 (Bay 2) Arm-in-position sensor is not Active
More than one product is requested from the Accuload
One of P4400 or P4300 is already loading to the gantry

Page 45 of 54
Narrative Functional Description
No.: PB2036-2000-ELE-FDE-001 Rev: B
Date: 15/05/2020
LSH-1001 is active (if intending to load out to Bay 1)
LSH-1002 is active (if intending to load out to Bay 2)
Hot Oil System
9.1 System Description
The PMB plant will tie into the existing hot oil system that consists of heaters H205 and H206, and two hot oil circulation pumps (P2102 and P2103). The PMB plant will require hot oil as follows:
• T4000 internal hot oil coils
• T4100 internal hot oil coils
• T4200 hot oil jackets (external to tank);
• T4600 internal hot oil coils;
• T4700 internal hot oil coils
• P4000/P4100/P4200/P4300/P4400 pump hot oil jackets
• H4200 homogeniser hot oil jacket
• Heat tracing on pipework and equipment.
T4200 is fitted with two sets of heating coils in an external tank jacket. The hot oil runs through the coils to heat the product in the tank. TCV-4200-1 and TCV-4200-2 are installed in the hot oil supply line to control the flow of hot oil through the heating coils.
T4000, T4100, T4600 and T4700 are fitted with internal heating coils inside the tank. The hot oil runs through the coils to heat the product in the tank. Control valves TCV-4000, TCV-4100, TCV-4600 and TCV-4700, respectively, are installed in the hot oil supply lines to control the flow of hot oil through the heating coils.
The temperature gauging on the tanks will be used to drive the control valves based on temperature set points. The intent is to maintain T4000, T4100 and T4200 at 195°C and T4600 and T4700 at 185°C. Tie-ins will be made to the existing hot oil supply and return headers from H205/H206 and P2102/P2103.
9.2 Operational Sequences
The following sections describe the intended operational sequences of the hot oil system and should be read in conjunction with the Equipment Details.

Page 46 of 54
Narrative Functional Description
No.: PB2036-2000-ELE-FDE-001 Rev: B
Date: 15/05/2020
9.2.1 Tank Temperature Control
The PLC shall control the opening/closing of the hot oil control valves to maintain the tanks at a desired temperature. The temperature setpoint is set by the tank operational sequence, or manually entered by the Operator on the SCADA.
The PLC shall close these valves if the respective tank is being pumped out (i.e. the tank is active in a transfer or loadout sequence) to prevent the potential for overheating while the tank is being emptied. If these valves are not closed, the pumps will not be permitted to load out of the tank.
The control of these valves shall be set to automatic when any of the following occur:
1. Tank level is healthy (i.e. not High or Low);
2. Tank temperature is healthy (i.e. not High or Low);
3. The site trip Reset is activated.
The control of these valves shall be set to manual and 0% open when any of the following occur:
1. Tank has a High temperature;
2. Tank has a Low level;
3. An emergency stop alarm is active;
4. A power fault alarm is active.
Sour Gas System
10.1 System Description
PMB production generates noxious vapours referred to as off gas. The intent is to remove off gas and send it to the existing incineration system that services the Bitumen Import Facility.
The Puma Energy vapour system must operate in coordination with that of the existing bitumen plant. Certain production or operational sequences may require preferential use of the vapour destruction system; therefore, permissive and status signals will be exchanged between the plant control systems.
The vapour space of tanks T4000, T4200, T4600 and T4700 will be integrated into the existing off gas header. The sour gas from these tanks will be piped to a local knockout vessel, SP4000, where any condensate will be drained into a 205L drum, and the remaining light fractions will be piped to the sour gas line for combustion.

Page 47 of 54
Narrative Functional Description
No.: PB2036-2000-ELE-FDE-001 Rev: B
Date: 15/05/2020
Each tank will have a gooseneck free vent to permit fresh air makeup into the tank. The sour gas header is operated at a slight vacuum to draw vapours out of the respective tank rather than venting the vapours to atmosphere.
Actuated valves XV-4010, XV-4610 or XV-4710 on storage tanks T4000, T4600 and T4700 are located on the off-gas line connected to the main vapour system header from each tank. During pump out of T4000, T4600 or T4700 these valves remain closed to ensure fresh air is drawn into the tank through the goose neck inlet, instead of vapour from the sour gas system. During filling of any of the tanks, the respective actuated valves shall remain open such that vapour inside the tank is drawn through to the sour gas system.
The actuated valve XV-4210 on mixing tank T4200 is located in series with the goose neck inlet such that it can isolate the tank vapour space from the outside atmosphere. When this tank is being pumped out the actuated valve will open allowing fresh air into the tank vapour space. Conversely, when the tank is being filled, the actuated valve will close forcing vapour in the tank ullage space into the sour gas header.
The off-gas vent header will also have a large DN200 flow control valve FCV-4001 that draws air into the header to dilute the sour gas. FCV-4001 is designed to Fail Open which provides a backup for vacuum relief should the actuated valves fail to open.
A maximum flow rate from the Puma vapour system is set at 1250m3/hr which is measured via flow meter FIT-4000. If this flow rate exceeds the maximum allowable level, the vapour system will be progressively shutdown. That is, in order of lower priority, tank vent valves will be closed until the flowrate is less than 1250 m3/hr.
Measurement of the lower explosive limit (LEL) in the sour gas header system is made using two sets of sampling and detection units. LEL-4000 sensor sampling location is directly after the final main header isolation valve XV-4003. Its intent is to ensure even after the sour gas system has been isolated that no potentially explosive atmosphere in present in the line connecting to the combustor. LEL-4001 sensor sampling location is in between the two header isolation valves which provides a warning and allowance for the valve reaction time encase of LEL detection.
In line with the existing sour gas system, the following trip and alarm points are defined:
1) If LEL-4000 OR LEL-4001 > 40% LEL
a) Send trip signal to combustor
b) Shutdown all vapour system valves
c) Stop all pumps and manufacturing processes
d) Raise alarm on SCADA

Page 48 of 54
Narrative Functional Description
No.: PB2036-2000-ELE-FDE-001 Rev: B
Date: 15/05/2020
2) If LEL-4000 OR LEL-4001 > 25% LEL
a) Shutdown all vapour system valves
b) Stop all tank filling and manufacturing
c) Raise alarm on SCADA
3) If LEL-4000 OR LEL-4001 > 20% LEL
a) Open fresh air inlet valve FCV-4201 to 100%
b) Raise alarm on SCADA
4) If PIT-4201 >0kPa
a) Close all tank vapour vent valves
10.1.1 Equipment
The equipment listed in the table below form part of the sour gas system.
Equipment Tag Description Size / Capacity
XV-4003 Sour gas header final isolation valve 10”
XV-4220 Sour gas header isolation valve 8”
FCV-4202 Control valve in parallel with XV-4220 1”
FCV-4201 Fresh air inlet valve 8”
XV-4010 T4000 vapour vent valve 4”
XV-4210 T4200 vapour vent valve 10”
XV-4610 T4600 vapour vent valve 4”
XV-4710 T4700 vapour vent valve 4”
PIT-4201 Sour gas tank header pressure transmitter -100kPa – 100kPa
PIT-4202 Sour gas header pressure transmitter adjacent SP4000
-100kPa – 100kPa
LS-4000 SP4000 Knock out pot liquid level switch ON/OFF
FIT-4000 Sour gas header flow meter 0 – 1800m3
LEL-4000 LEL detector and trip circuit downstream of SP4000 0% - 100% LEL
LEL-4001 LEL detector and trip circuit upstream of SP4000 0% - 100% LEL
SP4000 Sour gas system knock-out pot 0.42m3
10.2 Operational Sequences
The following sections describe the intended operational sequences of the off-gas system and should be read in conjunction with the Equipment Details.

Page 49 of 54
Narrative Functional Description
No.: PB2036-2000-ELE-FDE-001 Rev: B
Date: 15/05/2020
10.2.1 SQ4000 - Initialisation
This sequence covers initialising the sour gas system and assumes the combustor is running normally and there have been no LEL trips prior.
1) PLC detects combustor healthy and running signals are OK.
2) Sensors LEL-4000 and LEL-4001 readings are less than 20%.
3) The PLC opens the final main vapour header valve XV-4003.
4) The PLC confirms vacuum pressure on PIT-4202 < -3kPa
5) The PLC opens the main vapour header valve XV-4220.
6) The PLC confirms vacuum pressure on PIT-4201 < -3kPa
7) Fresh air inlet valve FCV-4201 opens for 5 minutes to purge the vapour header and then closes.
10.2.2 SQ-4001 - Normal Tank Venting
In this scenario it is assumed that no tanks are being filled or emptied and the sour gas system has completed the initialisation sequence SQ4000.
1) Fresh air inlet valve FCV-4201 opens for 5 minutes to purge the vapour header and then closes.
2) The PLC open T4200 air inlet valve XV-4210 for 10 minutes and then closes.
3) The PLC open T4000 air inlet valve XV-4010 for 10 minutes and then closes.
4) The PLC open T4600 air inlet valve XV-4610 for 10 minutes and then closes.
5) The PLC open T4700 air inlet valve XV-4710 for 10 minutes and then closes.
6) If no tanks are being filled or Return to step 1.
10.2.3 SQ4002 – T4000 Tank Filling
This process assumes the sour gas system has completed the initialisation sequence SQ4000 and is currently in normal tank venting sequence SQ4001.
When any tanks bitumen inlet valve is opened it is assumed that a transfer of product into this tank is imminent. In this case the normal tank venting sequence SQ4001 is interrupted and the tank being filled is vented. When more than one tank is being filled simultaneously, multiple tank filling sequences are run.
1) The PLC detects XV-4001 tank T4000 inlet valve is open.

Page 50 of 54
Narrative Functional Description
No.: PB2036-2000-ELE-FDE-001 Rev: B
Date: 15/05/2020
2) The transfer pump is interlocked.
3) The PLC opens T4000 vent valve XV-4010.
4) The transfer pump interlock is removed.
5) The PLC closes all other tank vent valves XV-4210, XV-4610 and XV-4710. This assumes no other tanks are being filled.
6) When the transfer is completed and XV-4001 closes, the PLC returns to SQ4001.
10.2.4 SQ4003 – T4200 Tank Filling
1) The PLC detects XV-4201 tank T4200 inlet valve is open.
2) The transfer pump is interlocked.
3) The PLC closes T4200 vent valve XV-4210 preventing vapours escaping to atmosphere.
4) The transfer pump interlock is removed.
5) The PLC closes all other tank vent valves XV-4010, XV-4610 and XV-4710. This assumes no other tanks are being filled.
6) When the transfer is completed and XV-4201 closes, the PLC returns to SQ4001.
10.2.5 SQ4004 – T4600 Tank Filling
1) The PLC detects XV-4601 tank T4600 inlet valve is open.
2) The transfer pump is interlocked.
3) The PLC opens T4600 vent valve XV-4610.
4) The transfer pump interlock is removed.
5) The PLC closes all other tank vent valves XV-4010, XV-4210 and XV-4710. This assumes no other tanks are being filled.
6) When the transfer is completed and XV-4601 closes, the PLC returns to SQ4001.
10.2.6 SQ4005 – T4700 Tank Filling
7) The PLC detects XV-4701 tank T4700 inlet valve is open.
8) The transfer pump is interlocked.
9) The PLC opens T4700 vent valve XV-4710.
10) The transfer pump interlock is removed.

Page 51 of 54
Narrative Functional Description
No.: PB2036-2000-ELE-FDE-001 Rev: B
Date: 15/05/2020
11) The PLC closes all other tank vent valves XV-4010, XV-4210 and XV-4610. This assumes no other tanks are being filled.
12) When the transfer is completed and XV-4701 closes, the PLC returns to SQ4001.
10.2.7 SQ4006 – T4000 Tank Emptying
This process assumes the sour gas system has completed the initialisation sequence SQ4000 and is currently in normal tank venting sequence SQ4001.
When any tanks bitumen outlet valve is opened it is assumed that a transfer of product out of this tank is imminent. In this case the normal tank venting sequence SQ4001 is interrupted and the tank being emptied is isolated from the vapour system to allow fresh air into the tank vapour space. When more than one tank is being emptied simultaneously, multiple tank emptying sequences are run.
1) The PLC detects XV-4000 tank T4000 outlet valve is open.
2) The transfer pump is interlocked.
3) The PLC closes T4000 vent valve XV-4010.
4) The transfer pump interlock is removed.
5) When the transfer is completed and XV-4000 closes, the PLC returns to SQ4001.
10.2.8 SQ4007 – T4200 Tank Emptying
1) The PLC detects XV-4200 or XV-4203 tank T4200 outlet valves are open.
2) The transfer pump is interlocked.
3) The PLC opens T4200 vent valve XV-4210.
4) The transfer pump interlock is removed.
5) When the transfer is completed and XV-4200 and XV-4203 are closed, the PLC returns to SQ4001.
10.2.9 SQ4008 – T4600 Tank Emptying
1) The PLC detects XV-4600 tank T4600 outlet valve is open.
2) The transfer pump is interlocked.
3) The PLC closes T4600 vent valve XV-4610.
4) The transfer pump interlock is removed.
5) When the transfer is completed and XV-4600 closes, the PLC returns to SQ4001.

Page 52 of 54
Narrative Functional Description
No.: PB2036-2000-ELE-FDE-001 Rev: B
Date: 15/05/2020
10.2.10 SQ4009 – T4700 Tank Emptying
1) The PLC detects XV-4700 tank T4700 outlet valve is open.
2) The transfer pump is interlocked.
3) The PLC closes T4700 vent valve XV-4710.
4) The transfer pump interlock is removed.
5) When the transfer is completed and XV-4700 closes, the PLC returns to SQ4001.
10.2.11 SQ4010 – Initialisation After LEL Trip
Following a trip event where either LEL-4000 or LEL-4001 have detected an LEL greater than 25%, the whole vapour system will be shutdown and need to be initialised in a manner that prevents a flammable atmosphere being sent to the combustor.
1) PLC detects combustor healthy and running signals are OK.
2) The PLC opens the final main vapour header valve XV-4003.
3) The PLC confirms vacuum pressure on PIT-4202 < -3kPa.
4) The PLC opens fresh air inlet valve FCV-4201 to 100%.
5) A control loop adjusts FCV-4201 position to maintain the vapour header flow rate to be less than 1250m3/hr.
6) The PLC monitors LEL-4000 and LEL-4001 and waits for both readings to be less than 5% LEL.
7) The PLC begins opening control valve FCV-4202 until the vacuum pressure on PIT-4201 < -3kPa.
8) The PLC monitors LEL-4000 and LEL-4001 ensuring the LEL readings remain below 20%. Also monitor pressure in PIT-4201.
9) The positions of flow control valves FCV-4201 and FCV-4202 are controlled ensuring both LEL-4000 and LEL-4001 readings remain below 20%.
10) Once LELs are below 20% and PIT-4201 about 0 kPa or slight vacuum, the PLC opens tank T4200 tank vent valve XV-4210 for 10 minutes and then closes.
11) The PLC opens the main vapour header valve XV-4220
12) The PLC opens tank T4000 tank vent valve XV-4010 for 10 minutes and then closes.
13) The PLC opens tank T4600 tank vent valve XV-4610 for 10 minutes and then closes.

Page 53 of 54
Narrative Functional Description
No.: PB2036-2000-ELE-FDE-001 Rev: B
Date: 15/05/2020
14) The PLC opens tank T4700 tank vent valve XV-4710 for 10 minutes and then closes.
15) The PLC closes control valve FCV-4202 to 0%.
16) Return to SQ4001.
10.2.12 SQ4011 – Vapour Header Flowrate
The vapour header flowrate measured via FIT-4000 is maintained below the maximum permissible level of 1250m3/hr with the following process.
1) The PLC detects FIT-4000 flowrate > 1250m3/hr.
2) If SQ4001 tank sweeping sequence is active, close tank vent valves, or
3) If inter-tank transfer in progress, stop transfer, close tank vent valves.
4) If the PLC still detects FIT-4000 flowrate > 1250m3/hr and T4200 manufacturing is in progress, then
5) Stop T4200 manufacturing.
6) Shutdown vapour system valve XV-4220.
7) Wait for FIT-4000 flowrate to be < 1000m3/hr.
8) Perform initialisation sequence SQ4000.
10.2.13 Operator Controls
From the vapour system mimic screen operators can monitor the current sequence in progress, all process variables, valve positions and flow rate. The table below lists the vapour system parameters available to the operators.
Description Min Value Max Value Initial Value Security Level
Vapour system Status Automatic Shutdown Automatic 2
Operator settings for vapour system
Utilities
11.1 Air
New air piping shall be reticulated from the adjacent supply header to provide air to the PMB plant actuated valves. Air supply to valves shall be sacrificial

Page 54 of 54
Narrative Functional Description
No.: PB2036-2000-ELE-FDE-001 Rev: B
Date: 15/05/2020
plastic tubing (UV-resistant) such that in the event of a fire the valves fail safe.
11.2 Water
New water piping shall be reticulated from the adjacent supply header to all safety showers. All water lines shall be lagged to mitigate solar radiation overheating the water lines.
Safety showers will be provided in close proximity to the storage tank sample points, hot oil manifold, pump strainers, and the truck unloading point.
11.3 Lighting
Existing lighting infrastructure will be used in the PMB supersac bag unloading area and the loading gantry.
New lighting infrastructure shall be provided as required in the storage shed and around the PMB production plant.
APPENDICES
A. Cause and Effect Chart, 2036-EQCE-0001

NOTES ( ):
HOLDS:1 Subject to Confirmation
LEGEND:C CloseO OpenOI Open inhibitESDSD ShutdownST StartA ActivateSI Start Inhibit
CAUSE
Tag No Description Setting P&ID NO.
TAHH-4004 P4000 Motor Temperature High High HOLD1 2036-Q-0001 SDTALL-4003 P4000 Pump Jacket Temperature Low Low 170°C 2036-Q-0001 SDZIC-XV4000 XV-4000 Not Open - 2036-Q-0001 SITALL-4002 Bitumen C170 Temperature Low Low 170°C 2036-Q-0001 SDTAHH-4103 P4100 Motor Temperature High High HOLD1 2036-Q-0001 SDTALL-4102 P4100 Pump Jacket Temperature Low Low 80°C 2036-Q-0001 SDZIC-XV4100 XV-4100 Not Open - 2036-Q-0001 SIFAL-4000 Bitumen C170 Flow Low HOLD1 2036-Q-0001 C
FALL-4000 Bitumen C170 Flow Low Low HOLD1 2036-Q-0001 SDFAHH-4000 Bitumen C170 Flow High High HOLD1 2036-Q-0001 SDLAHH-4001 T4000 Tank Level High High 12315 mm 2036-Q-0001 SDLAH-4001 T4000 Tank Level High 11875 mm 2036-Q-0001 CLAL-4001 T4000 Tank Level Low 2297 mm 2036-Q-0001 CLALL-4001 T4000 Tank Level Low Low 2197 mm 2036-Q-0001 SDLAHH-4101 T4100 Tank Level High High 11970 mm 2036-Q-0001 SDLAH-4101 T4100 Tank Level High 11056 mm 2036-Q-0001LAL-4101 T4100 Tank Level Low 2243 mm 2036-Q-0001 C CLALL-4101 T4100 Tank Level Low Low 2143 mm 2036-Q-0001 SDPAHH-4000 P4000 Pump Discharge Pressure High High 1000 kPag 2036-Q-0001 SDPAHH-4100 P4100 Pump Discharge Pressure High High 1000 kPag 2036-Q-0001 SD
DPAHH-4000 DPIT-4000 Differential Pressure High High 25 kPa 2036-Q-0001 SDDPAHH-4100 DPIT-4100 Differential Pressure High High 25 kPa 2036-Q-0001 SDTAHH-4202 M4200 Temperature High High HOLD1 2036-Q-0002 SDTAHH-4200 T4200 Tank Temperature High High 200°C 2036-Q-0002 SD C C SDTALL-4200 T4200 Tank Temperature Low Low 170°C 2036-Q-0002 SD SD SDFALL-4200 Bitumen C170/Extract Oil Flow Low Low HOLD1 2036-Q-0002 SD SDLAHH-4201 T4200 Tank Level High High 5415 mm 2036-Q-0002 SD SDLAH-4201 T4200 Tank Level High 5130 mm 2036-Q-0002 CLAL-4201 T4200 Tank Level Low 2317 mm 2036-Q-0002 SI C CLALL-4201 T4200 Tank Level Low Low 2217 mm 2036-Q-0002 SD SDZIC-XV4200 XV-4200 Not Open - 2036-Q-0002 SI SIZIC-XV4203 XV-4203 Not Open - 2036-Q-0002 SILAHH-1002 Truck Level High High 2036-Q-0006 CZIO-1002 Arm Connection Open 2036-Q-0006 C
PAHH-4206 Pressure at Venturi Throat High High -1 kPag (HOLD1) 2036-Q-0011 C C C
SCALE:NA
REF:
STATUS:
BA
UGL DOC No. PB2036-2000-PRO-REP-001 REV
XV-4
711
XV-4
453
2036
-Q-0
006
2036
-Q-0
006
2036
-Q-0
006
XV-4
800
Load
ing
Arm
at G
antry
Bay
2
P440
0 Su
pply
to G
antry
P430
0 Su
pply
to G
antry
Solid
out
let f
rom
Hop
per H
4000
Bitu
men
sup
ply
for V
entu
ri SP
4001
Bitu
men
Fro
m V
entu
ri SP
4001
2036
-Q-0
011
2036
-Q-0
011
2036
-Q-0
011
XV-4
221
XV-4
222
XV-4
223
Extra
ct O
il Pu
mp
TCV-
4200
-1
M42
00
Vapo
ur D
isch
arge
from
Kno
ck o
ut
Pot S
P400
0
P440
0
TCV-
4100
PMB
Out
let f
rom
T460
0
XV-4
210
XV-4
600
P430
0
TCV-
4600
P410
0
XV-4
001
H42
00
TCV-
4200
-2
2036
-Q-0
005
2036
-Q-0
003
2036
-Q-0
005
XV-4
200
Tank
T-4
000
Vapo
ur A
ir Pu
rge
T420
0 So
ur G
as
XV-4
010
XV-4
003
XV-4
700
XV-4
220
XV-4
601
2036
-Q-0
003
2036
-Q-0
005
2036
-Q-0
005
Load
ing
Pum
p
PMB
inle
t to
T460
0
PMB
Out
let f
rom
T47
00
A470
0
2036
-Q-0
003
Mix
er fo
r T46
00
2036
-Q-0
002
2036
-Q-0
008
Hot
Oil
Supp
ly to
T47
00
A460
0
TCV-
4700
PMB
Inle
t to
T470
020
36-Q
-000
5
Gan
try P
ump
2036
-Q-0
002
XV-4
701
2036
-Q-0
003
2036
-Q-0
002
2306
-Q-0
008
Hot
Oil
supp
ly to
T46
00
Mix
er fo
r T47
00
JC AG BT
2036
-Q-0
003
2036
-Q-0
002
XV-4
201
T420
0 M
ix T
ank
Out
let
2036
-Q-0
002
BTCLIENT
MB
BYAG
CHECKED A3PUMA DOCUMENT NO.SHEET SIZE
CAUSE AND EFFECT CHART SHEET 1 OF 1
2036-EQCE-0001REVISION
BAPPROVED10-Dec-19 MB AG
2036
-Q-0
003
Hot
Oil
supp
ly to
T42
00 c
oil 2
2036
-Q-0
002
T420
0 M
ix T
ank
Inle
t
2036
-Q-0
002
PMB
Tran
sfer
Pum
p
MB
T410
0 Ex
tract
Oil
Inle
t/Out
let
XV-4
610
Hom
ogen
iser
XV-4
100
P100
1
Des
crip
tion
2036
-Q-0
001
2036
-Q-0
001
DESCRIPTION
RE-ISSUED FOR REVIEW
BY:
2036
-Q-0
008
Hot
Oil
supp
ly to
T42
00 c
oil 1
Hot
Oil
supp
ly to
T40
00
DATE
P400
0
ISSUED FOR REVIEW
C17
0 Bi
tum
en O
utle
t fro
m T
4000
2036
-Q-0
001
TCV-
4000
1. Pump speed control philosophy is to slow the pump incrementally before tripping
Emergency Shutdown
EFFE
CT
XV-4
000
2036
-Q-0
001
Tag
No
Load
ing
Pum
p #1
2185
33-P
I-10
P&ID
No
Bitu
men
C17
0 Pu
mp
PMB BITUMEN
DRAWING TITLE:
2036
-Q-0
001
C17
0 Bi
tum
en In
let t
o T4
000
COMMENTS
2036
-Q-0
008
15-May-20
DATE:
AG
CHECKED:
BOTANY BAY PMB PRODUCTION FACILITYDATE:APPROVED:
Project No.
PUMA ENERGY (AUSTRALIA) HOLDINGS
PROJECT TITLE:
DATE:AG
XV-4
710
Vapo
ur in
let t
o Kn
ock
out
PotS
P400
0
Tank
T-4
600
Vapo
ur A
ir Pu
rge
Tank
T-4
600
Vapo
ur A
ir Pu
rge
2036
-Q-0
003
Hot
Oil
supp
ly to
T41
00
P420
0
2036
-Q-0
008
T420
0 Sh
redd
er M
otor
2036
-Q-0
008

NOTES ( ):
HOLDS:1 Subject to Confirmation
LEGEND:C CloseO OpenOI Open inhibitESDSD ShutdownST StartA ActivateSI Start Inhibit
CAUSE
Tag No Description Setting P&ID NO.
LSHH-4000 SP4000 Liquid level High High HOLD 1 2036-Q-0002 CTAHH-4204 P4200 Motor Temperature High High 100°C 2036-Q-0003 SDTALL-4205 P4200 Pump Jacket Temperature Low Low 170°C 2036-Q-0003 SDTAHH-4207 H4200 Motor Temperature High High 100°C 2036-Q-0003 SDTAHH-4208 H4200 Homogeniser Temperature High High 200°C 2036-Q-0003 SDTALL-4208 H4200 Homogeniser Temperature Low Low 170°C 2036-Q-0003 SDTAHH-4600 T4600 Tank Temperature High High 200°C 2036-Q-0003 C SD C SDTALL-4600 T4600 Tank Temperature Low Low 170°C 2036-Q-0003 SD SDTAHH-4601 T4600 Tank Temperature High High 200°C 2036-Q-0003 C SD C SDTALL-4601 T4600 Tank Temperature Low Low 170°C 2036-Q-0003 SD SDTALL-4602 P4400 Pump Jacket Temperature Low Low 170°C 2036-Q-0003 SDTAHH-4603 P4400 Motor Temperature High High 100°C 2036-Q-0003 SDZIC-XV4600 XV-4600 Not Open - 2036-Q-0003 SITAHH-4604 A4600 Motor Temperature High High 100°C 2036-Q-0003 SDLAH-4601 T4600 Tank Level High 11875 mm 2036-Q-0003 C
LAHH-4601 T4600 Tank Level High High 12315 mm 2036-Q-0003 SDLAL-4601 T4600 Tank Level Low 2291 mm 2036-Q-0003 C SILALL-4601 T4600 Tank Level Low Low 2197 mm 2036-Q-0003 SDPAHH-4201 P4200 Pump Discharge Pressure High High 1000 kPag 2036-Q-0003 SDPALL-4202 P4200 Pump Suction Pressure Low Low (-) 75 kPag 2036-Q-0003 SDPAHH-4203 H4200 Homogeniser Discharge Pressure High High 1000 kPag 2036-Q-0003 SDPALL-4204 H4200 Homogeniser Suction Pressure Low Low (-) 75 kPag 2036-Q-0003 SDPAHH-4600 P4400 Pump Discharge Pressure High High 1000 kPag 2036-Q-0003 SDDPAH-4200 DPIT-4200 Differential Pressure High 20 kPa 2036-Q-0003 SI
DPAHH-4200 DPIT-4200 Differential Pressure High High 25 kPa 2036-Q-0003 SDDPAH-4600 DPIT-4600 Differential Pressure High 20 kPa 2036-Q-0003 SI
DPAHH-4600 DPIT-4600 Differential Pressure High High 25 kPa 2036-Q-0003 SDTAHH-4700 T4700 Tank Temperature High High 200°C 2036-Q-0005 SD CTALL-4700 T4700 Tank Temperature Low Low 170°C 2036-Q-0005 SD SDTAHH-4701 T4700 Tank Temperature High High 200°C 2036-Q-0005 SD CTALL-4701 T4700 Tank Temperature Low Low 170°C 2036-Q-0005 SD SDTAHH-4702 A4700 Motor Temperature High High HOLD 1 2036-Q-0005 SDTALL-4302 P4300 Pump Jacket Temperature Low Low 140 °C 2036-Q-0005 SDTAHH-4301 P4300 Motor Temperature High High 100°C 2036-Q-0005 SDLAH-4700 T4700 Tank Level High 11875 mm 2036-Q-0005 C
LAHH-4700 T4700 Tank Level High High 12315 mm 2036-Q-0005 SDLAL-4700 T4700 Tank Level Low 2297 mm 2036-Q-0005 SI CLALL-4700 T4700 Tank Level Low Low 2197 mm 2036-Q-0005 SDPAHH-4700 P4700 Pump Discharge Pressure High High 1000 kPag 2036-Q-0005 SDDPAH-4700 DPIT-4700 Differential Pressure High 20 kPa 2036-Q-0005 SI
DPAHH-4700 DPIT-4700 Differential Pressure High High 25 kPa 2036-Q-0005 SDZIC-XV4700 XV-4700 Not Open - 2036-Q-0005 SITAHH-4800 Gantry Bay 2 Temperature High High 200°C 2036-Q-0006 SD SDTAHH-4801 Gantry Bay 1 Temperature High High 200°C 2036-Q-0006 SD SD
LEL-4000-HH High High LEL Level in PMB Sour Gass System >25% 2036-Q-0002 SD SD SD C C C C C SD C C SD SD C C C C C C C SD C C C SD SD C C C SD C C C C C C C SDLEL-4001-HH High High LEL Level in PMB Sour Gass System >25% 2036-Q-0002 SD SD SD C C C C C SD C C SD SD C C C C C C C SD C C C SD SD C C C SD C C C C C C C
AA-4000 High High H2S level in PMB Facility (T4200) >8 ppm (HOLD) 2036-Q-0002 SD SD SD C C C C C SD C C SD SD C C C C C C C SD C C C SD SD C C C SD C C C C C C CAA-4001 High High H2S level in PMB Facility (T4200) >8 ppm (HOLD) 2036-Q-0002 SD SD SD C C C C C SD C C SD SD C C C C C C C SD C C C SD SD C C C SD C C C C C C CAA-4004 High High H2S level in PMB Facility (T4600) >8 ppm (HOLD) 2036-Q-0002 SD SD SD C C C C C SD C C SD SD C C C C C C C SD C C C SD SD C C C SD C C C C C C CAA-4002 High High H2S level in PMB Facility (T4700) >8 ppm (HOLD) 2036-Q-0002 SD SD SD C C C C C SD C C SD SD C C C C C C C SD C C C SD SD C C C SD C C C C C C CAA-4003 High High H2S level in PMB Facility (Gantry Area) >8 ppm (HOLD) 2036-Q-0002 SD SD SD C C C C C SD C C SD SD C C C C C C C SD C C C SD SD C C C SD C C C C C C C
Terminal Combustor not available (Signal from Terminal) SD SD SD C C C C C SD C C SD SD C C C C C C C SD C C C SD SD C C C SD C C C C C C CE Stop
ESD-1 Inside Switchroom on ESD-101 Door SD SD SD C C C C C C C C SD SD C C C C C C C SD C C C SD C C C C SD C C C C C C CESD-2 Control Building ESD-102 Door SD SD SD C C C C C C C C SD SD C C C C C C C SD C C C SD C C C C SD C C C C C C CESD-3 Hopper SD SD SD C C C C C C C C SD SD C C C C C C C SD C C C SD C C C C SD C C C C C C CESD-4 Top Tank T4200 SD SD SD C C C C C C C C SD SD C C C C C C C SD C C C SD C C C C SD C C C C C C CESD-5 Pump Bank SD SD SD C C C C C C C C SD SD C C C C C C C SD C C C SD C C C C SD C C C C C C CESD-6 External Switchroom SD SD SD C C C C C C C C SD SD C C C C C C C SD C C C SD C C C C SD C C C C C C C
BA
UGL DOC No. PB2036-2000-PRO-REP-001 REV
XV-4
800
XV-4
221
XV-4
222
XV-4
223
2036
-Q-0
011
2036
-Q-0
011
2036
-Q-0
011
P440
0 Su
pply
to G
antry
P430
0 Su
pply
to G
antry
Load
ing
Arm
at G
antry
Bay
2
Solid
out
let f
rom
Hop
per H
4000
Bitu
men
sup
ply
for V
entu
ri SP
4001
Bitu
men
Fro
m V
entu
ri SP
4001
BPUMA DOCUMENT NO. REVISION
DESCRIPTION DATE BY CHECKED APPROVED CLIENT A3 2036-EQCE-0001
BT CAUSE AND EFFECT CHART SHEET 2 OF 2ISSUED FOR REVIEW 10-Dec-19 MB AG AG BT SHEET SIZE
AG BOTANY BAY PMB PRODUCTION FACILITYRE-ISSUED FOR REVIEW 15-May-20 MB JC AG
AGPMB BITUMEN
PUMA ENERGY (AUSTRALIA) HOLDINGSCHECKED: DATE:
Project No.MB NABY: DATE: SCALE:
REF:
APPROVED:
PROJECT TITLE:
DRAWING TITLE:
DATE: STATUS:
XV-4
700
P430
0
TCV-
4700
COMMENTS
XV-4
710
XV-4
453
XV-4
711
A460
0
XV-4
600
XV-4
601
P440
0
A470
0
XV-4
701
XV-4
610
XV-4
201
XV-4
200
FCV-
4001
FCV-
4200
XV-4
003
TCV-
4600
XV-4
220
TCV-
4100
M42
00
TCV-
4200
-1
TCV-
4200
-2
H42
00
P420
0
Emergency Shutdown
Tag
No
P400
0
P410
0
P100
1
XV-4
001
XV-4
000
XV-4
100
TCV-
4000
Mix
er fo
r T47
00
PMB
Inle
t to
T470
0
PMB
Out
let f
rom
T47
00
Gan
try P
ump
Hot
Oil
Supp
ly to
T47
00
Tank
T-4
600
Vapo
ur A
ir Pu
rge
SP-4
000
Vapo
ur D
isch
arge
Hot
Oil
supp
ly to
T46
00
Mix
er fo
r T46
00
PMB
Out
let f
rom
T460
0
PMB
inle
t to
T460
0
Load
ing
Pum
p
Vapo
ur in
let t
o SP
-400
0
Tank
T-4
600
Vapo
ur A
ir Pu
rge
Hom
ogen
iser
PMB
Tran
sfer
Pum
p
T420
0 M
ix T
ank
Inle
t
T420
0 M
ix T
ank
Out
let
Tank
Vap
our A
ir Pu
rge
T420
0 So
ur G
as
T410
0 Ex
tract
Oil
Inle
t/Out
let
Hot
Oil
supp
ly to
T40
00
Hot
Oil
supp
ly to
T41
00
T420
0 Sh
redd
er M
otor
Hot
Oil
supp
ly to
T42
00 c
oil 1
Hot
Oil
supp
ly to
T42
00 c
oil 2
1. Pump speed control philosophy is to slow the pump incrementally before tripping
EFFE
CT
Des
crip
tion
Bitu
men
C17
0 Pu
mp
Extra
ct O
il Pu
mp
Load
ing
Pum
p #1
C17
0 Bi
tum
en In
let t
o T4
000
C17
0 Bi
tum
en O
utle
t fro
m T
4000
2036
-Q-0
005
2036
-Q-0
005
2036
-Q-0
005
2036
-Q-0
005
2036
-Q-0
008
2036
-Q-0
005
2036
-Q-0
006
2036
-Q-0
006
2036
-Q-0
006
2036
-Q-0
002
2306
-Q-0
008
2036
-Q-0
003
2036
-Q-0
003
2036
-Q-0
003
2036
-Q-0
003
2036
-Q-0
002
2036
-Q-0
003
2036
-Q-0
003
2036
-Q-0
003
2036
-Q-0
002
2036
-Q-0
002
2036
-Q-0
002
2036
-Q-0
002
2036
-Q-0
001
2036
-Q-0
008
2036
-Q-0
008
2036
-Q-0
002
2036
-Q-0
008
2036
-Q-0
008
P&ID
No
2036
-Q-0
001
2036
-Q-0
001
2185
33-P
I-10
2036
-Q-0
001
2036
-Q-0
001

1

GHD | Report for Puma Energy Australia - Botany PMB and CRMB Project, 12533800 | 36
Appendix B – ETC sampling report

20 January 2006 Report No: 060008r
Page: 1 of 10 GHD Services Pty Ltd Level 8, 180 Lonsdale Street Melbourne VIC 3000
Emission Testing – January 2006 Boral Gepps Cross and Salisbury Quarry
Dear Mr. Scott Anderson, Tests were performed on 12 January 2006 to determine levels of odour, volatile organic compounds (VOC’s) and polycyclic aromatic hydrocarbons (PAH’s) in the headspaces of a bitumen kettle at Boral Gepps Cross and another at Boral Salisbury Quarry.
DEFINITIONS.................................................................................................. 2 PLANT OPERATING CONDITIONS............................................................... 2 TEST METHODS ............................................................................................ 3 DEVIATIONS FROM TEST METHODS.......................................................... 3 ODOUR SAMPLING AND ANALYSIS PARAMETERS .................................. 4 RESULTS........................................................................................................ 5
Bitumen kettle headspace – Gepps Cross.............................................. 5 Bitumen kettle headspace – Salisbury Quarry ........................................ 8
Yours faithfully Emission Testing Consultants Pty Ltd
Matthew Heskin
Director
.

Report prepared for: GHD Services Pty Ltd
Date: 20 January 2006 Report No: 060008r Page: 2 of 10
DEFINITIONS
The following symbols and abbreviations are used in this test report:
NTP Normal temperature and pressure. Gas volumes and concentrations are expressed on a dry basis at 0°C, at discharge oxygen concentration and an absolute pressure of 101.325 kPa, unless otherwise specified.
Disturbance A flow obstruction or instability in the direction of the flow that may impede accurate flow determination. This includes centrifugal fans, axial fans, partially closed or closed dampers, louvres, bends, connections, junctions, direction changes or changes in pipe diameter.
BSP British standard pipe.
VOC Any chemical compound based on carbon in the boiling range 36 to 126°C, with a vapour pressure of at least 0.010kPa at 25°C (or having a corresponding volatility under the particular conditions of use) that adsorb onto activated charcoal and desorb into CS2, or that can be collected in a tedlar bag and be quantitatively recovered, and that are detected by GCMS. These compounds may contain oxygen, nitrogen and other elements, but specifically excluded are CO, CO2, carbonic acid, metallic carbides and carbonate salts.
D Duct diameter or equivalent duct diameter for rectangular ducts.
> Greater than
< Less than the minimum limit of detection using the specified method.
~ Approximately
NA Not applicable
PLANT OPERATING CONDITIONS
Plant operating conditions were supplied by Boral personnel.
Site Gepps Cross Salisbury Quarry
Bitumen grade
Volume of bitumen in kettle (L) 13000 31750
Temperature of bitumen (°C) 160 150
Temperature of headspace (°C) 143 122
Ambient temperature (°C) 20.8 17.1
Relative humidity (%) 63 71

Report prepared for: GHD Services Pty Ltd
Date: 20 January 2006 Report No: 060008r Page: 3 of 10
TEST METHODS
The following methods are accredited with the National Association of Testing Authorities (NATA) and are approved for the sampling and analysis of gases. Specific details of the methods are available on request.
All sampling and analysis conducted in accordance with EPA Vic approved methods and EPA publication 440.1.
All parameters are reported adjusted to dry NTP conditions unless otherwise stated.
On site sampling guidelines: according to ETC method 1.
Odour: according to AS4323.3, by dynamic olfactometry (forced-choice technique). Panel n-butanol threshold determination by analysis against a NATA certified n-butanol gas standard. Sampling conducted in duplicate. Concentrations reported on a wet NTP basis.
Volatile organic compounds (VOC): according to Vic EPA method 4230, by on site sampling onto a sorbent tube, with subsequent laboratory analysis by solvent desorption and GCMS. Where possible the ten major organic compounds were identified, quantified and reported. Any other VOC’s were quantified as the top compound present. Analysis performed under subcontract by MGT Environmental Consulting (NATA accreditation number 1261); report number 190326 dated 19 January 2006. Sampling conducted in duplicate.
Note: Laboratory analysis is not NATA endorsed.
Polycyclic aromatic hydrocarbons (PAHs): sampled according to Vic EPA method 4230, by on site sampling into a filter and sorbent tube, with subsequent laboratory analysis according to USEPA 8270C by solvent desorption and GCMS. Analysis performed under subcontract by MGT Environmental Consulting (NATA accreditation number 1261); report number 190326 dated 19 January 2006. Sampling conducted in duplicate.
DEVIATIONS FROM TEST METHODS
Polycyclic aromatic hydrocarbons (PAHs): greater than 10% of the total amount of naphthalene was present in the back section of the sorbent tube of all four samples. This may have lead to an underestimation of the concentration present in the headspaces of either or both kettles.

Report prepared for: GHD Services Pty Ltd
Date: 20 January 2006 Report No: 060008r Page: 4 of 10
ODOUR SAMPLING AND ANALYSIS PARAMETERS
Technique: AS4323.3 - Forced Choice
Reference odorant and threshold limits: n-Butanol, 20 to 80 ppb
Panel n-Butanol threshold value: 64 ppb
Date and time of analysis: 13/01/2006 @ 1000 - 1100hrs
Pre-dilution: 0.4L sample air + 10L dilution air (1 in 26)
Pre-dilution equipment: Dry Gas Meter 1025

Report prepared for: GHD Services Pty Ltd
Date: 20 January 2006 Report No: 060008r Page: 5 of 10
RESULTS
Bitumen kettle headspace – Gepps Cross
12 January 2006
Odour ResultsSample
ID
Sampling
Times
Odour 169 0828-0829 69,000 ou
182 0829-0830 77,000 ou
Average Results 73,000 ou
Concentration

Report prepared for: GHD Services Pty Ltd
Date: 20 January 2006 Report No: 060008r Page: 6 of 10
Bitumen kettle headspace – Gepps Cross
12 January 2006
Volatile Organic Compound (VOC)
Results
GC Mario
Sampling
Times
2-ethyl-1-decanol* - Test 1 0825-0835 150 mg/m³
2-ethyl-1-decanol* - Test 2 0825-0835 170 mg/m³
Average Results 160 mg/m³
2-propyl-1-heptanol* - Test 1 0825-0835 130 mg/m³
2-propyl-1-heptanol* - Test 2 0825-0835 170 mg/m³
Average Results 150 mg/m³
2-butyl-1-octanol* - Test 1 0825-0835 120 mg/m³
2-butyl-1-octanol* - Test 2 0825-0835 130 mg/m³
Average Results 130 mg/m³
2-ethyl-1-dodecanol* - Test 1 0825-0835 110 mg/m³
2-ethyl-1-dodecanol* - Test 2 0825-0835 160 mg/m³
Average Results 130 mg/m³
Hexyl octyl ether* - Test 1 0825-0835 50 mg/m³
Hexyl octyl ether* - Test 2 0825-0835 49 mg/m³
Average Results 49 mg/m³
0825-0835 33 mg/m³
0825-0835 31 mg/m³
Average Results 32 mg/m³
0825-0835 30 mg/m³
0825-0835 28 mg/m³
Average Results 29 mg/m³
m,p-xylenes - Test 1 0825-0835 23 mg/m³
m,p-xylenes - Test 2 0825-0835 22 mg/m³
Average Results 22 mg/m³
0825-0835 22 mg/m³
0825-0835 20 mg/m³
Average Results 21 mg/m³
Toluene - Test 1 0825-0835 13 mg/m³
Toluene - Test 2 0825-0835 13 mg/m³
Average Results 13 mg/m³
Minor VOC's* - Test 1 0825-0835 880 mg/m³
Minor VOC's* - Test 2 0825-0835 870 mg/m³
Average Results 870 mg/m³
1,2,4-trimethylbenzene* - Test 1
1,2,4-trimethylbenzene* - Test 2
1,3,5-trimethylbenzene* - Test 1
1,3,5-trimethylbenzene* - Test 2
1,2,3-trimethylbenzene* - Test 1
1,2,3-trimethylbenzene* - Test 2
Concentration at NTP

Report prepared for: GHD Services Pty Ltd
Date: 20 January 2006 Report No: 060008r Page: 7 of 10
Bitumen kettle headspace – Gepps Cross
12 January 2006
Polycyclic Aromatic Hydrocarbon
(PAH) Results
GC Mario
Sampling
Times
Acenaphthene - Test 1 0825-0835 < 0.005 mg/m³
Acenaphthene - Test 2 0825-0835 < 0.010 mg/m³
Acenaphthylene - Test 1 0825-0835 < 0.005 mg/m³
Acenaphthylene - Test 2 0825-0835 < 0.005 mg/m³
Anthracene - Test 1 0825-0835 < 0.005 mg/m³
Anthracene - Test 2 0825-0835 < 0.005 mg/m³
Benz(a)anthracene - Test 1 0825-0835 < 0.005 mg/m³
Benz(a)anthracene - Test 2 0825-0835 < 0.005 mg/m³
Benzo(a)pyrene - Test 1 0825-0835 < 0.005 mg/m³
Benzo(a)pyrene - Test 2 0825-0835 < 0.005 mg/m³
0825-0835 < 0.005 mg/m³
0825-0835 < 0.005 mg/m³
Benzo(g,h,i)perylene - Test 1 0825-0835 < 0.005 mg/m³
Benzo(g,h,i)perylene - Test 2 0825-0835 < 0.005 mg/m³
0825-0835 < 0.005 mg/m³
0825-0835 < 0.005 mg/m³
Chrysene - Test 1 0825-0835 < 0.005 mg/m³
Chrysene - Test 2 0825-0835 < 0.005 mg/m³
0825-0835 < 0.005 mg/m³
0825-0835 < 0.005 mg/m³
Fluoranthene - Test 1 0825-0835 < 0.005 mg/m³
Fluoranthene - Test 2 0825-0835 < 0.005 mg/m³
Fluorene - Test 1 0825-0835 0.045 mg/m³
Fluorene - Test 2 0825-0835 0.045 mg/m³
Average Results 0.045 mg/m³
0825-0835 < 0.005 mg/m³
0825-0835 < 0.005 mg/m³
Naphthalene - Test 1 0825-0835 2.0 mg/m³
Naphthalene - Test 2 0825-0835 1.7 mg/m³
Average Results 1.9 mg/m³
Phenanthrene - Test 1 0825-0835 < 0.02 mg/m³
Phenanthrene - Test 2 0825-0835 < 0.02 mg/m³
Pyrene - Test 1 0825-0835 < 0.005 mg/m³
Pyrene - Test 2 0825-0835 < 0.005 mg/m³
Total PAH - Test 1 0825-0835 2.3 mg/m³
Total PAH - Test 2 0825-0835 1.9 mg/m³
Average Results 2.1 mg/m³
Indeno(1,2,3-cd)pyrene - Test 1
Indeno(1,2,3-cd)pyrene - Test 2
Benzo(k)fluoranthene - Test 1
Benzo(k)fluoranthene - Test 2
Dibenz(a,h)anthracene - Test 1
Dibenz(a,h)anthracene - Test 2
Benzo(b)fluoranthene - Test 1
Benzo(b)fluoranthene - Test 2
Concentration at NTP
Refer to “DEVIATIONS FROM TEST METHODS” on page 4.

Report prepared for: GHD Services Pty Ltd
Date: 20 January 2006 Report No: 060008r Page: 8 of 10
Bitumen kettle headspace – Salisbury Quarry
12 January 2006
Odour ResultsSample
ID
Sampling
Times
Odour 6 0720-0721 77,000 ou
183 0721-0722 82,000 ou
Average Results 79,000 ou
Concentration

Report prepared for: GHD Services Pty Ltd
Date: 20 January 2006 Report No: 060008r Page: 9 of 10
Bitumen kettle headspace – Salisbury Quarry
12 January 2006
Volatile Organic Compound (VOC)
Results
SQ Mike
Sampling
Times
2-butyl-1-octanol* - Test 1 0715-0725 450 mg/m³
2-butyl-1-octanol* - Test 2 0715-0725 310 mg/m³
Average Results 380 mg/m³
2-ethyl-1-decanol* - Test 1 0715-0725 380 mg/m³
2-ethyl-1-decanol* - Test 2 0715-0725 240 mg/m³
Average Results 310 mg/m³
Hexyl octyl ether* - Test 1 0715-0725 270 mg/m³
Hexyl octyl ether* - Test 2 0715-0725 190 mg/m³
Average Results 230 mg/m³
2-propyl-1-heptanol* - Test 1 0715-0725 220 mg/m³
2-propyl-1-heptanol* - Test 2 0715-0725 150 mg/m³
Average Results 180 mg/m³
0715-0725 100 mg/m³
0715-0725 70 mg/m³
Average Results 87 mg/m³
m,p-xylene - Test 1 0715-0725 92 mg/m³
m,p-xylene - Test 2 0715-0725 64 mg/m³
Average Results 78 mg/m³
2-ethyl-1-dodecanol* - Test 1 0715-0725 86 mg/m³
2-ethyl-1-dodecanol* - Test 2 0715-0725 58 mg/m³
Average Results 72 mg/m³
Toluene - Test 1 0715-0725 81 mg/m³
Toluene - Test 2 0715-0725 57 mg/m³
Average Results 69 mg/m³
0715-0725 81 mg/m³
0715-0725 53 mg/m³
Average Results 67 mg/m³
0715-0725 58 mg/m³
0715-0725 40 mg/m³
Average Results 49 mg/m³
Minor VOC's* - Test 1 0715-0725 1,400 mg/m³
Minor VOC's* - Test 2 0715-0725 980 mg/m³
Average Results 1,200 mg/m³
1,2,3-trimethylbenzene* - Test 1
1,2,3-trimethylbenzene* - Test 2
1,2,4-trimethylbenzene* - Test 1
1,2,4-trimethylbenzene* - Test 2
Concentration at NTP
1,3,5-trimethylbenzene* - Test 1
1,3,5-trimethylbenzene* - Test 2

Report prepared for: GHD Services Pty Ltd
Date: 20 January 2006 Report No: 060008r Page: 10 of 10
Bitumen kettle headspace – Salisbury Quarry
12 January 2006
Polycyclic Aromatic Hydrocarbon
(PAH) Results
SQ Mike
Sampling
Times
Acenaphthene - Test 1 0715-0725 < 0.005 mg/m³
Acenaphthene - Test 2 0715-0725 < 0.005 mg/m³
Acenaphthylene - Test 1 0715-0725 < 0.005 mg/m³
Acenaphthylene - Test 2 0715-0725 < 0.005 mg/m³
Anthracene - Test 1 0715-0725 < 0.005 mg/m³
Anthracene - Test 2 0715-0725 < 0.005 mg/m³
Benz(a)anthracene - Test 1 0715-0725 < 0.005 mg/m³
Benz(a)anthracene - Test 2 0715-0725 < 0.005 mg/m³
Benzo(a)pyrene - Test 1 0715-0725 < 0.005 mg/m³
Benzo(a)pyrene - Test 2 0715-0725 < 0.005 mg/m³
0715-0725 < 0.005 mg/m³
0715-0725 < 0.005 mg/m³
Benzo(g,h,i)perylene - Test 1 0715-0725 < 0.005 mg/m³
Benzo(g,h,i)perylene - Test 2 0715-0725 < 0.005 mg/m³
0715-0725 < 0.005 mg/m³
0715-0725 < 0.005 mg/m³
Chrysene - Test 1 0715-0725 < 0.005 mg/m³
Chrysene - Test 2 0715-0725 < 0.005 mg/m³
0715-0725 < 0.005 mg/m³
0715-0725 < 0.005 mg/m³
Fluoranthene - Test 1 0715-0725 < 0.005 mg/m³
Fluoranthene - Test 2 0715-0725 < 0.005 mg/m³
Fluorene - Test 1 0715-0725 0.048 mg/m³
Fluorene - Test 2 0715-0725 0.037 mg/m³
Average Results 0.043 mg/m³
0715-0725 < 0.005 mg/m³
0715-0725 < 0.005 mg/m³
Naphthalene - Test 1 0715-0725 1.2 mg/m³
Naphthalene - Test 2 0715-0725 1.6 mg/m³
Average Results 1.4 mg/m³
Phenanthrene - Test 1 0715-0725 < 0.03 mg/m³
Phenanthrene - Test 2 0715-0725 < 0.03 mg/m³
Pyrene - Test 1 0715-0725 < 0.005 mg/m³
Pyrene - Test 2 0715-0725 < 0.005 mg/m³
Total PAH - Test 1 0715-0725 1.5 mg/m³
Total PAH - Test 2 0715-0725 1.8 mg/m³
Average Results 1.6 mg/m³
Indeno(1,2,3-cd)pyrene - Test 1
Indeno(1,2,3-cd)pyrene - Test 2
Benzo(k)fluoranthene - Test 1
Benzo(k)fluoranthene - Test 2
Dibenz(a,h)anthracene - Test 1
Dibenz(a,h)anthracene - Test 2
Benzo(b)fluoranthene - Test 1
Benzo(b)fluoranthene - Test 2
Concentration at NTP
Refer to “DEVIATIONS FROM TEST METHODS” on page 4

GHD | Report for Puma Energy Australia - Botany PMB and CRMB Project, 12533800 | 37
Appendix C – Air Noise Environment sampling report

Emissions Monitoring: PinkenbaFacility: H655 and TK406
Puma Energy398 Tingara Street
Pinkenba,
QLD 4008
Sampling Date: 28 September 2020
Issued: 12 October 2020
Prepared by:Air Noise EnvironmentABN: 13 081 834 513

Brisbane Office
A: Unit 3, 4 Tombo Street,
Capalaba, QLD 4157
T: +61 1300 851 761
Page 2 of 9 Puma Energy- Emissions Monitoring: Pinkenba Facility: H655 and TK406
C:\Users\gh\Desktop\207402.0183\Reporting\0183.Draft results01.odt

DOCUMENT CONTROL SHEET
Document DetailsProject Reference: 0183.Draft results01.odtDocument Title: Emissions Monitoring: Pinkenba Facility: H655 and TK406
Client: Puma EnergyDocument Reference: C:\Users\gh\Desktop\207402.0183\Reporting\0183.Draft results01.odt
Version NumberVersion: Issue Date: Prepared by: Description: Approved by: Signature:
00 7/10/20 Gary Hall Draft provisional results - -
01 12/10/20 Gary Hall Updated Draft Results - -
02
Revision HistoryRevision: Issue Date: Approved by: Signature: Details of Revision:
01.1
01.2
Copyright:
Air Noise Environment retains ownership of the copyright to all reports, drawings, designs, plans, figures and other workproduced by Air Noise Environment Pty Ltd during the course of fulfilling a commission. The client named on the cover of thisdocument shall have a licence to use such documents and materials for the purpose of the subject commission provided theyare reproduced in full or, alternatively, in part with due acknowledgement to Air Noise Environment. Third parties must notreproduce this document, in part or in full, without obtaining the prior permission of Air Noise Environment Pty Ltd.
Disclaimer:
This document has been prepared with all due care and attention by professional environmental practitioners according toaccepted practices and techniques. This document is issued in confidence and is relevant only to the issues pertinent to thesubject matter contained herein. Air Noise Environment Pty Ltd holds no responsibility for misapplication or misinterpretationby third parties of the contents of this document. If the revision history does not state that a Final version of the documenthas been issued, then it remains a draft. Draft versions of this document should not be relied upon for any purpose by theclient, regulatory agencies or other interested parties.
Where site inspections, testing or fieldwork have taken place, the report is based on the information made available by theclient or their nominees during the visit, visual observations and any subsequent discussions with regulatory authorities. It isfurther assumed that normal activities were being undertaken at the site on the day of the site visit(s).
The validity and comprehensiveness of supplied information has not been independently verified and, for the purposes of thisreport, it is assumed that the information provided to Air Noise Environment Pty Ltd for the purposes of this project is bothcomplete and accurate.
Page 3 of 9 Puma Energy- Emissions Monitoring: Pinkenba Facility: H655 and TK406
C:\Users\gh\Desktop\207402.0183\Reporting\0183.Draft results01.odt

Table of ContentsSummary 5
Table 1: Summary of Results 5
Table 1: Summary of Results for VOC and PAH for TK406 6
Appendix 1 – Odour Results 7
Appendix 2 – Sampling Results from H655 Sampled on 17 June 2020 8
Index of TablesTable 1: Summary of Results 5
Table 1: Summary of Results for VOC and PAH for TK406 6
Page 4 of 9 Puma Energy- Emissions Monitoring: Pinkenba Facility: H655 and TK406
C:\Users\gh\Desktop\207402.0183\Reporting\0183.Draft results01.odt

SummaryGas emission sampling was conducted from the heater stack H655 and from the TK406 tank vent at
the Puma Pinkenba Bitumen plant on 28 September 2020.
A total of 5 odour samples were collected. 2 odour samples were collected at the H655 stack. 3
odour samples were collected at the TK406 vent. Sampling for SO2 was conducted with a real time
electro-chemical gas analyser. An average of the SO2 results is included in the summary table below.
The raw data spreadsheets are available for review.
A summary of the provisional results are included in Table 1 and Table 2 below.
Table 1: Summary of Results
Compound Stack (H655) TK406 Vent Units
Odour (Sample 1) 279 OU (11:45) 92,700 OU (11:13) OU
Odour (Sample 2) 470 OU (11:50) 92,700 (OU) (11:20) OU
Odour (Sample 3) - 46,300 (OU) (12:14) OU
Sulphur Dioxide (average) 4 ppm (11:20 – 12:26) 9 ppm (11:30 – 12:37) ppm
PAH (Sample 1) BDLd (11:50) See Table 2 below (11:20) mg/m3
PAH (Sample 2) BDLd (11:54) See Table 2 below (11:28) mg/m3
PAH (Sample 3) - See Table 2 below (12:25) mg/m3
Speciated VOC (Sample 1) BDLd (11:50) See Table 2 below (11:20) mg/m3
Speciated VOC Sample 2) BDLd (11:54) See Table 2 below (11:28) mg/m3
Speciated VOC (Sample 3) - See Table 2 below (12:25) mg/m3
Velocity 2.6 a -b m/s
Stack/Duct Temperature 215 28c °C
Duct diameter 1.2 0.21 m
a Velocity measured during 17 June sampling campaign, Report 6200.H655.report01.1 (included as Appendix 2)b Velocity was not possible to measure at the sampling nipple on the tank duct.C Surface temperature of the Tank vent duct.d Below Detection Limits (approximately <0.1 mg/Nm3)
Production data during sampling:
Crumbed rubber was added to the Tank TK406 from 10:20 am to 11:00 am. Sampling was conducted after the crumbed rubber was added to the tank.
The odour Laboratory results are included as Appendix 1
Sampling results for 17 June 2020 for the H655 stack are included in Appendix 2.
Page 5 of 9 Puma Energy- Emissions Monitoring: Pinkenba Facility: H655 and TK406
C:\Users\gh\Desktop\207402.0183\Reporting\0183.Draft results01.odt

Table 2: Summary of Results for VOC and PAH for TK406
Compound TK406 Vent (11:20)
TK406 Vent (11:28)
TK406 Vent (12:25)
Units a
Naphthalene 1.38 1.31 1.63 mg/Nm3
Benzene 6.74 5.39 5.54 mg/Nm3
Toluene 33.06 29.58 29.01 mg/Nm3
Ethylbenzene 6.61 5.60 5.27 mg/Nm3
m & p-Xylenes 171.93 147.90 145.05 mg/Nm3
o-Xylene 1.72 1.37 1.23 mg/Nm3
Styrene 0.56 0.40 0.29 mg/Nm3
Isopropylbenzene 0.94 0.80 0.71 mg/Nm3
n-Propylbenzene 1.08 0.90 0.79 mg/Nm3
1,3,5-Trimethylbenzene
1.08 0.88 0.75 mg/Nm3
1,2,4-Trimethylbenzene 4.10 3.28 2.77 mg/Nm3
sec-Butylbenzene 0.19 0.15 - mg/Nm3
4-Isopropyltoluene 5.29 4.33 3.82 mg/Nm3
n-Butylbenzene 1.85 1.58 1.32 mg/Nm3
a mg/Nm3 (wet)
The following compounds were analysed- Only those compounds where results were detected are reported above.:Naphthalene, Acenaphthylene, Acenaphthene, Fluorene, Phenanthrene, Anthracene, Fluoranthene, Pyrene, Benz(a)anthracene, Chrysene, Benzo(b)&(k)fluoranthene, Benzo(a)pyrene, Indeno(1,2,3-cd)pyrene, Dibenz(ah)anthracene, Benzo(ghi)perylene, Benzene, Toluene, Ethylbenzene, m & p-Xylenes, o-Xylene, Styrene, Isopropylbenzene, n-Propylbenzene, 1,3,5-Trimethylbenzene, tert-Butylbenzene, 1,2,4-Trimethylbenzene, sec-Butylbenzene, 4-Isopropyltoluene, n-Butylbenzene, Dichlorodifluoromethane, Chloromethane, Vinyl chloride, Bromomethane, Chloroethane, Trichlorofluoromethane, 1,1-Dichloroethane, Dichloromethane, trans-1,2-Dichloroethene, 1,1-Dichloroethene, 2,2-Dichloropropane, cis-1,2-Dichloroethene, Bromochloromethane, 1,1,1-Trichloroethane, Carbon tetrachloride, 1,1-Dichloropropene, 1,2-Dichloroethane, Trichloroethene, 1,2-Dichloropropane, Dibromomethane, cis-1,3-Dichloropropene, trans-1,3-Dichloropropene, 1,1,2-Trichloroethane, Tetrachloroethene, 1,3-Dichloropropane, 1,2-Dibromoethane, 1,1,1,2-Tetrachloroethane, 1,1,2,2-Tetrachloroethane, 1,2,3-Trichloropropane, 1,2-Dibromo-3-chloropropane, Hexachlorobutadiene, Chlorobenzene, Bromobenzene, 2-Chlorotoluene, 4-Chlorotoluene, 1,3-Dichlorobenzene, 1,4-Dichlorobenzene, 1,2-Dichlorobenzene, 1,2,4-Trichlorobenzene, 1,2,3-Trichlorobenzene, Chloroform, Bromodichloromethane, Dibromochloromethane, Bromoform,
Page 6 of 9 Puma Energy- Emissions Monitoring: Pinkenba Facility: H655 and TK406
C:\Users\gh\Desktop\207402.0183\Reporting\0183.Draft results01.odt

Appendix 1 – Odour Results
Page 7 of 9 Puma Energy- Emissions Monitoring: Pinkenba Facility: H655 and TK406
C:\Users\gh\Desktop\207402.0183\Reporting\0183.Draft results01.odt

Appendix 2 – Sampling Results from H655Sampled on 17 June 2020
Page 8 of 9 Puma Energy- Emissions Monitoring: Pinkenba Facility: H655 and TK406
C:\Users\gh\Desktop\207402.0183\Reporting\0183.Draft results01.odt

THE ODOUR UNIT (QLD) PTY LTD
Accreditation Number:
14974
The Odour Unit Pty Ltd Issue Date: 13.11.2003 Revision: 13 ABN 53 091 165 061 Issued By: SB Revision Date: 10/08/20 Form 06 – Odour Concentration Results Sheet Last printed 9/30/2020 1:51:00 PM Approved By: TJS
2
Odour Sample Measurement Results Panel Roster Number: BNE20200928_034
Sample Location TOU
Sample ID
Sampling Date & Time
Analysis Date & Time
Panel Size
Valid ITEs
Sample Odour Concentration
(ou)
6279.1 Stack BC20169 28/09/2020
11:45 28/09/2020
14:35 4 8 279
6279.2 Stack BC20168 28/09/2020
11:50 28/09/2020
14:07 4 8 470
6279.3 T406 BC20171 28/09/2020
11:13 28/09/2020
15:24 4 8 92,700
6279.4 T406 BC20172 28/09/2020
11:20 28/09/2020
15:48 4 8 92,700
6279.5 T406 BC20170 28/09/2020
12:14 28/09/2020
14:57 4 8 46,300
Samples Received in Laboratory – From: ANE – Gary Hall Date: 28/09/2020 Time: 13:30 Note: The following are not covered by the NATA Accreditation issued to The Odour Unit Pty Ltd:
1. The collection of Isolation Flux Hood (IFH) samples and the calculation of the Specific Odour Emission Rate (SOER). 2. Final results that have been modified by the dilution factors where parties other than The Odour Unit Pty Ltd have performed the dilution of samples.

THE ODOUR UNIT (QLD) PTY LTD
Accreditation Number:
14974
The Odour Unit Pty Ltd Issue Date: 13.11.2003 Revision: 13 ABN 53 091 165 061 Issued By: SB Revision Date: 10/08/20 Form 06 – Odour Concentration Results Sheet Last printed 9/30/2020 1:51:00 PM Approved By: TJS
3
Odour Panel Calibration Results
Reference Odorant
Reference Odorant Panel Roster Number
Concentration of Reference gas
(ppb)
Panel Target Range for n-butanol
(ppb)
Measured Concentration
(ou)
Measured Panel Threshold
(ppb)
Does this panel calibration
measurement comply with
AS/NZS4323.3:2001 (Yes / No)
n-butanol BNE20200928_034 51,100 20 ≤ ≤ 80 1,449 35 Yes
Comments
Odour Characterisation Results
Sample ID Character
BC20168 Chlorine, oily, fuel, mechanic workshop
BC20169 Chlorine, smoky
BC20170 Burnt, gassy, new shoes
BC20171 Smoky, gassy, rubber, plastic
BC20172 Smoky, gassy, rubber
Disclaimers
1. Parties, other than The Odour Unit Pty Ltd, responsible for collecting odour samples have advised that they have voluntarily furnished these odour samples, appropriately collected and labelled, to The Odour Unit Pty Ltd for the purpose of odour testing. 2. The collection of odour samples by parties other than The Odour Unit Pty Ltd relinquishes The Odour Unit Pty Ltd from all responsibility for the sample collection and any effects or actions that the results from the test(s) may have. 3. Any comments included in, or attachments to, this Report are not covered by the NATA Accreditation issued to The Odour Unit Pty Ltd. 4. This report shall not be reproduced, except in full, without written approval of The Odour Unit Pty Ltd.
Report Status
Status Version Date Prepared by Checked by Change Reason
Final 1.0 28/09/2020 Stephen Munro Stephen Munro - -
Revised - - - - - -
END OF DOCUMENT

THE ODOUR UNIT (QLD) PTY LTD
PO Box 365,
CAPALABA, Qld 4157
2/57 Neumann Rd, CAPALABA, Qld 4157
Phone: +61 (0)7 3245 1700 Facsimile: +61 (0)7 3245 1800 Email: [email protected] Internet: www.odourunit.com.au ABN: 87 102 255 765
Accreditation Number:
14974
The Odour Unit Pty Ltd Issue Date: 13.11.2003 Revision: 13
ABN 53 091 165 061 Issued By: SB Revision Date: 10.08.2020
Form 06B – Odour Concentration Results Sheet Last printed 9/30/2020 1:51:00 PM Approved By: TJS
1
Odour Concentration Measurement Report
The measurement was commissioned by: Organisation Air Noise Environment Telephone 07 3245 7808
Contact Gary Hall Facsimile -- Sampling Site Undisclosed Email [email protected]
Sampling Method Undisclosed Sampling Team ANE
Order details: Order requested by Gary Hall Order accepted by Stephen Munro
Date of order 25 September 2020 TOU Project # Q2190_05 Order number Email Project Manager Stephen Munro
Signed by -- Testing operator Stephen Munro
Investigated Item Odour concentration in odour units ‘ou’, determined by sensory odour concentration measurements, of an odour sample supplied in a sampling bag.
Identification The odour sample bags were labelled individually. Each label recorded the testing laboratory, sample
number, sampling location (or Identification), sampling date and time, dilution ratio (if dilution was used) and whether further chemical analysis was required.
Method The odour concentration measurements were performed using dynamic olfactometry according to the
Australian/New Zealand Standard: Stationary source emissions – Part 3: ‘Determination of odour concentration by dynamic olfactometry (AS/NZS4323.3:2001). The odour perception characteristics of the panel within the presentation series for the samples were analogous to that for butanol calibration. Any deviation from the Australian standard is recorded in the ‘Comments’ section of this report.
Measuring Range The measuring range of the olfactometer is 22 ≤ ≤ 218 ou. If the measuring range was insufficient the odour
samples will have been pre-diluted. The machine is not calibrated beyond dilution setting 217. This is specifically mentioned with the results.
Environment The measurements were performed in an air- and odour-conditioned room. The room temperature is
maintained at 22 oC ±3 oC. Measuring Dates The date of each measurement is specified with the results. Instrument Used The olfactometer used during this testing session was:
TOU-OLF-004 Instrumental Precision
The precision of this instrument (expressed as repeatability) for a sensory calibration must be r 0.477 in accordance with the AS/NZS4323.3:2001. r = 0.352 (August 2020) Compliance – Yes
Instrumental Accuracy
The accuracy of this instrument for a sensory calibration must be A 0.217 in accordance with the AS/NZS4323.3:2001. A = 0.169 (August 2020) Compliance – Yes
Lower Detection Limit (LDL)
The LDL for the olfactometer has been determined to be 16 ou (4 times the lowest dilution setting)
Traceability The results of the tests, calibrations and/or measurements included in this document are traceable to
Australian/national standards. The assessors are individually selected to comply with fixed criteria and are monitored in time to keep within the limits of the standard. The results from the assessors are traceable to primary standards of n-butanol in nitrogen. Note Disclaimers on last page of this document.
Accredited for compliance with ISO/IEC 17025 - Testing.
This report shall not be reproduced, except in full.
Date: Monday, 28 September 2020 Panel Roster Number: BNE20200928_034
S. Munro
Authorised Signatory

Appendix 2 – Sampling Results from H655Sampled on 17 June 2020
Page 7 of 8 Puma Energy- Emissions Monitoring: Pinkenba Facility: H655 and TK406
C:\Users\gh\Desktop\207402.0183\Reporting\0183.Draft results.odt

Emissions Monitoring: PinkenbaFacility: H655
Puma Energy398 Tingara Street
Pinkenba,
QLD 4008
Sampling Date: 17 June 2020
Issued: 28 August 2020
Prepared by:Air Noise EnvironmentABN: 13 081 834 513
Accredited for Compliance with ISO/IEC 17025 – Testing

NATA Accreditation Number: 15841
Accredited for compliance with ISO/IEC 17025 – Testing
Should you have any queries regarding the contents of this document, please contact Air Noise Environment.
Brisbane Office
A: Unit 3, 4 Tombo Street,
Capalaba, QLD 4157
T: +61 1300 851 761
Page 2 of 13 Puma Energy- Emissions Monitoring: Pinkenba Facility: H655
N:\6200 - 207402.0125\Reporting\6200.H655.report.01.1.odt

DOCUMENT CONTROL SHEET
Document DetailsProject Reference: 6200.H655.report.01.1.odtDocument Title: Emissions Monitoring: Pinkenba Facility: H655
Client: Puma EnergyDocument Reference: N:\6200 - 207402.0125\Reporting\6200.H655.report.01.1.odt
Version NumberVersion: Issue Date: Prepared by: Description: Approved by: Signature:
00 27/8/2020 Puneet Verma Internal Draft - -
01 28/8/2020 Puneet Verma Final Gary Hall
Revision HistoryRevision: Issue Date: Approved by: Signature: Details of Revision:
01.1 28/8/2020 Gary Hall Corrected file name and Stack number in title
01.2
Copyright:
Air Noise Environment retains ownership of the copyright to all reports, drawings, designs, plans, figures and other workproduced by Air Noise Environment Pty Ltd during the course of fulfilling a commission. The client named on the cover of thisdocument shall have a licence to use such documents and materials for the purpose of the subject commission provided theyare reproduced in full or, alternatively, in part with due acknowledgement to Air Noise Environment. Third parties must notreproduce this document, in part or in full, without obtaining the prior permission of Air Noise Environment Pty Ltd.
Disclaimer:
This document has been prepared with all due care and attention by professional environmental practitioners according toaccepted practices and techniques. This document is issued in confidence and is relevant only to the issues pertinent to thesubject matter contained herein. Air Noise Environment Pty Ltd holds no responsibility for misapplication or misinterpretationby third parties of the contents of this document. If the revision history does not state that a Final version of the documenthas been issued, then it remains a draft. Draft versions of this document should not be relied upon for any purpose by theclient, regulatory agencies or other interested parties.
Where site inspections, testing or fieldwork have taken place, the report is based on the information made available by theclient or their nominees during the visit, visual observations and any subsequent discussions with regulatory authorities. It isfurther assumed that normal activities were being undertaken at the site on the day of the site visit(s).
The validity and comprehensiveness of supplied information has not been independently verified and, for the purposes of thisreport, it is assumed that the information provided to Air Noise Environment Pty Ltd for the purposes of this project is bothcomplete and accurate.
Page 3 of 13 Puma Energy- Emissions Monitoring: Pinkenba Facility: H655
N:\6200 - 207402.0125\Reporting\6200.H655.report.01.1.odt

Table of ContentsExecutive Summary 5
Table 1: Summary of Results 5
1 Introduction 6
2 Methodology 7
2.1 Emission Testing 7
2.2 Laboratory Analysis 7
2.3 Deviation from Methods 8
3 Results 9
3.1 Introduction 9
3.5 H655 9
Table 3.1: Process Conditions During Monitoring of Emissions from H655 9
Table 3.2: Flow and Sample Characteristics for H655 9
Table 3.3: Emissions Monitoring Results for H655 10
3.2 Accuracy of Monitoring Results 10
Appendix A – Glossary of Terms 11
Index of TablesTable 1: Summary of Results 5
Table 1.1: Monitoring Locations and Parameters 6
Table 2.1: Summary Of Emission Monitoring Methods 7
Table 2.2: Table of NATA Accredited Laboratories with NATA Accreditation Number 7
Table 3.1: Process Conditions During Monitoring of Emissions from H655 9
Table 3.2: Flow and Sample Characteristics for H655 9
Table 3.3: Emissions Monitoring Results for H655 10
Table 3.4: Estimated Method Uncertainties for H655 10
Page 4 of 13 Puma Energy- Emissions Monitoring: Pinkenba Facility: H655
N:\6200 - 207402.0125\Reporting\6200.H655.report.01.1.odt

Executive SummaryStack emission sampling was conducted from the heater stack H655 at the Puma Pinkenba Bitumen
plant on 17 June 2020. A summary of the results are included in Table 1 below.
Table 1: Summary of Results
CompoundRelease Point
UnitsH655
Carbon Monoxide (CO) 25 mg/m3
Particulates (TSP) 2.5 mg/m3
NOx (expressed as NO2) 97 mg/m3
Sulphur Trioxide (SO3) (expressed as SO2) 4.6 mg/m3
Sulphur Dioxide (SO2) 147 mg/m3
Total SOx (expressed as SO2) 152 mg/m3
Page 5 of 13 Puma Energy- Emissions Monitoring: Pinkenba Facility: H655
N:\6200 - 207402.0125\Reporting\6200.H655.report.01.1.odt

1 Introduction Puma Energy commissioned Air Noise Environment Pty Ltd to conduct monitoring of air emissions
from their Pinkenba Facility as part of their requirements for the Environmental authority
EPPR00854713.
Table 1.1 details the monitoring locations and the monitoring performed at each location. The
monitoring was completed on 17 June 2020.
Table 1.1: Monitoring Locations and Parameters
Compound
Release Point
H655
Velocity, Flowrate and Temperature ✔
Combustion Gases (CO, O2, CO2) ✔
Moisture Content ✔
Particulates ✔
Sulphur Dioxide (SO2) ✔
Oxides of Nitrogen (NO, NO2, NOx) ✔
Sulphur Dioxide (SO2) and Sulphur Trioxide/Sulphuric Acid (SO3, H2SO4) ✔
The monitoring of air emissions at the Pinkenba Facility was completed during normal operating
conditions. Any factors that may have affected the monitoring results were not observed by, or
brought to the notice of Air Noise Environment (ANE) staff except where noted in this report.
Page 6 of 13 Puma Energy- Emissions Monitoring: Pinkenba Facility: H655
N:\6200 - 207402.0125\Reporting\6200.H655.report.01.1.odt

2 Methodology
2.1 Emission TestingTable 2.1 below lists the Methods used when undertaking emission monitoring at the Pinkenba
Facility.
All air quality monitoring undertaken by the Company has been undertaken in accordance with the
methods identified in Table 2.1 below unless as specified in Section 2.3.
Table 2.1: Summary Of Emission Monitoring Methods
MeasurementParameter
Method Equivalency
Sampling Positions AS4323.1-1995 Method 1: selection of sampling positions
Velocity, Flowrate and Temperature
AS 4323.2-1995 Stationary Source Emissions - Method 2: Determination of Total Particulate Matter - Isokinetic Manual Sampling - Gravimetric Method
Oxygen and Carbon Dioxide
USEPA Method 3a Determination of Oxygen and Carbon Dioxide Concentrations in Emissions from Stationary Sources
Moisture Content USEPA Method 4 Determination of Moisture Content in Stack Gases
Particulates AS 4323.2-1995 Stationary Source Emissions - Method 2: Determination of Total Particulate Matter - Isokinetic Manual Sampling - Gravimetric Method
Oxides of Nitrogen (NO,NO2, NOx)
USEPA Method 7E Determination of Nitrogen Oxides Emissions from Stationary Sources (Instrumental Analyzer Procedure)
Sulphur Dioxide (SO2) and Sulphur Trioxide/Sulphuric Acid (SO3, H2SO4)
USEPA Method 8 Determination of Sulfuric Acid and Sulfur Dioxide Emissions fromStationary Sources
Carbon Monoxide USEPA Method 10B Determination of Carbon Monoxide Emissions from StationarySources
2.2 Laboratory AnalysisTable 2.2 Provides a list of the NATA accredited laboratories that performed the applicable analysis,
NATA accreditation number, and report number.
Table 2.2: Table of NATA Accredited Laboratories with NATA Accreditation Number
Measurement Parameter NATA Accreditation Number Report Number
Particulates (gravimetric)National Measurement Institute - 198 RN1259377
Sulphur Dioxide (SO2) and Sulphur Trioxide/Sulphuric Acid (SO3, H2SO4)
Page 7 of 13 Puma Energy- Emissions Monitoring: Pinkenba Facility: H655
N:\6200 - 207402.0125\Reporting\6200.H655.report.01.1.odt

2.3 Deviation from MethodsThe gas meter and critical orifice within the isokinetic sampling console was aligned as specified by
US EPA Method 5 - Determination of Particulate Matter Emissions from Stationary Sources. AS4323.2
requires the critical orifice to be positioned before the gas meter within the sampling system.
Page 8 of 13 Puma Energy- Emissions Monitoring: Pinkenba Facility: H655
N:\6200 - 207402.0125\Reporting\6200.H655.report.01.1.odt

3 Results
3.1 IntroductionThe following sections present a summary of results for each sampling location.
3.5 H655Table 3.4 provides a summary of process conditions during the air emissions monitoring for Release
Point – H655 at Pinkenba Facility.
Table 3.1: Process Conditions During Monitoring of Emissions from H655
Parameter Result Units
Gas Flow Rate 125 m3/hr
Oil circulation ON -
Burner setting Auto -
Results of emissions monitoring for H655 are provided in Table 3.2 and Table 3.3 below for emissions
monitoring completed on 17 June 2020.
Table 3.2: Flow and Sample Characteristics for H655
Parameter Monitoring Result Units
Run Start Time 10:37 hh:mm
Run Stop Time 11:57 hh:mm
Meter Calibration Factor 1.046 -
Pitot Tube Coefficient 0.84 -
Nozzle Diameter 11.00 mm
Total Meter Volume 0.615 m3
Average Meter Temperature 21 oC
Average Stack Temperature 211 oC
Barometric Pressure 767.31 mm Hg
Stack Static Pressure -0.2 mm H2O
Calculated Stack Moisture 8.3 %
Carbon Dioxide Percentage 8.58 %
Oxygen Percentage 4.93 %
Dry Gas Molecular Weight 29.57 g/g-mole
Wet Stack Gas Molecular Weight 28.61 g/g-mole
Average Stack Gas Velocity 2.6 m/s
Page 9 of 13 Puma Energy- Emissions Monitoring: Pinkenba Facility: H655
N:\6200 - 207402.0125\Reporting\6200.H655.report.01.1.odt

Parameter Monitoring Result Units
Stack Diameter 1.200 m
Actual Stack Flow Rate 170 m3/min
Dry Standard Stack Flow Rate 91 Nm3/min
Percent of Isokinetic Rate 97.1 %
Table 3.3: Emissions Monitoring Results for H655
CompoundEmission
Concentration(mg/Nm3)
Emission Rate(g/min)
Emission Rate(g/s)
Emission Rate(kg/hour)
CO 25 2.3 0.038 0.14
Particulates (TSP) 2.5 0.23 0.0038 0.0014
NOx (expressed as NO2) 97 8.8 0.15 0.53
SO3 (expressed as SO2) 4.6 0.42 0.007 0.030
SO2 (expressed as SO2) 147 13.3 0.22 0.80
Total SOx (expressed as SO2) 152 13.8 0.23 0.83
3.2 Accuracy of Monitoring ResultsTable 3.4 presents a summary of the estimated method uncertainties for each of the monitoring
parameters.
Table 3.4: Estimated Method Uncertainties for H655
MeasurementParameter
Method % Uncertainty Uncertainty Units
Oxygen USEPA Method 3A 2 0.10 %
Carbon Dioxide 2 0.17 %
Oxides of Nitrogen (NO, NO2, NOx)
USEPA Method 7E 2 0.94 ppm
Sulphur Dioxide (SO2) USEPA Method 6C 2.53 0.62 ppm
Carbon Monoxide USEPA Method 10B 3.2 0.65 ppm
Particulates AS 4323.2 15 0.39 mg/Nm3
Sulphates US EPA Method 8 10 1.66 mg/Nm3
# Uncertainty values cited are calculated at the 95% confidence level, with a coverage factor of 2.
Page 10 of 13 Puma Energy- Emissions Monitoring: Pinkenba Facility: H655
N:\6200 - 207402.0125\Reporting\6200.H655.report.01.1.odt

Appendix A – Glossary of Terms
Page 11 of 13 Puma Energy- Emissions Monitoring: Pinkenba Facility: H655
N:\6200 - 207402.0125\Reporting\6200.H655.report.01.1.odt

APPENDIX A: GLOSSARY OF TERMS
< The analytes tested for was not detected, the value stated is the reportable limit of detection
μg Micrograms (10-6grams)
AS Australian Standard
dscm dry standard cubic meters (at 0°C and 1 atmosphere)
g grams
kg kilograms
m metres
m3 Cubic Metres, actual gas volume in cubic metres as measured.
mg Milligrams
min Minute
mg/m3 Milligrams (10-3) per cubic metre.
mmH2O Millimetres of water
Mole SI Unit defined as an amount of a substance that contains as many elementary entities (e.g. atoms, molecules, ions, electrons) as there are atoms in 12 grams of pure Carbon-12 (12C)
N/A Not Applicable
ng Nanograms (10-9 grams)
Nm3 Normalised Cubic Metres - Gas volume in dry cubic metres at standard temperature and pressure (0°C and 101.3 kPa).
ou Odour Units
°C Degrees Celsius
μg/m3 Micrograms (10-6) per cubic metre. Conversions from g/m3 to parts pervolume concentrations (ie, ppb) are calculated at 25 °C.
ppb / ppm Parts per billion / million.
PM Particulate Matter.
PM10, PM2.5, PM1 Fine particulate matter with an equivalent aerodynamic diameter of less than 10, 2.5 or 1 micrometres respectively. Fine particulates are predominantly sourced from combustion processes. Vehicle emissions are a key source in urban environments.
sec Second
Sm3 Standardised Cubic Metres - Gas volume in dry cubic metres at standard temperature and pressure (0°C and 101.3 kPa) and corrected to a standardised value ( e.g. 7% O2).
Page 12 of 13 Puma Energy- Emissions Monitoring: Pinkenba Facility: H655
N:\6200 - 207402.0125\Reporting\6200.H655.report.01.1.odt

APPENDIX A: GLOSSARY OF TERMS
STP Standard Temperature and Pressure (0°C and 101.3 kPa).
TVOC Total Volatile Organic Compounds. These compounds can be both toxic and odorous.
USEPA United States Environmental Protection Agency
Page 13 of 13 Puma Energy- Emissions Monitoring: Pinkenba Facility: H655
N:\6200 - 207402.0125\Reporting\6200.H655.report.01.1.odt

Page 8 of 8 Puma Energy- Emissions Monitoring: Pinkenba Facility: H655 and TK406
C:\Users\gh\Desktop\207402.0183\Reporting\0183.Draft results.odt

GHD | Report for Puma Energy Australia - Botany PMB and CRMB Project, 12533800 | 38
Appendix D – newEQ report

This document is issued in accordance with NATA’s accreditation requirements. Accredited for compliance with ISO/ IEC 17025. NATA accredited laboratory 15438. This report must not be reproduced except in full. New Environmental Quality Pty Ltd; Unit 1, 20 Meadow Avenue, Coopers Plains, Qld. 4108 Australia. Ph: +61 7 3452 4700 Page 1 of 13
Sami Bitumen New Environmental Quality 15 Randle St P.O. Box 119 Pinkenba Coopers Plains Qld. 4108 4008, QLD ABN: 56 115 736 046 Tel: +617 3452 4700
Source emissions monitoring conducted at Sami Bitumen’s
Port of Brisbane facility
This report provides potentially sensitive information to the reader and as such should be considered a
confidential document. All recipients are required to treat this report as confidential. It is for the sole use of Sami Bitumen and those granted permission by Sami Bitumen only.
This report is an initial release Prepared by Quality checked by
Timon Berger BSci NATA Signatory (QSTI) Technical Manager
Accreditation Number: 15438
David Arbuckle BEnvEng (hons) NATA Signatory (QSTI) Director
project ID 05291
issue number 1
client Sami Bitumen
issue date 30th
September 2010
testing date 8th
September 2010
contact Mr. Scott van Woerkom
newEQ is part of the Pacific Environment Limited group of
companies www.pelgroup.com

report to Sami Bitumen newEQ Project ID: 05291 UNCONTROLLED WHEN PRINTED CONFIDENTIAL issue number: 1
This document is issued in accordance with NATA’s accreditation requirements. Accredited for compliance with ISO/ IEC 17025. NATA accredited laboratory 15438. This report must not be reproduced except in full.
New Environmental Quality Pty Ltd Page 2 of 13
EXECUTIVE SUMMARY
Table 1 provides summary results of emission monitoring conducted from the Port of Brisbane plant. The figures have been rounded up to three decimal places; for further details refer to supporting documentation.
Table 1 Summary of results
Emission Test Result Units of Measure
Date of test Wednesday 8th
September 2010
Temperature 70.0 °C
Velocity 25.3 m/s
Volumetric flowrate 16.162 Nm3/s
Moisture content 32.2 %
Carbon dioxide (average) < 0.5 %
Oxygen (average) 10.6 %
Carbon Monoxide 981 mg/Nm3
(dry)
Oxides of Nitrogen (as NO2) 28.7 mg/Nm3 (dry)
Total Organic Carbon (as propane) 58,700 mg/Nm3
(dry)
Sulphur Gases (average)
Hydrogen Sulphide 65.3 ppm
Carbonyl Sulphide 17.6 ppm
Sulphur Dioxide 0.480 ppm
Methyl mercaptan 5.03 ppm
ethyl mercaptan < 0.0150 ppm
Dimethyl Sulphide 1.77 ppm
Dimethyl disulphide 0.0120 ppm
carbon disulphide 1.10 ppm
i-propyl mercaptan 0.354 ppm
n-propyl mercaptan 1.07 ppm
Hydrogen Chloride 419 mg/Nm
3 (dry)
Hydrogen Fluoride 11.6 mg/Nm3
(dry)
Chlorine 4.66 mg/Nm3
(dry)

report to Sami Bitumen newEQ Project ID: 05291 UNCONTROLLED WHEN PRINTED CONFIDENTIAL issue number: 1
This document is issued in accordance with NATA’s accreditation requirements. Accredited for compliance with ISO/ IEC 17025. NATA accredited laboratory 15438. This report must not be reproduced except in full.
New Environmental Quality Pty Ltd Page 3 of 13
TABLE OF CONTENTS Page EXECUTIVE SUMMARY 2 INTRODUCTION 4 TEST METHODS 4 QUALITY ASSURANCE & QUALITY CONTROL 5 DEFINITIONS 6 CALCULATION OF RESULTS 7 LIST OF TABLES Table 1 Summary of results 2 Table 2: Test Methods 4 Table 3: Sampling Notes 4 Table 4: Analysis Notes 5 Table 5: Definitions 6 Table 6: Source data 7 Table 7: Gas composition data 7 Table 8: USEPA Method 18 tube results 8 Table 9: USEPA Method 18 rinse results 9 Table 10: USEPA Method 18 rinse results cont. 10 Table 11: Sulphur gas and VOC results 11 Table 12: VOC results cont. 12 Table 13: VOC results cont. 13 Table 14: Document Control 13

report to Sami Bitumen newEQ Project ID: 05291 UNCONTROLLED WHEN PRINTED CONFIDENTIAL issue number: 1
This document is issued in accordance with NATA’s accreditation requirements. Accredited for compliance with ISO/ IEC 17025. NATA accredited laboratory 15438. This report must not be reproduced except in full.
New Environmental Quality Pty Ltd Page 4 of 13
INTRODUCTION New Environmental Quality (newEQ) was commissioned by Sami Bitumen to sample process gases from their Port of Brisbane facility, Queensland. Sampling and analysis was conducted by newEQ on Wednesday the 8
th
September 2010. newEQ was responsible for the collection and analysis of all samples. The collected samples remained sealed and preserved in the appropriate manner. Upon return to the laboratory the samples were prepared and analysed by the correct methodologies.
TEST METHODS All sampling and analysis was conducted by newEQ unless otherwise stated. The results presented in this report are related to one or more reference calibrations held by newEQ.
Table 2: Test Methods
Parameter Test Method NATA Sample Note Analysis Note
Sample plane criteria AS 4323.1 Yes A 1
Gas Velocity and Temperature USEPA Method 2 Yes B 1
Stack gas density (O2 & CO2) USEPA Method 3A Yes C 1
Moisture content USEPA Method 4 Yes D 1
Nitrogen oxides USEPA Method 7E Yes C 1
Carbon monoxide USEPA Method 10 Yes C 1
Speciated Volatile Organic Carbons USEPA Method 18 Yes nil 2
Total Volatile Organic Carbons USEPA Method 25A Yes E 1
Hydrogen Chloride USEPA Method 26 Yes nil 2
Sulphur Compounds USEPA Method 18 No F 3
Table 3: Sampling Notes
ID Note
A Sample point was located after the condenser and cyclone system. Two 20mm holes were available through which to extract the samples.
The points were located in a straight section of the 6 inch pipe work connecting the system. The points were approximately 5 diameters downstream from a bend in the pipe.
The flue gas contained a relatively high moisture content and an oil residue, which could not be removed sufficiently with the condition unit available at the time. The oil residue interfered with this conditioning unit, making it unusable for this application. Gas bag samples were taken in its place.
B Velocities and temperature measurements were conducted using a standard type pitot and K-type thermocouple connected to a digital manometer and thermocouple indicator.
In total, 4 traverse points were measured along a single traverse axis.
C Analyser calibration and drift determination was conducted before and after the onsite sampling event in newEQ laboratory. Due to the nature of the flue gas, the analyser was unable to be run continuously on the source, instead tedlar bag samples with dilution factors were collected and analysed periodically.
D Moisture determinations were conducted using wet bulb / dry bulb temperature measurements and calculations based on ASME steam table data.
E Tedlar bag samples were collected and analysed on site using a Flame Ionisation Detector. The calibration gas used was propane; therefore results are referenced to ppm as propane.
F Tedlar bag samples with a dilution factor of 3 were collected and sent to Advanced Analytical for sulphur gas analysis. Prior to shipping a brief sample was extracted on a Drager Tube for indicative H2S concentration.
Analysis at the lab revealed further VOCs during the screen which were also reported by this lab.

report to Sami Bitumen newEQ Project ID: 05291 UNCONTROLLED WHEN PRINTED CONFIDENTIAL issue number: 1
This document is issued in accordance with NATA’s accreditation requirements. Accredited for compliance with ISO/ IEC 17025. NATA accredited laboratory 15438. This report must not be reproduced except in full.
New Environmental Quality Pty Ltd Page 5 of 13
Table 4: Analysis Notes
Note Company NATA Accreditation ID Report Number
1 newEQ 15438 05291
2 SGS Australia 2562 (4354) SE 81259
3 Advanced Analytical na A10/3181
QUALITY ASSURANCE & QUALITY CONTROL (QA/QC) newEQ operates within a quality system that meets the requirements of ISO17025 (NATA). Our quality system defines specific procedures and methodologies to ensure any project undertaken by newEQ is conducted with the highest level of quality given the specific confines of each project. These procedures address such facets as:
- project management - equipment calibration and maintenance - adherence to specific sampling methodologies - selection of sub-contracting laboratories - storage and freight of collected samples - final report preparation

report to Sami Bitumen newEQ Project ID: 05291 UNCONTROLLED WHEN PRINTED CONFIDENTIAL issue number: 1
This document is issued in accordance with NATA’s accreditation requirements. Accredited for compliance with ISO/ IEC 17025. NATA accredited laboratory 15438. This report must not be reproduced except in full.
New Environmental Quality Pty Ltd Page 6 of 13
DEFINITIONS The following terms and abbreviations may be used in this report:
Table 5: Definitions
Symbol Definition
< The analytes tested for was not detected; the value stated is the reportable limit of detection
Am3 Gas volume in cubic metres at measured conditions
AS Australian Standard
BH Back half of sample train (filter holder and impingers) (referred to during sample recovery) oC Degrees Celsius
dscm dry standard cubic meters
FH Front half of sample train (probe and filter holder) (referred to during sample recovery)
g Grams
kg Kilograms
m Metres
m3 actual gas volume in cubic metres as measured
mb Millibars
mg Milligrams (10-3
grams)
min Minute
ml Millilitres
mmH2O Millimetres of water
Mole SI unit that measures the amount of substance
N/A Not applicable
ng Nanograms (10-9
grams)
Nm3 Gas volume in dry cubic metres at standard temperature and pressure (0°C and 101.3 kPa)
PM Particulate matter
ppm-c Parts per million referenced to carbon
ppm-p Parts per million referenced to propane
sec Second
Sm3
Gas volume in dry cubic metres at standard temperature and pressure (0°C and 101.3 kPa) and corrected to a standardised value (e.g. 7% O2)
STP Standard temperature and pressure (0°C and 101.3 kPa)
TVOC Total volatile organic compounds
USEPA United States Environmental Protection Authority

report to Sami Bitumen newEQ Project ID: 05291 UNCONTROLLED WHEN PRINTED CONFIDENTIAL issue number: 1
This document is issued in accordance with NATA’s accreditation requirements. Accredited for compliance with ISO/ IEC 17025. NATA accredited laboratory 15438. This report must not be reproduced except in full.
New Environmental Quality Pty Ltd Page 7 of 13
CALCULATION OF RESULTS
Table 6: Source data
Table 7: Gas composition data

report to Sami Bitumen newEQ Project ID: 05291 UNCONTROLLED WHEN PRINTED CONFIDENTIAL issue number: 1
This document is issued in accordance with NATA’s accreditation requirements. Accredited for compliance with ISO/ IEC 17025. NATA accredited laboratory 15438. This report must not be reproduced except in full.
New Environmental Quality Pty Ltd Page 8 of 13
Table 8: USEPA Method 18 tube results

report to Sami Bitumen newEQ Project ID: 05291 UNCONTROLLED WHEN PRINTED CONFIDENTIAL issue number: 1
This document is issued in accordance with NATA’s accreditation requirements. Accredited for compliance with ISO/ IEC 17025. NATA accredited laboratory 15438. This report must not be reproduced except in full.
New Environmental Quality Pty Ltd Page 9 of 13
Table 9: USEPA Method 18 rinse results

report to Sami Bitumen newEQ Project ID: 05291 UNCONTROLLED WHEN PRINTED CONFIDENTIAL issue number: 1
This document is issued in accordance with NATA’s accreditation requirements. Accredited for compliance with ISO/ IEC 17025. NATA accredited laboratory 15438. This report must not be reproduced except in full.
New Environmental Quality Pty Ltd Page 10 of 13
Table 10: USEPA Method 18 rinse results cont.

report to Sami Bitumen newEQ Project ID: 05291 UNCONTROLLED WHEN PRINTED CONFIDENTIAL issue number: 1
This document is issued in accordance with NATA’s accreditation requirements. Accredited for compliance with ISO/ IEC 17025. NATA accredited laboratory 15438. This report must not be reproduced except in full.
New Environmental Quality Pty Ltd Page 11 of 13
Table 11: Sulphur gas and VOC results

report to Sami Bitumen newEQ Project ID: 05291 UNCONTROLLED WHEN PRINTED CONFIDENTIAL issue number: 1
This document is issued in accordance with NATA’s accreditation requirements. Accredited for compliance with ISO/ IEC 17025. NATA accredited laboratory 15438. This report must not be reproduced except in full.
New Environmental Quality Pty Ltd Page 12 of 13
Table 12: VOC results cont.

report to Sami Bitumen newEQ Project ID: 05291 UNCONTROLLED WHEN PRINTED CONFIDENTIAL issue number: 1
This document is issued in accordance with NATA’s accreditation requirements. Accredited for compliance with ISO/ IEC 17025. NATA accredited laboratory 15438. This report must not be reproduced except in full.
New Environmental Quality Pty Ltd Page 13 of 13
Table 13: VOC results cont.
Table 14: Document Control
Report ID Issue Date Comment Author Quality
05291 1 30th
September 2010 Initial release TB DA

GHD | Report for Puma Energy Australia - Botany PMB and CRMB Project, 12533800
Appendix E – Chemical odour level calculations
Table C1 Chemical Odour Level - Calculation
Odorous Constituent Concentration (ppm)
Threshold (ppm) Concentration
(OU)
Hydrogen Sulphide
65
0.0005a
130 000
Carbonyl Sulphide 17.6
NA -
Methyl Mercapton 5.03
0.00042b 12 000
Ethyl Mercapton <0.015
0.4b -
Dimethyl sulphide 1.77
2.5b 12 500
Dimethyl disulphide 0.012
7.5b -
Carbon disulphide 1.1
0.042c 8
i-propyl mercapton 0.354
0.45b -
n-propyl mercapton 1.07 0.75b -
Total - - 154 508
a Literature review Australian and overseas odour threshold data and ambient air quality criteria for hydrogen sulphide
– a report for NSW EPA, Australian Water Technologies, January 2001.
b. State Environment Protection Policy Air Quality Management (SEPP – AQM) EPA Victoria, 2001.
c. Compilation of odour threshold values in air and water, L.J van Gemert, National Institute for Water Supply and A.H
Nettenbreijer, Central Institute for Nutrition and Food Research TNO, June 1977.

GHD | Report for Puma Energy Australia - Botany PMB and CRMB Project, 12533800
Appendix F – Bulwer experimental run data

GHD | Report for Puma Energy Australia - Botany PMB and CRMB Project, 12533800
Appendix G – Meteorological analysis
Wind Speed
Wind Direction

GHD | Report for Puma Energy Australia - Botany PMB and CRMB Project, 12533800 | 42
Mixing Height
GHD
Level 15 133 Castlereagh Street T: 61 2 9239 7100 F: 61 2 9239 7199 E: [email protected]
© GHD 2020
This document is and shall remain the property of GHD. The document may only be used for the purpose for which it was commissioned and in accordance with the Terms of Engagement for the commission. Unauthorised use of this document in any form whatsoever is prohibited. 12533800-44854-3/https://projectsportal.ghd.com/sites/pp15_01/botanypmbprojectupda/ProjectDocs/12533800-REP_Puma Energy Air Quality Assessment.docx
Document Status
Revision Author Reviewer Approved for Issue Name Signature Name Signature Date
0 N
Spurrett E Smith E Smith 14/10/2020

www.ghd.com

Appendix C
AERMOD ready Meteorological data files for Port Botany – NSW

AERMOD
ready
Meteorological
data files for
Port Botany- NSW
This file was exclusively compiled
for PJRA By pDs Consultancy.
All rights reserved @2020
pDs Consultancy
@1999-2020

AERMOD READY METEOROLOGICAL DATA FILES
www.pdsconsultancy.com.au [email protected]
Experts in Air Modelling and Meteorology Page 2 of 17

AERMOD READY METEOROLOGICAL DATA FILES
www.pdsconsultancy.com.au [email protected]
Experts in Air Modelling and Meteorology Page 3 of 17
INTRODUCTION
New generation regulatory model AERMOD requires hourly averaged
meteorological data from a single site that is preferably within the model
domain (‘on-site’ or site-specific data). However, data from the nearest ‘off-
site’ meteorological station can be used when on-site data are not available,
and the off-site data are representative of the area of concern (i.e. the
meteorological parameters as well as surface characteristics characterise the
transport and dispersion conditions of the location in question).
It is also preferable that:
• The compilation of the input meteorological data file is done in
accordance with ‘best practice’, with procedures and algorithms
recommended or set by environment regulators/US & VIC EPA.
pDs Consultancy has been engaged by PJRA to compile an ‘AERMOD-
ready’ meteorological files for an application site in Port Botany in
NSW. Sydney Airport (maintained by BoM Australia) data found to be
representing this application site.
This input meteorological data files have been compiled basically following the
EPA, Victoria’s draft guidelines: “Construction of input meteorological data files
for EPA Victoria's regulatory air pollution model (AERMOD) (Publication
No.1550)”.

AERMOD READY METEOROLOGICAL DATA FILES
www.pdsconsultancy.com.au [email protected]
Experts in Air Modelling and Meteorology Page 4 of 17
LOCATIONS OF THE APPLICATION SITE AND THE DATA SITE : 45, FRIENDSHIP ROAD,
PORT BOTANY
Application site is within 10 KM radius
of the data site

AERMOD READY METEOROLOGICAL DATA FILES
www.pdsconsultancy.com.au [email protected]
Experts in Air Modelling and Meteorology Page 5 of 17
Data Processing
Input Information
Data Used for the compilation
Meteorological Data
1. Mandatory Data (Site-Representative, Sydney Airport)
i. 10m Wind Direction and Speed
ii. Ambient Temperature (Screen Level)
2. Supplementary data (Sydney Airport)
i. Surface Pressure
ii. 3 Hourly Cloud observations
iii. Relative Humidity
iv. Rainfall Rate
3. Upper air Data (BoM’s Sydney Airport)
i. Pressure Levels
ii. Geopotential Heights
iii. Temperature
iv. Dew Point

AERMOD READY METEOROLOGICAL DATA FILES
www.pdsconsultancy.com.au [email protected]
Experts in Air Modelling and Meteorology Page 6 of 17
Data Source • National Climate Centre, Bureau of Meteorology, Melbourne
for all 3 types of data
• Data Source: Sydney Airport, NSW
• Period :1 Jan 2015 to 31 Dec 2019 (5 years)-2017 selected
QA/QC ON RAW DATA
I. Hourly averaged winds both direction and speed and
temperature examined for gaps and wind stalls
· Suspected wind stalls (both wind direction and
speed) removed and filled appropriately preserving
the temporal consistency.
· Note that BoM Syncrotec Anemometer’s lowest
detection limit of wind speed is 2 KM/Hour (Wind
Speed Threshold)
II. Small gaps filled with pervious or following hour records
III. Days with big gaps removed maintaining 90% data recovery
IV. Parameters QA/QCed based on extreme values
V. Gaps in vertical temperature profiles were filled with previous
or following day data for the completeness.

AERMOD READY METEOROLOGICAL DATA FILES
www.pdsconsultancy.com.au [email protected]
Experts in Air Modelling and Meteorology Page 7 of 17
METSITE INFORMATION
DATA COVERAGE:
Year 2015 2016 2017 2018 2019
Season
Summer 100
Autumn 100
Winter 100
Spring 100
Annual 100
Annual coverage is 99%. It is meeting regulatory requirement (90% or better).
Seasonal coverage is also meeting the requirement.
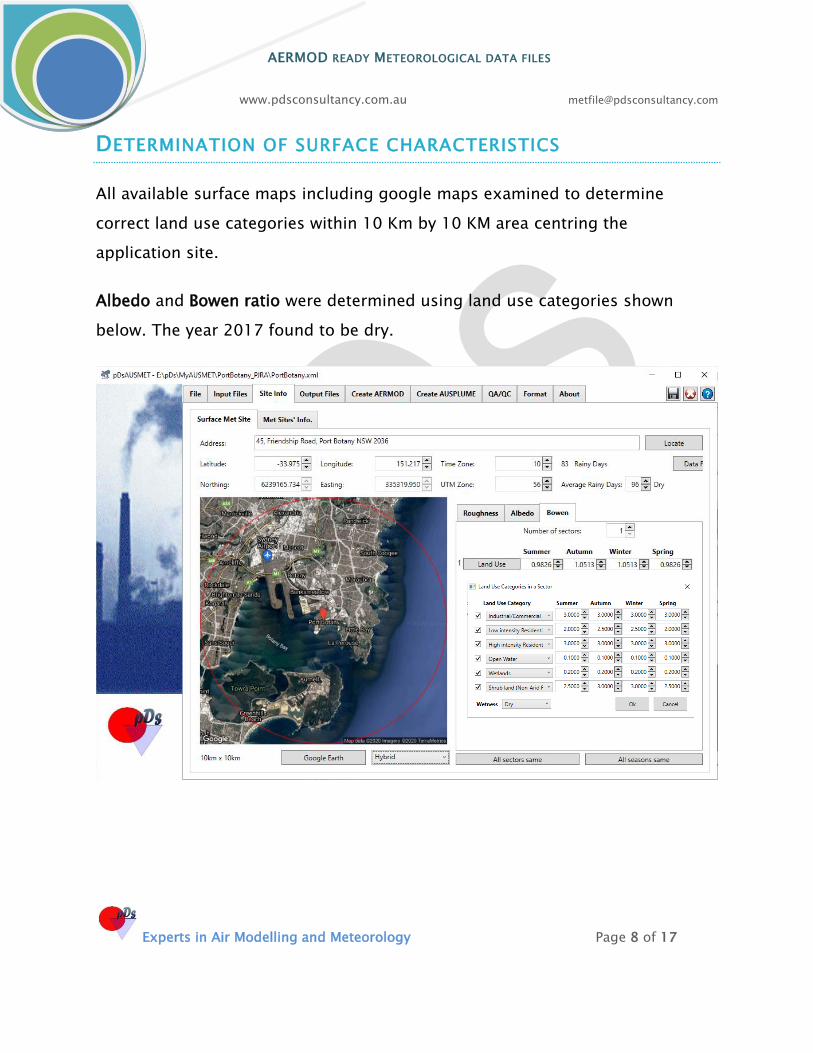
AERMOD READY METEOROLOGICAL DATA FILES
www.pdsconsultancy.com.au [email protected]
Experts in Air Modelling and Meteorology Page 8 of 17
DETERMINATION OF SURFACE CHARACTERISTICS
All available surface maps including google maps examined to determine
correct land use categories within 10 Km by 10 KM area centring the
application site.
Albedo and Bowen ratio were determined using land use categories shown
below. The year 2017 found to be dry.

AERMOD READY METEOROLOGICAL DATA FILES
www.pdsconsultancy.com.au [email protected]
Experts in Air Modelling and Meteorology Page 9 of 17
SURFACE ROUGHNESS
Sector dependent surface roughness was determined considering 11 sectors.
The roughness for each sector was determined professionally examining 4 arc
segments (250m).

AERMOD READY METEOROLOGICAL DATA FILES
www.pdsconsultancy.com.au [email protected]
Experts in Air Modelling and Meteorology Page 10 of 17
The following parameters were determined/computed following EPA, VIC and
US EPA guidelines.
Sensible Heat flux –Calculated based on cloud observations
I. Friction Velocity (U*)
II. Monin-Obukhov Length (L)
III. Height of the Stable Boundary Layer(SBL)
IV. Vertical Velocity Scale (W*)
V. Height of the Convective Boundary Layer (CBL)
Mixing height (Convective)-CBL
DEFINITION:
The convective mixing height, the depth of the surface mixed layer is the
height of the atmosphere above the ground, which is well mixed due
either to mechanical turbulence or convective turbulence. This height was
determined by using the methodology of Benkley and Schulman (Journal
of Applied Meteorology, Volume 18, 1979,pp 772-780). Sydney Airport
upper air observation containing temperature and moisture profiles and
surface temperature, pressure and relative humidity at Sydney Airport
were used to determine daytime mixing height.

AERMOD READY METEOROLOGICAL DATA FILES
www.pdsconsultancy.com.au [email protected]
Experts in Air Modelling and Meteorology Page 11 of 17
DATA ANALYSIS
ANNUAL WINDROSES FOR SYDNEY AIRPORT

AERMOD READY METEOROLOGICAL DATA FILES
www.pdsconsultancy.com.au [email protected]
Experts in Air Modelling and Meteorology Page 12 of 17
FREQUENCY OF WIND SPEED

AERMOD READY METEOROLOGICAL DATA FILES
www.pdsconsultancy.com.au [email protected]
Experts in Air Modelling and Meteorology Page 13 of 17
SEASONAL WINDROSES
Summer
Autumn

AERMOD READY METEOROLOGICAL DATA FILES
www.pdsconsultancy.com.au [email protected]
Experts in Air Modelling and Meteorology Page 14 of 17
Winter
Spring
Seasonal variations are clearly depicted.

AERMOD READY METEOROLOGICAL DATA FILES
www.pdsconsultancy.com.au [email protected]
Experts in Air Modelling and Meteorology Page 15 of 17
Appendix
FLOW CHARTS - CONSTRUCTION PROCEDURE

AERMOD READY METEOROLOGICAL DATA FILES
www.pdsconsultancy.com.au [email protected]
Experts in Air Modelling and Meteorology Page 16 of 17
Bibliography
Australian Standard 2923-1987: Standards Association of Australia
Benkley, C.W,& Schulman L.L 1979 :Estimating Hourly Mixing Depths from Historical Meteorological Data :Jl of Applied Meteorology Vol 1 page 772-780
USEPA 2004, AERMOD :Description of Model Formulation, EPA-454/R-03-00. United States Environmental Protection Agency, Washington DC, USA.
USEPA 2012, User Guide for the AERMOD Meteorological Processor-AERMET; Addendum, United States Environmental Protection Agency, Washington DC, USA.
USEPA, 2000, Meteorological Monitoring Guidance for Regulatory Modelling Applications, EPA-450/R-99-005.United States Environmental Protection Agency, Washington DC, USA.
USEPA, Office of Air Quality Planning and Standards, AERSURFACE User’s Guide, Research Triangle Park, North Carolina, EPA 454/B-08-001
USEPA, Office of Air Quality Planning and Standards, User’s Guide for the AERMOD Meteorological Processor (AERMET) and Addendum, Research Triangle Park, North Carolina, EPA 454/B-03-002.

AERMOD READY METEOROLOGICAL DATA FILES
www.pdsconsultancy.com.au [email protected]
Experts in Air Modelling and Meteorology Page 17 of 17
D ISCLAIMER
Compilation of input meteorological data files for AERMOD
was done under the supervision of qualified and experienced
meteorologists. Although all due care has been taken, we
cannot give any warranty, nor accept any liability (except that
required by law) in relation to the information given, its
completeness or its applicability to a particular problem.
These data and other material are supplied on the condition
that you agree to indemnify us and hold us harmless from
and against all liability, losses, claims, proceedings,
damages, costs and expenses, directly or indirectly relating
to, or arising from the use of or reliance on the data and
material which we have supplied.
COPYRIGHT
Bureau of Meteorology holds the copyright for the original
data purchased for PJRA.
Copyright of the value-added data set: Input meteorological
data files for AERMOD is held by pDs Consultancy. The
purchaser shall not reproduce, modify or supply (by sale or
otherwise) this data set.

Appendix D
Historic Wind Roses at Sydney Airport

Rose of Wind direction versus Wind speed in km/h (01 Apr 1939 to 11 Aug 2020)Custom times selected, refer to attached note for details
SYDNEY AIRPORT AMOSite No: 066037 • Opened Jan 1929 • Still Open • Latitude: -33.9465° • Longitude: 151.1731° • Elevation 6m
An asterisk (*) indicates that calm is less than 0.5%.Other important info about this analysis is available in the accompanying notes.
NNE
E
SES
SW
W
NW
CALM>= 0 and < 10
km/hCALM
>= 10 and < 20>= 20 and < 30
>= 30 and < 40>= 40
9 am 29247 Total Observations
10%
20%
30%
Calm 8%
Copyright Copyright © Commonwealth of Australia 2020 . Prepared on 11 Aug 2020Prepared by the Bureau of Meteorology.Contact us by phone on (03) 9669 4082, by fax on (03) 9669 4515, or by email on [email protected] We have taken all due care but cannot provide any warranty nor accept any liability for this information.
TCZANNUAL Page 1

Rose of Wind direction versus Wind speed in km/h (01 Apr 1939 to 11 Aug 2020)Custom times selected, refer to attached note for details
SYDNEY AIRPORT AMOSite No: 066037 • Opened Jan 1929 • Still Open • Latitude: -33.9465° • Longitude: 151.1731° • Elevation 6m
An asterisk (*) indicates that calm is less than 0.5%.Other important info about this analysis is available in the accompanying notes.
NNE
E
SES
SW
W
NW
CALM>= 0 and < 10
km/hCALM
>= 10 and < 20>= 20 and < 30
>= 30 and < 40>= 40
3 pm 29323 Total Observations
10%
20%
30%Calm 2%
Copyright Copyright © Commonwealth of Australia 2020 . Prepared on 11 Aug 2020Prepared by the Bureau of Meteorology.Contact us by phone on (03) 9669 4082, by fax on (03) 9669 4515, or by email on [email protected] We have taken all due care but cannot provide any warranty nor accept any liability for this information.
TCZANNUAL Page 1

Appendix E
CEC Engineers Calculation Sheet

CEC ENGINEERS
CALCULATION SHEET
Client : Quantem (Terminals Pty Ltd)
Project No. : 200003
Project : 2nd Thermal Oxidiser and Liquid Waste Burning
Calculation No: 200003CAL-002 Rev 1
Calculation Title: Thermal Oxidiser VOC Stack Emission Estimate Calculations
Calculation Summary
Calculation Objective:
Estimate the total thermal oxidiser VOC/HAP stack emissions from TO-1 and TO-2 for the worst case scenario
Estimate emissions from combustion system to confirm compliance with EPA requirements and input into stack dispersion modelling (by others)
Basis/Method:
1. Worst case emissions to the thermal oxidisers are estimated through first principal calculation methods and modelling of the bulk
tank, ship and truck vapour emissions during specific activities.
2. Worst case emissions from the thermal oxidisers are estimated through first principal methods using
calculations methods for the stoichiometric combustion of the VOC's and flammable liquids and mass and energy balances.
3. Both thermal oxidisers operating at the same time TO-1 (existing) and TO-2 (proposed new).
4. The maximum worst case calculation is based on the following scenario (with all loads occurring simultaneously):-
(i) Worst case VOC-inert stream (tanks diurnal breathing and export from tank T204 to ship at 200m3/hr and collection of benzene vapours)
(ii) Worst case dilute VOC-Air stream (future) based on collection vapours from 2 off flammable liquid truck fills.
(iii) Liquid waste burning based on BTX (benzene). Concentration and flowrate estimated to achieve the thermal capacity of the 2nd thermal
oxidiser TO-2- (6.5 l/min @ 80% (v/v) benzene)
5. BTX (benzene) was deemed to be the worst case chemical for the modelling emissions. The key reasons are:
a. It is a hazardous chemical requiring emissions to be reduced by the maximum extent possible.
b. It has a relatively high vapour pressure and molecular weight and as such the mass loading is generally higher
than many other chemicals for the same volumetric vapour rate.c. BTX vapour and liquid contain sulphur compounds (primarily hydrogen sulphide {H2S}) which also make it very odorous.
Using BTX maximises the emissions of H2S to the thermal oxidisers.
6. Contents of tanks are based on data supplied by Terminals.
7. Tanks capacity, diameter and height data supplied by Terminals.
8. Connection of tanks to the existing VOC-nitrogen inert vapour collection system are based on data supplied by Terminals (refer to attachments).
9. Thermal load from VOC/Air Dilute stream is based on CEC Engineers calculation 200003CAL-003.
10. A single thermal oxidiser has currently been installed with a thermal capacity of 15,000 MJ/hr.
11. Proposed 2nd thermal oxidiser will have a thermal capacity of 22,500 MJ/hr.
12. Previously CEC Engineers (refer to calculations 180003CAL-001 and 002 rev 2) estimated that the overall thermal capacity
required for the thermal oxidiser was 37,500 MJ/hr. This would be met by installing 2 off thermal oxidisers operating in parallel.
Assumptions:
The assumptions are listed below and in the calculation sheets
Expansion factor for diurnal breathing is based on thermal expansion of vapours plus expansion due to vapour pressure.
Daily emissions are assumed to occur over a 3 hr period.
Tanks assumed to be 25% full.
Temperature of tank contents ranges between 15˚C and 30˚C.
Inerted vapours are 100% saturated.
All tanks listed are breathing diurnally to the VOC-nitrogen inerted vapour collection system.
Maximum hydrogen sulphide (H2S) concentration in the BTX vapour space 4% v/v -based on past sample analysis - SGS report ENV11869
Maximum hydrogen sulphide (H2S) concentration in the BTX liquid 0.2% w/w -based on past sample analysis - SGS report ENV11869
Other assumptions are listed in the calculation sheet.
Conclusions/Outcomes:Refer to the following summary sheets for tabulated results of the emissions from the thermal oxidiser stacks.
Thermal oxidiser TO-1: sheet "Total Output TO-1"
Thermal oxidiser TO-2: sheet "Total Output TO-2"
Design Verification Control
Rev Issue Description Date Originated Checked Approved Client
1 Initial Issue 28/10/2020 FS AB
Attachments included, clearly labelled and referenced FS AB
Results/conclusions clearly summarised FS AB
Assumptions properly documented FS AB
Method of Calculation FS AB
Originator Checked
Input Data Correct FS AB
Front Cover Page 1

Client : Quantem (Terminals Pty Ltd) Calc by FS
Project No : 200003 Date 28/10/2020
Project : 2nd Thermal Oxidiser and Liquid Waste Burning Checked AB
Calculation No: 200003CAL-002 Rev 1
Thermal Oxidiser TO-1
Total Output Stack Emission EstimateStack Diameter 1 m
Exit Temperature 980oC
Input stream Total flue Total flue VOC/HAP VOC/HAP
vol rate at vol rate at discharge discharge
exit temp 0°C temp rate from rate from
combust combust
Am3/hr Nm
3/hr kg/hr g/min mg/m
3mg/m
3m/sec
Total TO-1
A Benzene 0.0073 0.1218 0.1370 0.6289
B Hexene 0.0111 0.1849 0.2080 0.9545
C Acetone 0.0062 0.1038 0.1167 0.5357
D Ethanol 0.0015 0.0256 0.0288 0.1320
E Methanol 0.0059 0.0988 0.1112 0.5104
F Styrene 0.0000 0.0005 0.0005 0.0024
G Vinyl Acetate 0.0020 0.0334 0.0376 0.1724
H Methyl Methacrylate 0.0000 0.0000 0.0000 0.0000
I Butyl Acrylates 0.0000 0.0003 0.0004 0.0018
J Methyl Isobutyl Carbinol (MIBC) 0.0000 0.0000 0.0000 0.0000
Hydrogen Sulphide (H2S) 444 97 0.0008 0.0139 0.0156 0.0717
Sulphur Dioxide (from combustion of H2S) 24 5 14.8789 248 279 1280
Supplementary N2 inerting 1165 254 0.0000 0.0000 0.0000 0.0000
Total (VOC-nitrogen inert stream, incl. N2
inerting)-excludes SO2 53333 11620 0.035 0.583 0.656 3.010 18.9
Breakdown:
Total (VOC-nitrogen inert stream, incl. N2 inerting)
A Benzene 10279 2240 0.00731 0.1218 0.2495 1.1451
B Hexene 14293 3114 0.00918 0.1530 0.3133 1.4380
C Acetone 4201 915 0.00420 0.0700 0.1433 0.6579
D Ethanol 1441 314 0.00153 0.0256 0.0524 0.2404
E Methanol 4138 902 0.00593 0.0988 0.2025 0.9293
F Styrene 40 9 0.00003 0.0005 0.0010 0.0044
G Vinyl Acetate 1588 346 0.00200 0.0334 0.0684 0.3140
H Methyl Methacrylate 0 0 0.00000 0.0000 0.0000 0.0000
I Butyl Acrylates 24 5 0.00002 0.0003 0.0007 0.0033
J Methyl Isobutyl Carbinol (MIBC) 0 0 0.00000 0.0000 0.0000 0.0000
Hydrogen Sulphide (H2S) 444 97 0.00083 0.0139 0.0285 0.1306
Sulphur Dioxide (from combustion of H2S) 24 5 14.88 247.98 395.59 1815.64
Supplementary N2 inerting 1165 254 0.0 0.0000 0.0000 0.0000
Total (VOC-nitrogen inert stream, incl. N2
inerting)-excludes SO2 37612 8195 0.031 0.517 0.825 3.787 13.3
VOC-Air
Benzene 0.00000 0.00000 0.000 0.000
Hexane 0.00191 0.03190 0.122 0.559
Acetone 0.00203 0.03377 0.129 0.592
Ethanol 0.00000 0.00000 0.000 0.000
Methanol 0.00000 0.00000 0.000 0.000
Vinyl Acetate 0.00000 0.00000 0.000 0.000
Total (VOC-Air Diluted Stream) 15721 3425 0.00394 0.06567 0.251 1.150 5.6
Conc'n of
VOC/HAP at
stack exit
temp
Conc'n of
VOC/HAP at
0°C temp
exit velocity
CEC Engineers Total Output TO-1 2 of 16

Client : Quantem (Terminals Pty Ltd) Calc by FS
Project No : 200003 Date 28/10/2020
Project : 2nd Thermal Oxidiser and Liquid Waste Burning Checked AB
Calculation No: 200003CAL-002 Rev 1
Thermal Oxidiser TO-2
Total Output Stack Emission EstimateStack Diameter 1.25 m Estimated - TBC by vendor
Exit Temperature 980oC
Input stream Total flue Total flue VOC/HAP VOC/HAP
vol rate at vol rate at discharge discharge
exit temp 0°C temp rate from rate from
combust combust
Am3/hr Nm
3/hr kg/hr g/min mg/m
3mg/m
3m/sec
Total TO-2
A Benzene 0.0345 0.1218 0.3809 1.7482
B Hexene 0.0111 0.1849 0.1225 0.5620
C Acetone 0.0062 0.1038 0.0687 0.3154
D Ethanol 0.0015 0.0256 0.0169 0.0777
E Methanol 0.0059 0.0988 0.0655 0.3005
F Styrene 0.0000 0.0005 0.0003 0.0014
G Vinyl Acetate 0.0020 0.0334 0.0221 0.1015
H Methyl Methacrylate 0.0000 0.0000 0.0000 0.0000
I Butyl Acrylates 0.0000 0.0003 0.0002 0.0011
J Methyl Isobutyl Carbinol (MIBC) 0.0000 0.0000 0.0000 0.0000
Hydrogen Sulphide (H2S) 454 99 0.0009 0.0148 0.0098 0.0450
Sulphur Dioxide (from combustion of H2S) 24 5 15.850 264 175 803
Supplementary N2 inerting 1165 254
Total (VOC-nitrogen inert stream, incl. N2
inerting)-excludes SO2 90580 19735 0.0622 1.0371 0.6870 3.1529 20.5
Breakdown:
VOC-Nitrogen Inert Stream, incl. N2 inerting
A Benzene 10279 2240 0.00731 0.1218 0.2495 1.1451
B Hexene 14293 3114 0.00918 0.1530 0.3133 1.4380
C Acetone 4201 915 0.00420 0.0700 0.1433 0.6579
D Ethanol 1441 314 0.00153 0.0256 0.0524 0.2404
E Methanol 4138 902 0.00593 0.0988 0.2025 0.9293
F Styrene 40 9 0.00003 0.0005 0.0010 0.0044
G Vinyl Acetate 1588 346 0.00200 0.0334 0.0684 0.3140
H Methyl Methacrylate 0 0 0.00000 0.0000 0.0000 0.0000
I Butyl Acrylates 24 5 0.00002 0.0003 0.0007 0.0033
J Methyl Isobutyl Carbinol (MIBC) 0 0 0.00000 0.0000 0.0000 0.0000
Hydrogen Sulphide (H2S) 444 97 0.00083 0.0139 0.0285 0.1306
Sulphur Dioxide (from combustion of H2S) 24 5 14.88 247.98 395.59 1815.64
Supplementary N2 inerting 1165 254
Total (VOC-nitrogen inert stream, incl. N2
inerting)-excludes SO2 37612 8195 0.0310 0.5173 0.8252 3.7873 8.5
VOC-Air Stream
Benzene 0.00000 0.00000 0.000 0.000
Hexane 0.00191 0.03190 0.122 0.559
Acetone 0.00203 0.03377 0.129 0.592
Ethanol 0.00000 0.00000 0.000 0.000
Methanol 0.00000 0.00000 0.000 0.000
Vinyl Acetate 0.00000 0.00000 0.000 0.000
Total (VOC-Air Diluted Stream) 15721 3425 0.00394 0.06567 0.251 1.150 3.6
Liquid Waste Burning Steam
A Benzene 37235 8113 0.02719 0.45323 0.73010 3.01918
B Hexene 0 0 0.00000 0.00000 0.00000 0.00000
C Acetone 0 0 0.00000 0.00000 0.00000 0.00000
D Ethanol 0 0 0.00000 0.00000 0.00000 0.00000
E Methanol 0 0 0.00000 0.00000 0.00000 0.00000
F Styrene 0 0 0.00000 0.00000 0.00000 0.00000
G Vinyl Acetate 0 0 0.00000 0.00000 0.00000 0.00000
H Methyl Methacrylate 0 0 0.00000 0.00000 0.00000 0.00000
I Butyl Acrylates 0 0 0.00000 0.00000 0.00000 0.00000
J Methyl Isobutyl Carbinol (MIBC) 0 0 0.00000 0.00000 0.00000 0.00000
Hydrogen Sulphide (H2S) 10.1 2.2 0.00005 0.0009 0.0015 0.0060
Sulphur Dioxide (from combustion of H2S) 1.54 0.33 0.971 16.183 26.069 119.650
Total (VOC)-excludes SO2 37247 8115 0.0272 0.454 0.732 3.358 8.4
Conc'n of
VOC/HAP at
stack exit
temp
Conc'n of
VOC/HAP at
0°C temp
exit
velocity
CEC Engineers Total Output TO-2 3 of 16

Client : Quantem (Terminals Pty Ltd) Calc by FS
Project No. : 200003 Date 28/10/2020
Project : 2nd Thermal Oxidiser and Liquid Waste Burning Checked AB
Rev 1Calculation No: 200003CAL-002
Emission Base Data-Botany TerminalProduct ID Product ID
Temperature 30 ˚C N2 inline inerting Benzene A Styrene F
% Saturated vapour 100% Truck ship loading- O2 conc initial 21% Hexene B Vinyl Acetate G
% Tank vapour space 75% Truck ship loading- O2 conc final 5.5% Acetone C Methyl Methacrylate H
Diurnal breathing time/day 3 hrs Ethanol D Butyl Acrylates I
Methanol E MIBC J
1 2 3 4 5 6 7 8 9 10 11 12 13 14 15 16 17 18 19 20 21 22 23 24 25 26 27 28 29 30 31 32 33
Note 1 Note 1 Note 1 Note 1 Note 1 Note 1 Note 1 Note 1 Note 1 Note 1 Note 1 Note 1 Note 1 Note 3 Note 4 Note 5
Existing Diameter Height Nominal ERV P Vent N2 Actual Design Actual Actual Design Design Calculation Product Product VOC Mole VOC % tank Tank VOC Maximum Breathing Tank fill Truck/ Truck/ship Truck/ Diurnal Tank fill Truck/ship Truck/ship Truck/ship
Tank Volume Setting Setting Setting Tank Tank Truck Ship Truck Ship Truck/Ship Nominated ID Vapour Fraction Conc. expansion Diurnal mass rate outflow to TO Ship vapours Ship Breathing loading loading loading
Number Filling filling Loading Loading Loading Loading Loading Density at 100 % Factor Breathing (diurnal) to VCS loading inline loading to VCS to VCS vapours N2 inerting vapours
Rate Rate Rate Rate Rate Rate Rate from tank (VOC-nitrogen
inert)
N2 inerted (VOC-Air
diluted )
(VOC-nitrogen
inert)
(VOC-Air
diluted )Sat. (max) (CEC) Y/N Y/N Y/N Y/N Y/N
m m m3 kPag kPag kPag m
3/hr m
3/hr m
3/hr m
3/hr m
3/hr m
3/hr m
3/hr kg/m
3kg/m
3
m3/hr kg/hr m
3/hr m
3/hr m
3/hr m
3/hr m
3/hr m
3/hr
Area 1
Cluster 1a
201 8.6 14.64 850 2.5 1.25 0.25 60 200 - 140 - 200 200 Methanol E 1.30 0.21 0.27 18.1% 38.4 10.5 238 Y N N N N 38.4 0 0 0 0
202 8.6 14.64 850 2.5 1.25 0.25 60 200 - 160 - 200 200 Benzene A 3.18 0.15 0.49 13.6% 29.0 14.1 229 Y N N N N 29.0 0 0 0 0
203 8.6 14.64 850 2.5 1.25 0.25 60 200 - 160 - 200 200 Styrene F 4.24 0.01 0.05 5.9% 12.4 0.6 212 Y N N N N 12.4 0 0 0 0
204 9.5 14.64 1038 2.5 1.25 0.25 60 200 - 160 - 160 200 Benzene A 3.18 0.15 0.49 13.6% 35.4 17.3 235 Y N Y Y N 35.4 0 200 564 0
205 9.5 14.64 1038 2.5 1.25 0.25 60 200 - 160 - 90 200 Benzene A 3.18 0.15 0.49 13.6% 35.4 17.3 235 Y N N N N 35.4 0 0 0 0
206 9.5 14.64 1038 2.5 1.25 0.25 60 200 - 140 - 200 200 Methanol E 1.30 0.21 0.27 18.1% 46.9 12.9 247 Y N N N N 46.9 0 0 0 0
207 9.5 14.64 1038 2.5 1.25 0.25 60 200 - 140 - 200 200 Methanol E 1.30 0.21 0.27 18.1% 46.9 12.9 247 Y N N N N 46.9 0 0 0 0
Sub total Area 1 cluster 1a 6702 244 85 244.3 0 200 564 0
Cluster 1b
221 7.6 12.2 553 2.5 1.25 0.25 60 200 - 160 - 200 200 Acetone C 2.36 0.37 0.87 27.1% 37.5 32.6 237 Y N N N N 37.5 0 0 0 0
Sub total Area 1 cluster 1b 553 37 32.6 37.5 0.0 0.0 0.0 0.0
Cluster 1c
223 6.1 10.97 321 2.5 1.25 0.25 60 200 - 160 - 200 200 Acetone C 2.36 0.37 0.87 27.1% 21.7 18.9 222 Y N N N N 21.7 0 0 0 0
230 7.6 12.2 553 2.5 1.25 0.25 60 200 - 160 - 200 200 Acetone C 2.36 0.37 0.87 27.1% 37.5 32.6 237 Y N N N N 37.5 0 0 0 0
Sub total Area 1 cluster 1c 874 59 51.4 59.2 0.0 0.0 0.0 0.0
Area 1 Total 8130 341 169.5 341.0 0.0 200.0 563.6 0.0
Area 2
Cluster 1
cluster 1a
233 7.6 12.2 553 2.5 1.25 0.25 - 200 72 - 90 - 90 Methanol E 1.30 0.21 0.27 18.1% 25.0 6.9 225 Y N N N N 25.0 0 0 0 0
234 7.6 12.2 553 2.5 1.25 0.25 - 200 72 - 90 - 90 Methanol E 1.30 0.21 0.27 18.1% 25.0 6.9 225 Y N N N N 25.0 0 0 0 0
241 9.58 17.08 1231 2.5 1.25 0.25 60 200 - 140 - 200 200 Ethanol D 1.87 0.10 0.19 11.5% 35.3 6.7 235 Y N N N N 35 0 0 0 0
242 7.6 12.2 553 2.5 1.25 0.25 - 200 72 - 90 - 90 Methanol E 1.30 0.21 0.27 18.1% 25.0 6.9 225 Y N N N N 25.0 0 0 0 0
243 7.6 12.2 553 2.5 1.25 0.25 - 200 72 - 90 - 90 Methanol E 1.30 0.21 0.27 18.1% 25.0 6.9 225 Y N N N N 25.0 0 0 0 0
251 7.6 12.2 553 2.5 1.25 0.25 60 200 - 140 - 200 200 Ethanol D 1.87 0.10 0.19 11.5% 15.9 3.0 216 Y N N N N 15.9 0 0 0 0
252 7.6 12.2 553 2.5 1.25 0.25 - 200 72 - 90 - 90 Methanol E 1.30 0.21 0.27 18.1% 25.0 6.9 225 Y N N N N 25.0 0 0 0 0
253 7.6 12.2 553 2.5 1.25 0.25 - 200 72 - 90 - 90 Butyl Acrylates I 5.22 0.01 0.05 5.8% 8.0 0.4 208 Y N N N N 8.0 0 0 0 0
254 7.6 12.2 553 2.5 1.25 0.25 - 200 72 - 90 - 90 Methanol E 1.30 0.21 0.27 18.1% 25.0 6.9 225 Y N N N N 25.0 0 0 0 0
259 7.6 12.2 553 2.5 1.25 0.25 - 200 72 - 90 - 90 Methanol E 1.30 0.21 0.27 18.1% 25.0 6.9 225 Y N N N N 25.0 0 0 0 0
260 7.6 12.2 553 2.5 1.25 0.25 60 200 - 140 - 200 200 Ethanol D 1.87 0.10 0.19 11.5% 15.9 3.0 216 Y N N N N 15.9 0 0 0 0
Sub total Area 2 cluster 1a 6765.6 249.9 61.2 249.9 0.0 0.0 0.0 0.0
Cluster 1b
235 7.6 12.2 553 2.5 1.25 0.25 - 200 72 - 90 - 90 Methanol E 1.30 0.21 0.27 18.1% 25.0 6.9 225 Y N N N N 25.0 0 0 0 0
240 7.6 12.2 553 2.5 1.25 0.25 60 200 - 140 - 200 200 Methanol E 1.30 0.21 0.27 18.1% 25.0 6.9 225 Y N N N N 25.0 0 0 0 0
245 7.6 12.2 553 2.5 1.25 0.25 - 200 72 - 90 - 90 Methanol E 1.30 0.21 0.27 18.1% 25.0 6.9 225 Y N N N N 25.0 0 0 0 0
250 7.6 12.2 553 2.5 1.25 0.25 60 200 - 140 - 200 200 Methanol E 1.30 0.21 0.27 18.1% 25.0 6.9 225 Y N N N N 25.0 0 0 0 0
255 7.6 12.2 553 2.5 1.25 0.25 60 200 - 140 - 200 200 Ethanol D 1.87 0.10 0.19 11.5% 15.9 3.0 216 Y N N N N 15.9 0 0 0 0
258 7.6 12.2 553 2.5 1.25 0.25 - 200 72 - 90 - 90 Methanol E 1.30 0.21 0.27 18.1% 25.0 6.9 225 Y N N N N 25.0 0 0 0 0
Sub total Area 2 cluster 1b 3321 140.8 37.3 140.8 0.0 0.0 0.0 0.0
Sub total Area 2 cluster 1 10086 390.7 98.6 390.7 0.0 0.0 0.0 0.0
Area 2 cluster 2
237 10.7 17.08 1536 2.5 1.25 0.25 - 200 72 - 90 - 90 Hexene B 3.42 0.30 1.01 21.9% 84.0 84.9 284 Y N N N N 84 0 0 0 0
238 9.58 17.08 1231 2.5 1.25 0.25 - 200 60 - 90 - 90 Hexene B 3.42 0.30 1.01 21.9% 67.3 68.1 267 Y N N N N 67 0 0 0 0
244 7.6 12.2 553 2.5 1.25 0.25 - 200 72 - 90 - 90 Hexene B 3.42 0.30 1.01 21.9% 30.3 30.6 230 Y N N N N 30 0 0 0 0
247 8.74 17.08 1025 2.5 1.25 0.25 60 200 - 140 - 200 200 Vinyl Acetate G 3.51 0.18 0.65 15.7% 40.2 26.0 240 Y N N N N 40.2 0 0 0 0
248 8.74 17.08 1025 2.5 1.25 0.25 60 200 - 140 - 200 200 Ethanol D 1.87 0.10 0.19 11.5% 29.4 5.6 229 Y N N N N 29.4 0 0 0 0
249 8.6 14.64 850 2.5 1.25 0.25 60 200 - 140 - 200 200 Ethanol D 1.87 0.10 0.19 11.5% 24.4 4.6 224 Y N N N N 24.4 0 0 0 0
256 7.6 12.2 553 2.5 1.25 0.25 60 200 - 140 - 200 200 Vinyl Acetate G 3.51 0.18 0.65 15.7% 21.7 14.1 222 Y N N N N 21.7 0 0 0 0
257 8.6 14.64 850 2.5 1.25 0.25 60 200 - 140 - 200 200 Ethanol D 1.87 0.10 0.19 11.5% 24.4 4.6 224 Y N N N N 24.4 0 0 0 0
Subtotal Area 2 cluster 2 7624 321.6 238.5 321.6 0.0 0.0 0.0 0.0
Area 2 Total 17710 712.3 337.1 712.3 0.0 0.0 0.0 0.0
Total 25840 1053 507 1053 0 200 564 0
Note 1: Information supplied by TPL
Note 2: Maximum tank filling 200 m3/hr from ship, 90 m3 from truck, maximum tank pump out 90 m3/hr to truck, 200 m3/hr to ship
Note 3 Estimated by CEC elsewhere based 15˚C temperature rise in liquid and vapour
Note 4 Estimated by CEC based on expansion factor and diurnal
Note 5 Summation of diurnal breathing and pump in rate
Worst Case Load
CEC Engineers Emission Base Data Page 4

Client : Quantem (Terminals Pty Ltd) Calc by FS
Project No : 200003 Date 28/10/2020
Project : 2nd Thermal Oxidiser and Liquid Waste Burning Checked AB
Rev 1
Calculation No: 200003CAL-002
VOC - Inert Emission EstimateWorst Case Load
All tanks listed are diurnally breathing simultaneously
BTX ship export + nitrogen inertingBase Temperature 30 °C H2S scrubber efficiency 0.00%
VOC % saturated (VOC/Inert Stream) 100% Refer to Comb Output-Emission Est sheet for input
VOC % saturated (VOC-AIR Diluted Stream) 50%
Stream Input stream Volumetric Base Molecular formula MW VOC VOC VOC 100% H2S H2S 100% Heat of Energy
ID rate input Temp at at density VOC VOC Mass rate Vol rate VOC Combustion
stream No of No of No of No of No of 100% XX% vol rate conc. inlet to mass rate of VOC
@ inlet temp Saturation Saturation scrubber Comb inlet Comb inlet net (LHV)
m3/hr °C C H O N S kg/m3 m3/hr kg/m3 kg/hr m3/hr kg/hr MJ/kg MJ/hr
VOC/Inert Stream
Tank Diurnal Breathing
A Benzene 99.8 30 6 6 0 78 15.4% 15.4% 3.18 15.3 0.49 48.7 40.21 1956
B Hexene 181.6 30 6 14 0 84 29.6% 29.6% 3.42 53.7 1.01 183.6 44.52 8171
C Acetone 96.7 30 3 6 1 58 36.8% 36.8% 2.36 35.6 0.87 84.0 28.60 2402
D Ethanol 160.9 30 2 6 1 46 10.2% 10.2% 1.87 16.4 0.19 30.7 26.85 824
E Methanol 432.0 30 1 4 1 32 21.1% 21.1% 1.30 91.0 0.27 118.6 19.94 2366
F Styrene 12.4 30 8 8 104 1.1% 1.1% 4.24 0.13 0.05 0.56 40.51 23
G Vinyl Acetate 61.9 30 4 6 2 86 18.5% 18.5% 3.51 11.4 0.65 40.1 22.65 908
H Methyl Methacrylate 0.0 30 5 8 2 100 6.2% 6.2% 4.08 0.00 0.25 0.00 26.40 0
I Butyl Acrylates 8.0 30 7 12 2 128 1.0% 1.0% 5.22 0.08 0.05 0.42 32.24 13
J Methyl Isobutyl Carbinol (MIBC) 0.0 30 102 0.8% 0.8% 4.16 0.00 0.03 0.00 38.70 0
K Hydrogen Sulphide (H2S) 99.8 30 2 1 34 4% 4.0% 1.39 3.99 0.06 5.55 3.99 5.55 15.24 85
Total Tank Diurnal Breathing 1053 30 223.6 0.48 506.5 16747
Tank Filling
A Benzene 0.0 30 6 6 0 78 15.4% 15.4% 3.18 0.0 0.49 0.0 40.21 0
B Hexene 0.0 30 6 14 0 84 29.6% 29.6% 3.42 0.0 1.01 0.0 44.52 0
C Acetone 0.0 30 3 6 1 58 36.8% 36.8% 2.36 0.0 0.87 0.0 28.60 0
D Ethanol 0.0 30 2 6 1 46 10.2% 10.2% 1.87 0.0 0.19 0.0 26.85 0
E Methanol 0.0 30 1 4 1 32 21.1% 21.1% 1.30 0.0 0.27 0.0 19.94 0
F Styrene 0.0 30 8 8 104 1.1% 1.1% 4.24 0.0 0.05 0.0 40.51 0
G Vinyl Acetate 0.0 30 4 6 2 86 18.5% 18.5% 3.51 0.0 0.65 0.0 22.65 0
H Methyl Methacrylate 0.0 30 5 8 2 100 6.2% 6.2% 4.08 0.0 0.25 0.0 26.40 0
I Butyl Acrylates 0.0 30 7 12 2 128 1.0% 1.0% 5.22 0.0 0.05 0.0 32.24 0
J Methyl Isobutyl Carbinol (MIBC) 0.0 30 102 0.8% 0.8% 4.16 0.0 0.03 0.0 38.70 0
K Hydrogen Sulphide (H2S) note 1
0.0 30 2 1 34 4% 4.0% 1.39 0.00 0.06 0.00 0.00 0.00 15.24 0
Total Tank Filling 0 30 0.0 #DIV/0! 0.0 0
Truck/Ship Filling
A Benzene 200.0 30 6 6 0 78 15.4% 15.4% 3.18 30.7 0.49 97.5 40.21 3921
B Hexene 0.0 30 6 14 0 84 29.6% 29.6% 3.42 0.0 1.01 0.0 44.52 0
C Acetone 0.0 30 3 6 1 58 36.8% 36.8% 2.36 0.0 0.87 0.0 28.60 0
D Ethanol 0.0 30 2 6 1 46 10.2% 10.2% 1.87 0.0 0.19 0.0 26.85 0
E Methanol 0.0 30 1 4 1 32 21.1% 21.1% 1.30 0.0 0.27 0.0 19.94 0
F Styrene 0.0 30 8 8 104 1.1% 1.1% 4.24 0.0 0.05 0.0 40.51 0
G Vinyl Acetate 0.0 30 4 6 2 86 18.5% 18.5% 3.51 0.0 0.65 0.0 22.65 0
H Methyl Methacrylate 0.0 30 5 8 2 100 6.2% 6.2% 4.08 0.0 0.25 0.0 26.40 0
I Butyl Acrylates 0.0 30 7 12 2 128 1.0% 1.0% 5.22 0.0 0.05 0.0 32.24 0
J Methyl Isobutyl Carbinol (MIBC) 0.0 30 102 0.8% 0.8% 4.16 0.0 0.03 0.0 38.70 0
K Hydrogen Sulphide (H2S) 200.0 30 2 1 34 4% 4.0% 1.39 8.00 0.06 11.12 8.00 11.12 15.24 169
Supplementary N2 inerting 563.6 30
Total Truck/Ship Filling (incl. N2 inerting) 764 30 30.7 0.13 97.5 4090
CEC Engineers VOC-Inert Emission Calc Page 5

VOC - Inert Emission EstimateWorst Case Load
All tanks listed are diurnally breathing simultaneously
BTX ship export + nitrogen inertingBase Temperature 30 °C H2S scrubber efficiency 0.00%
VOC % saturated (VOC/Inert Stream) 100% Refer to Comb Output-Emission Est sheet for input
VOC % saturated (VOC-AIR Diluted Stream) 50%
Stream Input stream Volumetric Base Molecular formula MW VOC VOC VOC 100% H2S H2S 100% Heat of Energy
ID rate input Temp at at density VOC VOC Mass rate Vol rate VOC Combustion
stream No of No of No of No of No of 100% XX% vol rate conc. inlet to mass rate of VOC
@ inlet temp Saturation Saturation scrubber Comb inlet Comb inlet net (LHV)
m3/hr °C C H O N S kg/m3 m3/hr kg/m3 kg/hr m3/hr kg/hr MJ/kg MJ/hr
Total
A Benzene 299.8 30 6 6 0 78 15.4% 15.4% 3.18 46.0 0.49 146.2 40.21 5877
B Hexene 181.6 30 6 14 0 84 29.6% 29.6% 3.42 53.7 1.01 183.6 44.52 8171
C Acetone 96.7 30 3 6 1 58 36.8% 36.8% 2.36 35.6 0.87 84.0 28.60 2402
D Ethanol 160.9 30 2 6 1 46 10.2% 10.2% 1.87 16.4 0.19 30.7 26.85 824
E Methanol 432.0 30 1 4 1 32 21.1% 21.1% 1.30 91.0 0.27 118.6 19.94 2366
F Styrene 12.4 30 8 8 104 1.1% 1.1% 4.24 0.13 0.05 0.56 40.51 23
G Vinyl Acetate 61.9 30 4 6 2 86 18.5% 18.5% 3.51 11.4 0.65 40.1 22.65 908
H Methyl Methacrylate 0.0 30 5 8 2 100 6.2% 6.2% 4.08 0.00 0.25 0.00 26.40 0
I Butyl Acrylates 8.0 30 7 12 2 128 1.0% 1.0% 5.22 0.08 0.05 0.42 32.24 13
J Methyl Isobutyl Carbinol (MIBC) 0.0 30 102 0.8% 0.8% 4.16 0.00 0.03 0.00 38.70 0
K Hydrogen Sulphide (H2S) 299.8 30 2 1 34 4% 4.0% 1.39 11.99 0.06 16.67 11.99 16.67 15.24 254
Supplementary N2 inerting 563.6 30
Total (incl. N2 inerting) 1817 30 254.3 0.33 604.1 20837
Note 1 4% H2S v/v based on historical BTX vapour analysis (Terminals Botany)- SGS report ENV11869- dated 20th October 2010
VOC/Air Dilute Stream (MJ/hr)
Thermal load from the VOC/Air dilute stream - Refer to previous CEC calculation 200003CAL-003 2875
Thermal Load Waste Burning (MJ/hr)
Max thermal load from liquid waste burning (6.5 l/min @ 80% (v/v) benzene) -Refer to Separate Calc Sheet LWB-Thermal Load 10644
Total Thermal Load (MJ/hr)
VOC/Inert stream thermal load + VOC/Air dilute stream thermal load +LWB 34356
Total thermal load existing thermal Oxidser TO-1 (MJ/hr) 11856
Total Thermal Load for 2nd Oxidiser TO-2 (MJ/hr) 22500
Heat of combustion data (A-G): source: Perry Chemical Engineers Handbook 7th Ed., pg's 2-195 to 2-199, Cmpd No 67, 34, 123, 83, 82, 80, 155
Heat of combustion data (H-J): source: Cameo Chemicals data sheets
Ambient temperature is same as inlet temperature
CEC Engineers VOC-Inert Emission Calc Page 6

Client : Quantem (Terminals Pty Ltd) Calc by FS
Project No : 200003 Date 28/10/2020
Project : 2nd Thermal Oxidiser and Liquid Waste Burning Checked AB
Calculation No: 200003CAL-002 Rev 1
VOC-Inert Stack Emission Estimate - Thermal Oxidiser TO-1
Worst Case Load
Input VOC -inert stream split 50% Combustor reduction eff (VOC) 99.99% Initial flue gas temp 30
Scrubber reduction eff (S) 0.00% Final flue gas temp 980
Combuster eff for (S) 99.99%
Combustor/Scrubber reduction eff (S) 99.99% % conversion of H2S to SO3 5%
Combustor diameter exit 1 m Est
Stream Input stream Molecular formula Required for Comb Required for Comb Combustion Flue products Average Flue prod Inlet Outlet Total flue Quench air Total flue products Total flue Total flue HAP/VOC HAP/VOC
ID Air with excess combustion air (only) at ambient temp CP air density Temp Comb flowrate flowrate with excess combustion & quench air vol rate at vol rate at discharge discharge
100% VOC 100% VOC
No
of No of No of No of No of with VOC Total air input 25C-800C as air Temp Amb Amb Amb Amb Amb Amb exit temp 0oC temp rate from rate from
Vol rate mass rate O2 N2 Air O2 N2 Air
with 100%
excess CO2 H20 SO2 N2
excess
O2 CO2 H20 SO2 N2 excess O2 Total
@ambient
temp CO2 H20 SO2/SO3 N2 O2 Total combust combust
m3/hr kg/hr C H O N S moles/moles or m3/m3 of combust VOC m3/hr m
3/hr m
3/hr m
3/hr moles/moles or m
3/m
3 of combust VOC m
3/hr m
3/hr m
3/hr m
3/hr m
3/hr m
3/hr kJ/kg°C kg/m
3 oC
oC m
3/hr m
3/hr m
3/hr m
3/hr m
3/hr m
3/hr m
3/hr m
3/hr Am
3/hr Nm
3/hr kg/hr g/min mg/m
3mg/m
3m/sec
Tank Diurnal Breathing (VOC-nitrogen inert stream)
A Benzene 7.660 24.327 6.0 6.0 0.0 0.0 0.0 7.5 28.21 35.71 57.4 216.1 273.6 547.1 6.0 3.0 0.0 28.2 7.5 46.0 23.0 0 432.2 57.4 558.6 1.0727 1.16 30.0 980.0 827.4 268.8 46.0 23.0 0.0 644.6 113.9 827.4 3421.5 745.5 0.0024 0.0405 0.0830 0.3812 1.211
B Hexene 26.834 91.779 6 14 0 0.0 0.0 9.5 35.74 45.24 254.9 959.0 1213.9 2427.9 6 7 0 35.7 9.5 161.0 187.8 0 1918.0 254.9 2521.8 1.0727 1.16 30.0 980.0 3456.2 934.4 161.0 187.8 0.0 2656.2 451.2 3456.2 14292.6 3114.0 0.0092 0.1530 0.3133 1.4380 5.058
C Acetone 17.780 41.988 3 6 1 0.0 0.0 4.5 16.93 21.43 80.0 301.0 381.0 762.0 3 3 0 16.9 4.5 53.3 53.3 0 602.0 80.0 788.7 1.0727 1.16 30.0 980.0 1016.0 227.3 53.3 53.3 0.0 781.5 127.7 1016.0 4201.3 915.4 0.0042 0.0700 0.1433 0.6579 1.487
D Ethanol 8.191 15.342 2 6 1 0.0 0.0 3.5 13.17 16.67 28.7 107.9 136.5 273.0 2 3 0 13.2 3.5 16.4 24.6 0 215.7 28.7 285.3 1.0727 1.16 30.0 980.0 348.4 63.1 16.4 24.6 0.0 265.6 41.9 348.4 1440.9 313.9 0.0015 0.0256 0.0524 0.2404 0.510
E Methanol 45.519 59.308 1 4 1 0.0 0.0 2 7.52 9.52 91.0 342.5 433.5 867.0 1 2 0 7.5 2.0 45.5 91.0 0 685.0 91.0 912.6 1.0727 1.16 30.0 980.0 1000.6 88.1 45.5 91.0 0.0 754.5 109.5 1000.6 4137.8 901.5 0.0059 0.0988 0.2025 0.9293 1.464
F Styrene 0.066 0.280 8 8 0 0.0 0.0 10 37.62 47.62 0.7 2.5 3.1 6.3 8 4 0 37.6 10.0 0.5 0.3 0 5.0 0.7 6.4 1.0727 1.16 30.0 980.0 9.6 3.2 0.5 0.3 0.0 7.5 1.3 9.6 39.7 8.6 0.0000 0.0005 0.0010 0.0044 0.014
G Vinyl Acetate 5.716 20.037 4 6 2 0.0 0.0 5.5 20.69 26.19 31.4 118.3 149.7 299.4 4 3 0 20.7 5.5 22.9 17.1 0 236.5 31.4 308.0 1.0727 1.16 30.0 980.0 383.9 75.9 22.9 17.1 0.0 296.5 47.4 383.9 1587.7 345.9 0.0020 0.0334 0.0684 0.3140 0.562
H Methyl Methacrylate 0.000 0.000 5 8 2 0.0 0.0 7 26.33 33.33 0.0 0.0 0.0 0.0 5 4 0 26.3 7.0 0.0 0.0 0 0.0 0.0 0.0 1.0727 1.16 30.0 980.0 0.0 0.0 0.0 0.0 0.0 0.0 0.0 0.0 0.0 0.0 0.0000 0.0000 0.0000 0.0000 0.000
I Butyl Acrylates 0.040 0.209 7 12 2 0.0 0.0 10 37.62 47.62 0.4 1.5 1.9 3.8 7 6 0 37.6 10.0 0.3 0.2 0 3.0 0.4 3.9 1.0727 1.16 30.0 980.0 5.7 1.8 0.3 0.2 0.0 4.4 0.8 5.7 23.5 5.1 0.0000 0.0003 0.0007 0.0033 0.008
J Methyl Isobutyl Carbinol (MIBC) 0.000 0.000 0 0 0 0.0 0.0 0 0.00 0.00 0.0 0.0 0.0 0.0 0 0 0 0.0 0.0 0.0 0.0 0 0.0 0.0 0.0 1.0727 1.16 30.0 980.0 0.0 0.0 0.0 0.0 0.0 0.0 0.0 0.0 0.0 0.0 0.0000 0.0000 0.0000 0.0000 0.000
K Hydrogen Sulphide (H2S) 2.00 2.77 0 2 0 0 1 0.5 1.9 2.4 1.0 3.8 4.8 9.5 0 1 1 1.9 0.5 0.0 2.0 2.0 7.5 1.0 12.5 1.0727 1.16 30.0 980.0 35.8 23.3 0.0 2.0 2.0 25.9 5.9 35.8 147.8 32.2 0.0003 0.0046 0.0095 0.0435 0.052
Total Tank Diurnal Breathing (VOC-nitrogen inert stream) 5397.8 1.0727 1.16 30.0 980.0 7083.6 1685.8 345.9 399.4 2.0 5436.7 899.6 7083.6 29293.0 6382.3 0.026 0.427 0.874 4.012 10.4
Tank Filling (VOC-inert stream)
A Benzene 0.000 0.000 6.0 6.0 0.0 0.0 0.0 7.5 28.21 35.71 0.0 0.0 0.0 0.0 6.0 3.0 0.0 28.2 7.5 0.0 0.0 0 0.0 0.0 0.0 1.0727 1.16 30.0 980.0 0.0 0.0 0.0 0.0 0.0 0.0 0.0 0.0 0.0 0.0 0.0000 0.0000 0.0000 0.0000 0.000
B Hexene 0.000 0.000 6 14 0 0.0 0.0 9.5 35.74 45.24 0.0 0.0 0.0 0.0 6 7 0 35.7 9.5 0.0 0.0 0 0.0 0.0 0.0 1.0727 1.16 30.0 980.0 0.0 0.0 0.0 0.0 0.0 0.0 0.0 0.0 0.0 0.0 0.0000 0.0000 0.0000 0.0000 0.000
C Acetone 0.000 0.000 3 6 1 0.0 0.0 4.5 16.93 21.43 0.0 0.0 0.0 0.0 3 3 0 16.9 4.5 0.0 0.0 0 0.0 0.0 0.0 1.0727 1.16 30.0 980.0 0.0 0.0 0.0 0.0 0.0 0.0 0.0 0.0 0.0 0.0 0.0000 0.0000 0.0000 0.0000 0.000
D Ethanol 0.000 0.000 2 6 1 0.0 0.0 3.5 13.17 16.67 0.0 0.0 0.0 0.0 2 3 0 13.2 3.5 0.0 0.0 0 0.0 0.0 0.0 1.0727 1.16 30.0 980.0 0.0 0.0 0.0 0.0 0.0 0.0 0.0 0.0 0.0 0.0 0.0000 0.0000 0.0000 0.0000 0.000
E Methanol 0.000 0.000 1 4 1 0.0 0.0 2 7.52 9.52 0.0 0.0 0.0 0.0 1 2 0 7.5 2.0 0.0 0.0 0 0.0 0.0 0.0 1.0727 1.16 30.0 980.0 0.0 0.0 0.0 0.0 0.0 0.0 0.0 0.0 0.0 0.0 0.0000 0.0000 0.0000 0.0000 0.000
F Styrene 0.000 0.000 8 8 0 0.0 0.0 10 37.62 47.62 0.0 0.0 0.0 0.0 8 4 0 37.6 10.0 0.0 0.0 0 0.0 0.0 0.0 1.0727 1.16 30.0 980.0 0.0 0.0 0.0 0.0 0.0 0.0 0.0 0.0 0.0 0.0 0.0000 0.0000 0.0000 0.0000 0.000
G Vinyl Acetate 0.000 0.000 4 6 2 0.0 0.0 5.5 20.69 26.19 0.0 0.0 0.0 0.0 4 3 0 20.7 5.5 0.0 0.0 0 0.0 0.0 0.0 1.0727 1.16 30.0 980.0 0.0 0.0 0.0 0.0 0.0 0.0 0.0 0.0 0.0 0.0 0.0000 0.0000 0.0000 0.0000 0.000
H Methyl Methacrylate 0.000 0.000 5 8 2 0.0 0.0 7 26.33 33.33 0.0 0.0 0.0 0.0 5 4 0 26.3 7.0 0.0 0.0 0 0.0 0.0 0.0 1.0727 1.16 30.0 980.0 0.0 0.0 0.0 0.0 0.0 0.0 0.0 0.0 0.0 0.0 0.0000 0.0000 0.0000 0.0000 0.000
I Butyl Acrylates 0.000 0.000 7 12 2 0.0 0.0 10 37.62 47.62 0.0 0.0 0.0 0.0 7 6 0 37.6 10.0 0.0 0.0 0 0.0 0.0 0.0 1.0727 1.16 30.0 980.0 0.0 0.0 0.0 0.0 0.0 0.0 0.0 0.0 0.0 0.0 0.0000 0.0000 0.0000 0.0000 0.000
J Methyl Isobutyl Carbinol (MIBC) 0.000 0.000 0 0 0 0.0 0.0 0 0.00 0.00 0.0 0.0 0.0 0.0 0 0 0 0.0 0.0 0.0 0.0 0 0.0 0.0 0.0 1.0727 1.16 30.0 980.0 0.0 0.0 0.0 0.0 0.0 0.0 0.0 0.0 0.0 0.0 0.0000 0.0000 0.0000 0.0000 0.000
K Hydrogen Sulphide (H2S) 0.000 0.000 0.0 2.0 0.0 0.0 1.0 0.5 1.9 2.4 0.0 0.0 0.0 0.0 0 1 1 1.9 0.5 0.0 0.0 0.0 0.0 0.0 0.0 1.0727 1.16 30.0 980.0 0.0 0.0 0.0 0.0 0.0 0.0 0.0 0.0 0.0 0.0 0.0000 0.0000 0.0000 0.0000 0.000
Total Tank Filling (VOC-nitrogen inert stream) 0.0 1.0727 1.16 30.0 980.0 0.0 0.0 0.0 0.0 0.0 0.0 0.0 0.0 0.0 0.0 0.000 0.000 #DIV/0! #DIV/0! 0.0
Truck/Ship Filling (VOC-nitrogen inert stream)
A Benzene 15.352 48.757 6.0 6.0 0.0 0.0 0.0 7.5 28.21 35.71 115.1 433.2 548.3 1096.6 6.0 3.0 0.0 28.2 7.5 92.1 46.1 0 866.3 115.1 1119.6 1.0727 1.16 30.0 980.0 1658.3 538.7 92.1 46.1 0.0 1291.9 228.3 1658.3 6857.6 1494.1 0.0049 0.0813 0.1664 0.7640 2.427
B Hexene 0.000 0.000 6 14 0 0.0 0.0 9.5 35.74 45.24 0.0 0.0 0.0 0.0 6 7 0 35.7 9.5 0.0 0.0 0 0.0 0.0 0.0 1.0727 1.16 30.0 980.0 0.0 0.0 0.0 0.0 0.0 0.0 0.0 0.0 0.0 0.0 0.0000 0.0000 0.0000 0.0000 0.000
C Acetone 0.000 0.000 3 6 1 0.0 0.0 4.5 16.93 21.43 0.0 0.0 0.0 0.0 3 3 0 16.9 4.5 0.0 0.0 0 0.0 0.0 0.0 1.0727 1.16 30.0 980.0 0.0 0.0 0.0 0.0 0.0 0.0 0.0 0.0 0.0 0.0 0.0000 0.0000 0.0000 0.0000 0.000
D Ethanol 0.000 0.000 2 6 1 0.0 0.0 3.5 13.17 16.67 0.0 0.0 0.0 0.0 2 3 0 13.2 3.5 0.0 0.0 0 0.0 0.0 0.0 1.0727 1.16 30.0 980.0 0.0 0.0 0.0 0.0 0.0 0.0 0.0 0.0 0.0 0.0 0.0000 0.0000 0.0000 0.0000 0.000
E Methanol 0.000 0.000 1 4 1 0.0 0.0 2 7.52 9.52 0.0 0.0 0.0 0.0 1 2 0 7.5 2.0 0.0 0.0 0 0.0 0.0 0.0 1.0727 1.16 30.0 980.0 0.0 0.0 0.0 0.0 0.0 0.0 0.0 0.0 0.0 0.0 0.0000 0.0000 0.0000 0.0000 0.000
F Styrene 0.000 0.000 8 8 0 0.0 0.0 10 37.62 47.62 0.0 0.0 0.0 0.0 8 4 0 37.6 10.0 0.0 0.0 0 0.0 0.0 0.0 1.0727 1.16 30.0 980.0 0.0 0.0 0.0 0.0 0.0 0.0 0.0 0.0 0.0 0.0 0.0000 0.0000 0.0000 0.0000 0.000
G Vinyl Acetate 0.000 0.000 4 6 2 0.0 0.0 5.5 20.69 26.19 0.0 0.0 0.0 0.0 4 3 0 20.7 5.5 0.0 0.0 0 0.0 0.0 0.0 1.0727 1.16 30.0 980.0 0.0 0.0 0.0 0.0 0.0 0.0 0.0 0.0 0.0 0.0 0.0000 0.0000 0.0000 0.0000 0.000
H Methyl Methacrylate 0.000 0.000 5 8 2 0.0 0.0 7 26.33 33.33 0.0 0.0 0.0 0.0 5 4 0 26.3 7.0 0.0 0.0 0 0.0 0.0 0.0 1.0727 1.16 30.0 980.0 0.0 0.0 0.0 0.0 0.0 0.0 0.0 0.0 0.0 0.0 0.0000 0.0000 0.0000 0.0000 0.000
I Butyl Acrylates 0.000 0.000 7 12 2 0.0 0.0 10 37.62 47.62 0.0 0.0 0.0 0.0 7 6 0 37.6 10.0 0.0 0.0 0 0.0 0.0 0.0 1.0727 1.16 30.0 980.0 0.0 0.0 0.0 0.0 0.0 0.0 0.0 0.0 0.0 0.0 0.0000 0.0000 0.0000 0.0000 0.000
J Methyl Isobutyl Carbinol (MIBC) 0.000 0.000 0 0 0 0.0 0.0 0 0.00 0.00 0.0 0.0 0.0 0.0 0 0 0 0.0 0.0 0.0 0.0 0 0.0 0.0 0.0 1.0727 1.16 30.0 980.0 0.0 0.0 0.0 0.0 0.0 0.0 0.0 0.0 0.0 0.0 0.0000 0.0000 0.0000 0.0000 0.000K Hydrogen Sulphide (H2S) 4.000 5.560 0.0 2.0 0.0 0.0 1.0 0.5 1.9 2.4 2.0 7.5 9.5 19.0 0 1 1 1.9 0.5 0.0 4.0 4.0 15.0 2.0 25.0 1.0727 1.16 30.0 980.0 71.7 46.6 0.0 4.0 4.0 51.9 11.8 71.7 296.3 64.6 0.0006 0.0093 0.0190 0.0871 0.105
19 Supplementary N2 inerting 281.8 281.8 281.8 1.0727 1.16 30.0 980.0 281.8 281.8 281.8 1165.4 253.9
20 Total Truck/Ship Filling (VOC-nitrogen inert stream, incl. N2 inerting) 1426.5 1.0727 1.16 30.0 980.0 2011.8 585.3 92.1 50.1 4.0 1625.5 240.1 2011.8 8319.3 1812.6 0.005 0.091 0.653 2.997 2.9
Total (VOC-nitrogen inert stream, incl. N2 inerting)
A Benzene 23.012 73.084 6.0 6.0 0.0 0.0 0.0 7.5 28.21 35.71 172.6 649.3 821.9 1643.7 6.0 3.0 0.0 28.2 7.5 138.1 69.0 0 1298.5 172.6 1678.3 1.0727 1.16 30.0 980.0 2485.7 807.4 138.07 69.04 0.00 1936.42 342.15 2485.68 10279.07 2239.57 0.0073 0.122 0.249 1.145 3.637
B Hexene 26.834 91.779 6 14 0 0.0 0.0 9.5 35.74 45.24 254.9 959.0 1213.9 2427.9 6 7 0 35.7 9.5 161.0 187.8 0 1918.0 254.9 2521.8 1.0727 1.16 30.0 980.0 3456.2 934.4 161.01 187.84 0.00 2656.23 451.16 3456.24 14292.64 3114.04 0.0092 0.153 0.313 1.438 5.058
C Acetone 17.78 41.99 3.0 6.0 1.0 0.0 0.0 4.5 16.93 21.43 80.0 301.0 381.0 762.0 3 3 0 16.9 4.5 53.3 53.3 0 602.0 80.0 788.7 1.0727 1.16 30.0 980.0 1016.0 227.3 53.34 53.34 0.00 781.55 127.74 1015.97 4201.35 915.38 0.0042 0.070 0.143 0.658 1.487
D Ethanol 8.19 15.34 2.0 6.0 1.0 0.0 0.0 3.5 13.17 16.67 28.7 107.9 136.5 273.0 2 3 0 13.2 3.5 16.4 24.6 0 215.7 28.7 285.3 1.0727 1.16 30.0 980.0 348.4 63.1 16.38 24.57 0.00 265.56 41.92 348.44 1440.91 313.94 0.0015 0.026 0.052 0.240 0.510
E Methanol 45.52 59.31 1.0 4.0 1.0 0.0 0.0 2 7.52 9.52 91.0 342.5 433.5 867.0 1 2 0 7.5 2.0 45.5 91.0 0 685.0 91.0 912.6 1.0727 1.16 30.0 980.0 1000.6 88.1 45.52 91.04 0.00 754.52 109.53 1000.60 4137.80 901.53 0.0059 0.099 0.202 0.929 1.464
F Styrene 0.07 0.28 8.0 8.0 0.0 0.0 0.0 10 37.62 47.62 0.7 2.5 3.1 6.3 8 4 0 37.6 10.0 0.5 0.3 0 5.0 0.7 6.4 1.0727 1.16 30.0 980.0 9.6 3.2 0.53 0.26 0.00 7.48 1.33 9.60 39.70 8.65 0.0000 0.000 0.001 0.004 0.014
G Vinyl Acetate 5.72 20.04 4.0 6.0 2.0 0.0 0.0 5.5 20.69 26.19 31.4 118.3 149.7 299.4 4 3 0 20.7 5.5 22.9 17.1 0 236.5 31.4 308.0 1.0727 1.16 30.0 980.0 383.9 75.9 22.87 17.15 0.00 296.54 47.39 383.94 1587.69 345.92 0.0020 0.033 0.068 0.314 0.562
H Methyl Methacrylate 0.00 0.00 5.0 8.0 2.0 0.0 0.0 7 26.33 33.33 0.0 0.0 0.0 0.0 5 4 0 26.3 7.0 0.0 0.0 0 0.0 0.0 0.0 1.0727 1.16 30.0 980.0 0.0 0.0 0.00 0.00 0.00 0.00 0.00 0.00 0.00 0.00 0.0000 0.000 0.000 0.000 0.000
I Butyl Acrylates 0.04 0.21 7.0 12.0 2.0 0.0 0.0 10 37.62 47.62 0.4 1.5 1.9 3.8 7 6 0 37.6 10.0 0.3 0.2 0 3.0 0.4 3.9 1.0727 1.16 30.0 980.0 5.7 1.8 0.28 0.24 0.00 4.40 0.77 5.69 23.52 5.13 0.0000 0.000 0.001 0.003 0.008
J Methyl Isobutyl Carbinol (MIBC) 0.00 0.00 0.0 0.0 0.0 0.0 0.0 0 0.00 0.00 0.0 0.0 0.0 0.0 0 0 0 0.0 0.0 0.0 0.0 0 0.0 0.0 0.0 1.0727 1.16 30.0 980.0 0.0 0.0 0.00 0.00 0.00 0.00 0.00 0.00 0.00 0.00 0.0000 0.000 0.000 0.000 0.000
K Hydrogen Sulphide (H2S) 6.00 8.33 0.0 2.0 0.0 0.0 1.0 0.5 1.9 2.4 3.0 11.3 14.3 28.6 0 1 1 1.9 0.5 0.0 6.0 6.0 22.6 3.0 37.5 1.0727 1.16 30.0 980.0 107.4 69.9 0.0 6.0 6.0 77.7 17.7 107.4 444.2 96.8 0.0008 0.0139 0.0285 0.1306 0.157
Sulphur Dioxide (from combustion of H2S) 1.0727 1.16 30.0 980.0 5.7 5.7 23.6 5.1 14.88 248.0 395.6 1815.6
Sulphur Trioxide (from combustion of H2S) 1.0727 1.16 30.0 980.0 0.3 0.3 1.2 0.3 0.78 13.1 20.8 95.6
26 Supplementary N2 inerting 281.8 281.8 281.8 1.0727 1.16 30.0 980.0 281.8 281.8 281.8 1165.4 253.9
Total (VOC-nitrogen inert stream, incl. N2 inerting) - excludes SO2 6824.3 1.0727 1.16 30.0 980.0 9095.4 2271.1 438.0 449.5 12.0 7062.3 1139.7 9095.4 37612.3 8194.9 0.031 0.517 0.825 3.787 13.3
General
Heat of combustion data: source: Perry Chemical Engineers Handbook 7th Ed., pg's 2-195 to 2-199, cmp no 67,6,123,83, 148, 228
Assume Heat of comb for MMA as per ethyl propionate 26.3 (methane =50.1 MJ/kg)
Ambient temperature is same as inlet temperature
Input stream rate to TO Conc'n of
HAP/VOC
at stack
exit temp
Conc'n of
HAP/VOC
at 0oC temp
exit
velocity
CEC Engineers TO-1 Output-VOC-Inert Emission Page 7

Client : Quantem (Terminals Pty Ltd) Calc by FS
Project No : 200003 Date 28/10/2020
Project : 2nd Thermal Oxidiser and Liquid Waste Burning Checked AB
Calculation No: 200003CAL-002 Rev 1
VOC-Inert Stack Emission Estimate - Thermal Oxidiser TO-2
Worst Case Load Input VOC -inert stream split 50% Combustor reduction eff (VOC) 99.99% Initial flue gas temp 30
Scrubber reduction eff (S) 0.00% Final flue gas temp 980
Combuster eff for (S) 99.99%
Combustor/Scrubber reduction eff (S) 99.99% % conversion of H2S to SO3 5%
Combustor diameter exit 1.25 m Est-TO Vendor to confirm
Stream Input stream Molecular formula Required for Comb Required for Comb Combustion Flue products Average Flue prod Inlet Outlet Total flue Quench air Total flue products Total flue Total flue HAP/VOC HAP/VOC
ID Air with excess combustion air (only) at ambient temp CP air density Temp Comb flowrate flowrate with excess combustion & quench air vol rate at vol rate at discharge discharge
100% VOC 100% VOC
No
of No of No of No of No of with VOC Total air input 25C-800C as air Temp Amb Amb Amb Amb Amb Amb exit temp 0oC temp rate from rate from
Vol rate mass rate O2 N2 Air O2 N2 Air
with 100%
excess CO2 H20 SO2 N2
excess
O2 CO2 H20 SO2 N2 excess O2 Total
@ambient
temp CO2 H20 SO2/SO3 N2 O2 Total combust combust
m3/hr kg/hr C H O N S moles/moles or m3/m3 of combust VOC m3/hr m
3/hr m
3/hr m
3/hr moles/moles or m
3/m
3 of combust VOC m
3/hr m
3/hr m
3/hr m
3/hr m
3/hr m
3/hr kJ/kg°C kg/m
3 oC
oC m
3/hr m
3/hr m
3/hr m
3/hr m
3/hr m
3/hr m
3/hr m
3/hr Am
3/hr Nm
3/hr kg/hr g/min mg/m
3mg/m
3m/sec
Tank Diurnal Breathing (VOC-nitrogen inert stream) m3/hr
A Benzene 7.660 24.327 6.0 6.0 0.0 0.0 0.0 7.5 28.21 35.71 57.4 216.1 273.6 547.1 6.0 3.0 0.0 28.2 7.5 46.0 23.0 0 432.2 57.4 558.6 1.0727 1.16 30.0 980.0 827.4 268.8 46.0 23.0 0.0 644.6 113.9 827.4 3421.5 745.5 0.0024 0.0405 0.0830 0.4 0.77
B Hexene 26.834 91.779 6 14 0 0.0 0.0 9.5 35.74 45.24 254.9 959.0 1213.9 2427.9 6 7 0 35.7 9.5 161.0 187.8 0 1918.0 254.9 2521.8 1.0727 1.16 30.0 980.0 3456.2 934.4 161.0 187.8 0.0 2656.2 451.2 3456.2 14292.6 3114.0 0.0092 0.1530 0.3133 1.4 3.24
C Acetone 17.780 41.988 3 6 1 0.0 0.0 4.5 16.93 21.43 80.0 301.0 381.0 762.0 3 3 0 16.9 4.5 53.3 53.3 0 602.0 80.0 788.7 1.0727 1.16 30.0 980.0 1016.0 227.3 53.3 53.3 0.0 781.5 127.7 1016.0 4201.3 915.4 0.0042 0.0700 0.1433 0.7 0.95
D Ethanol 8.191 15.342 2 6 1 0.0 0.0 3.5 13.17 16.67 28.7 107.9 136.5 273.0 2 3 0 13.2 3.5 16.4 24.6 0 215.7 28.7 285.3 1.0727 1.16 30.0 980.0 348.4 63.1 16.4 24.6 0.0 265.6 41.9 348.4 1440.9 313.9 0.0015 0.0256 0.0524 0.2 0.33
E Methanol 45.519 59.308 1 4 1 0.0 0.0 2 7.52 9.52 91.0 342.5 433.5 867.0 1 2 0 7.5 2.0 45.5 91.0 0 685.0 91.0 912.6 1.0727 1.16 30.0 980.0 1000.6 88.1 45.5 91.0 0.0 754.5 109.5 1000.6 4137.8 901.5 0.0059 0.0988 0.2025 0.9 0.94
F Styrene 0.066 0.280 8 8 0 0.0 0.0 10 37.62 47.62 0.7 2.5 3.1 6.3 8 4 0 37.6 10.0 0.5 0.3 0 5.0 0.7 6.4 1.0727 1.16 30.0 980.0 9.6 3.2 0.5 0.3 0.0 7.5 1.3 9.6 39.7 8.6 0.0000 0.0005 0.0010 0.0 0.01
G Vinyl Acetate 5.716 20.037 4 6 2 0.0 0.0 5.5 20.69 26.19 31.4 118.3 149.7 299.4 4 3 0 20.7 5.5 22.9 17.1 0 236.5 31.4 308.0 1.0727 1.16 30.0 980.0 383.9 75.9 22.9 17.1 0.0 296.5 47.4 383.9 1587.7 345.9 0.0020 0.0334 0.0684 0.3 0.36
H Methyl Methacrylate 0.000 0.000 5 8 2 0.0 0.0 7 26.33 33.33 0.0 0.0 0.0 0.0 5 4 0 26.3 7.0 0.0 0.0 0 0.0 0.0 0.0 1.0727 1.16 30.0 980.0 0.0 0.0 0.0 0.0 0.0 0.0 0.0 0.0 0.0 0.0 0.0000 0.0000 0.0000 0.0 0.00
I Butyl Acrylates 0.040 0.209 7 12 2 0.0 0.0 10 37.62 47.62 0.4 1.5 1.9 3.8 7 6 0 37.6 10.0 0.3 0.2 0 3.0 0.4 3.9 1.0727 1.16 30.0 980.0 5.7 1.8 0.3 0.2 0.0 4.4 0.8 5.7 23.5 5.1 0.0000 0.0003 0.0007 0.0 0.01
J Methyl Isobutyl Carbinol (MIBC) 0.000 0.000 0 0 0 0.0 0.0 0 0.00 0.00 0.0 0.0 0.0 0.0 0 0 0 0.0 0.0 0.0 0.0 0 0.0 0.0 0.0 1.0727 1.16 30.0 980.0 0.0 0.0 0.0 0.0 0.0 0.0 0.0 0.0 0.0 0.0 0.0000 0.0000 0.0000 0.0 0.00
K Hydrogen Sulphide (H2S) 2.00 2.77 0 2 0 0 1 0.5 1.9 2.4 1.0 3.8 4.8 9.5 0 1 1 1.9 0.5 0.0 2.0 2.0 7.5 1.0 12.5 1.0727 1.16 30.0 980.0 35.8 23.3 0.0 2.0 2.0 25.9 5.9 35.8 147.8 32.2 0.0003 0.0046 0.0095 0.0 0.03
Total Tank Diurnal Breathing (VOC-nitrogen inert stream) 5397.8 1.0727 1.16 30.0 980.0 7083.6 1685.8 345.9 399.4 2.0 5436.7 899.6 7083.6 29293.0 6382.3 0.026 0.427 0.874 4.012 6.6
Tank Filling (VOC-inert stream)
A Benzene 0.000 0.000 6.0 6.0 0.0 0.0 0.0 7.5 28.21 35.71 0.0 0.0 0.0 0.0 6.0 3.0 0.0 28.2 7.5 0.0 0.0 0 0.0 0.0 0.0 1.0727 1.16 30.0 980.0 0.0 0.0 0.0 0.0 0.0 0.0 0.0 0.0 0.0 0.0 0.0000 0.0000 0.0000 0.0000 0.00
B Hexene 0.000 0.000 6 14 0 0.0 0.0 9.5 35.74 45.24 0.0 0.0 0.0 0.0 6 7 0 35.7 9.5 0.0 0.0 0 0.0 0.0 0.0 1.0727 1.16 30.0 980.0 0.0 0.0 0.0 0.0 0.0 0.0 0.0 0.0 0.0 0.0 0.0000 0.0000 0.0000 0.0000 0.00
C Acetone 0.000 0.000 3 6 1 0.0 0.0 4.5 16.93 21.43 0.0 0.0 0.0 0.0 3 3 0 16.9 4.5 0.0 0.0 0 0.0 0.0 0.0 1.0727 1.16 30.0 980.0 0.0 0.0 0.0 0.0 0.0 0.0 0.0 0.0 0.0 0.0 0.0000 0.0000 0.0000 0.0000 0.00
D Ethanol 0.000 0.000 2 6 1 0.0 0.0 3.5 13.17 16.67 0.0 0.0 0.0 0.0 2 3 0 13.2 3.5 0.0 0.0 0 0.0 0.0 0.0 1.0727 1.16 30.0 980.0 0.0 0.0 0.0 0.0 0.0 0.0 0.0 0.0 0.0 0.0 0.0000 0.0000 0.0000 0.0000 0.00
E Methanol 0.000 0.000 1 4 1 0.0 0.0 2 7.52 9.52 0.0 0.0 0.0 0.0 1 2 0 7.5 2.0 0.0 0.0 0 0.0 0.0 0.0 1.0727 1.16 30.0 980.0 0.0 0.0 0.0 0.0 0.0 0.0 0.0 0.0 0.0 0.0 0.0000 0.0000 0.0000 0.0000 0.00
F Styrene 0.000 0.000 8 8 0 0.0 0.0 10 37.62 47.62 0.0 0.0 0.0 0.0 8 4 0 37.6 10.0 0.0 0.0 0 0.0 0.0 0.0 1.0727 1.16 30.0 980.0 0.0 0.0 0.0 0.0 0.0 0.0 0.0 0.0 0.0 0.0 0.0000 0.0000 0.0000 0.0000 0.00
G Vinyl Acetate 0.000 0.000 4 6 2 0.0 0.0 5.5 20.69 26.19 0.0 0.0 0.0 0.0 4 3 0 20.7 5.5 0.0 0.0 0 0.0 0.0 0.0 1.0727 1.16 30.0 980.0 0.0 0.0 0.0 0.0 0.0 0.0 0.0 0.0 0.0 0.0 0.0000 0.0000 0.0000 0.0000 0.00
H Methyl Methacrylate 0.000 0.000 5 8 2 0.0 0.0 7 26.33 33.33 0.0 0.0 0.0 0.0 5 4 0 26.3 7.0 0.0 0.0 0 0.0 0.0 0.0 1.0727 1.16 30.0 980.0 0.0 0.0 0.0 0.0 0.0 0.0 0.0 0.0 0.0 0.0 0.0000 0.0000 0.0000 0.0000 0.00
I Butyl Acrylates 0.000 0.000 7 12 2 0.0 0.0 10 37.62 47.62 0.0 0.0 0.0 0.0 7 6 0 37.6 10.0 0.0 0.0 0 0.0 0.0 0.0 1.0727 1.16 30.0 980.0 0.0 0.0 0.0 0.0 0.0 0.0 0.0 0.0 0.0 0.0 0.0000 0.0000 0.0000 0.0000 0.00
J Methyl Isobutyl Carbinol (MIBC) 0.000 0.000 0 0 0 0.0 0.0 0 0.00 0.00 0.0 0.0 0.0 0.0 0 0 0 0.0 0.0 0.0 0.0 0 0.0 0.0 0.0 1.0727 1.16 30.0 980.0 0.0 0.0 0.0 0.0 0.0 0.0 0.0 0.0 0.0 0.0 0.0000 0.0000 0.0000 0.0000 0.00
K Hydrogen Sulphide (H2S) 0.000 0.000 0.0 2.0 0.0 0.0 1.0 0.5 1.9 2.4 0.0 0.0 0.0 0.0 0 1 1 1.9 0.5 0.0 0.0 0.0 0.0 0.0 0.0 1.0727 1.16 30.0 980.0 0.0 0.0 0.0 0.0 0.0 0.0 0.0 0.0 0.0 0.0 0.0000 0.0000 0.0000 0.0000 0.00
Total Tank Filling (VOC-nitrogen inert stream) 0.0 1.0727 1.16 30.0 980.0 0.0 0.0 0.0 0.0 0.0 0.0 0.0 0.0 0.0 0.0 0.000 0.000 #DIV/0! #DIV/0! 0.00
Truck/Ship Filling (VOC-nitrogen inert stream)
A Benzene 15.352 48.757 6.0 6.0 0.0 0.0 0.0 7.5 28.21 35.71 115.1 433.2 548.3 1096.6 6.0 3.0 0.0 28.2 7.5 92.1 46.1 0 866.3 115.1 1119.6 1.0727 1.16 30.0 980.0 1658.3 538.7 92.1 46.1 0.0 1291.9 228.3 1658.3 6857.6 1494.1 0.0049 0.0813 0.1664 0.7640 1.55
B Hexene 0.000 0.000 6 14 0 0.0 0.0 9.5 35.74 45.24 0.0 0.0 0.0 0.0 6 7 0 35.7 9.5 0.0 0.0 0 0.0 0.0 0.0 1.0727 1.16 30.0 980.0 0.0 0.0 0.0 0.0 0.0 0.0 0.0 0.0 0.0 0.0 0.0000 0.0000 0.0000 0.0000 0.00
C Acetone 0.000 0.000 3 6 1 0.0 0.0 4.5 16.93 21.43 0.0 0.0 0.0 0.0 3 3 0 16.9 4.5 0.0 0.0 0 0.0 0.0 0.0 1.0727 1.16 30.0 980.0 0.0 0.0 0.0 0.0 0.0 0.0 0.0 0.0 0.0 0.0 0.0000 0.0000 0.0000 0.0000 0.00
D Ethanol 0.000 0.000 2 6 1 0.0 0.0 3.5 13.17 16.67 0.0 0.0 0.0 0.0 2 3 0 13.2 3.5 0.0 0.0 0 0.0 0.0 0.0 1.0727 1.16 30.0 980.0 0.0 0.0 0.0 0.0 0.0 0.0 0.0 0.0 0.0 0.0 0.0000 0.0000 0.0000 0.0000 0.00
E Methanol 0.000 0.000 1 4 1 0.0 0.0 2 7.52 9.52 0.0 0.0 0.0 0.0 1 2 0 7.5 2.0 0.0 0.0 0 0.0 0.0 0.0 1.0727 1.16 30.0 980.0 0.0 0.0 0.0 0.0 0.0 0.0 0.0 0.0 0.0 0.0 0.0000 0.0000 0.0000 0.0000 0.00
F Styrene 0.000 0.000 8 8 0 0.0 0.0 10 37.62 47.62 0.0 0.0 0.0 0.0 8 4 0 37.6 10.0 0.0 0.0 0 0.0 0.0 0.0 1.0727 1.16 30.0 980.0 0.0 0.0 0.0 0.0 0.0 0.0 0.0 0.0 0.0 0.0 0.0000 0.0000 0.0000 0.0000 0.00
G Vinyl Acetate 0.000 0.000 4 6 2 0.0 0.0 5.5 20.69 26.19 0.0 0.0 0.0 0.0 4 3 0 20.7 5.5 0.0 0.0 0 0.0 0.0 0.0 1.0727 1.16 30.0 980.0 0.0 0.0 0.0 0.0 0.0 0.0 0.0 0.0 0.0 0.0 0.0000 0.0000 0.0000 0.0000 0.00
H Methyl Methacrylate 0.000 0.000 5 8 2 0.0 0.0 7 26.33 33.33 0.0 0.0 0.0 0.0 5 4 0 26.3 7.0 0.0 0.0 0 0.0 0.0 0.0 1.0727 1.16 30.0 980.0 0.0 0.0 0.0 0.0 0.0 0.0 0.0 0.0 0.0 0.0 0.0000 0.0000 0.0000 0.0000 0.00
I Butyl Acrylates 0.000 0.000 7 12 2 0.0 0.0 10 37.62 47.62 0.0 0.0 0.0 0.0 7 6 0 37.6 10.0 0.0 0.0 0 0.0 0.0 0.0 1.0727 1.16 30.0 980.0 0.0 0.0 0.0 0.0 0.0 0.0 0.0 0.0 0.0 0.0 0.0000 0.0000 0.0000 0.0000 0.00
J Methyl Isobutyl Carbinol (MIBC) 0.000 0.000 0 0 0 0.0 0.0 0 0.00 0.00 0.0 0.0 0.0 0.0 0 0 0 0.0 0.0 0.0 0.0 0 0.0 0.0 0.0 1.0727 1.16 30.0 980.0 0.0 0.0 0.0 0.0 0.0 0.0 0.0 0.0 0.0 0.0 0.0000 0.0000 0.0000 0.0000 0.00K Hydrogen Sulphide (H2S) 4.000 5.560 0.0 2.0 0.0 0.0 1.0 0.5 1.9 2.4 2.0 7.5 9.5 19.0 0 1 1 1.9 0.5 0.0 4.0 4.0 15.0 2.0 25.0 1.0727 1.16 30.0 980.0 71.7 46.6 0.0 4.0 4.0 51.9 11.8 71.7 296.3 64.6 0.0006 0.0093 0.0190 0.0871 0.07
19 Supplementary N2 inerting 281.8 281.8 281.8 1.0727 1.16 30.0 980.0 281.8 281.8 281.8 1165.4 253.9
20 Total Truck/Ship Filling (VOC-nitrogen inert stream, incl. N2 inerting) 1426.5 1.0727 1.16 30.0 980.0 2011.8 585.3 92.1 50.1 4.0 1625.5 240.1 2011.8 8319.3 1812.6 0.005 0.091 0.653 2.997 1.9
Total (VOC-nitrogen inert stream, incl. N2 inerting)
A Benzene 23.012 73.084 6.0 6.0 0.0 0.0 0.0 7.5 28.21 35.71 172.6 649.3 821.9 1643.7 6.0 3.0 0.0 28.2 7.5 138.1 69.0 0 1298.5 172.6 1678.3 1.0727 1.16 30.0 980.0 2485.7 807.4 138.07 69.04 0.00 ###### 342.15 2485.68 10279.07 2239.57 0.0073 0.122 0.249 1.145 2.33
B Hexene 26.834 91.779 6 14 0 0.0 0.0 9.5 35.74 45.24 254.9 959.0 1213.9 2427.9 6 7 0 35.7 9.5 161.0 187.8 0 1918.0 254.9 2521.8 1.0727 1.16 30.0 980.0 3456.2 934.4 161.01 187.84 0.00 ###### 451.16 3456.24 14292.64 3114.04 0.0092 0.153 0.313 1.438 3.24
C Acetone 17.78 41.99 3.0 6.0 1.0 0.0 0.0 4.5 16.93 21.43 80.0 301.0 381.0 762.0 3 3 0 16.9 4.5 53.3 53.3 0 602.0 80.0 788.7 1.0727 1.16 30.0 980.0 1016.0 227.3 53.34 53.34 0.00 781.55 127.74 1015.97 4201.35 915.38 0.0042 0.070 0.143 0.658 0.95
D Ethanol 8.19 15.34 2.0 6.0 1.0 0.0 0.0 3.5 13.17 16.67 28.7 107.9 136.5 273.0 2 3 0 13.2 3.5 16.4 24.6 0 215.7 28.7 285.3 1.0727 1.16 30.0 980.0 348.4 63.1 16.38 24.57 0.00 265.56 41.92 348.44 1440.91 313.94 0.0015 0.026 0.052 0.240 0.33
E Methanol 45.52 59.31 1.0 4.0 1.0 0.0 0.0 2 7.52 9.52 91.0 342.5 433.5 867.0 1 2 0 7.5 2.0 45.5 91.0 0 685.0 91.0 912.6 1.0727 1.16 30.0 980.0 1000.6 88.1 45.52 91.04 0.00 754.52 109.53 1000.60 4137.80 901.53 0.0059 0.099 0.202 0.929 0.94
F Styrene 0.07 0.28 8.0 8.0 0.0 0.0 0.0 10 37.62 47.62 0.7 2.5 3.1 6.3 8 4 0 37.6 10.0 0.5 0.3 0 5.0 0.7 6.4 1.0727 1.16 30.0 980.0 9.6 3.2 0.53 0.26 0.00 7.48 1.33 9.60 39.70 8.65 0.0000 0.000 0.001 0.004 0.01
G Vinyl Acetate 5.72 20.04 4.0 6.0 2.0 0.0 0.0 5.5 20.69 26.19 31.4 118.3 149.7 299.4 4 3 0 20.7 5.5 22.9 17.1 0 236.5 31.4 308.0 1.0727 1.16 30.0 980.0 383.9 75.9 22.87 17.15 0.00 296.54 47.39 383.94 1587.69 345.92 0.0020 0.033 0.068 0.314 0.36
H Methyl Methacrylate 0.00 0.00 5.0 8.0 2.0 0.0 0.0 7 26.33 33.33 0.0 0.0 0.0 0.0 5 4 0 26.3 7.0 0.0 0.0 0 0.0 0.0 0.0 1.0727 1.16 30.0 980.0 0.0 0.0 0.00 0.00 0.00 0.00 0.00 0.00 0.00 0.00 0.0000 0.000 0.000 0.000 0.00
I Butyl Acrylates 0.04 0.21 7.0 12.0 2.0 0.0 0.0 10 37.62 47.62 0.4 1.5 1.9 3.8 7 6 0 37.6 10.0 0.3 0.2 0 3.0 0.4 3.9 1.0727 1.16 30.0 980.0 5.7 1.8 0.28 0.24 0.00 4.40 0.77 5.69 23.52 5.13 0.0000 0.000 0.001 0.003 0.01
J Methyl Isobutyl Carbinol (MIBC) 0.00 0.00 0.0 0.0 0.0 0.0 0.0 0 0.00 0.00 0.0 0.0 0.0 0.0 0 0 0 0.0 0.0 0.0 0.0 0 0.0 0.0 0.0 1.0727 1.16 30.0 980.0 0.0 0.0 0.00 0.00 0.00 0.00 0.00 0.00 0.00 0.00 0.0000 0.000 0.000 0.000 0.00
K Hydrogen Sulphide (H2S) 6.00 8.33 0.0 2.0 0.0 0.0 1.0 0.5 1.9 2.4 3.0 11.3 14.3 28.6 0 1 1 1.9 0.5 0.0 6.0 6.0 22.6 3.0 37.5 1.0727 1.16 30.0 980.0 107.4 69.9 0.0 6.0 6.0 77.7 17.7 107.4 444.2 96.8 0.0008 0.0139 0.0285 0.1306 0.10
Sulphur Dioxide (from combustion of H2S) 1.0727 1.16 30.0 980.0 5.7 5.7 23.6 5.1 14.88 248.0 395.6 1815.6
Sulphur Trioxide (from combustion of H2S) 1.0727 1.16 30.0 980.0 0.3 0.3 1.2 0.3 0.78 13.1 20.8 95.6
26 Supplementary N2 inerting 281.8 281.8 281.8 1.0727 1.16 30.0 980.0 281.8 281.8 281.8 1165.4 253.9
Total (VOC-nitrogen inert stream, incl. N2 inerting) - excludes SO2 6824.3 1.0727 1.16 30.0 980.0 9095.4 2271.1 438.0 449.5 12.0 7062.3 1139.7 9101.4 37612.3 8194.9 0.031 0.517 0.825 3.787 8.5
General
Heat of combustion data: source: Perry Chemical Engineers Handbook 7th Ed., pg's 2-195 to 2-199, cmp no 67,6,123,83, 148, 228
Assume Heat of comb for MMA as per ethyl propionate 26.3 (methane =50.1 MJ/kg)
Ambient temperature is same as inlet temperature
Input stream rate to TO Conc'n of
HAP/VOC
at stack
exit temp
Conc'n of
HAP/VOC at
0oC temp
exit
velocity
CEC Engineers TO-2 Output-VOC-Inert Emission Page 8

Client : Quantem (Terminals Pty Ltd) Calc by FS
Project No : 200003 Date 28/10/2020
Project : 2nd Thermal Oxidiser and Liquid Waste Burning Checked AB
Calculation No: 200003CAL-002 Rev 1
LWB Emission Estimate - Thermal Oxidiser TO-2
Worst Case Load Waste stream flow rate 6.50 l/min Combustor reduction eff (VOC) 99.99% Initial flue gas temp 30
Composition 80% Benzene Liquid Remainder water Scrubber reduction eff (S) 0.00% Final flue gas temp 980
% sulphur compounds in Benzene (liquid) 0.20% w/w Based on historical BTX liquid analysis (Terminals Botany)- SGS report ENV11869- dated 20th October 2010 Combuster eff for (S) 99.99%
Combustor/Scrubber reduction eff (S) 99.99% % conversion of H2S to SO3 5%
Combustor diameter exit 1.25 m Est
Stream Input stream Molecular formula Required for Comb Required for Comb Combustion Flue products Average Flue prod Inlet Outlet Total flue Quench air Total flue products Total flue Total flue HAP/VOC HAP/VOC
ID Air with excess combustion air (only) at ambient temp CP air density Temp Comb flowrate flowrate with excess combustion & quench air vol rate at vol rate at discharge discharge
Equivalent
100% VOC
vapour rate Liquid No of No of No of No of No of with VOC Total air input 25C-800C as air Temp Amb Amb Amb Amb Amb Amb exit temp 0oC temp rate from rate from
Vol rate mass rate O2 N2 Air O2 N2 Air
with 100%
excess CO2 H20 SO2 N2
excess
O2 CO2 H20 SO2 N2 excess O2 Total
@ambient
temp CO2 H20 SO2/SO3 N2 O2 Total combust combust
m3/hr kg/hr C H O N S moles/moles or m3/m3 of combust VOC m3/hr m
3/hr m
3/hr m
3/hr moles/moles or m
3/m
3 of combust VOC m
3/hr m
3/hr m
3/hr m
3/hr m
3/hr m
3/hr kJ/kg°C kg/m
3 oC
oC m
3/hr m
3/hr m
3/hr m
3/hr m
3/hr m
3/hr m
3/hr m
3/hr Am
3/hr Nm
3/hr kg/hr g/min mg/m
3mg/m
3m/sec
Total (Waste Stream)
A Benzene 85.6 271.9 6.0 6.0 0.0 0.0 0.0 7.5 28.21 35.71 642.2 2415.9 3058.1 6116.1 6.0 3.0 0.0 28.2 7.5 513.8 256.9 0 4831.8 642.2 6244.6 1.0727 1.16 30.0 980.0 9004.2 2759.6 513.76 256.88 0.00 7012 1222 9004.2 37235 8113 0.027 0.453 0.730 3.019 8.433
B Hexene 6 14 0 0.0 0.0 9.5 35.74 45.24 0.0 0.0 0.0 0.0 6 7 0 35.7 9.5 0.0 0.0 0 0.0 0.0 0.0 1.0727 1.16 30.0 980.0 0.0 0.0 0.00 0.00 0.00 0.00 0.00 0.00 0.00 0.00 0.000 0.000 0.000 0.000 0.000
C Acetone 3.0 6.0 1.0 0.0 0.0 4.5 16.93 21.43 0.0 0.0 0.0 0.0 3 3 0 16.9 4.5 0.0 0.0 0 0.0 0.0 0.0 1.0727 1.16 30.0 980.0 0.0 0.0 0.00 0.00 0.00 0.00 0.00 0.00 0.00 0.00 0.000 0.000 0.000 0.000 0.000
D Ethanol 2.0 6.0 1.0 0.0 0.0 3.5 13.17 16.67 0.0 0.0 0.0 0.0 2 3 0 13.2 3.5 0.0 0.0 0 0.0 0.0 0.0 1.0727 1.16 30.0 980.0 0.0 0.0 0.00 0.00 0.00 0.00 0.00 0.00 0.00 0.00 0.000 0.000 0.000 0.000 0.000
E Methanol 1.0 4.0 1.0 0.0 0.0 2 7.52 9.52 0.0 0.0 0.0 0.0 1 2 0 7.5 2.0 0.0 0.0 0 0.0 0.0 0.0 1.0727 1.16 30.0 980.0 0.0 0.0 0.00 0.00 0.00 0.00 0.00 0.00 0.00 0.00 0.000 0.000 0.000 0.000 0.000
F Styrene 8.0 8.0 0.0 0.0 0.0 10 37.62 47.62 0.0 0.0 0.0 0.0 8 4 0 37.6 10.0 0.0 0.0 0 0.0 0.0 0.0 1.0727 1.16 30.0 980.0 0.0 0.0 0.00 0.00 0.00 0.00 0.00 0.00 0.00 0.00 0.000 0.000 0.000 0.000 0.000
G Vinyl Acetate 4.0 6.0 2.0 0.0 0.0 5.5 20.69 26.19 0.0 0.0 0.0 0.0 4 3 0 20.7 5.5 0.0 0.0 0 0.0 0.0 0.0 1.0727 1.16 30.0 980.0 0.0 0.0 0.00 0.00 0.00 0.00 0.00 0.00 0.00 0.00 0.000 0.000 0.000 0.000 0.000
H Methyl Methacrylate 5.0 8.0 2.0 0.0 0.0 7 26.33 33.33 0.0 0.0 0.0 0.0 5 4 0 26.3 7.0 0.0 0.0 0 0.0 0.0 0.0 1.0727 1.16 30.0 980.0 0.0 0.0 0.00 0.00 0.00 0.00 0.00 0.00 0.00 0.00 0.000 0.000 0.000 0.000 0.000
I Butyl Acrylates 7.0 12.0 2.0 0.0 0.0 10 37.62 47.62 0.0 0.0 0.0 0.0 7 6 0 37.6 10.0 0.0 0.0 0 0.0 0.0 0.0 1.0727 1.16 30.0 980.0 0.0 0.0 0.00 0.00 0.00 0.00 0.00 0.00 0.00 0.00 0.000 0.000 0.000 0.000 0.000
J Methyl Isobutyl Carbinol (MIBC) 0.0 0.0 0.0 0.0 0.0 0 0.00 0.00 0.0 0.0 0.0 0.0 0 0 0 0.0 0.0 0.0 0.0 0 0.0 0.0 0.0 1.0727 1.16 30.0 980.0 0.0 0.0 0.00 0.00 0.00 0.00 0.00 0.00 0.00 0.00 0.000 0.000 0.000 0.000 0.000
K Hydrogen Sulphide (H2S) (0.2% w/w benzene) 0.39 0.54 0.0 2.0 0.0 0.0 1.0 0.5 1.9 2.4 0.20 0.74 0.93 1.86 0 1 1 1.9 0.5 0.0 0.4 0.39 1.5 0.2 2.5 1.0727 1.16 30.0 980.0 2.5 0.0 0.0 0.4 0.4 1.5 0.2 2.45 10.1 2.2 0.000054 0.0009 0.0015 0.0060 0.002
Sulphur Dioxide (from combustion of H2S) 1.0727 1.16 30.0 980.0 0.4 0.4 1.5 0.3 0.97 16.2 26.1 119.6
Sulphur Trioxide (from combustion of H2S) 1.0727 1.16 30.0 980.0 0.0 0.0 0.1 0.0 0.05 0.9 1.4 6.3
Total (VOC LWB stream) 6247.0 1.0727 1.16 30.0 980.0 9006.6 2759.6 513.8 257.3 0.8 7013.3 1221.9 9007.0 37246.8 8115.2 0.027 0.454 0.732 3.358 8.4
General
Heat of combustion data: source: Perry Chemical Engineers Handbook 7th Ed., pg's 2-195 to 2-199, cmp no 67,6,123,83, 148, 228
Assume Heat of comb for MMA as per ethyl propionate 26.3 (methane =50.1 MJ/kg)
Ambient temperature is same as inlet temperature
Input stream rate to TOConc'n of
HAP/VOC
at stack
exit temp
Conc'n of
HAP/VOC at
0oC temp
exit
velocity
CEC Engineers TO-2 Output-LWB Page 9

Client : Quantem (Terminals Pty Ltd) Calc by FS
Project No : 200003 Date 28/10/2020
Project : 2nd Thermal Oxidiser and Liquid Waste Burning Checked AB
Calculation No: 200003CAL-002 Rev 1
Liquid Waste Burning-Thermal load 80% Benzene, 6.5 L/min Flowrate (Normal Flow)- Thermal Load of Waste Stream at nominal Benzene Conc.
Total Liquid Waste Disposal Rate 6.50 l/min
Initial temp 5 ˚C
Final temp 980 ˚C
Heat Capacity of liquid stream/waste 2 kJ/kg/K
Heat Capacity of stack gases 1.166 kJ/kg/K
Density of Air 1.2 kg/m3
Stream Input stream % Volumetric Mass rate MW Liquid Mass rate Heat of Energy Mol rate formulae Mol ratio
Combustion
Air
Combustion
AirEnthalpy Sensible Total Total
ID V/V rate input density Combustion (-ve = generated) of Heat + Energy Energy
stream stream @25˚C of VOC (+ve = consumed)
comb
air/waste
liquid
Evaporation Super heat (-ve = generated)
net (LHV) (+ve = consumed)
l/min kg/min kg/m3 kg/hr MJ/kg MJ/hr kmols/hr kmols/hr m3/hr MJ/kg MJ/kg MJ/kg MJ/hr
A Benzene 80% 5.2 4.53 78 874.00 271.9 40.21 -10933 3.49 C6H6 7.50 125.11 2852.46 -10933
B Hexene 0.0% 0.0 0.00 84 678.00 0.0 44.52 0 0.00 C6H12 9.00 0.00 0.00 0
C Acetone 0.0% 0.0 0.00 58 791.00 0.0 28.60 0 0.00 C3H6O 4.50 0.00 0.00 0
D Ethanol 0.0% 0.0 0.00 46 806.00 0.0 26.85 0 0.00 C2H5OH 3.00 0.00 0.00 0
E Methanol 0.0% 0.0 0.00 32 791.00 0.0 19.94 0 0.00 CH3OH 1.50 0.00 0.00 0
F Styrene 0.0% 0.0 0.00 104 906.00 0.0 40.51 0 0.00 C8H8 10.00 0.00 0.00 0
G Vinyl Acetate 0.0% 0.0 0.00 86 934.00 0.0 22.65 0 0.00 C4H6O2 4.50 0.00 0.00 0
H Methyl Methacrylate 0.0% 0.0 0.00 100 943.00 0.0 26.40 0 0.00 C5H8O2 6.00 0.00 0.00 0
I Butyl Acrylates 0.0% 0.0 0.00 128 894.00 0.0 32.24 0 0.00 C7H12O2 9.00 0.00 0.00 0
J Methyl Isobutyl Carbinol (MIBC) 0.0% 0.0 0.00 102 802.00 0.0 38.70 0 0.00 C6H14O 9.00 0.00 0.00 0
Water 20% 1.3 1.31 18 997.00 78.6 0 2.26 1.42 3.68 289
Total 100.0% 6.5 5.84 350.56 -10933 -10644
CEC Engineers LWB-Thermal Load Page 10

Client : Quantem (Terminals Pty Ltd) Calc by FS
Project No. : 200003 Date 28/10/2020
Project : 2nd Thermal Oxidiser and Liquid Waste Burning Checked AB
Rev 1
Calculation No: 200003CAL-002
Vapour Density, Mole Fraction & Tank Expansion Factor
BENZENE From Perry 7th Ed Table 2-6 BENZENE From Perry 7th Ed Table 2-6 tank vol 1000 m3
C1 C2 C3 C4 C5 C1 C2 C3 C4 C5 tank empty 0.75
83.918 -6517.7 -9.3453 7.1182E-06 2 83.918 -6517.7 -9.3453 7.1182E-06 2 vap vol 750 m3
Temperature 30 ˚C Temperature 15 ˚C
303 K 288 K initial temp 15
Vapour Pressure 15747 Pa Vapour Pressure 7750 Pa initial mol fract act 0.08
15.7 kPa 7.7 kPa initial mol fract N2 0.92
Volume Act 56.66814
Tank Pressure 5 "WC Tank Pressure 5 "WC Volume Vol 693.3319
1.25 kPag 1.25 kPag 750
System Total 102.6 kPa System Total 102.6 kPa
Partial Pressure = Vapour Pressure at Saturation Partial Pressure = Vapour Pressure at Saturation Final temp 30
Partial Pressure / Total Pressure = Mole Fraction = Volume Fraction Partial Pressure / Total Pressure = Mole Fraction = Volume Fraction Final mol fract act 0.15
Final mol fract N2 0.85
Tank Displacement Tank Displacement Volume Act 115.1429
No Oxygen - All Nitrogen and Solvent Vapour No Oxygen - All Nitrogen and Solvent Vapour Volume Vol 634.8571
750
Benzene Molecular Weight 78 Mole fraction 0.154 Benzene Molecular Weight 78 Mole fraction 0.076
Nitrogen Molecular Weight 28 Mole fraction 0.846 Nitrogen Molecular Weight 28 Mole fraction 0.924 Vapour pressure expansion 8.4%
1.00 1.00
Therefore Average Molecular Weight 35.7 Therefore Average Molecular Weight 31.8 Thermal gas expansion 5.2%
PV =nRT, Density = MW x P/RT R = 8314 J/Kelvin.kmole PV =nRT, Density = MW x P/RT R = 8314 J/Kelvin.kmole expansion factor 13.6%
Density = 1.45 kg/m3 Total Flow Density = 1.36 kg/m3 Total Flow
Density = 3.18 kg/m3 Benzene vapour Density = 3.34 kg/m3 Benzene vapour
HEXENE From Perry 7th Ed Table 2-6 HEXENE From Perry 7th Ed Table 2-6 tank vol 1000 m3
C1 C2 C3 C4 C5 C1 C2 C3 C4 C5 tank empty 0.75
85.3 -6171.7 -9.702 8.9604E-06 2 85.3 -6171.7 -9.702 8.9604E-06 2 vap vol 750 m3
Temperature 30 ˚C Temperature 15 ˚C
303 K 288 K initial temp 15
Vapour Pressure 30314 Pa Vapour Pressure 15862 Pa initial mol fract act 0.15
30.3 kPa 15.9 kPa initial mol fract N2 0.85
Volume Act 115.9806
Tank Pressure 5 "WC Tank Pressure 5 "WC Volume Vol 634.0194
1.25 kPag 1.25 kPag 750
System Total 102.6 kPa System Total 102.6 kPa
Partial Pressure = Vapour Pressure at Saturation Partial Pressure = Vapour Pressure at Saturation Final temp 30
Partial Pressure / Total Pressure = Mole Fraction = Volume Fraction Partial Pressure / Total Pressure = Mole Fraction = Volume Fraction Final mol fract act 0.30
Final mol fract N2 0.70
Tank Displacement Tank Displacement Volume Act 221.6568
No Oxygen - All Nitrogen and Solvent Vapour No Oxygen - All Nitrogen and Solvent Vapour Volume Vol 528.3432
750
Hexene Molecular Weight 84 Mole fraction 0.296 Hexene Molecular Weight 84 Mole fraction 0.155
Nitrogen Molecular Weight 28 Mole fraction 0.704 Nitrogen Molecular Weight 28 Mole fraction 0.845 Vapour pressure expansion 16.7%
1.00 1.00
Therefore Average Molecular Weight 44.6 Therefore Average Molecular Weight 36.7 Thermal gas expansion 5.2%
PV =nRT, Density = MW x P/RT R = 8314 J/Kelvin.kmole PV =nRT, Density = MW x P/RT R = 8314 J/Kelvin.kmole expansion factor 21.9%
Density = 1.81 kg/m3 Total Flow Density = 1.57 kg/m3 Total Flow
Density = 3.42 kg/m3 Hexene vapour Density = 3.60 kg/m3 Hexene vapour
CEC Engineers Chem Data 1 11 of 16

Client : Quantem (Terminals Pty Ltd) Calc by FS
Project No. : 200003 Date 28/10/2020
Project : 2nd Thermal Oxidiser and Liquid Waste Burning Checked AB
Rev 1
Calculation No: 200003CAL-002
Vapour Density, Mole Fraction & Tank Expansion Factor
ACETONE From Perry 7th Ed Table 2-6 ACETONE From Perry 7th Ed Table 2-6 tank vol 1000 m3
C1 C2 C3 C4 C5 C1 C2 C3 C4 C5 tank empty 0.75
69.006 -5599.6 -7.0985 6.2237E-06 2 69.006 -5599.6 -7.0985 6.2237E-06 2 vap vol 750 m3
Temperature 30 ˚C Temperature 15 ˚C
303 K 288 K initial temp 15
Vapour Pressure 37719 Pa Vapour Pressure 19548 Pa initial mol fract act 0.19
37.7 kPa 19.5 kPa initial mol fract N2 0.81
Volume Act 142.9372
Tank Pressure 5 "WC Tank Pressure 5 "WC Volume Vol 607.0628
1.25 kPag 1.25 kPag 750
System Total 102.6 kPa System Total 102.6 kPa
Partial Pressure = Vapour Pressure at Saturation Partial Pressure = Vapour Pressure at Saturation Final temp 30
Partial Pressure / Total Pressure = Mole Fraction = Volume Fraction Partial Pressure / Total Pressure = Mole Fraction = Volume Fraction Final mol fract act 0.37
Final mol fract N2 0.63
Tank Displacement Tank Displacement Volume Act 275.8063
No Oxygen - All Nitrogen and Solvent Vapour No Oxygen - All Nitrogen and Solvent Vapour Volume Vol 474.1937
750
Acetone Molecular Weight 58 Mole fraction 0.368 Acetone Molecular Weight 58 Mole fraction 0.191
Nitrogen Molecular Weight 28 Mole fraction 0.632 Nitrogen Molecular Weight 28 Mole fraction 0.809 Vapour pressure expansion 21.9%
1 1
Therefore Average Molecular Weight 39.0 Therefore Average Molecular Weight 33.7 Thermal gas expansion 5.2%
PV =nRT, Density = MW x P/RT R = 8314 J/Kelvin.kmole PV =nRT, Density = MW x P/RT R = 8314 J/Kelvin.kmole expansion factor 27.1%
Density = 1.59 kg/m3 Total Flow Density = 1.44 kg/m3 Total Flow
Density = 2.36 kg/m3 Acetone vapour Density = 2.48 kg/m3 Acetone vapour
ETHANOL From Perry 7th Ed Table 2-6 ETHANOL From Perry 7th Ed Table 2-6 tank vol 1000 m3
C1 C2 C3 C4 C5 C1 C2 C3 C4 C5 tank empty 0.75
74.475 -7164.3 -7.327 3.1340E-06 2 74.475 -7164.3 -7.327 3.1340E-06 2 vap vol 750 m3
Temperature 30 ˚C Temperature 15 ˚C
303 K 288 K initial temp 15
Vapour Pressure 10443 Pa Vapour Pressure 4300 Pa initial mol fract act 0.04
10.4 kPa 4.3 kPa initial mol fract N2 0.96
Volume Act 31.44251
Tank Pressure 5 "WC Tank Pressure 5 "WC Volume Vol 718.5575
1.25 kPag 1.25 kPag 750
System Total 102.6 kPa System Total 102.6 kPa
Partial Pressure = Vapour Pressure at Saturation Partial Pressure = Vapour Pressure at Saturation Final temp 30
Partial Pressure / Total Pressure = Mole Fraction = Volume Fraction Partial Pressure / Total Pressure = Mole Fraction = Volume Fraction Final mol fract act 0.10
Final mol fract N2 0.90
Tank Displacement Tank Displacement Volume Act 76.35719
No Oxygen - All Nitrogen and Solvent Vapour No Oxygen - All Nitrogen and Solvent Vapour Volume Vol 673.6428
750
Ethanol Molecular Weight 46 Mole fraction 0.102 Ethanol Molecular Weight 46 Mole fraction 0.042
Nitrogen Molecular Weight 28 Mole fraction 0.898 Nitrogen Molecular Weight 28 Mole fraction 0.958 Vapour pressure expansion 6.3%
1 1
Therefore Average Molecular Weight 29.8 Therefore Average Molecular Weight 28.8 Thermal gas expansion 5.2%
PV =nRT, Density = MW x P/RT R = 8314 J/Kelvin.kmole PV =nRT, Density = MW x P/RT R = 8314 J/Kelvin.kmole expansion factor 11.5%
Density = 1.21 kg/m3 Total Flow Density = 1.23 kg/m3 Total Flow
Density = 1.87 kg/m3 Ethanol vapour Density = 1.97 kg/m3 Ethanol vapour
CEC Engineers Chem Data 1 12 of 16

Client : Quantem (Terminals Pty Ltd) Calc by FS
Project No. : 200003 Date 28/10/2020
Project : 2nd Thermal Oxidiser and Liquid Waste Burning Checked AB
Rev 1
Calculation No: 200003CAL-002
Vapour Density, Mole Fraction & Tank Expansion Factor
METHANOL METHANOL From Perry 7th Ed Table 2-6 tank vol 1000 m3
C1 C2 C3 C4 C5 C1 C2 C3 C4 C5 tank empty 0.75
81.768 -6876 -8.7078 7.1926E-06 2 81.768 -6876 -8.7078 7.1926E-06 2 vap vol 750 m3
Temperature 30 ˚C Temperature 15 ˚C
303 K 288 K initial temp 15
Vapour Pressure 21617 Pa Vapour Pressure 9678 Pa initial mol fract act 0.09
21.6 kPa 9.7 kPa initial mol fract N2 0.91
Volume Act 70.76916
Tank Pressure 5 "WC Tank Pressure 5 "WC Volume Vol 679.2308
1.25 kPag 1.25 kPag 750
System Total 102.6 kPa System Total 102.6 kPa
Partial Pressure = Vapour Pressure at Saturation Partial Pressure = Vapour Pressure at Saturation Final temp 30
Partial Pressure / Total Pressure = Mole Fraction = Volume Fraction Partial Pressure / Total Pressure = Mole Fraction = Volume Fraction Final mol fract act 0.21
Final mol fract N2 0.79
Tank Displacement Tank Displacement Volume Act 158.0642
No Oxygen - All Nitrogen and Solvent Vapour No Oxygen - All Nitrogen and Solvent Vapour Volume Vol 591.9358
750
Methanol Molecular Weight 32 Mole fraction 0.211 Methanol Molecular Weight 32 Mole fraction 0.094
Nitrogen Molecular Weight 28 Mole fraction 0.789 Nitrogen Molecular Weight 28 Mole fraction 0.906 Vapour pressure expansion 12.9%
1 1
Therefore Average Molecular Weight 28.8 Therefore Average Molecular Weight 28.4 Thermal gas expansion 5.2%
PV =nRT, Density = MW x P/RT R = 8314 J/Kelvin.kmole PV =nRT, Density = MW x P/RT R = 8314 J/Kelvin.kmole expansion factor 18.1%
Density = 1.17 kg/m3 Total Flow Density = 1.22 kg/m3 Total Flow
Density = 1.30 kg/m3 Methanol vapour Density = 1.37 kg/m3 Methanol vapour
STYRENE STYRENE From Perry 7th Ed Table 2-6 tank vol 1000 m3
C1 C2 C3 C4 C5 C1 C2 C3 C4 C5 tank empty 0.75
105.93 -8685.9 -12.42 7.5583E-06 2 105.93 -8685.9 -12.42 7.5583E-06 2 vap vol 750 m3
Temperature 30 ˚C Temperature 15 ˚C
303 K 288 K initial temp 15
Vapour Pressure 1089 Pa Vapour Pressure 430 Pa initial mol fract act 0.00
1.1 kPa 0.4 kPa initial mol fract N2 1.00
Volume Act 3.143507
Tank Pressure 5 "WC Tank Pressure 5 "WC Volume Vol 746.8565
1.25 kPag 1.25 kPag 750
System Total 102.6 kPa System Total 102.6 kPa
Partial Pressure = Vapour Pressure at Saturation Partial Pressure = Vapour Pressure at Saturation Final temp 30
Partial Pressure / Total Pressure = Mole Fraction = Volume Fraction Partial Pressure / Total Pressure = Mole Fraction = Volume Fraction Final mol fract act 0.01
Final mol fract N2 0.99
Tank Displacement Tank Displacement Volume Act 7.96287
No Oxygen - All Nitrogen and Solvent Vapour No Oxygen - All Nitrogen and Solvent Vapour Volume Vol 742.0371
750
Styrene Molecular Weight 104.15 Mole fraction 0.011 Styrene Molecular Weight 104.15 Mole fraction 0.004
Nitrogen Molecular Weight 28 Mole fraction 0.989 Nitrogen Molecular Weight 28 Mole fraction 0.996 Vapour pressure expansion 0.6%
1 1
Therefore Average Molecular Weight 28.8 Therefore Average Molecular Weight 28.3 Thermal gas expansion 5.2%
PV =nRT, Density = MW x P/RT R = 8314 J/Kelvin.kmole PV =nRT, Density = MW x P/RT R = 8314 J/Kelvin.kmole expansion factor 5.9%
Density = 1.17 kg/m3 Total Flow Density = 1.21 kg/m3 Total Flow
Density = 4.24 kg/m3 Styrene vapour Density = 4.46 kg/m3 Styrene vapour
CEC Engineers Chem Data 1 13 of 16

Client : Quantem (Terminals Pty Ltd) Calc by FS
Project No. : 200003 Date 28/10/2020
Project : 2nd Thermal Oxidiser and Liquid Waste Burning Checked AB
Rev 1
Calculation No: 200003CAL-002
Vapour Density, Mole Fraction & Tank Expansion Factor
VINYL ACETATE VINYL ACETATE From Perry 7th Ed Table 2-6 tank vol 1000 m3
C1 C2 C3 C4 C5 C1 C2 C3 C4 C5 tank empty 0.75
57.406 -5702.8 -5.0307 1.1042E-17 6 57.406 -5702.8 -5.0307 1.1042E-17 6 vap vol 750 m3
Temperature 30 ˚C Temperature 15 ˚C
303 K 288 K initial temp 15
Vapour Pressure 18946 Pa Vapour Pressure 9157 Pa initial mol fract act 0.09
18.9 kPa 9.2 kPa initial mol fract N2 0.91
Volume Act 66.95524
Tank Pressure 5 "WC Tank Pressure 5 "WC Volume Vol 683.0448
1.25 kPag 1.25 kPag 750
System Total 102.6 kPa System Total 102.6 kPa
Partial Pressure = Vapour Pressure at Saturation Partial Pressure = Vapour Pressure at Saturation Final temp 30
Partial Pressure / Total Pressure = Mole Fraction = Volume Fraction Partial Pressure / Total Pressure = Mole Fraction = Volume Fraction Final mol fract act 0.18
Final mol fract N2 0.82
Tank Displacement Tank Displacement Volume Act 138.5338
No Oxygen - All Nitrogen and Solvent Vapour No Oxygen - All Nitrogen and Solvent Vapour Volume Vol 611.4662
750
Vinyl Acetate Molecular Weight 86.09 Mole fraction 0.185 Vinyl Acetate Molecular Weight 86.09 Mole fraction 0.089
Nitrogen Molecular Weight 28 Mole fraction 0.815 Nitrogen Molecular Weight 28 Mole fraction 0.911 Vapour pressure expansion 10.5%
1 1
Therefore Average Molecular Weight 38.7 Therefore Average Molecular Weight 33.2 Thermal gas expansion 5.2%
PV =nRT, Density = MW x P/RT R = 8314 J/Kelvin.kmole PV =nRT, Density = MW x P/RT R = 8314 J/Kelvin.kmole expansion factor 15.7%
Density = 1.58 kg/m3 Total Flow Density = 1.42 kg/m3 Total Flow
Density = 3.51 kg/m3 Vinyl acetate vapour Density = 3.69 kg/m3 Vinyl acetate vapour
METHYL METHACRYLATE METHYL METHACRYLATE From BOC data (Same method as Perry 7th Ed Table 2-6) tank vol 1000 m3
C1 C2 C3 C4 C5 C1 C2 C3 C4 C5 tank empty 0.75
107.36 -8085.3 -12.72 8.3307E-06 2 107.36 -8085.3 -12.72 8.3307E-06 2 vap vol 750 m3
Temperature 30 ˚C Temperature 15 ˚C
303 K 288 K initial temp 15
Vapour Pressure 6387 Pa Vapour Pressure 2819 Pa initial mol fract act 0.03
6.4 kPa 2.8 kPa initial mol fract N2 0.97
Volume Act 20.61324
Tank Pressure 5 "WC Tank Pressure 5 "WC Volume Vol 729.3868
1.25 kPag 1.25 kPag 750
System Total 102.6 kPa System Total 102.6 kPa
Partial Pressure = Vapour Pressure at Saturation Partial Pressure = Vapour Pressure at Saturation Final temp 30
Partial Pressure / Total Pressure = Mole Fraction = Volume Fraction Partial Pressure / Total Pressure = Mole Fraction = Volume Fraction Final mol fract act 0.06
Final mol fract N2 0.94
Tank Displacement Tank Displacement Volume Act 46.70079
No Oxygen - All Nitrogen and Solvent Vapour No Oxygen - All Nitrogen and Solvent Vapour Volume Vol 703.2992
750
MMA Molecular Weight 100.12 Mole fraction 0.062 MMA Molecular Weight 100.12 Mole fraction 0.027
Nitrogen Molecular Weight 28 Mole fraction 0.938 Nitrogen Molecular Weight 28 Mole fraction 0.973 Vapour pressure expansion 3.6%
1 1
Therefore Average Molecular Weight 32.5 Therefore Average Molecular Weight 30.0 Thermal gas expansion 5.2%
PV =nRT, Density = MW x P/RT R = 8314 J/Kelvin.kmole PV =nRT, Density = MW x P/RT R = 8314 J/Kelvin.kmole expansion factor 8.8%
Density = 1.32 kg/m3 Total Flow Density = 1.28 kg/m3 Total Flow
Density = 4.08 kg/m3 Metylmetacrylate vapour Density = 4.29 kg/m3 Metylmetacrylate vapour
CEC Engineers Chem Data 1 14 of 16

Client : Quantem (Terminals Pty Ltd) Calc by FS
Project No. : 200003 Date 28/10/2020
Project : 2nd Thermal Oxidiser and Liquid Waste Burning Checked AB
Rev 1
Calculation No: 200003CAL-002
Vapour Density, Mole Fraction & Tank Expansion Factor
BUTYL ACRYLATE BUTYL ACRYLATE From Odor and VOC Control Handbook - H.J Rafson) tank vol 1000 m3
A B C A B C tank empty 0.75
8.141759 2199.925 273.16 8.141759 2199.925 273.16 vap vol 750 m3
Temperature 30 ˚C Temperature 15 ˚C
303 K 288 K
Vapour Pressure 7.68 mmHg Vapour Pressure 3.22 mmHg initial temp 15
1023 Pa 429 Pa initial mol fract act 0.00
1.0 kPa 0.4 kPa initial mol fract N2 1.00
Volume Act 3.135541
Tank Pressure 5 "WC Tank Pressure 5 "WC Volume Vol 746.8645
1.25 kPag 1.25 kPag 750
System Total 102.6 kPa System Total 102.6 kPa
Partial Pressure = Vapour Pressure at Saturation Partial Pressure = Vapour Pressure at Saturation Final temp 30
Partial Pressure / Total Pressure = Mole Fraction = Volume Fraction Partial Pressure / Total Pressure = Mole Fraction = Volume Fraction Final mol fract act 0.01
Final mol fract N2 0.99
Tank Displacement Tank Displacement Volume Act 7.482607
No Oxygen - All Nitrogen and Solvent Vapour No Oxygen - All Nitrogen and Solvent Vapour Volume Vol 742.5174
750
BA Molecular Weight 128.17 Mole fraction 0.010 BA Molecular Weight 128.17 Mole fraction 0.004
Nitrogen Molecular Weight 28 Mole fraction 0.990 Nitrogen Molecular Weight 28 Mole fraction 0.996 Vapour pressure expansion 0.6%
1 1
Therefore Average Molecular Weight 29.0 Therefore Average Molecular Weight 28.4 Thermal gas expansion 5.2%
PV =nRT, Density = MW x P/RT R = 8314 J/Kelvin.kmole PV =nRT, Density = MW x P/RT R = 8314 J/Kelvin.kmole expansion factor 5.8%
Density = 1.18 kg/m3 Total Flow Density = 1.22 kg/m3 Total Flow
Density = 5.22 kg/m3 Butyl acrylate vapour Density = 5.49 kg/m3 Butyl acrylate vapour
METHYL ISOBUTYL CARBINOL (MIBC) METHYL ISOBUTYL CARBINOL (MIBC) From Shell Chemicals Data Sheet tank vol 1000 m3
tank empty 0.75
A B C A B C vap vol 750 m3
6.63977 1521.88 196.767 6.63977 1521.88 196.767
Temperature 30 ˚C Temperature 15 ˚C initial temp 15
303 K 288 K initial mol fract act 0.00
Vapour Pressure 0.85 kPa Vapour Pressure 0.28 kPa initial mol fract N2 1.00
Volume Act 2.076018
Tank Pressure 5 "WC Tank Pressure 5 "WC Volume Vol 747.924
1.25 kPag 1.25 kPag 750
System Total 102.6 kPa System Total 102.6 kPa
Partial Pressure = Vapour Pressure at Saturation Partial Pressure = Vapour Pressure at Saturation Final temp 30
Partial Pressure / Total Pressure = Mole Fraction = Volume Fraction Partial Pressure / Total Pressure = Mole Fraction = Volume Fraction Final mol fract act 0.01
Final mol fract N2 0.99
Tank Displacement Tank Displacement Volume Act 6.203018
No Oxygen - All Nitrogen and Solvent Vapour No Oxygen - All Nitrogen and Solvent Vapour Volume Vol 743.797
750
MIBC Molecular Weight 102.174 Mole fraction 0.008 MIBC Molecular Weight 102.174 Mole fraction 0.003
Nitrogen Molecular Weight 28 Mole fraction 0.992 Nitrogen Molecular Weight 28 Mole fraction 0.997 Vapour pressure expansion 0.6%
1 1
Therefore Average Molecular Weight 28.6 Therefore Average Molecular Weight 28.2 Thermal gas expansion 5.2%
PV =nRT, Density = MW x P/RT R = 8314 J/Kelvin.kmole PV =nRT, Density = MW x P/RT R = 8314 J/Kelvin.kmole expansion factor 5.8%
Density = 1.17 kg/m3 Total Flow Density = 1.21 kg/m3 Total Flow
Density = 4.16 kg/m3 Butyl acrylate vapour Density = 4.38 kg/m3 Butyl acrylate vapour
CEC Engineers Chem Data 1 15 of 16

Client : Quantem (Terminals Pty Ltd) Calc by FS
Project No. : 200003 Date 28/10/2020
Project : 2nd Thermal Oxidiser and Liquid Waste Burning Checked AB
Rev 1
Calculation No: 200003CAL-002
Vapour Density, Mole Fraction & Tank Expansion Factor
Hydrogen Sulphide
Temperature 30 Deg C
303 Deg K
Tank Pressure 6 "WC
1.5 kPag
System Total 102.8 kPa
Partial Pressure = Vapour Pressure at Saturation
Partial Pressure / Total Pressure = Mole Fraction = Volume Fraction
Tank Displacement
No Oxygen - All Nitrogen and Solvent Vapour
H2S Molecular Weight 34 Mole fraction 0.04
Nitrogen Molecular Weight 28 Mole fraction 0.96
1.00
Therefore Average Molecular Weight 28.2
PV =nRT, Density = MW x P/RT R = 8314 J/Kelvin.kmole
Density = 1.15 Kg/m3 Of Total Flow
Density = 1.39 Kg/m3 Of H2S vapour
Sulphur dioxide
Temperature 30 Deg C
303 Deg K
Tank Pressure 6 "WC
1.5 kPag
System Total 102.8 kPa
Partial Pressure = Vapour Pressure at Saturation
Partial Pressure / Total Pressure = Mole Fraction = Volume Fraction
Tank Displacement
No Oxygen - All Nitrogen and Solvent Vapour
SO2 Molecular Weight 64 Mole fraction
PV =nRT, Density = MW x P/RT R = 8314 J/Kelvin.kmole
Density = 2.61 Kg/m3 Of SO2 vapour
CEC Engineers Chem Data 1 16 of 16

Appendix F
Stack Testing Reports

EML AIR PTY LTD ABN 98 006 878 342
Melbourne (Head Office) PO Box 466, Canterbury, Victoria 3126
427 Canterbury Road, Surrey Hills, Victoria 3127
T. +61 3 9836 1999 F. +61 3 9830 0670
E. [email protected] W. www.emlair.com.au
Our reference: N90851
Page 1 of 5
7 May 2013
This document is issued in accordance with NATA’s accreditation requirements. Accredited for compliance with ISO/IEC 17025. This document shall not be reproduced except in full
Air Emission Specialists MELBOURNE SYDNEY PERTH BRISBANE
Terminals Pty Ltd PO Box 148 MATRAVILLE NSW 2036
Attention Mr Geoff Millard
PORT BOTANY PLANT
Emission Testing Report - APRIL 2013
Tests were performed at the request of Terminals Pty Ltd to determine emissions to air as detailed below;
Test Summary
Location Test Date Test Parameters*
Benzene Combuster 17 April 2013 Total particulate matter, speciated volatile organic compounds (VOC’s) including benzene, hydrogen sulfide, sulfur dioxide, nitrogen oxides, carbon monoxide, carbon dioxide, oxygen
* Flow rate, velocity, temperature and moisture were determined unless otherwise stated.
Please refer to the following pages for results, plant operating conditions, test methods, quality assurance / quality control information and definitions.
Heath Thatcher DipAppSc Zac Xavier BSc BEngClient Manager Managing Directorjw doc:n90851.doc
julie.webb
New Stamp

EML AIR PTY LTD ABN 98 006 878 342 Our reference: N90851
Page 2 of 5 Test report prepared for Terminals Pty Ltd 7 May 2013
This document is issued in accordance with NATA’s accreditation requirements. Accredited for compliance with ISO/IEC 17025. This document shall not be reproduced except in full
Air Emission Specialists MELBOURNE SYDNEY PERTH BRISBANE
RESULTS
Date Client Terminals Pty LtdReport Stack ID Benzene CombustorLicence No. Location Port Botany State NSWEML Staff HTProcess Conditions Please refer to client records.Reason for testing: Client requested testing to determine emissions to airspace space space space space space space spaceSampling Plane Details
Sampling plane dimensions (mm) & area 1300 1.33 m²Sampling port size, number & depth 4" Flange (x2)Access & height of ports Fixed ladder 12.5 mDuct orientation & shape Vertical CircularDownstream disturbance Exit cone 2 DUpstream disturbance Change in diameter 5 DNo. traverses & points sampled 2 16Traverse method & compliance AS4323.1 Compliant but non-idealspace space space space space space space spaceComments
The sampling plane is too near to the upstream disturbance but is greater than or equal to 2DAll results reported on a dry basis at NTPspace space space space space space space spaceStack Parameters
Moisture content, %v/v 1.7 Gas molecular weight, g/g mole 29.2 (wet) 29.4 (dry)Gas density at NTP, kg/m³ 1.30 (wet) 1.31 (dry)space space space space space space space spaceGas Flow Parameters Isokinetic
Temperature, K 1305Velocity at sampling plane, m/s 15Volumetric flow rate, discharge, m³/s 20Volumetric flow rate (wet NTP), m³/s 4.3Volumetric flow rate (dry NTP), m³/s 4.2Mass flow rate (wet basis), kg/hour 20000Velocity difference, % <1space space space space space space space spaceIsokinetic
Sampling time
Concentration Mass Rate
mg/m³ g/s
Total particulate matter <0.83 <0.0035space space space space space space space space
Hydrogen SulfideSampling time
Concentration Mass Rate
mg/m³ g/s
Hydrogen sulfide <0.0039 <0.000016space space space space space space space space
Results
Flow to Combustor - 670 m³/hr. Online temperature ~990°C
17/04/2013N90851
Results
-
1105-1205
1045-1205

EML AIR PTY LTD ABN 98 006 878 342 Our reference: N90851
Page 3 of 5 Test report prepared for Terminals Pty Ltd 7 May 2013
This document is issued in accordance with NATA’s accreditation requirements. Accredited for compliance with ISO/IEC 17025. This document shall not be reproduced except in full
Air Emission Specialists MELBOURNE SYDNEY PERTH BRISBANE
Date Client Terminals Pty LtdReport Stack ID Benzene CombustorLicence No. Location Port Botany State NSWEML Staff HTProcess Conditions Please refer to client records.Reason for testing: Client requested testing to determine emissions to air
17/04/2013N90851-
Gases
Sampling time
Concentration Mass Rate Concentration Mass Rate Concentration Mass Rate
mg/m³ g/s mg/m³ g/s mg/m³ g/s
Nitrogen oxides (as NO2) 260 1.1 68 0.29 440 1.9
Sulfur dioxide 630 2.6 <5.7 <0.024 1200 5.1Carbon monoxide 44 0.19 11 0.047 210 0.87
Concentration Concentration Concentration
% % %
Carbon dioxide 6.6 5.6 7Oxygen 5.6 4.3 6.8space space space space space space space spaceVOC's (as n-Propane)
Sampling time
Concentration Mass Rate
mg/m³ g/s
Total 0 0 <0.041 <0.00017 0 0space space space space space space space spaceVOC's (speciated)
Sampling time
Concentration Mass Rate
mg/m³ g/s
Detection limit(1)<0.043 <0.00018
Benzene <0.043 <0.00018space space space space space space space space
(1) Unless otherwise reported, the following target compounds were found to be below detection:
space space space space space space space space
Pentane, Hexane, Heptane, Octane, Nonane, Decane, Undecane, Dodecane, Tridecane, TetradecaneEthanol, Isopropanol, Isobutanol, Butanol, 1-Methoxy-2-propanol, Cyclohexanol, 2-Butoxyethanol
Cyclohexane, 2-Methylhexane, 2,3-Dimethylpentane, 3-Methylhexane, Isooctane, Methylcyclohexane, alpha-Pinene, beta-Pinene, d-Limonene, 3-Carene
Acetone, Methyl ethyl ketone, Ethyl acetate, Isopropyl acetate, Propyl acetate, MIBK, 2-Hexanone, Butyl acetate, 1-Methoxy-2-propyl acetate, Cyclohexanone, Cellosolve acetate, 2-Butoxyethyl acetate, Ethyldiglycol acetate, Diacetone alcohol, Isophorone
1045-1145
Average Maximum
Results
Minimum1025-11251025-1125
Results
Dichloromethane, Chloroform, 1,1,1-Trichloroethane, 1,2-Dichloroethane, Carbon tetrachloride, 1,1-Dichloroethene, cis-1,2-Dichloroethene, trans-1,2-Dichloroethene, Trichloroethene, Tetrachloroethene, 1,1,2-Trichloroethane, 1,1,2,2-Tetrachloroethane, Chlorobenzene, Fluorobenzene
Benzene, Toluene, Ethylbenzene, m+p-Xylene, Styrene, o-Xylene, Isopropylbenzene, Propylbenzene, 1,3,5-Trimethylbenzene, alpha-Methylstyrene, tert-Butylbenzene, 1,2,4-Trimethylbenzene, 1,2,3-Trimethylbenzene, m-Diethylbenzene, o-Diethylbenzene, p-Diethylbenzene
1025-1125
1045-1145

EML AIR PTY LTD ABN 98 006 878 342 Our reference: N90851
Page 4 of 5 Test report prepared for Terminals Pty Ltd 7 May 2013
This document is issued in accordance with NATA’s accreditation requirements. Accredited for compliance with ISO/IEC 17025. This document shall not be reproduced except in full
Air Emission Specialists MELBOURNE SYDNEY PERTH BRISBANE
PLANT OPERATING CONDITIONS
Unless otherwise stated, the plant operating conditions were normal at the time of testing. See Terminals Pty Ltd’s records for complete process conditions. Testing was performed during benzene ship discharge operations to provide peak load rate between 1045 and 1210 on Wednesday, 17th April 2013
TEST METHODS
Unless otherwise stated, the following methods meet the requirements of the NSW Office of Environment and Heritage (as specified in the Approved Methods for the Sampling and Analysis of Air Pollutants in New South Wales, January 2007). All sampling and analysis was performed by EML Air unless otherwise specified. Specific details of the methods are available upon request.
NATA Accredited
Parameter NSW Test Method
Reference Method
Uncertainty*
Sampling Analysis
Sample Plane Criteria TM-1 AS 4323.1 - NA
Flow rate, temperature and velocity TM-2 USEPA 2 8%, 2%, 7% NA
Moisture content TM-22 USEPA 4 8%
Sulfur dioxide TM-4 USEPA 6C 12%
Hydrogen sulfide TM-5 USEPA 11 not specified
Nitrogen oxides (NOx) TM-11 USEPA 7E 12%
Particulate matter TM-15 AS 4323.2 5%
Carbon dioxide TM-24 USEPA 3A 13%
Oxygen TM-25 USEPA 3A 13%
Speciated volatile organic compounds TM-34 USEPA 18 19%
* Uncertainty values cited in this table are calculated at the 95% confidence level (coverage factor = 2)
AS – Australian Standard USEPA – United States Environmental Protection Agency TM - Test Method
QUALITY ASSURANCE / QUALITY CONTROL INFORMATION
EML Air Pty Ltd is accredited by the National Association of Testing Authorities (NATA) for the sampling and analysis of air pollutants from industrial sources (Accreditation number 2732). Unless otherwise stated test methods used are accredited with the National Association of Testing Authorities. For full details, search for EML Air at NATA’s website www.nata.asn.au.
EML Air is accredited to Australian Standard 17025 – General Requirements for the Competence of Testing and Calibration Laboratories. Australian Standard 17025 requires that a laboratory have a quality system similar to ISO 9002. More importantly it also requires that a laboratory have adequate equipment to perform the testing, as well as laboratory personnel with the competence to perform the testing. This quality assurance system is administered and maintained by the Quality Assurance Manager.
A formal Quality Control program is in place at EML Air to monitor analyses performed in the laboratory and sampling conducted in the field. The program is designed to check where appropriate; the sampling reproducibility, analytical method, accuracy, precision and the performance of the analyst. The Laboratory Manager is responsible for the administration and maintenance of this program.

EML AIR PTY LTD ABN 98 006 878 342 Our reference: N90851
Page 5 of 5 Test report prepared for Terminals Pty Ltd 7 May 2013
This document is issued in accordance with NATA’s accreditation requirements. Accredited for compliance with ISO/IEC 17025. This document shall not be reproduced except in full
Air Emission Specialists MELBOURNE SYDNEY PERTH BRISBANE
DEFINITIONS
The following symbols and abbreviations may be used in this test report:
NTP Normal temperature and pressure. Gas volumes and concentrations are expressed on a dry basis at 0°C, at discharge oxygen concentration and an absolute pressure of 101.325 kPa, unless otherwise specified.
Disturbance A flow obstruction or instability in the direction of the flow which may impede accurate flow determination. This includes centrifugal fans, axial fans, partially closed or closed dampers, louvres, bends, connections, junctions, direction changes or changes in pipe diameter.
VOC Any chemical compound based on carbon with a vapour pressure of at least 0.010 kPa at 25°C or having a corresponding volatility under the particular conditions of use. These compounds may contain oxygen, nitrogen and other elements, but specifically excluded are carbon monoxide, carbon dioxide, carbonic acid, metallic carbides and carbonate salts.
BSP British standard pipe
NA Not applicable
D Duct diameter or equivalent duct diameter for rectangular ducts
< Less than
> Greater than
≥ Greater than or equal to
~ Approximately

Date: 28 August 2013 Report No: 130431r Page: 1 of 12 Terminals Pty Ltd Gate 38B, 45 Friendship Rd Port Botany NSW 2036
Emission Testing – August 2013 EPA 4 – Benzene Combustor Inlet/Outlet Testing
Dear Mr G Millard,
Tests were performed 10th August 2013 to determine emissions from the Benzene Combustor Inlet and Outlet at the Port Botany plant of Terminals Pty Ltd.
LICENCE COMPARISON ............................................................................ 2 EXECUTIVE SUMMARY .............................................................................. 2 RESULTS ..................................................................................................... 3
Benzene Combustor Inlet (Test 1) ...............................................3 EPA 4 – Benzene Combustor Outlet (Test 1) ..............................4 Benzene Combustor Inlet (Test 2) ...............................................6 EPA 4 – Benzene Combustor Outlet (Test 2) ..............................7
SAMPLING PLANE OBSERVATIONS ........................................................ 9 PLANT OPERATING CONDITIONS ............................................................ 9 TEST METHODS ....................................................................................... 10 DEFINITIONS ............................................................................................. 11
Yours faithfully Emission Testing Consultants
David Corbett Ba/BCom Client Manager [email protected]

Report prepared for:
Terminals Pty Ltd
Date: 28 August 2013
Report No: 130431r
Page: 2 of 12
LICENCE COMPARISON
Note: All analytes are below the Licence Limit set by the NSW EPA as per licence 1048 (last amended on 6-May-2013). Results for the Benzene Combustor Outlet (stack) have also been corrected to 3% Oxygen as stipulated in Part 3, Schedule 5 of the Protection of the Environment Operations (Clean Air) Regulation, (NSW) 2010.
EXECUTIVE SUMMARY
Emission Testing Consultants (ETC) was engaged by Terminals Pty Ltd to perform emission monitoring as required by their NSW EPA Environment Protection Licence (number 1048). Monitoring was performed at 2 locations, twice, for the following parameters:
Testing commenced approximately half way through the benzene ship discharge period after notification from Terminals Pty Ltd personnel. The methodologies chosen by ETC are those stipulated by Terminals Pty Ltd Licence (1048). There were no technical issues in terms of sampling on the days of testing. Plant operating conditions have been noted in the report.
EPA No.Location
DescriptionPollutant Unit of measure
Licence
limit
Test 1
Concentration
Test 1
Concentration (corrected to 3% O2)
Test 2
Concentration
Test 2
Concentration (corrected to 3% O2)
Solid particles milligrams per cubic meter (mg/m3) 50 < 2 < 4 < 2 < 4
Nitrogen dioxide milligrams per cubic meter (mg/m3) 350 54 110 110 210
Volatile organic compounds (VOCs) milligrams per cubic meter (mg/m3) 20 < 0.7 < 2 < 0.7 < 1
Hydrogen sulphide milligrams per cubic meter (mg/m3) 5 < 0.03 < 0.07 < 0.03 < 0.07
4Benzene
Combustor
Discharge point
Sele
ction o
f sam
plin
g p
ositio
ns
Flo
w r
ate
Velo
city
Tem
pera
ture
Mois
ture
Part
icu
late
matt
er
Dry
gas D
ensity
Mole
cula
r w
eig
ht
Carb
on
dio
xid
e (
CO
2)
Oxyg
en
(O
2)
Carb
on
mo
no
xid
e (
CO
)
Nit
rog
en
oxid
es (
NO
x)
as N
O2
Su
lph
ur
dio
xid
e (
SO
2)
Hyd
rog
en
su
lph
ide (
H2S
)
Vo
lati
le o
rgan
ic c
om
po
un
ds (
VO
C)
EPA 4 - Benzene Combustor Outlet
Benzene Combustor Inlet

Report prepared for:
Terminals Pty Ltd
Date: 28 August 2013
Report No: 130431r
Page: 3 of 12
RESULTS
Benzene Combustor Inlet (Test 1)
10 August 2013
Note: If not listed above, the following compounds were not detected above the analytical range of the instrument. Please contact ETC
should you wish to discuss detection limits of specific undetected compounds; Acetone (2-propanone), Propylene Oxide, Acrylonitrile,
Methylene Chloride, MEK (2-butanone), Hexane, Ethyl Acetate, 1,2-dichloroethane, Benzene, Carbon tetrachloride, Cyclohexane, Ethyl
Acrylate, Trichloroethene (Trichloroethylene,TCE), 1,4-Dioxane, Epichlorohydrin, MIBK (4-methyl-2-pentanone), Toluene,
Tetrachloroethene (Perchloroethylene,PCE), n-Butyl Acetate, Chlorobenzene, Ethylbenzene, m/p-xylene, Styrene (Vinyl benzene), o-
xylene, Cyclohexanone, Nonane, Isopropylbenzene (Cumene), DIBK (Diisobutyl Ketone), α-Methylstyrene, Decane, Benzyl Chloride (α-
chlorotolune), Benzoyl Chloride, Naphthalene, Dodecane
Refer to “SAMPLE PLANE OBSERVATIONS” on page 9.
Flow Results M easured M W EPA 4 - Benzene Combustor (Inlet) Test 1 130431
Time of flow test 2100 & 2213 hrs
Stack dimensions at sampling plane 210 mm
Velocity at sampling plane 6.5 m/s
Average temperature 20 °C
Moisture content < 1 % v/v
Flow rate at discharge conditions 0.22 m³/sec
Flow rate at wet NTP conditions 0.21 m³/sec
Flow rate at dry NTP conditions 0.21 m³/sec
Dry gas density 1.3 kg/m3Molecular weight of stack gas, dry basis 29 g/g-mole
Volatile Organic Compound (VOC) Results
EPA 4 - Benzene
Combustor (Inlet)
Test 1 130431 13
Sampling
Times
Hexane 2110-2210 1.8 mg/m3 0.023 g/min
Cyclohexane 2110-2210 1.5 mg/m3 0.019 g/min
n-Butyl Acetate 2110-2210 13 mg/m3 0.16 g/min
Benzene 2110-2210 4,000 mg/m3 51 g/min
Toluene 2110-2210 160 mg/m3 2.0 g/min
m/p-Xylene 2110-2210 6.9 mg/m3 0.088 g/min
Styrene (Vinyl benzene) 2110-2210 2.3 mg/m3 0.030 g/min
o-Xylene 2110-2210 0.85 mg/m3 0.011 g/min
Total VOCs (as n-propane) 2110-2210 2,300 mg/m3 30 g/min
Concentration at NTP Mass rate

Report prepared for:
Terminals Pty Ltd
Date: 28 August 2013
Report No: 130431r
Page: 4 of 12
EPA 4 – Benzene Combustor Outlet (Test 1)
10 August 2013
Note: In addition to those listed above, the following compounds were not detected above the analytical range of the instrument. Please
contact ETC should you wish to discuss detection limits of specific undetected compounds; Acetone (2-propanone), Propylene Oxide,
Acrylonitrile, Methylene Chloride, MEK (2-butanone), Hexane, Ethyl Acetate, 1,2-dichloroethane, Benzene, Carbon tetrachloride,
Cyclohexane, Ethyl Acrylate, Trichloroethene (Trichloroethylene,TCE), 1,4-Dioxane, Epichlorohydrin, MIBK (4-methyl-2-pentanone),
Toluene, Tetrachloroethene (Perchloroethylene,PCE), n-Butyl Acetate, Chlorobenzene, Ethylbenzene, m/p-xylene, Styrene (Vinyl
benzene), o-xylene, Cyclohexanone, Nonane, Isopropylbenzene (Cumene), DIBK (Diisobutyl Ketone), α-Methylstyrene, Decane, Benzyl
Chloride (α- chlorotolune), Benzoyl Chloride, Naphthalene, Dodecane
Refer to “SAMPLE PLANE OBSERVATIONS” on page 9.
Flow Results M easured M W EPA 4 - Benzene Combustor (Outlet) Test 1 130431
Time of flow test 2055 & 2215 hrs
Stack dimensions at sampling plane 1010 mm
Velocity at sampling plane 9.5 m/s
Average temperature 771 °C
Moisture content <1 % v/v
Flow rate at discharge conditions 7.6 m³/sec
Flow rate at wet NTP conditions 2.0 m³/sec
Flow rate at dry NTP conditions 2.0 m³/sec
Volatile Organic Compound (VOC) Results
EPA 4 - Benzene
Combustor (Outlet)
Test 1 130431 120
Sampling
Times
Hexane 2110-2210 < 0.3 mg/m3 < 0.6 mg/m³ < 0.03 g/min
Cyclohexane 2110-2210 < 0.3 mg/m3 < 0.6 mg/m³ < 0.03 g/min
n-Butyl Acetate 2110-2210 < 0.3 mg/m3 < 0.6 mg/m³ < 0.03 g/min
Benzene 2110-2210 < 0.3 mg/m3 < 0.6 mg/m³ < 0.03 g/min
Toluene 2110-2210 < 0.3 mg/m3 < 0.6 mg/m³ < 0.03 g/min
Ethybenzene 2110-2210 < 0.3 mg/m3 < 0.6 mg/m³ < 0.03 g/min
m/p-Xylene 2110-2210 < 0.6 mg/m3 < 1 mg/m³ < 0.07 g/min
Styrene (Vinyl benzene) 2110-2210 < 0.3 mg/m3 < 0.6 mg/m³ < 0.03 g/min
o-Xylene 2110-2210 < 0.3 mg/m3 < 0.6 mg/m³ < 0.03 g/min
Total VOCs (as n-Propane) 2110-2210 < 0.7 mg/m3 < 2 mg/m³ < 0.09 g/min
Concentration at NTP Mass rateConcentration at 3% O2
Non Isokinetic Sampling Results
EPA 4 - Benzene
Combustor (Outlet)
Test 1 130431 120
Sampling
Times
Hydrogen sulphide 2105-2206 < 0.03 mg/m3 < 0.07 mg/m3 < 0.004 g/min
Concentration at 3% O2Concentration at NTP Mass rate

Report prepared for:
Terminals Pty Ltd
Date: 28 August 2013
Report No: 130431r
Page: 5 of 12
EPA 4 – Benzene Combustor Outlet (Test 1)
10 August 2013
Refer to “SAMPLE PLANE OBSERVATIONS” on page 9.
Continuous Analyser ResultsEPA 4 - Benzene
Combustor (Outlet)
Test 1 130431 120
Sampling
Times
Oxygen (dry basis) 2115-2214 12.4 % v/v - -
Carbon dioxide (dry basis) 2115-2214 3.6 % v/v - -
Dry gas density 2115-2214 1.3 kg/m3 - -
Molecular weight of stack gas, dry basis 2115-2214 29 g/g-mole - -
Nitrogen oxides as NO2 2115-2214 54 mg/m3 110 mg/m3 6.4 g/min
Sulphur dioxide as SO2 2115-2214 64 mg/m3 140 mg/m3 7.6 g/min
Carbon monoxide as CO 2115-2214 < 2 mg/m3 < 5 mg/m3 < 0.3 g/min
Concentration at NTP Concentration at 3% O2 Mass rate
Isokinetic Sampling Results
EPA 4 - Benzene
Combustor (Outlet)
Test 1 130431 120
Sampling
Times
Solid Particles 2105-2210 < 2 mg/m3 < 4 mg/m3 < 0.2 g/min
No. of sampling points 12
Length of sampling, min
Stack gas molecular weight, g/g-mole (wet) 29
Stack gas density, kg/m 3 at wet NTP 1.3
60
Concentration at NTP Mass rateConcentration at 3% O2

Report prepared for:
Terminals Pty Ltd
Date: 28 August 2013
Report No: 130431r
Page: 6 of 12
Benzene Combustor Inlet (Test 2)
10 August 2013
Note: If not listed above, the following compounds were not detected above the analytical range of the instrument. Please contact ETC
should you wish to discuss detection limits of specific undetected compounds; Acetone (2-propanone), Propylene Oxide, Acrylonitrile,
Methylene Chloride, MEK (2-butanone), Hexane, Ethyl Acetate, 1,2-dichloroethane, Benzene, Carbon tetrachloride, Cyclohexane, Ethyl
Acrylate, Trichloroethene (Trichloroethylene,TCE), 1,4-Dioxane, Epichlorohydrin, MIBK (4-methyl-2-pentanone), Toluene,
Tetrachloroethene (Perchloroethylene,PCE), n-Butyl Acetate, Chlorobenzene, Ethylbenzene, m/p-xylene, Styrene (Vinyl benzene), o-
xylene, Cyclohexanone, Nonane, Isopropylbenzene (Cumene), DIBK (Diisobutyl Ketone), α-Methylstyrene, Decane, Benzyl Chloride (α-
chlorotolune), Benzoyl Chloride, Naphthalene, Dodecane
Refer to “SAMPLE PLANE OBSERVATIONS” on page 9.
Flow Results M easured M W EPA 4 - Benzene Combustor (Inlet) Test 2 130431
Time of flow test 2320 & 0030 hrs
Stack dimensions at sampling plane 210 mm
Velocity at sampling plane 6.6 m/s
Average temperature 20 °C
Moisture content <1 % v/v
Flow rate at discharge conditions 0.23 m³/sec
Flow rate at wet NTP conditions 0.22 m³/sec
Flow rate at dry NTP conditions 0.22 m³/sec
Dry gas density 1.3 kg/m3
Molecular weight of stack gas, dry basis 29 g/g-mole
Volatile Organic Compound (VOC) Results
EPA 4 - Benzene
Combustor (Inlet)
Test 2 130431 13
Sampling
Times
Hexane 2325-0025 3.3 mg/m3 0.042 g/min
Cyclohexane 2325-0025 3.1 mg/m3 0.040 g/min
n-Butyl Acetate 2325-0025 9.1 mg/m3 0.12 g/min
Benzene 2325-0025 6,900 mg/m3 89 g/min
Toluene 2325-0025 290 mg/m3 3.8 g/min
Ethybenzene 2325-0025 0.35 mg/m3 0.0045 g/min
m/p-Xylene 2325-0025 10 mg/m3 0.14 g/min
Styrene (Vinyl benzene) 2325-0025 3.3 mg/m3 0.042 g/min
o-Xylene 2325-0025 1.3 mg/m3 0.016 g/min
Total VOCs (as n-Propane) 2325-0025 4,000 mg/m3 52 g/min
Concentration at NTP Mass rate

Report prepared for:
Terminals Pty Ltd
Date: 28 August 2013
Report No: 130431r
Page: 7 of 12
EPA 4 – Benzene Combustor Outlet (Test 2)
10 August 2013
Note: In addition to those listed above, the following compounds were not detected above the analytical range of the instrument. Please
contact ETC should you wish to discuss detection limits of specific undetected compounds; Acetone (2-propanone), Propylene Oxide,
Acrylonitrile, Methylene Chloride, MEK (2-butanone), Hexane, Ethyl Acetate, 1,2-dichloroethane, Benzene, Carbon tetrachloride,
Cyclohexane, Ethyl Acrylate, Trichloroethene (Trichloroethylene,TCE), 1,4-Dioxane, Epichlorohydrin, MIBK (4-methyl-2-pentanone),
Toluene, Tetrachloroethene (Perchloroethylene,PCE), n-Butyl Acetate, Chlorobenzene, Ethylbenzene, m/p-xylene, Styrene (Vinyl
benzene), o-xylene, Cyclohexanone, Nonane, Isopropylbenzene (Cumene), DIBK (Diisobutyl Ketone), α-Methylstyrene, Decane, Benzyl
Chloride (α- chlorotolune), Benzoyl Chloride, Naphthalene, Dodecane
Refer to “SAMPLE PLANE OBSERVATIONS” on page 9.
Flow Results M easured M W EPA 4 - Benzene Combustor (Outlet) Test 2 130431
Time of flow test 2320 & 0030 hrs
Stack dimensions at sampling plane 1010 mm
Velocity at sampling plane 11 m/s
Average temperature 866 °C
Moisture content <1 % v/v
Flow rate at discharge conditions 8.5 m³/sec
Flow rate at wet NTP conditions 2.0 m³/sec
Flow rate at dry NTP conditions 2.0 m³/sec
Volatile Organic Compound (VOC) Results
EPA 4 - Benzene
Combustor (Outlet)
Test 2 130431 120
Sampling
Times
Hexane 2325-0025 < 0.3 mg/m3 < 0.6 mg/m³ < 0.03 g/min
Cyclohexane 2325-0025 < 0.3 mg/m3 < 0.6 mg/m³ < 0.03 g/min
n-Butyl Acetate 2325-0025 < 0.3 mg/m3 < 0.6 mg/m³ < 0.03 g/min
Benzene 2325-0025 < 0.3 mg/m3 < 0.6 mg/m³ < 0.03 g/min
Toluene 2325-0025 < 0.3 mg/m3 < 0.6 mg/m³ < 0.03 g/min
Ethybenzene 2325-0025 < 0.3 mg/m3 < 0.6 mg/m³ < 0.03 g/min
m/p-Xylene 2325-0025 < 0.6 mg/m3 < 1 mg/m³ < 0.07 g/min
Styrene (Vinyl benzene) 2325-0025 < 0.3 mg/m3 < 0.6 mg/m³ < 0.03 g/min
o-Xylene 2325-0025 < 0.3 mg/m3 < 0.6 mg/m³ < 0.03 g/min
Total VOCs (as n-Propane) 2325-0025 < 0.7 mg/m3 < 1 mg/m³ < 0.09 g/min
Concentration at NTP Mass rateConcentration at 3% O2
Non Isokinetic Sampling Results
EPA 4 - Benzene
Combustor (Outlet)
Test 2 130431 120
Sampling
Times
Hydrogen sulphide 2325-0025 < 0.03 mg/m3 < 0.07 mg/m3 < 0.004 g/min
Concentration at 3% O2Concentration at NTP Mass rate

Report prepared for:
Terminals Pty Ltd
Date: 28 August 2013
Report No: 130431r
Page: 8 of 12
EPA 4 – Benzene Combustor Outlet (Test 2)
10 August 2013
Refer to “SAMPLE PLANE OBSERVATIONS” on page 9.
Continuous Analyser ResultsEPA 4 - Benzene
Combustor (Outlet)
Test 2 130431 120
Sampling
Times
Oxygen (dry basis) 2329-0028 11.6 % v/v - -
Carbon dioxide (dry basis) 2329-0028 4.2 % v/v - -
Dry gas density 2329-0028 1.3 kg/m3 - -
Molecular weight of stack gas, dry basis 2329-0028 29 g/g-mole - -
Nitrogen oxides as NO2 2329-0028 110 mg/m3 210 mg/m3 13 g/min
Sulphur dioxide as SO2 2329-0028 99 mg/m3 190 mg/m3 12 g/min
Carbon monoxide as CO 2329-0028 < 2 mg/m3 < 5 mg/m3 < 0.3 g/min
Concentration at NTP Concentration at 3% O2 Mass rate
Isokinetic Sampling Results
EPA 4 - Benzene
Combustor (Outlet)
Test 2 130431 120
Sampling
Times
Solid Particles 2320-0025 < 2 mg/m3 < 4 mg/m3 < 0.2 g/min
No. of sampling points 12
Length of sampling, min
Stack gas molecular weight, g/g-mole (wet) 29.1
Stack gas density, kg/m 3 at wet NTP 1.3
60
Concentration at NTP Mass rateConcentration at 3% O2

Report prepared for:
Terminals Pty Ltd
Date: 28 August 2013
Report No: 130431r
Page: 9 of 12
SAMPLING PLANE OBSERVATIONS
EPA 4 – Benzene Combustor Inlet The sampling plane had 2 x 4 inch flange port(s). The location was determined to be “ideal” as per AS4323.1. It was more than the required 2 duct diameters upstream from a bend. It was more than the required 6 duct diameters downstream from a junction. The sampling plane passed the flow assessment (items (a) to (f) of AS4323.1) and was therefore “compliant”. EPA 4 – Benzene Combustor Outlet
The sampling plane had 2 x 4 inch flange port(s). The location was determined to be “ideal” as per AS4323.1. It was more than the required 2 duct diameters upstream from the exit. It was more than the required 6 duct diameters downstream from a junction. The sampling plane passed the flow assessment (items (a) to (f) of AS4323.1) and was therefore “compliant”.
PLANT OPERATING CONDITIONS
Plant operating conditions were supplied by Terminals Pty Ltd personnel. Plant operating conditions were representative of stable operation for the duration of sampling. Testing was performed during the benzene (BTX) ship loading operation at a time deemed to provide peak load rate. Test 1 was performed when the Benzene combustor was operating with a combustion zone temperature set point of 790 °C. Test 2 was performed when the Benzene combustor was operating with a combustion zone temperature set point of 890 °C.

Report prepared for:
Terminals Pty Ltd
Date: 28 August 2013
Report No: 130431r
Page: 10 of 12
TEST METHODS
The following methods are accredited with the National Association of Testing Authorities (NATA) and are approved for the sampling and analysis of gases unless otherwise stated. Specific details of the methods are available on request. All sampling and analysis will be conducted in accordance with the test methods (TM) prescribed in NSW EPA’s Approved Methods for the Sampling and Analysis of Air Pollutants in New South Wales, Jan 2007 and in accordance with the Protection of the Environment Operations (Clean Air) Regulation 2010 unless otherwise specified. All parameters are reported adjusted to dry NTP conditions unless otherwise stated.
Sampling Analysis
NATANSW TM
MethodSampling Method NATA Analytical Laboratory Analytical Method
Analytical
Laboratory Report
Number(s)
Selection of sampling positions Yes TM-1 AS4323.1 Yes NA NA 130431r
Flow rate Yes TM-2 USEPA 2 Yes NA NA 130431r
Velocity Yes TM-2 USEPA 2 Yes NA NA 130431r
Temperature Yes TM-2 USEPA 2 Yes NA NA 130431r
Moisture Yes TM-22 USEPA 4 Yes NA NA 130431r
Particulate matter Yes TM-15 USEPA 5 YesEmission Testing
ConsultantsUSEPA 5 130431r
Dry gas Density Yes TM-23 USEPA 3A YesEmission Testing
ConsultantsUSEPA 3A 130431r
Molecular weight Yes TM-23 USEPA 3A YesEmission Testing
ConsultantsUSEPA 3A 130431r
Carbon dioxide (CO2) Yes TM-24 USEPA 3A YesEmission Testing
ConsultantsUSEPA 3A 130431r
Oxygen (O2) Yes TM-25 USEPA 3A YesEmission Testing
ConsultantsUSEPA 3A 130431r
Carbon monoxide (CO) Yes TM-32 USEPA 10 YesEmission Testing
ConsultantsUSEPA 10 130431r
Nitrogen oxides (NOx) as NO2 Yes TM-11 USEPA 7E YesEmission Testing
ConsultantsUSEPA 7E 130431r
Sulphur dioxide (SO2) Yes TM-4 USEPA 6C YesEmission Testing
ConsultantsUSEPA 6C 130431r
Hydrogen sulphide (H2S) Yes TM-5 USEPA 11 YesMGT-LabMark
Environmental Pty LtdUSEPA 11 389203-A
Volatile organic compounds
(VOC)Yes TM-34 USEPA 18 Yes SGS Australia Pty Ltd AN467 63138
Parameter

Report prepared for:
Terminals Pty Ltd
Date: 28 August 2013
Report No: 130431r
Page: 11 of 12
DEFINITIONS
The following symbols and abbreviations are used in test reports:
BSP British standard pipe.
Concentration Mass of analyte per cubic metre expressed at NTP dry conditions (ng, µg or mg/m3).
Flow rate at discharge conditions
Volume of gas flow per unit time expressed at discharge temperature, pressure and moisture content (m3/min).
Flow rate at wet NTP conditions
Volume of gas flow per unit time expressed at 0°C, an absolute pressure of 101.325 kPa and discharge moisture content (m3/min).
Flow rate at dry NTP conditions
Volume of gas flow per unit time expressed at 0°C, an absolute pressure of 101.325 kPa and 0% moisture content (m3/min).
Mass rate Mass of analyte per unit time (µg, mg or g/min).
Moisture content
Percentage of gaseous moisture in the gas expressed on a volume / volume percentage basis. This does not include moisture in the gas stream that is in the liquid phase (free moisture).
NA Not applicable.
NTP Normal temperature and pressure. Gas volumes and concentrations are expressed on a dry basis at 0°C, at discharge oxygen concentration and an absolute pressure of 101.325 kPa, unless otherwise specified.
ppm Parts per million expressed on a volume / volume wet basis.
Sampling plane Location at which measurements were conducted.
Velocity Gas velocity expressed at discharge temperature, pressure and moisture content (m/s)
VOC Any chemical compound based on carbon in the boiling range 36 to 126°C, with a vapour pressure of at least 0.010kPa at 25°C (or having a corresponding volatility under the particular conditions of use) that adsorb onto activated charcoal and desorb into CS2, or that can be collected in a tedlar bag and be quantitatively recovered, and that are detected by GCMS. These compounds may contain oxygen, nitrogen and other elements, but specifically excluded are CO, CO2, carbonic acid, metallic carbides and carbonate salts.
> Greater than.

Report prepared for:
Terminals Pty Ltd
Date: 28 August 2013
Report No: 130431r
Page: 12 of 12
< Less than the minimum limit of detection using the specified method.
~ Approximately.
Template version 240403
Date: 24 July 2013 Report No: 130224r Page: 1 of 7 Terminals Pty Ltd Gate 38B, 45 Friendship Rd Port Botany NSW 2036
Emission Testing – July 2013 EPA 4 – Benzene Combustor
Dear Mr G Millard,
Tests were performed 5th July 2013 to determine emissions to air from the Benzene Combustor at the Port Botany plant of Terminals Pty Ltd.
LICENCE COMPARISON ................................................................2 EXECUTIVE SUMMARY .................................................................2 RESULTS ........................................................................................3
EPA 4 – Benzene Combustor ......................................................3 SAMPLING PLANE OBSERVATIONS .............................................5 PLANT OPERATING CONDITIONS ................................................5 TEST METHODS .............................................................................5 DEFINITIONS ..................................................................................6
Yours faithfully Emission Testing Consultants
David Corbett Ba/BCom Client Manager [email protected]

Report prepared for:
Terminals Pty Ltd
Date: 24 July 2013
Report No: 130224r
Page: 2 of 7
LICENCE COMPARISON
Note: All analytes are below the Licence Limit set by the NSW EPA as per licence 1048 (last amended on 6-May-2013). Results have also been corrected to 3% Oxygen as stipulated in Part 3, Schedule 5 of the Protection of the Environment Operations (Clean Air) Regulation, (NSW) 2010.
EXECUTIVE SUMMARY
Emission Testing Consultants (ETC) was engaged by Terminals Pty Ltd to perform emission monitoring as required by their NSW EPA Environment Protection Licence (number 1048). Monitoring was performed on EPA Point 4 – Benzene Combustor for the following parameters:
Flow rate
Velocity
Temperature
Moisture
Solid particles
Dry gas Density
Molecular weight
Carbon dioxide (CO2)
Oxygen (O2)
Carbon monoxide (CO)
Nitrogen oxides (NOx) as NO2
Sulphur dioxide (SO2)
Hydrogen sulphide (H2S)
Volatile organic compounds (VOC)
Testing commenced half way through the benzene ship discharge period after notification from Terminals Pty Ltd personnel. The methodologies chosen by ETC are those stipulated by Terminals Pty Ltd Licence (1048). There were no technical issues in terms of sampling on the days of testing. Plant operating conditions have been noted in the report.
EPA No.Location
DescriptionPollutant Unit of measure
Licence
limit
Detected
values
Detected
values (corrected to
3% O2)
Solid particles milligrams per cubic meter (mg/m3) 50 < 3 < 4
Nitrogen dioxide milligrams per cubic meter (mg/m3) 350 59 88
Volatile organic compounds (VOCs) milligrams per cubic meter (mg/m3) 20 < 0.9 < 1
Hydrogen sulphide milligrams per cubic meter (mg/m3) 5 < 2 < 3
4Benzene
Combustor

Report prepared for:
Terminals Pty Ltd
Date: 24 July 2013
Report No: 130224r
Page: 3 of 7
RESULTS
EPA 4 – Benzene Combustor
5 July 2013
Flow Results M easured M W EPA 4 - Benzene Combustor 130224
Time of flow test 1150 & 1315 hrs
Stack dimensions at sampling plane 1010 mm
Velocity at sampling plane 7.3 m/s
Average temperature 954 °C
Moisture content 0.91 % v/v
Flow rate at discharge conditions 5.9 m³/sec
Flow rate at wet NTP conditions 1.3 m³/sec
Flow rate at dry NTP conditions 1.3 m³/sec
Continuous Analyser ResultsEPA 4 - Benzene
Combustor 130224
78
Sampling
Times
Oxygen (dry basis) 1200-1259 8.9 % v/v - -
Carbon dioxide (dry basis) 1200-1259 4.8 % v/v - -
Dry gas density 1200-1259 1.3 kg/m3 - -
Molecular weight of stack gas, dry basis 1200-1259 29 g/g-mole - -
Nitrogen oxides as NO2 1200-1259 59 mg/m3 88 mg/m3 4.6 g/min
Sulphur dioxide as SO2 1200-1259 51 mg/m3 75 mg/m3 3.9 g/min
Carbon monoxide as CO 1200-1259 11 mg/m3 16 mg/m3 0.86 g/min
Concentration at NTP Concentration at 3% O2 Mass rate

Report prepared for:
Terminals Pty Ltd
Date: 24 July 2013
Report No: 130224r
Page: 4 of 7
EPA 4 – Benzene Combustor
5 July 2013
Note: If not listed above, the following compounds were not detected above the analytical range of the instrument. Please contact ETC
should you wish to discuss detection limits of specific undetected compounds; Acetone (2-propanone), Propylene Oxide, Acrylonitrile,
Methylene Chloride, MEK (2-butanone), Hexane, Ethyl Acetate, 1,2-dichloroethane, Benzene, Carbon tetrachloride, Cyclohexane, Ethyl
Acrylate, Trichloroethene (Trichloroethylene,TCE), 1,4-Dioxane, Epichlorohydrin, MIBK (4-methyl-2-pentanone), Toluene,
Tetrachloroethene (Perchloroethylene,PCE), n-Butyl Acetate, Chlorobenzene, Ethylbenzene, m/p-xylene, Styrene (Vinyl benzene), o-
xylene, Cyclohexanone, Nonane, Isopropylbenzene (Cumene), DIBK (Diisobutyl Ketone), α-Methylstyrene, Decane, Benzyl Chloride (α-
chlorotolune), Benzoyl Chloride, Naphthalene, Dodecane
Refer to “SAMPLE PLANE OBSERVATIONS” on page 5.
Isokinetic Sampling Results
EPA 4 - Benzene
Combustor 130224
78
Sampling
Times
Solid Particles 1155-1301 < 3 mg/m3 < 4 mg/m3 < 0.2 g/min
No. of sampling points 12
Length of sampling, min
Stack gas molecular weight, g/g-mole (wet) 29
Stack gas density, kg/m3, at wet NTP 1.3
Concentration at NTP Mass rateConcentration at 3% O2
60
Non Isokinetic Sampling Results
EPA 4 - Benzene
Combustor 130224
78
Sampling
Times
Hydrogen sulphide 1201-1311 < 2 mg/m3 < 3 mg/m3 < 0.2 g/min
Concentration at 3% O2Concentration at NTP Mass rate
Volatile Organic Compound (VOC) Results
EPA 4 - Benzene
Combustor 130224
78
Sampling
Times
Benzene 1210-1310 < 0.4 mg/m3 < 0.5 mg/m³ < 0.03 g/min
Total VOCs (as n-Propane) 1210-1310 < 0.9 mg/m3 < 1 mg/m³ < 0.07 g/min
Concentration at NTP Mass rateConcentration at 3% O2

Report prepared for:
Terminals Pty Ltd
Date: 24 July 2013
Report No: 130224r
Page: 5 of 7
SAMPLING PLANE OBSERVATIONS
EPA 4 – Benzene Combustor
The sampling plane had 2 x 4 inch flange port(s). The location was determined to be “ideal” as per AS4323.1. It was more than the required 2 duct diameters upstream from the exit. It was more than the required 6 duct diameters downstream from a junction. The sampling plane passed the flow assessment (items (a) to (f) of AS4323.1) and was therefore “compliant”.
PLANT OPERATING CONDITIONS
Plant operating conditions were supplied by Terminals Pty Ltd personnel. Plant operating conditions were representative of typical operation for the duration of sampling. Testing was performed during a benzene (BTX) ship loading operation to provide peak load rate between 1200 to 1259 PM on Friday, 5th July 2013.
TEST METHODS
The following methods are accredited with the National Association of Testing Authorities (NATA) and are approved for the sampling and analysis of gases unless otherwise stated. Specific details of the methods are available on request.
All sampling and analysis will be conducted in accordance with the test methods (TM) prescribed in NSW EPA’s Approved Methods for the Sampling and Analysis of Air Pollutants in New South Wales, Jan 2007 and in accordance with the Protection of the Environment Operations (Clean Air) Regulation 2010 unless otherwise specified. All parameters are reported adjusted to dry NTP conditions unless otherwise stated.
ParameterNSW TM
MethodSampling Method NATA Analytical Laboratory Analytical Method NATA
Analytical
Laboratory NATA
accreditaion
number
Analytical
Laboratory Report
Number(s)
Analytical
Laboratory
Report Date(s)
Selection of sampling positions TM-1 AS4323.1 Yes NA NA Yes 14601
Flow rate TM-2 USEPA 2 Yes NA NA Yes 14601
Velocity TM-2 USEPA 2 Yes NA NA Yes 14601
Temperature TM-2 USEPA 2 Yes NA NA Yes 14601
Moisture TM-22 USEPA 4 Yes NA NA Yes 14601
Solid particles TM-15 AS4323.2 YesEmission Testing
ConsultantsAS4323.2 Yes 14601
Dry gas Density TM-23 USEPA 3A YesEmission Testing
ConsultantsUSEPA 3A Yes 14601 130224r 5/07/2013
Molecular weight TM-23 USEPA 3A YesEmission Testing
ConsultantsUSEPA 3A Yes 14601
Carbon dioxide (CO2) TM-24 USEPA 3A YesEmission Testing
ConsultantsUSEPA 3A Yes 14601
Oxygen (O2) TM-25 USEPA 3A YesEmission Testing
ConsultantsUSEPA 3A Yes 14601
Carbon monoxide (CO) TM-32 USEPA 10 YesEmission Testing
ConsultantsUSEPA 10 Yes 14601
Nitrogen oxides (NOx) as NO2 TM-11 USEPA 7E YesEmission Testing
ConsultantsUSEPA 7E Yes 14601
Sulphur dioxide (SO2) TM-4 USEPA 6C YesEmission Testing
ConsultantsUSEPA 6C Yes 14601
Hydrogen sulphide (H2S) TM-5 USEPA 11 Yes SGS Australia Pty Ltd AN513 Yes 2562(4354) 60654 12/07/2013
Volatile organic compounds
(VOC)TM-34 USEPA 18 Yes SGS Australia Pty Ltd AN467 Yes 2562(4354) 60654 12/07/2013

Report prepared for:
Terminals Pty Ltd
Date: 24 July 2013
Report No: 130224r
Page: 6 of 7
DEFINITIONS
The following symbols and abbreviations are used in test reports:
BSP British standard pipe.
Concentration Mass of analyte per cubic metre expressed at NTP dry conditions (ng, µg or mg/m3).
Flow rate at discharge conditions
Volume of gas flow per unit time expressed at discharge temperature, pressure and moisture content (m3/min).
Flow rate at wet NTP conditions
Volume of gas flow per unit time expressed at 0°C, an absolute pressure of 101.325 kPa and discharge moisture content (m3/min).
Flow rate at dry NTP conditions
Volume of gas flow per unit time expressed at 0°C, an absolute pressure of 101.325 kPa and 0% moisture content (m3/min).
Mass rate Mass of analyte per unit time (µg, mg or g/min).
Moisture content
Percentage of gaseous moisture in the gas expressed on a volume / volume percentage basis. This does not include moisture in the gas stream that is in the liquid phase (free moisture).
NA Not applicable.
NTP Normal temperature and pressure. Gas volumes and concentrations are expressed on a dry basis at 0°C, at discharge oxygen concentration and an absolute pressure of 101.325 kPa, unless otherwise specified.
ppm Parts per million expressed on a volume / volume wet basis.
Sampling plane Location at which measurements were conducted.
Velocity Gas velocity expressed at discharge temperature, pressure and moisture content (m/s)
VOC Any chemical compound based on carbon in the boiling range 36 to 126°C, with a vapour pressure of at least 0.010kPa at 25°C (or having a corresponding volatility under the particular conditions of use) that adsorb onto activated charcoal and desorb into CS2, or that can be collected in a tedlar bag and be quantitatively recovered, and that are detected by GCMS. These compounds may contain oxygen, nitrogen and other elements, but specifically excluded are CO, CO2, carbonic acid, metallic carbides and carbonate salts.
> Greater than.

Report prepared for:
Terminals Pty Ltd
Date: 24 July 2013
Report No: 130224r
Page: 7 of 7
< Less than the minimum limit of detection using the specified method.
~ Approximately.
Template version 240403

Date: 11 June 2014 Report No: 140239r Page: 1 of 6 Terminals Pty Ltd Gate 38B,45 Friendship Rd Port Botany NSW 2036
Emission Testing – May 2014 EPA 4 – Benzene Combustor
Dear Mr Michael Selleck,
Tests were performed 22 May 2014 to determine emissions to air from the Benzene Combustor at the 45 Friendship Rd plant of Terminals Pty Ltd.
LICENCE COMPARISON ............................................................................ 2 EXECUTIVE SUMMARY .............................................................................. 2 RESULTS ..................................................................................................... 3
EPA 4 – Benzene Combustor ......................................................3 SAMPLING PLANE OBSERVATIONS ........................................................ 5 PLANT OPERATING CONDITIONS ............................................................ 5 TEST METHODS ......................................................................................... 5 DEFINITIONS ............................................................................................... 6
Yours faithfully Emission Testing Consultants
Steven Cooper BEng (Env)
Quality Manager [email protected]

Report prepared for:
Terminals Pty Ltd
Date: 11 June 2014
Report No: 140239r
Page: 2 of 6
LICENCE COMPARISON
Note: All analytes highlighted in green are below the Licence Limit set by the NSW EPA as per licence 1048 (last amended on 13/09/2013).
EXECUTIVE SUMMARY
Emission Testing Consultants (ETC) was engaged by Terminals Pty Ltd to perform emission monitoring as required by their NSW EPA Environment Protection Licence (number 1048). Monitoring was performed at the Benzene Combustor (Outlet), for the following parameters:
Testing commenced approximately half way through the benzene ship loading period after notification from Terminals Pty Ltd personnel. The methodologies chosen by ETC are those stipulated by Terminals Pty Ltd Licence (1048). There were no technical issues in terms of sampling on the days of testing. Plant operating conditions have been noted in the report.
EPA No.Location
DescriptionPollutant Unit of measure
Licence
limit
Detected
Values
Detected
Values (corrected to 3% O2)
Solid Particles milligrams per cubic meter (mg/m3) 50 <4 <7
Nitrogen oxides (as NO2) milligrams per cubic meter (mg/m3) 350 78 130
Volatile organic compounds (VOCs) milligrams per cubic meter (mg/m3) 20 <0.7 <1
Hydrogen Sulphide (H2S) milligrams per cubic meter (mg/m3) 5 <2 <4
4Benzene
Combustor
Discharge point
Sele
ction o
f sam
plin
g p
ositio
ns
Flo
w r
ate
Velo
city
Tem
pera
ture
Mois
ture
Part
icu
late
matt
er
Dry
gas D
ensity
Mole
cula
r w
eig
ht
Carb
on
dio
xid
e (
CO
2)
Oxyg
en
(O
2)
Carb
on
mo
no
xid
e (
CO
)
Nit
rog
en
oxid
es (
NO
x)
as N
O2
Su
lph
ur
dio
xid
e (
SO
2)
Hyd
rog
en
su
lph
ide (
H2S
)
Vo
lati
le o
rgan
ic c
om
po
un
ds (
VO
C)
EPA 4 - Benzene Combustor

Report prepared for:
Terminals Pty Ltd
Date: 11 June 2014
Report No: 140239r
Page: 3 of 6
RESULTS
EPA 4 – Benzene Combustor
22 May 2014
Flow Results M easured M W EPA 4 - Benzene Combustor 140239
Date and time of flow test 22/05/2014 11:47
Date and time of flow test 22/05/2014 12:58
Stack dimensions at sampling plane 1010 mm
Velocity at sampling plane 4.1 m/s
Average temperature 747 °C
Moisture content Alt008 2.3 % v/v
Flow rate at discharge conditions 3.3 m³/sec
Flow rate at wet NTP conditions 0.89 m³/sec
Flow rate at dry NTP conditions 0.87 m³/sec
Isokinetic Sampling Results
EPA 4 - Benzene
Combustor 140239
52
Sampling
Times
Solid Particles 1153-1255 < 4 mg/m3 < 7 mg/m3 < 0.2 g/min
No. of sampling points 12
Length of sampling, min
Stack gas molecular weight, g/g-mole (wet) 28.8
Stack gas density, at wet NTP 1.29
Concentration at NTP Mass rateConcentration at 3% O2
60
Continuous Analyser ResultsEPA 4 - Benzene
Combustor 140239
52
Sampling
Times
Oxygen (dry basis) 1155-1254 10.5 % v/v - -
Carbon dioxide (dry basis) 1155-1254 3.9 % v/v - 240 kg/hour
Dry gas density 1155-1254 1.3 kg/m3 - -
Molecular weight of stack gas, dry basis 1155-1254 29 g/g-mole - -
Nitrogen oxides as NO2 1155-1254 78 mg/m3 130 mg/m3 4.1 g/min
Sulphur dioxide as SO2 1155-1254 46 mg/m3 78 mg/m3 2.4 g/min
Carbon monoxide as CO 1155-1254 9.4 mg/m3 16 mg/m3 0.49 g/min
Concentration at NTP Concentration at 3% O2 Mass rate

Report prepared for:
Terminals Pty Ltd
Date: 11 June 2014
Report No: 140239r
Page: 4 of 6
EPA 4 – Benzene Combustor
22 May 2014
Note: If not listed above, the following compounds were not detected above the analytical range of the instrument. Please contact ETC
should you wish to discuss detection limits of specific undetected compounds; Acetone (2-propanone), Propylene Oxide, Acrylonitrile,
Methylene Chloride, MEK (2-butanone), Hexane, Ethyl Acetate, 1,2-dichloroethane, Benzene, Carbon tetrachloride, Cyclohexane, Ethyl
Acrylate, Trichloroethene (Trichloroethylene,TCE), 1,4-Dioxane, Epichlorohydrin, MIBK (4-methyl-2-pentanone), Toluene,
Tetrachloroethene (Perchloroethylene,PCE), n-Butyl Acetate, Chlorobenzene, Ethylbenzene, m/p-xylene, Styrene (Vinyl benzene), o-
xylene, Cyclohexanone, Nonane, Isopropylbenzene (Cumene), DIBK (Diisobutyl Ketone), α-Methylstyrene, Decane, Benzyl Chloride (α-
chlorotolune), Benzoyl Chloride, Naphthalene, Dodecane
Refer to “SAMPLING PLANE OBSERVATIONS” on page 5.
Manual Sampling Results
EPA 4 - Benzene
Combustor 140239
52
Sampling
Times
Hydrogen sulphide 1153-1253 < 2 mg/m3 < 4 mg/m3 < 0.1 g/min
Concentration at 3% O2Concentration at NTP Mass rate
Volatile Organic Compound (VOC) Results
EPA 4 - Benzene
Combustor 140239
52
Sampling
Times
Total VOC as n-propane 1153-1253 < 0.7 mg/m3 < 1 mg/m3 < 0.04 g/min
Concentration at NTP Mass rateConcentration at 3% O2

Report prepared for:
Terminals Pty Ltd
Date: 11 June 2014
Report No: 140239r
Page: 5 of 6
SAMPLING PLANE OBSERVATIONS
EPA 4 – Benzene Combustor (Outlet)
The sampling plane had 2 x 4 inch flange port(s). The location was determined to be “ideal” as per AS4323.1. It was more than the required 2 duct diameters upstream from the exit. It was more than the required 6 duct diameters downstream from a junction. The sampling plane passed the flow assessment (items (a) to (f) of AS4323.1) and was therefore “compliant”.
PLANT OPERATING CONDITIONS
Plant operating conditions were supplied by Terminals Pty Ltd personnel. Testing was performed during the benzene (BTX) loading operation of the ship “Golden Accord” at a time deemed to provide peak load rate.
TEST METHODS
The following methods are accredited with the National Association of Testing Authorities (NATA) and are approved for the sampling and analysis of gases unless otherwise stated. Specific details of the methods are available on request. All sampling and analysis was conducted in accordance with the test methods (TM) prescribed in NSW EPA’s Approved Methods for the Sampling and Analysis of Air Pollutants in New South Wales, Jan 2007 and in accordance with the Protection of the Environment Operations (Clean Air) Regulation 2010 unless otherwise specified. All parameters are reported adjusted to dry NTP conditions unless otherwise stated.
Sampling Analysis
NATANSW TM
MethodSampling Method NATA Analytical Laboratory Analytical Method
Analytical
Laboratory Report
Number(s)
Selection of sampling positions Yes TM-1 AS4323.1 Yes NA NA 140239r
Flow rate Yes TM-2 USEPA 2 Yes NA NA 140239r
Velocity Yes TM-2 USEPA 2 Yes NA NA 140239r
Temperature Yes TM-2 USEPA 2 Yes NA NA 140239r
Moisture Yes TM-22 USEPA 4 Yes NA NA 140239r
Particulate matter Yes TM-15 USEPA 5 YesEmission Testing
ConsultantsUSEPA 5 140239r
Dry gas Density Yes TM-23 USEPA 3 YesEmission Testing
ConsultantsUSEPA 3 140239r
Molecular weight Yes TM-23 USEPA 3 YesEmission Testing
ConsultantsUSEPA 3 140239r
Carbon dioxide (CO2) Yes TM-24 USEPA 3A YesEmission Testing
ConsultantsUSEPA 3A 140239r
Oxygen (O2) Yes TM-25 USEPA 3A YesEmission Testing
ConsultantsUSEPA 3A 140239r
Carbon monoxide (CO) Yes TM-32 USEPA 10 YesEmission Testing
ConsultantsUSEPA 10 140239r
Nitrogen oxides (NOx) as NO2 Yes TM-11 USEPA 7E YesEmission Testing
ConsultantsUSEPA 7E 140239r
Sulphur dioxide (SO2) Yes TM-4 USEPA 6C YesEmission Testing
ConsultantsUSEPA 6C 140239r
Hydrogen sulphide (H2S) Yes TM-5 USEPA 11 Yes SGS Australia Pty Ltd USEPA 11 SE128239 R0
Volatile organic compounds
(VOC)Yes TM-34 USEPA 18 Yes SGS Australia Pty Ltd AN467 SE128239 R0
Parameter

Report prepared for:
Terminals Pty Ltd
Date: 11 June 2014
Report No: 140239r
Page: 6 of 6
DEFINITIONS
The following symbols and abbreviations are used in test reports:
Concentration Mass of analyte per cubic metre expressed at NTP dry conditions (ng, µg or mg/m3).
Flow rate at discharge conditions
Volume of gas flow per unit time expressed at discharge temperature, pressure and moisture content (m3/min).
Flow rate at wet NTP conditions
Volume of gas flow per unit time expressed at 0°C, an absolute pressure of 101.325 kPa and discharge moisture content (m3/min).
Flow rate at dry NTP conditions
Volume of gas flow per unit time expressed at 0°C, an absolute pressure of 101.325 kPa and 0% moisture content (m3/min).
Mass rate Mass of analyte per unit time (µg, mg or g/min).
Moisture content
Percentage of gaseous moisture in the gas expressed on a volume / volume percentage basis. This does not include moisture in the gas stream that is in the liquid phase (free moisture).
NA Not applicable.
NTP Normal temperature and pressure. Gas volumes and concentrations are expressed on a dry basis at 0°C, at discharge oxygen concentration and an absolute pressure of 101.325 kPa, unless otherwise specified.
Sampling plane Location at which measurements were conducted.
Velocity Gas velocity expressed at discharge temperature, pressure and moisture content (m/s)
VOC Any chemical compound based on carbon in the boiling range 36 to 126°C, with a vapour pressure of at least 0.010kPa at 25°C (or having a corresponding volatility under the particular conditions of use) that adsorb onto activated charcoal and desorb into CS2, or that can be collected in a tedlar bag and be quantitatively recovered, and that are detected by GCMS. These compounds may contain oxygen, nitrogen and other elements, but specifically excluded are CO, CO2, carbonic acid, metallic carbides and carbonate salts.
> Greater than.
< Less than the minimum limit of detection using the specified method.
~ Approximately.
Template version 200613

This document is confidential and is prepared for the exclusive use of Terminals Pty Ltd
and those granted permission by Terminals Pty Ltd.
Report Number R002024
Emission Testing Report
EPA 4 - Benzene Combustor
Terminals Pty Ltd, Port Botany

Ektimo 17 December 2015
Report R002024 prepared for Terminals Pty Ltd, PORT BOTANY Page 2 of 8
Document Information
Client Name: Terminals Pty Ltd
Report Number: R002024
Date of Issue: 17 December 2015
Attention: Michael Selleck
Address: Gate 38B, 45 Friendship Rd PORT BOTANY NSW 2036 Testing Laboratory: Ektimo (ETC) ABN 74 474 273 172
Report Status
Format Document Number Report Date Prepared By Reviewed By (1) Reviewed By (2)
Preliminary Report - - - - -
Draft Report - - - - -
Final Report R002024 17/12/2015 JKr SCo ADa
Amend Report - - - - -
Template Version: 151203
Amendment Record
Document Number Initiator Report Date Section Reason
Nil - - - -
Report Authorisation
Steven Cooper Client Manager
NATA Accredited Laboratory
No. 14601
Aaron Davis Operations Manager
Accredited for compliance with ISO/IEC 17025. NATA is a signatory to the ILAC mutual recognition arrangement for the mutual recognition of the equivalence of testing, calibration and inspection reports

Ektimo 17 December 2015
Report R002024 prepared for Terminals Pty Ltd, PORT BOTANY Page 3 of 8
Table of Contents
1 Executive Summary ....................................................................................................................... 4
2 Results Summary ........................................................................................................................... 4
3 Results ........................................................................................................................................... 5
3.1 EPA 4 – Benzene Combustor ..................................................................................................................................... 5
4 Plant Operating Conditions ........................................................................................................... 7
5 Test Methods................................................................................................................................. 7
6 Quality Assurance/ Quality Control Information .......................................................................... 7
7 Definitions ..................................................................................................................................... 8

Ektimo 17 December 2015
Report R002024 prepared for Terminals Pty Ltd, PORT BOTANY Page 4 of 8
1 EXECUTIVE SUMMARY
Ektimo was engaged by Terminals Pty Ltd to perform emission monitoring as required by their NSW EPA Environment Protection Licence (number 1048).
Results from the testing program indicate that Terminals Pty Ltd was within the requirements of the Licence during the sampling period.
Monitoring was performed as follows;
Location Test Date Test Parameters*
EPA 4 – Benzene Combustor 2 December 2015 Solid particles, carbon dioxide, oxygen, carbon monoxide, nitrogen oxides, sulfur dioxide, hydrogen sulfide, speciated volatile organic compounds
* Flow rate, velocity, temperature and moisture were determined unless otherwise stated
Testing commenced approximately half way through the benzene ship loading period after notification from Terminals Pty Ltd personnel.
The methodologies chosen by Ektimo are those recommended by the NSW Office of Environment and Heritage (as specified in the Approved Methods for the Sampling and Analysis of Air Pollutants in New South Wales, January 2007).
Plant operating conditions have been noted in the report.
2 RESULTS SUMMARY
The following licence comparison table shows that all analytes highlighted in green are below the licence limit set by the NSW EPA as per licence 1048 (last amended on 30/07/2014).
Detected valuesDetected values
(corrected to 3% O2)
2/12/2015 2/12/2015
Solid Particles mg/m3 50 <1 <1.8
Nitrogen oxides (as NO2) mg/m3 350 47 81
Volatile organic compounds (VOCs) mg/m3 20 0.25 0.43
Hydrogen Sulfide (H2S) mg/m3 5 <0.0043 <0.0075
Location DescriptionEPA No.Licence
limit Parameter Units
4 Benzene Combustor

Ektimo 17 December 2015
Report R002024 prepared for Terminals Pty Ltd, PORT BOTANY Page 5 of 8
3 RESULTS
3.1 EPA 4 – Benzene Combustor
Date Client Terminals Pty Ltd
Report Stack ID EPA 4 Benzene Combustor Stack
Licence No. Location Port Botany State NSW
Ektimo Staff Swo/Dhi
Process Conditions Please refer to client records.
Reason for testing: Client requested testing to determine emissions to air
space space space space space space space space space space space
Sampling Plane Details
Sampling plane dimensions
Sampling plane area
Sampling port size, number & depth
Access & height of ports Fixed ladder 9 m
Duct orientation & shape Vertical Circular
Downstream disturbance Exit 3 D
Upstream disturbance Change in diameter 2 D
No. traverses & points sampled 2 16
Compliance to AS4323.1
space space space space space space space space space space space
Comments
The sampling plane is too near to the upstream disturbance but is greater than or equal to 2D
space space space space space space space space space space space
Stack Parameters
Moisture content, %v/v 12
Gas molecular weight, g/g mole 28.0 (wet) 29.3 (dry)
Gas density at STP, kg/m³ 1.25 (wet) 1.31 (dry)
% Oxygen correction & Factor 3 % 1.72
Gas Flow Parameters
Temperature, °C 974
Velocity at sampling plane, m/s 11
Volumetric flow rate, discharge, m³/s 8.9
Volumetric flow rate (wet STP), m³/s 2
Volumetric flow rate (dry STP), m³/s 1.7
Mass flow rate (wet basis), kg/hour 8800
Sampling time, min 80
Isokinetic rate, % 95
Velocity difference, % <1
space space space space space space space space space space space
Isokinetic
Sampling time
Concentration
Corrected to
3% O2 M ass Rate
mg/m³ mg/m³ g/min
Solid particles <1 <1.8 <0.11
space space space space space space space space space space space
Hydrogen Sulfide
Sampling time
Concentration
Corrected to
3% O2 M ass Rate
mg/m³ mg/m³ g/min
Hydrogen sulfide <0.0043 <0.0075 <0.00045
Results
0825-0955
2/12/2015
R002024
Results
1048
4" Flange (x2)
Compliant but non-ideal
1010 mm
0.801 m²
0835-0935

Ektimo 17 December 2015
Report R002024 prepared for Terminals Pty Ltd, PORT BOTANY Page 6 of 8
Date Client Terminals Pty Ltd
Report Stack ID EPA 4 Benzene Combustor Stack
Licence No. Location Port Botany State NSW
Ektimo Staff Swo/Dhi
Process Conditions Please refer to client records.
Reason for testing: Client requested testing to determine emissions to air
space space space space space space space space space space space
Gases
Sampling time
Concentration
Corrected to 3%
O2 M ass Rate Concentration
Corrected to
3% O2 M ass Rate Concentration
Corrected to
3% O2 M ass Rate
mg/m³ mg/m³ g/min mg/m³ mg/m³ g/min mg/m³ mg/m³ g/min
Nitrogen oxides (as NO2) 47 81 4.9 12 21 1.3 92 160 9.6
Sulfur dioxide 37 64 3.9 <5.7 <9.8 <0.59 94 160 9.8
Carbon monoxide 13 23 1.4 8.7 15 0.91 19 32 1.9
Concentration Concentration Concentration
% % %
Carbon dioxide 4.7 4.1 5.1
Oxygen 10.5 8.9 11.9
space space space space space space space space space space space
Total VOCs*
(as n-Propane) Sampling time
Concentration
Corrected to
3% O2 M ass Rate
mg/m³ mg/m³ g/min
Total 0.25 0.42 0.025
VOC's (speciated)
Sampling time
Concentration
Corrected to
3% O2 M ass Rate
mg/m³ mg/m³ g/min
Detection limit(1)
<0.062 <0.11 <0.0064
Acetone 0.32 0.56 0.034
space space space space space space space space space space space
(1) Unless o therwise repo rted, the fo llo wing target co mpo unds were fo und to be belo w detect io n:
0830-0930
842-941
Maximum
2/12/2015
R002024
1048
842-941
Results0830-0930
Ethanol, Isopropanol, Isobutanol, Butanol, 1-M ethoxy-2-propanol, Cyclohexanol, 2-Butoxyethanol, Pentane, Hexane, Heptane, Octane, Nonane, Decane, Undecane, Dodecane, Tridecane,
Tetradecane, Cyclohexane, 2-M ethylhexane, 2,3-Dimethylpentane, 3-M ethylhexane, Isooctane, M ethylcyclohexane, alpha-Pinene, beta-Pinene, d-Limonene, 3-Carene, Acetone, M ethyl ethyl
ketone, Ethyl acetate, Isopropyl acetate, Propyl acetate, M IBK, 2-Hexanone, Butyl acetate, 1-M ethoxy-2-propyl acetate, Cyclohexanone, Celloso lve acetate, 2-Butoxyethyl acetate, Ethyldiglyco l
acetate, Diacetone alcohol, Isophorone, Benzene, Toluene, Ethylbenzene, m+p-Xylene, Styrene, o-Xylene, Isopropylbenzene, Propylbenzene, 1,3,5-Trimethylbenzene, alpha-M ethylstyrene, tert-
Butylbenzene, 1,2,4-Trimethylbenzene, 1,2,3-Trimethylbenzene, m-Diethylbenzene, o-Diethylbenzene, p-Diethylbenzene, Dichloromethane, Chloroform, 1,1,1-Trichloroethane, 1,2-Dichloroethane,
Carbon tetrachloride, 1,1-Dichloroethene, cis-1,2-Dichloroethene, trans-1,2-Dichloroethene, Trichloroethene, Tetrachloroethene, 1,1,2-Trichloroethane, 1,1,2,2-Tetrachloroethane, Chlorobenzene,
Fluorobenzene
Results
842-941
MinimumAverage
*Total VOCs does not include methane

Ektimo 17 December 2015
Report R002024 prepared for Terminals Pty Ltd, PORT BOTANY Page 7 of 8
4 PLANT OPERATING CONDITIONS
Unless otherwise stated, the plant operating conditions were normal at the time of testing. See Terminals Pty
Ltd’s records for complete process conditions.
5 TEST METHODS
All sampling and analysis was performed by Ektimo unless otherwise specified. Specific details of the
methods are available upon request
* Uncertainty values cited in this table are calculated at the 95% confidence level (coverage factor = 2)
6 QUALITY ASSURANCE/ QUALITY CONTROL INFORMATION
Ektimo (EML) and Ektimo (ETC) are accredited by the National Association of Testing Authorities (NATA) for
the sampling and analysis of air pollutants from industrial sources. Unless otherwise stated test methods
used are accredited with the National Association of Testing Authorities. For full details, search for Ektimo at
NATA’s website www.nata.com.au.
Ektimo (EML) and Ektimo (ETC) are accredited by NATA (National Association of Testing Authorities) to
ISO/IEC 17025. – General Requirements for the Competence of Testing and Calibration Laboratories. ISO/IEC
17025 requires that a laboratory have adequate equipment to perform the testing, as well as laboratory
personnel with the competence to perform the testing. This quality assurance system is administered and
maintained by the Compliance Manager.
NATA is a member of APLAC (Asia Pacific Laboratory Accreditation Co-operation) and of ILAC (International
Laboratory Accreditation Co-operation). Through the mutual recognition arrangements with both of these
organisations, NATA accreditation is recognised world –wide.
A formal Quality Control program is in place at Ektimo to monitor analyses performed in the laboratory and
sampling conducted in the field. The program is designed to check where appropriate; the sampling
reproducibility, analytical method, accuracy, precision and the performance of the analyst. The Laboratory
Manager is responsible for the administration and maintenance of this program.

Ektimo 17 December 2015
Report R002024 prepared for Terminals Pty Ltd, PORT BOTANY Page 8 of 8
7 DEFINITIONS
The following symbols and abbreviations may be used in this test report:
STP Standard temperature and pressure. Gas volumes and concentrations are expressed on a dry basis at 0°C, at discharge oxygen concentration and an absolute pressure of 101.325 kPa, unless otherwise specified.
Disturbance A flow obstruction or instability in the direction of the flow which may impede accurate flow determination. This includes centrifugal fans, axial fans, partially closed or closed dampers, louvres, bends, connections, junctions, direction changes or changes in pipe diameter.
VOC Any chemical compound based on carbon with a vapour pressure of at least 0.010 kPa at 25°C or having a corresponding volatility under the particular conditions of use. These compounds may contain oxygen, nitrogen and other elements, but specifically excluded are carbon monoxide, carbon dioxide, carbonic acid, metallic carbides and carbonate salts.
TOC The sum of all compounds of carbon which contain at least one carbon to carbon bond, plus methane and its derivatives.
OU The number of odour units per unit of volume. The numerical value of the odour concentration is equal to the number of dilutions to arrive at the odour threshold (50% panel response).
PM2.5 Atmospheric suspended particulate matter having an equivalent aerodynamic diameter of less than approximately 2.5 microns (µm).
PM10 Atmospheric suspended particulate matter having an equivalent aerodynamic diameter of less than approximately 10 microns (µm).
BSP British standard pipe NT Not tested or results not required NA Not applicable D50 ‘Cut size’ of a cyclone defined as the particle diameter at which the cyclone achieves a 50%
collection efficiency ie. half of the particles are retained by the cyclone and half are not and pass through it to the next stage. The D50 method simplifies the capture efficiency distribution by assuming that a given cyclone stage captures all of the particles with a diameter equal to or greater than the D50 of that cyclone and less than the D50 of the preceding cyclone.
D Duct diameter or equivalent duct diameter for rectangular ducts < Less than > Greater than ≥ Greater than or equal to ~ Approximately CEM Continuous Emission Monitoring CEMS Continuous Emission Monitoring System DER WA Department of Environment & Regulation DECC Department of Environment & Climate Change (NSW) EPA Environment Protection Authority FTIR Fourier Transform Infra Red NATA National Association of Testing Authorities RATA Relative Accuracy Test Audit AS Australian Standard USEPA United States Environmental Protection Agency Vic EPA Victorian Environment Protection Authority ISC Intersociety committee, Methods of Air Sampling and Analysis ISO International Organisation for Standardisation APHA American public health association, Standard Methods for the Examination of Water and
Waste Water CARB Californian Air Resources Board TM Test Method OM Other approved method CTM Conditional test method VDI Verein Deutscher Ingenieure (Association of German Engineers) NIOSH National Institute of Occupational Safety and Health XRD X-ray Diffractometry

This document is confidential and is prepared for the exclusive use of Terminals Pty Ltd
and those granted permission by Terminals Pty Ltd.
Report Number R001400
Emission Testing Report
EPA 4 - Benzene Combustor
Terminals Pty Ltd, Port Botany

Ektimo 29 July 2015
Report R001400 prepared for Terminals Pty Ltd, PORT BOTANY Page 2 of 8
Document Information
Client Name: Terminals Pty Ltd
Report Number: R001400
Date of Issue: 29 July 2015
Attention: Michael Selleck
Address: Gate 38B, 45 Friendship Rd PORT BOTANY NSW 2036 Testing Laboratory: Ektimo (ETC) ABN 74 474 273 172
Report Status
Format Document Number Report Date Prepared By Reviewed By (1) Reviewed By (2)
Preliminary Report - - - - -
Draft Report - - - - -
Final Report R001400 29 July 2015 JK AD SC
Amend Report - - - - -
Template Version: 150615
Amendment Record
Document Number Initiator Report Date Section Reason
Nil - - - -
Report Authorisation
Steven Cooper Client Manager
NATA Accredited Laboratory
No. 14601
Aaron Davis Operations Manager
Accredited for compliance with ISO/IEC 17025. NATA is a signatory to the ILAC mutual recognition arrangement for the mutual recognition of the equivalence of testing, calibration and inspection reports

Ektimo 29 July 2015
Report R001400 prepared for Terminals Pty Ltd, PORT BOTANY Page 3 of 8
Table of Contents
1 Licence Comparison ...................................................................................................................... 4
2 Executive Summary ....................................................................................................................... 4
3 Results ........................................................................................................................................... 5
3.1 EPA 4 – Benzene Combustor ..................................................................................................................................... 5
4 Plant Operating Conditions ........................................................................................................... 7
5 Test Methods................................................................................................................................. 7
6 Quality Assurance/ Quality Control Information .......................................................................... 7
7 Definitions ..................................................................................................................................... 8

Ektimo 29 July 2015
Report R001400 prepared for Terminals Pty Ltd, PORT BOTANY Page 4 of 8
1 LICENCE COMPARISON
Note: All analytes highlighted in green are below the Licence Limit set by the NSW EPA as per licence 1048 (last amended on 30/07/2014).
2 EXECUTIVE SUMMARY
Ektimo was engaged by Terminals Pty Ltd to perform emission monitoring as required by their NSW EPA Environment Protection Licence (number 1048).
Monitoring was performed as follows;
Location Test Date Test Parameters*
EPA 4 – Benzene Combustor 21 July 2015 Solid particles, carbon dioxide, oxygen, carbon monoxide, nitrogen oxides, sulfur dioxide, hydrogen sulfide, speciated volatile organic compounds
* Flow rate, velocity, temperature and moisture were determined unless otherwise stated
Testing commenced approximately half way through the benzene ship loading period after notification from Terminals Pty Ltd personnel.
It is noted that during sampling (between 1453 and 1508) a hexane truck was connected to the Combustor Inlet.
The methodologies chosen by Ektimo are those recommended by the NSW Office of Environment and
Heritage (as specified in the Approved Methods for the Sampling and Analysis of Air Pollutants in New South
Wales, January 2007).
Plant operating conditions have been noted in the report.
EPA Parameter Units Licence limit Detected values
21/07/2015
Solid Particles mg/m3 50 < 0.94 < 1.5
Nitrogen oxides (as NO2) mg/m3 350 84 140
Volatile organic compounds (VOCs) mg/m3 20 <0.073 <0.12
Hydrogen Sulfide (H2S) mg/m3 5 0.0035 0.0056
Detected values
(corrected to 3% O2) Location Description
Benzene Combustor4

Ektimo 29 July 2015
Report R001400 prepared for Terminals Pty Ltd, PORT BOTANY Page 5 of 8
3 RESULTS
3.1 EPA 4 – Benzene Combustor
Date Client Terminals Pty Ltd
Report Stack ID EPA 4 - Benzene Combustor
Licence No. Location Port Botany State NSW
Ektimo Staff Sco/Swo
Process Conditions Please refer to client records.
Reason for testing: Client requested testing to determine emissions to air
space space space space space space space space space space space
Sampling Plane Details
Sampling plane dimensions
Sampling plane area
Sampling port size, number & depth
Access & height of ports Fixed ladder 9 m
Duct orientation & shape Vertical Circular
Downstream disturbance Exit 3 D
Upstream disturbance Change in diameter 2 D
No. traverses & points sampled 2 16
Compliance to AS4323.1
space space space space space space space space space space space
Comments
The sampling plane is too near to the upstream disturbance but is greater than or equal to 2D
Unless otherwise indicated, the methods cited in this report have been performed without deviation
All results reported on a dry basis at STP
space space space space space space space space space space space
Stack Parameters
Moisture content, %v/v 8.2
Gas molecular weight, g/g mole 28.4 (wet) 29.3 (dry)
Gas density at STP, kg/m³ 1.27 (wet) 1.31 (dry)
% Oxygen correction & Factor 3 % 1.61
space space space space space space space space space space space
Gas Flow Parameters
Temperature, °C 940
Velocity at sampling plane, m/s 7.9
Volumetric flow rate, discharge, m³/s 6.3
Volumetric flow rate (wet STP), m³/s 1.4
Volumetric flow rate (dry STP), m³/s 1.3
Mass flow rate (wet basis), kg/hour 6500
Sampling time, min 80
Isokinetic rate, % 107
Velocity difference, % -10
space space space space space space space space space space space
Isokinetic
Sampling time
Concentration Corrected to 3% O2 M ass Rate
mg/m³ mg/m³ g/min
Solid particles <0.94 <1.5 <0.074
space space space space space space space space space space space
Non-isokinetics
Sampling time
Concentration Corrected to 3% O2 M ass Rate
mg/m³ mg/m³ g/min
Hydrogen sulfide 0.0035 0.0056 0.00027
space space space space space space space space space space space
Gases
Sampling time
Concentration
Corrected to 3%
O2 M ass Rate Concentration Corrected to 3% O2 M ass Rate Concentration
Corrected to 3%
O2 M ass Rate
mg/m³ mg/m³ g/min mg/m³ mg/m³ g/min mg/m³ mg/m³ g/min
Nitrogen oxides (as NO2) 84 140 6.6 51 83 4 180 300 14
Sulfur dioxide 98 160 7.7 74 120 5.8 130 210 10
Carbon monoxide 18 29 1.4 <2.5 <4 <0.19 32 52 2.5
Concentration Concentration Concentration
% % %
Carbon dioxide 4.9 3.4 5.8
Oxygen 9.8 5.4 13.3
1436-1535
Maximum
Results
1435-1555
21/07/2015
R001400
Results
1048
4" Flange (x2)
Compliant but non-ideal
1436-1535 1436-1535
Average Minimum
1010 mm
0.801 m²
1435-1535

Ektimo 29 July 2015
Report R001400 prepared for Terminals Pty Ltd, PORT BOTANY Page 6 of 8
Total VOC's
(as n-Propane) Sampling time
Concentration Corrected to 3% O2 M ass Rate
mg/m³ mg/m³ g/min
Total <0.073 <0.12 <0.0057
space space space space space space space space space space space
VOC's (speciated)
Sampling time
Concentration Corrected to 3% O2 M ass Rate
mg/m³ mg/m³ g/min
Detection limit(1)
<0.076 <0.12 <0.0059
space space space space space space space space space space space
(1) Unless o therwise repo rted, the fo llo wing target co mpo unds were fo und to be belo w detect io n:
1435-1535
Results
1435-1535
Ethanol, Isopropanol, Isobutanol, Butanol, 1-M ethoxy-2-propanol, Cyclohexanol, 2-Butoxyethanol, Pentane, Hexane, Heptane, Octane, Nonane, Decane, Undecane, Dodecane, Tridecane, Tetradecane,
Cyclohexane, 2-M ethylhexane, 2,3-Dimethylpentane, 3-M ethylhexane, Isooctane, M ethylcyclohexane, alpha-Pinene, beta-Pinene, d-Limonene, 3-Carene, Acetone, M ethyl ethyl ketone, Ethyl acetate, Isopropyl
acetate, Propyl acetate, M IBK, 2-Hexanone, Butyl acetate, 1-M ethoxy-2-propyl acetate, Cyclohexanone, Cellosolve acetate, 2-Butoxyethyl acetate, Ethyldiglycol acetate, Diacetone alcohol, Isophorone, Benzene,
Toluene, Ethylbenzene, m+p-Xylene, Styrene, o-Xylene, Isopropylbenzene, Propylbenzene, 1,3,5-Trimethylbenzene, alpha-M ethylstyrene, tert-Butylbenzene, 1,2,4-Trimethylbenzene, 1,2,3-Trimethylbenzene, m-
Diethylbenzene, o-Diethylbenzene, p-Diethylbenzene, Dichloromethane, Chloroform, 1,1,1-Trichloroethane, 1,2-Dichloroethane, Carbon tetrachloride, 1,1-Dichloroethene, cis-1,2-Dichloroethene, trans-1,2-
Dichloroethene, Trichloroethene, Tetrachloroethene, 1,1,2-Trichloroethane, 1,1,2,2-Tetrachloroethane, Chlorobenzene, Fluorobenzene
Results
Date Client Terminals Pty Ltd
Report Stack ID EPA 4 - Benzene Combustor
Licence No. Location Port Botany State NSW
Ektimo Staff Sco/Swo
Process Conditions Please refer to client records.
Reason for testing: Client requested testing to determine emissions to air
21/07/2015
R001400
1048

Ektimo 29 July 2015
Report R001400 prepared for Terminals Pty Ltd, PORT BOTANY Page 7 of 8
4 PLANT OPERATING CONDITIONS
Unless otherwise stated, the plant operating conditions were normal at the time of testing. See Terminals Pty
Ltd’s records for complete process conditions.
5 TEST METHODS
All sampling and analysis was performed by Ektimo unless otherwise specified. Specific details of the
methods are available upon request
* Uncertainty values cited in this table are calculated at the 95% confidence level (coverage factor = 2)
6 QUALITY ASSURANCE/ QUALITY CONTROL INFORMATION
Ektimo (EML), Ektimo (ETC) and Ektimo (ECS) are accredited by the National Association of Testing Authorities
(NATA) for the sampling and analysis of air pollutants from industrial sources. Unless otherwise stated test
methods used are accredited with the National Association of Testing Authorities. For full details, search for
Ektimo at NATA’s website www.nata.com.au.
Ektimo (EML), Ektimo (ETC) and Ektimo (ECS) are accredited by NATA (National Association of Testing
Authorities) to ISO/IEC 17025. – General Requirements for the Competence of Testing and Calibration
Laboratories. ISO/IEC 17025 requires that a laboratory have adequate equipment to perform the testing, as
well as laboratory personnel with the competence to perform the testing. This quality assurance system is
administered and maintained by the Compliance Manager.
NATA is a member of APLAC (Asia Pacific Laboratory Accreditation Co-operation) and of ILAC (International
Laboratory Accreditation Co-operation). Through the mutual recognition arrangements with both of these
organisations, NATA accreditation is recognised world –wide.
A formal Quality Control program is in place at Ektimo to monitor analyses performed in the laboratory and
sampling conducted in the field. The program is designed to check where appropriate; the sampling
reproducibility, analytical method, accuracy, precision and the performance of the analyst. The Laboratory
Manager is responsible for the administration and maintenance of this program.
Sampling Analysis
Sample plane criteria NSW TM-1 NA - NA
Velocity NSW TM-2 2ms-1 7% NA
Temperature NSW TM-2 0°C 2% NA
Flow rate NSW TM-2 Location
specific
8% NA
Sulfur dioxide NSW TM-4 6mg/m³ 12%
Hydrogen sulfide NSW TM-5 0.5mg/m³ not specified
Nitrogen oxides (NOx) NSW TM-11 4mg/m³ 12%
Solid particles NSW TM-15 0.001g/m³ 5%
Moisture content NSW TM-22 0.40% 8%
Carbon dioxide NSW TM-24 0.1% 13%
Oxygen NSW TM-25 0.1% 13%
Carbon monoxide NSW TM-32 0.0025g/m³ 12%
Speciated volatile organic compounds
(VOC’s)
NSW TM-34 0.3mg/m³ 19%
Parameter Test Method Method
Detection Limit
Uncertainty* NATA Accredited

Ektimo 29 July 2015
Report R001400 prepared for Terminals Pty Ltd, PORT BOTANY Page 8 of 8
7 DEFINITIONS
The following symbols and abbreviations may be used in this test report:
STP Standard temperature and pressure. Gas volumes and concentrations are expressed on a dry basis at 0°C, at discharge oxygen concentration and an absolute pressure of 101.325 kPa, unless otherwise specified.
Disturbance A flow obstruction or instability in the direction of the flow which may impede accurate flow determination. This includes centrifugal fans, axial fans, partially closed or closed dampers, louvres, bends, connections, junctions, direction changes or changes in pipe diameter.
VOC Any chemical compound based on carbon with a vapour pressure of at least 0.010 kPa at 25°C or having a corresponding volatility under the particular conditions of use. These compounds may contain oxygen, nitrogen and other elements, but specifically excluded are carbon monoxide, carbon dioxide, carbonic acid, metallic carbides and carbonate salts.
TOC The sum of all compounds of carbon which contain at least one carbon to carbon bond, plus methane and its derivatives.
OU The number of odour units per unit of volume. The numerical value of the odour concentration is equal to the number of dilutions to arrive at the odour threshold (50% panel response).
PM2.5 Atmospheric suspended particulate matter having an equivalent aerodynamic diameter of less than approximately 2.5 microns (µm).
PM10 Atmospheric suspended particulate matter having an equivalent aerodynamic diameter of less than approximately 10 microns (µm).
BSP British standard pipe NT Not tested or results not required NA Not applicable D50 ‘Cut size’ of a cyclone defined as the particle diameter at which the cyclone achieves a 50%
collection efficiency ie. half of the particles are retained by the cyclone and half are not and pass through it to the next stage. The D50 method simplifies the capture efficiency distribution by assuming that a given cyclone stage captures all of the particles with a diameter equal to or greater than the D50 of that cyclone and less than the D50 of the preceding cyclone.
D Duct diameter or equivalent duct diameter for rectangular ducts < Less than > Greater than ≥ Greater than or equal to ~ Approximately CEM Continuous Emission Monitoring CEMS Continuous Emission Monitoring System DER WA Department of Environment & Regulation DECC Department of Environment & Climate Change (NSW) EPA Environment Protection Authority FTIR Fourier Transform Infra Red NATA National Association of Testing Authorities RATA Relative Accuracy Test Audit AS Australian Standard USEPA United States Environmental Protection Agency Vic EPA Victorian Environment Protection Authority ISC Intersociety committee, Methods of Air Sampling and Analysis ISO International Organisation for Standardisation APHA American public health association, Standard Methods for the Examination of Water and
Waste Water CARB Californian Air Resources Board TM Test Method OM Other approved method CTM Conditional test method VDI Verein Deutscher Ingenieure (Association of German Engineers) NIOSH National Institute of Occupational Safety and Health XRD X-ray Diffractometry

This document is confidential and is prepared for the exclusive use of Terminals Pty Ltd
and those granted permission by Terminals Pty Ltd.
Report Number R002940
Emission Testing Report
EPA 4 – Benzene Combustor
Terminals Pty Ltd, Port Botany

Ektimo 15 August 2016
Report R002940 prepared for Terminals Pty Ltd, Port Botany Page 2 of 7
Document Information
Client Name: Terminals Pty Ltd
Report Number: R002940
Date of Issue: 15 August 2016
Attention: Brent Geeves
Address: Gate 38B, 45 Friendship Rd PORT BOTANY NSW 2036 Testing Laboratory: Ektimo (ETC) ABN 74 474 273 172
Report Status
Format Document Number Report Date Prepared By Reviewed By (1) Reviewed By (2)
Preliminary Report - - - - -
Draft Report R002940[DRAFT] 9/08/2016 JWe SWo/DHi SCo
Final Report R002940 15/08/2016 JWe SWo/DHi SCo
Amend Report - - - - -
Template Version: 160728
Amendment Record
Document Number Initiator Report Date Section Reason
Nil - - - -
Report Authorisation
Steven Cooper Client Manager
NATA Accredited Laboratory
No. 14601
Accredited for compliance with ISO/IEC 17025. NATA is a signatory to the ILAC mutual recognition arrangement for the mutual
recognition of the equivalence of testing, calibration and inspection reports

Ektimo 15 August 2016
Report R002940 prepared for Terminals Pty Ltd, Port Botany Page 3 of 7
Table of Contents
1 Executive Summary ....................................................................................................................... 4
2 Results Summary ........................................................................................................................... 4
3 Results ........................................................................................................................................... 5
3.1 EPA 4 – Benzene Combustor ..................................................................................................................................... 5
4 Plant Operating Conditions ........................................................................................................... 6
5 Test Methods................................................................................................................................. 6
6 Quality Assurance/ Quality Control Information .......................................................................... 6
7 Definitions ..................................................................................................................................... 7

Ektimo 15 August 2016
Report R002940 prepared for Terminals Pty Ltd, Port Botany Page 4 of 7
1 EXECUTIVE SUMMARY
Ektimo was engaged by Terminals Pty Ltd to perform emission monitoring as required by their NSW EPA Environment Protection Licence (number 1048).
Results from the testing program indicate that Terminals Pty Ltd was within the requirements of the Licence during the sampling period.
Monitoring was performed as follows:
Location Test Date Test Parameters*
EPA 4 – Benzene Combustor 1 August 2016 Speciated volatile organic compounds (VOC’s), carbon dioxide, oxygen, carbon monoxide, nitrogen oxides
* Flow rate, velocity, temperature and moisture were determined unless otherwise stated
Sampling was conducted when the benzene combustor was treating displaced gas from a BTEX tanker.
The sampling methodologies chosen by Ektimo are those recommended by the NSW Office of Environment and Heritage (as specified in the Approved Methods for the Sampling and Analysis of Air Pollutants in New South Wales, January 2007).
All results are reported on a dry basis at STP. Unless otherwise indicated, the methods cited in this report have been performed without deviation.
Plant operating conditions have been noted in the report.
2 RESULTS SUMMARY
The following licence comparison table shows that all analytes highlighted in green are below the licence limit set by the NSW EPA as per licence 1048 (last amended on 23/02/2016).
Detected valuesDetected values
(corrected to 3% O2)
01-08-16 01-08-16
Nitrogen oxides (as NO2) mg/m3 350 190 280
Volatile organic compounds (VOCs) mg/m3 20 <0.1 <0.2
Benzene mg/m3 1 <0.1 <0.2
Location DescriptionEPA No.Licence
limit Parameter Units
4 Benzene Combustor

Ektimo 15 August 2016
Report R002940 prepared for Terminals Pty Ltd, Port Botany Page 5 of 7
3 RESULTS
3.1 EPA 4 – Benzene Combustor
Date Client Terminals Pty Ltd
Report Stack ID EPA 4 - Benzene Combustor Stack
Licence No. Location Port Botany State NSW
Ektimo Staff Scott Woods
Process Conditions Please refer to client records.
space space space space space space space space space space space
Sampling Plane Details
Sampling plane dimensions
Sampling plane area
Sampling port size, number
Access & height of ports Fixed ladder 9 m
Duct orientation & shape Vertical Circular
Downstream disturbance Exit 3 D
Upstream disturbance Change in diameter 2 D
No. traverses & points sampled 2 16
Compliance of sample plane to AS4323.1
space space space space space space space space space space space
Comments
The sampling plane is deemed to be non-ideal or non-compliant due to the following reasons:
space space space space space space space space space space space
Stack Parameters
Moisture content, %v/v 8.2
Gas molecular weight, g/g mole 28.7 (wet) 29.6 (dry)
Gas density at STP, kg/m³ 1.28 (wet) 1.32 (dry)
% Oxygen correction & Factor 3 % 1.51
Gas Flow Parameters
Measurement time (hhmm) 1720
Temperature, °C 781
Velocity at sampling plane, m/s 8.7
Volumetric flow rate, discharge, m³/s 7
Volumetric flow rate (wet STP), m³/s 1.8
Volumetric flow rate (dry STP), m³/s 1.7
Mass flow rate (wet basis), kg/hour 8400
space space space space space space space space space space space
Gases
Sampling time
Concentration
Corrected to 3%
O2 M ass Rate Concentration
Corrected to 3%
O2 M ass Rate Concentration
Corrected to 3%
O2 M ass Rate
mg/m³ mg/m³ g/min mg/m³ mg/m³ g/min mg/m³ mg/m³ g/min
Nitrogen oxides (as NO2) 190 280 19 80 120 8 360 550 36
Concentration Concentration Concentration
% % %
Carbon dioxide 7.1 1.2 12.5
Oxygen 9.1 0.4 18.7
space space space space space space space space space space space
Total VOCs*
(as n-Propane) Sampling time
Concentration
Corrected to 3%
O2 M ass Rate
mg/m³ mg/m³ g/min
Total <0.1 <0.2 <0.01
space space space space space space space space space
VOC's (speciated)
Sampling time
Concentration
Corrected to 3%
O2 M ass Rate
mg/m³ mg/m³ g/min
Detection limit(1)
<0.1 <0.2 <0.01
Benzene <0.1 <0.2 <0.01
(1) Unless otherwise reported, the following target compounds were found to be below detection:
Results
1720-1820
Average
1721-1819
1-08-2016
R002940
1048
4" Flange (x2)
Compliant but non-ideal
1010 mm
0.801 m²
Minimum
1721-1819
Maximum
1721-1819
Ethanol, Isopropanol, Isobutanol, Butanol, 1-M ethoxy-2-propanol, Cyclohexanol, 2-Butoxyethanol, Pentane, Hexane, Heptane, Octane, Nonane, Decane, Undecane, Dodecane, Tridecane, TetradecaneTetradecane, Cyclohexane, 2-
M ethylhexane, 2,3-Dimethylpentane, 3-M ethylhexane, Isooctane, M ethylcyclohexane, alpha-Pinene, beta-Pinene, d-Limonene, 3-Carene3-Carene, Acetone, M ethyl ethyl ketone, Ethyl acetate, Isopropyl acetate, Propyl acetate, M IBK,
2-Hexanone, Butyl acetate, 1-M ethoxy-2-propyl acetate, Cyclohexanone, Cyclohexanone, Celloso lve acetate, 2-Butoxyethyl acetate, Ethyldiglyco l acetate, Diacetone alcohol, Isophorone, Benzene, Toluene, Ethylbenzene, m+p-Xylene,
Styrene, o-Xylene, Isopropylbenzene, Propylbenzene, 1,3,5-Trimethylbenzene, alpha-M ethylstyrene, alpha-M ethylstyrene, tert-Butylbenzene, 1,2,4-Trimethylbenzene, 1,2,3-Trimethylbenzene, m-Diethylbenzene, o-Diethylbenzene, p-
Diethylbenzene, Dichloromethane, Chloroform, 1,1,1-Trichloroethane, 1,2-Dichloroethane, Carbon tetrachloride, 1,1-Dichloroethene, cis-1,2-Dichloroethene, trans-1,2-Dichloroethene, Trichloroethene, Tetrachloroethene,
Tetrachloroethene, 1,1,2-Trichloroethane, 1,1,2,2-Tetrachloroethane, Chlorobenzene, Fluorobenzene
Results
1720-1820
The sampling plane is too near to the upstream disturbance but is greater than or equal to 2D

Ektimo 15 August 2016
Report R002940 prepared for Terminals Pty Ltd, Port Botany Page 6 of 7
4 PLANT OPERATING CONDITIONS
Unless otherwise stated, the plant operating conditions were normal at the time of testing. See Terminals Pty
Ltd’s records for complete process conditions.
5 TEST METHODS
All sampling and analysis was performed by Ektimo unless otherwise specified. Specific details of the
methods are available upon request.
1. Analysis performed by Ektimo (EML Air), NATA accreditation number 2732. Results were reported to Ektimo on 4 August 2016 in
report number R002940_SVOCs
6 QUALITY ASSURANCE/ QUALITY CONTROL INFORMATION
Ektimo (EML) and Ektimo (ETC) are accredited by the National Association of Testing Authorities (NATA) for
the sampling and analysis of air pollutants from industrial sources. Unless otherwise stated test methods
used are accredited with the National Association of Testing Authorities. For full details, search for Ektimo at
NATA’s website www.nata.com.au.
Ektimo (EML) and Ektimo (ETC) are accredited by NATA (National Association of Testing Authorities) to
ISO/IEC 17025. – General Requirements for the Competence of Testing and Calibration Laboratories. ISO/IEC
17025 requires that a laboratory have adequate equipment to perform the testing, as well as laboratory
personnel with the competence to perform the testing. This quality assurance system is administered and
maintained by the Compliance Manager.
NATA is a member of APLAC (Asia Pacific Laboratory Accreditation Co-operation) and of ILAC (International
Laboratory Accreditation Co-operation). Through the mutual recognition arrangements with both of these
organisations, NATA accreditation is recognised world –wide.
A formal Quality Control program is in place at Ektimo to monitor analyses performed in the laboratory and
sampling conducted in the field. The program is designed to check where appropriate; the sampling
reproducibility, analytical method, accuracy, precision and the performance of the analyst. The Laboratory
Manager is responsible for the administration and maintenance of this program.
Sampling Method Analysis Method Uncertainty*
Sampling Analysis
NSW TM-1 NA NA - NA
NSW TM-22 NSW TM-22 0.4% 19%
NSW TM-2 NA 0°C 2% NA
NSW TM-2 NA Location specific 8% NA
NSW TM-2 NA 2ms-2 7% NA
NSW TM-11 NSW TM-11 4mg/m³ 12%
NSW TM-32 NSW TM-32 0.0025g/m³ 12%
NSW TM-24 NSW TM-24 0.1% 13%
NSW TM-25 NSW TM-25 0.1% 13%
NSW TM-34 USEPA SW-846 8260 0.33mg/m³ 19% 1
Carbon dioxide
Carbon monoxide
Nitrogen oxides (NOx)
Method
Detection Limit
Sample plane criteria
Moisture content
Flow rate
Velocity
Speciated volatile organic compounds (VOC’s)
NATA AccreditedParameter
* Uncertainty values cited in this table are calculated at the 95% confidence level (coverage factor = 2)
Temperature
Oxygen

Ektimo 15 August 2016
Report R002940 prepared for Terminals Pty Ltd, Port Botany Page 7 of 7
7 DEFINITIONS
The following symbols and abbreviations may be used in this test report:
STP Standard temperature and pressure. Gas volumes and concentrations are expressed on a dry basis at 0°C, at discharge oxygen concentration and an absolute pressure of 101.325 kPa, unless otherwise specified.
Disturbance A flow obstruction or instability in the direction of the flow which may impede accurate flow determination. This includes centrifugal fans, axial fans, partially closed or closed dampers, louvres, bends, connections, junctions, direction changes or changes in pipe diameter.
VOC Any chemical compound based on carbon with a vapour pressure of at least 0.010 kPa at 25°C or having a corresponding volatility under the particular conditions of use. These compounds may contain oxygen, nitrogen and other elements, but specifically excluded are carbon monoxide, carbon dioxide, carbonic acid, metallic carbides and carbonate salts.
TOC The sum of all compounds of carbon which contain at least one carbon to carbon bond, plus methane and its derivatives.
OU The number of odour units per unit of volume. The numerical value of the odour concentration is equal to the number of dilutions to arrive at the odour threshold (50% panel response).
PM2.5 Atmospheric suspended particulate matter having an equivalent aerodynamic diameter of less than approximately 2.5 microns (µm).
PM10 Atmospheric suspended particulate matter having an equivalent aerodynamic diameter of less than approximately 10 microns (µm).
BSP British standard pipe NT Not tested or results not required NA Not applicable D50 ‘Cut size’ of a cyclone defined as the particle diameter at which the cyclone achieves a 50%
collection efficiency ie. half of the particles are retained by the cyclone and half are not and pass through it to the next stage. The D50 method simplifies the capture efficiency distribution by assuming that a given cyclone stage captures all of the particles with a diameter equal to or greater than the D50 of that cyclone and less than the D50 of the preceding cyclone.
D Duct diameter or equivalent duct diameter for rectangular ducts < Less than > Greater than ≥ Greater than or equal to ~ Approximately CEM Continuous Emission Monitoring CEMS Continuous Emission Monitoring System DER WA Department of Environment & Regulation DECC Department of Environment & Climate Change (NSW) EPA Environment Protection Authority FTIR Fourier Transform Infra Red NATA National Association of Testing Authorities RATA Relative Accuracy Test Audit AS Australian Standard USEPA United States Environmental Protection Agency Vic EPA Victorian Environment Protection Authority ISC Intersociety committee, Methods of Air Sampling and Analysis ISO International Organisation for Standardisation APHA American public health association, Standard Methods for the Examination of Water and
Waste Water CARB Californian Air Resources Board TM Test Method OM Other approved method CTM Conditional test method VDI Verein Deutscher Ingenieure (Association of German Engineers) NIOSH National Institute of Occupational Safety and Health XRD X-ray Diffractometry

This document is confidential and is prepared for the exclusive use of Terminals Pty Ltd
and those granted permission by Terminals Pty Ltd.
Report Number R003447
Emission Testing Report
EPA 4 – Benzene Combustor
Terminals Pty Ltd, Port Botany

Ektimo 24 May 2017
Report R003447 prepared for Terminals Pty Ltd, Port Botany Page 2 of 7
Document Information
Client Name: Terminals Pty Ltd
Report Number: R003447
Date of Issue: 24 May 2017
Attention: Adrian Phillips
Address: Gate 38B, 45 Friendship Rd PORT BOTANY NSW 2036 Testing Laboratory: Ektimo (ETC) ABN 74 474 273 172
Report Status
Format Document Number Report Date Prepared By Reviewed By (1) Reviewed By (2)
Preliminary Report - - - - -
Draft Report - - - - -
Final Report R003447 24/05/2017 JWe SCo ADa
Amend Report - - - - -
Template Version: 170407
Amendment Record
Document Number Initiator Report Date Section Reason
Nil - - - -
Report Authorisation
Steven Cooper Client Manager
NATA Accredited Laboratory
No. 14601
Accredited for compliance with ISO/IEC 17025. NATA is a signatory to the ILAC mutual recognition arrangement for the mutual
recognition of the equivalence of testing, calibration and inspection reports.

Ektimo 24 May 2017
Report R003447 prepared for Terminals Pty Ltd, Port Botany Page 3 of 7
Table of Contents
1 Executive Summary ....................................................................................................................... 4
2 Results Summary ........................................................................................................................... 4
3 Results ........................................................................................................................................... 5
3.1 EPA 4 – Benzene Combustor ..................................................................................................................................... 5
4 Plant Operating Conditions ........................................................................................................... 6
5 Test Methods................................................................................................................................. 6
6 Quality Assurance/ Quality Control Information .......................................................................... 6
7 Definitions ..................................................................................................................................... 7

Ektimo 24 May 2017
Report R003447 prepared for Terminals Pty Ltd, Port Botany Page 4 of 7
1 EXECUTIVE SUMMARY
Ektimo was engaged by Terminals Pty Ltd to perform emission monitoring as required by their NSW EPA Environment Protection Licence (number 1048).
Monitoring was performed as follows:
Location Test Date Test Parameters*
EPA 4 – Benzene Combustor 11 May 2017 Speciated volatile organic compounds (VOC’s), carbon dioxide, oxygen, carbon monoxide, nitrogen oxides
* Flow rate, velocity, temperature and moisture were determined unless otherwise stated
The sampling methodologies chosen by Ektimo are those recommended by the NSW Office of Environment and Heritage (as specified in the Approved Methods for the Sampling and Analysis of Air Pollutants in New South Wales, January 2007).
All results are reported on a dry basis at STP. Unless otherwise indicated, the methods cited in this report have been performed without deviation.
Plant operating conditions have been noted in the report.
2 RESULTS SUMMARY
The following licence comparison table shows that all analytes highlighted in green are below the licence limit set by the NSW EPA as per licence 1048 (last amended on 07/03/2017).
Detected valuesDetected values
(corrected to 3% O2)
11/05/17 11/05/17
Nitrogen oxides (as NO2) mg/m3 350 76 140
Volatile organic compounds (VOCs) mg/m3 20 0.28 0.51
Benzene mg/m3 1 <0.06 <0.1
Location DescriptionEPA No.Licence
limit Parameter Units
4 Benzene Combustor

Ektimo 24 May 2017
Report R003447 prepared for Terminals Pty Ltd, Port Botany Page 5 of 7
3 RESULTS
3.1 EPA 4 – Benzene Combustor
Date Client
Report Stack ID
Licence No. Location
Ektimo Staff State
Process Conditions Ship loaded is the Golden Aspirant
space space space space space space space space space space space
Sampling Plane Details
Sampling plane dimensions
Sampling plane area
Sampling port size, number
Access & height of ports Fixed ladder 9 m
Duct orientation & shape Vertical Circular
Downstream disturbance Exit 3 D
Upstream disturbance Change in diameter 2 D
No. traverses & points sampled 2 16
Sample plane compliance to AS4323.1
space space space space space space space space space space space
Comments
The sampling plane is deemed to be non-ideal or non-compliant due to the following reasons:
space space space space space space space space space space space
Stack Parameters
Moisture content, %v/v 5.9
Gas molecular weight, g/g mole 28.7 (wet) 29.3 (dry)
Gas density at STP, kg/m³ 1.28 (wet) 1.31 (dry)
% Oxygen correction & Factor 3 % 1.78
Flow measurement time(s) (hhmm) 1235 & 1350
Temperature, °C 767
Temperature, K 1040
Velocity at sampling plane, m/s 5.1
Volumetric flow rate, discharge, m³/s 4
Volumetric flow rate (wet STP), m³/s 1.1
Volumetric flow rate (dry STP), m³/s 1
Mass flow rate (wet basis), kg/hour 4900
Velocity difference, % -9
space space space space space space space space space space space
Gas Analyser ResultsSampling time
Mass Rate Mass Rate Mass Rate
Combustion Gases mg/m³ mg/m³ g/min mg/m³ mg/m³ g/min mg/m³ mg/m³ g/min
Nitrogen oxides (as NO2) 76 140 4.6 72 130 4.4 80 140 4.9
Carbon monoxide 3.1 5.4 0.19 <2 <3 <0.1 5 8.9 0.3
Carbon dioxide
Oxygen
space space space space space space space space space space space
Total VOCs(as n-Propane) Sampling time
Mass Rate
mg/m³ mg/m³ g/min
Total 0.28 0.51 0.017
space space space space space space space space space space space
VOC (speciated)
Sampling time
Mass Rate
mg/m³ mg/m³ g/min
Detection limit(1)
<0.06 <0.1 <0.003
Benzene <0.06 <0.1 <0.003
Toluene 0.6 1.1 0.036
(1) Unless otherwise reported, the following target compounds were found to be below detection:
%
5
11
1010 mm
0.801 m²
Terminals Pty Ltd
EPA 4 - Benzene Combustor Stack
Port Botany
NSWSteven Cooper & Scott Woods
Compliant but non-ideal
11/05/2017
R003447
1048
4" Flange (x2)
Concentration
Concentration
Corrected to
3% O2
Corrected to
3% O2
Results
Ethanol, Isopropanol, 1,1-Dichloroethene, Dichloromethane, trans-1,2-Dichloroethene, cis-1,2-Dichloroethene, Chloroform, 1,1,1-Trichloroethane, 1,2-Dichloroethane, Benzene, Carbon tetrachloride, Butanol, 1-M ethoxy-2-propanol,
Trichloroethene, Toluene, 1,1,2-trichloroethane, Tetrachloroethene, Chlorobenzene, Ethylbenzene, m + p-Xylene, Styrene, o-Xylene, 2-Butoxyethanol, 1,1,2,2-Tetrachloroethane, Isopropylbenzene, Propylbenzene, 1,3,5-
trimethylbenzene, tert-Butylbenzene, 1,2,4-trimethylbenzene, 1,2,3-trimethylbenzene, Acetone, Pentane, Acrylonitrile, n-Hexane, M ethyl ethyl ketone, Ethyl acetate, Cyclohexane, 2-M ethylhexane, 2,3-Dimethylpentane, Isopropyl
acetate, 3-M ethylhexane, Ethyl acrylate, Heptane, M ethyl methacrylate, Propyl acetate, M ethylcyclohexane, M IBK, 2-Hexanone, Octane, Butyl acetate, 1-methoxy-2-propyl acetate, Butyl acrylate, Nonane, Celloso lve acetate, alpha-
Pinene, beta-Pinene, Decane, 3-Carene, D-Limonene, Undecane, Dodecane, Tridecane, Tetradecane, Residuals as Toluene
Results
1246-1346
1246-1346
1252-1351
The sampling plane is too near to the upstream disturbance but is greater than or equal to 2D
Average Maximum
1252-1351
Minimum
Concentration
Corrected to
3% O2
Corrected to
3% O2
1252-1351
Gas Flow Parameters
Corrected to
3% O2ConcentrationConcentration
Concentration
%
4.8
10.8
Concentration
%
4.6
10.6
Concentration

Ektimo 24 May 2017
Report R003447 prepared for Terminals Pty Ltd, Port Botany Page 6 of 7
4 PLANT OPERATING CONDITIONS
Unless otherwise stated, the plant operating conditions were normal at the time of testing. See Terminals Pty
Ltd’s records for complete process conditions. All testing was conducted while the Golden Aspirant was being
loaded.
5 TEST METHODS
All sampling and analysis was performed by Ektimo unless otherwise specified. Specific details of the
methods are available upon request.
1. Analysis performed by Ektimo (EML Air), NATA accreditation number 2732. Results were reported to Ektimo on 23 May 2017 in
report number R003447_VOCs.
6 QUALITY ASSURANCE/ QUALITY CONTROL INFORMATION
Ektimo (EML) and Ektimo (ETC) are accredited by the National Association of Testing Authorities (NATA) for
the sampling and analysis of air pollutants from industrial sources. Unless otherwise stated test methods
used are accredited with the National Association of Testing Authorities. For full details, search for Ektimo at
NATA’s website www.nata.com.au.
Ektimo (EML) and Ektimo (ETC) are accredited by NATA (National Association of Testing Authorities) to
ISO/IEC 17025. – General Requirements for the Competence of Testing and Calibration Laboratories. ISO/IEC
17025 requires that a laboratory have adequate equipment to perform the testing, as well as laboratory
personnel with the competence to perform the testing. This quality assurance system is administered and
maintained by the Compliance Manager.
NATA is a member of APLAC (Asia Pacific Laboratory Accreditation Co-operation) and of ILAC (International
Laboratory Accreditation Co-operation). Through the mutual recognition arrangements with both of these
organisations, NATA accreditation is recognised world –wide.
A formal Quality Control program is in place at Ektimo to monitor analyses performed in the laboratory and
sampling conducted in the field. The program is designed to check where appropriate; the sampling
reproducibility, analytical method, accuracy, precision and the performance of the analyst. The Laboratory
Manager is responsible for the administration and maintenance of this program.
Sampling Method Analysis Method Uncertainty*
Enter a 'y' where required Sampling Analysis
NSW TM-1 NA - ✓ NA
NSW TM-22 NSW TM-22 19% ✓ ✓
NSW TM-2 NA 2% ✓ NA
NSW TM-2 NA 8% ✓ NA
NSW TM-2 NA 7% ✓ NA
NSW TM-11 NSW TM-11 12% ✓ ✓
NSW TM-32 NSW TM-32 12% ✓ ✓
NSW TM-24 NSW TM-24 13% ✓ ✓
NSW TM-25 NSW TM-25 13% ✓ ✓
NSW TM-34 USEPA SW-846 8260 19% ✓ ✓1
Velocity
Parameter NATA Accredited
Temperature
Flow rate
Sample plane criteria
Moisture content
Nitrogen oxides (NOx)
Carbon dioxide
Oxygen
Carbon monoxide
Speciated volatile organic compounds (VOC's)
* Uncertainty values cited in this table are calculated at the 95% confidence level (coverage factor = 2)

Ektimo 24 May 2017
Report R003447 prepared for Terminals Pty Ltd, Port Botany Page 7 of 7
7 DEFINITIONS
The following symbols and abbreviations may be used in this test report:
STP Standard temperature and pressure. Gas volumes and concentrations are expressed on a dry basis at 0°C, at discharge oxygen concentration and an absolute pressure of 101.325 kPa, unless otherwise specified.
Disturbance A flow obstruction or instability in the direction of the flow which may impede accurate flow determination. This includes centrifugal fans, axial fans, partially closed or closed dampers, louvres, bends, connections, junctions, direction changes or changes in pipe diameter.
VOC Any chemical compound based on carbon with a vapour pressure of at least 0.010 kPa at 25°C or having a corresponding volatility under the particular conditions of use. These compounds may contain oxygen, nitrogen and other elements, but specifically excluded are carbon monoxide, carbon dioxide, carbonic acid, metallic carbides and carbonate salts.
TOC The sum of all compounds of carbon which contain at least one carbon to carbon bond, plus methane and its derivatives.
OU The number of odour units per unit of volume. The numerical value of the odour concentration is equal to the number of dilutions to arrive at the odour threshold (50% panel response).
PM2.5 Atmospheric suspended particulate matter having an equivalent aerodynamic diameter of less than approximately 2.5 microns (µm).
PM10 Atmospheric suspended particulate matter having an equivalent aerodynamic diameter of less than approximately 10 microns (µm).
BSP British standard pipe NT Not tested or results not required NA Not applicable D50 ‘Cut size’ of a cyclone defined as the particle diameter at which the cyclone achieves a 50%
collection efficiency ie. half of the particles are retained by the cyclone and half are not and pass through it to the next stage. The D50 method simplifies the capture efficiency distribution by assuming that a given cyclone stage captures all of the particles with a diameter equal to or greater than the D50 of that cyclone and less than the D50 of the preceding cyclone.
D Duct diameter or equivalent duct diameter for rectangular ducts < Less than > Greater than ≥ Greater than or equal to ~ Approximately CEM Continuous Emission Monitoring CEMS Continuous Emission Monitoring System DER WA Department of Environment & Regulation DECC Department of Environment & Climate Change (NSW) EPA Environment Protection Authority FTIR Fourier Transform Infra Red NATA National Association of Testing Authorities RATA Relative Accuracy Test Audit AS Australian Standard USEPA United States Environmental Protection Agency Vic EPA Victorian Environment Protection Authority ISC Intersociety committee, Methods of Air Sampling and Analysis ISO International Organisation for Standardisation APHA American public health association, Standard Methods for the Examination of Water and
Waste Water CARB Californian Air Resources Board TM Test Method OM Other approved method CTM Conditional test method VDI Verein Deutscher Ingenieure (Association of German Engineers) NIOSH National Institute of Occupational Safety and Health XRD X-ray Diffractometry

This document is confidential and is prepared for the exclusive use of Terminals Pty Ltd (Botany NSW)
and those granted permission by Terminals Pty Ltd (Botany NSW).
Report Number R004726
Emission Testing Report
EPA 4 – Benzene Combustor
Terminals Pty Ltd, Port Botany

Ektimo 11 May 2018
Report R004726 prepared for Terminals Pty Ltd, Port Botany Page 2 of 7
Document Information
Client Name: Terminals Pty Ltd
Report Number: R004726
Date of Issue: 11 May 2018
Attention: Ted Wagstaff
Address: Gate 38B, 45 Friendship Rd PORT BOTANY NSW 2036 Testing Laboratory: Ektimo Pty Ltd, ABN 86 600 381 413
Report Status
Format Document Number Report Date Prepared By Reviewed By (1) Reviewed By (2)
Preliminary Report - - - - -
Draft Report - - - - -
Final Report R004726 11/05/2018 JWe Dhi SCo
Amend Report - - - - -
Template Version: 220318
Amendment Record
Document Number Initiator Report Date Section Reason
Nil - - - -
Report Authorisation
Steven Cooper Client Manager
NATA Accredited Laboratory
No. 14601
Accredited for compliance with ISO/IEC 17025 - Testing. NATA is a signatory to the ILAC mutual recognition arrangement for the mutual
recognition of the equivalence of testing, calibration and inspection reports.

Ektimo 11 May 2018
Report R004726 prepared for Terminals Pty Ltd, Port Botany Page 3 of 7
Table of Contents
1 Executive Summary ....................................................................................................................... 4
2 Results Summary ........................................................................................................................... 4
3 Results ........................................................................................................................................... 5
3.1 EPA 4 – Benzene Combustor ..................................................................................................................................... 5
4 Plant Operating Conditions ........................................................................................................... 6
5 Test Methods................................................................................................................................. 6
6 Quality Assurance/Quality Control Information ........................................................................... 6
7 Definitions ..................................................................................................................................... 7

Ektimo 11 May 2018
Report R004726 prepared for Terminals Pty Ltd, Port Botany Page 4 of 7
1 EXECUTIVE SUMMARY
Ektimo was engaged by Terminals Pty Ltd to perform emission monitoring as required by NSW EPA Environment Protection Licence (number 1048).
Monitoring was performed as follows:
Location Test Date Test Parameters*
EPA 4 – Benzene Combustor 21 April 2018 Speciated volatile organic compounds (VOC’s), carbon dioxide, oxygen, carbon monoxide, nitrogen oxides
* Flow rate, velocity, temperature and moisture were determined unless otherwise stated
All results are reported on a dry basis at STP. Unless otherwise indicated, the methods cited in this report have been performed without deviation.
Plant operating conditions have been noted in the report.
2 RESULTS SUMMARY
The following licence comparison table shows that all analytes highlighted in green are below the licence limit set by the NSW EPA as per licence 1048 (last amended on 23/11/2017).
Results have also been corrected to 3% Oxygen as stipulated in Schedule 5 of the Protection of the Environment Operations (Clean Air) Regulation, (NSW) 2010.
Detected valuesDetected values
(corrected to 3% O2)
21/04/2018 21/04/2018
Nitrogen oxides (as NO2) mg/m3 350 42 88
Volatile organic compounds (VOCs) mg/m3 20 0.57 1.2
Benzene mg/m3 1 0.053 0.11
Location DescriptionEPA No.Licence
limit Parameter Units
4 Benzene Combustor

Ektimo 11 May 2018
Report R004726 prepared for Terminals Pty Ltd, Port Botany Page 5 of 7
3 RESULTS
3.1 EPA 4 – Benzene Combustor
Date Client
Report Stack ID
Licence No. Location
Ektimo Staff State
Process Conditions Ship loaded is the Golden Creation 180417
space space space space space space space space space space space
Sampling Plane Details
Sampling plane dimensions
Sampling plane area
Sampling port size, number
Access & height of ports
Duct orientation & shape
Downstream disturbance
Upstream disturbance
No. traverses & points sampled
Sample plane compliance to AS4323.1
Comments
The sampling plane is deemed to be non-ideal or non-compliant due to the following reasons:
space space space space space space space space space space space
Stack Parameters
Moisture content, %v/v 4.2
Gas molecular weight, g/g mole 28.9 (wet) 29.3 (dry)
Gas density at STP, kg/m³ 1.29 (wet) 1.31 (dry)
% Oxygen correction & Factor 3 % 2.09
Flow measurement time(s) (hhmm) 0732 & 0908
Temperature, °C 787
Temperature, K 1060
Velocity at sampling plane, m/s 7
Volumetric flow rate, discharge, m³/s 5.6
Volumetric flow rate (wet STP), m³/s 1.5
Volumetric flow rate (dry STP), m³/s 1.4
Mass flow rate (wet basis), kg/hour 6800
Velocity difference, % <1
space space space space space space space space space space space
Gas Analyser ResultsSampling time
Mass Rate Mass Rate Mass Rate
Combustion Gases mg/m³ g/min mg/m³ g/min mg/m³ g/min
Nitrogen oxides (as NO2) 88 3.5 47 1.9 190 7.6
Carbon monoxide 88 3.5 <4 <0.2 3400 140
Carbon dioxide
Oxygen
Total VOCs(as n-Propane) Sampling time
Mass Rate
mg/m³ g/min
Total 1.2 0.048
space space space space space space space space space space space
VOC (speciated)
Sampling time
Mass Rate
mg/m³ g/min
Detection limit⁽¹⁾ <0.07 <0.003
Benzene 0.11 0.0045
Toluene 1.3 0.054
m + p-Xylene 0.18 0.0074
Pentane 0.67 0.027
(1) Unless otherwise reported, the following target compounds were found to be below detection:
Gas Flow Parameters
Corrected to
3% O2ConcentrationConcentration
Concentration
%
4.5
12.3
Concentration
11.2
Concentration
%
5.2
13.2
0746-0846
Ethanol, Isopropanol, 1,1-Dichloroethene, Dichloromethane, trans-1,2-Dichloroethene, cis-1,2-Dichloroethene, Chloroform, 1,1,1-Trichloroethane, 1,2-Dichloroethane, Carbon tetrachloride, Butanol, 1-M ethoxy-2-propanol,
Trichloroethylene, 1,1,2-trichloroethane, Tetrachloroethene, Chlorobenzene, Ethylbenzene, Styrene, o-Xylene, 2-Butoxyethanol, 1,1,2,2-Tetrachloroethane, Isopropylbenzene, Propylbenzene, 1,3,5-trimethylbenzene, tert-Butylbenzene,
1,2,4-trimethylbenzene, 1,2,3-trimethylbenzene, Acetone, Acrylonitrile, n-Hexane, M ethyl ethyl ketone, Ethyl acetate, Cyclohexane, 2-M ethylhexane, 2,3-Dimethylpentane, Isopropyl acetate, 3-M ethylhexane, Ethyl acrylate, Heptane,
M ethyl methacrylate, Propyl acetate, M ethylcyclohexane, M IBK, 2-Hexanone, Octane, Butyl acetate, 1-methoxy-2-propyl acetate, Butyl acrylate, Nonane, Celloso lve acetate, alpha-Pinene, beta-Pinene, Decane, 3-Carene, D-
Limonene, Undecane, Dodecane, Tridecane, Tetradecane
Results
0746-0846
Concentration
Corrected to
3% O2
Corrected to
3% O2
Results
Concentration
0747 - 0846
The sampling plane is too near to the upstream disturbance but is greater than or equal to 2D
Average Maximum
0747 - 0846
Minimum
Concentration
Corrected to
3% O2
Corrected to
3% O2
%
21/04/2018
R004726
1048
Terminals Pty Ltd
EPA 4 - Benzene Combustor Stack
Port Botany
NSWDavid Hill
Vertical
Exit
Change in diameter
2
Fixed ladder 9 m
Circular
3 D
2 D
16
0747 - 0846
3.9
1010 mm
0.801 m²
mg/m³
2342
42
mg/m³
91
1600
mg/m³
<2
mg/m³
0.57
0.65
0.088
0.32
mg/m³
<0.03
0.053
4" Flange (x2)
Compliant but non-ideal

Ektimo 11 May 2018
Report R004726 prepared for Terminals Pty Ltd, Port Botany Page 6 of 7
4 PLANT OPERATING CONDITIONS
Unless otherwise stated, the plant operating conditions were normal at the time of testing. See Terminals Pty
Ltd’s records for complete process conditions. All testing was conducted while the Golden Creation was being
loaded.
5 TEST METHODS
All sampling and analysis was performed by Ektimo unless otherwise specified. Specific details of the
methods are available upon request.
† Analysis performed by Ektimo, NATA accreditation number 14601. Laboratory analytical results were reported on 3 May 2018 in report number R004726_SVOCs.
6 QUALITY ASSURANCE/QUALITY CONTROL INFORMATION
Ektimo is accredited by the National Association of Testing Authorities (NATA) for the sampling and analysis of
air pollutants from industrial sources. Unless otherwise stated test methods used are accredited with the
National Association of Testing Authorities. For full details, search for Ektimo at NATA’s website
www.nata.com.au.
Ektimo is accredited by NATA (National Association of Testing Authorities) to ISO/IEC 17025 - Testing. ISO/IEC
17025 - Testing requires that a laboratory have adequate equipment to perform the testing, as well as
laboratory personnel with the competence to perform the testing. This quality assurance system is
administered and maintained by the Quality Director.
NATA is a member of APLAC (Asia Pacific Laboratory Accreditation Co-operation) and of ILAC (International
Laboratory Accreditation Co-operation). Through the mutual recognition arrangements with both of these
organisations, NATA accreditation is recognised worldwide.
A formal Quality Control program is in place at Ektimo to monitor analyses performed in the laboratory and
sampling conducted in the field. The program is designed to check where appropriate; the sampling
reproducibility, analytical method, accuracy, precision and the performance of the analyst. The Laboratory
Manager is responsible for the administration and maintenance of this program.
Sampling Method Analysis Method Uncertainty*
Sampling Analysis
NSW TM-1 NA - ✓ NA
NSW TM-2 NA 8%, 2%, 7% ✓ NA
NSW TM-22 NSW TM-22 19% ✓ ✓
NSW TM-24 NSW TM-24 13% ✓ ✓
NSW TM-32 NSW TM-32 12% ✓ ✓
NSW TM-11 NSW TM-11 12% ✓ ✓
NSW TM-25 NSW TM-25 13% ✓ ✓
NSW TM-34 Ektimo 344 19% ✓ ✓†
180404
* Uncertainty values cited in this table are calculated at the 95% confidence level (coverage factor = 2)
Speciated volatile organic compounds (VOC’s)
Nitrogen oxides (NOX)
Oxygen
Carbon monoxide
Carbon dioxide
NATA Accredited
Moisture content
Parameter
Sample plane criteria
Flow rate, temperature and velocity

Ektimo 11 May 2018
Report R004726 prepared for Terminals Pty Ltd, Port Botany Page 7 of 7
7 DEFINITIONS
The following symbols and abbreviations may be used in this test report:
~ Approximately < Less than > Greater than ≥ Greater than or equal to APHA American public health association, Standard Methods for the Examination of Water and
Waste Water AS Australian Standard BSP British standard pipe CARB Californian Air Resources Board CEM Continuous Emission Monitoring CEMS Continuous Emission Monitoring System CTM Conditional test method D Duct diameter or equivalent duct diameter for rectangular ducts D50 ‘Cut size’ of a cyclone defined as the particle diameter at which the cyclone achieves a 50%
collection efficiency ie. half of the particles are retained by the cyclone and half are not and pass through it to the next stage. The D50 method simplifies the capture efficiency distribution by assuming that a given cyclone stage captures all of the particles with a diameter equal to or greater than the D50 of that cyclone and less than the D50 of the preceding cyclone.
DECC Department of Environment & Climate Change (NSW) Disturbance A flow obstruction or instability in the direction of the flow which may impede accurate flow
determination. This includes centrifugal fans, axial fans, partially closed or closed dampers, louvres, bends, connections, junctions, direction changes or changes in pipe diameter.
DWER Department of Water and Environmental Regulation EPA Environment Protection Authority FTIR Fourier Transform Infra Red ISC Intersociety committee, Methods of Air Sampling and Analysis ISO International Organisation for Standardisation NA Not applicable NATA National Association of Testing Authorities NIOSH National Institute of Occupational Safety and Health NT Not tested or results not required OM Other approved method OU The number of odour units per unit of volume. The numerical value of the odour
concentration is equal to the number of dilutions to arrive at the odour threshold (50% panel response).
PM10 Atmospheric suspended particulate matter having an equivalent aerodynamic diameter of less than approximately 10 microns (µm).
PM2.5 Atmospheric suspended particulate matter having an equivalent aerodynamic diameter of less than approximately 2.5 microns (µm).
PSA Particle size analysis RATA Relative Accuracy Test Audit STP Standard temperature and pressure. Gas volumes and concentrations are expressed on a dry
basis at 0°C, at discharge oxygen concentration and an absolute pressure of 101.325 kPa, unless otherwise specified.
TM Test Method TOC The sum of all compounds of carbon which contain at least one carbon to carbon bond, plus
methane and its derivatives. USEPA United States Environmental Protection Agency VDI Verein Deutscher Ingenieure (Association of German Engineers) Vic EPA Victorian Environment Protection Authority VOC Any chemical compound based on carbon with a vapour pressure of at least 0.010 kPa at 25°C
or having a corresponding volatility under the particular conditions of use. These compounds may contain oxygen, nitrogen and other elements, but specifically excluded are carbon monoxide, carbon dioxide, carbonic acid, metallic carbides and carbonate salts.
XRD X-ray Diffractometry

This document is confidential and is prepared for the exclusive use of Terminals Pty Ltd
and those granted permission by Terminals Pty Ltd.
Report Number R007422
Emission Testing Report
EPA 4 – Benzene Combustor
Terminals Pty Ltd, Port Botany

Ektimo 27 May 2019
Report R007422 prepared for Terminals Pty Ltd, Port Botany Page 2 of 7
Document Information
Client Name: Terminals Pty Ltd
Report Number: R007422
Date of Issue: 27 May 2019
Attention: Ted Wagstaff
Address: Gate 38B, 45 Friendship Rd Port Botany NSW 2036 Testing Laboratory: Ektimo Pty Ltd, ABN 86 600 381 413
Report Status
Format Document Number Report Date Prepared By Reviewed By (1) Reviewed By (2)
Preliminary Report - - - - -
Draft Report - - - - -
Final Report R007422 27/05/2019 JWe SCo ZPa
Amend Report - - - - -
Template Version: 171218
Amendment Record
Document Number Initiator Report Date Section Reason
Nil - - - -
Report Authorisation
Steven Cooper Client Manager
NATA Accredited Laboratory
No. 14601
Accredited for compliance with ISO/IEC 17025 - Testing. NATA is a signatory to the ILAC mutual recognition arrangement for the mutual
recognition of the equivalence of testing, calibration and inspection reports.

Ektimo 27 May 2019
Report R007422 prepared for Terminals Pty Ltd, Port Botany Page 3 of 7
Table of Contents
1 Executive Summary ....................................................................................................................... 4
2 Results Summary ........................................................................................................................... 4
3 Results ........................................................................................................................................... 5
3.1 EPA 4 – Benzene Combustor ..................................................................................................................................... 5
4 Plant Operating Conditions ........................................................................................................... 6
5 Test Methods................................................................................................................................. 6
6 Quality Assurance/Quality Control Information ........................................................................... 6
7 Definitions ..................................................................................................................................... 7

Ektimo 27 May 2019
Report R007422 prepared for Terminals Pty Ltd, Port Botany Page 4 of 7
1 EXECUTIVE SUMMARY
Ektimo was engaged by Terminals Pty Ltd to perform emission monitoring as required by NSW EPA Environment Protection Licence (number 1048).
Monitoring was performed as follows:
Location Test Date Test Parameters*
EPA 4 – Benzene Combustor 5 May 2019 Speciated volatile organic compounds (VOC’s)
Carbon dioxide, oxygen, carbon monoxide, nitrogen oxides
* Flow rate, velocity, temperature and moisture were also determined.
All results are reported on a dry basis at STP.
Plant operating conditions have been noted in the report.
2 RESULTS SUMMARY
The following licence comparison table shows that all analytes highlighted in green are below the licence limit set by the NSW EPA as per licence 1048 (last amended on 23/11/2017).
Results have also been corrected to 3% Oxygen as stipulated in Schedule 5 of the Protection of the Environment Operations (Clean Air) Regulation, (NSW) 2010.
Detected valuesDetected values
(corrected to 3% O2)
5/05/2019 5/05/2019
Nitrogen oxides (as NO2) mg/m3 350 69 130
Volatile organic compounds (VOCs) mg/m3 20 <0.06 <0.1
Benzene mg/m3 1 <0.07 <0.1
Licence
limit Parameter Units
4 Benzene Combustor
Location DescriptionEPA No.

Ektimo 27 May 2019
Report R007422 prepared for Terminals Pty Ltd, Port Botany Page 5 of 7
3 RESULTS
3.1 EPA 4 – Benzene Combustor
Date Client
Report Stack ID
Licence No. Location
Ektimo Staff State
Process Conditions Ship loaded is the Golden Leader 190430
space space space space space space space space space space spaceSampling Plane DetailsSampling plane dimensions
Sampling plane area
Sampling port size, number
Access & height of ports
Duct orientation & shape
Downstream disturbance
Upstream disturbance
No. traverses & points sampled
Sample plane compliance to AS4323.1
Comments
The sampling plane is deemed to be non-ideal due to the following reasons:
space space space space space space space space space space spaceStack ParametersMoisture content, %v/v 7.4
Gas molecular weight, g/g mole 28.4 (wet) 29.2 (dry)
Gas density at STP, kg/m³ 1.27 (wet) 1.30 (dry)
% Oxygen correction & Factor 3 % 1.94
Flow measurement time(s) (hhmm) 2302 & 0018
Temperature, °C 780
Temperature, K 1053
Velocity at sampling plane, m/s 7.1
Volumetric flow rate, actual, m³/s 5.7
Volumetric flow rate (wet STP), m³/s 1.5
Volumetric flow rate (dry STP), m³/s 1.4
Mass flow rate (wet basis), kg/hour 6700
Velocity difference, % -10
space space space space space space space space space space space
Gas Analyser ResultsSampling time
Mass Rate Mass Rate Mass Rate
Combustion Gases mg/m³ g/min mg/m³ g/min mg/m³ g/min
Nitrogen oxides (as NO2) 130 5.7 130 5.4 140 6
Carbon monoxide 5.2 0.22 <5 <0.2 15 0.62
Carbon dioxide
Oxygen
Total VOCs (as n-Propane)Lower Bound Sampling time
Mass Rate
mg/m³ g/min
Total <0.1 <0.005
space space space space space space space space space space space
VOC (speciated)
Sampling time
Mass Rate
mg/m³ g/min
Detection limit⁽¹⁾ <0.1 <0.005
Benzene <0.1 <0.005
(1) Unless otherwise reported, the following target compounds were found to be below detection:
Compliant but non-ideal
4" Flange (x2)
mg/m³
<0.07
<0.07
mg/m³
<0.06
1010 mm
0.801 m²
mg/m³
6669
2.7
mg/m³
73
7.5
mg/m³
<2
3 D
2 D
16
2313 - 0013
3.5
Terminals Pty Ltd
EPA 4 - Benzene Combustor Stack
Port Botany
NSWSteven Cooper
Vertical
Exit
Change in diameter
2
Fixed ladder 9 m
Circular
5/05/2019
R007422
1048
%
2313 - 0013
The sampling plane is too near to the upstream disturbance but is greater than or equal to 2D
Average Maximum
2313 - 0013
Minimum
Concentration
Corrected to 3%
O2
Corrected to 3%
O2
Concentration
Corrected to 3%
O2
Corrected to 3%
O2
Results
Ethanol , Isopropanol , 1,1-Dichloroethene, Dichloromethane, trans-1,2-Dichloroethene, cis -1,2-Dichloroethene, Chloroform, 1,1,1-Trichloroethane, 1,2-Dichloroethane, Benzene, Carbon tetrachloride, Butanol , 1-Methoxy-
2-propanol , Trichloroethylene, Toluene, 1,1,2-Trichloroethane, Tetrachloroethene, Chlorobenzene, Ethylbenzene, m + p-Xylene, Styrene, o-Xylene, 2-Butoxyethanol , 1,1,2,2-Tetrachloroethane, Isopropylbenzene,
Propylbenzene, 1,3,5-Trimethylbenzene, 1,2,4-Trimethylbenzene, tert-Butylbenzene, 1,2,3-Trimethylbenzene, Acetone, Pentane, Acrylonitri le, Methyl ethyl ketone, n-Hexane, Ethyl acetate, Cyclohexane, Isopropyl acetate,
2-Methylhexane, 2,3-Dimethylpentane, 3-Methylhexane, Heptane, Ethyl acrylate, Methyl methacrylate, Propyl acetate, Methylcyclohexane, Methyl Isobutyl Ketone, 2-Hexanone, Octane, Butyl acetate, 1-Methoxy-2-propyl
acetate, Butyl acrylate, Nonane, Cel losolve acetate, α-Pinene, β-Pinene, Decane, 3-Carene, D-Limonene, Undecane, Dodecane, Tridecane, Tetradecane
Results2310-0010
2310-0010
Concentration
Gas Flow Parameters
Corrected to 3%
O2ConcentrationConcentration
Concentration
%
3.7
11.7
Concentration
11
Concentration
%
4
12

Ektimo 27 May 2019
Report R007422 prepared for Terminals Pty Ltd, Port Botany Page 6 of 7
4 PLANT OPERATING CONDITIONS
Unless otherwise stated, the plant operating conditions were normal at the time of testing. See Terminals Pty
Ltd ’s records for complete process conditions. All testing was conducted with the Golden Leader was being
loaded.
5 TEST METHODS
All sampling and analysis was performed by Ektimo unless otherwise specified. Specific details of the
methods are available upon request.
† Analysis performed by Ektimo, NATA accreditation number 14601. Laboratory analytical results were reported on 23 May 2019 in
report number R007422_SVOCs.
6 QUALITY ASSURANCE/QUALITY CONTROL INFORMATION
Ektimo is accredited by the National Association of Testing Authorities (NATA) for the sampling and analysis of
air pollutants from industrial sources. Unless otherwise stated test methods used are accredited with the
National Association of Testing Authorities. For full details, search for Ektimo at NATA’s website
www.nata.com.au.
Ektimo is accredited by NATA (National Association of Testing Authorities) to ISO/IEC 17025 - Testing. ISO/IEC
17025 - Testing requires that a laboratory have adequate equipment to perform the testing, as well as
laboratory personnel with the competence to perform the testing. This quality assurance system is
administered and maintained by the Quality Director.
NATA is a member of APLAC (Asia Pacific Laboratory Accreditation Co-operation) and of ILAC (International
Laboratory Accreditation Co-operation). Through the mutual recognition arrangements with both of these
organisations, NATA accreditation is recognised worldwide.

Ektimo 27 May 2019
Report R007422 prepared for Terminals Pty Ltd, Port Botany Page 7 of 7
7 DEFINITIONS
The following symbols and abbreviations may be used in this test report:
% v/v Volume to volume ratio, dry or wet basis ~ Approximately < Less than > Greater than ≥ Greater than or equal to APHA American public health association, Standard Methods for the Examination of Water and Waste Water AS Australian Standard BSP British standard pipe CARB Californian Air Resources Board CEM Continuous Emission Monitoring CEMS Continuous Emission Monitoring System CTM Conditional test method D Duct diameter or equivalent duct diameter for rectangular ducts D50 ‘Cut size’ of a cyclone defined as the particle diameter at which the cyclone achieves a 50% collection
efficiency ie. half of the particles are retained by the cyclone and half are not and pass through it to the next stage. The D50 method simplifies the capture efficiency distribution by assuming that a given cyclone stage captures all of the particles with a diameter equal to or greater than the D50 of that cyclone and less than the D50 of the preceding cyclone.
DECC Department of Environment & Climate Change (NSW) Disturbance A flow obstruction or instability in the direction of the flow which may impede accurate flow determination.
This includes centrifugal fans, axial fans, partially closed or closed dampers, louvres, bends, connections, junctions, direction changes or changes in pipe diameter.
DWER Department of Water and Environmental Regulation (WA) DEHP Department of Environment and Heritage Protection (QLD) EPA Environment Protection Authority FTIR Fourier Transform Infra-red ISC Intersociety committee, Methods of Air Sampling and Analysis ISO International Organisation for Standardisation Lower Bound Defines values reported below detection as equal to zero. Medium Bound Defines values reported below detection are equal to half the detection limit. NA Not applicable NATA National Association of Testing Authorities NIOSH National Institute of Occupational Safety and Health NT Not tested or results not required OM Other approved method OU The number of odour units per unit of volume. The numerical value of the odour concentration is equal to
the number of dilutions to arrive at the odour threshold (50% panel response). PM10 Atmospheric suspended particulate matter having an equivalent aerodynamic diameter of less than
approximately 10 microns (µm). PM2.5 Atmospheric suspended particulate matter having an equivalent aerodynamic diameter of less than
approximately 2.5 microns (µm). PSA Particle size analysis RATA Relative Accuracy Test Audit Semi-quantified VOCs Unknown VOCs (those not matching a standard compound), are identified by matching the mass spectrum of
the chromatographic peak to the NIST Standard Reference Database (version 14.0), with a match quality exceeding 70%. An estimated concentration will be determined by matching the integrated area of the peak with the nearest suitable compound in the analytical calibration standard mixture.
STP Standard temperature and pressure. Gas volumes and concentrations are expressed on a dry basis at 0°C, at discharge oxygen concentration and an absolute pressure of 101.325 kPa, unless otherwise specified.
TM Test Method TOC The sum of all compounds of carbon which contain at least one carbon to carbon bond, plus methane and its
derivatives. USEPA United States Environmental Protection Agency VDI Verein Deutscher Ingenieure (Association of German Engineers) Vic EPA Victorian Environment Protection Authority VOC Any chemical compound based on carbon with a vapour pressure of at least 0.010 kPa at 25°C or having a
corresponding volatility under the particular conditions of use. These compounds may contain oxygen, nitrogen and other elements, but specifically excluded are carbon monoxide, carbon dioxide, carbonic acid, metallic carbides and carbonate salts.
XRD X-ray Diffractometry Upper Bound Defines values reported below detection are equal to the detection limit.