Multigroup confirmatory factor analysis and structural invariance with age of the Behavior Rating...
22
This article was downloaded by: [jean-luc Roulin] On: 26 April 2014, At: 00:37 Publisher: Routledge Informa Ltd Registered in England and Wales Registered Number: 1072954 Registered office: Mortimer House, 37-41 Mortimer Street, London W1T 3JH, UK Child Neuropsychology: A Journal on Normal and Abnormal Development in Childhood and Adolescence Publication details, including instructions for authors and subscription information: http://www.tandfonline.com/loi/ncny20 Multigroup confirmatory factor analysis and structural invariance with age of the Behavior Rating Inventory of Executive Function (BRIEF)—French version Nathalie Fournet a , Jean-Luc Roulin a , Catherine Monnier b , Thierry Atzeni c , Olivier Cosnefroy d , Didier Le Gall e & Arnaud Roy ef a Laboratoire de Psychologie et Neurocognition (LPNC), Université de Savoie, Chambéry, France b Laboratoire Epsylon, Université Paul Valéry, Montpellier cedex 5, France c Laboratoire de Psychologie, Santé et Qualité de Vie, Bordeaux cedex, France d Laboratoire des Sciences de l’Éducation, Université Grenoble Alpes, Grenoble Cedex 9, France e Laboratoire de Psychologie des Pays de la Loire, UPRES EA 4638, LUNAM, Université d’Angers, Angers, France f Centre Référent du Langage, Unité Pédiatrique des Troubles d’Apprentissage, CHU de Nantes Centre de Compétence Nantais de Neurofibromatose, CHU de Nantes, Nantes, France Published online: 22 Apr 2014. To cite this article: Nathalie Fournet, Jean-Luc Roulin, Catherine Monnier, Thierry Atzeni, Olivier Cosnefroy, Didier Le Gall & Arnaud Roy (2014): Multigroup confirmatory factor analysis and structural invariance with age of the Behavior Rating Inventory of Executive Function (BRIEF)—French version, Child Neuropsychology: A Journal on Normal and Abnormal Development in Childhood and Adolescence, DOI: 10.1080/09297049.2014.906569 To link to this article: http://dx.doi.org/10.1080/09297049.2014.906569 PLEASE SCROLL DOWN FOR ARTICLE
-
Upload
independent -
Category
Documents
-
view
0 -
download
0
Transcript of Multigroup confirmatory factor analysis and structural invariance with age of the Behavior Rating...

This article was downloaded by: [jean-luc Roulin]On: 26 April 2014, At: 00:37Publisher: RoutledgeInforma Ltd Registered in England and Wales Registered Number: 1072954 Registeredoffice: Mortimer House, 37-41 Mortimer Street, London W1T 3JH, UK
Child Neuropsychology: A Journal onNormal and Abnormal Development inChildhood and AdolescencePublication details, including instructions for authors andsubscription information:http://www.tandfonline.com/loi/ncny20
Multigroup confirmatory factor analysisand structural invariance with ageof the Behavior Rating Inventory ofExecutive Function (BRIEF)—FrenchversionNathalie Fourneta, Jean-Luc Roulina, Catherine Monnierb, ThierryAtzenic, Olivier Cosnefroyd, Didier Le Galle & Arnaud Royef
a Laboratoire de Psychologie et Neurocognition (LPNC), Universitéde Savoie, Chambéry, Franceb Laboratoire Epsylon, Université Paul Valéry, Montpellier cedex 5,Francec Laboratoire de Psychologie, Santé et Qualité de Vie, Bordeauxcedex, Franced Laboratoire des Sciences de l’Éducation, Université GrenobleAlpes, Grenoble Cedex 9, Francee Laboratoire de Psychologie des Pays de la Loire, UPRES EA 4638,LUNAM, Université d’Angers, Angers, Francef Centre Référent du Langage, Unité Pédiatrique des Troublesd’Apprentissage, CHU de Nantes Centre de Compétence Nantaisde Neurofibromatose, CHU de Nantes, Nantes, FrancePublished online: 22 Apr 2014.
To cite this article: Nathalie Fournet, Jean-Luc Roulin, Catherine Monnier, Thierry Atzeni,Olivier Cosnefroy, Didier Le Gall & Arnaud Roy (2014): Multigroup confirmatory factor analysisand structural invariance with age of the Behavior Rating Inventory of Executive Function(BRIEF)—French version, Child Neuropsychology: A Journal on Normal and Abnormal Development inChildhood and Adolescence, DOI: 10.1080/09297049.2014.906569
To link to this article: http://dx.doi.org/10.1080/09297049.2014.906569
PLEASE SCROLL DOWN FOR ARTICLE

Taylor & Francis makes every effort to ensure the accuracy of all the information (the“Content”) contained in the publications on our platform. However, Taylor & Francis,our agents, and our licensors make no representations or warranties whatsoever as tothe accuracy, completeness, or suitability for any purpose of the Content. Any opinionsand views expressed in this publication are the opinions and views of the authors,and are not the views of or endorsed by Taylor & Francis. The accuracy of the Contentshould not be relied upon and should be independently verified with primary sourcesof information. Taylor and Francis shall not be liable for any losses, actions, claims,proceedings, demands, costs, expenses, damages, and other liabilities whatsoever orhowsoever caused arising directly or indirectly in connection with, in relation to or arisingout of the use of the Content.
This article may be used for research, teaching, and private study purposes. Anysubstantial or systematic reproduction, redistribution, reselling, loan, sub-licensing,systematic supply, or distribution in any form to anyone is expressly forbidden. Terms &Conditions of access and use can be found at http://www.tandfonline.com/page/terms-and-conditions
Dow
nloa
ded
by [
jean
-luc
Rou
lin]
at 0
0:37
26
Apr
il 20
14
Multigroup confirmatory factor analysis and structural
invariance with age of the Behavior Rating Inventory of
Executive Function (BRIEF)—French version
Nathalie Fournet1, Jean-Luc Roulin1, Catherine Monnier2,Thierry Atzeni3, Olivier Cosnefroy4, Didier Le Gall5,and Arnaud Roy5,6
1Laboratoire de Psychologie et Neurocognition (LPNC), Université de Savoie, Chambéry,France2Laboratoire Epsylon, Université Paul Valéry, Montpellier cedex 5, France3Laboratoire de Psychologie, Santé et Qualité de Vie, Bordeaux cedex, France4Laboratoire des Sciences de l’Éducation, Université Grenoble Alpes, Grenoble Cedex 9,France5Laboratoire de Psychologie des Pays de la Loire, UPRES EA 4638, LUNAM, Universitéd’Angers, Angers, France6Centre Référent du Langage, Unité Pédiatrique des Troubles d’Apprentissage, CHU deNantes Centre de Compétence Nantais de Neurofibromatose, CHU de Nantes, Nantes,France
The parent and teacher forms of the French version of the Behavioral Rating Inventory of ExecutiveFunction (BRIEF) were used to evaluate executive function in everyday life in a large sample ofhealthy children (N = 951) aged between 5 and 18.
Several psychometric methods were applied, with a view to providing clinicians with tools for scoreinterpretation. The parent and teacher forms of the BRIEF were acceptably reliable. Demographicvariables (such as age and gender) were found to influence the BRIEF scores. Confirmatory factoranalysis was then used to test five competing models of the BRIEF's latent structure. Two of these models(a three-factor model and a two-factor model, both based on a nine-scale structure) had a good fit.However, structural invariance with age was only obtained with the two-factor model.
The French version of the BRIEF provides a useful measure of everyday executive function andcan be recommended for use in clinical research and practice.
Keywords: Development; Executive function; Multigroup confirmatory factor analysis; Measurementinvariance; BRIEF.
We thank David Fraser D. Phil (Biotech Communication, Damery, France) for helpful comments on themanuscript’s English.
Address correspondence to Nathalie Fournet, Département de Psychologie Université de Savoie, LPNC,F-73011 Chambéry cedex, France. E-mail: [email protected]
Present affiliation of Nathalie Fournet and Jean-Luc Roulin is CNRS, LPNC UMR 5105, Grenoble,France
Child Neuropsychology, 2014http://dx.doi.org/10.1080/09297049.2014.906569
© 2014 Taylor & Francis
Dow
nloa
ded
by [
jean
-luc
Rou
lin]
at 0
0:37
26
Apr
il 20
14
The term “executive function” (EF) refers to a set of interrelated abilities responsible forcoordinating, guiding, and monitoring a person’s cognitive, behavioral, and emotionalfunctions (Denckla, 1996; Gioia, Isquith, Kenworthy, & Barton, 2002; Huizinga, Dolan,& van der Molen, 2006). Although there is still much debate as to whether executivefunctioning is unidimensional or multidimensional, the existence of interrelated (thoughpossibly distinct) abilities has been suggested in both adults and children (Huizinga et al.,2006; Lehto, Juujärvi, Kooistra, & Pulkkinen, 2003; Miyake et al., 2000). These specificabilities may include (among other factors) planning, mental flexibility, the initiation andmonitoring of action, inhibition (Miyake et al., 2000), and working memory (Pennington,1997). Executive functions emerge during the first few years of life and continue todevelop and strengthen significantly until mid-to-late adolescence or early adulthood.However, the various EFs appear to differ in terms of their developmental trajectories(Best & Miller, 2010; Romine & Reynolds, 2005).
Executive dysfunction will necessarily affect a child’s behavior in everyday life, bylimiting one’s ability to adjust to environmental demands or changes. Affected childrenare unable or poorly able to analyze, to initiate, to plan, to schedule, and to complete anactivity or to shift from one activity to another one in an appropriate way. In studies ofadults, impairments in EF have been linked to damage to (or dysfunction of) the prefrontalcortex and the disruption of frontosubcortical pathways (Alexander, DeLong, & Strick,1986; Cummings, 1993). The specific characterization of executive dysfunction dependson the component of the network that has been damaged. Executive dysfunction related toprefrontal-subcortical circuits is a characteristic feature of a variety of developmental,psychiatric, and neurological disorders in children, and there is a growing body ofevidence for early brain vulnerability in this domain (Dennis, 2006). Executive dysfunc-tion (amongst other conditions) has been described in autism spectrum disorders(Robinson, Goddard, Dritschel, Wisley, & Howlin, 2009; Robinson & Swanson, 1990;Russo et al., 2007), learning disabilities and attention disorders (Barkley, 1997; Willcutt,Doyle, Nigg, Faraone, & Pennington, 2005), Neurofibromatosis Type 1 (Roy et al., 2010),epilepsy, and traumatic brain injury (Levin et al., 1991).
At present, the assessment of EF in children is based on the methods used in adultsand is centered on the use of performance-based tasks or neuropsychological tests knownto be sensitive to prefrontal lobe damage, such as the Wisconsin Card Sorting Test(Heaton, Chelune, Talley, Kay, & Curtis, 1993), the Trail Making Test, verbal fluencytests, the Stroop Test (Lezak, Howieson, & Loring, 2004), and the Tower of London Task(Shallice, 1982). In most clinical situations, performance on these tasks is a good indicatorof a specific executive dysfunction. However, some highly dysfunctional children (show-ing distraction, disorganization, disinhibition, and dysregulation of their behavior at homeor at school) can exhibit normal scores on neuropsychological tests. For this reason (andin order to systematically compare clinical observations with real-world observations), itis essential that parents and teachers be given an opportunity to describe a child’sproblems in everyday life.
Although some neuropsychological tests have demonstrated sensitivity in the detec-tion of executive dysfunction, their ecological validity for the measurement of EF hasbeen challenged. When used alone, neuropsychological instruments do not consistentlydiscriminate between clinical groups and controls (Barkley, 1997; Mahone, 2002) orpredict performance in everyday activities (Wilson, 1993). In view of concerns aboutthe ecological validity of many laboratory-based instruments (Chaytor & Schmitter-Edgecombe, 2003), there is a need to examine EF in children by using multiple data
2 N. FOURNET ET AL.
Dow
nloa
ded
by [
jean
-luc
Rou
lin]
at 0
0:37
26
Apr
il 20
14
sources (including rating scales) and thus to assess children’s behaviors outside the testingenvironment.
The Behavior Rating Inventory of Executive Function (BRIEF; Gioia, Isquith,Guy, & Kenworthy, 2000a, 2000b) is a standardized rating scale used by parents andteachers to provide useful information about a child’s EF in one’s everyday environ-ments (e.g., home and school). The questionnaire is designed to measure variousbehavioral manifestations of EF in children and adolescents aged from 5 to 18. Thequestionnaire contains items that form eight clinical scales (Inhibit, Shift, EmotionalControl, Initiation, Working Memory, Plan/Organize, Organization of Materials, andMonitor) and two validity scales (inconsistency and negativity). These theoretically andstatistically derived scales form two broader Indices: The Behavioral Regulation Index(BRI; including Inhibit, Shift, and Emotional Control scales) and the Metacognitionindex (MI; including the Initiate, Working Memory, Plan/Organize, Organization ofMaterials. and Monitor scales). An overall score (the Global Executive Composite[GEC] Index) is also calculated.
The BRIEF is widely used in clinical and research settings with a variety ofchildhood disorders, including neurodevelopmental disorders and acquired brain lesions(Alloway et al., 2009; Anderson, Northam, Jacobs, Mikiewicz, & Anderson, 2002;Gathercole et al., 2008; Mahone, 2002; Reddy, Hale, & Brodzinsky, 2011; Slick,Lautzenhiser, Sherman, & Eyrl, 2006). However, as mentioned by Huizinga and Smidts(2010), the BRIEF has rarely been adapted for use outside English-speaking countries.Although Dutch (Huizinga & Smidts, 2010), Norwegian (Egeland & Fallmyr, 2010), andPortuguese (Santos, Ribeiro, & Miranda-Correia, 2010) versions are now available, theFrench-language version (Roy, Fournet, Roulin, & Le Gall, 2012) has not yet been used tostudy everyday EF in children.
Hence, the primary objective of the present study was to assess the factorialstructure of the French version of the BRIEF in detail (Roy et al., 2012). In theliterature, various models of the BRIEF have been examined. The results of some ofthese studies do not fully supported the eight clinical scales and two composite indicesused in the current BRIEF protocol. For example, Slick et al. (2006) provided a numberof arguments in favor of splitting the Monitor scale into two parts; in their factorialstudy of children with epilepsy, the Monitor scale strongly loaded two factors (the BRIand the MI). This finding was also reported by Gioia, Isquith, Retzlaff, and Espy(2002), who re-examined the BRIEF data and proposed a three-factor model with anine-scale configuration in which the monitor scale was split into two parts (Self andTask Monitor). The Self-Monitor subscale was associated with the BehavioralRegulation Index (BRI), together with the Inhibit scale, whereas the MetacognitionIndex (MI) consisted of the Task Monitor, Working Memory, Initiate, Plan/Organize,and Organization of Materials scales. Gioia et al. also suggested a new index (theEmotional Regulation Index) comprising the Emotional Control and Shift scales. Aconfirmatory factor analysis (CFA) of the BRIEF supported this division into ninesubscales (rather than eight) in a mixed population of healthy individuals and patients(Egeland & Fallmyr, 2010). For the teacher form of the BRIEF, Peters, Algina, Smithand Daunic (2012) also considered a three-factor model based on a nine-scale divisionand further challenged the two-factor model in the current BRIEF protocol. Eventhough this model (based on a nine-scale subdivision with a three-factor structure)appears to be the best-fitting one, we considered that it was essential to test thestructural invariance with age in a population of healthy subjects.
CFA AND AGE INVARIANCE OF THE BRIEF 3
Dow
nloa
ded
by [
jean
-luc
Rou
lin]
at 0
0:37
26
Apr
il 20
14
Hence, the objectives of the present study were as follows:
1. To report on the psychometric characteristics of the parent and teacher forms of theBRIEF (Gioia, Isquith, Guy, & Kenworthy, 2000b) and to assess the instrument in aFrench population;
2. To evaluate the BRIEF’s structure via CFA with structural equation modelling (SEM).Different models (with one, two, or three factors and eight- or nine-scale divisions) ofthe parent and teacher forms of the French BRIEF were examined for goodness of fitin different age groups;
3. To study the BRIEF’s measurement invariance with age. Various studies of executivefunctioning in children have sought a factorial solution based on the structure observedin adults. The continuing development of frontal structures throughout childhood andthe disparate developmental trajectories observed for EF components suggest that theBRIEF’s factorial structure might change with age.
METHOD
Participants
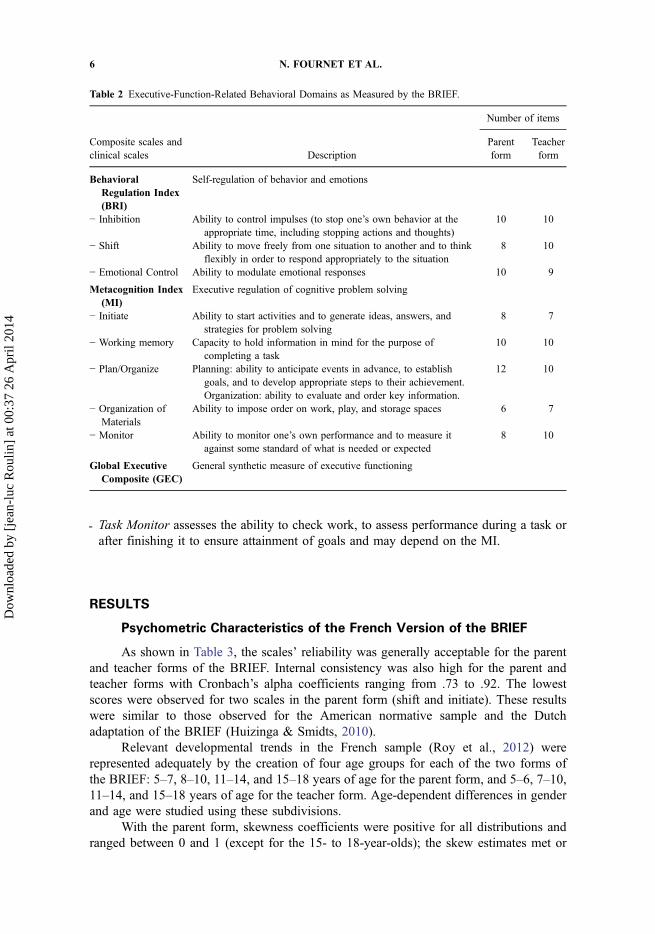
Parents and/or teachers rated EF in 951 healthy children and adolescents (464 boysand 487 girls, aged between 5 and 18 years), using the corresponding form of the Frenchversion of the BRIEF (Table 1). Only one copy of the parent form was provided per child;this could be completed by one parent or both parents.
Participants were recruited via mainstream schools and summer camps in urban andrural areas in France. After approval by the school board, parents were invited (in writing) toenroll in the study and to provide their informed consent to participation. The parents alsocompleted a questionnaire on demographic factors, including parental socioeconomic status,
Table 1 Normative Sample Size as a Function of Age and Gender for the Parent and TeacherForms of the BRIEF.
Age
Parent form Teacher form
Girls Boys Total Girls Boys Total
5 16 24 40 11 16 276 26 33 59 10 14 247 53 48 101 33 28 618 40 41 81 21 28 499 55 56 111 37 38 7510 58 55 113 38 30 6811 59 56 115 34 34 6812 33 38 71 13 15 2813 51 36 87 34 22 5614 32 28 60 18 18 3615 19 18 37 8 8 1616 14 12 26 5 7 1217 23 15 38 9 6 1518 8 4 12 0 1 1Total 487 464 951 271 265 536
4 N. FOURNET ET AL.
Dow
nloa
ded
by [
jean
-luc
Rou
lin]
at 0
0:37
26
Apr
il 20
14
the child’s age, gender, school grade, known or suspected problems during pregnancy,previous and ongoing drug treatments, and the presence of academic or medical support.On the basis of this questionnaire, participants were excluded if they reported having beendiagnosed with developmental, intellectual, psychiatric, or neurological disorders or mentalimpairments. Excluding children with disabilities from the study was a deliberate choice,since we wanted to focus on invariance during development. Indeed, incorporating childrenwith disabilities into the participant sample might have biased the data, since the develop-mental trajectory in pathological subjects may differ from that in healthy subjects.
The parent form sample was subdivided by gender into four different age groups: 5–7 , 8–10, 11–14, and 15–18 years. These age groups correspond to the norms used in theFrench version of the BRIEF.
The teachers of 536 of the 951 healthy children and adolescents (265 boys and 271girls, aged between 5 and 18) completed the teacher form of the French version of theBRIEF (see Table 1). Forms were completed by both parents and teachers for 516children, which enabled us to examine the degree of agreement between the parents’and teachers’ ratings. In France, children change their main teacher when they changegrade. In the present study, the teachers had known the children for at least 3 to 4 months(for 6 months, on average) at the time they filled out the questionnaire. Each teacher wasallowed to complete a BRIEF questionnaire for up to five children in one’s class.
As with the American normative data, the relevant developmental trends in theFrench sample were best represented by the formation of four different age groups for theteacher form (Roy et al., 2012). The sample was therefore subdivided by gender into fourdifferent age groups: 5–6 , 7–10, 11–14, and 15–18 years.
Material and Procedure
The BRIEF assesses behavior associated with executive dysfunction in activities ofdaily living in children aged from 5 to 18. The parent as well as the teacher forms of theBRIEF are both 86-item questionnaires on EF. Parents/teachers are asked to rate theirchild’s/student’s behavior in the last 6 months on a 3-point Likert scale, according towhether the behavior has “Never,” “Sometimes,” or “Often” been a problem. Theseanswers are then coded as ordinal variables (1 = never; 2 = sometimes; 3 = often). Thelast 14 items of the parent form of the BRIEF and the last 13 items of the teacher form ofthe BRIEF were not used to calculate the BRIEF scores (filling items). The BRIEF usuallyyields eight scale scores and three index scores.
The BRI is composed of three scales (Inhibit, Shift, and Emotional Control) and theMI is composed of five scales (Initiate, Working Memory, Plan/Organize, Organization ofMaterials, and Monitor). The GEC index comprises all the scales and is a measure ofoverall EF (see Table 2).
Given that the Monitor subscale has correlated more strongly with the BRI thanwith the MI in many studies (Egeland & Fallmyr, 2010; Gilotty, Kenworthy, Wagner,Sirian, & Black, 2002; McCandless & O’ Laughlin, 2007), Gioia, Isquith, Retzlaff, et al.(2002) suggested that the Monitor scale consists of items related to these two indices andthus dividing it into two subcomponents:
- Self-Monitor allows a child to keep track of the effect of one’s own behavior on othersand to attend one’s own behavior in the social context and may depend more closely onthe BRI.
CFA AND AGE INVARIANCE OF THE BRIEF 5
Dow
nloa
ded
by [
jean
-luc
Rou
lin]
at 0
0:37
26
Apr
il 20
14
- Task Monitor assesses the ability to check work, to assess performance during a task orafter finishing it to ensure attainment of goals and may depend on the MI.
RESULTS
Psychometric Characteristics of the French Version of the BRIEF
As shown in Table 3, the scales’ reliability was generally acceptable for the parentand teacher forms of the BRIEF. Internal consistency was also high for the parent andteacher forms with Cronbach’s alpha coefficients ranging from .73 to .92. The lowestscores were observed for two scales in the parent form (shift and initiate). These resultswere similar to those observed for the American normative sample and the Dutchadaptation of the BRIEF (Huizinga & Smidts, 2010).
Relevant developmental trends in the French sample (Roy et al., 2012) wererepresented adequately by the creation of four age groups for each of the two forms ofthe BRIEF: 5–7, 8–10, 11–14, and 15–18 years of age for the parent form, and 5–6, 7–10,11–14, and 15–18 years of age for the teacher form. Age-dependent differences in genderand age were studied using these subdivisions.
With the parent form, skewness coefficients were positive for all distributions andranged between 0 and 1 (except for the 15- to 18-year-olds); the skew estimates met or
Table 2 Executive-Function-Related Behavioral Domains as Measured by the BRIEF.
Composite scales andclinical scales Description
Number of items
Parentform
Teacherform
BehavioralRegulation Index(BRI)
Self-regulation of behavior and emotions
− Inhibition Ability to control impulses (to stop one’s own behavior at theappropriate time, including stopping actions and thoughts)
10 10
− Shift Ability to move freely from one situation to another and to thinkflexibly in order to respond appropriately to the situation
8 10
− Emotional Control Ability to modulate emotional responses 10 9
Metacognition Index(MI)
Executive regulation of cognitive problem solving
− Initiate Ability to start activities and to generate ideas, answers, andstrategies for problem solving
8 7
− Working memory Capacity to hold information in mind for the purpose ofcompleting a task
10 10
− Plan/Organize Planning: ability to anticipate events in advance, to establishgoals, and to develop appropriate steps to their achievement.Organization: ability to evaluate and order key information.
12 10
− Organization ofMaterials
Ability to impose order on work, play, and storage spaces 6 7
− Monitor Ability to monitor one’s own performance and to measure itagainst some standard of what is needed or expected
8 10
Global ExecutiveComposite (GEC)
General synthetic measure of executive functioning
6 N. FOURNET ET AL.
Dow
nloa
ded
by [
jean
-luc
Rou
lin]
at 0
0:37
26
Apr
il 20
14

exceeded the usual criteria. High skewness values were observed for the WorkingMemory scale (1.38 for the boys and 1.60 for the girls). All the kurtosis coefficientsranged from 1 to –1. As with the skewness coefficients, high kurtosis values wereobserved for the 15- to 18-year-olds on four subscales: Inhibition (for boys and girls),Emotional Control (for boys only), Initiate (for girls only), and Working Memory (forboys and girls). The datasets from the teacher form were not normally distributed; theskewness coefficients generally exceeded 1 (range: 0.17–2.66) and the highest valueswere observed for all scales in the 15–18 group. The kurtosis coefficients were also high(range: –0.15–9.63). The highest values were also observed for the 15–18 group andmostly for the Emotional Control scale. This leptokurtic distribution could be explainedby the teachers’ tendency to give similar answers for all of the children they wereevaluating.
The absence of symmetry and the observation of high kurtosis coefficients in the15–18 group prompted us to exclude this group from subsequent analyses concerning theteacher form of the BRIEF.
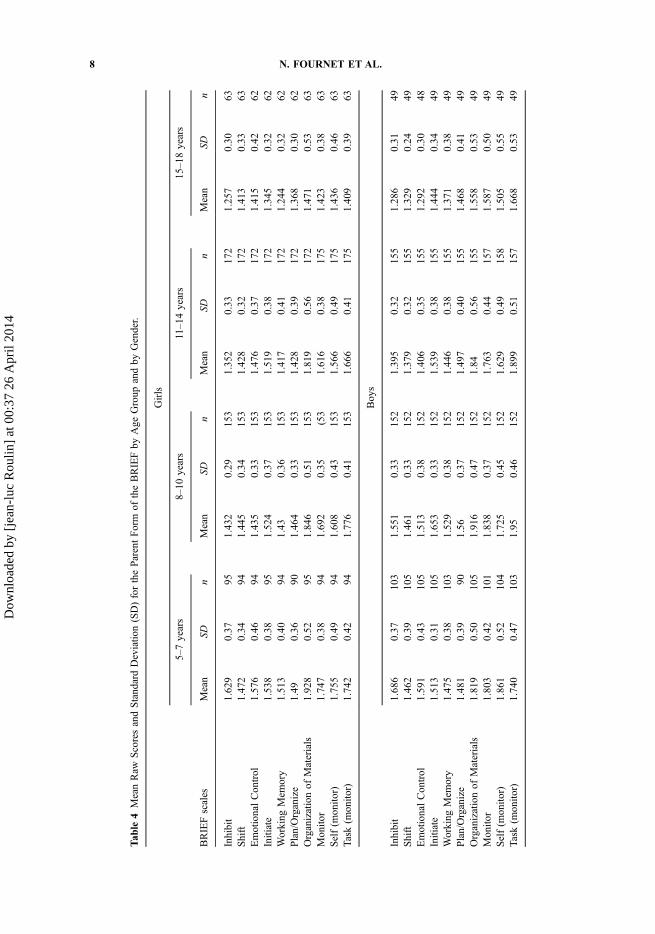
Table 4 gives the mean raw score ratings (range: 1–3) and standard deviations foreach of the eight BRIEF scales. A two-way multivariate analysis of variance (MANOVA)was performed to test for differences between age group and gender means on the BRIEFscales.
For the parent form, a statistically significant MANOVA effect was observed forgender, Wilks’s λ = .95, F(8, 905) = 5.353, p < .001, η2p = .045, and age group, Wilks’sλ = .79, F(24, 2625) = 9.236, p < .001, η2p = .07). The univariate F tests showed asignificant effect of age group on all scales (scores were lower with age) other than theplan/organize scale, F(3, 905) = 1.89, p < .15. A gender effect was also observed (withgirls obtaining lower scores than boys), except for the organization of materials, F(1,905) = 1.611, p < .20, and monitor, F(1, 905) < 1, scales.
For the teacher form, only the three youngest age groups were taken into account. Astatistically significant MANOVA effect was observed for gender, Wilks’s λ = .89, F(8,454) = 6.991, p < .001, η2p = .110, and age group, Wilks’s λ = .87, F(16, 908) = 3.939,p < .001, η2p = .065. The univariate F tests showed a significant effect of age group on allscales (scores were lower with age). A gender effect was observed (with girls obtaininglower scores than boys) for the Inhibition, F(1, 461) = 13.20, p < .001, Plan/Organize,
Table 3 Reliability: Cronbach’s Coefficients for Each of the Eight or Nine Scalesin the Parent and Teacher Forms of the BRIEF.
Parent form Teacher form
BRIEF scale alpha n alpha n
Inhibit .82 937 .89 525Shift .73 932 .86 519Emotional control .86 934 .91 526Initiate .73 934 .88 514Working Memory .86 936 .92 523Plan/Organize .86 904 .88 502Organization of materials .86 939 .90 505Monitor .77 937 .87 519Self (monitor) .73 932 .80 524Task (monitor) .80 921 .87 511
CFA AND AGE INVARIANCE OF THE BRIEF 7
Dow
nloa
ded
by [
jean
-luc
Rou
lin]
at 0
0:37
26
Apr
il 20
14
Tab
le4MeanRaw
ScoresandStand
ardDeviatio
n(SD)fortheParentForm
oftheBRIEFby
Age
Group
andby
Gender.
Girls
BRIEFscales
5–7years
8–10
years
11–1
4years
15–18years
Mean
SDn
Mean
SDn
Mean
SDn
Mean
SDn
Inhibit
1.629
0.37
951.432
0.29
153
1.352
0.33
172
1.257
0.30
63Shift
1.472
0.34
941.445
0.34
153
1.428
0.32
172
1.413
0.33
63EmotionalControl
1.576
0.46
941.435
0.33
153
1.476
0.37
172
1.415
0.42
62Initiate
1.538
0.38
951.524
0.37
153
1.519
0.38
172
1.345
0.32
62Working
Mem
ory
1.513
0.40
941.43
0.36
153
1.417
0.41
172
1.244
0.32
62Plan/Organize
1.49
0.36
901.464
0.33
153
1.428
0.39
172
1.368
0.30
62Organizationof
Materials
1.928
0.52
951.846
0.51
153
1.819
0.56
172
1.471
0.53
63Monito
r1.747
0.38
941.692
0.35
(53
1.616
0.38
175
1.423
0.38
63Self(m
onito
r)1.755
0.49
941.608
0.43
153
1.566
0.49
175
1.436
0.46
63Task
(monito
r)1.742
0.42
941.776
0.41
153
1.666
0.41
175
1.409
0.39
63
Boys
Inhibit
1.686
0.37
103
1.551
0.33
152
1.395
0.32
155
1.286
0.31
49Shift
1.462
0.39
105
1.461
0.33
152
1.379
0.32
155
1.329
0.24
49EmotionalControl
1.591
0.43
105
1.513
0.38
152
1.406
0.35
155
1.292
0.30
48Initiate
1.513
0.31
105
1.653
0.33
152
1.539
0.38
155
1.444
0.34
49Working
Mem
ory
1.475
0.38
103
1.529
0.38
152
1.446
0.38
155
1.371
0.38
49Plan/Organize
1.481
0.39
901.56
0.37
152
1.497
0.40
155
1.468
0.41
49Organizationof
Materials
1.819
0.50
105
1.916
0.47
152
1.84
0.56
155
1.558
0.53
49Monito
r1.803
0.42
101
1.838
0.37
152
1.763
0.44
157
1.587
0.50
49Self(m
onito
r)1.861
0.52
104
1.725
0.45
152
1.629
0.49
158
1.505
0.55
49Task
(monito
r)1.740
0.47
103
1.95
0.46
152
1.899
0.51
157
1.668
0.53
49
8 N. FOURNET ET AL.
Dow
nloa
ded
by [
jean
-luc
Rou
lin]
at 0
0:37
26
Apr
il 20
14

F(1, 461) = 6.85, p = .009, Organization of Materials, F(1, 461) = 31.82, p < .001, andmonitor scales, F(1, 461) = 15.32, p < .001.
Confirmatory Factor Analysis
One of the present study’s main objective was to address the following questions:To what extent are the different subscales of the BRIEF distinguishable (eight scales vs.nine scales)? How do the scales relate to one another? Are the data organized into a single,general executive factor, two factors (behavioral regulation and metacognition) or threefactors (behavioral regulation, emotional regulation, and metacognition)? These questionswere addressed by using CFA analyses to evaluate an a priori model (i.e., a model basedon theoretical considerations) with eight or nine subscales in terms of its fit to theobserved data and to compare a number of alternative hypotheses. The single-factormodel (reflecting the unitary hypothesis of EF) was based on eight or nine scales (referredto as 8S1F and 9S1F models, respectively). The Gioia et al. (2000b) eight-scale, two-factor (8S2F) model was also considered, as it is frequently used in clinical practice as areference for the parent and teacher forms of the BRIEF. We also studied a 9S2F model.Lastly, a nine-scale, three-factor (9S3F) model was specified, based on a nine-scalestructure and the factor structures found in a mixed clinical sample (attention deficit/hyperactivity disorder) and a control sample (Egeland & Fallmyr, 2010). The five modelsare summarized in Table 5.
Confirmatory factor analysis using SEM was performed with the Lavaan softwarepackage (Version 0.5–14) with R (Rosseel, 2012). This method evaluated the adequacy ofa proposed factor structure. In general, a chi-squared statistic is used as an absolute indexof goodness of fit. However, given that chi-squared is sensitive to the sample size andtends to be significant in large samples, additional fit indices were assessed. In all derivedmodels, goodness of-fit was assessed with the common fit index (Jackson, Gillaspy, &Purc-Stephenson, 2009). The model fit is considered to be satisfactory if (a) the adjustedgoodness-of-fit index (AGFI) is above .90 and (b) the root mean square error of
Table 5 Decomposition of the BRIEF into Eight or Nine Scales (Leading to Five Models).
Number of scales8 9
Number of factors 1 2 1 2 3
Model8S1F 8S2F 9S1F 9S2F 9S3F
Index BRI MI BRI MI BRI ERI MI
Inhibit x x x x xShift x x x x xEmotional Control x x x x xInitiate x x x x xWorking Memory x x x x xPlan/Organize x x x x xOrganization of Materials x x x x xMonitor x xSelf (monitor) x x xTask (monitor) x x x
Note. BRI = behavioral regulation index; MI = metacognition index; ERI = emotional regulation index.
CFA AND AGE INVARIANCE OF THE BRIEF 9
Dow
nloa
ded
by [
jean
-luc
Rou
lin]
at 0
0:37
26
Apr
il 20
14
approximation (RMSEA) and the standardized root mean square residual (SRMR) arebelow .08. Incremental fit indices were also considered: The comparative fit index (CFI)and Tucker-Lewis index (TLI) must be greater than .95. Lastly, the Akaike informationcriterion (AIC, a parsimony fit index) must be low (i.e., the model that produces thelowest value is the best).
To determine how well the model fit the sample data, we employed the robustmaximum likelihood estimator, which produces standard errors and tests of fit that arerobust in relation to non-normal continuous data (Brown, 2006, p. 379). Although theproportion of missing data from respondents was low (below 2%), respondents withmissing data above this threshold were nevertheless removed from the analysis.
For the parent and teacher forms of the BRIEF, the SEM analyses were first carriedout for the overall sample and then for each age group. The five models were thencompared for adequacy of fit. Table 6 summarizes the fit indices for the parent form data.
For the Parent Form. The eight- and nine-scale single-factor (8S1F and 9S1F)models fit the data poorly with regard to almost all the fit criteria. This was true for theoverall sample and for each age group (Table 6). The 9S3F model’s goodness of fitsuggests that the BRIEF’s internal structure is including latent Behavioral Regulation,Emotional Regulation, and Metacognition factors. However, the fit for the 9S2F model isalso quite good.
The 9S3F model has the lowest chi-squared for the overall sample, χ2 = 158.522,p < .001, and for the 5- to 7-year-old group, χ2 = 43.319, p < .01, the 8–10 group,χ2 = 70.864, p < .001, the 11–14 group, χ2 = 51.864, p < .01, and the 15–18 group,χ2 = 58.216, p < .001. Even though the 9S3F model did not have the lowest AIC, thevalues of the other indices prompt us to consider that the model’s fit is satisfactory. For theoverall sample, the SRMR (.039) and the RMSEA (.078) were lower for the 9S3F modelthan for the other models. The CFI, TLI, and AGFI were .964, .945, and .988, respec-tively. The 9S2F model (which included latent behavioral regulation and metacognitionfactors) also fit the observed data well; for the overall sample, the CFI was .954, the TLIwas .936, the SRMR was .042, and the RMSEA was .084.
For the Teacher Form. The same CFA was applied to data obtained from theteacher form of the BRIEF (first in the pooled three youngest age groups and then in eachage group). In view of convergence problems and poor fits, we only present the goodness-of-fit indices for the 9S3F model here (see Table 7).
The 9S3F model (the best fit for the parent form), did not provide an acceptable fitfor the teacher form of the BRIEF (RMSEA > .08 in all groups; CFI < .90 in all groupsother than the 11- to 14-year-olds; TLI < .90). An acceptable model did not emerge fromthe CFA analysis in the teacher form of the BRIEF.
Measurement Invariance for the Parent Form of the BRIEF
We also studied measurement invariance, in order to check whether the structurederived from the 9S3F model for the parent form of the BRIEF was indeed present in eachof the various age groups. An internal structure in line with what would be expected, asevidenced in the previous analysis, does not necessarily mean that this structure will bemaintained for the different age groups. Usually, one considers that if equal factor
10 N. FOURNET ET AL.
Dow
nloa
ded
by [
jean
-luc
Rou
lin]
at 0
0:37
26
Apr
il 20
14

loadings do not significantly worsen a model’s fit, then the indicators have similarrelationships with the latent EF construct in the different groups. The test for measurementinvariance was performed first on unconstrained models (for all age groups pooled) andthen on a model in which some parameters were constrained to be equal in all the groups:equality of factor loadings (in order to analyze metric invariance); equality of factor
Table 6 Goodness-of-Fit Indices for the Different Models for the Parent Form of the BRIEF.
Group Fit Index Model χ2 df CFI TLI AIC RMSEA SRMR AGFI
Overall group 8S1F 375.16*** 20 .893 .850 3505.12 .138 .056 .9698S2F 232.71*** 19 .936 .905 3330.96 .110 .043 .9819S1F 543.62*** 27 .860 .814 4871.05 .144 .064 .9559S2F 197.29*** 26 .954 .936 4453.00 .084 .042 .9879S3F 158.52*** 24 .964 .945 4410.62 .078 .039 .988
5–7 years 8S1F 113.42*** 20 .864 .810 814.38 .161 .070 .9578S2F 72.98*** 19 .921 .884 768.59 .126 .051 .9739S1F 147.31*** 27 .835 .781 1104.89 .157 .077 .9429S2F 68.99*** 26 .941 .919 1013.98 .096 .055 .9769S3F 43.32** 24 .974 .960 988.73 .067 .047 .984
8–10 years 8S1F 114.34*** 20 .916 .882 892.67 .124 .052 .9798S2F 86.40*** 19 .940 .911 862.54 .108 .046 .9839S1F 173.01*** 27 .878 .838 1349.82 .133 .061 .9719S2F 82.57*** 26 .953 .935 1248.37 .084 .044 .9879S3F 70.86*** 24 .961 .941 1238.37 .080 .038 .987
11–14 years 8S1F 113.19*** 20 .910 .874 1343.30 .118 .056 .9738S2F 67.64*** 19 .953 .931 1288.30 .088 .043 .9849S1F 184.54*** 27 .869 .825 1822.67 .133 .066 .9569S2F 57.77*** 26 .974 .963 1669.61 .061 .042 .9899S3F 51.86** 24 .977 .965 1666.51 .059 .040 .989
15–18 years 8S1F 71.57*** 20 .889 .845 230.54 .153 .060 .9528S2F 53.82*** 19 .925 .890 209.49 .129 .052 .9629S1F 92.17*** 27 .878 .838 339.47 .148 .063 .9449S2F 65.05*** 26 .927 .899 307.77 .117 .055 .9599S3F 58.22*** 24 .936 .904 301.98 .114 .057 .961
Notes. 8S1F = model with eight scales and one factor; 8S2F = model with eight scales and two factorsextracted; 9S1F = model with nine scales and one factor extracted; 9S2F = model with nine scales and twofactors extracted; 9S3F = model with nine scales and three factors extracted; χ2= chi-square scaled score;df = degrees of freedom; CFI = comparative fit index (scaled); TLI = Tucker-Lewis index (scaled);AIC = Akaike information criterion; RMSEA = root mean square error of approximation (scaled);SRMR = standardized root mean square residual; AGFI = adjusted goodness-of-fit index.**p < .01. ***p < .001.
Table 7 Goodness-of-Fit Indices (Scaled Scores) for the 9S3F Model for the Teacher Form of the BRIEF.
Fit Index Group χ2 df CFI TLI AIC RMSEA SRMR AGFI
Overall group 125.86*** 24 .864 .796 331.18 .165 .098 .9245–6 years 76.89*** 24 .825 .738 −28.16 .241 .107 .9647–10 years 196.81*** 24 .877 .816 719.75 .169 .109 .92311–14 years 79.86*** 24 .920 .880 −343.63 .115 .102 .957
Note. ***p < .001.
CFA AND AGE INVARIANCE OF THE BRIEF 11
Dow
nloa
ded
by [
jean
-luc
Rou
lin]
at 0
0:37
26
Apr
il 20
14
loadings and intercepts (in order to analyze the intercept invariance); and equality of factorloadings, intercepts, and residuals (in order to analyze strict invariance). If the uncon-strained and the constrained-equal models have similar chi-square difference statistics, onecan accept the constrained model and conclude that the model has measurement invar-iance across groups (i.e., the model is the same for each age group).
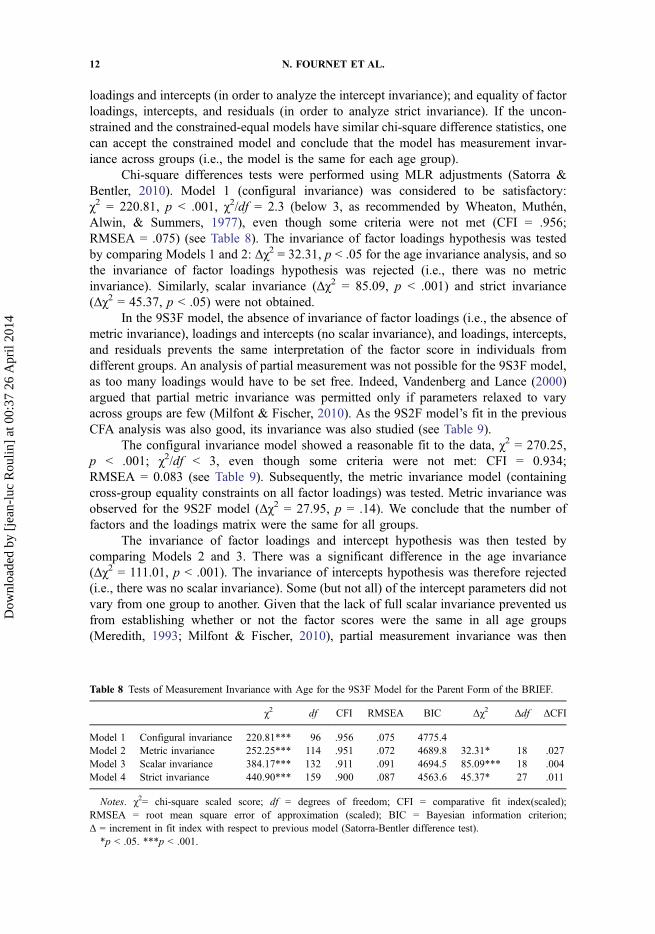
Chi-square differences tests were performed using MLR adjustments (Satorra &Bentler, 2010). Model 1 (configural invariance) was considered to be satisfactory:χ2 = 220.81, p < .001, χ2/df = 2.3 (below 3, as recommended by Wheaton, Muthén,Alwin, & Summers, 1977), even though some criteria were not met (CFI = .956;RMSEA = .075) (see Table 8). The invariance of factor loadings hypothesis was testedby comparing Models 1 and 2: Δχ2 = 32.31, p < .05 for the age invariance analysis, and sothe invariance of factor loadings hypothesis was rejected (i.e., there was no metricinvariance). Similarly, scalar invariance (Δχ2 = 85.09, p < .001) and strict invariance(Δχ2 = 45.37, p < .05) were not obtained.
In the 9S3F model, the absence of invariance of factor loadings (i.e., the absence ofmetric invariance), loadings and intercepts (no scalar invariance), and loadings, intercepts,and residuals prevents the same interpretation of the factor score in individuals fromdifferent groups. An analysis of partial measurement was not possible for the 9S3F model,as too many loadings would have to be set free. Indeed, Vandenberg and Lance (2000)argued that partial metric invariance was permitted only if parameters relaxed to varyacross groups are few (Milfont & Fischer, 2010). As the 9S2F model’s fit in the previousCFA analysis was also good, its invariance was also studied (see Table 9).
The configural invariance model showed a reasonable fit to the data, χ2 = 270.25,p < .001; χ2/df < 3, even though some criteria were not met: CFI = 0.934;RMSEA = 0.083 (see Table 9). Subsequently, the metric invariance model (containingcross-group equality constraints on all factor loadings) was tested. Metric invariance wasobserved for the 9S2F model (Δχ2 = 27.95, p = .14). We conclude that the number offactors and the loadings matrix were the same for all groups.
The invariance of factor loadings and intercept hypothesis was then tested bycomparing Models 2 and 3. There was a significant difference in the age invariance(Δχ2 = 111.01, p < .001). The invariance of intercepts hypothesis was therefore rejected(i.e., there was no scalar invariance). Some (but not all) of the intercept parameters did notvary from one group to another. Given that the lack of full scalar invariance prevented usfrom establishing whether or not the factor scores were the same in all age groups(Meredith, 1993; Milfont & Fischer, 2010), partial measurement invariance was then
Table 8 Tests of Measurement Invariance with Age for the 9S3F Model for the Parent Form of the BRIEF.
χ2 df CFI RMSEA BIC Δχ2 Δdf ΔCFI
Model 1 Configural invariance 220.81*** 96 .956 .075 4775.4Model 2 Metric invariance 252.25*** 114 .951 .072 4689.8 32.31* 18 .027Model 3 Scalar invariance 384.17*** 132 .911 .091 4694.5 85.09*** 18 .004Model 4 Strict invariance 440.90*** 159 .900 .087 4563.6 45.37* 27 .011
Notes. χ2= chi-square scaled score; df = degrees of freedom; CFI = comparative fit index(scaled);RMSEA = root mean square error of approximation (scaled); BIC = Bayesian information criterion;Δ = increment in fit index with respect to previous model (Satorra-Bentler difference test).*p < .05. ***p < .001.
12 N. FOURNET ET AL.
Dow
nloa
ded
by [
jean
-luc
Rou
lin]
at 0
0:37
26
Apr
il 20
14

studied. Model 3a constrained required equal factor loadings for each age group and mostof the specific factors but did not impose equality constraints for Inhibition, Task Monitor,Plan/Organize, and Organization of Materials factors. In contrast to the results for fullscalar invariance, the goodness of fit (chi-squared) for Model 3a (with partial scalarinvariance) was not significantly worse than that of the metric invariance model(Δχ2 = 8.78, p = .46). Model 3a also fitted as well as Model 2 when considering theΔCFI = .003 and was also preferred on the basis of its lower Bayesian informationcriterion (BIC).
Lastly, the invariance of factor loadings, intercepts, and residuals hypothesis ofinvariant loadings, intercepts, and residuals was tested (i.e., strict invariance).Comparisons of Models 3 and 4 revealed significant differences in the chi-square as afunction of the age group (Δχ2 = 61.99, p < .001), and so the hypothesis of strictinvariance was rejected. In the partial strict invariance analysis, the chi-square differencewas significant (Δχ2 = 61.25, p < .001) but the BIC was lower. Based on the number oftests in the model, it is probably safe to ignore the significance difference in the chi-squareanalyses.
Our overall conclusion is that, according to a CFA, there was a reasonable level ofpartial measurement invariance and structural invariance in all four age groups in the9S2F model of the parent form of the BRIEF.
DISCUSSION
Over the past decade, the BRIEF has consistently been the most popular researchinstrument for measuring behavioral EF in children. The present study had three basicobjectives. Our first objective was to examine the psychometric characteristics of theFrench version of the BRIEF parent and teacher forms. Multiple analyses of variance(with the scale scores as dependent variables) revealed large, statistically significant age-related differences (an increase in EF with age) and supported our choice of four agegroups for both the parent and teacher forms of the BRIEF: 5–7, 8–10, 11–14, and 15–18 years. Significant gender differences were also observed for most of the scales, withgirls appearing to be more efficient (as reported by their parents) than boys in terms oftheir EF. The teacher form of the BRIEF showed a leptokurtic distribution (with highskewness and kurtosis coefficients), and so the 15–18 group was eliminated from further
Table 9 Tests of Measurement Invariance with Age for the 9S2F Model for the Parent Form of the BRIEF.
χ2 df CFI RMSEA BIC Δχ2 Δdf ΔCFI
Model 1 Configural invariance 270.25*** 104 .941 .083 4780.9Model 2 Metric invariance 297.20*** 125 .939 .077 4670.3 27.95* 21 .002Model 3 Full Scalar invariance 446.16*** 146 .895 .094 4669.5 111.01*** 21 .045Model 3a Partial scalar invariance 313.84*** 134 .936 .076 4623.3 8.78** 9 .003Model 4 Full Strict invariance 516.17*** 173 .879 .093 4556.2 61.99*** 27 .015Model 4a Partial strict invariance 387.14*** 161 .928 .078 4513.0 61.25*** 27 .008
Notes. χ2= chi-square scaled score; df = degrees of freedom; CFI = comparative fit index (scaled);RMSEA = root mean square error of approximation (scaled); BIC = Bayesian information criterion;Δ = increment in fit index with respect to previous model (Satorra-Bentler difference test).*p = .14. **p = .46. ***p < .001.
CFA AND AGE INVARIANCE OF THE BRIEF 13
Dow
nloa
ded
by [
jean
-luc
Rou
lin]
at 0
0:37
26
Apr
il 20
14
analyses of this form. The remaining three age groups were analyzed for the teacher formof the questionnaire.
The fact that age and gender had effects on both forms of the BRIEF confirms theutility of normative data based on these variables. The scales’ reliability (as measured bythe indices of internal consistency) was generally acceptable for both the parent as well asfor the teacher form.
Secondly, we examined the construct validity of the BRIEF parent form in theFrench sample from the perspective of its factor structure and sought to determine whetherthat structure was invariant across age groups (using multigroup SEM). The 9S3F modelwas the best when considering the various subgroups and the overall study population,with the Self-Monitor and Inhibit scales making up the first factor (BRI), the EmotionalControl and Shift scales making up the second factor (Emotional Regulation Index), andthe Initiate, Working Memory, Plan/Organize, Organization of Materials, and TaskMonitor scales making up the third factor (IM). The 9S3F model had a significantlybetter fit than (a) single-factor models based on either eight or nine scales and (b) thebaseline 8S2F model (Gioia et al., 2000b) (although the latter’s fit was also acceptable). Incontrast, CFA did not produce an acceptable model for the teacher form of the BRIEF.
The third objective of the present work was to study the BRIEF’s invariance with age.As suggested by Huizinga and Smidts (2010, p. 63), “factorial invariance […] is important asit implies that we are measuring the same common factors, MI and BRI, in the four agegroups, and that we therefore can interpret observed age differences as differences withrespect to these factors.” We used SEM to test the stability of the three-factor model via ameasurement invariance test, which requires the factor configuration and factor loadings to bethe same for all groups of interest (Horn & McArdle, 1992; Meredith, 1993). For the parentform of the BRIEF, we established that the 9S3Fmodel has configural invariance with age butnot metric, scalar, or strict invariance: The factor loadings differed from one age group toanother. In other words, we did not measure the same construct in the same way in the variousage groups. It was not possible to analyze partial metric invariance for the model 9S3F, sincethere were too many parameters to be set free across groups. Given that the BRIEF consists ofdata from informants (parents or teachers), one can expect the tolerated difference betweenexpected behavior and observed behavior to change with age. However, since the 9S3Fmodeldid not have measurement invariance with age, the 9S2F model (which also had a good fit inthe all groups in a CFA) was tested for this parameter. The 9S2F model displayed configuralinvariance, meaning that the factorial structure was the same across all tested age groups. The9S2F model also displayed metric invariance, which means that the parents of children fromdifferent age groups responded to the items in the same way. In other words, the relationshipsbetween specific scales and the corresponding, underlying constructs have the same strengthin all age groups. At least partial scalar invariance was also observed, which means that factorscores can be interpreted in the same way for individuals from different groups.
The French version of the BRIEF therefore appears to be a reliable measure ofeveryday EF-related behavior in children. The observed age- and gender-related effectswere similar to those reported for the original BRIEF (developed in the United States) andthe Dutch-language versions (Gioia et al., 2000b; Huizinga & Smidts, 2010), whichfurther validates the questionnaire from a transcultural point of view. More generally, areduction in EF difficulties with age (at least from parents’ and teachers’ standpoints)supports the hypothesis whereby EF is characterized by a protracted development untillate adolescence (e.g., Anderson, Anderson, Northam, Jacobs, & Catroppa, 2001; Lehtoet al., 2003; Welsh, Pennington, & Groisser, 1991). Similarly, greater executive
14 N. FOURNET ET AL.
Dow
nloa
ded
by [
jean
-luc
Rou
lin]
at 0
0:37
26
Apr
il 20
14
dysfunction in boys is consistent with the results of earlier studies based on classicalneuropsychological tests. Although girls tend to outperform boys in some tasks, thepresence of an effect of gender on EF development is subject to debate and has notbeen investigated in depth (Brocki & Bohlin, 2004).
Our multigroup CFA had a number of limitations. The first concerned our analysis ofthe teacher form of the BRIEF. The absence of an acceptable model raises the followingquestion: Is the French version of the teacher form of the BRIEF (Roy et al., 2012) invalid?Should we not use it? It is difficult to state that the scale is invalid on the sole basis of ourpresent multigroup CFA. It would probably be necessary to analyze each of the items morecarefully. Furthermore, a scale that is not discriminant for healthy participants may still bediscriminant in a clinical context (i.e., for children suffering from acquired or neurodevelop-mental disorders). Further research on this point is required. The Peters et al. (2012) study didnot find a lack of fit for the teacher form but was based on an American sample of elementary-school students. This disparity emphasizes the need for cross-cultural studies of an instru-ment’s invariance. It is possible that EFs are viewed differently in different various cultures,that is, cross-cultural factors may affect the expression of executive dysfunction. However,previous studies of the parent form of the BRIEF questionnaire have shown that the factorstructure is the same in different countries, which indicates that a given executive dysfunctiontends to manifest itself in the same way (in behavior terms). Nevertheless, cultural aspects canbe reflected at the school level. For the teacher form of the BRIEF, the French data do notcorrespond to the factor structure identified in the original American study; this may be due tothe countries’ very different school systems.
In conclusion, a multigroup CFA analysis of the parent form of the BRIEF showedthat this instrument has a nine-scale structure (rather than an eight-scale structure). Forreasons of parsimony and because partial invariance between age groups was observed,we concluded that the 9S2F model was the best one for our sample of healthy children.
Almost all previous SEM studies of the BRIEF’s structure were performed on amixture of clinical subjects and healthy controls. The authors’ justification for this choiceof sample (see Egeland & Fallmyr, 2010, p. 336) was that “small variability in ahomogeneous group may falsely lead to a unidimensional factor due to normal scoreson all scales.” Our results clearly demonstrate that use of a healthy control sample doesnot lead to a unidimensional factor, since a 9S2F model gave the best fit in thispopulation. In the Dutch-language version, Huizinga and Smidts (2010) observed amultidimensional structure (an 8S2F model) with healthy subjects but did not test thenine-scale hypothesis. It would be interesting to perform a CFA with different clinicalgroups in order to test for measurement invariance. The 9S2F structure has also beensuggested for normative data from the adult version of the BRIEF (Roth, Isquith, & Gioia,2005). Our results are also in broad agreement with Slick et al.’s (2006) study of theparent form of the BRIEF in children with epilepsy; the latter researchers suggested theuse of a two-factor model in which three scales (Emotional Control, Shift, and Inhibit)loaded onto one factor, four scales (Plan/Organize, Working Memory, Initiate,Organization of Materials) loaded onto another factor, and the Monitor scale loadedonto both factors. Separating out the Monitor scale (leading to nine scales instead ofeight) has been suggested in previous CFA-based studies of the parent form of the BRIEF(Egeland & Fallmyr, 2010; Gioia, Isquith, Retzlaff, et al., 2002), albeit with a three-factorsubdivision. Only Gioia, Isquith, Retzlaff, et al. (2002) directly compared a 9S3F modelwith a 9S2F model. Even though Gioia et al. recommended the 9S2F model for theParents Form of the BRIEF, the published French normative dataset includes 8 scales and
CFA AND AGE INVARIANCE OF THE BRIEF 15
Dow
nloa
ded
by [
jean
-luc
Rou
lin]
at 0
0:37
26
Apr
il 20
14
2 factors (as did the original American dataset). Concluding that a 9S2F model is best (onthe basis of a multigroup CFA) does not modify the overall analysis in clinical practicebecause only one subscale is divided into two parts. As recommended by Gioia et al.(2000b; Gioia, Isquith, Retzlaff, et al., 2002), practitioners and researchers can continue tointerpret the standard eight scales and two factors (as proposed in the published normativedata) but may also consider the fact that the Monitor scale loads onto both factors. Peterset al. (2012) questioned the utility of revising the BRIEF protocols and scoring program.This argument can also be applied to the French version of the BRIEF.
Parent- or teacher-rated measures may be valuable for the assessment of childrenwith suspected impairments in EF—particularly when these impairments are due to braininjury or developmental or psychiatric diseases. It is important to bear in mind that theBRIEF is not a direct test of EF and should not be interpreted in isolation. Recent researchsuggests that the BRIEF can be used as a clinical tool for assessing a broad range of issuesbut has also raised questions about the BRIEF’s relationship with the performance-basedtasks that are commonly used to assess EF. Indeed, none of the BRIEF indices wereassociated with children’s scores in performance-based EF tasks (Bodnar, Prahme,Cutting, Denckla, & Mahone, 2007; McAuley, Chen, Goos, Schachar, & Crosbie,2010). This finding suggests that (a) it is preferable to examine EF in children throughmultiple sources, and (b) BRIEF results should be integrated with the results of perfor-mance-based tests and clinical interviews. Whenever possible, we should employ multipleindicators of the constructs we assess. Similarly, it appears especially necessary (whenassessing child’s real-life behavior with questionnaires) to compare opinions from at leasttwo different settings (typically home and school). The parent versus teacher divergencein opinion of EF observed in the present study supports this idea and may result from theinherent limitations of this type of method (i.e., a subjective assessment that is related toemotional issues and social representations, for example). Therefore, the use of EF testsand naturalistic observations should be supplemented with questionnaires or inventoriesthat (a) focus on the everyday consequences of executive dysfunction and (b) includeseveral points of view. Moreover, using questionnaires such as the BRIEF is particularlybeneficial for assessing changes in the severity of everyday executive dysfunction, inparallel with the standard neuropsychological examination.
In summary, the parent and teacher forms of the BRIEF were acceptably reliable.Demographic variables (age and gender) influenced the ratings. In the parent form, twoCFA models had a good fit: One had with a bipartite latent structure based on a nine-scaledivision and the other had a three-factor latent structure based on a nine-scale division.However, given that the three-factor latent structure did not display measurement invar-iance and the two-factor model had partial measurement invariance, we chose to favor thelatter factorial structure; that is, in addition to a general factor of executive functioning(GEC Index) based on a nine-scale division, it also measured specific factors correspond-ing to the Behavioral Regulation and Metacognition indices. The French version of theBRIEF provides a useful measure of everyday executive functioning for use in clinicalresearch and practice and can be used in parallel with more direct measures of EF. Assame structures are supposed in different cultures, a cross-cultural study could be of valuefor assessing clinical and theoretical aspects of EF.
Original manuscript received October 1, 2013Revised manuscript accepted March 16, 2014
First published online April 21, 2014
16 N. FOURNET ET AL.
Dow
nloa
ded
by [
jean
-luc
Rou
lin]
at 0
0:37
26
Apr
il 20
14
REFERENCES
Alexander, G. E., DeLong, M. R., & Strick, P. L. (1986). Parallel organization of functionallysegregated circuits linking basal ganglia and cortex. Annual Review of Neuroscience, 9, 357–381. doi:10.1146/annurev.ne.09.030186.002041
Alloway, T. P., Gathercole, S. E., Holmes, J., Place, M., Elliott, J. G., & Hilton, K. (2009). Thediagnostic utility of behavioral checklists in identifying children with ADHD and children withworking memory deficits. Child Psychiatry and Human Development, 40(3), 353–366.doi:10.1007/s10578-009-0131-3
Anderson, P., Northam, E., Jacobs, R., Mikiewicz, O., & Anderson, V. A. (2002). Relationshipsbetween cognitive and behavioral measures of executive function in children with braindisease. Child Neuropsychology (Neuropsychology, Development and Cognition: Section C),8(4), 231–240. doi:10.1076/chin.8.4.231.13509
Anderson, V. A., Anderson, P., Northam, E., Jacobs, R., & Catroppa, C. (2001). Development ofexecutive functions through late childhood and adolescence in an Australian sample.Developmental Neuropsychology, 20(1), 385–406. doi:10.1207/S15326942DN2001_5
Barkley, R. A. (1997). Behavioral inhibition, sustained attention, and executive functions:Constructing a unifying theory of ADHD. Psychological Bulletin, 121(1), 65–94.doi:10.1037/0033-2909.121.1.65
Best, J. R., & Miller, P. H. (2010). A developmental perspective on executive function. ChildDevelopment, 81(6), 1641–1660. doi:10.1111/j.1467-8624.2010.01499.x
Bodnar, L. E., Prahme, M. C., Cutting, L. E., Denckla, M. B., & Mahone, E. M. (2007). Constructvalidity of parent ratings of inhibitory control. Child Neuropsychology : A Journal on Normaland Abnormal Development in Childhood and Adolescence, 13(4), 345–362. doi:10.1080/09297040600899867
Brocki, K. C., & Bohlin, G. (2004). Executive functions in children aged 6 to 13: A dimensional anddevelopmental study. Developmental Neuropsychology, 26(2), 571–593. doi:10.1207/s15326942dn2602_3
Brown, T. A. (2006). Confirmatory factor analysis for applied research (p. 475). New York, NY:Guilford Press.
Chaytor, N., & Schmitter-Edgecombe, M. (2003). The ecological validity of neuropsychologicaltests: A review of the literature on everyday cognitive skills. Neuropsychology Review, 13(4),181–197. doi:10.1023/B:NERV.0000009483.91468.fb
Cummings, J. L. (1993). Frontal-subcortical circuits and human behavior. Archives of Neurology, 50(8), 873–880. doi:10.1001/archneur.1993.00540080076020
Denckla, M. B. (1996). Research on executive function in a neurodevelopmental context:Application of clinical measures. Developmental Neuropsychology, 12(1), 5–15. doi:10.1080/87565649609540637
Dennis, M. (2006). Prefrontal cortex: Typical and atypical development. In J. Risberg & J. Grafman(Eds.), The frontal lobes: Development, function and pathology (pp. 128–162). New York, NY:Cambridge University Press.
Egeland, J., & Fallmyr, Ø. (2010). Confirmatory factor analysis of the Behavior Rating Inventory ofExecutive Function (BRIEF): Support for a distinction between emotional and behavioralregulation. Child Neuropsychology: A Journal on Normal and Abnormal Development inChildhood and Adolescence, 16(4), 326–337. doi:10.1080/09297041003601462
Gathercole, S. E., Alloway, T. P., Kirkwood, H. J., Elliott, J. G., Holmes, J., & Hilton, K. A. (2008).Attentional and executive function behaviours in children with poor working memory.Learning and Individual Differences, 18(2), 214–223. doi:10.1016/j.lindif.2007.10.003
Gilotty, L., Kenworthy, L., Wagner, A. E., Sirian, L., & Black, D. O. (2002). Adaptive skills andexecutive function in autism spectrum disorders. Child Neuropsychology (Neuropsychology,Development and Cognition: Section C), 8(4), 241–248. doi:10.1076/chin.8.4.241.13504
CFA AND AGE INVARIANCE OF THE BRIEF 17
Dow
nloa
ded
by [
jean
-luc
Rou
lin]
at 0
0:37
26
Apr
il 20
14

Gioia, G. A., Isquith, P. K., Guy, S. C., & Kenworthy, L. (2000a). Test review behavior ratinginventory of executive function. Child Neuropsychology (Neuropsychology, Development andCognition: Section C), 6(3), 235–238. doi:10.1076/chin.6.3.235.3152
Gioia, G. A., Isquith, P. K., Guy, S. C., & Kenworthy, L. (2000b). Behavior rating inventory ofexecutive function professional manual. Lutz, FL: Psychological Assessment Resources.
Gioia, G. A., Isquith, P. K., Kenworthy, L., & Barton, R. M. (2002). Profiles of everyday executivefunction in acquired and developmental disorders. Child Neuropsychology (Neuropsychology,Development and Cognition: Section C), 8(2), 121–137. doi:10.1076/chin.8.2.121.8727
Gioia, G., Isquith, P. K., Retzlaff, P. D., & Espy, K. (2002). Confirmatory factor analysis of theBehavior Rating Inventory of Executive Function (BRIEF) in a clinical sample. ChildNeuropsychology (Neuropsychology, Development and Cognition: Section C), 8(4), 249–257.doi:10.1076/chin.8.4.249.13513
Heaton, R. K., Chelune, G., Talley, J. L., Kay, G. G., & Curtis, G. (1993). Wisconsin Card SortingTest (WCST) manual revised and expanded. Odessa: Psychological Assesment Ressources.
Horn, J. L., & McArdle, J. J. (1992). A practical and theoretical guide to measurement invariance inaging research. Experimental Aging Research, 18(3), 117–144. doi:10.1080/03610739208253916
Huizinga, M., Dolan, C. V., & van der Molen, M. W. (2006). Age-related change in executivefunction: Developmental trends and a latent variable analysis. Neuropsychologia, 44(11),2017–2036. doi:10.1016/j.neuropsychologia.2006.01.010
Huizinga, M., & Smidts, D. P. (2010). Age-related changes in executive function: A normative studywith the Dutch version of the Behavior Rating Inventory of Executive Function (BRIEF). ChildNeuropsychology, 17(1), 51–66. doi:10.1080/09297049.2010.509715
Jackson, D. L., Gillaspy, J. A., & Purc-Stephenson, R. (2009). Reporting practices in confirmatoryfactor analysis: An overview and some recommendations. Psychological Methods, 14(1), 6–23.doi:10.1037/a0014694
Lehto, J. E., Juujärvi, P., Kooistra, L., & Pulkkinen, L. (2003). Dimensions of executive functioning:Evidence from children. British Journal of Developmental Psychology, 21(1), 59–80.doi:10.1348/026151003321164627
Levin, H. S., Culhane, K. A., Hartmann, J., Evankovich, K., Mattson, A. J., Harward, H., …Fletcher, J. M. (1991). Developmental changes in performance on tests of purported frontallobe functioning. Developmental Neuropsychology, 7(3), 377–395. doi:10.1080/87565649109540499
Lezak, M. D., Howieson, D. B., & Loring, D. W. (2004). Neuropsychological assessment (4th ed.).New York, NY: Oxford University Press.
Mahone, E. (2002). Validity of the Behavior Rating Inventory of Executive Function in childrenwith ADHD and/or Tourette syndrome. Archives of Clinical Neuropsychology, 17(7), 643–662.doi:10.1016/S0887-6177(01)00168-8
McAuley, T., Chen, S., Goos, L., Schachar, R., & Crosbie, J. (2010). Is the Behavior RatingInventory of Executive Function more strongly associated with measures of impairment orexecutive function? Journal of the International Neuropsychological Society: JINS, 16(3),495–505. doi:10.1017/S1355617710000093
McCandless, S., & O’ Laughlin, L. (2007). The clinical utility of the Behavior Rating Inventory ofExecutive Function (BRIEF) in the diagnosis of ADHD. Journal of Attention Disorders, 10(4),381–389. doi:10.1177/1087054706292115
Meredith, W. (1993). Measurement invariance, factor analysis and factorial invariance.Psychometrika, 58(4), 525–543. doi:10.1007/BF02294825
Milfont, T. L., & Fischer, R. (2010). Testing measurement invariance across groups: Applications incross cultural research. International Journal of Psychological Research, 3(1), 111–121.
Miyake, A., Friedman, N. P., Emerson, M. J., Witzki, A. H., Howerter, A., & Wager, T. D. (2000).The unity and diversity of executive functions and their contributions to complex “Frontal
18 N. FOURNET ET AL.
Dow
nloa
ded
by [
jean
-luc
Rou
lin]
at 0
0:37
26
Apr
il 20
14
Lobe” tasks: A latent variable analysis. Cognitive Psychology, 41(1), 49–100. doi:10.1006/cogp.1999.0734
Pennington, B. F. (1997). Dimensions of executive functions in normal and abnormal development.In N. A. Krasnegor, G. R. Lyon, & P. S. Goldman-Rakic (Eds.), Development of the prefrontalcortex: Evolution, neurobiology, and behavior (pp. 265–281). Baltimore, MD: Paul H. BrookesPublishing.
Peters, C., Algina, J., Smith, S. W., & Daunic, A. P. (2012). Factorial validity of the Behavior RatingInventory of Executive Function (BRIEF)-Teacher form. Child Neuropsychology: A Journal onNormal and Abnormal Development in Childhood and Adolescence, 18(2), 168–181.doi:10.1080/09297049.2011.594427
Reddy, L. A., Hale, J. B., & Brodzinsky, L. K. (2011). Discriminant validity of the Behavior RatingInventory of Executive Function Parent Form for children with attention-deficit/hyperactivitydisorder. School Psychology Quarterly, 26(1), 45–55. doi:10.1037/a0022585
Robinson, J. A., & Swanson, K. L. (1990). Autobiographical memory: The next phase. AppliedCognitive Psychology, 4(4), 321–335. doi:10.1002/acp.2350040407
Robinson, S., Goddard, L., Dritschel, B., Wisley, M., & Howlin, P. (2009). Executive functions inchildren with autism spectrum disorders. Brain and Cognition, 71(3), 362–368. doi:10.1016/j.bandc.2009.06.007
Romine, C. B., & Reynolds, C. R. (2005). A model of the development of frontal lobe functioning:Findings from a meta-analysis. Applied Neuropsychology, 12(4), 190–201. doi:10.1207/s15324826an1204_2
Rosseel, Y. (2012). lavaan: An R package for structural equation. Journal of Stastitical Software, 48(2), 1–36. Retrieved from http://www.jstatsoft.org/v48/i02
Roth, R. M., Isquith, P. K., & Gioia, G. A. (2005). BRIEF-A: Behavior Rating Inventory ofExecutive Function – Adult version. Lutz, FL: Psychological Assesment Ressources.
Roy, A., Fournet, N., Roulin, J.-L., & Le Gall, D. (2012). BRIEF: Inventaire d’évaluation compor-tementale des fonctions executives. Paris: Editions Hogrefe France.
Roy, A., Roulin, J.-L., Charbonnier, V., Allain, P., Fasotti, L., Barbarot, S., … Le Gall D. (2010).Executive dysfunction in children with neurofibromatosis type 1: A study of action planning.Journal of the International Neuropsychological Society: JINS, 16(06), 1056–1063.doi:10.1017/S135561771000086X
Russo, N., Flanagan, T., Iarocci, G., Berringer, D., Zelazo, P. D., & Burack, J. A. (2007).Deconstructing executive deficits among persons with autism: Implications for cognitiveneuroscience. Brain and Cognition, 65(1), 77–86. doi:10.1016/j.bandc.2006.04.007
Santos, A., Ribeiro, I., & Miranda-Correia, L. (2010). Assessing executive functions of Portugueseschool-age students using the BRIEF. Procedia – Social and Behavioral Sciences, 9, 1251–1255. doi:10.1016/j.sbspro.2010.12.315
Satorra, A., & Bentler, P. M. (2010). Ensuring positiveness of the scaled chi-square test statistic.Psychometrika, 75, 243–248. doi:10.1007/s11336-009-9135-y
Shallice, T. (1982). Specific impairments of planning. Philosophical Transactions of the RoyalSociety B: Biological Sciences, 298(1089), 199–209. doi:10.1098/rstb.1982.0082
Slick, D. J., Lautzenhiser, A., Sherman, E. M. S., & Eyrl, K. (2006). Frequency of scale elevationsand factor structure of the Behavior Rating Inventory of Executive Function (BRIEF) inchildren and adolescents with intractable epilepsy. Child Neuropsychology: A Journal onNormal and Abnormal Development in Childhood and Adolescence, 12(3), 181–189.doi:10.1080/09297040600611320
Vandenberg, R. J., & Lance, C. E. (2000). A review and synthesis of the measurement invarianceliterature: Suggestions, practices, and recommendations for organizational research.Organizational Research Methods, 3, 4–69.
Welsh, M. C., Pennington, B. F., & Groisser, D. B. (1991). A normative‐developmental study ofexecutive function: A window on prefrontal function in children. DevelopmentalNeuropsychology, 7(2), 131–149. doi:10.1080/87565649109540483
CFA AND AGE INVARIANCE OF THE BRIEF 19
Dow
nloa
ded
by [
jean
-luc
Rou
lin]
at 0
0:37
26
Apr
il 20
14

Wheaton, B., Muthén, B., Alwin, D. F., & Summers, G. F. (1977). Assessing reliability and stabilityin panel models. In D. Heise (Ed.), Sociological methodology (pp. 84–136). San Francisco,CA: Jossey-Bass.
Willcutt, E. G., Doyle, A. E., Nigg, J. T., Faraone, S. V., & Pennington, B. F. (2005). Validity of theexecutive function theory of attention-deficit/hyperactivity disorder: A meta-analytic review.Biological Psychiatry, 57(11), 1336–1346. doi:10.1016/j.biopsych.2005.02.006
Wilson, B. A. (1993). Ecological validity of neuropsychological assessment: Do neuropsychologicalindexes predict performance in everyday activities? Applied and Preventive Psychology, 2(4),209–215. doi:10.1016/S0962-1849(05)80091-5
20 N. FOURNET ET AL.
Dow
nloa
ded
by [
jean
-luc
Rou
lin]
at 0
0:37
26
Apr
il 20
14