Critical success factors for e-learning acceptance: Confirmatory factor models
18
Computers & Education 49 (2007) 396–413 www.elsevier.com/locate/compedu 0360-1315/$ - see front matter © 2005 Elsevier Ltd. All rights reserved. doi:10.1016/j.compedu.2005.09.004 Critical success factors for e-learning acceptance: ConWrmatory factor models Hassan M. Selim ¤ Department of Business Administration, College of Business and Economics, United Arab Emirates University, Al Ain P.O. Box 17555, United Arab Emirates Received 9 April 2004; accepted 16 September 2005 Abstract E-learning, one of the tools emerged from information technology, has been integrated in many univer- sity programs. There are several factors that need to be considered while developing or implementing uni- versity curriculums that oVer e-learning based courses. This paper is intended to specify e-learning critical success factors (CSFs) as perceived by university students. The published e-learning critical success factors were surveyed and grouped into 4 categories namely, instructor, student, information technology, and university support. Each category included several measures. The categorization was tested by surveying 538 university students. The results revealed 8 categories of e-learning CSFs, each included several critical e-learning acceptance and success measures. The level of criticality of each measure was represented by its validity coeYcient. ConWrmatory factor modeling approach was used to assess the criticality of the measures included in each CSF category. © 2005 Elsevier Ltd. All rights reserved. Keywords: E-learning; Distance education; Structured equation modeling; ConWrmatory factor model This research was funded by Research AVairs at UAE University under Grant #05-4-11/02. * Tel.: +971 3 713 3202; fax: +971 3 763 2383. E-mail address: [email protected]
-
Upload
royalholloway -
Category
Documents
-
view
0 -
download
0
Transcript of Critical success factors for e-learning acceptance: Confirmatory factor models

Computers & Education 49 (2007) 396–413
www.elsevier.com/locate/compedu
Critical success factors for e-learning acceptance:ConWrmatory factor models �
Hassan M. Selim ¤
Department of Business Administration, College of Business and Economics, United Arab Emirates University,Al Ain P.O. Box 17555, United Arab Emirates
Received 9 April 2004; accepted 16 September 2005
Abstract
E-learning, one of the tools emerged from information technology, has been integrated in many univer-sity programs. There are several factors that need to be considered while developing or implementing uni-versity curriculums that oVer e-learning based courses. This paper is intended to specify e-learning criticalsuccess factors (CSFs) as perceived by university students. The published e-learning critical success factorswere surveyed and grouped into 4 categories namely, instructor, student, information technology, anduniversity support. Each category included several measures. The categorization was tested bysurveying 538 university students. The results revealed 8 categories of e-learning CSFs, each included severalcritical e-learning acceptance and success measures. The level of criticality of each measure was representedby its validity coeYcient. ConWrmatory factor modeling approach was used to assess the criticality of themeasures included in each CSF category.© 2005 Elsevier Ltd. All rights reserved.
Keywords: E-learning; Distance education; Structured equation modeling; ConWrmatory factor model
� This research was funded by Research AVairs at UAE University under Grant #05-4-11/02.* Tel.: +971 3 713 3202; fax: +971 3 763 2383.
E-mail address: [email protected]
0360-1315/$ - see front matter © 2005 Elsevier Ltd. All rights reserved.doi:10.1016/j.compedu.2005.09.004

H.M. Selim / Computers & Education 49 (2007) 396–413 397
1. Introduction
1.1. Literature review
Recently, information technology has been viewed as a solution to universities’ cost and qualityproblems. Information technology in teaching and learning has created a need to transform howuniversity students learn by using more modern, eYcient, and eVective alternative such as e-learn-ing. E-learning concept has been around for decades and is one of the most signiWcant recentdevelopments in the information systems industry (Wang, 2003). E-learning can be viewed as thedelivery of course content via electronic media, such as Internet, Intranets, Extranets, satellitebroadcast, audio/video tape, interactive TV, and CD-ROM (Urdan & Weggen, 2000). E-learningis one of the new learning trends that challenge the traditional “bucket theory” or the bankingconcept of education (Freire, 1994). The banking concept of education assumes that the instructorowns the knowledge and deposits it into the passive students who attend the class (Freire, 1994).E-learning has been viewed as synonymous with web-based learning (WBL), Internet-based train-ing (IBT), advanced distributed learning (ADL), web-based instruction (WBI), online learning(OL) and open/Xexible learning (OFL) (Khan, 2001).
The term Critical success factor (CSF) Wrst appeared in the literature in the 1980s when therewas interest in why some organizations seemed to be more successful than others, and researchwas carried out to investigate the success components (Ingram, Biermann, Cannon, Neil, & Wad-dle, 2000). CSFs are “those things that must be done if a company is to be successful” (Freund,1988). CSFs should be few in number, measurable and controllable. Although there is a largenumber of research articles on e-learning, few of them address the most important issue of e-learn-ing critical success factors. Papp (2000) explored distance learning from a macro perspective andsuggested some critical success factors that can assist faculty and universities in e-leaning environ-ment development. Papp’s e-learning CSFs included intellectual property, suitability of the coursefor e-learning environment, building the e-learning course, e-learning course content, e-learningcourse maintenance, e-learning platform, and measuring the success of an e-learning course. Papp(2000) suggested studying each one of these CSFs in isolation and also as a composite to deter-mine which factor(s) inXuence and impact e-learning success. Benigno and Trentin (2000) sug-gested a framework for the evaluation of e-leaning based courses, focusing on two aspects: the Wrstis evaluating the learning, and the second is evaluating the students’ performance. They consideredfactors such as student characteristics, student–student interaction, eVective support, learningmaterials, learning environment, and information technology.
Volery and Lord (2000) drew upon the results of a survey conducted amongst 47 studentsenrolled in an e-learning based management course at an Australian university. They identiWed threeCSFs in e-learning: technology (ease of access and navigation, interface design and level of interac-tion); instructor (attitudes towards students, instructor technical competence and classroom interac-tion); and previous use of technology from a student’s perspective. Soong, Chan, Chua, and Loh(2001) using a multiple case study, veriWed that the e-learning CSFs are: human factors, technicalcompetency of both instructor and student, e-learning mindset of both instructor and student, levelof collaboration, and perceived information technology infrastructure. They recommended that allthese factors should be considered in a holistic fashion by e-learning adopters. According to studiesconducted by Dillon and Guawardena (1995) and Leidner and Jarvenpaa (1993), three main

398 H.M. Selim / Computers & Education 49 (2007) 396–413
variables aVect the eVectiveness of e-learning environments: technology, instructor characteristics,and student characteristics. Using a survey on the perception of e-learning among postgraduatesenrolled at Curtin Business School, Helmi (2002) concluded that the three driving forces to e-learn-ing are information technology, market demands, and education brokers such as universities.
In an attempt to provide a pedagogical foundation as a prerequisite for successful e-learningimplementation, Govindasamy (2002) discussed seven e-learning quality benchmarks namely,institutional support, course development, teaching and learning, course structure, student sup-port, faculty support, and evaluation and assessment. Based on a comprehensive study by Baylorand Ritchie (2002), the impact of seven independent factors related to educational technology(planning, leadership, curriculum alignment, professional development, technology use, instruc-tor openness to change, and instructor computer use outside school) on Wve dependent measures(instructor’s technology competency, instructor’s technology integration, instructor morale,impact on student content acquisition, and higher order thinking skills acquisition) were studiedusing stepwise regression. The study resulted in models explaining each of the Wve dependentmeasures.
The purpose of e-learning, like any other learning approach, is to achieve the learning objec-tives. The objectives attainment measures can be environmental, technological, student related,and instructor related. In e-learning some of the crucial CSFs are technological, such as band-width, hardware reliability, and network security and accessibility. Another e-learning CSF is stu-dent engagement in learning models. E-learning models are synchronous (real time),asynchronous (anytime and anywhere), or a mix of the two. There are numerous tools thatinstructors can use to adopt an e-learning model: mini-lectures, electronic/conventional discus-sion, active/cooperative learning and many others. The third e-learning CSF is student related.Students must be motivated and committed. In e-learning based courses, students take the respon-sibility of their learning pace.
The objective of this study is to specify the CSF of e-learning acceptance by students. The studyaims at categorizing the e-learning CSFs and specifying the critical factors within each categoryusing conWrmatory factor models.
1.2. E-learning CSF categories
E-learning CSFs within a university environment can be grouped into four categories: (1)instructor; (2) student; (3) information technology; and (4) university support.
As for all educational endeavor, the instructor plays a central role in the eVectiveness andsuccess of e-learning based courses. Collis (1995) and Willis (1994) believed that it is not theinformation technology but the instructional implementation of the IT that determines the eVec-tiveness of e-learning. Webster and Hackley (1997) proposed three instructor characteristics thataVect e-learning success: (1) IT competency; (2) teaching style; and (3) attitude and mindset.Volery and Lord (2000) suggested that instructors provide various forms of oYce hours and con-tact methods with students. Instructors should adopt interactive teaching style, encourage stu-dent–student interaction. It is so important that instructors have good control over IT and iscapable of performing basic troubleshooting tasks.
University students are becoming more diverse and demand for e-learning based courses isincreasing (Papp, 2000; Volery & Lord, 2000). Students need to have time management, discipline,

H.M. Selim / Computers & Education 49 (2007) 396–413 399
and computer skills in order to be successful in the e-learning era. Student prior IT experiencesuch as having a computer at home and attitude towards e-learning is critical to e-learning success.As stated before, research concludes that e-learning based courses compare favorably with tradi-tional learning and e-learning students perform as well or better than traditional learning students(Beyth-Marom, Chajut, Roccas, & Sagiv, 2003). This shows that students like to use e-learning if itfacilitates their learning and allows them to learn any time any where in their own way (Papp,2000).
Information technology (IT) explosion resulted in changes in education. E-learningintegration into university courses is a component of the IT explosion; as a matter of fact IT isthe engine that drives the e-learning revolution. The eYcient and eVective use of IT in deliveringe-learning based components of a course is of critical importance to the success and studentacceptance of e-learning. So ensuring that the university IT infrastructure is rich, reliable andcapable of providing the courses with the necessary tools to make the delivery process assmooth as possible is critical to the success of e-learning. IT tools include network bandwidth,network security, network accessibility, audio and video plug-ins, courseware authoring appli-cations, Internet availability, instructional multimedia services, videoconferencing, course man-agement systems, and user interface.
E-learning projects that were not successful in achieving their goals did not have access totechnical advice and support (Aldexander, McKemzie, & Geissinger, 1998; Soong et al., 2001).If the technical support is lacking, the e-learning will not succeed. University administrationsupport to e-learning is essential for its success. This study limited the e-learning CSF categoriesto those that were reported in the literature while including newly used items within each CSFcategory.
2. Method
2.1. Participants
The courses selected for the study combine both e-learning and traditional learning tools andall of them are laptop-based courses and use active and student centered learning methods. Tradi-tional learning tools used in the selected courses are required attendance, regular textbook, andpresence of instructor during the scheduled class time. E-learning tools used are electronic stu-dent–student and student–instructor communication, asynchronous course material deliveredthrough a Blackboard (adopted course management information system) course web, in-classactive and collaborating learning activities, and student self-pacing pattern.
Data were collected through an anonymous survey instrument administered to 900 undergrad-uate university students during the Fall semester of 2002. Respondents for this study consisted of538 (334 females and 204 males) – a response rate of 60% – undergraduate students enrolled in Wve100-level mandatory laptop-based courses distributed over 37 class sections. The studentsinvolved in this study were obliged to use the technology for all aspects of the course. All theselected courses were oVered by the AACSB accredited college of Business and Economics at theUnited Arab Emirates University (UAEU). UAEU has 5 campuses located in 4 diVerent geo-graphical sites. Table 1 summarizes the demographic proWle and descriptive statistics of the

400 H.M. Selim / Computers & Education 49 (2007) 396–413
respondents. Student ages ranged from 17 to 28 years, with a mean age of 19.98 years (SDD1.256).Students came from 18 diVerent middle eastern countries and cultural backgrounds. They have anaverage GPA of 2.6 with a standard deviation of 0.54. Participants had 8 majors, namely account-ing, economics, Wnance and banking, general business, management, management informationsystems, marketing, and statistics. The exposure to e-learning technologies of the participating stu-dents varied from 1 to 3 years, 38.7% had 1 year of exposure, 36.6% had 2 years, and 24.7% had 3years of exposure. All students participated voluntarily in the study.
2.2. Instrument
A survey instrument for specifying the critical success factors within each category was devel-oped. The survey instrument consisted of 5 sections, a section for each CSF category in addition toa demographic characteristics section. Each CSF category was observed via a group of indicators.Numerous instruments have been developed to measure e-learning satisfaction. Therefore, variouspotential indicators exist to measure each CSF category.
The instructor characteristics construct section included 13 indicators (INS1–INS13) whichassessed the characteristics of instructors (see Appendix for the indicator details). IndicatorsINS1–INS11 were adopted from Volery and Lord (2000) to capture instructor’s attitudetowards the technology, teaching style, and control of the technology. The last two items INS12
Table 1Demographic proWle and descriptive statistics of surveyed students
Item Frequency Percentage
GenderMale 204 37.9Female 334 62.1
Age17–19 210 39.020–22 313 58.223–25 12 02.226–28 3 00.6
Years at UAEU1–2 381 70.823–4 153 28.445–6 4 00.74
Years of e-learning1 208 38.72 197 36.63 133 24.7
PC ownershipYes 474 88.1No 64 11.9

H.M. Selim / Computers & Education 49 (2007) 396–413 401
and INS13 were adopted from Soong et al. (2001) to complete measuring the instructor’s teach-ing style.
Twenty-two indicators were used in assessing the students’ characteristics construct (STD1–STD22). The Wrst two indicators measured the student motivation to use e-learning. IndicatorsSTD3–STD7 measured the student technical competency. Items STD8–STD10 measuredstudent’s attitudes about the active learning activities that are facilitated using e-learning. ItemsSTD11–STD15 measured student interactive collaboration. The Wrst 15 indicators were adoptedfrom Soong et al. (2001). Seven additional indicators were developed to measure the eVectivenessof e-learning course content, structure, and design from student perception (see Appendix fordetails).
Thirteen indicators were developed to measure the technology reliability, richness, consistency,and eVectiveness which represented the information technology construct. The Wrst eight indica-tors (TEC1–TEC8) were adopted from Volery and Lord (2000). The 8 indicators measured the on-campus ease of Internet access and browsing, browsing speed, course websites ease of use, userinterface eYciency, student–student communication reliability, and student–instructor communi-cation. The last Wve items (TEC9–TEC13) were developed to capture the eVectiveness of the ITinfrastructure and services available at UAEU. They measured consistency of computers accessusing the same authentication, computer network reliability, and student information systemeYciency.
The university support section consisted of 5 items (SUP1–SUP5) and all of them were devel-oped to capture the eVectiveness and eYciency of the university technical support, library servicesand computer labs reliability.
Some of the items were negatively worded. All items used a Wve-point Likert-type scale ofpotential responses: strongly agree, agree, neutral, disagree, and strongly disagree. The instru-ment was pre-tested by a random sample of 70 students. Minor changes to the order andwording of the items resulted from the pre-testers opinions. The survey instruments were dis-tributed during laptop-based lectures and were left to the students to be Wlled and returnedlater. Around 900 instruments were distributed, 538 usable responses were used giving a 60%response rate. The students were informed that all data were anonymous and were to be usedin assessing the acceptance of e-learning technology at the university instruction environ-ment. Table 2 shows the mean and variance of each item in the e-learning assessment instru-ment.
3. Structural equation modeling approach
Structural equation modeling (SEM) techniques have been used heavily in measuring useracceptance of information technology (Chau, 1997; Venkatesh, Morris, Davis, & Davis, 2003).In technology uptake, several published studies have adopted the SEM approach in their stud-ies. Examples include (Adams, Nelson, & Todd, 1992; Barki & Hartwick, 1994; Chau, 1997;Chwelos, Benbasat, & Dexter, 2001; Goodhue, Klein, & March, 2000; Hartwick & Barki, 1994;Igbaria & Parasuraman, 1989; Koufaris, 2002; Lederer, Maupin, Sena, & Zhuang, 2000; Moon& Kim, 2001; Rai, Lang, & Welker, 2002; Straub, Loch, & Hill, 2001; Venkatesh, 2001;Venkatesh & Davis, 2000).

402 H.M. Selim / Computers & Education 49 (2007) 396–413
Table 2Descriptive statistics of e-learning CSF indicators
Item Mean SD
INS1 3.82 1.01INS2 3.68 1.07INS3 4.00 1.02INS4 3.99 1.00INS5 4.00 0.99INS6 3.92 0.97INS7 3.94 1.00INS8 3.86 1.02INS9 3.89 0.98INS10 3.91 1.02INS11 3.86 1.03INS12 3.73 1.03INS13 3.87 1.01
TECH1 4.18 0.99TECH2 3.82 1.13TECH3 3.88 0.98TECH4 4.05 0.90TECH5 3.99 0.88TECH6 3.75 0.95TECH7 3.96 1.01TECH8 4.01 0.96TECH9 3.99 1.05TECH10 3.95 0.97TECH11 3.91 1.04TECH12 4.13 0.91TECH13 3.88 0.98
STUD1 3.87 1.04STUD2 3.58 1.06STUD3 4.05 1.06STUD4 4.00 1.00STUD5 3.82 1.01STUD6 3.96 1.04STUD7 4.01 1.05STUD8 3.59 1.013STUD9 3.73 0.99STUD10 3.54 1.07STUD11 3.22 1.07STUD12 3.30 1.11STUD13 3.59 1.01STUD14 3.10 1.04STUD15 3.57 1.03STUD16 3.68 1.00STUD17 3.61 1.05STUD18 3.68 1.04STUD19 3.91 0.96STUD20 3.73 1.00
(continued on next page)e

H.M. Selim / Computers & Education 49 (2007) 396–413 403
As recommended by Segars and Grover (1993), the conWrmatory factor (or measurement)model should be assessed Wrst and “Wxed” before the structural equation model is examined. Thevalidity of the conWrmatory factor model can be assessed by conWrmatory factor analysis usingLISREL. As mentioned by Chau (1997), there is a number of measures generated by LISREL toevaluate the goodness of Wt of the research model. The most popular index is perhaps the chi-square (�2) statistic. This statistic tests the proposed model against the general alternative in whichall observed variables are correlated (in LISREL terms, unconstrained). With this index, signiW-cant values indicate poor model Wt while non-signiWcant values indicate good Wt. This is why it isalso called a “badness-of-Wt” measure. Hartwick and Barki (1994) used four other measures ofoverall model goodness of Wt: �2/degrees of freedom, Non-Normed Fit Index (NNFI), Compara-tive Fit Index (CFI), and Average Absolute Standardized Residual (AASR). In another study,Segars and Grover (1993) included several other measures of model Wt: Goodness-of-Wt Index(GFI), Adjusted Goodness-of-Wt Index (AGFI), Pit Criterion, and Root Mean Square Residual.Segars and Grover (1993) recommended acceptance range for each measure of model Wt, theseranges were readapted by Chau (1997). Poor goodness-of-model-Wt indicates possible model mis-speciWcations. Two parts of the LISREL output, standardized residuals and modiWcation indices,can be used to help determine possible sources of the lack of Wt.
Generally, LISREL consists of two distinct parts: the conWrmatory factor model and the struc-tural equation model (Chau, 1997; Segars & Grover, 1993). The conWrmatory factor model speci-Wes the relations of the observed factors to their posited underlying constructs. The structuralequation model speciWes the relationships of the constructs to one another as posited by researchmodels (Chau, 1997). Based on the discussion presented in this section, the following sectionexamines the conWrmatory factor models of each e-learning CSF category.
4. Examination of the conWrmatory factor models
ConWrmatory factor models (CFMs) approach was conducted to specify and validate theunderlying critical indicators in each of the e-learning CSF categories (instructor characteristics,student characteristics, technology, and university support). The CFM speciWes the relations of theobserved indicators to the e-learning CSF category. The purpose of the CFM is to describe howwell the observed indicators serve as critical measurement of e-learning CSF category. LISRELversion 8.52 was used to develop the polychoric correlation and asymptotic covariance matricesused in generating the factor loadings because all the items were represented by ordinal variables.
Table 2 (continued)
Item Mean SDSTUD21 3.84 0.98STUD22 3.81 0.94
SUP1 4.04 0.96SUP2 3.86 0.94SUP3 3.85 0.93SUP4 3.69 1.00SUP5 3.73 0.97

404 H.M. Selim / Computers & Education 49 (2007) 396–413
4.1. Instructor conWrmatory factor model
Fig. 1 shows the 13 items (INS1–INS13) proposed to measure the instructor characteristics con-struct (INS) as a critical factor of e-learning acceptance by students. Standardized factor loadingsor standardized validity coeYcients are shown in Fig. 1 indicating high validity. The observedmeasures showed moderate Wt of the model. The model yielded a �2 statistic of 141 and a p-valueof 0.00 which suggested a moderate Wt. The ratio �2/DF is 2.23, which is below the maximumallowed value of 3.0. The GFI, NNFI, CFI and AGFI values are 0.99, NFI is 0.98, and RMSEA is0.05, all within acceptable levels. Standardized residuals and modiWcation indexes provided byLISREL output suggested that the four indicators INS1, INS2, INS7, and INS8 should be sepa-rated from the other instructor characteristic indicators. The four indicators are related to theinstructor’s style and control of the e-learning tools. Therefore, the INS conWrmatory factor modelwas split into two models: INS-A and INS-B. Fig. 2 shows the two measurement models. Theobserved LISREL Wt measures satisWed the recommended values. This testiWes to the validity ofthe indicators used to capture the instructor characteristics factor. INS7 and INS8 yielded themaximum validity coeYcients of 0.88 and 0.91, respectively. They represent the most valid indica-tors of the instructor’s control on e-learning technologies and tools. Since INS10 and INS13 hadthe maximum validity coeYcient of 0.86, they are the most valid indicators of the instructor’steaching style and attitude towards adopting e-learning. All t values of the branches were signiW-cant (above 2.00).
Fig. 1. Instructor conWrmatory factor model.
0.92
0.94
0.95
0.93
0.91
0.92
0.88
0.89
0.90
0.94
0.91
0.85
INS13
INS12
INS11
INS10
INS9
INS8
INS7
INS6
INS5
INS4
INS3
INS2 0.82
INS1
INS

H.M. Selim / Computers & Education 49 (2007) 396–413 405
4.2. Student conWrmatory factor model
An attempt was made to test all of the student indicators (STD1–STD22) using one conWrma-tory factor model. The model’s Wt measures indicated poor Wt and LISREL output suggested thatthe STD construct be split into 3 categories. The Wrst, STD-COMP, consisted of STD1 to STD10which measured student motivation to use e-learning technology, student computing competency,and student mindset about e-learning. The second, ST-COLL, comprised 5 items (STD11–STD15)that measured student interactive collaboration capabilities. The third, ST-CONT, comprised thelast 7 indicators (STD16–STD22). All the 7 indicators were related to e-learning course contentand design. This factor captured students’ perception about interactivity, eYciency and eVective-ness of Blackboard as a course management system used by the university as an e-learningresources management tool. The availability and timeliness of course materials and e-learningcourse components were tested by this CSF category.
Fig. 3 shows the ST-COMP conWrmatory factor model. This category included student’s motiveto use e-learning and the approach that best suits him/her such as learning by construction orabsorption. All the Wt measures of ST-COMP model surpassed the acceptance levels indicating theadequacy of validity of the model, �2D52.69, p-valueD0.06 which indicate good model Wt. All thet values of the validity coeYcients shown in Fig. 3 are signiWcant indicating a non-zero correlationbetween the student computing ability indicators and the e-learning CSF category. STD6
Fig. 2. ConWrmatory factor model of INS-A and INS-B.
0.86
0.84
0.85
0.84
0.86
0.81
0.80
0.80
0.77
INS13
INS12
INS11
INS10
INS9
INS6
INS5
INS4
INS3
INS-A
0.91
0.73
0.88
0.69
INS8
INS7
INS2
INS1
INS-B
406 H.M. Selim / Computers & Education 49 (2007) 396–413
indicator had the maximum validity coeYcient of 0.89 indicating that this indicator is the mostcritical success factor among the 10 indicators. It can be concluded that the student previousknowledge in using computers is the most critical success factor that can be used to measure stu-dent computing capabilities to absorb and accept e-learning. This factor was followed by STD9with validity coeYcient of 0.87. STD9 measured the student ability to learn using a constructionapproach that is by participation and contribution. All included indicators exhibited a level ofcriticality to the acceptance of e-learning (all validity coeYcients were more than 0.75).
Fig. 4 shows the conWrmatory factor model for STD-COLL that represented the studentinteractive collaboration abilities. All the Wt measures were within the acceptable levels, �2D4.29,p-valueD0.12 which indicate good model Wt. This e-learning CSF category indicated that the moreinteractions the students get exposed to, the more opportunities they have to learn. The e-learningresources such as on-line discussion forums can play a mediating role for collaboration amongstudents. All validity coeYcients were signiWcant with t values of more than 2.00. As shown inFig. 4, STD14 has the maximum validity coeYcient indicating that the ability of the students toinitialize discussions is the most critical factor in measuring the student collaboration abilities.
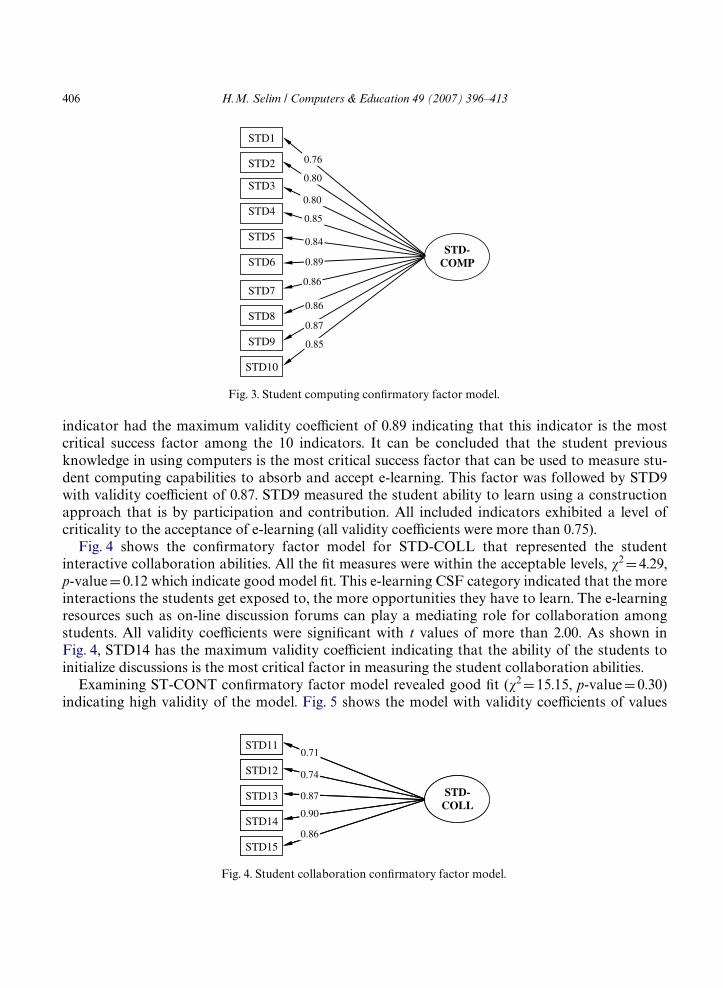
Examining ST-CONT conWrmatory factor model revealed good Wt (�2D15.15, p-valueD0.30)indicating high validity of the model. Fig. 5 shows the model with validity coeYcients of values
Fig. 3. Student computing conWrmatory factor model.
0.85
0.87
0.89
0.86
0.86
0.84
0.85
0.80
0.80
STD10
STD9
STD8
STD7
STD6
STD5
STD4
STD3
STD2 0.76
STD1
STD-COMP
Fig. 4. Student collaboration conWrmatory factor model.
STD-COLL
0.86
0.74
0.90
0.87
0.71
STD15
STD14
STD13
STD12
STD11
STD-COLL
0.86
0.74
0.90
0.87
0.71
STD15
STD14
STD13
STD12
STD11

H.M. Selim / Computers & Education 49 (2007) 396–413 407
more than 0.75 and signiWcant. Navigating course webs (STD19) showed the maximum validitycoeYcient indicating high level of criticality. The validity coeYcients showed that all the 7 indica-tors are considered CSFs and crucial to the acceptance of e-learning technologies and tools.
4.3. Technology conWrmatory factor model
The technology CSF category of e-learning acceptance was measured by 13 indicators. Theindicators used in the technology factor were related to the ease of technology access and naviga-tion, visual technology interface, and the information technology infrastructure reliability andeVectiveness. The technology (TEC) conWrmatory factor model was evaluated for its validity. Themeasures suggested a moderate Wt of the measurement model. The LISREL output was examinedand accordingly the TEC factor category was split into two factors, TEC-A and TEC-B. TheTEC-A factor, shown in Fig. 6, comprised indicators related to technology access, navigation, andinterface. TEC-B factor, shown in Fig. 6, included the indicators related to information technol-ogy infrastructure reliability and eVectiveness. Both measurement models were examined andyielded good Wt measures and achieved the recommended levels. As shown in Fig. 6, TEC4 yieldedthe maximum validity coeYcient indicating the most critical factor to measure TEC-A CSF cate-gory is the ease of use of web facilities. Both TEC3, TEC5, and TEC6 showed very high validitycoeYcients in support to TEC4 criticality. They indicated to the criticality of screen designs,browsing speed, and well structured content. TEC-B CSF category had TEC10 as the most validindicator with coeYcient value of 0.89 and this indicated to the criticality of computer labs avail-ability to students. All validity coeYcients were signiWcant as indicated by the t value of each one.The students were mostly satisWed with the on-campus Internet access, course websites availablevia Blackboard, and online course registration.
4.4. Support conWrmatory factor model
The university support factor is the second wing of the technology factor and was measuredusing 5 indicators. All the items were related to university support to e-learning initiatives avail-able. The support included library services, help desk, computer labs and facilities. Students weremostly satisWed with university support. The SUP conWrmatory factor model is given in Fig. 7.
Fig. 5. Student content conWrmatory factor model.
0.78
0.81
STD16
STD22
STD-CONT
0.87
0.87
0.87
0.89
0.78
STD21
STD20
STD19
STD18
STD17

408 H.M. Selim / Computers & Education 49 (2007) 396–413
Examining the model revealed good Wt measures indicating high level of validity. SUP4 was themost critical factor in measuring the university support. SUP4 measured the availability of com-puters to practice. Two more critical factors of the university support were the availability ofprinting facilities and the student over all satisfaction with the university support to e-learninginitiatives.
E-learning CSFs were speciWed within each CSF category. The proposition of grouping e-learningCSFs into 4 categories was not supported by the research results. The conWrmatory factor modelstest results proposed 8 categories for e-learning CSFs as follows: (1) instructor’s attitude towardsand control of the technology, (2) instructor’s teaching style, (3) student motivation and technicalcompetency, (4) student interactive collaboration, (5) e-learning course content and structure, (6)ease of on-campus internet access, (7) eVectiveness of information technology infrastructure, and (8)
Fig. 6. Technology conWrmatory factor model.
TEC1
TEC2
TEC3
TEC4
TEC5
0.77
0.74
0.87
0.87
0.86
0.89
TEC6
TEC-A
TEC8
TEC9
TEC10
TEC11
TEC12
0.78
0.89
0.87
0.87
0.87
TEC13
TEC-B
0.78
0.81
TEC7
Fig. 7. Support conWrmatory factor model.
SUP
0.86
0.74
0.90
0.87
0.71
SUP5
SUP4
SUP3
SUP2
SUP1

H.M. Selim / Computers & Education 49 (2007) 396–413 409
university support of e-learning activities. Each category of the 8 categories included several criticalmeasures. The level of criticality of each indicator is represented by its validity coeYcient.
5. Conclusions and future work
E-learning has been and will be adopted by many higher education institutions. Consequently,several adoption-related critical factors must be carefully evaluated before, during, and after anyadoption. The adoption of e-learning technology is a complicated process of establishing anddeveloping an integrated information technology system. This paper, in line with the literature,speciWed eight e-learning critical success factor (CSF) categories that can assist universities andinstructors to eYciently and eVectively adopt e-learning technologies. The criticality level of eachCSF was evaluated. The speciWed e-learning CSF categories were based on students perceptionsand included: instructor characteristics (attitude towards and control of the technology,and teaching style), student characteristics (computer competency, interactive collaboration, ande-learning course content and design), technology (ease of access and infrastructure), and support.The eight CSF categories impact the decision to adopt e-learning technology in higher educationinstitutions. A sample of 37 class sections with 900 enrolled students was used to identify and mea-sure the proposed e-learning CSFs. The students perceived the eight CSF categories as criticaldeterminants of e-learning acceptance.
All indicators of the instructor’s attitude towards and control of technology indicated high lev-els of criticality to measure the posited category. The validity coeYcient values were above 0.75indicating high level of validity. The most critical indicators were instructor’s attitude towardsinteractive learning and teaching via e-learning technologies. All indicators of the instructor’steaching style yielded validity coeYcients of 0.69 or more indicating reasonable to high criticalityof all the 4 measures of this category.
Student motivation and technical competency measures indicated high levels of validity withvalues of 0.76 or more. Previous student experience with personal computers came as themost critical factor in this category with a validity coeYcient of 0.89. The class discussion was per-ceived as the most critical factor in the student interactive collaboration category. Course contentas an e-learning CSF category contained 7 critical factors. All validity coeYcients had values of0.78 or more. Course management system was the most critical factor in this category with 0.89validity coeYcient.
In the technological dimension, the ease of on-campus Internet access category included 6 fac-tors. The ease of use of the course web was the most critical factor followed by browser eYciencyand screen design. Reliability of the information technology infrastructure as a CSF categorycomprised 7 factors. The most critical factor among them was the availability of computer labs forpractice. Computer network reliability and student information system came in the second placeof criticality with 0.87 validity coeYcient. University support was not limited to technical assis-tance and troubleshooting but included library and information availability. Students indicatedthat they would register in future e-learning based courses assuring their positive attitude and sup-port to e-learning technology and tools.
For future work, there is a need to expand on this research to develop a causal structural equa-tion model that includes all the 8 constructs (INS-A, INS-B, ST-COMP, ST-COLL, ST-CONT,

410 H.M. Selim / Computers & Education 49 (2007) 396–413
TEC-A, TEC-B, and SUP). The objective of the causal research model would be to study theeVects of the Wrst 8 CSFs on e-learning acceptance which can be represented as a 9th construct inthe research model. The proposed research model can generate causal relationships among the 9factors. Another future expansion is to check the validity of the causal research model in diVerentcountries. In conclusion, this study speciWed the critical factors aVecting e-learning technologyadoption by universities from students’ perspective.
Acknowledgments
My thanks and appreciation to the Research AVairs at UAE University for funding thisresearch. The support of all the students involved in this research is gratefully acknowledged.
Appendix. E-learning CSF instrument
Instructor characteristics (INS)INS1 The instructor is enthusiastic about teaching the classINS2 The instructor’s style of presentation holds me interestINS3 The instructor is friendly towards individual studentsINS4 The instructor has a genuine interest in studentsINS5 Students felt welcome in seeking advice/helpINS6 The instructor encourages student interactionINS7 The instructor handles the e-learning units eVectivelyINS8 The instructor explains how to use the e-learning componentsINS9 I feel the instructor is keen that we use the e-learning based unitsINS10 We were invited to ask questions/receive answersINS11 We were encouraged to participate in classINS12 The instructor encourages and motivates me to use e-learningINS13 The instructor is active in teaching me
the course subjects via e-learning
Student characteristics (STD)STD1 The e-learning encourages me to search for more
facts than the traditional methodsSTD2 The e-learning encourages me to participate more
actively in the discussion than the traditional methodsSTD3 I enjoy using personal computersSTD4 I use the personal computers for work and playSTD5 I was comfortable with using the PC and software
applications before I took up the e-learning based courses(continued on next page)

H.M. Selim / Computers & Education 49 (2007) 396–413 411
Appendix (continued)
STD6 My previous experience in using the PC and software applicationshelped me in the e-learning based courses
STD7 I am not intimidated by using the e-learning based coursesSTD8 I learn best by absorption (sit still and absorb)STD9 I learn best by construction (by participation and contribution)STD10 I learn better by construction than absorptionSTD11 I only read messages in the discussion groupSTD12 I do read as well as participate in the discussion groupSTD13 The instructor initiated most of the discussionSTD14 The students initiated most of the discussionSTD15 The instructor participated actively in the discussionSTD16 I found the instructions on using the e-learning components
to be suYciently clearSTD17 I found the course content to be suYcient and related to the subjectSTD18 It was easy to understand the structure of the e-learning componentsSTD19 It was easy to navigate through the Blackboard/course webSTD20 The e-learning components was available all the timeSTD21 The course materials were placed on-line in a timely mannerSTD22 I perceive the design of the e-learning components to be good
Technology (TEC)TEC1 Easy on-campus access to the InternetTEC2 Did not experience problems while browsingTEC3 Browsing speed was satisfactoryTEC4 Overall, the website was easy to useTEC5 Information was well structured/presentedTEC6 I found the screen design pleasantTEC7 I could interact with classmates through the webTEC8 I could easily contact the instructorTEC9 I can use any PC at the university
using the same account and passwordTEC10 I can use the computer labs for practicingTEC11 I can rely on the computer networkTEC12 I can register courses on-line using BannerTEC13 Overall, the information technology infrastructure is eYcient
Support (SUP)SUP1 I can access the central library website and search for materialsSUP2 I can get technical support from techniciansSUP3 I think that the UAEU e-learning support is goodSUP4 There are enough computers to use and practiceSUP5 I can print my assignments and materials easily

412 H.M. Selim / Computers & Education 49 (2007) 396–413
References
Adams, D. A., Nelson, R. R., & Todd, P. A. (1992). Perceived usefulness, ease of use, and usage of information technol-ogy: a replication. MIS Quarterly, 16(2 (June)), 227–248.
Aldexander, S., McKemzie, J., & Geissinger, H. (1998). An evaluation of information technology projects for universitylearning. Available from http://www.dest.gov.au/archive/cutsd/publications/exsummary.html.
Barki, H., & Hartwick, J. (1994). User participation, conXict, and conXict resolution: the mediating roles of inXuence.Information Systems Research, 5(4 (December)), 422–438.
Baylor, A. L., & Ritchie, D. (2002). What factors facilitate teacher skill, teacher morale, and perceived student learning intechnology-using classrooms? Computers & Education, 39, 395–414.
Benigno, V., & Trentin, G. (2000). The evaluation of online courses. Journal of Computer Assisted Learning, 16, 259–270.Beyth-Marom, R., Chajut, E., Roccas, S., & Sagiv, L. (2003). Internet-assisted versus traditional distance learning envi-
ronments: factors aVecting students’ preferences. Computers & Education, 41(1), 65–76.Chau, P. Y. K. (1997). Reexamining a model for evaluating information center success using a structural equation mod-
eling approach. Decision Sciences, 28(2), 309–334.Chwelos, P., Benbasat, I., & Dexter, A. S. (2001). Empirical test of an EDI adoption model. Information Systems
Research, 12(3), 304–321.Collis, B. (1995). Anticipating the impact of multimedia in education: lessons from the literature. Computers in Adult
Education and Training, 2(2), 136–149.Dillon, C. L., & Guawardena, C. N. (1995). A framework for the evaluation of telecommunications-based distance educa-
tion. Paper presented at the 17th Congress of the International Council for Distance Education, Open University,Milton Keynes.
Freire, P. (1994). Pedagogy of the oppressed. London, UK: Continuum.Freund, Y. P. (1988). Critical success factors. Planning Review, 16(4), 20–25.Goodhue, D. L., Klein, B. D., & March, S. T. (2000). User evaluations of IS as surrogates for objective performance.
Information & Management, 38, 87–101.Govindasamy, T. (2002). Successful implementation of e-learning; pedagogical considerations. The Internet and Higher
Education, 4(3–4), 287–299.Hartwick, J., & Barki, H. (1994). Explaining the role of user participation in information system use. Management Sci-
ence, 40(4), 440–465.Helmi, A. (2002). An analysis on impetus of online education Curtin University of Technology, Western Australia. The
Internet and Higher Education, 4(3), 243–253.Igbaria, M., & Parasuraman, S. (1989). A path analytic study of individual characteristics, computer anxiety, and atti-
tudes towards microcomputers. Journal of Management, 15(3), 373–388.Ingram, H., Biermann, K., Cannon, J., Neil, J., & Waddle, C. (2000). Internalizing action learning: a company perspec-
tive. Establishing critical success factors for action learning courses. International Journal of Contemporary Hospital-ity Management, 12(2), 107–113.
Khan, B. H. (2001). A framework for web-based learning. Engelwood CliVs, NJ: Educational Technology Publications.Koufaris, M. (2002). Applying the technology acceptance model and Xow theory to online consumer behavior. Informa-
tion Systems Research, 13(2), 205–223.Lederer, A. L., Maupin, D. J., Sena, M. P., & Zhuang, Y. (2000). The technology acceptance model and the World Wide
Web. Decision Support Systems, 29(3), 269–282.Leidner, D. E., & Jarvenpaa, S. L. (1993). The information age confronts education: case studies on electronic classroom.
Information Systems Research, 4(1), 24–54.Moon, J., & Kim, Y. (2001). Extending the TAM for a World-Wide-Web context. Information & Management, 38, 217–
230.Papp, R. (2000). Critical success factors for distance learning. Paper presented at the Americas Conference on Informa-
tion Systems, Long Beach, CA, USA.Rai, A., Lang, S., & Welker, R. (2002). Assessing the validity of IS success models: an empirical test and theoretical anal-
ysis. Information Systems Research, 13(1), 50–69.

H.M. Selim / Computers & Education 49 (2007) 396–413 413
Segars, A. H., & Grover, V. (1993). Re-examining perceived ease of use and usefulness: a conWrmatory factor analysis.MIS Quarterly, 17(4 (December)), 517–525.
Soong, B. M. H., Chan, H. C., Chua, B. C., & Loh, K. F. (2001). Critical success factors for on-line course resources.Computers & Education, 36(2), 101–120.
Straub, D., Loch, K., & Hill, C. (2001). Transfer of information technology to the Arab World: A test of cultural inXu-ence modeling. Journal of Global Information Management, 9(4), 6–28.
Urdan, T. A., & Weggen, C. C. (2000). Corporate e-learning: exploring a new frontier. WRHAMBRECHT+CO.Venkatesh, V. (2001). Determinants of perceived ease of use: integrating control, intrinsic motivation, and emotion into
the technology acceptance model. Information Systems Research, 11(4), 342–365.Venkatesh, V., & Davis, F. D. (2000). A theoretical extension of the technology acceptance model: four longitudinal Weld
studies. Management Science, 46(2), 186–204.Venkatesh, V., Morris, M. G., Davis, G. B., & Davis, F. D. (2003). User acceptance of information technology: towards a
uniWed view. MIS Quarterly, 27(3), 425–478.Volery, T., & Lord, D. (2000). Critical success factors in online education. The International Journal of Educational Man-
agement, 14(5), 216–223.Wang, Y. (2003). Assessment of learner satisfaction with asynchronous electronic learning systems. Information & Man-
agement, 41(1), 75–86.Webster, J., & Hackley, P. (1997). Teaching eVectiveness in technology-mediated distance learning. Academy of Manage-
ment Journal, 40(6), 1282–1309.Willis, B. (1994). Enhancing faculty eVectiveness in distance education. In B. Willis (Ed.), Distance education: Strategies
and tools. Englewood CliVs, NJ: Educational Technology Publications, Inc.