
Multi-objective optimization of the geometry of a double ...
Upload
independentCategory
view
1download
0
MULTICUBE: Multi-Objective Design Space
Exploration of Multi-Core Architectures
Cristina Silvano∗, William Fornaciari∗, Gianluca Palermo∗, Vittorio Zaccaria∗, Fabrizio Castro∗,
Marcos Martinez†, Sara Bocchio‡, Roberto Zafalon‡, Prabhat Avasare§, Geert Vanmeerbeeck§,
Chantal Ykman-Couvreur§, Maryse Wouters§, Carlos Kavka¶, Luka Onesti¶, Alessandro Turco¶,
Umberto Bondi‖, Giovanni Mariani‖, Hector Posadas‡‡, Eugenio Villar‡‡, Chris Wu††,
Fan Dongruix, Zhang Hao
x, Tang Shibin
x
∗ Dipartimento di Elettronica e Informazione - Politecnico di Milano - Milano - Italy†Design of Systems on Silicon (DS2) - Valencia - Spain, ‡STMicroelectronics - Italy, §IMEC vzw - Belgium,
¶ESTECO - Italy, ‖ALaRI - Universita’ della Svizzera Italiana - Switzerland, ‡‡University of Cantabria - Spain,††STMicroelectronics Beijing - China,
xInstitute of Computing Technology - Chinese Academy of Sciences - China
Abstract—Technology trends enable the integration of manyprocessor cores in a System-on-Chip (SoC). In these complexarchitectures, several architectural parameters can be tuned tofind the best trade-off in terms of multiple metrics such as energyand delay. The main goal of the MULTICUBE project consistsof the definition of an automatic Design Space Explorationframework to support the design of next generation many-corearchitectures1.
I. INTRODUCTION
The main goal of MULTICUBE project is the definition
of an automatic framework to support multi-objective De-
sign Space Exploration (DSE) of multi and many core SoC
architectures. The framework enables the tuning of several
architectural parameters to minimize multiple metrics (such
as energy and latency) while meeting system-level constraints
(such as throughput, bandwidth and QoS). The project focuses
on the definition of an automatic modeling and optimization
methodologies for improving the conventional SoC design
flow. In such a design flow, the optimization process is still
done manually, based on the past experience of the designer
to leverage existing simulation models to explore the design
space and find out power-performance trade-offs (Pareto anal-
ysis).
The project targets an efficient and automatic exploration
of parallel embedded architectures in terms of several design
parameters such as available parallelism (e.g., number of cores,
processor issue width), cache-subsystem (e.g. cache size and
associativity) and NoC-related parameters (e.g., channel buffer
size). When dealing with complex many-core architectures, the
design space exploration can easily become very huge, making
a full-search simulation-based exploration unfeasible. Auto-
matic exploration techniques based on optimisation heuristics
should be used to figure out an approximate Pareto set in a
reasonable time. The exploration time can even be reduced by
decreasing the number of design points to be simulated. This
can be done by using analytical models to predict the system
behavior corresponding to design points not yet simulated.
1This project is supported by the EC under grant MULTICUBE FP7-216693
These analytical models are defined from a training set of
simulations.
II. THE MULTICUBE DESIGN METHODOLOGY
The MULTICUBE design flow (shown in Figure 1) consists
of two frameworks:
Power/Performance Estimation Framework includes the
simulation tools for power and performance estimation of
the target architectures to be explored. Each configurable
simulation model accepts an architectural configuration as
input and generates, at the end of simulation, the correspond-
ing system-level metrics running the reference application.
The combination of architecture and reference application is
defined, from here on, as use case. The simulators used in the
context of the project are either open source (MULTICUBE-
SCOPE) or proprietary (such as the IMEC TLM platform,
the STMicroelectronics SP2 simulator or the Institute of
Computing Technology’s (ICT) many core simulator). The
tool interface has been standardized with the definition of the
MULTICUBE XML interface so as other simulators can be
plugged in with minimal effort. Besides event-based simula-
tion, a set of Response Surface Models has been developed
to further speedup the evaluation of the system-level metrics
through analytical expressions derived from a training set of
simulations.
Design Space Exploration Framework contains the tools
for automatic DSE and interacts with the power/performance
estimation framework by iteratively generating different in-
stances of the design space and reading back power and per-
formance evaluation metrics (system metrics). This framework
includes several optimization heuristics for identifying pow-
er/performance trade-offs and generating the approximated
Pareto frontier which may be more or less close to the actual
Pareto front. The DSE tools developed in the project are: the
open source (MULTICUBE Explorer tool) and the proprietary
(ESTECO’s modeFRONTIER) optimization tool (widely used
tool in multi-disciplinary optimization).
The Use Case and Simulator Provider. (S)he is the system
architect providing the simulator with a set of configurable
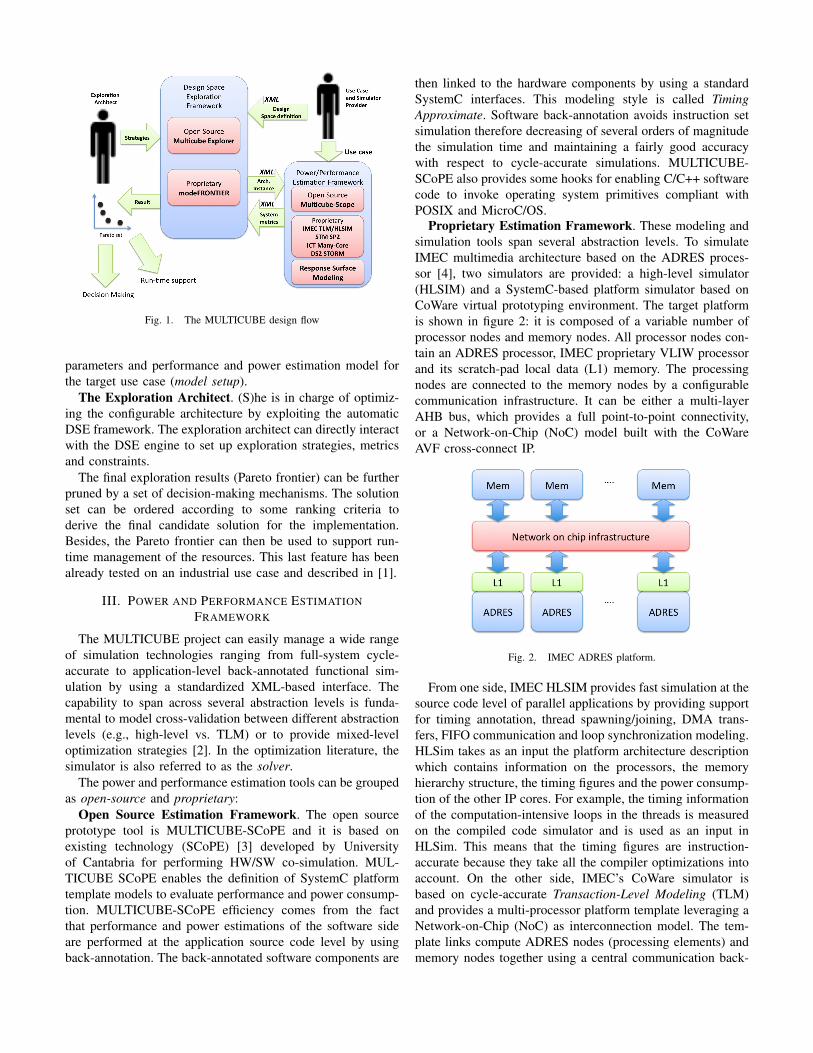
Fig. 1. The MULTICUBE design flow
parameters and performance and power estimation model for
the target use case (model setup).
The Exploration Architect. (S)he is in charge of optimiz-
ing the configurable architecture by exploiting the automatic
DSE framework. The exploration architect can directly interact
with the DSE engine to set up exploration strategies, metrics
and constraints.
The final exploration results (Pareto frontier) can be further
pruned by a set of decision-making mechanisms. The solution
set can be ordered according to some ranking criteria to
derive the final candidate solution for the implementation.
Besides, the Pareto frontier can then be used to support run-
time management of the resources. This last feature has been
already tested on an industrial use case and described in [1].
III. POWER AND PERFORMANCE ESTIMATION
FRAMEWORK
The MULTICUBE project can easily manage a wide range
of simulation technologies ranging from full-system cycle-
accurate to application-level back-annotated functional sim-
ulation by using a standardized XML-based interface. The
capability to span across several abstraction levels is funda-
mental to model cross-validation between different abstraction
levels (e.g., high-level vs. TLM) or to provide mixed-level
optimization strategies [2]. In the optimization literature, the
simulator is also referred to as the solver.
The power and performance estimation tools can be grouped
as open-source and proprietary:
Open Source Estimation Framework. The open source
prototype tool is MULTICUBE-SCoPE and it is based on
existing technology (SCoPE) [3] developed by University
of Cantabria for performing HW/SW co-simulation. MUL-
TICUBE SCoPE enables the definition of SystemC platform
template models to evaluate performance and power consump-
tion. MULTICUBE-SCoPE efficiency comes from the fact
that performance and power estimations of the software side
are performed at the application source code level by using
back-annotation. The back-annotated software components are
then linked to the hardware components by using a standard
SystemC interfaces. This modeling style is called Timing
Approximate. Software back-annotation avoids instruction set
simulation therefore decreasing of several orders of magnitude
the simulation time and maintaining a fairly good accuracy
with respect to cycle-accurate simulations. MULTICUBE-
SCoPE also provides some hooks for enabling C/C++ software
code to invoke operating system primitives compliant with
POSIX and MicroC/OS.
Proprietary Estimation Framework. These modeling and
simulation tools span several abstraction levels. To simulate
IMEC multimedia architecture based on the ADRES proces-
sor [4], two simulators are provided: a high-level simulator
(HLSIM) and a SystemC-based platform simulator based on
CoWare virtual prototyping environment. The target platform
is shown in figure 2: it is composed of a variable number of
processor nodes and memory nodes. All processor nodes con-
tain an ADRES processor, IMEC proprietary VLIW processor
and its scratch-pad local data (L1) memory. The processing
nodes are connected to the memory nodes by a configurable
communication infrastructure. It can be either a multi-layer
AHB bus, which provides a full point-to-point connectivity,
or a Network-on-Chip (NoC) model built with the CoWare
AVF cross-connect IP.
Fig. 2. IMEC ADRES platform.
From one side, IMEC HLSIM provides fast simulation at the
source code level of parallel applications by providing support
for timing annotation, thread spawning/joining, DMA trans-
fers, FIFO communication and loop synchronization modeling.
HLSim takes as an input the platform architecture description
which contains information on the processors, the memory
hierarchy structure, the timing figures and the power consump-
tion of the other IP cores. For example, the timing information
of the computation-intensive loops in the threads is measured
on the compiled code simulator and is used as an input in
HLSim. This means that the timing figures are instruction-
accurate because they take all the compiler optimizations into
account. On the other side, IMEC’s CoWare simulator is
based on cycle-accurate Transaction-Level Modeling (TLM)
and provides a multi-processor platform template leveraging a
Network-on-Chip (NoC) as interconnection model. The tem-
plate links compute ADRES nodes (processing elements) and
memory nodes together using a central communication back-

bone. This model has been used for creating back-annotation
data used in the HLSIM simulator and performing cross-
validation. Overall, we found an acceptable relative accuracy
with a significant speed-up in simulation time (see Figure
3, where the relative accuracy and speed of MULTICUBE-
SCoPE technology has been added for comparison).
Fig. 3. Accuracy versus speed trade-off for several abstraction levelsimulators .
An instruction set simulator has been used for SP2 super-
scalar processor provided from STMicroelectronics and for
the many-core architecture from ICT. Both simulators expose
program execution time and power consumption as system
level metrics. More in detail, the ICT many-core architecture
is a tiled MIMD machine composed of a bi-dimensional grid
of homogeneous, general-purpose compute elements, called
tiles. A 2D-mesh network architecture is used for connecting
the cores to a non-shared memory sub-system.
Finally, as an example of control-oriented architecture, the
DS2’s STORM platform has been integrated in the framework.
The platform is used to model a PLC (Programmable Logic
Controller) technology with several implementation choices.
For this platform, both Ethernet QoS and internal communi-
cation are considered as metrics.
IV. ADVANTAGES OF AUTOMATIC DSE
Multi-objective optimization heuristics and high-level sim-
ulation techniques can successfully contribute to dramatically
decrease the exploration time, while guaranteeing a certain
level of ’closeness’ to the actual Pareto frontier. Reducing the
exploration time reduces the time-to-market of the product and
therefore the risk to miss market deadlines (with the associated
economic loss).
Both conventional and automatic DSE starts from a defi-
nition of design-space (see Figure 4) representing the set of
feasible architectural configurations. In a conventional DSE
approach, the starting point is the definition of an initial
model (model setup phase) of the target architecture. The
enabling simulation technologies used for creating such a
model can range from cycle-accurate SystemC up to anno-
tated functional simulation, with variable ratio of accuracy
with respect to speed. The exploration is done iteratively by
subjective assumptions of the designer, who will edit manually
the architectural simulator and modify a limited number of
parameters per evaluation. The model simulation corresponds
to a limited portion of the time of the overall exploration
procedure. A larger amount of time is spent by the designer
editing the configuration parameters and/or the model structure
and analyzing the results. There is also an idle time (from the
point of view of the use of computational resources) that lasts
from the end of the simulation till the moment in which human
operator is informed about it and handles the simulation tools
to get the results.
In this case, the overall quality of the DSE is based on the
designer’s ability and past experience to assess the results and
to move towards the next instance of the model to be simulated
based on aggregate information resulting from the simulation
campaign. The outcome (solution set) is thus highly dependent
on the skills and past experience of the designer.
An automatic DSE flow uses numerical/objective criteria
combined with efficient heuristics to drive the exploration. The
basic assumption is that the model should be a configurable
template model which can be automatically manipulated to
generate any instance of the target design space. The model
setup stage, thus, may be longer than in the conventional
case. Given the configurable model template, the DSE tool
will change systematically all the parameters at each step
and will evaluate the best result based on robust optimisation
heuristics. The automatic selection of the next configuration
to be simulated (model selection) is typically faster than the
conventional one because of it does not involve any overhead
due to human intervention. The final output of the automatic
DSE flow is a set of dominant configurations in the design
space which are, with high probability, close to the actual
Pareto set. Besides, all data concerning previous evaluations
are stored in a structured database which can be automatically
analyzed by using mathematical/statistical tools to derive ag-
gregate information about the population of analyzed design
points.
V. DESIGN SPACE EXPLORATION FRAMEWORK
The structure of the exploration framework is composed
of an open-source optimization tool (MULTICUBE Explorer)
and a proprietary multi-objective optimization tool (ESTECO’s
modeFRONTIER). The open-source tool has been designed
from scratch to address embedded system exploration, while
the proprietary tool is an existing tool for multi-disciplinary
optimization which has been re-targeted to address discrete
embedded system exploration. In general, DSE is an op-
timization process that takes into account a typical set of
IP parameters that are associated with the memory system
structure (e.g., cache size), the inherent parallelism of the
processor (e.g., number of simultaneous tasks and the instruc-
tion issue width) and the on-chip interconnect configuration.
The optimization problem involves either the maximization
or minimization of multiple objectives (such as execution

Fig. 4. Comparison between a manual (or conventional) design space exploration approach and an automatic approach.
time, power consumption, area, etc.) making the definition of
optimality not unique [5].
In our context, the multi-objective optimization targets a set
of n system configuration parameters grouped on a configu-
ration vector:
a =
a1
. . .
an
∈ A (1)
where A is usually a finite, discrete domain (subset of Nn0 ).
The multi-objective optimization problem is defined as a set
of m objective functions to be minimized (or maximized):
mina∈A
φ(a) =
φ1(a). . .
φm(a)
∈ Rm (2)
subject to a set of k constraints which, without loss of
generality, can be expressed as:
χ(a) =
χ1(a). . .
χk(a)
≤
0. . .
0
(3)
The set of feasible solutions of an optimization problem is
defined as the feasible region:
Φ = a ∈ A | χi(a) ≤ 0, 1 ≤ i ≤ k
In single-objective optimization problems, the feasible set is
totally ordered w.r.t. the function φ(a), thus a single exact
solution a exists. When several objectives are defined, the
feasible set is partially ordered through dominance relation
and, thus, multiple exact solutions exist. The solution set is
defined as the exact Pareto set of the problem. We say that φ
dominates γ when:
φ ≺ γ =
φi ≤ γi,∀i = 1, . . . ,m and
φi < γi for at least one i(4)
Given a subset of feasible configurations Ω ⊆ A, we define
the Pareto set Ψ associated to Ω as:
Ψ(Ω) =
a∣
∣
∣
(
a ∈ (Φ ∩ Ω)∧¬∃b ∈ Ψ(Ω) s.t. φ(b) ≺ φ(a)
)
(5)
The Pareto set Ψ(Φ) is the exact Pareto set of the problem.
Based on set theory, the projection of Ψ(Φ) in the objective
space is called the exact Pareto front.
Fig. 5. Pareto Dominance, Ω = aa, ab, ac. Point ac is dominated bypoint ab.
Whenever the considered solution set Ω is a subset of the
feasible solution space Φ, the Pareto set Ψ(Ω) is called an
approximate Pareto set of the problem.
Figure 5 shows a feasible set of solutions Ω = Φ =aa,ab,ac for an unconstrained minimization problem for
[φ1, φ2]. Point ac is dominated by point ab since both φ1(ac)and φ2(ac) are greater than φ1(ab) and φ2(ab). In this case
we thus have that Ψ(Ω) = aa,ab.
The overall goal of multi-objective optimization heuristics
is to identify approximate Pareto sets which are as near as
possible to the exact Pareto set. For evaluating the quality of
the approximate Pareto sets, a measure of the distance between
the exact and the approximate Pareto sets can be introduced. In
literature, many quality functions have been proposed to tackle
this problem [6]. In the MULTICUBE project we leveraged
the Average Distance from Reference Set (ADRS). The ADRS
is used to measure the distance between the exact Pareto set
Π = Ψ(Φ) and the approximate Pareto set Λ = Ψ(Ω) [7]:
ADRS(Π,Λ) =1
|Π|
∑
aR∈Π
(
minaA∈Λ
δ(aR,aA)
)
(6)
where δ is a measure of the normalized distance in the
objective function space of two configurations:
δ(aR,aA) = maxj=1,...,m
0,φj(aA) − φj(aR)
φj(aR)
(7)
The ADRS is usually measured in terms of percentage; the
higher the ADRS, the worst is Λ with respect to Π.

A. Multi-objective optimization heuristics
In this section we present the multi-objective optimization
heuristics implemented in MULTICUBE project and an anal-
ysis of the features carried out on an industrial architecture.
So far, the following optimisation algorithms have been
implemented and analyzed:
• Standard algorithms: In this group we can find well-
known multi-objective optimisation algorithms that have
been implemented by following the original specification.
The group is composed of the NSGA-II [8] and MOGA-
II [9] algorithms.
• Enhanced algorithms: In this group we can find en-
hanced version of standard algorithms in order to deal
with the specific discrete parameters addressed in MUL-
TICUBE. The group is composed of the MOSA [10], ES
and MOPSO [11] algorithms.
• New algorithms: In this group we can find all the
algorithms that have been specifically defined in the
MULTICUBE project for multi-objective optimization in
the context of SoC design optimization. In this group
we can find the MFGA (Evolutionary) [12] and APRS
(Randomized) algorithms.
Evaluation of the algorithms. The algorithm validation
shown here is based on the Low-Power Processor Use Case
(Superscalar Processor SP2) delivered by STMicroelectronics-
China. The executable model for the design space exploration
consists of sp2sim simulator, which is an instruction set
simulator for the SP2 microprocessor design. The benchmark
application selected is the 164.gzip application, based on the
popular gzip compression algorithm. The design space is de-
fined as a combination of 11 configuration parameters, among
which out-of-order execution parameters (issue width, reorder
buffer length, rename register number), cache sub-system
(instruction and data cache configurations and load/store queue
sizes), branch prediction (type and table size). For improving
the validation speed, the number of input parameters was
reduced to 7 by fixing the remaining ones to a constant value.
The final design space of the problem is composed of 9,216
designs while the three objectives to be minimized are the total
number of cycles, the power dissipation and the area.
A fair evaluation of non-deterministic algorithms requires
several repeated runs without changing any parameter besides
the random generator seed. Notwithstanding the relative small
search space consisting of only 9,216 designs, very large
variations can be observed in the algorithms behavior and
a rigorous study needs to analyze also this aspect. Besides,
preliminary tests were performed in order to identify non-
significant parameters that have been then fixed to a con-
stant value. Algorithms configuration parameters are usually
problem-dependent. Typically, they depend on the user expec-
tations: the optimal choices for the parameters that control
the ratio between exploration and exploitation phase (e.g.,
the temperature schedule in the MOSA heuristic) are strictly
related to the number of evaluations the user can afford. It
was decided to tune these parameters considering the largest
target (i.e. 50% of the design space, as described below) and
accepting possible worse results in the partial samples. The
evaluation process then proceeds checking at fixed numbers
of explored points the quality of the non-dominated front
found so far. The steps selected for the evaluation are: 184
designs (corresponding to about 2% of the design space), 461
(5%), 922 (10%), 1,843 (20%), 2,765 (30%), 3,686 (40%) and
4,608 (50%). Only the requests of evaluation of new designs
were counted, since sometimes the algorithms requested the
evaluation of an already evaluated design due to the inherent
behavior of their random engines.
Fig. 6. Number of Pareto points found plotted against the percentages ofevaluated designs.
Concerning all algorithms, we found that they easily reach
an ADRS value below 2% evaluating 30% of the design space
(lower ADRS corresponds to a better solution). This result can
be considered very promising though variations in the slope of
the lines for some algorithms are due to different ’behavioral’
phases of the specific optimization process. The most clear
example encountered in the project was the MOSA heuristic
with its ’hot’ and ’cold’ phase. We point out also that a semi-
automatic support is also provided by modeFRONTIER tool
to choose the most suitable algorithm for the target design
space.
Figure 6 shows the number of true Pareto points found
by the algorithms at the specified percentage of design space
exploration. MOSA is tuned to reach the top of the exploitation
phase at 50% of evaluations and therefore its results are the
worst up to 20-30%, while at the end it is one of the most
effective algorithms. APRS shows a similar behavior.
B. Response surface modeling
To further increase the efficiency of the exploration process,
Response Surface Modeling (RSM) techniques have been
introduced in the project. The basic idea is to reduce the
number of simulations by defining an analytical response
model of the system metrics based on a subset of simulations
used as training set. Then the analytical expressions are used
to predict the unknown system response. More in detail, RSM

Copyright © 2022 FDOKUMEN