
Multi-site tumor sampling highlights molecular intra-tumor ...
16
RESEARCH Open Access Multi-site tumor sampling highlights molecular intra-tumor heterogeneity in malignant pleural mesothelioma Clément Meiller 1 , François Montagne 1,2 , Theo Z. Hirsch 1 , Stefano Caruso 1 , Julien de Wolf 1,3 , Quentin Bayard 1 , Jean-Baptiste Assié 1,4,5 , Léa Meunier 1 , Yuna Blum 6,7 , Lisa Quetel 1 , Laure Gibault 8,9 , Ecaterina Pintilie 10 , Cécile Badoual 8,9 , Sarah Humez 11,12 , Françoise Galateau-Sallé 13 , Marie-Christine Copin 11,14 , Eric Letouzé 1 , Arnaud Scherpereel 15,16 , Jessica Zucman-Rossi 1,8 , Françoise Le Pimpec-Barthes 1,8,17 , Marie-Claude Jaurand 1 and Didier Jean 1* Abstract Background: Malignant pleural mesothelioma (MPM) is a heterogeneous cancer. Better knowledge of molecular and cellular intra-tumor heterogeneity throughout the thoracic cavity is required to develop efficient therapies. This study focuses on molecular intra-tumor heterogeneity using the largest series to date in MPM and is the first to report on the multi-omics profiling of a substantial series of multi-site tumor samples. Methods: Intra-tumor heterogeneity was investigated in 16 patients from whom biopsies were taken at distinct anatomical sites. The paired biopsies collected from apex, side wall, costo-diaphragmatic, or highest metabolic sites as well as 5 derived cell lines were screened using targeted sequencing. Whole exome sequencing, RNA sequencing, and DNA methylation were performed on a subset of the cohort for deep characterization. Molecular classification, recently defined histo-molecular gradients, and cell populations of the tumor microenvironment were assessed. Results: Sequencing analysis identified heterogeneous variants notably in NF2, a key tumor suppressor gene of mesothelial carcinogenesis. Subclonal tumor populations were shared among paired biopsies, suggesting a polyclonal dissemination of the tumor. Transcriptome analysis highlighted dysregulation of cell adhesion and extracellular matrix pathways, linked to changes in histo-molecular gradient proportions between anatomic sites. Methylome analysis revealed the contribution of epigenetic mechanisms in two patients. Finally, significant changes in the expression of immune mediators and genes related to immunological synapse, as well as differential infiltration of immune populations in the tumor environment, were observed and led to a switch from a hot to a cold immune profile in three patients. © The Author(s). 2021 Open Access This article is licensed under a Creative Commons Attribution 4.0 International License, which permits use, sharing, adaptation, distribution and reproduction in any medium or format, as long as you give appropriate credit to the original author(s) and the source, provide a link to the Creative Commons licence, and indicate if changes were made. The images or other third party material in this article are included in the article's Creative Commons licence, unless indicated otherwise in a credit line to the material. If material is not included in the article's Creative Commons licence and your intended use is not permitted by statutory regulation or exceeds the permitted use, you will need to obtain permission directly from the copyright holder. To view a copy of this licence, visit http://creativecommons.org/licenses/by/4.0/. The Creative Commons Public Domain Dedication waiver (http://creativecommons.org/publicdomain/zero/1.0/) applies to the data made available in this article, unless otherwise stated in a credit line to the data. * Correspondence: [email protected] 1 Centre de Recherche des Cordeliers, Inserm UMRS-1138, Sorbonne Université, Université de Paris, Functional Genomics of Solid Tumors, Paris, France Full list of author information is available at the end of the article Meiller et al. Genome Medicine (2021) 13:113 https://doi.org/10.1186/s13073-021-00931-w
-
Upload
khangminh22 -
Category
Documents
-
view
0 -
download
0
Transcript of Multi-site tumor sampling highlights molecular intra-tumor ...
RESEARCH Open Access
Multi-site tumor sampling highlightsmolecular intra-tumor heterogeneity inmalignant pleural mesotheliomaClément Meiller1, François Montagne1,2, Theo Z. Hirsch1, Stefano Caruso1, Julien de Wolf1,3, Quentin Bayard1,Jean-Baptiste Assié1,4,5, Léa Meunier1, Yuna Blum6,7, Lisa Quetel1, Laure Gibault8,9, Ecaterina Pintilie10,Cécile Badoual8,9, Sarah Humez11,12, Françoise Galateau-Sallé13, Marie-Christine Copin11,14, Eric Letouzé1,Arnaud Scherpereel15,16, Jessica Zucman-Rossi1,8, Françoise Le Pimpec-Barthes1,8,17, Marie-Claude Jaurand1 andDidier Jean1*
Abstract
Background: Malignant pleural mesothelioma (MPM) is a heterogeneous cancer. Better knowledge of molecularand cellular intra-tumor heterogeneity throughout the thoracic cavity is required to develop efficient therapies. Thisstudy focuses on molecular intra-tumor heterogeneity using the largest series to date in MPM and is the first toreport on the multi-omics profiling of a substantial series of multi-site tumor samples.
Methods: Intra-tumor heterogeneity was investigated in 16 patients from whom biopsies were taken at distinctanatomical sites. The paired biopsies collected from apex, side wall, costo-diaphragmatic, or highest metabolic sitesas well as 5 derived cell lines were screened using targeted sequencing. Whole exome sequencing, RNAsequencing, and DNA methylation were performed on a subset of the cohort for deep characterization. Molecularclassification, recently defined histo-molecular gradients, and cell populations of the tumor microenvironment wereassessed.
Results: Sequencing analysis identified heterogeneous variants notably in NF2, a key tumor suppressor gene ofmesothelial carcinogenesis. Subclonal tumor populations were shared among paired biopsies, suggesting apolyclonal dissemination of the tumor. Transcriptome analysis highlighted dysregulation of cell adhesion andextracellular matrix pathways, linked to changes in histo-molecular gradient proportions between anatomic sites.Methylome analysis revealed the contribution of epigenetic mechanisms in two patients. Finally, significant changesin the expression of immune mediators and genes related to immunological synapse, as well as differentialinfiltration of immune populations in the tumor environment, were observed and led to a switch from a hot to acold immune profile in three patients.
© The Author(s). 2021 Open Access This article is licensed under a Creative Commons Attribution 4.0 International License,which permits use, sharing, adaptation, distribution and reproduction in any medium or format, as long as you giveappropriate credit to the original author(s) and the source, provide a link to the Creative Commons licence, and indicate ifchanges were made. The images or other third party material in this article are included in the article's Creative Commonslicence, unless indicated otherwise in a credit line to the material. If material is not included in the article's Creative Commonslicence and your intended use is not permitted by statutory regulation or exceeds the permitted use, you will need to obtainpermission directly from the copyright holder. To view a copy of this licence, visit http://creativecommons.org/licenses/by/4.0/.The Creative Commons Public Domain Dedication waiver (http://creativecommons.org/publicdomain/zero/1.0/) applies to thedata made available in this article, unless otherwise stated in a credit line to the data.
* Correspondence: [email protected] de Recherche des Cordeliers, Inserm UMRS-1138, SorbonneUniversité, Université de Paris, Functional Genomics of Solid Tumors, Paris,FranceFull list of author information is available at the end of the article
Meiller et al. Genome Medicine (2021) 13:113 https://doi.org/10.1186/s13073-021-00931-w

Conclusions: This comprehensive analysis reveals patient-dependent spatial intra-tumor heterogeneity at thegenetic, transcriptomic, and epigenetic levels and in the immune landscape of the tumor microenvironment.Results support the need for multi-sampling for the implementation of molecular-based precision medicine.
Keywords: Thoracic tumor, Spatial molecular intra-tumor heterogeneity, Clonality, NF2 subclonal mutation, Tumormicroenvironment
BackgroundMalignant pleural mesothelioma (MPM) is a rare andhighly aggressive tumor arising in the thoracic cavity.Exposure to asbestos is the main risk factor, and despitethe ban of this mineral fiber in several countries, MPMremains a major public health problem worldwide. Inmost patients, MPM is an incurable cancer with a verypoor prognosis, notably due to the ineffectiveness ofconventional anti-tumor treatments. The reference treat-ment is based on systemic platinum-based chemother-apy combined with pemetrexed, a treatment thatimproves survival by only a few months even with therecent addition of the anti-VEGF therapy bevacizumab[1]. More recently, immunotherapy based on immunecheckpoint inhibitors has shown survival benefits in par-ticular in patients with non-epithelioid histology, with-out an accurate predictive biomarker for treatmentresponse besides age and histology [2–4]. Despite thisrecent therapeutic progress, there is still an urgent needto develop a precision medicine approach taking into ac-count MPM heterogeneity.Like most solid tumors, MPM is a heterogeneous can-
cer with high variability between patients [5]. The het-erogeneity of MPM was first described at the histologiclevel by defining three main types: epithelioid, sarcoma-toid, and biphasic. Different histologic subtypes havebeen described especially for the epithelioid type includ-ing, but, not limited to, tubulopapillary, acinar, trabecu-lar, solid, and micropapillary architectural subtypes [6,7]. Interestingly, studies show that histologic subtypeand grade of epithelioid MPM have a prognostic impact[6, 8]. More recently, the rare transitional type, whichcould also be a subtype of the sarcomatoid type, wasdescribed [9]. Large-scale omics and next-generationsequencing (NGS) studies have demonstrated MPMinter-tumor heterogeneity at the molecular level and ledto molecular classifications into two to four subtypes[10–13]. More recent publications have shown thatMPM heterogeneity is well-described by a continuum[10, 14]. Recently, we defined histo-molecular gradients,which also takes into consideration intra-tumor hetero-geneity, by determining the proportions of epithelioid-like and sarcomatoid-like cellular entities (E.score andS.score), related to the two extreme histological types ofMPM, within tumor samples. These gradients have ahigh prognostic value and are of interest to guide
therapeutic strategies, including targeted therapies andimmunotherapies [10].MPM is a solid tumor characterized by a diffuse locor-
egional growth within the pleural cavity. A polyclonalorigin has been described and subclonal cell populationswith specific mutations have been evidenced [15, 16]. Sofar, only two studies have focused on spatial genetic het-erogeneity [17, 18]. Variability in the mutational loadwithout involving key genes of mesothelial carcinogen-esis was first observed between anatomical locations in aseries of six patients [17]. Very recently, a series of ninepatients also highlighted heterogeneous mutations be-tween anatomical locations [18]. Some evidence sup-ports spatial heterogeneity concerning the tumormicroenvironment [5]. Both the above studies showeddistinct T-cell repertoires depending on the tumor ana-tomic region [17, 18]. However, contrary to inter-tumormicroenvironmental heterogeneity in terms of stromaland immune cell infiltration [10, 19], intra-tumor cellheterogeneity of the tumor microenvironment has notyet been reported.In the present study, we have gone further in the
characterization of MPM molecular spatial heterogeneityin the largest series of patients (16 cases) studied so far.We not only defined the heterogeneity at the geneticlevel and, for the first time, characterized the spatial dys-regulation of gene expression, epigenetic changes, andtumor microenvironment differential infiltration.
MethodsPatientsTumor samples were collected from up to four distinctanatomical sites (apex, side wall, costo-diaphragmatic,and highest metabolic sites detected by positron emis-sion tomography (PET) scan when present, shown inAdditional file 1: Figure S1) in a series of 16 patientswho had diagnostic biopsies or surgery resections forMPM in two French hospitals (CHRU of Lille and Hôpi-tal Européen Georges Pompidou of Paris). For each pa-tient, the tumor location is indicated (A: apex; B: sidewall; C: costo-diaphragmatic; D: highest metabolic site).Non-tumoral samples (blood or muscle of the chestwall) were available for 9 patients. Patients were diag-nosed between 2014 and 2017 and tumors were certifiedby the French National Pathology Expertise Network(Mesopath) as MPM [20]. Histologic type, subtype, and
Meiller et al. Genome Medicine (2021) 13:113 Page 2 of 16
grade were determined by MesoPath expert pathologistsand part of the series was reviewed according to theWHO 2021 update [21]. The experiments were under-taken with the understanding and written consent ofeach subject. The study methodologies were conformedto the standards set by the Declaration of Helsinki andapproved by a local medical ethics committee (CPP Ile-de-France II). The sampling procedures were approvedby the French research ministry (CODECOH no. DC-2016-2771). Samples were annotated with detailedclinico-pathological and epidemiologic information ob-tained from pathology reports (Additional file 1: TableS1). Based on tumor purity and a quality check of ex-tracted nucleic acids, two tumor samples per patientwere used for further analysis. Three metrics were usedto evaluate tumor purity: (i) pathologist assessment oftumor cellularity, (ii) prediction by RT-qPCR of non-tumor components using WISP deconvolution method[10], and (iii) frequencies of variants determined by tar-geted NGS. For the few patients with more than 2 quali-fied tumor samples, paired samples with the closesttumor purity were kept. In addition, MPM primary celllines were generated from five patients in our laboratory,from fresh tumor samples collected at sites distinct fromthe four previous locations. They were established, cul-tured as previously described [22], and used at low-passage numbers (6 to 10 passages). All tumor samplesand cell lines were analyzed by targeted NGS, 9 pairedtumor samples by whole exome sequencing (T199LE-A/B, T200LE-A/C, T201LE-A/B, T203LE-A/C, T225LE-A/D, T227LE-A/D, T277HP-A/C, T278HP-A/C, T333HP-A/C), 8 by RNA sequencing (T199LE-A/B, T201LE-A/B,T203LE-A/C, T225LE-A/D, T227LE-A/D, T277HP-A/C,T278HP-A/C, T333HP-A/C), and 5 by methylation pro-filing (T203LE-A/C, T227LE-A/D, T277HP-A/C,T278HP-A/C, T333HP-A/C).
Nucleic acid extractionFor tumor samples, a preliminary step of tissue disrup-tion and cell lysis was achieved using TissueLyser II(Qiagen, Courtaboeuf, France). Genomic DNA and totalRNA from tumor samples and cell pellets, obtained fromcultures of MPM primary cell lines at passages 6 to 10,were extracted using the AllPrep DNA/RNA/miRNAUniversal kit (Qiagen) according to the manufacturer’sprotocol. For the fresh tumor sample used to establishMPM_83, automated DNA extraction was performed onmultiple sections (n = 34) of the frozen preserved samplefollowing the protocol of the Maxwell 16 Tissue DNApurification kit and the Maxwell instrument (Promega,Charbonnières-les-Bains, France). DNA and RNA quan-tifications were done by fluorescence measurements(Hoechst dye) on a FLUOstar Omega microplate reader(BMG Labtech, Champigny sur Marne, France) and by
spectrometry on a NanoDrop-1000 (Ozyme, Saint-Cyr-l’Ecole, France), respectively. We used agarose gel migra-tion for DNA to ensure the absence of excessive degrad-ation before sequencing and methylation analysis. Weassessed RNA integrity on a Fragment Analyzer (AgilentTechnologies, Courtaboeuf, France) before RNA-seqanalysis.
Targeted next-generation sequencing (NGS) and variantcallingWe performed targeted NGS using our in-house proto-col recently published in detail to sequence 21 genes andthe TERT promoter on the whole series of samples (16patients) [22, 23]. Briefly, library preparation was basedon a multiplex PCR enrichment and sequencing wasachieved by a MiSeq instrument (Illumina, Evry, France).FASTQ files were generated by the Illumina MiSeq Re-porter software. Primer sequences were removed usingthe fastx_trimmer function from the fastx toolkit. Readswere aligned on the human genome assembly hg19/GRCh37 using the Burrows-Wheeler aligner (BWA) andbam files were generated using samtools. Variant callingwas performed with Unified Genotyper and variant an-notation was obtained using the Oncotator annotationalgorithm, along with the ensembl Variant Effect Pre-dictor (VEP) algorithm and the Annovar annotation. Fi-nally, based on these annotations, all somatic variantswith a functional consequence were checked byvisualization using Integrative Genomic Viewer (IGV)software (Broad Institute, Cambridge, MA, USA). Vari-ants of interest were validated either using whole exomesequencing (WES) data or by a second independent tar-geted NGS. Genome coordinates were converted to hu-man genome assembly hg38/GRCh38 using the UCSCLiftOver online tool [24].
Whole exome sequencing (WES) and variant callingLibrary preparation, exome capture, sequencing, anddata analysis were performed by IntegraGen (Evry,France). We screened all paired biopsies with non-tumoral samples available (9 patients) [23]. Briefly, gen-omic DNA was captured either using the Agilent in-solution enrichment methodology with their biotinylatedoligonucleotide probe library (SureSelect Clinical Re-search Exome V2, Agilent Technologies) or the TwistHuman Core Exome Enrichment System (Twist Bio-science, San Francisco, USA), followed by paired-end 75base massively parallel sequencing on IlluminaHiSeq4000. Sequence capture, enrichment, and elutionwere performed according to the manufacturer’s instruc-tions and protocols without modification, except for thelibrary prepared using NEBNext® Ultra II kit (New Eng-land Biolabs, Evry, France). Image analysis and base call-ing were performed using Illumina Real-Time Analysis
Meiller et al. Genome Medicine (2021) 13:113 Page 3 of 16
(2.7.7) with default parameters. Sequence reads weremapped to the human genome build hg38/GRCh38 byusing the BWA tool. The duplicated reads were removedusing sambamba tools. Variant calling, allowing theidentification of genetic alterations, as well as SNV (sin-gle nucleotide variation) and small insertions/deletions(up to 20 bp), was performed via the Broad Institute’sGATK Haplotype Caller GVCF tool (3.7) for constitu-tional DNA and via the Broad Institute’s MuTect toolfor somatic DNA. Ensembl’s VEP (variant effect pre-dictor) program processed variants for further annota-tion [25, 26]. An in-house post-processing workflow wasapplied to filter out candidate somatic mutations thatwere more consistent with artifacts or germline muta-tions. Finally, the variants were validated by visualizationusing IGV software. Two bioinformatics predictions formissense pathogenicity were used: SIFT (5.2.2) and Poly-Phen (2.2.2) and damaging variants were considered if itwas predicted by at least one tool. The circular binarysegmentation algorithm implemented in the Bioconduc-tor package DNAcopy (DNAcopy 1.32.0) as well asFACET R package (v.0.6.1.) were used to reconstructcopy-number profiles from WES data [27, 28]. ForFACET analysis, single nucleotide polymorphisms (SNP)count matrix for both tumoral and non-tumoral sampleswas obtained by processing bam files with snp-pileup(arguments: -q15; -Q20; -P100; -r20,0). Then, SNPmatrix was processed using preProcSample function(cval = 25, snp.nbhd=250, ndepth=30) to generate log-R-ratio and the segmentation. ProcSample (cval=150, min.-nhet=5) was then used to estimate the wild-type 2-copystate. Finally, emcncf (min.nhet=5) function was used toestimate sample ploidy and purity. R package ggplot wasused to make pangenomic graphical representations.Cancer-related genes were based on Tier 1 of the CancerGene Census (CGC) database [29, 30].
Clonality predictionFor each mutation, we used the Palimpsest R package[31] to estimate the fraction of tumor cells harboringthis variant (cancer cell fraction, CCF) in each tumor, aspreviously described [32]. In addition, the emcncf (min.-nhet=5) function of FACET package (v.0.6.1.) was usedto determine cellular fraction and allele-specific copy-numbers per segments from CNV data [28]. T200LEwas excluded from this analysis as results were not reli-able probably due to low tumor purity. CCF for CNVwas calculated by dividing a cellular fraction by tumorpurity. For pairs of tumor samples from a given patient,the comparison of the CCF distribution between sampleswas used to sort mutations or CNV among clonalshared, subclonal shared, clonal private, and subclonalprivate variants. Variants or CNV were considered sub-clonal if the CCF value of both tumor samples were
lower than 0.5 and, for variants only, if the upper limitof the confidence interval was below 1. Shared variantswere found in both paired tumor samples in contrast toprivate variants.
RNA sequencingLibrary preparation and sequencing were performed byIntegraGen on paired biopsies of 8 patients [23]. Librar-ies were prepared using the TruSeq Stranded mRNA kit(Illumina) or the NEBNext Ultra II Directional RNA Li-brary Prep Kit (New England Biolabs), according to thesupplier’s recommendations. Briefly, the key steps ofboth protocols were (i) purification of PolyA-containingmRNA molecules using poly-T oligo attached magneticbeads from 1 μg total RNA, (ii) RNA fragmentationusing divalent cations at an elevated temperature to ob-tain approximately 300 bp fragments, (iii) double-strandcDNA synthesis, and (iv) Illumina adapter ligation andcDNA library amplification by PCR for sequencing.Paired-end 75 base massively parallel sequencing wasthen carried out on an Illumina HiSeq4000. FASTQ fileswere aligned to the human reference genome hg38/GRCh38 using TopHat2 V.2.0.14 [33]. We removedreads mapping to multiple locations, and we usedHTSeq [34] to obtain the number of reads associatedwith each gene in the Gencode v27 database. The Bio-conductor DESeq2 package [35] was used to import rawHTSeq counts for each sample into R statistical software(R Foundation for Statistical Computing, Vienna,Austria) and to apply variance stabilizing transformationto the raw count matrix. FPKM values (number of frag-ments per kilobase of exon model and millions ofmapped reads) were calculated by normalizing the countmatrix for the library size estimated with the DESeq2package and the coding length of each gene. Differen-tially expressed genes were determined using bothFPKM and DESeq2-normalized RNA-seq data: genesthat displayed a FPKM value below 1 in both paired bi-opsies were excluded and we considered as differentiallyexpressed only genes with a difference of DESeq2 ex-pression values between paired samples above 1. Hier-archical clustering was done using cosine distance andWard’s linkage method in R statistical software with the500 most differentially expressed genes. Network ana-lysis of the distribution of the differentially expressedgenes among tumor samples was performed using theweb-based interactive tool DiVenn [36].
Gene fusion detectionFusions detected by TopHat2 (--fusion-search --fu-sion-min-dist2000 --fusion-anchor-length13 --fusion-ignore-chromosomes chrM) were filtered using theTopHatFusion pipeline [37]. We discarded artifactsbased on fusion redundancy among samples from
Meiller et al. Genome Medicine (2021) 13:113 Page 4 of 16
different patients. Fusions validated by BLAST andwith at least 20 split-reads or pairs of reads spanningthe fusion event in at least one of the paired tumorsamples were retained. Shashimi plots were generatedusing junctions.bed provided by TopHat2 to deter-mine the junctions supported by splitted reads andbedtools genomecov function (with -bga -split op-tions) to calculate the coverage from the aligned bamfiles.
Molecular classification and histo-molecular scorepredictionsExpression data from RNA sequencing (DESeq2-normal-ized counts) were used to predict molecular subgroupsand histo-molecular scores (E/S.score) based on cen-troids and deconvolution approaches, respectively, as de-scribed previously [10].
Methylation profilingExperimental works and data analysis were performedby IntegraGen on paired biopsies of 5 patients [38]. First,bisulfite conversion of 500 ng of DNA samples was per-formed with the Zymo EZ DNA Methylation Kit(Ozyme) according to the manufacturer’s instructions.Then, methylation analysis was performed on the Infi-nium MethylationEPIC BeadChip Kit (Illumina) follow-ing the supplier’s recommendations. Briefly, sampleswere denatured, neutralized, and incubated in the Illu-mina hybridization oven for 20–24 h at 37 °C to uni-formly amplify genomic DNA, then enzymaticallyfragmented. Following the fragmentation step, sampleswere hybridized to the BeadChip and incubated at 48 °Cfor 16–24 h in the Illumina hybridization oven. Finally,non-hybridized and unspecific hybridized DNA sampleswere washed from the BeadChip, and labeled nucleotideswere added to extend and stain primers hybridized tothe samples. The Illumina iScan system (with the iScanControl Software) was used to scan Illumina MethEpicBeadChips and raw data were analyzed with GenomeS-tudio software v2011 according to Illumina’s recommen-dations to generate result files with beta-values. Lociwere considered as differentially methylated betweenpaired tumor samples when both detection p-valueswere lower than 0.05 and a difference of at least 0.2 wasobserved between beta-values of each tumor sample. Tocompare with genes previously reported to be correlatedto the E.score or the S.score [10], we only consideredgenes with expression changes in the expected sense ac-cording to the histo-molecular scores of the paired biop-sies. Hierarchical clustering was done using cosinedistance and Ward’s linkage method in R statistical soft-ware with the 500 CpG showing the most variability intheir methylation beta-value.
Pathway dysregulation analysisSignal pathway dysregulation analysis was performed bytwo complementary approaches : over-representationanalysis and single-sample Gene Set Enrichment Ana-lysis (ssGSEA). Differentially expressed or methylatedgenes lists obtained for each patient were used as inputfor over-representation analysis in the web-based GeneSeT AnaLysis Toolkit using the KEGG, Reactome, orGeneOntology Biological Process non-redundant data-bases [39]. We only considered pathways with false dis-covery rate (FDR) adjusted p-values lower than 0.05.Gene ratio is the proportion of differentially expressedgenes regarding the total number of genes included in agiven pathway. SsGSEA were calculated as gene-set vari-ation analysis (GSVA) enrichment scores using theDESeq2-normalized RNA-seq data, after excluding geneswith a FPKM value below 1 for all samples, and theGSVA package [40]. The absolute value of the delta ofeach ssGSEA score between paired tumor samples(ssGSEA_score) was used to assess intra-tumorheterogeneity.
Tumor microenvironment estimationThe microenvironment cell population counter (MCP-counter) method [41] was used to compute scores of in-filtration for different cell populations from DESeq2-normalized RNA-seq data. To optimize the prediction ofthe relative abundance of stromal and immune cellswithin MPM tumors, the genes included in the signatureof each cell population were selected based on their ab-sence of expression in 22 MPM cell lines. IGKC andCHRM3-AS2 were also excluded as gene expression wasnot present in all datasets. The complete list of genesused for each population is available in Additional file 1:Table S2. For integrative analysis with public datasets, atotal of 295 samples from three different series of RNA-seq were combined in the integrated analysis, includingthe 16 paired tumor samples, 209 samples from Buenoet al. [11, 42], and 70 samples from TCGA [13] down-loaded through the Broad Institute TCGA GDAC fire-hose tool [43]. Then, we standardized gene expressionseparately to have a mean of 0 and a standard deviationof 1 per gene in each dataset. Statistical analysis and datavisualization were performed using R software. Unsuper-vised hierarchical clustering was performed using cosinedistance and Ward’s linkage method. The Wilcoxon testwas used to estimate the difference in the abundance ofimmune populations within paired tumor samples.
Immunohistochemical stainingFormalin-fixed, paraffin-embedded (FFPE) tumor biop-sies (3 biopsies at distant sites per patient) were sec-tioned at a thickness of 3 μm and stained on positivelycharged glass slides. Deparaffinization, rehydration, and
Meiller et al. Genome Medicine (2021) 13:113 Page 5 of 16

antigen retrieval were performed by CC1 (prediluted;pH 8.0) antigen retrieval solution (Ventana Medical Sys-tems, Inc.) on the Ventana BenchMark ULTRA auto-mated slide stainer for 32 min at 100 °C. Specimens wereincubated with primary antibodies anti-CD3 (cloneLN10; Leica; dilution 1:100), anti-CD8 (clone C8/144B;Dako, dilution 1:25), and anti-CD20 (clone L26; Diago-mics; dilution 1:150) followed by visualization with theUltraview DAB IHC Detection Kit. The specimens werethen counterstained with hematoxylin II and bluing re-agent (Ventana) and coverslipped. Each IHC run con-tained a positive control.
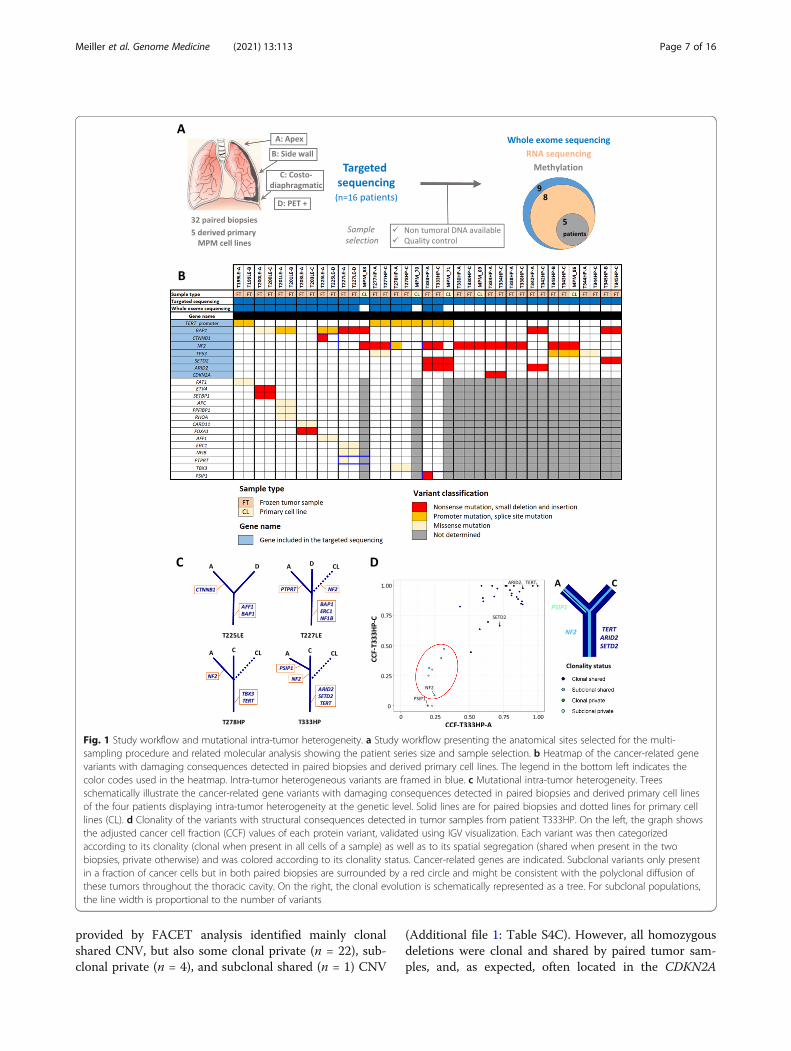
ResultsMutational intra-tumor heterogeneityPaired tumor samples collected prior to chemotherapytreatment at two distinct anatomical sites from 16 MPMpatients and five MPM-derived primary cell lines wereanalyzed by different NGS and omics methods (Fig. 1a).Patient characteristics are detailed in Additional file 1:Table S1. In summary, patients were chemonaïve, mostlymale (81%), had a past exposure to asbestos (62%), andwere diagnosed at a median age of 74 years. One tumorwas biphasic and the others were epithelioid, the mostfrequent histologic type. Even if the epithelioid tumorsbelong to different subtypes and grades, our series donot fully reflect the histologic diversity of MPM. Germ-line mutations in cancer-related genes for 9 patients arereported in Additional file 1: Table S3A. Among genespreviously reported as altered by pathogenic or likelypathogenic germline mutations in MPM [44], damagingvariants were found in SDHA and PALB2 genes in pa-tients T225LE and T277HP, respectively.To investigate mutational intra-tumor heterogeneity,
we performed targeted NGS on a panel of key genes ofmesothelial carcinogenesis [22] for the entire series andWES for patients with non-tumoral DNA available to godeeper in their genetic characterization. Most of theprotein-altering somatic variants, validated using mul-tiple sequencing approaches and IGV visualization, werecommon between paired samples from a given patient(Fig. 1b, c; Additional file 1: Table S3B-D). However, wefound intra-tumor heterogeneous variants in the well-known mesothelioma driver gene NF2. Among eightpatients harboring NF2 mutations, three displayed intra-tumor heterogeneity. The first patient (T227LE) had aNF2 nonsense variant in the derived primary cell line(MPM_83), although it was not called in the paired bi-opsies. Therefore, we investigated the presence of thevariant in the fresh tumor sample used to establishMPM_83 by sequencing multiple sections of this sampleand found the NF2 variant at different frequencies, con-firming the subclonal status of the NF2 mutation (Add-itional file 2: Figure S2, Additional file 1: Table S3E). For
the second patient (T278HP), we detected an NF2 splicesite variant in the sample localized at the apex but it wasabsent in the paired costo-diaphragmatic sample and inthe derived primary cell line (MPM_70). Finally, thethird patient (T333HP) presented an NF2 nonsense vari-ant at low frequency in both biopsies, but the mutationwas not found in the derived primary cell line (MPM_71), suggesting that this mutation was subclonal andprobably absent in the fresh tumor sample used to estab-lish MPM_71. In addition to NF2, we also detectedintra-tumor heterogeneous mutations in three cancer-related genes [29]: (i) a frameshift insertion variant inCTNNB1 for patient T225LE, (ii) a missense variant inthe protein tyrosine phosphatase receptor PTPRT for pa-tient T227LE (however, based on RNA-seq data, thisgene does not seem to be expressed in both samples ofthis tumor), and (iii) a nonsense variant in the transcrip-tional coactivator PSIP1 for patient T333HP, to ourknowledge the first mutation in this gene described forMPM (Fig. 1b).The clonality of the protein-altering variants was also
assessed to investigate subclonal tumor populations thatcould be in different proportions among paired samples.To perform a robust analysis of clonality, we calculatedthe cancer cell fraction of each variant, by normalizingvariant frequencies with copy number and tumor purity(Additional file 1: Table S4A). As expected, we foundmost of the cancer-related gene variants to be clonal andshared by both paired samples except for the four genesmentioned previously (Additional file 2: Figure S3).Tumor clonality was heterogeneous between patients,who showed a variable number of private variants ran-ging from 0 to 12 (Additional file 1: Table S4B). Strik-ingly, we found a subclonal tumor population present inboth biopsies in patient T333HP supported by six vari-ants, including NF2 (Fig. 1d). Of note, the variant fre-quencies in the clonal tumor population (ARID2,SETD2, and TERT promoter) and in the subclonal popu-lation (NF2) were validated by targeted NGS for this pa-tient (Additional file 1: Table S3B). This suggests thepolyclonal dissemination of these tumors throughout thethoracic cavity. Furthermore, shared subclonal variantswere also identified in three other patients, i.e., T199LE,T203LE, and T225LE (Additional file 2: Figure S3).
Copy number variations and fusion transcriptsBecause MPM is often characterized by chromosomal al-terations, we took advantage of WES coverage andRNA-seq data to analyze copy number variations (CNV)and fusion transcripts, respectively. First, we found thatpangenomic CNV between paired samples were verysimilar using both DNAcopy or FACET tools, notably inthe CDKN2A, BAP1, and NF2 loci (Additional file 2: Fig-ures S4 and S5). Segmentation and CNV clonality
Meiller et al. Genome Medicine (2021) 13:113 Page 6 of 16
provided by FACET analysis identified mainly clonalshared CNV, but also some clonal private (n = 22), sub-clonal private (n = 4), and subclonal shared (n = 1) CNV
(Additional file 1: Table S4C). However, all homozygousdeletions were clonal and shared by paired tumor sam-ples, and, as expected, often located in the CDKN2A
Fig. 1 Study workflow and mutational intra-tumor heterogeneity. a Study workflow presenting the anatomical sites selected for the multi-sampling procedure and related molecular analysis showing the patient series size and sample selection. b Heatmap of the cancer-related genevariants with damaging consequences detected in paired biopsies and derived primary cell lines. The legend in the bottom left indicates thecolor codes used in the heatmap. Intra-tumor heterogeneous variants are framed in blue. c Mutational intra-tumor heterogeneity. Treesschematically illustrate the cancer-related gene variants with damaging consequences detected in paired biopsies and derived primary cell linesof the four patients displaying intra-tumor heterogeneity at the genetic level. Solid lines are for paired biopsies and dotted lines for primary celllines (CL). d Clonality of the variants with structural consequences detected in tumor samples from patient T333HP. On the left, the graph showsthe adjusted cancer cell fraction (CCF) values of each protein variant, validated using IGV visualization. Each variant was then categorizedaccording to its clonality (clonal when present in all cells of a sample) as well as to its spatial segregation (shared when present in the twobiopsies, private otherwise) and was colored according to its clonality status. Cancer-related genes are indicated. Subclonal variants only presentin a fraction of cancer cells but in both paired biopsies are surrounded by a red circle and might be consistent with the polyclonal diffusion ofthese tumors throughout the thoracic cavity. On the right, the clonal evolution is schematically represented as a tree. For subclonal populations,the line width is proportional to the number of variants
Meiller et al. Genome Medicine (2021) 13:113 Page 7 of 16
locus. Interestingly, we identified a CNV with a subclo-nal status in both paired tumor biopsies in patientT333HP, supporting previous results based on variantclonality analysis. Then, we searched for fusion tran-scripts in RNA-seq data that we generated for the sameseries of samples screened with WES, except for tumorsamples from patient T200LE due to poor RNA qualityin addition to very low tumor content. In three patients,we detected fusions involving a cancer-related gene,such as STK11 and KDM6A, quoted as altered in MPMin the Cosmic database (release v91), or TFG reported infusions in other cancers (Additional file 1: Table S5,Additional file 2: Figure S6A) [45]. Interestingly, wefound that the fusion transcript in patient T277HP in-volving TFG and ADGRG7 led to abnormal gene expres-sion of the adhesion G-protein coupled receptor ADGRG7, a gene not commonly expressed in MPM (Add-itional file 2: Figure S6B). For these three fusions, bothpaired samples harbored the rearrangement. To note, wealso detected four fusion transcripts restricted to one ofthe paired samples in three patients, but they did not in-volve cancer-related genes. In conclusion, we did not ob-serve structural intra-tumor heterogeneity at thegenomic level with an evident contribution to cancerdevelopment.
Differential gene expression and signal pathwaydysregulationGene expression analysis, from the RNA-seq data ofpaired samples from eight patients, indicated globalgene expression as being patient-specific, as shown byunsupervised clustering (Additional file 2: Figure S7).The number of differentially expressed (DE) genes be-tween paired samples ranged from 647 to 2119 genes,regardless of tumor cellularity (Spearman correlationtest, R squared=0.01, p = 0.79), with a majority ofprotein coding genes (Additional file 2: Figure S8A).A high proportion of these protein coding genes wasfound to be differentially expressed in several tumorsamples (Additional file 1: Table S6A, Additional file2: Figure S8B). However, shared DE genes were dis-tributed throughout all tumor samples (Additional file2: Figure S8C). We performed signal pathway over-representation analysis using the KEGG, Reactome,and GeneOntology databases on protein coding genesdifferentially expressed between paired samples.Among the top recurrent pathways detected in allthese databases, we found two main families, the firstone related to cell adhesion and extracellular matrixorganization and the second to immune communica-tion (Additional file 1: Table S6B-D).We also analyzed signal pathway dysregulation by
ssGSEA across the whole cohort (Additional file 1: TableS6E). Recurrent major changes between paired tumor
samples concern immune pathways, more precisely re-lated to immunological synapses involving specific im-mune cells infiltration such as antigen-presenting cells(dendritic and B cells) and T cells.
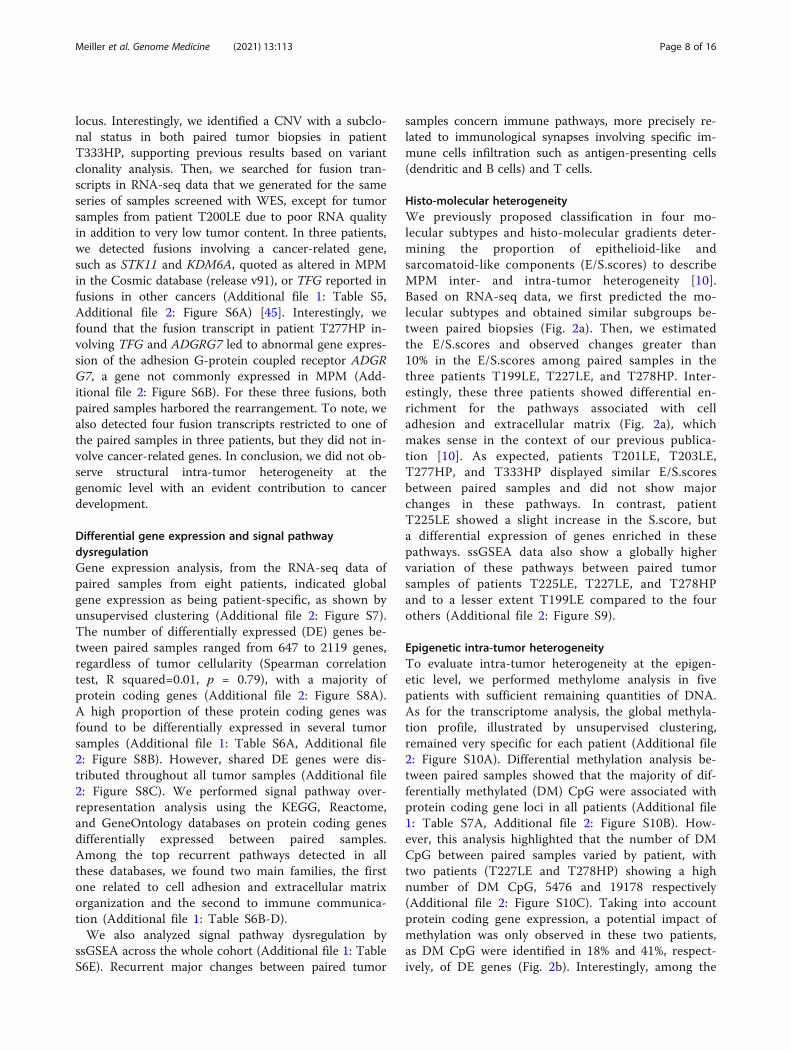
Histo-molecular heterogeneityWe previously proposed classification in four mo-lecular subtypes and histo-molecular gradients deter-mining the proportion of epithelioid-like andsarcomatoid-like components (E/S.scores) to describeMPM inter- and intra-tumor heterogeneity [10].Based on RNA-seq data, we first predicted the mo-lecular subtypes and obtained similar subgroups be-tween paired biopsies (Fig. 2a). Then, we estimatedthe E/S.scores and observed changes greater than10% in the E/S.scores among paired samples in thethree patients T199LE, T227LE, and T278HP. Inter-estingly, these three patients showed differential en-richment for the pathways associated with celladhesion and extracellular matrix (Fig. 2a), whichmakes sense in the context of our previous publica-tion [10]. As expected, patients T201LE, T203LE,T277HP, and T333HP displayed similar E/S.scoresbetween paired samples and did not show majorchanges in these pathways. In contrast, patientT225LE showed a slight increase in the S.score, buta differential expression of genes enriched in thesepathways. ssGSEA data also show a globally highervariation of these pathways between paired tumorsamples of patients T225LE, T227LE, and T278HPand to a lesser extent T199LE compared to the fourothers (Additional file 2: Figure S9).
Epigenetic intra-tumor heterogeneityTo evaluate intra-tumor heterogeneity at the epigen-etic level, we performed methylome analysis in fivepatients with sufficient remaining quantities of DNA.As for the transcriptome analysis, the global methyla-tion profile, illustrated by unsupervised clustering,remained very specific for each patient (Additional file2: Figure S10A). Differential methylation analysis be-tween paired samples showed that the majority of dif-ferentially methylated (DM) CpG were associated withprotein coding gene loci in all patients (Additional file1: Table S7A, Additional file 2: Figure S10B). How-ever, this analysis highlighted that the number of DMCpG between paired samples varied by patient, withtwo patients (T227LE and T278HP) showing a highnumber of DM CpG, 5476 and 19178 respectively(Additional file 2: Figure S10C). Taking into accountprotein coding gene expression, a potential impact ofmethylation was only observed in these two patients,as DM CpG were identified in 18% and 41%, respect-ively, of DE genes (Fig. 2b). Interestingly, among the
Meiller et al. Genome Medicine (2021) 13:113 Page 8 of 16
DE protein coding genes associated to DM CpG, 18%and 47%, respectively, in patients T227LE andT278HP, are genes previously identified to be corre-lated with the E/S.scores of the histo-molecular gradi-ents (Fig. 2c). Furthermore, in T278HP, these geneswere enriched in previously identified pathways in-volved in cell adhesion and extracellular matrixorganization (Additional file 1: Table S7B; Additionalfile 2: Figure S10D). These results support the notionthat epigenetic regulation could contribute to the
variations occurring in the proportions of epithelioid-like and sarcomatoid-like components in patientT278HP and to a lesser extent in patient T227LE, inagreement with our previous studies demonstratingthat histo-molecular gradients are related to epigen-etic regulation [10].
Tumor microenvironmentWe next analyzed the immune landscape changes inpaired samples. Comparison based on over-
Fig. 2 Intra-tumor heterogeneity at the transcriptomic and epigenetic levels. a Molecular heterogeneity (molecular classifications and histo-molecular gradients) of the paired tumor samples and the over-represented pathways linked to cell adhesion and the extracellular matrix areshown in the table. For each patient, the tumor location is indicated (A: apex; B: side wall; C: costo-diaphragmatic; D: highest metabolic site). Themolecular classifications into two to four subtypes and the E/S.scores were predicted based on RNA-seq data and are colored in blue or greendepending on the subtypes and with a red gradient for the E/S.scores. Pathway over-representation is indicated by a circle with the size and acolor proportional to the gene ratio and the FDR p-values, respectively. b, c Based on transcriptome and methylome analysis, the differentiallyexpressed protein coding genes with an associated differentially methylated CpG (DE_DM genes) between paired tumor samples weredetermined. The percentage of DE_DM genes among all the differentially expressed protein coding genes is shown in the histogram for eachpatient. The number of DE_DM genes is indicated at the right of the histogram bars (b). The proportion of protein coding genes previouslyshown to be correlated to the E/S.scores [10] in all DE_DM genes is indicated in the pie charts for patients T227LE and T278HP (c). DE:differentially expressed; DM: differentially methylated
Meiller et al. Genome Medicine (2021) 13:113 Page 9 of 16
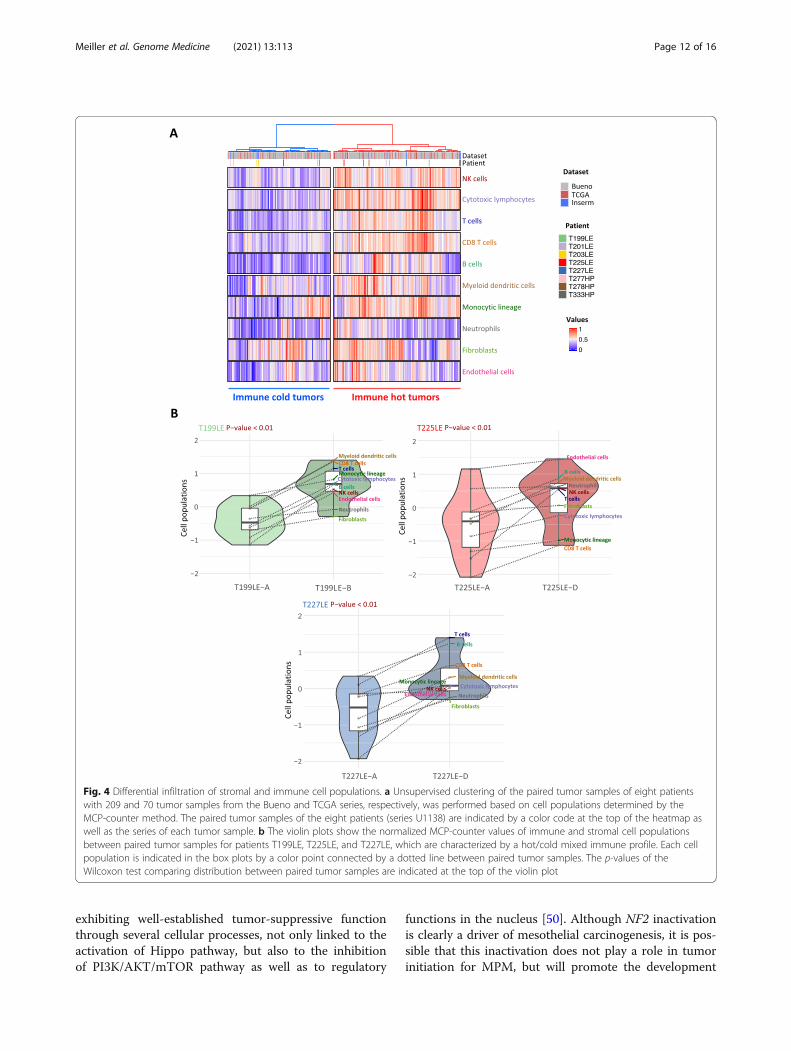
representation analysis of the immune system-relatedpathways redundant among the KEGG, Reactome, andGeneOntology databases (Additional file 1: Table S6)highlights pathways belonging to immune cell communi-cation such as cytokines and chemokines (Fig. 3a). ThessGSEA analysis points out changes in immunologicalsynapse pathways (Fig. 3b). Overall, dysregulation in im-mune pathways between paired tumor samples washigher in T199LE, T225LE, T227LE, and to a lesser ex-tent T201LE. Several immune checkpoints also showeddifferential expression between paired samples (Fig. 3c).In particular, a fold change greater than 2 was found inimmune checkpoints targeted by immunotherapy, i.e.,PDL1 (CD274) for T277HP and T278HP, CTLA4(CTLA4) for T227LE, and PD1 (PDCD1) for T278HP. Inaddition, we estimated the relative proportions of im-mune and stromal populations using MCP-counter de-fined biomarkers (Additional file 1: Table S2) fromRNA-seq data to determine the consistency of the tumormicroenvironment between paired samples. Clusteringanalysis using the estimated cell populations from pairedsamples integrated with tumor samples from the Buenoand TCGA series [11, 13] separated tumor samples intwo clusters, one with a high level of immune cell infil-tration corresponding to a hot tumor immune profile,and the other with a lower level of infiltration corre-sponding to a cold profile (Fig. 4a). Three paired tumorsamples from patients T199LE, T225LE, and T227LE,which displayed the highest dysregulation in immunepathways using both pathway analyses, were distributedseparately between hot and cold tumors, indicatingmajor changes in terms of the tumor microenvironmentcomposition. Clustering of paired samples without theintegration of other tumor samples also separated thetumor paired samples of patients T199LE, T225LE, andT227LE between the cold and hot phenotypes (Add-itional file 2: Figure S11). These paired samples showedsignificantly different relative proportions of stromal andimmune cell populations with an increase in the infiltra-tion of all cell populations in the hot immune profilepaired sample compared to the cold immune profilesample (Fig. 4b). More complex changes with an in-crease or decrease in certain cell populations betweenpaired samples were also observed in other patients(Additional file 2: Figure S12A). Individual comparisonof cell populations showed that natural killer cells, cyto-toxic lymphocytes, myeloid dendritic cells, T cells, Bcells, and T CD8 cells were variable in paired tumorsswitching from a cold to a hot immune profile (Add-itional file 2: Figure S12B). SsGSEA analysis of the aggre-gated pathways linked to specific immune cellpopulations confirmed the greatest changes in the infil-tration within paired tumors with a hot/cold mixed pro-file. Comparison between paired tumors with a hot/cold
mixed profile and the others displayed significant differ-ences (Mann-Whitney test, p = 0.04) for natural killercells, myeloid dendritic cells, and T cells (Additional file2: Figure S13). IHC using anti-CD3, anti-CD8, and anti-CD20 antibodies on 3 FFPE tumor samples per patient,biopsied at distant anatomic sites, showed heterogeneousinfiltration of T and B cells in T199LE patient and to alesser extent in T225LE and T227LE patients (Add-itional file 2: Figure S14).
DiscussionThe present study provides a comprehensive descriptionof spatial intra-tumor heterogeneity in MPM, along withnew insights into tumor evolution and clues to the im-pact on therapy.By a robust analysis of clonality restricted to validated
somatic protein-altering variants, we confirmed the oc-currence of MPM populations with different mutationprofiles, depending on the anatomic site in the same pa-tient, as previously observed [17, 18]. All tumors har-bored many shared clonal mutations, supporting thenotion that MPM was derived from a single cell in ourseries, contrary to the polyclonal origin previously de-scribed [15]. Along with these shared clonal variants, thepresence of private clonal or subclonal variants indicatesthat tumor cells spread in the thoracic cavity and con-tinue to evolve separately at different locations. One im-portant finding was the existence of subclonal tumorpopulations shared between anatomic sites for at leastone patient and likely in three others, which supportspolyclonal dissemination throughout the thoracic cavityin some MPM patients. Evidence of polyclonal dissemin-ation has been observed in metastases for several cancers[46]. This is possibly related to multiple waves of migrat-ing cells or to the implantation of circulating tumor cellclusters composed of genetically distinct clones thathave been described in biological fluids [47]. For MPM,numerous large tissue fragments and multicellular ballsor berry-like clusters of cells are observed by cytology inthe pleural fluid of patients [48, 49]. Our results suggestthat these multicellular structures of tumor cells partici-pate in the spread of MPM in the thoracic cavity.NF2 is one of the main mutated tumor suppressor
genes in MPM. As it plays a key role during mesothelialcarcinogenesis, inactivating variants were expected to beclonal [50]. However, we clearly demonstrate the pres-ence of subclonal NF2 mutations in three patients, char-acterized by clonal mutation in other key MPM mutatedcancer genes including BAP1, SETD2, and the TERTpromoter. The existence of MPM subclones harboringNF2 mutations was first suggested by a study identifyingone cell line with homozygous NF2 mutation, althoughthis was almost undetectable in the original tumor in aseries of nine MPM patients [16]. Heterogenous NF2
Meiller et al. Genome Medicine (2021) 13:113 Page 10 of 16

mutations between different tumor regions were also re-ported in two out of nine patients in another study, butthe subclonality was not confirmed by a rigorous CCFanalysis as we performed here [18]. Altogether, these
results suggest that subclonal NF2 mutations are fre-quent in MPM and support that NF2 inactivation couldbe a late event during MPM development. Merlinencoded by the NF2 gene, is a multifunctional protein
Fig. 3 Intra-tumor heterogeneity of immune pathway. a, b Dysregulated immune pathways identified by over-representation analysis (a) andsingle-sample Gene Set Enrichment Analysis (ssGSEA) (b). For each patient, the tumor location is indicated (A: apex; B: side wall; C: costo-diaphragmatic; D: highest metabolic site). The immunologic status “hot” or “cold” was determined based on clusterization of stromal and immunecell infiltration (see Fig. 4). Over-representation of each pathway linked to immune communication is indicated as a circle, whose size isproportional to the gene ratio and the color gradient represents the FDR p-values (a). The differences in the ssGSEA score (delta_score) of eachpaired tumor sample are indicated as a color gradient (b). c The differential expression between paired tumor samples of immune checkpoints isshown in the heatmap. Differential expression was set to 0 for genes which did not display an FPKM score higher than 1 in at least one of thepaired biopsies. The differentially expressed genes with a fold change of at least 2 are framed in blue. The genes encoding PDL1 (CD274), CTLA4(CTLA4), and PD1 (PDCD1) are indicated by a blue arrow
Meiller et al. Genome Medicine (2021) 13:113 Page 11 of 16
exhibiting well-established tumor-suppressive functionthrough several cellular processes, not only linked to theactivation of Hippo pathway, but also to the inhibitionof PI3K/AKT/mTOR pathway as well as to regulatory
functions in the nucleus [50]. Although NF2 inactivationis clearly a driver of mesothelial carcinogenesis, it is pos-sible that this inactivation does not play a role in tumorinitiation for MPM, but will promote the development
Fig. 4 Differential infiltration of stromal and immune cell populations. a Unsupervised clustering of the paired tumor samples of eight patientswith 209 and 70 tumor samples from the Bueno and TCGA series, respectively, was performed based on cell populations determined by theMCP-counter method. The paired tumor samples of the eight patients (series U1138) are indicated by a color code at the top of the heatmap aswell as the series of each tumor sample. b The violin plots show the normalized MCP-counter values of immune and stromal cell populationsbetween paired tumor samples for patients T199LE, T225LE, and T227LE, which are characterized by a hot/cold mixed immune profile. Each cellpopulation is indicated in the box plots by a color point connected by a dotted line between paired tumor samples. The p-values of theWilcoxon test comparing distribution between paired tumor samples are indicated at the top of the violin plot
Meiller et al. Genome Medicine (2021) 13:113 Page 12 of 16

of a more aggressive tumor. This hypothesis is in linewith several findings: (i) inactivation of NF2 in mousemodels led to a variety of malignant tumors but not tomesothelioma [51], except if this inactivation was associ-ated with asbestos exposure or with the inactivation ofother tumor suppressor genes [52]; recent studiesscreening germline mutations in large cohorts of pa-tients (reviewed in [44]) did not identify NF2 as a cancersusceptibility gene for MPM; and (iii) NF2 mutationsshowed a significantly higher mutation rate in MPMwith an advanced stage [22]. We previously showed thatMPM with mutations in members of the Hippo pathwaycould be more sensitive to specific anti-cancer molecules[53]. The Hippo pathway is becoming attractive for tar-geted therapy in cancer, and numerous companies aredeveloping compounds to inhibit the Hippo pathway[54]. Implementation of a therapeutic strategy based onHippo pathway dysregulation will need to take into ac-count the clonality of NF2 mutations in MPM. A hetero-geneous frameshift deletion was also found in CTNNB1.Inactivating mutations were previously reported inMPM [22, 55]. Loss of the beta-catenin protein in aMPM subclonal population lead to alterations in theWnt signaling pathway, which is involved in therapeuticresistance [56]. Consequently, detection of this subclonalpopulation could be of therapeutic interest.The presence of chromosomal abnormalities including
structural changes is a key feature of MPM [57]. How-ever, our data and those of Chen et al. [18] showed thatchromosomal profiles are globally similar between differ-ent regions within the same tumor. Similarly to copynumber aberrations, we did not identify specific relevantgene fusions limited to one of the paired tumor samples.As chromothripsis and chromoplexy lead to massive re-arrangements in several chromosome regions in MPM[58, 59], specific omic or NGS approaches will be neededto deeply analyze spatial tumor heterogeneity at thechromosome level. However, our results suggest that themain chromosomal alterations occurring in MPM areearly events of mesothelial carcinogenesis, in accordancewith the mechanism of action of asbestos, which is well-described as a genotoxic agent inducing chromosomaldamage [60].In addition to the detection of heterogeneous popula-
tions characterized by specific mutations, our resultshighlight major changes at the transcriptomic level be-tween tumors at different anatomic sites in some pa-tients, leading to the dysregulation of specific pathways.We showed that gene expression changes are related toepigenetic mechanisms in at least two patients. Methyla-tion analysis is limited to 5 patients, with only two withconsistent changes, and allows only descriptive conclu-sions to be drawn. Dysregulation of cell adhesion andextracellular matrix organization pathways is frequent in
patients and may reflect variations between the propor-tion of epithelioid and sarcomatoid phenotypes accord-ing to the anatomical site. One histologic study showedthat a diagnosis of epithelioid MPM in the initial biopsywas changed to the biphasic or sarcomatoid type in 19%of cases when the surgical resection was evaluated [61].In agreement, we observed variation greater than 10%and up to 23% in the E/S.scores of the paired biopsies ofthree patients [10]. We found epithelioid tumor sampleswith high S.score (up to 0.68), consistent with previousobservations in larger series [10, 22]. This may be relatedto the tumor representativity of a FFPE tumor sectioncompared to a piece of frozen tissue, or to a differentevaluation sensitivity. Another hypothesis is that theS.score predicts the proportion of sarcomatoid-like cells,which may not have completely a characteristic sarco-matoid cell morphology. Gene expression-based signa-tures to predict physiological process or prognosis suchas the E/S.score or the CV score (CLDN15/VIM) inMPM [10, 11, 62], as well as response to treatment is be-coming popular, and some of them have been evaluatedin phase 3 clinical trials for breast cancer [63]. Based onour results, multi-site tumor sampling should be recom-mended before implementing these assays in MPM.Finally, we found consequent spatial intra-tumor het-
erogeneity of the immune microenvironment. We veri-fied that this result was not due to a bias in sequencingdepth between samples. This is in line with previousstudies showing changes in the T cell repertoires at dif-ferent anatomic sites [17, 18]. Using the MCP-countermethod, whose predictions were validated previously byimmunohistochemistry in MPM [10], we emphasizeddifferential immune cell infiltration between paired sam-ples. Importantly, for three patients, the immune profilecould be considered hot or cold depending on the pairedsamples. Substantial gene expression variation was alsoobserved for PDL1, PD1, and CTLA4 in some patients.As immunotherapy with immune checkpoint inhibitorsis emerging as a promising therapeutic option for MPMpatients, biomarkers to predict the response to thistreatment are a crucial issue [2]. No predictive bio-marker is currently clearly defined for MPM, but im-mune cell infiltration and immune checkpointexpression have been suggested in other cancers, indi-cating that spatial intra-tumor heterogeneity needs to betaken into account to identify biomarkers in MPM [64].The limitation of this study is the small size of the
series in terms of patients and tumor samples per pa-tient. Further studies in larger series are needed toconfirm the frequency of our major findings and tohave an exhaustive view of spatial intra-tumor hetero-geneity in MPM. To predict response to therapy, itwould be also crucial to monitor clonal evolutionafter treatment.
Meiller et al. Genome Medicine (2021) 13:113 Page 13 of 16
ConclusionsSpatial intra-tumor heterogeneity is complex in MPMand varies among patients. We highlighted multipletypes of heterogeneity, i.e., (i) genetic, (ii) transcriptomic,(iii) epigenetic, and (iv) linked to the immune micro-environment. It was found that the accuracy of histo-logic classification is increased by the examination ofseveral tumor biopsies, and multi-sampling is recom-mended [21, 61]. Our molecular analysis also supportsthe notion that separate anatomic sites should be sam-pled from the pleural cavity to be able to estimate prog-nosis or predict response to treatment based onmolecular characteristics, with the aim of developingmolecular-based precision medicine strategies in orderto improve patient survival and quality of life.
AbbreviationsCCF: Cancer cell fraction; DE: Differentially expressed; DM: Differentiallymethylated; MPM: Malignant pleural mesothelioma; NGS: Next-generationsequencing; PET: Positron emission tomography; ssGSEA: Single-sample GeneSet Enrichment Analysis; TERT_prom: TERT promoter; WES: Whole exomesequencing
Supplementary InformationThe online version contains supplementary material available at https://doi.org/10.1186/s13073-021-00931-w.
Additional file 1: Table S1. Clinical annotations of MPM patients.Table S2. List of biomarkers included in MCP-counter. Table S3. Variantswith structural consequences in genes and variants in the TERT promoter.A Germline mutations identified by whole exome sequencing. B Variantscorrespondence between sequencing methods. C Somatic variants withstructural consequences in genes and variants in the TERT promoter iden-tified by whole exome sequencing. D Variants with structural conse-quences in genes and variants in the TERT promoter identified by DNAtargeted sequencing. E DNA targeted sequencing of multiple sections ofthe T227LE fresh tumor sample used to generate the MPM_83 primarycell line. Table S4. Clonality of the protein-altering somatic variants de-tected by whole exome sequencing. A Cancer cell fraction (CCF) valuesof protein-altering variants. B Clonality per patient based on protein-altering variants. C Cancer cell fraction (CCF) values of copy number varia-tions (CNV) based on FACET analysis. D Clonality per patient based onFACET analysis. Table S5. Fusion transcripts identified by RNA-seq. TableS6. Pathway dysregulation between paired tumor samples. A Differen-tially expressed protein coding genes between paired tumor samples. BPathways dysregulated between paired tumor samples in the GeneOntol-ogy Biological Process non-redundant database. C Pathways dysregulatedbetween paired tumor samples in the KEGG database. D Pathways dys-regulated between paired tumor samples in the Reactome database. EPathways analysis using single sample Gene Set Enrichment Analysis(ssGSEA) in the GeneOntology Biological Process, KEGG and Reactomedatabases. Table S7. Epigenetic dysregulation between paired tumorsamples. A Differentially methylated CpG between paired tumor samples.B Pathways dysregulated between paired tumor samples based on differ-entially expressed protein coding genes associated with differentiallymethylated CpG in the GeneOntology Biological Process non-redundant,KEGG and Reactome databases.
Additional file 2: Figure S1. Positron emission tomography (PET) scansof the two patients with biopsies performed on highest metabolite sites.Figure S2. Frequencies of BAP1 and NF2 variants in the fresh tumorsample used to generate the MPM_83 primary cell line. Figure S3.Cancer cell fraction in paired MPM samples. Figure S4. Pangenomiccopy number variation profile determined by DNAcopy. Figure S5.Pangenomic copy number variation profile determined by FACET. Figure
S6. Fusion transcripts identified by RNA-seq. Figure S7. Unsupervisedclustering of MPM tumor samples based on gene expression profiles. Fig-ure S8. Differentially expressed genes between paired tumor samples.Figure S9. Single sample Gene Set Enrichment Analysis (ssGSEA) forpathways related to cell adhesion and extracellular matrix. Figure S10.Epigenetic intra-tumor heterogeneity. Figure S11. Differential infiltrationof stromal and immune cell populations. Figure S12. Distribution of im-mune and stromal populations among paired tumor samples. FigureS13. Single sample Gene Set Enrichment Analysis (ssGSEA) for pathwaysrelated to immune cell infiltration. Figure S14. Immunohistochemicalstaining of tumor-infiltrating T and B cells in patients with paired tumorsamples switching from a cold to a hot immune profile.
AcknowledgementsNot applicable.
Authors’ contributionsCM, JZR, FLPB, MCJ, and DJ are responsible for the study concept anddesign. MCC, LG, CB, EP, AS, and FLPB provided patient materials. JBA andFM collected and organized clinical data. MCC, LG, CB, and FGS performed ahistologic analysis of tumor samples. SH and MCC performedimmunohistochemistry analysis. LQ, JdW, JBA, FM, and CM contributed tosample preparation and quality control. CM performed the acquisition ofdata. YB, LM, QB, SC, TZH, and EL developed the bioinformatics tools and thepipeline analysis. SC, TZH, CM, and DJ performed the analysis andinterpretation of data. CM, MCJ, and DJ were major contributors in writingthe manuscript. FLPB, JZR, and DJ are responsible for the study supervision.All authors read and approved the final manuscript.
FundingThis work was supported by Inserm, the Ligue Contre le Cancer (Ile deFrance committee and national program Cartes d’Identité des Tumeurs (CIT)),Hadassah France, the Chancellerie des Universités de Paris (Legs POIX) andCancéropôle Île-de-France (Emergence). JBA, FM, LQ and JdW weresupported by grants from Fondation pour la Recherche Médicale (FRM), fromthe Institut thématique multi-organismes (ITMO) Cancer (Plan Cancer 2014–2019), from Cancéropôle Île-de-France and from the Fondation ARC, respect-ively. JdW and FM were also supported by grant of the Société Française deChirurgie Thoracique et Cardio-Vasculaire (SFCTCV). The Inserm research unitis supported by the Labex OncoImmunology (investissement d’avenir), Coupd’Elan de la Fondation Bettencourt-Shueller, the SIRIC CARPEM, the Institutthématique multi-organismes (ITMO) Cancer (Plan Cancer 2014-2019) andCancéropôle Île-de-France.
Availability of data and materialsThe datasets supporting the conclusions of this article are included withinthe article (and its additional files). The NGS data (Targeted NGS, wholeexome sequencing, RNA-Seq) are available in the European Genome-phenome Archive (EGA) under the EGAS00001005328 study number, https://ega-archive.org/studies/EGAS00001005328 [23]. The methylome data areavailable in Gene Expression Omnibus (GEO) repository under the GSE175769series number, https://www.ncbi.nlm.nih.gov/geo/query/acc.cgi?acc=GSE175769 [38].
Declarations
Ethics approval and consent to participateThis study is a part of a research project approved by a Medical EthicsCommittee (CPP Ile-de-France II; ID-RCB: 2020-A01425-34). All patients gavetheir written informed consent for the use of their tumor specimen for re-search. The sampling procedures were approved by the French researchministry (CODECOH no. DC-2016-2771). The study methodologies were con-formed to the standards set by the Declaration of Helsinki.
Consent for publicationNot applicable.
Competing interestsThe authors declare that they have no competing interests.
Meiller et al. Genome Medicine (2021) 13:113 Page 14 of 16
Author details1Centre de Recherche des Cordeliers, Inserm UMRS-1138, SorbonneUniversité, Université de Paris, Functional Genomics of Solid Tumors, Paris,France. 2Present address: Service de Chirurgie Thoracique, Hôpital Calmette,CHRU de Lille, Lille, France. 3Present address: Service de Chirurgie Thoraciqueet Transplantation Pulmonaire, Hôpital Foch, Suresnes, France. 4UniversityParis-Est Créteil (UPEC), CEpiA (Clinical Epidemiology and Ageing), EA 7376-IMRB, UPEC, Créteil, France. 5GRC OncoThoParisEst, Service de Pneumologie,CHI Créteil, UPEC, Créteil, France. 6Programme Cartes d’Identité des Tumeurs(CIT), Ligue Nationale Contre Le Cancer, Paris, France. 7Present address: IGDRUMR 6290, CNRS, Université de Rennes 1, Rennes, France. 8AssistancePublique-Hôpitaux de Paris, Hôpital Européen Georges Pompidou, Paris,France. 9Service d’Anatomopathologie et Cytologie, Université de Paris,Hôpital Européen Georges Pompidou, Paris, France. 10Univ. Lille, CHU Lille,Service de Chirurgie Thoracique, Hôpital Calmette, Lille, France. 11Univ. Lille,CHU Lille, Institut de Pathologie, Lille, France. 12Univ. Lille, CNRS, Inserm, CHULille, Institut Pasteur de Lille, UMR9020 – UMR1277 - Canther – CancerHeterogeneity, Plasticity and Resistance to Therapies, Lille, France. 13CentreNational Référent MESOPATH, Centre Leon Berard, Lyon, France. 14Presentaddress: Département de Pathologie Cellulaire et Tissulaire, CHU d’Angers,Angers, France. 15Univ. Lille, CHU Lille, Service de Pneumologie etd’Oncologie Thoracique, unité INSERM 1189 OncoThAI, Lille, France. 16RéseauNational Expert pour le Mésothéliome Pleural Malin (NETMESO), Lille, France.17Service de Chirurgie Thoracique, Hôpital Européen Georges Pompidou,Paris, France.
Received: 9 November 2020 Accepted: 30 June 2021
References1. Zalcman G, Mazieres J, Margery J, Greillier L, Audigier-Valette C, Moro-Sibilot
D, et al. Bevacizumab for newly diagnosed pleural mesothelioma in theMesothelioma Avastin Cisplatin Pemetrexed Study (MAPS): a randomised,controlled, open-label, phase 3 trial. Lancet. 2016;387(10026):1405–14.https://doi.org/10.1016/S0140-6736(15)01238-6.
2. de Gooijer CJ, Borm FJ, Scherpereel A, Baas P. Immunotherapy in malignantpleural mesothelioma. Front Oncol. 2020;10:187. https://doi.org/10.3389/fonc.2020.00187.
3. Scherpereel A, Mazieres J, Greillier L, Lantuejoul S, Dô P, Bylicki O, et al.Nivolumab or nivolumab plus ipilimumab in patients with relapsedmalignant pleural mesothelioma (IFCT-1501 MAPS2): a multicentre, open-label, randomised, non-comparative, phase 2 trial. Lancet Oncol. 2019;20(2):239–53. https://doi.org/10.1016/S1470-2045(18)30765-4.
4. Baas P, Scherpereel A, Nowak AK, Fujimoto N, Peters S, Tsao AS, et al. First-line nivolumab plus ipilimumab in unresectable malignant pleuralmesothelioma (CheckMate 743): a multicentre, randomised, open-label,phase 3 trial. The Lancet. 2021;397(10272):375–86. https://doi.org/10.1016/S0140-6736(20)32714-8.
5. Oehl K, Vrugt B, Opitz I, Meerang M. Heterogeneity in malignant pleuralmesothelioma. Int J Mol Sci. 2018;19(6):1603. https://doi.org/10.3390/ijms19061603.
6. Husain AN, Colby TV, Ordóñez NG, Allen TC, Attanoos RL, Beasley MB, et al.Guidelines for Pathologic Diagnosis of Malignant Mesothelioma 2017Update of the Consensus Statement From the International MesotheliomaInterest Group. Arch Pathol Lab Med. 2018;142(1):89–108. https://doi.org/10.5858/arpa.2017-0124-RA.
7. Husain AN, Colby T, Ordonez N, Krausz T, Attanoos R, Beasley MB, et al.Guidelines for pathologic diagnosis of malignant mesothelioma: 2012update of the consensus statement from the International MesotheliomaInterest Group. Arch Pathol Lab Med. 2013;137(5):647–67. https://doi.org/10.5858/arpa.2012-0214-OA.
8. Bilecz A, Stockhammer P, Theegarten D, Kern I, Jakopovic M, Samarzija M,et al. Comparative analysis of prognostic histopathologic parameters insubtypes of epithelioid pleural mesothelioma. Histopathology. 2020;77(1):55–66. https://doi.org/10.1111/his.14105.
9. Galateau Salle F, Le Stang N, Tirode F, Courtiol P, Nicholson AG, Tsao M-S,et al. Comprehensive molecular and pathologic evaluation of transitionalmesothelioma assisted by deep learning approach: a multi-institutionalstudy of the international mesothelioma panel from the MESOPATHreference center. J Thorac Oncol. 2020;15(6):1037–53. https://doi.org/10.1016/j.jtho.2020.01.025.
10. Blum Y, Meiller C, Quetel L, Elarouci N, Ayadi M, Tashtanbaeva D, et al.Dissecting heterogeneity in malignant pleural mesothelioma through histo-molecular gradients for clinical applications. Nat Commun. 2019;10(1):1333.https://doi.org/10.1038/s41467-019-09307-6.
11. Bueno R, Stawiski EW, Goldstein LD, Durinck S, De Rienzo A, Modrusan Z,et al. Comprehensive genomic analysis of malignant pleural mesotheliomaidentifies recurrent mutations, gene fusions and splicing alterations. NatGenet. 2016;48(4):407–16. https://doi.org/10.1038/ng.3520.
12. de Reyniès A, Jaurand M-C, Renier A, Couchy G, Hysi I, Elarouci N, et al.Molecular classification of malignant pleural mesothelioma: identification ofa poor prognosis subgroup linked to the epithelial-to-mesenchymaltransition. Clin Cancer Res. 2014;20(5):1323–34. https://doi.org/10.1158/1078-0432.CCR-13-2429.
13. Hmeljak J, Sanchez-Vega F, Hoadley KA, Shih J, Stewart C, Heiman D, et al.Integrative molecular characterization of malignant peural mesothelioma.Cancer Discov. 2018;8(12):1548–65. https://doi.org/10.1158/2159-8290.CD-18-0804.
14. Alcala N, Mangiante L, Le-Stang N, Gustafson CE, Boyault S, Damiola F, et al.Redefining malignant pleural mesothelioma types as a continuum uncoversimmune-vascular interactions. EBioMedicine. 2019;48:191–202. https://doi.org/10.1016/j.ebiom.2019.09.003.
15. Comertpay S, Pastorino S, Tanji M, Mezzapelle R, Strianese O, Napolitano A,et al. Evaluation of clonal origin of malignant mesothelioma. J Transl Med.2014;12(1):301. https://doi.org/10.1186/s12967-014-0301-3.
16. Oey H, Daniels M, Relan V, Chee TM, Davidson MR, Yang IA, et al. Whole-genome sequencing of human malignant mesothelioma tumours and celllines. Carcinogenesis. 2019;40(6):724–34. https://doi.org/10.1093/carcin/bgz066.
17. Kiyotani K, Park J-H, Inoue H, Husain A, Olugbile S, Zewde M, et al.Integrated analysis of somatic mutations and immune microenvironment inmalignant pleural mesothelioma. Oncoimmunology. 2017;6(2):e1278330.https://doi.org/10.1080/2162402X.2016.1278330.
18. Chen R, Lee W-C, Fujimoto J, Li J, Hu X, Mehran R, et al. Evolution ofgenomic and T-cell repertoire heterogeneity of malignant pleuralmesothelioma under dasatinib treatment. Clin Cancer Res. 2020;26(20):5477–86. https://doi.org/10.1158/1078-0432.CCR-20-1767.
19. Minnema-Luiting J, Vroman H, Aerts J, Cornelissen R. Heterogeneity inimmune cell content in malignant pleural mesothelioma. Int J Mol Sci. 2018;19(4). https://doi.org/10.3390/ijms19041041.
20. Galateau-Sallé F, Gilg Soit Ilg A, Le Stang N, Brochard P, Pairon JC, Astoul P,et al. The French mesothelioma network from 1998 to 2013. Ann Pathol.2014;34(1):51–63. https://doi.org/10.1016/j.annpat.2014.01.009.
21. Nicholson AG, Sauter JL, Nowak AK, Kindler HL, Gill RR, Remy-Jardin M, et al.EURACAN/IASLC Proposals for updating the histologic classification ofpleural mesothelioma: towards a More multidisciplinary approach. J ThoracOncol. 2020;15(1):29–49. https://doi.org/10.1016/j.jtho.2019.08.2506.
22. Quetel L, Meiller C, Assié J-B, Blum Y, Imbeaud S, Montagne F, et al. Geneticalterations of malignant pleural mesothelioma: association to tumorheterogeneity and overall survival. Mol Oncol. 2020;14(6):1207–23. https://doi.org/10.1002/1878-0261.12651.
23. EGA study EGAS00001005328. https://ega-archive.org/studies/EGAS00001005328.
24. Haeussler M, Zweig AS, Tyner C, Speir ML, Rosenbloom KR, Raney BJ, et al.The UCSC Genome Browser database: 2019 update. Nucleic Acids Res. 2019;47(D1):D853–8. https://doi.org/10.1093/nar/gky1095.
25. Cibulskis K, Lawrence MS, Carter SL, Sivachenko A, Jaffe D, Sougnez C, et al.Sensitive detection of somatic point mutations in impure andheterogeneous cancer samples. Nat Biotechnol. 2013;31(3):213–9. https://doi.org/10.1038/nbt.2514.
26. Tarasov A, Vilella AJ, Cuppen E, Nijman IJ, Prins P. Sambamba: fastprocessing of NGS alignment formats. Bioinformatics. 2015;31(12):2032–4.https://doi.org/10.1093/bioinformatics/btv098.
27. Venkatraman ES, Olshen AB. A faster circular binary segmentation algorithmfor the analysis of array CGH data. Bioinformatics. 2007;23(6):657–63. https://doi.org/10.1093/bioinformatics/btl646.
28. Shen R, Seshan VE. FACETS: allele-specific copy number and clonalheterogeneity analysis tool for high-throughput DNA sequencing.Nucleic Acids Res. 2016;44(16):e131. https://doi.org/10.1093/nar/gkw520.
29. Sondka Z, Bamford S, Cole CG, Ward SA, Dunham I, Forbes SA. The COSMICCancer Gene Census: describing genetic dysfunction across all human
Meiller et al. Genome Medicine (2021) 13:113 Page 15 of 16

cancers. Nat Rev Cancer. 2018;18(11):696–705. https://doi.org/10.1038/s41568-018-0060-1.
30. Cosmic Cancer Gene Census. http://cancer.sanger.ac.uk/census. Accessed 24Jan 2020.
31. Shinde J, Bayard Q, Imbeaud S, Hirsch TZ, Liu F, Renault V, et al. Palimpsest:an R package for studying mutational and structural variant signaturesalong clonal evolution in cancer. Bioinformatics. 2018;34(19):3380–1. https://doi.org/10.1093/bioinformatics/bty388.
32. Letouzé E, Shinde J, Renault V, Couchy G, Blanc J-F, Tubacher E, et al.Mutational signatures reveal the dynamic interplay of risk factors andcellular processes during liver tumorigenesis. Nat Commun. 2017;8(1):1315.https://doi.org/10.1038/s41467-017-01358-x.
33. Kim D, Pertea G, Trapnell C, Pimentel H, Kelley R, Salzberg SL. TopHat2:accurate alignment of transcriptomes in the presence of insertions,deletions and gene fusions. Genome Biol. 2013;14(4):R36. https://doi.org/10.1186/gb-2013-14-4-r36.
34. Anders S, Pyl PT, Huber W. HTSeq--a Python framework to work with high-throughput sequencing data. Bioinformatics. 2015;31(2):166–9. https://doi.org/10.1093/bioinformatics/btu638.
35. Love MI, Huber W, Anders S. Moderated estimation of fold change anddispersion for RNA-seq data with DESeq2. Genome Biol. 2014;15(12):550.https://doi.org/10.1186/s13059-014-0550-8.
36. Sun L, Dong S, Ge Y, Fonseca JP, Robinson ZT, Mysore KS, et al. DiVenn: AnInteractive and Integrated Web-Based Visualization Tool for ComparingGene Lists. Front Genet. 2019;10:421. https://doi.org/10.3389/fgene.2019.00421.
37. Bayard Q, Meunier L, Peneau C, Renault V, Shinde J, Nault J-C, et al. CyclinA2/E1 activation defines a hepatocellular carcinoma subclass with arearrangement signature of replication stress. Nat Commun. 2018;9(1):5235.https://doi.org/10.1038/s41467-018-07552-9.
38. GEO series GSE175769. https://www.ncbi.nlm.nih.gov/geo/query/acc.cgi?acc=GSE175769.
39. Liao Y, Wang J, Jaehnig EJ, Shi Z, Zhang B. WebGestalt 2019: gene setanalysis toolkit with revamped UIs and APIs. Nucleic Acids Res. 2019;47(W1):W199–205. https://doi.org/10.1093/nar/gkz401.
40. Hänzelmann S, Castelo R, Guinney J. GSVA: gene set variation analysis formicroarray and RNA-seq data. BMC Bioinformatics. 2013;14(1):7. https://doi.org/10.1186/1471-2105-14-7.
41. Becht E, Giraldo NA, Lacroix L, Buttard B, Elarouci N, Petitprez F, et al.Estimating the population abundance of tissue-infiltrating immune andstromal cell populations using gene expression. Genome Biol. 2016;17(1):218. https://doi.org/10.1186/s13059-016-1070-5.
42. EGA study EGAS00001001563. https://ega-archive.org/studies/EGAS00001001563.
43. Broad Institute TCGA Genome Data Analysis Center. Analysis-readystandardized TCGA data from Broad GDAC Firehose stddata__2015_06_01run. 2015. https://doi.org/10.7908/C1251HBG.
44. Panou V, Røe OD. Inherited Genetic Mutations and Polymorphisms inMalignant Mesothelioma: A Comprehensive Review. IJMS. 2020;21(12):4327.https://doi.org/10.3390/ijms21124327.
45. Chen Y, Tseng S-H. Targeting tropomyosin-receptor kinase fused gene incancer. Anticancer Res. 2014;34(4):1595–600.
46. Birkbak NJ, McGranahan N. Cancer genome evolutionary trajectories inmetastasis. Cancer Cell. 2020;37(1):8–19. https://doi.org/10.1016/j.ccell.2019.12.004.
47. Amintas S, Bedel A, Moreau-Gaudry F, Boutin J, Buscail L, Merlio J-P, et al.Circulating tumor cell clusters: united we stand divided we fall. IJMS. 2020;21(7):2653. https://doi.org/10.3390/ijms21072653.
48. Hjerpe A, Ascoli V, Bedrossian CWM, Boon ME, Creaney J, Davidson B, et al.Guidelines for the cytopathologic diagnosis of epithelioid and mixed-typemalignant mesothelioma: a secondary publication. Cytopathology. 2015;26(3):142–56. https://doi.org/10.1111/cyt.12250.
49. Matsumoto S, Nabeshima K, Kamei T, Hiroshima K, Kawahara K, Hata S, et al.Morphology of 9p21 homozygous deletion-positive pleural mesotheliomacells analyzed using fluorescence in situ hybridization and virtualmicroscope system in effusion cytology: 9p21 Deletion-Positive MPM Cells.Cancer Cytopathol. 2013;121(8):415–22. https://doi.org/10.1002/cncy.21269.
50. Sato T, Sekido Y. NF2/Merlin inactivation and potential therapeutic targetsin mesothelioma. IJMS. 2018;19(4):988. https://doi.org/10.3390/ijms19040988.
51. McClatchey AI, Saotome I, Mercer K, Crowley D, Gusella JF, Bronson RT, et al.Mice heterozygous for a mutation at the Nf2 tumor suppressor locus
develop a range of highly metastatic tumors. Genes Dev. 1998;12(8):1121–33. https://doi.org/10.1101/gad.12.8.1121.
52. Jean D, Jaurand M-C. Mesotheliomas in Genetically Engineered MiceUnravel Mechanism of Mesothelial Carcinogenesis. IJMS. 2018;19(8):2191.https://doi.org/10.3390/ijms19082191.
53. Tranchant R, Quetel L, Tallet A, Meiller C, Renier A, de Koning L, et al. Co-occurring mutations of tumor suppressor genes, LATS2 and NF2, inmalignant pleural mesothelioma. Clin Cancer Res. 2017;23(12):3191–202.https://doi.org/10.1158/1078-0432.CCR-16-1971.
54. Dey A, Varelas X, Guan K-L. Targeting the Hippo pathway in cancer, fibrosis,wound healing and regenerative medicine. Nat Rev Drug Discov. 2020;19(7):480–94. https://doi.org/10.1038/s41573-020-0070-z.
55. Shigemitsu K, Sekido Y, Usami N, Mori S, Sato M, Horio Y, et al. Geneticalteration of the beta-catenin gene (CTNNB1) in human lung cancer andmalignant mesothelioma and identification of a new 3p21.3 homozygousdeletion. Oncogene. 2001;20(31):4249–57. https://doi.org/10.1038/sj.onc.1204557.
56. Martin-Orozco E, Sanchez-Fernandez A, Ortiz-Parra I, Ayala-San Nicolas M.WNT signaling in tumors: the way to evade drugs and immunity. FrontImmunol. 2019;10:2854. https://doi.org/10.3389/fimmu.2019.02854.
57. Blanquart C, Jaurand M-C, Jean D. The biology of malignant mesotheliomaand the relevance of preclinical models. Front Oncol. 2020;10:388. https://doi.org/10.3389/fonc.2020.00388.
58. Mansfield AS, Peikert T, Smadbeck JB, Udell JBM, Garcia-Rivera E, Elsbernd L,et al. Neoantigenic potential of complex chromosomal rearrangements inmesothelioma. J Thorac Oncol. 2019;14(2):276–87. https://doi.org/10.1016/j.jtho.2018.10.001.
59. Yoshikawa Y, Emi M, Hashimoto-Tamaoki T, Ohmuraya M, Sato A, TsujimuraT, et al. High-density array-CGH with targeted NGS unmask multiplenoncontiguous minute deletions on chromosome 3p21 in mesothelioma.Proc Natl Acad Sci USA. 2016;113(47):13432–7. https://doi.org/10.1073/pnas.1612074113.
60. Kane AB, Jean D, Knuutila S, Jaurand M-C. Malignant Mesothelioma:Mechanism of Carcinogenesis. In: Anttila S, Boffetta P, editors. OccupationalCancers [Internet]. Cham: Springer International Publishing; 2020. p. 343–62.[cited 2020 Feb 15]. Available from: http://link.springer.com/10.1007/978-3-030-30766-0_19.
61. Chirieac LR, Hung YP, Foo WC, Hofer MD, VanderLaan PA, Richards WG,et al. Diagnostic value of biopsy sampling in predicting histology in patientswith diffuse malignant pleural mesothelioma. Cancer. 2019;125(23):4164–71.https://doi.org/10.1002/cncr.32416.
62. Severson DT, De Rienzo A, Bueno R. Mesothelioma in the age of “Omics”:Before and after The Cancer Genome Atlas. J Thorac Cardiovasc Surg. 2020;160:1078–1083.e2.
63. Markopoulos C, Hyams DM, Gomez HL, Harries M, Nakamura S, Traina T,et al. Multigene assays in early breast cancer: Insights from recent phase 3studies. Eur J Surg Oncol. 2020;46(4):656–66. https://doi.org/10.1016/j.ejso.2019.10.019.
64. Bai R, Lv Z, Xu D, Cui J. Predictive biomarkers for cancer immunotherapywith immune checkpoint inhibitors. Biomark Res. 2020;8(1):34. https://doi.org/10.1186/s40364-020-00209-0.
Publisher’s NoteSpringer Nature remains neutral with regard to jurisdictional claims inpublished maps and institutional affiliations.
Meiller et al. Genome Medicine (2021) 13:113 Page 16 of 16