Multi-Physics Comparison of Surface-Mounted and Interior ...
20
Citation: Du, G.; Li, N.; Zhou, Q.; Gao, W.; Wang, L.; Pu, T. Multi-Physics Comparison of Surface-Mounted and Interior Permanent Magnet Synchronous Motor for High-Speed Applications. Machines 2022, 10, 700. https:// doi.org/10.3390/machines10080700 Academic Editors: Yawei Wang and Tianjie Zou Received: 23 July 2022 Accepted: 16 August 2022 Published: 17 August 2022 Publisher’s Note: MDPI stays neutral with regard to jurisdictional claims in published maps and institutional affil- iations. Copyright: © 2022 by the authors. Licensee MDPI, Basel, Switzerland. This article is an open access article distributed under the terms and conditions of the Creative Commons Attribution (CC BY) license (https:// creativecommons.org/licenses/by/ 4.0/). machines Article Multi-Physics Comparison of Surface-Mounted and Interior Permanent Magnet Synchronous Motor for High-Speed Applications Guanghui Du, Niumei Li, Qixun Zhou *, Wentao Gao, Lu Wang and Tao Pu School of Electrical and Control Engineering, Xi’an University of Science and Technology, Xi’an 710054, China * Correspondence: [email protected] Abstract: For high-speed permanent magnet machines (HSPMMs), two different rotor structures are widely used: surface-mounted permanent magnet (SPM) and interior permanent magnet (IPM). The two different rotor structures have a large impact on the comprehensive performance in mul- tiple physical fields of HSPMMs, including mechanical stress, electromagnetic characteristics, and temperature distribution. However, the multi-physics comparison of two different rotor structures is rare in the existing literature, which makes it difficult for designers to choose a suitable rotor structure. Therefore, in this paper, the comprehensive performance of multi-physics for SPM and IPM is comprehensively compared and analyzed. Firstly, the SPM and IPM were designed under 60 kW and 30,000 rpm with the condition of the same stator structure, winding type and volume. Secondly, to ensure that the two rotor structures meet the stress-field constraints, a finite element model (FEM) was built in Ansys Workbench. The influence of different parameters on the rotor stress was analyzed. Following this, the electromagnetic characteristics and temperature distributions of the two motors were compared and analyzed comprehensively through the FEM. Finally, a prototype of an SPM rotor structure is selected and manufactured. The validity of the multi-physics analysis and design was verified through experimental measurements. The above analysis will provide a reference when a designer chooses a rotor structure for an HSPMM. Keywords: high-speed permanent magnet machine; surface-mounted permanent magnet; interior permanent magnet; multi-physics comparison 1. Introduction In recent years, with the rapid development of high-frequency drive power and high- performance PM materials, high-speed permanent magnet machines (HSPMMs) have been widely studied [1,2]. Because of the demand for higher power density and efficiency, HSPMMs are becoming increasingly popular in various fields, such as distributed power generation systems, flywheel energy storage and compressors [3]. HSPMMs have two different rotor structures: a surface-mounted permanent magnet (SPM) and an interior permanent magnet (IPM) [4–6]. The PM materials have high compressive strength and low tensile strength. The PM of an SPM motor needs to set a high-strength protective sleeve outside the PM [7]. The PM of an IPM motor is embedded in the rotor core, so the structure is more complicated than the SPM. At high speed, the centrifugal force is mainly concentrated on the magnetic bridge, which easily causes damage to the magnetic bridge. This structure has a conflict between rotor flux leakage and rotor safety [8]. Both SPM and IPM motors have their own advantages and disadvantages, but the multi-physics comparison of two different rotor structures, which will be the focus of this paper, is not yet clear. In the existing literature, there are many papers that compare and analyze the per- formance of a certain rotor structure, but only a few studies focus on comparing the comprehensive performance of two rotor structures. For the SPM rotor structure, the tangential stress of the PM can be effectively reduced with the tangential segmentation Machines 2022, 10, 700. https://doi.org/10.3390/machines10080700 https://www.mdpi.com/journal/machines
-
Upload
khangminh22 -
Category
Documents
-
view
0 -
download
0
Transcript of Multi-Physics Comparison of Surface-Mounted and Interior ...

Citation: Du, G.; Li, N.; Zhou, Q.;
Gao, W.; Wang, L.; Pu, T.
Multi-Physics Comparison of
Surface-Mounted and Interior
Permanent Magnet Synchronous
Motor for High-Speed Applications.
Machines 2022, 10, 700. https://
doi.org/10.3390/machines10080700
Academic Editors: Yawei Wang
and Tianjie Zou
Received: 23 July 2022
Accepted: 16 August 2022
Published: 17 August 2022
Publisher’s Note: MDPI stays neutral
with regard to jurisdictional claims in
published maps and institutional affil-
iations.
Copyright: © 2022 by the authors.
Licensee MDPI, Basel, Switzerland.
This article is an open access article
distributed under the terms and
conditions of the Creative Commons
Attribution (CC BY) license (https://
creativecommons.org/licenses/by/
4.0/).
machines
Article
Multi-Physics Comparison of Surface-Mountedand Interior Permanent Magnet Synchronous Motor forHigh-Speed ApplicationsGuanghui Du, Niumei Li, Qixun Zhou *, Wentao Gao, Lu Wang and Tao Pu
School of Electrical and Control Engineering, Xi’an University of Science and Technology, Xi’an 710054, China* Correspondence: [email protected]
Abstract: For high-speed permanent magnet machines (HSPMMs), two different rotor structuresare widely used: surface-mounted permanent magnet (SPM) and interior permanent magnet (IPM).The two different rotor structures have a large impact on the comprehensive performance in mul-tiple physical fields of HSPMMs, including mechanical stress, electromagnetic characteristics, andtemperature distribution. However, the multi-physics comparison of two different rotor structuresis rare in the existing literature, which makes it difficult for designers to choose a suitable rotorstructure. Therefore, in this paper, the comprehensive performance of multi-physics for SPM andIPM is comprehensively compared and analyzed. Firstly, the SPM and IPM were designed under60 kW and 30,000 rpm with the condition of the same stator structure, winding type and volume.Secondly, to ensure that the two rotor structures meet the stress-field constraints, a finite elementmodel (FEM) was built in Ansys Workbench. The influence of different parameters on the rotor stresswas analyzed. Following this, the electromagnetic characteristics and temperature distributions ofthe two motors were compared and analyzed comprehensively through the FEM. Finally, a prototypeof an SPM rotor structure is selected and manufactured. The validity of the multi-physics analysisand design was verified through experimental measurements. The above analysis will provide areference when a designer chooses a rotor structure for an HSPMM.
Keywords: high-speed permanent magnet machine; surface-mounted permanent magnet; interiorpermanent magnet; multi-physics comparison
1. Introduction
In recent years, with the rapid development of high-frequency drive power and high-performance PM materials, high-speed permanent magnet machines (HSPMMs) havebeen widely studied [1,2]. Because of the demand for higher power density and efficiency,HSPMMs are becoming increasingly popular in various fields, such as distributed powergeneration systems, flywheel energy storage and compressors [3]. HSPMMs have twodifferent rotor structures: a surface-mounted permanent magnet (SPM) and an interiorpermanent magnet (IPM) [4–6]. The PM materials have high compressive strength andlow tensile strength. The PM of an SPM motor needs to set a high-strength protectivesleeve outside the PM [7]. The PM of an IPM motor is embedded in the rotor core, so thestructure is more complicated than the SPM. At high speed, the centrifugal force is mainlyconcentrated on the magnetic bridge, which easily causes damage to the magnetic bridge.This structure has a conflict between rotor flux leakage and rotor safety [8]. Both SPM andIPM motors have their own advantages and disadvantages, but the multi-physics comparisonof two different rotor structures, which will be the focus of this paper, is not yet clear.
In the existing literature, there are many papers that compare and analyze the per-formance of a certain rotor structure, but only a few studies focus on comparing thecomprehensive performance of two rotor structures. For the SPM rotor structure, thetangential stress of the PM can be effectively reduced with the tangential segmentation
Machines 2022, 10, 700. https://doi.org/10.3390/machines10080700 https://www.mdpi.com/journal/machines

Machines 2022, 10, 700 2 of 20
of the PM. For applications requiring high power density, alloy protective sleeves cannotmeet the constraints of multi-physics due to large eddy-current losses [9,10]. The electricalconductivity of the sleeve has a great influence on the eddy-current distribution in the rotorof the HSPMM [11]. The greater the thickness of the sleeve, the smaller the equivalent stressof the sleeve will be. However, this also increases the difficulty of heat dissipation due tothe poor heat dissipation capability of the sleeve [12]. In the case of the outer diameterof the rotor being the same, the thickness of the carbon-fiber sleeve can be smaller thanthat of the alloy sleeve. Under the condition of the same power density, the PM usage ofthe ring PM motor is less than that of the cylinder PM motor [13]. The electromagneticcharacteristics of the two different IPM rotor structures are mainly compared, includingdouble-layer PM rotor structures and single-layer PM rotor structures. The electromagneticperformance of the double-layer PM rotor structures is better compared to the single-layer PM [14]. Three kinds of different IPM rotor structures are compared, including thesingle-V shape, double-V shape and delta shape. Through analysis, it is concluded that theoverall performance of the single-V type is the best [15]. For an 8-kW, 40,000-rpm HSPMM,the loss distribution of a new type of IPM and SPM rotor structure is compared, in termsof motor efficiency, stator copper loss and rotor iron loss [16]. For a 140-kW, 24,000-rpmHSPMM, spoke-type IPM and SPM rotor structures are designed, and the mechanical,electromagnetic and thermal performances are compared [17]. For an 11-kW, 8200-rpmmotor, the loss characteristics and temperature distributions of SPM and tangential IPMare compared. The comparative analysis shows that the total loss of the IPM rotor structureis higher than that of the SPM, but the performance of the IPM rotor structure is better thanthat of the SPM [18]. From the above literature analysis, it can be seen that both SPM rotorstructures and IPM rotor structures have been studied. The PM of an SPM motor needsto be set with a high-strength protective sleeve, which will lead to poor heat dissipation.The IPM rotor structure not only avoids the poor thermal conductivity of the sleeve, butalso has good heat dissipation performance in the rotor core. However, the rotor stressconstraints of the IPM rotor structure are difficult to satisfy. Therefore, both SPM andIPM rotor structures have different advantages and disadvantages in multiple physicalfields, including rotor stress, electromagnetic fields, and temperature fields. However, thecomparison of the two rotor structures in the existing literature is only based on a singlephysical field, and it would be difficult for the designer to fully judge which rotor structureis more suitable. Therefore, the SPM and IPM rotor structures are compared and analyzedbased on multiple physical fields.
In this paper, the comprehensive performances of two rotor structures are discussedand comparatively investigated in multiple physical fields, including rotor stress, elec-tromagnetic characteristics, losses and temperature distribution. In Section 2, the SPMmotor with a carbon-fiber protective sleeve and the IPM motor with a radial structure areselected. The initial electromagnetic design schemes for two different rotor structures arepresented. In Section 3, the 2D-FEM is established in Ansys Workbench. Stress analysis ofthe two different rotor structures is carried out. In Section 4, the 2D-FEM is established inAnsys Maxwell. The electromagnetic performances of the two motors are calculated andcompared—for example, their magnetic flux density, electromotive motor force and loss.In Section 5, the 2D-FEM is established in Motor-CAD. The cooling system is designed.The temperature distributions of the two rotor structures are compared. In Section 6, aprototype is manufactured based on the SPM rotor structure, then the electromagneticcharacteristics, thermal distribution and operating conditions are experimentally mea-sured. The validity of the multi-physics analysis and design is verified. In Section 7,the comprehensive performances of multiple physical fields of the two rotor structuresare regularly summarized, and three conclusions are drawn, including mechanical stress,electromagnetic characteristics and temperature characteristics. In the future, the results ofmulti-physics comparisons have a certain reference value for selecting between the tworotor structures when designing an HSPMM.

Machines 2022, 10, 700 3 of 20
2. Motor Structure and Parameters
In this paper, two different motor structures are designed for a 60-kW, 30,000-rpmHSPMM. As shown in Figure 1, a 24-slot and 4-pole HSPMM was designed. N38UH PMmaterial was selected because of its high remanence and relatively larger coercive force.The main parameters of two motors are listed in Table 1. The key parameter sizes remainedthe same when designing the two motors.
Machines 2022, 10, x FOR PEER REVIEW 3 of 21
electromagnetic characteristics and temperature characteristics. In the future, the results
of multi‐physics comparisons have a certain reference value for selecting between the two
rotor structures when designing an HSPMM.
2. Motor Structure and Parameters
In this paper, two different motor structures are designed for a 60‐kW, 30,000‐rpm
HSPMM. As shown in Figure 1, a 24‐slot and 4‐pole HSPMM was designed. N38UH PM
material was selected because of its high remanence and relatively larger coercive force.
The main parameters of two motors are listed in Table 1. The key parameter sizes re‐
mained the same when designing the two motors.
The models of the SPM motor are shown in Figure 1a,b. The structure of the SPM
motor is simple, since the PM is attached to the surface of the rotor core. However, the
tensile strength of PM is low. It is necessary to set a carbon‐fiber protective sleeve on the
external surface of PM to protect the PM.
The models of the IPM motor are shown in Figure 1c,d. The PM of the IPM motor is
embedded in the rotor core, so the structure is more complicated than the SPM motor.
However, the IPM rotor structure saves a protective sleeve, and the heat dissipation per‐
formance is better than that of the SPM.
Sleeve
PM
Shaft
Rotor core
(a) (b)
Stator core
Winding
PM
Shaft
Rotor core
PM
Rotor core
Shaft
(c) (d)
Figure 1. Two different model of the motor: (a) Model of SPM motor; (b) Rotor structure of SPM
motor; (c) Model of IPM motor; (d) Rotor structure of IPM motor.
Figure 1. Two different model of the motor: (a) Model of SPM motor; (b) Rotor structure of SPMmotor; (c) Model of IPM motor; (d) Rotor structure of IPM motor.
Table 1. The main parameters of 60-kW HSPMM.
Parameters Values
Rated power (kW) 60
Rated speed (rpm) 30,000
Rated voltage (V) 380 (RMS)
Stator slot numberPole number
244
Stator inner diameter (mm)Axial length (mm)
90110
Rotor outer diameter (mm) 86
Permanent magnet thickness (mm) 7
Air-gap length (mm) 2
PM material N38UH

Machines 2022, 10, 700 4 of 20
The models of the SPM motor are shown in Figure 1a,b. The structure of the SPMmotor is simple, since the PM is attached to the surface of the rotor core. However, thetensile strength of PM is low. It is necessary to set a carbon-fiber protective sleeve on theexternal surface of PM to protect the PM.
The models of the IPM motor are shown in Figure 1c,d. The PM of the IPM motoris embedded in the rotor core, so the structure is more complicated than the SPM motor.However, the IPM rotor structure saves a protective sleeve, and the heat dissipationperformance is better than that of the SPM.
Multi-physics constraints, such as rotor stress, electromagnetic characteristics andtemperature distribution, should be satisfied during the design of the HSPMM. In thismotor design process, the main physics field constraints considered are as follows:
1. Stress-field constraints: The maximum yield strength of PM is 75 MPa. The sleevestrength yield limit is 1960 MPa. The yield strength of the rotor core is 480 MPa.
2. Electromagnetic field constraints: The output power in the rated load is ≥60 kW.In the design, a commercial frequency converter is used, which can output a peakvoltage of 600 V. Considering the voltage margin of the converter, the amplitude ofthe back-EMF under no load is limited between 500 V and 540 V. The amplitude ofair-gap magnetic flux density is between 0.4 T and 0.6 T. The thermal load is requiredto be < 200 A2/mm3.
3. Thermal field constraints: The limited working temperature of PM materials is 150 ◦C. Themaximum temperature of the rotor is 150 ◦C. The maximum winding temperature is 130 ◦C.
3. Rotor Stress Analysis
In the design process of an HSPMM, a reasonable rotor stress analysis is a necessaryprerequisite to guarantee its safety and reliability. In this Section, in order to comparativelyanalyze the stress field of the two kinds of rotor structures, 2D-FEM is established. Accordingto symmetry, a 1/4 cross-sectional model of the HSPMM is used in Ansys Workbench.
Based on the material properties presented in Table 2, the stress distribution character-istics of rotors with different rotor structures are calculated [19,20]. In the stress simulation,the simulated operating states of the motors with two rotor structures are that the motorsrun at high speed and the rotors are in a high-temperature thermal environment. That is, themotor speed is 30,000 rpm and the temperature rise of each part of the rotor is 100 ◦C. For theSPM motor, the maximum tangential stress of PM, the maximum equivalent stress of sleeveand the total deformation of sleeve and PM are simulated, respectively. For the IPM motor,the maximum equivalent stress and total deformation of the rotor are calculated.
Table 2. Rotor material properties.
Material Properties Rotor Core PMCarbon Fiber
Tangential Radial
Density (kg/m3) 7850 7400 1800Elastic modulus (GPa) 200 160 125 8.8
Poisson’s ratio 0.3 0.24 0.28 0.015CTE 1 (10−6/K) 11 8 −0.38 28
Yield strength (MPa) 480 75 1960 −1001: CTE is short for coefficient of thermal expansion.
3.1. Stress Analysis of SPM Rotor
NdFeB PM materials have high compressive strength and low tensile strength. There-fore, it is necessary to set a protective sleeve outside the PM, and use an interference fitto impose compressive stress on the PM. Too thick a sleeve can result in a large effectiveair-gap length (including air gap length and sleeve thickness). The electromagnetic per-formance of the motor is affected. If the sleeve is too thin, the sleeve may loosen anddeform. Too much interference fit can make installation difficult and even damage thecontact surfaces. Too little interference fit may loosen the sleeve. Therefore, a reasonable

Machines 2022, 10, 700 5 of 20
selection of sleeve thickness and interference fit is important for HSPMMs with SPM rotorstructures. The SPM motor stress analysis is simulated by building 2D-FEM. The carbonfiber sleeve is mounted on the PM outer surface by interference fit
Keeping the same interference fit, the influence of sleeve thicknesses on the stress ofsleeve and PM is shown in Figure 2a. It can be seen that the PM stress decreases with theincrease in the sleeve thickness. The equivalent stress of the sleeve also decreases graduallyas the sleeve thickness increases, but when the sleeve thickness is more than 5 mm, thedecreasing trend of sleeve stress becomes slow. This means that the continuous increasein the sleeve thickness does not significantly reduce the sleeve stress. Combined with theabove analysis, the sleeve thickness selected is 5 mm.
Machines 2022, 10, x FOR PEER REVIEW 5 of 21
CTE 1 (10−6/K) 11 8 −0.38 28
Yield strength (MPa) 480 75 1960 −100 1: CTE is short for coefficient of thermal expansion.
3.1. Stress Analysis of SPM Rotor
NdFeB PM materials have high compressive strength and low tensile strength. There‐
fore, it is necessary to set a protective sleeve outside the PM, and use an interference fit to
impose compressive stress on the PM. Too thick a sleeve can result in a large effective air‐
gap length (including air gap length and sleeve thickness). The electromagnetic perfor‐
mance of the motor is affected. If the sleeve is too thin, the sleeve may loosen and deform.
Too much interference fit can make installation difficult and even damage the contact sur‐
faces. Too little interference fit may loosen the sleeve. Therefore, a reasonable selection of
sleeve thickness and interference fit is important for HSPMMs with SPM rotor structures.
The SPM motor stress analysis is simulated by building 2D‐FEM. The carbon fiber sleeve
is mounted on the PM outer surface by interference fit
Keeping the same interference fit, the influence of sleeve thicknesses on the stress of
sleeve and PM is shown in Figure 2a. It can be seen that the PM stress decreases with the
increase in the sleeve thickness. The equivalent stress of the sleeve also decreases gradu‐
ally as the sleeve thickness increases, but when the sleeve thickness is more than 5 mm,
the decreasing trend of sleeve stress becomes slow. This means that the continuous in‐
crease in the sleeve thickness does not significantly reduce the sleeve stress. Combined
with the above analysis, the sleeve thickness selected is 5 mm.
Keeping the sleeve thickness constant, the influence of interference fit on the sleeve
and PM stress is shown in Figure 2b. As the interference fit increases, the stress of the
sleeve increases, but the stress of the PM decreases. When the interference fit is 0.2 mm,
the sleeve stress is 770 MPa and PM stress is −30 MPa. The maximum tangential stress of
the PM is negative, which means that it is subjected to compressive stress. The interference
fit is selected as 0.15 mm within the stress‐field constraint.
(a) (b)
Figure 2. The influence of different factors on sleeve and PM stress: (a) Sleeve thickness; (b) Inter‐
ference fit.
The effects of sleeve thickness and interference fit on sleeve stress and PM stress are
shown in Figure 3. It can be seen from Figure 3a that the equivalent stress of the sleeve
decreases as the sleeve thickness increases and the interference fit decreases. The variation
in sleeve stress with interference fit is severe, which means that the effect of interference
fit on sleeve stress is more obvious compared to the sleeve thickness. The sleeve thickness
has little effect on the sleeve stress by comparison. The influences of sleeve thickness and
interference fit on the PM stress are shown in Figure 3b. The sleeve thickness and the
interference fit both have a great influence on the tangential stress of the PM.
Figure 2. The influence of different factors on sleeve and PM stress: (a) Sleeve thickness; (b) Interference fit.
Keeping the sleeve thickness constant, the influence of interference fit on the sleeveand PM stress is shown in Figure 2b. As the interference fit increases, the stress of the sleeveincreases, but the stress of the PM decreases. When the interference fit is 0.2 mm, the sleevestress is 770 MPa and PM stress is −30 MPa. The maximum tangential stress of the PMis negative, which means that it is subjected to compressive stress. The interference fit isselected as 0.15 mm within the stress-field constraint.
The effects of sleeve thickness and interference fit on sleeve stress and PM stress areshown in Figure 3. It can be seen from Figure 3a that the equivalent stress of the sleevedecreases as the sleeve thickness increases and the interference fit decreases. The variationin sleeve stress with interference fit is severe, which means that the effect of interference fiton sleeve stress is more obvious compared to the sleeve thickness. The sleeve thicknesshas little effect on the sleeve stress by comparison. The influences of sleeve thickness andinterference fit on the PM stress are shown in Figure 3b. The sleeve thickness and theinterference fit both have a great influence on the tangential stress of the PM.
Combining the results in Figures 2 and 3, the sleeve thickness and interference fit areselected to be 5 mm and 0.15 mm, respectively. The stress simulation results are shownin Figure 4. The maximum tangential stress of PM is −13 MPa. The equivalent stress ofthe sleeve is 596 MPa. The deformations of the sleeve and PM are 0.17 mm and 0.03 mm,respectively. It is clear that the stresses of the sleeve and the PM both satisfy the stress-fieldconstraints with a large margin.
3.2. Stress Analysis of IPM Rotor
In this section, the conventional radial IPM structure is introduced, as shown inFigure 5. The distance between the PM slot and the rotor outer diameter is called magneticbridge thickness, and the distance between each pole of the PM slot is called the ribthickness (the rib in this figure represents half of the actual distance). The centrifugalforce at high speed is mainly concentrated on the magnetic bridge, which easily causesbridge damage. From the perspective of stress, the bridge is the weakest part in terms ofmechanical strength. The bridge thickness should be larger to reduce stress. However, from

Machines 2022, 10, 700 6 of 20
the perspective of electromagnetic design, the size of the magnetic bridge should be assmall as possible to realize magnetic saturation. Therefore, it is very important to study theinfluence of the magnetic bridge thickness.
Machines 2022, 10, x FOR PEER REVIEW 6 of 21
(a) (b)
Figure 3. The influence of sleeve thickness and interference fit on sleeve stress and PM stress: (a)
Equivalent stress of sleeve; (b) Tangential stress of PM.
Combining the results in Figures 2 and 3, the sleeve thickness and interference fit are
selected to be 5 mm and 0.15 mm, respectively. The stress simulation results are shown in
Figure 4. The maximum tangential stress of PM is −13 MPa. The equivalent stress of the
sleeve is 596 MPa. The deformations of the sleeve and PM are 0.17 mm and 0.03 mm,
respectively. It is clear that the stresses of the sleeve and the PM both satisfy the stress‐
field constraints with a large margin.
596
582
569
555
542
523
515
501
483
474
Stress(MPa)
-13.097
-15.347
-18.596
-21.346
-24.096
-26.345
-29.535
-32.844
-35.094
-37.844
Stress(MPa)
(a) (b)
Deformation(mm)
0.17146
0.17086
0.16926
0.16815
0.16705
0.16594
0.16434
0.16378
0.16263
0.16152
Deformation(mm)
0.02675
0.02631
0.02587
0.02543
0.02493
0.02454
0.02410
0.02366
0.02921
0.02278
(c) (d)
Figure 4. Simulation results: (a) Equivalent stress of sleeve; (b) Tangential stress of PM; (c) Defor‐
mation of sleeve; (d) Deformation of PM.
Figure 3. The influence of sleeve thickness and interference fit on sleeve stress and PM stress:(a) Equivalent stress of sleeve; (b) Tangential stress of PM.
Machines 2022, 10, x FOR PEER REVIEW 6 of 21
(a) (b)
Figure 3. The influence of sleeve thickness and interference fit on sleeve stress and PM stress: (a)
Equivalent stress of sleeve; (b) Tangential stress of PM.
Combining the results in Figures 2 and 3, the sleeve thickness and interference fit are
selected to be 5 mm and 0.15 mm, respectively. The stress simulation results are shown in
Figure 4. The maximum tangential stress of PM is −13 MPa. The equivalent stress of the
sleeve is 596 MPa. The deformations of the sleeve and PM are 0.17 mm and 0.03 mm,
respectively. It is clear that the stresses of the sleeve and the PM both satisfy the stress‐
field constraints with a large margin.
596
582
569
555
542
523
515
501
483
474
Stress(MPa)
-13.097
-15.347
-18.596
-21.346
-24.096
-26.345
-29.535
-32.844
-35.094
-37.844
Stress(MPa)
(a) (b)
Deformation(mm)
0.17146
0.17086
0.16926
0.16815
0.16705
0.16594
0.16434
0.16378
0.16263
0.16152
Deformation(mm)
0.02675
0.02631
0.02587
0.02543
0.02493
0.02454
0.02410
0.02366
0.02921
0.02278
(c) (d)
Figure 4. Simulation results: (a) Equivalent stress of sleeve; (b) Tangential stress of PM; (c) Defor‐
mation of sleeve; (d) Deformation of PM. Figure 4. Simulation results: (a) Equivalent stress of sleeve; (b) Tangential stress of PM; (c) Deforma-tion of sleeve; (d) Deformation of PM.
The 2D-FEM is built to simulate the mechanical stress, because the PM is undercompressive stress in this structure. In addition, the PM can withstand the compressivestress of 800 MPa, and has a large margin. Therefore, the stress distribution and totaldeformation of the rotor are mainly analyzed in this section. In the stress analysis of theIPM motor model, the contact surface between the outer surface of the PM and the rotor

Machines 2022, 10, 700 7 of 20
core is set to be in bounding contact, and the rest of the contact surfaces are in frictionalcontact. The results are shown in Figure 6.
It can be seen that with the gradual increase in bridge thickness, the maximumequivalent stress of the rotor decreases significantly. When the bridge thickness increasesfrom 1 mm to 2 mm, the rotor stress decreases from 3961 MPa to 2385 MPa, reduced by39.8%. However, when the bridge thickness increases from 2.5 mm to 3.5 mm, the rotorstress decreases from 1904 MPa to 1690 MPa, reduced by 11.2%. The total deformation alsodecreases from 0.104 mm to 0.084 mm, reduced by 19.2%. As the thickness of the magneticbridge increases, the decreasing trend of rotor stress and deformation becomes slow.
Figure 7 shows the effect of bridge thickness and rib thickness on rotor stress and totaldeformation. It can be seen that the bridge thickness has a great influence on the rotorstress and deformation. As the bridge thickness increases, the rotor stress and deformationdecrease sharply. However, the rotor stress and deformation are mildly affected by therib thickness. With the increase of the thickness of magnetic rib, the rotor stress anddeformation reduce slightly.
In this section, the effect of the bridge thickness on the rotor electromagnetic perfor-mance is analyzed. In Figure 8, the no-load leakage flux factor is illustrated when the bridgethicknesses are changed. It can be seen that the bridge thickness increases from 1 mm to3.5 mm, the no-load leakage flux factor increases from 1.12 to 1.56, an increase of 39.3%.With the increase in bridge thickness, the no-load flux leakage factor increases gradually,which affects the electromagnetic performance of the motor. A large no-load flux leakagefactor also means that the flux leakage of the motor is large while the main flux is small.
Machines 2022, 10, x FOR PEER REVIEW 7 of 21
3.2. Stress Analysis of IPM Rotor
In this section, the conventional radial IPM structure is introduced, as shown in Fig‐
ure 5. The distance between the PM slot and the rotor outer diameter is called magnetic
bridge thickness, and the distance between each pole of the PM slot is called the rib thick‐
ness (the rib in this figure represents half of the actual distance). The centrifugal force at
high speed is mainly concentrated on the magnetic bridge, which easily causes bridge
damage. From the perspective of stress, the bridge is the weakest part in terms of mechan‐
ical strength. The bridge thickness should be larger to reduce stress. However, from the
perspective of electromagnetic design, the size of the magnetic bridge should be as small
as possible to realize magnetic saturation. Therefore, it is very important to study the in‐
fluence of the magnetic bridge thickness.
PM
Bridge
Rib
Figure 5. The structure of a conventional IPM rotor.
The 2D‐FEM is built to simulate the mechanical stress, because the PM is under com‐
pressive stress in this structure. In addition, the PM can withstand the compressive stress
of 800 MPa, and has a large margin. Therefore, the stress distribution and total defor‐
mation of the rotor are mainly analyzed in this section. In the stress analysis of the IPM
motor model, the contact surface between the outer surface of the PM and the rotor core
is set to be in bounding contact, and the rest of the contact surfaces are in frictional contact.
The results are shown in Figure 6.
It can be seen that with the gradual increase in bridge thickness, the maximum equiv‐
alent stress of the rotor decreases significantly. When the bridge thickness increases from
1 mm to 2 mm, the rotor stress decreases from 3961 MPa to 2385 MPa, reduced by 39.8%.
However, when the bridge thickness increases from 2.5 mm to 3.5 mm, the rotor stress
decreases from 1904 MPa to 1690 MPa, reduced by 11.2%. The total deformation also de‐
creases from 0.104 mm to 0.084 mm, reduced by 19.2%. As the thickness of the magnetic
bridge increases, the decreasing trend of rotor stress and deformation becomes slow.
Figure 5. The structure of a conventional IPM rotor.
Machines 2022, 10, x FOR PEER REVIEW 8 of 21
(a) (b)
Figure 6. The influence of bridge thickness on rotor stress and total deformation: (a) Maximum
equivalent stress of rotor; (b) Total deformation.
Figure 7 shows the effect of bridge thickness and rib thickness on rotor stress and
total deformation. It can be seen that the bridge thickness has a great influence on the rotor
stress and deformation. As the bridge thickness increases, the rotor stress and deformation
decrease sharply. However, the rotor stress and deformation are mildly affected by the
rib thickness. With the increase of the thickness of magnetic rib, the rotor stress and de‐
formation reduce slightly.
(a) (b)
Figure 7. The influence of bridge thickness and rib thickness on rotor stress and total deformation:
(a) Maximum equivalent stress of rotor; (b) Total deformation.
In this section, the effect of the bridge thickness on the rotor electromagnetic perfor‐
mance is analyzed. In Figure 8, the no‐load leakage flux factor is illustrated when the
bridge thicknesses are changed. It can be seen that the bridge thickness increases from 1
mm to 3.5 mm, the no‐load leakage flux factor increases from 1.12 to 1.56, an increase of
39.3%. With the increase in bridge thickness, the no‐load flux leakage factor increases
gradually, which affects the electromagnetic performance of the motor. A large no‐load
flux leakage factor also means that the flux leakage of the motor is large while the main
flux is small.
Figure 6. The influence of bridge thickness on rotor stress and total deformation: (a) Maximumequivalent stress of rotor; (b) Total deformation.

Machines 2022, 10, 700 8 of 20
Machines 2022, 10, x FOR PEER REVIEW 8 of 21
(a) (b)
Figure 6. The influence of bridge thickness on rotor stress and total deformation: (a) Maximum
equivalent stress of rotor; (b) Total deformation.
Figure 7 shows the effect of bridge thickness and rib thickness on rotor stress and
total deformation. It can be seen that the bridge thickness has a great influence on the rotor
stress and deformation. As the bridge thickness increases, the rotor stress and deformation
decrease sharply. However, the rotor stress and deformation are mildly affected by the
rib thickness. With the increase of the thickness of magnetic rib, the rotor stress and de‐
formation reduce slightly.
(a) (b)
Figure 7. The influence of bridge thickness and rib thickness on rotor stress and total deformation:
(a) Maximum equivalent stress of rotor; (b) Total deformation.
In this section, the effect of the bridge thickness on the rotor electromagnetic perfor‐
mance is analyzed. In Figure 8, the no‐load leakage flux factor is illustrated when the
bridge thicknesses are changed. It can be seen that the bridge thickness increases from 1
mm to 3.5 mm, the no‐load leakage flux factor increases from 1.12 to 1.56, an increase of
39.3%. With the increase in bridge thickness, the no‐load flux leakage factor increases
gradually, which affects the electromagnetic performance of the motor. A large no‐load
flux leakage factor also means that the flux leakage of the motor is large while the main
flux is small.
Figure 7. The influence of bridge thickness and rib thickness on rotor stress and total deformation:(a) Maximum equivalent stress of rotor; (b) Total deformation.
Machines 2022, 10, x FOR PEER REVIEW 9 of 21
Figure 8. Relationship between no‐load leakage flux factor and bridge thickness.
Combining the results in Figures 6–8, the thickness of bridge and rib are designed to
be 3.5 mm and 1.6 mm. The stress simulation results are shown in Figure 9. It is obvious
that the peak point of rotor stress is located near the magnetic bridge. The total defor‐
mation is 0.084 mm, and the rotor stress is 1690 MPa. However, it is still far greater than
the yield strength of 480 MPa. If the mechanical stress exceeds the ultimate strength of the
material, the bridge will be severely deformed or even broken. Therefore, necessary
measures should be taken to improve the mechanical reliability of the rotor.
Stress(MPa)
1689.7
1502.1
1314.4
1126.7
989.06
751.40
563.78
376.06
133.83
0.7276
0.083807
0.074495
0.065133
0.055372
0.046560
0.037243
0.027936
0.013624
0.009812
0
Deformation(mm)
(a) (b)
Figure 9. Simulation results: (a) Rotor stress; (b)Total deformation.
3.3. Stress Analysis of IPM Rotor with Stiffener
It is difficult for the conventional radial IPM structure to meet the stress‐field con‐
straints of an HSPMM. In order to reduce the rotor stress, the PM is segmented into two
sections. A stiffener is added to disperse the centrifugal force, which was previously only
borne by the magnetic bridge. The rotor structure with stiffener is shown in Figure 10.
PM
BridgeStiffener
Figure 10. The IPM rotor structure with stiffener.
Figure 8. Relationship between no-load leakage flux factor and bridge thickness.
Combining the results in Figures 6–8, the thickness of bridge and rib are designed tobe 3.5 mm and 1.6 mm. The stress simulation results are shown in Figure 9. It is obviousthat the peak point of rotor stress is located near the magnetic bridge. The total deformationis 0.084 mm, and the rotor stress is 1690 MPa. However, it is still far greater than the yieldstrength of 480 MPa. If the mechanical stress exceeds the ultimate strength of the material,the bridge will be severely deformed or even broken. Therefore, necessary measures shouldbe taken to improve the mechanical reliability of the rotor.
Machines 2022, 10, x FOR PEER REVIEW 9 of 21
Figure 8. Relationship between no‐load leakage flux factor and bridge thickness.
Combining the results in Figures 6–8, the thickness of bridge and rib are designed to
be 3.5 mm and 1.6 mm. The stress simulation results are shown in Figure 9. It is obvious
that the peak point of rotor stress is located near the magnetic bridge. The total defor‐
mation is 0.084 mm, and the rotor stress is 1690 MPa. However, it is still far greater than
the yield strength of 480 MPa. If the mechanical stress exceeds the ultimate strength of the
material, the bridge will be severely deformed or even broken. Therefore, necessary
measures should be taken to improve the mechanical reliability of the rotor.
Stress(MPa)
1689.7
1502.1
1314.4
1126.7
989.06
751.40
563.78
376.06
133.83
0.7276
0.083807
0.074495
0.065133
0.055372
0.046560
0.037243
0.027936
0.013624
0.009812
0
Deformation(mm)
(a) (b)
Figure 9. Simulation results: (a) Rotor stress; (b)Total deformation.
3.3. Stress Analysis of IPM Rotor with Stiffener
It is difficult for the conventional radial IPM structure to meet the stress‐field con‐
straints of an HSPMM. In order to reduce the rotor stress, the PM is segmented into two
sections. A stiffener is added to disperse the centrifugal force, which was previously only
borne by the magnetic bridge. The rotor structure with stiffener is shown in Figure 10.
PM
BridgeStiffener
Figure 10. The IPM rotor structure with stiffener.
Figure 9. Simulation results: (a) Rotor stress; (b) Total deformation.
3.3. Stress Analysis of IPM Rotor with Stiffener
It is difficult for the conventional radial IPM structure to meet the stress-field con-straints of an HSPMM. In order to reduce the rotor stress, the PM is segmented into two

Machines 2022, 10, 700 9 of 20
sections. A stiffener is added to disperse the centrifugal force, which was previously onlyborne by the magnetic bridge. The rotor structure with stiffener is shown in Figure 10.
Figure 11 shows the influence of stiffener thickness on rotor stress and total deforma-tion. With the increase of stiffener thickness, the maximum equivalent stress on the rotorpresents a decreasing trend, but the trend of decreasing is different. When the stiffenerthickness is less than 2 mm, the rotor stress decreases significantly. When the stiffenerthickness increases from 0.5 mm to 2 mm, the rotor stress decreases by 36.1%. When thestiffener thickness is greater than 2 mm, the declining trend of rotor stress slows down.When the stiffener thickness increases from 2 mm to 3 mm, the rotor stress decreases by13.9%. The variation trend of total deformation is the same as that of rotor stress.
The effects of bridge thickness and stiffener thickness on rotor stress and total de-formation are shown in Figure 12. When the bridge thickness and the stiffener thicknessincrease, the rotor stress decreases. Similarly, when the bridge thickness and the stiffenerthickness increase, the total deformation of the rotor decreases. The influence of the stiffenerthickness on total deformation is more obvious than that of the bridge thickness. To satisfythe stress-field constraints, the bridge thickness selected was 2.3 mm.
Dividing the PM into two sections helps to reduce the maximum stress of the rotor, butadditional magnetic flux leakage paths will increase. The no-load flux leakage factor underdifferent stiffener thicknesses is calculated through 2D-FEM, and the results are shown inFigure 13. Results show that the no-load leakage flux factor rises linearly with the increase instiffener thickness. Therefore, on the premise of satisfying the mechanical strength, the thicknessof the stiffener should be as small as possible. The stiffener thickness selected was 2.8 mm.
Machines 2022, 10, x FOR PEER REVIEW 9 of 21
Figure 8. Relationship between no‐load leakage flux factor and bridge thickness.
Combining the results in Figures 6–8, the thickness of bridge and rib are designed to
be 3.5 mm and 1.6 mm. The stress simulation results are shown in Figure 9. It is obvious
that the peak point of rotor stress is located near the magnetic bridge. The total defor‐
mation is 0.084 mm, and the rotor stress is 1690 MPa. However, it is still far greater than
the yield strength of 480 MPa. If the mechanical stress exceeds the ultimate strength of the
material, the bridge will be severely deformed or even broken. Therefore, necessary
measures should be taken to improve the mechanical reliability of the rotor.
Stress(MPa)
1689.7
1502.1
1314.4
1126.7
989.06
751.40
563.78
376.06
133.83
0.7276
0.083807
0.074495
0.065133
0.055372
0.046560
0.037243
0.027936
0.013624
0.009812
0
Deformation(mm)
(a) (b)
Figure 9. Simulation results: (a) Rotor stress; (b)Total deformation.
3.3. Stress Analysis of IPM Rotor with Stiffener
It is difficult for the conventional radial IPM structure to meet the stress‐field con‐
straints of an HSPMM. In order to reduce the rotor stress, the PM is segmented into two
sections. A stiffener is added to disperse the centrifugal force, which was previously only
borne by the magnetic bridge. The rotor structure with stiffener is shown in Figure 10.
PM
BridgeStiffener
Figure 10. The IPM rotor structure with stiffener. Figure 10. The IPM rotor structure with stiffener.
Machines 2022, 10, x FOR PEER REVIEW 10 of 21
Figure 11 shows the influence of stiffener thickness on rotor stress and total defor‐
mation. With the increase of stiffener thickness, the maximum equivalent stress on the
rotor presents a decreasing trend, but the trend of decreasing is different. When the stiff‐
ener thickness is less than 2 mm, the rotor stress decreases significantly. When the stiffener
thickness increases from 0.5 mm to 2 mm, the rotor stress decreases by 36.1%. When the
stiffener thickness is greater than 2 mm, the declining trend of rotor stress slows down.
When the stiffener thickness increases from 2 mm to 3 mm, the rotor stress decreases by
13.9%. The variation trend of total deformation is the same as that of rotor stress.
(a) (b)
Figure 11. The influence of stiffener thickness on rotor stress and total deformation: (a) Maximum
equivalent stress of rotor; (b) Total deformation.
The effects of bridge thickness and stiffener thickness on rotor stress and total defor‐
mation are shown in Figure 12. When the bridge thickness and the stiffener thickness in‐
crease, the rotor stress decreases. Similarly, when the bridge thickness and the stiffener
thickness increase, the total deformation of the rotor decreases. The influence of the stiff‐
ener thickness on total deformation is more obvious than that of the bridge thickness. To
satisfy the stress‐field constraints, the bridge thickness selected was 2.3 mm.
(a) (b)
Figure 12. The influence of stiffener thickness and bridge thickness on rotor stress and total defor‐
mation: (a) Maximum equivalent stress of rotor; (b) Total deformation.
Dividing the PM into two sections helps to reduce the maximum stress of the rotor,
but additional magnetic flux leakage paths will increase. The no‐load flux leakage factor
under different stiffener thicknesses is calculated through 2D‐FEM, and the results are
shown in Figure 13. Results show that the no‐load leakage flux factor rises linearly with
Figure 11. The influence of stiffener thickness on rotor stress and total deformation: (a) Maximumequivalent stress of rotor; (b) Total deformation.

Machines 2022, 10, 700 10 of 20
Machines 2022, 10, x FOR PEER REVIEW 10 of 21
Figure 11 shows the influence of stiffener thickness on rotor stress and total defor‐
mation. With the increase of stiffener thickness, the maximum equivalent stress on the
rotor presents a decreasing trend, but the trend of decreasing is different. When the stiff‐
ener thickness is less than 2 mm, the rotor stress decreases significantly. When the stiffener
thickness increases from 0.5 mm to 2 mm, the rotor stress decreases by 36.1%. When the
stiffener thickness is greater than 2 mm, the declining trend of rotor stress slows down.
When the stiffener thickness increases from 2 mm to 3 mm, the rotor stress decreases by
13.9%. The variation trend of total deformation is the same as that of rotor stress.
(a) (b)
Figure 11. The influence of stiffener thickness on rotor stress and total deformation: (a) Maximum
equivalent stress of rotor; (b) Total deformation.
The effects of bridge thickness and stiffener thickness on rotor stress and total defor‐
mation are shown in Figure 12. When the bridge thickness and the stiffener thickness in‐
crease, the rotor stress decreases. Similarly, when the bridge thickness and the stiffener
thickness increase, the total deformation of the rotor decreases. The influence of the stiff‐
ener thickness on total deformation is more obvious than that of the bridge thickness. To
satisfy the stress‐field constraints, the bridge thickness selected was 2.3 mm.
(a) (b)
Figure 12. The influence of stiffener thickness and bridge thickness on rotor stress and total defor‐
mation: (a) Maximum equivalent stress of rotor; (b) Total deformation.
Dividing the PM into two sections helps to reduce the maximum stress of the rotor,
but additional magnetic flux leakage paths will increase. The no‐load flux leakage factor
under different stiffener thicknesses is calculated through 2D‐FEM, and the results are
shown in Figure 13. Results show that the no‐load leakage flux factor rises linearly with
Figure 12. The influence of stiffener thickness and bridge thickness on rotor stress and total deforma-tion: (a) Maximum equivalent stress of rotor; (b) Total deformation.
Machines 2022, 10, x FOR PEER REVIEW 11 of 21
the increase in stiffener thickness. Therefore, on the premise of satisfying the mechanical
strength, the thickness of the stiffener should be as small as possible. The stiffener thick‐
ness selected was 2.8 mm.
Figure 13. Relationship between no‐load leakage flux factor and stiffener thickness.
Considering the influence of rotor stress and the no‐load leakage flux factor, the
thickness of the bridge and stiffener were designed to be 2.3 mm and 2.8 mm, respectively.
The simulation results are shown in Figure 14. It is obvious that the peak point of rotor
stress is located at the root of the stiffener. Due to the segmented structure, the mechanical
reliability of the rotor is significantly enhanced. The rotor stress is 430 MPa, and the total
deformation is 0.031 mm, which also meets the stress‐field constraints.
429.57
381.98
334.23
286.63
233.93
191.34
143.69
96.041
43.890
0.7459
Stress(MPa)
0.031151
0.023519
0.025333
0.023256
0.020624
0.017992
0.015360
0.012723
0.010097
0.007465
Deformation(mm)
(a) (b)
Figure 14. Simulation results: (a) Rotor stress; (b) Total deformation.
From the consideration of rotor stress, the design of rotor parameters is finally deter‐
mined for the HSPMM, as shown in Table 3. Two motors with different rotor structures
are designed based on the same stator design parameters, the same motor volume and the
similar line back‐EMF. The two motors with different structures have the same permanent
magnet thickness, but a different embrace is used to ensure similar no‐load back‐EMF.
The PM of the SPM motor is in the shape of a ring, while the IPM is a cuboid, so the volume
of the two PMs is different. The permanent magnet consumption of the IPM motor is only
66.7% of that of the SPM motor. For the SPM motor, the sleeve thickness and interference
fit were selected to be 5 mm and 0.15 mm, respectively. For the IPM motor, the thickness
of the bridge and stiffener were designed to be 2.3 mm and 2.8 mm, respectively.
In the rotor stress analysis and comparison, both rotor structures satisfy the stress
constraints. The sleeve stress of the SPM motor is 596 MPa, and the safety factor is 3.29.
The rotor core stress of the IPM motor is 430 MPa, and the safety factor is 1.12. SPM motors
have greater stress margins than IPM motors.
Figure 13. Relationship between no-load leakage flux factor and stiffener thickness.
Considering the influence of rotor stress and the no-load leakage flux factor, thethickness of the bridge and stiffener were designed to be 2.3 mm and 2.8 mm, respectively.The simulation results are shown in Figure 14. It is obvious that the peak point of rotorstress is located at the root of the stiffener. Due to the segmented structure, the mechanicalreliability of the rotor is significantly enhanced. The rotor stress is 430 MPa, and the totaldeformation is 0.031 mm, which also meets the stress-field constraints.
Machines 2022, 10, x FOR PEER REVIEW 11 of 21
the increase in stiffener thickness. Therefore, on the premise of satisfying the mechanical
strength, the thickness of the stiffener should be as small as possible. The stiffener thick‐
ness selected was 2.8 mm.
Figure 13. Relationship between no‐load leakage flux factor and stiffener thickness.
Considering the influence of rotor stress and the no‐load leakage flux factor, the
thickness of the bridge and stiffener were designed to be 2.3 mm and 2.8 mm, respectively.
The simulation results are shown in Figure 14. It is obvious that the peak point of rotor
stress is located at the root of the stiffener. Due to the segmented structure, the mechanical
reliability of the rotor is significantly enhanced. The rotor stress is 430 MPa, and the total
deformation is 0.031 mm, which also meets the stress‐field constraints.
429.57
381.98
334.23
286.63
233.93
191.34
143.69
96.041
43.890
0.7459
Stress(MPa)
0.031151
0.023519
0.025333
0.023256
0.020624
0.017992
0.015360
0.012723
0.010097
0.007465
Deformation(mm)
(a) (b)
Figure 14. Simulation results: (a) Rotor stress; (b) Total deformation.
From the consideration of rotor stress, the design of rotor parameters is finally deter‐
mined for the HSPMM, as shown in Table 3. Two motors with different rotor structures
are designed based on the same stator design parameters, the same motor volume and the
similar line back‐EMF. The two motors with different structures have the same permanent
magnet thickness, but a different embrace is used to ensure similar no‐load back‐EMF.
The PM of the SPM motor is in the shape of a ring, while the IPM is a cuboid, so the volume
of the two PMs is different. The permanent magnet consumption of the IPM motor is only
66.7% of that of the SPM motor. For the SPM motor, the sleeve thickness and interference
fit were selected to be 5 mm and 0.15 mm, respectively. For the IPM motor, the thickness
of the bridge and stiffener were designed to be 2.3 mm and 2.8 mm, respectively.
In the rotor stress analysis and comparison, both rotor structures satisfy the stress
constraints. The sleeve stress of the SPM motor is 596 MPa, and the safety factor is 3.29.
The rotor core stress of the IPM motor is 430 MPa, and the safety factor is 1.12. SPM motors
have greater stress margins than IPM motors.
Figure 14. Simulation results: (a) Rotor stress; (b) Total deformation.
From the consideration of rotor stress, the design of rotor parameters is finally deter-mined for the HSPMM, as shown in Table 3. Two motors with different rotor structuresare designed based on the same stator design parameters, the same motor volume and the

Machines 2022, 10, 700 11 of 20
similar line back-EMF. The two motors with different structures have the same permanentmagnet thickness, but a different embrace is used to ensure similar no-load back-EMF. ThePM of the SPM motor is in the shape of a ring, while the IPM is a cuboid, so the volume ofthe two PMs is different. The permanent magnet consumption of the IPM motor is only66.7% of that of the SPM motor. For the SPM motor, the sleeve thickness and interferencefit were selected to be 5 mm and 0.15 mm, respectively. For the IPM motor, the thickness ofthe bridge and stiffener were designed to be 2.3 mm and 2.8 mm, respectively.
In the rotor stress analysis and comparison, both rotor structures satisfy the stressconstraints. The sleeve stress of the SPM motor is 596 MPa, and the safety factor is 3.29.The rotor core stress of the IPM motor is 430 MPa, and the safety factor is 1.12. SPM motorshave greater stress margins than IPM motors.
Table 3. Two kinds of rotor structure design parameters.
Parameters SPM IPM
Embrace 1 0.83Permanent magnet thickness (mm) 7 7
Permanent magnet width (mm) 60 40Sleeve thickness (mm) 5 -Interference fit (mm) 0.15 -Rib thickness (mm) - 1.6
Bridge rib thickness (mm) - 2.3Reinforcement thickness - 2.8
Sleeve/rotor core stress (MPa) 596 430Stress safety factor 3.29 1.12
4. Analysis of Electromagnetic Performances of Two Different Rotor Structures
Based on the two rotor structures established in Section 3, the 2D-FEM is establishedfor the HSPMMs. The electromagnetic performances of the two motors are calculated andcompared by 2D FEA. In the electromagnetic simulation, the purpose of the machines isas an electric motor, which is excited with current. Besides this, the motor is simulated intwo operating states: no-load and rated load. In the no-load operation state, the excitationcurrent of the motor is 0 A, and the motor speed is 30,000 rpm. Under rated load operation,the excitation current of the motor is 132 A, and the motor speed is 30,000 rpm.
4.1. Magnetic Flux Distributions
The magnetic flux distributions are calculated under no load condition, as shown inFigure 15. The magnetic flux lines of both SPM and IPM motors are evenly distributed. However,the magnetic flux density is very different. For the SPM motor, the maximum magnetic fluxdensity is 1.43 T, which is located in the stator yoke. For the IPM motor, the maximum magneticflux density is 2.28 T, which is located at the magnetic bridge of the rotor core.
4.2. Line-to-Line Back-EMF
Figure 16 shown the line-to-line back-EMF and Fourier-transform results of the twodifferent structures under no-load conditions. It is obvious that the line back-EMF of SPMis much smoother compared with that of the IPM. The total harmonic distortion (THD) ofthe SPM motor is 0.64% and that of the IPM motor is 3.20%. The 11th and 13th harmonicsof IPM are higher than that of SPM. Besides, the no-load line back-EMF of the IPM motoris 520 V while that of the SPM motor is 538 V. The back-EMF of IPM motor is reduced fortwo reasons. On the one hand, in order to meet the rotor-stress design requirements, theadditional flux leakage path is increased due to the addition of a stiffener on the rotor core.The no-load flux leakage factor of the IPM motor is as high as 1.72. On the other hand, dueto space constraints, the PM consumption of the IPM motor is only 66.7% of that of theSPM motor. Therefore, the no-load back-EMF of the IPM motor is slightly lower than thatof the SPM motor.

Machines 2022, 10, 700 12 of 20
Machines 2022, 10, x FOR PEER REVIEW 12 of 21
Table 3. Two kinds of rotor structure design parameters.
Parameters SPM IPM
Embrace 1 0.83
Permanent magnet thickness (mm) 7 7
Permanent magnet width (mm) 60 40
Sleeve thickness (mm) 5 ‐
Interference fit (mm) 0.15 ‐
Rib thickness (mm) ‐ 1.6
Bridge rib thickness (mm) ‐ 2.3
Reinforcement thickness ‐ 2.8
Sleeve/rotor core stress (MPa) 596 430
Stress safety factor 3.29 1.12
4. Analysis of Electromagnetic Performances of Two Different Rotor Structures
Based on the two rotor structures established in Section 3, the 2D‐FEM is established
for the HSPMMs. The electromagnetic performances of the two motors are calculated and
compared by 2D FEA. In the electromagnetic simulation, the purpose of the machines is
as an electric motor, which is excited with current. Besides this, the motor is simulated in
two operating states: no‐load and rated load. In the no‐load operation state, the excitation
current of the motor is 0 A, and the motor speed is 30,000 rpm. Under rated load operation,
the excitation current of the motor is 132 A, and the motor speed is 30,000 rpm.
4.1. Magnetic Flux Distributions
The magnetic flux distributions are calculated under no load condition, as shown in
Figure 15. The magnetic flux lines of both SPM and IPM motors are evenly distributed.
However, the magnetic flux density is very different. For the SPM motor, the maximum
magnetic flux density is 1.43 T, which is located in the stator yoke. For the IPM motor, the
maximum magnetic flux density is 2.28 T, which is located at the magnetic bridge of the
rotor core.
1.4327
1.3372
1.2417
1.1462
1.0507
0.9551
0.8596
0.7641
0.6686
0.5731
0.4776
0.3821
0.2866
0.1910
0.0955
0.0000
B(tesla)A(Wb/m)
0.0716
0.0152
0.0129
0.0106
0.0082
0.0059
0.0035
0.0012
-0.0012
-0.0035
-0.0059
-0.0082
-0.0106
-0.0129
-0.0152
-0.0176
A(Wb/m)
0.0180
0.0156
0.0132
0.0108
0.0084
0.0060
0.0036
0.0012
-0.0012
-0.0036
-0.0060
-0.0084
-0.0108
-0.0132
-0.0156
-0.0180
2.2776
2.1257
1.9739
1.8221
1.6702
1.5184
1.3665
1.2147
1.0629
0.9110
0.7592
0.6074
0.4555
0.3037
0.1518
0.0000
B(tesla)
(a) (b)
Figure 15. Magnetic flux distributions of SPM and IPM under no load: (a) SPM; (b) IPM.
4.2. Line‐to‐Line Back‐EMF
Figure 16 shown the line‐to‐line back‐EMF and Fourier‐transform results of the two
different structures under no‐load conditions. It is obvious that the line back‐EMF of SPM
is much smoother compared with that of the IPM. The total harmonic distortion (THD) of
the SPM motor is 0.64% and that of the IPM motor is 3.20%. The 11th and 13th harmonics
Figure 15. Magnetic flux distributions of SPM and IPM under no load: (a) SPM; (b) IPM.
Machines 2022, 10, x FOR PEER REVIEW 13 of 21
of IPM are higher than that of SPM. Besides, the no‐load line back‐EMF of the IPM motor
is 520 V while that of the SPM motor is 538 V. The back‐EMF of IPM motor is reduced for
two reasons. On the one hand, in order to meet the rotor‐stress design requirements, the
additional flux leakage path is increased due to the addition of a stiffener on the rotor
core. The no‐load flux leakage factor of the IPM motor is as high as 1.72. On the other
hand, due to space constraints, the PM consumption of the IPM motor is only 66.7% of
that of the SPM motor. Therefore, the no‐load back‐EMF of the IPM motor is slightly lower
than that of the SPM motor.
(a) (b)
Figure 16. Line‐to‐line back‐EMF of SPM and IPM under no load: (a) SPM; (b) IPM.
4.3. Air Gap Radial Magnetic Flux Density
Under no‐load and rated load conditions, the radial air‐gap flux density and Fourier‐
transform results of the two structures are comprehensively compared, as shown in Fig‐
ure 17.
For no‐load conditions, the air‐gap flux density waveforms of the two motors are
close to trapezoidal wave. The fundamental amplitude of SPM is slightly higher than that
of IPM. This is why the back‐EMF of SPM is higher than that of IPM.
For rated load conditions, both the IPM and the SPM contain high harmonic compo‐
nents. Due to the small air gap of the IPM motor, the stator current has a great influence
on the air‐gap magnetic flux density distribution of the IPM motor. In particular, the 3rd,
5th, 11th and 13th harmonic components of the two structures are high. Overall, the air‐
gap flux density waveforms of SPM are closer to a sine wave, and the harmonic compo‐
nents are much less than those of the IPM.
(a) (b)
Figure 16. Line-to-line back-EMF of SPM and IPM under no load: (a) SPM; (b) IPM.
4.3. Air Gap Radial Magnetic Flux Density
Under no-load and rated load conditions, the radial air-gap flux density and Fourier-transform results of the two structures are comprehensively compared, as shown in Figure 17.
For no-load conditions, the air-gap flux density waveforms of the two motors are closeto trapezoidal wave. The fundamental amplitude of SPM is slightly higher than that ofIPM. This is why the back-EMF of SPM is higher than that of IPM.
For rated load conditions, both the IPM and the SPM contain high harmonic compo-nents. Due to the small air gap of the IPM motor, the stator current has a great influence onthe air-gap magnetic flux density distribution of the IPM motor. In particular, the 3rd, 5th,11th and 13th harmonic components of the two structures are high. Overall, the air-gapflux density waveforms of SPM are closer to a sine wave, and the harmonic componentsare much less than those of the IPM.
4.4. Torque and Cogging Torque Characteristics
Figure 18 shows the torque and cogging torque waveforms of the SPM and IPM motors.Calculating the average value of the second cycle, the torque of the SPM is 19.63 N·m whilethe torque of the IPM is 19.58 N·m. The average torque of the SPM is slightly larger thanthat of the IPM because the line back-EMF of the SPM is larger than that of the IPM. Inaddition, as can be seen from Figure 18b, the torque ripple of the SPM is smaller than thatof the IPM due to the smaller cogging torque compared to the IPM motor.

Machines 2022, 10, 700 13 of 20
Machines 2022, 10, x FOR PEER REVIEW 13 of 21
of IPM are higher than that of SPM. Besides, the no‐load line back‐EMF of the IPM motor
is 520 V while that of the SPM motor is 538 V. The back‐EMF of IPM motor is reduced for
two reasons. On the one hand, in order to meet the rotor‐stress design requirements, the
additional flux leakage path is increased due to the addition of a stiffener on the rotor
core. The no‐load flux leakage factor of the IPM motor is as high as 1.72. On the other
hand, due to space constraints, the PM consumption of the IPM motor is only 66.7% of
that of the SPM motor. Therefore, the no‐load back‐EMF of the IPM motor is slightly lower
than that of the SPM motor.
(a) (b)
Figure 16. Line‐to‐line back‐EMF of SPM and IPM under no load: (a) SPM; (b) IPM.
4.3. Air Gap Radial Magnetic Flux Density
Under no‐load and rated load conditions, the radial air‐gap flux density and Fourier‐
transform results of the two structures are comprehensively compared, as shown in Fig‐
ure 17.
For no‐load conditions, the air‐gap flux density waveforms of the two motors are
close to trapezoidal wave. The fundamental amplitude of SPM is slightly higher than that
of IPM. This is why the back‐EMF of SPM is higher than that of IPM.
For rated load conditions, both the IPM and the SPM contain high harmonic compo‐
nents. Due to the small air gap of the IPM motor, the stator current has a great influence
on the air‐gap magnetic flux density distribution of the IPM motor. In particular, the 3rd,
5th, 11th and 13th harmonic components of the two structures are high. Overall, the air‐
gap flux density waveforms of SPM are closer to a sine wave, and the harmonic compo‐
nents are much less than those of the IPM.
(a) (b)
Machines 2022, 10, x FOR PEER REVIEW 14 of 21
(c) (d)
Figure 17. Air‐gap radial magnetic flux density of SPM and IPM under no load and rated load: (a)
Air‐gap radial magnetic flux density with mechanical angle waveform at no load; (b) Fourier trans‐
form at no load; (c) Air‐gap radial magnetic flux density with mechanical angle waveform at rated
load; (d) Fourier transform at rated load.
4.4. Torque and Cogging Torque Characteristics
Figure 18 shows the torque and cogging torque waveforms of the SPM and IPM mo‐
tors. Calculating the average value of the second cycle, the torque of the SPM is 19.63 N∙m
while the torque of the IPM is 19.58 N∙m. The average torque of the SPM is slightly larger
than that of the IPM because the line back‐EMF of the SPM is larger than that of the IPM.
In addition, as can be seen from Figure 18b, the torque ripple of the SPM is smaller than
that of the IPM due to the smaller cogging torque compared to the IPM motor.
(a) (b)
Figure 18. Torque and cogging torque of SPM and IPM under rated load: (a) Torque; (b) Cogging
torque.
4.5. Rotor Loss Comparative Analysis
The rotor eddy‐current density distribution of the two rotor structures under rated
load are illustrated in Figure 19. For better comparison, the eddy‐current loss distributions
of the two rotor structures are presented based on the same upper and lower limits. It is
observed that the maximum eddy current density occurs at the PM for both rotor struc‐
tures. However, the maximum eddy‐current density of the SPM motor is much higher
than that of IPM motor.
The losses at each position of two rotors are calculated as shown in Figure 20. Ac‐
cording to the eddy‐current density distribution, the loss on the PM of SPM is larger than
that of IPM, but the total loss of IPM is far greater than that of SPM due to the large rotor
core loss. For the SPM motor, on the one hand, the eddy‐current losses on the sleeve are
small due to the poor electrical conductivity of the carbon‐fiber sleeve. On the other hand,
Figure 17. Air-gap radial magnetic flux density of SPM and IPM under no load and rated load:(a) Air-gap radial magnetic flux density with mechanical angle waveform at no load; (b) Fouriertransform at no load; (c) Air-gap radial magnetic flux density with mechanical angle waveform atrated load; (d) Fourier transform at rated load.
Machines 2022, 10, x FOR PEER REVIEW 14 of 21
(c) (d)
Figure 17. Air‐gap radial magnetic flux density of SPM and IPM under no load and rated load: (a)
Air‐gap radial magnetic flux density with mechanical angle waveform at no load; (b) Fourier trans‐
form at no load; (c) Air‐gap radial magnetic flux density with mechanical angle waveform at rated
load; (d) Fourier transform at rated load.
4.4. Torque and Cogging Torque Characteristics
Figure 18 shows the torque and cogging torque waveforms of the SPM and IPM mo‐
tors. Calculating the average value of the second cycle, the torque of the SPM is 19.63 N∙m
while the torque of the IPM is 19.58 N∙m. The average torque of the SPM is slightly larger
than that of the IPM because the line back‐EMF of the SPM is larger than that of the IPM.
In addition, as can be seen from Figure 18b, the torque ripple of the SPM is smaller than
that of the IPM due to the smaller cogging torque compared to the IPM motor.
(a) (b)
Figure 18. Torque and cogging torque of SPM and IPM under rated load: (a) Torque; (b) Cogging
torque.
4.5. Rotor Loss Comparative Analysis
The rotor eddy‐current density distribution of the two rotor structures under rated
load are illustrated in Figure 19. For better comparison, the eddy‐current loss distributions
of the two rotor structures are presented based on the same upper and lower limits. It is
observed that the maximum eddy current density occurs at the PM for both rotor struc‐
tures. However, the maximum eddy‐current density of the SPM motor is much higher
than that of IPM motor.
The losses at each position of two rotors are calculated as shown in Figure 20. Ac‐
cording to the eddy‐current density distribution, the loss on the PM of SPM is larger than
that of IPM, but the total loss of IPM is far greater than that of SPM due to the large rotor
core loss. For the SPM motor, on the one hand, the eddy‐current losses on the sleeve are
small due to the poor electrical conductivity of the carbon‐fiber sleeve. On the other hand,
Figure 18. Torque and cogging torque of SPM and IPM under rated load: (a) Torque; (b) Cogging torque.
4.5. Rotor Loss Comparative Analysis
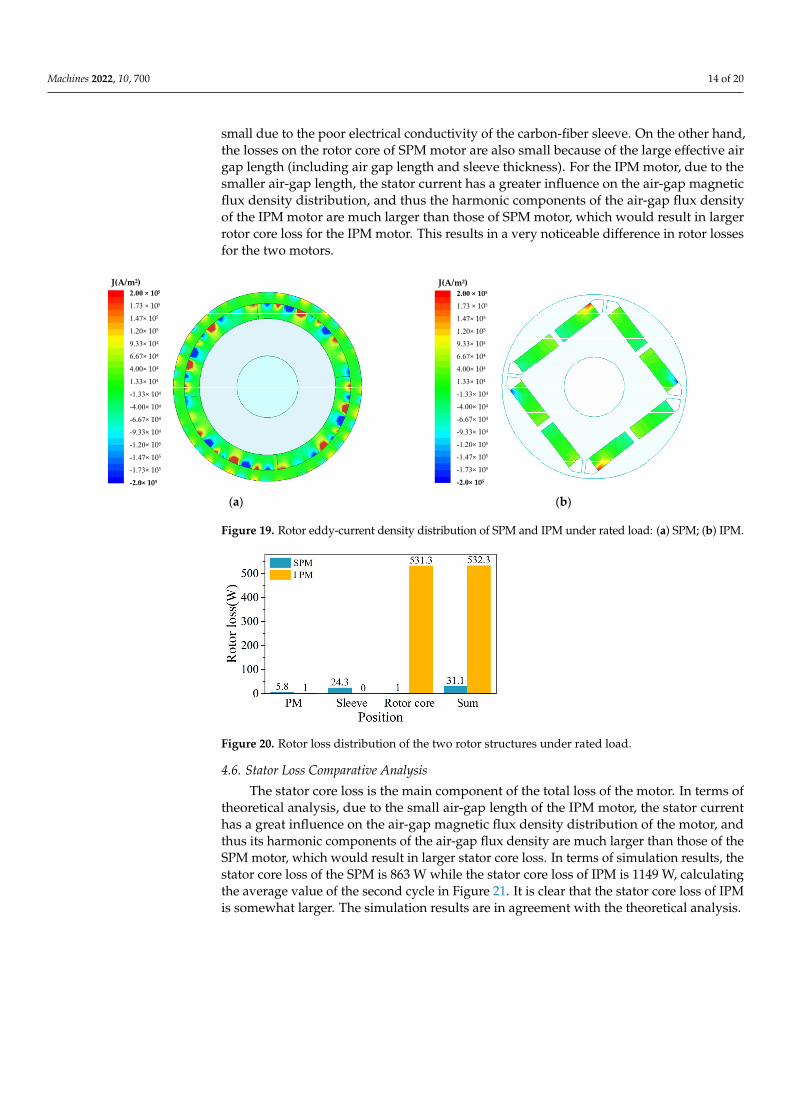
The rotor eddy-current density distribution of the two rotor structures under ratedload are illustrated in Figure 19. For better comparison, the eddy-current loss distributionsof the two rotor structures are presented based on the same upper and lower limits. It isobserved that the maximum eddy current density occurs at the PM for both rotor structures.However, the maximum eddy-current density of the SPM motor is much higher than thatof IPM motor.
The losses at each position of two rotors are calculated as shown in Figure 20. Ac-cording to the eddy-current density distribution, the loss on the PM of SPM is larger thanthat of IPM, but the total loss of IPM is far greater than that of SPM due to the large rotorcore loss. For the SPM motor, on the one hand, the eddy-current losses on the sleeve are
Machines 2022, 10, 700 14 of 20
small due to the poor electrical conductivity of the carbon-fiber sleeve. On the other hand,the losses on the rotor core of SPM motor are also small because of the large effective airgap length (including air gap length and sleeve thickness). For the IPM motor, due to thesmaller air-gap length, the stator current has a greater influence on the air-gap magneticflux density distribution, and thus the harmonic components of the air-gap flux densityof the IPM motor are much larger than those of SPM motor, which would result in largerrotor core loss for the IPM motor. This results in a very noticeable difference in rotor lossesfor the two motors.
Machines 2022, 10, x FOR PEER REVIEW 15 of 21
the losses on the rotor core of SPM motor are also small because of the large effective air
gap length (including air gap length and sleeve thickness). For the IPM motor, due to the
smaller air‐gap length, the stator current has a greater influence on the air‐gap magnetic
flux density distribution, and thus the harmonic components of the air‐gap flux density
of the IPM motor are much larger than those of SPM motor, which would result in larger
rotor core loss for the IPM motor. This results in a very noticeable difference in rotor losses
for the two motors.
2.00 × 10⁵
1.73 × 10⁵
1.47× 10⁵
1.20× 10⁵
9.33× 10⁴
6.67× 10⁴
4.00× 10⁴
1.33× 10⁴
-1.33× 10⁴
-4.00× 10⁴
-6.67× 10⁴
-9.33× 10⁴
-1.20× 10⁵
-1.47× 10⁵
-1.73× 10⁵
-2.0× 10⁵
J(A/m2)
2.00 × 10⁵
1.73 × 10⁵
1.47× 10⁵
1.20× 10⁵
9.33× 10⁴
6.67× 10⁴
4.00× 10⁴
1.33× 10⁴
-1.33× 10⁴
-4.00× 10⁴
-6.67× 10⁴
-9.33× 10⁴
-1.20× 10⁵
-1.47× 10⁵
-1.73× 10⁵
-2.0× 10⁵
J(A/m2)
(a) (b)
Figure 19. Rotor eddy‐current density distribution of SPM and IPM under rated load: (a) SPM; (b)
IPM.
Figure 20. Rotor loss distribution of the two rotor structures under rated load.
4.6. Stator Loss Comparative Analysis
The stator core loss is the main component of the total loss of the motor. In terms of
theoretical analysis, due to the small air‐gap length of the IPM motor, the stator current
has a great influence on the air‐gap magnetic flux density distribution of the motor, and
thus its harmonic components of the air‐gap flux density are much larger than those of
the SPM motor, which would result in larger stator core loss. In terms of simulation re‐
sults, the stator core loss of the SPM is 863 W while the stator core loss of IPM is 1149 W,
calculating the average value of the second cycle in Figure 21. It is clear that the stator core
loss of IPM is somewhat larger. The simulation results are in agreement with the theoret‐
ical analysis.
Figure 19. Rotor eddy-current density distribution of SPM and IPM under rated load: (a) SPM; (b) IPM.
Machines 2022, 10, x FOR PEER REVIEW 15 of 21
the losses on the rotor core of SPM motor are also small because of the large effective air
gap length (including air gap length and sleeve thickness). For the IPM motor, due to the
smaller air‐gap length, the stator current has a greater influence on the air‐gap magnetic
flux density distribution, and thus the harmonic components of the air‐gap flux density
of the IPM motor are much larger than those of SPM motor, which would result in larger
rotor core loss for the IPM motor. This results in a very noticeable difference in rotor losses
for the two motors.
2.00 × 10⁵
1.73 × 10⁵
1.47× 10⁵
1.20× 10⁵
9.33× 10⁴
6.67× 10⁴
4.00× 10⁴
1.33× 10⁴
-1.33× 10⁴
-4.00× 10⁴
-6.67× 10⁴
-9.33× 10⁴
-1.20× 10⁵
-1.47× 10⁵
-1.73× 10⁵
-2.0× 10⁵
J(A/m2)
2.00 × 10⁵
1.73 × 10⁵
1.47× 10⁵
1.20× 10⁵
9.33× 10⁴
6.67× 10⁴
4.00× 10⁴
1.33× 10⁴
-1.33× 10⁴
-4.00× 10⁴
-6.67× 10⁴
-9.33× 10⁴
-1.20× 10⁵
-1.47× 10⁵
-1.73× 10⁵
-2.0× 10⁵
J(A/m2)
(a) (b)
Figure 19. Rotor eddy‐current density distribution of SPM and IPM under rated load: (a) SPM; (b)
IPM.
Figure 20. Rotor loss distribution of the two rotor structures under rated load.
4.6. Stator Loss Comparative Analysis
The stator core loss is the main component of the total loss of the motor. In terms of
theoretical analysis, due to the small air‐gap length of the IPM motor, the stator current
has a great influence on the air‐gap magnetic flux density distribution of the motor, and
thus its harmonic components of the air‐gap flux density are much larger than those of
the SPM motor, which would result in larger stator core loss. In terms of simulation re‐
sults, the stator core loss of the SPM is 863 W while the stator core loss of IPM is 1149 W,
calculating the average value of the second cycle in Figure 21. It is clear that the stator core
loss of IPM is somewhat larger. The simulation results are in agreement with the theoret‐
ical analysis.
Figure 20. Rotor loss distribution of the two rotor structures under rated load.
4.6. Stator Loss Comparative Analysis
The stator core loss is the main component of the total loss of the motor. In terms oftheoretical analysis, due to the small air-gap length of the IPM motor, the stator currenthas a great influence on the air-gap magnetic flux density distribution of the motor, andthus its harmonic components of the air-gap flux density are much larger than those of theSPM motor, which would result in larger stator core loss. In terms of simulation results, thestator core loss of the SPM is 863 W while the stator core loss of IPM is 1149 W, calculatingthe average value of the second cycle in Figure 21. It is clear that the stator core loss of IPMis somewhat larger. The simulation results are in agreement with the theoretical analysis.

Machines 2022, 10, 700 15 of 20Machines 2022, 10, x FOR PEER REVIEW 16 of 21
Figure 21. Stator iron core losses of the two rotor structures under rated load.
5. Temperature Distribution of Two Different Rotor Structures
So far, two motors with different structures have been compared in electromagnetic
field performance. However, the HSPMM generates a lot of heat during continuous oper‐
ation. In order to ensure the safety and lifetime of HSPMMs, the thermal analysis must be
conducted and an excellent cooling system should be designed.
5.1. Temperature Calculation Model
The research objects of this section are two motors with different rotor structures,
both of which adopt water cooling systems with a spiral waterway outside the stator.
Maintaining the same cooling conditions, the thermal analysis is performed by Motor‐
CAD. The FEMs are shown in Figure 22. The motor is running at rated load and the motor
speed is 30,000 rpm. In this design, the ambient temperature is 30 °C, and the water flow
rate is set to 1 m3/h. The parameter settings of the cooling system are shown in Table 4.
Water cooling
Water cooling
(a) (b)
Figure 22. Motor cooling system design: (a) SPM; (b) IPM.
Table 4. The parameters of the cooling system.
Parameters Values
Water temperature (°C) 30
Water flow rate (m3/h) 1
Spiral channel width (mm) 10
Spiral channel spacing (mm) 10
Figure 21. Stator iron core losses of the two rotor structures under rated load.
5. Temperature Distribution of Two Different Rotor Structures
So far, two motors with different structures have been compared in electromagneticfield performance. However, the HSPMM generates a lot of heat during continuousoperation. In order to ensure the safety and lifetime of HSPMMs, the thermal analysis mustbe conducted and an excellent cooling system should be designed.
5.1. Temperature Calculation Model
The research objects of this section are two motors with different rotor structures,both of which adopt water cooling systems with a spiral waterway outside the stator.Maintaining the same cooling conditions, the thermal analysis is performed by Motor-CAD.The FEMs are shown in Figure 22. The motor is running at rated load and the motor speedis 30,000 rpm. In this design, the ambient temperature is 30 ◦C, and the water flow rate isset to 1 m3/h. The parameter settings of the cooling system are shown in Table 4.
Machines 2022, 10, x FOR PEER REVIEW 16 of 21
Figure 21. Stator iron core losses of the two rotor structures under rated load.
5. Temperature Distribution of Two Different Rotor Structures
So far, two motors with different structures have been compared in electromagnetic
field performance. However, the HSPMM generates a lot of heat during continuous oper‐
ation. In order to ensure the safety and lifetime of HSPMMs, the thermal analysis must be
conducted and an excellent cooling system should be designed.
5.1. Temperature Calculation Model
The research objects of this section are two motors with different rotor structures,
both of which adopt water cooling systems with a spiral waterway outside the stator.
Maintaining the same cooling conditions, the thermal analysis is performed by Motor‐
CAD. The FEMs are shown in Figure 22. The motor is running at rated load and the motor
speed is 30,000 rpm. In this design, the ambient temperature is 30 °C, and the water flow
rate is set to 1 m3/h. The parameter settings of the cooling system are shown in Table 4.
Water cooling
Water cooling
(a) (b)
Figure 22. Motor cooling system design: (a) SPM; (b) IPM.
Table 4. The parameters of the cooling system.
Parameters Values
Water temperature (°C) 30
Water flow rate (m3/h) 1
Spiral channel width (mm) 10
Spiral channel spacing (mm) 10
Figure 22. Motor cooling system design: (a) SPM; (b) IPM.
Table 4. The parameters of the cooling system.
Parameters Values
Water temperature (◦C) 30Water flow rate (m3/h) 1
Spiral channel width (mm) 10Spiral channel spacing (mm) 10

Machines 2022, 10, 700 16 of 20
5.2. Temperature Comparative Analysis
Combined with the thermal field constraints, the maximum tolerable temperature ofthe rotor was set to 150 ◦C for increasing the reliability. Besides this, the maximum windingtemperature was set to 130 ◦C for increasing the lifetime of the HSPMM.
The temperature distribution and comparison when the two motors run stably for aperiod of time are shown in Figures 23 and 24. For the SPM motor, the rotor temperatureis higher than that of the stator due to the poor thermal conductivity of the carbon-fibersleeve. The maximum temperature of the motor is at the sleeve, which is about 118 ◦C. Themaximum winding temperature is 72 ◦C. The maximum temperature of the stator windingand rotor satisfy the temperature-field constraints. For the IPM motor, the temperatureof the rotor position is particularly high due to the large core losses. The maximum rotortemperature is 194 ◦C. which is much higher than the temperature-field constraints.
Machines 2022, 10, x FOR PEER REVIEW 17 of 21
5.2. Temperature Comparative Analysis
Combined with the thermal field constraints, the maximum tolerable temperature of
the rotor was set to 150 °C for increasing the reliability. Besides this, the maximum wind‐
ing temperature was set to 130 °C for increasing the lifetime of the HSPMM.
The temperature distribution and comparison when the two motors run stably for a
period of time are shown in Figures 23 and 24. For the SPM motor, the rotor temperature
is higher than that of the stator due to the poor thermal conductivity of the carbon‐fiber
sleeve. The maximum temperature of the motor is at the sleeve, which is about 118 °C.
The maximum winding temperature is 72 °C. The maximum temperature of the stator
winding and rotor satisfy the temperature‐field constraints. For the IPM motor, the tem‐
perature of the rotor position is particularly high due to the large core losses. The maxi‐
mum rotor temperature is 194 °C. which is much higher than the temperature‐field con‐
straints.
(a) (b)
Figure 23. The temperature distribution of different rotor structures: (a) SPM; (b) IPM.
Figure 24. The temperatures on the different positions at rated speed.
6. Prototype and Experiment
6.1. Comparison Summary of Multi‐Physics
Combined with the rotor stress analysis in Section 3, the electromagnetic field analy‐
sis in Section 4, and the temperature‐field analysis in Section 5, the multi‐physics compar‐
ison results of SPM and IPM motors are shown in Table 5.
In the rotor stress analysis and comparison, both rotor structures satisfy the stress
constraints. The sleeve stress of the SPM motor is 596 MPa, and the safety factor is 3.29.
The rotor core stress of the IPM motor is 430 MPa, and the safety factor is 1.12. SPM motors
have greater stress margins than IPM motors.
Figure 23. The temperature distribution of different rotor structures: (a) SPM; (b) IPM.
Machines 2022, 10, x FOR PEER REVIEW 17 of 21
5.2. Temperature Comparative Analysis
Combined with the thermal field constraints, the maximum tolerable temperature of
the rotor was set to 150 °C for increasing the reliability. Besides this, the maximum wind‐
ing temperature was set to 130 °C for increasing the lifetime of the HSPMM.
The temperature distribution and comparison when the two motors run stably for a
period of time are shown in Figures 23 and 24. For the SPM motor, the rotor temperature
is higher than that of the stator due to the poor thermal conductivity of the carbon‐fiber
sleeve. The maximum temperature of the motor is at the sleeve, which is about 118 °C.
The maximum winding temperature is 72 °C. The maximum temperature of the stator
winding and rotor satisfy the temperature‐field constraints. For the IPM motor, the tem‐
perature of the rotor position is particularly high due to the large core losses. The maxi‐
mum rotor temperature is 194 °C. which is much higher than the temperature‐field con‐
straints.
(a) (b)
Figure 23. The temperature distribution of different rotor structures: (a) SPM; (b) IPM.
Figure 24. The temperatures on the different positions at rated speed.
6. Prototype and Experiment
6.1. Comparison Summary of Multi‐Physics
Combined with the rotor stress analysis in Section 3, the electromagnetic field analy‐
sis in Section 4, and the temperature‐field analysis in Section 5, the multi‐physics compar‐
ison results of SPM and IPM motors are shown in Table 5.
In the rotor stress analysis and comparison, both rotor structures satisfy the stress
constraints. The sleeve stress of the SPM motor is 596 MPa, and the safety factor is 3.29.
The rotor core stress of the IPM motor is 430 MPa, and the safety factor is 1.12. SPM motors
have greater stress margins than IPM motors.
Figure 24. The temperatures on the different positions at rated speed.
6. Prototype and Experiment6.1. Comparison Summary of Multi-Physics
Combined with the rotor stress analysis in Section 3, the electromagnetic field analysisin Section 4, and the temperature-field analysis in Section 5, the multi-physics comparisonresults of SPM and IPM motors are shown in Table 5.
As seen from Table 5, the safety factor of rotor stress for the SPM motor is 3.29, andit is 1.12 for the IPM motor, which indicates that the SPM motor has a larger stress safetymargin than the IPM motor.
In the comparative analysis of the electromagnetic field, the amplitude of no-loadline back-EMF of the IPM motor is 520 V while that of the SPM motor is 538 V. Generallyspeaking, for the IPM motor, there is a smaller physical air-gap length due to the lack of asleeve, and it is easy to design a larger no-load back-EMF. However, the no-load back-EMF

Machines 2022, 10, 700 17 of 20
of an IPM motor is reduced for two reasons. On the one hand, in order to meet the rotor-stress design requirements, the additional flux leakage path is increased due to the additionof a stiffener on the rotor core. The no-load flux leakage factor of the IPM motor is as highas 1.72. On the other hand, due to space constraints, the PM consumption of the IPM motoris only 66.7% of that of the SPM motor. Therefore, the no-load line back-EMF of the IPMmotor is slightly lower than that of the SPM motor.
Table 5. Multi-physics comparison results for two motors.
Parameters SPM IPM
Permanent magnet thickness (mm) 7 7Permanent magnet width (mm) 60 40
No-load flux leakage factor 1 1.72Sleeve/rotor core stress (MPa) 596 430
Stress safety factor 3.29 1.12Fundamental amplitude of back-EMF (V) 538 526
THD of back-EMF 0.64% 3.20%Torque (N·m) 19.63 19.58
Rotor Loss (W) 31.1 532.3Stator Loss (W) 863 1149
Efficiency 95.27% 93.97%Maximum temperature of winding (◦C) 71.7 86.8
Maximum temperature of rotor core (◦C) 97.9 194.2
In addition, the efficiency of the IPM motor is 93.97%, which is also lower than that ofthe SPM motor. The low efficiency of IPM motors is due to the large losses. On one hand,for the SPM motor, the eddy-current losses on the sleeve are very small due to the poorelectrical conductivity of the carbon-fiber sleeve. Besides this, the loss on the rotor core ofSPM motor is also small due to the large effective air-gap length (including air-gap lengthand sleeve thickness). On the other hand, due to the small air-gap length of the IPM motor,the stator current has a great influence on the air-gap magnetic flux density distribution ofthe IPM motor, and thus the harmonic components of the air-gap flux density of the IPMmotor are much larger than those of SPM motor, which would result in larger stator coreloss and larger rotor core loss for IPM motor. The above reasons lead to a very obviousdifference in rotor loss for the two structures.
In the analysis and comparison of the temperature field, the temperature of the rotorpart is larger than that of the stator. The maximum rotor temperature of the SPM motor is98 ◦C due to the poor thermal conductivity of the carbon-fiber sleeve. Although the IPMrotor structure has good heat-dissipation performance, the temperature of the rotor core isas high as 194 ◦C due to the large loss. It can be seen that the rotor temperature of the SPMmotor is much lower than that of the IPM.
Compared with the SPM motor, the IPM motor has a larger reluctance torque, so theIPM motor has better constant power range and field-weakening control performance.When a larger speed expansion through field weakening is required, the IPM motor willhave a large advantage over the SPM motor. The motors in this paper are usually usedin rated operation, and there is no requirement on the performance of speed expansionthrough field weakening.
6.2. Prototype Experiment
Based on the above multi-physics comparative analysis, the SPM motor can satisfy theconstraints of each field, including stress-field constraints, electromagnetic field constraintsand temperature-field constraints. Therefore, a prototype of SPM rotor structure for 60 kWand 30,000 rpm was selected and manufactured, as shown in Figure 25.
In addition, the electromagnetic characteristics and temperature distribution of theSPM prototype were tested. The test results are shown in Figure 26. The no-load back-EMFtest result of the prototype is 534 V while the calculated value is 538 V, with an error of

Machines 2022, 10, 700 18 of 20
0.7%. The test result of the stator winding temperature of the prototype is 70.9 ◦C whilethe calculated value is 71.7 ◦C; the error is 1.1%. The total loss of the prototype is 3120 W,which is close to the calculated result. It is obvious that the experimental results of theelectromagnetic field and temperature field are in good agreement with the simulationresults. Besides, the prototype was operated at 30,000 rpm for 3 h. During this period, theprototype has been running securely and stably, which shows that the stress field of thisdesign is also reasonable.
Machines 2022, 10, x FOR PEER REVIEW 19 of 21
Based on the above multi‐physics comparative analysis, the SPM motor can satisfy
the constraints of each field, including stress‐field constraints, electromagnetic field con‐
straints and temperature‐field constraints. Therefore, a prototype of SPM rotor structure
for 60 kW and 30,000 rpm was selected and manufactured, as shown in Figure 25.
Figure 25. Prototype photo.
In addition, the electromagnetic characteristics and temperature distribution of the
SPM prototype were tested. The test results are shown in Figure 26. The no‐load back‐
EMF test result of the prototype is 534 V while the calculated value is 538 V, with an error
of 0.7%. The test result of the stator winding temperature of the prototype is 70.9 °C while
the calculated value is 71.7 °C; the error is 1.1%. The total loss of the prototype is 3120 W,
which is close to the calculated result. It is obvious that the experimental results of the
electromagnetic field and temperature field are in good agreement with the simulation
results. Besides, the prototype was operated at 30,000 rpm for 3 h. During this period, the
prototype has been running securely and stably, which shows that the stress field of this
design is also reasonable.
Overall, the results of the prototype test show that the SPM prototype meets the con‐
straints of multi‐physics fields, including the stress field, electromagnetic field and tem‐
perature field.
Figure 26. Prototype test results.
7. Conclusions
In this paper, the comprehensive performance of SPM and IPM rotor structures is
compared and analyzed based on multiple physical fields, including rotor stress, the elec‐
tromagnetic field and the temperature field. The two different rotor structures are ana‐
lyzed and compared by multi‐physical finite element models. The results show that the
SPM rotor structure satisfies all the multi‐physics constraints. The following conclusions
can be drawn from the results of simulation and experiment:
Figure 25. Prototype photo.
Machines 2022, 10, x FOR PEER REVIEW 19 of 21
Based on the above multi‐physics comparative analysis, the SPM motor can satisfy
the constraints of each field, including stress‐field constraints, electromagnetic field con‐
straints and temperature‐field constraints. Therefore, a prototype of SPM rotor structure
for 60 kW and 30,000 rpm was selected and manufactured, as shown in Figure 25.
Figure 25. Prototype photo.
In addition, the electromagnetic characteristics and temperature distribution of the
SPM prototype were tested. The test results are shown in Figure 26. The no‐load back‐
EMF test result of the prototype is 534 V while the calculated value is 538 V, with an error
of 0.7%. The test result of the stator winding temperature of the prototype is 70.9 °C while
the calculated value is 71.7 °C; the error is 1.1%. The total loss of the prototype is 3120 W,
which is close to the calculated result. It is obvious that the experimental results of the
electromagnetic field and temperature field are in good agreement with the simulation
results. Besides, the prototype was operated at 30,000 rpm for 3 h. During this period, the
prototype has been running securely and stably, which shows that the stress field of this
design is also reasonable.
Overall, the results of the prototype test show that the SPM prototype meets the con‐
straints of multi‐physics fields, including the stress field, electromagnetic field and tem‐
perature field.
Figure 26. Prototype test results.
7. Conclusions
In this paper, the comprehensive performance of SPM and IPM rotor structures is
compared and analyzed based on multiple physical fields, including rotor stress, the elec‐
tromagnetic field and the temperature field. The two different rotor structures are ana‐
lyzed and compared by multi‐physical finite element models. The results show that the
SPM rotor structure satisfies all the multi‐physics constraints. The following conclusions
can be drawn from the results of simulation and experiment:
Figure 26. Prototype test results.
Overall, the results of the prototype test show that the SPM prototype meets theconstraints of multi-physics fields, including the stress field, electromagnetic field andtemperature field.
7. Conclusions
In this paper, the comprehensive performance of SPM and IPM rotor structures iscompared and analyzed based on multiple physical fields, including rotor stress, theelectromagnetic field and the temperature field. The two different rotor structures areanalyzed and compared by multi-physical finite element models. The results show that theSPM rotor structure satisfies all the multi-physics constraints. The following conclusionscan be drawn from the results of simulation and experiment:
1. For the rotor stress analysis and comparison, both rotor structures meet the stressconstraints, but the IPM has a small margin. As the sleeve thickness of SPM increases,the equivalent stress of the sleeve and the tangential stress of PM decrease. Whenthe sleeve thickness is 5 mm, the sleeve stress is 596 MPa, while the yield strength ofthe carbon-fiber sleeve is 1960 MPa. The IPM structure has a conflict between rotorflux leakage and rotor stress. The traditional radial structure cannot meet the stressconstraints. When the thickness of the magnetic bridge is 3.5 mm, the rotor stress is1690 MPa, which is much larger than the yield strength of the rotor corn of 480 MPa.Dividing the PM into two sections and adding a stiffener can effectively reduce the rotor

Machines 2022, 10, 700 19 of 20
stress. When the stiffener thickness is 2.8 mm, the leakage flux factor is as high as 1.72,and the rotor stress is 430 MPa, which is close to the yield strength of the rotor core.
2. For the electromagnetic field analysis and comparison, the loss of the two rotorstructures is quite different, and the performance of other aspects is similar. Comparedwith IPM, the line back-EMF and air-gap flux density waveforms of SPM are closer tosine waves. The torque of SPM is slightly greater than that of IPM. In addition, therotor loss of IPM is 532 W while the rotor loss of SPM is 31 W. The stator core loss ofIPM is 1149 W while the stator core loss of SPM is 863 W.
3. For the temperature-field analysis comparison, the temperature difference of therotor part is larger than that of the stator part for the two rotor structures. The statortemperature of SPM is 66.6 ◦C while the stator temperature of IPM is 79.9 ◦C. The rotortemperature of SPM is 98 ◦C due to the poor thermal conductivity of the carbon-fibersleeve. Although the IPM rotor structure has better heat dissipation performance,the rotor temperature is as high as 194 ◦C due to large losses. The IPM temperaturedistribution does not satisfy the temperature-field constraints.
Author Contributions: Conceptualization, G.D. and Q.Z.; Data curation, G.D. and N.L.; Formal analysis,N.L.; Funding acquisition, G.D.; Investigation, G.D. and N.L.; Methodology, G.D. and N.L.; Projectadministration, G.D.; Resources, G.D.; Software, N.L.; Supervision, Q.Z.; Validation, G.D., Q.Z., W.G.,L.W. and T.P.; Visualization, N.L.; Writing—original draft, N.L.; Writing—review and editing, G.D., N.L.,W.G., L.W. and T.P. All authors have read and agreed to the published version of the manuscript.
Funding: This research was funded by National Nature Science Foundation of China, grant number52177056.
Institutional Review Board Statement: Not applicable.
Informed Consent Statement: Not applicable.
Data Availability Statement: Not applicable.
Conflicts of Interest: The authors declare no conflict of interest.
References1. Du, G.H.; Huang, N.; He, H.C.; Lei, G.; Zhu, J.G. Parameter Design for a High-Speed Permanent Magnet Machine Under
Multiphysics Constraints. IEEE Trans. Energy Convers. 2020, 35, 2025–2035. [CrossRef]2. Hou, P.; Ge, B.J.; Tao, D.J.; Pan, B.; Wang, Y. Rotor Strength Analysis of FeCo-Based Permanent Magnet High Speed Motor.
Machines 2022, 10, 462. [CrossRef]3. Qi, Z.N.; Zhang, Y.; Yu, S.Y.; Xu, Z.Y. Design and Analysis of a 30 KW, 30,000 r/Min High-Speed Permanent Magnet Motor for
Compressor Application. Energies 2022, 15, 3923. [CrossRef]4. Lin, Y.Z.; Huang, Y.K.; Zhang, T. Comprehensive Design and Analysis of Rotor Stress for HSPMM Considering Cooling Method.
Machines 2022, 10, 475. [CrossRef]5. Hong, J.F.; Wang, S.M.; Yang, Z.L. Comparison of Electromagnetic Excited Vibration for SPM and IPM Motors. In Proceed-
ings of the 2017 19th European Conference on Power Electronics and Applications (EPE’17 ECCE Europe), Warsaw, Poland,11–14 September 2017; IEEE: Piscataway, NJ, USA, 2017; pp. 1–8.
6. Pellegrino, G.; Vagati, A.; Guglielmi, P.; Boazzo, B. Performance Comparison Between Surface-Mounted and Interior PM MotorDrives for Electric Vehicle Application. IEEE Trans. Ind. Electron. 2012, 59, 803–811. [CrossRef]
7. Ahn, J.H.; Han, C.; Kim, C.W.; Choi, J.Y. Rotor Design of High-Speed Permanent Magnet Synchronous Motors Considering RotorMagnet and Sleeve Materials. IEEE Trans. Appl. Supercond. 2018, 28, 5201504. [CrossRef]
8. Chu, G.Y.; Dutta, R.; Rahman, M.F.; Lovatt, H.; Sarlioglu, B. Analytical Calculation of Maximum Mechanical Stress on the Rotorof Interior Permanent-Magnet Synchronous Machines. IEEE Trans. Ind. Appl. 2020, 56, 1321–1331. [CrossRef]
9. Du, G.H.; Xu, W.; Zhu, J.G.; Huang, N. Rotor Stress Analysis for High-Speed Permanent Magnet Machines Considering AssemblyGap and Temperature Gradient. IEEE Trans. Energy Convers. 2019, 34, 2276–2285. [CrossRef]
10. Du, G.H.; Xu, W.; Huang, N.; Cheng, X.; Xiao, X.Y. Rotor Design of High Power High Speed Permanent Magnet MachineConsidering Multiphysics Constraints. In Proceedings of the 2019 22nd International Conference on Electrical Machines andSystems (ICEMS), Harbin, China, 11–14 August 2019; pp. 1–5.
11. Li, W.L.; Qiu, H.B.; Zhang, X.C.; Cao, J.C.; Zhang, S.N.; Yi, R. Influence of Rotor-Sleeve Electromagnetic Characteristics onHigh-Speed Permanent-Magnet Generator. IEEE Trans. Ind. Electron. 2014, 61, 3030–3037. [CrossRef]

Machines 2022, 10, 700 20 of 20
12. Wang, L.; Du, G.H.; Tong, J.; Huang, N.; Hu, C.S.; Xu, W. Comparation of Different Rotor Sleeves of Highspeed Permanent MagnetSynchronous Motors Based on Multi-Physics. In Proceedings of the 2021 IEEE 4th Student Conference on Electric Machines andSystems (SCEMS), Huzhou, China, 1–3 December 2021; IEEE: Piscataway, NJ, USA, 2021; pp. 1–5.
13. Xia, Y.; Li, J.; Qu, R.H.; Fang, H.Y. Comparison of Two Rotor Topologies for High-Speed Permanent Magnet SynchronousMachines. In Proceedings of the 2016 XXII International Conference on Electrical Machines (ICEM), Lausanne, Switzerland,4–7 September 2016; IEEE: Piscataway, NJ, USA, 2016; pp. 1419–1425.
14. Liu, X.P.; Zhang, Z.X.; Xiao, J.J.; Xu, H. Comparison and Analysis of Electromagnetic Characteristics of IPMSM with Single andDouble Layer PMs. JAE 2018, 58, 483–496. [CrossRef]
15. Yang, Y.Y.; Castano, S.; Yang, R.; Kasprzak, M.; Bilgin, B.; Sathyan, A.; Dadkhah, H.; Emadi, A. Design and Comparison of InteriorPermanent Magnet Motor Topologies for Traction Applications. IEEE Trans. Transp. Electrif. 2017, 3, 86–97. [CrossRef]
16. Kim, S.I.; Kim, Y.K.; Lee, G.H.; Hong, J.P. A Novel Rotor Configuration and Experimental Verification of Interior PM SynchronousMotor for High-Speed Applications. IEEE Trans. Magn. 2012, 48, 843–846. [CrossRef]
17. Dong, J.N.; Huang, Y.K.; Jin, L.; Lin, H.Y. Comparative Study of Surface-Mounted and Interior Permanent-Magnet Motors forHigh-Speed Applications. IEEE Trans. Appl. Supercond. 2016, 26, 5200304. [CrossRef]
18. Zhao, N.N.; Liu, W.G. Loss Calculation and Thermal Analysis of Surface-Mounted PM Motor and Interior PM Motor. IEEE Trans.Magn. 2015, 51, 8112604. [CrossRef]
19. Tao, P.; Du, G.H.; Tong, J.; Huang, N.; Li, N.M.; Xu, W. Comparison of Rotor Strength of Various Rotor Structures for Ultra-High-Speed Permanent Magnet Synchronous Motor. In Proceedings of the 2021 IEEE 4th Student Conference on Electric Machines andSystems (SCEMS), Huzhou, China, 1–3 December 2021; IEEE: Piscataway, NJ, USA, 2021; pp. 1–6.
20. Fang, H.Y.; Li, D.W.; Qu, R.H.; Li, J.; Wang, C.; Song, B. Rotor Design and Eddy-Current Loss Suppression for High-SpeedMachines with a Solid-PM Rotor. IEEE Trans. Ind. Applicat. 2019, 55, 448–457. [CrossRef]