Mule cognition: a case of hybrid vigour
10
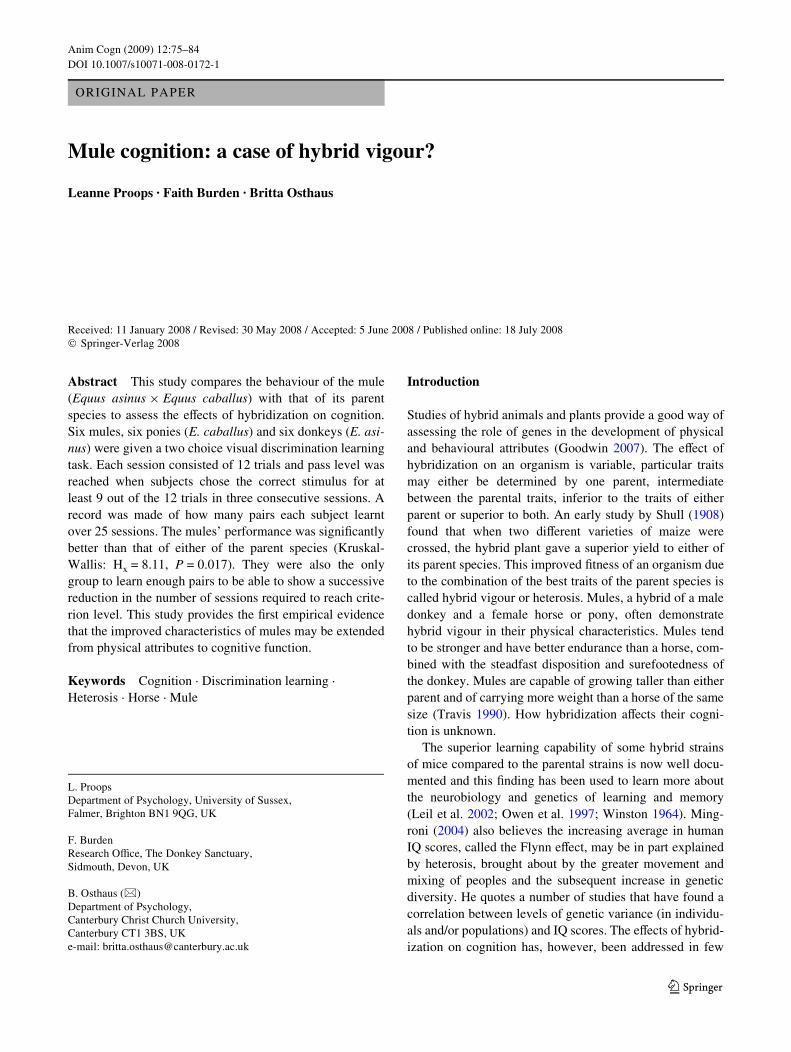
Anim Cogn (2009) 12:75–84 DOI 10.1007/s10071-008-0172-1 123 ORIGINAL PAPER Mule cognition: a case of hybrid vigour? Leanne Proops · Faith Burden · Britta Osthaus Received: 11 January 2008 / Revised: 30 May 2008 / Accepted: 5 June 2008 / Published online: 18 July 2008 © Springer-Verlag 2008 Abstract This study compares the behaviour of the mule (Equus asinus £ Equus caballus) with that of its parent species to assess the eVects of hybridization on cognition. Six mules, six ponies (E. caballus) and six donkeys (E. asi- nus) were given a two choice visual discrimination learning task. Each session consisted of 12 trials and pass level was reached when subjects chose the correct stimulus for at least 9 out of the 12 trials in three consecutive sessions. A record was made of how many pairs each subject learnt over 25 sessions. The mules’ performance was signiWcantly better than that of either of the parent species (Kruskal- Wallis: H x = 8.11, P = 0.017). They were also the only group to learn enough pairs to be able to show a successive reduction in the number of sessions required to reach crite- rion level. This study provides the Wrst empirical evidence that the improved characteristics of mules may be extended from physical attributes to cognitive function. Keywords Cognition · Discrimination learning · Heterosis · Horse · Mule Introduction Studies of hybrid animals and plants provide a good way of assessing the role of genes in the development of physical and behavioural attributes (Goodwin 2007). The eVect of hybridization on an organism is variable, particular traits may either be determined by one parent, intermediate between the parental traits, inferior to the traits of either parent or superior to both. An early study by Shull (1908) found that when two diVerent varieties of maize were crossed, the hybrid plant gave a superior yield to either of its parent species. This improved Wtness of an organism due to the combination of the best traits of the parent species is called hybrid vigour or heterosis. Mules, a hybrid of a male donkey and a female horse or pony, often demonstrate hybrid vigour in their physical characteristics. Mules tend to be stronger and have better endurance than a horse, com- bined with the steadfast disposition and surefootedness of the donkey. Mules are capable of growing taller than either parent and of carrying more weight than a horse of the same size (Travis 1990). How hybridization aVects their cogni- tion is unknown. The superior learning capability of some hybrid strains of mice compared to the parental strains is now well docu- mented and this Wnding has been used to learn more about the neurobiology and genetics of learning and memory (Leil et al. 2002; Owen et al. 1997; Winston 1964). Ming- roni (2004) also believes the increasing average in human IQ scores, called the Flynn eVect, may be in part explained by heterosis, brought about by the greater movement and mixing of peoples and the subsequent increase in genetic diversity. He quotes a number of studies that have found a correlation between levels of genetic variance (in individu- als and/or populations) and IQ scores. The eVects of hybrid- ization on cognition has, however, been addressed in few L. Proops Department of Psychology, University of Sussex, Falmer, Brighton BN1 9QG, UK F. Burden Research OYce, The Donkey Sanctuary, Sidmouth, Devon, UK B. Osthaus (&) Department of Psychology, Canterbury Christ Church University, Canterbury CT1 3BS, UK e-mail: [email protected]
-
Upload
canterbury -
Category
Documents
-
view
1 -
download
0
Transcript of Mule cognition: a case of hybrid vigour
Anim Cogn (2009) 12:75–84
DOI 10.1007/s10071-008-0172-1ORIGINAL PAPER
Mule cognition: a case of hybrid vigour?
Leanne Proops · Faith Burden · Britta Osthaus
Received: 11 January 2008 / Revised: 30 May 2008 / Accepted: 5 June 2008 / Published online: 18 July 2008© Springer-Verlag 2008
Abstract This study compares the behaviour of the mule(Equus asinus £ Equus caballus) with that of its parentspecies to assess the eVects of hybridization on cognition.Six mules, six ponies (E. caballus) and six donkeys (E. asi-nus) were given a two choice visual discrimination learningtask. Each session consisted of 12 trials and pass level wasreached when subjects chose the correct stimulus for atleast 9 out of the 12 trials in three consecutive sessions. Arecord was made of how many pairs each subject learntover 25 sessions. The mules’ performance was signiWcantlybetter than that of either of the parent species (Kruskal-Wallis: Hx = 8.11, P = 0.017). They were also the onlygroup to learn enough pairs to be able to show a successivereduction in the number of sessions required to reach crite-rion level. This study provides the Wrst empirical evidencethat the improved characteristics of mules may be extendedfrom physical attributes to cognitive function.
Keywords Cognition · Discrimination learning · Heterosis · Horse · Mule
Introduction
Studies of hybrid animals and plants provide a good way ofassessing the role of genes in the development of physicaland behavioural attributes (Goodwin 2007). The eVect ofhybridization on an organism is variable, particular traitsmay either be determined by one parent, intermediatebetween the parental traits, inferior to the traits of eitherparent or superior to both. An early study by Shull (1908)found that when two diVerent varieties of maize werecrossed, the hybrid plant gave a superior yield to either ofits parent species. This improved Wtness of an organism dueto the combination of the best traits of the parent species iscalled hybrid vigour or heterosis. Mules, a hybrid of a maledonkey and a female horse or pony, often demonstratehybrid vigour in their physical characteristics. Mules tendto be stronger and have better endurance than a horse, com-bined with the steadfast disposition and surefootedness ofthe donkey. Mules are capable of growing taller than eitherparent and of carrying more weight than a horse of the samesize (Travis 1990). How hybridization aVects their cogni-tion is unknown.
The superior learning capability of some hybrid strainsof mice compared to the parental strains is now well docu-mented and this Wnding has been used to learn more aboutthe neurobiology and genetics of learning and memory(Leil et al. 2002; Owen et al. 1997; Winston 1964). Ming-roni (2004) also believes the increasing average in humanIQ scores, called the Flynn eVect, may be in part explainedby heterosis, brought about by the greater movement andmixing of peoples and the subsequent increase in geneticdiversity. He quotes a number of studies that have found acorrelation between levels of genetic variance (in individu-als and/or populations) and IQ scores. The eVects of hybrid-ization on cognition has, however, been addressed in few
L. ProopsDepartment of Psychology, University of Sussex, Falmer, Brighton BN1 9QG, UK
F. BurdenResearch OYce, The Donkey Sanctuary, Sidmouth, Devon, UK
B. Osthaus (&)Department of Psychology, Canterbury Christ Church University, Canterbury CT1 3BS, UKe-mail: [email protected]
123
76 Anim Cogn (2009) 12:75–84
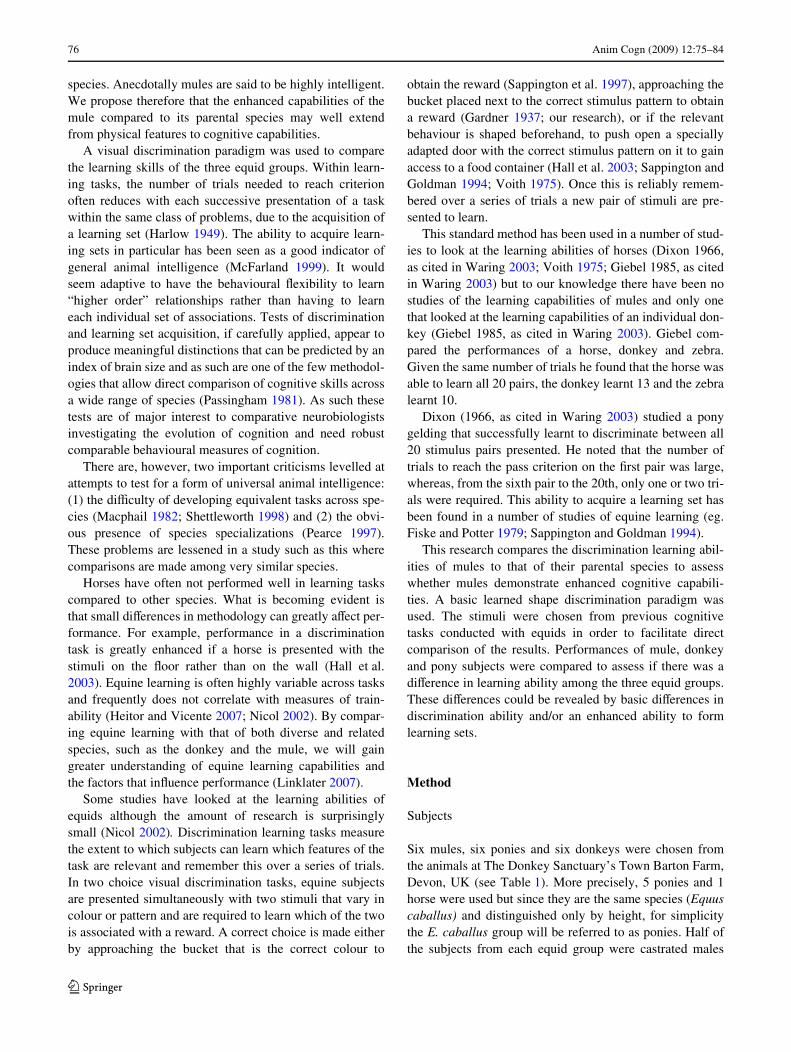
species. Anecdotally mules are said to be highly intelligent.We propose therefore that the enhanced capabilities of themule compared to its parental species may well extendfrom physical features to cognitive capabilities.
A visual discrimination paradigm was used to comparethe learning skills of the three equid groups. Within learn-ing tasks, the number of trials needed to reach criterionoften reduces with each successive presentation of a taskwithin the same class of problems, due to the acquisition ofa learning set (Harlow 1949). The ability to acquire learn-ing sets in particular has been seen as a good indicator ofgeneral animal intelligence (McFarland 1999). It wouldseem adaptive to have the behavioural Xexibility to learn“higher order” relationships rather than having to learneach individual set of associations. Tests of discriminationand learning set acquisition, if carefully applied, appear toproduce meaningful distinctions that can be predicted by anindex of brain size and as such are one of the few methodol-ogies that allow direct comparison of cognitive skills acrossa wide range of species (Passingham 1981). As such thesetests are of major interest to comparative neurobiologistsinvestigating the evolution of cognition and need robustcomparable behavioural measures of cognition.
There are, however, two important criticisms levelled atattempts to test for a form of universal animal intelligence:(1) the diYculty of developing equivalent tasks across spe-cies (Macphail 1982; Shettleworth 1998) and (2) the obvi-ous presence of species specializations (Pearce 1997).These problems are lessened in a study such as this wherecomparisons are made among very similar species.
Horses have often not performed well in learning taskscompared to other species. What is becoming evident isthat small diVerences in methodology can greatly aVect per-formance. For example, performance in a discriminationtask is greatly enhanced if a horse is presented with thestimuli on the Xoor rather than on the wall (Hall et al.2003). Equine learning is often highly variable across tasksand frequently does not correlate with measures of train-ability (Heitor and Vicente 2007; Nicol 2002). By compar-ing equine learning with that of both diverse and relatedspecies, such as the donkey and the mule, we will gaingreater understanding of equine learning capabilities andthe factors that inXuence performance (Linklater 2007).
Some studies have looked at the learning abilities ofequids although the amount of research is surprisinglysmall (Nicol 2002). Discrimination learning tasks measurethe extent to which subjects can learn which features of thetask are relevant and remember this over a series of trials.In two choice visual discrimination tasks, equine subjectsare presented simultaneously with two stimuli that vary incolour or pattern and are required to learn which of the twois associated with a reward. A correct choice is made eitherby approaching the bucket that is the correct colour to
obtain the reward (Sappington et al. 1997), approaching thebucket placed next to the correct stimulus pattern to obtaina reward (Gardner 1937; our research), or if the relevantbehaviour is shaped beforehand, to push open a speciallyadapted door with the correct stimulus pattern on it to gainaccess to a food container (Hall et al. 2003; Sappington andGoldman 1994; Voith 1975). Once this is reliably remem-bered over a series of trials a new pair of stimuli are pre-sented to learn.
This standard method has been used in a number of stud-ies to look at the learning abilities of horses (Dixon 1966,as cited in Waring 2003; Voith 1975; Giebel 1985, as citedin Waring 2003) but to our knowledge there have been nostudies of the learning capabilities of mules and only onethat looked at the learning capabilities of an individual don-key (Giebel 1985, as cited in Waring 2003). Giebel com-pared the performances of a horse, donkey and zebra.Given the same number of trials he found that the horse wasable to learn all 20 pairs, the donkey learnt 13 and the zebralearnt 10.
Dixon (1966, as cited in Waring 2003) studied a ponygelding that successfully learnt to discriminate between all20 stimulus pairs presented. He noted that the number oftrials to reach the pass criterion on the Wrst pair was large,whereas, from the sixth pair to the 20th, only one or two tri-als were required. This ability to acquire a learning set hasbeen found in a number of studies of equine learning (eg.Fiske and Potter 1979; Sappington and Goldman 1994).
This research compares the discrimination learning abil-ities of mules to that of their parental species to assesswhether mules demonstrate enhanced cognitive capabili-ties. A basic learned shape discrimination paradigm wasused. The stimuli were chosen from previous cognitivetasks conducted with equids in order to facilitate directcomparison of the results. Performances of mule, donkeyand pony subjects were compared to assess if there was adiVerence in learning ability among the three equid groups.These diVerences could be revealed by basic diVerences indiscrimination ability and/or an enhanced ability to formlearning sets.
Method
Subjects
Six mules, six ponies and six donkeys were chosen fromthe animals at The Donkey Sanctuary’s Town Barton Farm,Devon, UK (see Table 1). More precisely, 5 ponies and 1horse were used but since they are the same species (Equuscaballus) and distinguished only by height, for simplicitythe E. caballus group will be referred to as ponies. Half ofthe subjects from each equid group were castrated males
123
Anim Cogn (2009) 12:75–84 77
and half were female. Animals from the three equid groupswere all in good health, with no visual problems; they werematched for age as far as possible and otherwise chosenrandomly. Ages ranged from 12 to 30 with a mean age of18.00 § 5.10 for the mules, 20.17 § 3.87 for the poniesand 22.00 § 6.42 for the donkeys. Subjects were kept inone of four groups containing between 12 and 35 individu-als. Most of the subjects were kept in mixed equid groups,with one donkey being kept in an all donkey group and twomules being kept in an all mule group. Groups were housedin large barns where hay and straw were provided ad libi-tum and access was given to grazing for 2–5 h daily. Thesubjects were not food deprived for the experiments andwere brought to the test area from the Weld or indoor barnwhen required. Only animals that were accustomed to feed-ing from buckets and showed no separation anxiety whenbrought to the test area were included in the study. None ofthe subjects showed any stereotypies and all behaviourobserved by the researchers and staV at the Donkey Sanctu-ary was normal. This is important because equids with ster-eotypic behaviour have been shown to have impairedlearning rates and higher perseveration rates compared tohealthy controls (Hemmings et al. 2007; Parker et al. 2008).
Subject histories
This research discusses whether any diVerences in perfor-mance among the equid groups is likely to be due to geneticdiVerences and as such it is important to rule out diVerencesin training and exposure to people. Since these subjectswere rescue animals not all of them have a complete historybut the extent of their training, if known, and the length oftime they had been at the sanctuary are detailed in Table 1.Those that have only had a basic training have never beenridden or driven (from a carriage) but can be halter lead.Some have been driven or ridden in the past but none of thesubjects were worked since arriving at the Donkey Sanctu-ary. While at the sanctuary animals are usually moved fromtheir inside enclosures to their grazing in herds and are onlyoccasionally caught to be groomed or for medical attention.Therefore, since the time of their arrival at the sanctuarythey have not received much direct exposure to humans orany focused training beyond making sure they can be han-dled.
Test area and apparatus
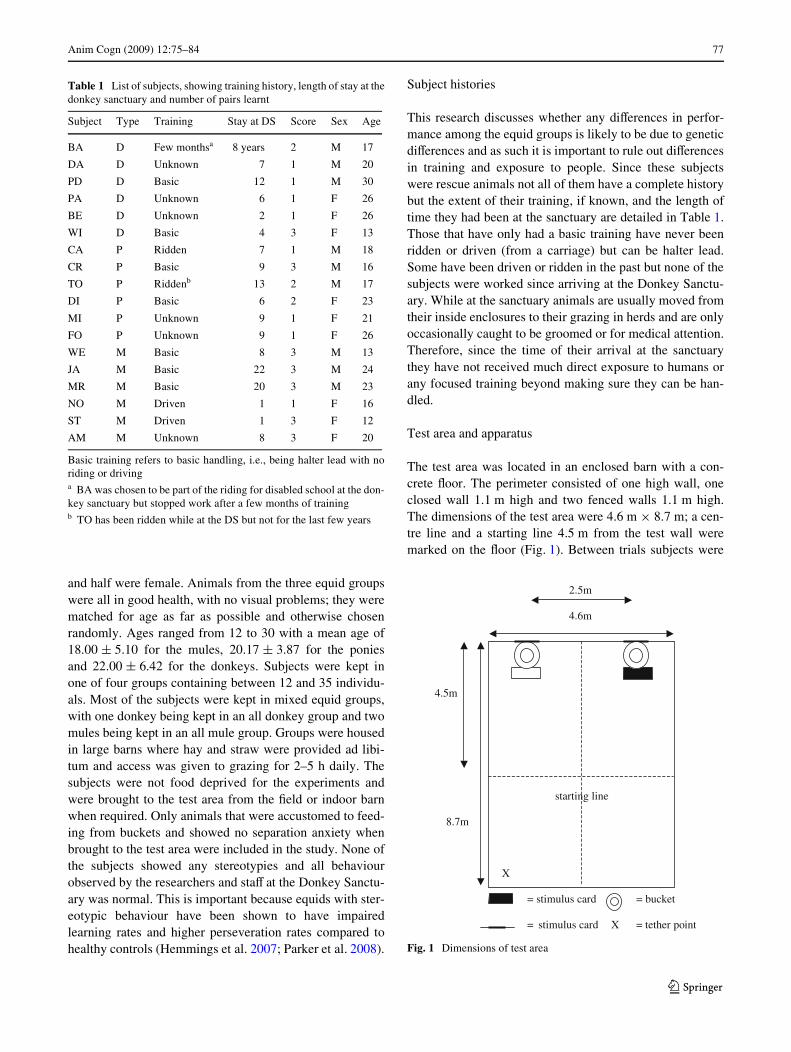
The test area was located in an enclosed barn with a con-crete Xoor. The perimeter consisted of one high wall, oneclosed wall 1.1 m high and two fenced walls 1.1 m high.The dimensions of the test area were 4.6 m £ 8.7 m; a cen-tre line and a starting line 4.5 m from the test wall weremarked on the Xoor (Fig. 1). Between trials subjects were
Table 1 List of subjects, showing training history, length of stay at thedonkey sanctuary and number of pairs learnt
Basic training refers to basic handling, i.e., being halter lead with noriding or drivinga BA was chosen to be part of the riding for disabled school at the don-key sanctuary but stopped work after a few months of trainingb TO has been ridden while at the DS but not for the last few years
Subject Type Training Stay at DS Score Sex Age
BA D Few monthsa 8 years 2 M 17
DA D Unknown 7 1 M 20
PD D Basic 12 1 M 30
PA D Unknown 6 1 F 26
BE D Unknown 2 1 F 26
WI D Basic 4 3 F 13
CA P Ridden 7 1 M 18
CR P Basic 9 3 M 16
TO P Riddenb 13 2 M 17
DI P Basic 6 2 F 23
MI P Unknown 9 1 F 21
FO P Unknown 9 1 F 26
WE M Basic 8 3 M 13
JA M Basic 22 3 M 24
MR M Basic 20 3 M 23
NO M Driven 1 1 F 16
ST M Driven 1 3 F 12
AM M Unknown 8 3 F 20
Fig. 1 Dimensions of test area
2.5m
4.6m
4.5m
starting line
8.7m
X
= stimulus card = bucket
= stimulus card X = tether point
123
78 Anim Cogn (2009) 12:75–84
tethered at point X. Buckets were placed 1.25 m each sideof the longitudinal centre line, 0.30 m from the back fence.
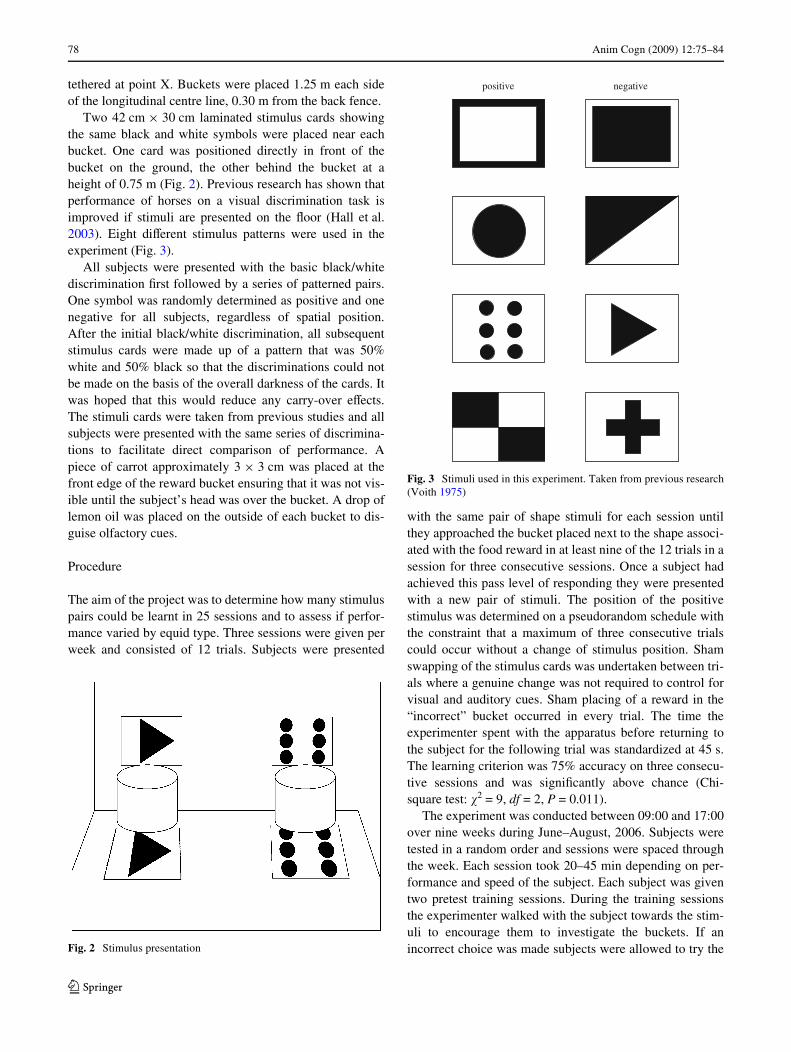
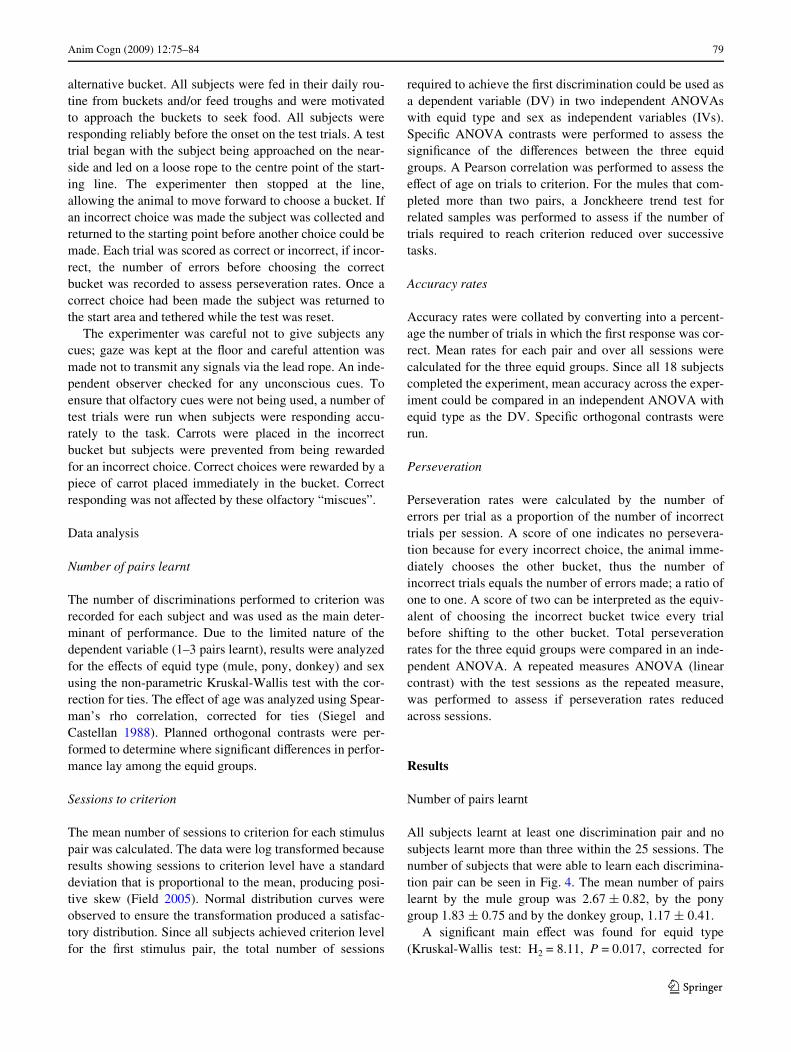
Two 42 cm £ 30 cm laminated stimulus cards showingthe same black and white symbols were placed near eachbucket. One card was positioned directly in front of thebucket on the ground, the other behind the bucket at aheight of 0.75 m (Fig. 2). Previous research has shown thatperformance of horses on a visual discrimination task isimproved if stimuli are presented on the Xoor (Hall et al.2003). Eight diVerent stimulus patterns were used in theexperiment (Fig. 3).
All subjects were presented with the basic black/whitediscrimination Wrst followed by a series of patterned pairs.One symbol was randomly determined as positive and onenegative for all subjects, regardless of spatial position.After the initial black/white discrimination, all subsequentstimulus cards were made up of a pattern that was 50%white and 50% black so that the discriminations could notbe made on the basis of the overall darkness of the cards. Itwas hoped that this would reduce any carry-over eVects.The stimuli cards were taken from previous studies and allsubjects were presented with the same series of discrimina-tions to facilitate direct comparison of performance. Apiece of carrot approximately 3 £ 3 cm was placed at thefront edge of the reward bucket ensuring that it was not vis-ible until the subject’s head was over the bucket. A drop oflemon oil was placed on the outside of each bucket to dis-guise olfactory cues.
Procedure
The aim of the project was to determine how many stimuluspairs could be learnt in 25 sessions and to assess if perfor-mance varied by equid type. Three sessions were given perweek and consisted of 12 trials. Subjects were presented
with the same pair of shape stimuli for each session untilthey approached the bucket placed next to the shape associ-ated with the food reward in at least nine of the 12 trials in asession for three consecutive sessions. Once a subject hadachieved this pass level of responding they were presentedwith a new pair of stimuli. The position of the positivestimulus was determined on a pseudorandom schedule withthe constraint that a maximum of three consecutive trialscould occur without a change of stimulus position. Shamswapping of the stimulus cards was undertaken between tri-als where a genuine change was not required to control forvisual and auditory cues. Sham placing of a reward in the“incorrect” bucket occurred in every trial. The time theexperimenter spent with the apparatus before returning tothe subject for the following trial was standardized at 45 s.The learning criterion was 75% accuracy on three consecu-tive sessions and was signiWcantly above chance (Chi-square test: �2 = 9, df = 2, P = 0.011).
The experiment was conducted between 09:00 and 17:00over nine weeks during June–August, 2006. Subjects weretested in a random order and sessions were spaced throughthe week. Each session took 20–45 min depending on per-formance and speed of the subject. Each subject was giventwo pretest training sessions. During the training sessionsthe experimenter walked with the subject towards the stim-uli to encourage them to investigate the buckets. If anincorrect choice was made subjects were allowed to try theFig. 2 Stimulus presentation
Fig. 3 Stimuli used in this experiment. Taken from previous research(Voith 1975)
positive negative
123
Anim Cogn (2009) 12:75–84 79
alternative bucket. All subjects were fed in their daily rou-tine from buckets and/or feed troughs and were motivatedto approach the buckets to seek food. All subjects wereresponding reliably before the onset on the test trials. A testtrial began with the subject being approached on the near-side and led on a loose rope to the centre point of the start-ing line. The experimenter then stopped at the line,allowing the animal to move forward to choose a bucket. Ifan incorrect choice was made the subject was collected andreturned to the starting point before another choice could bemade. Each trial was scored as correct or incorrect, if incor-rect, the number of errors before choosing the correctbucket was recorded to assess perseveration rates. Once acorrect choice had been made the subject was returned tothe start area and tethered while the test was reset.
The experimenter was careful not to give subjects anycues; gaze was kept at the Xoor and careful attention wasmade not to transmit any signals via the lead rope. An inde-pendent observer checked for any unconscious cues. Toensure that olfactory cues were not being used, a number oftest trials were run when subjects were responding accu-rately to the task. Carrots were placed in the incorrectbucket but subjects were prevented from being rewardedfor an incorrect choice. Correct choices were rewarded by apiece of carrot placed immediately in the bucket. Correctresponding was not aVected by these olfactory “miscues”.
Data analysis
Number of pairs learnt
The number of discriminations performed to criterion wasrecorded for each subject and was used as the main deter-minant of performance. Due to the limited nature of thedependent variable (1–3 pairs learnt), results were analyzedfor the eVects of equid type (mule, pony, donkey) and sexusing the non-parametric Kruskal-Wallis test with the cor-rection for ties. The eVect of age was analyzed using Spear-man’s rho correlation, corrected for ties (Siegel andCastellan 1988). Planned orthogonal contrasts were per-formed to determine where signiWcant diVerences in perfor-mance lay among the equid groups.
Sessions to criterion
The mean number of sessions to criterion for each stimuluspair was calculated. The data were log transformed becauseresults showing sessions to criterion level have a standarddeviation that is proportional to the mean, producing posi-tive skew (Field 2005). Normal distribution curves wereobserved to ensure the transformation produced a satisfac-tory distribution. Since all subjects achieved criterion levelfor the Wrst stimulus pair, the total number of sessions
required to achieve the Wrst discrimination could be used asa dependent variable (DV) in two independent ANOVAswith equid type and sex as independent variables (IVs).SpeciWc ANOVA contrasts were performed to assess thesigniWcance of the diVerences between the three equidgroups. A Pearson correlation was performed to assess theeVect of age on trials to criterion. For the mules that com-pleted more than two pairs, a Jonckheere trend test forrelated samples was performed to assess if the number oftrials required to reach criterion reduced over successivetasks.
Accuracy rates
Accuracy rates were collated by converting into a percent-age the number of trials in which the Wrst response was cor-rect. Mean rates for each pair and over all sessions werecalculated for the three equid groups. Since all 18 subjectscompleted the experiment, mean accuracy across the exper-iment could be compared in an independent ANOVA withequid type as the DV. SpeciWc orthogonal contrasts wererun.
Perseveration
Perseveration rates were calculated by the number oferrors per trial as a proportion of the number of incorrecttrials per session. A score of one indicates no persevera-tion because for every incorrect choice, the animal imme-diately chooses the other bucket, thus the number ofincorrect trials equals the number of errors made; a ratio ofone to one. A score of two can be interpreted as the equiv-alent of choosing the incorrect bucket twice every trialbefore shifting to the other bucket. Total perseverationrates for the three equid groups were compared in an inde-pendent ANOVA. A repeated measures ANOVA (linearcontrast) with the test sessions as the repeated measure,was performed to assess if perseveration rates reducedacross sessions.
Results
Number of pairs learnt
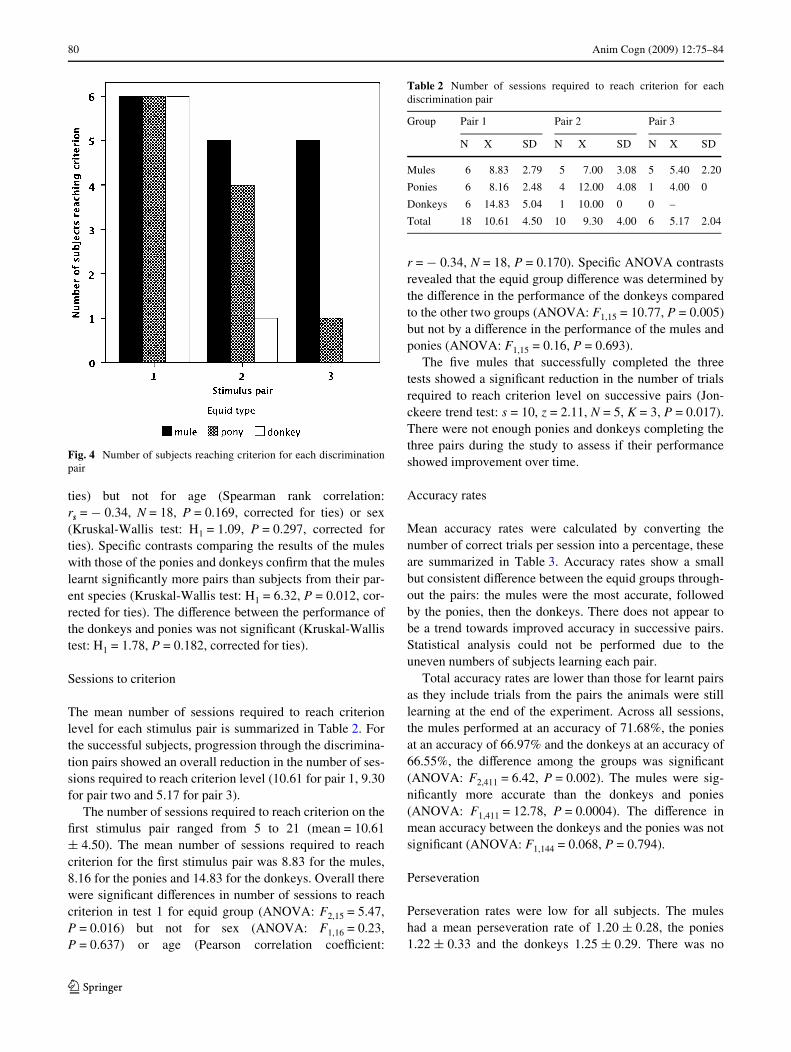
All subjects learnt at least one discrimination pair and nosubjects learnt more than three within the 25 sessions. Thenumber of subjects that were able to learn each discrimina-tion pair can be seen in Fig. 4. The mean number of pairslearnt by the mule group was 2.67 § 0.82, by the ponygroup 1.83 § 0.75 and by the donkey group, 1.17 § 0.41.
A signiWcant main eVect was found for equid type(Kruskal-Wallis test: H2 = 8.11, P = 0.017, corrected for
123
80 Anim Cogn (2009) 12:75–84
ties) but not for age (Spearman rank correlation:rs = ¡ 0.34, N = 18, P = 0.169, corrected for ties) or sex(Kruskal-Wallis test: H1 = 1.09, P = 0.297, corrected forties). SpeciWc contrasts comparing the results of the muleswith those of the ponies and donkeys conWrm that the muleslearnt signiWcantly more pairs than subjects from their par-ent species (Kruskal-Wallis test: H1 = 6.32, P = 0.012, cor-rected for ties). The diVerence between the performance ofthe donkeys and ponies was not signiWcant (Kruskal-Wallistest: H1 = 1.78, P = 0.182, corrected for ties).
Sessions to criterion
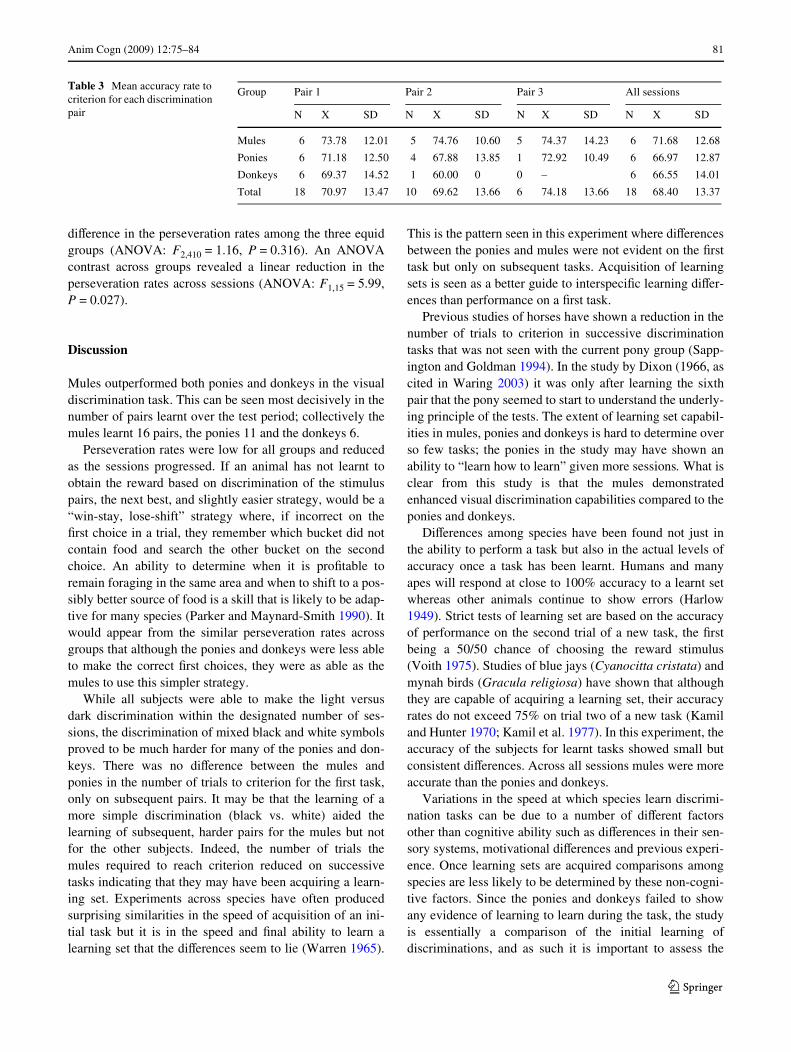
The mean number of sessions required to reach criterionlevel for each stimulus pair is summarized in Table 2. Forthe successful subjects, progression through the discrimina-tion pairs showed an overall reduction in the number of ses-sions required to reach criterion level (10.61 for pair 1, 9.30for pair two and 5.17 for pair 3).
The number of sessions required to reach criterion on theWrst stimulus pair ranged from 5 to 21 (mean = 10.61§ 4.50). The mean number of sessions required to reachcriterion for the Wrst stimulus pair was 8.83 for the mules,8.16 for the ponies and 14.83 for the donkeys. Overall therewere signiWcant diVerences in number of sessions to reachcriterion in test 1 for equid group (ANOVA: F2,15 = 5.47,P = 0.016) but not for sex (ANOVA: F1,16 = 0.23,P = 0.637) or age (Pearson correlation coeYcient:
r = ¡ 0.34, N = 18, P = 0.170). SpeciWc ANOVA contrastsrevealed that the equid group diVerence was determined bythe diVerence in the performance of the donkeys comparedto the other two groups (ANOVA: F1,15 = 10.77, P = 0.005)but not by a diVerence in the performance of the mules andponies (ANOVA: F1,15 = 0.16, P = 0.693).
The Wve mules that successfully completed the threetests showed a signiWcant reduction in the number of trialsrequired to reach criterion level on successive pairs (Jon-ckeere trend test: s = 10, z = 2.11, N = 5, K = 3, P = 0.017).There were not enough ponies and donkeys completing thethree pairs during the study to assess if their performanceshowed improvement over time.
Accuracy rates
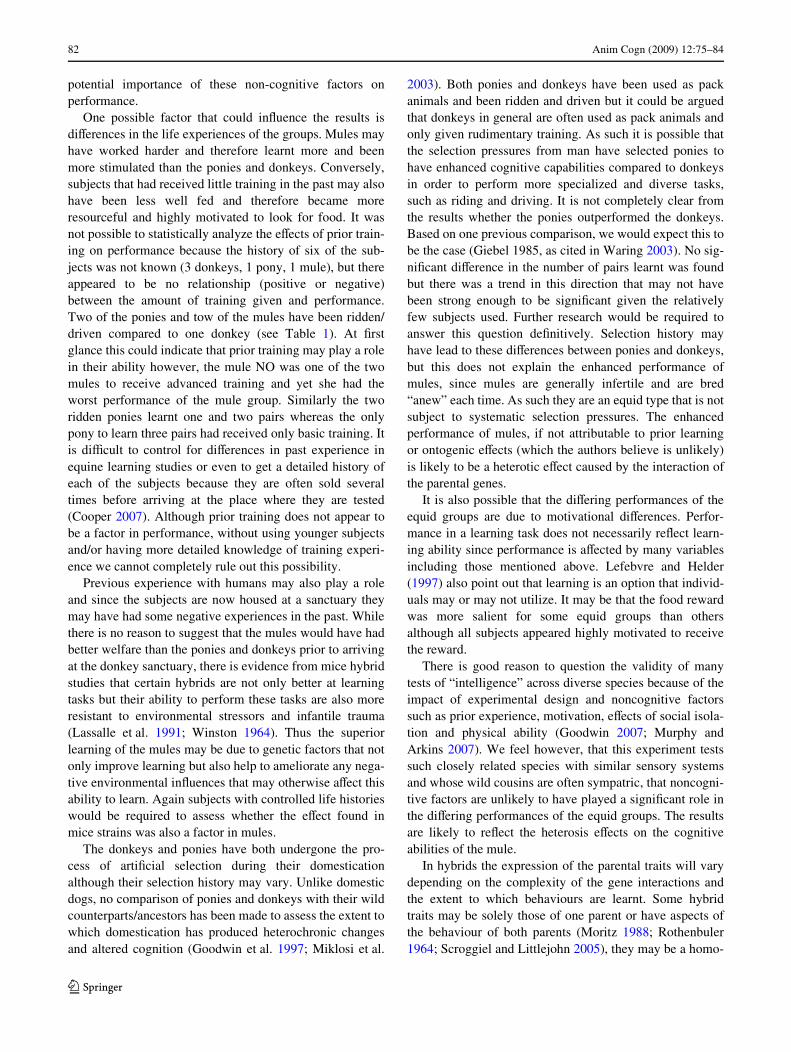
Mean accuracy rates were calculated by converting thenumber of correct trials per session into a percentage, theseare summarized in Table 3. Accuracy rates show a smallbut consistent diVerence between the equid groups through-out the pairs: the mules were the most accurate, followedby the ponies, then the donkeys. There does not appear tobe a trend towards improved accuracy in successive pairs.Statistical analysis could not be performed due to theuneven numbers of subjects learning each pair.
Total accuracy rates are lower than those for learnt pairsas they include trials from the pairs the animals were stilllearning at the end of the experiment. Across all sessions,the mules performed at an accuracy of 71.68%, the poniesat an accuracy of 66.97% and the donkeys at an accuracy of66.55%, the diVerence among the groups was signiWcant(ANOVA: F2,411 = 6.42, P = 0.002). The mules were sig-niWcantly more accurate than the donkeys and ponies(ANOVA: F1,411 = 12.78, P = 0.0004). The diVerence inmean accuracy between the donkeys and the ponies was notsigniWcant (ANOVA: F1,144 = 0.068, P = 0.794).
Perseveration
Perseveration rates were low for all subjects. The muleshad a mean perseveration rate of 1.20 § 0.28, the ponies1.22 § 0.33 and the donkeys 1.25 § 0.29. There was no
Fig. 4 Number of subjects reaching criterion for each discriminationpair
Table 2 Number of sessions required to reach criterion for eachdiscrimination pair
Group Pair 1 Pair 2 Pair 3
N X SD N X SD N X SD
Mules 6 8.83 2.79 5 7.00 3.08 5 5.40 2.20
Ponies 6 8.16 2.48 4 12.00 4.08 1 4.00 0
Donkeys 6 14.83 5.04 1 10.00 0 0 –
Total 18 10.61 4.50 10 9.30 4.00 6 5.17 2.04
123
Anim Cogn (2009) 12:75–84 81
diVerence in the perseveration rates among the three equidgroups (ANOVA: F2,410 = 1.16, P = 0.316). An ANOVAcontrast across groups revealed a linear reduction in theperseveration rates across sessions (ANOVA: F1,15 = 5.99,P = 0.027).
Discussion
Mules outperformed both ponies and donkeys in the visualdiscrimination task. This can be seen most decisively in thenumber of pairs learnt over the test period; collectively themules learnt 16 pairs, the ponies 11 and the donkeys 6.
Perseveration rates were low for all groups and reducedas the sessions progressed. If an animal has not learnt toobtain the reward based on discrimination of the stimuluspairs, the next best, and slightly easier strategy, would be a“win-stay, lose-shift” strategy where, if incorrect on theWrst choice in a trial, they remember which bucket did notcontain food and search the other bucket on the secondchoice. An ability to determine when it is proWtable toremain foraging in the same area and when to shift to a pos-sibly better source of food is a skill that is likely to be adap-tive for many species (Parker and Maynard-Smith 1990). Itwould appear from the similar perseveration rates acrossgroups that although the ponies and donkeys were less ableto make the correct Wrst choices, they were as able as themules to use this simpler strategy.
While all subjects were able to make the light versusdark discrimination within the designated number of ses-sions, the discrimination of mixed black and white symbolsproved to be much harder for many of the ponies and don-keys. There was no diVerence between the mules andponies in the number of trials to criterion for the Wrst task,only on subsequent pairs. It may be that the learning of amore simple discrimination (black vs. white) aided thelearning of subsequent, harder pairs for the mules but notfor the other subjects. Indeed, the number of trials themules required to reach criterion reduced on successivetasks indicating that they may have been acquiring a learn-ing set. Experiments across species have often producedsurprising similarities in the speed of acquisition of an ini-tial task but it is in the speed and Wnal ability to learn alearning set that the diVerences seem to lie (Warren 1965).
This is the pattern seen in this experiment where diVerencesbetween the ponies and mules were not evident on the Wrsttask but only on subsequent tasks. Acquisition of learningsets is seen as a better guide to interspeciWc learning diVer-ences than performance on a Wrst task.
Previous studies of horses have shown a reduction in thenumber of trials to criterion in successive discriminationtasks that was not seen with the current pony group (Sapp-ington and Goldman 1994). In the study by Dixon (1966, ascited in Waring 2003) it was only after learning the sixthpair that the pony seemed to start to understand the underly-ing principle of the tests. The extent of learning set capabil-ities in mules, ponies and donkeys is hard to determine overso few tasks; the ponies in the study may have shown anability to “learn how to learn” given more sessions. What isclear from this study is that the mules demonstratedenhanced visual discrimination capabilities compared to theponies and donkeys.
DiVerences among species have been found not just inthe ability to perform a task but also in the actual levels ofaccuracy once a task has been learnt. Humans and manyapes will respond at close to 100% accuracy to a learnt setwhereas other animals continue to show errors (Harlow1949). Strict tests of learning set are based on the accuracyof performance on the second trial of a new task, the Wrstbeing a 50/50 chance of choosing the reward stimulus(Voith 1975). Studies of blue jays (Cyanocitta cristata) andmynah birds (Gracula religiosa) have shown that althoughthey are capable of acquiring a learning set, their accuracyrates do not exceed 75% on trial two of a new task (Kamiland Hunter 1970; Kamil et al. 1977). In this experiment, theaccuracy of the subjects for learnt tasks showed small butconsistent diVerences. Across all sessions mules were moreaccurate than the ponies and donkeys.
Variations in the speed at which species learn discrimi-nation tasks can be due to a number of diVerent factorsother than cognitive ability such as diVerences in their sen-sory systems, motivational diVerences and previous experi-ence. Once learning sets are acquired comparisons amongspecies are less likely to be determined by these non-cogni-tive factors. Since the ponies and donkeys failed to showany evidence of learning to learn during the task, the studyis essentially a comparison of the initial learning ofdiscriminations, and as such it is important to assess the
Table 3 Mean accuracy rate to criterion for each discrimination pair
Group Pair 1 Pair 2 Pair 3 All sessions
N X SD N X SD N X SD N X SD
Mules 6 73.78 12.01 5 74.76 10.60 5 74.37 14.23 6 71.68 12.68
Ponies 6 71.18 12.50 4 67.88 13.85 1 72.92 10.49 6 66.97 12.87
Donkeys 6 69.37 14.52 1 60.00 0 0 – 6 66.55 14.01
Total 18 70.97 13.47 10 69.62 13.66 6 74.18 13.66 18 68.40 13.37
123
82 Anim Cogn (2009) 12:75–84
potential importance of these non-cognitive factors onperformance.
One possible factor that could inXuence the results isdiVerences in the life experiences of the groups. Mules mayhave worked harder and therefore learnt more and beenmore stimulated than the ponies and donkeys. Conversely,subjects that had received little training in the past may alsohave been less well fed and therefore became moreresourceful and highly motivated to look for food. It wasnot possible to statistically analyze the eVects of prior train-ing on performance because the history of six of the sub-jects was not known (3 donkeys, 1 pony, 1 mule), but thereappeared to be no relationship (positive or negative)between the amount of training given and performance.Two of the ponies and tow of the mules have been ridden/driven compared to one donkey (see Table 1). At Wrstglance this could indicate that prior training may play a rolein their ability however, the mule NO was one of the twomules to receive advanced training and yet she had theworst performance of the mule group. Similarly the tworidden ponies learnt one and two pairs whereas the onlypony to learn three pairs had received only basic training. Itis diYcult to control for diVerences in past experience inequine learning studies or even to get a detailed history ofeach of the subjects because they are often sold severaltimes before arriving at the place where they are tested(Cooper 2007). Although prior training does not appear tobe a factor in performance, without using younger subjectsand/or having more detailed knowledge of training experi-ence we cannot completely rule out this possibility.
Previous experience with humans may also play a roleand since the subjects are now housed at a sanctuary theymay have had some negative experiences in the past. Whilethere is no reason to suggest that the mules would have hadbetter welfare than the ponies and donkeys prior to arrivingat the donkey sanctuary, there is evidence from mice hybridstudies that certain hybrids are not only better at learningtasks but their ability to perform these tasks are also moreresistant to environmental stressors and infantile trauma(Lassalle et al. 1991; Winston 1964). Thus the superiorlearning of the mules may be due to genetic factors that notonly improve learning but also help to ameliorate any nega-tive environmental inXuences that may otherwise aVect thisability to learn. Again subjects with controlled life historieswould be required to assess whether the eVect found inmice strains was also a factor in mules.
The donkeys and ponies have both undergone the pro-cess of artiWcial selection during their domesticationalthough their selection history may vary. Unlike domesticdogs, no comparison of ponies and donkeys with their wildcounterparts/ancestors has been made to assess the extent towhich domestication has produced heterochronic changesand altered cognition (Goodwin et al. 1997; Miklosi et al.
2003). Both ponies and donkeys have been used as packanimals and been ridden and driven but it could be arguedthat donkeys in general are often used as pack animals andonly given rudimentary training. As such it is possible thatthe selection pressures from man have selected ponies tohave enhanced cognitive capabilities compared to donkeysin order to perform more specialized and diverse tasks,such as riding and driving. It is not completely clear fromthe results whether the ponies outperformed the donkeys.Based on one previous comparison, we would expect this tobe the case (Giebel 1985, as cited in Waring 2003). No sig-niWcant diVerence in the number of pairs learnt was foundbut there was a trend in this direction that may not havebeen strong enough to be signiWcant given the relativelyfew subjects used. Further research would be required toanswer this question deWnitively. Selection history mayhave lead to these diVerences between ponies and donkeys,but this does not explain the enhanced performance ofmules, since mules are generally infertile and are bred“anew” each time. As such they are an equid type that is notsubject to systematic selection pressures. The enhancedperformance of mules, if not attributable to prior learningor ontogenic eVects (which the authors believe is unlikely)is likely to be a heterotic eVect caused by the interaction ofthe parental genes.
It is also possible that the diVering performances of theequid groups are due to motivational diVerences. Perfor-mance in a learning task does not necessarily reXect learn-ing ability since performance is aVected by many variablesincluding those mentioned above. Lefebvre and Helder(1997) also point out that learning is an option that individ-uals may or may not utilize. It may be that the food rewardwas more salient for some equid groups than othersalthough all subjects appeared highly motivated to receivethe reward.
There is good reason to question the validity of manytests of “intelligence” across diverse species because of theimpact of experimental design and noncognitive factorssuch as prior experience, motivation, eVects of social isola-tion and physical ability (Goodwin 2007; Murphy andArkins 2007). We feel however, that this experiment testssuch closely related species with similar sensory systemsand whose wild cousins are often sympatric, that noncogni-tive factors are unlikely to have played a signiWcant role inthe diVering performances of the equid groups. The resultsare likely to reXect the heterosis eVects on the cognitiveabilities of the mule.
In hybrids the expression of the parental traits will varydepending on the complexity of the gene interactions andthe extent to which behaviours are learnt. Some hybridtraits may be solely those of one parent or have aspects ofthe behaviour of both parents (Moritz 1988; Rothenbuler1964; Scroggiel and Littlejohn 2005), they may be a homo-
123

Anim Cogn (2009) 12:75–84 83
geneous blend of the parental species’ behaviours (Bentleyand Hoy 1972; Page et al. 2001), or they may be positivelyor negatively heterotic depending on the dominance rela-tionships among alleles at each locus and the interactionbetween loci. We can see all of these outcomes in the vari-ous characteristics of the mule. In their morphology, manyaspects of mules can be attributed distinctly to one or theother of its parent species, for example, the long ears, shortmane and narrow hooves of the donkey are often combinedwith the size and body shape of the horse (Travis 1990).Their call is also a combination of the parental whinny andbray. In their dominance and type of social organizationmules appear to be intermediate between the parental spe-cies, inhabiting the middle ranks of a mixed group of don-keys, mules and ponies (Proops, unpublished data). Interms of their Wtness, mules demonstrate hybrid disadvan-tage in that the vast majority of them are sterile. In many oftheir physical abilities they show hybrid vigour, beingsuperior to that of either parent. This is the Wrst study toclearly demonstrate that the concept of hybrid vigour mightbe extended from physical attributes to cognitive abilities.In the case of learning abilities mules were signiWcantlybetter than those of either parent species. This enhancedability to form associations between stimuli and to recog-nize “higher order” relationships should be taken intoaccount in their husbandry and in their training.
Assessment of whether hybridization causes a corre-sponding increase in cognitive capabilities in other hybridanimals would be informative and provide an ideal oppor-tunity to investigate further the genetics of behaviour. Acomparison of the cognitive capabilities of hinnies (E.caballus £ E. asinus) and mules would be of interest, asreciprocal hybrids often vary in the behaviours they expressrelative to their parental species (Bentley and Hoy 1972).Hinnies are often reported not to demonstrate the hybridvigour of the mule (Travis 1990). To create a more detailedknowledge of the similarities and diVerences betweendiVerent equid groups, tasks looking at social cognitioncould be conducted. Recent studies of horses have shown aform of social learning and an ability to read human cues(Krueger and Heinze 2008; Maros et al. 2008). It may bethat aspects of hybrid vigour seen in mule cognition extendto social cognition and human interaction. Results are rele-vant not just to building up a picture of gene interactions inthe hybrid mule but also because few studies have looked atthe learning abilities of horses and far fewer have taken acomparative approach to equid learning. More interspeciWcequid learning comparisons are needed if we are to under-stand how equid cognitive abilities evolved (Linklater2007).
Acknowledgments This experiment complies with the United King-dom Home OYce regulations concerning animal research and welfare
as well as the University of Exeter regulations on the use of animals.We are grateful to the members of staV at The Donkey Sanctuary’sTown Barton farm for their support and willingness to facilitate thisproject. For comments on the manuscript we thank Karen McComb.
References
Bentley DR, Hoy RR (1972) Genetic control of the neuronal networkgenerating cricket Teleogryllus gryllus song patterns. Anim Be-hav 20:478–492
Cooper JJ (2007) Equine learning behaviour: Common knowledge andsystematic research. Behav Processes 76:24–26
Field A (2005) Discovering statistics using SPSS, 2nd edn. Sage, Lon-don
Fiske JC, Potter GD (1979) Discrimination reversal learning in year-ling horses. J Anim Sci 49:583–588
Gardner LP (1937) The responses of horses in a discrimination prob-lem. J Comp Psychol 23:13–34
Goodwin D (2007) Equine learning behaviour: what we know, whatwe don’t and future research priorities. Behav Processes 76:17–19
Goodwin D, Bradshaw JWS, Wickens SM (1997) PaedomorphosisaVects agonistic visual signals of domestic dogs. Anim Behav53:297–304
Hall CA, Cassaday HJ, Derrington AM (2003) The eVect of stimulusheight on visual discrimination in horses. J Anim Sci 81:1715–1720
Harlow HF (1949) The formation of learning sets. Psychol Rev 56:51–65
Heitor F, Vicente L (2007) Learning about horses: what is equinelearning all about? Behav Processes 76:34–36
Hemmings A, McBride SD, Hale CE (2007) Perseverative respondingand the aetiology of equine oral stereotypy. Appl Anim Behav Sci104:143–150
Kamil AC, Hunter MW (1970) Performance on object-discriminationlearning set by Greater Hill Mynah (Gracula religiosa). J CompPhysiol Psychol 73:68–73
Kamil AC, Jones TB, Pietrewicz A, Maudlin JE (1977) Positive trans-fer from successive reversal training to learning set in blue jays(Cyanocitta cristata). J Comp Physiol Psychol 91:79–86
Krueger K, Heinze J (2008) Horse sense: social status of horses (Equuscaballus) aVects their likelihood of copying other horses’ behav-iour. Anim Cogn. doi:10.1007/s10071-007-0133-0
Lassalle JM, BulmanXeming B, Wahlsten D (1991) Hybrid vigorand maternal environment in mice. 2. Water escape learning,open-Weld activity and spatial memory. Behav Processes23:35–45
Lefebvre L, Helder R (1997) Scrounger numbers and the inhibition ofsocial learning in pigeons. Behav Processes 40:201–207
Leil TA, Ossadtchi A, Cortes JS, Leahy RM, Smith DJ (2002) Findingnew candidate genes for learning and memory. J Neurosci Res68:127–137
Linklater WL (2007) Equine learning in a wider context-opportunitiesfor integrative pluralism. Behav Processes 76:53–56
Macphail EM (1982) Brain and intelligence in vertebrates. ClarendenPress, Oxford
Maros K, Gácsi M, Miklósi Á (2008) Comprehension of human point-ing gestures in horses (Equus caballus). Anim Cogn. doi:10.1007/s10071-008-0136-5
McFarland D (1999) Animal behaviour. Pearson Education, Harlow,Essex
Miklosi A, Kubinyi E, Topal J, Gacsi M, Viranyi Z, Csanyi V (2003)A simple reason for a big diVerence: wolves do not look back athumans, but dogs do. Curr Biol 13:763–766
123
84 Anim Cogn (2009) 12:75–84
Mingroni MA (2004) The secular rise in IQ: giving heterosis a closerlook. Intelligence 32:65–83
Moritz RFA (1988) A reevaluation of the two-locus model for hygenicbehaviour in honeybees (Apis mellifera L.). J Hered 79:257–262
Murphy J, Arkins S (2007) Equine learning behaviour. Behav Pro-cesses 76:1–13
Nicol CJ (2002) Equine learning: progress and suggestions for futureresearch. Appl Anim Behav Sci 78:193–208
Owen EH, Logue SF, Rasmussen DL, Wehner JM (1997) Assessmentof learning by the Morris water task and fear conditioning in in-bred mouse strains and F-1 hybrids: implications of genetic back-ground for single gene mutations and quantitative trait locianalyses. Neuroscience 80:1087–1099
Page B, Goldsworthy SD, Hindell MA (2001) Vocal traits of hybrid furseals: intermediate to their parental species. Anim Behav 61:959–967
Parker ST, Maynard-Smith J (1990) Optimality theory in evolutionarybiology. Nature 348:27–33
Parker M, Redhead ES, Goodwin D, McBride SD (2008) Impairedinstrumental choice in crib-biting horses (Equus caballus). BehavBrain Res 191:137–140
Passingham RE (1981) Primate specializations in brain and intelli-gence. Symp Zool Soc Lond 46:361–388
Pearce JM (1997) Animal learning and cognition, 2nd edn. PsychologyPress, Hove, UK
Rothenbuler WC (1964) Behaviour genetics of nest cleaning in honey-bees I. Responses of four in-bred lines to disease-killed brood.Anim Behav 12:578–583
Sappington BF, Goldman L (1994) Discrimination learning and con-cept formation in the Arabian horse. J Anim Sci 72:3080–3087
Sappington BKF, McCall CA, Coleman DA, Kuhlers DL, Lishak RS(1997) A preliminary study of the relationship between discrimi-nation reversal learning and performance tasks in yearling and 2-year old horses. Appl Anim Behav Sci 53:157–166
Scroggiel MP, Littlejohn MJ (2005) Territorial vocal behaviour in hy-brid smooth froglets, Geocrinia laevis complex (Anura: Myobatr-achidae). Behav Ecol Sociobiol 58:72–79
Shettleworth SJ (1998) Cognition evolution, and behaviour. OxfordUniversity Press, New York
Shull GH (1908) The composition of a Weld of maize. American Breed-er’s Association, Washington
Siegel S, Castellan NJ (1988) Nonparametric statistics for the behav-ioural sciences, 2nd edn. McGraw-Hill, New York
Travis L (1990) The mule. J. A. Allen & Co, LondonVoith VL (1975) Pattern discrimination, learning set formation, mem-
ory retention, spatial and visual reversal learning in the horse.MSc thesis, Ohio State University
Waring G (2003) Horse Behaviour, 2nd edn. Noyes Publishing/Wil-liam Andrew Publishing, Norwich, NY
Warren JM (1965) Primate learning in comparative perspective. In:Shrier AM, Harlow HF, Stollnittz F (eds) Behaviour of nonhumanprimates. Academic Press, New York
Winston HD (1964) Heterosis + learning in mouse. J Comp PhysiolPsychol 57:279
123