muchea industrial park amendment 1 local structure plan 1
136
-
Upload
khangminh22 -
Category
Documents
-
view
2 -
download
0
Transcript of muchea industrial park amendment 1 local structure plan 1

2322Rep124A
This page has been left blank intentionally

32322Rep124A
MUCHEA INDUSTRIAL PARK
AMENDMENT 1
LOCAL STRUCTURE PLAN 1
PART TWO: EXPLANATORY REPORT
Prepared by:
PO Box 796Subiaco WA 6904
08 9382 1233www.cleplan.com.au
2322Rep124AJanuary 2021

2322Rep124A
This page has been left blank intentionally
52322Rep124A
CLIENT / PROJECT MANAGER
Harvis
PROJECT TEAM
Town Planning and Urban Design - CLE Town Planning + Design
Retail Assessment - Shrapnel Urban Planning
Traffic Analysis - WSP

2322Rep124A
This page has been left blank intentionally
72322Rep124A
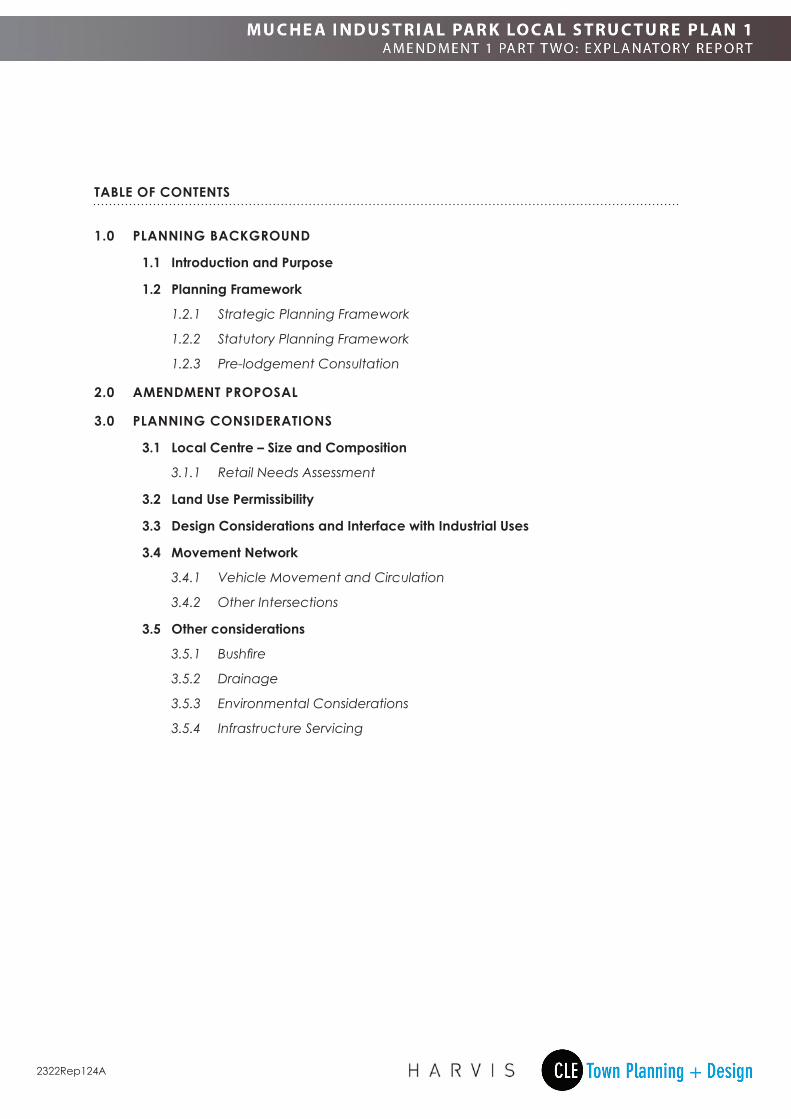
TABLE OF CONTENTS
1.0 PLANNING BACKGROUND
1.1 Introduction and Purpose
1.2 Planning Framework
1.2.1 Strategic Planning Framework
1.2.2 Statutory Planning Framework
1.2.3 Pre-lodgement Consultation
2.0 AMENDMENT PROPOSAL
3.0 PLANNING CONSIDERATIONS
3.1 Local Centre – Size and Composition
3.1.1 Retail Needs Assessment
3.2 Land Use Permissibility
3.3 Design Considerations and Interface with Industrial Uses
3.4 Movement Network
3.4.1 Vehicle Movement and Circulation
3.4.2 Other Intersections
3.5 Other considerations
3.5.1 Bushfire
3.5.2 Drainage
3.5.3 Environmental Considerations
3.5.4 Infrastructure Servicing

2322Rep124A
This page has been left blank intentionally
92322Rep124A
FIGURES
Figure 1: Design Principles Plan
Figure 2: BAL Contour Plan
APPENDICES
Appendix 1: Retail Needs Assessment
Appendix 2: Traffic Impact Assessment Addendum
Appendix 3: Original Traffic Impact Assessment (2015)
2322Rep124A
1.0 PLANNING BACKGROUND
1.1 Introduction and PurposeLocal Structure Plan 1 (LSP 1) for the Muchea Industrial Park (MIP) was approved by the Western Australian Planning Commission (WAPC) on 13 October 2017. LSP 1 is the overarching framework guiding the staged subdivision and development of approximately 150 hectares of industrial land. To date, the WAPC has issued subdivision approvals for the first two stages and development has significantly progressed. BP has constructed one of the largest roadhouses and truck stops in Western Australia and the vision for a strategic employment node in Muchea is being delivered. The proponent, Harvis, has constructed the first stage lots with the majority already sold. The MIP has generated significant momentum and as a result, attracted interest from parties seeking to invest in the MIP and deliver land uses that were not originally anticipated at the time LSP 1 was prepared.
LSP 1 was primarily expected to attract land uses requiring large laydown and storage areas associated with the resources sector. Whilst this is still the case, an opportunity has arisen to further diversify the range of land uses capable of occurring within the MIP in order to enhance the services and amenities available to workers. These services and amenities would also provide for local residents within the primary catchment as well as passing traffic on Tonkin Highway.
Whilst an element of ‘shop’ and ‘retail’ offerings has been planned within the broader Muchea Employment Node (MEN) from the outset, it has become apparent that these types of uses will be viable in the shorter-term. To investigate the matter further, Harvis commissioned the preparation of a Retail Needs Assessment (RNA) (refer Appendix 1). The RNA concludes that within the primary catchment of the MIP, there is currently unmet demand for an additional 925m² of shop / retail floor space. By the year 2031, the RNA estimates that unmet demand will increase to approximately 2,045m² of shop / retail floor space based on an expanding workforce population within the MIP combined with population growth within the primary catchment.
Amendment 1 to LSP 1 has been prepared to facilitate development of a local service centre at the entrance to the MIP in response to an identified demand for shop / retail services and other complimentary uses. A 2.1 hectare site has been selected that is anticipated to provide for up to 6,850m² of nett leasable area (NLA). This floor space is planned to accommodate up to 2,650m² of uses such as drive-thru fast food, fuel retail, medical services / consulting rooms, a small supermarket with a liquor offering as well as up to 4,200m² of service-based light industrial uses such as automotive repairs / parts and tyres. The specific site has been determined based on its strong locational attributes, both in the context of Harvis’ MIP as well as the broader MEN. These include:
• High-level of exposure to Tonkin Highway enabling the capture of passing trade;
• Easy navigation for vehicles travelling on Tonkin Highway in both directions, with efficient and legible access provided to the site;
• Its location within the first stages of subdivision and development, allowing for delivery of the local service centre in the shorter-term. This will bring services and amenities to the MIP sooner and create additional jobs and investment up-front;
12322Rep124A 1
• Synergies with the existing BP Roadhouse on the opposite side of the ‘Loop Road’ that will combine to create a focal point at the entrance to the MIP, strengthening the node and assisting to define the precinct at the key access point to the broader MEN from Tonkin Highway; and
• It will service an immediate industrial catchment that is being developed as part of the first stages of the MIP. This will maximise the immediate customer base and provide services and amenities within immediate proximity of the first employment uses in the MIP.
This Part 2 - Explanatory Report explains and justifies the amendments to the Part 1 – Implementation Report and the LSP Map. It does not replace the previous Explanatory Report prepared in support the original LSP 1 (September 2017) rather, it forms an addendum and is supplementary to, the previous Explanatory Report and addresses only the proposed amendments.
Amendment 1 to LSP 1 is supported by the necessary technical reports as follows:
• Appendix 1: Retail Needs Assessment (Shrapnel Urban Planning) – demonstrates the need for the local service centre in Muchea and demonstrates the suitability of the proposed location;
• Appendix 2: Traffic Impact Assessment Addendum (WSP) – demonstrates that the anticipated increase in traffic volumes can be suitably accommodated via the planned network of roads and intersections; and
• Appendix 3: Original 2015 Traffic Impact Assessment (GTA Consultants) – provided for information purposes only and to be used as a point of reference when reading the Traffic Impact Assessment Addendum at Appendix 2.
1.2 Planning Framework1.2.1 Strategic Planning Framework
Muchea Employment Node Structure Plan (August 2011)
Prepared by the WAPC and finalised in 2011, the Muchea Employment Node Structure Plan (MENSP) sets the high-level strategic framework for the planning of an employment node in Muchea. The MENSP has guided previous local scheme amendments and structure plans within the MEN that are in turn, coordinating the subdivision and development of the first stages of the MIP. With specific reference to the purpose of this amendment, the MENSP includes a list of land uses that are planned to occur within the MEN including indicative areas for these uses.
Table 1.1 of the MENSP outlines an indicative ‘land use area split’ for the MEN to the year 2030 based on a total demand for 596 hectares. The predominant land use typologies anticipated for the MEN were ‘primary/rural’ at 47% of the total land area, ‘storage/distribution’ at 24%, ‘service industry’ at 16% and ‘manufacturing/processing/fabrication’ at 9.5%. Whilst relatively minor by comparison, the MENSP also made provision for approximately 1.0 hectare of ‘shop/retail’ and 6.4 hectares of ‘other retail’ at 1% of the total area. Consistent with the planning for the MEN, this amendment to LSP 1 will provide for approximately 2,650m² of ‘shop/retail’ and ‘other retail’ floor space, delivering a range of uses intended to service employees of the MEN as well as local residents and passing trade on Tonkin Highway.
2322Rep124A2
Shire of Chittering Local Planning Strategy (2019)
The Shire of Chittering’s Local Planning Strategy (LPS) was finalised in 2019 and serves as the local strategic framework guiding land use planning across the Shire. The LPS was finalised after LSP 1 was approved and as such, includes specific objectives and strategies for LSP 1 as part of the broader MEN.
In terms of planning for industrial land uses, the key objective stated in the LPS is to:
“provide for and protect industrial land uses at strategic locations and limit ad-hoc industrial locations throughout the Shire”.
To achieve this objective, the LPS seeks to:
• Make Muchea Industrial Park a focus for industrial development; and
• Promote and cater for a range of compatible uses within industrial zoned land and incorporate design features that address buffers and amenity, including fencing, vegetation buffers, open space and other compatible transition uses.”
With specific reference to the MEN, the LPS identifies the following objectives:
• Promote industrial development within the Muchea Industrial Park; and
• Respect the rural amenity and environmental values in the design and development of the Muchea Industrial Park.
The second objective listed above has been suitably addressed through the preparation and approval of LSP 1, which identifies those areas of land capable of development and those with environmental values that warrant protection and management within local reserves. As the amendment covers an area previously identified for industrial development, on site environmental values are not a relevant consideration to the proposal.
In order to promote the MEN for industrial development, the LPS outlines the following relevant strategies and actions:
• Maximiseeffortstorealiseeconomicflow-oneffectsgeneratedbyStateinfrastructureprojects, including Northlink; and
• Direct all future industrial development to the Muchea Industrial Park.
The proximity of the proposed amendment site to Tonkin Highway (Northlink) is a critical factor in why this location for the local service centre has been chosen. The high-exposure and direct access provided by the MENs only interchange with Tonkin Highway provides an unrivalled opportunity for not only diversifying and enhancing the local amenities available for employees and travellers, it will increase the employment density within the MEN, attract business investment in the shorter-term and serve as a catalyst for further investment and business attraction. This ability for the amendment site to accommodate a local service centre in the short term stems directly from Tonkin Highway, thereby maximising the economic flow-on effects generated by State infrastructure, as strategised by the Shire’s LPS.
32322Rep124A 3
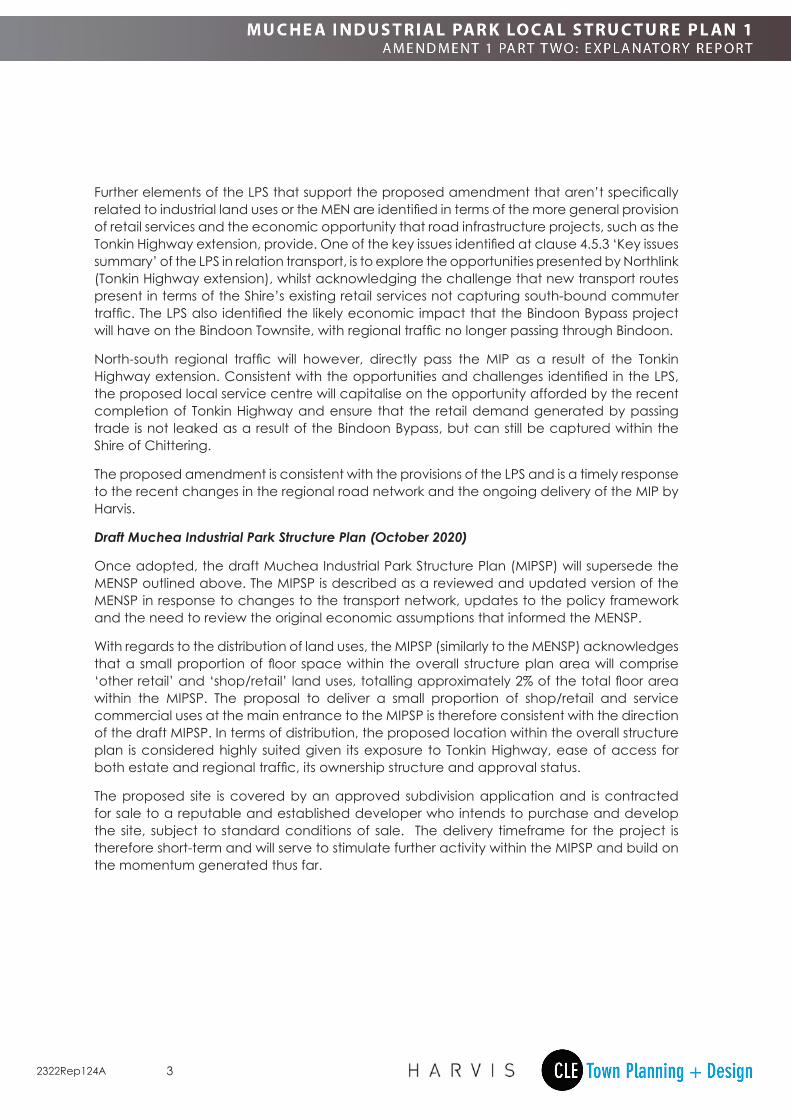
Further elements of the LPS that support the proposed amendment that aren’t specifically related to industrial land uses or the MEN are identified in terms of the more general provision of retail services and the economic opportunity that road infrastructure projects, such as the Tonkin Highway extension, provide. One of the key issues identified at clause 4.5.3 ‘Key issues summary’ of the LPS in relation transport, is to explore the opportunities presented by Northlink (Tonkin Highway extension), whilst acknowledging the challenge that new transport routes present in terms of the Shire’s existing retail services not capturing south-bound commuter traffic. The LPS also identified the likely economic impact that the Bindoon Bypass project will have on the Bindoon Townsite, with regional traffic no longer passing through Bindoon.
North-south regional traffic will however, directly pass the MIP as a result of the Tonkin Highway extension. Consistent with the opportunities and challenges identified in the LPS, the proposed local service centre will capitalise on the opportunity afforded by the recent completion of Tonkin Highway and ensure that the retail demand generated by passing trade is not leaked as a result of the Bindoon Bypass, but can still be captured within the Shire of Chittering.
The proposed amendment is consistent with the provisions of the LPS and is a timely response to the recent changes in the regional road network and the ongoing delivery of the MIP by Harvis.
Draft Muchea Industrial Park Structure Plan (October 2020)
Once adopted, the draft Muchea Industrial Park Structure Plan (MIPSP) will supersede the MENSP outlined above. The MIPSP is described as a reviewed and updated version of the MENSP in response to changes to the transport network, updates to the policy framework and the need to review the original economic assumptions that informed the MENSP.
With regards to the distribution of land uses, the MIPSP (similarly to the MENSP) acknowledges that a small proportion of floor space within the overall structure plan area will comprise ‘other retail’ and ‘shop/retail’ land uses, totalling approximately 2% of the total floor area within the MIPSP. The proposal to deliver a small proportion of shop/retail and service commercial uses at the main entrance to the MIPSP is therefore consistent with the direction of the draft MIPSP. In terms of distribution, the proposed location within the overall structure plan is considered highly suited given its exposure to Tonkin Highway, ease of access for both estate and regional traffic, its ownership structure and approval status.
The proposed site is covered by an approved subdivision application and is contracted for sale to a reputable and established developer who intends to purchase and develop the site, subject to standard conditions of sale. The delivery timeframe for the project is therefore short-term and will serve to stimulate further activity within the MIPSP and build on the momentum generated thus far.
2322Rep124A4
1.2.2 Statutory Planning Framework
Local Planning Scheme No. 6
Harvis’ MIP is zoned ‘Industrial Development’ under the Shire’s Local Planning Scheme No. 6 (LPS 6). The primary objective for the ‘Industrial Development’ zone is to designate the land for future industrial development and employment creation purposes through the preparation and endorsement of structure plans. The MIP is also covered by the ‘Muchea Employment Node Special Control’ area which sets out the detailed reporting requirements and matters to be addressed at each stage of the planning process i.e. structure planning, subdivision and development.
Schedule 2 – Zoning Table of LPS 6 confirms that land use permissibility within the zone is to be in accordance with an approved structure plan. In order for a decision maker to assess and determine land uses at the development application stage, the structure plan needs to suitably accommodate the intended land uses through an appropriate zoning designation on the structure plan map.
Clause 4.9 of LPS 6 ‘Requirements for Industrial Zones and land Uses’ will apply to future development proposals within the ‘Industrial Development’ zone, which includes the proposed local service centre. The most relevant provisions that will need to be addressed at the subsequent development application stage include the requirement to manage pollutants (if any) and on-site wastewater disposal.
Local Structure Plan 1
The proposed local service centre is currently designated ‘General Industry’ under LSP 1. The majority of land uses that are intended to occur within the local service centre such as ‘shop’ and ‘fast food outlet’ are not permitted within the ‘General Industry’ zone as per Table 2 of LPS 6. In order to provide certainty for future applicants and decision-makers alike, a structure plan amendment that assigns an appropriate zoning is required, as is proposed by this amendment.
Local Planning Policy No. 33 – Muchea Industrial Park Design Guidelines
All future development proposals within the MEN will be required to have due regard to the provisions of the Muchea Industrial Park Design Guidelines (the Guidelines), adopted as a local planning policy by the Shire of Chittering. The Guidelines establish a range of development standards such as building design, setbacks, landscaping and signage that will need to be considered in the preparation and assessment of future development applications.
52322Rep124A 5
State Planning Policy 4.1 – State Industrial Buffer Policy (SPP 4.1)
SPP 4.1 seeks to protect the long-term security of industrial land from encroachment by sensitive land uses. As such, SPP 4.1 is not applicable to the proposed LSP amendment as the range of land uses that are provided for within the Special Use Zone are not defined as sensitive land uses. The amendment will provide for employment-generating land uses only and does not propose accommodation of any type. As such, the potential for and need to manage land use conflict is not a consideration for this proposal. Notwithstanding, it is intended that the design response to the sites context within a broader General Industry precinct will respond appropriately, as discussed in further detail under section 3.1 below.
1.2.3 Pre-lodgement Consultation
The following stakeholders and agencies were consulted in the preparation of this amendment:
• The Shire of Chittering; and
• The Department of Planning, Lands and Heritage (DPLH).
No fundamental issues were raised during the pre-lodgement consultation. The DPLH recommended that potential alternative locations be investigated for the local service centre based on traffic and access considerations. The locational attributes that have informed the site selection of the local service centre are discussed in the section 1.1 above and 3.0 below.
2322Rep124A6
2.0 AMENDMENT PROPOSALAs outlined above, the current LSP 1 Map identifies the proposed local service centre as ‘General Industry’. Land use permissibility is therefore in accordance with the ‘General Industry’ column of the LPS 6 zoning table however, many uses that are intended to occur are not capable of approval within the ‘General Industry’ zone. The zoning designation on the structure plan map therefore requires amending to provide certainty regarding the intended land use outcomes. The primary purpose of this amendment is therefore to change the zoning designation on the LSP Map for the local service centre, with other minor changes proposed to reflect the more recent subdivision approvals.
As LPS 6 does not have a suitable ‘standard’ zoning for a local service centre (or similar), an alternative zoning approach is proposed. Specifically, a ‘Special Use’ zone will be identified on the LSP Map with a corresponding land use table inserted into the Part 1 – Implementation report. The ‘Special Use’ table prescribes a list of land uses that are suitable and desirable for a local service centre that is proposed on the periphery of an industrial estate and is also adjacent a primary regional road that accommodates significant regional traffic. The ‘Special Use’ zone provides an opportunity for a more discreet, tailored approach to the land use planning for the site, as compared to a standard zoning approach. At ultimate development, it is expected that the local centre will comprise up to approximately 2,650m² of shop/retail NLA and approximately 4,200m² of service industry-type uses.
In addition to the primary purpose of the amendment i.e. to provide for a local service centre at the entrance to the MIP, there are a number of minor modifications proposed in response to the subdivision design and approval process that has occurred since LSP 1 was approved. These are summarised as follows:
• The east-west road (Canaveral Way) adjacent the northern boundary of the proposed ‘Special Use’ zone and running parallel to the ‘Loop Road’ has been straightened to provide a more regular lot shape for the local service centre;
• The small ‘Drainage’ reserve in the north-west corner of the ‘Conservation’ reserve and adjacent the ‘Loop Road’ has been deleted consistent with the approved Urban Water Management Plan;
• ‘Plan B – Access Staging Plan’ has been deleted in its entirety as it is no longer relevant post-construction of the Tonkin Highway extension and the associated interchange connection with the MIP; and
• The location of Main Roads WA’s (MRWA) ‘Controlled Access Route’ for oversize overmass vehicles has been identified on the western boundary LSP 1 based on MRWA’s controlled network which was confirmed as part of the initial subdivision for Stage 1.
The minor modifications listed above do not necessitate changes to the text within the Part 1 – Implementation report, with the changes limited to the LSP Map.
72322Rep124A 7
3.0 PLANNING CONSIDERATIONSThe following sections explain and justify the proposed amendment and are limited to the planning matters relevant to the proposed local service centre. Matters that have already been addressed through the preparation of the original Part 2 - Explanatory Report (September 2017) that are not affected by the proposed amendment are not discussed as part this report.
3.1 Local Service Centre – Size and CompositionThe amendment proposes to enable development of a 2.1 hectare site as a local service centre providing amenities for workers within the MEN as well as regional traffic travelling along Tonkin Highway and local residents within the catchment. The 2.1 hectare gross site area is estimated to comprise up to 2,650m² of shop/retail floor space and 4,200m² of compatible service-commercial and industry - service businesses at full development.
Development of the local service centre is likely to be staged to match the gradual increase in demand for shop/retail offerings. Whilst the first stage will be delivered in the short-term, future expansion up to the anticipated ultimate floor space amount is likely to occur sequentially based on the following growth factors:
• The increasing size of the MEN workforce over time, which is expected to continue to grow even once the proposed local service centre is built-out;
• The relocation of the Road Train Assembly Area to the MRWA site directly adjacent the MIP;
• An increase in traffic numbers along Tonkin Highway; and
• An increase in the residential population within the primary catchment of the proposed local service centre.
3.1.1 Retail Needs Assessment
An RNA has been prepared by retail consultant Shrapnel Urban Planning and forms Appendix 1 to this report. The key findings of the RNA are summarised as follows:
• Even without development of the MEN and the associated workforce population, there is currently an unmet demand for an additional 925m² of shop/retail floor space within the primary catchment based on the existing resident population;
• To the year 2031, growth of the MEN workforce combined with resident population growth within the primary catchment will create an estimated unmet demand for retail / shop floor space of approximately 2,045m²;
• Demand will continue to increase beyond 2031 as the MEN workforce and local resident population continues to grow such that in the longer-term, additional centres may be warranted within the MEN; and
• The proposed site for the local service centre is the most suitable location within the MIP, given it’s high visibility, ‘gateway’ access into the first stage of development within the MIP, its ability to compliment other uses within the MIP and its ease of access for employees entering and leaving the MIP via the loop road.
2322Rep124A8
Based on the findings of the RNA, a first stage development for approximately 925m² of retail/shop floor space is considered viable, with additional floor space to accommodate other complimentary service-commercial and industry – service land uses. Whilst the shop/retail floor space technically includes drive-thru fast food uses, it is anticipated that a substantial portion of demand for these uses will be generated by passing trade in addition to the resident and workforce population numbers. As such, it may be feasible that 925m² of shop/retail floor space is warranted in addition to any drive-thru fast food uses however, this will be at the discretion of the proponent.
3.2 Land Use PermissibilityTable 2 – Special Use Zone within the Part 1 – Implementation report provides a list of permitted land uses for the local service centre that are informed by the following key objectives:
• Provide services and amenities for employees within the MIP and broader MEN and alleviate the need to travel for daily shopping needs and personal services;
• Provide food offerings and a respite destination for drivers / vehicles travelling north-south on the regional road network;
• Provide convenient access to a wide range of retail offerings for north-south regional traffic and capture retail expenditure within Muchea and the Shire of Chittering in order to minimise leakage;
• Encourage and facilitate complementary uses that allow for multi-purpose trips to the centre;
• Allow for land uses that have synergies with, and support the MRWA Road Train Assembly Area (RTAA) and other industrial uses within the MEN;
• Avoid and minimise the potential for land use conflict by not permitting land uses that may be incompatible with industrial uses in close proximity;
• Orientate retail uses that require higher-levels of exposure towards Tonkin Highway and the loop road and provide for industry – service uses further from Tonkin Highway to assist management of the interface with the adjoining General Industry lots; and
• Not permit any sensitive-land uses that have the potential to conflict with the General Industry-zoned land to ensure that industrial uses are not compromised by competing land uses.
92322Rep124A 9
3.3 Design Considerations and Interface with Industrial UsesThe detailed design of the proposed local service centre will be undertaken by the future owner of the site. Given the size of the site and the fact that it is covered by an existing subdivision approval, there are no constraining factors that would preclude development of the site as proposed by this amendment. As with all development sites, there are certain attributes that will necessitate a design response and should inform future detailed designs. These are summarised as follows:
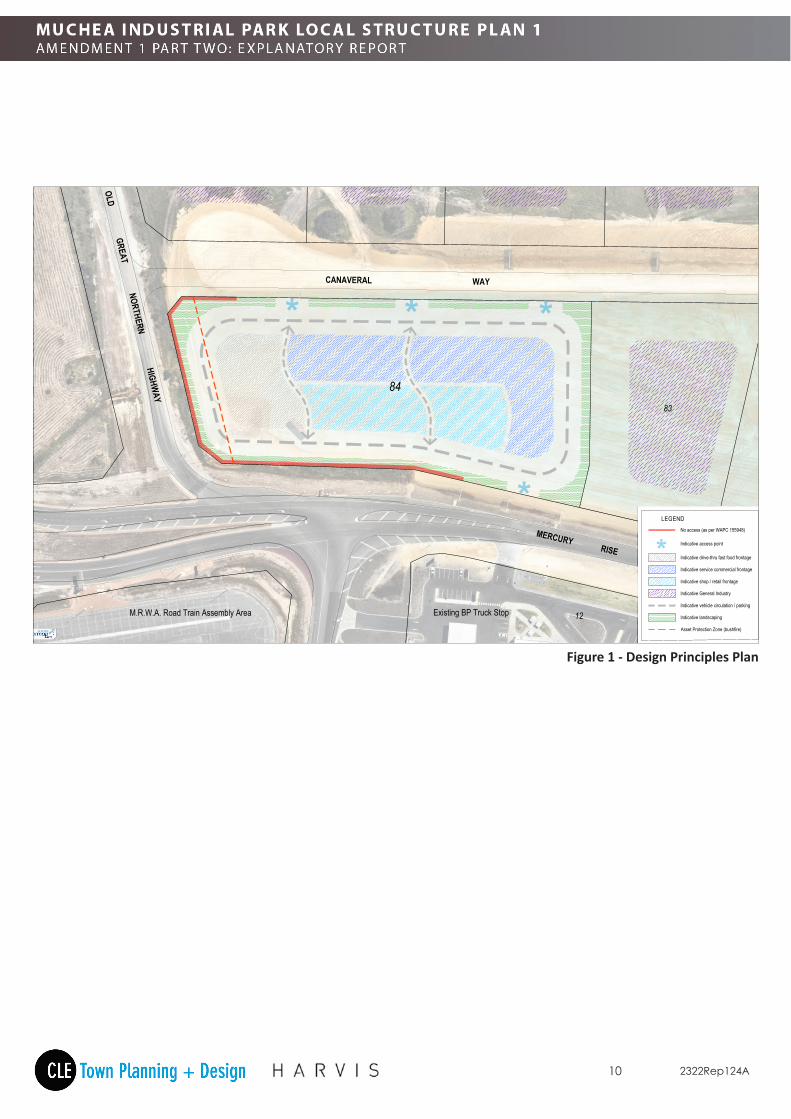
• Access to the site is restricted in certain locations based on the outcomes of subdivision approval reference WAPC 155948. These access restrictions will be placed on the title of the proposed 2.1 hectare local service centre lot and are identified on the ‘Design Principles Plan’ (refer Figure 1). As demonstrated by the Design Principles Plan, the site can comfortably accommodate legible and unfettered access / egress notwithstanding the access restrictions;
• Uses that are expected to benefit most from the high exposure to Tonkin Highway, such as drive-thru fast food and a potential service station, will naturally gravitate to the western boundary. Internal traffic and circulation areas will need to accommodate visitor movement for these uses; and
• The adjoining, undeveloped lots to the east and north will remain zoned ‘General Industry’ under LSP 1. Whilst the land uses capable of occurring within the proposed Special Use Zone are not ‘sensitive land uses’ and do not warrant any particular buffer or management response, it is preferable and intended that the shop/retail uses that provide customer amenities such as food, beverage and convenience shopping will avoid orientating towards General Industry zoned land. As depicted on the Design Principles Plan, shop/retail uses should orientate towards the southern boundary where they are visible for wayfinding purposes and will be easily accessible to customers of the BP Roadhouse.
2322Rep124A10
1
12
21 22 31
83
84
MERCURY RISE
CANAVERAL WAY
Existing BP Truck Stop
OLD GREAT NORTHERN HIGHWAY
GREAT NORTHERN HIGHWAY
M.R.W.A. Road Train Assembly Area
* * *
*
Lot 84 Muchea scale: 1:1,000 @A3, 1:500 @A1date: 18 December 2020
plan no: 2322-126A-01
0 10 20 50m30 40
Indicative drive-thru fast food frontage
Indicative shop / retail frontage
Indicative service commercial frontage
Indicative landscaping
Indicative General Industry
This plan has been prepared for general information purposes only and uses potentially uncontrolled data fromexternal sources. CLE does not guarantee the accuracy of this plan and it should not be used for any detailedsite design. This plan remains the property of CLE.
Indicative access point
No access (as per WAPC 155948)
Asset Protection Zone (bushfire)24.10.2020
Indicative vehicle circulation / parking
*
Figure 1 - Design Principles Plan
112322Rep124A 11
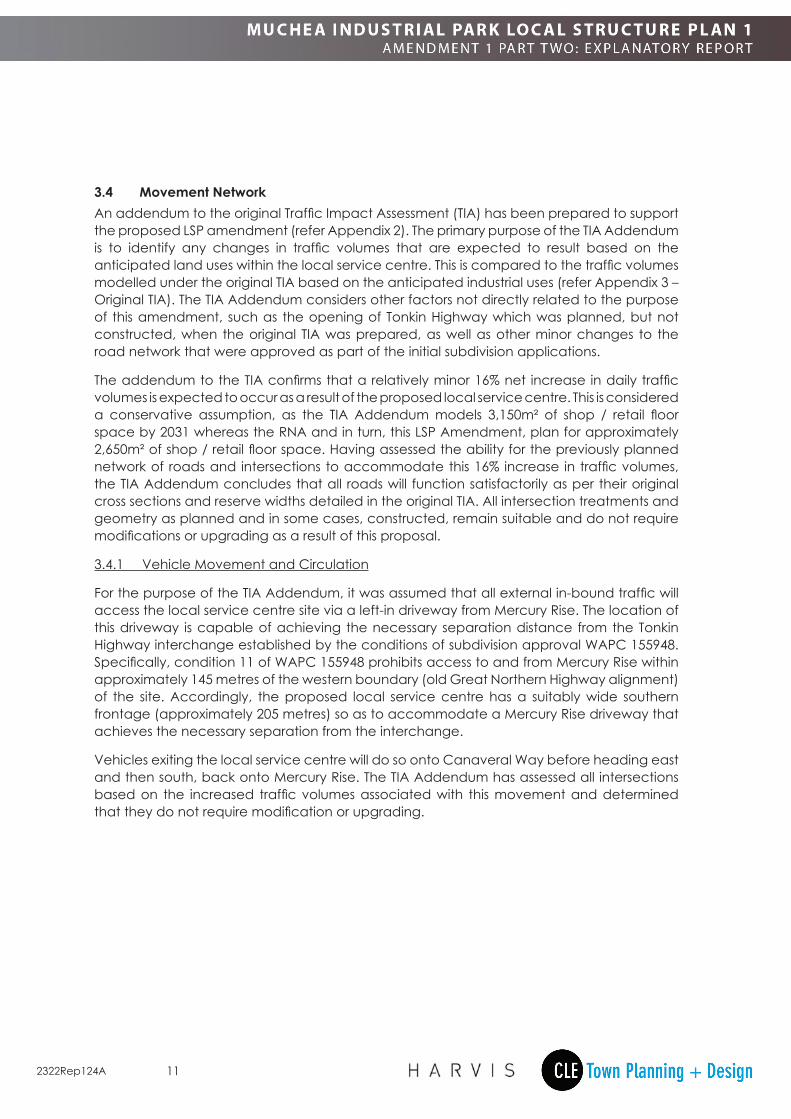
3.4 Movement NetworkAn addendum to the original Traffic Impact Assessment (TIA) has been prepared to support the proposed LSP amendment (refer Appendix 2). The primary purpose of the TIA Addendum is to identify any changes in traffic volumes that are expected to result based on the anticipated land uses within the local service centre. This is compared to the traffic volumes modelled under the original TIA based on the anticipated industrial uses (refer Appendix 3 – Original TIA). The TIA Addendum considers other factors not directly related to the purpose of this amendment, such as the opening of Tonkin Highway which was planned, but not constructed, when the original TIA was prepared, as well as other minor changes to the road network that were approved as part of the initial subdivision applications.
The addendum to the TIA confirms that a relatively minor 16% net increase in daily traffic volumes is expected to occur as a result of the proposed local service centre. This is considered a conservative assumption, as the TIA Addendum models 3,150m² of shop / retail floor space by 2031 whereas the RNA and in turn, this LSP Amendment, plan for approximately 2,650m² of shop / retail floor space. Having assessed the ability for the previously planned network of roads and intersections to accommodate this 16% increase in traffic volumes, the TIA Addendum concludes that all roads will function satisfactorily as per their original cross sections and reserve widths detailed in the original TIA. All intersection treatments and geometry as planned and in some cases, constructed, remain suitable and do not require modifications or upgrading as a result of this proposal.
3.4.1 Vehicle Movement and Circulation
For the purpose of the TIA Addendum, it was assumed that all external in-bound traffic will access the local service centre site via a left-in driveway from Mercury Rise. The location of this driveway is capable of achieving the necessary separation distance from the Tonkin Highway interchange established by the conditions of subdivision approval WAPC 155948. Specifically, condition 11 of WAPC 155948 prohibits access to and from Mercury Rise within approximately 145 metres of the western boundary (old Great Northern Highway alignment) of the site. Accordingly, the proposed local service centre has a suitably wide southern frontage (approximately 205 metres) so as to accommodate a Mercury Rise driveway that achieves the necessary separation from the interchange.
Vehicles exiting the local service centre will do so onto Canaveral Way before heading east and then south, back onto Mercury Rise. The TIA Addendum has assessed all intersections based on the increased traffic volumes associated with this movement and determined that they do not require modification or upgrading.
2322Rep124A12
3.4.2 Other Intersections
In addition to the above, the TIA Addendum also considers changes to two MIP intersections that are not related to the local service centre the subject of this amendment. These changes are summarised as follows:
1. The Mercury Rise ‘full movement’ intersection shown on the LSP Map has been constructed as a 90 degree corner, consistent with its current role providing access to the MIP lots. If and when Mercury Rise is extended to the east by others, further scenario testing will be required to determine whether any additional intersection controls will be required. The TIA addendum however, confirms that the current intersection will function satisfactorily at full development of the MIP.
2. The original LSP (Plan B – Access Staging Plan) proposed a left in / left out (LILO) intersection for the section of GNH that intersects with the Tonkin Highway interchange. Through the subdivision process for Stage 1 of the MIP, MRWA confirmed that this short length of GNH would not be accessible to the public. It was designed and constructed as a restricted access road for ‘high wide loads’ using GNH. The TIA addendum considers the removal of this intersection and confirms that redistribution of local traffic that may have used this intersection can be accommodated on the broader network without consequence. The LSP 1 Map has been updated to show this restricted access route to provide clarity and certainty for proponents and decision-makers.
132322Rep124A 13
3.5 Other considerations3.5.1 Bushfire
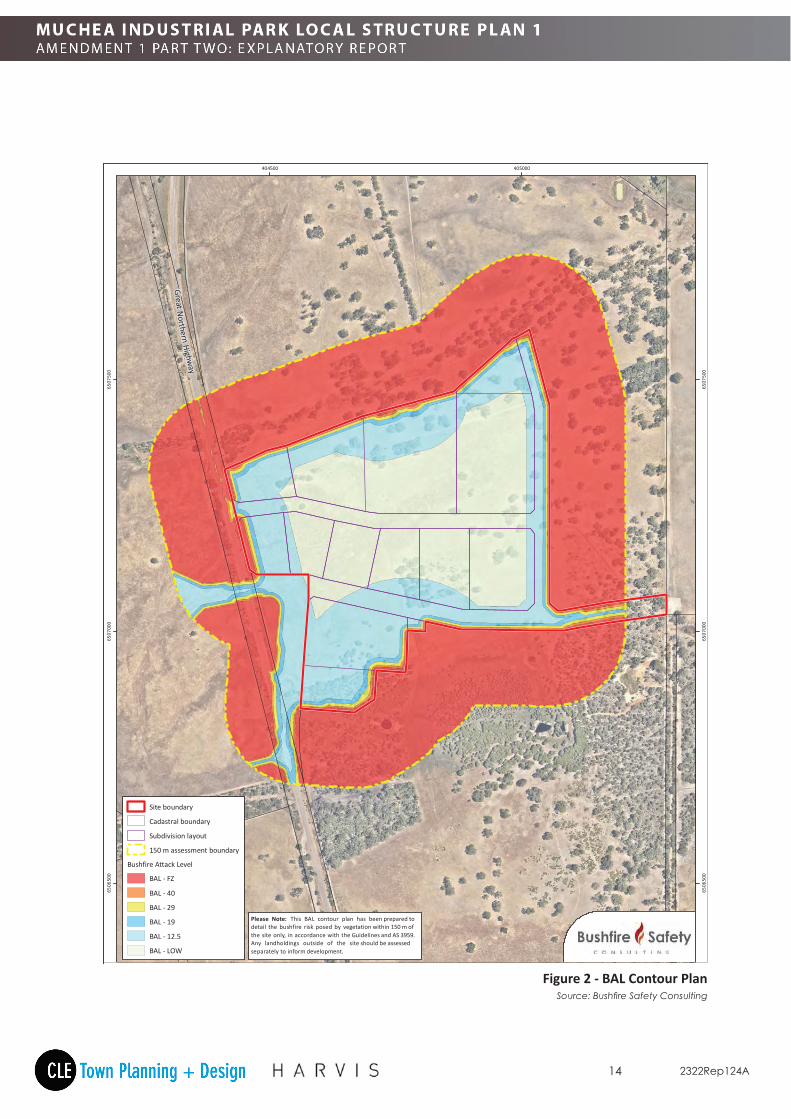
A Bushfire Management Plan (BMP) was prepared and approved as part of the subdivision approval for Stage 1 of the MIP where the proposed local service centre is located. The Bushfire Attack Level (BAL) Contour Plan prepared in association with the BMP identified the western portion of the proposed local service centre is affected by a bushfire hazard (refer Figure 2 – BAL Contour Plan). In order to manage this potential bushfire hazard, the BMP identifies a 13m wide Asset Protection Zone (APZ) where no buildings will be constructed. The APZ can be easily accommodated under the proposed development scenario for the local service centre as the 13m area adjoining the western boundary will be developed for landscaping (low bushfire threat), car parking and vehicle circulation. This design response will effectively manage the potential bushfire threat and bushfire does not constrain development of a local service centre.
3.5.2 Drainage
An Urban Water Management Plan (UWMP) has been prepared and approved over Stage 1 of the MIP which includes the proposed local service centre site. Development of the site as facilitated by this amendment will implement the drainage strategy outlined in the UWMP, specifically:
• A bio retention area within a larger lot detention area will be provided on site to treat and retain minor stormwater events. The location of the lot detention area is expected to coincide with the low-point of the site in the south-west and/or north-west corner(s);
• Major events will be detained within the local detention area to maintain the pre-development flow rates before discharging into the road side conveyance swales constructed as part of subdivisional works; and
• Conveyance swales adjoin the southern and western boundaries of the site and will allow for onsite surface water to be discharged into a western or southern direction, depending on final earthworks and site design.
3.5.3 Environmental Considerations
As previously stated, subdivision approval has been granted for Stage 1 and subdivisional works, including earthworks, have been undertaken in accordance with the approved engineering drawings. All environmental matters have been addressed as part of previous planning processes and the proposed local service centre site is unconstrained by environmental factors.
2322Rep124A14
kyle.middleton
G reat NorthernHighw
ay
404500
404500
405000
405000
6506
500
6506
500
6507
000
6507
000
6507
500
6507
500
While Emerge Associates makes every attempt to ensure the accuracy and completeness of data, Emerge accepts no responsibility for externally sourced data used
Site boundary
Cadastral boundary
Subdivision layout
150 m assessment boundary
Bushfire Attack Level
BAL - FZ
BAL - 40
BAL - 29
BAL - 19
BAL - 12.5
BAL - LOW
Sirona Capital Management Pty Ltd
Bushfire Management PlanNorthern Gateway Industrial Park, Stage 1
Bushfire Attack Level Contour PlanFigure 6:
Project:
Client: ± GDA 1994 MGA Zone 50
Scale: 1:6,250@A4
0 50 100 150
Metres
Plan Number:EP17-089(04)--F11Drawn:Date:Checked: Approved:Date:
KNM16/10/2017ADBKK02/11/2017
Please Note: This BAL contour plan has been prepared todetail the bushfire risk posed by vegetation within 150 m ofthe site only, in accordance with the Guidelines and AS 3959.Any landholdings outside of the site should be assessedseparately to inform development.
Figure 2 - BAL Contour PlanSource:BushfireSafetyConsulting
152322Rep124A 15
3.5.4 Infrastructure Servicing
A connection to a potable water supply and an underground electricity supply is required through standard subdivision conditions and will be delivered as part of subdivisional works prior to the title for the local service centre being created.
Wastewater treatment will occur on-site using secondary treatment systems with nutrient removal in accordance with the subdivision approval. The site is not within the ‘effluent sensitive area’ identified on the LSP Map. At 2.1 hectares in area, the local service centre site is suitably sized to allow for onsite treatment to occur. Details and specifications (including irrigation areas) for the treatment of effluent on-site will need to be provided as part of the development application in accordance with clause 6.3.1 of the LSP and the approved UWMP.

2322Rep124A
APPENDICES
Appendix 1: Retail Needs Assessment
Appendix 2: Traffic Impact Assessment Addendum
Appendix 3: Original Traffic Impact Assessment (2015)

172322Rep124A
APPENDIX 1
Retail Needs Assessment
Telephone: +61 8 9388-2893 Fax: +61 8 9381-4208 E-mail: [email protected] Web: www.shrapnel.com.au
SHRAPNEL URBAN PLANNING
Muchea Industrial Park LSP 1 Amendment
December 2020
Proposed Special Use ZoneRetail Needs Assessment
SHRAPNEL URBAN PLANNING
Muchea Industrial Park LSP 1 Amendment Special Use Zone – Retail Needs Assessment; December 2020
Contents
SUMMARY AND CONCLUSIONS ............................................................................................................... i
INTRODUCTION ....................................................................................................................................... 1
Rationale for the Special Use Zone ..................................................................................................... 3
Retail Needs Assessment .................................................................................................................... 4
Terminology ........................................................................................................................................ 4
RETAIL NEEDS ASSESSMENT ................................................................................................................... 6
Study Area ........................................................................................................................................... 6
Relevant Towns ................................................................................................................................... 7
Gingin Town Centre ........................................................................................................................ 7
Bindoon Town Centre ..................................................................................................................... 8
Muchea ........................................................................................................................................... 8
Bullsbrook ....................................................................................................................................... 9
Summary of existing retail floorspace in study area towns .......................................................... 10
Ellenbrook Central ........................................................................................................................ 10
Population and Retail Spending ........................................................................................................ 11
Retail Floorspace Needs (Primary study area) .................................................................................. 12
Current Unmet Demand (2020) .................................................................................................... 12
Population Forecasts ..................................................................................................................... 13
Potential Demand from Employees .............................................................................................. 14
Total Potential Shop/ Retail Floorspace Demand ......................................................................... 15
Passing non‐local Traffic ............................................................................................................... 16
Site Area ........................................................................................................................................ 16
SHRAPNEL URBAN PLANNING
Muchea Industrial Park LSP 1 Amendment Page i Special Use Zone – Retail Needs Assessment; December 2020
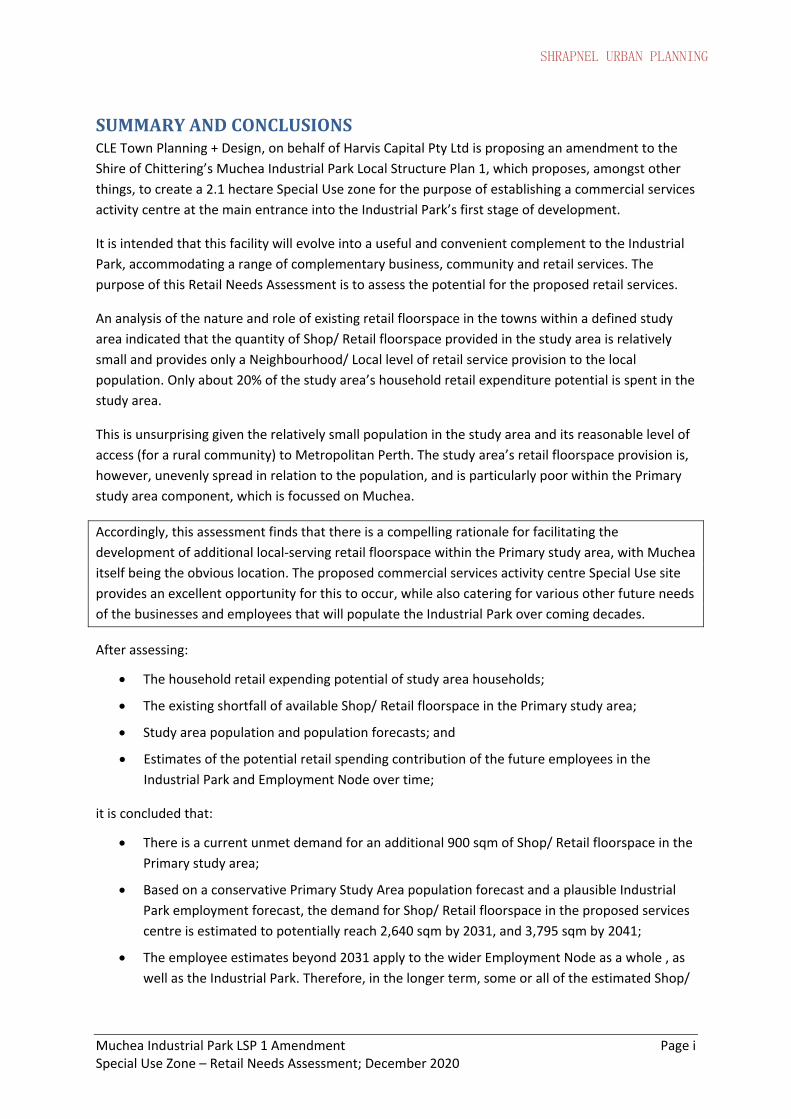
SUMMARYANDCONCLUSIONSCLE Town Planning + Design, on behalf of Harvis Capital Pty Ltd is proposing an amendment to the
Shire of Chittering’s Muchea Industrial Park Local Structure Plan 1, which proposes, amongst other
things, to create a 2.1 hectare Special Use zone for the purpose of establishing a commercial services
activity centre at the main entrance into the Industrial Park’s first stage of development.
It is intended that this facility will evolve into a useful and convenient complement to the Industrial
Park, accommodating a range of complementary business, community and retail services. The
purpose of this Retail Needs Assessment is to assess the potential for the proposed retail services.
An analysis of the nature and role of existing retail floorspace in the towns within a defined study
area indicated that the quantity of Shop/ Retail floorspace provided in the study area is relatively
small and provides only a Neighbourhood/ Local level of retail service provision to the local
population. Only about 20% of the study area’s household retail expenditure potential is spent in the
study area.
This is unsurprising given the relatively small population in the study area and its reasonable level of
access (for a rural community) to Metropolitan Perth. The study area’s retail floorspace provision is,
however, unevenly spread in relation to the population, and is particularly poor within the Primary
study area component, which is focussed on Muchea.
Accordingly, this assessment finds that there is a compelling rationale for facilitating the
development of additional local‐serving retail floorspace within the Primary study area, with Muchea
itself being the obvious location. The proposed commercial services activity centre Special Use site
provides an excellent opportunity for this to occur, while also catering for various other future needs
of the businesses and employees that will populate the Industrial Park over coming decades.
After assessing:
The household retail expending potential of study area households;
The existing shortfall of available Shop/ Retail floorspace in the Primary study area;
Study area population and population forecasts; and
Estimates of the potential retail spending contribution of the future employees in the
Industrial Park and Employment Node over time;
it is concluded that:
There is a current unmet demand for an additional 900 sqm of Shop/ Retail floorspace in the
Primary study area;
Based on a conservative Primary Study Area population forecast and a plausible Industrial
Park employment forecast, the demand for Shop/ Retail floorspace in the proposed services
centre is estimated to potentially reach 2,640 sqm by 2031, and 3,795 sqm by 2041;
The employee estimates beyond 2031 apply to the wider Employment Node as a whole , as
well as the Industrial Park. Therefore, in the longer term, some or all of the estimated Shop/
SHRAPNEL URBAN PLANNING
Muchea Industrial Park LSP 1 Amendment Page ii Special Use Zone – Retail Needs Assessment; December 2020
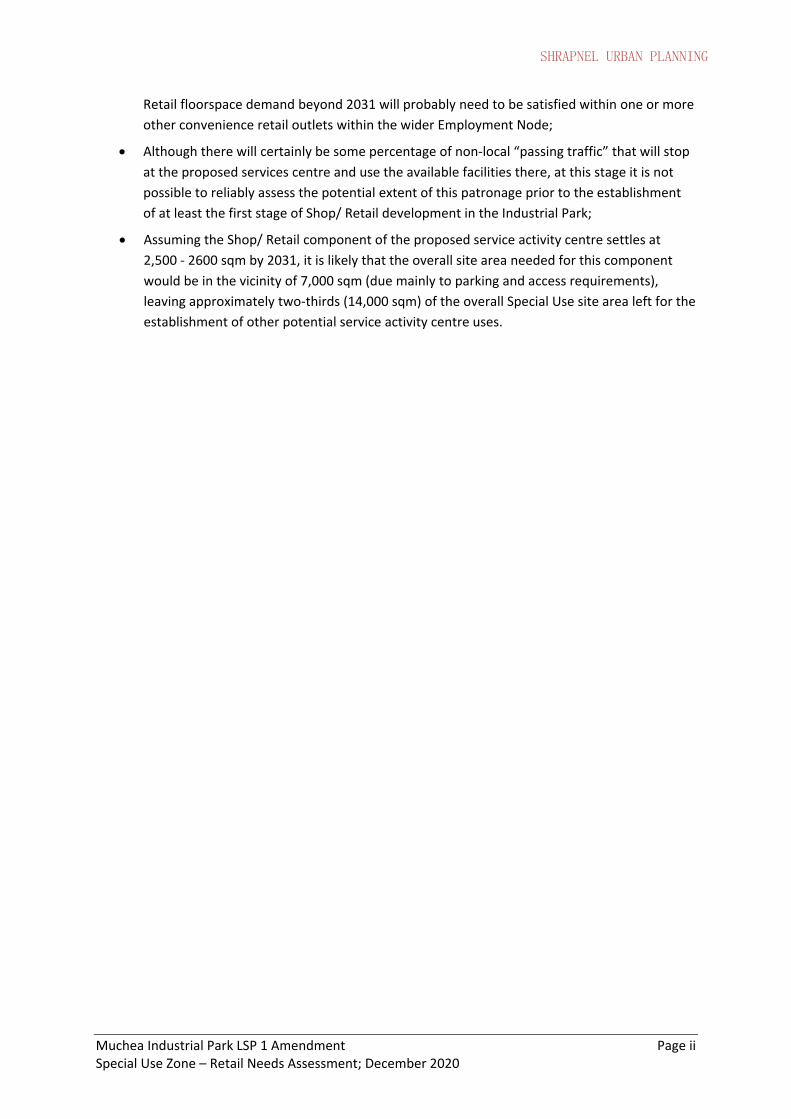
Retail floorspace demand beyond 2031 will probably need to be satisfied within one or more
other convenience retail outlets within the wider Employment Node;
Although there will certainly be some percentage of non‐local “passing traffic” that will stop
at the proposed services centre and use the available facilities there, at this stage it is not
possible to reliably assess the potential extent of this patronage prior to the establishment
of at least the first stage of Shop/ Retail development in the Industrial Park;
Assuming the Shop/ Retail component of the proposed service activity centre settles at
2,500 ‐ 2600 sqm by 2031, it is likely that the overall site area needed for this component
would be in the vicinity of 7,000 sqm (due mainly to parking and access requirements),
leaving approximately two‐thirds (14,000 sqm) of the overall Special Use site area left for the
establishment of other potential service activity centre uses.
SHRAPNEL URBAN PLANNING
Muchea Industrial Park LSP 1 Amendment Page 1 Special Use Zone – Retail Needs Assessment; December 2020
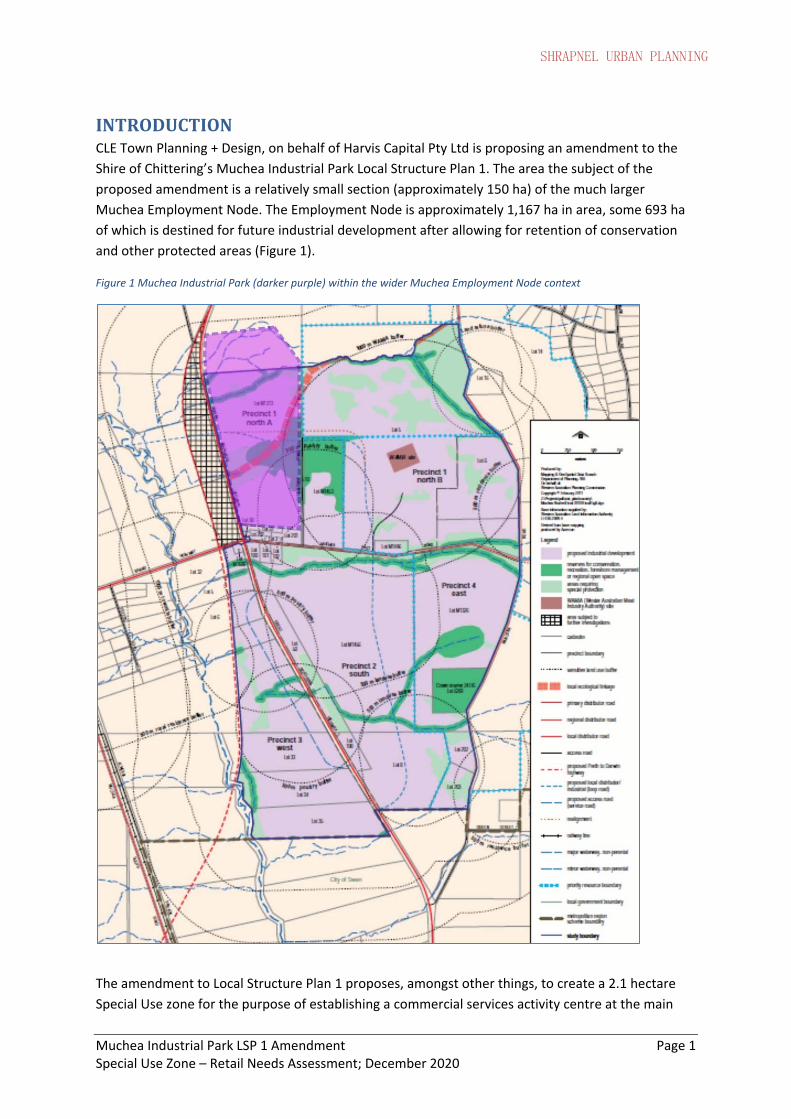
INTRODUCTIONCLE Town Planning + Design, on behalf of Harvis Capital Pty Ltd is proposing an amendment to the
Shire of Chittering’s Muchea Industrial Park Local Structure Plan 1. The area the subject of the
proposed amendment is a relatively small section (approximately 150 ha) of the much larger
Muchea Employment Node. The Employment Node is approximately 1,167 ha in area, some 693 ha
of which is destined for future industrial development after allowing for retention of conservation
and other protected areas (Figure 1).
Figure 1 Muchea Industrial Park (darker purple) within the wider Muchea Employment Node context
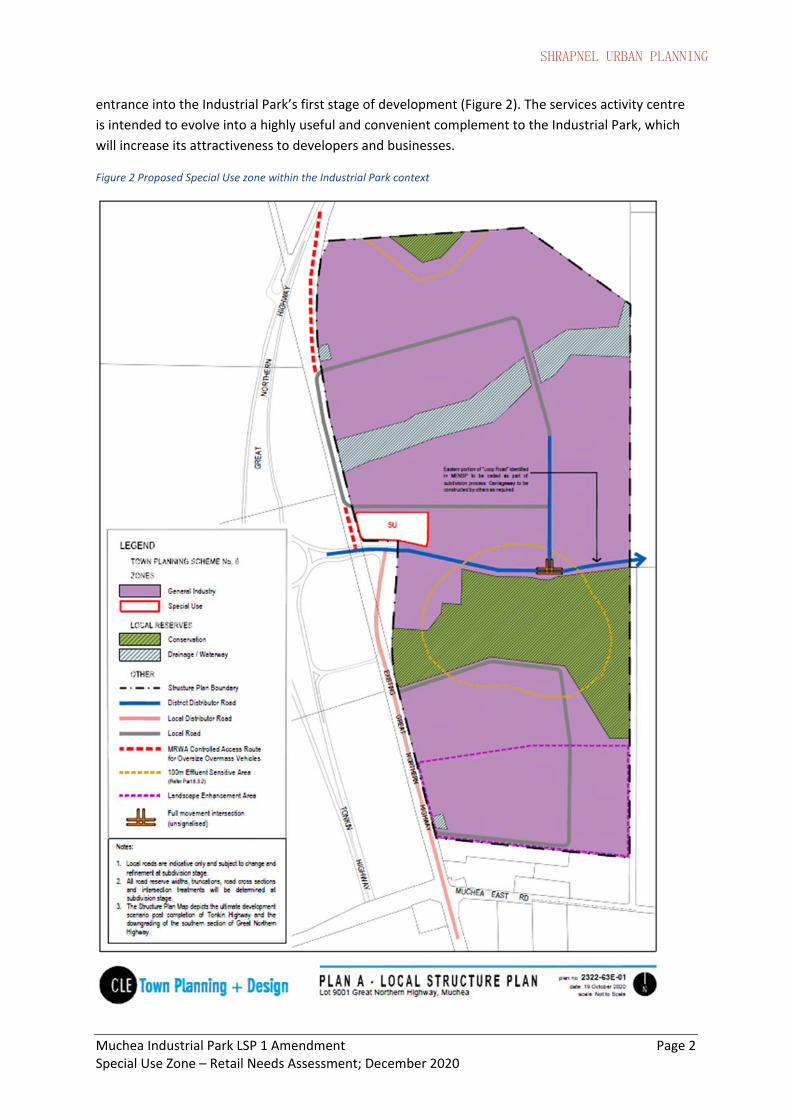
The amendment to Local Structure Plan 1 proposes, amongst other things, to create a 2.1 hectare
Special Use zone for the purpose of establishing a commercial services activity centre at the main
SHRAPNEL URBAN PLANNING
Muchea Industrial Park LSP 1 Amendment Page 2 Special Use Zone – Retail Needs Assessment; December 2020
entrance into the Industrial Park’s first stage of development (Figure 2). The services activity centre
is intended to evolve into a highly useful and convenient complement to the Industrial Park, which
will increase its attractiveness to developers and businesses.
Figure 2 Proposed Special Use zone within the Industrial Park context
SHRAPNEL URBAN PLANNING
Muchea Industrial Park LSP 1 Amendment Page 3 Special Use Zone – Retail Needs Assessment; December 2020
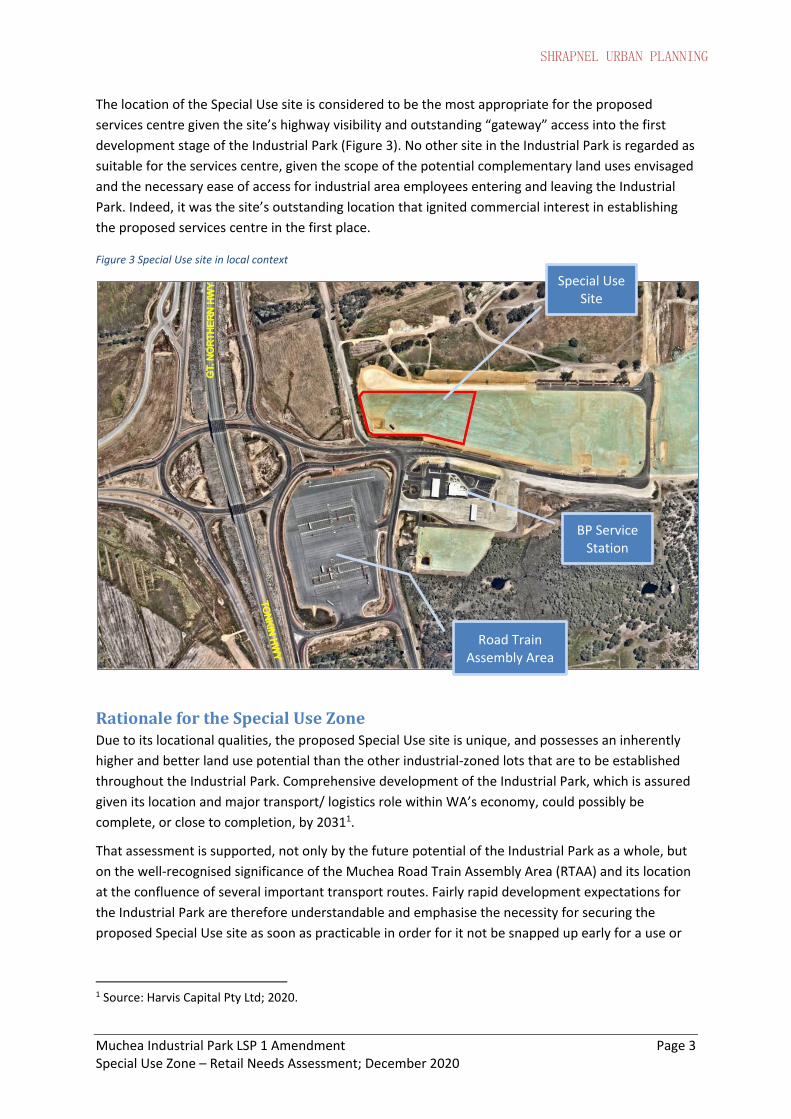
The location of the Special Use site is considered to be the most appropriate for the proposed
services centre given the site’s highway visibility and outstanding “gateway” access into the first
development stage of the Industrial Park (Figure 3). No other site in the Industrial Park is regarded as
suitable for the services centre, given the scope of the potential complementary land uses envisaged
and the necessary ease of access for industrial area employees entering and leaving the Industrial
Park. Indeed, it was the site’s outstanding location that ignited commercial interest in establishing
the proposed services centre in the first place.
Figure 3 Special Use site in local context
RationalefortheSpecialUseZoneDue to its locational qualities, the proposed Special Use site is unique, and possesses an inherently
higher and better land use potential than the other industrial‐zoned lots that are to be established
throughout the Industrial Park. Comprehensive development of the Industrial Park, which is assured
given its location and major transport/ logistics role within WA’s economy, could possibly be
complete, or close to completion, by 20311.
That assessment is supported, not only by the future potential of the Industrial Park as a whole, but
on the well‐recognised significance of the Muchea Road Train Assembly Area (RTAA) and its location
at the confluence of several important transport routes. Fairly rapid development expectations for
the Industrial Park are therefore understandable and emphasise the necessity for securing the
proposed Special Use site as soon as practicable in order for it not be snapped up early for a use or
1 Source: Harvis Capital Pty Ltd; 2020.
Special Use Site
BP Service Station
Road Train Assembly Area
SHRAPNEL URBAN PLANNING
Muchea Industrial Park LSP 1 Amendment Page 4 Special Use Zone – Retail Needs Assessment; December 2020
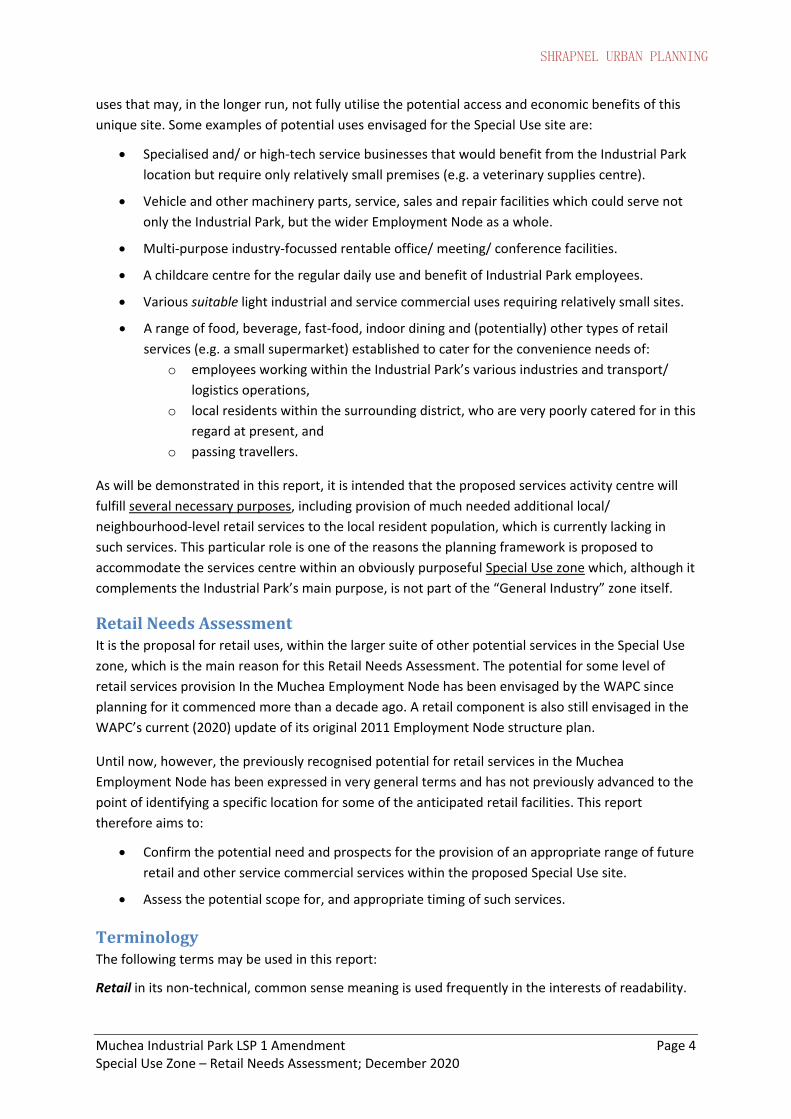
uses that may, in the longer run, not fully utilise the potential access and economic benefits of this
unique site. Some examples of potential uses envisaged for the Special Use site are:
Specialised and/ or high‐tech service businesses that would benefit from the Industrial Park
location but require only relatively small premises (e.g. a veterinary supplies centre).
Vehicle and other machinery parts, service, sales and repair facilities which could serve not
only the Industrial Park, but the wider Employment Node as a whole.
Multi‐purpose industry‐focussed rentable office/ meeting/ conference facilities.
A childcare centre for the regular daily use and benefit of Industrial Park employees.
Various suitable light industrial and service commercial uses requiring relatively small sites.
A range of food, beverage, fast‐food, indoor dining and (potentially) other types of retail
services (e.g. a small supermarket) established to cater for the convenience needs of:
o employees working within the Industrial Park’s various industries and transport/
logistics operations,
o local residents within the surrounding district, who are very poorly catered for in this
regard at present, and
o passing travellers.
As will be demonstrated in this report, it is intended that the proposed services activity centre will
fulfill several necessary purposes, including provision of much needed additional local/
neighbourhood‐level retail services to the local resident population, which is currently lacking in
such services. This particular role is one of the reasons the planning framework is proposed to
accommodate the services centre within an obviously purposeful Special Use zone which, although it
complements the Industrial Park’s main purpose, is not part of the “General Industry” zone itself.
RetailNeedsAssessmentIt is the proposal for retail uses, within the larger suite of other potential services in the Special Use
zone, which is the main reason for this Retail Needs Assessment. The potential for some level of
retail services provision In the Muchea Employment Node has been envisaged by the WAPC since
planning for it commenced more than a decade ago. A retail component is also still envisaged in the
WAPC’s current (2020) update of its original 2011 Employment Node structure plan.
Until now, however, the previously recognised potential for retail services in the Muchea
Employment Node has been expressed in very general terms and has not previously advanced to the
point of identifying a specific location for some of the anticipated retail facilities. This report
therefore aims to:
Confirm the potential need and prospects for the provision of an appropriate range of future
retail and other service commercial services within the proposed Special Use site.
Assess the potential scope for, and appropriate timing of such services.
TerminologyThe following terms may be used in this report:
Retail in its non‐technical, common sense meaning is used frequently in the interests of readability.
SHRAPNEL URBAN PLANNING
Muchea Industrial Park LSP 1 Amendment Page 5 Special Use Zone – Retail Needs Assessment; December 2020
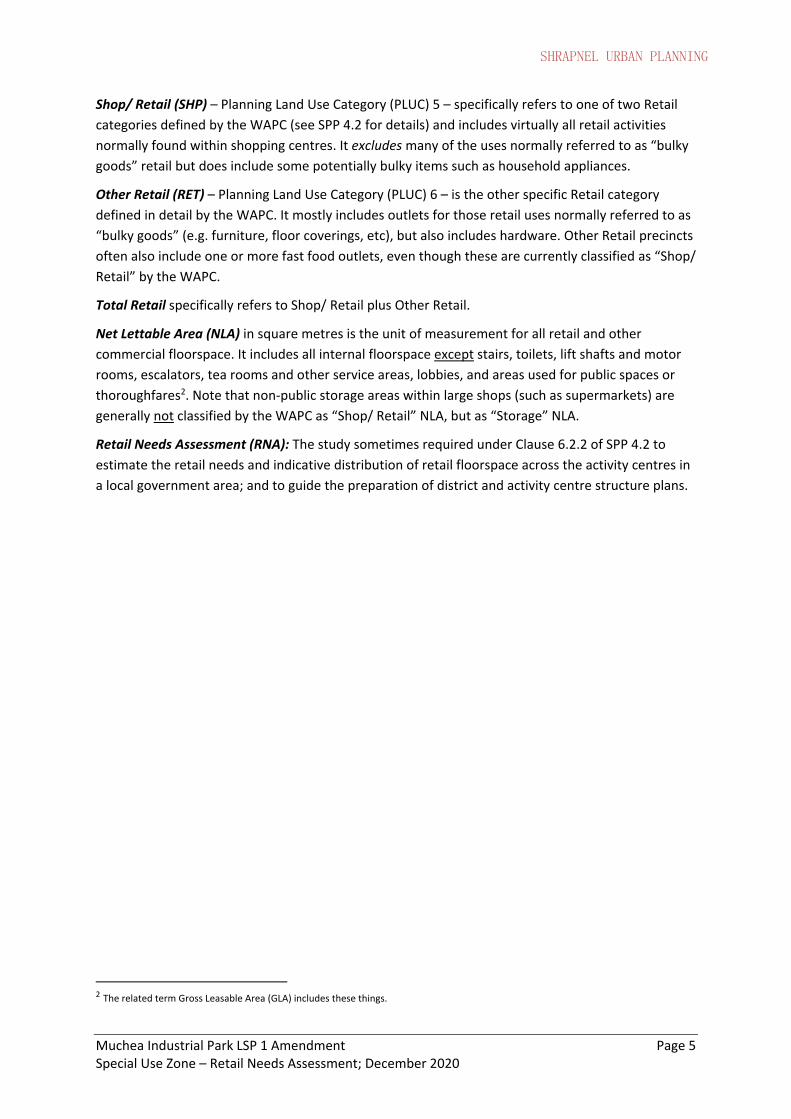
Shop/ Retail (SHP) – Planning Land Use Category (PLUC) 5 – specifically refers to one of two Retail
categories defined by the WAPC (see SPP 4.2 for details) and includes virtually all retail activities
normally found within shopping centres. It excludes many of the uses normally referred to as “bulky
goods” retail but does include some potentially bulky items such as household appliances.
Other Retail (RET) – Planning Land Use Category (PLUC) 6 – is the other specific Retail category
defined in detail by the WAPC. It mostly includes outlets for those retail uses normally referred to as
“bulky goods” (e.g. furniture, floor coverings, etc), but also includes hardware. Other Retail precincts
often also include one or more fast food outlets, even though these are currently classified as “Shop/
Retail” by the WAPC.
Total Retail specifically refers to Shop/ Retail plus Other Retail.
Net Lettable Area (NLA) in square metres is the unit of measurement for all retail and other
commercial floorspace. It includes all internal floorspace except stairs, toilets, lift shafts and motor
rooms, escalators, tea rooms and other service areas, lobbies, and areas used for public spaces or
thoroughfares2. Note that non‐public storage areas within large shops (such as supermarkets) are
generally not classified by the WAPC as “Shop/ Retail” NLA, but as “Storage” NLA.
Retail Needs Assessment (RNA): The study sometimes required under Clause 6.2.2 of SPP 4.2 to
estimate the retail needs and indicative distribution of retail floorspace across the activity centres in
a local government area; and to guide the preparation of district and activity centre structure plans.
2 The related term Gross Leasable Area (GLA) includes these things.
SHRAPNEL URBAN PLANNING
Muchea Industrial Park LSP 1 Amendment Page 6 Special Use Zone – Retail Needs Assessment; December 2020
RETAILNEEDSASSESSMENT
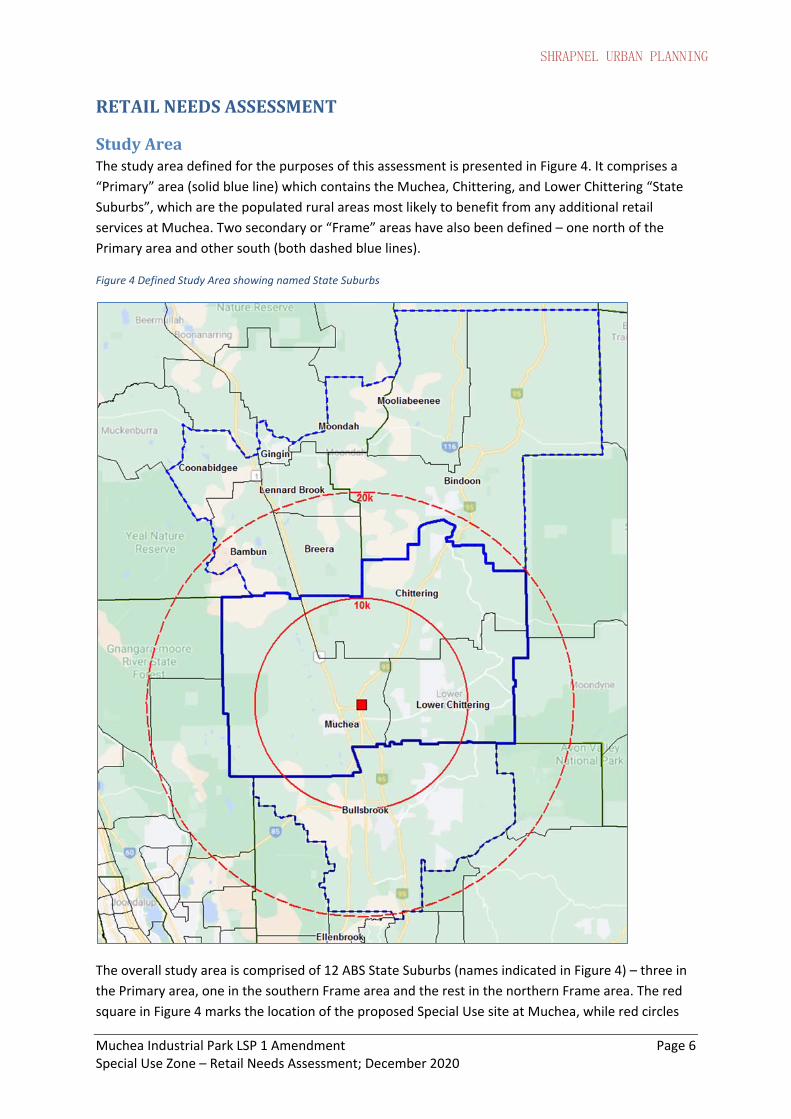
StudyAreaThe study area defined for the purposes of this assessment is presented in Figure 4. It comprises a
“Primary” area (solid blue line) which contains the Muchea, Chittering, and Lower Chittering “State
Suburbs”, which are the populated rural areas most likely to benefit from any additional retail
services at Muchea. Two secondary or “Frame” areas have also been defined – one north of the
Primary area and other south (both dashed blue lines).
Figure 4 Defined Study Area showing named State Suburbs
The overall study area is comprised of 12 ABS State Suburbs (names indicated in Figure 4) – three in
the Primary area, one in the southern Frame area and the rest in the northern Frame area. The red
square in Figure 4 marks the location of the proposed Special Use site at Muchea, while red circles
SHRAPNEL URBAN PLANNING
Muchea Industrial Park LSP 1 Amendment Page 7 Special Use Zone – Retail Needs Assessment; December 2020
define the 10 and 20 km radii around the Special Use site. State Suburbs were selected as the most
relevant sources of population data for this assessment, being the most useful in area.
RelevantTownsThe towns within the defined study area currently serving most of the local retail needs of the study
area population and travellers through the area, are:
Gingin (about 25km NNW of the SU site)
Bindoon (about 23km NNE of the SU site)
Muchea (town site about 2km SW of the SU site)
Bullsbrook (10km South of the SU site).
The commercial centres within each of these towns were surveyed for the purposes of this
assessment and the quantity and quality of retail floorspace estimated. Shop/ Retail (PLUC 5) and
Other Retail (PLUC 6) floorspace has been estimated separately.
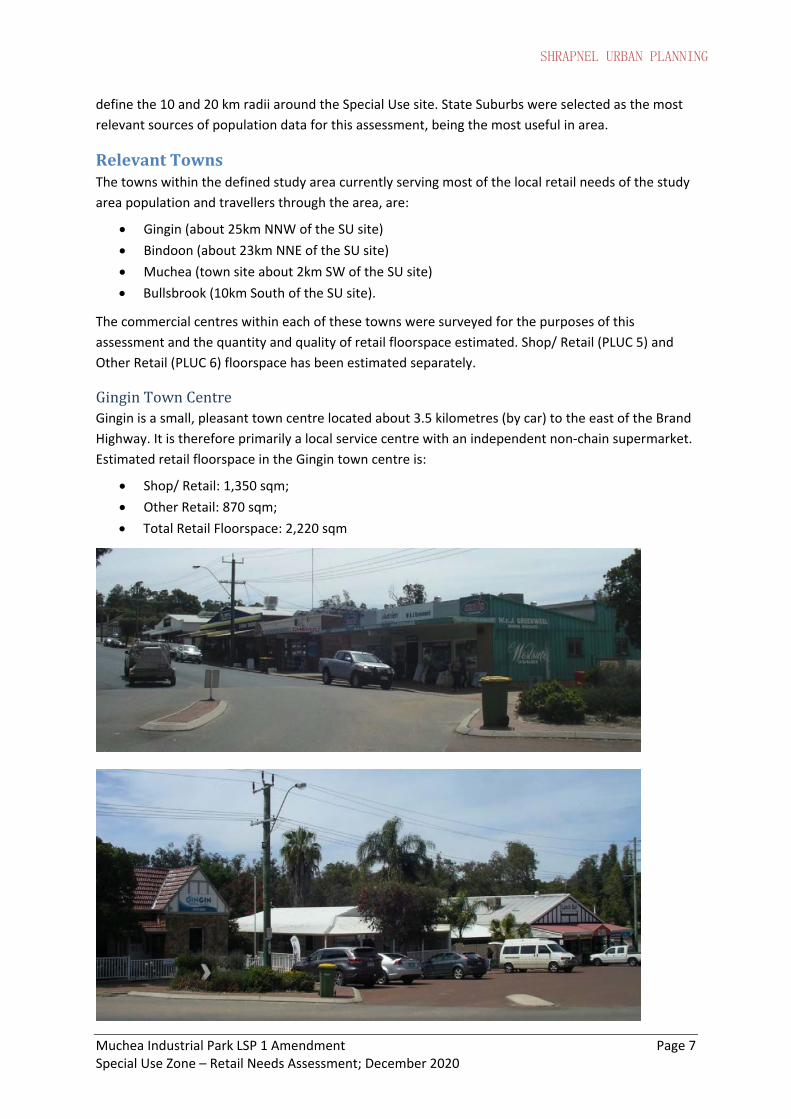
GinginTownCentreGingin is a small, pleasant town centre located about 3.5 kilometres (by car) to the east of the Brand
Highway. It is therefore primarily a local service centre with an independent non‐chain supermarket.
Estimated retail floorspace in the Gingin town centre is:
Shop/ Retail: 1,350 sqm;
Other Retail: 870 sqm;
Total Retail Floorspace: 2,220 sqm
SHRAPNEL URBAN PLANNING
Muchea Industrial Park LSP 1 Amendment Page 8 Special Use Zone – Retail Needs Assessment; December 2020
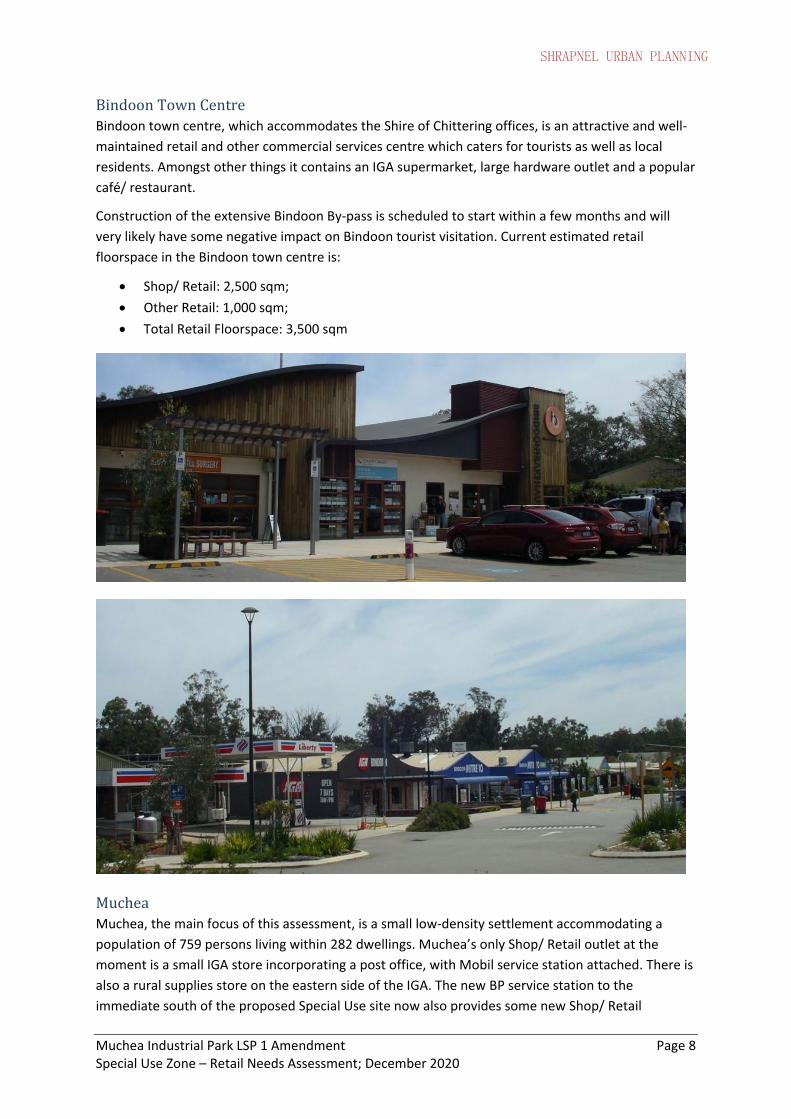
BindoonTownCentreBindoon town centre, which accommodates the Shire of Chittering offices, is an attractive and well‐
maintained retail and other commercial services centre which caters for tourists as well as local
residents. Amongst other things it contains an IGA supermarket, large hardware outlet and a popular
café/ restaurant.
Construction of the extensive Bindoon By‐pass is scheduled to start within a few months and will
very likely have some negative impact on Bindoon tourist visitation. Current estimated retail
floorspace in the Bindoon town centre is:
Shop/ Retail: 2,500 sqm;
Other Retail: 1,000 sqm;
Total Retail Floorspace: 3,500 sqm
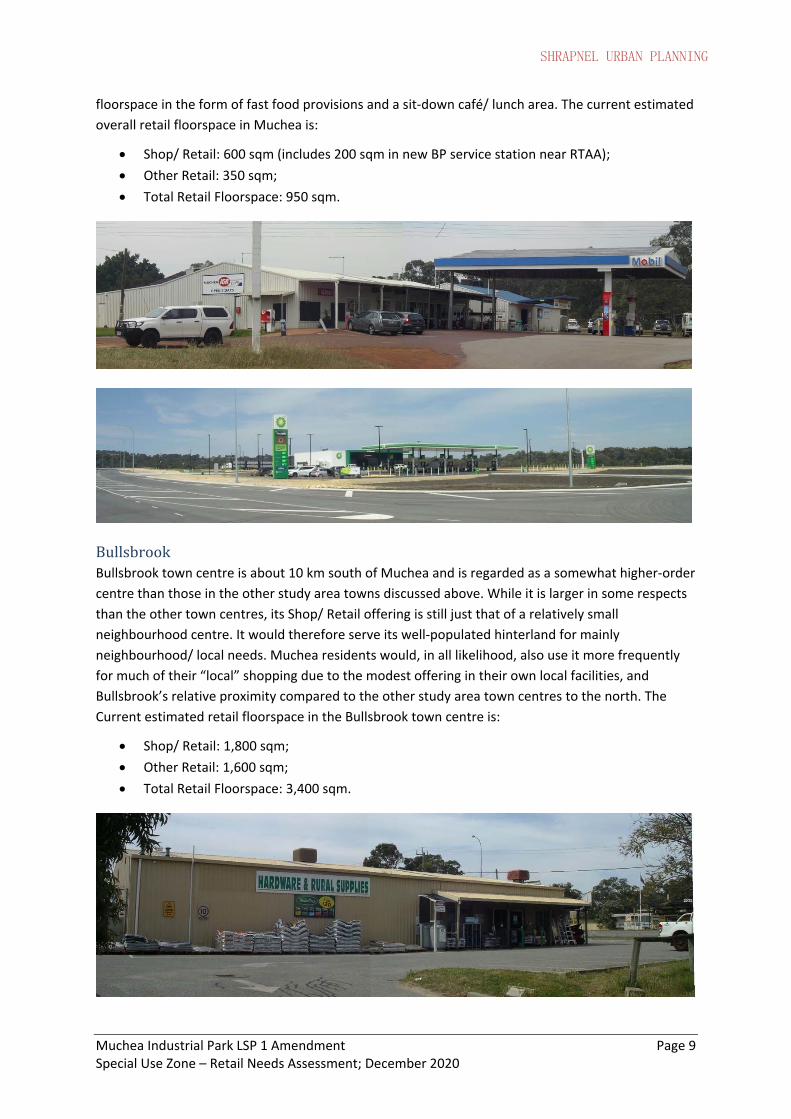
MucheaMuchea, the main focus of this assessment, is a small low‐density settlement accommodating a
population of 759 persons living within 282 dwellings. Muchea’s only Shop/ Retail outlet at the
moment is a small IGA store incorporating a post office, with Mobil service station attached. There is
also a rural supplies store on the eastern side of the IGA. The new BP service station to the
immediate south of the proposed Special Use site now also provides some new Shop/ Retail
SHRAPNEL URBAN PLANNING
Muchea Industrial Park LSP 1 Amendment Page 9 Special Use Zone – Retail Needs Assessment; December 2020
floorspace in the form of fast food provisions and a sit‐down café/ lunch area. The current estimated
overall retail floorspace in Muchea is:
Shop/ Retail: 600 sqm (includes 200 sqm in new BP service station near RTAA);
Other Retail: 350 sqm;
Total Retail Floorspace: 950 sqm.
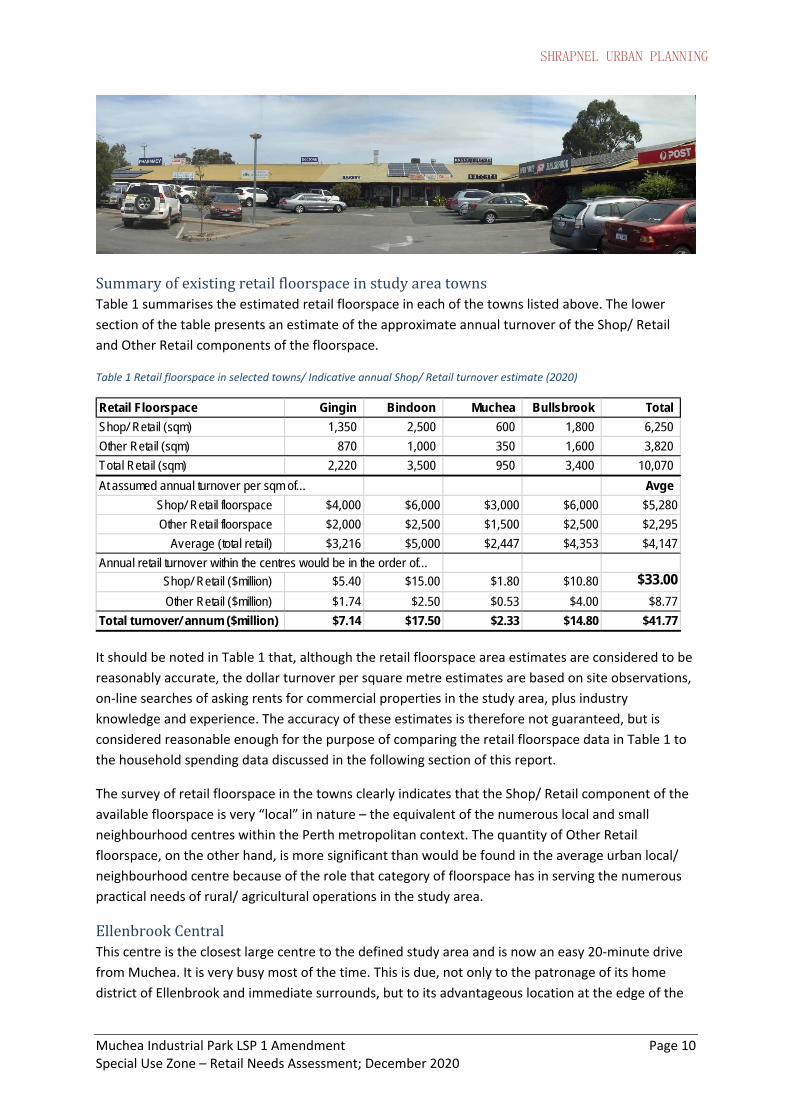
BullsbrookBullsbrook town centre is about 10 km south of Muchea and is regarded as a somewhat higher‐order
centre than those in the other study area towns discussed above. While it is larger in some respects
than the other town centres, its Shop/ Retail offering is still just that of a relatively small
neighbourhood centre. It would therefore serve its well‐populated hinterland for mainly
neighbourhood/ local needs. Muchea residents would, in all likelihood, also use it more frequently
for much of their “local” shopping due to the modest offering in their own local facilities, and
Bullsbrook’s relative proximity compared to the other study area town centres to the north. The
Current estimated retail floorspace in the Bullsbrook town centre is:
Shop/ Retail: 1,800 sqm;
Other Retail: 1,600 sqm;
Total Retail Floorspace: 3,400 sqm.
SHRAPNEL URBAN PLANNING
Muchea Industrial Park LSP 1 Amendment Page 10 Special Use Zone – Retail Needs Assessment; December 2020
SummaryofexistingretailfloorspaceinstudyareatownsTable 1 summarises the estimated retail floorspace in each of the towns listed above. The lower
section of the table presents an estimate of the approximate annual turnover of the Shop/ Retail
and Other Retail components of the floorspace.
Table 1 Retail floorspace in selected towns/ Indicative annual Shop/ Retail turnover estimate (2020)
Retail Floorspace Gingin Bindoon Muchea Bullsbrook Total
Shop/ Retail (sqm) 1,350 2,500 600 1,800 6,250
Other Retail (sqm) 870 1,000 350 1,600 3,820
Total Retail (sqm) 2,220 3,500 950 3,400 10,070
At assumed annual turnover per sqm of… Avge
Shop/ Retail floorspace $4,000 $6,000 $3,000 $6,000 $5,280
Other Retail floorspace $2,000 $2,500 $1,500 $2,500 $2,295
Average (total retail) $3,216 $5,000 $2,447 $4,353 $4,147
Annual retail turnover within the centres would be in the order of…
Shop/ Retail ($million) $5.40 $15.00 $1.80 $10.80 $33.00
Other Retail ($million) $1.74 $2.50 $0.53 $4.00 $8.77
Total turnover/ annum ($million) $7.14 $17.50 $2.33 $14.80 $41.77
It should be noted in Table 1 that, although the retail floorspace area estimates are considered to be
reasonably accurate, the dollar turnover per square metre estimates are based on site observations,
on‐line searches of asking rents for commercial properties in the study area, plus industry
knowledge and experience. The accuracy of these estimates is therefore not guaranteed, but is
considered reasonable enough for the purpose of comparing the retail floorspace data in Table 1 to
the household spending data discussed in the following section of this report.
The survey of retail floorspace in the towns clearly indicates that the Shop/ Retail component of the
available floorspace is very “local” in nature – the equivalent of the numerous local and small
neighbourhood centres within the Perth metropolitan context. The quantity of Other Retail
floorspace, on the other hand, is more significant than would be found in the average urban local/
neighbourhood centre because of the role that category of floorspace has in serving the numerous
practical needs of rural/ agricultural operations in the study area.
EllenbrookCentralThis centre is the closest large centre to the defined study area and is now an easy 20‐minute drive
from Muchea. It is very busy most of the time. This is due, not only to the patronage of its home
district of Ellenbrook and immediate surrounds, but to its advantageous location at the edge of the
SHRAPNEL URBAN PLANNING
Muchea Industrial Park LSP 1 Amendment Page 11 Special Use Zone – Retail Needs Assessment; December 2020
large rural hinterland to the north which, now and until a planned district centre in Bullsbrook is
eventually constructed, will cater only for small local/ neighbourhood retail floorspace demand.
Shop/ Retail: 28,501 sqm;
Other Retail: 30,926 sqm;
Total Retail Floorspace: 59,427 sqm
(Source WAPC Land Use and Employment Survey ~2016)
PopulationandRetailSpendingThis section assesses the overall spending potential of the study area’s population with a view to
estimating the proportion of its expenditure likely to occur within the retail floorspace available in
the study area’s towns, verses elsewhere – i.e. outside the study area, including online. Table 2
presents 2016 household and population data for the study area, including estimates of household
and individual retail spending.
Table 2 Population and annual retail spending by study area households (2016)3
Data Item Primary Area Frame Nth Frame Sth Total Study Area
Households 1,428 1,148 1,959 4,535
Persons 3,999 2,628 5,185 11,812
Convenience Shop/ Retail ($M/ annum) $37.10 $25.34 $50.06 $112.49
Comparison Shop/ Retail ($M/ annum) $12.33 $7.52 $16.86 $36.71
Total Shop/ Retail Spend ($M/ annum) $49.42 $32.85 $66.92 $149.20
Avge annual Shop/ Retail Spend per household $34,610 $28,618 $34,162 $32,900
Avge annual Shop/ Retail Spend per person $12,359 $12,502 $12,907 $12,631
Total Other Retail Spend ($M/ annum) $20.11 $12.77 $25.24 $58.12
Avge annual Other Retail Spend per household $14,085 $11,119 $12,887 $12,817
Avge annual Other/ Retail Spend per person $5,030 $4,857 $4,869 $4,921
Total Retail Spend ($M/ annum) $69.54 $45.62 $92.17 $207.32
Avge annual Total Retail Spend per Household $48,695 $39,738 $47,049 $45,717
Avge annual Total Spend per Person $17,388 $17,359 $17,776 $17,552
Sources: Households & Population – ABS; Retail Spending – Market Data Systems (2016)
3 NOTE: For the purposes of this assessment it is assumed that the 2016 household expenditure estimates presented in Table 2 still apply in 2020.
SHRAPNEL URBAN PLANNING
Muchea Industrial Park LSP 1 Amendment Page 12 Special Use Zone – Retail Needs Assessment; December 2020
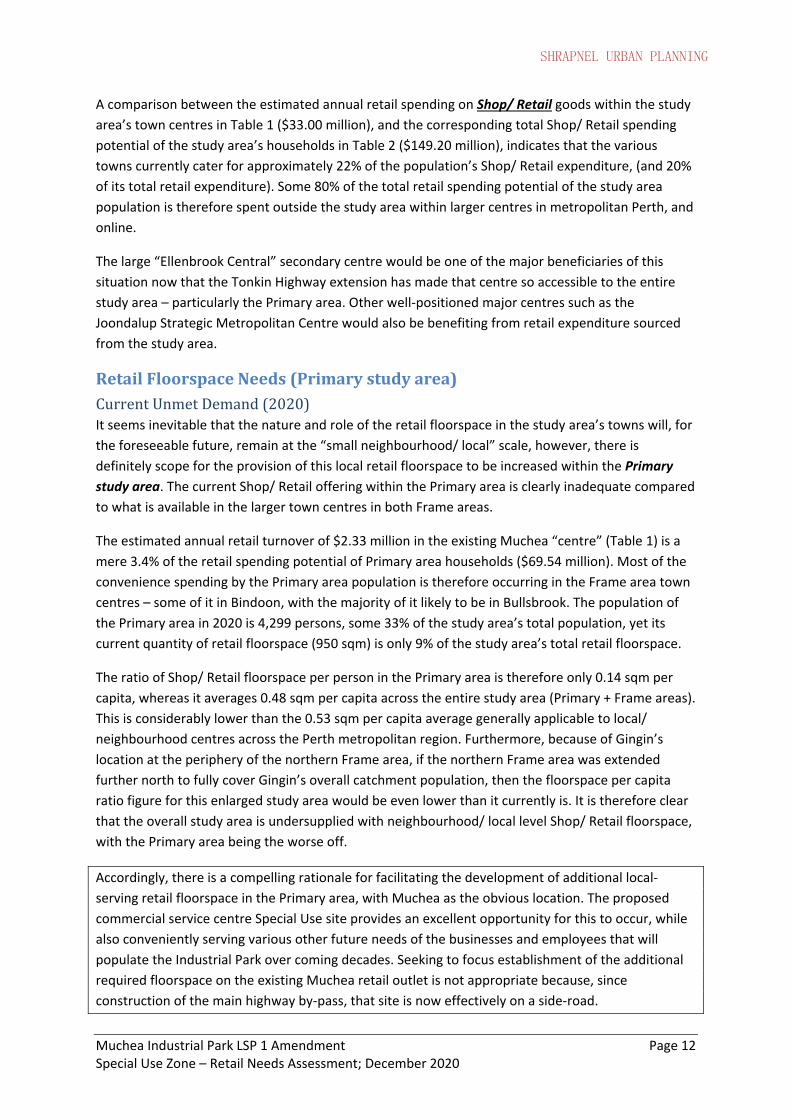
A comparison between the estimated annual retail spending on Shop/ Retail goods within the study
area’s town centres in Table 1 ($33.00 million), and the corresponding total Shop/ Retail spending
potential of the study area’s households in Table 2 ($149.20 million), indicates that the various
towns currently cater for approximately 22% of the population’s Shop/ Retail expenditure, (and 20%
of its total retail expenditure). Some 80% of the total retail spending potential of the study area
population is therefore spent outside the study area within larger centres in metropolitan Perth, and
online.
The large “Ellenbrook Central” secondary centre would be one of the major beneficiaries of this
situation now that the Tonkin Highway extension has made that centre so accessible to the entire
study area – particularly the Primary area. Other well‐positioned major centres such as the
Joondalup Strategic Metropolitan Centre would also be benefiting from retail expenditure sourced
from the study area.
RetailFloorspaceNeeds(Primarystudyarea)CurrentUnmetDemand(2020)It seems inevitable that the nature and role of the retail floorspace in the study area’s towns will, for
the foreseeable future, remain at the “small neighbourhood/ local” scale, however, there is
definitely scope for the provision of this local retail floorspace to be increased within the Primary
study area. The current Shop/ Retail offering within the Primary area is clearly inadequate compared
to what is available in the larger town centres in both Frame areas.
The estimated annual retail turnover of $2.33 million in the existing Muchea “centre” (Table 1) is a
mere 3.4% of the retail spending potential of Primary area households ($69.54 million). Most of the
convenience spending by the Primary area population is therefore occurring in the Frame area town
centres – some of it in Bindoon, with the majority of it likely to be in Bullsbrook. The population of
the Primary area in 2020 is 4,299 persons, some 33% of the study area’s total population, yet its
current quantity of retail floorspace (950 sqm) is only 9% of the study area’s total retail floorspace.
The ratio of Shop/ Retail floorspace per person in the Primary area is therefore only 0.14 sqm per
capita, whereas it averages 0.48 sqm per capita across the entire study area (Primary + Frame areas).
This is considerably lower than the 0.53 sqm per capita average generally applicable to local/
neighbourhood centres across the Perth metropolitan region. Furthermore, because of Gingin’s
location at the periphery of the northern Frame area, if the northern Frame area was extended
further north to fully cover Gingin’s overall catchment population, then the floorspace per capita
ratio figure for this enlarged study area would be even lower than it currently is. It is therefore clear
that the overall study area is undersupplied with neighbourhood/ local level Shop/ Retail floorspace,
with the Primary area being the worse off.
Accordingly, there is a compelling rationale for facilitating the development of additional local‐
serving retail floorspace in the Primary area, with Muchea as the obvious location. The proposed
commercial service centre Special Use site provides an excellent opportunity for this to occur, while
also conveniently serving various other future needs of the businesses and employees that will
populate the Industrial Park over coming decades. Seeking to focus establishment of the additional
required floorspace on the existing Muchea retail outlet is not appropriate because, since
construction of the main highway by‐pass, that site is now effectively on a side‐road.
SHRAPNEL URBAN PLANNING
Muchea Industrial Park LSP 1 Amendment Page 13 Special Use Zone – Retail Needs Assessment; December 2020
Accounting for these factors it is considered reasonable that, for local retail floorspace planning
purposes, a Shop/ Retail floorspace per capita ratio of .35 sqm be applied within the Primary area
itself. This ratio strikes a reasonable and practicable balance point between the ratio for the study
area as a whole, and the inappropriately low ratio currently applying to the Primary area component
of the study area.
Applying the .35 sqm per capita ratio to the current Primary area population (4,299 in 2020), results
in an estimate of 1,505 sqm of Shop/ Retail floorspace in Muchea instead of the existing 600 sqm4.
This floorspace would be generating annual Shop/ Retail turnover of between $4.5 million and $6.0
million, depending on the quality of the floorspace5, thus putting it on a par with the estimated
performance of Gingin town centre. It would also be saving local residents much travel time.
Therefore, taking account of the approximately 200 sqm of retail space now provided within the BP
Service Station, it is concluded that there is currently (2020) an unmet demand for 905 sqm of
Shop/ Retail floorspace within the Primary area.
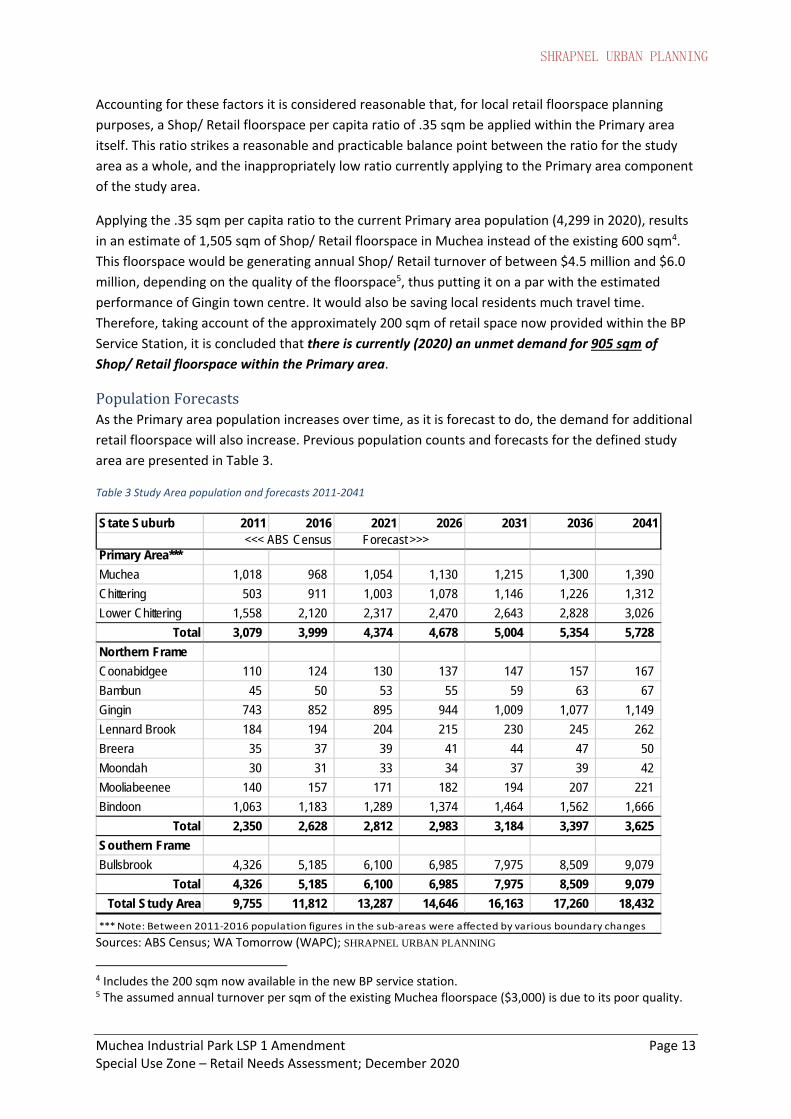
PopulationForecastsAs the Primary area population increases over time, as it is forecast to do, the demand for additional
retail floorspace will also increase. Previous population counts and forecasts for the defined study
area are presented in Table 3.
Table 3 Study Area population and forecasts 2011‐2041
State Suburb 2011 2016 2021 2026 2031 2036 2041 <<< ABS Census Forecast >>>
Primary Area***
Muchea 1,018 968 1,054 1,130 1,215 1,300 1,390
Chittering 503 911 1,003 1,078 1,146 1,226 1,312
Lower Chittering 1,558 2,120 2,317 2,470 2,643 2,828 3,026
Total 3,079 3,999 4,374 4,678 5,004 5,354 5,728
Northern Frame
Coonabidgee 110 124 130 137 147 157 167
Bambun 45 50 53 55 59 63 67
Gingin 743 852 895 944 1,009 1,077 1,149
Lennard Brook 184 194 204 215 230 245 262
Breera 35 37 39 41 44 47 50
Moondah 30 31 33 34 37 39 42
Mooliabeenee 140 157 171 182 194 207 221
Bindoon 1,063 1,183 1,289 1,374 1,464 1,562 1,666
Total 2,350 2,628 2,812 2,983 3,184 3,397 3,625
Southern Frame
Bullsbrook 4,326 5,185 6,100 6,985 7,975 8,509 9,079
Total 4,326 5,185 6,100 6,985 7,975 8,509 9,079
Total Study Area 9,755 11,812 13,287 14,646 16,163 17,260 18,432
*** Note: Between 2011‐2016 population figures in the sub‐areas were affected by various boundary changes
Sources: ABS Census; WA Tomorrow (WAPC); SHRAPNEL URBAN PLANNING
4 Includes the 200 sqm now available in the new BP service station. 5 The assumed annual turnover per sqm of the existing Muchea floorspace ($3,000) is due to its poor quality.
SHRAPNEL URBAN PLANNING
Muchea Industrial Park LSP 1 Amendment Page 14 Special Use Zone – Retail Needs Assessment; December 2020
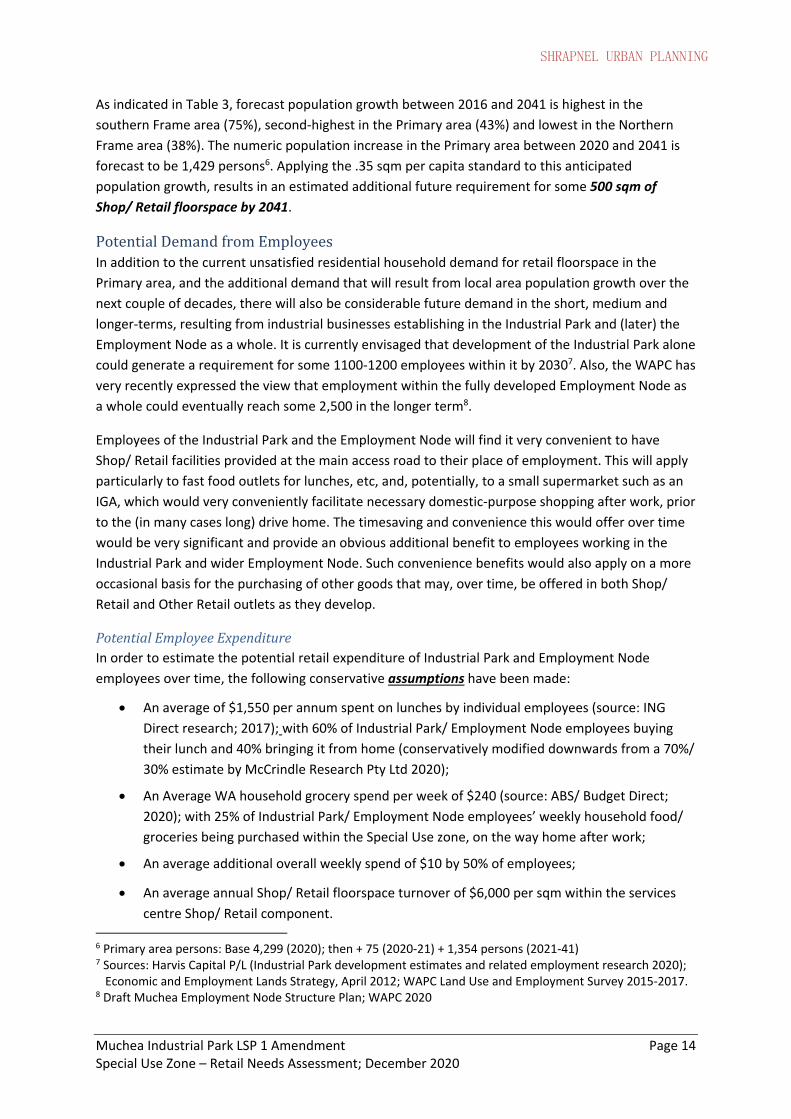
As indicated in Table 3, forecast population growth between 2016 and 2041 is highest in the
southern Frame area (75%), second‐highest in the Primary area (43%) and lowest in the Northern
Frame area (38%). The numeric population increase in the Primary area between 2020 and 2041 is
forecast to be 1,429 persons6. Applying the .35 sqm per capita standard to this anticipated
population growth, results in an estimated additional future requirement for some 500 sqm of
Shop/ Retail floorspace by 2041.
PotentialDemandfromEmployeesIn addition to the current unsatisfied residential household demand for retail floorspace in the
Primary area, and the additional demand that will result from local area population growth over the
next couple of decades, there will also be considerable future demand in the short, medium and
longer‐terms, resulting from industrial businesses establishing in the Industrial Park and (later) the
Employment Node as a whole. It is currently envisaged that development of the Industrial Park alone
could generate a requirement for some 1100‐1200 employees within it by 20307. Also, the WAPC has
very recently expressed the view that employment within the fully developed Employment Node as
a whole could eventually reach some 2,500 in the longer term8.
Employees of the Industrial Park and the Employment Node will find it very convenient to have
Shop/ Retail facilities provided at the main access road to their place of employment. This will apply
particularly to fast food outlets for lunches, etc, and, potentially, to a small supermarket such as an
IGA, which would very conveniently facilitate necessary domestic‐purpose shopping after work, prior
to the (in many cases long) drive home. The timesaving and convenience this would offer over time
would be very significant and provide an obvious additional benefit to employees working in the
Industrial Park and wider Employment Node. Such convenience benefits would also apply on a more
occasional basis for the purchasing of other goods that may, over time, be offered in both Shop/
Retail and Other Retail outlets as they develop.
PotentialEmployeeExpenditureIn order to estimate the potential retail expenditure of Industrial Park and Employment Node
employees over time, the following conservative assumptions have been made:
An average of $1,550 per annum spent on lunches by individual employees (source: ING
Direct research; 2017); with 60% of Industrial Park/ Employment Node employees buying
their lunch and 40% bringing it from home (conservatively modified downwards from a 70%/
30% estimate by McCrindle Research Pty Ltd 2020);
An Average WA household grocery spend per week of $240 (source: ABS/ Budget Direct;
2020); with 25% of Industrial Park/ Employment Node employees’ weekly household food/
groceries being purchased within the Special Use zone, on the way home after work;
An average additional overall weekly spend of $10 by 50% of employees;
An average annual Shop/ Retail floorspace turnover of $6,000 per sqm within the services
centre Shop/ Retail component.
6 Primary area persons: Base 4,299 (2020); then + 75 (2020‐21) + 1,354 persons (2021‐41) 7 Sources: Harvis Capital P/L (Industrial Park development estimates and related employment research 2020); Economic and Employment Lands Strategy, April 2012; WAPC Land Use and Employment Survey 2015‐2017.
8 Draft Muchea Employment Node Structure Plan; WAPC 2020
SHRAPNEL URBAN PLANNING
Muchea Industrial Park LSP 1 Amendment Page 15 Special Use Zone – Retail Needs Assessment; December 2020
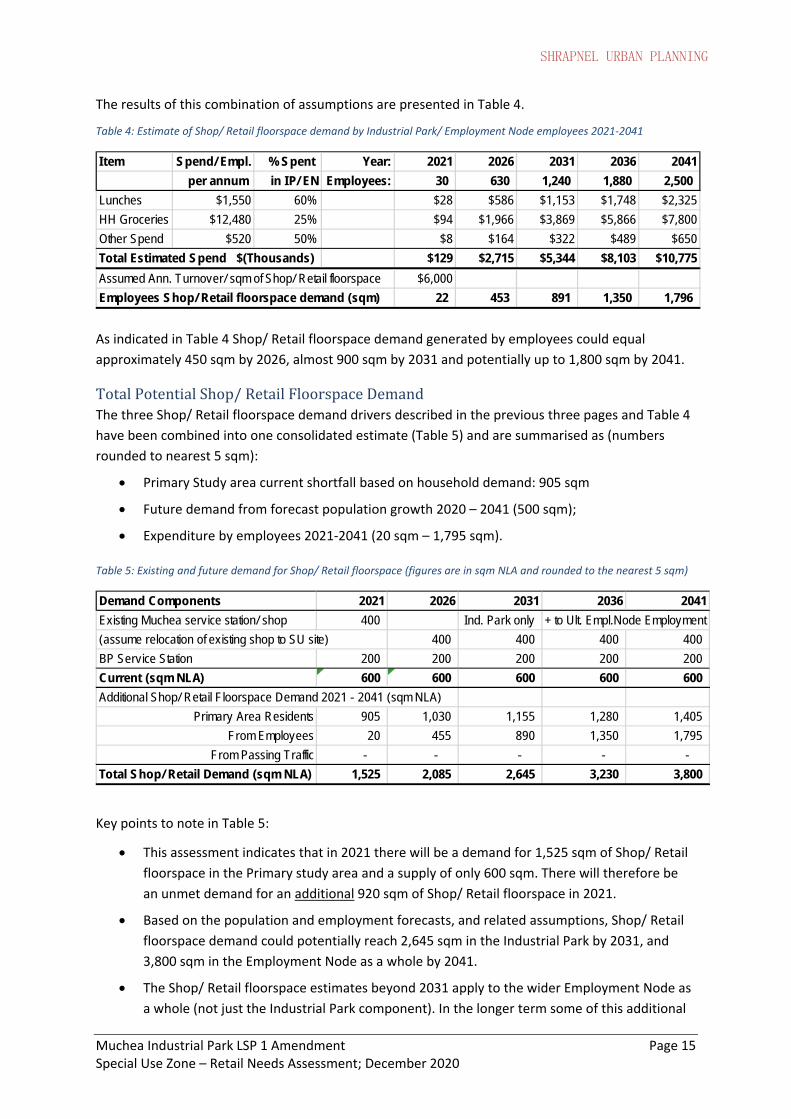
The results of this combination of assumptions are presented in Table 4.
Table 4: Estimate of Shop/ Retail floorspace demand by Industrial Park/ Employment Node employees 2021‐2041
I tem Spend/ Empl. % Spent Year: 2021 2026 2031 2036 2041
per annum in IP/ EN Employees: 30 630 1,240 1,880 2,500
Lunches $1,550 60% $28 $586 $1,153 $1,748 $2,325
HH Groceries $12,480 25% $94 $1,966 $3,869 $5,866 $7,800
Other Spend $520 50% $8 $164 $322 $489 $650
Total Estimated Spend $(Thousands) $129 $2,715 $5,344 $8,103 $10,775
Assumed Ann. Turnover/ sqm of Shop/ Retail floorspace $6,000
Employees Shop/ Retail floorspace demand (sqm) 22 453 891 1,350 1,796
As indicated in Table 4 Shop/ Retail floorspace demand generated by employees could equal
approximately 450 sqm by 2026, almost 900 sqm by 2031 and potentially up to 1,800 sqm by 2041.
TotalPotentialShop/RetailFloorspaceDemandThe three Shop/ Retail floorspace demand drivers described in the previous three pages and Table 4
have been combined into one consolidated estimate (Table 5) and are summarised as (numbers
rounded to nearest 5 sqm):
Primary Study area current shortfall based on household demand: 905 sqm
Future demand from forecast population growth 2020 – 2041 (500 sqm);
Expenditure by employees 2021‐2041 (20 sqm – 1,795 sqm).
Table 5: Existing and future demand for Shop/ Retail floorspace (figures are in sqm NLA and rounded to the nearest 5 sqm)
Demand Components 2021 2026 2031 2036 2041
Existing Muchea service station/ shop 400 Ind. Park only + to Ult. Empl.Node Employment
(assume relocation of existing shop to SU site) 400 400 400 400
BP Service Station 200 200 200 200 200
Current (sqm NLA) 600 600 600 600 600
Additional Shop/ Retail Floorspace Demand 2021 - 2041 (sqm NLA)
Primary Area Residents 905 1,030 1,155 1,280 1,405
From Employees 20 455 890 1,350 1,795
From Passing Traffic - - - - -
Total Shop/ Retail Demand (sqm NLA) 1,525 2,085 2,645 3,230 3,800
Key points to note in Table 5:
This assessment indicates that in 2021 there will be a demand for 1,525 sqm of Shop/ Retail
floorspace in the Primary study area and a supply of only 600 sqm. There will therefore be
an unmet demand for an additional 920 sqm of Shop/ Retail floorspace in 2021.
Based on the population and employment forecasts, and related assumptions, Shop/ Retail
floorspace demand could potentially reach 2,645 sqm in the Industrial Park by 2031, and
3,800 sqm in the Employment Node as a whole by 2041.
The Shop/ Retail floorspace estimates beyond 2031 apply to the wider Employment Node as
a whole (not just the Industrial Park component). In the longer term some of this additional
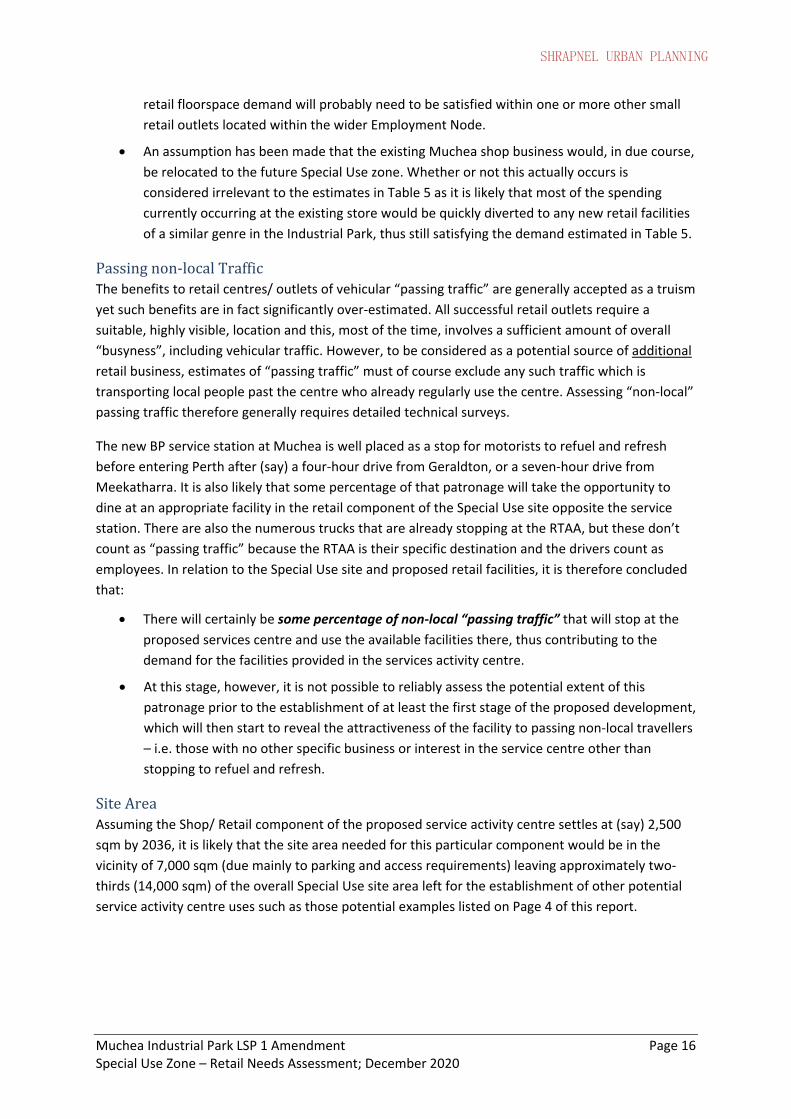
SHRAPNEL URBAN PLANNING
Muchea Industrial Park LSP 1 Amendment Page 16 Special Use Zone – Retail Needs Assessment; December 2020
retail floorspace demand will probably need to be satisfied within one or more other small
retail outlets located within the wider Employment Node.
An assumption has been made that the existing Muchea shop business would, in due course,
be relocated to the future Special Use zone. Whether or not this actually occurs is
considered irrelevant to the estimates in Table 5 as it is likely that most of the spending
currently occurring at the existing store would be quickly diverted to any new retail facilities
of a similar genre in the Industrial Park, thus still satisfying the demand estimated in Table 5.
Passingnon‐localTrafficThe benefits to retail centres/ outlets of vehicular “passing traffic” are generally accepted as a truism
yet such benefits are in fact significantly over‐estimated. All successful retail outlets require a
suitable, highly visible, location and this, most of the time, involves a sufficient amount of overall
“busyness”, including vehicular traffic. However, to be considered as a potential source of additional
retail business, estimates of “passing traffic” must of course exclude any such traffic which is
transporting local people past the centre who already regularly use the centre. Assessing “non‐local”
passing traffic therefore generally requires detailed technical surveys.
The new BP service station at Muchea is well placed as a stop for motorists to refuel and refresh
before entering Perth after (say) a four‐hour drive from Geraldton, or a seven‐hour drive from
Meekatharra. It is also likely that some percentage of that patronage will take the opportunity to
dine at an appropriate facility in the retail component of the Special Use site opposite the service
station. There are also the numerous trucks that are already stopping at the RTAA, but these don’t
count as “passing traffic” because the RTAA is their specific destination and the drivers count as
employees. In relation to the Special Use site and proposed retail facilities, it is therefore concluded
that:
There will certainly be some percentage of non‐local “passing traffic” that will stop at the
proposed services centre and use the available facilities there, thus contributing to the
demand for the facilities provided in the services activity centre.
At this stage, however, it is not possible to reliably assess the potential extent of this
patronage prior to the establishment of at least the first stage of the proposed development,
which will then start to reveal the attractiveness of the facility to passing non‐local travellers
– i.e. those with no other specific business or interest in the service centre other than
stopping to refuel and refresh.
SiteAreaAssuming the Shop/ Retail component of the proposed service activity centre settles at (say) 2,500
sqm by 2036, it is likely that the site area needed for this particular component would be in the
vicinity of 7,000 sqm (due mainly to parking and access requirements) leaving approximately two‐
thirds (14,000 sqm) of the overall Special Use site area left for the establishment of other potential
service activity centre uses such as those potential examples listed on Page 4 of this report.

2322Rep124A
APPENDIX 2
Traffic Impact Assessment Addendum

HARVIS
MUCHEA INDUSTRIAL PARK
TRANSPORT ASSESSMENT ADDENDUM
DECEMBER 2020
CONFIDENTIAL
This document may contain confidential and legally privileged information, neither of which are intended to be waived,
and must be used only for its intended purpose. Any unauthorised copying, dissemination or use in any form or by any
means other than by the addressee, is strictly prohibited. If you have received this document in error or by any means
other than as authorised addressee, please notify us immediately and we will arrange for its return to us.
PS121619-PAM-REP-0001_Rev B Confidential December 2020
Muchea Industrial Park Transport Assessment Addendum
Harvis
WSP
Level 5, 503 Murray Street
Perth WA 6000
PO Box 7181
Cloisters Square WA 6850
Tel: +61 8 9489 9700
Fax: +61 8 9489 9777
wsp.com
REV DATE DETAILS
A 10/12/20 Draft for client review
B 18/12/20 Final
NAME DATE SIGNATURE
Prepared by: Lachlan Piper 10/12/20
Reviewed by: Leigh Dawson 17/12/20
Approved by: Mark Fowler 18/12/20
1 INTRODUCTION ................................................................... 1
1.1 CONTEXT.................................................................................... 1
2 EXISTING SITUATION ......................................................... 2
2.1 LSP AREA USE AND LOCATION ............................................. 2
2.2 EXISTING TRANSPORT NETWORKS ...................................... 2
2.3 EXISTING TRAFFIC VOLUMES ................................................ 2
3 DEVELOPMENT PROPOSAL ............................................ 7
3.1 CONTEXT.................................................................................... 7
3.2 DEVELOPMENT PROPOSAL .................................................... 7
4 TRAFFIC IMPACT ASSESSMENT .................................... 9
4.1 ASSESSMENT SCENARIOS ..................................................... 9
4.2 ASSUMPTIONS .......................................................................... 9
4.3 TRAFFIC GENERATION .......................................................... 11
4.4 DISTRIBUTION AND ASSIGNMENT ....................................... 13
4.5 TRAFFIC IMPACT ASSESSMENT .......................................... 15
4.6 ROAD HIERARCHY AND CROSS-SECTIONS ....................... 16
5 CONCLUSION ..................................................................... 21
TABLE OF CONTENTS
Project No PS121619 Muchea Industrial Park Transport Assessment Addendum Harvis
WSP December 2020
Page 1
1 INTRODUCTION
1.1 CONTEXT
This Addendum provides an update to the Lot 102, Muchea Local Structure Plan Transport Assessment Issue C report
dated 21/12/15 prepared by GTA consultants (the original report), in relation to the proposed Local Structure Plan LSP,
at the now named Muchea Industrial Park.
The Addendum is provided to account for an update to the LSP land and transport network assumptions, updating only
sections of the original report impacted by the changes, as such this Addendum should be read in conjunction with the
original report.
The changes accounted for in this Addendum include:
— Access arrangements to the LSP, including a change already approved as part of the original LSP approval process
— A revision to both the proposed land uses
— The external transport network is also revised, with the completion of the Northlink project in April 2020 extending
the Tonkin Highway from Morley to Muchea.
The revised assessment follows the same methodology as utilised in the initial assessment where practical. This
Addendum is therefore structured as follows following this Section:
Table 1.1 Addendum Structure and Content
ORIGINAL REPORT CHAPTER UPADTED IN THIS ADDENDUM EXTENT OF UPDATE
2. Existing Situation Yes Existing transport networks and traffic volumes updated to reflect opening of Northlink.
3. Development Proposal Yes Updated to reflect revised proposal including land uses and access.
4. Traffic Impact Assessment Yes Net change trip generation completed for revised proposal.
5. Conclusion Yes Updated to reflect analysis now being undertaken.
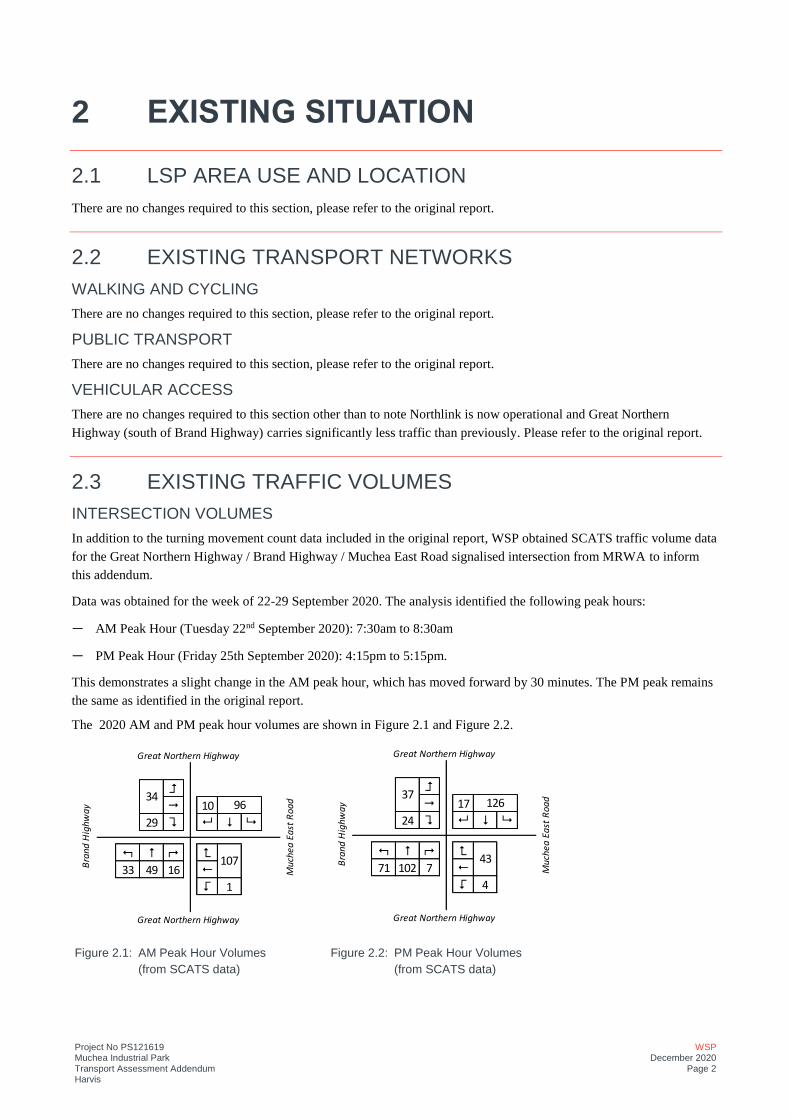
Project No PS121619 Muchea Industrial Park Transport Assessment Addendum Harvis
WSP December 2020
Page 2
2 EXISTING SITUATION
2.1 LSP AREA USE AND LOCATION
There are no changes required to this section, please refer to the original report.
2.2 EXISTING TRANSPORT NETWORKS
WALKING AND CYCLING
There are no changes required to this section, please refer to the original report.
PUBLIC TRANSPORT
There are no changes required to this section, please refer to the original report.
VEHICULAR ACCESS
There are no changes required to this section other than to note Northlink is now operational and Great Northern
Highway (south of Brand Highway) carries significantly less traffic than previously. Please refer to the original report.
2.3 EXISTING TRAFFIC VOLUMES
INTERSECTION VOLUMES
In addition to the turning movement count data included in the original report, WSP obtained SCATS traffic volume data
for the Great Northern Highway / Brand Highway / Muchea East Road signalised intersection from MRWA to inform
this addendum.
Data was obtained for the week of 22-29 September 2020. The analysis identified the following peak hours:
— AM Peak Hour (Tuesday 22nd September 2020): 7:30am to 8:30am
— PM Peak Hour (Friday 25th September 2020): 4:15pm to 5:15pm.
This demonstrates a slight change in the AM peak hour, which has moved forward by 30 minutes. The PM peak remains
the same as identified in the original report.
The 2020 AM and PM peak hour volumes are shown in Figure 2.1 and Figure 2.2.
Figure 2.1: AM Peak Hour Volumes (from SCATS data)
Figure 2.2: PM Peak Hour Volumes (from SCATS data)
=
" 10
29 ? 8 $ 9
: # ; <
33 49 16 !
> 1
96
107
34
Great Northern Highway
Bra
nd H
ighw
ay
Muc
hea
East
Roa
d
Great Northern Highway
=
" 17
24 ? 8 $ 9
: # ; <
71 102 7 !
> 4
Bra
nd H
ighw
ay
Great Northern Highway
Muc
hea
East
Roa
d37126
43
Great Northern Highway
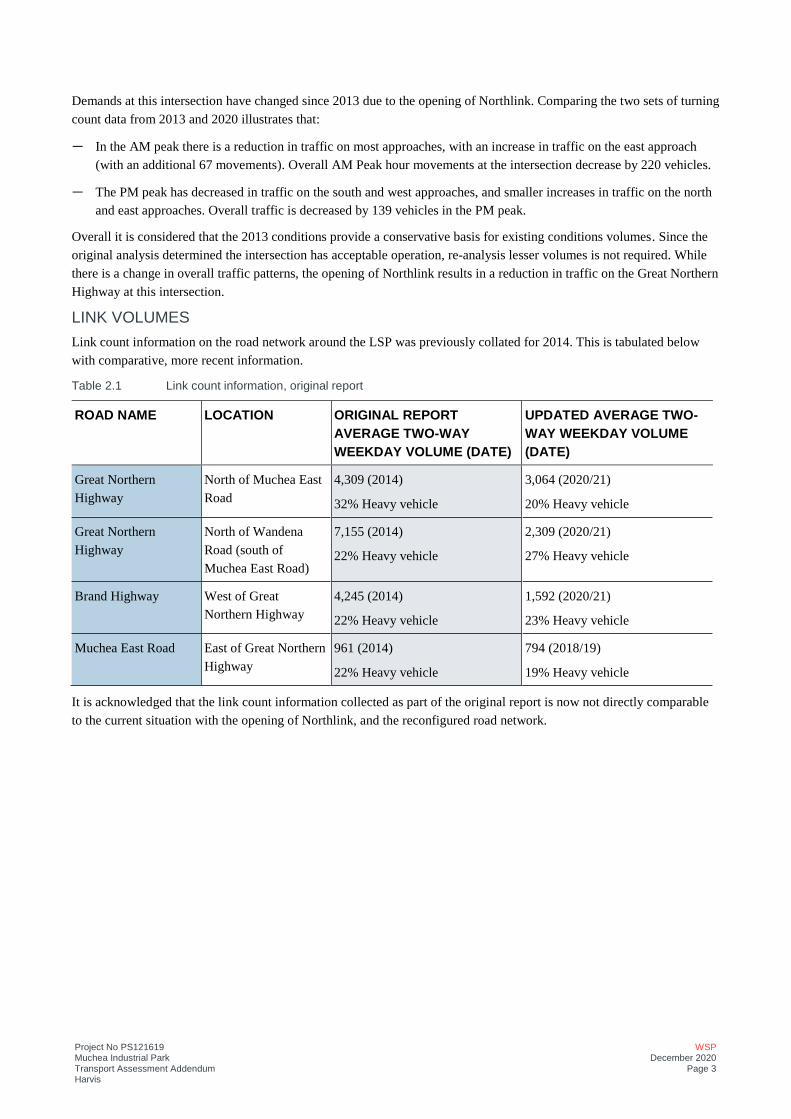
Project No PS121619 Muchea Industrial Park Transport Assessment Addendum Harvis
WSP December 2020
Page 3
Demands at this intersection have changed since 2013 due to the opening of Northlink. Comparing the two sets of turning
count data from 2013 and 2020 illustrates that:
— In the AM peak there is a reduction in traffic on most approaches, with an increase in traffic on the east approach
(with an additional 67 movements). Overall AM Peak hour movements at the intersection decrease by 220 vehicles.
— The PM peak has decreased in traffic on the south and west approaches, and smaller increases in traffic on the north
and east approaches. Overall traffic is decreased by 139 vehicles in the PM peak.
Overall it is considered that the 2013 conditions provide a conservative basis for existing conditions volumes. Since the
original analysis determined the intersection has acceptable operation, re-analysis lesser volumes is not required. While
there is a change in overall traffic patterns, the opening of Northlink results in a reduction in traffic on the Great Northern
Highway at this intersection.
LINK VOLUMES
Link count information on the road network around the LSP was previously collated for 2014. This is tabulated below
with comparative, more recent information.
Table 2.1 Link count information, original report
ROAD NAME LOCATION ORIGINAL REPORT
AVERAGE TWO-WAY
WEEKDAY VOLUME (DATE)
UPDATED AVERAGE TWO-
WAY WEEKDAY VOLUME
(DATE)
Great Northern
Highway
North of Muchea East
Road
4,309 (2014)
32% Heavy vehicle
3,064 (2020/21)
20% Heavy vehicle
Great Northern
Highway
North of Wandena
Road (south of
Muchea East Road)
7,155 (2014)
22% Heavy vehicle
2,309 (2020/21)
27% Heavy vehicle
Brand Highway West of Great
Northern Highway
4,245 (2014)
22% Heavy vehicle
1,592 (2020/21)
23% Heavy vehicle
Muchea East Road East of Great Northern
Highway
961 (2014)
22% Heavy vehicle
794 (2018/19)
19% Heavy vehicle
It is acknowledged that the link count information collected as part of the original report is now not directly comparable
to the current situation with the opening of Northlink, and the reconfigured road network.
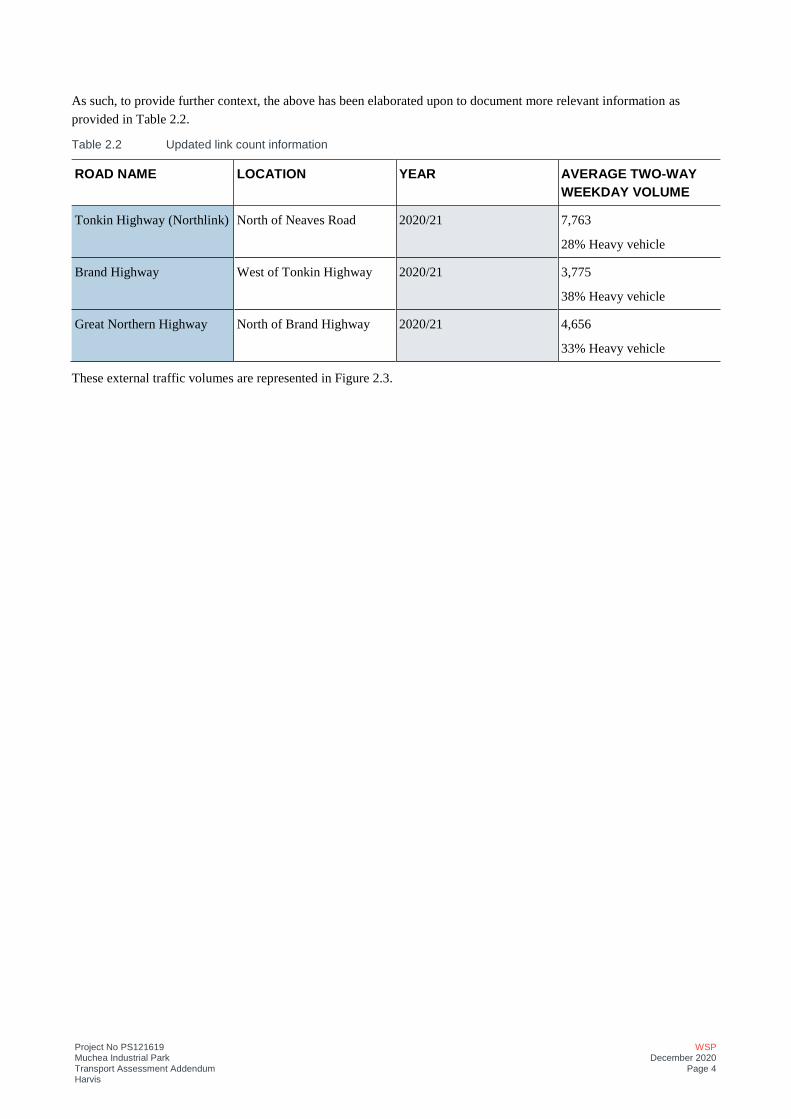
Project No PS121619 Muchea Industrial Park Transport Assessment Addendum Harvis
WSP December 2020
Page 4
As such, to provide further context, the above has been elaborated upon to document more relevant information as
provided in Table 2.2.
Table 2.2 Updated link count information
ROAD NAME LOCATION YEAR AVERAGE TWO-WAY
WEEKDAY VOLUME
Tonkin Highway (Northlink) North of Neaves Road 2020/21 7,763
28% Heavy vehicle
Brand Highway West of Tonkin Highway 2020/21 3,775
38% Heavy vehicle
Great Northern Highway North of Brand Highway 2020/21 4,656
33% Heavy vehicle
These external traffic volumes are represented in Figure 2.3.
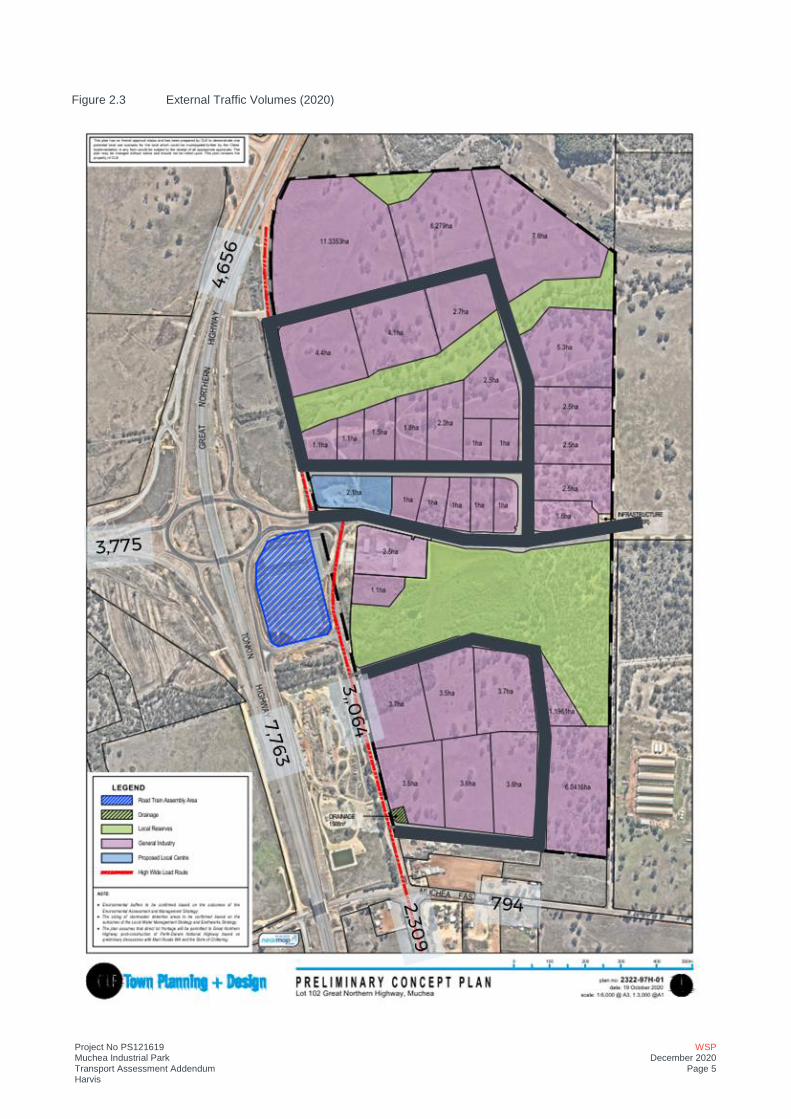
Project No PS121619 Muchea Industrial Park Transport Assessment Addendum Harvis
WSP December 2020
Page 5
Figure 2.3 External Traffic Volumes (2020)
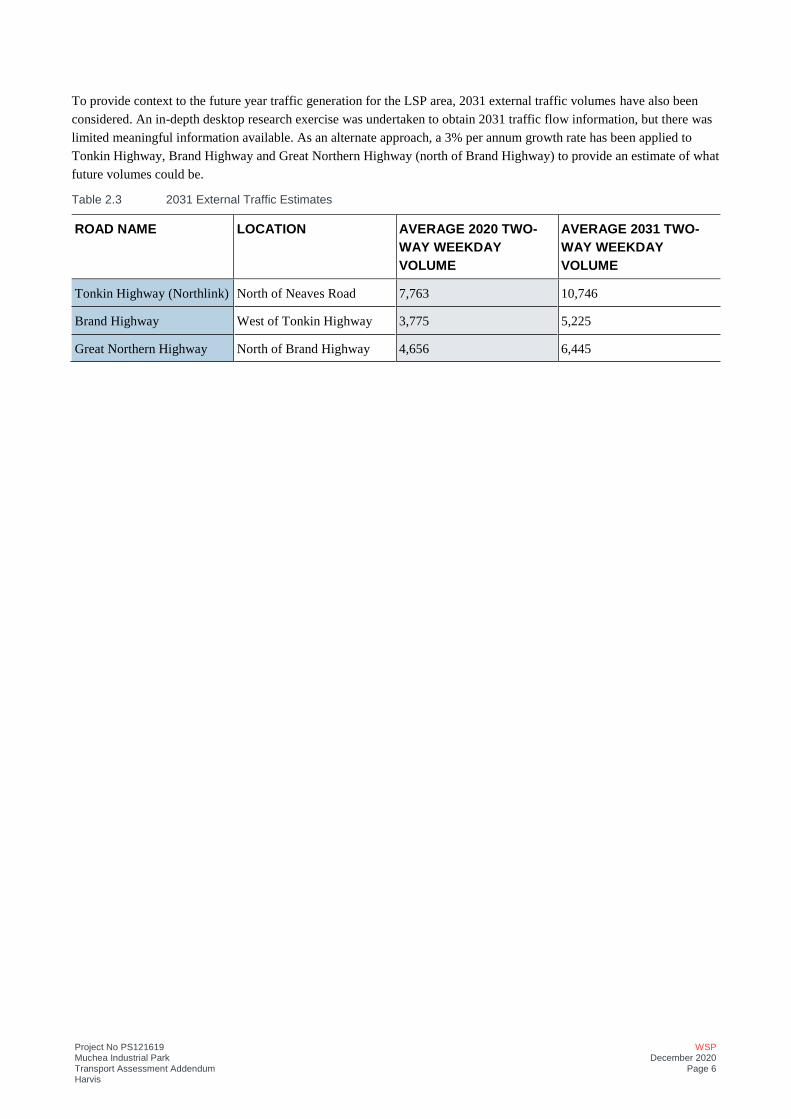
Project No PS121619 Muchea Industrial Park Transport Assessment Addendum Harvis
WSP December 2020
Page 6
To provide context to the future year traffic generation for the LSP area, 2031 external traffic volumes have also been
considered. An in-depth desktop research exercise was undertaken to obtain 2031 traffic flow information, but there was
limited meaningful information available. As an alternate approach, a 3% per annum growth rate has been applied to
Tonkin Highway, Brand Highway and Great Northern Highway (north of Brand Highway) to provide an estimate of what
future volumes could be.
Table 2.3 2031 External Traffic Estimates
ROAD NAME LOCATION AVERAGE 2020 TWO-
WAY WEEKDAY
VOLUME
AVERAGE 2031 TWO-
WAY WEEKDAY
VOLUME
Tonkin Highway (Northlink) North of Neaves Road 7,763 10,746
Brand Highway West of Tonkin Highway 3,775 5,225
Great Northern Highway North of Brand Highway 4,656 6,445
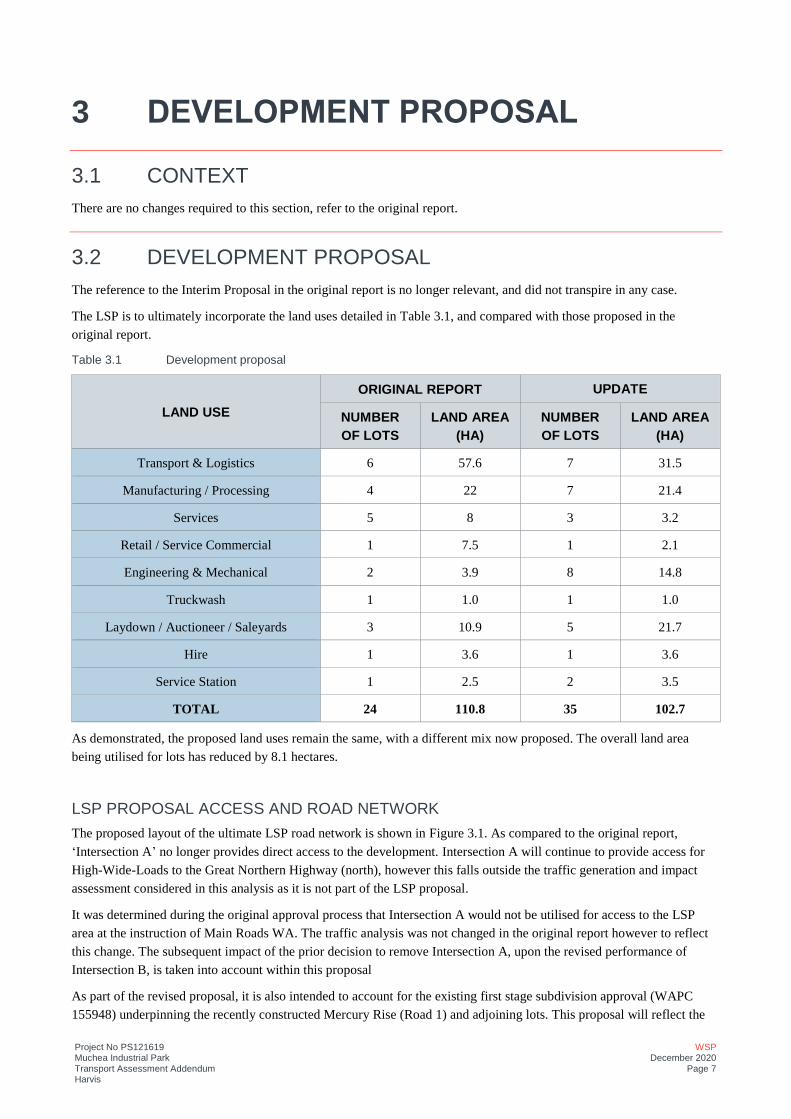
Project No PS121619 Muchea Industrial Park Transport Assessment Addendum Harvis
WSP December 2020
Page 7
3 DEVELOPMENT PROPOSAL
3.1 CONTEXT
There are no changes required to this section, refer to the original report.
3.2 DEVELOPMENT PROPOSAL
The reference to the Interim Proposal in the original report is no longer relevant, and did not transpire in any case.
The LSP is to ultimately incorporate the land uses detailed in Table 3.1, and compared with those proposed in the
original report.
Table 3.1 Development proposal
LAND USE
ORIGINAL REPORT UPDATE
NUMBER
OF LOTS
LAND AREA
(HA)
NUMBER
OF LOTS
LAND AREA
(HA)
Transport & Logistics 6 57.6 7 31.5
Manufacturing / Processing 4 22 7 21.4
Services 5 8 3 3.2
Retail / Service Commercial 1 7.5 1 2.1
Engineering & Mechanical 2 3.9 8 14.8
Truckwash 1 1.0 1 1.0
Laydown / Auctioneer / Saleyards 3 10.9 5 21.7
Hire 1 3.6 1 3.6
Service Station 1 2.5 2 3.5
TOTAL 24 110.8 35 102.7
As demonstrated, the proposed land uses remain the same, with a different mix now proposed. The overall land area
being utilised for lots has reduced by 8.1 hectares.
LSP PROPOSAL ACCESS AND ROAD NETWORK
The proposed layout of the ultimate LSP road network is shown in Figure 3.1. As compared to the original report,
‘Intersection A’ no longer provides direct access to the development. Intersection A will continue to provide access for
High-Wide-Loads to the Great Northern Highway (north), however this falls outside the traffic generation and impact
assessment considered in this analysis as it is not part of the LSP proposal.
It was determined during the original approval process that Intersection A would not be utilised for access to the LSP
area at the instruction of Main Roads WA. The traffic analysis was not changed in the original report however to reflect
this change. The subsequent impact of the prior decision to remove Intersection A, upon the revised performance of
Intersection B, is taken into account within this proposal
As part of the revised proposal, it is also intended to account for the existing first stage subdivision approval (WAPC
155948) underpinning the recently constructed Mercury Rise (Road 1) and adjoining lots. This proposal will reflect the
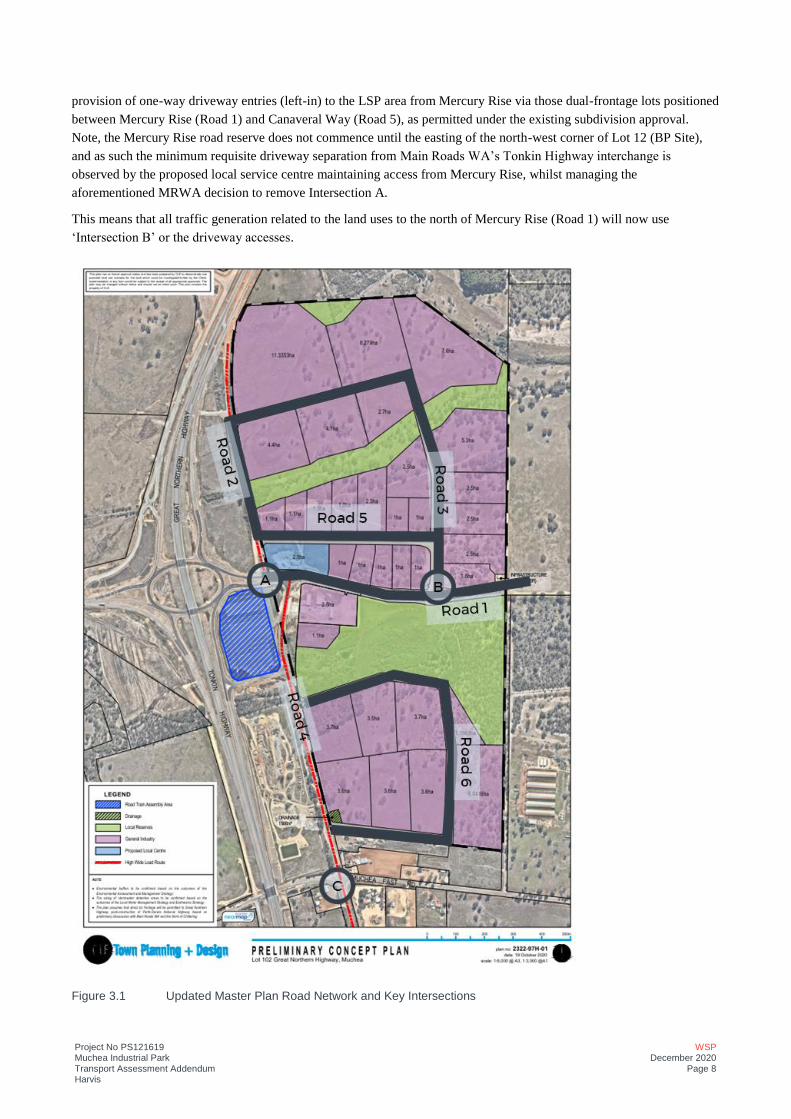
Project No PS121619 Muchea Industrial Park Transport Assessment Addendum Harvis
WSP December 2020
Page 8
provision of one-way driveway entries (left-in) to the LSP area from Mercury Rise via those dual-frontage lots positioned
between Mercury Rise (Road 1) and Canaveral Way (Road 5), as permitted under the existing subdivision approval.
Note, the Mercury Rise road reserve does not commence until the easting of the north-west corner of Lot 12 (BP Site),
and as such the minimum requisite driveway separation from Main Roads WA’s Tonkin Highway interchange is
observed by the proposed local service centre maintaining access from Mercury Rise, whilst managing the
aforementioned MRWA decision to remove Intersection A.
This means that all traffic generation related to the land uses to the north of Mercury Rise (Road 1) will now use
‘Intersection B’ or the driveway accesses.
Figure 3.1 Updated Master Plan Road Network and Key Intersections
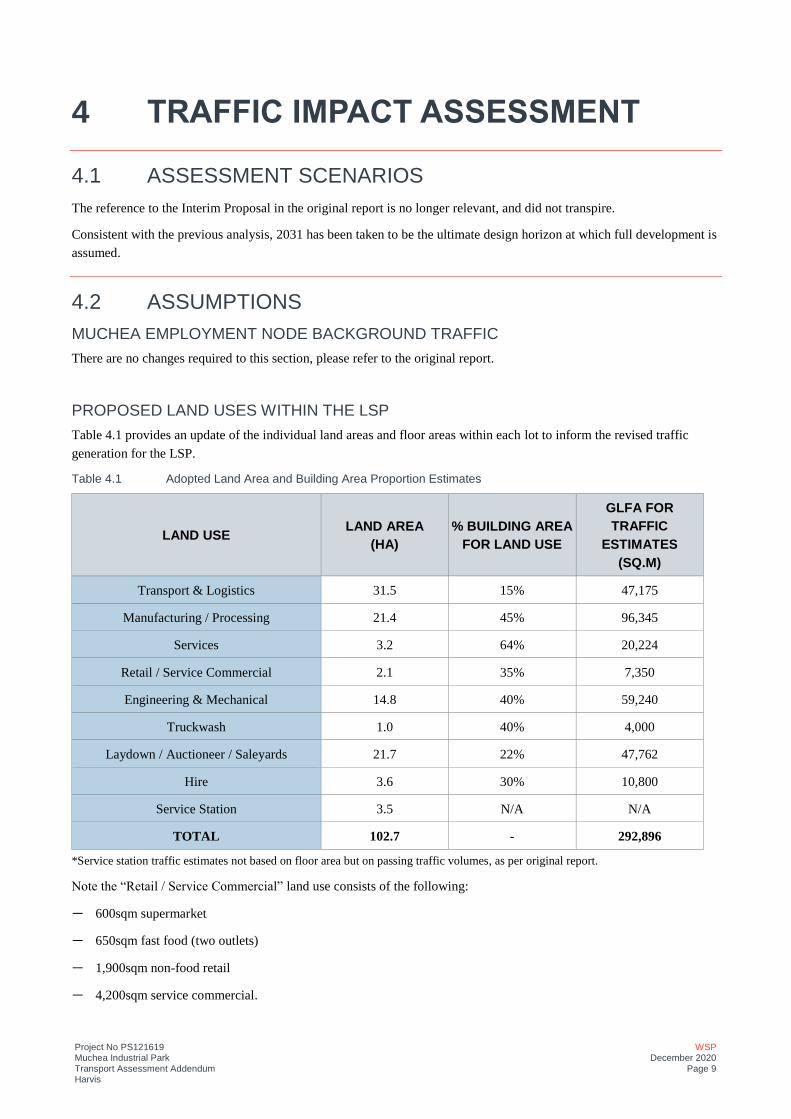
Project No PS121619 Muchea Industrial Park Transport Assessment Addendum Harvis
WSP December 2020
Page 9
4 TRAFFIC IMPACT ASSESSMENT
4.1 ASSESSMENT SCENARIOS
The reference to the Interim Proposal in the original report is no longer relevant, and did not transpire.
Consistent with the previous analysis, 2031 has been taken to be the ultimate design horizon at which full development is
assumed.
4.2 ASSUMPTIONS
MUCHEA EMPLOYMENT NODE BACKGROUND TRAFFIC
There are no changes required to this section, please refer to the original report.
PROPOSED LAND USES WITHIN THE LSP
Table 4.1 provides an update of the individual land areas and floor areas within each lot to inform the revised traffic
generation for the LSP.
Table 4.1 Adopted Land Area and Building Area Proportion Estimates
LAND USE LAND AREA
(HA)
% BUILDING AREA
FOR LAND USE
GLFA FOR
TRAFFIC
ESTIMATES
(SQ.M)
Transport & Logistics 31.5 15% 47,175
Manufacturing / Processing 21.4 45% 96,345
Services 3.2 64% 20,224
Retail / Service Commercial 2.1 35% 7,350
Engineering & Mechanical 14.8 40% 59,240
Truckwash 1.0 40% 4,000
Laydown / Auctioneer / Saleyards 21.7 22% 47,762
Hire 3.6 30% 10,800
Service Station 3.5 N/A N/A
TOTAL 102.7 - 292,896
*Service station traffic estimates not based on floor area but on passing traffic volumes, as per original report.
Note the “Retail / Service Commercial” land use consists of the following:
— 600sqm supermarket
— 650sqm fast food (two outlets)
— 1,900sqm non-food retail
— 4,200sqm service commercial.
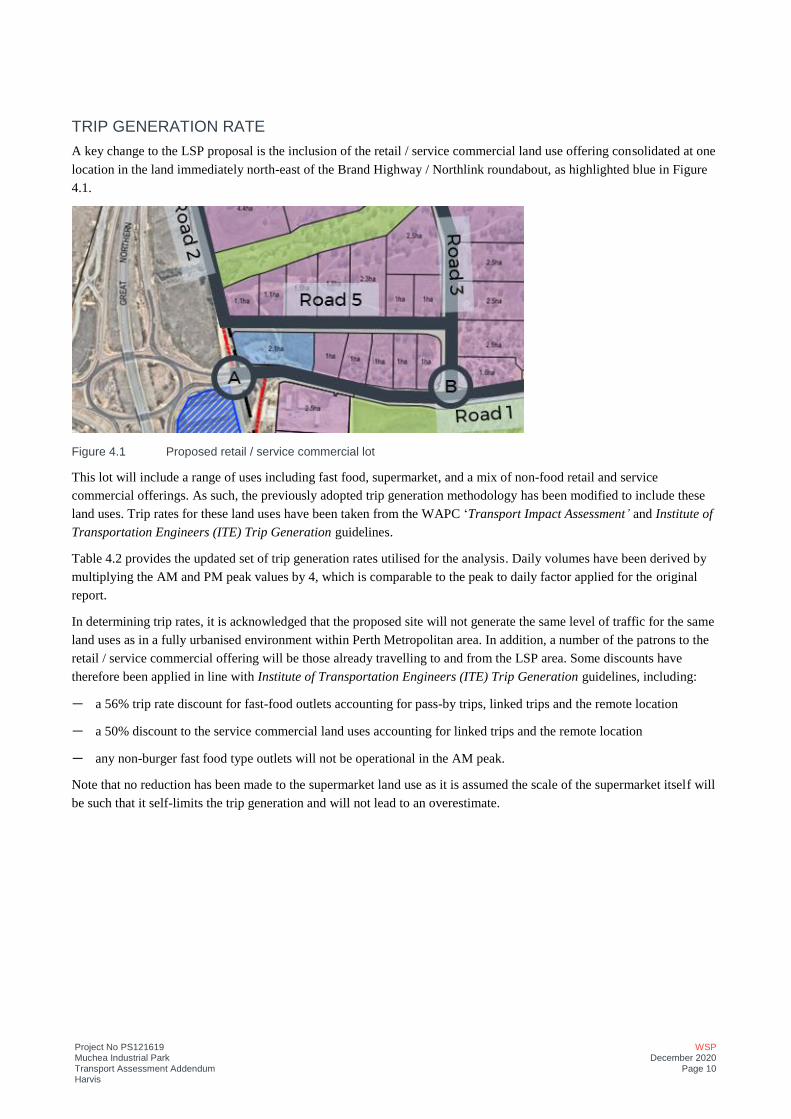
Project No PS121619 Muchea Industrial Park Transport Assessment Addendum Harvis
WSP December 2020
Page 10
TRIP GENERATION RATE
A key change to the LSP proposal is the inclusion of the retail / service commercial land use offering consolidated at one
location in the land immediately north-east of the Brand Highway / Northlink roundabout, as highlighted blue in Figure
4.1.
Figure 4.1 Proposed retail / service commercial lot
This lot will include a range of uses including fast food, supermarket, and a mix of non-food retail and service
commercial offerings. As such, the previously adopted trip generation methodology has been modified to include these
land uses. Trip rates for these land uses have been taken from the WAPC ‘Transport Impact Assessment’ and Institute of
Transportation Engineers (ITE) Trip Generation guidelines.
Table 4.2 provides the updated set of trip generation rates utilised for the analysis. Daily volumes have been derived by
multiplying the AM and PM peak values by 4, which is comparable to the peak to daily factor applied for the original
report.
In determining trip rates, it is acknowledged that the proposed site will not generate the same level of traffic for the same
land uses as in a fully urbanised environment within Perth Metropolitan area. In addition, a number of the patrons to the
retail / service commercial offering will be those already travelling to and from the LSP area. Some discounts have
therefore been applied in line with Institute of Transportation Engineers (ITE) Trip Generation guidelines, including:
— a 56% trip rate discount for fast-food outlets accounting for pass-by trips, linked trips and the remote location
— a 50% discount to the service commercial land uses accounting for linked trips and the remote location
— any non-burger fast food type outlets will not be operational in the AM peak.
Note that no reduction has been made to the supermarket land use as it is assumed the scale of the supermarket itself will
be such that it self-limits the trip generation and will not lead to an overestimate.
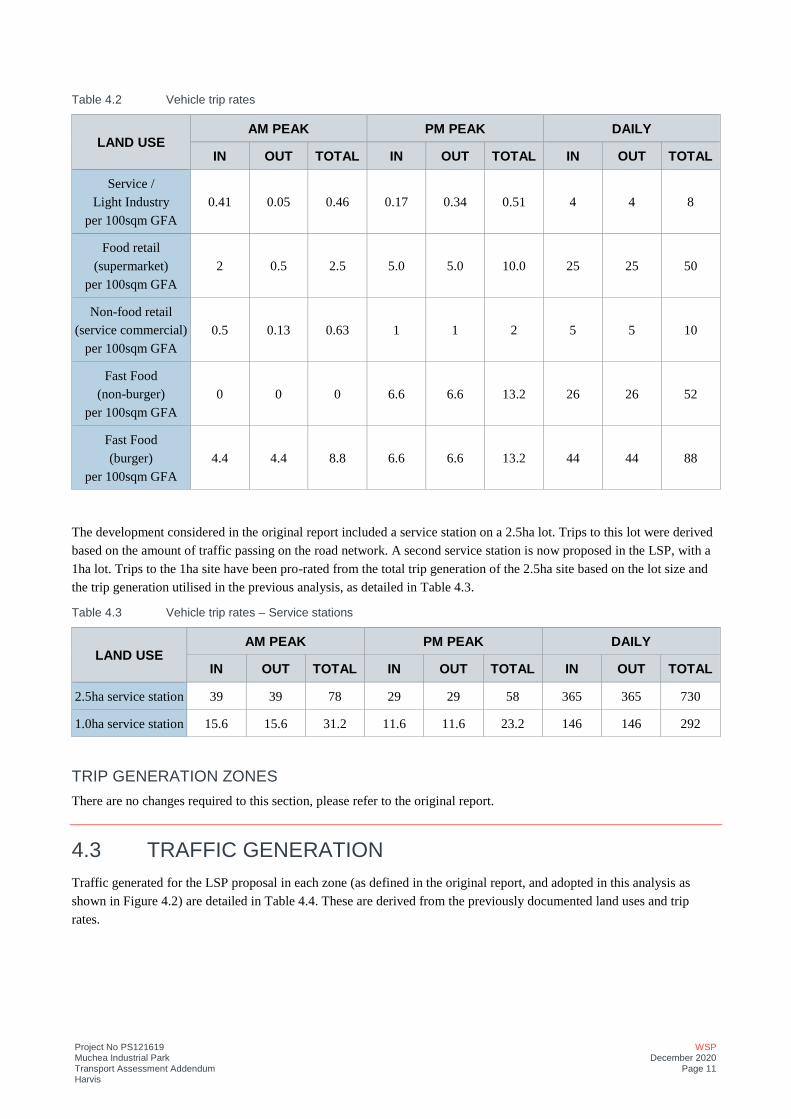
Project No PS121619 Muchea Industrial Park Transport Assessment Addendum Harvis
WSP December 2020
Page 11
Table 4.2 Vehicle trip rates
LAND USE AM PEAK PM PEAK DAILY
IN OUT TOTAL IN OUT TOTAL IN OUT TOTAL
Service /
Light Industry
per 100sqm GFA
0.41 0.05 0.46 0.17 0.34 0.51 4 4 8
Food retail
(supermarket)
per 100sqm GFA
2 0.5 2.5 5.0 5.0 10.0 25 25 50
Non-food retail
(service commercial)
per 100sqm GFA
0.5 0.13 0.63 1 1 2 5 5 10
Fast Food
(non-burger)
per 100sqm GFA
0 0 0 6.6 6.6 13.2 26 26 52
Fast Food
(burger)
per 100sqm GFA
4.4 4.4 8.8 6.6 6.6 13.2 44 44 88
The development considered in the original report included a service station on a 2.5ha lot. Trips to this lot were derived
based on the amount of traffic passing on the road network. A second service station is now proposed in the LSP, with a
1ha lot. Trips to the 1ha site have been pro-rated from the total trip generation of the 2.5ha site based on the lot size and
the trip generation utilised in the previous analysis, as detailed in Table 4.3.
Table 4.3 Vehicle trip rates – Service stations
LAND USE AM PEAK PM PEAK DAILY
IN OUT TOTAL IN OUT TOTAL IN OUT TOTAL
2.5ha service station 39 39 78 29 29 58 365 365 730
1.0ha service station 15.6 15.6 31.2 11.6 11.6 23.2 146 146 292
TRIP GENERATION ZONES
There are no changes required to this section, please refer to the original report.
4.3 TRAFFIC GENERATION
Traffic generated for the LSP proposal in each zone (as defined in the original report, and adopted in this analysis as
shown in Figure 4.2) are detailed in Table 4.4. These are derived from the previously documented land uses and trip
rates.
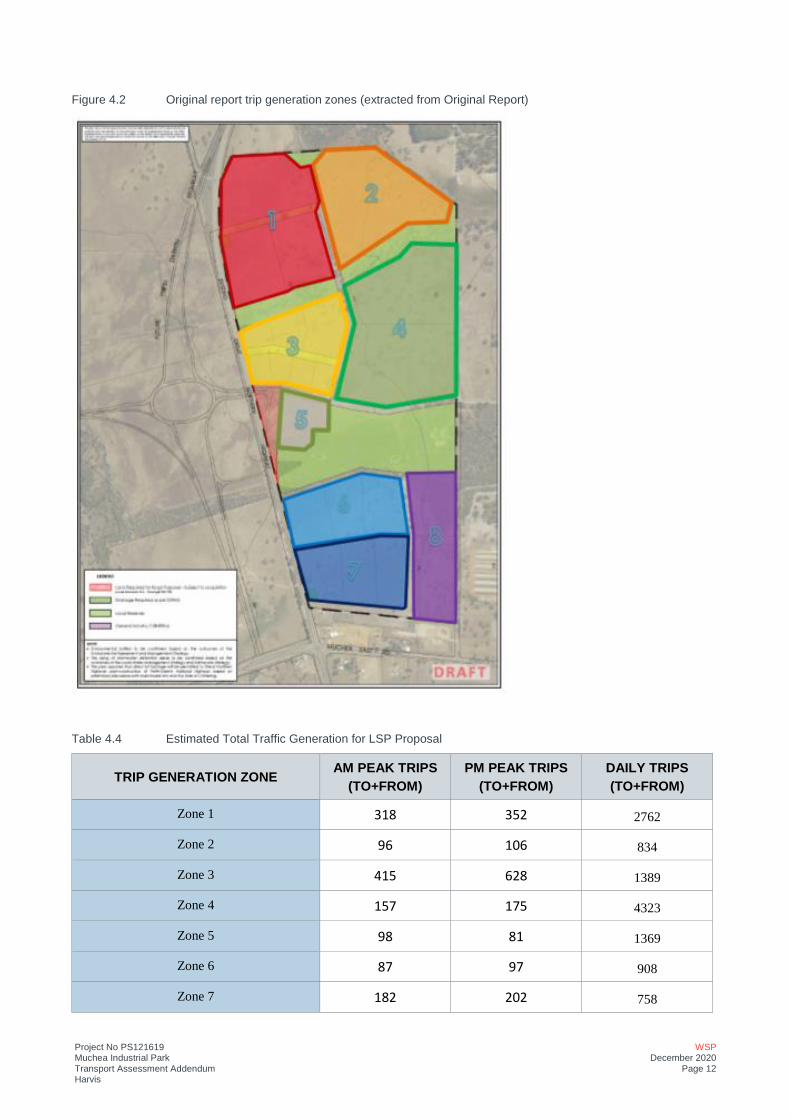
Project No PS121619 Muchea Industrial Park Transport Assessment Addendum Harvis
WSP December 2020
Page 12
Figure 4.2 Original report trip generation zones (extracted from Original Report)
Table 4.4 Estimated Total Traffic Generation for LSP Proposal
TRIP GENERATION ZONE AM PEAK TRIPS
(TO+FROM)
PM PEAK TRIPS
(TO+FROM)
DAILY TRIPS
(TO+FROM)
Zone 1 318 352 2762
Zone 2 96 106 834
Zone 3 415 628 1389
Zone 4 157 175 4323
Zone 5 98 81 1369
Zone 6 87 97 908
Zone 7 182 202 758
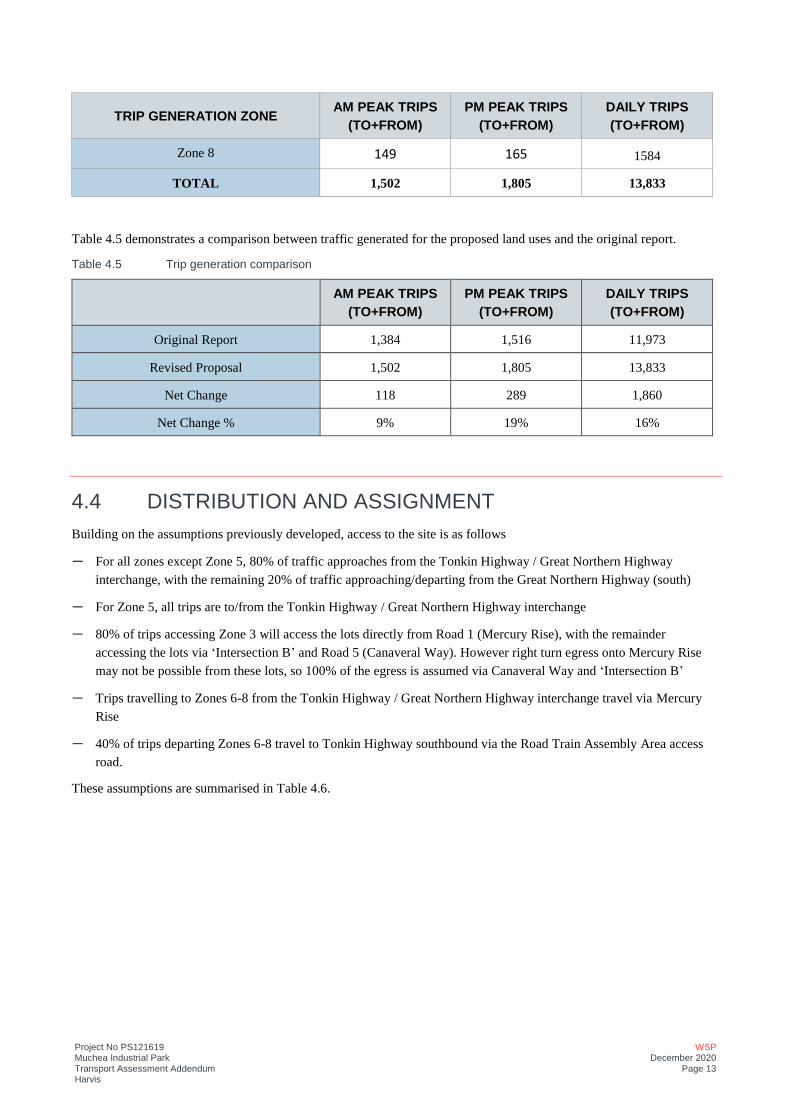
Project No PS121619 Muchea Industrial Park Transport Assessment Addendum Harvis
WSP December 2020
Page 13
TRIP GENERATION ZONE AM PEAK TRIPS
(TO+FROM)
PM PEAK TRIPS
(TO+FROM)
DAILY TRIPS
(TO+FROM)
Zone 8 149 165 1584
TOTAL 1,502 1,805 13,833
Table 4.5 demonstrates a comparison between traffic generated for the proposed land uses and the original report.
Table 4.5 Trip generation comparison
AM PEAK TRIPS
(TO+FROM)
PM PEAK TRIPS
(TO+FROM)
DAILY TRIPS
(TO+FROM)
Original Report 1,384 1,516 11,973
Revised Proposal 1,502 1,805 13,833
Net Change 118 289 1,860
Net Change % 9% 19% 16%
4.4 DISTRIBUTION AND ASSIGNMENT
Building on the assumptions previously developed, access to the site is as follows
— For all zones except Zone 5, 80% of traffic approaches from the Tonkin Highway / Great Northern Highway
interchange, with the remaining 20% of traffic approaching/departing from the Great Northern Highway (south)
— For Zone 5, all trips are to/from the Tonkin Highway / Great Northern Highway interchange
— 80% of trips accessing Zone 3 will access the lots directly from Road 1 (Mercury Rise), with the remainder
accessing the lots via ‘Intersection B’ and Road 5 (Canaveral Way). However right turn egress onto Mercury Rise
may not be possible from these lots, so 100% of the egress is assumed via Canaveral Way and ‘Intersection B’
— Trips travelling to Zones 6-8 from the Tonkin Highway / Great Northern Highway interchange travel via Mercury
Rise
— 40% of trips departing Zones 6-8 travel to Tonkin Highway southbound via the Road Train Assembly Area access
road.
These assumptions are summarised in Table 4.6.
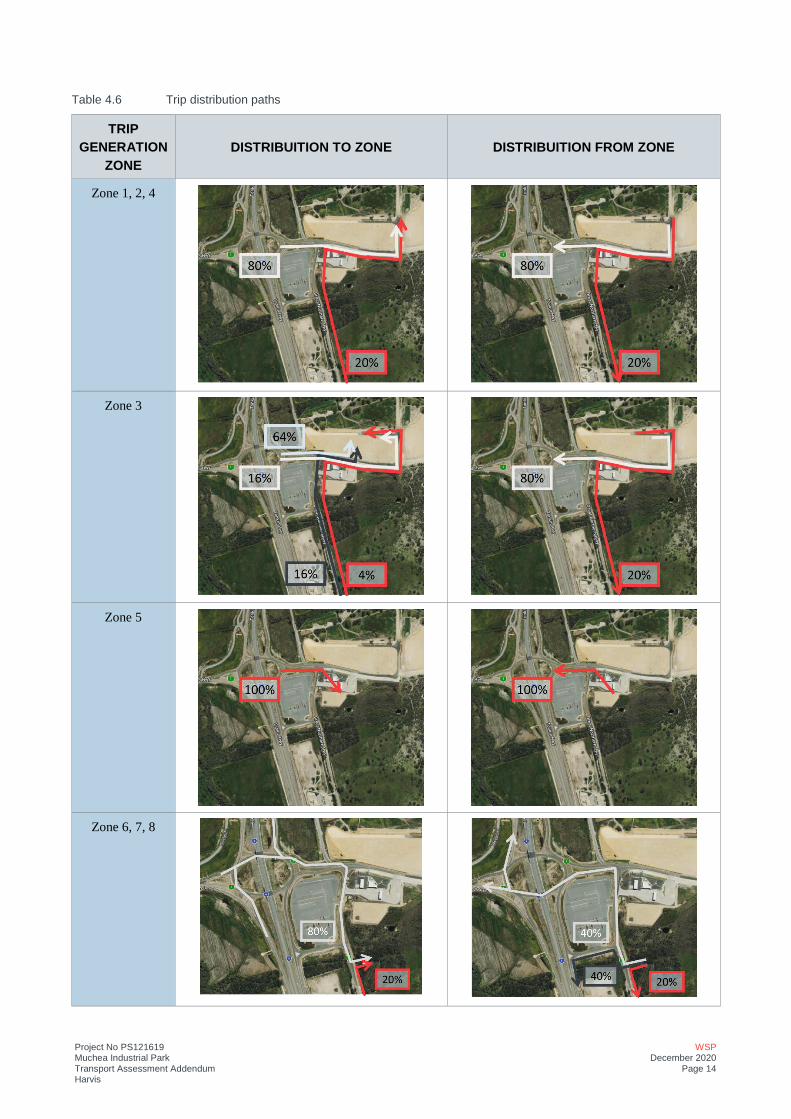
Project No PS121619 Muchea Industrial Park Transport Assessment Addendum Harvis
WSP December 2020
Page 14
Table 4.6 Trip distribution paths
TRIP
GENERATION
ZONE
DISTRIBUITION TO ZONE DISTRIBUITION FROM ZONE
Zone 1, 2, 4
Zone 3
Zone 5
Zone 6, 7, 8
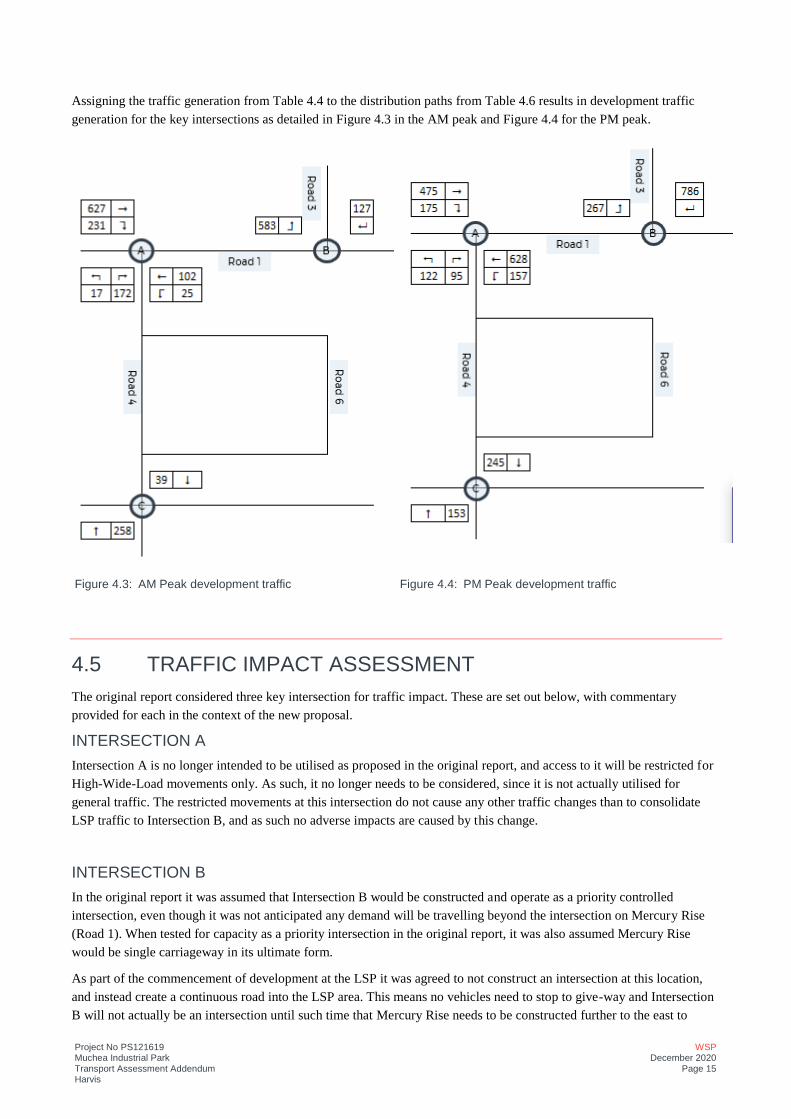
Project No PS121619 Muchea Industrial Park Transport Assessment Addendum Harvis
WSP December 2020
Page 15
Assigning the traffic generation from Table 4.4 to the distribution paths from Table 4.6 results in development traffic
generation for the key intersections as detailed in Figure 4.3 in the AM peak and Figure 4.4 for the PM peak.
Figure 4.3: AM Peak development traffic Figure 4.4: PM Peak development traffic
4.5 TRAFFIC IMPACT ASSESSMENT
The original report considered three key intersection for traffic impact. These are set out below, with commentary
provided for each in the context of the new proposal.
INTERSECTION A
Intersection A is no longer intended to be utilised as proposed in the original report, and access to it will be restricted for
High-Wide-Load movements only. As such, it no longer needs to be considered, since it is not actually utilised for
general traffic. The restricted movements at this intersection do not cause any other traffic changes than to consolidate
LSP traffic to Intersection B, and as such no adverse impacts are caused by this change.
INTERSECTION B
In the original report it was assumed that Intersection B would be constructed and operate as a priority controlled
intersection, even though it was not anticipated any demand will be travelling beyond the intersection on Mercury Rise
(Road 1). When tested for capacity as a priority intersection in the original report, it was also assumed Mercury Rise
would be single carriageway in its ultimate form.
As part of the commencement of development at the LSP it was agreed to not construct an intersection at this location,
and instead create a continuous road into the LSP area. This means no vehicles need to stop to give-way and Intersection
B will not actually be an intersection until such time that Mercury Rise needs to be constructed further to the east to
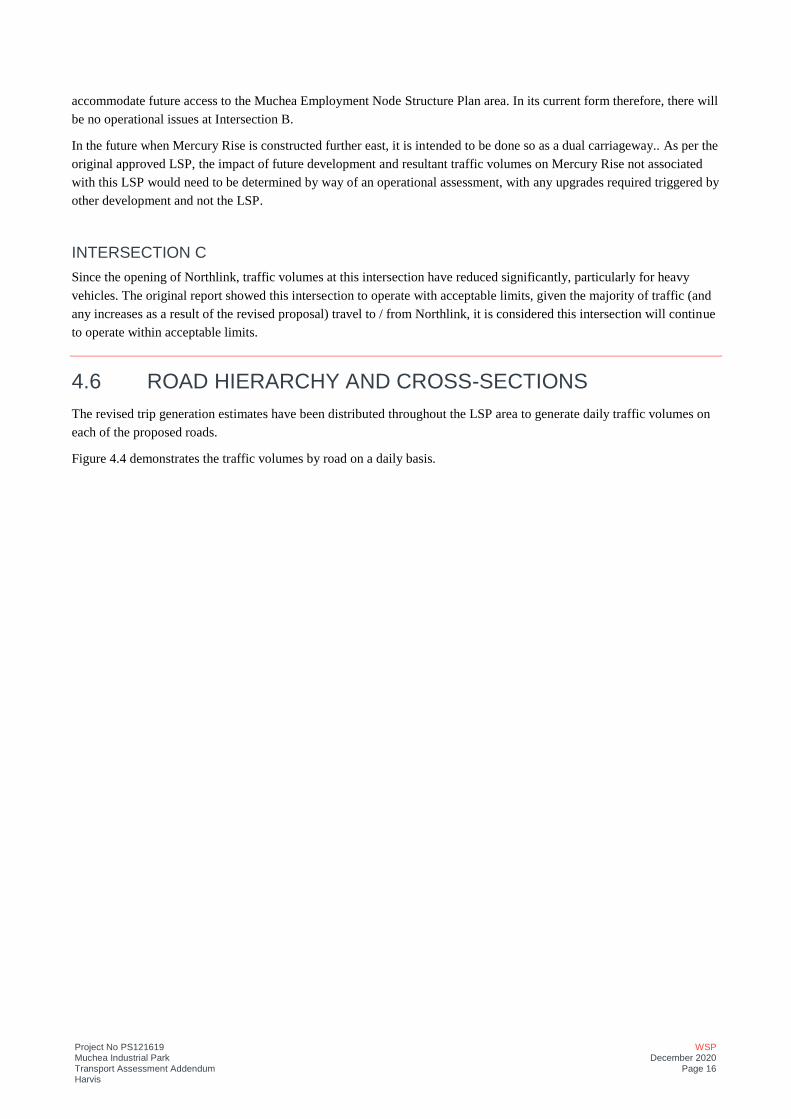
Project No PS121619 Muchea Industrial Park Transport Assessment Addendum Harvis
WSP December 2020
Page 16
accommodate future access to the Muchea Employment Node Structure Plan area. In its current form therefore, there will
be no operational issues at Intersection B.
In the future when Mercury Rise is constructed further east, it is intended to be done so as a dual carriageway.. As per the
original approved LSP, the impact of future development and resultant traffic volumes on Mercury Rise not associated
with this LSP would need to be determined by way of an operational assessment, with any upgrades required triggered by
other development and not the LSP.
INTERSECTION C
Since the opening of Northlink, traffic volumes at this intersection have reduced significantly, particularly for heavy
vehicles. The original report showed this intersection to operate with acceptable limits, given the majority of traffic (and
any increases as a result of the revised proposal) travel to / from Northlink, it is considered this intersection will continue
to operate within acceptable limits.
4.6 ROAD HIERARCHY AND CROSS-SECTIONS
The revised trip generation estimates have been distributed throughout the LSP area to generate daily traffic volumes on
each of the proposed roads.
Figure 4.4 demonstrates the traffic volumes by road on a daily basis.
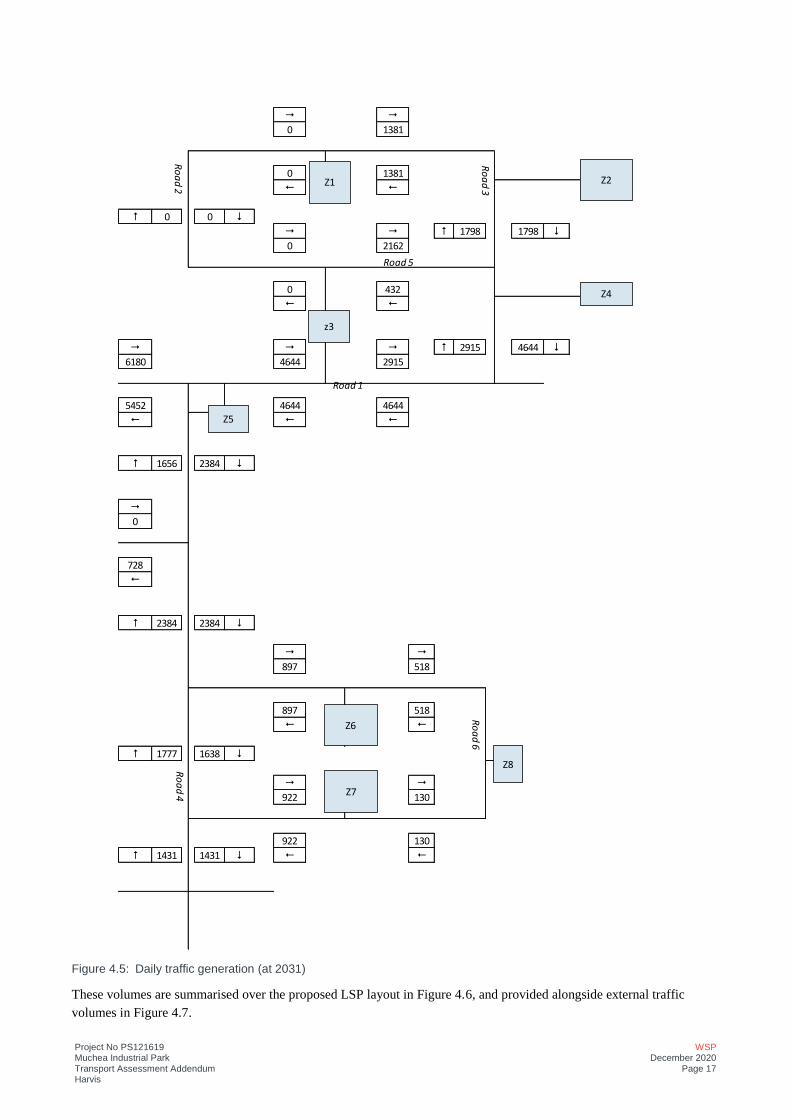
Project No PS121619 Muchea Industrial Park Transport Assessment Addendum Harvis
WSP December 2020
Page 17
Figure 4.5: Daily traffic generation (at 2031)
These volumes are summarised over the proposed LSP layout in Figure 4.6, and provided alongside external traffic
volumes in Figure 4.7.
" "
0 1381
0 1381
! !
# 0 0 $
" " # 1798 1798 $
0 2162
0 432
! !
" " " # 2915 4644 $
6180 4644 2915
5452 4644 4644
! ! !
# 1656 2384 $
"
0
728
!
# 2384 2384 $
" "
897 518
897 518
! !
# 1777 1638 $
" "
922 130
922 130
# 1431 1431 $ ! !
z3
Z4
Z5
Z6
Z8
Z1 Z2
Z7
Road 1
Road 5
Ro
ad
6
Ro
ad
4
Ro
ad
3
Ro
ad
2
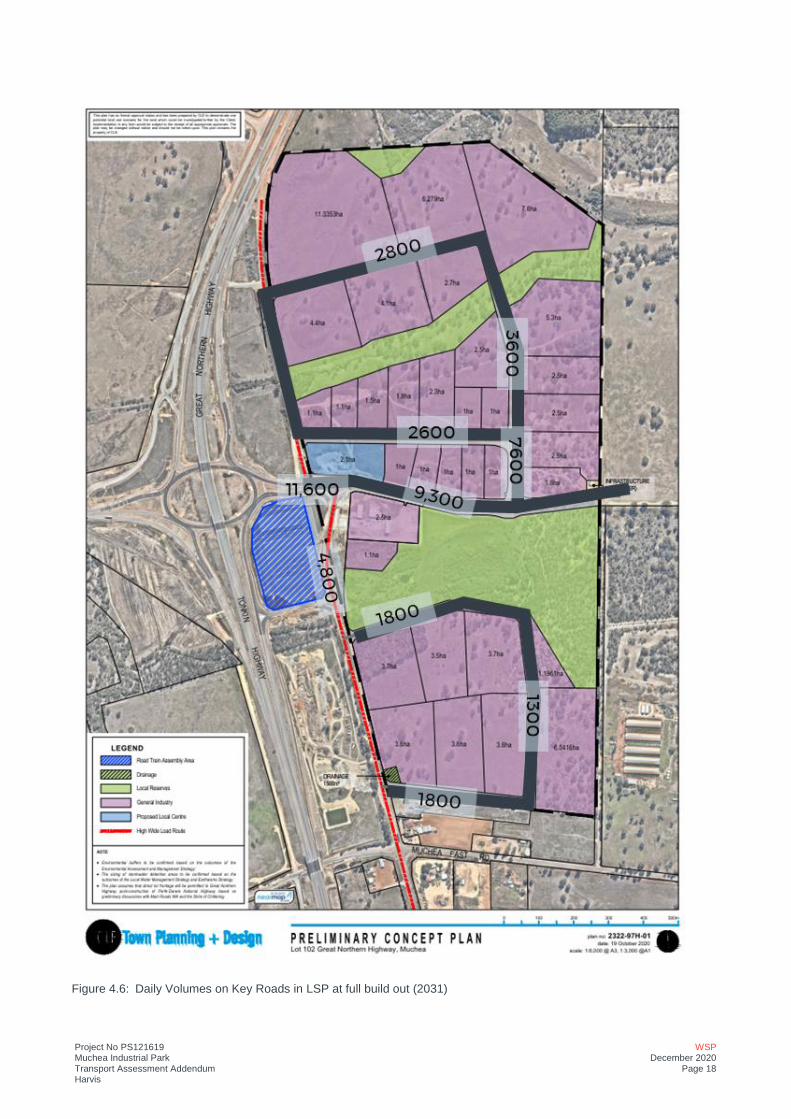
Project No PS121619 Muchea Industrial Park Transport Assessment Addendum Harvis
WSP December 2020
Page 18
Figure 4.6: Daily Volumes on Key Roads in LSP at full build out (2031)
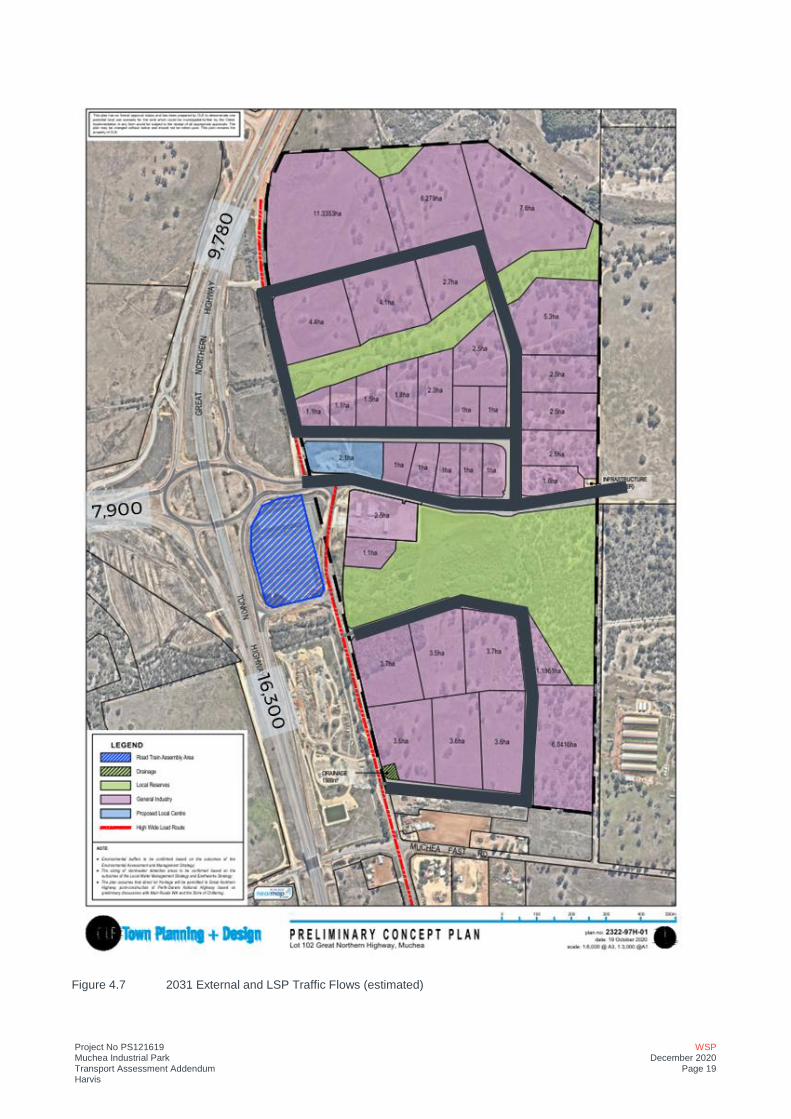
Project No PS121619 Muchea Industrial Park Transport Assessment Addendum Harvis
WSP December 2020
Page 19
Figure 4.7 2031 External and LSP Traffic Flows (estimated)

Project No PS121619 Muchea Industrial Park Transport Assessment Addendum Harvis
WSP December 2020
Page 20
These volumes are comparable to those in the original report, and as such no changes to the proposed road hierarchy are
required.
Similarly, the revised proposal will not materially change the vehicle types accessing the LSP area, given this and the
limited change in daily traffic volumes, no changes are required to the previously proposed cross-sections.
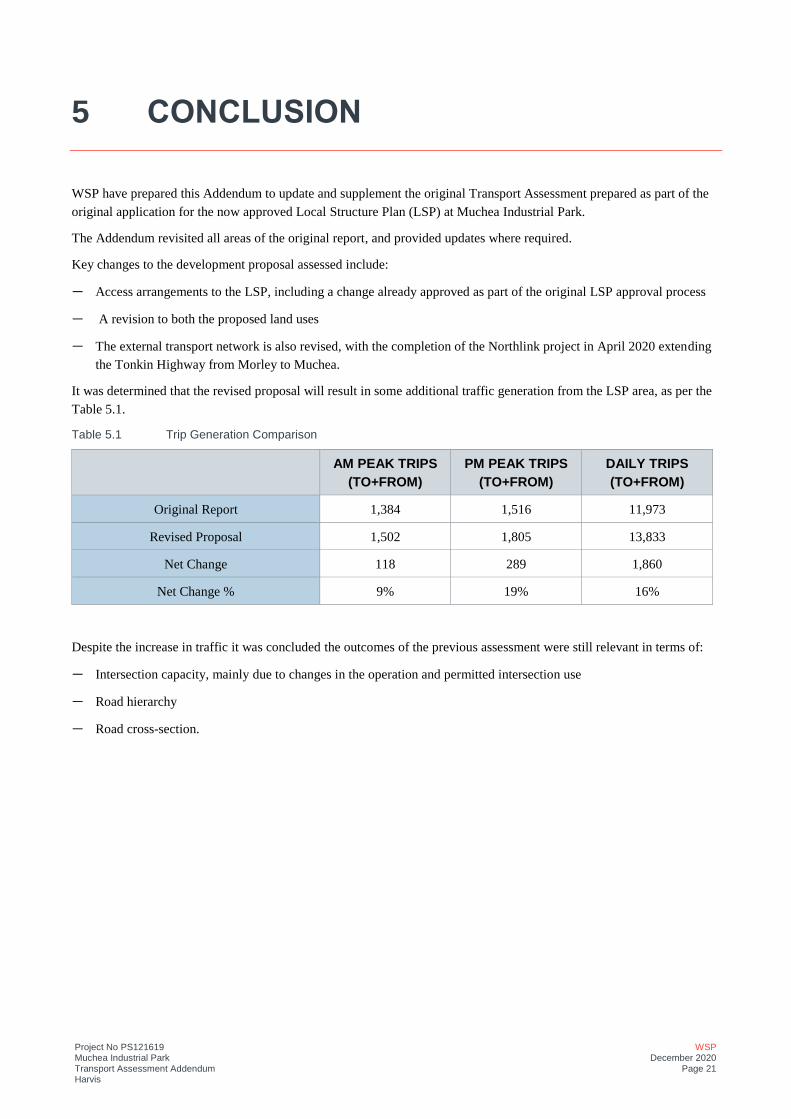
Project No PS121619 Muchea Industrial Park Transport Assessment Addendum Harvis
WSP December 2020
Page 21
5 CONCLUSION
WSP have prepared this Addendum to update and supplement the original Transport Assessment prepared as part of the
original application for the now approved Local Structure Plan (LSP) at Muchea Industrial Park.
The Addendum revisited all areas of the original report, and provided updates where required.
Key changes to the development proposal assessed include:
— Access arrangements to the LSP, including a change already approved as part of the original LSP approval process
— A revision to both the proposed land uses
— The external transport network is also revised, with the completion of the Northlink project in April 2020 extending
the Tonkin Highway from Morley to Muchea.
It was determined that the revised proposal will result in some additional traffic generation from the LSP area, as per the
Table 5.1.
Table 5.1 Trip Generation Comparison
AM PEAK TRIPS
(TO+FROM)
PM PEAK TRIPS
(TO+FROM)
DAILY TRIPS
(TO+FROM)
Original Report 1,384 1,516 11,973
Revised Proposal 1,502 1,805 13,833
Net Change 118 289 1,860
Net Change % 9% 19% 16%
Despite the increase in traffic it was concluded the outcomes of the previous assessment were still relevant in terms of:
— Intersection capacity, mainly due to changes in the operation and permitted intersection use
— Road hierarchy
— Road cross-section.

192322Rep124A
APPENDIX 3
Original Traffic Impact Assessment (2015)
© GTA Consultants (GTA Consultants (WA) Pty Ltd) 2015
The information contained in this document is confidential and
intended solely for the use of the client for the purpose for which it has
been prepared and no representation is made or is to be implied as
being made to any third party. Use or copying of this document in
whole or in part without the written permission of GTA Consultants
constitutes an infringement of copyright. The intellectual property
contained in this document remains the property of GTA Consultants. Bla
nk R
ep
ort
(150630 v
1.7
)
Melbourne | Sydney | Brisbane
Canberra | Adelaide | Perth
Gold Coast | Townsville
Lot 102, Muchea
Local Structure Plan
Transport Assessment
Issue: C 21/12/15
Client: Sirona Capital
Reference: 16P1004000
GTA Consultants Office: WA
Quality Record
Issue Date Description Prepared By Checked By Approved By Signed
C 21/12/15 Final Lucas Stewart Mark Fowler
Tanya Moran Tanya Moran
Lot 102, Muchea
Local Structure Plan
Transport Assessment
Client // Sirona Capital
Office // WA
Reference // 16P1004000
Date // 21/12/15
16P1004000 // 21/12/15
Transport Assessment // Issue: C
Lot 102, Muchea, Local Structure Plan
Table of Contents
1. Introduction 1
1.1 Background & Proposal 1
1.2 References 1
1.3 Scoping Discussion 1
2. Existing Situation 2
2.1 LSP Area Use and Location 2
2.2 Existing Transport Networks 3
2.3 Existing Traffic Volumes 4
3. Development Proposal 7
3.1 Context 7
3.2 Development Proposal 7
4. Traffic Impact Assessment 12
4.1 Assessment Scenarios 12
4.2 Assumptions 12
4.3 Traffic Generation 16
4.4 Distribution and Assignment 18
4.5 Traffic Impact Assessment 21
4.6 Road Hierarchy and Cross-Sections 24
5. Conclusion 31
Appendices
A: Proposed Local Structure Plan
B: Scoping Correspondence with Authorities
C: SIDRA Outputs
Figures
Figure 2.1: LSP Area and its Existing Environs 2
Figure 2.2: AM Peak Hour Turning Movement Volumes (from 2013 counts) 5
Figure 2.3: PM Peak Hour Turning Movement Volumes (from 2013 counts) 5
Figure 2.4: AM Peak Hour Volumes (from SCATS data) 6
Figure 2.5: PM Peak Hour Volumes (from SCATS data) 6
Figure 3.1: Proposed Interim Proposal Location 8
Figure 3.2: Proposed Ultimate Structure Plan Concept, Road Network and Key
Intersections 10
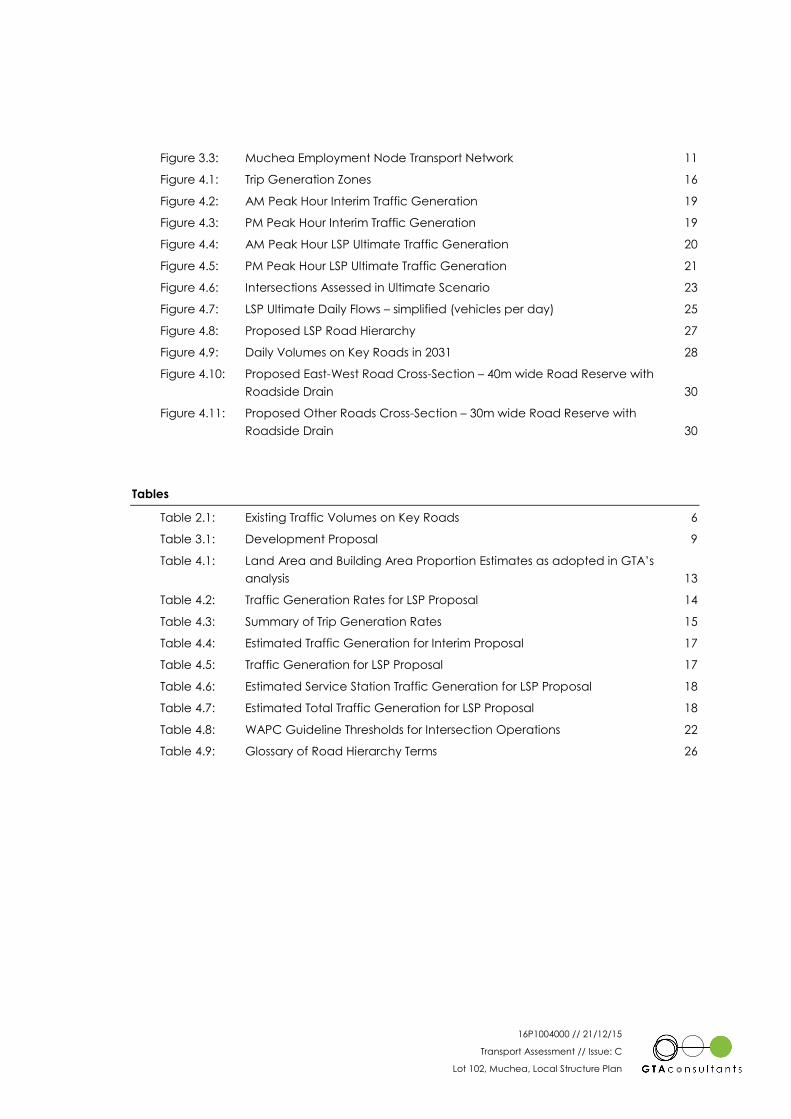
16P1004000 // 21/12/15
Transport Assessment // Issue: C
Lot 102, Muchea, Local Structure Plan
Figure 3.3: Muchea Employment Node Transport Network 11
Figure 4.1: Trip Generation Zones 16
Figure 4.2: AM Peak Hour Interim Traffic Generation 19
Figure 4.3: PM Peak Hour Interim Traffic Generation 19
Figure 4.4: AM Peak Hour LSP Ultimate Traffic Generation 20
Figure 4.5: PM Peak Hour LSP Ultimate Traffic Generation 21
Figure 4.6: Intersections Assessed in Ultimate Scenario 23
Figure 4.7: LSP Ultimate Daily Flows – simplified (vehicles per day) 25
Figure 4.8: Proposed LSP Road Hierarchy 27
Figure 4.9: Daily Volumes on Key Roads in 2031 28
Figure 4.10: Proposed East-West Road Cross-Section – 40m wide Road Reserve with
Roadside Drain 30
Figure 4.11: Proposed Other Roads Cross-Section – 30m wide Road Reserve with
Roadside Drain 30
Tables
Table 2.1: Existing Traffic Volumes on Key Roads 6
Table 3.1: Development Proposal 9
Table 4.1: Land Area and Building Area Proportion Estimates as adopted in GTA’s
analysis 13
Table 4.2: Traffic Generation Rates for LSP Proposal 14
Table 4.3: Summary of Trip Generation Rates 15
Table 4.4: Estimated Traffic Generation for Interim Proposal 17
Table 4.5: Traffic Generation for LSP Proposal 17
Table 4.6: Estimated Service Station Traffic Generation for LSP Proposal 18
Table 4.7: Estimated Total Traffic Generation for LSP Proposal 18
Table 4.8: WAPC Guideline Thresholds for Intersection Operations 22
Table 4.9: Glossary of Road Hierarchy Terms 26
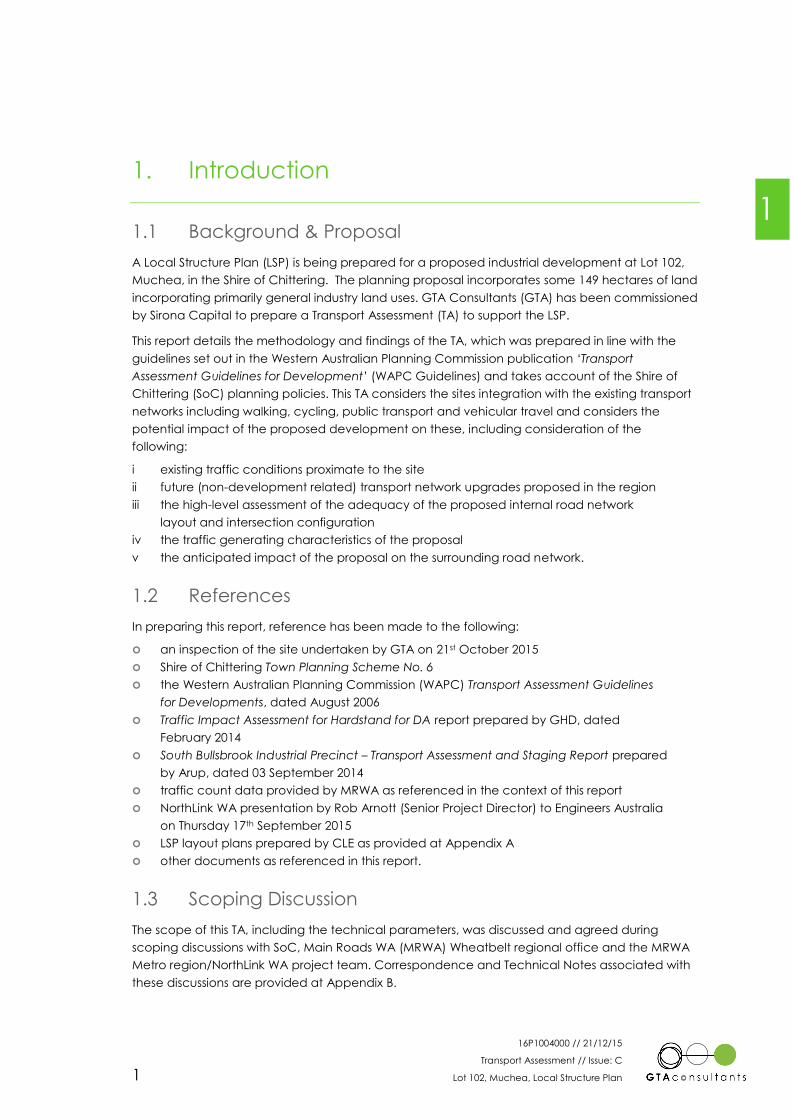
16P1004000 // 21/12/15
Transport Assessment // Issue: C
Lot 102, Muchea, Local Structure Plan 1
1. Introduction
1.1 Background & Proposal
A Local Structure Plan (LSP) is being prepared for a proposed industrial development at Lot 102,
Muchea, in the Shire of Chittering. The planning proposal incorporates some 149 hectares of land
incorporating primarily general industry land uses. GTA Consultants (GTA) has been commissioned
by Sirona Capital to prepare a Transport Assessment (TA) to support the LSP.
This report details the methodology and findings of the TA, which was prepared in line with the
guidelines set out in the Western Australian Planning Commission publication ‘Transport
Assessment Guidelines for Development’ (WAPC Guidelines) and takes account of the Shire of
Chittering (SoC) planning policies. This TA considers the sites integration with the existing transport
networks including walking, cycling, public transport and vehicular travel and considers the
potential impact of the proposed development on these, including consideration of the
following:
i existing traffic conditions proximate to the site
ii future (non-development related) transport network upgrades proposed in the region
iii the high-level assessment of the adequacy of the proposed internal road network
layout and intersection configuration
iv the traffic generating characteristics of the proposal
v the anticipated impact of the proposal on the surrounding road network.
1.2 References
In preparing this report, reference has been made to the following:
an inspection of the site undertaken by GTA on 21st October 2015
Shire of Chittering Town Planning Scheme No. 6
the Western Australian Planning Commission (WAPC) Transport Assessment Guidelines
for Developments, dated August 2006
Traffic Impact Assessment for Hardstand for DA report prepared by GHD, dated
February 2014
South Bullsbrook Industrial Precinct – Transport Assessment and Staging Report prepared
by Arup, dated 03 September 2014
traffic count data provided by MRWA as referenced in the context of this report
NorthLink WA presentation by Rob Arnott (Senior Project Director) to Engineers Australia
on Thursday 17th September 2015
LSP layout plans prepared by CLE as provided at Appendix A
other documents as referenced in this report.
1.3 Scoping Discussion
The scope of this TA, including the technical parameters, was discussed and agreed during
scoping discussions with SoC, Main Roads WA (MRWA) Wheatbelt regional office and the MRWA
Metro region/NorthLink WA project team. Correspondence and Technical Notes associated with
these discussions are provided at Appendix B.
1
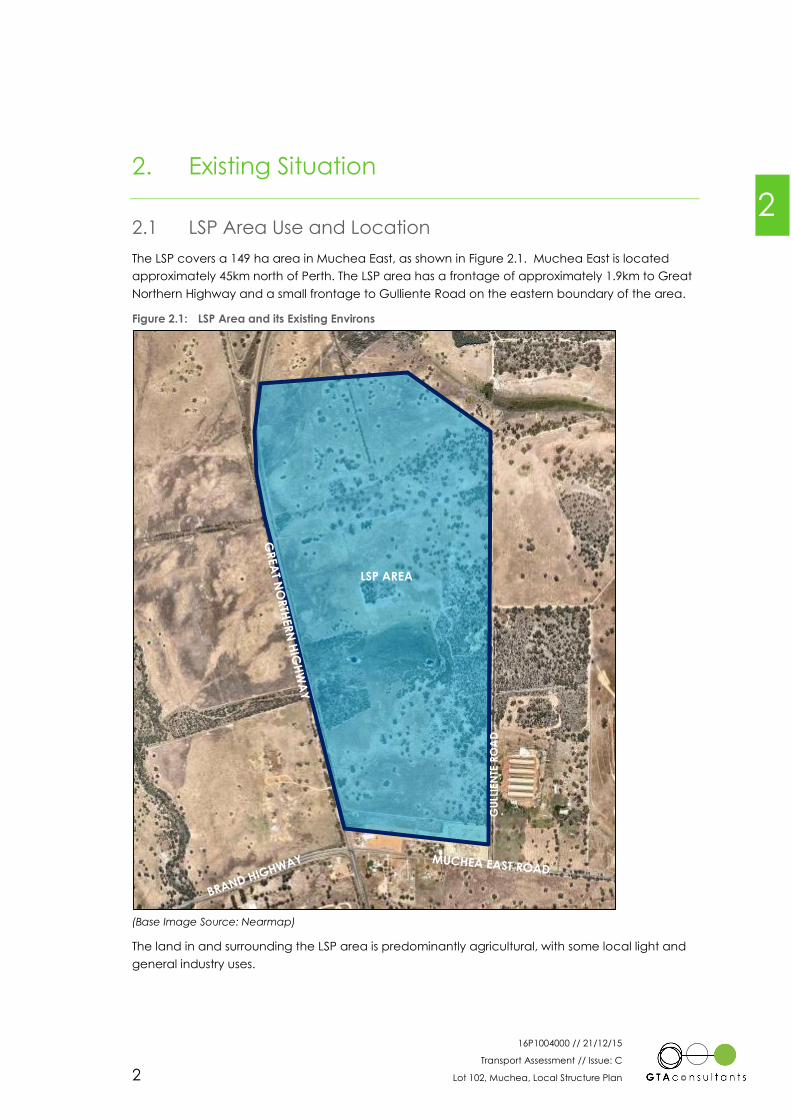
16P1004000 // 21/12/15
Transport Assessment // Issue: C
Lot 102, Muchea, Local Structure Plan 2
2. Existing Situation
2.1 LSP Area Use and Location
The LSP covers a 149 ha area in Muchea East, as shown in Figure 2.1. Muchea East is located
approximately 45km north of Perth. The LSP area has a frontage of approximately 1.9km to Great
Northern Highway and a small frontage to Gulliente Road on the eastern boundary of the area.
Figure 2.1: LSP Area and its Existing Environs
(Base Image Source: Nearmap)
The land in and surrounding the LSP area is predominantly agricultural, with some local light and
general industry uses.
LSP AREA
GU
LLIE
NTE
RO
AD
2
16P1004000 // 21/12/15
Transport Assessment // Issue: C
Lot 102, Muchea, Local Structure Plan 3
2.2 Existing Transport Networks
Walking and Cycling
There are no specific pedestrian or cycle infrastructure present within a reasonable distance (by
each mode) of the LSP area.
Given the rural nature of the LSP area and the long distances to nearest residencies (in excess of
3km to Muchea and Lower Chittering), it is anticipated that walking demand will be negligible
from the LSP area to other walking generators outside of the LSP.
Any cyclists in the area local to the LSP currently travel on the established road networks.
The proposed walking and cycling infrastructure within the LSP is discussed in Section 3.2 –
Development Proposal.
Public Transport
Public transport bus services currently operate on Great Northern Highway in the form of long
distance regional services. No bus stops currently exist on Great Northern Highway along the LSP
frontage.
As identified in the Muchea Employment Node Structure Plan, the land uses proposed for the
area mean feasible provision of public transport services is difficult to achieve. Notwithstanding
this, if the provision of services is deemed necessary in the future there exists an opportunity to
provide a bus stop on the upgraded section of the Perth Darwin National Highway (Northlink WA)
for existing bus services which operate on this route, adjacent to the site. It is likely that any bus
stop on NorthLink WA would cater for the already operating regional services as opposed to any
new local services, which may not be sustainable from a demand perspective in the short to
medium term.
Vehicular Access
The existing primary vehicle access routes for the LSP are highlighted in Figure 2.1 and discussed
below.
Great Northern Highway
The Great Northern Highway is under the control of MRWA and classified as a Primary Distributor in
the MRWA Road Hierarchy. The Great Northern Highway is listed as a Network 7 Restricted
Access Vehicle (RAV) road for its entire 230km length between Perth and Wubin, including its
length proximate to the subject site.
The Great Northern Highway plays a strategic role in the movement of freight between Perth and
northern WA. It is a two-lane, two-way undivided road set with a generally 9m wide carriageway
set within a 40m (or greater) wide road reserve (approx.) as it passes the LSP area. It has a
110km/h posted north of the Brand Highway intersection as it passes the site, with this speed limit
dropping to 80km/h through the intersection.
The Great Northern Highway is currently subject to an upgrade programme which will enable the
movement of Network 10 RAV vehicles to travel on the route from north of the Brand Highway.
16P1004000 // 21/12/15
Transport Assessment // Issue: C
Lot 102, Muchea, Local Structure Plan 4
Brand Highway
The Brand Highway is under the control of MRWA and classified as a Primary Distributor in the
MRWA Road Hierarchy. The Brand Highway is listed as a Network 7 RAV road for its entire length
between Perth and south of Geraldton, including the section through the Muchea townsite.
The Brand Highway is a two-lane, two-way undivided road with a 9m wide carriageway set within
a 30m wide road reserve (approx). It has a 110km/h posted speed limit to the north of Muchea,
with this speed limit dropping to 80km/h through Muchea and on its approach to the intersection
at the Great Northern Highway.
Muchea East Road
Muchea East Road is under the control of the Shire of Chittering and classified as a Regional
Distributor in the MRWA Road Hierarchy. It is listed as a Network 7 RAV road for approximately
1.2km of its length immediately east of the Great Northern Highway.
Muchea East Road is a two-lane two-way undivided road with an 8m wide carriageway set
within a 20m wide road reserve (approx). It has a 100km/h posted speed limit to the east of the
Great Northern Highway, slowing to 80km/h on the approach to the intersection.
Gulliente Road
Gulliente Road is under the control of the Shire of Chittering and classified as an Access Road in the
MRWA Road Hierarchy. It is listed as a Network 2 RAV road with conditions that a written approval
from the Shire of Chittering permitting the use of this road must be carried by drivers and produced
on demand. For the first 310m from Muchea East Road, Gulliente Road is sealed but is narrow at
approximately 6.5m to 7m wide, beyond this it becomes an unsealed access track.
Gulliente Road is a two-lane two-way undivided road set within a 20m wide road reserve
(approx). There is no posted speed limit on Gulliente Road, with a default 50km/h speed limit
therefore applying.
2.3 Existing Traffic Volumes
In order to inform the assessment of the impact of the LSP on the existing road network in the area,
a number of sources have been exhausted to collate traffic data information, as set out below.
Intersection Volumes
Manual Turning Movement Counts
Turning movement counts were recorded at the following intersections on Tuesday 19 November
2013:
Great Northern Highway / Brand Highway / Muchea East Road
Muchea East Road / Gulliente Road.
The turning movement count data identified the following peak hours:
Great Northern Highway / Brand Highway / Muchea East Road
AM Peak Hour: 7:00am to 8:00am
PM Peak Hour: 4:15pm to 5:15pm
Muchea East Road / Gulliente Road
AM Peak Hour: 7:15am to 8:15am
PM Peak Hour: 4:45pm to 5:45pm.
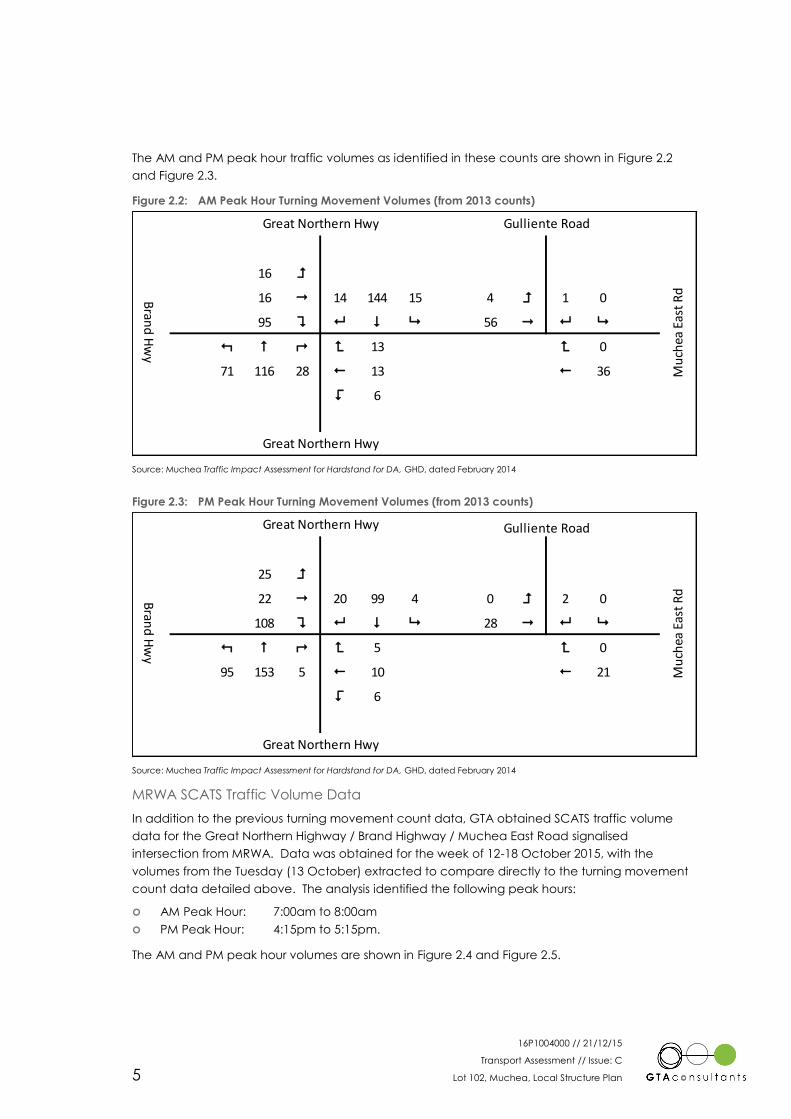
16P1004000 // 21/12/15
Transport Assessment // Issue: C
Lot 102, Muchea, Local Structure Plan 5
The AM and PM peak hour traffic volumes as identified in these counts are shown in Figure 2.2
and Figure 2.3.
Figure 2.2: AM Peak Hour Turning Movement Volumes (from 2013 counts)
Source: Muchea Traffic Impact Assessment for Hardstand for DA, GHD, dated February 2014
Figure 2.3: PM Peak Hour Turning Movement Volumes (from 2013 counts)
Source: Muchea Traffic Impact Assessment for Hardstand for DA, GHD, dated February 2014
MRWA SCATS Traffic Volume Data
In addition to the previous turning movement count data, GTA obtained SCATS traffic volume
data for the Great Northern Highway / Brand Highway / Muchea East Road signalised
intersection from MRWA. Data was obtained for the week of 12-18 October 2015, with the
volumes from the Tuesday (13 October) extracted to compare directly to the turning movement
count data detailed above. The analysis identified the following peak hours:
AM Peak Hour: 7:00am to 8:00am
PM Peak Hour: 4:15pm to 5:15pm.
The AM and PM peak hour volumes are shown in Figure 2.4 and Figure 2.5.
16 =
16 " 14 144 15 4 = 1 0
95 ? 8 $ 9 56 " 8 9
: # ; < 13 < 0
71 116 28 ! 13 ! 36
> 6
Bran
d H
wy
Great Northern Hwy
Mu
chea
Eas
t R
d
Gulliente RoadGreat Northern Hwy
25 =
22 " 20 99 4 0 = 2 0
108 ? 8 $ 9 28 " 8 9
: # ; < 5 < 0
95 153 5 ! 10 ! 21
> 6
Gulliente Road
Bran
d H
wy
Mu
chea
Eas
t R
d
Great Northern Hwy
Great Northern Hwy
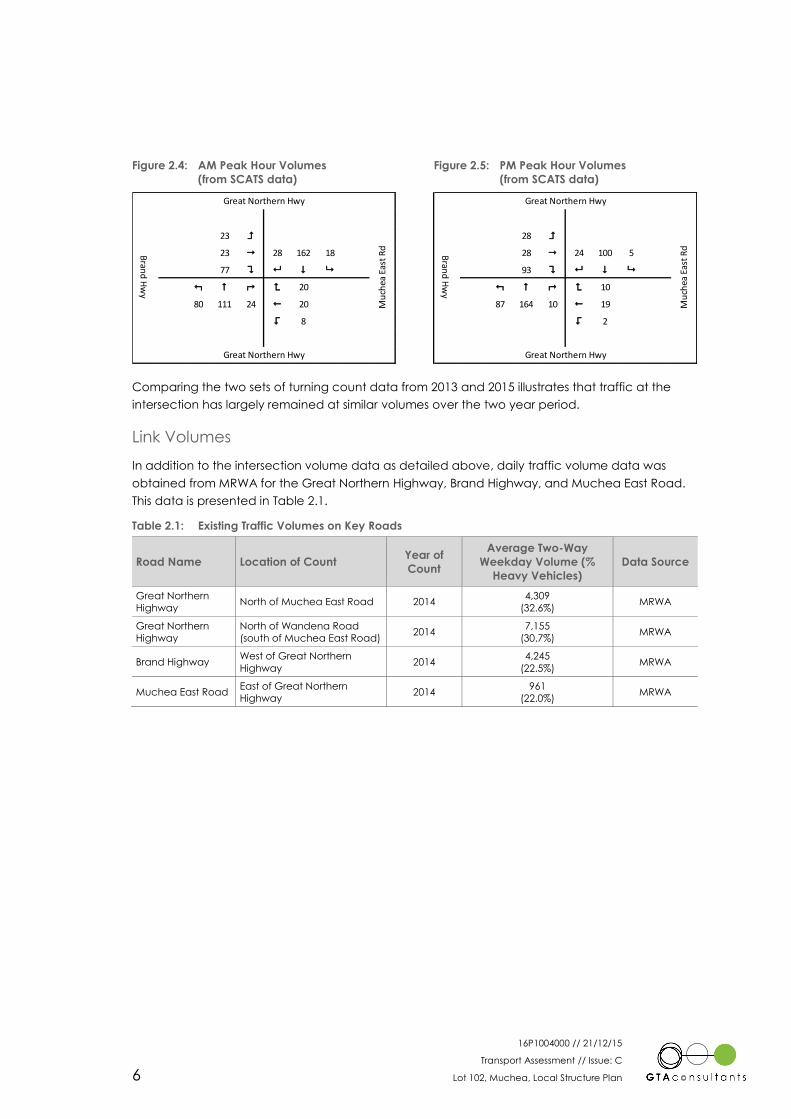
16P1004000 // 21/12/15
Transport Assessment // Issue: C
Lot 102, Muchea, Local Structure Plan 6
Figure 2.4: AM Peak Hour Volumes
(from SCATS data)
Figure 2.5: PM Peak Hour Volumes
(from SCATS data)
Comparing the two sets of turning count data from 2013 and 2015 illustrates that traffic at the
intersection has largely remained at similar volumes over the two year period.
Link Volumes
In addition to the intersection volume data as detailed above, daily traffic volume data was
obtained from MRWA for the Great Northern Highway, Brand Highway, and Muchea East Road.
This data is presented in Table 2.1.
Table 2.1: Existing Traffic Volumes on Key Roads
Road Name Location of Count Year of
Count
Average Two-Way
Weekday Volume (%
Heavy Vehicles)
Data Source
Great Northern
Highway North of Muchea East Road 2014
4,309
(32.6%) MRWA
Great Northern
Highway
North of Wandena Road
(south of Muchea East Road) 2014
7,155
(30.7%) MRWA
Brand Highway West of Great Northern
Highway 2014
4,245
(22.5%) MRWA
Muchea East Road East of Great Northern
Highway 2014
961
(22.0%) MRWA
23 =
23 " 28 162 18
77 ? 8 $ 9
: # ; < 20
80 111 24 ! 20
> 8
Great Northern Hwy
Bran
d H
wy
Mu
chea
Eas
t R
d
Great Northern Hwy
28 =
28 " 24 100 5
93 ? 8 $ 9
: # ; < 10
87 164 10 ! 19
> 2
Great Northern HwyB
rand
Hw
y
Mu
chea
Eas
t R
d
Great Northern Hwy
16P1004000 // 21/12/15
Transport Assessment // Issue: C
Lot 102, Muchea, Local Structure Plan 7
3. Development Proposal
3.1 Context
The subject site is located adjacent to the Great Northern Highway, and just north of the Brand
Highway. These routes will be the subject to significant changes in the near future as a result of
the NorthLink WA project that is currently being delivered by MRWA. The NorthLink WA project
involves the two key elements of:
Southern Section: Tonkin Highway grade separations
Perth Darwin National Highway: a 37km link between the Southern Section and Great
Northern Highway / Brand Highway in Muchea.
A key element of the Perth Darwin National Highway is the delivery of a large-scale interchange
between Great Northern Highway and Brand Highway, which will be located adjacent to the LSP
area. The delivery of this is yet unconfirmed but it is understood there is a desire to deliver the
project in its entirety by the end of 20191.
In coordination with the NorthLink WA project, the Great Northern Highway – Muchea to Wubin
Stage 2 Upgrade project is also currently being delivered by MRWA. The intent of this project is to
improve safety and efficiency on the highway between Muchea and Wubin and also upgrade
the road to a standard that allows the movement of RAV 10 from the current RAV 7. RAV classes
allow the movement of vehicles of particular dimensions and weight on specific routes. The RAV
10 classification would terminate at Muchea and so at this location vehicles would be required to
‘de-couple’ and convert into smaller RAV 7 vehicles for travel south into Perth or north via the
Brand Highway. In order to enable this, MRWA propose to construct a Road Train Assembly Area
(RTAA) directly adjacent to the LSP which is accessed directly from the Perth Darwin National
Highway.
3.2 Development Proposal
As a result of the major infrastructure works in the area, it is proposed to defer the opening of the
LSP proposals until the NorthLink WA infrastructure upgrades are complete. In the meantime, it is
proposed to provide an interim development scenario which will allow the operation of an
unmanned fuel station. Further information on the interim and LSP proposals are provided below.
Interim Proposal
It is proposed to operate an unmanned re-fuelling facility within the LSP area prior to the
implementation of the LSP proposals. The re-fuelling facility will be located on the Great Northern
Highway frontage of the LSP area, as conceptually shown in Figure 3.1.
1 NorthLink WA presentation by Rob Arnott (Senior Project Director) to Engineers Australia on Thursday 17th September 2015.
3
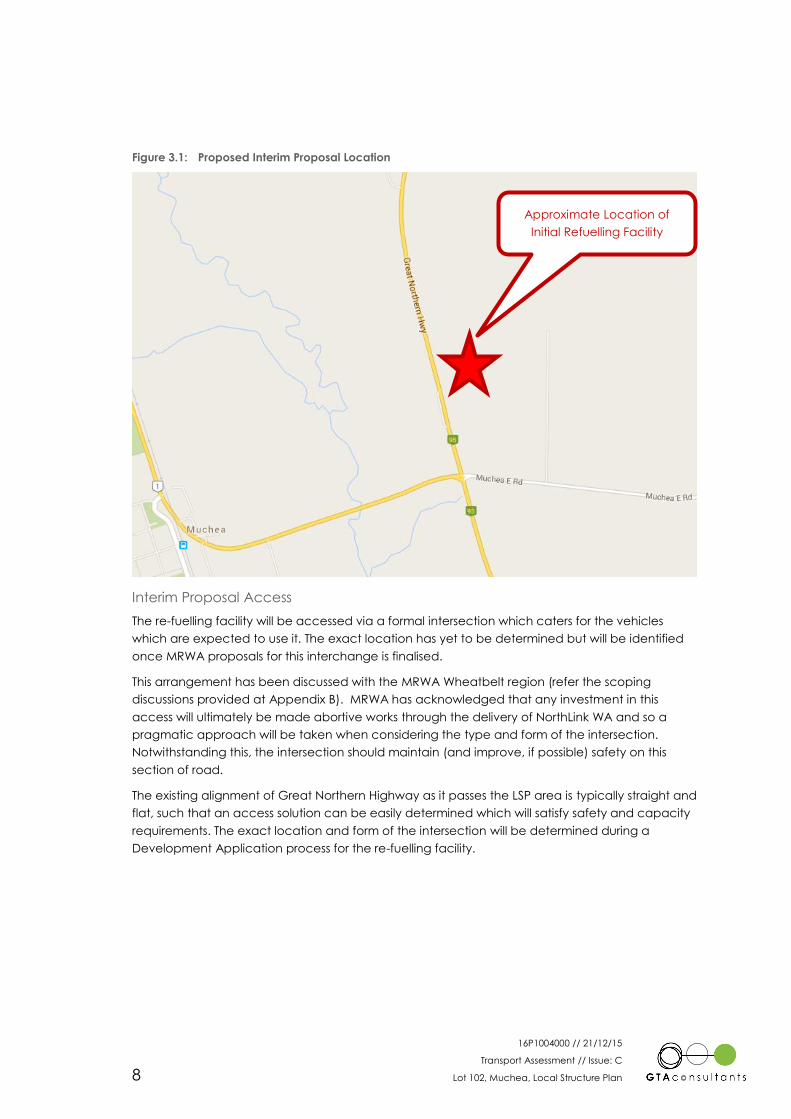
16P1004000 // 21/12/15
Transport Assessment // Issue: C
Lot 102, Muchea, Local Structure Plan 8
Figure 3.1: Proposed Interim Proposal Location
Interim Proposal Access
The re-fuelling facility will be accessed via a formal intersection which caters for the vehicles
which are expected to use it. The exact location has yet to be determined but will be identified
once MRWA proposals for this interchange is finalised.
This arrangement has been discussed with the MRWA Wheatbelt region (refer the scoping
discussions provided at Appendix B). MRWA has acknowledged that any investment in this
access will ultimately be made abortive works through the delivery of NorthLink WA and so a
pragmatic approach will be taken when considering the type and form of the intersection.
Notwithstanding this, the intersection should maintain (and improve, if possible) safety on this
section of road.
The existing alignment of Great Northern Highway as it passes the LSP area is typically straight and
flat, such that an access solution can be easily determined which will satisfy safety and capacity
requirements. The exact location and form of the intersection will be determined during a
Development Application process for the re-fuelling facility.
Approximate Location of
Initial Refuelling Facility
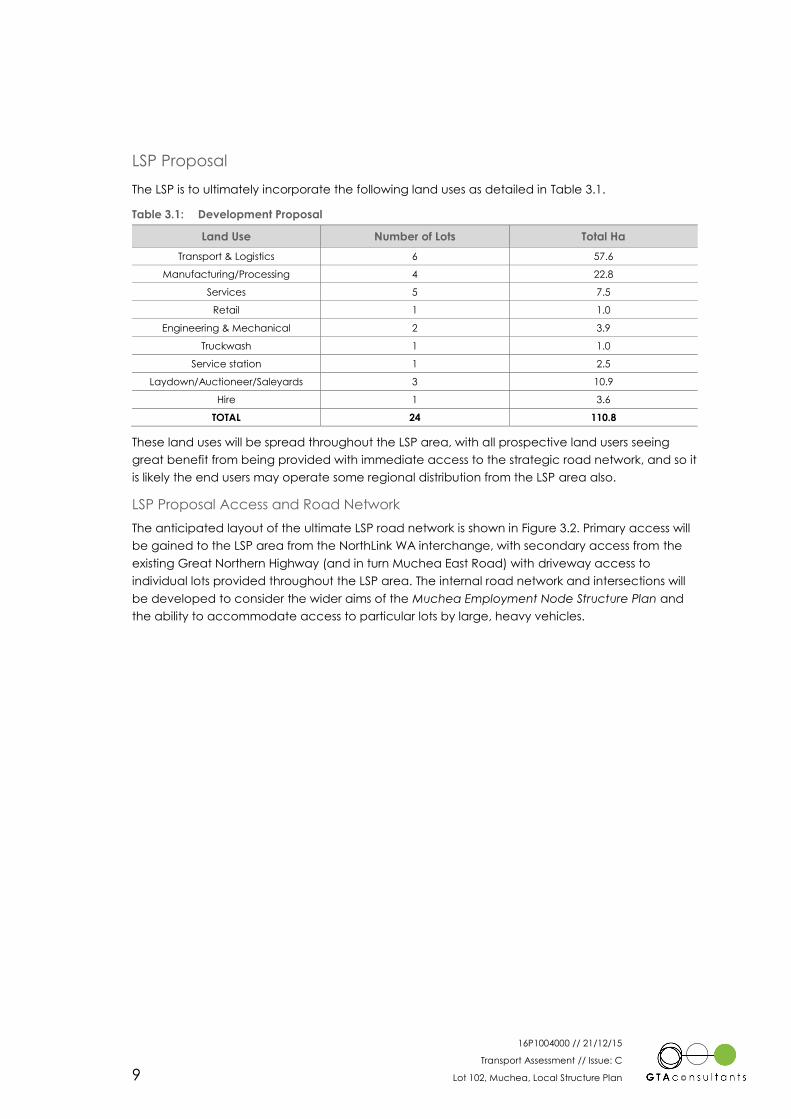
16P1004000 // 21/12/15
Transport Assessment // Issue: C
Lot 102, Muchea, Local Structure Plan 9
LSP Proposal
The LSP is to ultimately incorporate the following land uses as detailed in Table 3.1.
Table 3.1: Development Proposal
Land Use Number of Lots Total Ha
Transport & Logistics 6 57.6
Manufacturing/Processing 4 22.8
Services 5 7.5
Retail 1 1.0
Engineering & Mechanical 2 3.9
Truckwash 1 1.0
Service station 1 2.5
Laydown/Auctioneer/Saleyards 3 10.9
Hire 1 3.6
TOTAL 24 110.8
These land uses will be spread throughout the LSP area, with all prospective land users seeing
great benefit from being provided with immediate access to the strategic road network, and so it
is likely the end users may operate some regional distribution from the LSP area also.
LSP Proposal Access and Road Network
The anticipated layout of the ultimate LSP road network is shown in Figure 3.2. Primary access will
be gained to the LSP area from the NorthLink WA interchange, with secondary access from the
existing Great Northern Highway (and in turn Muchea East Road) with driveway access to
individual lots provided throughout the LSP area. The internal road network and intersections will
be developed to consider the wider aims of the Muchea Employment Node Structure Plan and
the ability to accommodate access to particular lots by large, heavy vehicles.
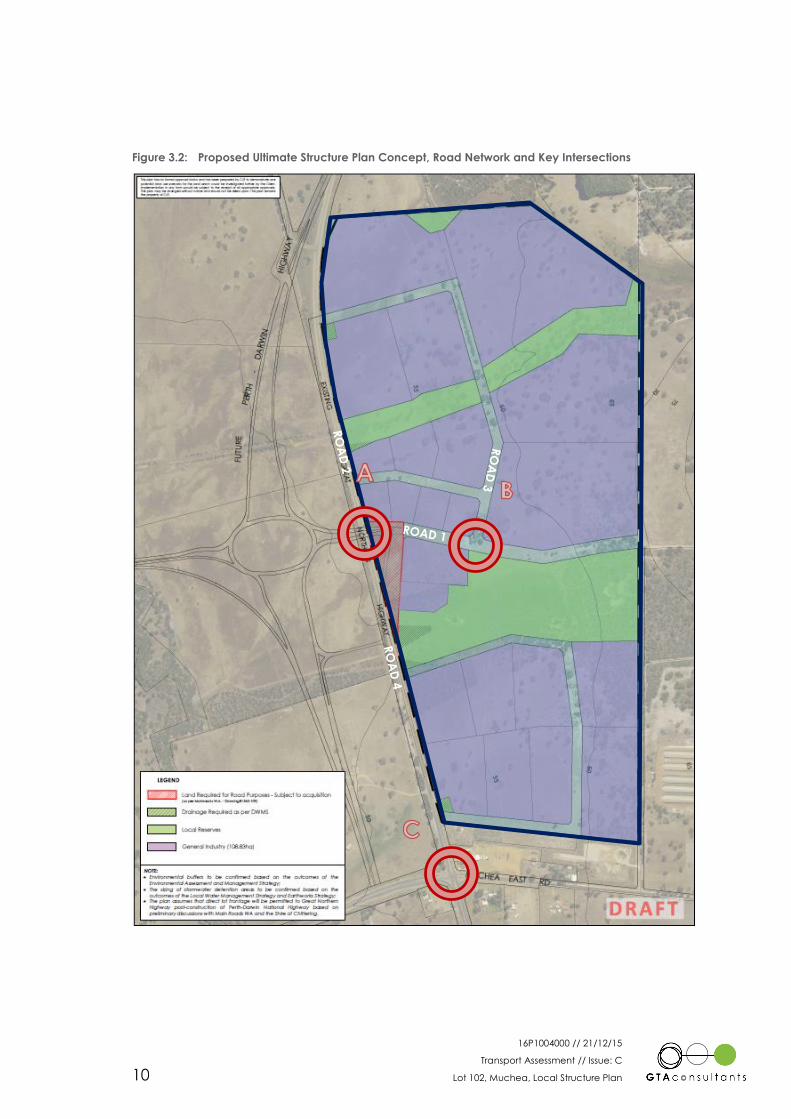
16P1004000 // 21/12/15
Transport Assessment // Issue: C
Lot 102, Muchea, Local Structure Plan 10
Figure 3.2: Proposed Ultimate Structure Plan Concept, Road Network and Key Intersections
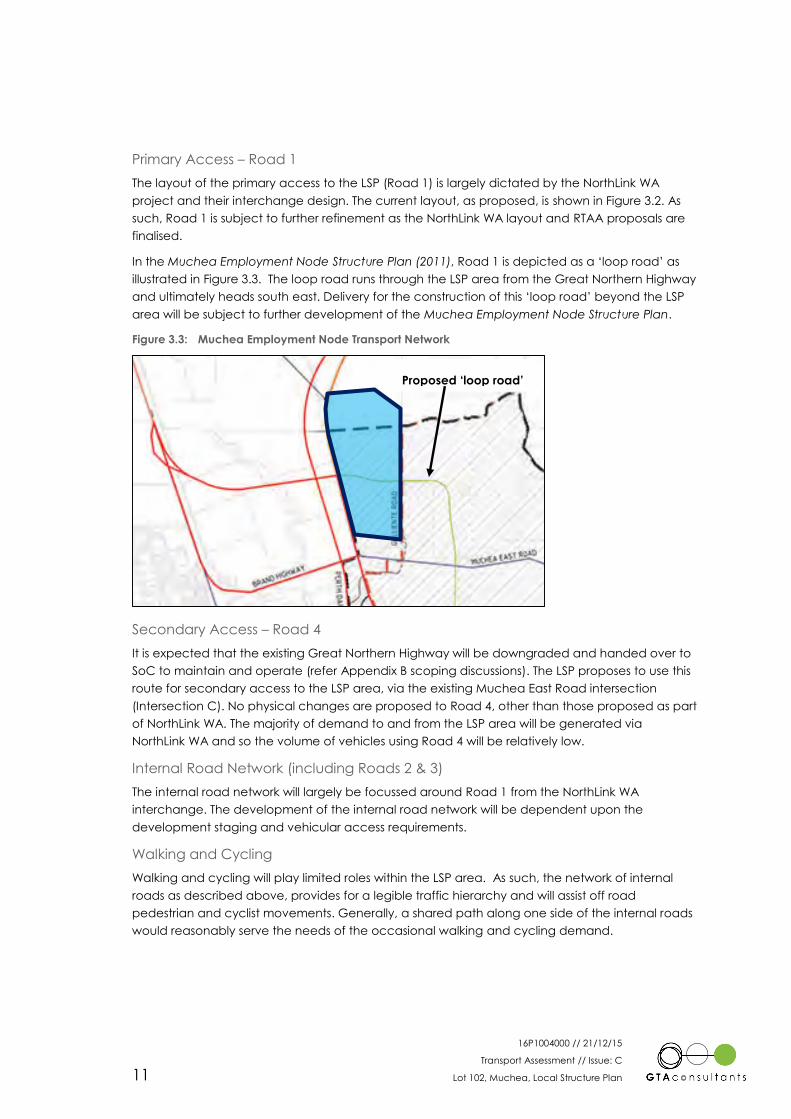
16P1004000 // 21/12/15
Transport Assessment // Issue: C
Lot 102, Muchea, Local Structure Plan 11
Primary Access – Road 1
The layout of the primary access to the LSP (Road 1) is largely dictated by the NorthLink WA
project and their interchange design. The current layout, as proposed, is shown in Figure 3.2. As
such, Road 1 is subject to further refinement as the NorthLink WA layout and RTAA proposals are
finalised.
In the Muchea Employment Node Structure Plan (2011), Road 1 is depicted as a ‘loop road’ as
illustrated in Figure 3.3. The loop road runs through the LSP area from the Great Northern Highway
and ultimately heads south east. Delivery for the construction of this ‘loop road’ beyond the LSP
area will be subject to further development of the Muchea Employment Node Structure Plan.
Figure 3.3: Muchea Employment Node Transport Network
Secondary Access – Road 4
It is expected that the existing Great Northern Highway will be downgraded and handed over to
SoC to maintain and operate (refer Appendix B scoping discussions). The LSP proposes to use this
route for secondary access to the LSP area, via the existing Muchea East Road intersection
(Intersection C). No physical changes are proposed to Road 4, other than those proposed as part
of NorthLink WA. The majority of demand to and from the LSP area will be generated via
NorthLink WA and so the volume of vehicles using Road 4 will be relatively low.
Internal Road Network (including Roads 2 & 3)
The internal road network will largely be focussed around Road 1 from the NorthLink WA
interchange. The development of the internal road network will be dependent upon the
development staging and vehicular access requirements.
Walking and Cycling
Walking and cycling will play limited roles within the LSP area. As such, the network of internal
roads as described above, provides for a legible traffic hierarchy and will assist off road
pedestrian and cyclist movements. Generally, a shared path along one side of the internal roads
would reasonably serve the needs of the occasional walking and cycling demand.
Proposed ‘loop road’
16P1004000 // 21/12/15
Transport Assessment // Issue: C
Lot 102, Muchea, Local Structure Plan 12
4. Traffic Impact Assessment
4.1 Assessment Scenarios
Two key scenarios have been determined for consideration as part of this assessment, in line with
the development proposals set out in Section 3.2.
Interim Proposal (2016)
Given likely planning and construction timeframes, it is expected that the proposed re-fuelling
facility would be operational by the end of 2016. As such, this has been assumed to be the base
year for the interim proposal traffic impact assessment. A 2% per annum traffic growth rate has
been applied to determine the 2016 base volumes from existing volumes, on the basis of historic
traffic growth identified on Great Northern Highway as it passes the site.
LSP Proposal (2031)
The LSP Proposal scenario assumes that the entire subject site is fully developed, and that the
proposed NorthLink WA road upgrades (including future intersections and interchanges) are all
complete and operational.
In this scenario, the re-fuelling facility delivered as part of the Interim Proposal will be removed
from the site and replaced as a full roadside service station (with convenience store and
associated facilities) in a location proximate to the proposed RTAA.
In accordance with MRWA traffic modelling for the NorthLink WA project, 2031 has been taken to
be the ultimate design horizon at which full development is assumed.
4.2 Assumptions
Muchea Employment Node (Background Traffic)
All land beyond the LSP to the east is currently zoned ‘Agricultural Resource’ and at the time of
writing this report, there are no known scheme amendments proposed within the Muchea
Employment Node Structure Plan area to rezone land to facilitate industrial development. Further,
the project team is not aware of any proposed developments that will generate additional traffic
on the road network, specifically on the loop road (Road 1).
Assumption 1: On the basis of the above, it would be reasonable to assume that at LSP’s full
development around 2031, there would be no or very little traffic demand accessing the loop
road through the LSP area from the east.
There is therefore no requirement, for the purposes of operating the LSP area, to provide any road
link to the east of ‘Intersection B’. This means that the intersection does not need to be an
intersection as there is no real purpose for the road to the east for the operations of the LSP.
Assuming an eastern approach to form ‘Intersection B’ is constructed, it will initially be adequate
to provide a priority controlled intersection. The intersection operational assessment detailed in
Section 4.5 demonstrates a priority control will have some surplus traffic capacity during peak
periods.
4
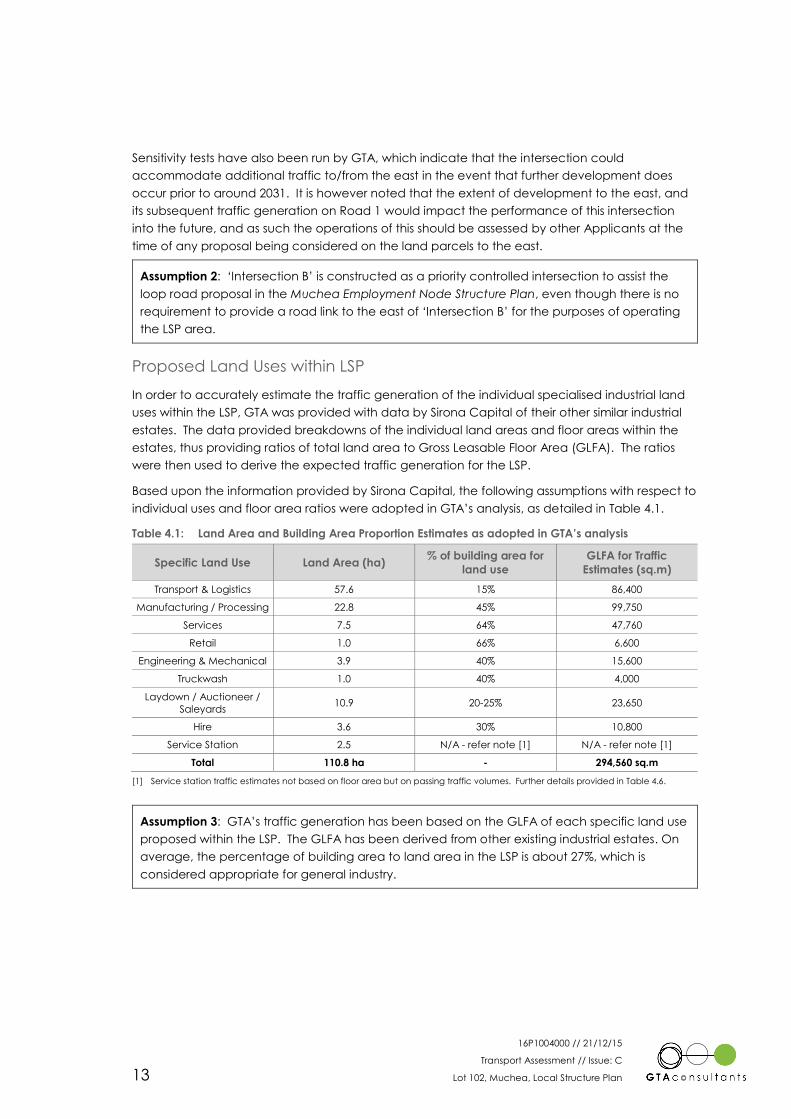
16P1004000 // 21/12/15
Transport Assessment // Issue: C
Lot 102, Muchea, Local Structure Plan 13
Sensitivity tests have also been run by GTA, which indicate that the intersection could
accommodate additional traffic to/from the east in the event that further development does
occur prior to around 2031. It is however noted that the extent of development to the east, and
its subsequent traffic generation on Road 1 would impact the performance of this intersection
into the future, and as such the operations of this should be assessed by other Applicants at the
time of any proposal being considered on the land parcels to the east.
Assumption 2: ‘Intersection B’ is constructed as a priority controlled intersection to assist the
loop road proposal in the Muchea Employment Node Structure Plan, even though there is no
requirement to provide a road link to the east of ‘Intersection B’ for the purposes of operating
the LSP area.
Proposed Land Uses within LSP
In order to accurately estimate the traffic generation of the individual specialised industrial land
uses within the LSP, GTA was provided with data by Sirona Capital of their other similar industrial
estates. The data provided breakdowns of the individual land areas and floor areas within the
estates, thus providing ratios of total land area to Gross Leasable Floor Area (GLFA). The ratios
were then used to derive the expected traffic generation for the LSP.
Based upon the information provided by Sirona Capital, the following assumptions with respect to
individual uses and floor area ratios were adopted in GTA’s analysis, as detailed in Table 4.1.
Table 4.1: Land Area and Building Area Proportion Estimates as adopted in GTA’s analysis
Specific Land Use Land Area (ha) % of building area for
land use
GLFA for Traffic
Estimates (sq.m)
Transport & Logistics 57.6 15% 86,400
Manufacturing / Processing 22.8 45% 99,750
Services 7.5 64% 47,760
Retail 1.0 66% 6,600
Engineering & Mechanical 3.9 40% 15,600
Truckwash 1.0 40% 4,000
Laydown / Auctioneer /
Saleyards 10.9 20-25% 23,650
Hire 3.6 30% 10,800
Service Station 2.5 N/A - refer note [1] N/A - refer note [1]
Total 110.8 ha - 294,560 sq.m
[1] Service station traffic estimates not based on floor area but on passing traffic volumes. Further details provided in Table 4.6.
Assumption 3: GTA’s traffic generation has been based on the GLFA of each specific land use
proposed within the LSP. The GLFA has been derived from other existing industrial estates. On
average, the percentage of building area to land area in the LSP is about 27%, which is
considered appropriate for general industry.
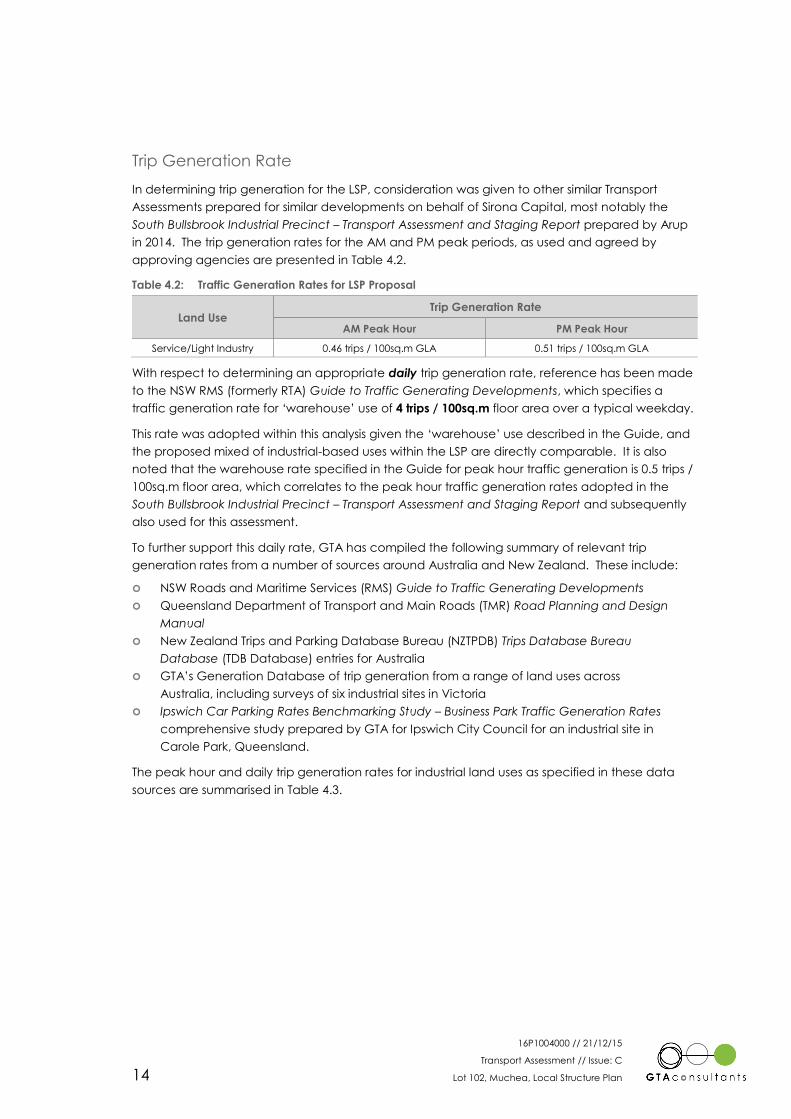
16P1004000 // 21/12/15
Transport Assessment // Issue: C
Lot 102, Muchea, Local Structure Plan 14
Trip Generation Rate
In determining trip generation for the LSP, consideration was given to other similar Transport
Assessments prepared for similar developments on behalf of Sirona Capital, most notably the
South Bullsbrook Industrial Precinct – Transport Assessment and Staging Report prepared by Arup
in 2014. The trip generation rates for the AM and PM peak periods, as used and agreed by
approving agencies are presented in Table 4.2.
Table 4.2: Traffic Generation Rates for LSP Proposal
Land Use Trip Generation Rate
AM Peak Hour PM Peak Hour
Service/Light Industry 0.46 trips / 100sq.m GLA 0.51 trips / 100sq.m GLA
With respect to determining an appropriate daily trip generation rate, reference has been made
to the NSW RMS (formerly RTA) Guide to Traffic Generating Developments, which specifies a
traffic generation rate for ‘warehouse’ use of 4 trips / 100sq.m floor area over a typical weekday.
This rate was adopted within this analysis given the ‘warehouse’ use described in the Guide, and
the proposed mixed of industrial-based uses within the LSP are directly comparable. It is also
noted that the warehouse rate specified in the Guide for peak hour traffic generation is 0.5 trips /
100sq.m floor area, which correlates to the peak hour traffic generation rates adopted in the
South Bullsbrook Industrial Precinct – Transport Assessment and Staging Report and subsequently
also used for this assessment.
To further support this daily rate, GTA has compiled the following summary of relevant trip
generation rates from a number of sources around Australia and New Zealand. These include:
NSW Roads and Maritime Services (RMS) Guide to Traffic Generating Developments
Queensland Department of Transport and Main Roads (TMR) Road Planning and Design
Manual
New Zealand Trips and Parking Database Bureau (NZTPDB) Trips Database Bureau
Database (TDB Database) entries for Australia
GTA’s Generation Database of trip generation from a range of land uses across
Australia, including surveys of six industrial sites in Victoria
Ipswich Car Parking Rates Benchmarking Study – Business Park Traffic Generation Rates
comprehensive study prepared by GTA for Ipswich City Council for an industrial site in
Carole Park, Queensland.
The peak hour and daily trip generation rates for industrial land uses as specified in these data
sources are summarised in Table 4.3.
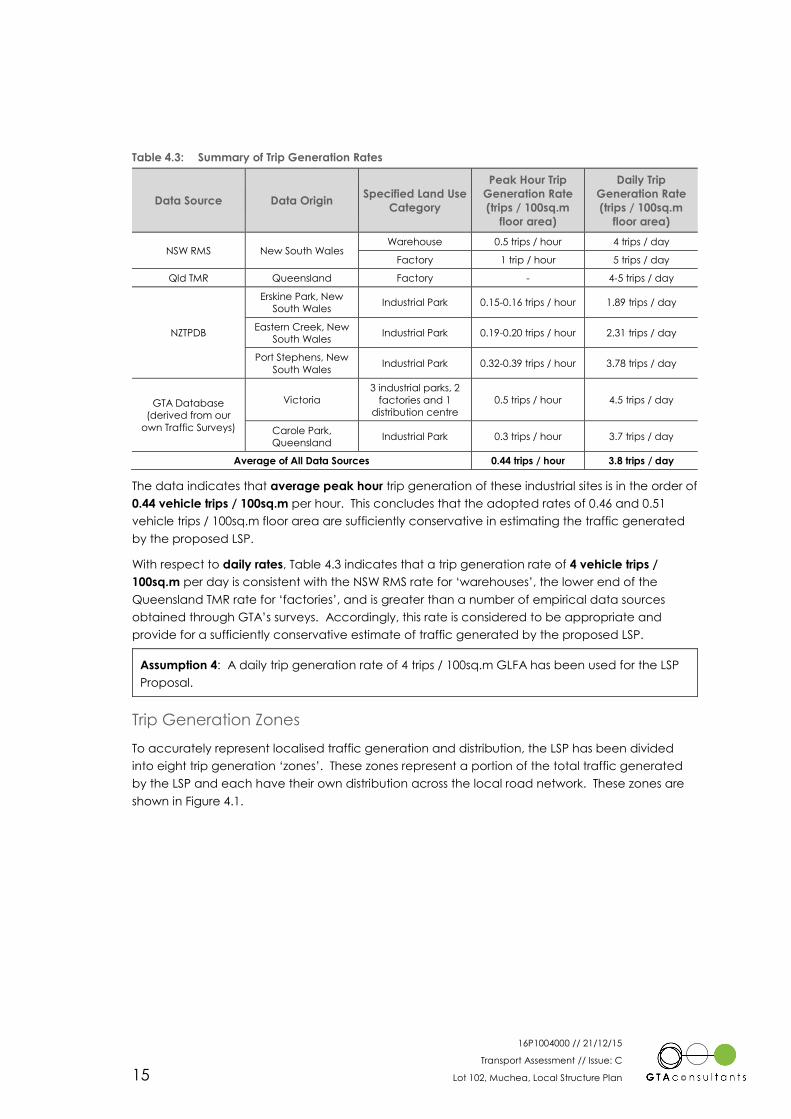
16P1004000 // 21/12/15
Transport Assessment // Issue: C
Lot 102, Muchea, Local Structure Plan 15
Table 4.3: Summary of Trip Generation Rates
Data Source Data Origin Specified Land Use
Category
Peak Hour Trip
Generation Rate
(trips / 100sq.m
floor area)
Daily Trip
Generation Rate
(trips / 100sq.m
floor area)
NSW RMS New South Wales Warehouse 0.5 trips / hour 4 trips / day
Factory 1 trip / hour 5 trips / day
Qld TMR Queensland Factory - 4-5 trips / day
NZTPDB
Erskine Park, New
South Wales Industrial Park 0.15-0.16 trips / hour 1.89 trips / day
Eastern Creek, New
South Wales Industrial Park 0.19-0.20 trips / hour 2.31 trips / day
Port Stephens, New
South Wales Industrial Park 0.32-0.39 trips / hour 3.78 trips / day
GTA Database
(derived from our
own Traffic Surveys)
Victoria
3 industrial parks, 2
factories and 1
distribution centre
0.5 trips / hour 4.5 trips / day
Carole Park,
Queensland Industrial Park 0.3 trips / hour 3.7 trips / day
Average of All Data Sources 0.44 trips / hour 3.8 trips / day
The data indicates that average peak hour trip generation of these industrial sites is in the order of
0.44 vehicle trips / 100sq.m per hour. This concludes that the adopted rates of 0.46 and 0.51
vehicle trips / 100sq.m floor area are sufficiently conservative in estimating the traffic generated
by the proposed LSP.
With respect to daily rates, Table 4.3 indicates that a trip generation rate of 4 vehicle trips /
100sq.m per day is consistent with the NSW RMS rate for ‘warehouses’, the lower end of the
Queensland TMR rate for ‘factories’, and is greater than a number of empirical data sources
obtained through GTA’s surveys. Accordingly, this rate is considered to be appropriate and
provide for a sufficiently conservative estimate of traffic generated by the proposed LSP.
Assumption 4: A daily trip generation rate of 4 trips / 100sq.m GLFA has been used for the LSP
Proposal.
Trip Generation Zones
To accurately represent localised traffic generation and distribution, the LSP has been divided
into eight trip generation ‘zones’. These zones represent a portion of the total traffic generated
by the LSP and each have their own distribution across the local road network. These zones are
shown in Figure 4.1.
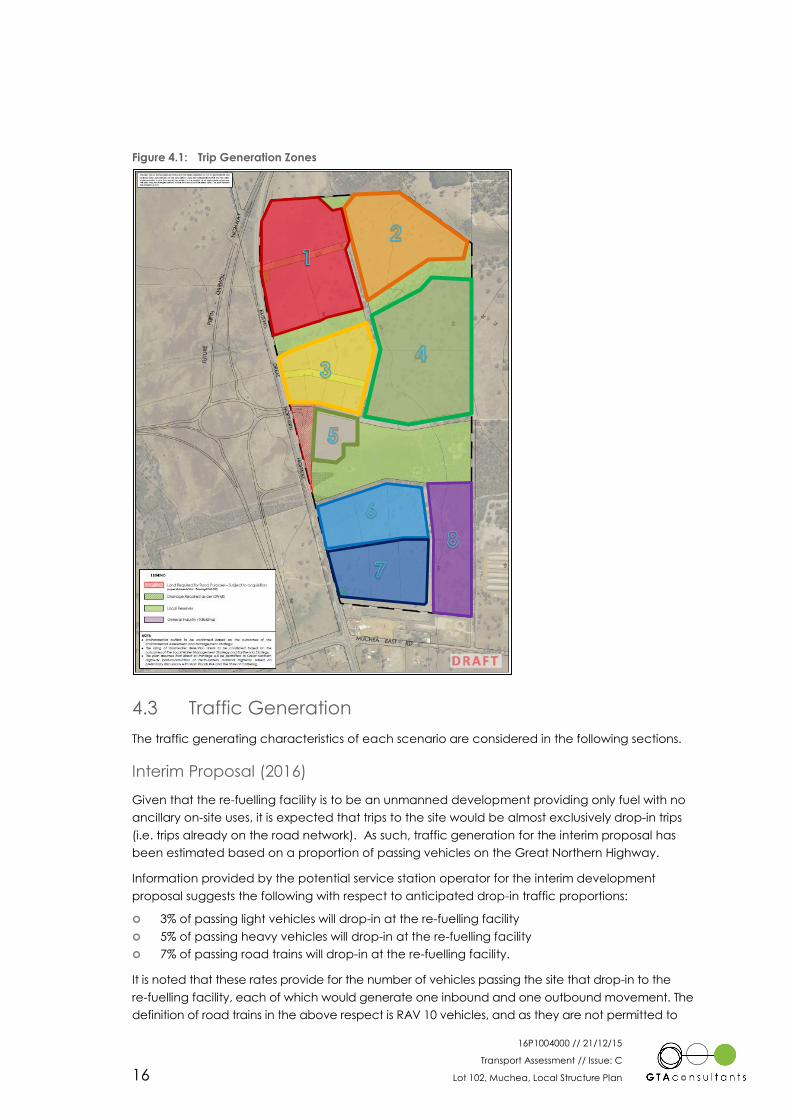
16P1004000 // 21/12/15
Transport Assessment // Issue: C
Lot 102, Muchea, Local Structure Plan 16
Figure 4.1: Trip Generation Zones
4.3 Traffic Generation
The traffic generating characteristics of each scenario are considered in the following sections.
Interim Proposal (2016)
Given that the re-fuelling facility is to be an unmanned development providing only fuel with no
ancillary on-site uses, it is expected that trips to the site would be almost exclusively drop-in trips
(i.e. trips already on the road network). As such, traffic generation for the interim proposal has
been estimated based on a proportion of passing vehicles on the Great Northern Highway.
Information provided by the potential service station operator for the interim development
proposal suggests the following with respect to anticipated drop-in traffic proportions:
3% of passing light vehicles will drop-in at the re-fuelling facility
5% of passing heavy vehicles will drop-in at the re-fuelling facility
7% of passing road trains will drop-in at the re-fuelling facility.
It is noted that these rates provide for the number of vehicles passing the site that drop-in to the
re-fuelling facility, each of which would generate one inbound and one outbound movement. The
definition of road trains in the above respect is RAV 10 vehicles, and as they are not permitted to
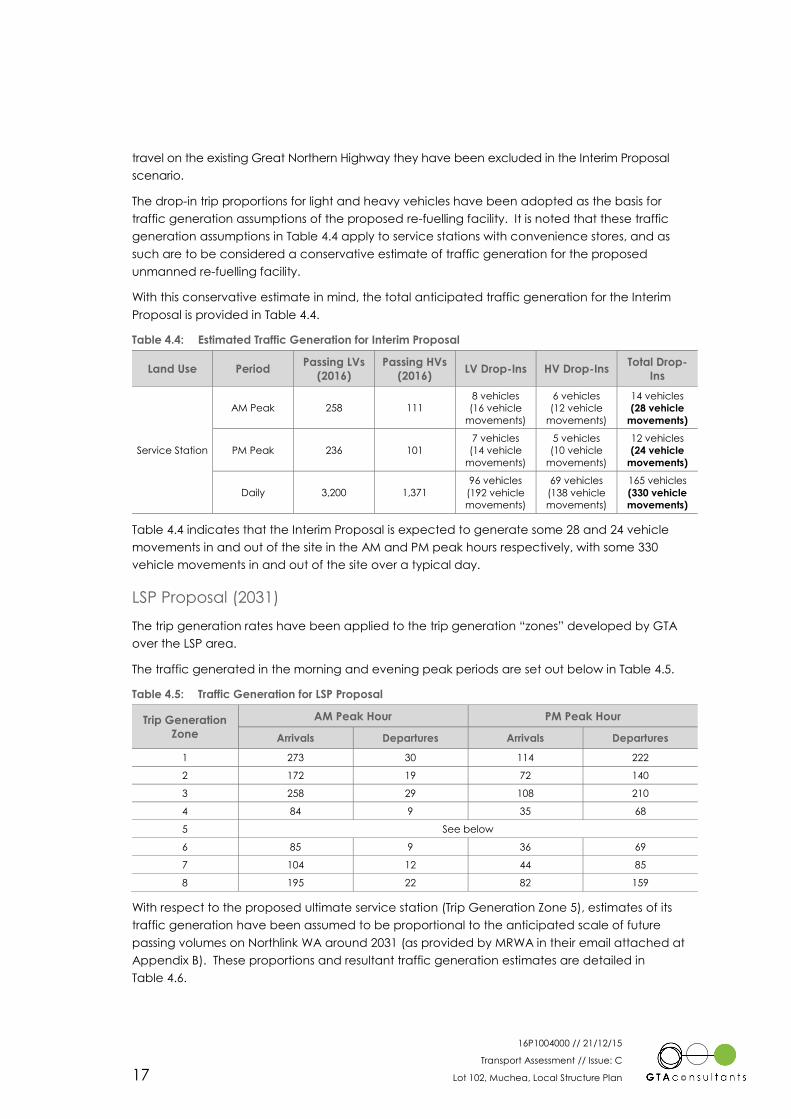
16P1004000 // 21/12/15
Transport Assessment // Issue: C
Lot 102, Muchea, Local Structure Plan 17
travel on the existing Great Northern Highway they have been excluded in the Interim Proposal
scenario.
The drop-in trip proportions for light and heavy vehicles have been adopted as the basis for
traffic generation assumptions of the proposed re-fuelling facility. It is noted that these traffic
generation assumptions in Table 4.4 apply to service stations with convenience stores, and as
such are to be considered a conservative estimate of traffic generation for the proposed
unmanned re-fuelling facility.
With this conservative estimate in mind, the total anticipated traffic generation for the Interim
Proposal is provided in Table 4.4.
Table 4.4: Estimated Traffic Generation for Interim Proposal
Land Use Period Passing LVs
(2016)
Passing HVs
(2016) LV Drop-Ins HV Drop-Ins
Total Drop-
Ins
Service Station
AM Peak 258 111 8 vehicles
(16 vehicle
movements)
6 vehicles
(12 vehicle
movements)
14 vehicles
(28 vehicle
movements)
PM Peak 236 101
7 vehicles
(14 vehicle
movements)
5 vehicles
(10 vehicle
movements)
12 vehicles
(24 vehicle
movements)
Daily 3,200 1,371
96 vehicles
(192 vehicle
movements)
69 vehicles
(138 vehicle
movements)
165 vehicles
(330 vehicle
movements)
Table 4.4 indicates that the Interim Proposal is expected to generate some 28 and 24 vehicle
movements in and out of the site in the AM and PM peak hours respectively, with some 330
vehicle movements in and out of the site over a typical day.
LSP Proposal (2031)
The trip generation rates have been applied to the trip generation “zones” developed by GTA
over the LSP area.
The traffic generated in the morning and evening peak periods are set out below in Table 4.5.
Table 4.5: Traffic Generation for LSP Proposal
Trip Generation
Zone
AM Peak Hour PM Peak Hour
Arrivals Departures Arrivals Departures
1 273 30 114 222
2 172 19 72 140
3 258 29 108 210
4 84 9 35 68
5 See below
6 85 9 36 69
7 104 12 44 85
8 195 22 82 159
With respect to the proposed ultimate service station (Trip Generation Zone 5), estimates of its
traffic generation have been assumed to be proportional to the anticipated scale of future
passing volumes on Northlink WA around 2031 (as provided by MRWA in their email attached at
Appendix B). These proportions and resultant traffic generation estimates are detailed in
Table 4.6.
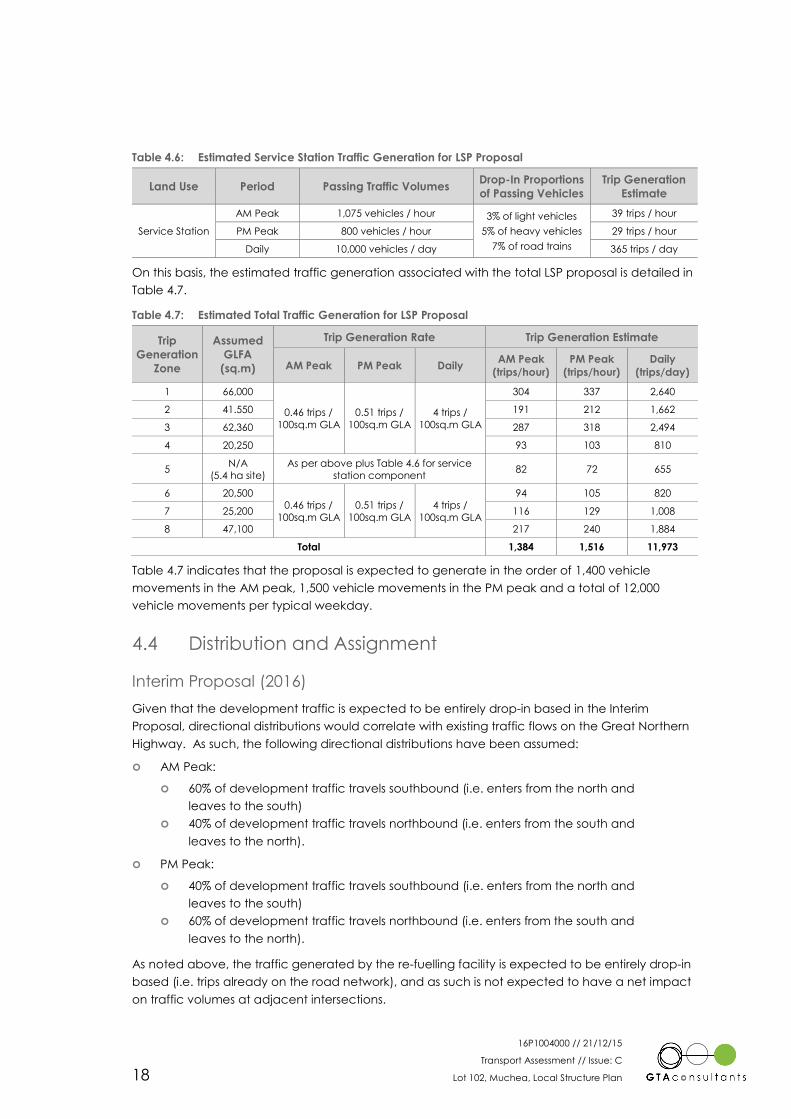
16P1004000 // 21/12/15
Transport Assessment // Issue: C
Lot 102, Muchea, Local Structure Plan 18
Table 4.6: Estimated Service Station Traffic Generation for LSP Proposal
Land Use Period Passing Traffic Volumes Drop-In Proportions
of Passing Vehicles
Trip Generation
Estimate
Service Station
AM Peak 1,075 vehicles / hour 3% of light vehicles
5% of heavy vehicles
7% of road trains
39 trips / hour
PM Peak 800 vehicles / hour 29 trips / hour
Daily 10,000 vehicles / day 365 trips / day
On this basis, the estimated traffic generation associated with the total LSP proposal is detailed in
Table 4.7.
Table 4.7: Estimated Total Traffic Generation for LSP Proposal
Trip
Generation
Zone
Assumed
GLFA
(sq.m)
Trip Generation Rate Trip Generation Estimate
AM Peak PM Peak Daily AM Peak
(trips/hour)
PM Peak
(trips/hour)
Daily
(trips/day)
1 66,000
0.46 trips /
100sq.m GLA
0.51 trips /
100sq.m GLA
4 trips /
100sq.m GLA
304 337 2,640
2 41.550 191 212 1,662
3 62,360 287 318 2,494
4 20,250 93 103 810
5 N/A
(5.4 ha site)
As per above plus Table 4.6 for service
station component 82 72 655
6 20,500 0.46 trips /
100sq.m GLA
0.51 trips /
100sq.m GLA
4 trips /
100sq.m GLA
94 105 820
7 25,200 116 129 1,008
8 47,100 217 240 1,884
Total 1,384 1,516 11,973
Table 4.7 indicates that the proposal is expected to generate in the order of 1,400 vehicle
movements in the AM peak, 1,500 vehicle movements in the PM peak and a total of 12,000
vehicle movements per typical weekday.
4.4 Distribution and Assignment
Interim Proposal (2016)
Given that the development traffic is expected to be entirely drop-in based in the Interim
Proposal, directional distributions would correlate with existing traffic flows on the Great Northern
Highway. As such, the following directional distributions have been assumed:
AM Peak:
60% of development traffic travels southbound (i.e. enters from the north and
leaves to the south)
40% of development traffic travels northbound (i.e. enters from the south and
leaves to the north).
PM Peak:
40% of development traffic travels southbound (i.e. enters from the north and
leaves to the south)
60% of development traffic travels northbound (i.e. enters from the south and
leaves to the north).
As noted above, the traffic generated by the re-fuelling facility is expected to be entirely drop-in
based (i.e. trips already on the road network), and as such is not expected to have a net impact
on traffic volumes at adjacent intersections.
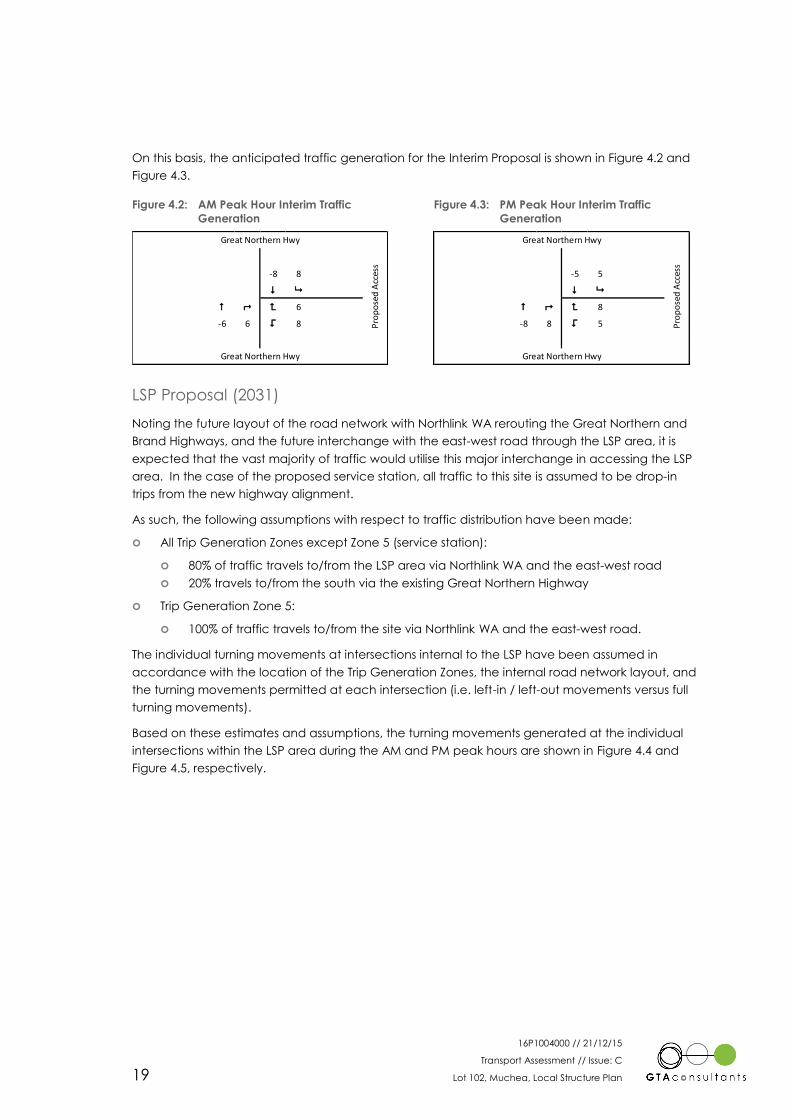
16P1004000 // 21/12/15
Transport Assessment // Issue: C
Lot 102, Muchea, Local Structure Plan 19
On this basis, the anticipated traffic generation for the Interim Proposal is shown in Figure 4.2 and
Figure 4.3.
Figure 4.2: AM Peak Hour Interim Traffic
Generation
Figure 4.3: PM Peak Hour Interim Traffic
Generation
LSP Proposal (2031)
Noting the future layout of the road network with Northlink WA rerouting the Great Northern and
Brand Highways, and the future interchange with the east-west road through the LSP area, it is
expected that the vast majority of traffic would utilise this major interchange in accessing the LSP
area. In the case of the proposed service station, all traffic to this site is assumed to be drop-in
trips from the new highway alignment.
As such, the following assumptions with respect to traffic distribution have been made:
All Trip Generation Zones except Zone 5 (service station):
80% of traffic travels to/from the LSP area via Northlink WA and the east-west road
20% travels to/from the south via the existing Great Northern Highway
Trip Generation Zone 5:
100% of traffic travels to/from the site via Northlink WA and the east-west road.
The individual turning movements at intersections internal to the LSP have been assumed in
accordance with the location of the Trip Generation Zones, the internal road network layout, and
the turning movements permitted at each intersection (i.e. left-in / left-out movements versus full
turning movements).
Based on these estimates and assumptions, the turning movements generated at the individual
intersections within the LSP area during the AM and PM peak hours are shown in Figure 4.4 and
Figure 4.5, respectively.
-8 8
$ 9
# ; < 6
-6 6 > 8
Great Northern Hwy
Pro
po
sed
Acc
ess
Great Northern Hwy
-5 5
$ 9
# ; < 8
-8 8 > 5
Great Northern Hwy
Pro
po
sed
Acc
ess
Great Northern Hwy
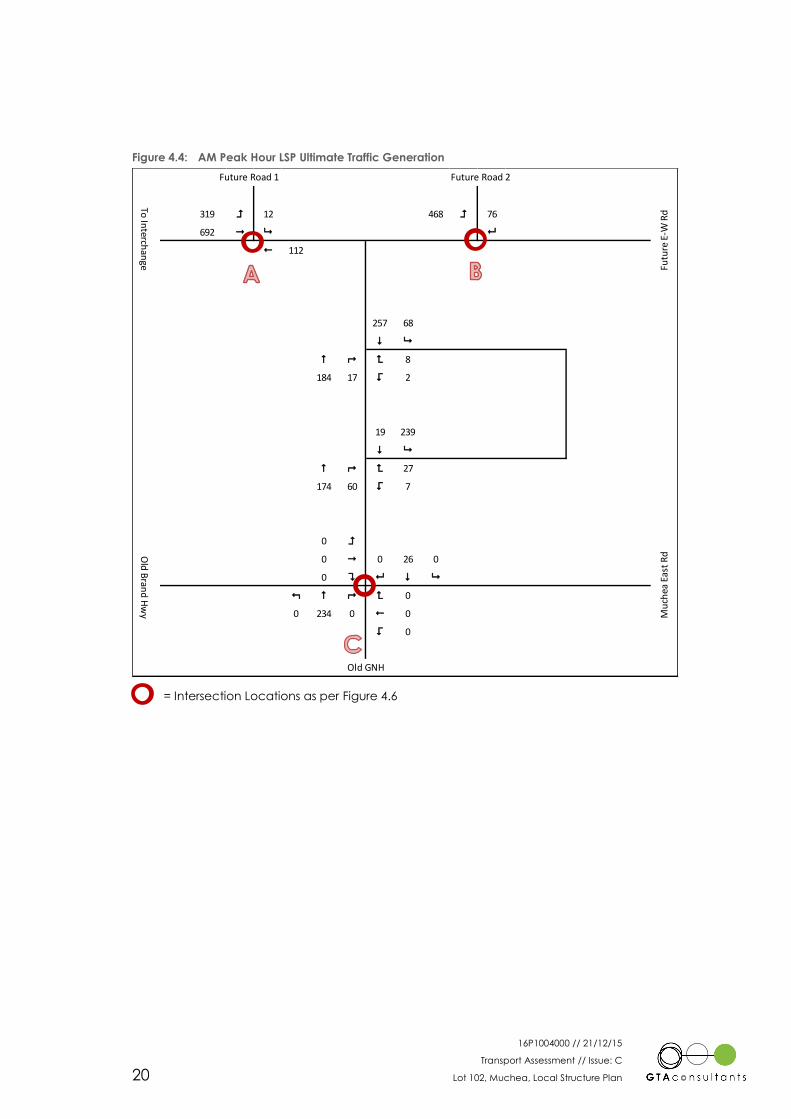
16P1004000 // 21/12/15
Transport Assessment // Issue: C
Lot 102, Muchea, Local Structure Plan 20
Figure 4.4: AM Peak Hour LSP Ultimate Traffic Generation
= Intersection Locations as per Figure 4.6
319 = 12 468 = 76
692 " 9 8
! 112
257 68
$ 9
# ; < 8
184 17 > 2
19 239
$ 9
# ; < 27
174 60 > 7
0 =
0 " 0 26 0
0 ? 8 $ 9
: # ; < 0
0 234 0 ! 0
> 0
Old GNH
Old
Bran
d H
wy M
uch
ea E
ast
Rd
Future Road 1 Future Road 2
To In
terchan
ge Futu
re E
-W R
d
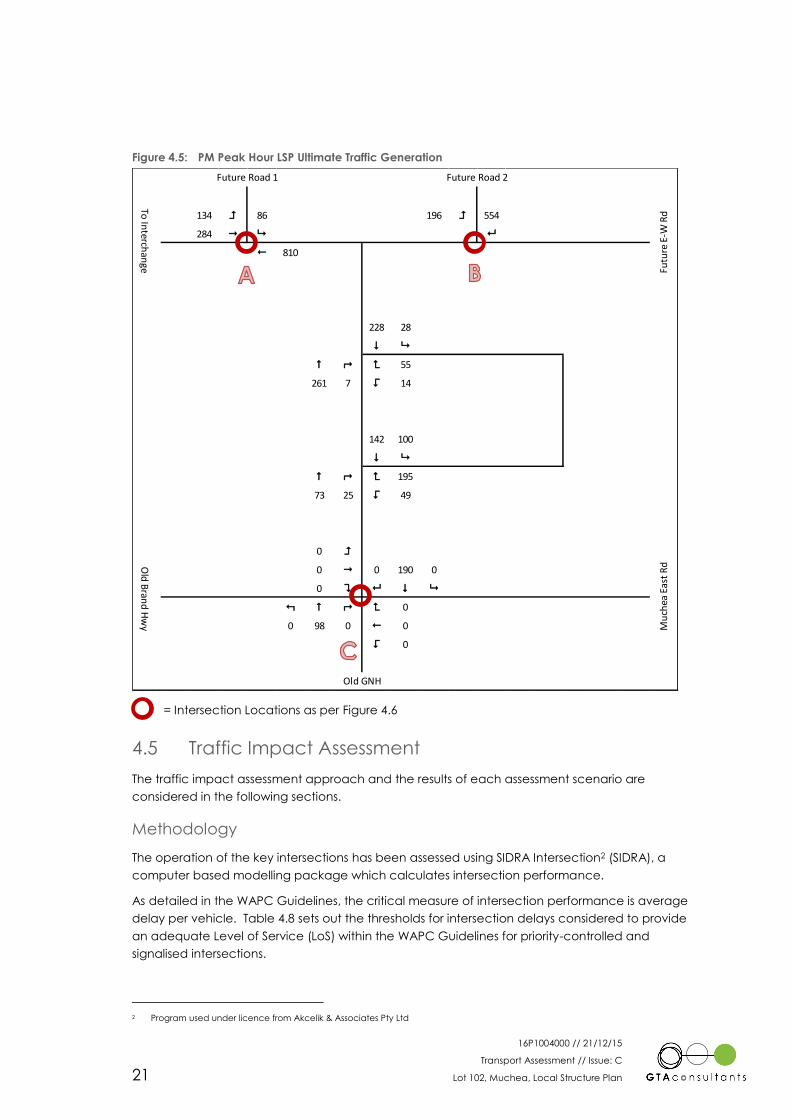
16P1004000 // 21/12/15
Transport Assessment // Issue: C
Lot 102, Muchea, Local Structure Plan 21
Figure 4.5: PM Peak Hour LSP Ultimate Traffic Generation
= Intersection Locations as per Figure 4.6
4.5 Traffic Impact Assessment
The traffic impact assessment approach and the results of each assessment scenario are
considered in the following sections.
Methodology
The operation of the key intersections has been assessed using SIDRA Intersection2 (SIDRA), a
computer based modelling package which calculates intersection performance.
As detailed in the WAPC Guidelines, the critical measure of intersection performance is average
delay per vehicle. Table 4.8 sets out the thresholds for intersection delays considered to provide
an adequate Level of Service (LoS) within the WAPC Guidelines for priority-controlled and
signalised intersections.
2 Program used under licence from Akcelik & Associates Pty Ltd
134 = 86 196 = 554
284 " 9 8
! 810
228 28
$ 9
# ; < 55
261 7 > 14
142 100
$ 9
# ; < 195
73 25 > 49
0 =
0 " 0 190 0
0 ? 8 $ 9
: # ; < 0
0 98 0 ! 0
> 0
Old GNH
Futu
re E
-W R
d
Old
Bran
d H
wy M
uch
ea E
ast
Rd
Future Road 1 Future Road 2
To In
terchan
ge
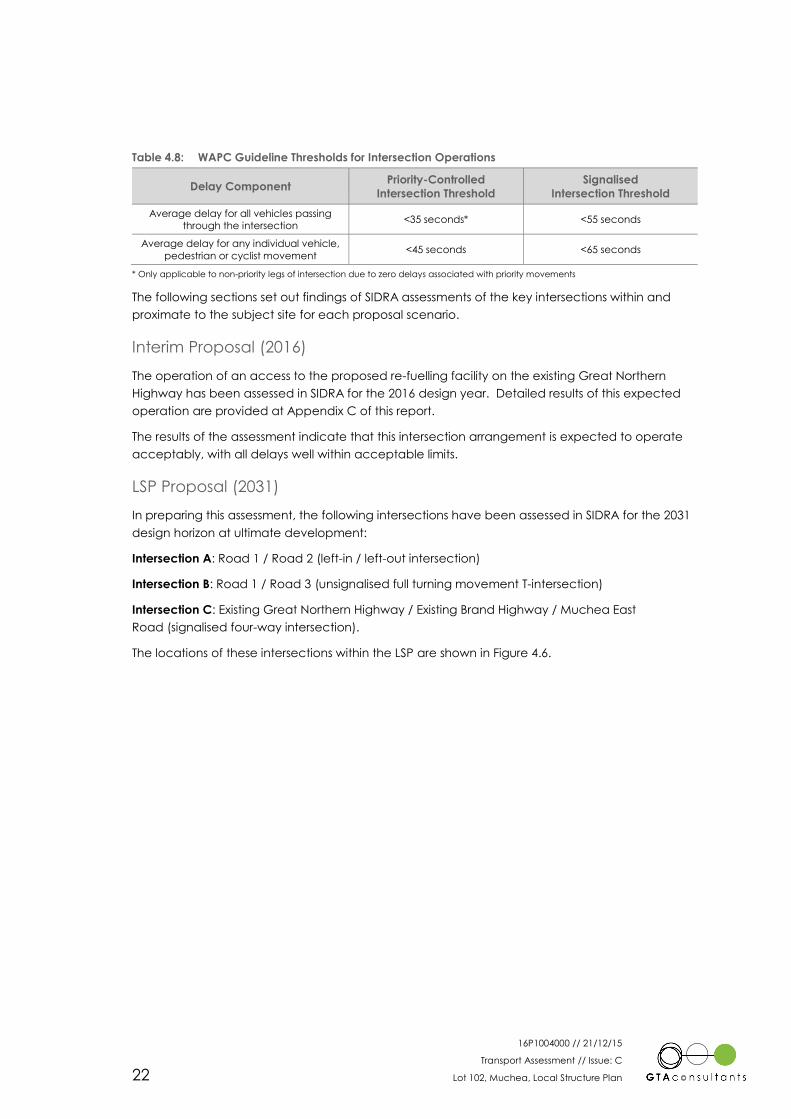
16P1004000 // 21/12/15
Transport Assessment // Issue: C
Lot 102, Muchea, Local Structure Plan 22
Table 4.8: WAPC Guideline Thresholds for Intersection Operations
Delay Component Priority-Controlled
Intersection Threshold
Signalised
Intersection Threshold
Average delay for all vehicles passing
through the intersection <35 seconds* <55 seconds
Average delay for any individual vehicle,
pedestrian or cyclist movement <45 seconds <65 seconds
* Only applicable to non-priority legs of intersection due to zero delays associated with priority movements
The following sections set out findings of SIDRA assessments of the key intersections within and
proximate to the subject site for each proposal scenario.
Interim Proposal (2016)
The operation of an access to the proposed re-fuelling facility on the existing Great Northern
Highway has been assessed in SIDRA for the 2016 design year. Detailed results of this expected
operation are provided at Appendix C of this report.
The results of the assessment indicate that this intersection arrangement is expected to operate
acceptably, with all delays well within acceptable limits.
LSP Proposal (2031)
In preparing this assessment, the following intersections have been assessed in SIDRA for the 2031
design horizon at ultimate development:
Intersection A: Road 1 / Road 2 (left-in / left-out intersection)
Intersection B: Road 1 / Road 3 (unsignalised full turning movement T-intersection)
Intersection C: Existing Great Northern Highway / Existing Brand Highway / Muchea East
Road (signalised four-way intersection).
The locations of these intersections within the LSP are shown in Figure 4.6.
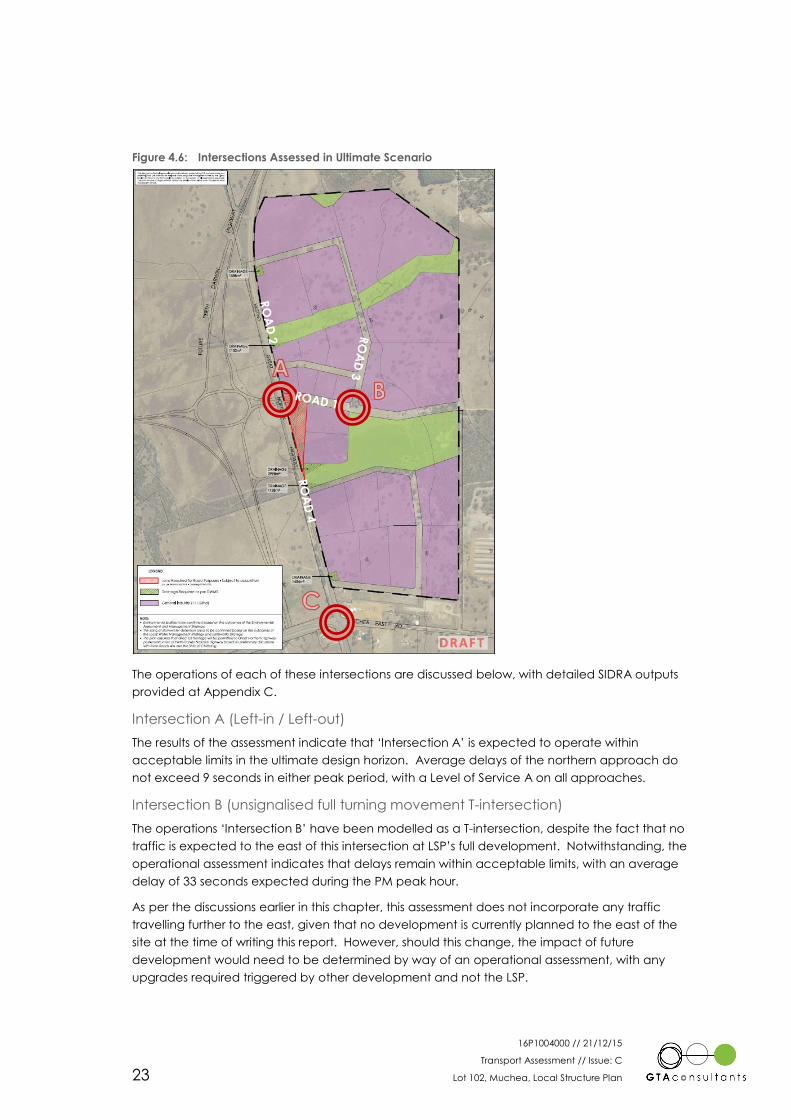
16P1004000 // 21/12/15
Transport Assessment // Issue: C
Lot 102, Muchea, Local Structure Plan 23
Figure 4.6: Intersections Assessed in Ultimate Scenario
The operations of each of these intersections are discussed below, with detailed SIDRA outputs
provided at Appendix C.
Intersection A (Left-in / Left-out)
The results of the assessment indicate that ‘Intersection A’ is expected to operate within
acceptable limits in the ultimate design horizon. Average delays of the northern approach do
not exceed 9 seconds in either peak period, with a Level of Service A on all approaches.
Intersection B (unsignalised full turning movement T-intersection)
The operations ‘Intersection B’ have been modelled as a T-intersection, despite the fact that no
traffic is expected to the east of this intersection at LSP’s full development. Notwithstanding, the
operational assessment indicates that delays remain within acceptable limits, with an average
delay of 33 seconds expected during the PM peak hour.
As per the discussions earlier in this chapter, this assessment does not incorporate any traffic
travelling further to the east, given that no development is currently planned to the east of the
site at the time of writing this report. However, should this change, the impact of future
development would need to be determined by way of an operational assessment, with any
upgrades required triggered by other development and not the LSP.
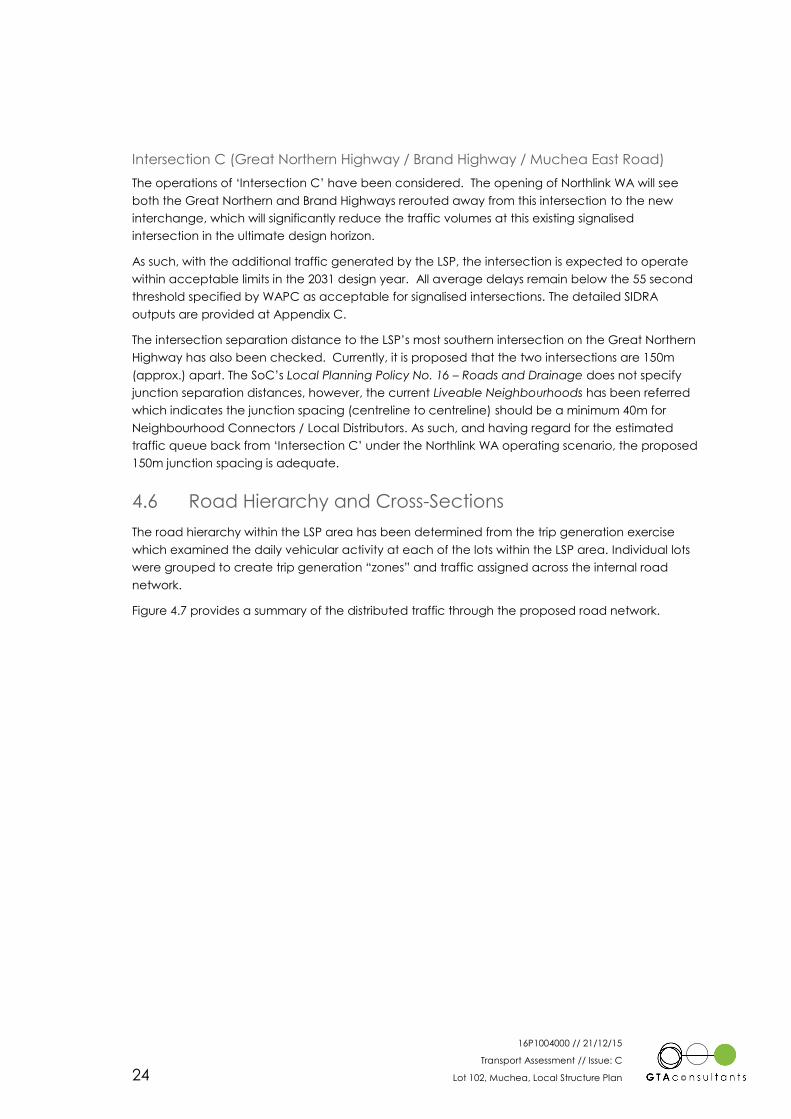
16P1004000 // 21/12/15
Transport Assessment // Issue: C
Lot 102, Muchea, Local Structure Plan 24
Intersection C (Great Northern Highway / Brand Highway / Muchea East Road)
The operations of ‘Intersection C’ have been considered. The opening of Northlink WA will see
both the Great Northern and Brand Highways rerouted away from this intersection to the new
interchange, which will significantly reduce the traffic volumes at this existing signalised
intersection in the ultimate design horizon.
As such, with the additional traffic generated by the LSP, the intersection is expected to operate
within acceptable limits in the 2031 design year. All average delays remain below the 55 second
threshold specified by WAPC as acceptable for signalised intersections. The detailed SIDRA
outputs are provided at Appendix C.
The intersection separation distance to the LSP’s most southern intersection on the Great Northern
Highway has also been checked. Currently, it is proposed that the two intersections are 150m
(approx.) apart. The SoC’s Local Planning Policy No. 16 – Roads and Drainage does not specify
junction separation distances, however, the current Liveable Neighbourhoods has been referred
which indicates the junction spacing (centreline to centreline) should be a minimum 40m for
Neighbourhood Connectors / Local Distributors. As such, and having regard for the estimated
traffic queue back from ‘Intersection C’ under the Northlink WA operating scenario, the proposed
150m junction spacing is adequate.
4.6 Road Hierarchy and Cross-Sections
The road hierarchy within the LSP area has been determined from the trip generation exercise
which examined the daily vehicular activity at each of the lots within the LSP area. Individual lots
were grouped to create trip generation “zones” and traffic assigned across the internal road
network.
Figure 4.7 provides a summary of the distributed traffic through the proposed road network.
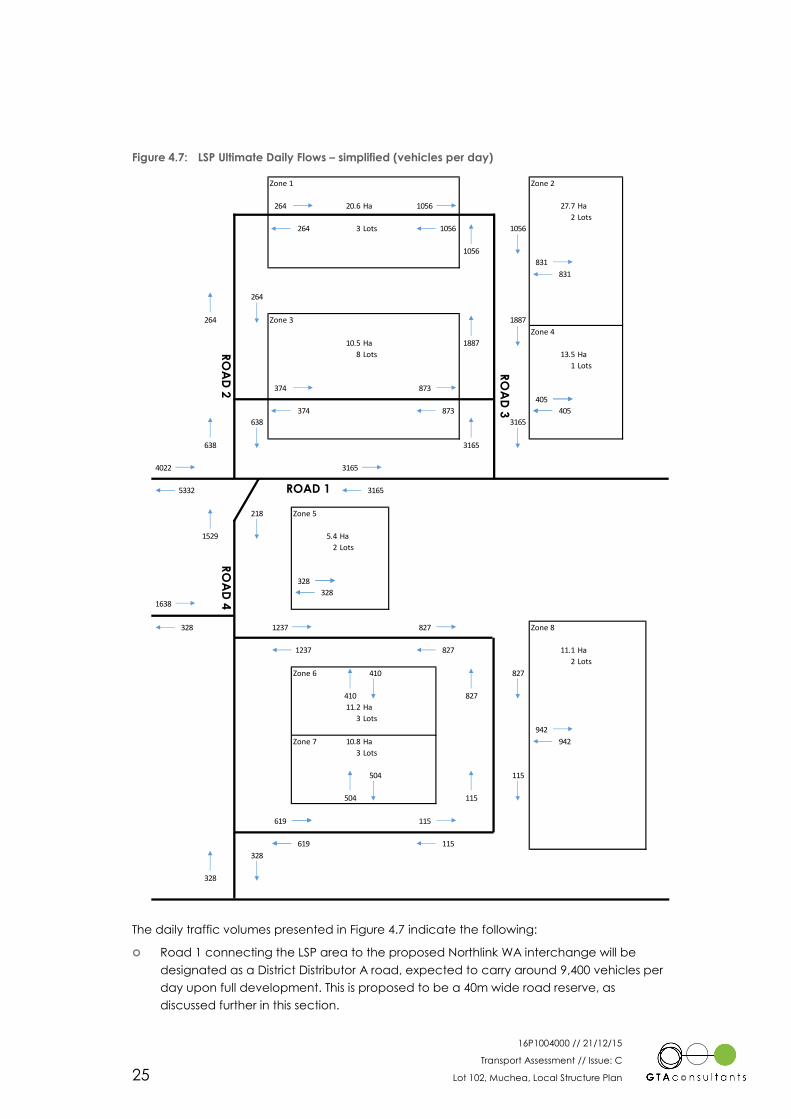
16P1004000 // 21/12/15
Transport Assessment // Issue: C
Lot 102, Muchea, Local Structure Plan 25
Figure 4.7: LSP Ultimate Daily Flows – simplified (vehicles per day)
The daily traffic volumes presented in Figure 4.7 indicate the following:
Road 1 connecting the LSP area to the proposed Northlink WA interchange will be
designated as a District Distributor A road, expected to carry around 9,400 vehicles per
day upon full development. This is proposed to be a 40m wide road reserve, as
discussed further in this section.
Zone 1 Zone 2
264 20.6 Ha 1056 27.7 Ha
2 Lots
264 3 Lots 1056 1056 50 Employees
139 Employees
1056
831
831
264
264 Zone 3 1887
Zone 4
10.5 Ha 1887
8 Lots 13.5 Ha
131 Employees 1 Lots
25 Employees
374 873
405
374 873 405
638 3165
638 3165
4022 3165
5332 3165
218 Zone 5
1529 5.4 Ha
2 Lots
12 Employees
328
328
1638
328 1237 827 Zone 8
1237 827 11.1 Ha
2 Lots
Zone 6 410 827 114 Employees
410 827
11.2 Ha
3 Lots
62 Employees 942
Zone 7 10.8 Ha 942
3 Lots
67 Employees
504 115
504 115
619 115
619 115
328
328
RO
AD
2
RO
AD
4
RO
AD
3
ROAD 1
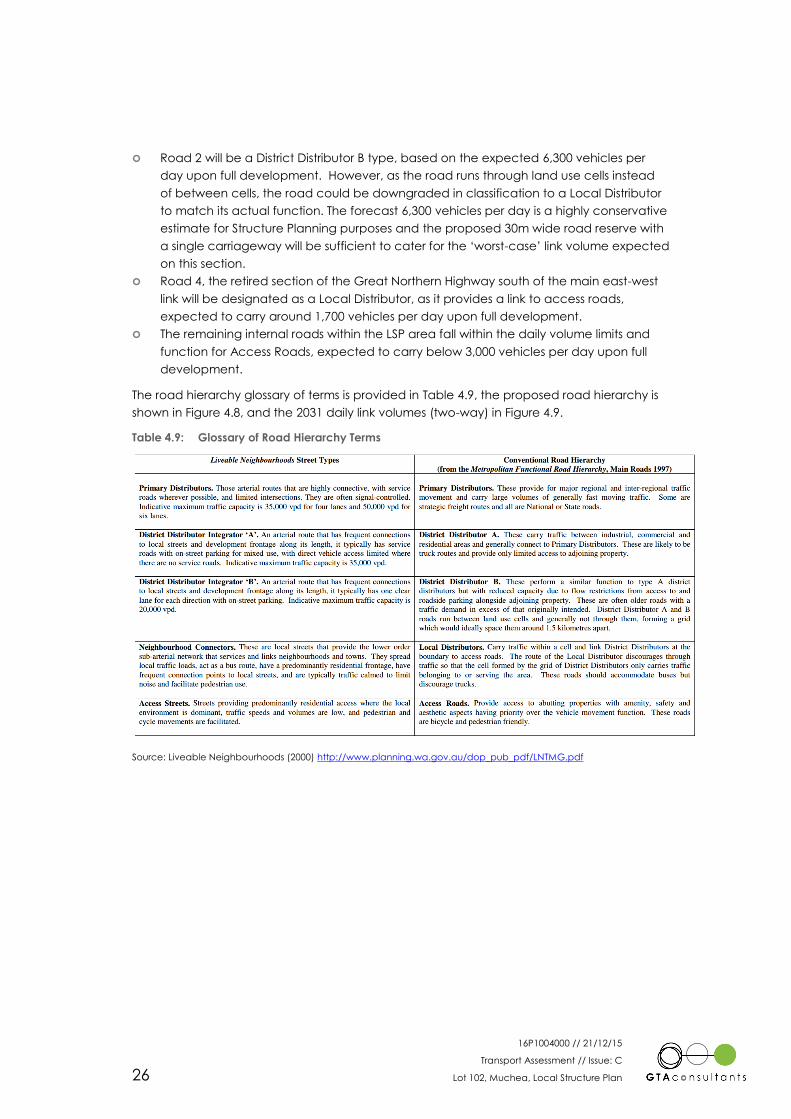
16P1004000 // 21/12/15
Transport Assessment // Issue: C
Lot 102, Muchea, Local Structure Plan 26
Road 2 will be a District Distributor B type, based on the expected 6,300 vehicles per
day upon full development. However, as the road runs through land use cells instead
of between cells, the road could be downgraded in classification to a Local Distributor
to match its actual function. The forecast 6,300 vehicles per day is a highly conservative
estimate for Structure Planning purposes and the proposed 30m wide road reserve with
a single carriageway will be sufficient to cater for the ‘worst-case’ link volume expected
on this section.
Road 4, the retired section of the Great Northern Highway south of the main east-west
link will be designated as a Local Distributor, as it provides a link to access roads,
expected to carry around 1,700 vehicles per day upon full development.
The remaining internal roads within the LSP area fall within the daily volume limits and
function for Access Roads, expected to carry below 3,000 vehicles per day upon full
development.
The road hierarchy glossary of terms is provided in Table 4.9, the proposed road hierarchy is
shown in Figure 4.8, and the 2031 daily link volumes (two-way) in Figure 4.9.
Table 4.9: Glossary of Road Hierarchy Terms
Source: Liveable Neighbourhoods (2000) http://www.planning.wa.gov.au/dop_pub_pdf/LNTMG.pdf
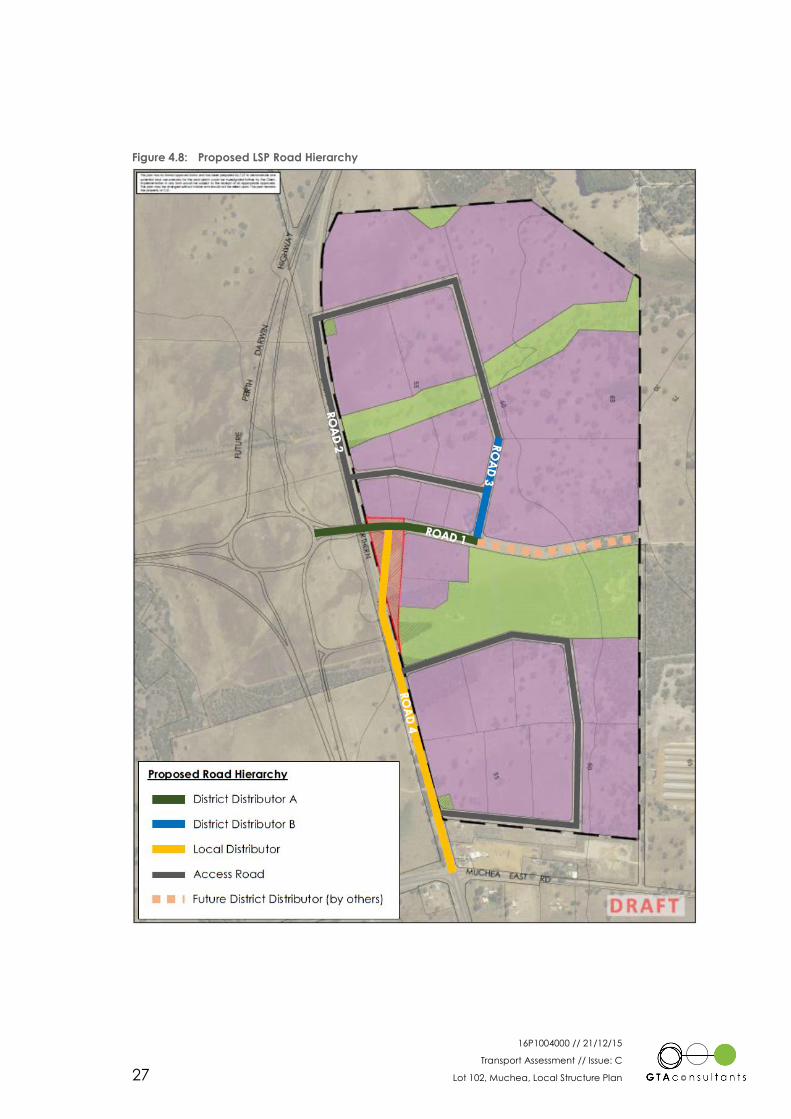
16P1004000 // 21/12/15
Transport Assessment // Issue: C
Lot 102, Muchea, Local Structure Plan 27
Figure 4.8: Proposed LSP Road Hierarchy
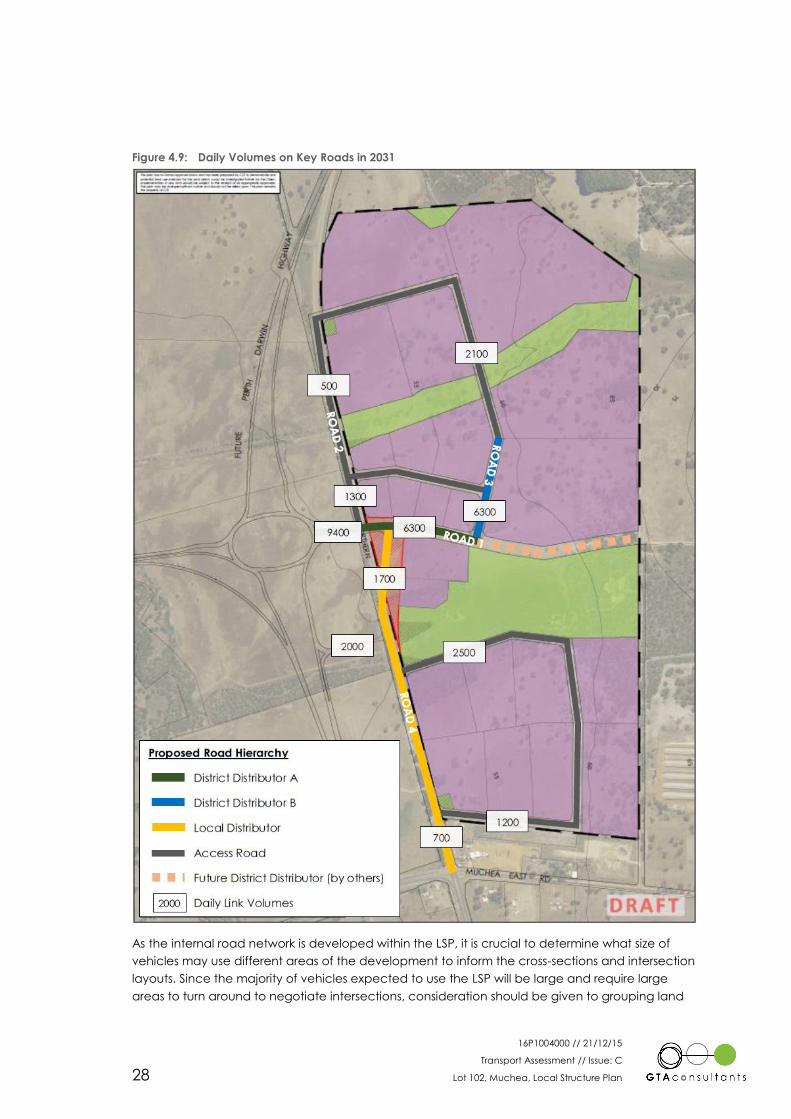
16P1004000 // 21/12/15
Transport Assessment // Issue: C
Lot 102, Muchea, Local Structure Plan 28
Figure 4.9: Daily Volumes on Key Roads in 2031
As the internal road network is developed within the LSP, it is crucial to determine what size of
vehicles may use different areas of the development to inform the cross-sections and intersection
layouts. Since the majority of vehicles expected to use the LSP will be large and require large
areas to turn around to negotiate intersections, consideration should be given to grouping land
16P1004000 // 21/12/15
Transport Assessment // Issue: C
Lot 102, Muchea, Local Structure Plan 29
uses by vehicles sizes which would allow the larger intersections to be applied only in specific
areas of the LSP.
In order to determine the appropriate road reserves for each of the roads within the LSP area,
reference has also been made to the Muchea Employment Node Structure Plan, which
correlates the main east-west road within the LSP as the ‘loop road’. This is proposed to be a 40m
wide road reserve, designed with provision for future use as a High Wide Load route and/or
dualling.
The proposed LSP road reserve widths have also been cross-checked with the SoC’s Local
Planning Policy No. 16 – Roads and Drainage. This policy provides the following guidance with
respect to road reserve widths for urban areas:
Important Through Roads: 40m road reserve width
Other Roads: 20m road reserve width.
Applying these requirements to the proposed LSP road network layout, it is considered that Road
4 and Road 1 would constitute ‘important through roads’ as per SoC’s definition, given the
distribution role they provide to the LSP area and beyond. These roads would therefore require a
minimum reserve width of 40m.
The existing Great Northern Highway is set within a road reserve of 40m or greater, and as such
meets the minimum requirement.
The Great Northern Highway is also a key Over Size Over Mass (OSOM) load route. In this respect,
the design of the RTAA and access to it will need to allow access by these vehicles. OSOM routes
typically apply a 10m x 10m clearance envelope to allow passage of these vehicles, and this will
need to be considered when designing the internal roads.
The indicative cross-section for a 40m road reserve has been prepared as shown in Figure 4.10.
This cross-section proposes a single carriageway road initially, with a 10m wide pavement and a
combined 9.5m wide bench, swale and verge. This reserve width gives provision for future
duallling when the traffic volumes warrant it in the longer term.
The remaining roads proposed within the LSP would be classed as ‘other roads’ and therefore
require a minimum reserve width of 20m as per SoC’s requirements. A width of 30m has been
proposed for the ‘other roads’ to accommodate necessary swales and verge widths as shown in
Figure 4.11.
On the above basis, the proposed road reserves are expected to be suitable to service the LSP
and accord with the Muchea Employment Node Structure Plan and the SoC’s design
requirements.
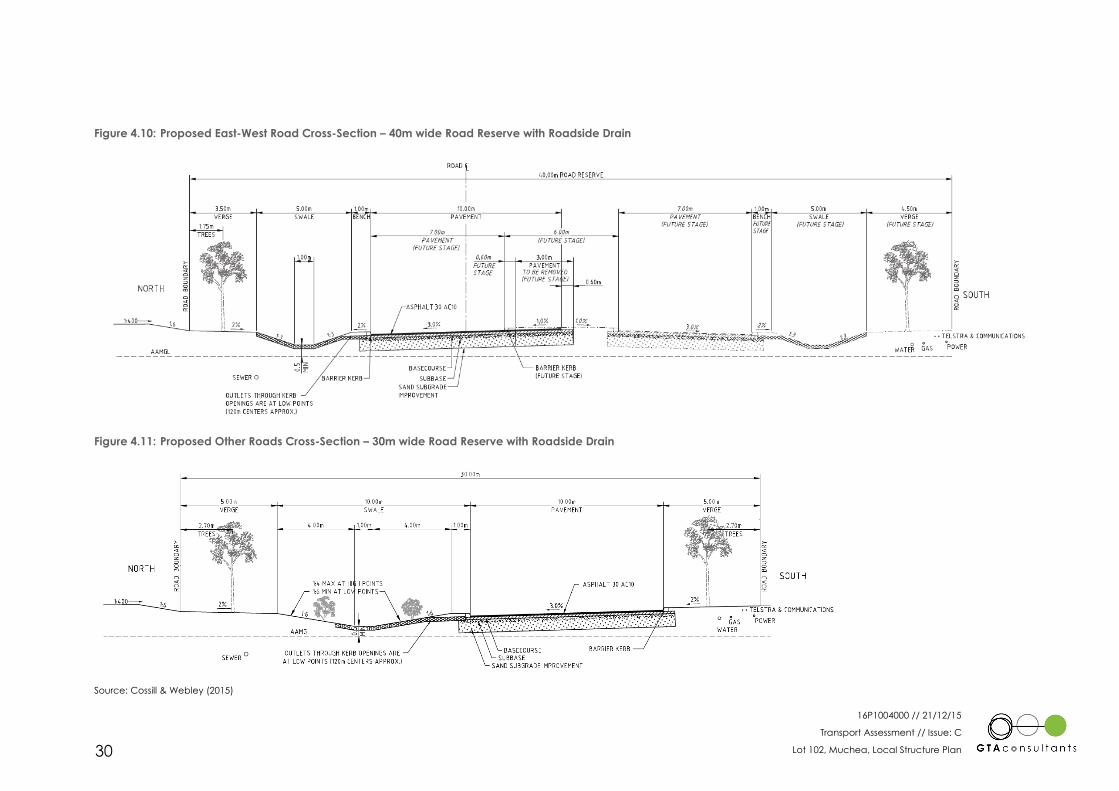
16P1004000 // 21/12/15
Transport Assessment // Issue: C
Lot 102, Muchea, Local Structure Plan 30
Figure 4.10: Proposed East-West Road Cross-Section – 40m wide Road Reserve with Roadside Drain
Figure 4.11: Proposed Other Roads Cross-Section – 30m wide Road Reserve with Roadside Drain
Source: Cossill & Webley (2015)
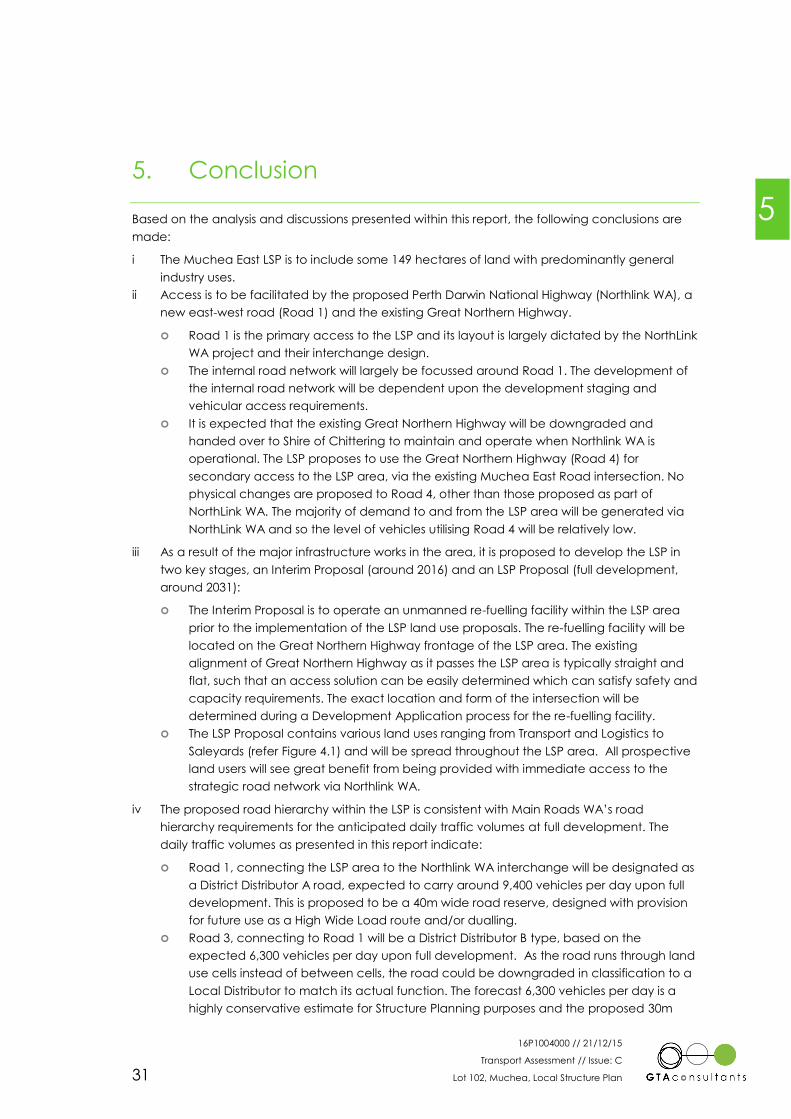
16P1004000 // 21/12/15
Transport Assessment // Issue: C
Lot 102, Muchea, Local Structure Plan 31
5. Conclusion
Based on the analysis and discussions presented within this report, the following conclusions are
made:
i The Muchea East LSP is to include some 149 hectares of land with predominantly general
industry uses.
ii Access is to be facilitated by the proposed Perth Darwin National Highway (Northlink WA), a
new east-west road (Road 1) and the existing Great Northern Highway.
Road 1 is the primary access to the LSP and its layout is largely dictated by the NorthLink
WA project and their interchange design.
The internal road network will largely be focussed around Road 1. The development of
the internal road network will be dependent upon the development staging and
vehicular access requirements.
It is expected that the existing Great Northern Highway will be downgraded and
handed over to Shire of Chittering to maintain and operate when Northlink WA is
operational. The LSP proposes to use the Great Northern Highway (Road 4) for
secondary access to the LSP area, via the existing Muchea East Road intersection. No
physical changes are proposed to Road 4, other than those proposed as part of
NorthLink WA. The majority of demand to and from the LSP area will be generated via
NorthLink WA and so the level of vehicles utilising Road 4 will be relatively low.
iii As a result of the major infrastructure works in the area, it is proposed to develop the LSP in
two key stages, an Interim Proposal (around 2016) and an LSP Proposal (full development,
around 2031):
The Interim Proposal is to operate an unmanned re-fuelling facility within the LSP area
prior to the implementation of the LSP land use proposals. The re-fuelling facility will be
located on the Great Northern Highway frontage of the LSP area. The existing
alignment of Great Northern Highway as it passes the LSP area is typically straight and
flat, such that an access solution can be easily determined which can satisfy safety and
capacity requirements. The exact location and form of the intersection will be
determined during a Development Application process for the re-fuelling facility.
The LSP Proposal contains various land uses ranging from Transport and Logistics to
Saleyards (refer Figure 4.1) and will be spread throughout the LSP area. All prospective
land users will see great benefit from being provided with immediate access to the
strategic road network via Northlink WA.
iv The proposed road hierarchy within the LSP is consistent with Main Roads WA’s road
hierarchy requirements for the anticipated daily traffic volumes at full development. The
daily traffic volumes as presented in this report indicate:
Road 1, connecting the LSP area to the Northlink WA interchange will be designated as
a District Distributor A road, expected to carry around 9,400 vehicles per day upon full
development. This is proposed to be a 40m wide road reserve, designed with provision
for future use as a High Wide Load route and/or dualling.
Road 3, connecting to Road 1 will be a District Distributor B type, based on the
expected 6,300 vehicles per day upon full development. As the road runs through land
use cells instead of between cells, the road could be downgraded in classification to a
Local Distributor to match its actual function. The forecast 6,300 vehicles per day is a
highly conservative estimate for Structure Planning purposes and the proposed 30m
5
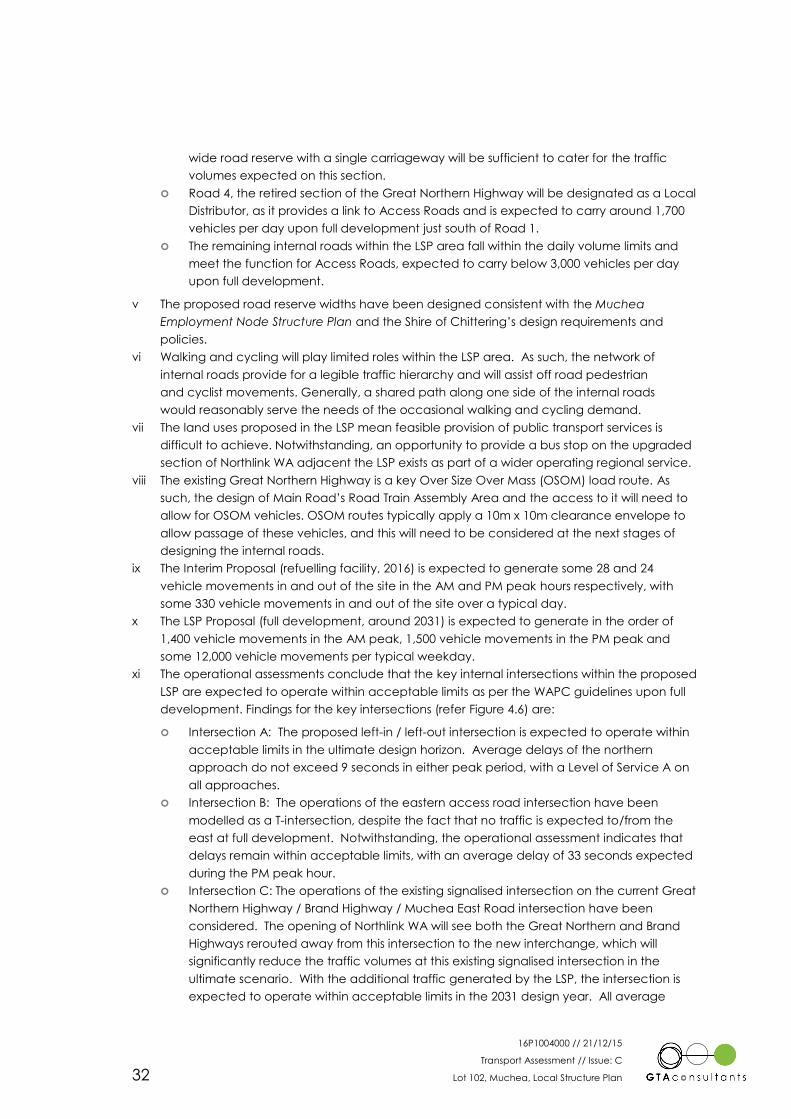
16P1004000 // 21/12/15
Transport Assessment // Issue: C
Lot 102, Muchea, Local Structure Plan 32
wide road reserve with a single carriageway will be sufficient to cater for the traffic
volumes expected on this section.
Road 4, the retired section of the Great Northern Highway will be designated as a Local
Distributor, as it provides a link to Access Roads and is expected to carry around 1,700
vehicles per day upon full development just south of Road 1.
The remaining internal roads within the LSP area fall within the daily volume limits and
meet the function for Access Roads, expected to carry below 3,000 vehicles per day
upon full development.
v The proposed road reserve widths have been designed consistent with the Muchea
Employment Node Structure Plan and the Shire of Chittering’s design requirements and
policies.
vi Walking and cycling will play limited roles within the LSP area. As such, the network of
internal roads provide for a legible traffic hierarchy and will assist off road pedestrian
and cyclist movements. Generally, a shared path along one side of the internal roads
would reasonably serve the needs of the occasional walking and cycling demand.
vii The land uses proposed in the LSP mean feasible provision of public transport services is
difficult to achieve. Notwithstanding, an opportunity to provide a bus stop on the upgraded
section of Northlink WA adjacent the LSP exists as part of a wider operating regional service.
viii The existing Great Northern Highway is a key Over Size Over Mass (OSOM) load route. As
such, the design of Main Road’s Road Train Assembly Area and the access to it will need to
allow for OSOM vehicles. OSOM routes typically apply a 10m x 10m clearance envelope to
allow passage of these vehicles, and this will need to be considered at the next stages of
designing the internal roads.
ix The Interim Proposal (refuelling facility, 2016) is expected to generate some 28 and 24
vehicle movements in and out of the site in the AM and PM peak hours respectively, with
some 330 vehicle movements in and out of the site over a typical day.
x The LSP Proposal (full development, around 2031) is expected to generate in the order of
1,400 vehicle movements in the AM peak, 1,500 vehicle movements in the PM peak and
some 12,000 vehicle movements per typical weekday.
xi The operational assessments conclude that the key internal intersections within the proposed
LSP are expected to operate within acceptable limits as per the WAPC guidelines upon full
development. Findings for the key intersections (refer Figure 4.6) are:
Intersection A: The proposed left-in / left-out intersection is expected to operate within
acceptable limits in the ultimate design horizon. Average delays of the northern
approach do not exceed 9 seconds in either peak period, with a Level of Service A on
all approaches.
Intersection B: The operations of the eastern access road intersection have been
modelled as a T-intersection, despite the fact that no traffic is expected to/from the
east at full development. Notwithstanding, the operational assessment indicates that
delays remain within acceptable limits, with an average delay of 33 seconds expected
during the PM peak hour.
Intersection C: The operations of the existing signalised intersection on the current Great
Northern Highway / Brand Highway / Muchea East Road intersection have been
considered. The opening of Northlink WA will see both the Great Northern and Brand
Highways rerouted away from this intersection to the new interchange, which will
significantly reduce the traffic volumes at this existing signalised intersection in the
ultimate scenario. With the additional traffic generated by the LSP, the intersection is
expected to operate within acceptable limits in the 2031 design year. All average
16P1004000 // 21/12/15
Transport Assessment // Issue: C
Lot 102, Muchea, Local Structure Plan 33
delays remain below the 55 second threshold specified by WAPC as acceptable for
signalised intersections.
The separation distance of ‘Intersection C’ to the LSP’s most southern proposed
intersection on the Great Northern Highway has also been checked. Currently, it is
proposed the two intersections are 150m (approx.) apart. Based on the downgraded
future function of the Great Northern Highway and having regard for the estimated
traffic queue back under the Northlink WA operating scenario, the proposed 150m
junction spacing is expected to be adequate.
16P1004000 // 21/12/15
Transport Assessment // Issue: C
Lot 102, Muchea, Local Structure Plan
Appendix A
Proposed Local Structure Plan
Ap
pe
nd
ix A
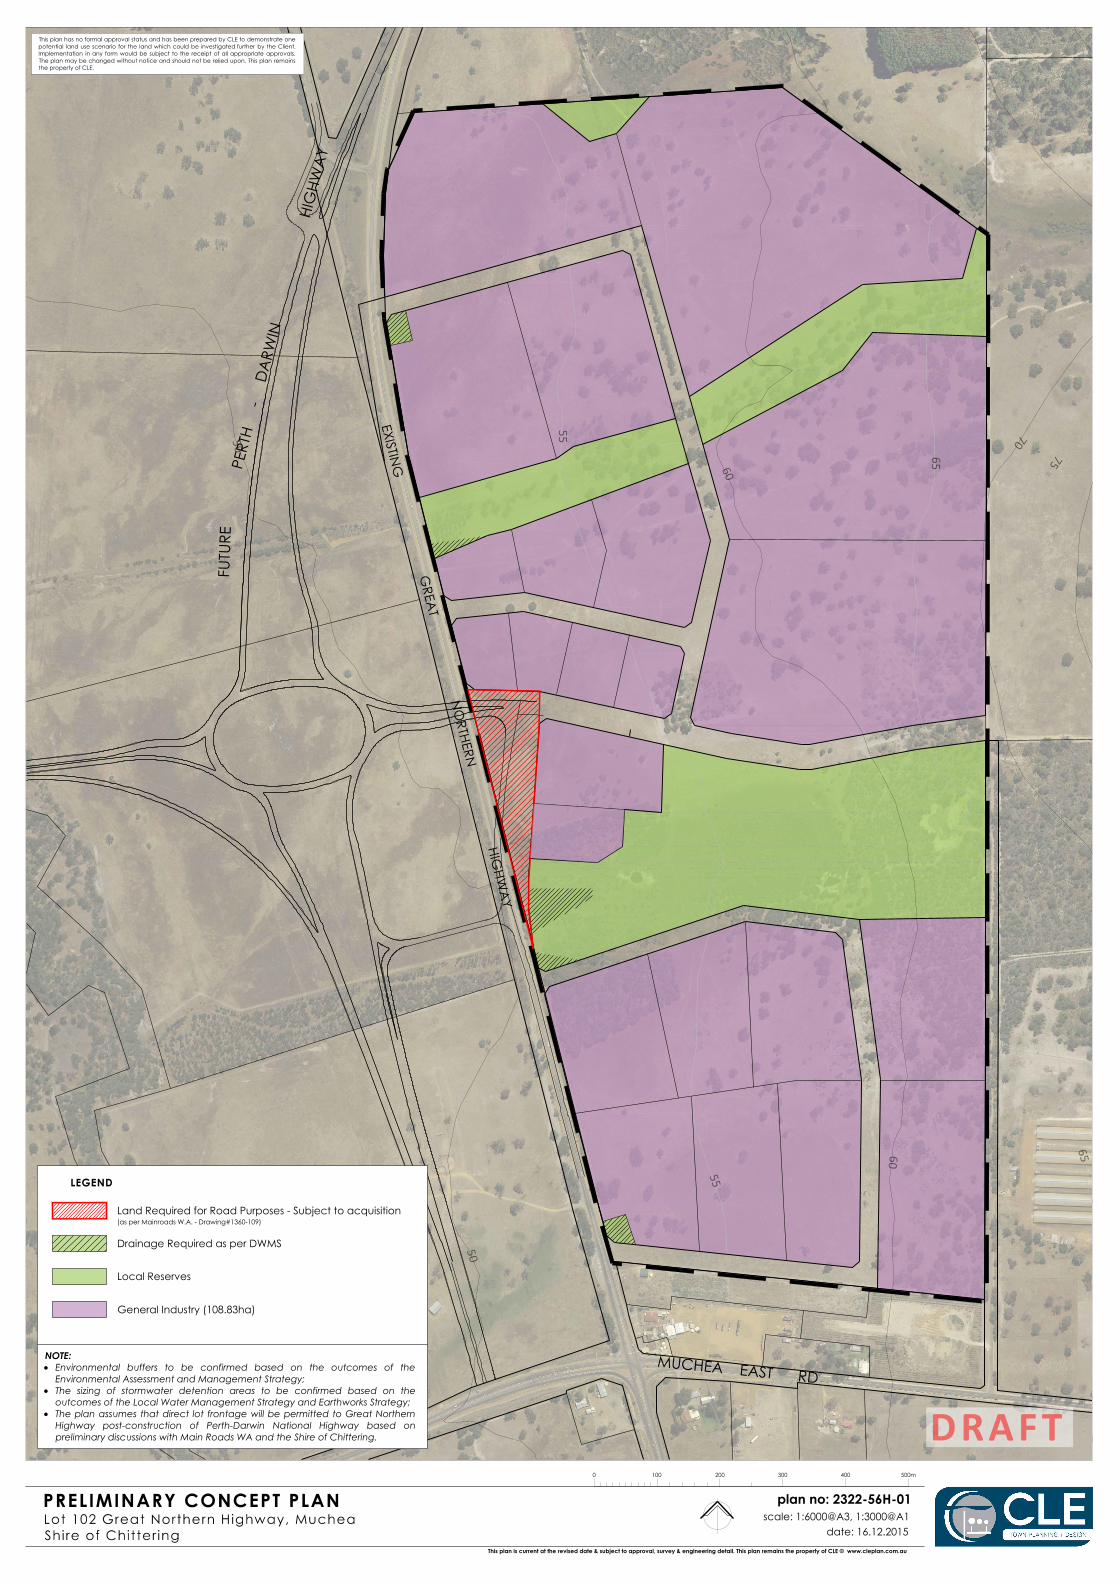
50
55
60
65
70
75 80
50
55
60
65
EXISTING
GREA
T NO
RTHERN HIG
HWA
Y
MUCHEA EAST RD
PERT
H
-
DA
RWIN
HIG
HWA
Y
FUTU
RE
plan no: 2322-56H-01scale: 1:6000@A3, 1:3000@A1
date: 16.12.2015This plan is current at the revised date & subject to approval, survey & engineering detail. This plan remains the property of CLE © www.cleplan.com.au
0 100 200 300 400 500m
Land Required for Road Purposes - Subject to acquisition(as per Mainroads W.A. - Drawing#1360-109)
Drainage Required as per DWMS
General Industry (108.83ha)
NOTE: Environmental buffers to be confirmed based on the outcomes of the
Environmental Assessment and Management Strategy; The sizing of stormwater detention areas to be confirmed based on the
outcomes of the Local Water Management Strategy and Earthworks Strategy; The plan assumes that direct lot frontage will be permitted to Great Northern
Highway post-construction of Perth-Darwin National Highway based onpreliminary discussions with Main Roads WA and the Shire of Chittering.
This plan has no formal approval status and has been prepared by CLE to demonstrate onepotential land use scenario for the land which could be investigated further by the Client.Implementation in any form would be subject to the receipt of all appropriate approvals.The plan may be changed without notice and should not be relied upon. This plan remainsthe property of CLE.
Local Reserves
16P1004000 // 21/12/15
Transport Assessment // Issue: C
Lot 102, Muchea, Local Structure Plan
Appendix B
Scoping Correspondence with Authorities
Ap
pe
nd
ix B
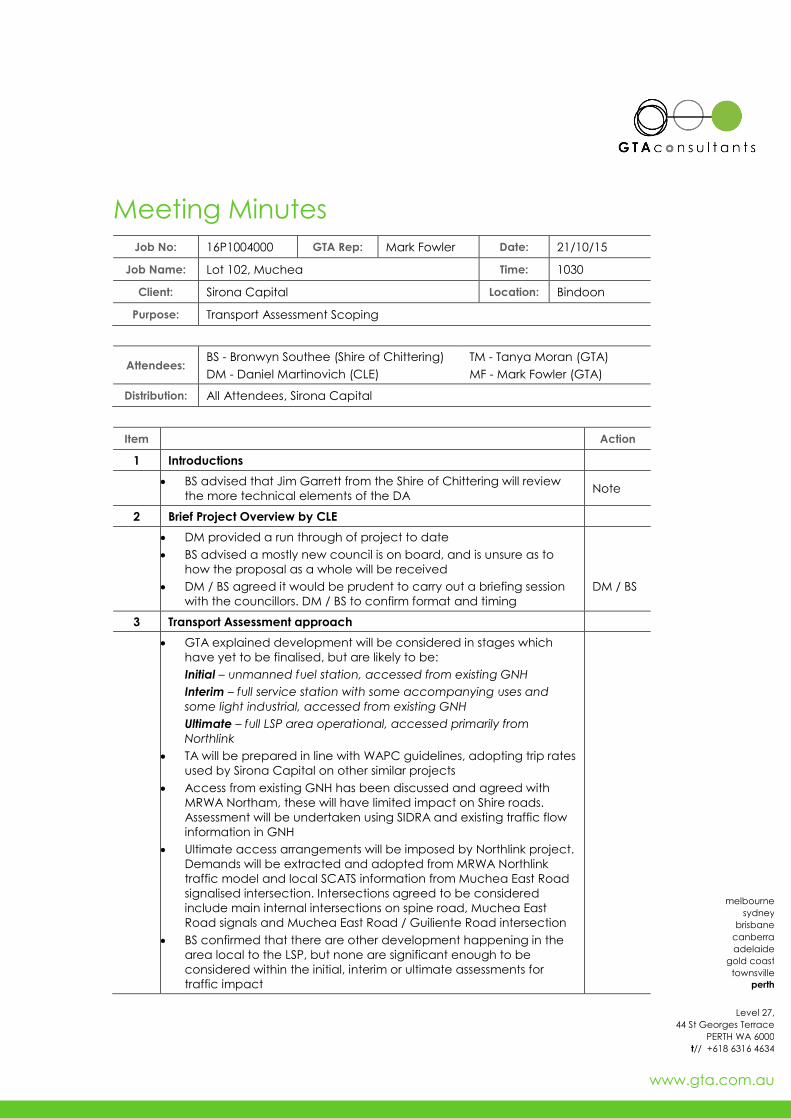
melbourne
sydney
brisbane
canberra
adelaide
gold coast
townsville
perth
Level 27,
44 St Georges Terrace
PERTH WA 6000
t// +618 6316 4634
www.gta.com.au
Meeting Minutes
Job No: 16P1004000 GTA Rep: Mark Fowler Date: 21/10/15
Job Name: Lot 102, Muchea Time: 1030
Client: Sirona Capital Location: Bindoon
Purpose: Transport Assessment Scoping
Attendees: BS - Bronwyn Southee (Shire of Chittering)
DM - Daniel Martinovich (CLE)
TM - Tanya Moran (GTA)
MF - Mark Fowler (GTA)
Distribution: All Attendees, Sirona Capital
Item Action
1 Introductions
BS advised that Jim Garrett from the Shire of Chittering will review
the more technical elements of the DA Note
2 Brief Project Overview by CLE
DM provided a run through of project to date
BS advised a mostly new council is on board, and is unsure as to
how the proposal as a whole will be received
DM / BS agreed it would be prudent to carry out a briefing session
with the councillors. DM / BS to confirm format and timing
DM / BS
3 Transport Assessment approach
GTA explained development will be considered in stages which
have yet to be finalised, but are likely to be:
Initial – unmanned fuel station, accessed from existing GNH
Interim – full service station with some accompanying uses and
some light industrial, accessed from existing GNH
Ultimate – full LSP area operational, accessed primarily from
Northlink
TA will be prepared in line with WAPC guidelines, adopting trip rates
used by Sirona Capital on other similar projects
Access from existing GNH has been discussed and agreed with
MRWA Northam, these will have limited impact on Shire roads.
Assessment will be undertaken using SIDRA and existing traffic flow
information in GNH
Ultimate access arrangements will be imposed by Northlink project.
Demands will be extracted and adopted from MRWA Northlink
traffic model and local SCATS information from Muchea East Road
signalised intersection. Intersections agreed to be considered
include main internal intersections on spine road, Muchea East
Road signals and Muchea East Road / Guiliente Road intersection
BS confirmed that there are other development happening in the
area local to the LSP, but none are significant enough to be
considered within the initial, interim or ultimate assessments for
traffic impact
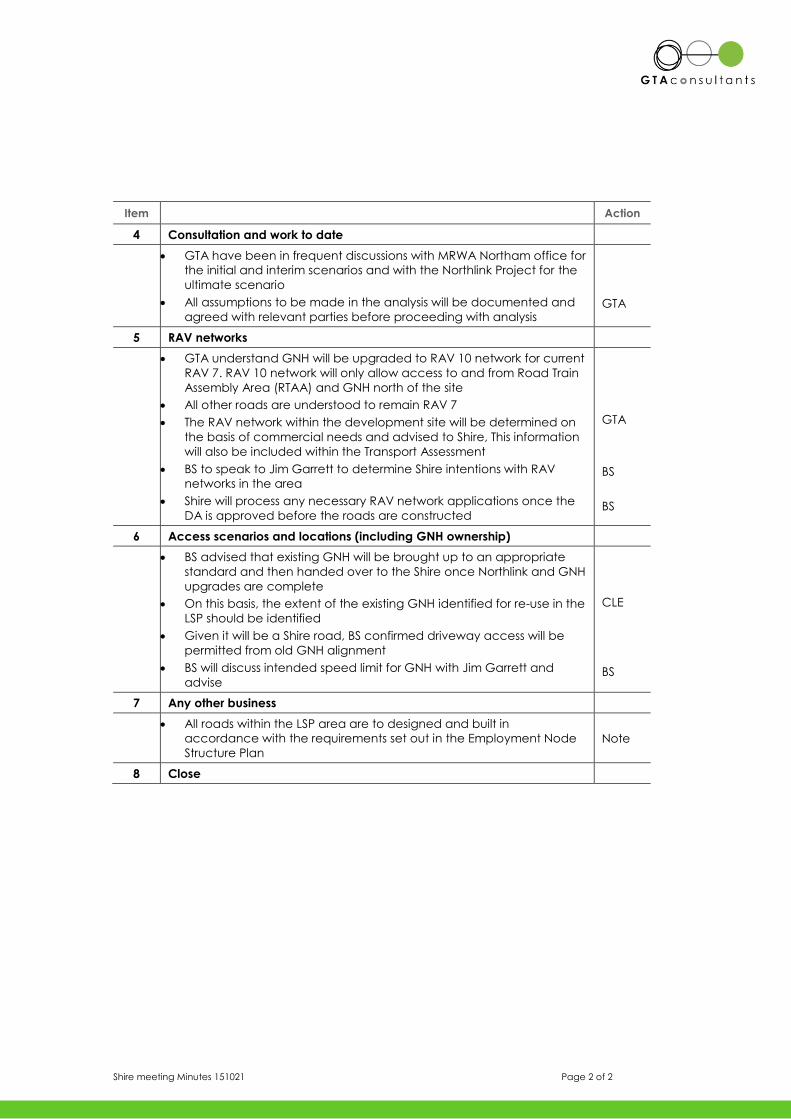
Shire meeting Minutes 151021 Page 2 of 2
Item Action
4 Consultation and work to date
GTA have been in frequent discussions with MRWA Northam office for
the initial and interim scenarios and with the Northlink Project for the
ultimate scenario
All assumptions to be made in the analysis will be documented and
agreed with relevant parties before proceeding with analysis
GTA
5 RAV networks
GTA understand GNH will be upgraded to RAV 10 network for current
RAV 7. RAV 10 network will only allow access to and from Road Train
Assembly Area (RTAA) and GNH north of the site
All other roads are understood to remain RAV 7
The RAV network within the development site will be determined on
the basis of commercial needs and advised to Shire, This information
will also be included within the Transport Assessment
BS to speak to Jim Garrett to determine Shire intentions with RAV
networks in the area
Shire will process any necessary RAV network applications once the
DA is approved before the roads are constructed
GTA
BS
BS
6 Access scenarios and locations (including GNH ownership)
BS advised that existing GNH will be brought up to an appropriate
standard and then handed over to the Shire once Northlink and GNH
upgrades are complete
On this basis, the extent of the existing GNH identified for re-use in the
LSP should be identified
Given it will be a Shire road, BS confirmed driveway access will be
permitted from old GNH alignment
BS will discuss intended speed limit for GNH with Jim Garrett and
advise
CLE
BS
7 Any other business
All roads within the LSP area are to designed and built in
accordance with the requirements set out in the Employment Node
Structure Plan
Note
8 Close
melbourne
sydney
brisbane
canberra
adelaide
gold coast
townsville
perth
Level 27,
44 St Georges Terrace
PERTH WA 6000
t// +618 6316 4634
www.gta.com.au
MEMORANDUM
GTA Consultants (GTA) has prepared this Memorandum to set out the technical parameters
of the Transport Assessment for the LSP that have been discussed with MRWA and Shire of
Chittering.
As previously communicated, the development will likely be staged as follows:
• Initial – unmanned fuel station, accessed from existing GNH
• Interim – full service station with some accompanying uses and some light industrial,
accessed from existing GNH
• Ultimate – full Structure Plan area operational, accessed primarily from Northlink.
The assumptions are set out in Attachment 1, and are proposed to be adopted within the
Transport Assessment for the LSP where appropriate.
It is respectfully requested that MRWA and Shire of Chittering confirm their respective
acceptance of the assumptions herein by Wednesday 28th October 2015. This will enable the
commencement of the Transport Assessment for the LSP reporting, and ensure project
timelines are adhered to.
In light of this, if there are any items you would like to discuss in more detail, or require more
clarity please contact me directly.
Yours sincerely
GTA CONSULTANTS
Mark Fowler
Senior Consultant
TO: Main Roads Western Australia(MRWA) / Shire of Chittering
CC: Sirona Capital / CLE
FROM: GTA Consultants
DATE: 23/10/2015
OUR REF: 16P1004000
PAGE 1 OF 2
RE: Lot 102, Muchea – Traffic and Transport Assumptions for Local Structure Plan (LSP)
Lucas.Stewart
Rectangle
Lucas.Stewart
Typewritten Text
N/A as of 11/12/15
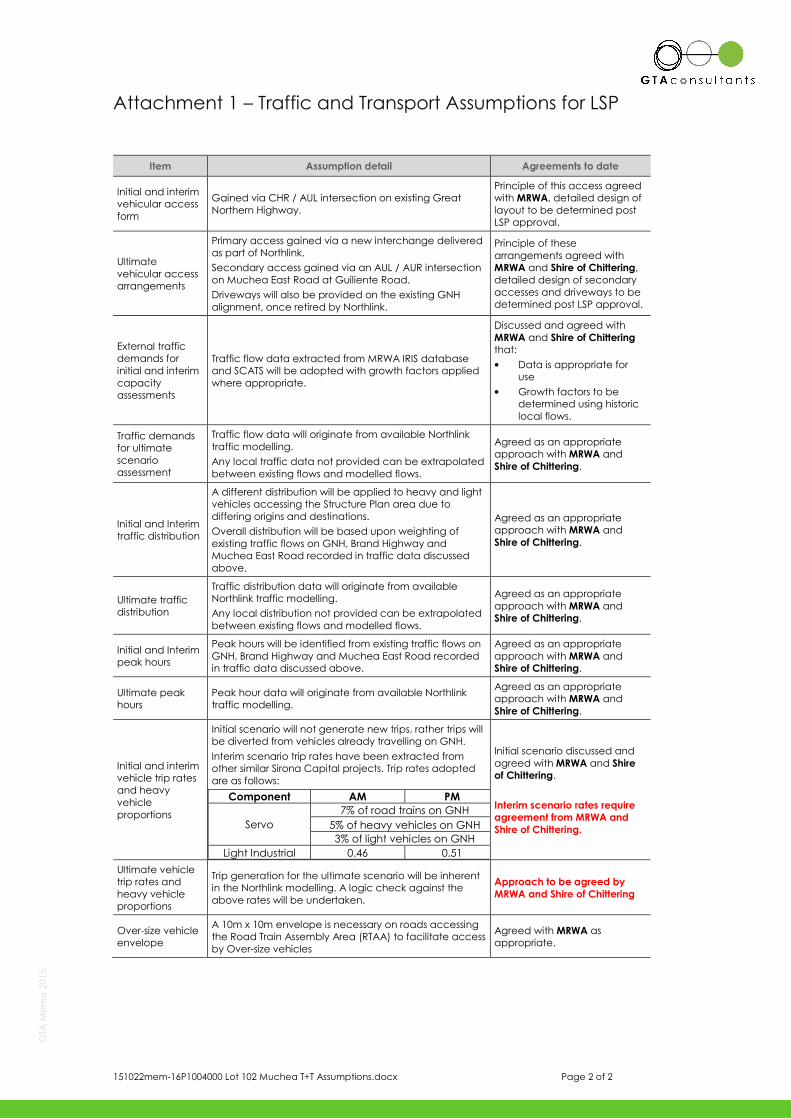
Attachment 1 – Traffic and Transport Assumptions for LSP
151022mem-16P1004000 Lot 102 Muchea T+T Assumptions.docx Page 2 of 2
Item Assumption detail Agreements to date
Initial and interim
vehicular access
form
Gained via CHR / AUL intersection on existing Great
Northern Highway.
Principle of this access agreed
with MRWA, detailed design of
layout to be determined post
LSP approval.
Ultimate
vehicular access
arrangements
Primary access gained via a new interchange delivered
as part of Northlink.
Secondary access gained via an AUL / AUR intersection
on Muchea East Road at Guiliente Road.
Driveways will also be provided on the existing GNH
alignment, once retired by Northlink.
Principle of these
arrangements agreed with
MRWA and Shire of Chittering,
detailed design of secondary
accesses and driveways to be
determined post LSP approval.
External traffic
demands for
initial and interim
capacity
assessments
Traffic flow data extracted from MRWA IRIS database
and SCATS will be adopted with growth factors applied
where appropriate.
Discussed and agreed with
MRWA and Shire of Chittering
that:
• Data is appropriate for
use
• Growth factors to be
determined using historic
local flows.
Traffic demands
for ultimate
scenario
assessment
Traffic flow data will originate from available Northlink
traffic modelling.
Any local traffic data not provided can be extrapolated
between existing flows and modelled flows.
Agreed as an appropriate
approach with MRWA and
Shire of Chittering.
Initial and Interim
traffic distribution
A different distribution will be applied to heavy and light
vehicles accessing the Structure Plan area due to
differing origins and destinations.
Overall distribution will be based upon weighting of
existing traffic flows on GNH, Brand Highway and
Muchea East Road recorded in traffic data discussed
above.
Agreed as an appropriate
approach with MRWA and
Shire of Chittering.
Ultimate traffic
distribution
Traffic distribution data will originate from available
Northlink traffic modelling.
Any local distribution not provided can be extrapolated
between existing flows and modelled flows.
Agreed as an appropriate
approach with MRWA and
Shire of Chittering.
Initial and Interim
peak hours
Peak hours will be identified from existing traffic flows on
GNH, Brand Highway and Muchea East Road recorded
in traffic data discussed above.
Agreed as an appropriate
approach with MRWA and
Shire of Chittering.
Ultimate peak
hours
Peak hour data will originate from available Northlink
traffic modelling.
Agreed as an appropriate
approach with MRWA and
Shire of Chittering.
Initial and interim
vehicle trip rates
and heavy
vehicle
proportions
Initial scenario will not generate new trips, rather trips will
be diverted from vehicles already travelling on GNH.
Interim scenario trip rates have been extracted from
other similar Sirona Capital projects. Trip rates adopted
are as follows:
Component AM PM
Servo
7% of road trains on GNH
5% of heavy vehicles on GNH
3% of light vehicles on GNH
Light Industrial 0.46 0.51
Initial scenario discussed and
agreed with MRWA and Shire
of Chittering.
Interim scenario rates require
agreement from MRWA and
Shire of Chittering.
Ultimate vehicle
trip rates and
heavy vehicle
proportions
Trip generation for the ultimate scenario will be inherent
in the Northlink modelling. A logic check against the
above rates will be undertaken.
Approach to be agreed by
MRWA and Shire of Chittering
Over-size vehicle
envelope
A 10m x 10m envelope is necessary on roads accessing
the Road Train Assembly Area (RTAA) to facilitate access
by Over-size vehicles
Agreed with MRWA as
appropriate.
GTA Memo 2015
Lucas.Stewart
Typewritten Text
N/A
Lucas.Stewart
Typewritten Text
Agreed for GTA to make interpretation of the scale of traffic volumes in 2031. Refer MRWA email attached (4/11/15).
Lucas.Stewart
Rectangle
Lucas.Stewart
Rectangle
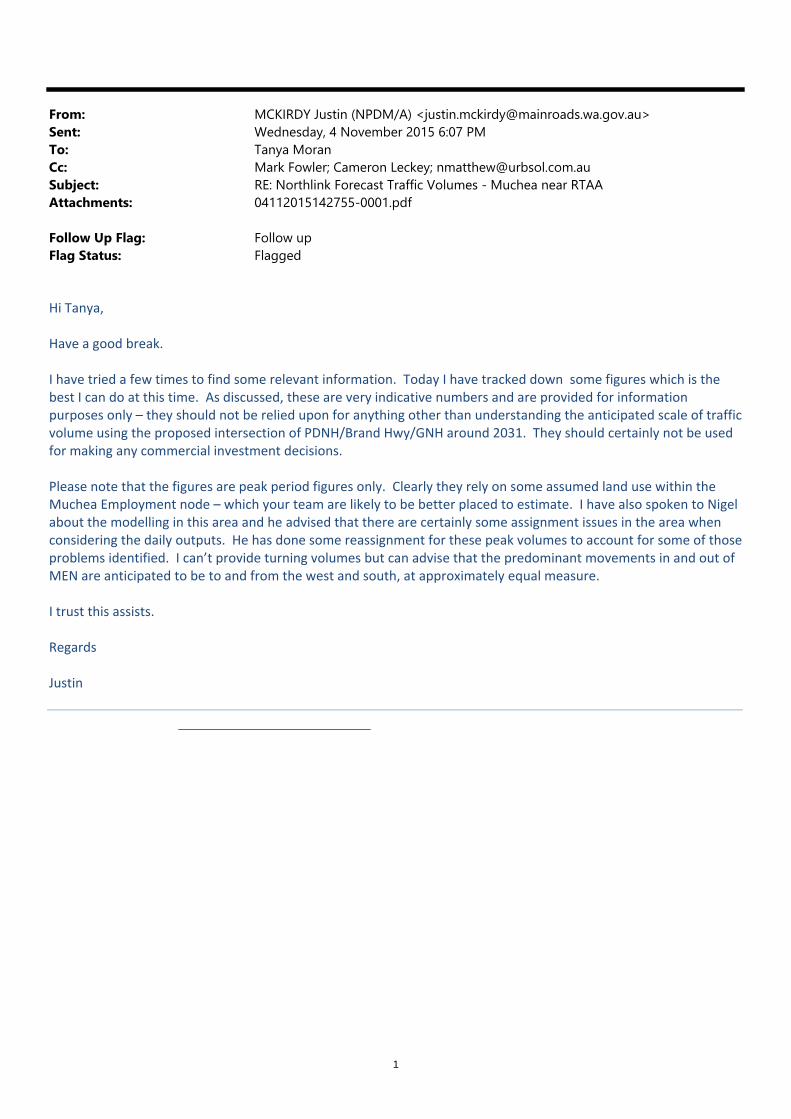
1
From: MCKIRDY Justin (NPDM/A) <[email protected]>Sent: Wednesday, 4 November 2015 6:07 PMTo: Tanya MoranCc: Mark Fowler; Cameron Leckey; [email protected]: RE: Northlink Forecast Traffic Volumes - Muchea near RTAAAttachments: 04112015142755-0001.pdf
Follow Up Flag: Follow upFlag Status: Flagged
Hi Tanya,
Have a good break.
I have tried a few times to find some relevant information. Today I have tracked down some figures which is the best I can do at this time. As discussed, these are very indicative numbers and are provided for information purposes only – they should not be relied upon for anything other than understanding the anticipated scale of traffic volume using the proposed intersection of PDNH/Brand Hwy/GNH around 2031. They should certainly not be used for making any commercial investment decisions.
Please note that the figures are peak period figures only. Clearly they rely on some assumed land use within the Muchea Employment node – which your team are likely to be better placed to estimate. I have also spoken to Nigel about the modelling in this area and he advised that there are certainly some assignment issues in the area when considering the daily outputs. He has done some reassignment for these peak volumes to account for some of those problems identified. I can’t provide turning volumes but can advise that the predominant movements in and out of MEN are anticipated to be to and from the west and south, at approximately equal measure.
I trust this assists.
Regards
Justin
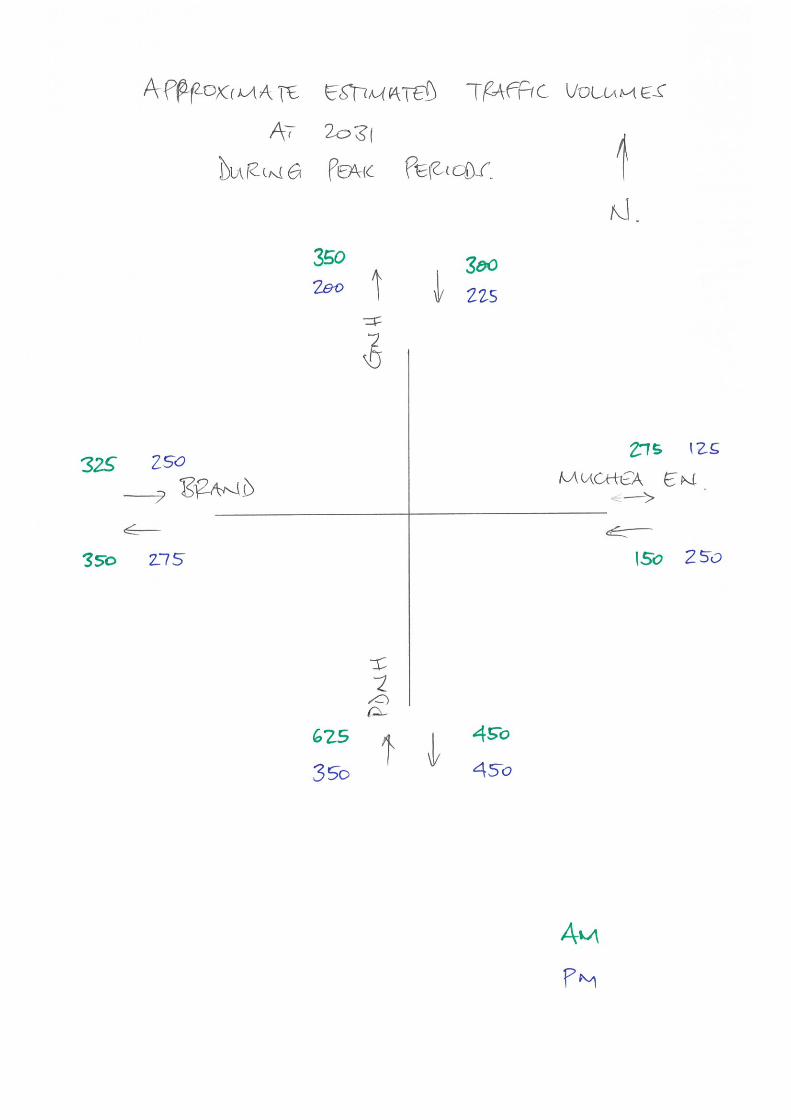
16P1004000 // 21/12/15
Transport Assessment // Issue: C
Lot 102, Muchea, Local Structure Plan
Appendix C
SIDRA Outputs
Ap
pe
nd
ix C
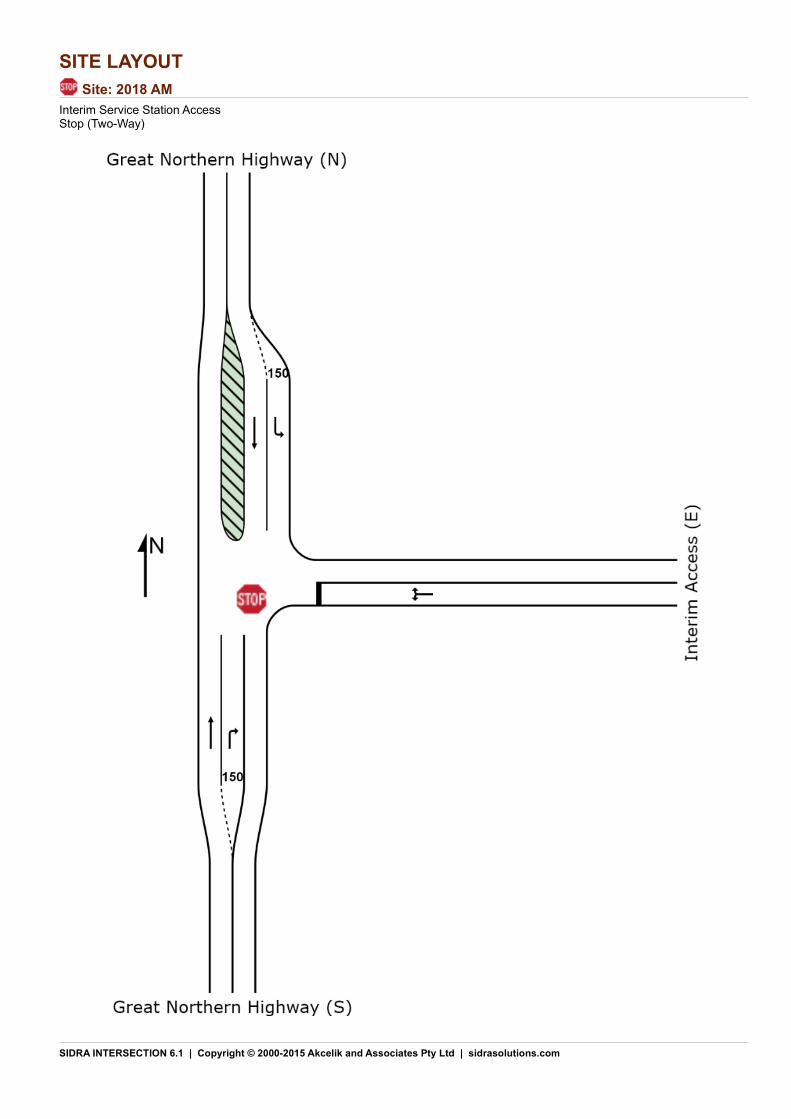
SITE LAYOUT
Site: 2018 AM
Interim Service Station AccessStop (Two-Way)
SIDRA INTERSECTION 6.1 | Copyright © 2000-2015 Akcelik and Associates Pty Ltd | sidrasolutions.com

Organisation: GTA CONSULTANTS | Created: Monday, 14 December 2015 2:23:03 PMProject: P:\16P1000-1099\16P1004000 - Muchea LSP - Industrial\Modelling\151103sid-16P1004000_GNH_Initial.sip6
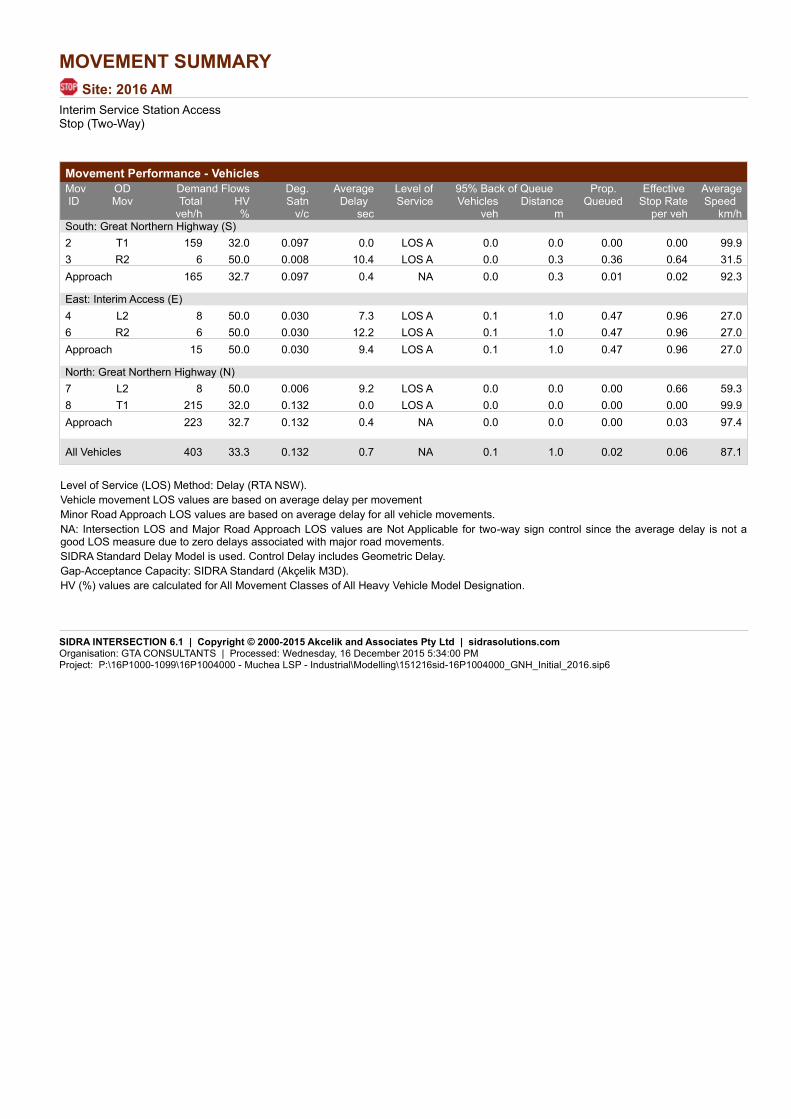
MOVEMENT SUMMARY
Site: 2016 AM
Interim Service Station AccessStop (Two-Way)
Movement Performance - Vehicles
Demand Flows 95% Back of QueueMovID
ODMov
Deg.Satn
AverageDelay
Level ofService
Prop. Queued
Effective Stop Rate
AverageSpeed Total HV Vehicles Distance
veh/h % v/c sec veh m per veh km/hSouth: Great Northern Highway (S)
2 T1 159 32.0 0.097 0.0 LOS A 0.0 0.0 0.00 0.00 99.9
3 R2 6 50.0 0.008 10.4 LOS A 0.0 0.3 0.36 0.64 31.5
Approach 165 32.7 0.097 0.4 NA 0.0 0.3 0.01 0.02 92.3
East: Interim Access (E)
4 L2 8 50.0 0.030 7.3 LOS A 0.1 1.0 0.47 0.96 27.0
6 R2 6 50.0 0.030 12.2 LOS A 0.1 1.0 0.47 0.96 27.0
Approach 15 50.0 0.030 9.4 LOS A 0.1 1.0 0.47 0.96 27.0
North: Great Northern Highway (N)
7 L2 8 50.0 0.006 9.2 LOS A 0.0 0.0 0.00 0.66 59.3
8 T1 215 32.0 0.132 0.0 LOS A 0.0 0.0 0.00 0.00 99.9
Approach 223 32.7 0.132 0.4 NA 0.0 0.0 0.00 0.03 97.4
All Vehicles 403 33.3 0.132 0.7 NA 0.1 1.0 0.02 0.06 87.1
Level of Service (LOS) Method: Delay (RTA NSW).
Vehicle movement LOS values are based on average delay per movement
Minor Road Approach LOS values are based on average delay for all vehicle movements.
NA: Intersection LOS and Major Road Approach LOS values are Not Applicable for two-way sign control since the average delay is not a good LOS measure due to zero delays associated with major road movements.
SIDRA Standard Delay Model is used. Control Delay includes Geometric Delay.
Gap-Acceptance Capacity: SIDRA Standard (Akçelik M3D).
HV (%) values are calculated for All Movement Classes of All Heavy Vehicle Model Designation.
SIDRA INTERSECTION 6.1 | Copyright © 2000-2015 Akcelik and Associates Pty Ltd | sidrasolutions.comOrganisation: GTA CONSULTANTS | Processed: Wednesday, 16 December 2015 5:34:00 PMProject: P:\16P1000-1099\16P1004000 - Muchea LSP - Industrial\Modelling\151216sid-16P1004000_GNH_Initial_2016.sip6
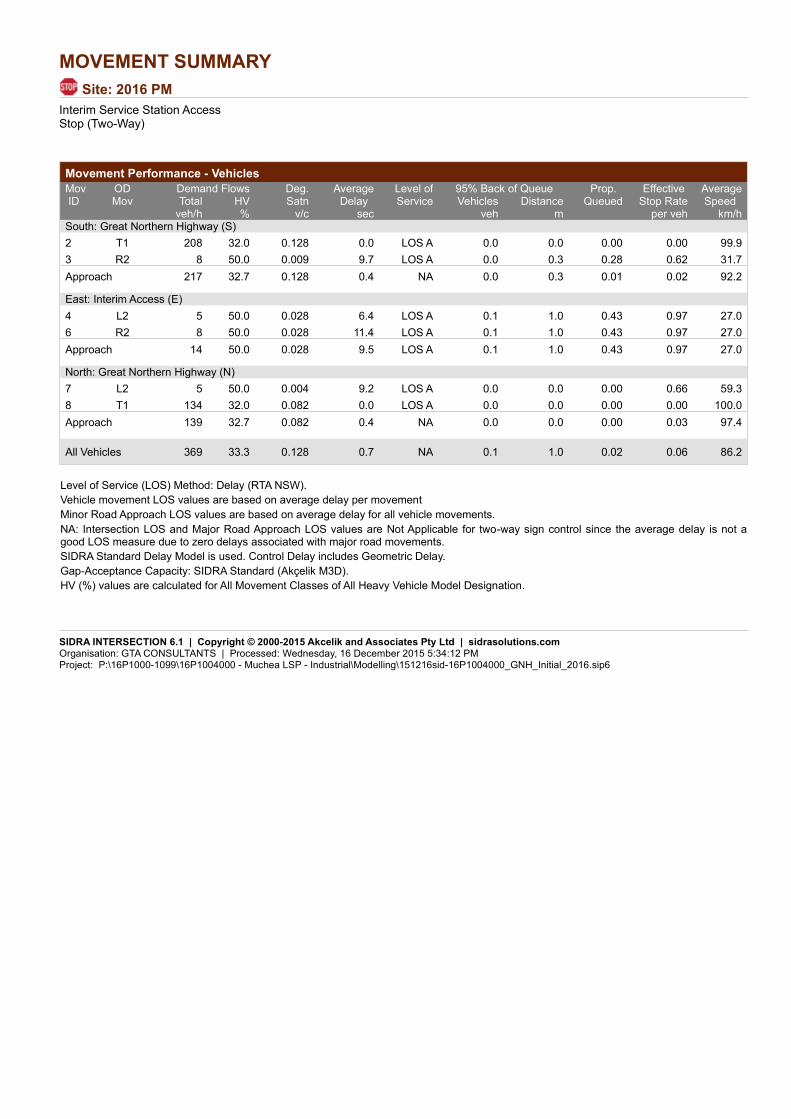
MOVEMENT SUMMARY
Site: 2016 PM
Interim Service Station AccessStop (Two-Way)
Movement Performance - Vehicles
Demand Flows 95% Back of QueueMovID
ODMov
Deg.Satn
AverageDelay
Level ofService
Prop. Queued
Effective Stop Rate
AverageSpeed Total HV Vehicles Distance
veh/h % v/c sec veh m per veh km/hSouth: Great Northern Highway (S)
2 T1 208 32.0 0.128 0.0 LOS A 0.0 0.0 0.00 0.00 99.9
3 R2 8 50.0 0.009 9.7 LOS A 0.0 0.3 0.28 0.62 31.7
Approach 217 32.7 0.128 0.4 NA 0.0 0.3 0.01 0.02 92.2
East: Interim Access (E)
4 L2 5 50.0 0.028 6.4 LOS A 0.1 1.0 0.43 0.97 27.0
6 R2 8 50.0 0.028 11.4 LOS A 0.1 1.0 0.43 0.97 27.0
Approach 14 50.0 0.028 9.5 LOS A 0.1 1.0 0.43 0.97 27.0
North: Great Northern Highway (N)
7 L2 5 50.0 0.004 9.2 LOS A 0.0 0.0 0.00 0.66 59.3
8 T1 134 32.0 0.082 0.0 LOS A 0.0 0.0 0.00 0.00 100.0
Approach 139 32.7 0.082 0.4 NA 0.0 0.0 0.00 0.03 97.4
All Vehicles 369 33.3 0.128 0.7 NA 0.1 1.0 0.02 0.06 86.2
Level of Service (LOS) Method: Delay (RTA NSW).
Vehicle movement LOS values are based on average delay per movement
Minor Road Approach LOS values are based on average delay for all vehicle movements.
NA: Intersection LOS and Major Road Approach LOS values are Not Applicable for two-way sign control since the average delay is not a good LOS measure due to zero delays associated with major road movements.
SIDRA Standard Delay Model is used. Control Delay includes Geometric Delay.
Gap-Acceptance Capacity: SIDRA Standard (Akçelik M3D).
HV (%) values are calculated for All Movement Classes of All Heavy Vehicle Model Designation.
SIDRA INTERSECTION 6.1 | Copyright © 2000-2015 Akcelik and Associates Pty Ltd | sidrasolutions.comOrganisation: GTA CONSULTANTS | Processed: Wednesday, 16 December 2015 5:34:12 PMProject: P:\16P1000-1099\16P1004000 - Muchea LSP - Industrial\Modelling\151216sid-16P1004000_GNH_Initial_2016.sip6
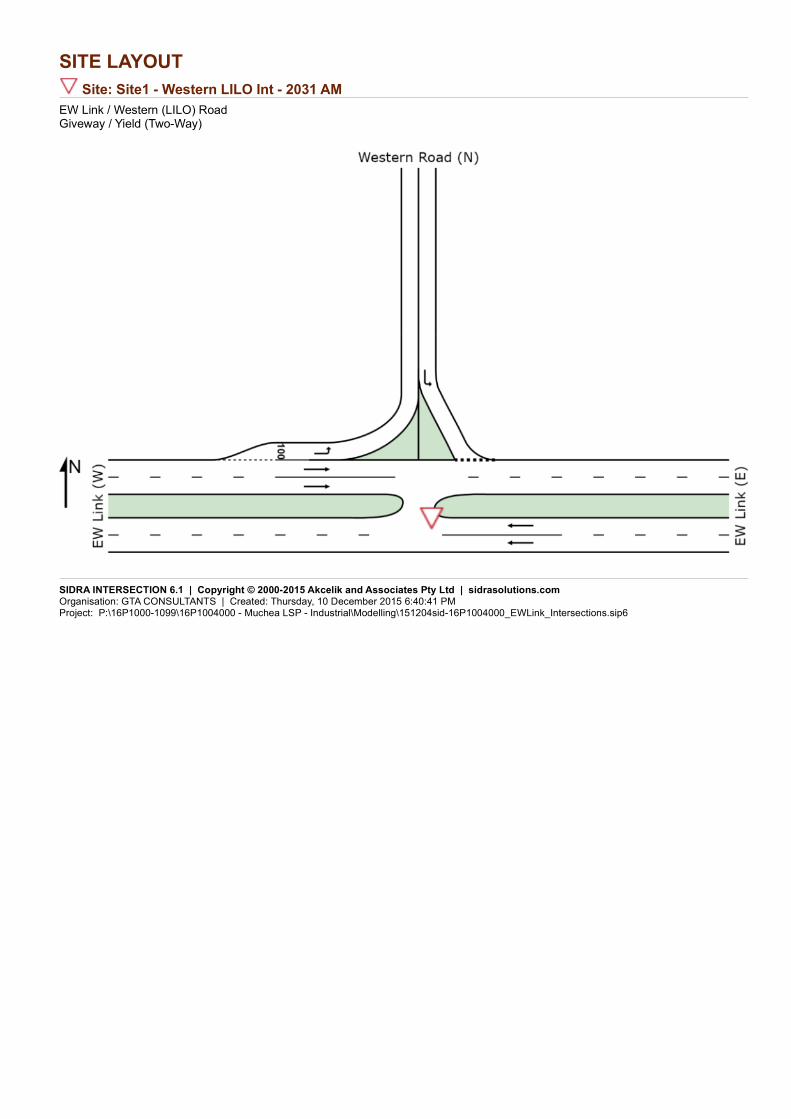
SITE LAYOUT
Site: Site1 - Western LILO Int - 2031 AM
EW Link / Western (LILO) RoadGiveway / Yield (Two-Way)
SIDRA INTERSECTION 6.1 | Copyright © 2000-2015 Akcelik and Associates Pty Ltd | sidrasolutions.comOrganisation: GTA CONSULTANTS | Created: Thursday, 10 December 2015 6:40:41 PMProject: P:\16P1000-1099\16P1004000 - Muchea LSP - Industrial\Modelling\151204sid-16P1004000_EWLink_Intersections.sip6
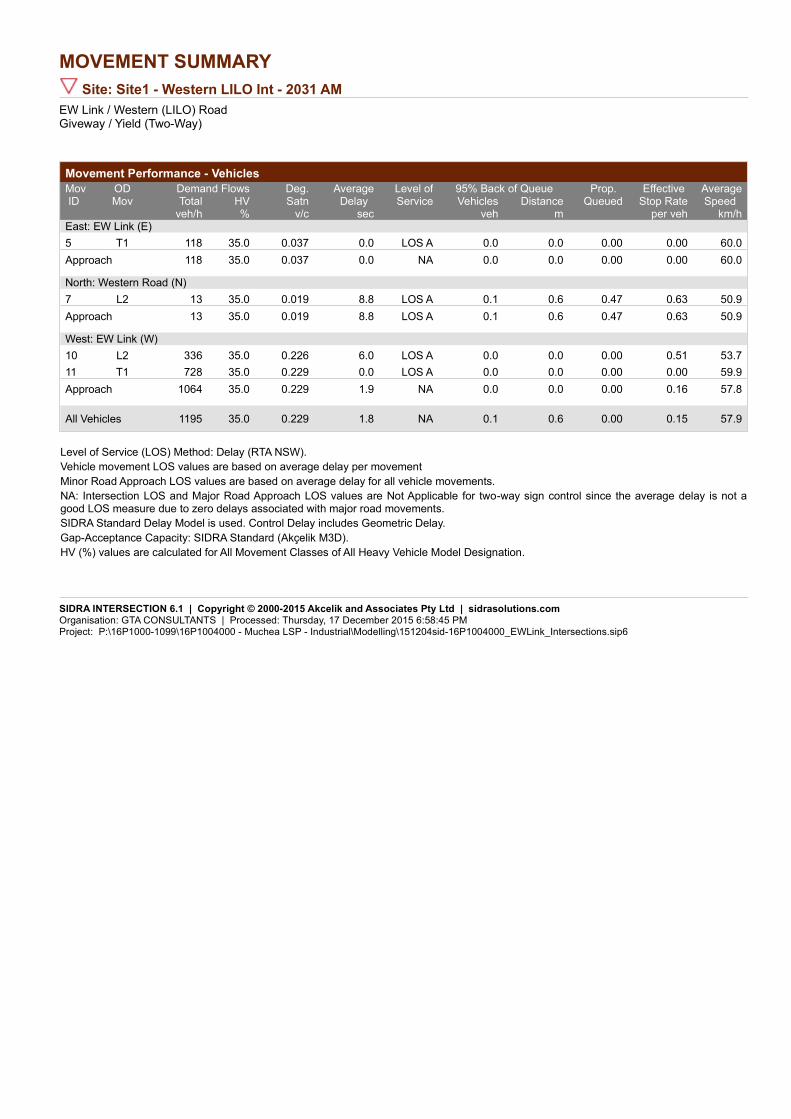
MOVEMENT SUMMARY
Site: Site1 - Western LILO Int - 2031 AM
EW Link / Western (LILO) RoadGiveway / Yield (Two-Way)
Movement Performance - Vehicles
Demand Flows 95% Back of QueueMovID
ODMov
Deg.Satn
AverageDelay
Level ofService
Prop. Queued
Effective Stop Rate
AverageSpeed Total HV Vehicles Distance
veh/h % v/c sec veh m per veh km/hEast: EW Link (E)
5 T1 118 35.0 0.037 0.0 LOS A 0.0 0.0 0.00 0.00 60.0
Approach 118 35.0 0.037 0.0 NA 0.0 0.0 0.00 0.00 60.0
North: Western Road (N)
7 L2 13 35.0 0.019 8.8 LOS A 0.1 0.6 0.47 0.63 50.9
Approach 13 35.0 0.019 8.8 LOS A 0.1 0.6 0.47 0.63 50.9
West: EW Link (W)
10 L2 336 35.0 0.226 6.0 LOS A 0.0 0.0 0.00 0.51 53.7
11 T1 728 35.0 0.229 0.0 LOS A 0.0 0.0 0.00 0.00 59.9
Approach 1064 35.0 0.229 1.9 NA 0.0 0.0 0.00 0.16 57.8
All Vehicles 1195 35.0 0.229 1.8 NA 0.1 0.6 0.00 0.15 57.9
Level of Service (LOS) Method: Delay (RTA NSW).
Vehicle movement LOS values are based on average delay per movement
Minor Road Approach LOS values are based on average delay for all vehicle movements.
NA: Intersection LOS and Major Road Approach LOS values are Not Applicable for two-way sign control since the average delay is not a good LOS measure due to zero delays associated with major road movements.
SIDRA Standard Delay Model is used. Control Delay includes Geometric Delay.
Gap-Acceptance Capacity: SIDRA Standard (Akçelik M3D).
HV (%) values are calculated for All Movement Classes of All Heavy Vehicle Model Designation.
SIDRA INTERSECTION 6.1 | Copyright © 2000-2015 Akcelik and Associates Pty Ltd | sidrasolutions.comOrganisation: GTA CONSULTANTS | Processed: Thursday, 17 December 2015 6:58:45 PMProject: P:\16P1000-1099\16P1004000 - Muchea LSP - Industrial\Modelling\151204sid-16P1004000_EWLink_Intersections.sip6
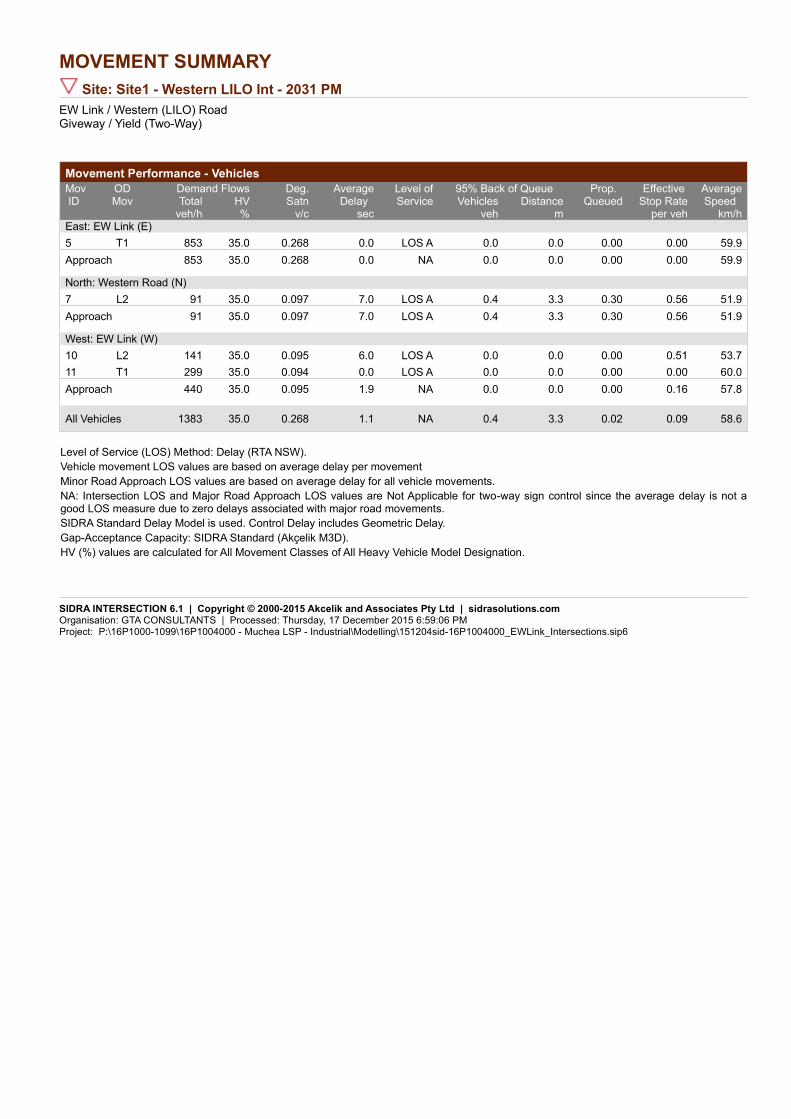
MOVEMENT SUMMARY
Site: Site1 - Western LILO Int - 2031 PM
EW Link / Western (LILO) RoadGiveway / Yield (Two-Way)
Movement Performance - Vehicles
Demand Flows 95% Back of QueueMovID
ODMov
Deg.Satn
AverageDelay
Level ofService
Prop. Queued
Effective Stop Rate
AverageSpeed Total HV Vehicles Distance
veh/h % v/c sec veh m per veh km/hEast: EW Link (E)
5 T1 853 35.0 0.268 0.0 LOS A 0.0 0.0 0.00 0.00 59.9
Approach 853 35.0 0.268 0.0 NA 0.0 0.0 0.00 0.00 59.9
North: Western Road (N)
7 L2 91 35.0 0.097 7.0 LOS A 0.4 3.3 0.30 0.56 51.9
Approach 91 35.0 0.097 7.0 LOS A 0.4 3.3 0.30 0.56 51.9
West: EW Link (W)
10 L2 141 35.0 0.095 6.0 LOS A 0.0 0.0 0.00 0.51 53.7
11 T1 299 35.0 0.094 0.0 LOS A 0.0 0.0 0.00 0.00 60.0
Approach 440 35.0 0.095 1.9 NA 0.0 0.0 0.00 0.16 57.8
All Vehicles 1383 35.0 0.268 1.1 NA 0.4 3.3 0.02 0.09 58.6
Level of Service (LOS) Method: Delay (RTA NSW).
Vehicle movement LOS values are based on average delay per movement
Minor Road Approach LOS values are based on average delay for all vehicle movements.
NA: Intersection LOS and Major Road Approach LOS values are Not Applicable for two-way sign control since the average delay is not a good LOS measure due to zero delays associated with major road movements.
SIDRA Standard Delay Model is used. Control Delay includes Geometric Delay.
Gap-Acceptance Capacity: SIDRA Standard (Akçelik M3D).
HV (%) values are calculated for All Movement Classes of All Heavy Vehicle Model Designation.
SIDRA INTERSECTION 6.1 | Copyright © 2000-2015 Akcelik and Associates Pty Ltd | sidrasolutions.comOrganisation: GTA CONSULTANTS | Processed: Thursday, 17 December 2015 6:59:06 PMProject: P:\16P1000-1099\16P1004000 - Muchea LSP - Industrial\Modelling\151204sid-16P1004000_EWLink_Intersections.sip6
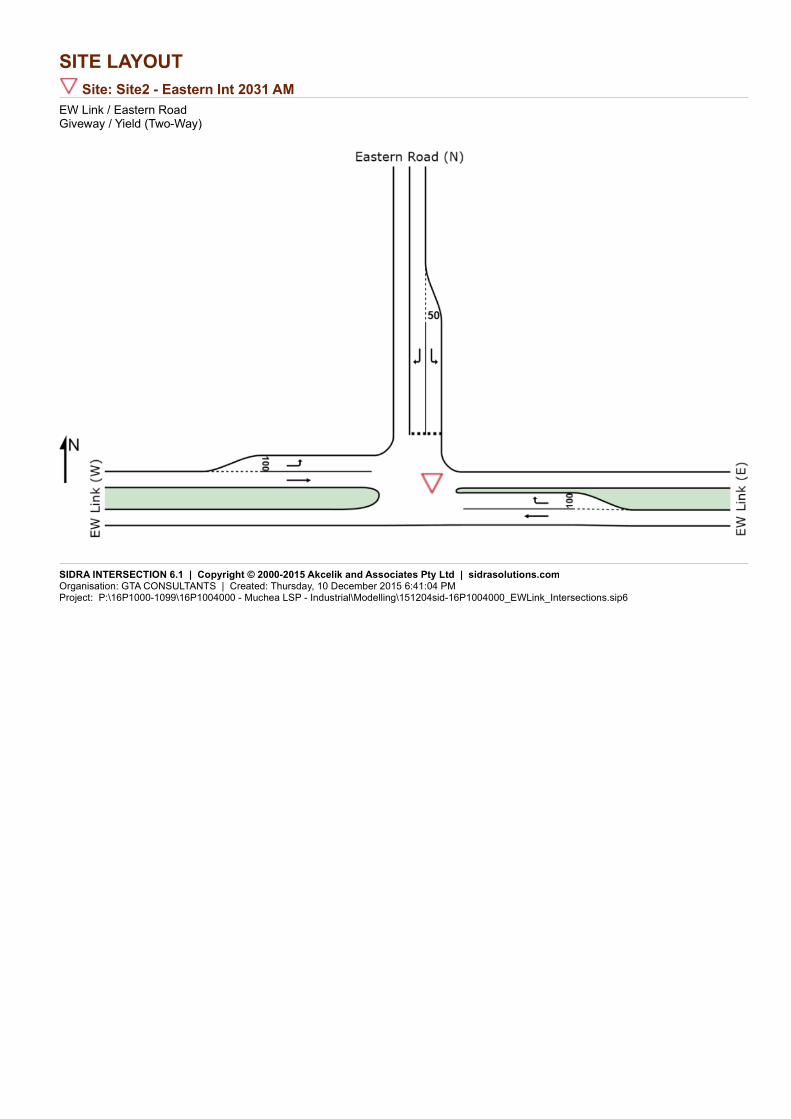
SITE LAYOUT
Site: Site2 - Eastern Int 2031 AM
EW Link / Eastern RoadGiveway / Yield (Two-Way)
SIDRA INTERSECTION 6.1 | Copyright © 2000-2015 Akcelik and Associates Pty Ltd | sidrasolutions.comOrganisation: GTA CONSULTANTS | Created: Thursday, 10 December 2015 6:41:04 PMProject: P:\16P1000-1099\16P1004000 - Muchea LSP - Industrial\Modelling\151204sid-16P1004000_EWLink_Intersections.sip6
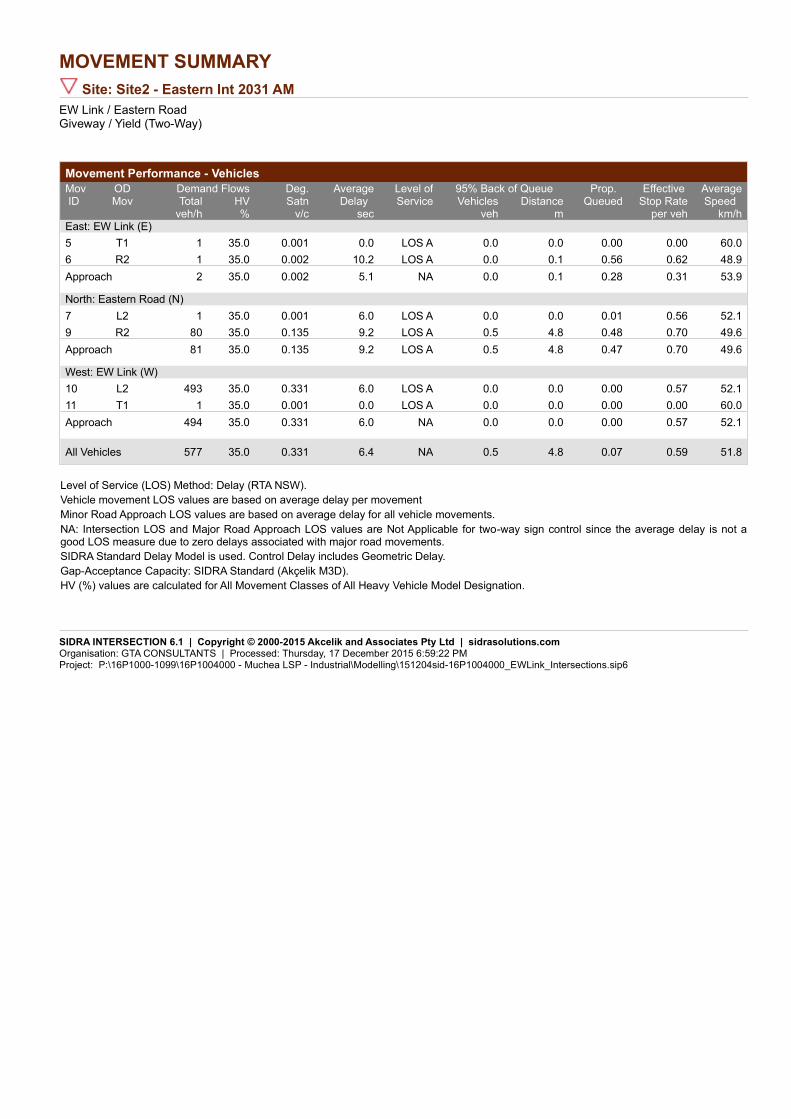
MOVEMENT SUMMARY
Site: Site2 - Eastern Int 2031 AM
EW Link / Eastern RoadGiveway / Yield (Two-Way)
Movement Performance - Vehicles
Demand Flows 95% Back of QueueMovID
ODMov
Deg.Satn
AverageDelay
Level ofService
Prop. Queued
Effective Stop Rate
AverageSpeed Total HV Vehicles Distance
veh/h % v/c sec veh m per veh km/hEast: EW Link (E)
5 T1 1 35.0 0.001 0.0 LOS A 0.0 0.0 0.00 0.00 60.0
6 R2 1 35.0 0.002 10.2 LOS A 0.0 0.1 0.56 0.62 48.9
Approach 2 35.0 0.002 5.1 NA 0.0 0.1 0.28 0.31 53.9
North: Eastern Road (N)
7 L2 1 35.0 0.001 6.0 LOS A 0.0 0.0 0.01 0.56 52.1
9 R2 80 35.0 0.135 9.2 LOS A 0.5 4.8 0.48 0.70 49.6
Approach 81 35.0 0.135 9.2 LOS A 0.5 4.8 0.47 0.70 49.6
West: EW Link (W)
10 L2 493 35.0 0.331 6.0 LOS A 0.0 0.0 0.00 0.57 52.1
11 T1 1 35.0 0.001 0.0 LOS A 0.0 0.0 0.00 0.00 60.0
Approach 494 35.0 0.331 6.0 NA 0.0 0.0 0.00 0.57 52.1
All Vehicles 577 35.0 0.331 6.4 NA 0.5 4.8 0.07 0.59 51.8
Level of Service (LOS) Method: Delay (RTA NSW).
Vehicle movement LOS values are based on average delay per movement
Minor Road Approach LOS values are based on average delay for all vehicle movements.
NA: Intersection LOS and Major Road Approach LOS values are Not Applicable for two-way sign control since the average delay is not a good LOS measure due to zero delays associated with major road movements.
SIDRA Standard Delay Model is used. Control Delay includes Geometric Delay.
Gap-Acceptance Capacity: SIDRA Standard (Akçelik M3D).
HV (%) values are calculated for All Movement Classes of All Heavy Vehicle Model Designation.
SIDRA INTERSECTION 6.1 | Copyright © 2000-2015 Akcelik and Associates Pty Ltd | sidrasolutions.comOrganisation: GTA CONSULTANTS | Processed: Thursday, 17 December 2015 6:59:22 PMProject: P:\16P1000-1099\16P1004000 - Muchea LSP - Industrial\Modelling\151204sid-16P1004000_EWLink_Intersections.sip6
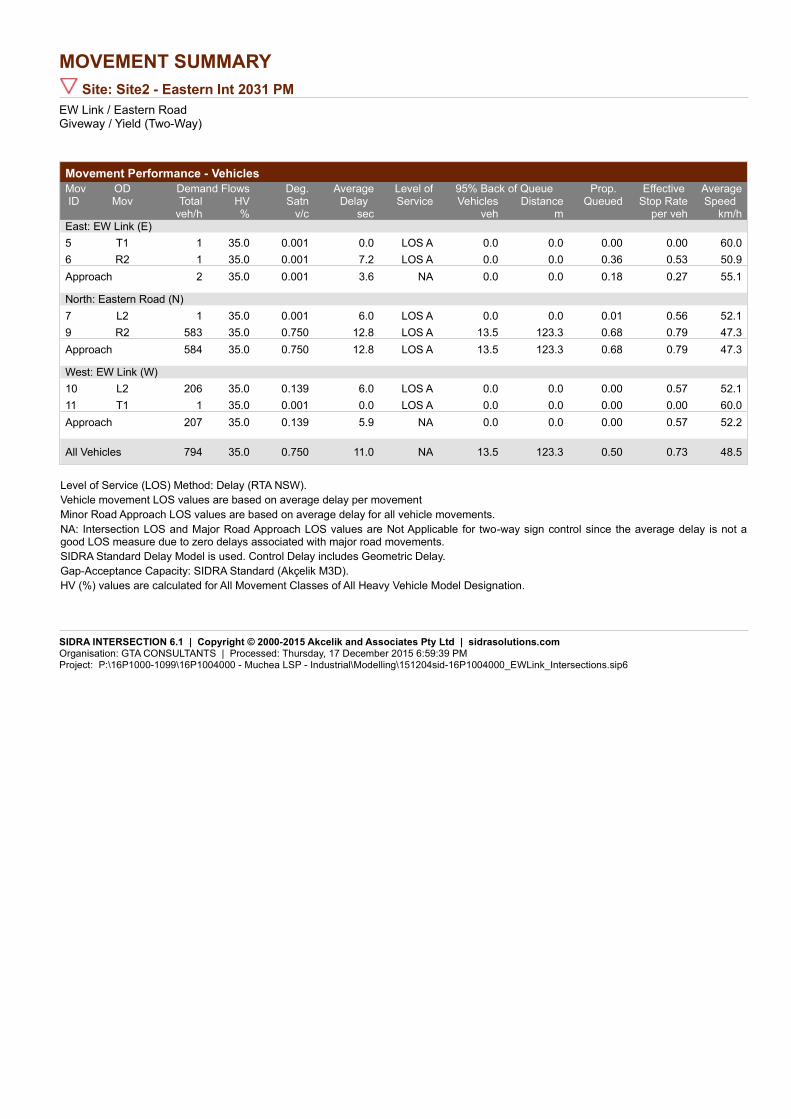
MOVEMENT SUMMARY
Site: Site2 - Eastern Int 2031 PM
EW Link / Eastern RoadGiveway / Yield (Two-Way)
Movement Performance - Vehicles
Demand Flows 95% Back of QueueMovID
ODMov
Deg.Satn
AverageDelay
Level ofService
Prop. Queued
Effective Stop Rate
AverageSpeed Total HV Vehicles Distance
veh/h % v/c sec veh m per veh km/hEast: EW Link (E)
5 T1 1 35.0 0.001 0.0 LOS A 0.0 0.0 0.00 0.00 60.0
6 R2 1 35.0 0.001 7.2 LOS A 0.0 0.0 0.36 0.53 50.9
Approach 2 35.0 0.001 3.6 NA 0.0 0.0 0.18 0.27 55.1
North: Eastern Road (N)
7 L2 1 35.0 0.001 6.0 LOS A 0.0 0.0 0.01 0.56 52.1
9 R2 583 35.0 0.750 12.8 LOS A 13.5 123.3 0.68 0.79 47.3
Approach 584 35.0 0.750 12.8 LOS A 13.5 123.3 0.68 0.79 47.3
West: EW Link (W)
10 L2 206 35.0 0.139 6.0 LOS A 0.0 0.0 0.00 0.57 52.1
11 T1 1 35.0 0.001 0.0 LOS A 0.0 0.0 0.00 0.00 60.0
Approach 207 35.0 0.139 5.9 NA 0.0 0.0 0.00 0.57 52.2
All Vehicles 794 35.0 0.750 11.0 NA 13.5 123.3 0.50 0.73 48.5
Level of Service (LOS) Method: Delay (RTA NSW).
Vehicle movement LOS values are based on average delay per movement
Minor Road Approach LOS values are based on average delay for all vehicle movements.
NA: Intersection LOS and Major Road Approach LOS values are Not Applicable for two-way sign control since the average delay is not a good LOS measure due to zero delays associated with major road movements.
SIDRA Standard Delay Model is used. Control Delay includes Geometric Delay.
Gap-Acceptance Capacity: SIDRA Standard (Akçelik M3D).
HV (%) values are calculated for All Movement Classes of All Heavy Vehicle Model Designation.
SIDRA INTERSECTION 6.1 | Copyright © 2000-2015 Akcelik and Associates Pty Ltd | sidrasolutions.comOrganisation: GTA CONSULTANTS | Processed: Thursday, 17 December 2015 6:59:39 PMProject: P:\16P1000-1099\16P1004000 - Muchea LSP - Industrial\Modelling\151204sid-16P1004000_EWLink_Intersections.sip6
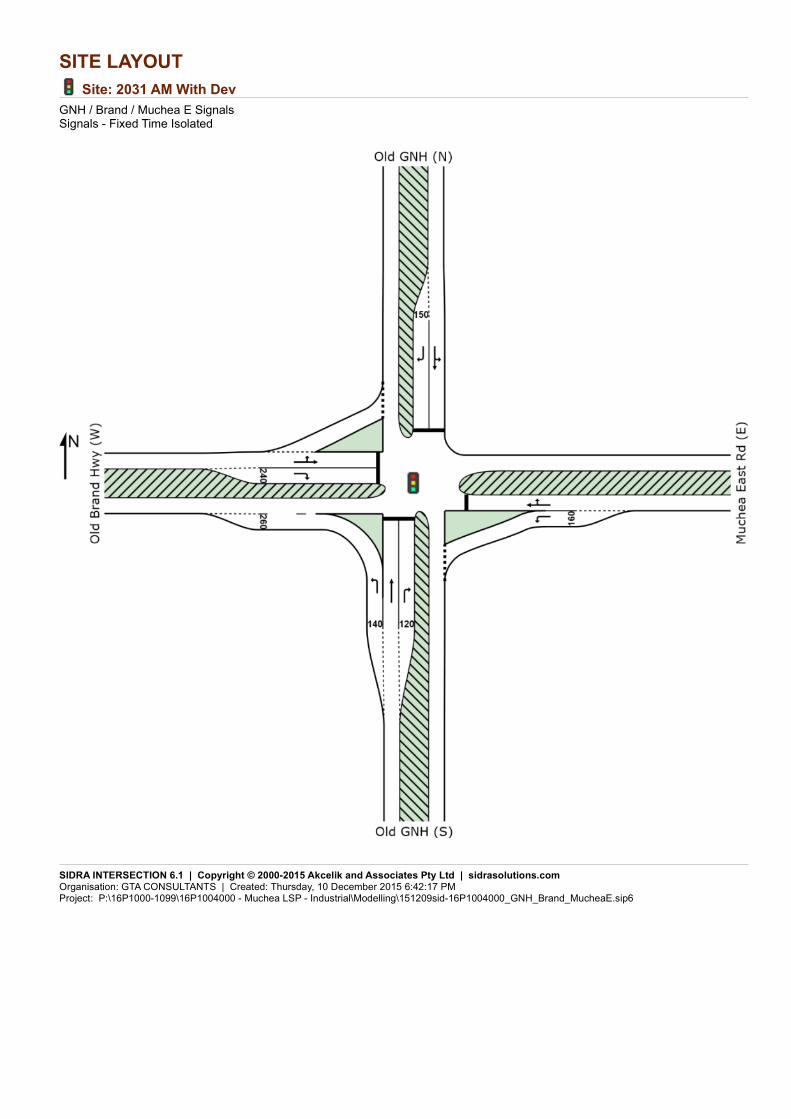
SITE LAYOUT
Site: 2031 AM With Dev
GNH / Brand / Muchea E SignalsSignals - Fixed Time Isolated
SIDRA INTERSECTION 6.1 | Copyright © 2000-2015 Akcelik and Associates Pty Ltd | sidrasolutions.comOrganisation: GTA CONSULTANTS | Created: Thursday, 10 December 2015 6:42:17 PMProject: P:\16P1000-1099\16P1004000 - Muchea LSP - Industrial\Modelling\151209sid-16P1004000_GNH_Brand_MucheaE.sip6
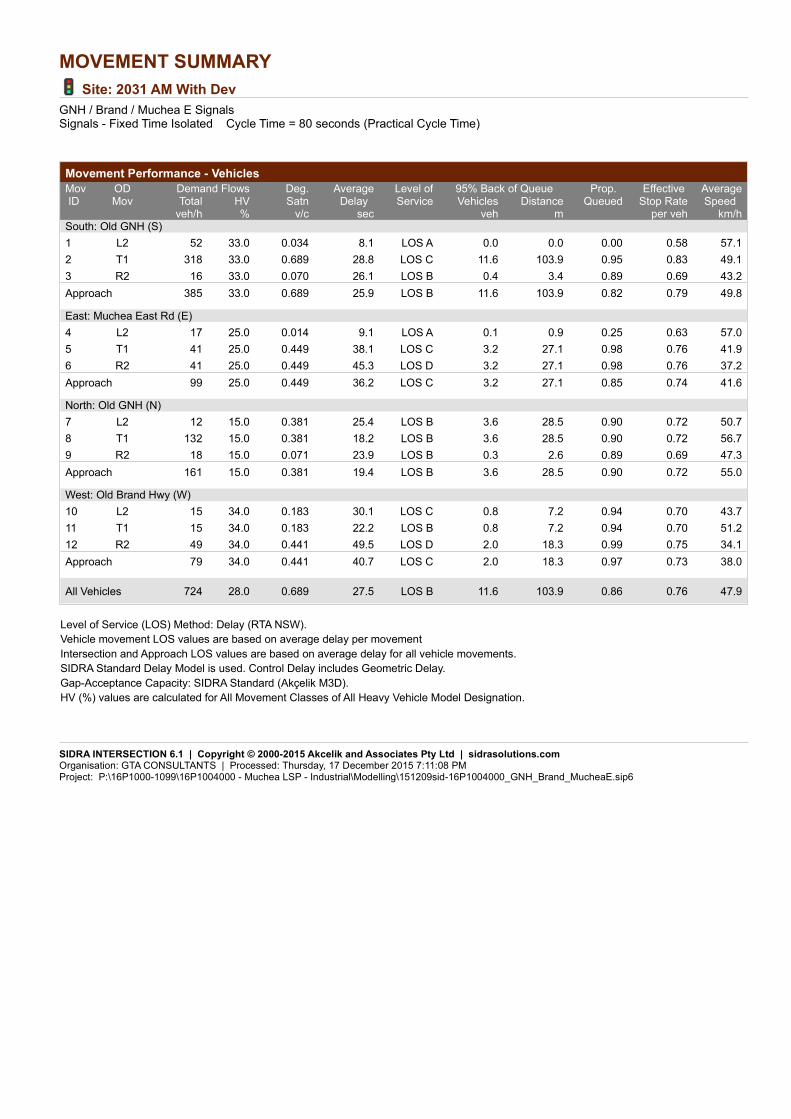
MOVEMENT SUMMARY
Site: 2031 AM With Dev
GNH / Brand / Muchea E SignalsSignals - Fixed Time Isolated Cycle Time = 80 seconds (Practical Cycle Time)
Movement Performance - Vehicles
Demand Flows 95% Back of QueueMovID
ODMov
Deg.Satn
AverageDelay
Level ofService
Prop. Queued
Effective Stop Rate
AverageSpeed Total HV Vehicles Distance
veh/h % v/c sec veh m per veh km/hSouth: Old GNH (S)
1 L2 52 33.0 0.034 8.1 LOS A 0.0 0.0 0.00 0.58 57.1
2 T1 318 33.0 0.689 28.8 LOS C 11.6 103.9 0.95 0.83 49.1
3 R2 16 33.0 0.070 26.1 LOS B 0.4 3.4 0.89 0.69 43.2
Approach 385 33.0 0.689 25.9 LOS B 11.6 103.9 0.82 0.79 49.8
East: Muchea East Rd (E)
4 L2 17 25.0 0.014 9.1 LOS A 0.1 0.9 0.25 0.63 57.0
5 T1 41 25.0 0.449 38.1 LOS C 3.2 27.1 0.98 0.76 41.9
6 R2 41 25.0 0.449 45.3 LOS D 3.2 27.1 0.98 0.76 37.2
Approach 99 25.0 0.449 36.2 LOS C 3.2 27.1 0.85 0.74 41.6
North: Old GNH (N)
7 L2 12 15.0 0.381 25.4 LOS B 3.6 28.5 0.90 0.72 50.7
8 T1 132 15.0 0.381 18.2 LOS B 3.6 28.5 0.90 0.72 56.7
9 R2 18 15.0 0.071 23.9 LOS B 0.3 2.6 0.89 0.69 47.3
Approach 161 15.0 0.381 19.4 LOS B 3.6 28.5 0.90 0.72 55.0
West: Old Brand Hwy (W)
10 L2 15 34.0 0.183 30.1 LOS C 0.8 7.2 0.94 0.70 43.7
11 T1 15 34.0 0.183 22.2 LOS B 0.8 7.2 0.94 0.70 51.2
12 R2 49 34.0 0.441 49.5 LOS D 2.0 18.3 0.99 0.75 34.1
Approach 79 34.0 0.441 40.7 LOS C 2.0 18.3 0.97 0.73 38.0
All Vehicles 724 28.0 0.689 27.5 LOS B 11.6 103.9 0.86 0.76 47.9
Level of Service (LOS) Method: Delay (RTA NSW).
Vehicle movement LOS values are based on average delay per movement
Intersection and Approach LOS values are based on average delay for all vehicle movements.
SIDRA Standard Delay Model is used. Control Delay includes Geometric Delay.
Gap-Acceptance Capacity: SIDRA Standard (Akçelik M3D).
HV (%) values are calculated for All Movement Classes of All Heavy Vehicle Model Designation.
SIDRA INTERSECTION 6.1 | Copyright © 2000-2015 Akcelik and Associates Pty Ltd | sidrasolutions.comOrganisation: GTA CONSULTANTS | Processed: Thursday, 17 December 2015 7:11:08 PMProject: P:\16P1000-1099\16P1004000 - Muchea LSP - Industrial\Modelling\151209sid-16P1004000_GNH_Brand_MucheaE.sip6
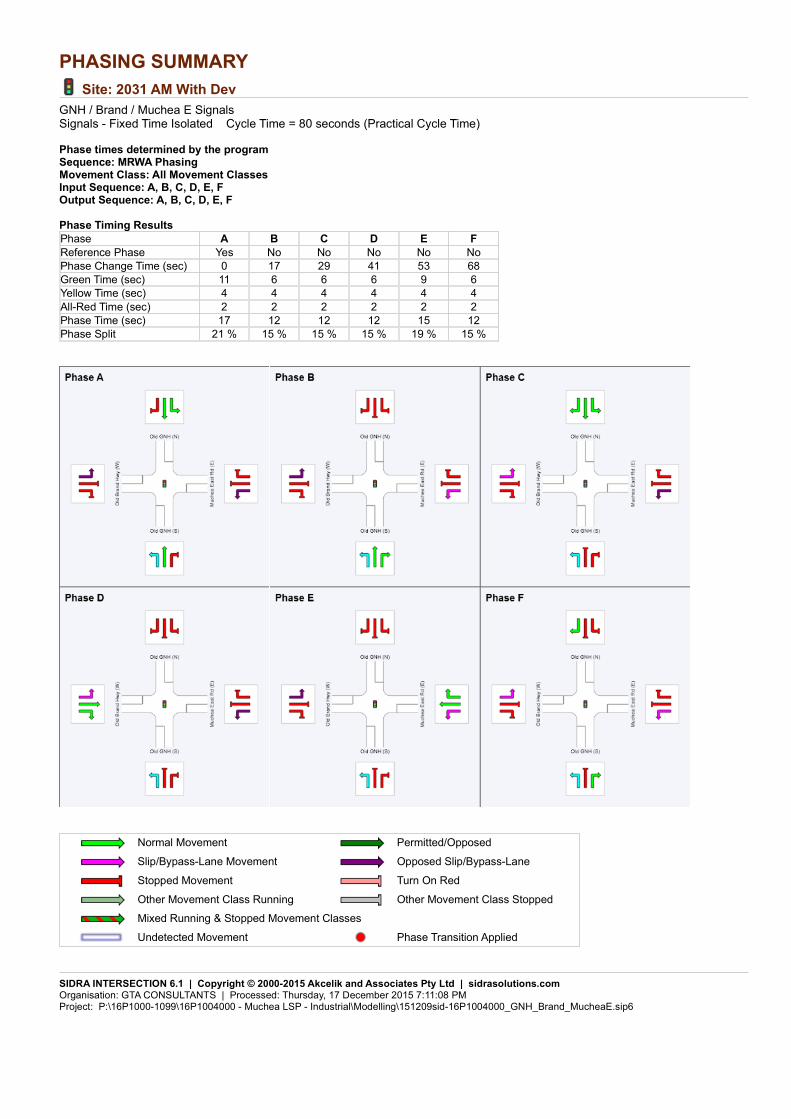
PHASING SUMMARY
Site: 2031 AM With Dev
GNH / Brand / Muchea E SignalsSignals - Fixed Time Isolated Cycle Time = 80 seconds (Practical Cycle Time)
Phase times determined by the programSequence: MRWA PhasingMovement Class: All Movement ClassesInput Sequence: A, B, C, D, E, FOutput Sequence: A, B, C, D, E, F
Phase Timing Results
Phase A B C D E F
Reference Phase Yes No No No No No
Phase Change Time (sec) 0 17 29 41 53 68
Green Time (sec) 11 6 6 6 9 6
Yellow Time (sec) 4 4 4 4 4 4
All-Red Time (sec) 2 2 2 2 2 2
Phase Time (sec) 17 12 12 12 15 12
Phase Split 21 % 15 % 15 % 15 % 19 % 15 %
Normal Movement Permitted/Opposed
Slip/Bypass-Lane Movement Opposed Slip/Bypass-Lane
Stopped Movement Turn On Red
Other Movement Class Running Other Movement Class Stopped
Mixed Running & Stopped Movement Classes
Undetected Movement Phase Transition Applied
SIDRA INTERSECTION 6.1 | Copyright © 2000-2015 Akcelik and Associates Pty Ltd | sidrasolutions.comOrganisation: GTA CONSULTANTS | Processed: Thursday, 17 December 2015 7:11:08 PMProject: P:\16P1000-1099\16P1004000 - Muchea LSP - Industrial\Modelling\151209sid-16P1004000_GNH_Brand_MucheaE.sip6
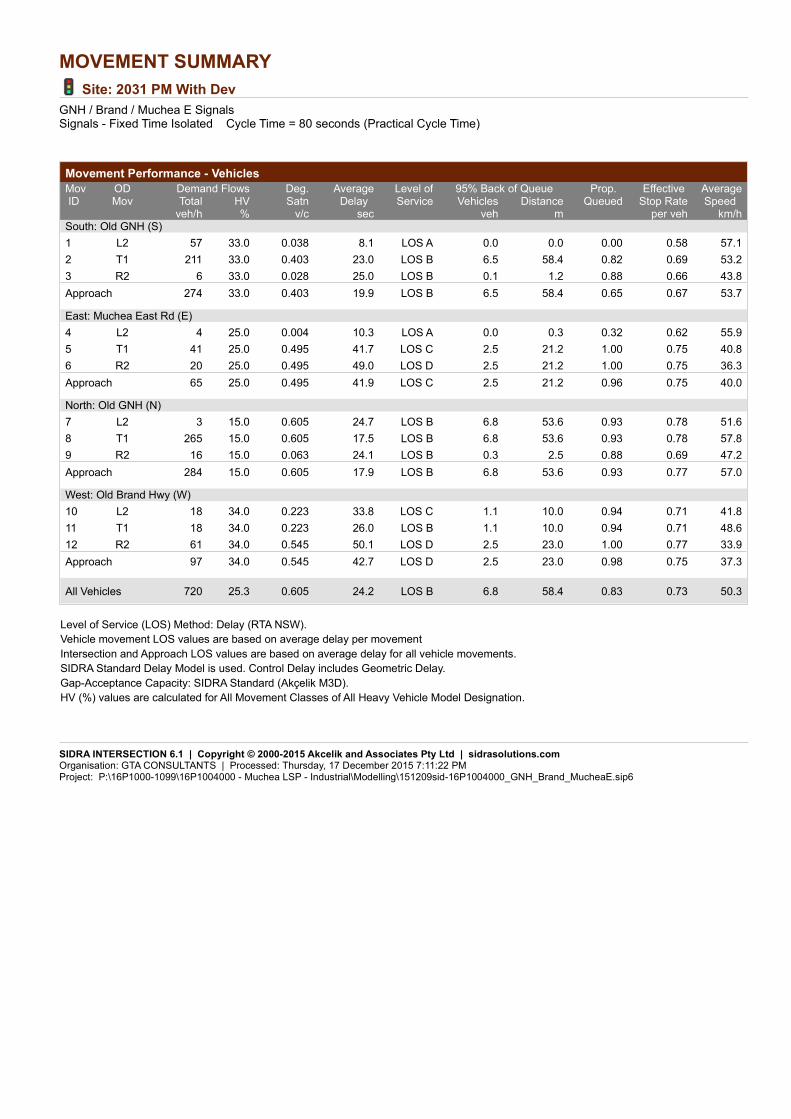
MOVEMENT SUMMARY
Site: 2031 PM With Dev
GNH / Brand / Muchea E SignalsSignals - Fixed Time Isolated Cycle Time = 80 seconds (Practical Cycle Time)
Movement Performance - Vehicles
Demand Flows 95% Back of QueueMovID
ODMov
Deg.Satn
AverageDelay
Level ofService
Prop. Queued
Effective Stop Rate
AverageSpeed Total HV Vehicles Distance
veh/h % v/c sec veh m per veh km/hSouth: Old GNH (S)
1 L2 57 33.0 0.038 8.1 LOS A 0.0 0.0 0.00 0.58 57.1
2 T1 211 33.0 0.403 23.0 LOS B 6.5 58.4 0.82 0.69 53.2
3 R2 6 33.0 0.028 25.0 LOS B 0.1 1.2 0.88 0.66 43.8
Approach 274 33.0 0.403 19.9 LOS B 6.5 58.4 0.65 0.67 53.7
East: Muchea East Rd (E)
4 L2 4 25.0 0.004 10.3 LOS A 0.0 0.3 0.32 0.62 55.9
5 T1 41 25.0 0.495 41.7 LOS C 2.5 21.2 1.00 0.75 40.8
6 R2 20 25.0 0.495 49.0 LOS D 2.5 21.2 1.00 0.75 36.3
Approach 65 25.0 0.495 41.9 LOS C 2.5 21.2 0.96 0.75 40.0
North: Old GNH (N)
7 L2 3 15.0 0.605 24.7 LOS B 6.8 53.6 0.93 0.78 51.6
8 T1 265 15.0 0.605 17.5 LOS B 6.8 53.6 0.93 0.78 57.8
9 R2 16 15.0 0.063 24.1 LOS B 0.3 2.5 0.88 0.69 47.2
Approach 284 15.0 0.605 17.9 LOS B 6.8 53.6 0.93 0.77 57.0
West: Old Brand Hwy (W)
10 L2 18 34.0 0.223 33.8 LOS C 1.1 10.0 0.94 0.71 41.8
11 T1 18 34.0 0.223 26.0 LOS B 1.1 10.0 0.94 0.71 48.6
12 R2 61 34.0 0.545 50.1 LOS D 2.5 23.0 1.00 0.77 33.9
Approach 97 34.0 0.545 42.7 LOS D 2.5 23.0 0.98 0.75 37.3
All Vehicles 720 25.3 0.605 24.2 LOS B 6.8 58.4 0.83 0.73 50.3
Level of Service (LOS) Method: Delay (RTA NSW).
Vehicle movement LOS values are based on average delay per movement
Intersection and Approach LOS values are based on average delay for all vehicle movements.
SIDRA Standard Delay Model is used. Control Delay includes Geometric Delay.
Gap-Acceptance Capacity: SIDRA Standard (Akçelik M3D).
HV (%) values are calculated for All Movement Classes of All Heavy Vehicle Model Designation.
SIDRA INTERSECTION 6.1 | Copyright © 2000-2015 Akcelik and Associates Pty Ltd | sidrasolutions.comOrganisation: GTA CONSULTANTS | Processed: Thursday, 17 December 2015 7:11:22 PMProject: P:\16P1000-1099\16P1004000 - Muchea LSP - Industrial\Modelling\151209sid-16P1004000_GNH_Brand_MucheaE.sip6

PHASING SUMMARY
Site: 2031 PM With Dev
GNH / Brand / Muchea E SignalsSignals - Fixed Time Isolated Cycle Time = 80 seconds (Practical Cycle Time)
Phase times determined by the programSequence: MRWA PhasingMovement Class: All Movement ClassesInput Sequence: A, B, C, D, E, FOutput Sequence: A, B, C, D, E, F
Phase Timing Results
Phase A B C D E F
Reference Phase Yes No No No No No
Phase Change Time (sec) 0 20 32 44 56 68
Green Time (sec) 14 6 6 6 6 6
Yellow Time (sec) 4 4 4 4 4 4
All-Red Time (sec) 2 2 2 2 2 2
Phase Time (sec) 20 12 12 12 12 12
Phase Split 25 % 15 % 15 % 15 % 15 % 15 %
Normal Movement Permitted/Opposed
Slip/Bypass-Lane Movement Opposed Slip/Bypass-Lane
Stopped Movement Turn On Red
Other Movement Class Running Other Movement Class Stopped
Mixed Running & Stopped Movement Classes
Undetected Movement Phase Transition Applied
SIDRA INTERSECTION 6.1 | Copyright © 2000-2015 Akcelik and Associates Pty Ltd | sidrasolutions.comOrganisation: GTA CONSULTANTS | Processed: Thursday, 17 December 2015 7:11:22 PMProject: P:\16P1000-1099\16P1004000 - Muchea LSP - Industrial\Modelling\151209sid-16P1004000_GNH_Brand_MucheaE.sip6

Melbourne
A Level 25, 55 Collins Street
PO Box 24055
MELBOURNE VIC 3000
P +613 9851 9600
Brisbane
A Level 4, 283 Elizabeth Street
BRISBANE QLD 4000
GPO Box 115
BRISBANE QLD 4001
P +617 3113 5000
Adelaide
A Suite 4, Level 1, 136 The Parade
PO Box 3421
NORWOOD SA 5067
P +618 8334 3600
Townsville
A Level 1, 25 Sturt Street
PO Box 1064
TOWNSVILLE QLD 4810
P +617 4722 2765
Sydney
A Level 6, 15 Help Street
CHATSWOOD NSW 2067
PO Box 5254
WEST CHATSWOOD NSW 1515
P +612 8448 1800
Canberra
A Tower A, Level 5,
7 London Circuit
Canberra ACT 2600
P +612 6243 4826
Gold Coast
A Level 9, Corporate Centre 2
Box 37, 1 Corporate Court
BUNDALL QLD 4217
P +617 5510 4800
F +617 5510 4814
Perth
A Level 27, 44 St Georges Terrace
PERTH WA 6000
P +618 6361 4634
www.gta.com.au www.gta.com.au