MUC1 (CA27.29) before and after Chemotherapy and ... - MDPI
13
Citation: Huebner, H.; Häberle, L.; Müller, V.; Schrader, I.; Lorenz, R.; Forstbauer, H.; Fink, V.; Schochter, F.; Bekes, I.; Mahner, S.; et al. MUC1 (CA27.29) before and after Chemotherapy and Prognosis in High-Risk Early Breast Cancer Patients. Cancers 2022, 14, 1721. https://doi.org/10.3390/ cancers14071721 Academic Editor: Carlos S. Moreno Received: 23 January 2022 Accepted: 9 March 2022 Published: 28 March 2022 Publisher’s Note: MDPI stays neutral with regard to jurisdictional claims in published maps and institutional affil- iations. Copyright: © 2022 by the authors. Licensee MDPI, Basel, Switzerland. This article is an open access article distributed under the terms and conditions of the Creative Commons Attribution (CC BY) license (https:// creativecommons.org/licenses/by/ 4.0/). cancers Article MUC1 (CA27.29) before and after Chemotherapy and Prognosis in High-Risk Early Breast Cancer Patients Hanna Huebner 1,† , Lothar Häberle 1,2,† , Volkmar Müller 3 , Iris Schrader 4 , Ralf Lorenz 5 , Helmut Forstbauer 6 , Visnja Fink 7 , Fabienne Schochter 7 , Inga Bekes 8 , Sven Mahner 9 , Julia Jückstock 9 , Naiba Nabieva 1 , Andreas Schneeweiss 10,11 , Hans Tesch 12 , Sara Y. Brucker 13 , Jens-Uwe Blohmer 14 , Tanja N. Fehm 15 , Georg Heinrich 16 , Mahdi Rezai 17 , Matthias W. Beckmann 1 , Peter A. Fasching 1,18, * , Wolfgang Janni 7,‡ and Brigitte Rack 7,9,‡ 1 Department of Gynecology and Obstetrics, Comprehensive Cancer Center EMN, Erlangen University Hospital, Friedrich-Alexander-Universität Erlangen-Nürnberg (FAU), 91054 Erlangen, Germany; [email protected] (H.H.); [email protected] (L.H.); [email protected] (N.N.); [email protected] (M.W.B.) 2 Biostatistics Unit, Department of Gynecology and Obstetrics, Erlangen University Hospital, Friedrich-Alexander-Universität Erlangen-Nürnberg (FAU), 91054 Erlangen, Germany 3 Department of Gynecology, University of Hamburg-Eppendorf, 20251 Hamburg, Germany; [email protected] 4 Breast Center, Diakovere Henriettenstift, 30171 Hannover, Germany; [email protected] 5 Gynecologic Practice Dres Lorenz, Hecker, Wesche, 38100 Braunschweig, Germany; [email protected] 6 Hemato-Oncological Practice Dres Forstbauer and Ziske, 53840 Troisdorf, Germany; [email protected] 7 Department of Gynecology and Obstetrics, Ulm University Hospital, 89081 Ulm, Germany; visnja.fi[email protected] (V.F.);[email protected] (F.S.); [email protected] (W.J.); [email protected] (B.R.) 8 Clinic for Medical Oncology and Hematology, Cantonal Hospital St. Gallen, 9000 St. Gallen, Switzerland; [email protected] 9 Department of Obstetrics and Gynecology, University Hospital, Ludwig-Maximilians-Universität München (LMU), 80337 Munich, Germany; [email protected] (S.M.); [email protected] (J.J.) 10 National Center for Tumor Diseases, Heidelberg University Hospital, 69120 Heidelberg, Germany; [email protected] 11 Department of Gynecology and Obstetrics, Heidelberg University Hospital, 69120 Heidelberg, Germany 12 Department of Oncology, Onkologie Bethanien, 60389 Frankfurt, Germany; [email protected] 13 Department of Gynecology and Obstetrics, Tübingen University Hospital, 72076 Tübingen, Germany; [email protected] 14 Department of Gynecology, Breast Center, Charité-Universitätsmedizin, 10117 Berlin, Germany; [email protected] 15 Department of Gynecology and Obstetrics, Düsseldorf University Hospital, Heinrich Heine University, 40225 Düsseldorf, Germany; [email protected] 16 Department of Gynecologic Oncology, Schwerpunktpraxis für Gynäkologische Onkologie, 40235 Fürstenwalde, Germany; [email protected] 17 Department of Breast Diseases, Breast Center of Duisburg, Sant Ana Hospitat, 47259 Duisburg, Germany; [email protected] 18 Department of Medicine, Division of Hematology/Oncology, David Geffen School of Medicine, University of California at Los Angeles, Los Angeles, CA 90095, USA * Correspondence: [email protected]; Tel.: +49-9131-9188-0611 † These authors contributed equally to this work. ‡ These authors contributed equally to this work. Simple Summary: CA27.29 (MUC1) is a well described biomarker for prediction of prognosis and treatment efficacy. CA27.29 is mainly evaluated in the preoperative setting. However, testing of postoperative levels and additional assessment after chemotherapy might be more informative for analyzing the usefulness of CA27.29 in relation to the efficacy of chemotherapy. Thus, both pre- and post-chemotherapy values were assessed from patients enrolled in the breast cancer SUCCESS-A trial. Pre-chemotherapy assessment was associated with disease-free survival. It had no prognostic value Cancers 2022, 14, 1721. https://doi.org/10.3390/cancers14071721 https://www.mdpi.com/journal/cancers
-
Upload
khangminh22 -
Category
Documents
-
view
0 -
download
0
Transcript of MUC1 (CA27.29) before and after Chemotherapy and ... - MDPI

�����������������
Citation: Huebner, H.; Häberle, L.;
Müller, V.; Schrader, I.; Lorenz, R.;
Forstbauer, H.; Fink, V.; Schochter, F.;
Bekes, I.; Mahner, S.; et al. MUC1
(CA27.29) before and after
Chemotherapy and Prognosis in
High-Risk Early Breast Cancer
Patients. Cancers 2022, 14, 1721.
https://doi.org/10.3390/
cancers14071721
Academic Editor: Carlos S. Moreno
Received: 23 January 2022
Accepted: 9 March 2022
Published: 28 March 2022
Publisher’s Note: MDPI stays neutral
with regard to jurisdictional claims in
published maps and institutional affil-
iations.
Copyright: © 2022 by the authors.
Licensee MDPI, Basel, Switzerland.
This article is an open access article
distributed under the terms and
conditions of the Creative Commons
Attribution (CC BY) license (https://
creativecommons.org/licenses/by/
4.0/).
cancers
Article
MUC1 (CA27.29) before and after Chemotherapy and Prognosisin High-Risk Early Breast Cancer PatientsHanna Huebner 1,† , Lothar Häberle 1,2,†, Volkmar Müller 3, Iris Schrader 4, Ralf Lorenz 5, Helmut Forstbauer 6,Visnja Fink 7, Fabienne Schochter 7 , Inga Bekes 8, Sven Mahner 9, Julia Jückstock 9, Naiba Nabieva 1 ,Andreas Schneeweiss 10,11, Hans Tesch 12, Sara Y. Brucker 13 , Jens-Uwe Blohmer 14 , Tanja N. Fehm 15,Georg Heinrich 16, Mahdi Rezai 17, Matthias W. Beckmann 1, Peter A. Fasching 1,18,* , Wolfgang Janni 7,‡
and Brigitte Rack 7,9,‡
1 Department of Gynecology and Obstetrics, Comprehensive Cancer Center EMN, Erlangen UniversityHospital, Friedrich-Alexander-Universität Erlangen-Nürnberg (FAU), 91054 Erlangen, Germany;[email protected] (H.H.); [email protected] (L.H.); [email protected] (N.N.);[email protected] (M.W.B.)
2 Biostatistics Unit, Department of Gynecology and Obstetrics, Erlangen University Hospital,Friedrich-Alexander-Universität Erlangen-Nürnberg (FAU), 91054 Erlangen, Germany
3 Department of Gynecology, University of Hamburg-Eppendorf, 20251 Hamburg, Germany;[email protected]
4 Breast Center, Diakovere Henriettenstift, 30171 Hannover, Germany; [email protected] Gynecologic Practice Dres Lorenz, Hecker, Wesche, 38100 Braunschweig, Germany;
[email protected] Hemato-Oncological Practice Dres Forstbauer and Ziske, 53840 Troisdorf, Germany;
[email protected] Department of Gynecology and Obstetrics, Ulm University Hospital, 89081 Ulm, Germany;
[email protected] (V.F.); [email protected] (F.S.);[email protected] (W.J.); [email protected] (B.R.)
8 Clinic for Medical Oncology and Hematology, Cantonal Hospital St. Gallen, 9000 St. Gallen, Switzerland;[email protected]
9 Department of Obstetrics and Gynecology, University Hospital, Ludwig-Maximilians-UniversitätMünchen (LMU), 80337 Munich, Germany; [email protected] (S.M.);[email protected] (J.J.)
10 National Center for Tumor Diseases, Heidelberg University Hospital, 69120 Heidelberg, Germany;[email protected]
11 Department of Gynecology and Obstetrics, Heidelberg University Hospital, 69120 Heidelberg, Germany12 Department of Oncology, Onkologie Bethanien, 60389 Frankfurt, Germany; [email protected] Department of Gynecology and Obstetrics, Tübingen University Hospital, 72076 Tübingen, Germany;
[email protected] Department of Gynecology, Breast Center, Charité-Universitätsmedizin, 10117 Berlin, Germany;
[email protected] Department of Gynecology and Obstetrics, Düsseldorf University Hospital, Heinrich Heine University,
40225 Düsseldorf, Germany; [email protected] Department of Gynecologic Oncology, Schwerpunktpraxis für Gynäkologische Onkologie,
40235 Fürstenwalde, Germany; [email protected] Department of Breast Diseases, Breast Center of Duisburg, Sant Ana Hospitat, 47259 Duisburg, Germany;
[email protected] Department of Medicine, Division of Hematology/Oncology, David Geffen School of Medicine,
University of California at Los Angeles, Los Angeles, CA 90095, USA* Correspondence: [email protected]; Tel.: +49-9131-9188-0611† These authors contributed equally to this work.‡ These authors contributed equally to this work.
Simple Summary: CA27.29 (MUC1) is a well described biomarker for prediction of prognosis andtreatment efficacy. CA27.29 is mainly evaluated in the preoperative setting. However, testing ofpostoperative levels and additional assessment after chemotherapy might be more informative foranalyzing the usefulness of CA27.29 in relation to the efficacy of chemotherapy. Thus, both pre- andpost-chemotherapy values were assessed from patients enrolled in the breast cancer SUCCESS-A trial.Pre-chemotherapy assessment was associated with disease-free survival. It had no prognostic value
Cancers 2022, 14, 1721. https://doi.org/10.3390/cancers14071721 https://www.mdpi.com/journal/cancers

Cancers 2022, 14, 1721 2 of 13
in node-negative patients, but there was a clear association in node-positive patients. Furthermore, itwas shown that post-chemotherapy CA27.29 assessment did not add any prognostic value, eitheron its own or in addition to pre-chemotherapy assessment. In conclusion, this indicates that pre-and post-chemotherapy values do not provide additional information. However, pre-chemotherapyCA27.29 could be a suitable tool to identify a group with unfavorable prognosis among node-positive patients.
Abstract: Soluble MUC1 has been discussed as a biomarker for predicting prognosis, treatmentefficacy, and monitoring disease activity in breast cancer (BC) patients. Most studies in adjuvantsettings have used preoperative assessment. This study, part of the SUCCESS-A trial (NCT02181101),assessed the prognostic value of soluble MUC1 before and after standard adjuvant chemotherapy.Patients with high-risk BC were treated within the SUCCESS-A trial with either three cycles of5-fluorouracil, epirubicin, and cyclophosphamide followed by three cycles of docetaxel or threecycles of FEC followed by three cycles of docetaxel and gemcitabine. Cox regression analyses wereperformed to investigate the prognostic value of CA27.29 before and after chemotherapy relative todisease-free survival (DFS), along with established BC prognostic factors such as age, body massindex, tumor size, nodal status, estrogen receptor, progesterone receptor, HER2 status, and grading.Pre-chemotherapy and post-chemotherapy CA27.29 assessments were available for 2687 patientsof 3754 randomized patients. Pre-chemotherapy CA27.29 assessment was associated with DFS inaddition to established prognostic factors. It had no prognostic value in node-negative patients,but there was a clear association in node-positive patients. Post-chemotherapy CA27.29 assessmentdid not add any prognostic value, either on its own or in addition to pre-chemotherapy CA27.29assessment.
Keywords: early breast cancer; tumor marker; chemotherapy; anthracycline; taxane; MUC1;CA27.29; CA15-3
1. Introduction
Biomarkers that help to monitor the efficacy of treatment may be extremely usefulfor predicting prognosis, guiding the therapy and assessing the early response to it [1].There has been growing interest in the extent to which tumor markers may be of value forpredicting the prognosis and treatment response in individual patients and for monitor-ing therapy.
One of these biomarkers is MUC1, which is overexpressed in many malignancies,particularly in breast cancer (BC) [2,3]. It comprises two subunits, a transmembrane(MUC1-C) and an extracellular subunit (MUC1-N). MUC1-C has been described as havingoncogenic functions, interacting with receptor tyrosine kinases and activating severalpathways including the PI3K-, MAPK-, NFκB-, and Wnt/β catenin pathways [3].
MUC1-N can be shed, is soluble in serum, and can be measured with antibodiesdirected against epitopes of this subunit. The shed and soluble subunit is often referred tousing the name of the antigen (CA27.29 or CA15-3)—i.e., the target of the analytic assay forthe measurement of MUC1 levels [2].
MUC1 is a prognostic marker in both early [4–18] and advanced BC [19,20]. In moststudies in patients with non-metastatic BC, blood for MUC1 assessment has been obtainedpreoperatively. Clear associations were found between tumor size and the soluble MUC1-level. While large studies have shown that soluble MUC1 is a predictor of prognosisfor both early and advanced tumor stages independently of the tumor stage [7,9,15],it may be hypothesized that the close association between tumor stage and MUC1 isdue to the fact that MUC1 levels mirror the tumor burden in BC patients. However,testing of postoperative levels and additional assessment after chemotherapy might bemore informative for analyzing the usefulness of MUC1 in relation to the efficacy ofchemotherapy and other biological effects, such as its role in early systemic tumor spread.

Cancers 2022, 14, 1721 3 of 13
The aim of this study was therefore to assess the association with disease-free survivaland MUC1 as measured using a CA27.29 assay before and after adjuvant chemotherapy,taking into account established prognostic factors.
2. Materials and Methods2.1. Study Design
In the SUCCESS-A open-label phase 3 trial, patients were randomly assigned at aratio of 1:1 to either an anthracycline/taxane-based chemotherapy or to this chemotherapyregimen plus gemcitabine [21]. Further treatment specifications are provided in the Sup-plementary methods. The SUCCESS-A study was conducted as an investigator-initiatedand led trial in Germany approved by all the ethics committees responsible and was con-ducted in accordance with the Declaration of Helsinki. All of the patients provided writteninformed consent before entering the study.
2.2. Participants
Patients were eligible if they were aged 18 or older and had a diagnosis of early,non-metastasized, high-risk invasive BC, defined by tumor stage, tumor grade, hormonereceptor status or age. The full inclusion/exclusion criteria are provided in AdditionalTable 1.
Table 1. Patient Characteristics.
Characteristic Mean or Count SD or %
Age 53.0 10.5
BMI 26.2 5.0CA27.29
Before chemotherapy 18.4 8.1After chemotherapy 23.1 9.8
pTpT1 1106 41.2pT2 1411 52.5pT3 137 5.1pT4 33 1.2
pNpN+ 1764 65.6pN0 923 34.4
HistologyDuctal 2202 82.0
Lobular 302 11.2Other 183 6.8
GradingG1 118 4.4G2 1304 48.5G3 1265 47.1
ERER− 922 34.3ER+ 1765 65.7
PRPR− 1091 40.6PR+ 1596 59.4
HER2/neuHER2− 2038 75.8HER2+ 649 24.2
BMI, body mass index; ER, estrogen receptor; PR, progesterone receptor; SD, standard deviation.

Cancers 2022, 14, 1721 4 of 13
2.3. End Points, Follow-Up, and Data Capture
Disease-free survival was defined as the time from the last chemotherapy administra-tion to the earliest date of disease progression (distant metastasis, local recurrence, deathfrom any cause) or the date of censoring. Patients who were lost to follow-up before themaximum observation time of 5.5 years or were disease-free after the maximum observa-tion time were censored at the last date on which they were known to be disease-free or atthe maximum observation time. The maximum observation period of 5.5 years consists ofsix months of chemotherapy and (up to) five years of follow-up thereafter.
For survival and recurrence assessment, the patients were followed at the studysites at 3-month intervals for the first three years and every six months thereafter. Thefollow-up included clinical examinations (at each visit), mammography (every six months),and symptom-driven examinations if necessary. High quality of the data was ensuredby electronic data management, including automated plausibility checks and regularmonitoring visits to the study site by an independent clinical research organization (AlcedisGmbH, Giessen, Germany) and a data monitoring committee (DMC).
2.4. Assessment of Soluble MUC1 with the CA27.29 Assay
Laboratory analysis was performed centrally in the Department of Gynecology and Ob-stetrics at Munich University Hospital [22]. Approximately 10 mL of peripheral blood wasdrawn by peripheral vein puncture in standard serum tubes and centrifuged (10 min,2000× g, room temperature) within 24–72 h following the collection time to removeclots. The serum was immediately transferred to an immunoreaction cup from the STAIA-Pack 27.29 series (Tosoh Bioscience, Tessenderlo, Belgium) for further analysis. TheCA27.29 serum concentration was measured using the AIA-600 II automated enzymeimmunoassay system (Tosoh Bioscience, Tessenderlo, Belgium) in accordance with the man-ufacturer’s instructions. In brief, serum samples were combined with a diluent (1:20) andwere transferred to an immunoreaction cup from the ST-AIA-Pack 27.29 series. CA27.29was immobilized using magnetic beads conjugated to antibodies. Enzyme-labeled antibod-ies attached to a different epitope were then bound to the CA27.29 antigen in a sandwichmanner. The samples were then incubated at 37 ◦C, followed by a washing step to removeany unbound antibody. The fluorogenic substrate 4-methylumbelliferyl phosphate wasadded to the test cup, and enzyme activity was measured on the basis of the amount offluorescence.
2.5. Statistical Methods
The primary objective was to study whether information about CA27.29 before andafter chemotherapy improves the ability to predict disease-free survival for each patient, inaddition to other well-known predictors. For this purpose, Cox regression analyses wereperformed as described in the Supplementary methods [23–28]. In brief, a Cox regressionmodel for commonly known predictors was compared with a further model containingthose variables and additionally CA27.29 before and after chemotherapy and all relevantinteraction terms for those variables (“full model”) using the likelihood ratio test (LRT). Incase of significance, the full model was tested for the relevance of the included interactionterms by comparing the full model with a model without interaction terms using a secondLRT. In the case of significance, a variable selection procedure was carried out to identifyrelevant interaction terms (“final model”). Hazard ratios (HRs) and survival rates wereestimated using the final model. Furthermore, the predictive ability of CA27.29 before andafter chemotherapy was compared.
All of the tests were two-sided, and a p value of <0.05 was regarded as statisticallysignificant. Calculations were carried out using R statistical software (V3.0.1, 2013, TheR Foundation for Statistical Computing, Vienna, Austria). Remark criteria were used toreport tumor marker data [29].

Cancers 2022, 14, 1721 5 of 13
3. Results3.1. Patient Characteristics
In total, 3754 patients were randomly assigned in the SUCCESS-A study. For inclusionin the present analysis, patients were required to have serum samples for CA27.29 analysisat the time of study inclusion and after chemotherapy (n = 2687). Complete information onall variables as listed in Table 1 was available for 98.2% of these patients. The percentageof values missing for each variable was less than 0.5%, with the exception of HER2 (1.5%).The characteristics of the patients are shown in Table 1. CA27.29 values before and afterchemotherapy were strongly correlated (Figure 1).
Cancers 2022, 14, x 5 of 14
out to identify relevant interaction terms (“final model”). Hazard ratios (HRs) and sur-vival rates were estimated using the final model. Furthermore, the predictive ability of CA27.29 before and after chemotherapy was compared.
All of the tests were two-sided, and a p value of <0.05 was regarded as statistically significant. Calculations were carried out using R statistical software (V3.0.1, 2013, The R Foundation for Statistical Computing, Vienna, Austria). Remark criteria were used to re-port tumor marker data [29].
3. Results 3.1. Patient Characteristics
In total, 3754 patients were randomly assigned in the SUCCESS-A study. For inclu-sion in the present analysis, patients were required to have serum samples for CA27.29 analysis at the time of study inclusion and after chemotherapy (n = 2687). Complete infor-mation on all variables as listed in Table 1 was available for 98.2% of these patients. The percentage of values missing for each variable was less than 0.5%, with the exception of HER2 (1.5%). The characteristics of the patients are shown in Table 1. CA27.29 values be-fore and after chemotherapy were strongly correlated (Figure 1).
Figure 1. CA27.29 before chemotherapy versus CA27.29 after chemotherapy. Outliers were trun-cated at 50 U/mL.
3.2. Prediction of Disease-Free Survival CA27.29 was significantly associated with disease-free survival additionally to other
predictors (p < 0.000001, first LRT). The effect of CA27.29 on survival differed between patient subgroups (p < 0.001, second LRT). The variable selection process resulted in a final Cox regression model that included, besides the predictors of the reduced model, the interactions of CA27.29 before chemotherapy relative to lymph node status (pN) and tu-mor size (pT). CA27.29 before chemotherapy was nonlinearly associated with survival, with two degrees of freedom, whereas CA27.29 after chemotherapy was best described as a linear predictor.
The expected probability of 5-year survival was calculated for each patient using the final model. Many patients were found to have a high probability of living free of disease for at least five years, whereas only a few patients had a low probability (Figure S1). The
Figure 1. CA27.29 before chemotherapy versus CA27.29 after chemotherapy. Outliers were truncatedat 50 U/mL.
3.2. Prediction of Disease-Free Survival
CA27.29 was significantly associated with disease-free survival additionally to otherpredictors (p < 0.000001, first LRT). The effect of CA27.29 on survival differed betweenpatient subgroups (p < 0.001, second LRT). The variable selection process resulted in afinal Cox regression model that included, besides the predictors of the reduced model, theinteractions of CA27.29 before chemotherapy relative to lymph node status (pN) and tumorsize (pT). CA27.29 before chemotherapy was nonlinearly associated with survival, withtwo degrees of freedom, whereas CA27.29 after chemotherapy was best described as alinear predictor.
The expected probability of 5-year survival was calculated for each patient usingthe final model. Many patients were found to have a high probability of living free ofdisease for at least five years, whereas only a few patients had a low probability (Figure S1).The mean and median probabilities were 85.9% and 88.6%, respectively. One quarter ofall patients had a likelihood less than 82.6%, and one quarter had a likelihood greaterthan 92.5%.
Patient subgroups were defined based on the two predictors pN and pT. pN0 is definedas no cancer cells in any nearby nodes and pN+ as the presence of cancer cells in lymphnodes. pT1 means that the tumor is 2 cm across or less, pT2 means that the tumor size ismore than 2 cm but no more than 5 cm, and pT3/4 means that the tumor is bigger than5 cm or of any size growing into the chest wall or skin. No association of CA27.29 beforechemotherapy with survival was observed in patients with lymph node-negative tumors(Table 2 and Figure 2a).
Cancers 2022, 14, 1721 6 of 13
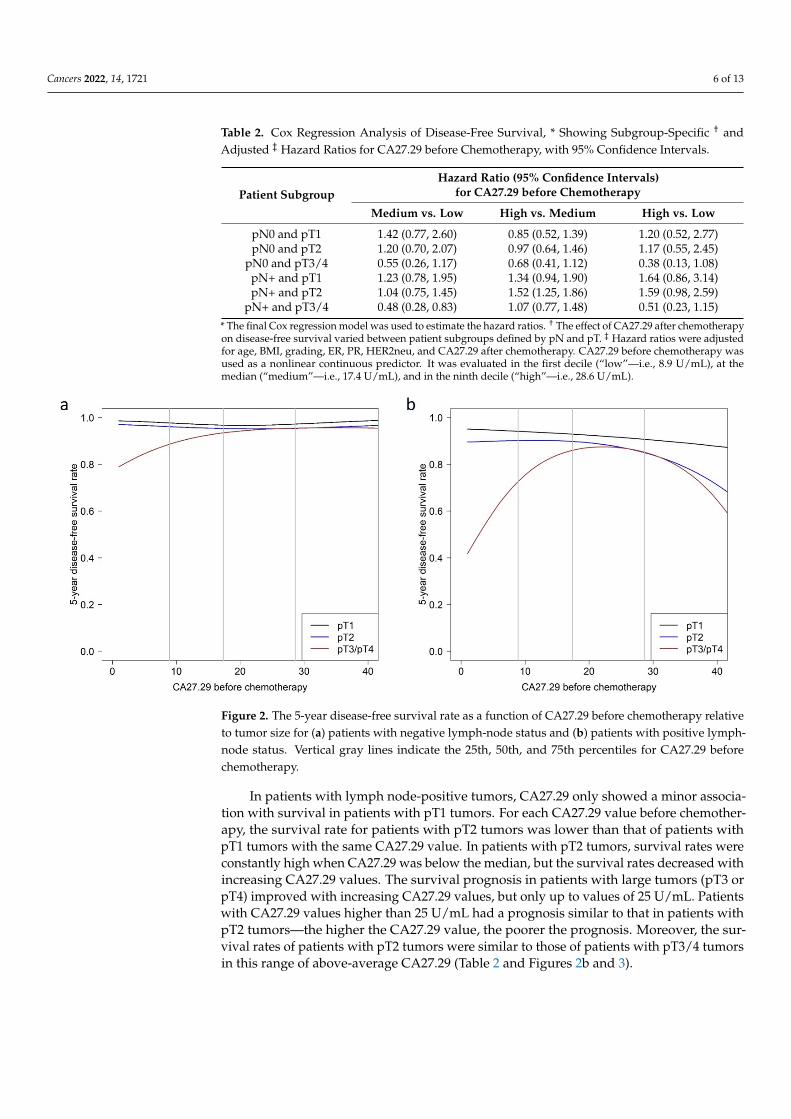
Table 2. Cox Regression Analysis of Disease-Free Survival, * Showing Subgroup-Specific † andAdjusted ‡ Hazard Ratios for CA27.29 before Chemotherapy, with 95% Confidence Intervals.
Patient SubgroupHazard Ratio (95% Confidence Intervals)
for CA27.29 before Chemotherapy
Medium vs. Low High vs. Medium High vs. Low
pN0 and pT1 1.42 (0.77, 2.60) 0.85 (0.52, 1.39) 1.20 (0.52, 2.77)pN0 and pT2 1.20 (0.70, 2.07) 0.97 (0.64, 1.46) 1.17 (0.55, 2.45)
pN0 and pT3/4 0.55 (0.26, 1.17) 0.68 (0.41, 1.12) 0.38 (0.13, 1.08)pN+ and pT1 1.23 (0.78, 1.95) 1.34 (0.94, 1.90) 1.64 (0.86, 3.14)pN+ and pT2 1.04 (0.75, 1.45) 1.52 (1.25, 1.86) 1.59 (0.98, 2.59)
pN+ and pT3/4 0.48 (0.28, 0.83) 1.07 (0.77, 1.48) 0.51 (0.23, 1.15)
* The final Cox regression model was used to estimate the hazard ratios. † The effect of CA27.29 after chemotherapyon disease-free survival varied between patient subgroups defined by pN and pT. ‡ Hazard ratios were adjustedfor age, BMI, grading, ER, PR, HER2neu, and CA27.29 after chemotherapy. CA27.29 before chemotherapy wasused as a nonlinear continuous predictor. It was evaluated in the first decile (“low”—i.e., 8.9 U/mL), at themedian (“medium”—i.e., 17.4 U/mL), and in the ninth decile (“high”—i.e., 28.6 U/mL).
Cancers 2022, 14, x 6 of 14
mean and median probabilities were 85.9% and 88.6%, respectively. One quarter of all patients had a likelihood less than 82.6%, and one quarter had a likelihood greater than 92.5%.
Patient subgroups were defined based on the two predictors pN and pT. pN0 is de-fined as no cancer cells in any nearby nodes and pN+ as the presence of cancer cells in lymph nodes. pT1 means that the tumor is 2 cm across or less, pT2 means that the tumor size is more than 2 cm but no more than 5 cm, and pT3/4 means that the tumor is bigger than 5 cm or of any size growing into the chest wall or skin. No association of CA27.29 before chemotherapy with survival was observed in patients with lymph node-negative tumors (Table 2 and Figure 2a).
Table 2. Cox Regression Analysis of Disease-Free Survival, * Showing Subgroup-Specific † and Ad-justed ‡ Hazard Ratios for CA27.29 before Chemotherapy, with 95% Confidence Intervals.
Patient Subgroup Hazard Ratio (95% Confidence Intervals)
for CA27.29 before Chemotherapy Medium vs. Low High vs. Medium High vs. Low
pN0 and pT1 1.42 (0.77, 2.60) 0.85 (0.52, 1.39) 1.20 (0.52, 2.77) pN0 and pT2 1.20 (0.70, 2.07) 0.97 (0.64, 1.46) 1.17 (0.55, 2.45)
pN0 and pT3/4 0.55 (0.26, 1.17) 0.68 (0.41, 1.12) 0.38 (0.13, 1.08) pN+ and pT1 1.23 (0.78, 1.95) 1.34 (0.94, 1.90) 1.64 (0.86, 3.14) pN+ and pT2 1.04 (0.75, 1.45) 1.52 (1.25, 1.86) 1.59 (0.98, 2.59)
pN+ and pT3/4 0.48 (0.28, 0.83) 1.07 (0.77, 1.48) 0.51 (0.23, 1.15) * The final Cox regression model was used to estimate the hazard ratios. † The effect of CA27.29 after chemotherapy on disease-free survival varied between patient subgroups defined by pN and pT. ‡ Hazard ratios were adjusted for age, BMI, grading, ER, PR, HER2neu, and CA27.29 after chemo-therapy. CA27.29 before chemotherapy was used as a nonlinear continuous predictor. It was eval-uated in the first decile (“low”—i.e., 8.9 U/mL), at the median (“medium”—i.e., 17.4 U/mL), and in the ninth decile (“high”—i.e., 28.6 U/mL).
Figure 2. The 5-year disease-free survival rate as a function of CA27.29 before chemotherapy relative to tumor size for (a) patients with negative lymph-node status and (b) patients with positive lymph-node status. Vertical gray lines indicate the 25th, 50th, and 75th percentiles for CA27.29 before chem-otherapy.
Figure 2. The 5-year disease-free survival rate as a function of CA27.29 before chemotherapy relativeto tumor size for (a) patients with negative lymph-node status and (b) patients with positive lymph-node status. Vertical gray lines indicate the 25th, 50th, and 75th percentiles for CA27.29 beforechemotherapy.
In patients with lymph node-positive tumors, CA27.29 only showed a minor associa-tion with survival in patients with pT1 tumors. For each CA27.29 value before chemother-apy, the survival rate for patients with pT2 tumors was lower than that of patients withpT1 tumors with the same CA27.29 value. In patients with pT2 tumors, survival rates wereconstantly high when CA27.29 was below the median, but the survival rates decreased withincreasing CA27.29 values. The survival prognosis in patients with large tumors (pT3 orpT4) improved with increasing CA27.29 values, but only up to values of 25 U/mL. Patientswith CA27.29 values higher than 25 U/mL had a prognosis similar to that in patients withpT2 tumors—the higher the CA27.29 value, the poorer the prognosis. Moreover, the sur-vival rates of patients with pT2 tumors were similar to those of patients with pT3/4 tumorsin this range of above-average CA27.29 (Table 2 and Figures 2b and 3).

Cancers 2022, 14, 1721 7 of 13
Cancers 2022, 14, x 7 of 14
In patients with lymph node-positive tumors, CA27.29 only showed a minor associ-ation with survival in patients with pT1 tumors. For each CA27.29 value before chemo-therapy, the survival rate for patients with pT2 tumors was lower than that of patients with pT1 tumors with the same CA27.29 value. In patients with pT2 tumors, survival rates were constantly high when CA27.29 was below the median, but the survival rates de-creased with increasing CA27.29 values. The survival prognosis in patients with large tu-mors (pT3 or pT4) improved with increasing CA27.29 values, but only up to values of 25 U/mL. Patients with CA27.29 values higher than 25 U/mL had a prognosis similar to that in patients with pT2 tumors—the higher the CA27.29 value, the poorer the prognosis. Moreover, the survival rates of patients with pT2 tumors were similar to those of patients with pT3/4 tumors in this range of above-average CA27.29 (Table 2 and Figures 2b and 3).
Figure 3. Kaplan–Meier curves for disease-free survival relative to pT and CA27.29 before chemo-therapy grouped into three almost equal categories (“low”, <10; “intermediate,” from 10 to 26; “high”, 26 or more) in lymph node-positive patients.
No association between CA27.29 after chemotherapy and the disease-free survival was found. The adjusted HR per 10 U/mL increase of CA27.29 was 0.95 (95% CI, 0.83–1.10).
In summary, a “high-risk patient” is a patient with a lymph-node positive tumor with at least pT2 and high CA27.29 values before chemotherapy or pT3/4 and low or high but not intermediate CA27.29 values before chemotherapy. The survival prognosis is further increased or decreased, respectively, by histology, grading, ER, PR, and HER status. For instance, a patient with a tumor classified as T2, G3, ER+, PR+, and HER− is predicted to have a 5-year disease-free survival with a likelihood of 85% if the preoperative CA27.29 level was low and a likelihood of 75% if the preoperative CA27.29 was high. Table 3 shows the predicted 5-year survival rates obtained from the final model.
Figure 3. Kaplan–Meier curves for disease-free survival relative to pT and CA27.29 before chemother-apy grouped into three almost equal categories (“low”, <10; “intermediate,” from 10 to 26; “high”,26 or more) in lymph node-positive patients.
No association between CA27.29 after chemotherapy and the disease-free survivalwas found. The adjusted HR per 10 U/mL increase of CA27.29 was 0.95 (95% CI, 0.83–1.10).
In summary, a “high-risk patient” is a patient with a lymph-node positive tumorwith at least pT2 and high CA27.29 values before chemotherapy or pT3/4 and low orhigh but not intermediate CA27.29 values before chemotherapy. The survival prognosisis further increased or decreased, respectively, by histology, grading, ER, PR, and HERstatus. For instance, a patient with a tumor classified as T2, G3, ER+, PR+, and HER− ispredicted to have a 5-year disease-free survival with a likelihood of 85% if the preoperativeCA27.29 level was low and a likelihood of 75% if the preoperative CA27.29 was high.Table 3 shows the predicted 5-year survival rates obtained from the final model.
Table 3. Predicted 5-Year Disease-Free Survival Rates Relative to Patient Subgroups *.
Characteristic
5-Year Survival Rate (95% Confidence Intervals)
Low †
CA27.29 beforeChemotherapy
MediumCA27.29 beforeChemotherapy
HighCA27.29 beforeChemotherapy
Age ‡
Low 0.89 (0.85, 0.93) 0.89 (0.86, 0.92) 0.84 (0.79, 0.89)Medium 0.90 (0.87, 0.94) 0.90 (0.87, 0.92) 0.85 (0.81, 0.89)
High 0.91 (0.88, 0.94) 0.91 (0.88, 0.93) 0.86 (0.82, 0.91)
BMILow 0.90 (0.87, 0.94) 0.90 (0.87, 0.93) 0.85 (0.81, 0.90)
Medium 0.90 (0.87, 0.94) 0.90 (0.87, 0.92) 0.85 (0.81, 0.89)High 0.90 (0.87, 0.94) 0.90 (0.87, 0.92) 0.85 (0.80, 0.90)
pTpT1 0.94 (0.92, 0.97) 0.93 (0.91, 0.95) 0.91 (0.87, 0.94)pT2 0.90 (0.87, 0.94) 0.90 (0.87, 0.92) 0.85 (0.81, 0.89)
pT3/4 0.73 (0.61, 0.87) 0.86 (0.80, 0.92) 0.85 (0.78, 0.93)

Cancers 2022, 14, 1721 8 of 13
Table 3. Cont.
Characteristic
5-Year Survival Rate (95% Confidence Intervals)
Low †
CA27.29 beforeChemotherapy
MediumCA27.29 beforeChemotherapy
HighCA27.29 beforeChemotherapy
pNpN0 0.96 (0.94, 0.98) 0.95 (0.94, 0.97) 0.95 (0.93, 0.98)pN+ 0.90 (0.87, 0.94) 0.90 (0.87, 0.92) 0.85 (0.81, 0.89)
HistologyDuctal 0.90 (0.87, 0.94) 0.90 (0.87, 0.92) 0.85 (0.81, 0.89)
Lobular 0.88 (0.83, 0.93) 0.87 (0.83, 0.91) 0.81 (0.75, 0.88)Other 0.93 (0.88, 0.97) 0.92 (0.88, 0.96) 0.89 (0.83, 0.95)
GradingG1 0.94 (0.92, 0.97) 0.94 (0.92, 0.96) 0.91 (0.88, 0.95)G2 0.90 (0.87, 0.94) 0.90 (0.87, 0.92) 0.85 (0.81, 0.89)G3 0.84 (0.78, 0.89) 0.83 (0.79, 0.87) 0.75 (0.69, 0.83)
ERER− 0.86 (0.80, 0.92) 0.86 (0.81, 0.91) 0.79 (0.72, 0.87)ER+ 0.90 (0.87, 0.94) 0.90 (0.87, 0.92) 0.85 (0.81, 0.89)PR
PR− 0.84 (0.78, 0.91) 0.84 (0.79, 0.89) 0.76 (0.69, 0.85)PR+ 0.90 (0.87, 0.94) 0.90 (0.87, 0.92) 0.85 (0.81, 0.89)
HER2HER2− 0.90 (0.87, 0.94) 0.90 (0.87, 0.92) 0.85 (0.81, 0.89)HER2+ 0.93 (0.90, 0.96) 0.93 (0.90, 0.95) 0.89 (0.85, 0.93)
CA27.29 after chemotherapy
Low 0.90 (0.86, 0.93) 0.89 (0.86, 0.92) 0.84 (0.79, 0.90)Medium 0.90 (0.87, 0.94) 0.90 (0.87, 0.92) 0.85 (0.81, 0.89)
High 0.91 (0.87, 0.95) 0.91 (0.88, 0.93) 0.86 (0.82, 0.90)* The final Cox regression model was used to estimate survival rates. Survival rates were estimated for a fictivepatient belonging to a specific subgroup but is average with regard to all other characteristics. An “averagepatient” is considered to be a patient of median age, median BMI, and median CA27.29 after chemotherapy,with the most frequent characteristics (pT2, ductal, G2, ER+, PR+, HER2−). † CA27.29 before chemotherapywas used as a nonlinear continuous predictor. It was evaluated in the first decile (“low”—i.e., 8.9 U/mL), at themedian (“medium”—i.e., 17.4 U/mL), and in the ninth decile (“high”—i.e., 28.6 U/mL). ‡ Age, BMI, and CA27.29after chemotherapy were used as linear predictors. They were evaluated in the first decile (“low”—i.e., 39 years,20.6 kg/m2, or 11.7 U/mL), at the median (“medium”—i.e., 53 years and 25.8 kg/m2, or 21.6 U/mL), and in theninth decile (“high”—i.e., 67 years, 32.9 kg/m2, or 37.0 U/mL).
Both the full and final models performed better than the basic model without CA27.29predictors with regard to distinguishing between patients with and without events up totwo and five years of follow-up, respectively (Supplementary Table S2, cross-validatedAUC). The full model, however, performed better than the final model; the difference in thecross-validated AUC was 0.041 at two years and 0.06 at five years, implying a certain jointinfluence of predictors that are poorly predictive on their own. A comparison between theapparent and cross-validated AUC shows that the final model was less overfitted than thefull model. The addition of CA27.29 before chemotherapy to the basic model improvedprediction, whereas the addition of CA27.29 after chemotherapy did not, confirming theresults of the main analysis.
4. Discussion
This study showed that CA27.29 after surgery but before chemotherapy providesprognostic information additional to that available with commonly known prognosticfactors. CA27.29 after chemotherapy did not add any prognostic information in additionto commonly known prognostic factors and CA27.29 before chemotherapy. The impact of

Cancers 2022, 14, 1721 9 of 13
CA27.29 differed relative to tumor size and nodal status—mainly confining the associationof CA27.29 and prognosis to node-positive patients.
In this setting, serial use of CA27.29 did not increase its usefulness as a biomarker.However, there have been several reports in which it was not a single, static soluble MUC1value that was used for prognostic or predictive purposes, but rather serial measurementswith adjustment of later values by the earlier ones [19,30–40]. There are several poten-tial reasons why the two values in the present study were not superior to the one beforechemotherapy alone. Firstly, the two assessments were highly correlated (Figure 1). Sec-ondly, the values after chemotherapy may reflect a baseline value for MUC1 rather thanan activity marker for the disease [30], assuming that at the second time point, the timeinterval is long enough to exclude any influence of the primary disease on the MUC1 value,and the likelihood of recurrence is rather low. The prognostic information provided byCA27.29 after chemotherapy may therefore be rather low.
Before chemotherapy, two interactions were observed: one between tumor size andCA27.29, and one between nodal status and CA27.29. Patients with a negative nodal statushad an excellent prognosis. However, no association between CA27.29 and the prognosiswas observed. This might be due to general better prognosis of node-negative BC patientsresulting in less impact of CA27.29 levels [41,42].
An effect of CA27.29 on the prognosis was seen in node-positive patients, with theexception of patients with advanced tumor stages (pT3/4). In the latter, low CA27.29 valueswere associated with an unfavorable prognosis. Interactions between molecular subtypeswere not analyzed since the assumptions for the proportional hazard function were notmet and there was a strong correlation between ER and PR. Several larger studies havereported associations between tumor size, nodal status, and MUC1 [7,9,12,17]. Patientswith larger tumors and positive lymph-node status had higher preoperative MUC1 values.Postoperative values were assessed in only one of these studies [15], but no associationbetween tumor size, nodal status and CA15-3 was reported. In the present study, therewas an association between tumor size and postoperative/before chemotherapy CA27.29values, but not with nodal status, a finding that was also reported by Rack et al. [43].
Only one study has investigated the association of postoperative MUC1 assessmentsin relation to other prognostic factors (tumor size, lymph-node status, histological grading,and hormone receptor status) [15]. Carcinoembryonic antigen as well as CA15-3 wasincluded but did not have a prognostic effect in the multivariable model. The study alsofound that postoperative values differ from preoperative ones [15]. Approximately 18%of all patients had a decrease in CA15-3 values of more than 33%. The decrease was evenmore prominent in node-positive patients [15]. This might be an indication that MUC1plays a different role in node-positive patients than in node-negative ones, but it might alsobe due to the fact that node-negative patients do not have elevated MUC1 levels initiallyand can therefore not achieve a decrease after surgery that easily.
MUC1 has been widely discussed as a prognostic biomarker and potential target foranticancer treatment [44,45]. In addition to this, however, MUC1 has been linked to immuneregulatory mechanisms such as protection from infections, regulation of inflammatoryresponse and, in particular, its ability to function as a T cell regulator and checkpointmolecule [46–49]. With respect to the latter, co-stimulatory and co-inhibitory abilitiesare discussed, which might influence the activity of regulatory T cells, but also CD4+ orCD8+ cells in general [47,48]. Thus, the association of low CA27.29 values and poorprognosis of node-positive patients with advanced tumor stage (pT3/4) might be dueto the loss of the MUC1-regulated immune response. A lack of co-stimulatory and co-inhibitory MUC1 activities might particularly impact patients with advanced tumor stageand cancer-affected lymph nodes. Thus, for future studies, it could be of interest to evaluatethe proliferation, differentiation, and activation of circulating immune cells in addition toCA27.29 values [49].
MUC1 has been prioritized as a promising target for anticancer therapies [44,45].Vaccination strategies appear to be of particular interest, as MUC1 is overexpressed in

Cancers 2022, 14, 1721 10 of 13
BC and other cancer histologies and has been reported to have a high level of immuno-genicity [45,50]. The present study shows that node-negative patients may not be ideal foran anti-MUC1 therapeutic study. Patients should potentially be node-positive with highMUC1 serum levels to derive benefit.
This study has several strengths and weaknesses. It is the first large-scale study inwhich samples have been analyzed in a multicenter prospective phase III chemotherapyinvestigation. CA27.29 was assessed centrally, ensuring high-quality data and standardizedanalytic methods. It therefore appears to be justifiable to generalize the results, althoughthe study was restricted to a high-risk group undergoing chemotherapy. While the overallsample size was reasonably high with more than 2600 patients, the unfavorable prognosticeffect in patients with pT3/4 and low CA27.29 may be imprecise due the small sample sizefor that specific patient group.
5. Conclusions
In conclusion, this study did not show additional prognostic value for serial CA27.29assessment before and after chemotherapy alongside commonly used prognostic factorsand postoperative CA27.29 measurements. In combination with tumor size and nodalstatus, as well as other prognostic factors, however, serial CA27.29 measurements canidentify patients with an unfavorable prognosis. This patient population may be suitablefor further anti-MUC1 treatment after standard therapies.
Supplementary Materials: The following supporting information can be downloaded at: https://www.mdpi.com/article/10.3390/cancers14071721/s1, Figure S1: Distribution of the predicted5-year disease-free survival probability (0–100%) in the study population (n = 2687); Table S1: FullInclusion and Exclusion Criteria; Table S2: Performance of Cox Regression Models [23–28].
Author Contributions: Conceptualization, V.M., A.S., H.T., T.N.F., M.W.B., P.A.F., W.J. and B.R.; datacuration, L.H.; formal analysis, H.H., L.H., V.M., I.S., H.F., V.F., I.B., S.M., J.J., N.N., A.S., H.T., S.Y.B.,J.-U.B., T.N.F., G.H. and M.R.; investigation, R.L., H.F., V.F., F.S., I.B., S.M., J.J., N.N., S.Y.B., J.-U.B.,G.H. and M.R.; methodology, P.A.F.; project administration, F.S.; resources, I.S., R.L., I.B., A.S., T.N.F.,M.W.B. and B.R.; supervision, P.A.F., W.J. and B.R.; visualization, H.H. and L.H.; writing—originaldraft, H.H., L.H. and P.A.F.; writing—review & editing, V.M., I.S., R.L., H.F., V.F., F.S., I.B., S.M.,J.J., N.N., A.S., H.T., S.Y.B., J.-U.B., T.N.F., G.H., M.R., M.W.B., W.J. and B.R. All authors revised themanuscript critically for important intellectual content. All authors have approved the submittedversion and have agreed both to be personally accountable for the author’s own contributions andto ensure that questions related to the accuracy or integrity of any part of the work, even ones inwhich the author was not personally involved, are appropriately investigated, resolved, and theresolution documented in the literature. All authors have read and agreed to the published versionof the manuscript.
Funding: SUCCESS-A was in part supported by grants from Novartis, AstraZeneca, Chugai, Sanofi-Aventis, and Lilly. The study was investigator-initiated and investigator-led, and the bodies providingfinancial support played no part in the study design, data collection, data analysis, data interpretation,or writing of the report. The authors had full access to all of the data and had final responsibility forthe decision to submit for publication. We acknowledge financial support by Deutsche Forschungsge-meinschaft and Friedrich-Alexander-Universität Erlangen-Nürnberg within the funding programme“Open Access Publication Funding”.
Institutional Review Board Statement: The study was conducted in accordance with the Declarationof Helsinki and was approved by the Institutional the ethical board of the Ludwig-Maximilian-University of Munich (Project Nr. 076-05).
Informed Consent Statement: Informed consent was obtained from all subjects involved in the study.
Data Availability Statement: The datasets used and analyzed during the current study are availablefrom the corresponding author on reasonable request. The data are not publicly available due toethical restrictions.
Acknowledgments: We would like to thank all patients and the staff involved in the study at theparticipating study sites.

Cancers 2022, 14, 1721 11 of 13
Conflicts of Interest: P.A.F.: honoraria from Novartis, Amgen, Pfizer, Celgene, Roche, Puma. V.M.:received speaker honoraria from Amgen, Astra Zeneca, Celgene, Daiichi-Sankyo, Eisai, Pfizer, MSD,Novartis, Roche, Teva, and consultancy honoraria from Genomic Health, Hexal, Roche, Pierre Fabre,Amgen, ClinSol, Novartis, MSD, Daiichi-Sankyo, Eisai, Lilly, Tesaro and Nektar. Institutional researchsupport from Novartis, Roche, Seattle Genetics, Genentech. A.S.: honoraria from Roche, Celgene.H.T.: honoraria from Novartis, Roche, AMGEN, Pfizer, Astra Zeneca, Eisai, MSD, Lilly. S.M. hasreceived research support, advisory board, honoraria and travel expenses from AbbVie, AstraZeneca,Clovis, Eisai, GlaxoSmithKline, Medac, MSD, Novartis, Olympus, PharmaMar, Roche, Sensor Kinesis,Teva, Tesaro. S.Y.B.’s honoraria from Novartis, Pfizer, Roche, MSD, Teva. J.-U.B.: honoraria fromRoche, Novartis, Pfizer, AstraZeneca and MSD. M.W.B.’s institution conducts research with fundingfrom Novartis, Pfizer. W.J.: Sanofi-Aventis, Novartis, Pfizer. B.R.: honoraria from AstraZeneca,Chugai, Lilly, Novartis, Sanofi-Aventis, Janssen-Cilag. N.N.: is currently an employee of Novartisand has received travel support from Novartis and TEVA in the past. F.S.: Speaker honoraria fromRoche, Novartis, Pfizer, GSK, AstraZenica und Clovis. Travel expenses: Lilly, Pfizer, Roche, Novartis.All other authors have no conflict of interest.
Abbreviations
AE Adverse eventANC Absolute neutrophil countBC Breast cancerBMI Body mass indexCI Confidence intervalCMF Cyclophosphamide, methotrexate and fluorouracilCTC Circulating tumor cellsDFS Disease-free survivalDoc DocetaxelER Estrogen receptorFEC 5-fluoroucacil, epirubicin and cyclophosphamide5-FU 5-fluorouracilG-CSF Granulocyte-colony stimulating factorGem GemcitabineHER2 Human epidermal growth factor receptor 2HR Hazard ratioHRS Hormone receptor statusMAPK Mitogen-activated protein kinaseMUC1-C Carboxy-terminal transmembrane subunitMUC1-N Amino-terminal extracellular subunitNFκB Nuclear factor kappa BOS Overall survivalPI3K Phosphatidylinositol-3′-kinasePR Progesterone receptorSGPT Serum glutamate pyruvate transaminase
References1. Hartkopf, A.D.; Muller, V.; Wockel, A.; Lux, M.P.; Janni, W.; Ettl, J.; Belleville, E.; Schutz, F.; Fasching, P.A.; Kolberg, H.C.;
et al. Translational Highlights in Breast and Ovarian Cancer 2019—Immunotherapy, DNA Repair, PI3K Inhibition and CDK4/6Therapy. Geburtshilfe Frauenheilkd 2019, 79, 1309–1319. [CrossRef] [PubMed]
2. Duffy, M.J.; Evoy, D.; McDermott, E.W. CA 15-3: Uses and limitation as a biomarker for breast cancer. Clin. Chim. Acta 2010, 411,1869–1874. [CrossRef] [PubMed]
3. Kufe, D.W. MUC1-C oncoprotein as a target in breast cancer: Activation of signaling pathways and therapeutic approaches.Oncogene 2013, 32, 1073–1081. [CrossRef] [PubMed]
4. Shao, Y.; Sun, X.; He, Y.; Liu, C.; Liu, H. Elevated Levels of Serum Tumor Markers CEA and CA15-3 Are Prognostic Parametersfor Different Molecular Subtypes of Breast Cancer. PLoS ONE 2015, 10, e0133830. [CrossRef] [PubMed]
5. Wu, S.G.; He, Z.Y.; Zhou, J.; Sun, J.Y.; Li, F.Y.; Lin, Q.; Guo, L.; Lin, H.X. Serum levels of CEA and CA15-3 in different molecularsubtypes and prognostic value in Chinese breast cancer. Breast 2014, 23, 88–93. [CrossRef] [PubMed]
6. Li, H.; Chen, K.; Su, F.; Song, E.; Gong, C. Preoperative CA 15-3 levels predict the prognosis of nonmetastatic luminal A breastcancer. J. Surg. Res. 2014, 189, 48–56. [CrossRef]

Cancers 2022, 14, 1721 12 of 13
7. Lee, J.S.; Park, S.; Park, J.M.; Cho, J.H.; Kim, S.I.; Park, B.W. Elevated levels of preoperative CA 15-3 and CEA serum levels haveindependently poor prognostic significance in breast cancer. Ann. Oncol. 2013, 24, 1225–1231. [CrossRef]
8. Ali, H.Q.; Mahdi, N.K.; Al-Jowher, M.H. The value of CA15-3 in diagnosis, prognosis and treatment response in women withbreast cancer. JPMA J. Pak. Med. Assoc. 2013, 63, 1138–1141.
9. Sandri, M.T.; Salvatici, M.; Botteri, E.; Passerini, R.; Zorzino, L.; Rotmensz, N.; Luini, A.; Mauro, C.; Bagnardi, V.; Cassatella,M.C.; et al. Prognostic role of CA15.3 in 7942 patients with operable breast cancer. Breast Cancer Res. Treat. 2012, 132, 317–326.[CrossRef]
10. Molina, R.; Auge, J.M.; Farrus, B.; Zanon, G.; Pahisa, J.; Munoz, M.; Torne, A.; Filella, X.; Escudero, J.M.; Fernandez, P.; et al.Prospective evaluation of carcinoembryonic antigen (CEA) and carbohydrate antigen 15.3 (CA 15.3) in patients with primarylocoregional breast cancer. Clin. Chem. 2010, 56, 1148–1157. [CrossRef]
11. Lumachi, F.; Basso, S.M.; Bonamini, M.; Marzano, B.; Milan, E.; Waclaw, B.U.; Chiara, G.B. Relationship between preoperativeserum markers CA 15-3 and CEA and relapse of the disease in elderly (>65 years) women with breast cancer. Anticancer Res. 2010,30, 2331–2334. [PubMed]
12. Duffy, M.J.; Duggan, C.; Keane, R.; Hill, A.D.; McDermott, E.; Crown, J.; O’Higgins, N. High preoperative CA 15-3 concentrationspredict adverse outcome in node-negative and node-positive breast cancer: Study of 600 patients with histologically confirmedbreast cancer. Clin. Chem. 2004, 50, 559–563. [CrossRef] [PubMed]
13. Kumpulainen, E.J.; Keskikuru, R.J.; Johansson, R.T. Serum tumor marker CA 15.3 and stage are the two most powerful predictorsof survival in primary breast cancer. Breast Cancer Res. Treat. 2002, 76, 95–102. [CrossRef] [PubMed]
14. Gion, M.; Boracchi, P.; Dittadi, R.; Biganzoli, E.; Peloso, L.; Mione, R.; Gatti, C.; Paccagnella, A.; Marubini, E. Prognostic role ofserum CA15.3 in 362 node-negative breast cancers. An old player for a new game. Eur. J. Cancer 2002, 38, 1181–1188. [CrossRef]
15. Ebeling, F.G.; Stieber, P.; Untch, M.; Nagel, D.; Konecny, G.E.; Schmitt, U.M.; Fateh-Moghadam, A.; Seidel, D. Serum CEA and CA15-3 as prognostic factors in primary breast cancer. Br. J. Cancer 2002, 86, 1217–1222. [CrossRef] [PubMed]
16. Canizares, F.; Sola, J.; Perez, M.; Tovar, I.; De Las Heras, M.; Salinas, J.; Penafiel, R.; Martinez, P. Preoperative values of CA15-3 and CEA as prognostic factors in breast cancer: A multivariate analysis. Tumour Biol. 2001, 22, 273–281.
17. Shering, S.G.; Sherry, F.; McDermott, E.W.; O’Higgins, N.J.; Duffy, M.J. Preoperative CA 15-3 concentrations predict outcome ofpatients with breast carcinoma. Cancer 1998, 83, 2521–2527. [CrossRef]
18. Molina, R.; Jo, J.; Filella, X.; Zanon, G.; Pahisa, J.; Munoz, M.; Farrus, B.; Latre, M.L.; Escriche, C.; Estape, J.; et al. c-erbB-2oncoprotein, CEA, and CA 15.3 in patients with breast cancer: Prognostic value. Breast Cancer Res. Treat. 1998, 51, 109–119.[CrossRef]
19. Di Gioia, D.; Heinemann, V.; Nagel, D.; Untch, M.; Kahlert, S.; Bauerfeind, I.; Koehnke, T.; Stieber, P. Kinetics of CEA and CA15-3correlate with treatment response in patients undergoing chemotherapy for metastatic breast cancer (MBC). Tumour Biol. 2011, 32,777–785. [CrossRef]
20. Laessig, D.; Nagel, D.; Heinemann, V.; Untch, M.; Kahlert, S.; Bauerfeind, I.; Stieber, P. Importance of CEA and CA 15-3 duringdisease progression in metastatic breast cancer patients. Anticancer Res. 2007, 27, 1963–1968.
21. de Gregorio, A.; Haberle, L.; Fasching, P.A.; Muller, V.; Schrader, I.; Lorenz, R.; Forstbauer, H.; Friedl, T.W.P.; Bauer, E.; de Gregorio,N.; et al. Gemcitabine as adjuvant chemotherapy in patients with high-risk early breast cancer-results from the randomized phaseIII SUCCESS-A trial. Breast Cancer Res. 2020, 22, 111. [CrossRef] [PubMed]
22. von Minckwitz, G.; Arnold, N.; Denkert, C.; Dittmer, J.; Fehm, T.; Harbeck, N.; Janni, W.; Meinhold-Heerlein, I.; Muller, V.; Pantel,K.; et al. Preservation of Biomaterials for translational research in current breast cancer studies: Review and recommendations.Geburtshilfe Frauenheilkd 2007, 67, 451–459. [CrossRef]
23. Salmen, J.; Neugebauer, J.; Fasching, P.A.; Haeberle, L.; Huober, J.; Wockel, A.; Rauh, C.; Schuetz, F.; Weissenbacher, T.; Kost, B.;et al. Pooled analysis of the prognostic relevance of progesterone receptor status in five German cohort studies. Breast Cancer Res.Treat. 2014, 148, 143–151. [CrossRef] [PubMed]
24. Hastie, T.; Tibshirani, R. Generalized additive models for medical research. Stat. Methods Med. Res. 1995, 4, 187–196. [CrossRef][PubMed]
25. Ripatti, S.; Palmgren, J. Estimation of multivariate frailty models using penalized partial likelihood. Biometrics 2000, 56, 1016–1022.[CrossRef]
26. Grambsch, P.M.; Therneau, T.M. Proportional Hazards Tests and Diagnostics Based on Weighted Residuals. Biometrika 1994, 81,515–526. [CrossRef]
27. Ware, J.H. The limitations of risk factors as prognostic tools. N. Engl. J. Med. 2006, 355, 2615–2617. [CrossRef]28. Uno, H.; Cai, T.X.; Tian, L.; Wei, L.J. Evaluating prediction rules for t-year survivors with censored regression models. J. Am. Stat.
Assoc. 2007, 102, 527–537. [CrossRef]29. McShane, L.M.; Altman, D.G.; Sauerbrei, W.; Taube, S.E.; Gion, M.; Clark, G.M.; Statistics Subcommittee of the NCI-EORTC
Working Group on Cancer Diagnostics. REporting recommendations for tumour MARKer prognostic studies (REMARK).Br. J. Cancer 2005, 93, 387–391. [CrossRef]
30. Stieber, P.; Nagel, D.; Blankenburg, I.; Heinemann, V.; Untch, M.; Bauerfeind, I.; Di Gioia, D. Diagnostic efficacy of CA 15-3 andCEA in the early detection of metastatic breast cancer-A retrospective analysis of kinetics on 743 breast cancer patients. Clin.Chim. Acta 2015, 448, 228–231. [CrossRef]
Cancers 2022, 14, 1721 13 of 13
31. Pedersen, A.C.; Sorensen, P.D.; Jacobsen, E.H.; Madsen, J.S.; Brandslund, I. Sensitivity of CA 15-3, CEA and serum HER2 in theearly detection of recurrence of breast cancer. Clin. Chem. Lab. Med. 2013, 51, 1511–1519. [CrossRef] [PubMed]
32. Bahrami-Ahmadi, A.; Makarian, F.; Mortazavizadeh, M.R.; Yazdi, M.F.; Chamani, M. Symptomatic metastasis prediction withserial measurements of CA 15.3 in primary breast cancer patients. J. Res. Med. Sci. 2012, 17, 850–854. [PubMed]
33. Bahrami, A.; Mortazavizadeh, M.R.; Yazdi, M.F.; Chamani, M. Serial tumour markers serum carcinoembryonic antigen and cancerantigen 15-3 assays in detecting symptomatic metastasis in breast cancer patients. East. Mediterr. Health J. 2012, 18, 1055–1059.[CrossRef] [PubMed]
34. Evangelista, L.; Baretta, Z.; Vinante, L.; Cervino, A.R.; Gregianin, M.; Ghiotto, C.; Bozza, F.; Saladini, G. Could the serialdetermination of Ca15.3 serum improve the diagnostic accuracy of PET/CT? Results from small population with previous breastcancer. Ann. Nucl. Med. 2011, 25, 469–477. [CrossRef]
35. Wu, S.C.; Chou, F.F.; Rau, K.M. Clinical significance of a serum CA 15-3 surge and the usefulness of CA 15-3 kinetics in monitoringchemotherapy response in patients with metastatic breast cancer. Breast Cancer Res. Treat. 2010, 124, 879–882. [CrossRef]
36. Mariani, L.; Miceli, R.; Michilin, S.; Gion, M. Serial determination of CEA and CA 15.3 in breast cancer follow-up: An assessmentof their diagnostic accuracy for the detection of tumour recurrences. Biomarkers 2009, 14, 130–136. [CrossRef]
37. Kim, H.S.; Park, Y.H.; Park, M.J.; Chang, M.H.; Jun, H.J.; Kim, K.H.; Ahn, J.S.; Kang, W.K.; Park, K.; Im, Y.H. Clinical significanceof a serum CA15-3 surge and the usefulness of CA15-3 kinetics in monitoring chemotherapy response in patients with metastaticbreast cancer. Breast Cancer Res. Treat. 2009, 118, 89–97. [CrossRef]
38. De La Lande, B.; Hacene, K.; Floiras, J.L.; Alatrakchi, N.; Pichon, M.F. Prognostic value of CA 15.3 kinetics for metastatic breastcancer. Int. J. Biol. Markers 2002, 17, 231–238. [CrossRef]
39. Jager, W.; Eibner, K.; Loffler, B.; Gleixner, S.; Kramer, S. Serial CEA and CA 15-3 measurements during follow-up of breast cancerpatients. Anticancer Res. 2000, 20, 5179–5182.
40. Gion, M.; Cappelli, G.; Mione, R.; Pistorello, M.; Meo, S.; Vignati, G.; Fortunato, A.; Saracchini, S.; Biasioli, R.; Giulisano, M.Evaluation of critical differences of CEA and CA 15.3 levels in serial samples from patients operated for breast cancer. Int. J. Biol.Markers 1994, 9, 135–139. [CrossRef]
41. Tang, C.; Wang, P.; Li, X.; Zhao, B.; Yang, H.; Yu, H.; Li, C. Lymph node status have a prognostic impact in breast cancer patientswith distant metastasis. PLoS ONE 2017, 12, e0182953. [CrossRef] [PubMed]
42. Hung, M.; Xu, J.; Nielson, D.; Bounsanga, J.; Gu, Y.; Hansen, A.R.; Voss, M.W. Evaluating the Prediction of Breast Cancer SurvivalUsing Lymph Node Ratio. J. Breast Cancer 2018, 21, 315–320. [CrossRef] [PubMed]
43. Rack, B.; Schindlbeck, C.; Juckstock, J.; Genss, E.M.; Hepp, P.; Lorenz, R.; Tesch, H.; Schneeweiss, A.; Beckmann, M.W.;Lichtenegger, W.; et al. Prevalence of CA 27.29 in primary breast cancer patients before the start of systemic treatment. AnticancerRes. 2010, 30, 1837–1841. [PubMed]
44. Pillai, K.; Pourgholami, M.H.; Chua, T.C.; Morris, D.L. MUC1 as a potential target in anticancer therapies. Am. J. Clin. Oncol. 2015,38, 108–118. [CrossRef] [PubMed]
45. Acres, B.; Limacher, J.M. MUC1 as a target antigen for cancer immunotherapy. Exp. Rev. Vaccines 2005, 4, 493–502. [CrossRef]46. Dhar, P.; McAuley, J. The Role of the Cell Surface Mucin MUC1 as a Barrier to Infection and Regulator of Inflammation. Front.
Cell Infect. Microbiol. 2019, 9, 117. [CrossRef]47. Konowalchuk, J.D.; Agrawal, B. MUC1 mucin is expressed on human T-regulatory cells: Function in both co-stimulation and
co-inhibition. Cell Immunol. 2012, 272, 193–199. [CrossRef]48. Konowalchuk, J.D.; Agrawal, B. MUC1 is a novel costimulatory molecule of human T cells and functions in an AP-1-dependent
manner. Hum. Immunol. 2012, 73, 448–455. [CrossRef]49. Agrawal, B.; Gupta, N.; Konowalchuk, J.D. MUC1 Mucin: A Putative Regulatory (Checkpoint) Molecule of T Cells. Front.
Immunol. 2018, 9, 2391. [CrossRef]50. Hossain, M.K.; Wall, K.A. Immunological Evaluation of Recent MUC1 Glycopeptide Cancer Vaccines. Vaccines 2016, 4, 25.
[CrossRef]