M.Sc. ZOOLOGY LAB MANUAL - Midnapore City College
42
M.Sc. ZOOLOGY LAB MANUAL MIDNAPORE CITY COLLEGE Prepared By Biological Science Dept. Zoology 2nd Semester
-
Upload
khangminh22 -
Category
Documents
-
view
5 -
download
0
Transcript of M.Sc. ZOOLOGY LAB MANUAL - Midnapore City College

M.Sc. ZOOLOGY LAB MANUAL
MIDNAPORE CITY COLLEGE
Prepared By
Biological Science Dept.Zoology
2nd Semester

Zoology Lab Manual Dept. of Biological Science
MIDNAPORE CITY COLLEGE
PREFACE TO THE FIRST EDITION
This is the first edition of Lab Manual for PG Zoology Second Semester. Hope this edition will
help you during practical. This edition mainly tried to cover the whole syllabus. Some hard core
instrument based topic are not present here that will be guided by responsive teachers at the time
of practical.

Dept. of Biological Sciences
MIDNAPORE CITY COLLEGE
ACKNOWLEDGEMENT
We are really thankful to our students, teachers , and non-teaching staffs to make this effort little bit complete.
Mainly thanks to Director and Principal Sir to motivate for making this lab manual.
Zoology Lab Manual

Laboratory Practice Safety Rules
1. Use safety glass when dealing with fire and chemical.
2. Should use front cover clothes during biochemistry practical.
3. Always use hand wash after dissection and any type of chemical use.
4. Carefully handle needles , forceps, microscope and any other dissecting instrument.
Zoology Lab Manual Dept. of Biological Science
MIDNAPORE CITY COLLEGE

Zoology Lab Manual Dept. of Biological Science
MIDNAPORE CITY COLLEGE
CEM-295, Estimation of primary productivity in aquatic ecosystems
INDEX
Sl. No. CONTENT PAGE No.
Estimation of primary productivity in aquatic ecosystems 011.
Determination of the minimum size and number of quadrats –Species area curve method
052.
Quantitative estimation of protein- Lowry method or byFolin-Ciocalteu reagent
103.
Estimation of glucose by dinitrosalicylic acid (dns) reagent 134.
Detection of Reducing Sugar by Benedict’s, Barfoed’s &Fehling’s Reagent
155.
Detection of Amino Acid by Ninhydrin Reaction 186.
Estimation of DNA by Diphenylamine method 207.
CEM-296, Taxonomic Keys
Taxonomic Keys 218.
Principle and Metod of Agarose Gel Electrophoresis 339.
Isolation & Purification of DNA from Tissue 3510.

ZOO 295
Estimation of primary productivity in aquatic ecosystems
Introduction
The primary production in the aquatic ecosystem starts with the synthesis of organic
compounds from the inorganic constituents of water by the activity of plants / phytoplankton
in the presence of sunlight. The inorganic constituents which form the raw material for this
synthesis are water, carbon dioxide, nitrate ions, phosphate ions and various other chemical
substances. The products are mainly carbohydrates and proteins and fats in very small
quantities. Organic production by plants is the first step in tapping energy by living beings
from non-living natural resources and hence called primary productivity.
The method of estimating primary productivity by dark and light bottle method was
introduced by Garder and Gran (1930). In this method, the water samples are incubated for a
certain period in light and dark bottles which are then suspended at the same depths from
where the sample are taken. In light bottles, oxygen is released as a result of photosynthesis
and a part of oxygen is used for community respiration. In the dark bottles, only oxygen
consumption takes place as a result of respiration. The amount of oxygen liberated by
phytoplankton during photosynthesis is considered as a measure of primary production.
Material required
i. BOD bottle (2 light / transparent and 1 dark)
ii. Nylon or Jute ropes
iii. Burettes
iv. Reagents
a. Manganous sulphate solution
b. Alkaline iodide azide solution
c. Sodium thiosulphate
d. Concentrated Sulphuric acid
e. Starch indicator solution
Procedure:
a. Fill three BOD bottles with water sample in round stoppered bottles (1 Light bottle, 1 dark
bottle and 1 control light bottle) avoiding air bubbles.
b. Water sample in the control bottle is immediately fixed by using Winker’s fixatives
c. The dark bottle is wrapped with aluminium foil and kept in a black bag to protect from
light.
d. Use one of the light bottles for estimating the initial dissolved oxygen As control
e. Suspend both light and dark bottles exactly at the depth from where the sample was drawn
are then suspended on to a raft and anchored.
Zoology Lab Manual Dept. of Biological Science
1MIDNAPORE CITY COLLEGE

f. The bottles are normally incubated for a period of 3-4 hrs between dawn to midday or
sunset in the respective depths
g. At the end of incubation period, the bottles are retrieved and fixed with oxygen fixatives.
h. The oxygen content in the sample is determined by using Winkler’s method.
Calculation
Let the initial oxygen level be- IB
Let the final oxygen level in dark bottle be - DB
Let the final oxygen level in light bottle be - LB
Net oxygen production - LB – IB
Oxygen consumed for respiration - IB – DB
Gross production of oxygen - LB – DB
Let ‘t’ be the number of hours of incubation
Therefore, the Primary productivity can be calculated from the formula
LB – DB x 1000 x 0.375
Gross primary productivity = ____________________________ mg C/m3/hour
1.25 x t
LB = IB x 1000 x 0375
Net primary productivity = _____________________________ mg C/m3/hour
1.25 x t
IB – DB x 1000 x 1 x 0.375
Community respiration rate = __________________________ mg C/m3/hour
t
Zoology Lab Manual Dept. of Biological Science
2MIDNAPORE CITY COLLEGE

Estimation of transparency of water Principle:
The turbidity of a body of water is related to the cleanliness of the water. Waters with low
concentrations of total suspended solids (TSS) are clearer and less turbid than those with high
TSS concentrations. Turbidity can be caused by high concentrations of biota such as
phytoplankton, or by loading of abiotic matter such as sediments. Turbidity can be measured
using several methods. The easiest and least expensive method is through the employment of
a Secchi disk. A Secchi disk is an 8-inch diameter disk with alternating black and white
quadrants that is lowered into the water column until it can no longer be seen from the
surface. The point at which the disk disappears is a function of the lake turbidity.
Procedure
1. Slowly lower the Secchi disk into the water on the shady side of the boat until it is no longer visible. Record this depth.
2. Slowly raise the disk until it just becomes visible once again. Record this depth.
3. Average the depths from steps 1 and 2 to get the Secchi depth.
4. This may be repeated for a measurement of precision.
Result
Secchi disklight penetration = (A+B) / 2
A= depth at which secchi disc disappears
B= depth at which secchi disc reappears
Measurement of intensity of light – using Lux meter
Introduction
Accurate and quantifiable measurement of light is essential in creating desired outcomes in practical day to day applications as well as unique applications. From measuring the amount of light in a work space surface to ensuring emergency exits have proper illumination, light measurement and analysis is an important step in ensuring efficiency and safety. To perform these measurements, technicians often make use of lux meters which are specialized devices that measure the intensity of light falling on a surface, or "lux."
Zoology Lab Manual Dept. of Biological Science
3MIDNAPORE CITY COLLEGE

Procedure
Compute for the square of the distance and multiply it by Pi and then by four. The outcome must be a radius identical to the specific space from the source. This calculation is the area of sphere at a particular distance. Divide the light concentration in lumens by the spherical area. The product is the illuminance in foot-candles or lux, depending on whether feet or meters were used. Application of a correction factor is needed if the light reaches the surface at an angle less than 90 degrees. This can be done by multiplying the computed illuminance value by the cosine of the off-axis angle. Applications of Lux meter i) Photography and Video Filming. By measuring the light in luxes, photographers can
adjust their shutter speed and depth of field to get the best picture quality. The device can also be very useful for filming outdoor scenes of television programs or movies as it allows adjustments to make sure scenes filmed in different light levels have a consistent brightness on screen.
ii) Health and Safety regulations : It can be used to check whether the brightness of a room
is enough to meet any rules designed to protect workers from suffering damage to their eyesight. Using a lux meter takes into account the size of the room in a way that simply measuring the intensity of the light source in lumens would not.
iii) Photographic Mesurements; It also measures the photography subject’s
illuminance. When using a lux light meter, the photographer can determine the aperture number and the exposure setting.
Safety Guideline
i. In case of digital Lux meter, it is necessary to replace battery when the meter shows battery low.
ii. The meter should ever not be placed in water deep enough to submerge any part of the upper body of the meter. This will ruin the meter.
iii. Do not store the instrument where temperature or humidity is excessively high.
iv. The measurement points should not be too close to walls or obstructions
v. Daylight should be shielded by blinds or curtains when assessing artificial lighting only
Zoology Lab Manual Dept. of Biological Science
4MIDNAPORE CITY COLLEGE

Determination of the minimum size and number of quadrats – Species area
curve method.
I. Determination of minimum number of quadrats
Requirements:
Metre scale, string, four nails (or quadrat), note book, graph paper, herbarium sheet, cello
tape.
Method:
i. Lay down 20-50 quadrats of definite size at random in the grassland to be studied, make a
list of different plant species (e.g., A-J) present in each quadrat and note down their
botanical names or hypothetic numbers (e.g., A, B, C,…, J) as shown in Table 42. u
ii. With the help of the data available in Table, find out the accumulating total of the number
of species for each quadrat.
iii. Now take a graph paper sheet and plot the number of quadrats on X-axis and the
accumulating total number of species on Y-axis of the graph paper.
Observations and results:
A curve would be obtained. Note carefully that this curve also starts flattening. The point at
which this curve starts flattening up would give us the minimum number of quadrats required
to be laid down in the grassland.
Zoology Lab Manual Dept. of Biological Science
5MIDNAPORE CITY COLLEGE

II. Determination of the minimum size of the quadrat by species area-curve method.
Requirements:
Nails, cord or string, metre scale, hammer, pencil, notebook.
Method:
i. Prepare a L-shaped structure of 1 × 1 metre size in the given area by using 3 nails and
tying them with a cord or string.
ii. Measure 10 cm on one side of the arm L and the same on the other side of L, and prepare
10 x 10 sq. cm area using another set of nails and string. Note the number of species in
this area of 10 x 10 sq. cm.
iii. Increase this area to 20 × 20 sq. cm and note the additional species growing in this area.
iv. Repeat the same procedure for 30 × 30 sq. cm, 40 × 40 sq. cm and so on till 1 × 1 sq.
metre area is covered (Fig. 67) and note the number of additional species every time.
Record the data in the following table:
Zoology Lab Manual Dept. of Biological Science
6MIDNAPORE CITY COLLEGE

v. Prepare a graph using the data recorded in the above table. Size of the quadrats is plotted
on X- axis and the number of species on Y-axis (Fig. 67 B).
Observations:
The curve starts flattening or shows only a steady increase (Fig. 67 B) at one point in the
graph.
Results:
The point of the graph, at which the curve starts flattening or shows only a steady or gradual
increase, indicates the minimum size or minimum area of the quadrat suitable for study.
Study of density, diversity, frequency and abundance of plant community.
Requirements:
i. Metre scale
ii. string
iii. four nails or quadrat
iv. notebook.
A. Frequency
Frequency is the number of sampling units or quadrats in which a given species occurs.
Percentage frequency (%F) can be estimated by the following formula:
B. Density
Density is the number of individuals per unit area and can be calculated by the
following formula:
Zoology Lab Manual Dept. of Biological Science
7MIDNAPORE CITY COLLEGE
C. Abundance:
Abundance is described as the number of individuals per quadrat of occurrence.
Abundance for each species can be calculated by the following formula:
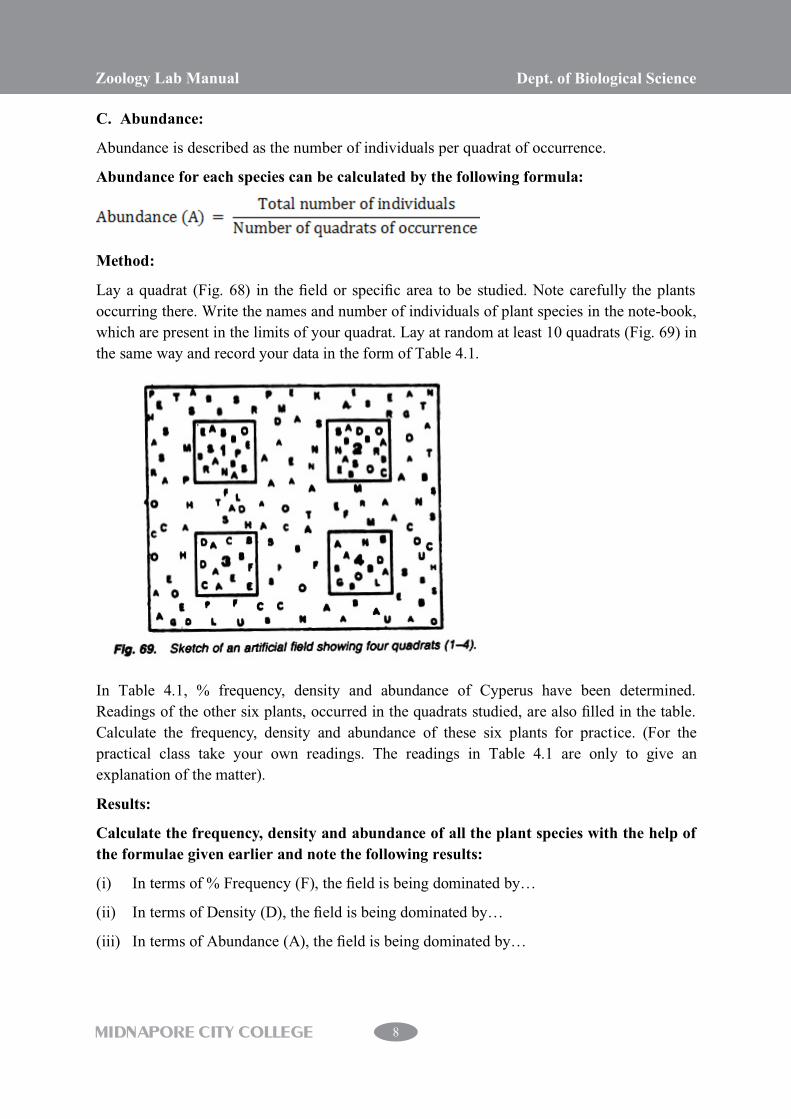
Method:
Lay a quadrat (Fig. 68) in the field or specific area to be studied. Note carefully the plants
occurring there. Write the names and number of individuals of plant species in the note-book,
which are present in the limits of your quadrat. Lay at random at least 10 quadrats (Fig. 69) in
the same way and record your data in the form of Table 4.1.
In Table 4.1, % frequency, density and abundance of Cyperus have been determined.
Readings of the other six plants, occurred in the quadrats studied, are also filled in the table.
Calculate the frequency, density and abundance of these six plants for practice. (For the
practical class take your own readings. The readings in Table 4.1 are only to give an
explanation of the matter).
Results:
Calculate the frequency, density and abundance of all the plant species with the help of
the formulae given earlier and note the following results:
(i) In terms of % Frequency (F), the field is being dominated by…
(ii) In terms of Density (D), the field is being dominated by…
(iii) In terms of Abundance (A), the field is being dominated by…
Zoology Lab Manual Dept. of Biological Science
8MIDNAPORE CITY COLLEGE

Observations:
Table: Size of quadrat: 50cm × 50cm = 2500 cm2
Zoology Lab Manual Dept. of Biological Science
9MIDNAPORE CITY COLLEGE

Biochemistry
Quantitative estimation of protein- Lowry method or by Folin-Ciocalteu
reagent
INTRODUCTION:
Measurement of the quantity of the protein present in the solution is common and
fundamental methods used in all laboratories. Generally these are of two types-
a. Direct spectophotometric method
b. Colorimetric method
Colorimetric method such as Biuret method, Lowery method, Bradford method etc are used
extensively. These are the destructive method of protein analysis because the protein being
measure cannot be recovered after such analysis. In this colorimetric method protein
concentrations are measured by taking absorbance of visible wed length of light.
PRINCIPLE:
The “Lowery or Folin-Ciocalteau method” combines the copper reaction of the biuret method
and the Folin-Ciocalteau reagent which reacts with tyrosine residues in proteins. When
alkaline copper sulphate solution containing Sodium-Potassium Tartarate reacts with a
protein solution, the copper ions forms a co-ordination complex with four NH peptide bond
groups. In addition the phosphor molybdate present in the Folin-Ciocalteau reagent is
reduced by tyrosine and tryptophan (aromatic amino acid) present in the protein, produce a
dark blue/ purple colour complex, with maximum absorbance at 700nm. The intensity of the
colour depends on the amount of these aromatic amino acids present which thus very with the
different proteins present in the test sample.
CHEMICALS:
1. Alkaline sodium carbonate solution(20g/liter NaଶCoଷ in 0.1 mol/ltr NaOH)
2. Copper sulphate sodium patasium tartarare solution(5g/ltr CuS�ସ,5ܪ ଶ in 10g/ltr Na-
K tartarate).
3. Alkaline solution, prepared freshly by using 50ml of solution1 and 1ml of solution 2.
4. Folin-ciocalteau reagent(containing solution of sodium tungstate and sodium
molybolate in phosphoric and hydrochloric acids and it is commercially available).
Diluted the commercially available reagent with an equal of water just before use.
5. Standard sample preparation:- BSA standard solution are prepared by dissolved BSA
in Dܪ ଶ . The concentration of new stock sample is 0.1mg/ml.
6. At first 0.1ml, 0.2ml, 0.3ml, 0.4ml, 0.5ml, 0.6ml, 0.7ml, 0.8ml, 0.9ml of protein
sample is taken in dry test tube from 2nd stock or diluted stock solution of
protein(BSA). Then the volume make upto 1ml by adding distilled water in test tube
and prepared different concentration of protein solution(20, 40, 60, 80�g/ml).
Zoology Lab Manual Dept. of Biological Science
10MIDNAPORE CITY COLLEGE

OTHER REAGENTS:
i. Test tube
ii. Test tube rack
iii. Tissue paper
iv. Graph paper
v. Reagent bottle
vi. Beakers
vii. Measuring cylinders
viii. Posteur pipettes
ix. Notepad
x. Calculator
PROCEDURE:
1. previously prepared BSA stock solutions are used(10�g/ml, 20�g/ml, 30�g/ml,
40�g/ml, 50�g/ml, 60�g/ml, 70�g/ml, 80�g/ml, 90�g/ml).
2. 1ml distilled water is taken in a dry test tube and marked as “Blanked” there is no
protein solution is present.
3. 1ml alkaline solution is added into each and every test tube.
4. Solution are incubated for 15 min at room temperature.
5. 0.1ml Folin reagent is added into each test tube.
6. Next the complete mixture are allowed for incubation at room temperature for 30 min.
This incubation should be in dark.
7. Last the OD are measure in colorimeter a 700nm and graph is plotted based on the OD
value.
Zoology Lab Manual Dept. of Biological Science
11MIDNAPORE CITY COLLEGE

PREPARATION OF BSA STANDARD CURVE:
SAMPLE NO.
BSA CONCENTRATION
(�g)
BSA TAKEN (�l)
DISTILLED WATER
(�l)
OD VALUE
CORRECT OD VALUE
1. 10 100 900 0.07 0.06 2. 20 200 800 0.15 0.14 3. 30 300 700 0.24 0.23 4. 40 400 600 0.28 0.27 5. 50 500 500 0.37 0.36 6. 60 600 400 0.38 0.37 7. 70 700 300 0.51 0.50 8. 80 800 200 0.64 0.63 9. 90 900 100 0.78 0.77
BLANK 0 0 1000 0.01
SAMPLE PROTEIN TAKEN (� )
DISTILLED WATER (� )
OD VALUE CORRECTED OD VALUE
UNKNOWM 400 600 1.06 1.05
CALCULATION: According to the graph the concentration of unknown sample is
158�g/ml.
Zoology Lab Manual Dept. of Biological Science
12MIDNAPORE CITY COLLEGE

Estimation of glucose by dinitrosalicylic acid (dns) reagent
MATERIAL REQUIRES:
· Glucose solution
· DNS solution
· 40% sodium potassium tertarate
· Distilled water
· Beaker, test tube, conical flask, tissue
PROCEDURE:
1. Preparation of standard glucose solution: Dissolve glucose in 100ml Dܪ ଶ .
2. DNS solution preparation: DNS- 1gm in 20ml NaOH solution ܪܦ ଶ 30ml. The NaOH
solution is prepared by dissolving 80mg NaOH in 20ml distilled water.
I. For preparing standard glucose curve of 1st 0.2,0.4,0.6,0.8,0.5,0.6,0.7,0.8,0.9 and
1mg of standard solution is taken in a test tube.
II. Then the total volume of each sample is made upto 1ml by adding �� ଶ is
prepared various concentration of glucose solution.
INTRODUCTION: Carbohydrates are the most abundant class of organic compounds founds in living organisms. Carbohydrates are a major source of metabolic energy transport compound ATP, recognition sites on all source and one of three essential components of DNA and RNA.
Carbohydrates are classified according to their molecular size solubility. Carbohydrates are classified in groups according to the number of individual sample sugar units.
MONOSACCHARIDE: They are the simplest form of sugar and are usually colourless water soluble and crystalline solids. E.G.- glucose, fructose, galactose etc.
DISACCHARIDES: It is formed when two monosaccharide undergo condensation reaction and are water soluble. E.G.- sucrose.
POLYSACCHARIDES: It is formed when two monosaccharide until bound together by glycosidic bond. E.G.- starch, cellulose etc.
PRINCIPLE: 3,5 dinitrosalicylic acid is used extensively in biochemistry for estimation of reducing sugar. It detect the presence of free carboxyl group (C=O) of reducing sugar. This involved the oxidation of the aldehyde function group and the ketone functional group. During this reaction DNS is reduced to 3 amino nitrosalicylic acid which under alkaline conditions is convert to a reddish-brown coloured complex which has an absorbance maximum of 540 nm.
Zoology Lab Manual Dept. of Biological Science
13MIDNAPORE CITY COLLEGE

III. After that 1ml �� ଶ is tahen in a day test tube which is marked as blank.
IV. Next 2ml DNS solution is added in each and every test tube.
V. At last test tube are placed in boiling water both for 10 min.
VI. After that the test tubes are cooled at room temperature.
VII. Then at last the OD value is measured by colorimeter at 540nm.
Working Protocol:
Test tube no
Conc. Of glucose
� /◌
Volume of solution�
Volume of �� ଶ�
Volume of DNS�
Cover the test tube with in aluminium foile or paraffin and heat for 5min
OD value in 580nm
Correct OD value
B - 0 1000 2 0.17 - ଵ 50 100 900 2 0.31 0.14 ଶ 100 200 800 2 0.38 0.21 ଷ 150 300 700 2 0.43 0.26 ସ 200 400 600 2 0.52 0.35 ହ 250 500 500 2 0.56 0.39 � 300 600 400 2 0.62 0.45 � 350 700 300 2 0.65 0.48 400 800 200 2 0.69 0.52 ଽ 450 900 100 2 0.74 0.57
U - 300 700 2 0.53 0.36
CALCULATION : According to the graph the concentration of unknown sample is 205
� /◌ .
Zoology Lab Manual Dept. of Biological Science
14MIDNAPORE CITY COLLEGE

DETECTION OF REDUCING SUGAR BY BENEDICT’S, BARFOED’S &
FEHLING’S REAGENT
MONOSACCHARIDES: All monosaccharides have the molecular formula ܪ�ܥ ଵଶ �,
although they differ in the arrangement of H and OH groups in space (called isomers 1
steroisomers).
DISACCHARIDE: Monosaccharides combined in pairs from disaccharide(sucrose: glucose+ fructose; lactose: glucose+ galactose, maltose: glucose+ glucose). The C-O-C bond that holds monosaccharide in disaccharides are called glycoside bonds which can be broken by hydrolysis. Ex – sucrose, lactose etc.
STARCH POLYSACCHARIDES: often glucose can form long chain polymers called polysaccharide. Cellulose and starch are plant products while glycogen is made by animals, includinf humans. A cellulose molecule (found in wood, cotton etc) consist of a few thousand glucose monomers joined together with every other one inverted relative to the next. REQUIRED REAGENT:
· Barfoed’s reagent · Benedict’s reagent · Fehling’s solution A · Fehling’s solution B · Molisch’s reagent · Seliwanoff’s reagent
MOLISCH’S TEST:
PROCEDURE: Add two drops of 5% solution of α napthol in acohol to about 3ml of
carbohydrate solution. Mix it properly and pour in concentred sulphuric acid down the side of
the test tube so as to form a layer of acid.
OBSERVATION: a purple ring appears in the acid water interface.
O
O O O O
O O O O
O O O O
A carbohydrate is a hydrophilic organic molecule with a 2:1 ratio of hydrogen and oxygen, and a general formula Cx(H₂O)Y,where x and y are whole numbers. In the sugar glucose, for example, x=y=6 and the formula is, therefore C H O Different kinds of carbohydrates along 6 12 6
with their salient, features are tabulated below.
Zoology Lab Manual Dept. of Biological Science
15MIDNAPORE CITY COLLEGE

IODINE TEST:
PROCEDURE: take 3ml of acidified (with dilute HCL) carbohydrate test solution,
containing polysaccharide(10g/ltr), add a few drops of iodine solution (5m mol/ltr in KCL
{30g/ltr}).
OBSERVATION: the solution turned blue or red brown indicating the presence of starch
and glycogen respectively.
FEHLING’S TEST:
PROCEDURE: pour 2ml of carbohydrate test solution (containing reducing sugar) into test
tube. Add 2ml of fehling’s solution (1ml of each fehling’s solution A and B) shake to
components in the test tube gentle and bring to boil.
OBSERVATION: the initial blue colour of the mixture turns green or yellow and finally
brick red precipitate forms. The result indicates presence of reducing sugar.
BENEDICT’S TEST:
PROCEDURE: add 5drop of carbohydrate test solution to 2ml of benedict’s reagent in the
test tube. Place the test tube in a boiling water bath (100°C) for 2-3mints.
OBSERVATION: a red rush brown precipitate of ܥ�ଶ forms indicating the presence of
reducing sugar.
BARFOED TEST:
PROCEDURE: Add about 1ml of carbohydrate test solution to about 3ml of barfoed’s
reagent. Mix thoroughly and boil for 30sec. Allow the mixture to cool.
OBSERVATION: a red precipitate of cuprous oxide indicates of monosaccharides.
SELIWANOFF’S TEST:
PROCEDURE: add 1ml of carbohydrate test sample solution to about 3ml Seliwanoff’s
reagent. Mixed thoroughly and bring to boil. Allow to cool.
OBSERVATION: in the presence of fructose a red colour develops.
HYDROLYSIS:
PROCEDURE: take 2ml of carbohydrates solution in a test tube. Add 1ml of dilute HCL.
Mixed the two solutions thoroughly and boiling neutralize the content of the test tube with
sodium hydrogen carbohydrate ( ܥܪ◌ ଷ). Cheek the pH for neutrality. Now perform all
reducing sugar test.
Zoology Lab Manual Dept. of Biological Science
16MIDNAPORE CITY COLLEGE

UNKNOWN TEST
EXPERIMEMT OBSERVATION INTERFERENCE
Molisch’s Test: in a test tube 3ml of sample is taken. Then 2-3 drops of molisch’s reagent is taken and then conc. ܪ ଶ
◌ ସ taken down side
of the test tube.
A purple ring appear at the junction of two layer
Presence of carbohydrate.
Iodine Test: take 1ml of sample and 2-3 drop of iodine is added.
No colour changed Absence of polysaccharide.
Benedict’s Test: in a test tube 3ml of sample is taken and 3ml of benedict’s reagent is mixed and heated for few mints.
At first yellow and then red or rust brown PPT formed.
Presence of reducing sugar.
Barfoed’s Test: in a test tube 3ml of sample is taken and 3ml of berfoed’s reagent and the heated for 2-3mints.
Red granules of ܥ�ଶ appears the bottom.
Presence of reducing monosaccharide.
Seliwanoff’s Test: in a test tube 1ml of sample is taken and then 3ml of saliwanoff’s reagent taken. Then heated for 2-3 mints and the cool the test tube.
Cherry red colour appear after cooling
Presence of fructose
CONFIRMATIVE TEST:
SELIWANOFF’S TEST: in a test tube 1ml of sample taken then 3ml Seliwanoff’s reagent
and then heated for mint then cool the test tube. After cooling cheery red colour appeared.
Confirmly the unknown solution is fructose.
Zoology Lab Manual Dept. of Biological Science
17MIDNAPORE CITY COLLEGE

DETECTION OF AMINO ACID BY NINHYDRIN REACTION
PRINCIPLE: This test due to a reaction between α-amini group of free amino acid and
ninhydrin. Ninhydrin is a powerful oxidising agent and in its presence amino acid undergo
oxidaticee deamination liberating ammonia, Carbone dioxide a corresponding aldehyde and
reduce form of ninhydrin. The ammonia formed α amino group reacts with ninhydrin and its
reduced product(hydrindantin) to give a blue substance dikito hydrin (Ruhemann’s purple).
However, in case at amino acid like proline, a different product having a bright yellow colour
is formed. Aspargine which has a free product group reacts to give a brown coloured product.
This test is also gives by proteins peptides.
MATERIALS AND REAGENTS:
· Standard solution- this solution made by glycine, the concentration of standard
sample solution is 100µg/ml.
· Ninhydrin reagent- this reagent is made by ninhydrine, ethanol and water.
· Test tube, beaker, conical flaxes, pipettes, tissue paper etc.
· Colorimeter, boiling water bath,
PROCEDURE:
1. Standard solution- stock amino acid is prepared by dissolving amino acid (glycine) in
Dܪ ଶ .
2. Ninhydrin reagent: Ninhydrin is dissolved in ethanol.
I. Al first 0.1ml, 0.15ml, 0.20ml, 0.25ml, 0.3ml, 0.35ml, 0.40ml, 0.425ml, 0.45ml of
glycine solution is taken in dry test tube.
II. Then the total volume of each sample is made upto 0.5ml by adding Dܪ ଶ and
prepared various concentration (40, 50, 60, 70, 80, 825, 85, 87.5 µg/ml) at
glycine.
III. After that Dܪ ଶ of 0.5ml taken in a dry test tube which is named as blank.
IV. Next 4ml of ninhydrin solution is added with each test tube.
V. Unknown sample is prepared by some process. In this solution the unknown
sample volume is 0.02ml and rest volume made upto 5ml by adding 0.48ml
Dܪ ଶ .
VI. After that test tube are cooled at room temperature.
VII. At last the OD value is measured by colorimeter at 580nm.
Zoology Lab Manual Dept. of Biological Science
18MIDNAPORE CITY COLLEGE

WORKING PROTOCAL:
Test tube no
Conc of glycine (µg/ml)
Volume of std solution (ml)
Volume of Dܪ ଶ (ml)
Volume of ninhydrin reagent (ml)
Incubation in water both for 10-15 mints
OD value of 580 nm
Corre-cted OD value
B 0 0 0.5 4 0.01 - ଵ 40 0.1 0.4 4 0.11 0.1 ଶ 50 0.15 0.35 4 0.13 0.12 ଷ 60 0.2 0.3 4 0.16 0.15 ସ 70 0.25 0.25 4 0.17 0.16 ହ 80 0.3 0.2 4 0.2 0.19 � 90 0.35 0.15 4 0.25 0.24 � 100 0.4 0.1 4 0.29 0.28 150 0.45 0.05 4 0.56 0.55
U - 0.02 0.48 4 1.09 1.08
CALCULATION: unknown sample’s concentration is calculated by the graph. Unknown
sample’s OD value is 1.08. So, the concentration is 114 µg/mg.
COMMENT: our unknown sample contains 114 µg/mg amino acid. The concentration of
amino acid in known sample is 114 µg/mg.
Zoology Lab Manual Dept. of Biological Science
19MIDNAPORE CITY COLLEGE

Estimation of DNA by Diphenylamine method
Principle:
This is a general reaction given by deoxypentoses. The 2-deoxyribose of DNA, in the
presence of acid, is converted to ω-hydroxilevulinic aldehyde, which reacts with
diphenylamine to form a blue coloured complex, which can be read at 595 nm.
Requirements:
1. Standard DNA solution- Dissolve calf thymus DNA (200µg/ml) in 1N perchloric
acid/buffered saline.
2. Diphenylamine solution- Dissolve 1g of diphenylamine in 100 ml of glacial acetic acid
and 2.5 ml of concentrated H2SO4. This solution must be prepared fresh
3. Buffered Saline- 0.5 mol/litre NaCl; 0.015 mol/litre sodium citrate, pH 7.
Procedure:
1. Pipette out 0.0, 0.2, 0.4, 0.6, 0.8 and 1 ml of working standard in to the series of labeled
test tubes.
2. Pipette out 1 ml of the given sample in another test tube.
3. Make up the volume to 1 ml in all the test tubes. A tube with 1 ml of distilled water
serves as the blank.
4. Now add 2 ml of DPA reagent to all the test tubes including the test tubes labeled
'blank' and 'unknown'.
5. Mix the contents of the tubes by vortexing / shaking the tubes and incubate on a boiling
water bath for 10 min.
6. Then cool the contents and record the absorbance at 595 nm against blank. 7. Then plot
the standard curve by taking concentration of DNA along X-axis and absorbance at 595
nm along Y-axis.
8. Then from this standard curve calculate the concentration of DNA in the given sample.
Result: The given unknown sample contains ----µg DNA/ml.
Observations
Volume of standard (200 µg/ml) DNA (ml)
Volume of distilled water (ml)
Concent ration of DNA (µg)
Volume of DPA reagent (ml)
Incubate In boiling water bath for 10 Min & Cool
Measure OD at 595 nm
0.0 1 00 2 0.0 0.2 0.8 40 2 0.4 0.6 80 2 0.6 0.4 120 2 0.8 0.2 160 2 1.0 0.0 200 2 1.0 Unknown
0.0 To be Estimated
2
Zoology Lab Manual Dept. of Biological Science
20MIDNAPORE CITY COLLEGE

ZOO 296 TAXONOMIC KEYS
A key is a device by which each specimen in a group of specimens may be identified.
This can be achieved by presenting diagnostic characters in a series of alternative choices.
The worker finds the correct name of his specimen by making the appropriate choice in a
series of consecutive steps. A good key is strictly dichotomous, not offering more than two
alternatives at any point. The statements should be sufficiently definite to permit
identification of a single specimen without reference to other species. Also the statements
should apply to the given specimen without reference to the opposite sex or to immature
stages. These should be treated in different keys. It is impossible to work out a key that
permits the identification of all species. It is good to omit authorities from specific names in
keys if these are mentioned elsewhere in the article. If the primary contrasting characters
cannot be clearly seen due to damage of the specimen, the supplemental characters become
desirable for diagnosis.
Types of Keys
Bracket Key:
The most commonly used key by the taxonomists is the bracket key. This key has the
advantage that the couplets are composed of alternatives which are side by side for ready
comparison. It is also economical in space. It may be run forward or backward with equal
facility by following the numbers which indicate the path that the various choices follow. The
numbers in brackets are responsible for running backward
in the key.
a fish, frog, snake, bat, bird and cat. One has to put up
questions about them in such a way that only one of the two answers are possible i.e.,
yes or no or present or absent.
1. External ears present ……………………………………………. 2
External ears absent …………………………………………….. 3
2. (1) Wings present ……………………………………………………. bat
Wings absent …………………………………………………….. cat
3. (1) Wings present ……………………………………………………. pigeon
Wings absent …………………………………………………….. 4
4. (3) Possess limbs ……………………………………………………. frog
Limbs absent …………………………………………………...… 5
5. (4) Possess gills ……………………………………………………… fish
Gills absent ……………………………………………………….. snake
Zoology Lab Manual Dept. of Biological Science
21MIDNAPORE CITY COLLEGE

Indented Key:
The other type of key is the indented key. It has the advantage that the
relationship of the various divisions is apparent to the eye. But it is disadvantageous in that the
alternatives may be widely separated and wasteful of space. For this reason, it is generally used only
for short keys, keys to higher taxa or comparative keys. A key based on the hypothetical data is given
as follows:
A. External ears present
B. Wings present ……….………………………………………… bat
BB. Wings absent …………..……………………………………… cat
AA. External ears absent
B. Legs present
C. Wings present …………………………………………………. pigeon
CC. Wings absent ……….…………………………………………. frog
BB. Without legs
C. Possess gills …………………………………………………… fish
CC. Gills absent ……………………………………………………. snake
Pictorial Key:
The third type of key is the pictorial key which is designed for special purposes. This key is used by
nonscientists for field identification. The critical characters are illustrated and described in such a way
that they can be used by non-technical persons, engineers as well as entomologists. These keys have
also been employed as field guides to higher taxa, vertebrates and flowering plants.
PARASITOLOGY
v Identifying character
· Microscopic, acellular animal single of the organism can perform all physiological
activities.
§ Locomotory organs are pseudopodia, cilia, flagella or myonome fibrils.
Hence, the specimen belongs to subkingdom-Protozoa
§ Locomotory organs may be either pseudopodia or flagella or both.
§ Intercellular parasitic organism.
§ Syngamy is the usual mode of reproduction.
§ Apical complex usually consist of one or two polar rings.
Hence, the specimen belongs to phylum-Apicomplexa
§ Complete cone is formed by conoid.
§ Locomotory organs if present may be pseudopodia or flagella.
Zoology Lab Manual Dept. of Biological Science
22MIDNAPORE CITY COLLEGE

§ Reproduction by both sexsual and asexual methods.
Hence, the specimen belongs to class-Sporozoa
§ Within trophozoid appears as a halfring form, known as single ring.
§ The redish chromatin granules the nucleus lies on this thin side.
§ The cytoplasm of RBC contains schuffners dots.
Hence, the specimen seems to be Plasmodium vivax.
v Identifying character
§ Microscopic, acellular animal single cell of the organism can perform all
physiological activities.
§ Locomotory organs are pseudopodia,cilia,flagella or myoneme fibrils.
Hence, the specimen belongs to subkingdom-Protozoa.
§ Locomotory organs may be either pseudopodia or flagella or both.
§ Intercellular parasitic organism.
§ Syngamy is the usual mode of reproduction.
Hence, the specimen belongs to phylum-Apicomplexa.
§ Complete cone is formed by conoid.
§ Locomotory organs if present may be pseudopodia or flagella.
§ Reproduction by both sexual and asexual methods.
Hence, the specimen belongs to class- Sporozoa.
The diameter of the immatured ring is 1.25-1.5µm and the cytoplasmic ring is uniform.
In the some RBC more than one ring may be found and the nucleus may remain side by side
or may lie in the opposite pole of the ring.
Hence, the specimen seems to be Plasmodium falciparum.
Zoology Lab Manual Dept. of Biological Science
23MIDNAPORE CITY COLLEGE
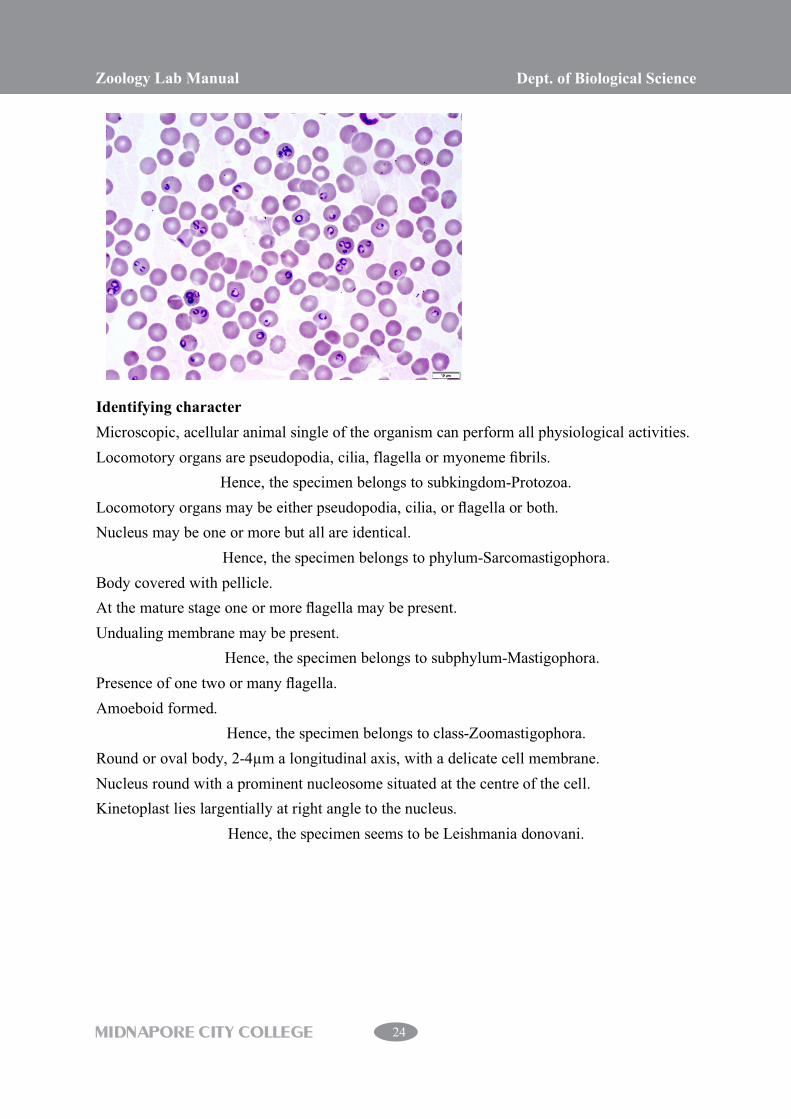
Identifying character
Microscopic, acellular animal single of the organism can perform all physiological activities.
Locomotory organs are pseudopodia, cilia, flagella or myoneme fibrils.
Hence, the specimen belongs to subkingdom-Protozoa.
Locomotory organs may be either pseudopodia, cilia, or flagella or both.
Nucleus may be one or more but all are identical.
Hence, the specimen belongs to phylum-Sarcomastigophora.
Body covered with pellicle.
At the mature stage one or more flagella may be present.
Undualing membrane may be present.
Hence, the specimen belongs to subphylum-Mastigophora.
Presence of one two or many flagella.
Amoeboid formed.
Hence, the specimen belongs to class-Zoomastigophora.
Round or oval body, 2-4µm a longitudinal axis, with a delicate cell membrane.
Nucleus round with a prominent nucleosome situated at the centre of the cell.
Kinetoplast lies largentially at right angle to the nucleus.
Hence, the specimen seems to be Leishmania donovani.
Zoology Lab Manual Dept. of Biological Science
24MIDNAPORE CITY COLLEGE

v Identifying Character
Unsegmented, bilaterally symmetrical and round in cross section.
Body cavity is pseudocoel.
Alimentary canal is provided with distinct mouth and anus.
Blood vascular system absent.
Hence, the specimen belongs to phylum- Aschelminthes.
Pseudocoelomate animal.
Unsegmented or superficially segmented body.
Straight non-muscular intestine with a posterior anus.
Hence, the specimen belongs to class- Nematoda.
The posterior end of the male is curved and provided with a pair of equal pineae setae.
Mouth is provided with three prominent lips.
Body cavity is pseudocoel.
Body covered with thick cuticle.
Hence, the specimen seems to be Ascaris sp.
Zoology Lab Manual Dept. of Biological Science
25MIDNAPORE CITY COLLEGE

v Identifying character
Bilaterally symmetrical dorsoventrally compressed and aceolomate animal.
Body space is packed with parenchyma.-
Hence, the specimen belongs to phylum- Platyhelminthes.
Endoparasitic, gut always present provide with pharynx and bifurcated intestine.
Well-developed suckers are usually present.
Hence, the specimen belongs to class- Trematoda.
Anterior sucker is present surrounding the mouth.
A simple acetabulate ventral sucker present.
Endoparasite with complex life always require one or more intermediate hosts.
Hence, the specimen belongs to subclass- Digenia.
Body is leaf like, dorsoventrally flattened.
Anterior end terminate into a conical projection called cephalic cone.
Between oral and ventral suckers is gonopore.
Excretory pore at the posterior end.
A short distance behind cephalic cone is an adhesive acetobulum or ventral sucker.
Hence, the specimen seems to be Fasciola sp.
Zoology Lab Manual Dept. of Biological Science
26MIDNAPORE CITY COLLEGE

v Identifying character
Bilaterally symmetrical dorsoventrally compressed and acelomate animal.
Body space is packed with parenchyma.
Hence, the specimen belongs to phylum- Platyhelminthes
Endoparasitic, gut always present provide with pharynx and bifurcated intestine.
Well-developed suckers are usually present.
Hence, the specimen belongs to class- Trematoda
Colour of the body is red.
Intestine is forked and branched.
There are two tests with random arrangement, sperm ducts.
Genital atrium is gut beneath the fork of the intestine.
Hence, the specimen seems to be Paramphistomum sp.
Zoology Lab Manual Dept. of Biological Science
27MIDNAPORE CITY COLLEGE

v Identifying character
Bilaterally symmetrical and metamerically segmented body.
Jointed appendages present.
Body is covered with thick chitinous covering as cuticular exoskeleton.
Hence, the specimen belongs to phylum- Arthropoda.
Body is divided into head, thorax and abdomen.
The fourth head segment bears a pair of mandible.
Hence, the specimen belongs to subphylum- Mandibulata.
Thorax always bears three segments as pro, meso and meta thorax.
One pair of antenna always present.
Hence, the specimen belongs to class- Insecta.
Adult with wings or secondarily wingless.
Hence, the specimen belongs to subclass- Pterygota.
Maxillary palps 5-jointed and appeared club shaped in males and as long as probosis in
female.
The wings have spot.
Sites on the surface with an angle.
Hence, the specimen seems to be Anopheles sp.
Zoology Lab Manual Dept. of Biological Science
28MIDNAPORE CITY COLLEGE

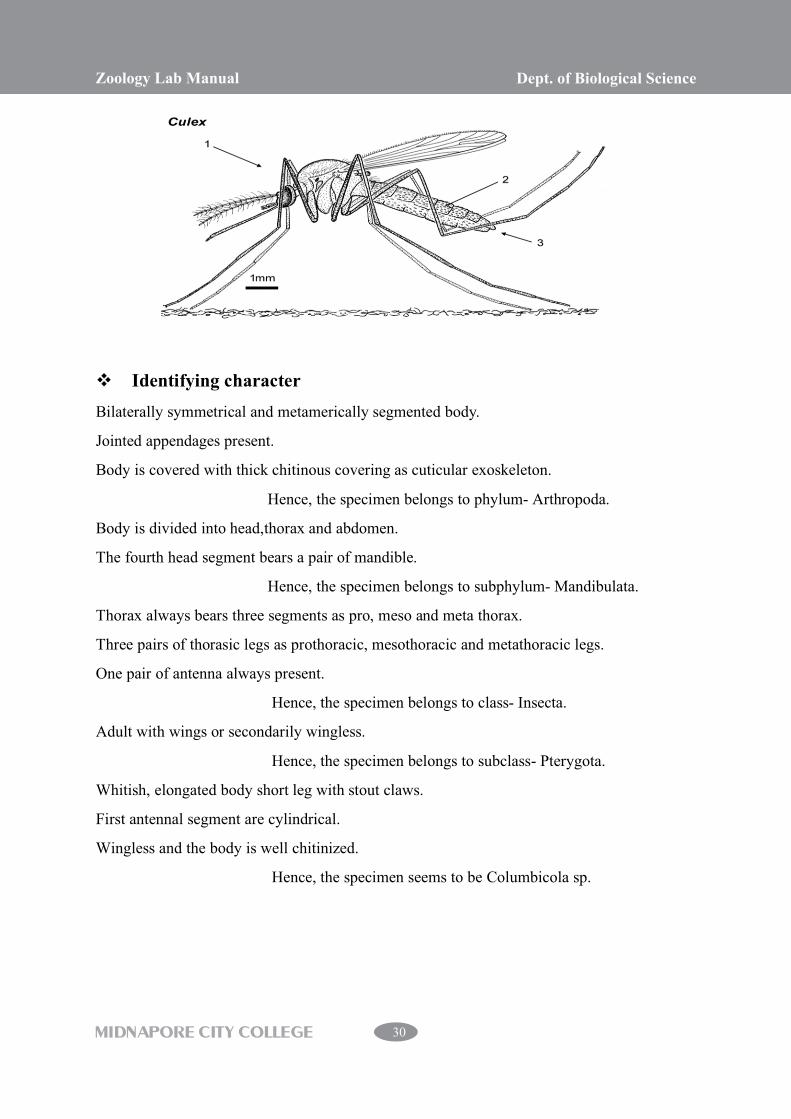
v Identifying character
Bilaterally symmetrical and metamerically segmented body.
Jointed appendages present.
Body is covered with thick chitinous covering as cuticular exoskeleton.
Hence, the specimen belongs to phylum- Arthropoda.
Body is divided into head,thorax and abdomen.
The fourth head segment bears a pair of mandible.
Hence, the specimen belongs to subphylum- Mandibulata.
Thorax always bears three segments as pro, meso and meta thorax.
Three pairs of thorasic legs as prothoracic, mesothoracic and metathoracic legs.
One pair of antenna always present.
Hence, the specimen belongs to class- Insecta.
Adult with wings or secondarily wingless.
Hence, the specimen belongs to subclass- Pterygota.
Insect is small, soft, slender and covered with small scales.
Maxillary palps are usually as long as probosis and five jointed.
Hence, the specimen seems to be Culex sp.
Zoology Lab Manual Dept. of Biological Science
29MIDNAPORE CITY COLLEGE
v Identifying character
Bilaterally symmetrical and metamerically segmented body.
Jointed appendages present.
Body is covered with thick chitinous covering as cuticular exoskeleton.
Hence, the specimen belongs to phylum- Arthropoda.
Body is divided into head,thorax and abdomen.
The fourth head segment bears a pair of mandible.
Hence, the specimen belongs to subphylum- Mandibulata.
Thorax always bears three segments as pro, meso and meta thorax.
Three pairs of thorasic legs as prothoracic, mesothoracic and metathoracic legs.
One pair of antenna always present.
Hence, the specimen belongs to class- Insecta.
Adult with wings or secondarily wingless.
Hence, the specimen belongs to subclass- Pterygota.
Whitish, elongated body short leg with stout claws.
First antennal segment are cylindrical.
Wingless and the body is well chitinized.
Hence, the specimen seems to be Columbicola sp.
Zoology Lab Manual Dept. of Biological Science
30MIDNAPORE CITY COLLEGE
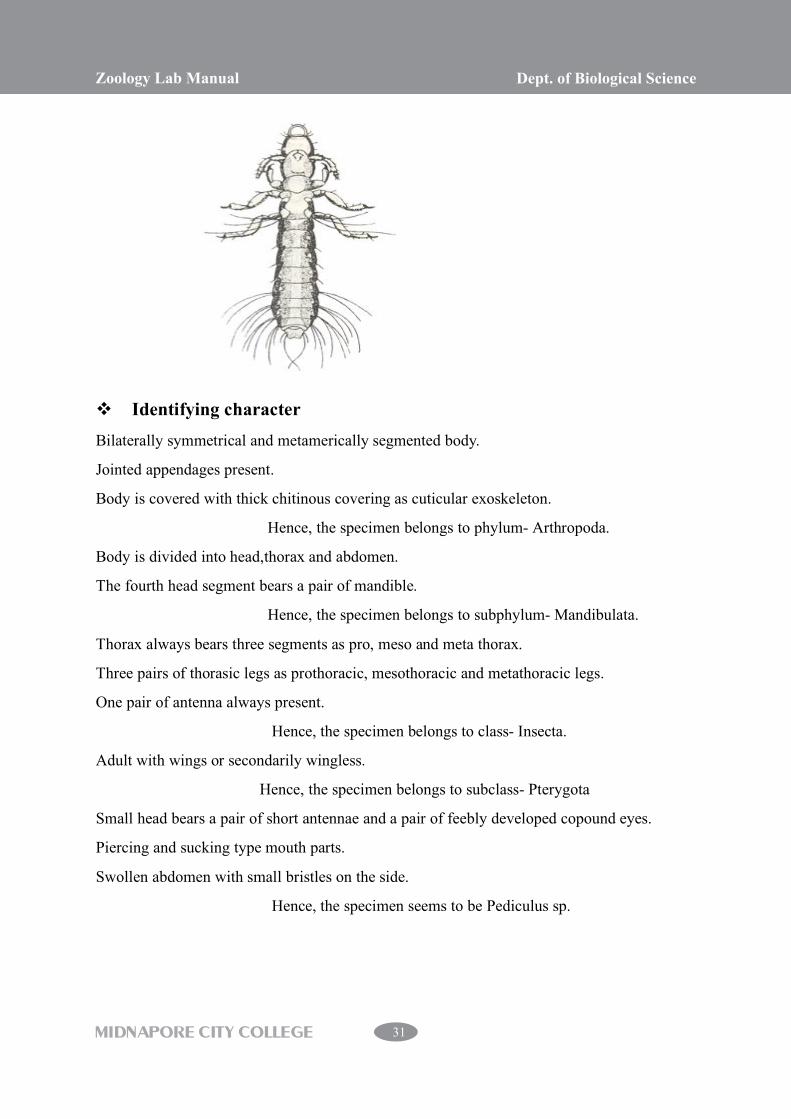
v Identifying character
Bilaterally symmetrical and metamerically segmented body.
Jointed appendages present.
Body is covered with thick chitinous covering as cuticular exoskeleton.
Hence, the specimen belongs to phylum- Arthropoda.
Body is divided into head,thorax and abdomen.
The fourth head segment bears a pair of mandible.
Hence, the specimen belongs to subphylum- Mandibulata.
Thorax always bears three segments as pro, meso and meta thorax.
Three pairs of thorasic legs as prothoracic, mesothoracic and metathoracic legs.
One pair of antenna always present.
Hence, the specimen belongs to class- Insecta.
Adult with wings or secondarily wingless.
Hence, the specimen belongs to subclass- Pterygota
Small head bears a pair of short antennae and a pair of feebly developed copound eyes.
Piercing and sucking type mouth parts.
Swollen abdomen with small bristles on the side.
Hence, the specimen seems to be Pediculus sp.
Zoology Lab Manual Dept. of Biological Science
31MIDNAPORE CITY COLLEGE

v Identifying character
Bilaterally symmetrical and metamerically segmented body.
Jointed appendages present.
Body is covered with thick chitinous covering as cuticular exoskeleton.
Hence, the specimen belongs to phylum- Arthropoda.
Body is divided into head,thorax and abdomen.
The fourth head segment bears a pair of mandible.
Hence, the specimen belongs to subphylum- Mandibulata.
Thorax always bears three segments as pro, meso and meta thorax.
Three pairs of thorasic legs as prothoracic, mesothoracic and metathoracic legs.
One pair of antenna always present.
Hence, the specimen belongs to class- Insecta.
Adult with wings or secondarily wingless.
Hence, the specimen belongs to subclass- Pterygota
Piercing and sucking mouth parts.
Herbivorous and predaceous.
Hence, the specimen belongs to order- Hemipterh.
Flattened oval body, usually without wings.
Fore wings in the form of spiny pad.
Prominent eyes at the sides of head.
Head short, broad and set inside lateral extension of pro-thorax.
Hence, the specimen seems to be Climex sp.
Zoology Lab Manual Dept. of Biological Science
32MIDNAPORE CITY COLLEGE

PRINCIPLE AND METOD OF AGAROSE GEL ELECTROPHORESIS
PRINCIPLE:
Agarose gel electrophoresis used to analyse and quantite nuclic acid. The agarose for agarose
gel electrophoresis is purified from agarose. Agarose is a linear polymer made up of
repeating units of 1.3-linked � D galactopyranase and 1.4-linked 3.6 anhydro a 1
galactopyranose. Agarose has an average MW of 12000 and contains about 35-40 agarobise
units. Agarose in solution exist as left handed double helices. About 7-11 such helices from
bundles which extend as long as rods and appear to intertwine with one another, further
strengthening the frame work of the gel. The cross links are held together by hydrogen and
hydrophobic bonds. By changing the gel conc. the pre size can be altered. Higher the
concentration of agarose smaller the pre size and vise versa. Because of large pre size even at
low concentration. Agarose gel are widely used for separation of DNA and RNA.
MATERIALS REQUIRED:
1. Agarose solution
2. Ethidium bromide.
3. Electrophoresis buffer
EFFECTS OF AGAROSE CONCENTRATION ON SEPARATION RANGE:
The following table describe the relationship between agarose concentration and separation
range of nuclic acid.
AGAROSE CONCENTRATION (%) SEPARATION RANGE (kb) 0.3 5 to 60 0.6 1 to 20 0.8 0.8 to 10 1.0 0.4 to 8 1.2 0.3 to 6 1.5 0.2 to 4
Zoology Lab Manual Dept. of Biological Science
33MIDNAPORE CITY COLLEGE
FACTORS WHICH AFFECT THE RATE OF MIGRATION OF NUCLEIC ACIDS IN
AGAROSE GEL:
Rate of migration of nucleic acids in agarose gel depends mainly on five important
parameters.
1. AGAROSE CONCENTRATION:
Higher conc. of gel is used for the separation of lower weight DNA & RNA fragments
and vice-versa.
2. MOLECULAR WEIGHT:
A duplex DNA fragment migrates at rates inversely proportional to the log molecular
weight. A plot of log MW mobility gives a straight line.
3. CONFIRMATION:
Supercoild DNA moves faster followed by linear forms & relaxed open circular forms.
4. APPLIED VALTAGES:
At low voltages (<5V/cm) the rate of migration is directly proportional to the applied
voltage.
5. BASE COMPOSITION & TEMPERATURE:
Base composition & running the gel between 4& 30 C don’t change the mobilites.
PREPARATION OF STOCK SOLUTION FOR DNA GEL:
Two different buffer systems are used for separation of nucleic acid by agarose gel
electrophoresis. There compositions are given below:
i. TBE buffer
ii. TAE buffer:
PREPARATION OF AGAROSE SOLUTION FOR GEL CASTING:
Dissolved the agarose by placing the flashes in boiling water bath cool to Luke warm. Cover
the sides of a tray using cello tape & place the comb about 1cm from the top of the tray. Pour
the agarose without making any bubbles, cool it for 20mints and take off the combs and
uncovered the tapes.
PREPARATION OF SAMPLE LOADING DYE GLYCEROLLS BROMOPHENOL
BLUE
30ml glycerol (30%), 250mg bromophenol blue, dHଶO 100ml.
Zoology Lab Manual Dept. of Biological Science
34MIDNAPORE CITY COLLEGE

PROCEDURE:
1. The DNA sample is mixed with the loading dye and loaded in the well carefully
using pipetman & capillary tube.
2. One the sample is loaded in to the well the cathode is connected towards the top
end of the gel and anode(Red positive) terminal is connected towerds the bottom
end of the gel. The maximum volume that can be loaded onto a well formed from
a 105mm thickness tooth of the comb is 30�l. The electrophoresis is started by
switching on the D.C. power pack.
3. The gel is run at 5V/cm. As the bromophenol blue has moved 1cm above the
bottom end. The current is switched off the power supply is disconnected and the
gel along with the platform is stain is plastic tray containing 0.5�g/ml ethidium
bromide in the sterile distilled water.
4. After about 30-40 min the platform & gel is rinsed with distilled water & by
keeping the platform in a standing position, the gel is gently pushed onto the UV
transluminator. UV light is switched on and the DNA bands are seen and
photographed at 5.6 for 10 seconds with an orange filter.
RESULT: After electrophoresis DNA bands can be visualized under VU light and they
appear as orange fluorescence.
ISOLATION & PURIFICATION OF DNA FROM TISSUE
PRINCIPLE:
The genomic DNA isolation depends on what the application of the DNA after isolation.
Generally all methods include the disruption and lysis of cell. This followed sometimes by
the removal of RNA and other materials.
In general, the separation of DNA from cell and cellular components can be divided into four
steps-
I. Cell disruption
II. Cell lysis
III. Removal of proteins
IV. Receving of DNA
REQUIREMENTS:
Micro centrifuged tube, chicken liver, tips, and micro pipette reagents.
Zoology Lab Manual Dept. of Biological Science
35MIDNAPORE CITY COLLEGE

REAGENTS AND IT’S PREPARATION:
1. Lysis buffer: 50ml Tris, 20ml EDTA, 100ml NaCl, 1% SDS proteinase all are
mixed well and volume made upto 100ml.
2. TE buffer: 50�l Tris solution+ 5�l of EDTA solution + DHଶO volume made upto
5ml.
3. PCI (phenol: Chloroform: Isoamyl alcohol):- 25:24:1
4. TAE buffer 1X: 0.484gm Tris + 0.115ml acetic acid + EDTA 0.25 gm are mixed
properly and volume made upto 100ml.
5. DNA loading dye: glycerol, Bromophenol blue.
6. Ethidium Bromide (EtBr): 10mg/ml dissolved in 1X TAE buffer.
PROCEDURE:
1. 1 of tissue was added to 50�l of lysis buffer.
2. The tissue was then homogenised by tissue homogenizer which is able to break
sufficient cell membrane and nuclear membrane.
3. The homogenised mixture was then stored at 4°C temperature for 15min.
4. The homogenised mixture was then centrifuged at 12000 rpm for 10 min under
4°C temperature.
5. After centrifugugation, supernatant was collected and equal volume of P:C:I was
added to microcentrifuged tube.
6. Then this mixture again centrifuged at 12000 rpm for 5min under 4°c.
7. The upper aquas solution was collected and added equal volume of chloroform.
8. After that mixture was centrifuged again at 12000 rpm for 5min at 4°C.
9. Thus upper aquas layer was collected and equal volume of sodium acetate
(�� ଶܥ ¯ ) and double volume of ethanol (�� ଷ�� ଶܪ ) were added.
10. Then the mixture was taken properly and stored at -20°C for 1 hr or overnight (as
required).
11. After that mixture was centrifuged at 8000 rpm for 8-10 min.
12. Next pellet was treated with 70% ethanol and centrifuged at 8000 rpm for 8min.
13. Then pellets were dried properly by evaporation at alcohol and dissolved in of TE
buffer.
14. Load in well of DNA agarose (1%) gel and run the gel.
15. The result was studied by using transluminator.
Zoology Lab Manual Dept. of Biological Science
36MIDNAPORE CITY COLLEGE

OBSERVATION:
After sometime it was seens that DNA migrated from –Ve to +Ve in agarose gel. The bands
were found just below the well.
RESULT AND INTERPRETATION:
From the above observation we may interpreted that the genome which is absorbed in the
well indicates that the animal tissue under investigation contain genomic DNA.
PURIFICATION:
1. RNAse treatment is for 30-35 min at 37°C.
2. A stock solution of protease is prepared and from that stock solution 1/20 th
volume is added to the isolation DNA. The preparation is a incubated at 37°C for
1hr.
3. To the preparation of �� ܥ ଷ is added for 15 min and centrifuged for 10000 rpm
for 10 min.
4. Sample kept on ice ban 10min.
5. Aqueous phase is pipette out in a tube and 2 volume of chilled ethanol is added.
Zoology Lab Manual Dept. of Biological Science
37MIDNAPORE CITY COLLEGE