MRI and PET Compatible Bed for Direct Co-Registration in Small Animals
7
1596 IEEE TRANSACTIONS ON NUCLEAR SCIENCE, VOL. 60, NO. 3, JUNE 2013 MRI and PET Compatible Bed for Direct Co-Registration in Small Animals Antonietta Bartoli, Giovanna Esposito, Luca D’Angeli, Linda Chaabane, and Enzo Terreno Abstract—To obtain an accurate co-registration with stand- alone PET and MRI scanners, we developed a compatible bed system for mice and rats that enables both images to be ac- quired without repositioning the animals. MRI acquisitions were performed on a preclinical 7T scanner (Pharmascan, Bruker), whereas PET scans were acquired on a YAP-(S)PET (ISE s.r.l.). The bed performance was tested both on a phantom (NEMA Image Quality phantom) and in vivo (healthy rats and mice brain). Fiducial markers filled up with a drop of F were visible in both modalities. Co-registration process was performed using the point-based registration technique. The reproducibility and accuracy of the co-registration were assessed using the phantom. The reproducibility of the translation distances was 0.2 mm along the z axis. On the other hand, the accuracy depended on the physical size of the phantom structures under investigation but was always lower than 4%. Regions of Interest (ROIs) drawn on the fused images were used for quantification purposes. PET and MRI intensity profiles on small structures of the phantom showed that the underestimation in activity concentration reached 90% in regions that were smaller than the PET spatial resolution, while the MRI allowed a good visualization of the 1 mm rod. PET/MRI images of healthy mice and rats highlighted the expected superior capability of MRI to define brain structures. The simplicity of our developed MRI/PET compatible bed and the quality of the fused images obtained offers a promising opportunity for a future preclinical translation, particularly for neuroimaging studies. Index Terms—Fiducial marker, MRI/PET, point-based registra- tion, small animal imaging. I. INTRODUCTION P OSITRON Emission Tomography (PET) provides an ex- cellent sensitivity and specificity to track biomolecules labeled with a radioactive isotope. However, the poor spatial resolution hampers quantification, especially in small animal imaging. To overcome this limitation, PET needs to be associ- ated with high resolution imaging techniques, such as Computed Tomography (CT) or Magnetic Resonance Imaging (MRI). This combined information simplifies the navigation within the re- constructed images, leading to an easier definition of the regions Manuscript received June 06, 2012; revised November 05, 2012; accepted March 26, 2013. Date of publication June 05, 2013; date of current version June 12, 2013. A. Bartoli was with the Molecular and Preclinical Imaging Centers, Univer- sity of Turin, Torino, Italy. She is now with the Institute of Clinical Physiology, National Research Council (CNR), Pisa, Italy (e-mail: [email protected]). G. Esposito, L. D’Angeli, and E. Terreno are with the Molecular and Preclin- ical Imaging Centers, University of Turin, Torino, Italy (e-mail: giovanna.es- [email protected]; [email protected]; [email protected]). L. Chaabane is with INSPE–Division of Neuroscience, San Raffaele Scien- tific Institute, 20132 Milano, Italy (e-mail: [email protected]). Color versions of one or more of the figures in this paper are available online at http://ieeexplore.ieee.org. Digital Object Identifier 10.1109/TNS.2013.2262950 of interest (ROIs) and improves in the quantification of radio- tracer uptake [1]. Since the 1990s, the challenge imposed by multimodal imaging has been tackled both on a software and hardware level. The software approach is based on algorithms that retrospectively align 3-dimensional (3D) data, acquired by stand-alone modalities, to common spatial coordinates [2]. The hardware approach on the other hand, physically integrates two different scanners, and the hardware device then aligns the two images. After its recent clinical introduction [3], [4], it became evident that the hardware integration of PET/CT systems was superior to PET and CT stand-alone scanners, thereby sig- nificantly improving diagnostic and therapeutic management. PET/CT combined scanners have been used to such an extent, that the last decade can be considered as the PET/CT era [4]. Following its clinical success, PET/CT scanners have also been developed for preclinical imaging and their diffusion has increased over the last few years. Despite this success, PET/CT systems still have some limita- tions. One major drawback is that CT provides only limited soft tissue contrast and exposes the patient (or animal) to an addi- tional radiation dose [5]. Thus the combination of PET/MRI was soon recognized as an appealing alternative, primarily based on the particular ad- vantages of MRI over CT such as its very low invasiveness, the excellent soft tissue contrast, and its ability to complementary functional information [6]. The development of PET/MRI scanners started in the early 1990’s [7], i.e., before PET/CT modality became commercially available. In contrast to PET/CT, where the two imaging compo- nents are attached back-to-back and linked through a common patient table, PET/MRI technology focused on integrating the PET inside the MRI in order to match the fields of view (FOV) of the two modalities [1]. However, installing a PET insert inside a MRI scanner is quite challenging due to the mutual electromagnetic interference [8]. In fact, the strong static magnetic field, the switching of mag- netic gradients, and the use of radiofrequency (RF) make MRI incompatible with sensitive PET detectors. On the other hand, PET detectors can significantly disturb the homogeneity of the main magnetic field of MRI scanners. Based on these restrictions, the development of MRI-com- patible PET detectors has been a topic of intensive research for more than 15 years [1]. In the same period, several co-registra- tion algorithms, especially in functional brain imaging studies, have been developed [2], [9]. Hybrid PET/MRI systems based on the use of MRI-compat- ible PET components, would allow simultaneous PET/MRI ac- 0018-9499/$31.00 © 2013 IEEE
-
Upload
independent -
Category
Documents
-
view
2 -
download
0
Transcript of MRI and PET Compatible Bed for Direct Co-Registration in Small Animals
1596 IEEE TRANSACTIONS ON NUCLEAR SCIENCE, VOL. 60, NO. 3, JUNE 2013
MRI and PET Compatible Bed for DirectCo-Registration in Small Animals
Antonietta Bartoli, Giovanna Esposito, Luca D’Angeli, Linda Chaabane, and Enzo Terreno
Abstract—To obtain an accurate co-registration with stand-alone PET and MRI scanners, we developed a compatible bedsystem for mice and rats that enables both images to be ac-quired without repositioning the animals. MRI acquisitions wereperformed on a preclinical 7T scanner (Pharmascan, Bruker),whereas PET scans were acquired on a YAP-(S)PET (ISE s.r.l.).The bed performance was tested both on a phantom (NEMAImage Quality phantom) and in vivo (healthy rats and micebrain). Fiducial markers filled up with a drop of F were visiblein both modalities. Co-registration process was performed usingthe point-based registration technique. The reproducibility andaccuracy of the co-registration were assessed using the phantom.The reproducibility of the translation distances was 0.2 mm alongthe z axis. On the other hand, the accuracy depended on thephysical size of the phantom structures under investigation butwas always lower than 4%. Regions of Interest (ROIs) drawn onthe fused images were used for quantification purposes. PET andMRI intensity profiles on small structures of the phantom showedthat the underestimation in activity concentration reached 90% inregions that were smaller than the PET spatial resolution, whiletheMRI allowed a good visualization of the 1 mm rod. PET/MRIimages of healthy mice and rats highlighted the expected superiorcapability of MRI to define brain structures. The simplicity ofour developed MRI/PET compatible bed and the quality of thefused images obtained offers a promising opportunity for a futurepreclinical translation, particularly for neuroimaging studies.
Index Terms—Fiducial marker, MRI/PET, point-based registra-tion, small animal imaging.
I. INTRODUCTION
P OSITRON Emission Tomography (PET) provides an ex-cellent sensitivity and specificity to track biomolecules
labeled with a radioactive isotope. However, the poor spatialresolution hampers quantification, especially in small animalimaging. To overcome this limitation, PET needs to be associ-ated with high resolution imaging techniques, such as ComputedTomography (CT) orMagnetic Resonance Imaging (MRI). Thiscombined information simplifies the navigation within the re-constructed images, leading to an easier definition of the regions
Manuscript received June 06, 2012; revised November 05, 2012; acceptedMarch 26, 2013. Date of publication June 05, 2013; date of current version June12, 2013.A. Bartoli was with the Molecular and Preclinical Imaging Centers, Univer-
sity of Turin, Torino, Italy. She is now with the Institute of Clinical Physiology,National Research Council (CNR), Pisa, Italy (e-mail: [email protected]).G. Esposito, L. D’Angeli, and E. Terreno are with the Molecular and Preclin-
ical Imaging Centers, University of Turin, Torino, Italy (e-mail: [email protected]; [email protected]; [email protected]).L. Chaabane is with INSPE–Division of Neuroscience, San Raffaele Scien-
tific Institute, 20132 Milano, Italy (e-mail: [email protected]).Color versions of one or more of the figures in this paper are available online
at http://ieeexplore.ieee.org.Digital Object Identifier 10.1109/TNS.2013.2262950
of interest (ROIs) and improves in the quantification of radio-tracer uptake [1].Since the 1990s, the challenge imposed by multimodal
imaging has been tackled both on a software and hardwarelevel. The software approach is based on algorithms thatretrospectively align 3-dimensional (3D) data, acquired bystand-alone modalities, to common spatial coordinates [2]. Thehardware approach on the other hand, physically integrates twodifferent scanners, and the hardware device then aligns the twoimages.After its recent clinical introduction [3], [4], it became
evident that the hardware integration of PET/CT systems wassuperior to PET and CT stand-alone scanners, thereby sig-nificantly improving diagnostic and therapeutic management.PET/CT combined scanners have been used to such an extent,that the last decade can be considered as the PET/CT era [4].Following its clinical success, PET/CT scanners have also
been developed for preclinical imaging and their diffusion hasincreased over the last few years.Despite this success, PET/CT systems still have some limita-
tions. One major drawback is that CT provides only limited softtissue contrast and exposes the patient (or animal) to an addi-tional radiation dose [5].Thus the combination of PET/MRI was soon recognized as
an appealing alternative, primarily based on the particular ad-vantages of MRI over CT such as its very low invasiveness, theexcellent soft tissue contrast, and its ability to complementaryfunctional information [6].The development of PET/MRI scanners started in the early
1990’s [7], i.e., before PET/CT modality became commerciallyavailable. In contrast to PET/CT, where the two imaging compo-nents are attached back-to-back and linked through a commonpatient table, PET/MRI technology focused on integrating thePET inside the MRI in order to match the fields of view (FOV)of the two modalities [1].However, installing a PET insert inside aMRI scanner is quite
challenging due to the mutual electromagnetic interference [8].In fact, the strong static magnetic field, the switching of mag-netic gradients, and the use of radiofrequency (RF) make MRIincompatible with sensitive PET detectors. On the other hand,PET detectors can significantly disturb the homogeneity of themain magnetic field of MRI scanners.Based on these restrictions, the development of MRI-com-
patible PET detectors has been a topic of intensive research formore than 15 years [1]. In the same period, several co-registra-tion algorithms, especially in functional brain imaging studies,have been developed [2], [9].Hybrid PET/MRI systems based on the use of MRI-compat-
ible PET components, would allow simultaneous PET/MRI ac-
0018-9499/$31.00 © 2013 IEEE

BARTOLI et al.: MRI AND PET COMPATIBLE BED FOR DIRECT CO-REGISTRATION IN SMALL ANIMALS 1597
quisitions, however these systems are still under developmentand they are very expensive.In imaging centers where both MRI and PET systems are
available, dedicated algorithms for image co-registration havebeen developed. However misregistration errors can producesignificant differences in radioligand quantification.Another approach to combine existing stand alone PET and
MRI systems involves the implementation of a movable exam-ination table [10].Several systems have been developed, both for clinical [10],
[11] and preclinical systems [12]–[14].In the clinical systems the fusion process is based on seg-
mentation, and in [10] the fusion process is assisted by a shuttlesystem.On the other hand, the preclinical systems use a rigid body
transformation as co-registration method and employ externalfiducial markers to evaluate the co-registration accuracy [12]or to estimate the co-registration residual errors [13]. In [13] aspecifically designed bed was used.In this work, we followed the movable specifically designed
bed approach by developing a compatible bed system for miceand rats that allows PET/MRI to be acquired in sequential modewithout animal repositioning. To maintain the animal position,three (in mice studies) or four (in rats studies) external markerswere introduced, thereby facilitating and improving the qualityof the co-registration that was performed using the point-basedregistration technique.
II. MATERIALS AND METHODS
A. Imaging Systems and Compatible Bed Development
MRI acquisitions were performed with a preclinical 7Tscanner (Pharmascan, Bruker), and PET scans were carried outon YAP-(S)PET (ISE s.r.l.). The YAP-(S)PET is made up offour detector heads, each consisting of a YAlO3:Cematrix of 20 20 elements, each, coupledto a R2486 PS-PMT by Hamamatsu. The four modules arepositioned on a rotating gantry with the opposite detectors 15cm apart and in time coincidence when used in PET mode. Thescanner has a cylindrical FOV, with a height of 4 cm (along theaxial direction) and a diameter of 4 cm (transaxial plane) [15].Since PET and MRI are stand-alone scanners located in dif-
ferent rooms close to each other, we developed a common bedso that the animals can be moved under anesthesia from onescanner to the other.The MRI scanner is equipped with a Plexiglas bed that in-
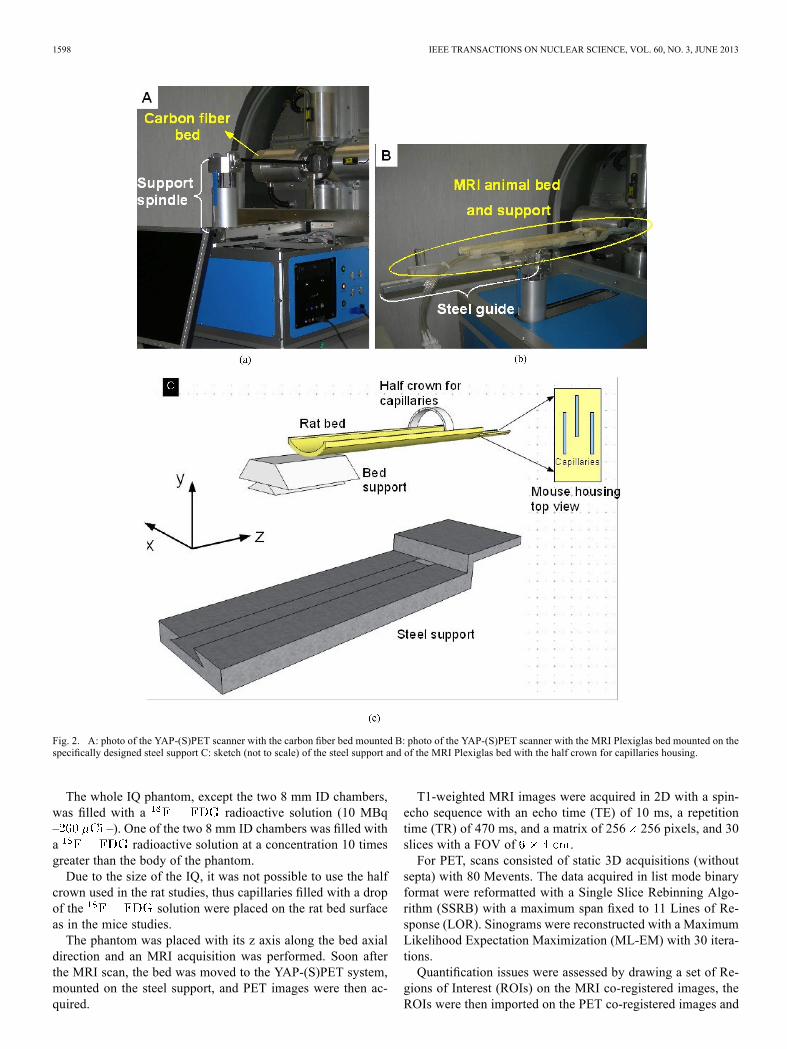
cludes a mask for gas anesthesia (Fig. 1), while for the YAP-(S)PET scanner, a carbon fiber bed is used (Fig. 2(a)) whichis incompatible with MRI. We therefore made a steel supportfor the YAP-(S)PET scanner, specifically designed to embed theMRI Plexiglas bed (see Figs. 2(b) and 2(c)). Fig. 2(c) also showsthe system frame of reference: the z axis is oriented along thescanner axial direction.The steel support is equipped with a dovetail guide that im-
proves the system stability by reducing the bed support slack.The Plexiglas bed support has a wider translation range in the
axial direction into the MRI scanner respect to the YAP-(S)PET( , see Fig. 3).
Fig. 1. The MRI 7T scanner (Pharmascan. Bruker) with the Plexiglas bed sup-port.
To guarantee that the Plexiglas bed can properly fit inside thePET scanner, the steel support was mounted on the same spindlethat is used for the carbon fiber bed but oriented in the oppositedirection respect to the PET scanner entrance.Once the MRI scans had been performed, the bed was re-
moved, transported to the PET scan and mounted on the steelsupport. Despite the transportation process may be accurate,slight misalignments can always occur due to translation offsetsof the bed during positioning. In order to limit this problem, ex-ternal markers visible in bothmodalities were also placed withinthe bed. For both mice and rats imaging, the fiducial markerswere made with glass capillaries [1 mm internal diameter (ID)and 1 cm in length] filled with a drop of solution( , – –)which are visible in both modalities. Since in MRI, the radiofre-quency coils for mice have a limited space compared to the rat’scoil, the fiducial markers were placed differently. For rats, thecapillaries were inserted inside a Plexiglas half crown specif-ically developed with four holes in which the capillaries werefitted. This half crown was firmly fixed to the top of the bedabove the head of the animal. For mice, three fiducial markerswere placed on the bed surface (see Fig. 2(c)). In both configu-rations, the markers were oriented along the z axis on different yplanes. In addition, a relative shift along the z axis was appliedto the capillary position (see Fig. 2(c) to create both transaxialand axial reference points.
B. Phantom Acquisitions: Image Quality
To test the MRI-PET compatible bed support and co-regis-tration accuracy, phantom acquisition was performed using theNEMA Image Quality (IQ) phantom [16].The IQ is a Plexiglas cylinder consisting of three parts: a cen-
tral fillable chamber with a 30 mm diameter and 30 mm length;a lid attached to the uniform region containing two region cham-bers (15 mm in length and 8 mm of internal , 10 mm externaland 1 mm wall thickness); a 20 mm solid final part with 5 fil-lable rods with diameters of 1, 2, 3, 4 and 5 mm.
1598 IEEE TRANSACTIONS ON NUCLEAR SCIENCE, VOL. 60, NO. 3, JUNE 2013
Fig. 2. A: photo of the YAP-(S)PET scanner with the carbon fiber bed mounted B: photo of the YAP-(S)PET scanner with the MRI Plexiglas bed mounted on thespecifically designed steel support C: sketch (not to scale) of the steel support and of the MRI Plexiglas bed with the half crown for capillaries housing.
The whole IQ phantom, except the two 8 mm ID chambers,was filled with a radioactive solution (10 MBq– –). One of the two 8 mm ID chambers was filled witha radioactive solution at a concentration 10 timesgreater than the body of the phantom.Due to the size of the IQ, it was not possible to use the half
crown used in the rat studies, thus capillaries filled with a dropof the solution were placed on the rat bed surfaceas in the mice studies.The phantom was placed with its z axis along the bed axial
direction and an MRI acquisition was performed. Soon afterthe MRI scan, the bed was moved to the YAP-(S)PET system,mounted on the steel support, and PET images were then ac-quired.
T1-weighted MRI images were acquired in 2D with a spin-echo sequence with an echo time (TE) of 10 ms, a repetitiontime (TR) of 470 ms, and a matrix of 256 256 pixels, and 30slices with a FOV of .For PET, scans consisted of static 3D acquisitions (without
septa) with 80 Mevents. The data acquired in list mode binaryformat were reformatted with a Single Slice Rebinning Algo-rithm (SSRB) with a maximum span fixed to 11 Lines of Re-sponse (LOR). Sinograms were reconstructed with a MaximumLikelihood Expectation Maximization (ML-EM) with 30 itera-tions.Quantification issues were assessed by drawing a set of Re-
gions of Interest (ROIs) on the MRI co-registered images, theROIs were then imported on the PET co-registered images and

BARTOLI et al.: MRI AND PET COMPATIBLE BED FOR DIRECT CO-REGISTRATION IN SMALL ANIMALS 1599
Fig. 3. The MRI bed support installation on the MRI (top) and PET (bottom)scanner, respectively.
the counts were evaluated. The MRI ROIs, drawn according tothe physical dimensions of the phantom structures were placedon the transaxial sections on both the 30 mm central sectionand the five rods.Two PET IQ acquisitions were performed to investigate pos-
sible attenuation issues introduced by the use of the MRI Plexi-glas bed in the PET scans: one with the phantom on the carbonfiber bed and the other with the phantom on the MRI Plexiglasbed. Both the acquisitions were performed with the IQ filledas described above and with the same PET protocol used forthe MRI/PET acquisitions. Due to the configuration geometry,the highest attenuation effect is expected along the y axis ofthe image. The impact of the attenuation was thus evaluated bycomparing a profile along y in the uniform part of the IQ for thetwo separate acquisitions.
C. In Vivo Imaging
In vivo imaging experiments were performed on both healthymice (C57BL6) and rats (Lewis) focusing on the central nervoussystem: brain and spinal cord. To normalize uptakewithin the brain, animals were fasted for 12-14 hours prior toimaging exams.Before animal preparation, the fiducial markers were filled
with a drop of -FDG solution and then inserted in thesupport (see Fig. 2(c). In order not to saturate the PET images,markers need to have as little activity as possible to be visiblein the PET acquisition and not impair the image quality. Thefiducial markers were filled with and of radiotracerfor rats and mice, respectively.Prior to anesthesia (isofluorane gas mixed with oxygen), a
catheter filled with physiological serum was placed in the tailvein. The animal was then placed within the MRI bed and im-ages were acquired with the MRI scanner. When the images hadbeen acquired, the bed holding the animal was transferred tothe YAP-(S)PET room and mounted on the steel support. ThePET exam was performed after intravenous administration of
(37 MBq – 1 mCi – in rats and 15 MBq – 0.4 mCi– in mice).In rat studies MRI was performed with a FOV size equal to
, using a 3D T2 weighted spin-echo sequence with
a rare factor of 8, matrix size of. In mice acquisitions, the MRI scan was performed
with the same FOV size as the YAP-(S)PET one ,using a 3D T2 weighted spin-echo sequence with a rare factorof 8, matrix size of .PET images were performed in 3D mode after an uptake timeof 45 minutes and 20 and 40 Mevents were acquired for rats andmice, respectively.As with the IQ acquisitions, the PET data were stored in list
mode binary format, reorganized by an SSRB algorithm witha maximum span fixed to 11 LOR and sinograms were recon-structed with ML-EM with 30 iterations.
D. Co-Registration
Co-registration process was performed using the point-based(also called landmark-based) registration technique. The infor-mation feature used is the homologous point pair. This point pairidentifies the same physical location in both images. Once a setof points in the MRI image (reference points) and a set of pointsin the PET image (model points) have been identified, the twospatial point arrangements are brought into optimal agreementby means of a 3D geometrical transformation. The same trans-formation is then applied to the whole PET image [17]. For thispurpose, we used the commercial software PMOD [18].For both phantom and animal studies, the MRI and PET im-
ages were opened with the “Fusion tool” and common physicallocations (the fiducial markers) were identified in the two imagesets. In order to limit the user subjectivity in defining the land-marks, for each fiducial marker, in both PET and MRI images,we first roughly defined the marker position, then we drew or-thogonal profiles centered on that position and finally we set themarkers in relation to the profile centroids (see Fig. 4). Markerassignment was performed in three dimensions: transaxial andaxial sections. In the axial section, the markers were set at thecapillary end in correspondence of an intensity decrease of 50%with respect to the capillaries’ profile maximum.The set matching of the two markers was performed with
PMOD by selecting the rigid transformation modality.The PMOD matching algorithm iteratively minimizes the
sum of the squared distances between the reference markers(MRI) and the model markers (PET) [19]. However, the esti-mate of the registration errors for this rigid body transformationis not reported in the PMOD handbook.In order to assess the co-registration reproducibility [20],
the whole procedure was then repeated five times by three dif-ferent users on each set of the performed PET/MRI studies (IQphantom, rat and mouse brain). The transformation parametersfrom all the registrations were analyzed by calculating the meanand the standard deviation of the translation distances (x, yand z) and the rotation angles ( , and ).Co-registration accuracy was evaluated by measuring the in-
fluence of the co-registration procedure on the quantitative PETimage analysis [21]. Each of the users that performed the co-reg-istration reproducibility test, defined two sets of ROIs on thePET/MRI co-registered images of the IQ phantom. Each setconsisted of the following ROIs: one on the filled 8 mm IDchamber, one on the uniform part, and others on the 5, 4 and3 mm rods. The PET ROI set was drawn in the transaxial slice

1600 IEEE TRANSACTIONS ON NUCLEAR SCIENCE, VOL. 60, NO. 3, JUNE 2013
Fig. 4. A series of transaxial slices of the MRI (top line), PET (middle) andfused (bottom) images, before (left) and after (right) the co-registration.
showing the maximum tracer intensity. Each ROI was a circlewith a diameter corresponding to the physical dimension of theselected phantom feature and was centered on the pixel withthe maximum intensity. The MRI ROIs were drawn on the MRIimage by encompassing the selected geometrical structures ofthe phantom. The MRI ROIs were then imported into the PETco-registered image, in the same slice that was used to draw PETROIs. ROI counts were evaluated for both PET and MRI ROIsets.Co-registration accuracy was evaluated by comparing the
percentage of variation between the PET and the MRI ROI sets.Possible bed deflections do not have an impact on the co-reg-
istration, which uniquely depends on the relative position be-tween the animal (or the phantom) and the fiducial markers.
III. RESULTS
A. Phantom Acquisitions: Image Quality
Fig. 4 reports a transaxial section of the IQ phantom beforeand after the co-registration process. The two capillary sectionslying on this slice are clearly visible in both the PET and MRIimages.Fig. 5 shows the comparison of a profile along y in the uni-
form part of the IQ for the two separate PET acquisitions per-
Fig. 5. Profiles along y in the uniform part of the IQ phantom for two separatePET acquisitions: one using the carbon fiber (continuous line) and the other oneby using the MRI Plexiglas bed (dashed line).
Fig. 6. Intensity profiles through the 1, 2, 3, 4, and 5 hot rods of the NEMAImage Quality phantom from MRI data (in black) and PET data (in light grey).
formed with the carbon fiber bed (continuous line) and the MRIPlexiglas bed (dashed line), respectively. The IQ profile ob-tained with the Plexiglas bed shows a global attenuation of about15%.Fig. 6 shows how partial volume effects and resolution limits
[17] do not enable the smallest hole (1 mm ) to be visualizedon the PET image. On the other hand, the MRI higher spatialresolution managed to identify all the IQ rods.In terms of quantification, PET’s underestimation of the ac-
tivity concentration increased with a reduction in object size,approaching 90% for a 1 mm rod. On the other hand, the MRIintensity profiles through the diameter of the five IQ fillable rodsare nearly constant.
B. In Vivo Imaging
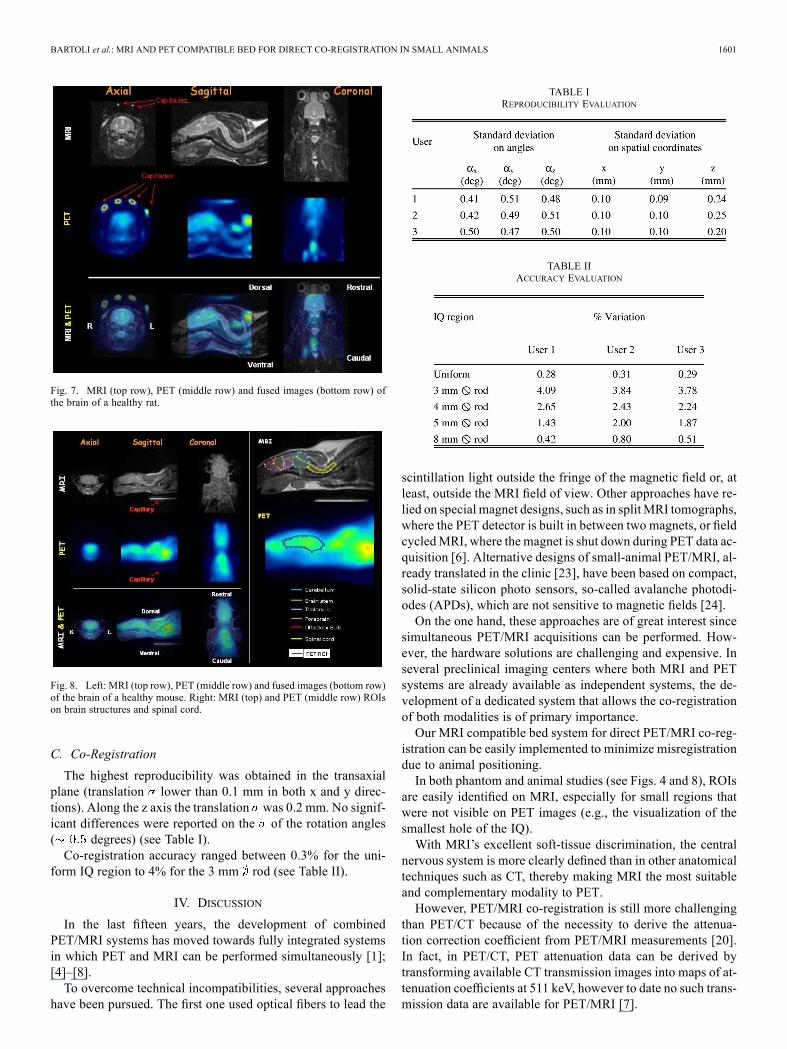
In vivo PET/MRI data were easily co-registered using theexternal markers that were clearly visible in the images (Figs. 7and 8).In spite of the poor spatial resolution of the PET images, dif-
ferent brain structures were clearly distinguished on the co-reg-istered 3D MRI images acquired with a spatial resolution of
(Fig. 8).
BARTOLI et al.: MRI AND PET COMPATIBLE BED FOR DIRECT CO-REGISTRATION IN SMALL ANIMALS 1601
Fig. 7. MRI (top row), PET (middle row) and fused images (bottom row) ofthe brain of a healthy rat.
Fig. 8. Left: MRI (top row), PET (middle row) and fused images (bottom row)of the brain of a healthy mouse. Right: MRI (top) and PET (middle row) ROIson brain structures and spinal cord.
C. Co-Registration
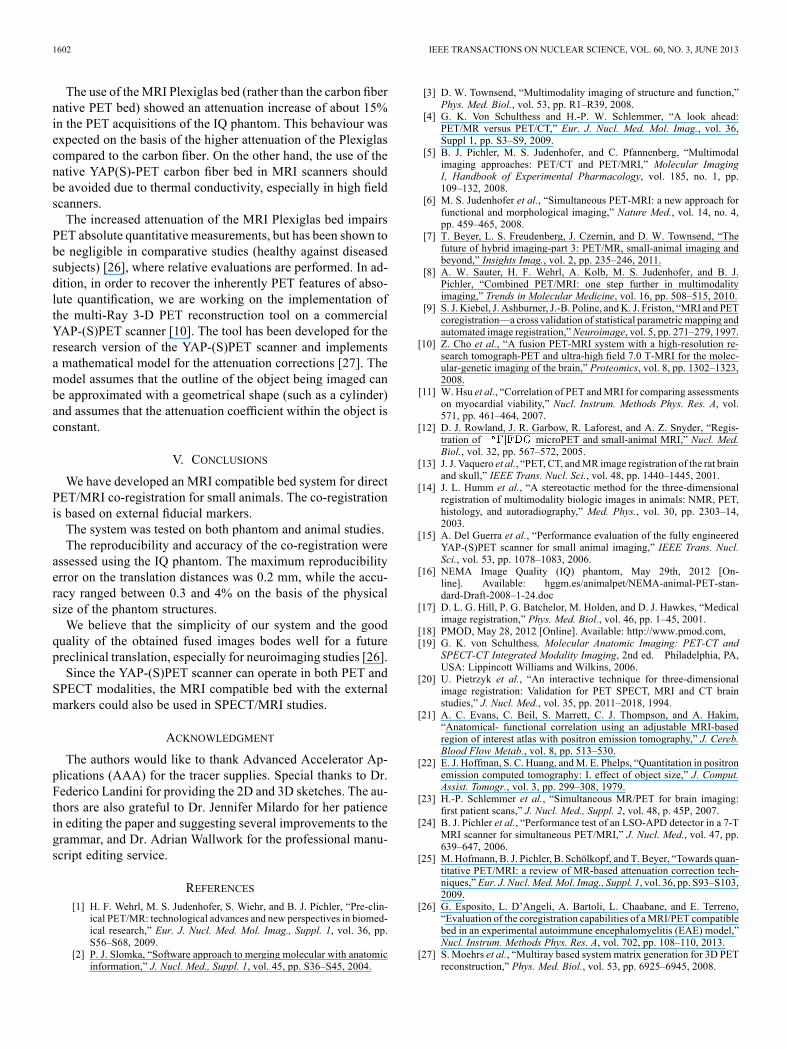
The highest reproducibility was obtained in the transaxialplane (translation lower than 0.1 mm in both x and y direc-tions). Along the z axis the translation was 0.2 mm. No signif-icant differences were reported on the of the rotation angles( degrees) (see Table I).Co-registration accuracy ranged between 0.3% for the uni-
form IQ region to 4% for the 3 mm rod (see Table II).
IV. DISCUSSION
In the last fifteen years, the development of combinedPET/MRI systems has moved towards fully integrated systemsin which PET and MRI can be performed simultaneously [1];[4]–[8].To overcome technical incompatibilities, several approaches
have been pursued. The first one used optical fibers to lead the
TABLE IREPRODUCIBILITY EVALUATION
TABLE IIACCURACY EVALUATION
scintillation light outside the fringe of the magnetic field or, atleast, outside the MRI field of view. Other approaches have re-lied on special magnet designs, such as in splitMRI tomographs,where the PET detector is built in between two magnets, or fieldcycledMRI, where the magnet is shut down during PET data ac-quisition [6]. Alternative designs of small-animal PET/MRI, al-ready translated in the clinic [23], have been based on compact,solid-state silicon photo sensors, so-called avalanche photodi-odes (APDs), which are not sensitive to magnetic fields [24].On the one hand, these approaches are of great interest since
simultaneous PET/MRI acquisitions can be performed. How-ever, the hardware solutions are challenging and expensive. Inseveral preclinical imaging centers where both MRI and PETsystems are already available as independent systems, the de-velopment of a dedicated system that allows the co-registrationof both modalities is of primary importance.Our MRI compatible bed system for direct PET/MRI co-reg-
istration can be easily implemented to minimize misregistrationdue to animal positioning.In both phantom and animal studies (see Figs. 4 and 8), ROIs
are easily identified on MRI, especially for small regions thatwere not visible on PET images (e.g., the visualization of thesmallest hole of the IQ).With MRI’s excellent soft-tissue discrimination, the central
nervous system is more clearly defined than in other anatomicaltechniques such as CT, thereby making MRI the most suitableand complementary modality to PET.However, PET/MRI co-registration is still more challenging
than PET/CT because of the necessity to derive the attenua-tion correction coefficient from PET/MRI measurements [20].In fact, in PET/CT, PET attenuation data can be derived bytransforming available CT transmission images into maps of at-tenuation coefficients at 511 keV, however to date no such trans-mission data are available for PET/MRI [7].
1602 IEEE TRANSACTIONS ON NUCLEAR SCIENCE, VOL. 60, NO. 3, JUNE 2013
The use of the MRI Plexiglas bed (rather than the carbon fibernative PET bed) showed an attenuation increase of about 15%in the PET acquisitions of the IQ phantom. This behaviour wasexpected on the basis of the higher attenuation of the Plexiglascompared to the carbon fiber. On the other hand, the use of thenative YAP(S)-PET carbon fiber bed in MRI scanners shouldbe avoided due to thermal conductivity, especially in high fieldscanners.The increased attenuation of the MRI Plexiglas bed impairs
PET absolute quantitative measurements, but has been shown tobe negligible in comparative studies (healthy against diseasedsubjects) [26], where relative evaluations are performed. In ad-dition, in order to recover the inherently PET features of abso-lute quantification, we are working on the implementation ofthe multi-Ray 3-D PET reconstruction tool on a commercialYAP-(S)PET scanner [10]. The tool has been developed for theresearch version of the YAP-(S)PET scanner and implementsa mathematical model for the attenuation corrections [27]. Themodel assumes that the outline of the object being imaged canbe approximated with a geometrical shape (such as a cylinder)and assumes that the attenuation coefficient within the object isconstant.
V. CONCLUSIONS
We have developed an MRI compatible bed system for directPET/MRI co-registration for small animals. The co-registrationis based on external fiducial markers.The system was tested on both phantom and animal studies.The reproducibility and accuracy of the co-registration were
assessed using the IQ phantom. The maximum reproducibilityerror on the translation distances was 0.2 mm, while the accu-racy ranged between 0.3 and 4% on the basis of the physicalsize of the phantom structures.We believe that the simplicity of our system and the good
quality of the obtained fused images bodes well for a futurepreclinical translation, especially for neuroimaging studies [26].Since the YAP-(S)PET scanner can operate in both PET and
SPECT modalities, the MRI compatible bed with the externalmarkers could also be used in SPECT/MRI studies.
ACKNOWLEDGMENT
The authors would like to thank Advanced Accelerator Ap-plications (AAA) for the tracer supplies. Special thanks to Dr.Federico Landini for providing the 2D and 3D sketches. The au-thors are also grateful to Dr. Jennifer Milardo for her patiencein editing the paper and suggesting several improvements to thegrammar, and Dr. Adrian Wallwork for the professional manu-script editing service.
REFERENCES[1] H. F. Wehrl, M. S. Judenhofer, S. Wiehr, and B. J. Pichler, “Pre-clin-
ical PET/MR: technological advances and new perspectives in biomed-ical research,” Eur. J. Nucl. Med. Mol. Imag., Suppl. 1, vol. 36, pp.S56–S68, 2009.
[2] P. J. Slomka, “Software approach to merging molecular with anatomicinformation,” J. Nucl. Med., Suppl. 1, vol. 45, pp. S36–S45, 2004.
[3] D. W. Townsend, “Multimodality imaging of structure and function,”Phys. Med. Biol., vol. 53, pp. R1–R39, 2008.
[4] G. K. Von Schulthess and H.-P. W. Schlemmer, “A look ahead:PET/MR versus PET/CT,” Eur. J. Nucl. Med. Mol. Imag., vol. 36,Suppl 1, pp. S3–S9, 2009.
[5] B. J. Pichler, M. S. Judenhofer, and C. Pfannenberg, “Multimodalimaging approaches: PET/CT and PET/MRI,” Molecular ImagingI, Handbook of Experimental Pharmacology, vol. 185, no. 1, pp.109–132, 2008.
[6] M. S. Judenhofer et al., “Simultaneous PET-MRI: a new approach forfunctional and morphological imaging,” Nature Med., vol. 14, no. 4,pp. 459–465, 2008.
[7] T. Beyer, L. S. Freudenberg, J. Czernin, and D. W. Townsend, “Thefuture of hybrid imaging-part 3: PET/MR, small-animal imaging andbeyond,” Insights Imag., vol. 2, pp. 235–246, 2011.
[8] A. W. Sauter, H. F. Wehrl, A. Kolb, M. S. Judenhofer, and B. J.Pichler, “Combined PET/MRI: one step further in multimodalityimaging,” Trends in Molecular Medicine, vol. 16, pp. 508–515, 2010.
[9] S. J. Kiebel, J. Ashburner, J.-B. Poline, andK. J. Friston, “MRI and PETcoregistration—a cross validation of statistical parametric mapping andautomated image registration,”Neuroimage, vol. 5, pp. 271–279, 1997.
[10] Z. Cho et al., “A fusion PET-MRI system with a high-resolution re-search tomograph-PET and ultra-high field 7.0 T-MRI for the molec-ular-genetic imaging of the brain,” Proteomics, vol. 8, pp. 1302–1323,2008.
[11] W. Hsu et al., “Correlation of PET andMRI for comparing assessmentson myocardial viability,” Nucl. Instrum. Methods Phys. Res. A, vol.571, pp. 461–464, 2007.
[12] D. J. Rowland, J. R. Garbow, R. Laforest, and A. Z. Snyder, “Regis-tration of microPET and small-animal MRI,” Nucl. Med.Biol., vol. 32, pp. 567–572, 2005.
[13] J. J. Vaquero et al., “PET, CT, andMR image registration of the rat brainand skull,” IEEE Trans. Nucl. Sci., vol. 48, pp. 1440–1445, 2001.
[14] J. L. Humm et al., “A stereotactic method for the three-dimensionalregistration of multimodality biologic images in animals: NMR, PET,histology, and autoradiography,” Med. Phys., vol. 30, pp. 2303–14,2003.
[15] A. Del Guerra et al., “Performance evaluation of the fully engineeredYAP-(S)PET scanner for small animal imaging,” IEEE Trans. Nucl.Sci., vol. 53, pp. 1078–1083, 2006.
[16] NEMA Image Quality (IQ) phantom, May 29th, 2012 [On-line]. Available: hggm.es/animalpet/NEMA-animal-PET-stan-dard-Draft-2008–1-24.doc
[17] D. L. G. Hill, P. G. Batchelor, M. Holden, and D. J. Hawkes, “Medicalimage registration,” Phys. Med. Biol., vol. 46, pp. 1–45, 2001.
[18] PMOD, May 28, 2012 [Online]. Available: http://www.pmod.com,[19] G. K. von Schulthess, Molecular Anatomic Imaging: PET-CT and
SPECT-CT Integrated Modality Imaging, 2nd ed. Philadelphia, PA,USA: Lippincott Williams and Wilkins, 2006.
[20] U. Pietrzyk et al., “An interactive technique for three-dimensionalimage registration: Validation for PET SPECT, MRI and CT brainstudies,” J. Nucl. Med., vol. 35, pp. 2011–2018, 1994.
[21] A. C. Evans, C. Beil, S. Marrett, C. J. Thompson, and A. Hakim,“Anatomical- functional correlation using an adjustable MRI-basedregion of interest atlas with positron emission tomography,” J. Cereb.Blood Flow Metab., vol. 8, pp. 513–530.
[22] E. J. Hoffman, S. C. Huang, andM. E. Phelps, “Quantitation in positronemission computed tomography: I. effect of object size,” J. Comput.Assist. Tomogr., vol. 3, pp. 299–308, 1979.
[23] H.-P. Schlemmer et al., “Simultaneous MR/PET for brain imaging:first patient scans,” J. Nucl. Med., Suppl. 2, vol. 48, p. 45P, 2007.
[24] B. J. Pichler et al., “Performance test of an LSO-APD detector in a 7-TMRI scanner for simultaneous PET/MRI,” J. Nucl. Med., vol. 47, pp.639–647, 2006.
[25] M.Hofmann, B. J. Pichler, B. Schölkopf, and T. Beyer, “Towards quan-titative PET/MRI: a review of MR-based attenuation correction tech-niques,”Eur. J. Nucl.Med.Mol. Imag., Suppl. 1, vol. 36, pp. S93–S103,2009.
[26] G. Esposito, L. D’Angeli, A. Bartoli, L. Chaabane, and E. Terreno,“Evaluation of the coregistration capabilities of aMRI/PET compatiblebed in an experimental autoimmune encephalomyelitis (EAE) model,”Nucl. Instrum. Methods Phys. Res. A, vol. 702, pp. 108–110, 2013.
[27] S. Moehrs et al., “Multiray based system matrix generation for 3D PETreconstruction,” Phys. Med. Biol., vol. 53, pp. 6925–6945, 2008.