![Accuracy of distinguishing between dysembryoplastic neuroepithelial tumors and other epileptogenic brain neoplasms with [11C]methionine PET](https://static.fdokumen.com/doc/165x107/63360da5cd4bf2402c0b568c/accuracy-of-distinguishing-between-dysembryoplastic-neuroepithelial-tumors-and-other.jpg)
MR-Less Surface-Based Amyloid Assessment Based on 11C PiB PET
14
MR-Less Surface-Based Amyloid Assessment Based on 11 C PiB PET Luping Zhou 1,3 *, Olivier Salvado 1 , Vincent Dore 1 , Pierrick Bourgeat 1 , Parnesh Raniga 1 , S. Lance Macaulay 4 , David Ames 6,7 , Colin L. Masters 5 , Kathryn A. Ellis 5,7 , Victor L. Villemagne 2 , Christopher C. Rowe 2 , Jurgen Fripp 1 , AIBL Research Group " 1 CSIRO Preventative Health Flagship, CSIRO Computational Informatics, The Australian e-Health Research Centre, Herston, Australia, 2 Department of Nuclear Medicine and Centre for PET, Austin Hospital, Heidelberg, Australia, 3 Department of Computer Science and Software Engineering, University of Wollongong, Wollongong, Australia, 4 CSIRO Preventative-Health National Research Flagship, Parkville, Australia, 5 Mental Health Research Institute/Florey Institute of Neuroscience and Mental Health, The University of Melbourne, Parkville, Australia, 6 National Ageing Research Institute, Parkville, Australia, 7 Academic Unit for Psychiatry of Old Age, Department of Psychiatry, The University of Melbourne, Kew, Parkville, Australia Abstract Background: b-amyloid (Ab) plaques in brain’s grey matter (GM) are one of the pathological hallmarks of Alzheimer’s disease (AD), and can be imaged in vivo using Positron Emission Tomography (PET) with 11 C or 18 F radiotracers. Estimating Ab burden in cortical GM has been shown to improve diagnosis and monitoring of AD. However, lacking structural information in PET images requires such assessments to be performed with anatomical MRI scans, which may not be available at different clinical settings or being contraindicated for particular reasons. This study aimed to develop an MR-less Ab imaging quantification method that requires only PET images for reliable Ab burden estimations. Materials and Methods: The proposed method has been developed using a multi-atlas based approach on 11 C-PiB scans from 143 subjects (75 PiB+ and 68 PiB- subjects) in AIBL study. A subset of 20 subjects (PET and MRI) were used as atlases: 1) MRI images were co-registered with tissue segmentation; 2) 3D surface at the GM-WM interfacing was extracted and registered to a canonical space; 3) Mean PiB retention within GM was estimated and mapped to the surface. For other participants, each atlas PET image (and surface) was registered to the subject’s PET image for PiB estimation within GM. The results are combined by subject-specific atlas selection and Bayesian fusion to generate estimated surface values. Results: All PiB+ subjects (N = 75) were highly correlated between the MR-dependent and the PET-only methods with Intraclass Correlation (ICC) of 0.94, and an average relative difference error of 13% (or 0.23 SUVR) per surface vertex. All PiB- subjects (N = 68) revealed visually akin patterns with a relative difference error of 16% (or 0.19 SUVR) per surface vertex. Conclusion: The demonstrated accuracy suggests that the proposed method could be an effective clinical inspection tool for Ab imaging scans when MRI images are unavailable. Citation: Zhou L, Salvado O, Dore V, Bourgeat P, Raniga P, et al. (2014) MR-Less Surface-Based Amyloid Assessment Based on 11 C PiB PET. PLoS ONE 9(1): e84777. doi:10.1371/journal.pone.0084777 Editor: Karl Herholz, University of Manchester, United Kingdom Received July 26, 2013; Accepted November 18, 2013; Published January 10, 2014 Copyright: ß 2014 Zhou et al. This is an open-access article distributed under the terms of the Creative Commons Attribution License, which permits unrestricted use, distribution, and reproduction in any medium, provided the original author and source are credited. Funding: Core funding for the AIBL study was provided by the CSIRO (http://www.csiro.au/) Flagship Collaboration Fund and the Science and Industry Endowment Fund (SIEF http://www.sief.org.au/) in partnership with Edith Cowan University (https://www.ecu.edu.au/), Florey neuro-sciences and Mental Health Research institutes (http://www.florey.edu.au/), Alzheimer’s Australia (http://www.fightdementia.org.au/), National Age-ing Research Institute (http://www.mednwh. unimelb.edu.au/), Austin Health (http://www.austin.org.au/), CogState Ltd. (http://cogstate.com/), Hollywood Private Hospital (http://www.hollywood. ramsayhealth.com.au/), Sir Charles Gardner Hospital (http://www.scgh.health.wa.gov.au/). The AIBL study also receives funding from the National Health and Medical Research Council (http://www.nhmrc.gov.au/), the Dementia Collaborative Research Centers program (http://www.fightdementia.org.au/victoria/ dementia-collaborative-research-centres-1.aspx), The McCusker Alzheimer’s Research Foundation (http://alzheimers.com.au/) and Operational Infrastructure Support from the Government of Victoria (http://www.vic.gov.au/), Australia. Pfizer International (http://www.pfizer.com.au/default.aspx) has contributed financial support to AIBL to assist with analysis of blood samples and to further the AIBL research program. The funders had no role in study design and data analysis, decision to publish, or preparation of this manuscript. Competing Interests: Luping Zhou, Olivier Salvado, Vincent Dore, Pierrick Bourgeat, Victor L. Villemagne, Christopher C. Rowe, Jurgen Fripp might be listed as co-inventor in a patent that has been lodged describing a technology using techniques described in this manuscript. The authors’ patent application name is: Method and apparatus for the assessment of medical images. The patent application number is: PCT/AU2012/001536. More information could be found from this link: http://www.google.com/patents/WO2013086580A1?cl = en CogState Ltd. (http://cogstate.com/), Hollywood Private Hospital (http://www.hollywood. ramsayhealth.com.au/) and Sir Charles Gardner Hospital (http://www.scgh.health.wa.gov.au/) have contributed to the financial support of AIBL study through the partnership with the Science and Industry Endowment Fund (SIEF http://www.sief.org.au/). Pfizer International (http://www.pfizer.com.au/default.aspx) has contributed financial support to AIBL to assist with analysis of blood samples and to further the AIBL research program. There are no further patents, products in development or marketed products to declare. This does not alter the authors’ adherence to all the PLOS ONE policies on sharing data and materials, as detailed online in the guide for authors. * E-mail: [email protected] " Membership of the AIBL Research Group is provided in the Acknowledgments. PLOS ONE | www.plosone.org 1 January 2014 | Volume 9 | Issue 1 | e84777
-
Upload
independent -
Category
Documents
-
view
4 -
download
0
Transcript of MR-Less Surface-Based Amyloid Assessment Based on 11C PiB PET
MR-Less Surface-Based Amyloid Assessment Based on11C PiB PETLuping Zhou1,3*, Olivier Salvado1, Vincent Dore1, Pierrick Bourgeat1, Parnesh Raniga1,
S. Lance Macaulay4, David Ames6,7, Colin L. Masters5, Kathryn A. Ellis5,7, Victor L. Villemagne2,
Christopher C. Rowe2, Jurgen Fripp1, AIBL Research Group"
1 CSIRO Preventative Health Flagship, CSIRO Computational Informatics, The Australian e-Health Research Centre, Herston, Australia, 2 Department of Nuclear Medicine
and Centre for PET, Austin Hospital, Heidelberg, Australia, 3 Department of Computer Science and Software Engineering, University of Wollongong, Wollongong,
Australia, 4 CSIRO Preventative-Health National Research Flagship, Parkville, Australia, 5 Mental Health Research Institute/Florey Institute of Neuroscience and Mental
Health, The University of Melbourne, Parkville, Australia, 6 National Ageing Research Institute, Parkville, Australia, 7 Academic Unit for Psychiatry of Old Age, Department
of Psychiatry, The University of Melbourne, Kew, Parkville, Australia
Abstract
Background: b-amyloid (Ab) plaques in brain’s grey matter (GM) are one of the pathological hallmarks of Alzheimer’sdisease (AD), and can be imaged in vivo using Positron Emission Tomography (PET) with 11C or 18F radiotracers. EstimatingAb burden in cortical GM has been shown to improve diagnosis and monitoring of AD. However, lacking structuralinformation in PET images requires such assessments to be performed with anatomical MRI scans, which may not beavailable at different clinical settings or being contraindicated for particular reasons. This study aimed to develop an MR-lessAb imaging quantification method that requires only PET images for reliable Ab burden estimations.
Materials and Methods: The proposed method has been developed using a multi-atlas based approach on 11C-PiB scansfrom 143 subjects (75 PiB+ and 68 PiB- subjects) in AIBL study. A subset of 20 subjects (PET and MRI) were used as atlases: 1)MRI images were co-registered with tissue segmentation; 2) 3D surface at the GM-WM interfacing was extracted andregistered to a canonical space; 3) Mean PiB retention within GM was estimated and mapped to the surface. For otherparticipants, each atlas PET image (and surface) was registered to the subject’s PET image for PiB estimation within GM. Theresults are combined by subject-specific atlas selection and Bayesian fusion to generate estimated surface values.
Results: All PiB+ subjects (N = 75) were highly correlated between the MR-dependent and the PET-only methods withIntraclass Correlation (ICC) of 0.94, and an average relative difference error of 13% (or 0.23 SUVR) per surface vertex. All PiB-subjects (N = 68) revealed visually akin patterns with a relative difference error of 16% (or 0.19 SUVR) per surface vertex.
Conclusion: The demonstrated accuracy suggests that the proposed method could be an effective clinical inspection toolfor Ab imaging scans when MRI images are unavailable.
Citation: Zhou L, Salvado O, Dore V, Bourgeat P, Raniga P, et al. (2014) MR-Less Surface-Based Amyloid Assessment Based on 11C PiB PET. PLoS ONE 9(1): e84777.doi:10.1371/journal.pone.0084777
Editor: Karl Herholz, University of Manchester, United Kingdom
Received July 26, 2013; Accepted November 18, 2013; Published January 10, 2014
Copyright: � 2014 Zhou et al. This is an open-access article distributed under the terms of the Creative Commons Attribution License, which permitsunrestricted use, distribution, and reproduction in any medium, provided the original author and source are credited.
Funding: Core funding for the AIBL study was provided by the CSIRO (http://www.csiro.au/) Flagship Collaboration Fund and the Science and IndustryEndowment Fund (SIEF http://www.sief.org.au/) in partnership with Edith Cowan University (https://www.ecu.edu.au/), Florey neuro-sciences and Mental HealthResearch institutes (http://www.florey.edu.au/), Alzheimer’s Australia (http://www.fightdementia.org.au/), National Age-ing Research Institute (http://www.mednwh.unimelb.edu.au/), Austin Health (http://www.austin.org.au/), CogState Ltd. (http://cogstate.com/), Hollywood Private Hospital (http://www.hollywood.ramsayhealth.com.au/), Sir Charles Gardner Hospital (http://www.scgh.health.wa.gov.au/). The AIBL study also receives funding from the National Health andMedical Research Council (http://www.nhmrc.gov.au/), the Dementia Collaborative Research Centers program (http://www.fightdementia.org.au/victoria/dementia-collaborative-research-centres-1.aspx), The McCusker Alzheimer’s Research Foundation (http://alzheimers.com.au/) and Operational InfrastructureSupport from the Government of Victoria (http://www.vic.gov.au/), Australia. Pfizer International (http://www.pfizer.com.au/default.aspx) has contributed financialsupport to AIBL to assist with analysis of blood samples and to further the AIBL research program. The funders had no role in study design and data analysis,decision to publish, or preparation of this manuscript.
Competing Interests: Luping Zhou, Olivier Salvado, Vincent Dore, Pierrick Bourgeat, Victor L. Villemagne, Christopher C. Rowe, Jurgen Fripp might be listed asco-inventor in a patent that has been lodged describing a technology using techniques described in this manuscript. The authors’ patent application name is:Method and apparatus for the assessment of medical images. The patent application number is: PCT/AU2012/001536. More information could be found from thislink: http://www.google.com/patents/WO2013086580A1?cl = en CogState Ltd. (http://cogstate.com/), Hollywood Private Hospital (http://www.hollywood.ramsayhealth.com.au/) and Sir Charles Gardner Hospital (http://www.scgh.health.wa.gov.au/) have contributed to the financial support of AIBL study throughthe partnership with the Science and Industry Endowment Fund (SIEF http://www.sief.org.au/). Pfizer International (http://www.pfizer.com.au/default.aspx) hascontributed financial support to AIBL to assist with analysis of blood samples and to further the AIBL research program. There are no further patents, products indevelopment or marketed products to declare. This does not alter the authors’ adherence to all the PLOS ONE policies on sharing data and materials, as detailedonline in the guide for authors.
* E-mail: [email protected]
" Membership of the AIBL Research Group is provided in the Acknowledgments.
PLOS ONE | www.plosone.org 1 January 2014 | Volume 9 | Issue 1 | e84777

Introduction
b-amyloid (Ab) plaques are one of the neuropathological
hallmarks of Alzheimer’s disease (AD), which starts accumulating
several years before the clinical phenotype of dementia is
manifested [5], [32–33]. The development of molecular imaging
agents allows assessing Ab deposition in vivo. The most widely
used Ab imaging radiotracer is Pittsburgh Compound B (11C-PiB),
which binds with high affinity and high specificity to Ab plaques
[15]. It has been shown that AD patients tend to have 50% to 90%
higher PiB retention than age-matched normal controls in cortical
brain regions such as frontal, precuneus, parietal and temporal
cortices [40], [26], [20], [8]. High PiB retention has also been
found in mild cognitive impairment (MCI) [14], and faster MCI
converters had higher PiB retention than slower converters [21].
The main brain tissues: grey matter (GM), white matter (WM),
and cerebrospinal fluid (CSF) have different degrees of PiB
retention. For example, cortical GM has marked PiB retention in
AD patients, while a much faster clearance is observed in normal
controls. On the other hand WM has non-specific retention but a
much slower clearance in both AD and normal controls [15], [9].
Recent research [39] indicated that the spatial pattern of
amyloid deposition is related to cognitive performance and may be
more informative than the biomarker of total amyloid burden.
Significantly increased PiB uptake in AD patients in the middle
frontal gyrus, posterior cingulated cortex and inferior parietal lobe
were also found good discriminators for differentiating AD
patients from normal controls [17]. Therefore, the visualization
of spatial patterns of PiB uptake would be a valuable clinical tool.
The cortical surface based visualization could provide a more
compact representation of PiB uptake than the traditional image
based visualization, which is more convenient for instant
inspections by clinicians. Similar tools are widely used to assess
glucose metabolism with Fluorodeoxyglucose (FDG-PET), and a
good example is Neurostat (NeuroStat/3D-SSP: http://128.95.65.
28/_Download). These tools benefit from the fact that FDG
uptake in the WM is very low compared to that of the GM, and
therefore a straightforward sum or maximum projection is
sufficient to estimate the GM uptake on the cortical surface. This
assumption does not hold for most Ab imaging radiotracers,
including PiB, which have significant retention in the WM, and
therefore the 3D surface separating WM and GM is not well-
defined and has to be estimated. This problem is compounded by
the observations that individuals with low PiB retention show a
lower signal in the GM than in the WM as opposed to individuals
with high PiB retention where the GM signal is higher than the
one in the WM. Those issues are very challenging as PET imaging
lacks anatomical details and resolution to distinguish the GM/
WM interface. As a result, Magnetic Resonance Imaging (MRI) is
often used for the correct sampling of GM regions [38], [10], [13].
This involves segmenting the brain into GM and WM masks, and
extracting the separating surface. This surface is then registered to
the subject PET scan where GM PiB retention can be measured
and displayed.
In standard clinical setups, when PET Ab imaging scans are
visually assessed, MRI scans are not always available (e.g. different
system, MRI scan done later) or might be contraindicated (e.g.
presence of metallic implants, claustrophobia, pathological trem-
or). This paper proposes a method to estimate the PiB retention on
the cortical surface without the need of an MRI scan. Our
proposed ‘‘PET-only’’ approach is compared to the standard
method where MRI is available, which we refer to as the MRI-
dependent method.
A PET-only method was reported in [16]. It employed a single
MRI atlas with segmented tissues, co-registered to a PET atlas
from the same subject. When a new subject PET was registered to
the PET atlas, the MRI atlas could be aligned using the same
transform to estimate the GM. The maximal PiB retention within
the subject GM was measured along the normal direction of the
brain surface. The selection of that single atlas remains an issue
and may affect the performance of the method.
We hypothesize that using multiple atlases and a probabilistic
estimation of the GM would allow PiB retention to be estimated
accurately so that acquiring an additional MRI is unnecessary. We
extend this concept by allowing spatially ‘‘local’’ atlas selection,
where the selected atlases are locally combined at each brain
surface location using a Bayesian framework to improve the
posterior probability of the estimation. This essentially provides a
localized linear weighting for each atlas. In addition, we introduce
a ‘‘soft’’ tissue probability map to locally guide the estimation of
the PiB retention. With these strategies, the PiB retention can be
estimated directly from the PET image alone, without explicit
segmentation of grey matter.
In this study, we do not evaluate the estimated PiB uptake to
classify AD from NC as it has already been reported that the
spatial pattern of grey matter PiB uptake (with the use of MRI)
could be employed for classifying the risk of developing AD [17],
and different classification schemes bring different classification
accuracies. Such a divergence would not inform on the accuracy of
our proposed PiB estimate method. Instead, we focus on validating
the agreement of the proposed PET-only method with the
traditional MR-dependent method. As long as the estimation
discrepancy of the two methods is minimized, classification
schemes that are applicable to PiB uptake estimated by the MR-
dependent method can be potentially transported to that by the
PET-only method.
Materials and Methods
Ethics StatementAll the data were obtained from the Australian Imaging
Biomarkers and Lifestyle study [7]. The complete listing of
AIBL investigators is available at. Core funding for the AIBL study
was provided by the CSIRO (http://www.csiro.au/) Flagship
Collaboration Fund and the Science and Industry Endowment
Fund (SIEF http://www.sief.org.au/) in partnership with Edith
Cowan University (https://www.ecu.edu.au/), Florey neurosci-
ences and Mental Health Research institutes (http://www.florey.
edu.au/), Alzheimer’s Australia (http://www.fightdementia.
org.au/), National Ageing Research Institute (http://www.
mednwh.unimelb.edu.au/), Austin Health (http://www.austin.
org.au/), CogState Ltd. (http://cogstate.com/), Hollywood Pri-
vate Hospital (http://www.hollywood.ramsayhealth.com.au/),
Sir Charles Gardner Hospital (http://www.scgh.health.wa.gov.
au/). The AIBL study also receives funding from the National
Health and Medical Research Council (http://www.nhmrc.gov.
au/), the Dementia Collaborative Research Centers program
(http://www.fightdementia.org.au/victoria/dementia-collaborative-
research-centres-1.aspx), The McCusker Alzheimer’s Research
Foundation (http://alzheimers.com.au/) and Operational Infra-
structure Support from the Government of Victoria (http://
www.vic.gov.au/), Australia. Pfizer International (http://www.
pfizer.com.au/default.aspx) has contributed financial support to
AIBL to assist with analysis of blood samples and to further the
AIBL research program.
MR-Less Surface-Based Amyloid Assessment
PLOS ONE | www.plosone.org 2 January 2014 | Volume 9 | Issue 1 | e84777

ParticipantsPiB scans from 143 subjects from the AIBL study were used.
The AIBL dataset is available online in LONI image data archive
(https://ida.loni.ucla.edu/login.jsp?project = AIBL).These subjects
underwent both MR and PiB-PET scans at the Austin Hospital
(Melbourne). Approval for the study was obtained from the
Austin Health Human Research Ethics Committee and St
Vincent’s Health Research Ethics Committee, and written
informed consent for participation was obtained for each subject
prior to the scans.
T1-weighted MRI were obtained using the ADNI magnetiza-
tion prepared rapid gradient echo protocol at 3T, with in-plane
resolution 161 mm and 1.2 mm slice thickness. The PiB-PET
scans were acquired using an Allegro PET camera (Phillips,
Amsterdam, the Netherlands). Each participant was injected with
370 MBq of 11C-PiB, and a 30-minute acquisition in 3D mode
was performed starting 40 minutes after injection (665-minute
frames). A transmission scan was performed for attenuation
correction. PET images were reconstructed using a 3D RAMLA
algorithm. More description about the PET imaging was given in
[26].
All 143 subjects were categorized into either PiB+ (‘‘AD-like’’)
or PiB- (‘‘Control-like’’) groups according to their neocortical
standard uptake value ratio (SUVR). SUVR is defined as the ratio
of the regional brain PiB retention to the average of cerebellar
cortex area [24], [18], [12]. In this study, the neocortical SUVR
value was summarized using the mean SUVR in the GM masked
neocortical region composed of the frontal, superior parietal,
lateral temporal, occipital and anterior and posterior cingulated
regions of the AAL ROI atlas [35]. This is consistent with [27]
where similar ROIs were used for SUVR computation for the
AIBL dataset. Following [27], subjects with neocortical SUVR
greater than 1.5 were labeled PiB+ and those with neocortical
SUVR equal or less than 1.5 were labeled PiB-. The cut-off value
of 1.5 was also used by in [11], [30]. In order to get a more
detailed assessment, each image group is further subdivided into
those PiB- with a neocortical SUVR above and below 1.3, and
those PiB+ with a neocortical SUVR above and below 2.0. The
demographic information about the subjects is presented in
Table 1. They include 38 AD subjects, 37 MCI subjects, 65
normal control subjects, and 3 unclassified subjects.
We sorted all subjects according to their SUVRs and uniformly
sampled a subset of 20 cases (with both MRI and PET images)
from the sorted list as an atlas set. In this way, the atlas set was
drawn from the full range of PiB SUVR (Table 2). The atlas set
includes 5 AD subjects, 5 MCI subjects, and 10 normal control
subjects.
MethodsAn overview of the method is shown in Figure 1 and briefly
described here.
For each new subject (without MRI),
N 1)Align priors: the PET image was aligned to each atlas PET
image (Section ‘‘Affine registration of PET images’’), which
includes a GM tissue probability, and a cortical surface. The
generation of these atlases is described in Section ‘‘Atlas
generation’’.
N 2)Locally and adaptively select optimal M atlases for each
cortical location (Section ‘‘Local atlas selection’’).
N 3)Generate consensus PiB estimate for each region using a
Bayesian framework (Section ‘‘Surface-based estimation by
multi-atlas fusion’’).
The final output from this approach is a cortical surface (with
atlas correspondence) with each vertex encoding the raw PiB
retention estimation for that location.
This surface can then be SUVR normalized [24], [4] and used
in visual reading (e.g. for clinical diagnosis) or used in population
studies.
Atlas generation. The atlas set comprised twenty subjects
with both PET and MR images (the atlases). All the atlases images
were spatially normalized in two steps i) rigid registration [22]
between the PET and MR images of the same subject; and ii) a
non-linear registration [28] between the MR images of different
subjects to the MNI space [19]. The aligned MRI images were
further segmented into GM, WM and CSF tissue maps by the
implementation of the segmentation algorithm in [2] with
topological constraints that force the GM to be a continuous
layer covering the WM [29]. GM segmentation was also
topologically corrected in deep sulci [29]. A surface between
GM and WM was computed using an expectation maximization
scheme [2]. The cortical correspondence among the population of
GM-WM atlas surfaces was computed using a multi-scale non–
rigid surface registration EM-ICP algorithm [6]. An arbitrary
surface was selected as the reference, with all other atlas surfaces
registered and resampled. Each surface mesh consisted of 81922
vertices.
Affine registration of PET images. Each subject PET
image was aligned to the 20 PET atlases using an affine
registration based on block matching of feature points in PET
images [22]. This method iteratively pairs image blocks, computes
the corresponding transformation via maximizing normalized
cross correlation, and then transforms the feature points accord-
ingly until convergence. After registration, the surface and the
probability maps were propagated into subject space.
Table 1. Demographic information.
SUVR ,1.3 1.3,1.5 1.5,2.0 .2.0 PiB- PiB+
Number of subjects Total (Female) 36 (21) 32 (14) 17 (11) 58 (26) 68 (35) 75 (37)
Age mean (STD) 74.2 (6.5) 73.2 (7.2) 70.4 (12.3) 76.1 (8.6) 73.7 (6.8) 74.8 (9.8)
MMSE mean (STD) 28.2 (2.0) 27.7 (2.7) 25.8 (3.5) 25.4 (5.1) 27.9 (2.4) 25.5 (4.8)
doi:10.1371/journal.pone.0084777.t001
Table 2. SUVR of Atlases.
SUVR ,1.3 1.3,1.6 1.6,2.0 .2.0 PiB- PiB+
No. of Atlases 4 5 3 8 9 11
doi:10.1371/journal.pone.0084777.t002
MR-Less Surface-Based Amyloid Assessment
PLOS ONE | www.plosone.org 3 January 2014 | Volume 9 | Issue 1 | e84777

Local atlas selection. To account for differences between
the subject and the 20 atlases, only 10 atlases were selected using
local matching. For each surface vertex, PET image similarity
between the subject and an atlas was computed in a 30630630
(voxels) neighborhood by normalized mutual information (NMI)
[31]. The ten most similar atlas PET images were selected to
generate the final estimation at each vertex via a Bayesian fusion
scheme explained in the next section.
Surface-based estimation by multi-atlas fusion. Given a
PET image I xð Þ, where x denotes an image voxel, we aimed at
measuring the mean PiB retention in grey matter along the normal
direction of the transformed atlas surface ST. That equals to
estimate the expectation Ex[D d I,x,lð Þ½ �, where d I,x,lð Þ is an
indicator function:
d I,x,lð Þ~I xð Þ, forl~1
0, elsewhere:
�
The symbol D denotes the intersection of the line along the
normal direction of a surface vertex v and the PET image I. The
symbol l is the tissue label, representing GM, WM and CSF with
the values of 1, 2 and 3, respectively. Taking discrete probability,
we have
Ex[D d I,x,lð Þ½ �~Xx[D
I xð ÞP l~1DI,xð ÞP I,xð Þ: ð1Þ
Assuming that x is evenly sampled from D, the probability
P I,xð Þ~ 1Dj j, where |D| is the length of D. The posterior label
probability P lDI,xð Þ was estimated from the transformed atlases
ATi (i = 1 ? ? ? n, with n the number of atlases selected in Section
‘‘Local atlas selection’’ by marginalizing the joint probability
P l,ATi DI,x
� �:
P lDI,xð Þ~Xn
i~1
P l,ATi DI,x
� �~Xn
i~1
P lDATi ,I,x
� �P AT
i DI,x� �
: ð2Þ
P lDATi ,I,x
� �represents the probability for the voxel x to be GM
in the transformed atlas ATi , which was obtained in our case from
the transformed atlas probability maps. The probability
P ATi DI,x
� �measures the probability of the voxel x to be well
aligned between the test image I and the transformed atlasATi .
In our approach, P ATi DI,x
� �was set proportional to the
reciprocal of the metric of normalized mutual information
estimated locally within the neighborhood N xð Þ of x. That is,
Figure 1. Overview of the proposed method.doi:10.1371/journal.pone.0084777.g001
MR-Less Surface-Based Amyloid Assessment
PLOS ONE | www.plosone.org 4 January 2014 | Volume 9 | Issue 1 | e84777
P ATi DI,x
� �~P AT
i DI,N xð Þ� �
. As mentioned in Section ‘‘Local atlas
selection’’, the size of N xð Þ should be large to avoid fitting noise
but small enough to fit local information. In our approach, N xð Þwas set to be 30630630 (voxels), covering all the voxels along the
line D. Therefore, P ATi DI,N xð Þ
� �was constant with respect to the
variable x (x M D).
Combining (1) and (2), we have
Ex[D d I,x,lð Þ½ �~ 1
Dj jXx[D
I xð ÞP l~1DI,xð Þ
~1
Dj jXx[D
I xð ÞXn
i~1
P l~1DATi ,I,x
� �P AT
i DI,x� � !
~Xn
i~1
P ATi DI,N xð Þ
� � 1
Dj jXx[D
I xð ÞP l~1DATi ,I,x
� � !: ð3Þ
Equation (3) shows the additive property for the estimation of
the mean PiB retention at each surface vertex: the estimation from
multiple atlases can be attained by independent estimation from
each single atlas and then linearly combined in a weighted scheme.
The combination weights P ATi DI,N xð Þ
� �reflect the alignment
between the test image and the transformed atlasATi . As the
alignment is assessed by local metric, such a combination is
nonlinear for the whole surface. This additive property is
important for our approach where the atlas set needs to be
dynamically determined. It makes the switch of selected atlases
easy by confining the changes to the affected atlases only, thus
being computationally efficient.
SUVR Normalization. PiB retention was normalized using
SUVR [24], [18], [12]. The intensity values I xð Þ in the original
PET image were homogeneously scaled by a parameter k. As NMI
matches structures instead of intensity values, P ATi DI,N xð Þ
� �is
invariant to k, and so is the GM probability P l~1DATi ,I,x
� �.
Thus, we have
Ex[D d I,x,lð Þ½ �~kXn
i~1
P ATi DI,N xð Þ
� � 1
Dj jXx[D
I xð ÞP l~1DATi ,I,x
� � !, ð4Þ
where k is determined by SUVR. Eqn. (4) shows that when
SUVR changes, our estimation (3) can be simply scaled by the
parameter k. Methods to perform PET-only SUVR normalization
were proposed in [24], [4], which can segment the cerebellum in
PET images without MRI.
Surface Visualization. AD patients usually have higher Abburdens than the healthy population. Such difference can be
converted into z-scores based on the mean and standard deviation
of the Ab burden in PiB- healthy subjects. To facilitate clinical
inspection, surface based z-score maps were generated, so that the
unusual Ab accumulation could be immediately identified and
localized. Once the z-score maps were computed for each subject,
the left and right hemispheres were assembled and visualized from
six perspectives to generate a clinician friendly report.
ValidationThe proposed method was compared to the MRI-dependent
method, which is illustrated in Figure 2. The MRI image of each
subject was segmented into three tissues of GM, WM and CSF
(same as in the proposed method). The surface of MRI GM/WM
interface was extracted and registered with the atlas surfaces using
the multi-resolution EM-ICP method as described in Section
‘‘Atlas generation’’. The subject surface (used in MRI-dependent
method) and the atlas surface (used in the proposed PET-only
method) share the same number of corresponding vertices
allowing direct comparison. PiB retention was measured along
the normal directions of the subject surface and averaged within
the MRI GM mask. The obtained mean PiB retention was
mapped onto the subject surface and visualized as in the proposed
method.
The difference in PiB estimation between the MRI-dependent
and the proposed methods was measured by absolute values (abs)
or ratios (%) averaged over the total subjects. Such measurements
were conducted at both the vertex and the Region of Interest
(ROI) levels. In other words, at the vertex level we took each
vertex as the comparison unit, while at the ROI level we took each
ROI as the comparison unit. The ROIs were those from [35],
which were mapped onto the MRI.
More specifically, two errors were computed:
MeanVar absð Þ~PN
i~1
P Vj jv~1 EMRI
i,v {EPETi,v
�� ��N| Vj j ,
MeanVar %ð Þ~2PN
i~1
P Vj jv~1 EMRI
i,v {EPETi,v
�� ��=(DEMRIi,v zEPET
i,v )
N| Vj j ,
where i is the index of a subject, and EMRIi,v and EPET
i,v are the
corresponding estimations at the v-th vertex. The value of Vj j is
set to the total number of vertices within the scope of the
comparison that could be either the whole surface or a specific
ROI.
Similarly, at the ROI level, two errors were computed:
MeanVar absð Þ~PN
i~1
P Rj jj~1 REMRI
i,j {REPETi,j
��� ���N| Rj j ,
MeanVar %ð Þ~2PN
i~1
P Rj jj~1 REMRI
i,j {REPETi,j
��� ���=(DREMRIi,j zREPET
i,j )
N| Rj j ,
where j is the index of an ROI, and Rj j is the total number of the
involved ROIs. If the comparison is conducted for a specific ROI, we set
Rj j~1. Here REMRIi,j and REPET
i,j represent the averaged estimations for
the j-th ROI, which were computed as
REi,j~
P Rj
�� ��v~1 Ei,v
Rj
�� �� ,
MR-Less Surface-Based Amyloid Assessment
PLOS ONE | www.plosone.org 5 January 2014 | Volume 9 | Issue 1 | e84777
where Ei,v is defined as before, the estimation at the v-th vertex
of the i-th subject. Rj
�� �� is the size (the number of vertices) of the
j-th ROI.
Z-score estimation was validated at each surface vertex by
comparing the estimations from the MRI-dependent and the
PET-only methods. The z-score of an estimation at the v-th vertex
of the i-th subject was computed by
Zscorei,v~Ei,v{mv
sv
,
where mv is the mean and sv is the standard deviation of the
estimations at the v-th vertex from the PiB- normal subjects. Z-
score maps were used to detect the deviation of a subject from an
asymptomatic control group using the MRI-dependent estimation
of PiB retention. To calculate the z-scores of a new subject, mv and
sv were computed over all 67 PiB- normal subjects in our data set
(removing the new subject if it were PiB-). That is, for the i-th PiB-
normal subject, we assumed that the ground truth were known for
all except the i-th PiB- normal subjects, and computed the mv and
sv over these subjects. Although slightly different for different PiB-
normal subjects, the same mv and sv were used when computing
ZscoreMRIi,v and ZscorePET
i,v for a given subject i, cancelling its
influence when computing ZscoreMRIi,v {ZscorePET
i,v : The mean
and the standard deviation (STD) of the z-score differences
between the two methods were calculated as
MeanDiffzscore~
PNi~1
P Vj jv~1 ZscoreMRI
i,v {ZscorePETi,v
�� ��N| Vj j ,
STDDiffzscore~
ffiffiffiffiffiffiffiffiffiffiffiffiffiffiffiffiffiffiffiffiffiffiffiffiffiffiffiffiffiffiffiffiffiffiffiffiffiffiffiffiffiffiffiffiffiffiffiffiffiffiffiffiffiffiffiffiffiffiffiffiffiffiffiffiffiffiffiffiffiffiffiffiffiffiffiffiffiffiffiffiffiffiffiffiffiffiffiffiffiffiffiffiffiffiffiffiffiffiffiffiffiffiffiffiffiffiffiffiffiffiffiffiffiffiffiffiffiffi1
N
XN
i~1
P Vj jv~1 ZscoreMRI
i,v {ZscorePETi,v
�� ��Vj j {MeanDiffzscore
!2vuut :
As defined above, N is the number of total subjects and Vj j the
number of total surface vertices.
Results
In the following sections, results were presented by using the
MRI-dependent assessment as the ground truth. We demonstrated
the accuracy of the PET-only method for both PiB retention
estimation and z-score map estimation. Our proposed method was
also compared to a naive single-atlas based PET-only method
similar to that in [16]. In order to evaluate the performance of the
proposed Ab estimation method, the results presented used the
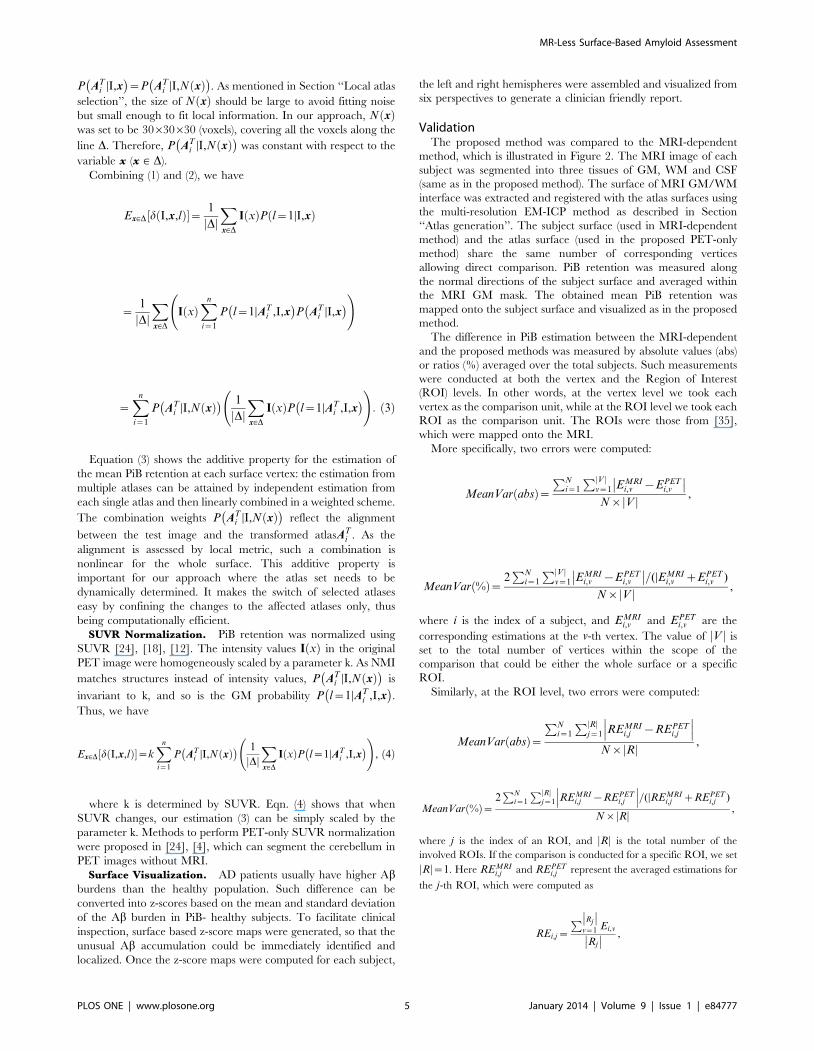
Figure 2. Illustration of the MRI-dependent method. The PiB retention is measured in the PET image within its grey matter mask obtained fromMRI tissue segmentation, and averaged along the normal direction of the GM-WM interface (overlaid on the PET image) extracted from the subject’sMRI. The mean PiB value for each surface vertex is mapped onto the surface for visualization.doi:10.1371/journal.pone.0084777.g002
MR-Less Surface-Based Amyloid Assessment
PLOS ONE | www.plosone.org 6 January 2014 | Volume 9 | Issue 1 | e84777
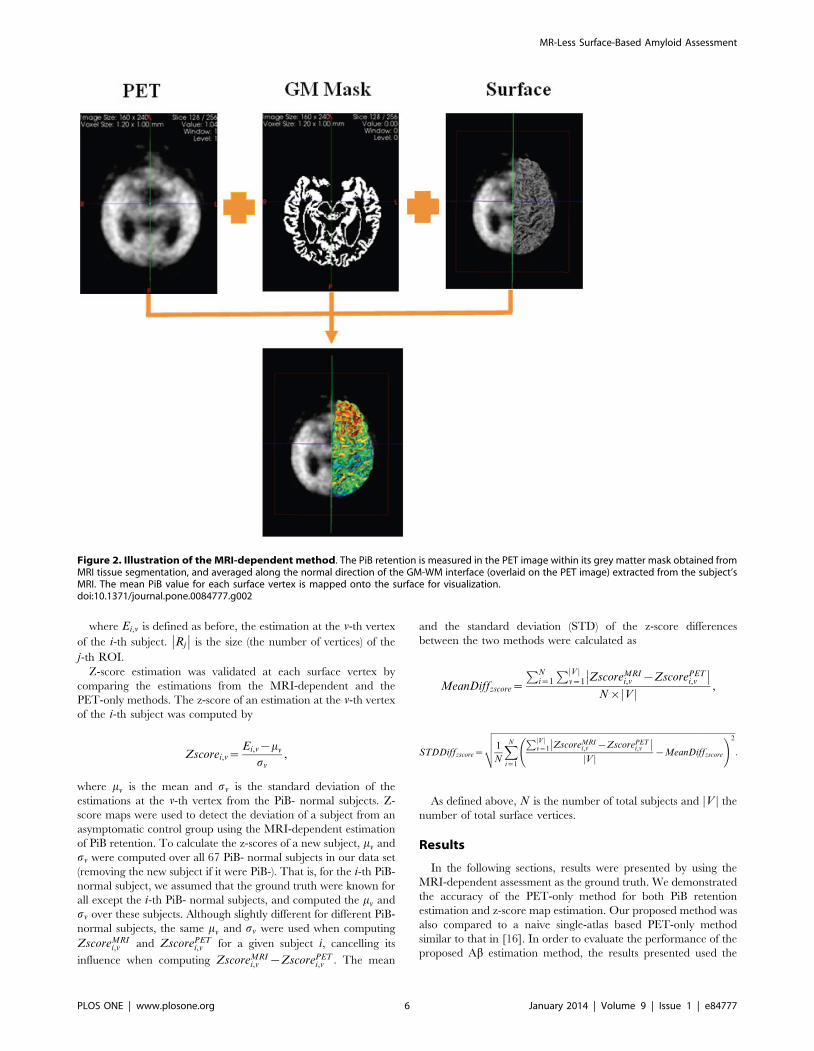
Figure 3. Visual Inspection for PiB measurements. Surface-based PiB measurements from the MRI-dependent method (the top row) and theproposed method (the bottom row) for four examples: (a) AD, (b) PiB+ NC, (c) PiB+ NC, and (d) PiB- NC.doi:10.1371/journal.pone.0084777.g003
MR-Less Surface-Based Amyloid Assessment
PLOS ONE | www.plosone.org 7 January 2014 | Volume 9 | Issue 1 | e84777

same MR-based SUVR normalization for both the MRI-
dependent and the PET-only methods.
Comparison of PiB Retention EstimationVisual inspection. Figure 3 shows four representative
examples displaying the MRI-dependent (top row) and the PET-
only (bottom row) methods: one PiB+ AD patient, one PiB+ NC
(normal control) with high PiB retention, one PiB+ NC with low
PiB retention, and one PiB- NC. The two methods present visually
similar results for each subject.
Quantitative comparison. Quantitative analysis results are
summarized in Table 3 and Table 4.
In Table 3 and Table 4, ‘‘Mean MRI’’ and ‘‘Mean PiB’’ are the
mean ROI PiB retention estimated by the MRI-dependent and
PET-only methods respectively. The estimation differences (mean
VAR) are measured at both ROI and vertex level, as shown in the
tables. The Pearson correlation and the intra-class correlation
(ICC) are computed by correlating the estimations from the two
methods at each vertex, respectively.
The PiB+ group had lower VAR ratio (2.1561.5% for ROI,
13.461.2% for vertex) than the PiB2 group (3.662.3% for ROI,
16.661.5% for vertex), as well as attaining higher Pearson
correlation/ICC (0.74/0.94) than the PiB- group (0.42/0.72).
This difference was expected, because the PiB2 group has
minimal PiB retention, a reduced dynamic range and is therefore
more susceptible to noise. The accuracy in the PiB2 group
allowed identifying similar patterns to the MRI-dependent method
(Figure 4 (d)), with an absolute VAR of 0.0460.03 for ROI, and
0.1960.02 for vertex. We also found that our estimation errors for
both groups were close to the reported reproducible errors of PiB
quantification using 30 min imaging [1] (cited in Table 3 and
Table 4).
In addition to the selected ROIs listed in Table 3 and 4, the
vertex-based mean estimation error (in ratio) and the mean
Table 3. Comparison between MRI-dependent and PET-only methods for PiB+ group (averaging over 123 subjects that are notincluded in the atlas set).
AllLateral FrontalCortex
OccipitalCortex
Lateral TemporalCortex Parietal Cortex
PosteriorCingulate Putamen
Mean MRI 1.8760.27 1.8760.28 1.8660.27 1.8760.27 1.8660.27 1.8860.28 1.8360.26
Mean PiB 1.8460.25 1.8560.25 1.8360.25 1.8460.25 1.8460.25 1.8560.25 1.8160.24
ROI
Mean VAR (abs) 0.0460.03 0.0460.03 0.0460.03 0.0460.03 0.0460.03 0.0560.04 0.0460.03
Mean VAR (%) 2.1561.5 2.2661.6 2.1361.5 2.0861.4 2.1161.5 2.4261.7 2.0461.4
*Cited Mean VAR (%) - 3.9 3.7 3.3 3.7 4.9 5.1
Vertex
Mean VAR(abs) 0.2360.04 0.2360.04 0.2360.04 0.2260.04 0.2360.04 0.2360.04 0.2360.04
Mean VAR (%) 13.461.2 13.461.2 13.361.2 13.161.2 13.461.2 13.561.5 13.661.6
Pearson Corr (R) 0.7460.06 0.7360.06 0.7460.06 0.7560.06 0.7460.06 0.7460.07 0.7560.07
ICC 0.94 0.94 0.94 0.94 0.94 0.94 0.94
*Cited ICC - 0.95 0.94 0.97 0.94 0.88 0.89
doi:10.1371/journal.pone.0084777.t003
Table 4. Comparison between MRI-dependent and PET-only methods for PiB- group (averaging over 123 subjects that are notincluded in the atlas set).
AllLateral FrontalCortex Occipital Cortex
Lateral TemporalCortex Parietal Cortex Posterior Cingulate Putamen
Mean MRI 1.1560.08 1.1560.08 1.1660.08 1.1560.08 1.1660.08 1.1660.09 1.1560.09
Mean PiB 1.1960.08 1.1960.08 1.1960.08 1.1960.08 1.1960.08 1.1960.08 1.1960.08
ROI
Mean VAR (abs) 0.0460.03 0.0460.03 0.0460.03 0.0460.03 0.0460.03 0.0460.03 0.0560.03
Mean VAR (%) 3.6062.3 3.6362.4 3.4262.1 3.4862.2 3.4662.4 3.2262.3 3.8162.4
*Cite Mean VAR (%) - 2.7 3.2 2.5 2.0 0.9 4.1
Vertex
Mean VAR(abs) 0.1960.02 0.1960.02 0.1960.02 0.1860.02 0.1960.02 0.1960.02 0.1960.02
Mean VAR(%) 16.361.7 16.361.2 16.261.6 16.161.6 16.561.7 16.361.7 16.561.8
Pearson Corr (R) 0.4260.1 0.4260.1 0.4360.1 0.4260.1 0.4160.1 0.4360.1 0.4160.1
ICC 0.72 0.72 0.72 0.72 0.71 0.76 0.68
*Cited ICC - 0.73 0.75 0.69 0.59 0.75 0.66
doi:10.1371/journal.pone.0084777.t004
MR-Less Surface-Based Amyloid Assessment
PLOS ONE | www.plosone.org 8 January 2014 | Volume 9 | Issue 1 | e84777
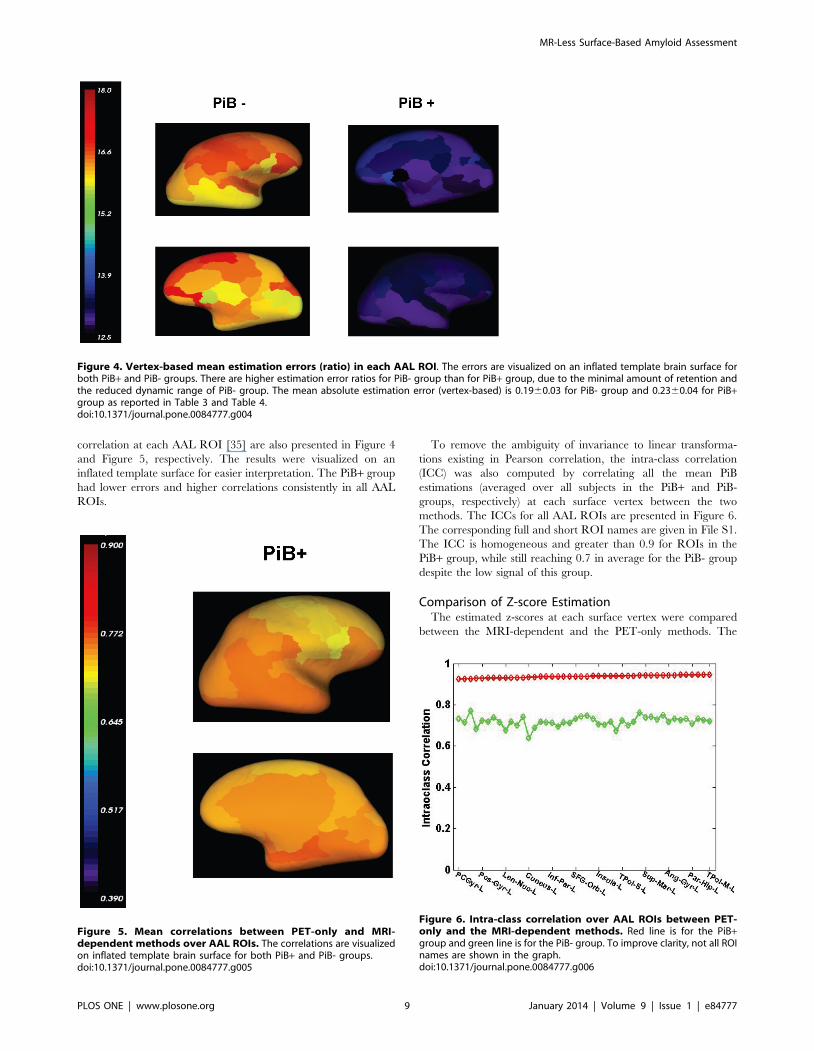
correlation at each AAL ROI [35] are also presented in Figure 4
and Figure 5, respectively. The results were visualized on an
inflated template surface for easier interpretation. The PiB+ group
had lower errors and higher correlations consistently in all AAL
ROIs.
To remove the ambiguity of invariance to linear transforma-
tions existing in Pearson correlation, the intra-class correlation
(ICC) was also computed by correlating all the mean PiB
estimations (averaged over all subjects in the PiB+ and PiB-
groups, respectively) at each surface vertex between the two
methods. The ICCs for all AAL ROIs are presented in Figure 6.
The corresponding full and short ROI names are given in File S1.
The ICC is homogeneous and greater than 0.9 for ROIs in the
PiB+ group, while still reaching 0.7 in average for the PiB- group
despite the low signal of this group.
Comparison of Z-score EstimationThe estimated z-scores at each surface vertex were compared
between the MRI-dependent and the PET-only methods. The
Figure 4. Vertex-based mean estimation errors (ratio) in each AAL ROI. The errors are visualized on an inflated template brain surface forboth PiB+ and PiB- groups. There are higher estimation error ratios for PiB- group than for PiB+ group, due to the minimal amount of retention andthe reduced dynamic range of PiB- group. The mean absolute estimation error (vertex-based) is 0.1960.03 for PiB- group and 0.2360.04 for PiB+group as reported in Table 3 and Table 4.doi:10.1371/journal.pone.0084777.g004
Figure 5. Mean correlations between PET-only and MRI-dependent methods over AAL ROIs. The correlations are visualizedon inflated template brain surface for both PiB+ and PiB- groups.doi:10.1371/journal.pone.0084777.g005
Figure 6. Intra-class correlation over AAL ROIs between PET-only and the MRI-dependent methods. Red line is for the PiB+group and green line is for the PiB- group. To improve clarity, not all ROInames are shown in the graph.doi:10.1371/journal.pone.0084777.g006
MR-Less Surface-Based Amyloid Assessment
PLOS ONE | www.plosone.org 9 January 2014 | Volume 9 | Issue 1 | e84777

z-score difference and the Pearson correlation were computed and
presented in Table 5. Similarly to the PiB retention estimation, the
z-scores for PiB+ group from the PET-only method agreed well
with that from the MRI-dependent method with a mean
difference of 0.94 per vertex and a standard deviation of 0.2,
and a Pearson correlation R = 0.81. The PiB- group was found to
have a mean z-score difference of 0.71 per vertex and a standard
deviation of 0.1, and a Pearson correlation R = 0.4 between the
PET-only and the MRI-dependent estimations.
For a visual comparison, Figure 7 and Figure 8 display the mean
z-scores averaged over the PiB+ AD group and the PiB- NC
group, respectively. It can be seen that the z-scores for both PiB+and PiB- groups are similar between the two methods. Two
individual examples are given in Figure 9 and Figure 10, where
similar levels and pattern of PiB retention can be observed.
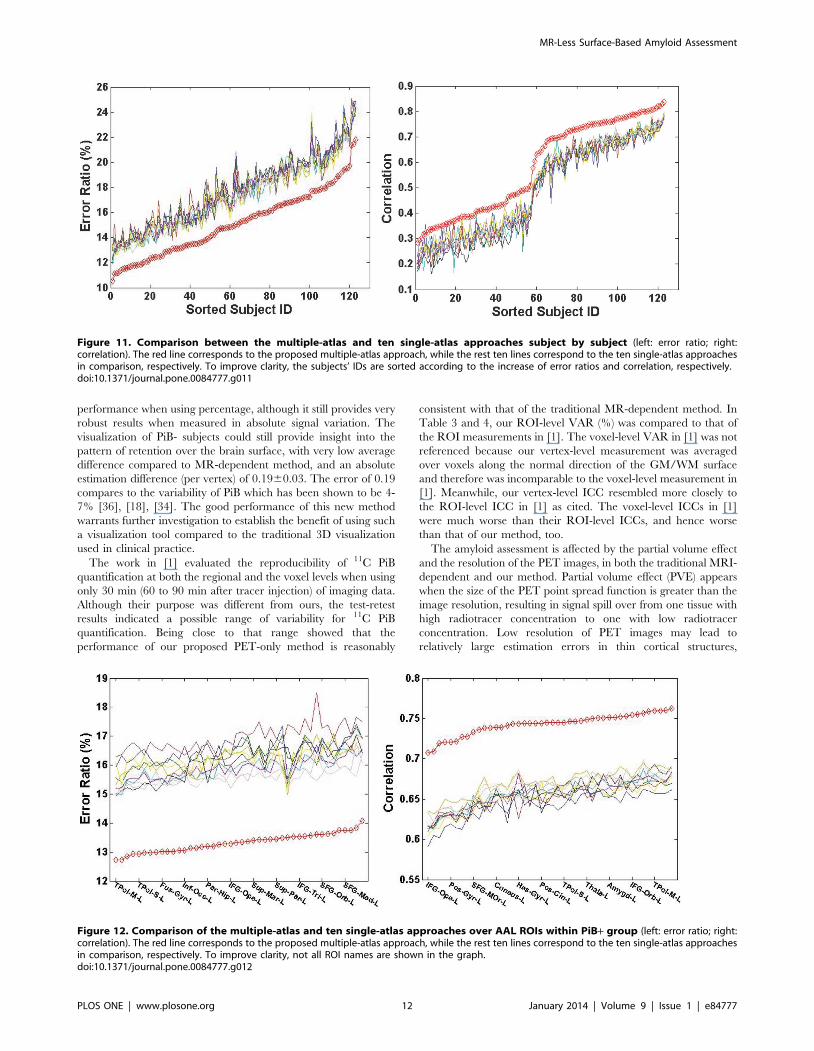
Comparison of Multiple Atlas vs. Single AtlasTo demonstrate the advantage of using multiple atlases, the
average estimation error ratios for each subject and the
correlations with the MRI-dependent method were compared
between using any randomly selected single-atlas approaches and
the proposed multiple-atlas approach. The results were plotted in
Figure 11. The red line corresponds to the result from the
multiple-atlas approach, and the ten other lines correspond to ten
single-atlas approaches. The estimation from the multiple-atlas
approach consistently exhibits significantly lower average estima-
tion errors and higher correlations over the 123 test subjects
compared to the best results obtained using any single atlas.
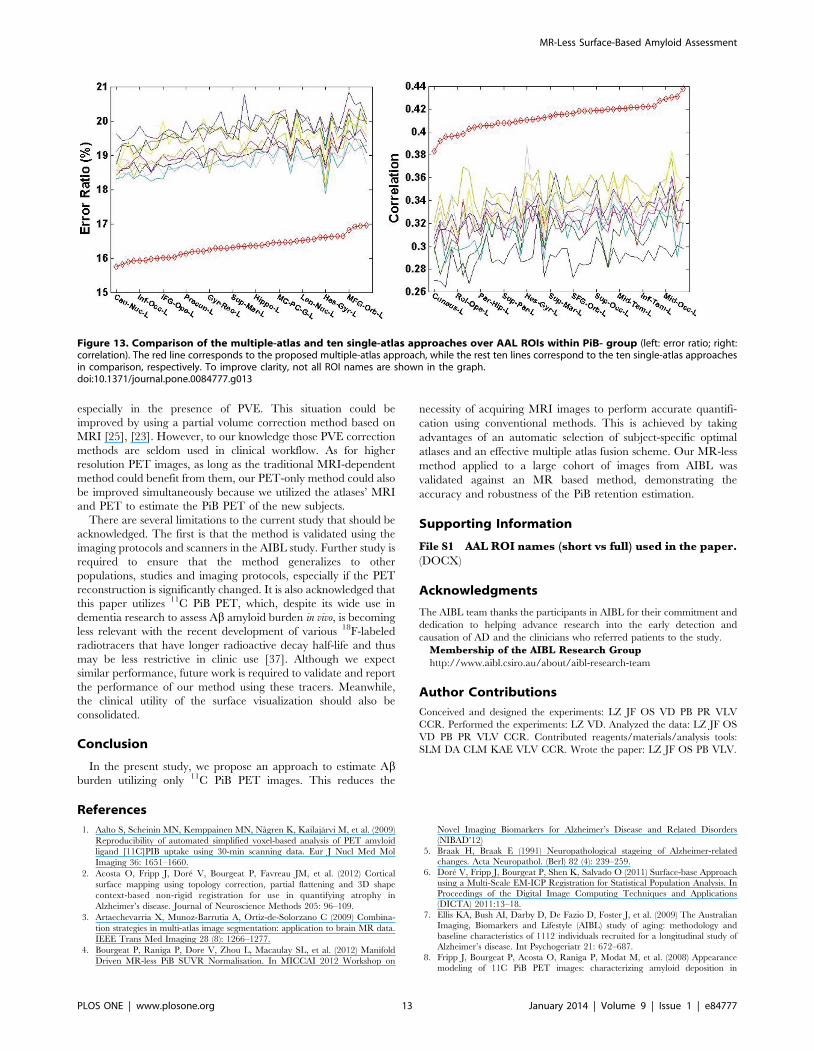
Moreover, the estimation error ratios and the correlations are
further broken into surface ROIs according to the AAL atlas to
explore the local estimation performance. Within each ROI, the
estimation error ratio and the correlation are averaged over all the
subjects in PiB+ and PiB- groups, respectively. The results are
summarized in Figure 12 and Figure 13. The red line corresponds
to the result from the multiple-atlas approach, and the other ten
lines correspond to the ten single-atlas approaches. The results
reveal a pronounced advantage of the proposed multi-atlas
approach (when averaged over the groups) over any single-atlas
approach in all the AAL ROIs for both PiB+ and PiB- groups.
Discussion
We developed a surface-based method to quantify and visualize
PiB retention within cortical GM without the need of MR images.
Our proposed PET-only method showed good correlation with the
more traditional MRI-dependent method. The variation between
the two methods was similar to published test-retest result of PiB
quantification [1]. As PiB retention within GM may indicate Abdeposition associated with Alzheimer’s disease, our proposed
method could be used as a clinical tool to help physicians to easily
determine the Ab burden of patients, improving diagnostic
confidence. Future studies will be performed to investigate and
validate the clinical utility of the proposed method.
Our method compared very favorably against the single-atlas
based PET-only method. Although no quantitative analysis about
the precision was reported in [16], we found that the performance
of single-atlas based method was highly dependent on the atlas
selection due to the different anatomy between the single atlas and
the subject. For example, for some given subject, the estimation
error ratio (per vertex) varied from 15% to 25% when different
individual atlases were used from the pool of the 20 atlases.
Previous work in MRI has found that multiple atlases allowed
averaging registration errors and increasing robustness via some
consensus method [3]. However, the optimal way of selecting
atlases and combining them is application-dependent. In our case,
PiB retention in the population is quite heterogeneous (globally)
and patchy (locally) both in terms of shape and appearance. In
order to address this variation, we adopted several strategies to
benefit from the use of multiple atlases. Firstly, we set up a pool of
atlases that covered the whole spectrum of the disease. As changes
in PiB retention are believed to reflect Ab progressive accumu-
lation, the atlases were therefore chosen to match the full range of
PiB cases. Secondly, a subset of 10 atlases was selected from the
atlas pool according to the closest ‘‘local’’ matching of appearance.
Using a subject-specific subset of atlases reduced the negative
influence of dissimilar atlases to that subject. We also found that
‘‘local’’ matching had better capacity to handle the inter-subject
variation than ‘‘global’’ matching. In our case, using global
matching for multiple atlases could not outperform a good single
Table 5. Comparison of Z-score Estimation between the PET-only and the MRI-dependent Methods (averaging over 123subjects that are not in the atlas set).
Z-score Difference:(per vertex) ± Pearson Correlation (R)
PiB+ Group 0.9460.2 0.81
PiB- Group 0.7160.1 0.40
doi:10.1371/journal.pone.0084777.t005
Figure 7. Mean Z-score for PiB+ AD group. The Z-scores are estimated by the MRI-dependent (top row) and the PET-only (bottom row) methods,respectively.doi:10.1371/journal.pone.0084777.g007
MR-Less Surface-Based Amyloid Assessment
PLOS ONE | www.plosone.org 10 January 2014 | Volume 9 | Issue 1 | e84777

atlas based approach. Thirdly, the estimations from each atlas
were ‘‘locally’’ weighted in a Bayesian fusion framework. This
framework also involved a probabilistic tissue map that considered
the variation within the training population. These strategies
allowed locally adaptive estimation of the PiB retention to be
made, which reduced errors due to mismatches in the distribution
of the plaques and GM shapes. This is important and allowed our
method to successfully handle more unusual or early stage
(asymmetries, focal retention) subjects. The parameters that we
used (10 most similar out of 20 atlases) were found to provide the
best results. Whether using different number for different cohorts
would be more optimal remains to be investigated.
The performances of the proposed method were excellent for
the PiB+ group and better than for the PiB- group. This is
expected since PiB- subjects have low PiB retention in the GM,
and therefore a very low SNR. This low SNR decreases the
Figure 10. Z-score for an individual PiB- subject. It is estimated by the MRI-dependent (top row) and the PET-only (bottom row) methods,respectively.doi:10.1371/journal.pone.0084777.g010
Figure 8. Mean Z-score for PiB- NC group. The Z-scores are estimated by the MRI-dependent (top row) and the PET-only (bottom row) methods,respectively.doi:10.1371/journal.pone.0084777.g008
Figure 9. Z-score for an individual PiB+ subject. It is estimated by the MRI-dependent (top row) and the PET-only (bottom row) methods,respectively.doi:10.1371/journal.pone.0084777.g009
MR-Less Surface-Based Amyloid Assessment
PLOS ONE | www.plosone.org 11 January 2014 | Volume 9 | Issue 1 | e84777
performance when using percentage, although it still provides very
robust results when measured in absolute signal variation. The
visualization of PiB- subjects could still provide insight into the
pattern of retention over the brain surface, with very low average
difference compared to MR-dependent method, and an absolute
estimation difference (per vertex) of 0.1960.03. The error of 0.19
compares to the variability of PiB which has been shown to be 4-
7% [36], [18], [34]. The good performance of this new method
warrants further investigation to establish the benefit of using such
a visualization tool compared to the traditional 3D visualization
used in clinical practice.
The work in [1] evaluated the reproducibility of 11C PiB
quantification at both the regional and the voxel levels when using
only 30 min (60 to 90 min after tracer injection) of imaging data.
Although their purpose was different from ours, the test-retest
results indicated a possible range of variability for 11C PiB
quantification. Being close to that range showed that the
performance of our proposed PET-only method is reasonably
consistent with that of the traditional MR-dependent method. In
Table 3 and 4, our ROI-level VAR (%) was compared to that of
the ROI measurements in [1]. The voxel-level VAR in [1] was not
referenced because our vertex-level measurement was averaged
over voxels along the normal direction of the GM/WM surface
and therefore was incomparable to the voxel-level measurement in
[1]. Meanwhile, our vertex-level ICC resembled more closely to
the ROI-level ICC in [1] as cited. The voxel-level ICCs in [1]
were much worse than their ROI-level ICCs, and hence worse
than that of our method, too.
The amyloid assessment is affected by the partial volume effect
and the resolution of the PET images, in both the traditional MRI-
dependent and our method. Partial volume effect (PVE) appears
when the size of the PET point spread function is greater than the
image resolution, resulting in signal spill over from one tissue with
high radiotracer concentration to one with low radiotracer
concentration. Low resolution of PET images may lead to
relatively large estimation errors in thin cortical structures,
Figure 12. Comparison of the multiple-atlas and ten single-atlas approaches over AAL ROIs within PiB+ group (left: error ratio; right:correlation). The red line corresponds to the proposed multiple-atlas approach, while the rest ten lines correspond to the ten single-atlas approachesin comparison, respectively. To improve clarity, not all ROI names are shown in the graph.doi:10.1371/journal.pone.0084777.g012
Figure 11. Comparison between the multiple-atlas and ten single-atlas approaches subject by subject (left: error ratio; right:correlation). The red line corresponds to the proposed multiple-atlas approach, while the rest ten lines correspond to the ten single-atlas approachesin comparison, respectively. To improve clarity, the subjects’ IDs are sorted according to the increase of error ratios and correlation, respectively.doi:10.1371/journal.pone.0084777.g011
MR-Less Surface-Based Amyloid Assessment
PLOS ONE | www.plosone.org 12 January 2014 | Volume 9 | Issue 1 | e84777
especially in the presence of PVE. This situation could be
improved by using a partial volume correction method based on
MRI [25], [23]. However, to our knowledge those PVE correction
methods are seldom used in clinical workflow. As for higher
resolution PET images, as long as the traditional MRI-dependent
method could benefit from them, our PET-only method could also
be improved simultaneously because we utilized the atlases’ MRI
and PET to estimate the PiB PET of the new subjects.
There are several limitations to the current study that should be
acknowledged. The first is that the method is validated using the
imaging protocols and scanners in the AIBL study. Further study is
required to ensure that the method generalizes to other
populations, studies and imaging protocols, especially if the PET
reconstruction is significantly changed. It is also acknowledged that
this paper utilizes 11C PiB PET, which, despite its wide use in
dementia research to assess Ab amyloid burden in vivo, is becoming
less relevant with the recent development of various 18F-labeled
radiotracers that have longer radioactive decay half-life and thus
may be less restrictive in clinic use [37]. Although we expect
similar performance, future work is required to validate and report
the performance of our method using these tracers. Meanwhile,
the clinical utility of the surface visualization should also be
consolidated.
Conclusion
In the present study, we propose an approach to estimate Abburden utilizing only 11C PiB PET images. This reduces the
necessity of acquiring MRI images to perform accurate quantifi-
cation using conventional methods. This is achieved by taking
advantages of an automatic selection of subject-specific optimal
atlases and an effective multiple atlas fusion scheme. Our MR-less
method applied to a large cohort of images from AIBL was
validated against an MR based method, demonstrating the
accuracy and robustness of the PiB retention estimation.
Supporting Information
File S1 AAL ROI names (short vs full) used in the paper.
(DOCX)
Acknowledgments
The AIBL team thanks the participants in AIBL for their commitment and
dedication to helping advance research into the early detection and
causation of AD and the clinicians who referred patients to the study.
Membership of the AIBL Research Group
http://www.aibl.csiro.au/about/aibl-research-team
Author Contributions
Conceived and designed the experiments: LZ JF OS VD PB PR VLV
CCR. Performed the experiments: LZ VD. Analyzed the data: LZ JF OS
VD PB PR VLV CCR. Contributed reagents/materials/analysis tools:
SLM DA CLM KAE VLV CCR. Wrote the paper: LZ JF OS PB VLV.
References
1. Aalto S, Scheinin MN, Kemppainen MN, Nagren K, Kailajarvi M, et al. (2009)
Reproducibility of automated simplified voxel-based analysis of PET amyloid
ligand [11C]PIB uptake using 30-min scanning data. Eur J Nucl Med Mol
Imaging 36: 1651–1660.
2. Acosta O, Fripp J, Dore V, Bourgeat P, Favreau JM, et al. (2012) Cortical
surface mapping using topology correction, partial flattening and 3D shape
context-based non-rigid registration for use in quantifying atrophy in
Alzheimer’s disease. Journal of Neuroscience Methods 205: 96–109.
3. Artaechevarria X, Munoz-Barrutia A, Ortiz-de-Solorzano C (2009) Combina-
tion strategies in multi-atlas image segmentation: application to brain MR data.
IEEE Trans Med Imaging 28 (8): 1266–1277.
4. Bourgeat P, Raniga P, Dore V, Zhou L, Macaulay SL, et al. (2012) Manifold
Driven MR-less PiB SUVR Normalisation. In MICCAI 2012 Workshop on
Novel Imaging Biomarkers for Alzheimer’s Disease and Related Disorders
(NIBAD’12)
5. Braak H, Braak E (1991) Neuropathological stageing of Alzheimer-related
changes. Acta Neuropathol. (Berl) 82 (4): 239–259.
6. Dore V, Fripp J, Bourgeat P, Shen K, Salvado O (2011) Surface-base Approach
using a Multi-Scale EM-ICP Registration for Statistical Population Analysis. In
Proceedings of the Digital Image Computing Techniques and Applications(DICTA) 2011:13–18.
7. Ellis KA, Bush AI, Darby D, De Fazio D, Foster J, et al. (2009) The AustralianImaging, Biomarkers and Lifestyle (AIBL) study of aging: methodology and
baseline characteristics of 1112 individuals recruited for a longitudinal study ofAlzheimer’s disease. Int Psychogeriatr 21: 672–687.
8. Fripp J, Bourgeat P, Acosta O, Raniga P, Modat M, et al. (2008) Appearance
modeling of 11C PiB PET images: characterizing amyloid deposition in
Figure 13. Comparison of the multiple-atlas and ten single-atlas approaches over AAL ROIs within PiB- group (left: error ratio; right:correlation). The red line corresponds to the proposed multiple-atlas approach, while the rest ten lines correspond to the ten single-atlas approachesin comparison, respectively. To improve clarity, not all ROI names are shown in the graph.doi:10.1371/journal.pone.0084777.g013
MR-Less Surface-Based Amyloid Assessment
PLOS ONE | www.plosone.org 13 January 2014 | Volume 9 | Issue 1 | e84777

Alzheimer’s disease, mild cognitive impairment and healthy aging. Neuroimage
43 (3): 430–439.
9. Fodero-Tavoletti T, Rowe C, McLean A, Leone L, Li X, et al. (2009)
Characterization of PiB binding to white matter in Alzheimer disease and other
dementias. J Nucl Med. 50(2): 198–204.
10. Hammers A, Allom R, Koepp J, Free L, Myers R, et al. (2003) Three-
dimensional maximum probability atlas of the human brain, with particular
reference to the temporal lobe. Hum. Brain Mapp. 19(4): 224–247.
11. Jack CR Jr, Lowe VJ, Senjem ML, Weigand SD, Kemp BJ, et al. (2008) 11C PiB
and structural MRI provide complementary information in imaging of
Alzheimer’s disease and amnestic mild cognitive impairment. Brain 131: 665–
680.
12. Joachim C, Morris J, Selkoe D (1989) Diffuse senile plaques occur commonly in
the cerebellum in Alzheimer’s disease. American J. Pathol. 135 (2): 309–319.
13. Kemppainen M, Aalto S, Wilson IA, Nagren K, Helin S, et al. (2006) Voxel-
based analysis of PET amyloid ligand [11C]PiB uptake in Alzheimer disease.
Neurology 67: 1534–1535.
14. Kemppainen M, Aalto S, Wilson I, Nagren K, Helin S, et al. (2007) PET
amyloid ligand [11C] PiB uptake is increased in mild cognitive impairment.
Neurology 68 (5): 1603–1606.
15. Klunk E, Engler H, Nordberg A, Wang Y, Blomqvist G, et al. (2004) Imaging
brain amyloid in Alzheimer’s disease with Pittsburgh Compound-B. Ann.
Neurol. 55 (3): 306–319.
16. Lilja, A., Thurfjell L., 2010. Tools for aiding in the diagnosis of neurodegen-
erative diseases. http://www.faqs.org/patents/app/20100080432
17. Li Y, Rinne JO, Mosconi L, Pirraglia E, Rusinek H, et al. (2008) Regional
analysis of FDG and PIB-PET images in normal aging, mild cognitive
impairment, and Alzheimer’s disease. Eur. J. Nucl. Med. Mol. Imaging. 35
(12): 2169–2181.
18. Lopresti BJ, Klunk WE, Mathis CA, Hoge JA, Ziolko SK, et al. (2005) Simplified
quantification of Pittsburgh Compound B amyloid imaging PET studies: a
comparative analysis. J Nucl Med. 46 (12): 1959–1972.
19. Mazziotta J, Toga A, Evans A, Fox P, Lancaster J, et al. (2001) A probabilistic
atlas and reference system for the human brain. Philos Trans R Soc Lond B Biol
Sci 356: 1293–1322.
20. Ng S, Villemagne L, Berlangieri S, Lee T, Cherk M, et al. (2007) Visual
assessment versus quantitative assessment of 11C-PiB PET and 18F-FDG PET
for detection of Alzheimer’s disease. J. Nucl. Med. 48 (4): 547–552.
21. Okello A, Koivunen J, Edison P, Archer A, Turkheimer E, et al. (2009)
Conversion of amyloid positive and negative MCI to AD over 3 years: an 11C-
PIB PET study. Neurology 73(10): 754–760.
22. Ourselin S, Roche A, Subsol G, Pennec X, Ayache N (2001) Reconstructing a
3D structure from serial histological sections. Image Vis. Comput. 19 (1): 25–31.
23. Raniga P, Bourgeat P, Fripp J, Acosta O, Ourselin S, et al. (2009) Alzheimer’s
disease detection using 11C-PiB with improved partial volume effect correction.
In SPIE: Medical Imaging 2009.
24. Raniga P, Bourgeat P, Villemagne V, O’Keefe G, Rowe C, et al. (2007) PIB-
PET Segmentation for Automatic SUVR Normalization Without MR
Information. In Proceedings of IEEE International Symposium on Biomedical
Imaging: From Nano to Macro (ISBI) 2007: 348–351.25. Rousset OG, Ma Y, and Evans AC (1998) Correction for partial volume effects
in PET: Principle and validation. Journal Nucl Med 39(5): 904–911.
26. Rowe CC, Ng S, Ackermann U, Gong J, Pike K, et al. (2007) Imaging beta-amyloid burden in aging and dementia. Neurology 68 (20): 1718–1725.
27. Rowe CC, Ellis KA, Rimajova M, Bourgeat P, Pike KE, et al. (2010) Amyloidimaging results from the Australian Imaging, Biomarker and Lifestyle (AIBL)
study of aging. Neurobiol. Aging. 31: 1275.
28. Rueckert D, Sonoda LI, Hayes C, Hill DLG, Leach MO, et al. (1999) NonrigidRegistration Using Free-Form Deformations: Application to Breast MR Images.
IEEE Trans. on Medical Imaging 18(8): 712–721.29. Rueda A, Acosta O, Couprie M, Bourgeat P, Fripp J, et al. (2010) Topology-
corrected segmentation and local intensity estimates for improved partial volumeclassification of brain cortex in MRI,’’ J. Neurosci. Methods 188: 305–315.
30. Schott JM, Bartlett JW, Fox NC, Barnes J (2010) Increased brain atrophy rates
in cognitively normal older adults with low cerebrospinal fluid Abeta1-42. AnnNeurol 68: 825–834.
31. Studholme C, Hill D, Hawkes D (1999) An overlap invariant entropy measure of3D Medical image alignment. Pattern Recogn. 32 (1): 71–86.
32. Thal DR, Rub U, Orantes M, Braak H (2002) Phases of Abeta-deposition in the
human brain and its relevance for the development of AD. Neurology 58 (12):1791–1800.
33. Thal DR, Capetillo-Zarate E, Del Tredici K, Braak H (2006) The developmentof amyloid beta protein deposits in the aged brain. Sci. Aging Knowledge
Environ. 2006 (6).34. Tolboom N, Yaqub M, Boellaard R, Luurtsema G, Windhorst AD, et al. (2009)
Test-retest variability of quantitative 11C PIB studies in Alzheimer’s disease.
Eur J Nucl Med Mol Imaging 36(10): 1629–1638.35. Tzourio-Mazoyer N, Landeau B, Papathanassiou D, Crivello F, Etard O, et al.
(2002) Automated Anatomical Labeling of Activations in SPM Using aMacroscopic Anatomical Parcellation of the MNI MRI Single-Subject Brain.
NeuroImage 15: 273–289.
36. Villemagne VL, Pike KE, Chetelat G, Ellis KA, Mulligan RS, et al. (2011)Longitudinal Assessment of Ab and Cognition in Aging and Alzheimer Disease.
Ann Neurol. 69(1): 181–192.37. Villemagne VL, Ong K, Mulligan RS, Holl G, Pejoska S, et al. (2011) Amyloid
imaging with 18F-florbetaben in Alzheimer disease and other dementias. J NuclMed. 52:1210–1217.
38. Yasuno F, Hasnine H, Suhara T, Ichimiya T, Sudo Y, et al. (2002) Template-
based method for multiple volumes of interest of human brain PET images.Neuroimage 16 (3 Pt. 1): 577–586.
39. Yotter RA, Doshi J, Clark V, Sojkova J, Zhou Y, et al. (2013) Memory declineshows stronger associations with estimated spatial patterns of amyloid deposition
progression than total amyloid burden. Neurobiology of Aging. 34 (12): 2835–
2842.40. Ziolko K, Weissfeld A, Klunk E, Mathis A, Hoge A, et al. (2006) Evaluation of
voxel-based methods for the statistical analysis of PiB PET amyloid imagingstudies in Alzheimer’s disease. Neuroimage 33 (1): 94–102.
MR-Less Surface-Based Amyloid Assessment
PLOS ONE | www.plosone.org 14 January 2014 | Volume 9 | Issue 1 | e84777

![Intracellular reactions affecting 2-amino-4-([11C]methylthio)butyric acid ([11C]methionine) response to carbon ion radiotherapy in C10 glioma cells](https://static.fdokumen.com/doc/165x107/6343c86b88adeae9b9061aee/intracellular-reactions-affecting-2-amino-4-11cmethylthiobutyric-acid-11cmethionine.jpg)
![Differential Occupancy of Somatodendritic and Postsynaptic 5HT1A Receptors by Pindolol A Dose-Occupancy Study with [11C]WAY 100635 and Positron Emission Tomography in Humans](https://static.fdokumen.com/doc/165x107/6345cad4f474639c9b05018f/differential-occupancy-of-somatodendritic-and-postsynaptic-5ht1a-receptors-by-pindolol-1684244678.jpg)


![PET imaging of demyelination and remyelination in the cuprizone mouse model for multiple sclerosis: A comparison between [11C]CIC and [11C]MeDAS](https://static.fdokumen.com/doc/165x107/63419d7d8768bcaafb01b673/pet-imaging-of-demyelination-and-remyelination-in-the-cuprizone-mouse-model-for.jpg)
![(−)-N-[11C]propyl-norapomorphine: a positron-labeled dopamine agonist for PET imaging of D2 receptors](https://static.fdokumen.com/doc/165x107/6342642c801118feba064c47/-n-11cpropyl-norapomorphine-a-positron-labeled-dopamine-agonist-for-pet.jpg)
![Astrocytic tracer dynamics estimated from [1-11C]-acetate PET measurements](https://static.fdokumen.com/doc/165x107/6334cca03e69168eaf070c95/astrocytic-tracer-dynamics-estimated-from-1-11c-acetate-pet-measurements.jpg)
![Synthesis of oncological [11C]radiopharmaceuticals for clinical PET](https://static.fdokumen.com/doc/165x107/633497dee9e768a27a101d8b/synthesis-of-oncological-11cradiopharmaceuticals-for-clinical-pet.jpg)
![Differential Occupancy of Somatodendritic and Postsynaptic 5HT1A Receptors by Pindolol: A Dose-Occupancy Study with [11C]WAY 100635 and Positron Emission Tomography in Humans](https://static.fdokumen.com/doc/165x107/631c4aedd5372c006e045dcf/differential-occupancy-of-somatodendritic-and-postsynaptic-5ht1a-receptors-by-pindolol-1675040353.jpg)
![In vivo imaging of brain lesions with [11C]CLINME, a new PET radioligand of peripheral benzodiazepine receptors](https://static.fdokumen.com/doc/165x107/6334cc8e3e69168eaf070c8d/in-vivo-imaging-of-brain-lesions-with-11cclinme-a-new-pet-radioligand-of-peripheral.jpg)