MQA-SSP-Final.pdf - Mining Qualifications Authority
267
-
Upload
khangminh22 -
Category
Documents
-
view
1 -
download
0
Transcript of MQA-SSP-Final.pdf - Mining Qualifications Authority


foreword
The Mining Qualifications Authority prides itself in ensuring that the Mining and Mineral Sector remains at the cutting edge of skills development. In keeping up with this progression, this Board submits to the Department of Higher Education and Training (DHET) the First Draft of the Sector Skills Plan (SSP) update for the Mining and Minerals Sector for the period 2015 to 2020.
The Sector Skills Plan has been prepared in accordance with the National Skills Development Strategy (NSDS) III for the period 2011 to 2016, and in accordance with the expectations of the DHET. This SSP has been presented to the Skills Research and Planning Committee. The improvement of the skills of our workforce is imperative for the economic development of our sector, for the improvement of our health and safety record and for the growth and wellbeing of all employees. The main purpose of this SSP update is to guide and inform skills development initiatives in the sector. It is the result of not only a thorough research process, but also of extensive stakeholder consultation. Through the consultative processes the stakeholders have taken ownership of this plan and now all stakeholders are urged to work together over the next five years to address the skills development priorities and to achieve the goals and objectives set in this SSP.
Mr David Msiza
Chairperson: MQA Board

endorsed by for Title Signature / date
Mr David Msiza
State: Department of Mineral Resources, Trevenna Campus, Building 2 C, Cnr Meintjes and Schoeman Street, Sunnyside Pretoria.Private Bag X59, Arcadia 0007
MQA Board: ChairpersonChief Inspector of Mines - DMR
Mr Amon Teteme
Organised Labour:National Union of Mineworkers (NUM)7 Rissik Str,Johannesburg.P O Box 2424 Johannesburg 2000
MQA Board: Convener – Organised Labour Skills Development Officer - NUM
Mr Vusi Mabena
Employers:Chamber of Mines (COM)5 Hollard StreetMarshalltown.P O Box 61809Marshalltown 2107
MQA Board:Convener – EmployersSenior Executive: Transformation and Stakeholder Relations - COM
Mr Samuel Seepei
MQA7 Anerley RoadParktown, JohannesburgPrivate Bag X118, Marshalltown, 2017
Chief Executive Officer of the MQA
STAKeHoLder eNdorSeMeNT
This is the Sector Skills Plan update prepared by the Mining Qualifications Authority (MQA) for the Mining and Minerals Sector (2015 – 2020). It is submitted to the Minister of Higher Education and Training in partial compliance with the requirements of the Skills Development Act of 1998 as amended. The MQA was registered as a Sector Education and Training Authority for this sector on 20 March 2000. The Sector Skills Plan update is hereby endorsed by duly authorized representatives of the state, employer organizations and organised labour in this national economic sector.

TABLe of CoNTeNTSYNoPSIS 1
1. INTrodUCTIoN 5
1.1 ProCeSS foLLowed IN THe deVeLoPMeNT of THIS SSP UPdATe 61.1.1 Information sources utilised 61.1.2 Consultation process for SSP update (2011–2016) 71.1.3 Sector participation 71.1.4 Other consultations 81.1.5 Consultation process for SSP update (2012–2019) 81.1.6 Consultation process for SSP update (2015–2020) 8
2. SeCTor ProfILe 9
2.2.1 INTrodUCTIoN 102.2.2 INdUSTrIAL CoVerAGe 102.2.3 oVerVIew of MQA SUBSeCTorS 102.3.1 Coal mining 102.3.2 Gold mining 112.3.3 PGM mining 112.3.4 Diamond mining 112.3.5 Other mining commodities 122.3.6 Cement, lime, aggregates and sand 122.3.7 Services incidental to mining industry 122.3.8 Diamond processing 122.3.9 Jewellery manufacturing 132.4 orGANISATIoNS IN THe SeCTor 132.5 eMPLoYMeNT IN THe SeCTor 142.5.1 Total employment 142.5.2 Provincial distribution of employees 152.5.3 Educational profile 172.5.4 Race and gender distribution of employees 172.5.5 Age distribution of employees: 2014 212.5.6 Disability 212.6 CHArACTerISTICS of THe SeCTor 222.6.1 Regulation of the sector 222.6.2 Labour organisation 232.6.3 Employer organisations 232.6.4 Professional organisations 232.6.5 Geographic location 232.6.6 Small-scale mining 242.6.7 Migrant labour 242.6.8 Outsourcing and subcontracting of labour 25

2.6.9 Language use 252.6.10 HIV and AIDS 262.6.11 Mine accidents and fatalities 282.6.12 Environmental impact 362.6.13 Beneficiation 322.7 TrANSforMATIoN of THe SeCTor 332.7.1 Mineral rights and mine ownership 332.7.2 Black economic empowerment and employment equity 332.7.3 The Mining Charter and Codes of Good Practice 342.7.4 Social and Labour Plan 352.8 STAKeHoLder CoNSULTATIoNS 362.9 CoNCLUSIoN 55
3. eCoNoMIC PerforMANCe of THe SeCTor 57
3.1 INTrodUCTIoN 573.2 MINING, MINerALS ANd SUSTAINABLe deVeLoPMeNT 573.3 fACTorS THAT INfLUeNCe THe eCoNoMIC PerforMANCe of THe SeCTor 583.3.1 Sources of demand for MMS products 593.3.2 Economic cycles, commodity markets and commodity prices 603.3.3 The exchange rate 653.3.4 Government expenditure and infrastructure development 663.3.5 The demand for energy 663.3.6 Technological advancements 663.3.7 The availability of skills 673.3.8 Environmental conservation and rehabilitation 673.3.9 The availability of mineral resources 673.4 CoMPoSITIoN of ANd CHANGeS IN GroSS VALUe Added 683.4.1 Economic growth 683.5 CoNTrIBUTIoN To eCoNoMIC ACTIVITY 703.6 SCeNArIo ModeLLING 723.7 INITIATIVeS To eNHANCe THe eCoNoMIC PerforMANCe of THe SeCTor 743.8 fUTUre eCoNoMIC PerforMANCe of THe SeCTor 783.9 CoNCLUSIoN 78
4. deMANd for LABoUr 80
4.1 INTrodUCTIoN 804.2 TreNdS IN eMPLoYMeNT 804.2.1 Total employment 804.2.2 Occupational demand 834.3 reMUNerATIoN TreNdS 904.4 fUTUre deMANd 924.4.1 Baseline employment 924.4.2 Assumptions used in the creation of the model 93 4.4.3 Interaction between the demand and supply sides of the labour market 96

4.4.4 Results of 4 scenarios: MQA Demand Projection Model (NDPL), National Development Plan (NDP) vision 2030, and National Development Plan (NDP) for Mining 96 4.5 New deVeLoPMeNTS IN THe MINING ANd MINerALS SeCTor THAT wILL IMPACT oN SKILLS deMANd 1014.5.1 Overview 101 4.5.2 Technology 1014.5.3 Growing middle class 1014.5.4 Declining birth rates and ageing population 1024.5.5 Social media 102 4.5.6 Black empowerment and affirmative action 102 4.5.7 SMME development 102 4.5.8 Social drivers of change 103 4.5.9 Hydraulic fracturing 103 4.6 CoNCLUSIoN 103 5. THe SUPPLY of SKILLS To THe SeCTor 105
5.1 INTrodUCTIoN 1055.2 CUrreNT SUPPLY 106 5.2.1 Current employment 106 5.2.2 Unemployment 106 5.3 THe SUPPLY of New SKILLS To THe SeCTor 107 5.3.1 Higher education and training 1075.3.2 FET colleges 116 5.4 TrAINING ANd deVeLoPMeNT of THe CUrreNT worKforCe 1185.4.1 Managers and Professionals 120 5.4.2 Technicians 120 5.4.3 Clerical and Support Workers 121 5.4.4 Trades workers 1215.4.5 Plant and Machine Operators 122 5.4.6 Elementary Occupations 1235.4.7 ABET 124 5.4.8 Learnerships 1255.4.9 Certificates of competency 1275.4.9.1 Chamber of Mines certificates 1275.4.9.2 DMR certificates 1285.4.9.3 Management and supervisory development 128 5.4.10 Development of mining communities 130 5.4.11 In-service training 1305.5 THe MQA INTerVeNTIoNS To ALLeVIATe SKILLS SHorTAGeS 130 5.6 THe QUALITY of TrAINING 130 5.7 oTHer fACTorS THAT wILL IMPACT oN SKILLS SUPPLY 1315.7.1 Rationale 1315.7.2 Assessment of learning material 131

5.8 CoNCLUSIoN 131
6. SKILLS NeedS of THe MMS 133
6.1 INTrodUCTIoN 1336.2 BroAd CATeGorIeS of SKILLS deVeLoPMeNT NeedS 133 6.2.1 Core skills 134 6.2.2 Mine health and safety 1346.2.3 HIV/AIDS awareness and prevention 1346.2.4 Adult Basic Education and Training (ABET) 1346.2.5 Recognition of Prior Learning (RPL) 1346.2.6 Scarce skills 1356.2.7 The development of HDSA managers 1356.2.8 Environmental skills 1356.2.9 Training and development of retrenched employees 1356.2.10 Development of mining communities and communities in labour-sending areas 1366.2.11 Supporting beneficiation in local areas through skills development 1366.2.12 Strengthening government capacity 1366.3 SCArCe SKILLS 1366.3.1 Absolute scarcity (suitably skilled people are not available in the labour market) 1366.3.2 Relative scarcity (suitably skilled people available but do not meet other employment criteria) 136 6.4 CoMPArING SKILLS deMANd To SKILLS SUPPLY 142 6.4.1 Occupational group: Managers 142 6.4.2 Occupational group: Professionals 143 6.4.3 Occupational group: Technicians and associate professionals 143 6.4.4 Occupational group: Clerical support workers 1436.4.5 Occupational group: Service and sales workers 1436.4.6 Occupational group: Skilled agricultural, forestry, fishery, craft and related trades workers 143 6.4.7 Occupational group: Elementary workers 1446.5 CoNCLUSIoN 145
7 STrATeGIC IMPerATIVeS 146
7.1 INTrodUCTIoN 146 7.2 SeCTorAL CoNTrIBUTIoN To STrATeGIC AreAS of foCUS for NSdS III 147 7.2.1 Key developmental and transformation imperatives 147 7.2.2 NSDS III Goals 151 7.3 SeCTorAL CoNTrIBUTIoN To THe PreSIdeNT’S oUTCoMeS APProACH To PLANNING GoVerNMeNT’S worK 151 7.3.1 MQA’s contribution to Presidential outcomes for the Minister of Mineral Resources 1527.3.2 MQA’s contribution to Presidential outcomes for the Minister of Higher Education and Training 1567.4 SUPPorT of GoVerNMeNT’S MTSf oBJeCTIVeS 1587.4.1 Speeding up growth and transforming the economy to create decent work and sustainable livelihoods 1587.4.2 Massive programme to build economic and social infrastructure 158 7.4.3 Strengthen the skills and human resources base 159

7.4.4 Improve the health profile of all South Africans 159 7.4.5 Intensify the fight against crime and corruption 1597.4.6 Build cohesive, caring and sustainable communities 159 7.4.7 Sustainable resource management and use 159 7.4.8 Build a developmental state, including improvement of public services and the strengthening of democratic institutions 1607.5 SUPPorT of GoVerNMeNT’S INdUSTrIAL PoLICY ACTIoN PLAN (IPAP) 1607.6 SUPPorT of NATIoNAL BeNefICIATIoN STrATeGY for SoUTH AfrICA 163 7.7 SUPPorT of THe New GrowTH PATH ANd THe NATIoNAL SKILLS ACCord 1657.7.1 Commitment 1: Expand the level of training using existing facilities more fully 166 7.7.2 Commitment 2: Make internship and placement opportunities available within workplaces 167 7.7.3 Commitment 3: Set guidelines of ratios of trainees: artisans, as well as across the technical vocations, in order to improve the level of training 167 7.7.4 Commitment 4: Improve the funding of training and the use of funds available for training and incentives on companies to train 167 7.7.5 Commitment 6: Improve SETA governance and financial management, as well as stakeholder involvement 1677.7.6 Commitment 7: Align training with the New Growth Path and improve SSPs 167 7.7.7 Commitment 8: Improve the role and performance of the FET colleges 168 7.8 SUPPorT of THe NATIoNAL deVeLoPMeNT PLAN: VISIoN 2030 1687.9 SUPPorT of THe GoVerNMeNT’S INfrASTrUCTUre PLAN ANd STrATeGIC INTeGrATed ProJeCTS 1697.10 CoNCLUSIoN 170
8. STrATeGIC oBJeCTIVeS ANd ProGreSS oN SKILLS deVeLoPMeNT PrIorITIeS 171
8.1. INTrodUCTIoN 174 8.2. SKILLS deVeLoPMeNT PrIorITY 1: SUPPorT TrANSforMATIoN of THe SeCTor THroUGH SKILLS deVeLoPMeNT 1748.2.1. Goal and objective 174 8.2.2. Targets and progress 1748.3. SKILLS deVeLoPMeNT PrIorITY 2: SUPPorT oBJeCTIVe deCISIoN-MAKING for SKILLS deVeLoPMeNT THroUGH reSeArCH IN THe SeCTor 1758.3.1. Goal and objective 1758.3.2. Targets and progress 175 8.4. SKILLS deVeLoPMeNT PrIorITY 3: eNHANCe INforMATIoN MANAGeMeNT for SKILLS deVeLoPMeNT IN THe SeCTor 1768.4.1. Goal and objective 1768.4.2. Targets and progress 1768.5. SKILLS deVeLoPMeNT PrIorITY 4: fACILITATe ANd SUPPorT THe IMPLeMeNTATIoN of Core SeCTor SKILLS ANd deVeLoP ProGrAMMeS ALIGNed wITH THe SeCTor QUALIfICATIoNS frAMeworK 177 8.5.1. Goal and objective 1778.5.2. Targets and progress 1778.6. SKILLS deVeLoPMeNT PrIorITY 5: eNHANCe THe MoNITorING, eVALUATIoN ANd reVIew of THe deLIVerY CAPACITY ANd QUALITY of SKILLS deVeLoPMeNT IN THe SeCTor 183 8.6.1. Goal and objective 183

8.6.2. Targets and progress 183
refereNCeS 188 APPeNdICeS 193APPENDIX 1: METHODOLOGY USED IN THE DEVELOPMENT OF SECTOR PROFILES 193 APPENDIX 2: SIC CODES AND SUBSECTORS USED IN THE MMS 195APPENDIX 3: MMS SCARCE SKILLS LIST SUBMITTED BY THE MINING QUALIFICATIONS AUTHORITY ON 5 JULY 2014. 197 APPENDIX 4: MINING CHARTER SCORECARD 209 APPENDIX 5: LEARNERSHIP ENROLMENTS AND ACHIEVEMENTS 2001 TO 2012 211 APPENDIX 6: GOVERNMENT CERTIFICATES ISSUED BY DMR 228 APPENDIX 7: TIMELINES FOR MQA PROJECTS 232 APPENDIX 8: MQA Qualifications Framework 234 APPENDIX 9: ALIGNMENT OF MQA’s SKILLS DEVELOPMENT PRIORITIES WITH NSDS III 242
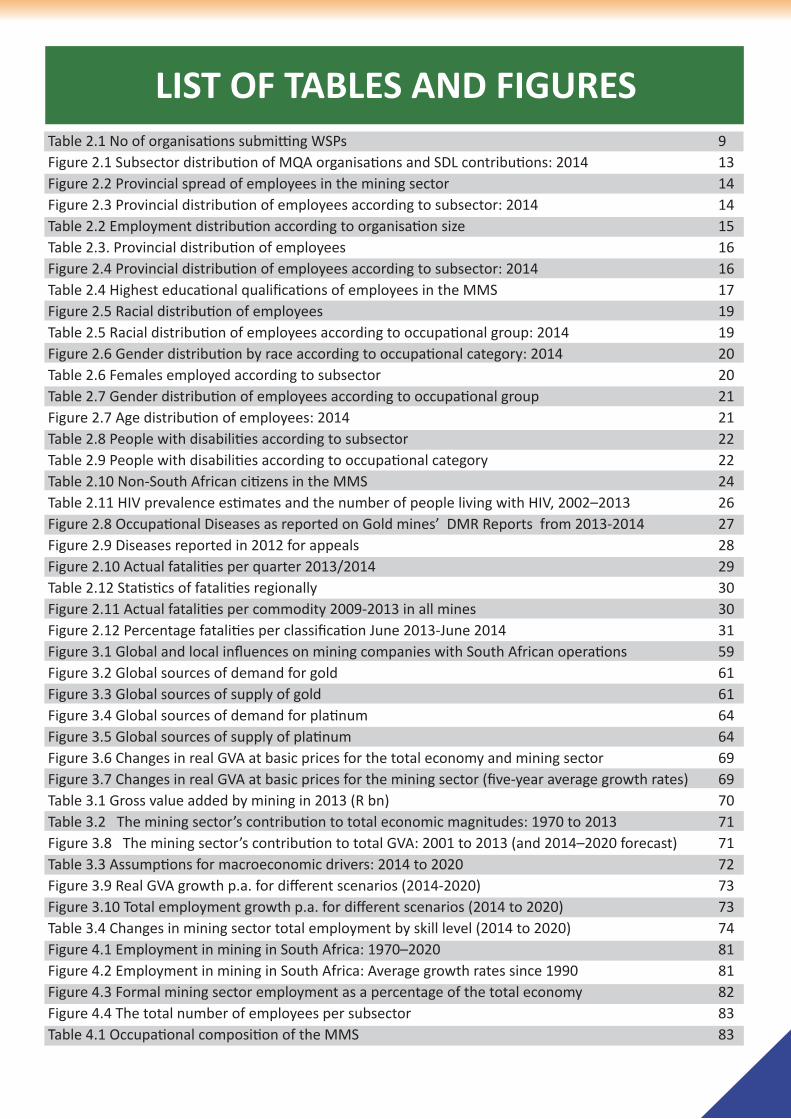
Table 2.1 No of organisations submitting WSPs 9Figure 2.1 Subsector distribution of MQA organisations and SDL contributions: 2014 13Figure 2.2 Provincial spread of employees in the mining sector 14Figure 2.3 Provincial distribution of employees according to subsector: 2014 14Table 2.2 Employment distribution according to organisation size 15Table 2.3. Provincial distribution of employees 16Figure 2.4 Provincial distribution of employees according to subsector: 2014 16Table 2.4 Highest educational qualifications of employees in the MMS 17Figure 2.5 Racial distribution of employees 19Table 2.5 Racial distribution of employees according to occupational group: 2014 19Figure 2.6 Gender distribution by race according to occupational category: 2014 20Table 2.6 Females employed according to subsector 20Table 2.7 Gender distribution of employees according to occupational group 21Figure 2.7 Age distribution of employees: 2014 21Table 2.8 People with disabilities according to subsector 22Table 2.9 People with disabilities according to occupational category 22Table 2.10 Non-South African citizens in the MMS 24Table 2.11 HIV prevalence estimates and the number of people living with HIV, 2002–2013 26Figure 2.8 Occupational Diseases as reported on Gold mines’ DMR Reports from 2013-2014 27Figure 2.9 Diseases reported in 2012 for appeals 28Figure 2.10 Actual fatalities per quarter 2013/2014 29Table 2.12 Statistics of fatalities regionally 30Figure 2.11 Actual fatalities per commodity 2009-2013 in all mines 30Figure 2.12 Percentage fatalities per classification June 2013-June 2014 31Figure 3.1 Global and local influences on mining companies with South African operations 59Figure 3.2 Global sources of demand for gold 61Figure 3.3 Global sources of supply of gold 61Figure 3.4 Global sources of demand for platinum 64Figure 3.5 Global sources of supply of platinum 64Figure 3.6 Changes in real GVA at basic prices for the total economy and mining sector 69Figure 3.7 Changes in real GVA at basic prices for the mining sector (five-year average growth rates) 69Table 3.1 Gross value added by mining in 2013 (R bn) 70Table 3.2 The mining sector’s contribution to total economic magnitudes: 1970 to 2013 71Figure 3.8 The mining sector’s contribution to total GVA: 2001 to 2013 (and 2014–2020 forecast) 71Table 3.3 Assumptions for macroeconomic drivers: 2014 to 2020 72Figure 3.9 Real GVA growth p.a. for different scenarios (2014-2020) 73Figure 3.10 Total employment growth p.a. for different scenarios (2014 to 2020) 73Table 3.4 Changes in mining sector total employment by skill level (2014 to 2020) 74Figure 4.1 Employment in mining in South Africa: 1970–2020 81Figure 4.2 Employment in mining in South Africa: Average growth rates since 1990 81Figure 4.3 Formal mining sector employment as a percentage of the total economy 82Figure 4.4 The total number of employees per subsector 83Table 4.1 Occupational composition of the MMS 83
LIST of TABLeS ANd fIGUreS

Table 4.2 Engineering professionals employed according to race 84Table 4.3: Managers employed according to race 85Table 4.4 Professionals employed according to race 86Figure 4.5 The semi-skilled and unskilled labour intensity per subsector 87Figure 4.6 The skilled labour intensity per subsector 87Figure 4.7 The highly-skilled labour intensity per subsector 88Table 4.5 Technicians and associate professionals employed according to race 88Table 4.6 Skilled agricultural, forestry, fishery, craft and related trades workers employed according to race 89Table 4.7 Service and sales workers employed according to race 89Table 4.8 Plant and machine operators employed according to race 89Table 4.9 Percentage of people employed in elementary occupations according to race 90Figure 4.8 Comparative total real labour remuneration per subsector 91Figure 4.9 Comparative real remuneration per employee per subsector 92Table 4.10 Vacancy rate per OFO main groups’ vacancy rates 93Table 4.11 Number of positions, according to occupational group: 2014 93Table 4.12 Annual mortality rates per occupational group 95Table 4.13 Number of retirees per OFO major groups 95Table 4.14 People leaving the mining sector annually as per OFO major group 96Figure 4.10 Four Scenarios: Total number of positions to be filled by 2020 97Figure 4.11 Projections for future demand: new and replacement demand 2013-2020 97Figure 4.12 Positions to be filled as per OFO major group 98Figure 4.13 Sector replacement positions compared to new positions 98Table 4.15 Total number of employees per OFO occupational group 99Table 4.16 Projected annual number of additional engineering professionals needed in the sector: 2013–2020 99Table 4.17 Projected annual number of additional technicians and associate professionals needed in the sector: 2013-2020 (selected occupations) 100Table 4.18 Projected annual number of additional skilled agricultural, forestry, fishery, craft and related trades workers in the sector: 2013–2020 (selected occupations) 100 Figure 5.1 Unemployed/Ex mine workers: 2001–2013 107Table 5.1 Unemployed/Ex mine workers: 2001–2013 107Figure 5.2 Entry-level qualifications awarded in the relevant fields of study: 1999–2012 108Table 5.2 The supply and demand of engineering occupations 1999 and 2012 109Figure 5.3 Population Group Composition of 2013 Engineering graduates 109Table 5.3 Graduates in Engineering fields 2013 110Figure 5.4 Gender distribution of graduates* according to field of study: 2013 110Table 5.4 Racial and gender distribution of graduates* according to field of study: 2003–2012 111Figure 5.5 Racial and gender distribution of Black and Black female graduates according to filed of study 2003-2012 111Table 5.5 Bursaries awarded by the MQA: 2002–2013 114Table 5.6 Work experience opportunities facilitated by the MQA: 2006–2013 115Table 5.7 Interns placed in host companies by the MQA: 2005-2013 116Table 5.8 Number of Managers and Professional and Programmes Completed in 2014 120 Table 5.9 Number of Technicians and Programmes Completed in 2014 121 Table 5.10 Number of Trades Workers and Programmes Completed in 2014 122

Table 5.11 Number of Plant and Machine Operators and Programmes Completed in 2014 136Table 5.12 Number of Elementary Workers and Programmes Completed in 2014 123 Figure 5.6 Employees who completed ABET: 2006/07 to 2013/14 124Figure 5.7 Learnership enrolments and completions: 2001 to 2013 125Figure 5.8 Learners who qualified on trade-related learnerships over the period 2003 to 2013 126Table 5.13 Number of learner registrations and completions on trade-related learnerships: 2003–2013 127 Table 5.14 Chamber of Mines certificates awarded: 2010-2013 128Table 5.15 Consolidated table: Engineering certificates issued from 2000/2001-2012/2013 129 Table 6.1 Absolute and Relative scarcity 138Table 6.2 Stakeholder scarce skills identification 145 Figure 7.1 NSDS III goals 151Figure 7.2 Mapping the field: IPAP transversal interventions 160Figure 7.3 IPAP sectoral interventions 2 and 3 161Figure 7.4 Fitting it all together 163 Figure 7.5 Beneficiation as a consequence of mineral extraction and processing activities 164Figure 7.6 The SETA landscape 2011–2016 165Figure 7.7 The Manufacturing Cluster 165 Figure 7.8 The Services Cluster 165 Figure 7.9The Financial Cluster 165 Figure 7.10 The Social Cluster 165 Table 7.1 Seven undertakings pertaining to SSP’s 167Figure 7.11 The Strategic Integrated Projects 169 Table 8.1 Qualifications under development 178 Table 8.2 Number of learning packs developed in the specified year 179 Table 8.3 Artisan Development Performance 183 Table 8.4 Number of learners’ certification (2013/14) 185 Table 8.5 Additional recommended research projects 189 Alignment of MQA strategic objectives with NSDS III

ABET Adult Basic Education and TrainingAEMFC African Exploration Mining and Finance CorporationAGOA African Growth and Opportunity ActAIDS Acquired Immune Deficiency SyndromeANC African National CongressAQP Assessment Quality PartnersASPASA Aggregates and Sand Producers Association of Southern AfricaATR Annual Training ReportB-B-BEE Broad-based Black Economic EmpowermentBEE Black Economic EmpowermentCAD Computer-aided DesignCBO Community-based OrganisationCHE Council on Higher EducationCLAS Cement, Lime, Aggregates and SandCPI Consumer Price IndexCRM Customer Relationship ManagementCSMI Centre for Sustainability in Mining and IndustryCTF Culture Transformation FrameworkDBE Department of Basic EducationDEA Department of Environmental AffairsDHET Department of Higher Education and TrainingDME Department of Minerals and EnergyDMR Department of Mineral ResourcesDoL Department of LabourDPW Department of Public WorksDQP Development Quality PartnerDR Disaster RecoveryDRDLR Department of Rural Development and Land ReformECSA Engineering Council of South AfricaEIUG Energy Intensive User GroupETF Exchange Traded FundsEPWP Expanded Public Works ProgrammeETQA Education and Training Quality AssuranceExco Executive CommitteeFC Foundational CommunicationFET Further Education and TrainingFLC Foundational Learning CompetencyFML Foundational Mathematical LiteracyGATT General Agreement on Trade and TariffsGCC Government Certificate of CompetencyGDP Gross Domestic ProductGET General Education and TrainingGVA Gross Value AddedHDI Historically Disadvantaged IndividualHDSA Historically Disadvantaged South AfricanHEMIS Higher Education Management Information SystemHET Higher Education and TrainingHIV Human Immunodeficiency Virus
LIST of ABreVIATIoNS ANd ACroNYMS

HR Human ResourcesHRD Human Resources DevelopmentHSRC Human Sciences Research CouncilIDC Industrial Development CorporationIMF International Monetary FundIPAP Industrial Policy Action PlanIRM Industrial Raw MaterialsISO International Standards OrganisationJIPSA Joint Initiative on Priority Skills of South AfricaJSE Johannesburg Securities ExchangeKSO Key Strategic ObjectiveLED Local Economic DevelopmentLFS Labour Force SurveyLME London Metal ExchangeLDPM Labour Demand Prediction ModelMDP Management Development ProgrammeMEC Member of the Executive CouncilmerSETA Manufacturing, Engineering and Related Services SETAMHSA Mine Health and Safety ActMHSC Mine Health and Safety CouncilMIGDETT Mining Industry Growth, Development and Employment Task TeamMIS Management Information SystemMMS Mining and Minerals SectorMRAC Mining Regulation Advisory CommitteeMPRDA Mineral and Petroleum Resources Development ActMRSW Mines Rescue Services WorkerMQA Mining Qualifications AuthorityMTSF Medium-term Strategic FrameworkNATED National Technical EducationNCV National Certificate VocationNDP National Development PlanNEC National Executive CommitteeNEET Not in employment, education and trainingNGO Non-Governmental OrganisationNGP New Growth PathNHI National Health InsuranceNLPE Non-levy-paying enterpriseNLRD National Learners' Records DatabaseNPA National Prosecuting AuthorityNPC National Planning CommissionNQF National Qualifications FrameworkNSDF National Sustainable Development FrameworkNSDS National Skills Development StrategyNSF National Skills FundNSFAS National Student Financial Aid SchemeNSSD National Strategy for Sustainable DevelopmentNUM National Union of MineworkersNYDA National Youth Development AgencyOECD Organisation for Economic Cooperation and DevelopmentOFO Organising Framework for OccupationsOHS Occupational Health and SafetyOTC Over-the-counter

PES Public Employment ServicesPGM Platinum Group MetalsPIVOTAL Professional, Vocational, Technical and Academic LearningPTT Platinum Task TeamQCTO Quality Council for Trades and OccupationsR RandR&D Research and DevelopmentRDP Reconstruction and Development PlanRPL Recognition of Prior LearningRRT Resource Rent Tax SA South AfricaSADC Southern African Development CommunitySADPMR South African Diamond and Precious Metals RegulatorSAQA South African Qualifications AuthoritySDC Skills Development CommitteeSDL Skills Development LevySDF Skills Development FacilitatorSDF Skills Development FrameworkSDM Sustainable Development in MiningSDT State Diamond TraderSEE Survey of Employment and EarningsSETA Sector Education and Training AuthoritySGB Standards Generating BodySHE Safety, Health and EnvironmentSHE&Q Safety, Health, Environment and QualitySIC Standard Industrial ClassificationSIMS State Intervention in the Minerals Sector SIP Strategic Integrated ProjectSME Small and Micro EnterprisesSMME Small, medium and micro enterprisesSOC Standard Occupational ClassificationSRP Skills Research and PlanningSSP Sector Skills PlanTB TuberculosisTDCA Trade, Cooperation and Development AgreementTEBA The Employment Bureau of AfricaThe dti Department of Trade and IndustryUASA United Association of South Africa The UnionUNCSD United Nations Conference on Sustainable DevelopmentUnisa University of South AfricaUS United StatesUSD United States DollarWBMS World Bureau of Metal StatisticsW&R SETA Wholesale and Retail SETAWIL Workplace-integrated LearningWSP Workplace Skills PlanZAR South African Rand

SYNoPSIS
The Sector Education and Training Authority (SETA) for the Mining and Minerals Sector (MMS), the Mining Qualifications Authority (MQA), prepared this Sector Skills Plan (SSP) update according to the requirements of the Department of Higher Education and Training (DHET). It is based on the following DHET approach according to the draft Sector Skills plan framework and requirements, sector skills plans and annual updates 2011-2016:
• Provides an explanation of the minimal SSP requirements including both regulatory (legislative) and evaluation criteria
• Highlights flexibility in approaches, methods and formats that are available to SETAs to meet the particular circumstances that prevail in their sectors.
From the outset, it is important to take cognisance of the fact that the MQA was established in terms of the Mine Health and Safety Act (Act No. 29 of 1996) (MHSA), before the promulgation of the Skills Development Act and the establishment of SETAs. The MQA was established in order to improve health and safety standards through education and training in the mining sector. The MHSA also prescribes the composition and governance structures of the MQA. It specifies the tripartite nature of the MQA, with the state in the form of the Department of Mineral Resources (DMR), organised labour, and employers playing equally important roles in the governance of the organisation. In this tripartite structure, the state (in the person of the Chief Inspector of Mines) occupies the chairperson position on a permanent basis.
Furthermore, the Minerals and Petroleum Resources Development Act (Act No. 28 of 2002) (MPRDA) establishes the Minerals and Mining Development Board that must “in consultation with the Mining Qualifications Authority, ensure the promotion of human resource development in the mining and minerals industry”.
The legislative arrangements impose on the MQA a legislated responsibility to place health and safety at the centre of its focus and skills development activities. It also means that the MQA has a dual mandate: to satisfy the requirements of the skills development legislation, as well as those of the mine health and safety legislation.
The analysis presented in this Sector Skills Plan (SSP) draws on a range of information sources, including the official statistical information published by the DMR, Statistics South Africa and the Department of Higher Education and Training, and other relevant resources, such as legislation, and local and international public and private publications. The MQA has also developed its own data system, which is updated annually with information from the workplace skills plans (WSPs) and annual training reports (ATRs). These WSPs contain considerably more information than the legislated minimum requirements. A total of 573 organisations submitted WSPs, which is slightly down from the 607 in 2013.
As was the case in the past two years, in 2014/2015, employers submitted individual employee records with all the demographic variables used in the construction of the sector profile, as well as information on the training that those individuals received. This information, referred to as “source data”, enabled the MQA to do a much more accurate and detailed analysis of the sector.
1

This information, combined with the information that all mines submit to the DMR every three months, was used to build a coherent statistical picture of the MMS and to track trends over time. It also forms the foundation of the data used in the sector profile. The projections of the future demand for labour were derived from a demand projection model developed for the MQA, as well as alternative research facilities, but is still based on the source data mentioned above. However, the scarce skills mapped against Organising Framework of Occupations (OFO) Version 2013 were drawn from the source data of the WSP/ATR submissions for the 2014/2015 year.
Statistical information, wherever possible, was updated with the most recent information. New legislation and policies that impact on the sector were also considered and incorporated into the document where appropriate. The revised information was then presented to the SRP Committee for comment and further input, within the tight time constraints.
The SSP update, together with the strategic plan, will be reviewed and approved by the MQA Board. A final SSP update will be submitted in September 2014, incorporating further stakeholder and Board input, more recent data on employment in the MMS, and feedback from the DHET, if received.
The MQA is, inter alia, also driven by the following policies and strategies, among others:
• Mine Health and Safety Act(MHSA)
• Beneficiation Strategy
• Mining Charter
• National Youth Accord
• NSDS III
• State Presidential Priorities
• National Skills Accord
• Local Economic Development (LED)
• National Sustainable Development Framework
• DMRs’ “Green Mining Strategy”;
• DMR’s Sustainable Development through Mining Strategic Framework
• Strategic Integrated Projects (SIPs)
2

• IPAP
• NDP
• Mineral and petroleum resources development Act
All of the above are in some way incorporated into the strategic objectives and action plan of the MQA (Chapter 7).
This SSP consists of eight chapters. Chapter 1 serves as an introduction to both the MQA as an organisation, as well as to the process followed in developing this document. Chapter 2 provides a descriptive profile of the sector. After a brief overview of the nine MQA subsectors and the profile of the organisations that make up the MMS, employment in the sector is discussed from various perspectives. This is followed by a summary of the characteristics of the sector that have a particular impact on skills development priorities and programme implementation. The transformation of the sector is considered in light of the relevant government legislation and policy documents, including the Beneficiation Strategy and the proposed State Intervention in the Minerals Sector (SIMS).
Chapter 3 deals with the economic performance of the sector. Within a framework of sustainable development, this chapter considers the various factors that have an impact on the economic performance of the MMS, presently and in the future, as well as data on the economic growth of the sector and its contribution to GDP, and the initiatives that are in place to enhance the sector’s growth.
Chapter 4 considers the sector’s demand for labour. Past demand is described and forecasts for future demand are made according to a MQA Labour Projection Demand Model (LPDM, the optimistic growth scenario of 2.6% per annum) for the period 2013–2020. It also takes into consideration the National Development Plan (NDP) for Mining which depicts the following 3 employment growth scenario assumptions:
• Mediocre minerals scenario (NDP): -0.5% per annum
• Solid minerals scenario (NDP): 1.3% per annum
• Diversified scenario (NDP): 1.98% per annum
Chapter 5 describes the supply of labour to the sector. A description of current supply (including both employed and unemployed workers) is supplemented by a discussion on the supply of new skills into the sector, as well as development of skills among those already employed within the sector. The chapter also considers the MQA’s interventions that are aimed at alleviating skills shortages.
Chapter 6 provides a qualitative comparison between skills demand and skills supply. An outline of the broad categories of skills development needs as they emerge from this SSP is followed by more detailed information on specific scarce skills in the sector. The final section, which directly compares demand and supply, highlights the areas of skills shortages and skills gaps, and the challenges that need to be considered if the mismatch is to be addressed.
3

Chapter 7 outlines the six skills development priorities, known as strategic objectives, for the MQA – the culmination of the research and consultations processes described above. This chapter also outlines the MQA’s contribution to the strategic areas of focus of the NSDS III, government’s Medium-term Strategic Framework (MTSF) objectives, government’s Industrial Policy Action Plan (IPAP), the New Growth Path (NGP), the National Skills Accord and the Beneficiation Strategy of South Africa. Furthermore, the recently released National Development Plan: Vision 2030 and the Infrastructure Plan have been considered.
Chapter 8 concludes this SSP update and reports on the progress made so far in respect of the skills development priorities identified in Chapter 7
It is important to note when reading this SSP, that while issues are complex and cross-cutting, adherence to the structure of an SSP document demands that only particular aspects of any given issue are discussed in one particular chapter. This document must therefore be read as a whole.
4

1. INTrodUCTIoN
On 30 April 2010, the Minister of Higher Education and Training, in consultation with the National Skills Authority, released the first draft framework for the National Skills Development Strategy 2011/12 to 2015/16 (NSDS III) for comment and response from stakeholders.
Section 10 (1) (a) of the Skills Development Act No 97 of 1998 (as amended) requires each SETA to develop a five-year Sector Skills Plan (SSP). The MQA developed a SSP for 2011 to 2016. The SSP is the basis for informing the MQA’s strategy and annual performance plans (APP).
According to this Act, all sector education and training authorities (SETAs) were required to submit sectoral analyses to the Department of Higher Education and Training (DHET).
The SSP is to follow the broad guidelines given by the NSDS in the framework document. The submission date for the sector analysis was 30 June 2010 and the Mining Qualifications Authority (MQA) duly submitted a sector analysis of the Mining and Minerals Sector (MMS).
The DHET also requires the SETAs to revise and update their SSPs every year. This current SSP is a revision of the one submitted in August 2013 and the first update submitted in August 2011.
The main purpose of the SSP is described in the guideline document issued by the DHET on 23 June 2010, entitled Department of Higher Education and Training – Guide to the process and time frames for developing sector skills plans and the NSDS III. According to this guideline, the purpose of the SSP is as follows:
• Determine skills development priorities after an analysis of the skills demand and trends, and supply issues within the sector.
• Identify a set of sector specific [skills development] objectives and goals that will meet sector needs, economic or industrial growth strategies, and meet scarce and critical skills [needs] in the sector.
• Identify strategies to address these objectives and goals.
• Identify activities that will support these strategies.
• Report on performance in relation to these objectives and goals.
Although the writing of this SSP was guided by the DHET’s requirements, it is important to take cognisance of the fact that the MQA was established in terms of the Mine Health and Safety Act (Act No. 29 of 1996) (MHSA), i.e., before the promulgation of the Skills Development Act and the establishment of the SETAs. The MQA was established to improve health and safety standards through education and training in the mining sector. The MHSA also prescribes the composition and governance structures of the MQA. It specifies the tripartite nature of the MQA, with the state (in the form of the Department of Mineral Resources (DMR)), organised labour and employers playing equally important roles in the governance of the organisation. In this tripartite structure, the state (in the person of the Chief Inspector of Mines) occupies the chairperson position on a permanent basis. The MHSA is currently being reviewed to strengthen enforcement provisions, simplify the administrative system for issuing fines, reinforce offences and penalties, substitute and remove ambiguities and also effect certain amendments to ensure consistency with the Mineral and Petroleum
5

Resources Development Act (MPRDA). These amendments will soon serve before Cabinet to obtain approval for submission to Parliament.1
Furthermore, the MPRDA establishes the Minerals and Mining Development Board that must “in consultation with the Mining Qualifications Authority, ensure the promotion of human resource development in the mining and minerals industry”.2
The legislative arrangements set out above impose on the MQA a legislated responsibility to place health and safety at the centre of its focus and activities. It also means that the MQA has a dual responsibility: to satisfy the requirements of the skills development legislation, as well as those of the mine health and safety legislation.
This SSP annual update for the period 2014-2015 reflects amendments as recommended by the DHET and takes into consideration the review processes of the skills planning by DHET and the Human Resource Development Council (HRDCSA).
1.1 ProCeSS foLLowed IN THe deVeLoPMeNT of THIS SSP UPdATe
1.1.1 Information sources utilised
No single database currently provides a complete and comprehensive profile of the MMS as it has been defined for the purposes of the Skills Development Act, and for this reason it was necessary to use a range of data sources in the development of this SSP and in the current update:
• The MQA has, over the years, developed a format for the workplace skills plans (WSPs) and annual training reports (ATRs) that exceeds the minimum legislated requirements.
• The source data referred to above classified all employees according to version 10 of the Organising Framework for Occupations (OFO). The source data of the WSP/ATR submissions for the 2012/13 financial year were according to OFO Version 2013 and Data Tables.
• The DMR’s database of mines is updated quarterly through mandatory submissions. This data, which is also regarded by Statistics South Africa as the official statistics on employment in the mining industry, was used to supplement and weight the information from the WSPs in the MQA’s data system (see Appendix 1 for more details). This SSP update uses the DMR’s employment figures for the first quarter of 2014.
• Other national data sources used include, for example, the economic data series of the Labour Force Survey (LFS) published by Statistics South Africa and the Higher Education Management Information System (HEMIS) maintained by the DHET.
In addition to the quantitative data sources outlined above, the MQA has also undertaken a range of research projects based on its research agenda. Several of the research projects contributed to the understanding
1 Department of Mineral Resources.Annual Report 2011/12.
2 Minerals and Petroleum Resources Development Act, Act No. 28 of 2002, Section 58(1)(b).
6

of the MMS and were used in the preparation of this SSP update. These were augmented with research conducted by other institutions in the sector, such as the Mine Health and Safety Council (MHSC).
Finally, the demand projections presented in Chapter 4 of this report were derived from two models: an econometric model that produces forecasts for the total economy, and a demand projection model developed specifically for the MQA. In the previous SSP, projections were only made at the broad occupational level. The availability of the source data referred to above made it possible to refine this model and to project the demand for labour at a detailed occupational level.
1.1.2 Consultation process for SSP update (2011–2016)
According to the White paper for Post-School Educational and training, Government Gazette No. 37224, 15 January 2014, the SETAs have a crucial role to play in facilitating such workplace learning partnerships between employers and educational institutions.
SETAs will focus on developing the skills of those in existing enterprises and the development of a skills pipeline to such workplaces. Their focus will be narrowed to engaging with stakeholders in the workplace, establishing their needs, and ensuring that providers have the capacity to deliver against these.
The SETAs will supply sector-specific, reliable quantitative data to the national central planning process, engage with key stakeholders to test scenarios that emerge from the central skills planning process, and plan to support provision in priority areas. The DHET, with the SETAs, will use the national and sectoral information on skills demand to plan supply.
The Development of the SSP of the MQA will be fed into the national central planning process to support provision in priority areas.
1.1.3 Sector participation
In order to ensure high levels of participation in the development of the Sector Analysis Report, the MQA Board established a project team to work with its research partner in the development of the SSP. This team consisted of representatives from each of the three constituencies: employers, labour and the state (DMR), together with the MQA managers and key personnel in the Skills Development and Research Unit. The team provided information for the original sector analysis and commented on the SSP.
The MQA will conduct a series of workshops with its stakeholder constituencies over the next few months. Workshops will also be held with the MQA Board. At these workshops, the sector analysis report will be interrogated and commented on. The workshops will also focus on the stakeholders’ views regarding the skills development priorities that the MQA should set for the next five years and the contributions that the MQA and the sector could make to the national imperatives set out in various government policies, including the National Development Plan (NDP). Subsequently, a further MQA Board workshop will be held to present and receive comments on the draft SSP and the strategic plan.
7

1.1.4 Other consultations
In the SSP preparation process, the MQA contacted all nine provinces via their premiers’ offices to obtain their economic development plans and inputs into the skills needs and priorities in their provinces. Written input was also received from the Department of Environmental Affairs (DEA), which was then followed up by further engagements on the SSP.
Comments from stakeholders and the comments received by the DHET were considered at an MQA Board strategic planning session held on 18 and 19 November 2010. As far as possible, comments were accommodated and incorporated. When the final NSDS III was released by the DHET on 13 January 2011, the MQA aligned the SSP with the NSDS III. The SSP was then finalised and presented to the various stakeholder representatives for final sign-off.
1.1.5 Consultation process for SSP update (2012–2019)
In 2012-2013, the MQA established a task team to assist with and contribute to the SSP update. This task team consisted of representatives of the three stakeholder groupings: employers, organised labour and the state (DMR), together with the relevant MQA managers.
All the statistical information, new legislation and policies that impact on the sector were also considered and incorporated into the document where appropriate. The revised information was presented to the task team for comment and further input.
The SSP was then reviewed and approved by the MQA Board during a strategic planning session.
In 2013, the MQA Board Standing Committee: Skills Research and Planning (SRP) guided and contributed to the SSP update. This Board Standing Committee consisted of representatives of the three stakeholder groupings: employers, organised labour and the state (DMR), together with the relevant MQA managers. .
The SSP update, together with the strategic plan, was then reviewed and approved by the MQA Board during a strategic planning session on 28 and 29 August 2012.
The revised information was then presented to the SRP Committee for comment and further input, within the tight time constraints. Comments were received from the MQA Board at the Board session on the 3rd and 4th of October 2013.
1.1.6 Consultation process for SSP update (2015–2020)
MQA conducted consultative sessions from 17 June to 20 June 2014 in the provinces of Gauteng, Free State, North West, Limpopo, Northern Cape, Eastern Cape and Mpumalanga. These consultative sessions were to gather information from stakeholders for the enhancement of the SSP process and to add to the research process and data gathering, thus improving the authenticity and validity of the SSP.
8

2. SeCTor ProfILe2.1 INTrodUCTIoN
Last year there were 1616 levy paying organisations compared to this year’s 1564, which shows a decrease of 52 of organisations paying levies. There were also 1397 non levy paying organisations as compared to 1411 this year, which shows a growth of 14 non-levy paying enterprises. A total of 573 organisations submitted WSPs, which is slightly down from the 607 in 2013. There has been a steady increase in the number of WSPs submitted over a five year period, peaking at 612 in 2012. The decrease in the small levy paying organisations needs further investigation and a process needs to be put in place for them to participate in skills development for their employees. The table below indicates the number of employees who submit WSPs and the percentage over a 6 year period.
Table 2.1 No of organisations submitting WSPs
Year Levy payers WSPs submitted % of levy payers
2007/2008 1 289 307 23.8
2008/2009 1 442 373 25.9
2009/2010 1 294 466 36.0
2010/2011 1 480 598 40.4
2011/2012 1 398 612 43.8
2012/2013 1616 607 37.6
2013/2014 1 564 573 36.6
Source: Calculated from MQA data system, August 2014.
9

2.2 INdUSTrIAL CoVerAGe
The MMS was demarcated by the Department of Labour (DoL) in 1999. All mining activities covered by the Standard Industrial Classification (SIC) codes 21000 to 29000, as well as a small component of manufacturing – namely the Manufacturing of Cement, Lime and Plaster (SIC code 34240), Jewellery Manufacturing and Related Articles (SIC code 39210), the Cutting and Polishing of Diamonds (SIC code 39212) Jewellery and Related Articles (composed of precious metals, precious and semi-precious stones and pearls) (SIC code 39211) and Other Precious and Semi-precious Stones Precious and Semi-precious Stone Cutting and Polishing (SIC code 39219).
Even though the DHET has defined the sectors to be served by the respective SETAs, organisations have a choice regarding the SETA they want to register with. There are a number of organisations not directly involved in mining activities as such, but closely associated with the sector, have chosen to register with the MQA or have been allocated to the MQA by the DHET.
In order to facilitate the analysis of data covering such a wide spectrum of SIC codes, organisations in the sector have been categorised into the following nine subsectors:
· Coal Mining· Gold Mining· Platinum Group Metals (PGM) Mining· Diamond Mining· Other Mining, which includes the mining of iron ore, chrome, manganese, copper, phosphates and
salt· Cement, Lime, Aggregates and Sand (CLAS)· Services Incidental to Mining · Diamond Processing · Jewellery Manufacturing
All the organisations that do not fall within the designated SIC codes, but that have elected to register with the MQA or remained with the MQA after being allocated to the SETA by the DHET, are grouped in the subsector Services Incidental to Mining.
2.3 oVerVIew MQA SUBSeCTorS
This section provides a brief overview of each of the MQA’s nine subsectors. In describing the profile of the sector in the rest of this chapter, subsector breakdowns are presented wherever possible.
2.3.1 Coal mining
The South African coal mining industry is ranked 7th in the world in terms of production and 6th in terms of reserves, contributing 3.6% to global output. Total coal sales by value increased by 23% from 2010 to an amount of R87.8 billion. In 2011, 58% of local coal by value (roughly one quarter in terms of volume) was exported.3 South Africa exports coal to 34 countries, with the European Union being the primary market
3 Chamber of Mines. Facts and Figures booklet, 2012.
4 Mwape P, Roberts MJ, Mokwena E, Musi L, Tjatjie T, Mnguni M, Mashaba P, Kwata PG. Part One: South Africa’s Mineral Industry – General Review. Department of Minerals and Energy, South Africa’s Mineral Industry, 2007/2008.
10

(84.5%). Over 80% of the country’s saleable coal is supplied by the five largest mining groups. Coal reserves, and therefore mining activity, are predominantly in Mpumalanga and Limpopo.4
2.3.2 Gold mining
The South African gold mining industry is ranked first in the world in terms of gold reserves and 5th in the world in terms of production.5 Three of the world’s ten largest gold mining companies have headquarters in South Africa and have operations not only in South Africa, but also in Australia, West Africa and in South America.
Gauteng dominates in gold mining, accounting for roughly 49.9% of South African production. This is followed by North West (23.1%), Free State (21.3%), Mpumalanga (4.5%) and Limpopo (1.2%). Only about 5% of the country’s gold production is beneficiated locally to coins and jewellery.6
2.3.3 PGM mining
PGM is a component of six chemically similar elements: platinum, palladium, rhodium, ruthenium, iridium and osmium. The South African reserve base constitutes 87.7% of the global reserves, while the country contributes 58.7% to global production, ranking 1st in both categories. South African reserves are concentrated mainly in North West and Limpopo, these two provinces are contributing 63.5% and 30.2% respectively to national production. The PGM mining subsector consists of a small number of very large companies.7
In order to address the challenges facing the industry, the Minister of Mineral Resources, the Mining Industry Growth and Development Task Team (MIGDETT) and the chief executives of the PGM mining companies are considering a report from the MIGDETT Platinum Task Team (PTT) established to consider the challenges facing the PGM mining sector.
The Platinum Producers’ Forum was started a few years ago in response to the need for platinum producers in the Rustenburg area to cooperate on infrastructure and community development issues. The Platinum Producers’ Forum has identified ways in which producers can pool resources and engage in cooperative ventures. The platinum sector has successfully pioneered the concept of cooperative social development programmes through the Platinum Producers’ Forum; this is being replicated in the coal and in the gold sectors.8
2.3.4 Diamond mining
South Africa was ranked 5th in the world in terms of diamond production by value in 2009, after Russia, Canada, Botswana and Angola9. In South Africa, deposits are concentrated in the Northern Cape and Limpopo. De Beers Consolidated Mines dominates South African diamond mining, with mines in South Africa, Botswana,
5 Chamber of Mines.Facts and Figures booklet, 2012.
6 Mwape P, Roberts MJ, Mokwena E, Musi L, Tjatjie T, Mnguni M, Mashaba P, Kwata PG. Part One: South Africa’s Mineral Industry – General Review. Department of Minerals and Energy, South Africa’s Mineral Industry, 2007/2008.
7 Ibid.
x Southern African Institute of Mining and Metallurgy: The Rise of Resource Nationalism
8 http://list.gcis.gov.za/mailman/listinfo/sanews; released 2 August 2012.
9 Chamber of Mines. Facts & Figures booklet, 2012.
11

Namibia and Tanzania. This company contributed 29% of global production by mass, and 41% by value, in 2007. Diamond supply has fallen nearly 30% since 2007 and demand has risen by the same percentage in that same five-year period.
2.3.5 Other mining commodities
Included in South Africa’s other mining sectors are the producers of uranium, copper, iron ore, manganese and salt. Uranium production is a by-product of gold mining and distribution of the sector mirrors that of gold mining. South Africa’s copper deposits lie mainly in Limpopo, with copper being mined mainly by one large company.
In terms of iron ore, South Africa is ranked 13th in the world for reserves, 6th for production and 5th for exports. For manganese, the country is ranked 1st in the world for reserves, 2nd for production and 2nd for exports.10 In 2011, South Africa‘s manganese production increased by 21% to 8.7 mt. Iron ore and manganese deposits are concentrated in the Northern Cape.11
2.3.6 Cement, lime, aggregates and sand
The CLAS subsector is dominated by medium and smaller sized mining companies. The vast majority of small-scale mining applications (90%) also fall into this group of industrial commodities. Most sales are localized, with aggregate and sand contributing 43% to total sales, limestone and lime 21%, and phosphate concentrate 15%. Larger firms in this subsector include cement manufacturers, phosphates, vermiculite and dimension stone producers. Dimension stone is also the one commodity in this group that is exported in bulk.
2.3.7 Services incidental to mining industry
The services incidentals to mining industry consist of a large group of relatively smaller companies; the mining subsector consists of an array of companies that provide services to the mining sector. This subsector includes organisations involved in research and development in the field of mining and mineral extraction, and organisations that render services to mining companies, for example, training, catering services, payroll services, the manufacturing, distribution, hiring and maintenance of machinery and equipment used in mining, mining consulting services, and shaft sinking, transportation and logistics.
2.3.8 Diamond processing
The South African diamond processing industry consists of 221 licensed diamond manufacturers. The diamond trading company De Beers is the major supplier of rough diamonds to the industry, although some are sourced from local independent mines and others imported from Belgium, a major global buyer of rough diamonds. The Master Diamond Cutters’ Association has 80 members, which employ approximately 95% of the labour in this small subsector.12
10 Ibid.
11 Chamber of Mines. Facts & Figures booklet, 2012.
12 http://www.essentialsjewelry.com/southafrica-gem-jewelry/south-africa-rough-diamond.html, accessed 11 November 2010.
12

South Africa’s State Diamond Trader (SDT) was launched in February 2008 and is mandated to purchase 10% of South Africa’s rough diamond production and to sell these to local beneficiates.
2.3.9 Jewellery manufacturing
Firms in this subsector beneficiate mining outputs such as precious metals (gold, platinum and silver) and diamonds in the manufacture of jewellery for both the domestic and the export markets. The majority of the companies in this subsector are small. The jewellery manufacturers are located mainly in Gauteng, the Western Cape and KwaZulu-Natal. Jewellery manufacturing is very often combined with the wholesale or retail sale of jewellery products, hence, many of the jewellery manufacturers are registered with the Wholesale and Retail SETA (W&R SETA).
2.4 orGANISATIoNS IN THe SeCTor
The subsector distribution of the levy-paying organisations, percentage levy payments and percentage employees in each subsector, during this analysis, is indicated in Figure 2.1 below. The bulk proportion of levies were paid by PGM Mining (23%), which at the same time represents 32% of employees in the sector. In comparison gold mining paid 10% of the levies in the sector, and represents the second highest number of employees (24%) in the subsector. Other mining paid 25% of the sector levies, but showed a lower proportion ratio of employees (19%) in the sector. Presently 1564 organisations are paying levies and 1411 are non-payers of levies.
Figure 2.1 Subsector distribution of MQA organisations and SDL contributions: 2014
Source: Calculated from MQA data system, July 2014.
In addition to the levy-paying organisations, the sector also includes the DMR, which is a non-levy paying organisation. The CLAS and jewellery manufacturing subsectors both include a number of very small non-levy-paying organisations.13
13 In the previous version of the SSP, weights used to extrapolate WSP information to subsector totals were adjusted to provide for levy-exempt companies. However, in research into small organisations in the MMS, only a very small number of levy-exempt companies could be traced and the research revealed that employment in these companies is almost negligible. For this reason, in this SSP update, no additional weighting was used to account for small non-levy-paying organisations.
13
32%
2%
11%
2% 1%
24%
0%
19%
6%
2%
23%
4%
20%
3% 2%
10%
0%
25%
8%
4% 7%
10%
15%
4% 2%
5% 5%
29%
19%
5%
0%
5%
10%
15%
20%
25%
30%
35%
% Employees
% Payroll
% Employers

2.5 eMPLoYMeNT IN THe SeCTor
2.5.1 Total employment
Figure 2.2 Provincial spread of employees in the mining sector
Stats SA, 2014 Quarterly Labour Force Survey, Quarter 4, 2013
These figures include permanent employees as well as contractors. The largest number of workers based on provinces are in the North West amounting to 138 000 in 2012 and increasing to 163 000 in 2013 a difference of 25 000, followed by Mpumalanga with 63 000 workers in 2012 and increasing to 89 000 in 2013 a difference of 26 000. Gauteng had 26 000 workers in 2012 which increased to 49 000 in 2013 an increase of 23 000. KZN experienced a sharp decline with 30 000 workers in 2012 and only paltry 6 000 workers in 2013 a significant decline indeed (Figure 2.2).
Figure 2.3 Provincial distribution of employees according to subsector: 2014
14
MiningWestern
CapeEastern
CapeNorthern
CapeFree State
KwazuluNatal
NorthWest
GautengMpumala
ngaLimpopo
-50 000
-
50 000
100 000
150 000
200 000
250 000
300 000
350 000
400 000
450 000
0
100000
200000
300000
400000
500000
600000
700000
Eastern Cape
Free State
Gauteng
KZN
Limpopo
Mpumalanga
North West
Northern Cape
Western Cape
Grand Total
Source: Calculated from MQA data system, July 2014.

Figure 2.3 above shows the number of employees in the MMS according to the subsector. The PGM sector is dominantly in the North West Province. Gold mining is mainly in Gauteng and coal mining mainly in Mpumalanga. Most of the employees in the MMS sector are in the North West Province (195 840) followed by Gauteng (123 795), Limpopo (90 425) and Mpumalanga (74 309). The smaller mining provinces where the lowest numbers of employees are found are in Western Cape (5 658) and the Eastern Cape (2 647).
Table 2.2 Employment distribution according to organisation size
Source: Calculated from MQA data system, July 2014.
2.5.2 Provincial distribution of employees
The provincial distribution of employees can be seen in Figure 2.2 and Table 2.3. The province with the
15
largest number of workers is North West (34%). This is because of the large-scale PGM mining that takes place in the province. Gauteng is home to some of the large gold mines and 22% of the total MMS resides in this province. Limpopo houses 16% of the sector, with most of the coal mines situated in this province. A total of 13% of the sector is based in Mpumalanga, which has substantial numbers of people employed in Coal mining and in the other mining subsector.
The Western Cape and the Eastern Cape have very little mining activities, however, the Eastern Cape is one of the areas from which the MMS sources labour. Therefore, the MMS contributes to the economy of this province. Only 5% of the employees in the MMS are based in the Northern Cape.
The Stats SA figures in the same period were estimated at 380 000 and during the 4th Quarter (December 2013) period it was estimated at 426 000.14
14 Stats SA, 2014 Quarterly Labour Force Survey, Quarter 4, 2013

Employed by Mining Industry per Province
Oct-Dec 2012
Jan-Mar 2013
Apr-Jun
2013
Jul-Sep 2013
Oct-Dec 2013
Qtr-to-qtr change
Year-to-year change
Qtr-to-qtr change
Year-to-year change
Mining 380
393
403
422
426
4
46 0,9
12,0
Western Cape 4
3
3
2
3
1
-1
48,8
-16.3
Eastern Cape 2
2
1
. 1
-
-1
-
-51.9
Northern Cape 17
21
19
18
20
2
3 8,7
19.8
Free State 26
25
21
23
25
3
-1
12.2
-2.0
Kwazulu Natal 30
25
25
21
6
-15
-24
-71.7
-79.7
North West 138
148
154
160
163
3
25
1.8 18,5
Gauteng 26
20
27
36
49
14
24
38,8 92,2
Mpumalanga 63
80
82
87
89
2
26 2,5 41,7
Limpopo 76
70
71
75
69
-6
-7
-8.0
-9.5
Source: Stats SA 2014 Quarterly Labour Force, Quarter 4, 2013
16
Table 2.3 Provincial distribution of employees
Figure 2.4 Provincial distribution of employees according to subsector: 2014
Source: MQA data system July 2014
0%
8%
22%
2%
16% 13%
34%
5%
1%
Eastern Cape
Free State
Gauteng
KZN
Limpopo
Mpumalanga
North West
Northern Cape
Western Cape

2.5.3 Educational profile
The MMS employs a large number of people who have very little formal schooling. The educational profile of employees is depicted in Table 2.4. In 2014, 43% of the employees in the sector had an educational qualification below Grade 12 (the first level on the National Qualifications Framework (NQF)). Just over a quarter (27%) of the employees in the sector had NQF Level 4 qualifications (matric or equivalent) and 13% had post-school qualifications.
The MQA started to collect information on educational levels in the 2002/03 financial year. The percentage of people with educational qualifications below Grade 9, i.e., people who could possibly benefit from adult basic education and training (ABET), decreased from 66.2% in 2002 to 48.9% in 2009. 15
The proportion of people in the sector with post-school qualifications increased from 4.5% in 2002 to 9.5% in 2009 and 13% in 2013. The percentage of people in the sector with matric increased from 11.5% in 2002 to 19.5% in 2009 and 27% in 2014.
15 Owing to limitations of the MQA data system, this level of detailed information was not available for 2010 and 2011.
17
Table 2.4 Highest educational qualifications of employees in the MMS
2.5.4 Race and gender distribution of employees
The majority of employees in the MMS are African. In 2014, 85% of the employees were African and 2% coloured (Figure 2.5). Whites constituted 12% of employment and Indians less than 1%.
Source: Calculated from MQA data system, July 2014.

Figure 2.5 Racial distribution of employees
Source: Calculated from MQA data system, July 2014.
Even though Africans formed the majority of the workers in the sector, they were not equally represented in all the occupational groups. The majority, 62% of managers, and 39% of professionals were White, 69% of Technicians and Associate Professionals were black and 96% of Plant and Machine Operators and Assemblers were African and 56% of the category skilled craft and related trades workers (the category that includes artisans) were Black (Table 2.5). This shows a marked difference from the previous reporting year.
Except for the occupational category managers, in which whites make up 62% of the total, Africans (and Africans in general) make up the majority of employees, including 54% of professionals, 69% of technicians and associate professions, 56% of the category skilled craft and related trades workers (the category that includes artisans) and 98% of plant and machine operators and assemblers.
85%
2% 0% 12%
African
Coloured
Indian
White
18

Table 2.5 Racial distribution of employees according to occupational group: 2014
Source: Calculated from MQA data system, July 2014.
In 2014, 12% of the employees in the MMS were female – 10% African female and 2% white female. Females formed 12% of the workforce in this occupational group. Many females were employed as clerical support workers and they constituted 49% of this occupational category. 5% of females were employed as plant and machine operators and assemblers. Women employed as professionals constituted 31% of all professionals in the sector. In the occupational group managers, the sector employed, women represented 16% of the workers in this group (see Figure 2.6).
19

Figure 2.6 Gender distribution by race according to occupational category: 2014
Table 2.6 shows the increases in females’ share of employment from 2002 to 2014. In 2002, only 4% of the workers were female. This figure increased three-fold to 12% in 2014. Information on the number of female employees in the different subsectors is only available from 2002. The subsectors diamond processing and jewellery manufacturing proportionally have the largest employment of females (25% and 50% respectively in 2014), while 16% and 17% of the workforce, respectively in the coal and diamond mining subsectors are female. In the gold mining, PGM mining and services incidental to mining subsectors 10%, 11% and 13% respectively are female.
E
Table 2.6 Females employed according to subsector
16Source: Calculated from MQA data system, July 2014.
In Table 2.7 females, make up 16% of managers, compared to 84% of male managers. A marked difference is present in the professional grouping (31% compared to 69%), which is a positive indication of the potential development of female managers from the professional grouping. A substantive impact on this potential development will be if more females can be developed in the technicians and associate professionals grouping, as this grouping has a natural tendency to develop new members of the professional grouping. The MQA should focus on the fruition of this skills development opportunity.
16 This is weighted by a factor to get the total employees in the sector (Refer to appendix 1)
Source: Calculated from MQA data system, July 2014
20

Table 2.7 Gender distribution of employees according to occupational group
Source: Calculated from MQA data system, July 2014.
2.5.5 Age distribution of employees: 2014
The age distribution of employees in the MMS can be seen in Figure 2.7. In 2014, only 5% of the total number of employees was 25 years or younger. The majority, 32% were between 26 and 35; and 29% were between 36 and 45. Only 9% were 56 years and older. The tendency of the possible non-interest in the mining sector by the age grouping 25 and younger (5%) should be a matter of concern as this grouping is the feeding ground for the long-term development of career stability and job creation in the sector. This skills development opportunity should be investigated further in view of understanding the criteria to enhance job opportunities in this sector.
23
Figure 2.7 Age distribution of employees: 2014
Source: Calculated from MQA data system, July 2014.
2.5.6.Disability
Most of the work in the MMS is of a strenuous physical nature and the opportunities for the employment of people with disabilities in certain occupations (especially those on the mining sites) are limited. This
21

17 Department of Minerals and Energy, Mine Health and Safety Inspectorates’ Minimum Standards of Fitness to Perform Work at a Mine.
22
statement is underscored by the Mine Health and Safety Inspectorates’ Minimum Standards of Fitness to Perform Work at a Mine.17 However, some of the professional, clerical and administrative positions in mining, and positions in the non-mining subsectors, such as diamond processing and jewellery manufacturing, lend themselves to the employment of people with disabilities. In 2014, the sector employed 4924 people with disabilities – 0.87% of total employment (Table 2.8). The subsector with the highest employment of people with disabilities was PGM mining, with people with disabilities constituting 0.58% of total employment.
Table 2.8 People with disabilities according to subsector
Table 2.9 People with disabilities according to occupational category
Source: Calculated from MQA data system, July 2014.
2.6 CHArACTerISTICS of THe SeCTor
2.6.1 Regulation of the sector
The MMS is a highly regulated industry with a numerous number of policies and pieces of legislation regulating the functioning of organisations in the sector. The most important of these are the MHSA and the MPRDA.

23
The MQA is responsible for the development and registration of qualifications that provide the necessary competency levels and for the certification of people who have reached the required competency levels.
The MPRDA determines that mineral rights vest in the state and that organisations that wish to engage in or continue with mining activities have to apply for mining licences with the DMR. This means that mining companies have to comply with the requirements set by the DMR in order to secure or to retain mining rights.
The MPRDA also determines that all mining operations have to comply with the National Environmental Management Act (Act No. 107 of 1998). Environmental management and rehabilitation is, therefore, an important issue in skills development in the sector.
2.6.2 Labour organisation
The workforce of the MMS, particularly in mining, is highly unionised. The union with the largest membership is the National Union of Mineworkers (NUM). Other unions active in the mining industry include the United Association of South Africa (UASA), Solidarity and the Association of Mineworkers and Construction Union (AMCU) (as well as a few others). The most active union in the jewellery industry is the Jewellers and Goldsmiths Union (which is currently active only in the Western Cape).19
2.6.3 Employer organisations
Employers in the MMS are equally well organised. The largest employer organisation is the Chamber of Mines, which represents most of the large mining companies. Many employers in the CLAS subsector belong to the Aggregates and Sand Producers Association of Southern Africa (ASPASA), while many of those in the diamond processing subsector belong to the Diamond Council. The Jewellery Council is the largest employer organisation in the jewellery manufacturing subsector.
2.6.4 Professional organisations
The professionals working in the sector are affiliated with various professional associations and bodies and many belong to voluntary professional associations. The professional bodies play important roles in skills development in the sector and close relationships exist between them and the MQA.
2.6.5 Geographic location
The geographic location of mining operations has many implications that need to be taken into account and consideration in skills planning:
· In many areas, mines are the main employers and, through their involvement with local communities, they play an important role in the development of rural areas.
· Small towns and rural communities are seriously affected when mining operations close down. · Because of their location, mining operations are often not a first choice for new entrants to the labour
market.
Gauteng has a very high concentration of mining operations.

2.6.6 Small-scale mining
Although most of the mining operations are large, small-scale mining also forms an important part of the sector. Small-scale mining activities have grown considerably since 1994, and include both men and women operators of a diverse racial profile. In South Africa, small-scale mining is defined, on the basis of the guidelines provided for in the National Small Business Amendment Act of 2003, as a mining activity that employs fewer than 50 people, that has an annual turnover of less than R7.5 million, and that has a gross asset value of less than R4.5 million. However, as some entities do not fit precisely into this category, classification is often difficult to determine.20
The MPRDA supports the development of the small-scale mining sector through a number of provisions that include technical and financial assistance to the subsector, access to historically classified information, a special permit regime, and preference to historically disadvantaged South Africans (HDSAs).
The DMR has developed a draft National Small-Scale Mining Strategy, through which it hopes that a number of challenges that are faced by the small-scale mining sector can be met.21 The MQA will play a key role in the development of expertise, capacity and skills. Skills development will invariably have an indirect impact on the other challenges faced by small-scale miners, such as becoming compliant with the relevant legislation.
The MQA study survey in 2010 revealed, among other things, that small organisations were particularly hard hit by the recent recession and adverse economic climate. The small mines are scattered across the country and seldom have access to training opportunities. They also find it difficult to release people to undergo training off-site. At the same time, they cannot afford in-house training facilities and expertise22
2.6.7 Migrant labour
The MMS employs a large number of foreign workers. The MQA required employers who submitted WSPs/ATRs in 2013/14 to provide information on the number of foreign nationals that they have employed. Based on this information, it was estimated that at the end of March 2014, the sector employed approximately 79 763 non-South Africans – 14% of the total workforce. The largest employer of foreign workers is the gold mining subsector – 27% of its total workforce (Table 2.10).
Table 2.10 Non-South African citizens in the MMS
Source: Calculated from MQA data system, July 2014.
18 Information provided by the Jewellery Council of South Africa.19 At the time of writing this report, statistical information on membership of the various unions was sought, but complete and reliable information could not be obtained in time20 MQA-CSMI, Small-scale Mining Colloquium, Johannesburg, South Africa.Report and Analysis of Outputs, September 2010.
24

The MMS also employs migrant workers from other parts of the country – specifically from the Eastern Cape. This migrant labour system has created a unique relationship between the MMS and labour-sending areas. Many areas that are situated far from mining activities are essentially dependent on the MMS for their economic survival. These areas are severely affected by the contraction of the MMS 23 The number of foreign nationals for 2014 (Table 2.10 above) amounted to 79 763 employees or 14% in the sector. In the wake of the unfortunate Marikana tragedy and the mining unrest, the Presidential Special Package announced that money will be spent on improving the living conditions in mining communities.
2.6.8 Outsourcing and subcontracting of labour
Similar to global trends in employment, roughly one third of all people working in the mining industry are now employed through a non-standard employment contract24 The majority of these are employed by labour brokers. Subcontracting firms range from larger, established contractors employing over 1 000 workers to micro-enterprises employing between one and 100 people.
While labour unions’ concerns around labour subcontracting relate to issues such as lower pay, more dangerous work and limited or no access to social benefits such as sick-leave and death benefits, employers point to the challenges of maintaining profitable operations in uncertain market conditions as a key reason for using subcontractors. This is mainly in the Free State, but has also become an issue in other regions.
In some of the mines, contract workers are made to work in the most dangerous areas of the mine where there are also many illegal miners who normally pose a serious threat to the safety and security of these workers25
2.6.9 Language use
MMS use a large number of migrant workers, the industry is faced with the challenge of accommodating people from different language groups in the same work environment – some foreign workers have little command of any of the South African languages. This led to the development of a pidgin, Fanagalo language as a means of communication in the mining sector. This language diversity poses serious challenges to the MMS and the MQA.
Fanagalo is used mostly in the underground work environment, that it is still used in at least 52 of the larger mines in the country, and that approximately 40% of the workers in the mining components of the MMS are still using it or are exposed to it. Fanagalo is also used in the training environment. Some mining houses have started phasing out of Fanagalo on their mines. One such example is Gold Fields’ New Way of Communication Project26 A number of mining companies have taken the initiative and are implementing programmes that phase out Fanagalo within their companies 27 The DMR noted that “The lack of common communication undermines the efficiency of oral communication and has a negative effect on skills development”28.
22 EE Research Focus, Small Companies Survey: Diamond Processing, Jewellery Manufacturing, and Cement, Lime, Aggregates and Sand (CLAS) subsectors, Report to the MQA, May
2011.
23 Mining Charter, Section 4.4.
24 A standard contract of employment refers to: a full-time contract of employment of indefinite duration for work that is performed at the premises of the employer. Part-time work,
fixed-term contracts, casual work or piece work, or work that is arranged through a third party, such as a labour broker, are all forms of non-standard employment, which implies that
the employment contract is no longer subject to regulation by the state or other agencies such as the unions.
25 Bezuidenhout, A, Buhlungu, S, Hlela, H, Modisha, G & Sikwebu, D. 2005.Members first: A research report on the state of servicing in the National Union of Mineworkers.
Johannesburg: Sociology of Work Unit, p. 12; see also Buhlungu, S & Bezuidenhout, A. 2007. Old Victories, New Struggles: The State of the National Union of Mineworkers. In: Buhlungu,
S, Daniel, J, Lutchman J and Southall R (eds.) State of the Nation, 2006-2007. Pretoria: HSRC Press.
25

2.6.10 HIV and AIDS
With an HIV prevalence rate of 16.6 per cent amongst South Africans aged between 15 – 49 years, South Africa has the largest HIV epidemic in the world.
• It is estimated that 316 900 adult South Africans and 63 600 South African children were newly infected with HIV during 2011. This equates to an incidence of 1042 new HIV infections per day29
30Table 2.11 below gives a breakdown of this prevalence in South Africa and the number of people living with HIV in South Africa:
Knowledge of the HIV epidemic in South Africa is based primarily on the prevalence data collected annually from pregnant women attending public antenatal clinics since 1990. This release assumed the median time from HIV infection to death in line with the UNAIDS Reference Group recommendation of 10.5 years for men and 11.5 years for women. Adult HIV incidence is disaggregated into female and male incidences by specifying the ratio of new female infections to new male infections. This report assumes a ratio of female to male prevalence for those aged 15 to 49 of 1.5 in 2013.
Table 2.11 HIV prevalence estimates and the number of people living with HIV, 2002–2013
Source: Statistics South Africa, Mid-year Population estimates, 2013.
The above table shows a steady growth in the number of people living with HIV in South Africa. Studies show
26 http://countryoffice.unfpa.org/filemanager/files/southafrica/HIV_Prevention_Fact_Accessed 19/05/2014
27 Bezuidenhout A, Bischoff, C & Masondo, T. 2010.Meeting expectations? A research report on the state of servicing in the National Union of Mineworkers.Society, Work and
Development Institute, University of the Witwatersrand, Johannesburg, p 99.
28 University of the Witwatersrand, Wits Language School, Gold Fields New Way of Communication Project
29 http://www.witslanguageschool.com/Newsroom.aspx; accessed 09/08/2012.
30 Annual Report 2012 Chamber of Mines South Africa.
26

that the prevalence in the mining industry is markedly higher – 27% in gold mining and 24.6% in platinum mining31 In 2005, the DMR estimated that 24% of the mining industry’s workers were living with HIV and AIDS32
Mining is a high-risk environment. The use of migrant labour, single-sex hostels and the severing of family structures contribute to the spread of the infection. The hard physical work required of mine workers, plus the risk of occupational disease, may speed the onset of illness among HIV-positive workers34
Occupational diseases
Tuberculosis (TB), noise-induced hearing loss and silicosis are the main occupational health challenges faced by the mining industry35 The combination of HIV and silicosis has a large effect on TB risk36
Figure 2.8 Occupational Diseases as reported on Gold mines’ DMR Reports from 2013-2014
Source: DMR Occupational Health and Safety Report September 2014
According to the DMR, the incidence of TB is also higher than the national average. This is fuelled by the surge in HIV and AIDS co-infection. The bigger mines have good TB programmes, but the emergence of drug-resistant strains is making control of TB much more difficult. In 2003 it was reported that 9 384 miners had Pulmonary tuberculosis (PTB) and in 2013 only 3 255 were reported to have PTB. There is a significant decline on the PTB cases over the years. The same with Noise Induced Hearing Loss (NIHL) from 2003 it had 6 021
31 Presidential Audit Report 2008. Challenge of Communication.
32 Rees D, Murray J, Nelson G & Sonnenberg P. Oscillating migration and the epidemics of silicosis, tuberculosis, and HIV infection in South African gold miners. Published online in Wiley
InterScience, www.interscience.wiley.com.
33 Chamber of Mines. Bringing the underground AIDs fight to surface, www//http.bullion.org.za, published 2003 June 20.
34 Department of Minerals and Energy. Annual Report of the Mine Health and Safety Inspectorate 2004/05.
35 Ibid.
36 The Mine Health and Safety Council’s Strategic Plan for the period 2011/12 – 2013/14, January 2011.
27
2003 2004 2005 2006 2007 2008 2009 2010 2011 2012 2013
Silicosis 2200 1603 1790 1348 1681 1778 1694 1742 1286 1420 1430
NIHL 6021 4109 7638 2561 2049 1994 1280 1212 1228 1075 1389
PTB 9384 762 8005 4067 4588 4639 4468 4452 3062 2838 3255
TOTAL 17605 6474 17433 7976 8318 8411 7442 7406 5576 5333 6074
0
2000
4000
6000
8000
10000
12000
14000
16000
18000
20000

cases reported and in 2013 only 1389 cases of NIHL were reported. Silicosis has also shown a steady decline from 2200 in 2003 to 1430 in 201337
The MHSC Summit 2011 adopted an MHSC Summit HIV/AIDS and TB Action Plan aimed at improving the situation of HIV/AIDS in the mining industry, significantly improving the lifestyle of mineworkers, and focusing action on the fight against HIV/AIDS and TB38
figure 2.9 diseases reported in 2012 for appeals
Source: DMR Occupational Health and Safety Report March 2014
In 2012, appeals were commonly lodged against the following diseases: tuberculosis, vision, hearing loss, injuries and other diseases. Tuberculosis is highly disputed by employees as most of them do not accept the fact that they could be medically incapacitated due to a curable disease. Some employees respond well to TB treatment, while others don’t, but end up with complications which lead to disability and ultimately medical boarding due to ill health39
2.6.11 Mine accidents and fatalities
Mining is an inherently risky activity and the industry worldwide has a record of similar types of accidents associated with known hazards (and occasional disasters). South Africa has very large, deep and labour-intensive mines. In the early 1990s, mainly as a result of pressure exerted by the NUM, the Leon Commission of Enquiry into Mine Health and Safety was established. The resulting report led to the establishment of a new legal and regulatory environment governing health and safety (including the MHSA), as well as tripartite (government, labour and employer) structures and processes for implementation. The report also increased the pressure on companies and management to improve the health and safety record of the industry.
oVerALL fATALITIeS Per MoNTH IN THe MINING SeCTor
In total 93 employees were reported killed and 3126 were reported injured during the period June 2013-2014.
37 DMR Report September 2014
38 The Mine Health and Safety Council. Zero harm through action, 2011 Health and Safety Summit Outcomes
39 Department of Mineral Resources; Health and Safety Report 2014
28
0% 3%
12%
12%
16%
0%
10%
17%
1%
18%
11% 0% Heat stress
Vision
Hearing Loss
Injury
Asthma/ COAD
Diabetes/ Hypertension
Tuberculosis
Silicosis
Other Diseases
Epilepsy

From June 2013 to June 2014, seventeen (17) fatalities were reported in the Platinum commodity. During the same period 1074 casualties were reported injured as classified. 928 were involved in accidents in the Platinum sector. The numbers of fatalities compared to the injured make 1.6% during the same period. However, there is correlation between the platinum and the gold mining commodities. There is a high rate of injuries encountered by workers in these industries, because they are labour intensive in comparison to coal mining.
During the month of March 2014, five (5) fatalities were reported. However, from January to March 2014 a total of twenty seven (27) mine workers were fatally injured whilst during the same period in 2013 a total of twenty-four (24) mine workers were fatally injured. This translates to an increase in fatalities of 13% year on year40
Figure 2.10 Actual fatalities per quarter 2013/2014
40 Department of Minerals Resources: Occupational Health and Safety Report, March 2014
41 Department of Minerals and Energy. Annual Report of the Mine Health and Safety Inspectorate 2007/08.
42 Mine Health and Safety Council.Strategic Plan for the period 2011/12 – 2013/14, January 2011.
29
Source: DMR Occupational Health and Safety Report March 2014
41Mine health and safety summits have been held more or less every two years since 2003 and role players remain committed to the improvement of the health and safety record of the industry.
The three areas that are regularly the leading cause of accidents and injury are falls of ground, machinery and transportation, and rail-bound equipment42
Statistics of fatalities by region
The table below illustrates the progressive performance of each region with regard to fatalities. During the month of March 2014, six (6) of the ten (10) regions managed to mine without a fatality.
1
15
8
6
16
5
0
2
4
6
8
10
12
14
16
18
2013
2014

Table 2.12 Statistics of fatalities regionally
wC NC fS eC KZN MPU LP GP Nw-Kd Nw-rB ToTAL
Jan 0 0 1 0 0 2 0 2 0 1 6
feb 0 0 1 0 1 1 1 11 1 0 16
March 0 0 1 0 0 1 0 2 1 0 5
Total 0 0 3 0 1 4 1 15 2 1 27
Source: DMR Occupational Health and Safety Report March 2014
Analysis of fatalities by commodity
For the purpose of the analysis, commodities are grouped into gold (AU), platinum (PT), coal (CL) and other mines (i.e. chrome manganese, diamonds, stone, sand, brickworks, etc). The comparison of fatalities year to date as reflected on the graph below shows an increase in fatalities in the gold sector, a decrease in the coal sector and a reduction in the platinum and other mines sectors respectively43
Figure 2.11 Actual fatalities per commodity 2009-2013 in all mines
Au Cl Pt Oth
81
18
41
26
62
12
34
19
51
12
37
23
53
11
28
20
37
7
27 22
2009
2010
2011
2012
2013
43 Department of Minerals and Resources: Occupational Health and Safety Report, March 2014
Source: DMR Occupational Health and Safety Report 2014
From 2009 to 2013 , the gold sector is leading with 287 reported ) fatalities, the coal sector is the least with 60 reported fatalities during the same period ,the platinum sector is second with 167 reported fatalities and Other mines is the third with 110 reported fatalities. There is a significant decline in fatalities from 2009-2013 in all commodities.
30

Source: Occupational Health and Safety Report June 2014
Trackless Mobile Machines (TMM) (18%)
There were twenty eight (28) fatalities reported in this category from June 2013 to June 2014. One (1) was reported in March 2014. A worker was fatally injured when pinned to the sidewall by an LHD.
Electricity (3%) One worker died during this period, including an electrician who was killed whilst fault finding.
Fall of Ground/Rockfall (30%)
There were thirty one (31) fatalities reported in this category during this period, all of these occurred in the gold mines.
Explosives (2%)
There were two (2) fatalities reported in this category between June 2013 and 2014.
General (27%)
There were twenty eight (28) fatalities reported in this category, from June 2013-2014 A worker was killed when he was inundated by broken ore, a second died when he fell out of a front end loader and a third worker was fatally injured when a guard car hooked onto a flange, whereby it broke, struck the worker and in the process fatally injured him, A fourth worker was killed when he was struck by a pipe structure that collapsed when he was busy levelling out the spreader bars44
Fall of ground 30%
Machinery 6%
Trackless mobile machinery
27%
Misc 4%
General 27%
Conveyance accidents
1%
Electricity 3%
Explosives 2%
Analysis of fatalities by classificationFigure 2.12 Percentage fatalities per classification June 2013-June 2014
44 Department of Minerals and Resources: Occupational Health and Safety Report, June 2014
31

Machinery (6%)
There were six (6) fatalities reported in this category, from June 2013-2014
Miscellaneous (4%)
There were (4) fatalities reported in this category, from 2013-2014.
The MQA was specifically tasked with the improvement of the occupational health and safety (OHS) skills capacity in the industry by reducing the rate of illiteracy and increasing the human resources supply in scarce skills areas that are critical to OHS45
Mine safety remains a very important issue for the MMS, and safety-related training will remain prominent on the MQA’s agenda. MQA will continue with the evaluation of qualifications in order to ensure that the competencies necessary for and the attitudinal aspects of health and safety are sufficiently covered.
2.6.12 Environmental impact
Even though mining is an important industry and creates employment in South Africa, it has its environmental footprint, which ranges from biodiversity loss (due to habitat destruction) to air, land and water pollution.
Developing South Africa’s natural resources in a way that is sustainable and does not degrade environmental quality in an unwarranted manner are state priorities reflected in the National Sustainable Development Framework (NSDF). Legislation exists for environmental impact assessments (to inform new developments), waste stream reduction and pollution control, the rehabilitation of mined areas and the restoration of spent mines46 The mining industry has to comply with this legislation and therefore needs to develop and cultivate the skills necessary for environmental management.
In July 2011, the DMR issued the Sustainable Development through Mining Strategic Framework document. This strategic framework document conveys the notional meaning of sustainable development in the mining sector. The vision is that by 2015, the South African minerals sector is expected to contribute optimally to sustainable development. A number of key strategic objectives (KSOs) have been developed out of this vision. Essentially, the mandate of the DMR is to ensure that the extraction of mineral and petroleum resources in South Africa aids sustainable development. The document illustrates and reflects on the model proposed for the Sustainable Development in Mining (SDM) programme for the minerals sector. The United Nations Conference on Sustainable Development (UNCSD) outcomes and inputs from industry will be assessed and the development of an implementation plan and indicators to ensure sustainability will follow47
45 Mine Health and Safety Council Mine Health and Safety Tripartite Leadership Summit, 5 September 2008.
46 Department of Environmental Affairs, Integrating the environmental driver into sector skills plans: An enabling document for all SETAs, July 2010
47 Department of Mineral Resources. Sustainable Development through Mining Strategic Framework, July 2011..
32

2.6.13 Beneficiation
The DMR’s June 2011 Beneficiation Strategy Report corresponds with South Africa’s Industrial Policy Action Plan and the New Growth Path, which identifies mineral beneficiation as one of the priority growth nodes to help create five million jobs by 2020. It is expected that beneficiation will become one of the major drivers in enhancing the empowerment of historically disadvantaged communities in South Africa. It also presents opportunities for the development of new entrepreneurs in large and small mining industries48 The strategy document covers the strategic framework to promote and enhance local beneficiation of mineral commodities mined in South Africa.
One of the constraints identified in the encouragement of beneficiation is skills sought for expediting local beneficiation49
Of the five streams in the strategy, two plans have been approved, two are under development and the fifth (jewellery) will only be developed after the Jewellery Summit. Effective from 2012, the measurement of the contribution of a mining company towards beneficiation is on the Mining Charter scorecard. It will be measured by “additional production volume contributory to local value addition beyond the baseline” and the compliance target is a percentage above baseline, to be achieved by 2014.
Despite government’s efforts to avail rough diamonds through the SDT, the level of beneficiated diamond output remains low in the country due to limited rough supply. The government therefore continues to look at improving access to rough diamonds by engaging in different pilot projects. This will ensure growth and sustainability of the diamond beneficiation industry, as well as job creation and poverty alleviation in the country. The MQA and its tripartite members can play a leading role in such projects.
2.7 TrANSforMATIoN of SeCTor
2.7.1 Mineral rights and mine ownership
Mineral rights and ownership are regulated through the MPRDA. The MPRDA strongly emphasises the state’s custodianship of mineral and petroleum resources and government’s intention to ensure that these resources are utilised in the best interest of the country and its people.
2.7.2 Black economic empowerment and employment equity
Closely linked to the need for transformation of ownership is the issue of black economic empowerment and employment equity. Since 1994 a number of acts pertaining to social transformation, the eradication of the effects of previous discriminatory legislation and practices, black economic empowerment and employment equity have been promulgated. These include, for example, the Employment Equity Act (Act No. 55 of 1998), the Preferential Procurement Framework Act (Act No. 5 of 2000) and the Broad-based Black Economic Empowerment (B-BBEE) Act (Act No. 53 of 2003).
48 http://www.dmr.gov.za/beneficiation-economics.html; accessed 09 August 2012
49 Department of Mineral Resources. A Beneficiation Strategy for the minerals industry of South Africa.
33

2.7.3 The Mining Charter and Codes of Good Practice
In addition to this legislation, the MPRDA required the development of a broad-based socioeconomic empowerment charter that would set the framework, targets and timetable for affecting the entry of HDSAs into the mining industry. As a consequence, the Broad-based Socioeconomic Empowerment Charter for the South African Mining Industry (the Mining Charter) was developed in 2002 and was –The Charter covers a wide range of areas for transformation. These include human resources development, employment equity, migrant labour, mine community and rural development, housing and living conditions, procurement, ownership and joint ventures, beneficiation, licensing and financing. The Charter specifies mechanisms and targets for human resources development.
The declaration contains 13 different commitments, most of which are also reflected in the amended Charter. Several of the declaration’s commitments and the requirements of the amended Charter have a direct bearing on skills development and on the work of the MQA. The most important of these are highlighted below.
First of all, in the declaration, the parties agreed to conduct at least two skills audits by 2014, and assess institutional and organisational absorptive capacity by no later than December 2010. Skills audit is an area in which the MQA is already involved and it plans to provide assistance to employers with the implementation of this undertaking. Secondly, the amended Charter retains an objective of 26% HDSA ownership of mines by 2014. Thirdly, mining companies are bound to invest a percentage of their annual payroll in all skills development activities, but excluding the mandatory skills levy, as follows:
• Target for 2010 – 3%• Target for 2011 – 3.5%• Target for 2012 – 4%• Target for 2013 – 4.5%• Target for 2014 – 5%
The implication of the increased spending on training is that the MQA has to ensure that the necessary programmes are in place, that there is a sufficient supply of accredited providers, and that all training that takes place is quality assured.
In terms of employment equity, companies are bound to the following:
• Create an environment conducive to promoting and encouraging diversity in order to increase and retain requisite skills.
• Ensure demographic representation of HDSAs with a minimum target of 40% by 2014 in each of the following occupational categories:
- Top management (Board)
- Senior management (Executive Committee (EXCO))
- Core and critical skills
34

- Middle management
- Junior management
• Identify and fast-track their existing talent pools to ensure high-level operational exposure in terms of career path programmes.
The amended Mining Charter places great emphasis on the sustainable development and growth of the mining industry. .
The focus of the Charter on environmental management places the development of environmental management and related skills on the MQA’s skills development agenda. The importance of health and safety training and the role that the MQA has to play in this regard was mentioned in Section 2.5.
The government developed a set of Codes of Good Practice for the minerals industry, which was gazetted in April 2009.
The Codes cover the following:
• Ownership
• Management control
• Employment equity
• Human resources development
• Preferential procurement
• Mine community and rural development
• Beneficiation
• Housing and living conditions standards
2.7.4 Social and Labour Plan
Another way in which the MPRDA ensures the effective transformation of the mining industry is by legally requiring applicants to submit a Social and Labour Plan before prospecting and mining rights are granted.
35

A Social and Labour Plan requires applicants to develop and implement the following:
• Comprehensive human resources development. • Local economic development programmes • Processes to address situations that may negatively affect the employment of workers
Applicants also have to submit annual reports on the implementation of their social and labour plans to the DMR in order to retain their mining licences.
Thus, the Social and Labour Plan aims to ensure that organisations in the MMS are deeply involved in rural development50
2. 8 STAKeHoLder CoNSULTATIoNS
The facilitators conducted consultative sessions from 17 June to 20 June 2014 in the following provinces:
• Gauteng
• Free State
• North West
• Limpopo
• Northern Cape
• Eastern cape
• Mpumalanga
Refer to the information below on the consultative sessions for each province.
Gauteng Stakeholder consultative meeting
Stakeholder input on PESTEL analysis
Political
• New parties emerging (EFF)
• Factions cause instability
• Influences instability (some form of instability)
• Opposition parties have influence on operations
• OEMS only, because of BBBEEs
• Schooling system producing inadequate mathematics and science learners
• Impacts on the production of skills in the sector
50 Awaiting more information on the implementation of the social and labour plan from the DMR.
36

• Gaps in the education system
• Mismatched positions - social factor
• Too many generalists rather than specialists
• Challenges of qualifications and experience mismatched
• Different strategies from government. Instructed not to employ the women on the position. (Political)
• Lack of real government in different mining department
Economical
• No accommodation for locals and accommodation for outsiders – artisan
• Too many programmes in place e.g. Mathematics teachers
Social
Bursaries awarded. Young people do not want to work in the mines
Lack of career guidance
Miners are currently having grade 7 and grade 8 in future. Matriculants may be considered
Industry attractiveness
Lack of understanding/advocacy/career guidance within mining sector
(Life after mining – development of mining, communities/labour sending areas Underground far less or unschooled workers
Grade 12 – to study ground work. After 5 years to more to others areas
Alignment of education. FET versus HET
• Trade test R80 000
• Legislative issues – grade 9 and older
• Mentorship tired
• Criteria issue from DHET
• Psychometric test not approved by Unions
Artisan certificate not going to group people on their levels of standard and education
FET and Universities articulation systems not in synch or trusting one another
Housing and living allowance but prefers the shack (Social issue)
Stipend used to support broader issues
Grants paid to encourage employers to take on youth
37

Youth subsidy not yet impacting on youth employment
Companies not putting much effort in empowering youth
Development located within urban areas
Platinum has lost more skilled people because of the strike
Health as well as safety issues
Young people want international organisations for travelling purposes. Not office bound. Diversity contributes to this situation.
Globalization also a factor
Skills gap and migration contributes to “Brain drain”
Technology
• Technology reduces jobs as company needs less workers
• Mechanisation affects this sector
• Alternative group of metals being considered by platinum group
Environment
• More awareness is needed
• Relevant skills needed to deal with environmental issues
• Geographic affects the social e.g. Working from home
Legal
• Petroleum act plays a major role
• Dealing with the attitude of people can minimize accidents in the sector
• Poor career counselling and career guidance
• DHET hosting career guidance sessions in order to draw more learners to in the mining sector e.g. Forensic Pathology
• Skills programme must be in place
• Standardization of new skills programme
• Occupationally directed skills
• Align material for skills programme. No mandate
38

Stakeholder input on scarce skills identification
Instrument mechanism
(No equity) – women and black males lacking
Not many providers for this qualification
Work environment does not allow safe working conditions
Barriers that need to be dealt with
Mill right – male – white – need equity as well as women
Need quick qualifications for pay (physical work)
Rigger
Training officers
Ageing – over 50
Succession planning – high cost
Life after mining
Must look at programme in discretionary grants
Lack of support for skills to help themselves
Award company to get awards for skills programme accomplishment
Want to have funding for skills programmes outside mandatory – for discretionary
Ventilation officer
Environmental - mining related
Geologist specializing in the environment
Innovation in technology
FLC
Mine management certificate
Mine overseers certificate
Leadership and management
Programme – (international and local)
Disabled – Admin – HR
Very physical environment
39

For access to wheelchairs etc.
Limpopo Stakeholder consultative meeting
Stakeholder input on PESTEL analysis
Political
• New government
• Union
• Nationalisation
• Compliance to Acts
• BBBEE
• Community Environment
• Alliances
• Service delivery
• Mining Charter
Economical
• Strike
• Recession
• Job creation / poverty alleviation
• Infrastructure development e.g. malls
• More foreign direct investments
• Interest rates
• Exchange rates
• Rand/dollar exchange
• Strikes
• Investors’ confidence
Social
• Strike
• Geographical Location
40

• Migration labour
• Unemployment
• Lack of skills
• HIV/AIDS
• Substance abuse
• Exposure
• Teenage pregnancies
• High divorce rates
• Improve literacy rate and skills development (ABET)
• LED
• Living conditions
Technology
• Mechanised Mining – Positive and Negative
• Retrenchment / Unemployment
• Improves working conditions
• Unemployment
• Safety improvement
• Communication
Environmental
• EMP
• More accidents due to busy roads
• Road damages
• Health - Air pollution, water pollution
• Green economy
• Global warming
• Legislation
41

Legal
• Labour Law
• BBBEE
• MPRDA
• SDA
• SDLA
• Land Restoration
• DMR
• EEA
• Mining charter
• Mine deaths and injuries
• OHASA
• OHSA/MHSA
• Mining rights
Stakeholder input on scarce skills identification
• Rock mechanic
• Goldsmith
• Mining engineer
• L&D Practitioners
• Diesel mechanics
• Salary dynamics (poor salaries)
• Scarce is relative vs. relative, absolute?
• Regional dynamics
• Failure to meet the minimum requirement
Northern Cape Stakeholder consultative meeting
Stakeholder input on PESTEL analysis
Political
• Influence of foreigners – money not spend in the country
42

• New cabinet ministry for SMME’s. Big pressure of big businesses to support SMME’s
• Emergence in AMCA in the Northern Cape
• Spend 6% of payroll on black. BBBEE codes might have higher targets
• Priorities for new minister
• Foreign ownership
• Revised codes
• Development of SMMEs
• Emergence of AMCU
• Social and Labour Plan
• Alignment to mining charter ending 2014
• BBBEE have adjusted training plan 6% on black employees
• Mining revised charter
• Change of Ministry
Economics
• Expansion in area
• Buying final product. Need to beneficiate
• Workers do not want outsourcing
• Wage gaps because of strikes – watching it
• Artisan salary not worth it in mining sector. Not considered as middle class
• Cost of living is high
• Artisans left country
• Lack of availability of skills
• Unattractiveness of the mining sector
• Need to make sector more attractiveness – need to attract youth
Social
• Rare to find children with mathematics and science in Khathu
• Kimberly has developed technology. Schools lack of infrastructure
43

• Dysfunctional facilitators
• Lack of mathematics and science teachers
• Language issue – Afrikaans is dominant, can contribute to skills leaving province
• Lack of infrastructure
• Dual households to support
V Distance of families
• Functional feasibility
• Language – Afrikaans as language
• Silicosis
• Occupational disease – mines have annual check up
• Maintaining expense levels
• Life after mining – unemployed put on training
• Prices of housing has sky rocketed
• Cost of living is sky high
• Cost of housing is exorbitant
Technology
• Diamond – changing all the time
• E learning
• New technology changing people
• Use latest technology available
• Training induction – e-induction programmes
• Replacement of people through mechanisation
• Processes are mechanised
• Use induction on e-learning platforms
• Use of simulators for learning
• Training of artisans from 4 years reduced to 18 months
• Use coaches and mentors in technology
• Simulators to cut
44

Environment
• Heritage. After effects of mining
• Quality of the water is bad
• Children affected by the poor quality of water
• Recycling and waste separation
Stakeholder input on Scarce skills identification
• No artisans on the list
• Surveyor must be removed
• Winch operator
• Rock engineer
• Geologist
• lubricator chemist/analytical
• Metallurgical engineer
• Mining underground training officer
• Learning material developers
• Quality control officers
• Mining environmental safety officers
• Mining certificates
Stakeholder Recommendations
• Need mathematics and science interventions at school level
• Need lecturers in N courses
• There is a problem with trade union classification
North West Stakeholder consultative meeting
Stakeholder input on PESTEL analysis
Political
• Effects on election. EFF aligned to AMCU in region
• Community initiated strike - (social)
• Capacity of state to deliver basic community necessities
45

• Safety attributed to strike (social)
• Fragmented implementations of HRD part of social and labour plan (legislative)
• ABET needs proper planning on company’s part (social). Need flexibility but costly.
• Grant structure rigid as it does not enable flexibility
• Proposal from companies on ABET
• Follow up to get clarity on qualification
Economic
• Value of metals – supply and demand, external endorsed
• Wage gap. Minimum entry level for workers should be regulated
• Lack of economic growth in region and diversity
• 90% mining activity in North West
• SMME development
Social
• Fanagalo - Cannot divorce Fanagalo from ABET
• English used for training material. How do we accommodate other languages e.g. in North West
• Will need to develop African languages, and this is a process.
Technology
• It is aligned to education systems. Training for R.D.O on hydraulic machines. Needs not to aligned qualification
• Technology is not changing to accommodate young generation
• Stimulating innovation
• What are possibilities of job creation vis-à-vis technology
• Must introduce technology into ABET training – e-learning
Environment
• Air and water in terms of mining rights
• Waste, fauna and flora etc.
• What to do with underground water, waste products (recycling of waste)
46

Legal
• Regulated by DMR - fatalities and accidents
• 4 out of 5 areas then mines operations stop
• DMR - do not know requirements foe competencies. Is it theory or skill
• Understanding of competency labour relations act to be reviewed
Stakeholder input on Scarce skills identification
• Winch operator: Enough of a supply in region
• Miners: Enough. Does not take long time to train
Stakeholder Recommendations
• ABET Need flexibility and lower costs.
• Grant structure rigid as it does not enable flexibility for ABET implementation
• Must accept proposals from companies on ABET
Mpumalanga Stakeholder consultative meeting
Stakeholder input on PESTEL analysis
Political
• Paradigm shift and power in between (ER and Labour)
• Lack of stability (Communism and Capitalism)
• Nationalisation
•Mines, Land, Banks
• BBBEE
•Progress very slow
•Fronting
•Procurement
• Mining - strategic industry – government regulation through laws and regulations
•Mining Charter
•SLP
47

Economical
• Price takers
• Beneficiation
• Price Schemes
• Privatisation and Nationalisation
• Corruption (EPWP)
• Lack of infrastructure (electricity)
• Sell to Eskom vs. export costs
• Investor’s confidence low
• Salaries and minimum wages
Social
• Subsidy
• Social divides between richer and poorer
• Cost of living
• Socio economic imbalances (Marikana)
• Unemployment
• High literacy levels
• Stakeholders engagements
• Transformation landscape - resistance
• Mining communities expectations and grievances
• Relocation of community
•Community upliftment
•Employment
•Skills development, not meeting minimum requirements for being employed or for further development
•Employees and community. Health and safety
Technological
• Digital divide
48

• Atomization
• Lack of mining research
• Mechanisation in coal better than in gold and platinum
• Training through simulators
Environmental
• More qualifications with lower income group
• Fauna and Flora (animals and plants)
• Wetlands
• Water pollution (general, AMD, air)
• Fines, Treatment
• Various permits and licenses
•Water use
•Air quality
•Dust
• Rehabilitation
• Consideration for nearby community
Legal
• Labour relations Act
• BCER
• Safety Act
• Employment Equity Act
• SDA
• Academic vs. GCC (Mine Health and Safety Act)
• Water Act
• CDIDA Act
• Audits
• Skills development Acts (stakeholder partitions)
• Pivotal grants (for unemployed)
49

• Various laws to comply with
•MPRDA
•IWULA
•NEMA
•BBBEE
•Mining charter etc.
Stakeholder input on Scarce skills identification
The current skills list of scarce skills was validated.
Free State Stakeholder consultative meeting
Stakeholder input on PESTEL analysis
Political
• Inequality
• Perception
• Operational standards
• Acts - more interaction with relevant stakeholders
• Nationalisation
• Fragmentation
• Employment equity - adherence to target
• Political stability
• Labour unrest (strikes)
• Clarification - future of industry
• Create an attractive investment environment (setting the scene)
• Power struggle - unions
• Integration of structures
Economic
• Local procurement
• Local manufacturing
• Local SMME development
50

• Nationalisation
• Existing investors
• Potential invention
• Community development
• Job losses and opportunities
• Availability of resources
• To stabilize currency (rand)
• Attract foreign investment
• Taxation
• Down scaling
• Production cost
• Loss of skill (voluntary)
• Pension ages
• Tax incentives (old / new mines)
Social
• Interaction - transparency (society) - All different levels (company, government as well as community)
• Upliftment: skills development
• Affirmative action
• Local community employment
• Local community upliftment
• Labour sending areas
• Languages
• Experience
• Employee turnover
Technological
• Investing in local invention
• Steam engines (CEPs)
51

Environmental
• Look after our environment
• Minimize environment damages
• Maximize green environment
• Air pollution - mine radiation
Legal
• Good practices
• Implementation and monitoring sector regulations
Stakeholder input on Scarce skills identification
• Geo-technical
• Instrument technician
• Rigger and Ropesman
• Winder Electricians
• Electrical Engineers
• Draughts person
Eastern Cape Stakeholder consultative meeting
Stakeholder input on PESTEL analysis
Political
• Mineral rights ownership - Social and Labour Plan
• Lack of skills courses on requirements of Social and Labour Plan
• DMR communication on Social and Labour Plan
• Jewellery industry is hurting - Although they are run well
• More intensive assistance - small manufacture
Economic
• China cement coming into the Eastern Cape, invading the market, coming cheaply, no government protection for the local companies and also had to retrench redundant staff thereof
• Government should put effort as they receive taxes from mines
• Social and Labour Plan and BBBEE should talk to each other
52

• Where is money spent by company going to socio-eco development
• Shareholders do not develop, take money out, do not up-skill workers
• Government should take responsibility, they should monitor progress
• BBBEE states that employees should get shares
• Huge gap between employees and executives
Social
• ABET management does not see importance
• Lack of training ABET providers in remote areas. Grant does not factor travel costs or training provided to go to remote areas if willing.
• Numbers are minimal in Eastern Cape so flexibility is needed
• Also costs to training providers here is a problem
• Transfer of skills to younger generation. Someone should mentor before retirement
Technology
• MQA should sponsor software:
Skills programmes for jewellery
1) Design
2) Casting
3) Rapid reproduction accredited
• Online courses to be provided by MQA
• Social and e-media are making things easier
Environmental
• Dispose oil. Need to make sure companies comply
• Rehabilitation - skills programmes. Replacement of vegetation. For example by seeding and growing nurseries.
• Water purification for reuse
Legal
• Mining Charter codes of good practice
53

• Sector regulation and policies
• Mine accidents and fatalities
Stakeholder input on Scarce skills identification
• Electrical Foreman. Need heavy current. Close to 2 years to find in Eastern Cape. Was on EE candidate
• Diesel Mechanic
• Boilermaker
• Millwright
• Production/0peration supervisor
• Mining supervisor
• Multiskilling
• Computer aided designer – skills gap for plumber and electrician
• Blaster
• Kiln Burner
• Communication Coordinator
Stakeholder Recommendations
• Rehabilitation - skills programmes. Replacement of vegetation. For example by seeding and growing nurseries.
• Grant for ABET must factor travel costs or training providers to go to remote areas if willing.
• Conclusion reflects that ABET should be prioritised. Also transformation in the upper levels requires intervention. It is important that capacity development is focused on.
• The definition of women in the mines needs to be clearly defined. Do women working in the office of a mine also qualify under the definition or is it women working underground in the production side, doing the actual mining? The mines are claiming that they have reached a 10% target for women, this needs to be examined.
• Women sitting in the offices may be in managerial positions or have better education and may be supervisors. These women do not go underground and are therefore not exposed to the training or barriers that the women that go underground have to pass. It becomes irrelevant therefore for them to do the physical tests.
• The issue of graduates having to complete GCC’s after they complete their degrees is problematic because the graduates become discouraged. Many of the Black graduates leave the mines after a
54

period of 6 months because the working conditions of their colleagues in the cities are better, they receive a higher salaries and are not subjected to further tests when they start working
• A system where the GCC tests are included into the university degrees should be looked into. The engineering graduates in the mining sector have to train for 2 years before they can be appointed as engineers, but in other sectors the graduates get taken as engineers immediately. The mining engineers that receive offers from the other sectors take up the offers and they leave.
• About 70% of the mining sector has a matric qualification and below and this is where ABET comes into play. A number of people do not get pass a matric qualification because of affordability. There needs to be research to show the numbers passing this barrier.
• Where there are no jobs for the specific skills, the employees decide to then look at other positions in the sector and move away from what they have studied. A number of educated people do underground work due to the scarcity of jobs.
Another factor that needs to be emphasised is that African women are sent to work underground while their counter-part White women are allocated office work. This obviously puts the African women at a huge disadvantage. Most of the mine stringent rules directly affect underground labourers. This matter needs to be addressed at Women Mining Conferences.
2.9 CoNCLUSIoN
The critical issues identified in the MQA sector analysis that requires special attention by the MQA and its tripartite members are the following:
· Realignment of the objectives of the MQA and its tripartite members, as depicted in the Mine Health and Safety Act, which necessitate closer cooperation and support of each other in the tripartite system.
· Introduce effective mining programmes that are available for human resources and skills development relevant to the following groups:
- MMS workers
- The youth
- Females
- People with disabilities
- People living with HIV/AIDS
· Promote effective and coordinated intervention to enhance occupational health and safety in the mining sector.
55

· Direct action to contribute to the beneficiation strategy of the government with special focus on creating appropriate skills development programmes and jobs.
· Create avenues and opportunities to assist retrenched employees in view of maintaining a valuable skills source (or pool) and filling vacancies elsewhere in the mining sector. Huge financial savings to all stakeholders can be realised if this approach is implemented.
In conclusion, the transformation of the MMS, both in terms of ownership and increased representation of HDSAs in management and professional positions, is driven by a growing body of general and sector-specific legislation.
These different aspects of the transformation effort will influence the skills development agenda of the MQA. In order for the MQA to overcome identified systemic challenges in the enhancement of effective skills development in the mining sector, a candid reassessment of its strategic objectives and the functional development of internal value-adding activities will be required. The potential of the MQA’s contribution to the effective utilisation of employees, in line with world best practices, is unlimited. Close cooperation and alignment will be of utmost importance.
56

3 eCoNoMIC PerforMANCe of THe SeCTor
3.1 INTrodUCTIoN
This chapter provides an overview of the economic performance of the sector and the factors that impact on it. The first section considers mining, minerals and sustainable development. It highlights the fact that, increasingly, mining operations have to meet the overall objectives set in the National Development Plan (NDP) for South Africa and the demands of a diverse range of stakeholders if they are to be granted not only a legal, but also a social licence to operate. While the importance of the Mining and Minerals Sector (MMS) to national and global economic development is unquestioned, the huge cost of production on the environment and on communities is becoming more widely appreciated, and it is becoming increasingly clear that the trade-offs between economic growth and sustainable development need to be carefully considered.
In the second section, the factors that influence the economic performance of the MMS are outlined. These interrelated factors include the various sources of demand for MMS products, economic cycles, commodity markets and commodity prices, access to and the cost of credit, the exchange rate, international trade and local access to raw materials, electricity supply, government expenditure and infrastructure development, technological advancements, the issuing of mining licences, the availability of skills, environmental conservation and rehabilitation, and the physical availability of mineral resources.
The following sections consider the economic growth of the sector and its contribution to GDP. Unfortunately, the national accounts data, which is mostly used in this chapter, only covers mining and not the total MMS. No separate information is available on the performance of the beneficiation components of the MMS (the diamond processing and jewellery manufacturing subsectors) and the services incidental to mining subsector. This economic overview thus focuses on economic growth trends and the contribution of the mining sector to, inter alia, the gross domestic product (GDP) of the country.
The final section looks at the current and planned initiatives to enhance the transformation and economic performance of the sector. A range of recent policy documents are considered in relation to their commitment to and actual impact on beneficiation, or value-added, activities.
3.2 MINING, MINerALS ANd SUSTAINABLe deVeLoPMeNT
The MMS is of vital importance to national and global economic growth and development. The millions of products constructed or manufactured, using the more than 90 substances mined around the world, are central to almost all aspects of modern living. Despite this, the supply of metals and minerals does not come without heavy social and environmental costs51 The issue of sustainable development has received an increasing amount of attention over the last decade. In 2008, the South African government published the National Sustainable Development Framework (NSDF) for South Africa, which culminated in the adoption in 2011 by Cabinet of the first National Strategy for Sustainable Development and Action Plan for the period 2011 to 2014, also referred to as NSSD I. According to these documents, sustainable development is about enhancing human wellbeing and quality of life for all time, in particular those most affected by poverty and inequality. The efficient use of resources and intergenerational equity are the core principles of sustainable development. The purpose of the NSDF is to enunciate South Africa’s national vision for sustainable development and indicate strategic interventions to re-orientate South Africa’s development path in a more
51 World Business Council for Sustainable Development. 2010. Mining, Minerals and Sustainable Development, Executive Brief, March 2010.
57

sustainable direction. It proposes a national vision, principles and areas for strategic intervention that will enable and guide the development of the national strategy and action plan. The framework identifies the following five priority areas or pathways towards sustainable development:
· Enhancing systems for integrated planning and implementation· Sustaining our ecosystems and using natural resources efficiently· Economic development via investing in sustainable infrastructure· Creating sustainable human settlements· Responding appropriately to emerging human development, economic and environmental
challenges52
One most challenging aspect of embedding sustainable development in the MMS is the difficulty of tying the concept to financial success, particularly when companies operate in areas characterised by poor governance capacity and corruption. Another challenge is the question of scale. Sustainable development interventions, whether social or environmental, are most effective when conceived and implemented on a regional scale to a regional plan. Site-level interventions, which are required in law, work against obtaining appropriate levels of scale and increase the risk of duplication. Sustainable development practices – engaging with and considering the needs of all the various stakeholders – will, however, become increasingly critical to the economic success of the MMS. Less and less will the bottom line be purely a function of national and global demand for metal and mineral products53
The NDP was approved by Cabinet in late 2012 and adopted by the ruling African National Congress (ANC) at its elective conference in Mangaung in December 2012 as a launchpad and blueprint for a future economic and socioeconomic development strategy for the country. It incorporates both the Industrial Policy Action Plan (IPAP) of the Department of Trade and Industry’s (the dti) and the New Growth Path (NGP) of the Ministry of Economic Development into the new National Planning Framework. The NDP also elaborates extensively on the identified objectives and actions, including the following issues:54
· Economy and employment· Environmental sustainability· Improving education, training and innovation· Promoting health· Building a capable and developmental state· Fighting corruption
3.3 fACTorS THAT INfLUeNCe THe eCoNoMIC PerforMANCe of THe SeCTor
The economic performance of the MMS is the result of the interaction between a number of factors. These include the sources of demand for MMS products - both locally and internationally; commodity markets and commodity prices; economic cycles; exchange rate movements: international trade barriers and agreements; local access to raw materials; electricity supply; production cost factors, notably labour costs and capital expenditure costs; government expenditure and infrastructure development; the demand for energy; technological advancements; the issuing of mining licences; the availability of skills; companies’ responsibilities regarding environmental conservation and rehabilitation; and last but not least, the physical availability of mineral resources. While these are discussed separately in the sections below, it is important to remember that, in reality, these issues are all interrelated.52 Department of Environmental Affairs and Tourism. 2008. People, planet and prosperity – A framework for sustainable development in South Africa, Pretoria.
53 World Business Council for Sustainable Development. 2002. Breaking New Ground - Final report of the Mining, Minerals and Sustainable Development Project.
54 National Planning Commission Our future: Make it work - National Development Plan 2030 - Executive Summary. http://www.info.gov.za/issues/national-development-plan/index.
html, accessed 8 August 2013.
58

According to a Deloitte report, mining companies are facing a series of economic, financial and operational challenges. South African mining companies must also account for uniquely local issues with profound operational implications. Some of the pressing issues are shown in the figure below.
Figure 3.1 Global and local influences on mining companies with South African operations
Source: Deloitte, 2013 Tough choices facing the mining industry pg 2
3.3.1 Sources of demand for MMS products
The outputs of the global MMS are utilised as intermediate inputs by a range of other sectors:
In South Africa, the major share (some 52%) of the output of the coal sector is used as input by the electricity, gas and steam sector, and amounted in value terms to R31 billion in 2013. South Africa’s economy is heavily dependent on coal, as it accounts for more than 70% of the country’s total primary energy consumption. The electricity sector accounts for more than half of the coal consumed in South Africa, followed by Sasol’s petrochemical industries, metallurgical industries, and domestic heating and cooking, according to an Eskom January 2013 factsheet. Other big users of coal are the manufacturing subsectors, notably petroleum, chemicals, rubber and plastic (12.8%), and basic iron and steel manufacturing (18.8%). The mining and quarrying sector is a small user of coal products, accounting for only 3,2% of demand (R1.9 billion) in 201355
· The bulk of global demand for Platinum Group Metals (PGM) is from the vehicle and engine manufacturing industry. These metals are used in the production of catalytic convertors, which reduce the toxicity of emissions from internal combustion engines. In addition, platinum is in demand from the jewellery sector, as well as the industrial sector, including glass, electronics and petroleum refining56 The demand for diamonds comes from two main sectors: the jewellery manufacturing sector and the industrial sector. Only roughly 20% of global production of diamonds is of gemstone
55 Quantec Research, Industry Structure Database.
56 Mwape P, Roberts MJ, Mokwena E, Musi L, Tjatjie T, Mnguni M, Mashaba P, Kwata PG. South Africa’s Mineral Industry 2007/2008: Part One: South Africa’s Mineral Industry – General
Review. Department of Minerals and Energy.
59

quality, the remainder is destined for the industrial market in the form of cutting and grinding tools. To date, demand for diamonds as an investment vehicle has been small, but this could change in the future.
· Copper is used predominantly by the building sector. The electrical engineering sectors are also significant sources of demand, while the light engineering and transport sectors make a notable, but minor contribution.
· Infrastructure development is the primary driver in iron ore demand, while demand for manganese is dependent on steel production, which accounts for over 90% of its consumption57
· Demand for industrial minerals, in particular aggregate, sand, limestone, dimension stone, brick clay and gypsum, is to a large extent dependent on activity levels in the building and construction sector. Phosphate rock, limestone, magnesite, gypsum, vermiculite and sulphur are used in the manufacture of fertilizer and animal feed, with demand driven by the agriculture sector. Various other industrial minerals are also used in the manufacture of pulp and paper, abrasives, plastics and polymers, ceramics and glass58
The South African MMS is fully integrated into and thus dependent on an international system of demand for and supply of these commodities.
3.3.2 Economic cycles, commodity markets and commodity prices
The demand for metal and mineral products is highly sensitive to fluctuations in local and international economic and market conditions. A major challenge for the sector is matching supply to demand in order to sustain commodity prices and therefore profitability. When demand outstrips supply, prices rise, which in turn raises the input costs for downstream beneficiators and ultimately the cost of manufactured products. This has a generally negative impact on global economic growth. Conversely, where supply outstrips demand, prices can fall quickly, resulting in the uneconomical and unsustainable production of raw materials from the MMS. The challenge is that while demand can rise or drop quite quickly, supply volumes are much more sticky as they are related to factors such as exploration and new mine development in the case of increasing supply, and laying off labour or even shutting down operations in the case of receding supply.
With the exception of the outputs of the cement, lime, aggregates and sand (CLAS) subsector, which are mainly sold into the domestic market, the local markets for mining and mineral products are relatively small and for this reason most of South Africa’s mining product is exported. The profitability of operations is thus directly affected by world commodity prices and the demand for commodities.
The global economic recession of 2008 and 2009 had a profound effect on commodity markets and prices. Prior to the crisis, the world experienced a commodities boom, which imploded unexpectedly in 2008 as the positive factors that, had driven the boom changed for the worse. By 2010, the prices of most minerals had returned to pre-recession levels, while 2011 saw a vast improvement in mineral sales and commodity prices, with the price index of industrial raw materials (IRM)59 rising by 21.7% in dollar terms. However, renewed economic weakness – especially in Europe – again led to a 20.3% decline IRM prices in 2012 followed by a 5.9% drop in 2013. IRM prices are expected to decline by a further 3% in 2014 before recovering somewhat in 2015.
57 Ibid.
58 Ibid.
59 The Economist Intelligence Unitconstructs an IRM price index consisting of nine hard commodities. The metals sector has a weighting of 65.1% in the IRM index, fibres 27.4% and
rubber 7.5%.
60

3.3.2.1 Gold
Despite buoyant demand for jewellery, bars and coins, overall demand for gold fell in 2013, reaching its lowest level in ten years, largely as a result of an exodus of investment from exchange-traded funds (ETFs) in gold. Gold lost its lure for ETF investors in developed countries amid subdued inflation, signs of economic recovery, booming equity markets and expectations of monetary tightening. This was only partially offset by a resurgence in jewellery and bar and coins demand in emerging markets, driven by rising income levels and lower prices. As such, the gold market was also characterised by a shift in demand from West to East. The main macroeconomic factors behind the stampede out of gold ETFs are likely to remain in place in 2014-15. However, ETF gold holdings, which by end-2013 had fallen back to their end-2009 level, are likely to prove “stickier” and we expect much lower outflows from ETFs in 2014-15. This, together with robust jewellery consumption, supported by lower prices, will result in a return to positive growth in gold consumption in 2014-15. Consumption growth will be strongest in 2014, at 13%, following a particularly weak 2013, as gold recovers some of its safe-haven allure amid concerns about economic weakness in emerging markets and risks of geopolitical tensions.
Figure 3.2 Global sources of demand for gold
figure 3.3 Global sources of supply of gold
-1000
0
1000
2000
3000
4000
5000
2011 2012 2013
Tonn
es
Industrial & dental Jewellery Net retail investment ETFs
Source. Economist intelligence Unit, World commodity forecasts 2014
Source. Economist intelligence Unit, World commodity forecasts 2014
61

The Economist Intelligence Unit expects global gold consumption to recover in 2014 after demand for the precious metal fell by over 12% in 2013. Economic conditions will not be supportive of large-scale investment into gold in 2014, as we have muted inflation expectations for OECD economies and expect the US in particular to perform well, which should support other asset classes. In 2015 consumption growth is forecast to ease to 5%.
After ten years of consecutive decline, South Africa’s gold production volume rebounded slightly in 2013, rising by 3.6% year on year. This was due to the sector’s robust performance in the three months ending December, with output 37% higher than in the final quarter of 2012, when activity had been disrupted by widespread strikes. However, gold exports in value terms still declined by 10.5% in 2013.
The 2014-15 outlook for South Africa’s gold sector remains grim. Producers will be hit by low international prices, although this will be partly countervailed by the South African rand’s depreciation. In addition, production will be depressed by structural factors, including the country’s ageing mines and deteriorating ore quality. Gold mining faces the same problems as South Africa’s entire mining sector, namely incessant labour disputes, rising energy and labour costs and uncertainty over not only the supply of labour and energy but also the legislative environment. Against this backdrop, we expect that South Africa’s output will fall by 2.3% a year on average in 2014-15.
3.3.2.2 Coal
In 2013, global demand for coal grew by 2.4% to 7.745 million tons, while production of liquefied natural gas rose by only 0.3%. China accounted for roughly 48% of global coal consumption. The country’s coal consumption in 2013 grew by 2.6%, according to the China National Coal Association. Electricity output rose by 7.3% year on year in 2013, as industrial activity picked up in the second half of the year. Coal imports also rose strongly, ending the year up 11.6%, but changes to import policy will fuel growth in Chinese imports in 2014-15 if fully implemented. China’s National Energy Administration (NEA) published its 2014 guidelines in late January, indicating that the government would prioritise imports of low-sulphur and ash-containing coal in an attempt to clean up China’s energy balance. In addition, local producers are reported to be offering price discounts for utilities to make use of Chinese coal, rather than imported grades, particularly from Indonesia. Despite the anticipation that global energy intensity is expected to be 31% lower than in 2011, energy used for power generation is expected to grow by 49% (2.1% p.a.) between 2011 and 2030. The fastest growing fuels will be renewables (including bio-fuels) with growth anticipated at 7.6% p.a. during 2011 to 2030. Nuclear (2.6% p.a.) and hydro (2.0% p.a.) are both expected to grow faster than total energy consumption. Among fossil fuels, gas will most likely grow the fastest (2.0% p.a.), followed by coal (1.2% p.a.) and oil (0.8% p.a.)60
The Economist Intelligence Unit expects growth in global coal consumption to grow at a steady rate, averaging 3.1% per year in 2014-15. China will continue to account for the majority of global consumption growth despite attempts to clean up its energy balance. However, coal usage in the US, India, South Korea and Japan will increase in 2014 owing to the fuel’s relative affordability compared with gas- or oil-fired power. Consumption growth is expected to slow slightly in 2015, as environmental considerations in the US and EU will limit demand for coal. While the Chinese government may make some headway in its environmental commitments, the sheer level of coal-fired capacity in China and the country’s economic-growth targets will mean that overall global coal demand will continue to rise61
60 BP Energy Outlook 2030. January 2013. http://www.bp.com/content/dam/bp/pdf/statistical-review/BP_World_Energy_Outlook_booklet_2013.pdf, accessed 7 August 2013.
61 The Economist Intelligence UnitLimited, May 2014. World commodity forecasts: industrial raw materials.
62

South African coal production contracted by 1.3% in volume in 2013. As a result, total local sales declined by 1.3% while exports volumes were down by 1.9%. The unit value per ton showed a 14.2% increase which caused the total value of coal sales to increase by 5.4% year on year63
3.3.2.3 Copper
Total world copper consumption in 2013 is estimated at 21m tonnes, implying an annual growth of 4.8% on the previous year. China led global growth last year, with an increase in copper apparent consumption that is estimated at 11.2%. This was on the back of high levels of imports, but much of the cathode brought into China from abroad last year went into unreported stockpiles, to be used as collateral for financing deals, not for physical consumption. This activity has already started to slow in 2014, so apparent consumption is likely to slow in turn this year, especially if these stocks start to be run down.
Regional tightness is expected to ease during 2014. Therefore expectations of high demand growth in 2014 may prove to be unrealistic, even though global economic growth should be stronger than that seen in 2013. Overall, the EIU forecast average global growth in copper consumption in 2014 of 4.1%, picking up to 4.4% in 201564
South Africa’s 82 768 ton of copper produced in 2013 accounted for only 0.4% of total world production. South African total local copper sales increased in value terms by 14.4% in 2013, while exports sales rose by 11.5% in value terms.
3.3.2.4 Platinum group metals
According to the latest Thomson Reuters GFMS Platinum & Palladium Survey65 , the platinum market last year recorded a surplus (prior to inventory movements) of 0.49 million oz. However, the market is expected to revert to a deficit in 2014, driven by the disruption in the South African platinum mining sector, which typically accounts for more than 70% of world mined platinum supply. Although production remained substantially below pre-2012 levels last year, Thomson Reuters believes that producers in aggregate ended 2013 with a position of finished metal inventory above ‘normal’ operational levels and have been able to begin to release this to customers during April to meet delivery needs. Market shortfalls seem likely in the case of both metals for several months after any resolution. The price impact relative to the severity of market events has been benign in early 2014, particularly in the case of platinum, but Thomson Reuters expects to see further price upside as metal supplies remain constrained into the second half.
62 Figures from the Department of Mineral Resources.
63 The Economist Intelligence UnitLimited, May 2014. World commodity forecasts: Industrial raw materials.
64 Thomson Reuters, GFMS Platinum & Palladium Survey 2014. Website: https://thomsonreutereikon.com/markets/metal-trading/
65 Figures from the Department of Mineral Resources.
63

Figure 3.5 Global sources of supply of platinum
Figure 3.4 Global sources of demand for platinum
0
Source: Thomson Reuters, GFMS Platinum & Palladium Survey 2014
Source: Thomson Reuters, GFMS Platinum & Palladium Survey 2014
The production of secondary material continued to increase. In 2013, supply from platinum auto catalyst scrap rose by 9% to 0.99 million oz, reflecting healthy increases across all regions, following a year of notable declines in 2012, and thus reinstating the post-recession recovery path. In Europe the increase was particularly pronounced thanks to greater numbers of heavily platinum-loaded diesel particulate filters being returned for recycling.
Supply of platinum jewellery scrap eased by 5% in 2013 to an estimated 0.41 million oz (12.6 t), with a 9% drop in recycling from Japan accounting for the bulk of the fall. This contraction, despite a rise in the average yen platinum price, suggested that consumers held on to assets in expectation of yet higher prices. Elsewhere, jewellery scrap from China rose only at a margin, while North America recorded a double-digit increase in scrap.
64

Demand was mixed in 2013. In the platinum market, auto catalyst demand fell by 1.2% to 2.91 million oz (90.6 t) last year. Demand increases from China and to a lesser extent North America proved insufficient to offset the continued negative trend in Europe – the largest market for platinum auto catalyst demand. In all regions, substitution continued with palladium usage making further inroads in the traditional platinum-based light and heavy duty diesel segments.
Palladium auto catalyst demand rose by 3.3% to 6.27 million oz (195.1 t) last year. This was driven particularly by the gasoline-dominant vehicle markets of North America and China with gains of 5% and 14% respectively. Following an exceptional increase in 2012, demand from Japan fell slightly, whereas the weakness in European auto sector overall meant that palladium demand for auto catalyst in this region did ease, but only very fractionally, by 1% against a platinum contraction of 7% in the European auto catayalist sector.
Total production of PGM increased by 3.9% in 2013 to 264 188 kg, which translated into a value increase of 21.7% in rand terms. Just more than 90% of South African PGM production was exported in 201365
3.3.2.5 Diamonds
The global market came under pressure in 2013 as a weakening rupee and tight credit conditions suppressed demand from the world’s biggest diamond polishing marker, India. However, China’s middle classes are demanding soaring numbers of the precious stones, and jewellery makers are increasingly desperate to gain access to a rough diamond source.
Consequently polished diamond prices increased in all categories in 2014 as trade volumes reached their highest level since early 2011. There was a healthy outlook for rough diamond prices this year, with analysts forecasting an overall rise of between 5% and 10%. The average price of rough diamonds exported from Antwerp in February 2014 was up 18% from December 2013, but still 12% lower year on year, according to Reuter’s calculations.
Traditionally the largest retail diamond market, the US jewellery market is set to grow by 4% to 8% annually for 5 years from 2013 with stronger growth in 2013-2014, according to estimates from the diamond industry research team at consultancy Equity Communications.
From a peak of 15.8 million carats produced in 2004, South African diamond production has showed a sharp decline, reaching only 6.1 million carats in 2009. Since then production has edged up again and reached 8.1 million carats in 2013, a rise of 12.4% on the previous year66 Kimberlite diamonds67 accounted for 96.7% of this total – up from around 90% in 2003 and 85% in the 1980s. Alluvial diamonds constituted 2.9% of total production in 2013, while marine production made up only 0.4% of the total.68
3.3.3 The exchange rate
The volatility displayed by the rand in the last decade has had a profound impact on export industries, iincluding the mining industry. The weakening of the rand obviously benefits the mining industry, while the relatively strong rand has an adverse effect.69 The exchange rate also affects the cost of production in dollar terms, with rapid fluctuations in the exchange rate making profitable production planning very difficult.
67 Figures from the Department of Mineral Resources.
68 Alluvial diamonds is the term used to describe diamonds that have been removed from the primary source (kimberlite) by natural erosive action over millions of years, and eventually
deposited in a new environment, such as a river bed, an ocean floor or a shoreline. In contrast, kimberlite diamonds are mined from rock formations below the earth’s surface.
65

For the diamond processing and jewellery manufacturing subsectors, the volatility of the local currency is particularly problematic, as raw material is bought at international (dollar-denominated) prices and sold at a later stage. Thus, the risk of holding material and stock is high for these businesses, which are generally small in size70
Most of the global competitors address these fluctuations in part by creating competitive metals financing products, or so-called “gold loans” for the industry. However, gold loan companies’ credit growth in India – the biggest market for gold loans – is set to halve his year, despite the Reserve Bank of India increasing the cap on loan-to-value ratios from 60% to 75%.
3.3.4 Government expenditure and infrastructure development
The impact of government’s infrastructure development programmes on the MMS is twofold. On the one hand, the mining component of the MMS is dependent on infrastructure (specifically the transport infrastructure) for the distribution of its products. The industry therefore stands to benefit from the upgrading of the power supply, roads and rail networks.
On the other hand, the CLAS subsector, as a supplier, is a major contributor to the upgrading of the roads network, and tends to grow or contract as a result of public investment in infrastructure. This subsector saw substantial growth in the run-up to the 2010 Soccer World Cup as a result of the upgrading of the roads and rail networks and the building of stadiums.
Public sector real fixed capital formation saw some significant investment growth in the two years prior to the 2010 Soccer World Cup with growth of 22.7% and 8.4% in 2008 and 2009 respectively. Public sector real fixed capital formation receded by 4.6% in 2010, but has averaged 4.1% p.a. over the past three years (2011-2013). During the forecast period 2014-2018, public sector spending is bound to increase by around 5% p.a.
3.3.5 The demand for energy
In addition to the demand for electricity generated from the industrial sector in periods of economic growth, factors such as urbanisation trends, the building of Reconstruction and Development Plan (RDP) housing72, and the formalisation of services to informal housing areas increase the demand for electricity from the national grid. Through the commissioning of the new coal-fired power stations, South Africa has committed itself to coal-based electricity generation for at least the next few decades. The head of Eskom operations stated in late 2009 that in response to the increased demand for coal for electricity, South Africa needs at least 40 new mines to prevent electricity shortages over the long term73
3.3.6 Technological advancements
Technological advancements that allow access to previously inaccessible metal or mineral deposits, which increase extraction levels from existing operations, or make extraction safer, easier or more cost effective,
69 Figures from the Department of Mineral Resources.
70 Chamber of Mines.Annual Report 2007/2008.
71 Human Sciences Research Council (HSRC) and Povey, Mulvenna and Associates.A skills analysis of the jewellery manufacturing and gemstone processing industries in South Africa.
MQA and GTZ. Johannesburg, May 2003.
72 Low-cost housing built by government according to the Reconstruction and Development Plan (RDP).
73 South Africa.info, South African needs 40 new coal mines, 12 August 2009, http://www.southafrica.info/news/business/832012.htm, accessed 14 November 2010.
66

have a direct impact on the competitive supply of MMS products onto the market. Many of South Africa’s metal deposits occur at great depth and will require ongoing advances in technology in order to be safely mined74
Investments in new technologies evidently depend on the capital outlays that companies are able and willing to commit. But to remain competitive in the global context, such investments are increasingly being seen as unavoidable. Growing investment in new and improved technologies also require that workers’ skills be upgraded to enable them to utilise new and improved technologies. In this process, productivity enhancements will most likely be experienced.
3.3.7. The availability of skills
The MMS is dependent on the availability of certain specific professional and technical skills in order to grow. Mine health and safety legislation and regulations set very strict competency requirements for certain positions and without people with the necessary competencies, mining operations cannot expand. The MMS has experienced severe shortages over the last number of years. These shortages are exacerbated by the lack of HDSAs with the requisite skills amid the drive for transformation referred to in Chapter 2 of this SSP. These shortages have constrained the growth of the sector.
3.3.8 Environmental conservation and rehabilitation
Environmental conservation and the rehabilitation of areas where mining or exploration has taken place are regulated through various acts and government policies. As indicated in the previous chapter, the MPRDA places the responsibility for rehabilitation on the holder of a prospecting permit or mining authorisation. In addition, the DMR has specific policies regarding financial provisions for rehabilitation upon the closure of a mining operation. At the same time, the Mining Charter places strong emphasis on sustainable development and environmental conservation and rehabilitation. Environmental management is weighted at 12% on the Mining Charter Scorecard. While critical for environmental preservation, the health and safety of the general population and the sustainable exploitation of our national resources, a change from the past practice of externalising the cost of conservation and rehabilitation efforts onto society towards internalising this cost as part of the production process needs to be factored into profitable production planning. Furthermore, this needs to be done from the outset and factored into the initial feasibility studies. In some instances, the balance between environmental considerations, growth of the sector and job creation or maintenance may be challenging to achieve. However, consideration of competing demands through the framework of integrated and sustainable development provides possibilities for achieving outcomes that go a long way towards meeting diverse stakeholder expectations75
3.3.9 The availability of mineral resources
Finally, a major factor in the future of the MMS is the availability of local mineral resources. It is well known that South Africa is richly endowed with mineral resources (South Africa’s high world rankings in terms of both production and reserves of the various MMS products are outlined in Chapter 2). However, as mineral reserves are non-renewable, their depletion may lead to the contraction of the industry. This is specifically
74 Pickering RGB.1996, Deep-level mining and role of R&D. The Journal of the South African Institute of Mining and Metallurgy, September/October 1996, http://www.saimm.co.za/
Journal/v096n05p173.pdf, accessed 14 November 2010.
75 World Business Council for Sustainable Development. 2002. Breaking New Ground - Final report of the Mining, Minerals and Sustainable Development Project.
67

true of the gold mining industry. Annual gold production decreased by approximately 73% over the period 1994 to 201376 and is bound to continue on a downward path as most of the remaining gold reserves occur at depths underground that prohibit their economic mining. The economic mining of a commodity is obviously also linked to other factors discussed above, such as available technology, the supply of electricity, the commodity price and the exchange rate77
While past global scares of mineral depletion resulted in increased exploration activities and in the discovery of new deposits, the reality remains that metals and minerals remain non-renewable resources and that mining activities will depend on their finite availability.
3.4. CoMPoSITIoN of ANd CHANGeS IN GroSS VALUe Added
3.4.1 Economic growth
With the exception of a few years, growth in the mining sector (as measured by its real gross value added - GVA) has underperformed the total economy since at least the early 1970s. More recently, during 2006 to 2009, the mining sector contracted by, on average, 2.9% per year, while the overall economy grew by 3.4% p.a. In 2010, the mining sector outperformed the overall economy by expanding by 5.7%, but this was again followed by two years of disappointing growth: 0.3% in 2011 and -3.6% in 2012. In 2013, mining sector growth amounted to 3.1% which was higher than the 1.9% recorded for the economy as a whole. Sporadic industrial action and the prolonged strike at certain platinum mines, together with a lacklustre economic performance may cause real mining GVA to average only 0.5% in 2014. Over the period 2015-2020, real GVA growth in the sector is expected to average around 2% p.a. which will be lower than the 3% growth projected for the economy as whole.
In 2013, the South African mining sector’s performance was hampered by the continued recession in Europe, weak commodity prices (with non-oil commodity prices declining by 6.8% in dollar terms) and industrial action, which caused significant production losses. Production in 2014 will be boosted by a weaker rand, although the threats of further industrial action causing work stoppages and more mine and shaft closures are clouding the outlook.
76 Centre for Sustainability in the Mining Industry (CSMI). The socioeconomic aspects of mine closure and sustainable development: Literature overview and lessons for the
socioeconomic aspects of closure, Report 1 of 1, Coaltech Project 7.8.5, January 2010.
77 Department of Mineral Resources data.
78 Source: Chamber of Mines, Chamber’s Memorandum to the National Treasury on the Draft Mineral and Petroleum Royalty Bill, www.bullion.org.za.
68

Figure 3.7 Changes in real GVA at basic prices for the mining sector (five-year average growth rates)
Figure 3.7 shows the growth in gross value added trends over five-year periods in gold mining, coal mining, and other mining (which includes PGM and diamond mining), while Figure 3.6 depicts the value added in constant prices over the period 1970 to 2012, with a forecast up to 2020.
It is clear that the most severe decline was experienced in gold mining. Although the gross value add of the combined grouping of PGM mining, diamond mining and other mining increased up to 2007, it was not sufficient to compensate for the decline in output from the gold mining industry. The steep decline in gross value added seen in 2008 and 2009 was the result of the global economic slow-down and recession in many countries which caused a decline in the demand for commodities78 Some growth in the industry returned in 2010 as a result of a steep increase in the demand for commodities and in the prices of commodities.
Figure 3.6 Changes in real GVA at basic prices for the total economy and mining sector
78 Chamber of Mines. Annual Report, 2008/2009.
.
Source: Quantec Research/Ecoquant
Source: Statisitic South Africa and Quantec Research
69
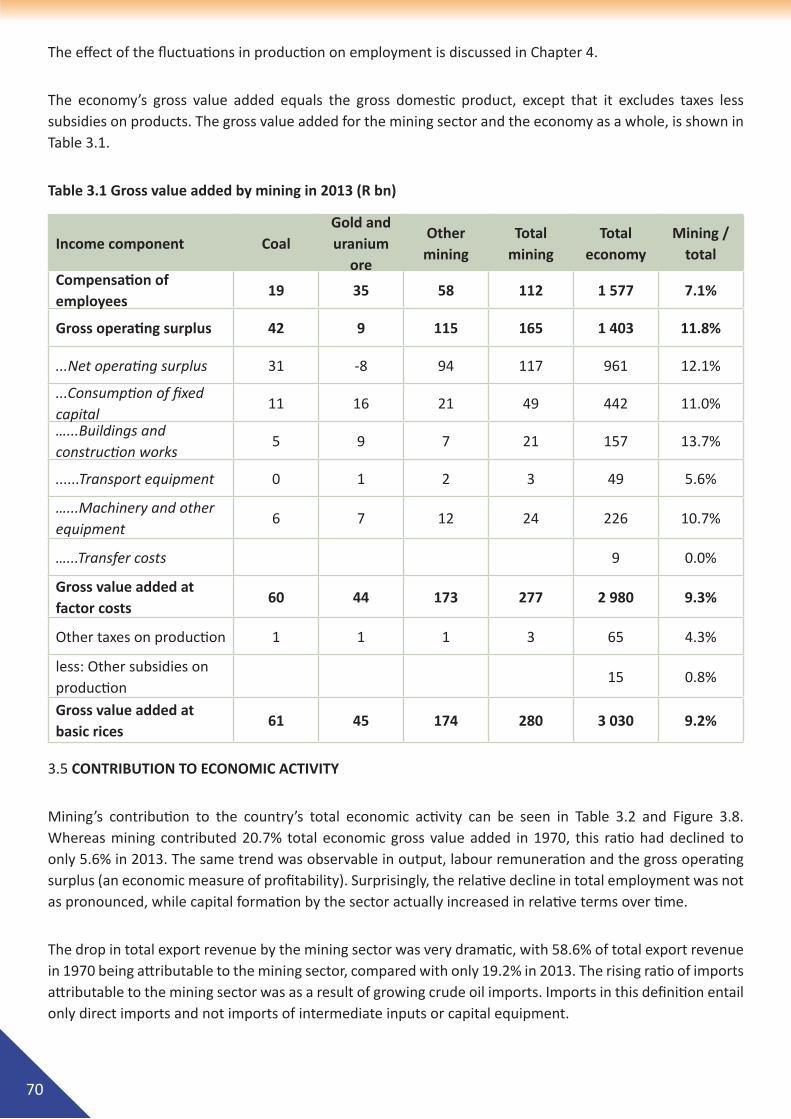
The effect of the fluctuations in production on employment is discussed in Chapter 4.
The economy’s gross value added equals the gross domestic product, except that it excludes taxes less subsidies on products. The gross value added for the mining sector and the economy as a whole, is shown in Table 3.1.
Table 3.1 Gross value added by mining in 2013 (R bn)
Income component CoalGold and uranium
ore
Other mining
Total mining
Total economy
Mining / total
Compensation of employees
19 35 58 112 1 577 7.1%
Gross operating surplus 42 9 115 165 1 403 11.8%
...Net operating surplus 31 -8 94 117 961 12.1%
...Consumption of fixed capital
11 16 21 49 442 11.0%
…...Buildings and construction works
5 9 7 21 157 13.7%
......Transport equipment 0 1 2 3 49 5.6%
…...Machinery and other equipment
6 7 12 24 226 10.7%
…...Transfer costs 9 0.0%
Gross value added at factor costs
60 44 173 277 2 980 9.3%
Other taxes on production 1 1 1 3 65 4.3%
less: Other subsidies on production
15 0.8%
Gross value added at basic rices
61 45 174 280 3 030 9.2%
3.5 CoNTrIBUTIoN To eCoNoMIC ACTIVITY
Mining’s contribution to the country’s total economic activity can be seen in Table 3.2 and Figure 3.8. Whereas mining contributed 20.7% total economic gross value added in 1970, this ratio had declined to only 5.6% in 2013. The same trend was observable in output, labour remuneration and the gross operating surplus (an economic measure of profitability). Surprisingly, the relative decline in total employment was not as pronounced, while capital formation by the sector actually increased in relative terms over time.
The drop in total export revenue by the mining sector was very dramatic, with 58.6% of total export revenue in 1970 being attributable to the mining sector, compared with only 19.2% in 2013. The rising ratio of imports attributable to the mining sector was as a result of growing crude oil imports. Imports in this definition entail only direct imports and not imports of intermediate inputs or capital equipment.
70

Table 3.2 The mining sector’s contribution to total economic magnitudes: 1970 to 2013
1970 1980 1990 2000 2013
Imports of goods and services 5.7% 4.7% 10.5% 16.6% 14.8%
Exports of goods and services 58.6% 49.0% 46.9% 33.8% 19.2%
Output 17.6% 9.4% 8.7% 6.7% 4.2%
Gross value added at basic values
20.7% 13.2% 10.5% 8.5% 5.6%
Labour remuneration 18.0% 11.4% 11.4% 6.5% 5.2%
Gross operating surplus 24.7% 15.9% 9.6% 11.1% 6.1%
Gross Fixed Capital Formation 5.4% 10.5% 13.2% 10.3% 11.8%
Capital stock 6.1% 6.3% 8.6% 7.9% 9.1%
Formal employment 8.4% 8.3% 7.4% 4.1% 4.9%
Figure 3.8 The mining sector’s contribution to total GVA: 2001 to 2013 (and 2014–2020 forecast)
Source: Quantec Research/Ecoquant
.
0%
1%
2%
3%
4%
5%
6%
7%
8%
9%
2001 2002 2003 2004 2005 2006 2007 2008 2009 2010 2011 2012 2013 2014 2015 2016 2017 2018 2019 2020
4.5% 4.4% 4.6% 4.7% 4.7% 4.5% 4.4% 4.0% 3.8% 4.0% 4.0% 3.7% 3.8% 3.7% 3.7% 3.6% 3.6% 3.5% 3.5% 3.5%
2.4% 2.3% 2.1% 1.9% 1.5% 1.4% 1.2% 1.0% 0.9% 0.8% 0.8% 0.7% 0.6% 0.7% 0.7% 0.7% 0.7% 0.7% 0.7% 0.7%
1.4% 1.3% 1.4% 1.4% 1.3% 1.2% 1.2% 1.2% 1.2% 1.2% 1.1% 1.1% 1.1% 1.1% 1.1% 1.1% 1.0% 1.0% 1.0% 1.0%
Source: Statisitic South Africa and Quantec Research
71

3.6 SCeNArIo ModeLLING
Forecasts for mining sector performance are based on a base-case scenario econometric model with an associated input-output model that provided sectoral forecasts. However, a partial model was also employed to obtain two alternative scenarios, which would cause a higher and a lower mining growth environment, compared with the base case, over the next few years79 The differences in assumptions on the changes in the levels of the “driver variables” can be observed from Table 3.3.
Table 3.3 Assumptions for macroeconomic drivers: 2014 to 2020
Base case Low overall mining growth scenario
High overall mining growth scenario
World growth (year on year percentage change) 2.9 1.5 4.3
USD/ZAR exchange rate 12.4 7.5 15.4
International metal prices (year on year percentage 2.5 -8.2 13.1
Gold price in dollar terms (year on year percentage -1.0 -14.7 12.6
SA producer price Inflation (year on year percentage) 5.5 10.2 0.8
Source: The Economist Intelligence Unit, Ecoquant and Quantec Research.
Usually higher international gold and other metal prices, along with a weaker rand exchange rate, will benefit mining output and also the sector’s operating surplus, gross value added and employment. However, changes will have to be sustained for a period of time and may affect the mining sector only with a delay.
Although higher world growth is usually beneficial for the demand for and prices of mining commodities, an inverse relationship may apply to gold mining since such a significant proportion of gold demand is derived from investment activity. Low global growth will therefore often cause investment demand for gold to rise because of increasing risks of lower returns on other investments. Higher input costs (approximated by the producer price inflation) will usually cause the gross value added by the mining sector to be adversely affected.
Changes in the gross value added by the mining sector for the different scenarios are depicted in Figure 3.6. With the exception of gold, negative growth rates for mining sectors were recorded in the low case scenario, while more than double the currently anticipated growth in mining value added could materialise the high case scenario.
79 Statistical properties of the series regarded to have an important bearing on the global demand for mining commodities and value added potential of South African mining
operations were utilised to obtain a high case and a low case scenario. Standard deviations from the historical mean percentage changes were calculated and a high case scenario was
constructed where the levels of the economic drivers were adjusted upwards or downwards (depending on the impact of the particular driver) for each forecasting period. The low case
scenario was constructed similarly with the levels adjusted in the opposite direction, compared to the high case scenario, for each driver.
72

Higher (or lower) value added growth in the mining sector, will logically be associated with higher (or lower) rates of employment growth in the sector as well. The overall changes in total employment growth over the period 2014 to 2020 are shown in Figure 3.9. It would appear that “other mining” would still experience a slight growth in employment even under a low case scenario, while the coal mining sector is expected to shed jobs regardless of whether global conditions change for the better or the worse. Employment in the gold/uranium ore mining sector will most likely only increase under highly favourable conditions.
Figure 3.9 Real GVA growth p.a. for different scenarios (2014-2020)
Figure 3.10 Total employment growth p.a. for different scenarios (2014 to 2020)
Source: Quantec Research/Ecoquant
-8.0 -6.0 -4.0 -2.0 0.02 .0 4.06 .0 8.0
-
-4.0 -3.0 -2.0 -1.0 0.01 .0 2.03 .0 4.05 .0
Source: Quantec Research/Ecoquant
05
73

Table 3.4 Changes in mining sector total employment by skill level (2014 to 2020)
Source: Ecoquant and Quantec Research.
Table 3.4 shows the possible impact per year (over the period 2014 to 2020) on the various skill levels under the three scenarios. A low case scenario could see a small extra number of highly skilled persons being employed each year with few job losses among the skilled workers and extensive job losses among the semi-skilled and unskilled workers. The converse would apply in the high case scenario, where significant job gains would be possible among all skill levels.
3.7 INITIATIVeS To eNHANCe THe eCoNoMIC PerforMANCe of THe SeCTor
In December 2008, the mining sector, in collaboration with tripartite stakeholders from government and organised labour, responded to the economic crisis by establishing the Mining Industry Growth, Development and Employment Task Team (MIGDETT). The task team focused on ways to manage the crisis in the short term, while looking to reposition the country for the next commodity up cycle in the long term. Innovative ways of helping companies to survive in the short term included proposals on reducing cost pressures, dealing with constraints affecting the sector and avoiding retrenchments where possible. In areas where retrenchment became unavoidable, measures to alleviate the consequences of retrenchment were proposed by MIGDETT, including more effective use of social plans80 MIGDETT currently continues with its work and focuses on the sustainable growth and meaningful transformation of South Africa’s mining sector81
In line with the principles of sustainable development, a key driver of increased sector performance is considered to be metals and minerals beneficiation (or value addition). A range of recent policy documents place a renewed focus on beneficiation or local value addition:
80 Chamber of Mines. Annual Report 2008/2009.
81 Department of Mineral Resources.http://www.info.gov.za/speeches/2010/10012509251001.htm, accessed 9 June 2010.
74

· The Mineral and Petroleum Resources Development Act (Act No. 28 of 2002) (DMR)· The Diamonds Amendment Act (Act No. 29 of 2005) (DMR)· The Diamonds Second Amendment Act (Act No. 30 of 2005) (DMR)· The Precious Metals Act (Act No. 37 of 2005) (DMR) · The Metals Sector Development Strategy of 2006 (–the dti) · The Beneficiation Strategy for the Minerals Industry of South Africa (June 2011) (DMR)· The Industrial Policy Action Plan (2013) (the dti) · The Amended Mining Charter· The New Growth Path: The Framework (2010)· The National Development Plan – Vision for 2030 (2011) (National Planning Commission)· Draft Framework Agreement for a Sustainable Mining Industry (entered into by organised labour,
organised business and government – 14 June 2013)
The MPRDA allows for 11% of the required 26% black economic empowerment (BEE) ownership in mining houses to be offset by facilitating local beneficiation. This prompted shareholding of AngloGold in Oro Africa and of Impala Platinum in Silplat, as a consequence. At the same time, the African Growth and Opportunity Act (AGOA) provided a 6% advantage to South Africa on jewellery exported to the USA. The current absence of a gold financing mechanism for the jewellery manufacturing subsector has, however, limited the impact of these incentives. The Jewellery Council of South Africa argues that if a viable gold financing mechanism could be developed, strong incentives will exist for foreign investment in local beneficiation82
The South African Diamond and Precious Metals Regulator (SADPMR) was created in 2007 when the Diamonds Amendment Act, the Diamonds Second Amendment Act and the Precious Metals Act, that together widened the scope of the previous South African Diamond Board to include the regulations of precious metals, were promulgated. Among the objects of the regulator are to ensure that the diamond and precious metals resources of the country are exploited and developed in the best interest of the people of South Africa, and to promote equitable access to, and local beneficiation from, the country’s diamonds and precious metals. While the South African Diamond Board had only a regulatory function, the SADPMR has a promotional role as well, which it admits will be a “challenge” to fulfil.83
South Africa’s State Diamond Trader (SDT), launched in February 2008,84 was also established as a direct result of the Diamonds Amendment Act and the Diamonds Second Amendment Act. The SDT is mandated to purchase 10% of South Africa’s rough diamond production at “market-related” prices and to sell these to local beneficiators – cutters and polishers. Prior to 2008, De Beer’s Diamdel subsidiary provided rough diamonds to smaller local cutting and polishing firms, which were not part of the group’s main rough diamond sales system. When the SDT came into operation, De Beers closed Diamdel, with many of its employees being seconded to the SDT for a three-year period to lend their experience to the start-up phase and to transferring critical skills. Unfortunately, it appears as if the SDT has not fulfilled its mandate – focusing instead on legal compliance issues and issues around the operations of the government diamond valuator – with local cutters and polishers now struggling to get access to stones. Industry has even made calls for Diamdel to resume its operations.
The Metals Sector Development Strategy, approved in 2006 by the dti, is aimed at increasing downstream beneficiation in the metals sector, particularly at Stage 4, which involves the conversion of intermediate refined products into finished goods for market consumption. The strategy targets five priority metal industry
82 Input from the Jewellery Council of South Africa.
83 South African Diamond and Precious Metals Regulator, www.sadpmr.co.za, accessed 17 November 2010.
84 Mining Weekly. State Diamond Trader officially launched, www.miningweekly.com/article/state-diamond-trader-officially-launched-2008-02-29, accessed 12 November 2010.
75

groupings, including precious metals and jewellery. Weak linkages and import parity pricing by large capital intensive upstream metal producers (involved in Stage 2 and 3 beneficiation processes) are identified as significant challenges to downstream beneficiation activities, as are security of raw materials supply, the lack of affordable metal financing, and specialised skills and manufacturing capacity. While the strategy set goals for 2014 and related interventions,85 in reality the challenges and obstacles remain.
The Beneficiation Strategy for the Minerals Industry of South Africa, which was finalised by the DMR in June 2011, proposes a coordinated approach to encouraging the increase in the beneficiation of minerals. It is proposed that beneficiation should take place through the development of specific value chains. The value chains that are proposed in this strategy document are the following: energy generation, steel and stainless steel fabrication, pigments and super alloy production, and jewellery manufacturing. Identifying the jewellery manufacturing subsector as a value chain for support, the strategy proposes as key action plans the establishment of jewellery hubs across the country, the establishment of an effective metal advance scheme for the sector to promote access to raw materials, as well as a focus by the MQA on structured training in supporting these activities. The beneficiation strategy will be implemented under the Mineral and Petroleum Resources Development Act of 2002,86
The fifth iteration of the Industrial Policy Action Plan (IPAP 2013/14-2015/16) focuses on value added production with state support centred on nurturing and defending industrial development. IPAP is based on need for sustainable long-term development that is underpinned by higher growth, exports and labour-intensive, value-adding economic activity in the production sectors, led by manufacturing.
According to a report on IPAP by the dti, South Africa reportedly has the largest reserves of mineral resources in the world (excluding oil), with an estimated value of $2.5 trillion. This endowment is dominated by the platinum group of metals (PGMs) (88% of global reserves), manganese (80%), chrome (72%), vanadium (32%) and gold (30%), but include a range of other substantial mineral reserves.
According to the dti, mineral beneficiation presents much untapped opportunity, but it has lagged in terms of policy development and implementation. Therefore much greater attention will have to be devoted to downstream beneficiation opportunities and the enormous potential that exists to deepen and extend the upstream value chain. The expected explosion of future demand associated with the sub-Saharan commodity boom will also support beneficiation processes. With this in mind, the dti has launched a comprehensive research project that will develop a strategy to identify commercialisation opportunities in projects for forward beneficiation and backward supply chain development in key mineral value-chains. The project will also seek to craft the policy instruments required to support the further expansion of South Africa’s extensive capabilities and competitiveness in this sector,87
The revised Mining Charter also promotes beneficiation through its BEE ownership off-set opportunity. One major challenge in the implementation is that, from industry’s perspective, the issue of beneficiation remains clouded and ill-defined, with no standard formulas for calculating or measuring beneficiation activities. Furthermore, while the Charter refers to the “mineral beneficiation framework”, no such document has been released.88
85 Department of Trade and Industry. 2005. Metals Sector Development Strategy.
86 Department of Mineral Resources. 2011. A Beneficiation Strategy for the Minerals Industry of South Africa.
87 Department of Trade and Industry. 2013. Industrial Policy Action Plan (IPAP).
88 Mining Matters.Spring 2010. The revised Mining Charter 2010.
76

Overall, while there is widespread government acknowledgement of the importance of beneficiation as a primary means to promote the economic development of the MMS in South Africa, and a similarly widespread understanding of the factors that are currently limiting this, there appears at this stage to be little concrete progress towards promoting beneficiation, particularly within diamond processing and jewellery manufacturing. This may, however, change if an efficient gold financing mechanism can be established according to target dates, if the State Diamond Trader is able to perform its mandate, and if the New Growth Path can be effectively implemented as proposed.
For its part, the MQA is directing efforts towards focused relationships with industry representative bodies through the creation of beneficiation skills development steering committees and engaging all stakeholders of the MMS in identifying and focusing skills development interventions.
The New Growth Path: The Framework, presented by Minister Ebrahim Patel on 23 November 2010, contains a central focus on beneficiation. The document focuses on growing the economy in a way that supports job creation. The New Growth Path has identified six priority areas or sectors for job creation, of which mining is one. The New Growth Path document refers to employment projections of the Industrial Development Corporation (IDC) that state that it is possible for the mining industry to create an additional 140 000 direct jobs by 2020, and 200 000 direct jobs by 2030. The main areas where job creation is possible are identified as enhanced PGM and coal exports, and final manufacturing using base metal products. According to the New Growth Path, the main actions that need to be pursued in order to create these jobs are reviewing the mining regulatory framework, including measures around licensing and the potential for a state-owned mining company, developing a ten-year strategic plan for electricity, logistics and skills for mining, and focusing on Stage 4 metal and minerals beneficiation, as outlined in the Beneficiation Strategy for the Minerals Industry of South Africa89 In February 2011, President Jacob Zuma launched a state-owned mining company, the African Exploration Mining and Finance Corporation (AEMFC), currently a subsidiary of the Central Energy Fund. The company will serve as the state-run mining firm, under which all state interests in mining will be consolidated. The government said it wants the AEMFC to focus on strategic minerals like coal and uranium to make sure of sufficient supplies to its power plants. All state interests in mining will be consolidated in this company.
Another initiative that follows on the announcement of the New Growth Path is the National Skills Accord, in which representatives of business, organised labour, community constituencies and government agreed on skills development actions in support of the New Growth Path. These undertakings are discussed in more detail in Chapter 7.
In July 2013, a framework agreement was signed by organised labour, organised business and government for a sustainable mining industry. In the preamble to the document, the parties acknowledged that the mining industry played a central role in the economy and job creation. The parties also agreed that the rule of law and stability was a fundamental pillar of our democracy and necessary to ensure economic and social development. Government, labour and business committed themselves to working together to ensure the sustainability of the mining sector for the future of the country and its people90
89 Republic of South Africa. The New Growth Path: The Framework, November 2010.
90 http://www.sanews.gov.za/south-africa/draft-framework-agreement-sustainable-mining-industry-entered-organised-labour, accessed on 10 August 2013.
77

3.8 fUTUre eCoNoMIC PreforMANCe of THe SeCTor
In the previous section, reference was made to the role of MIGDETT in relation to the sustainable growth of the mining sector. In February 2010, the MIGDETT agreed that it should develop a tripartite Strategy for the Sustainable Growth and Meaningful Transformation of the South African Mining Sector. The work was carried out in two streams: the one focusing on the competitiveness and growth of the sector and the other on the transformation of the sector. A task team dealing with the competitiveness and growth issues developed simulations that would determine the realistic growth potential of the South African mining industry in the absence of factors (some of which were highlighted in the previous section) that constrain the growth of the sector. Based on simulations and scenarios run for each mineral, it came to the conclusion that the total mining sector can achieve a growth rate of about 3% per year over the period 2010 to 2020. If gold mining is excluded, the sector can even sustain a growth rate of 3.9% per year. This growth could result in the creation of another 100 000 jobs by 2020. In another study conducted for the Chamber of Mines in 2009 (the McKinsey’s Mining Competitiveness benchmarking study), it was concluded that under the most favourable conditions, job creation in the sector can be as high as 200 000 by 202091
In the MIGDETT process, the factors affecting the competitiveness of the South African mining industry were identified. Important for this SSP is that human capital constraints are identified as one of the factors that negatively impact on the competitiveness and on the growth potential of the mining sector92
Another MIGDETT initiative was to investigate ways of encouraging greenfield exploration and promoting junior mining investment. One of the outcomes of those investigations was the conclusion that existing geological data needed to be updated, new data needed to be generated, and that surveying and prospecting technologies needed to be modernised. As a result of the task team’s efforts, several initiatives have been implemented to tackle these issues and improve South Africa’s exploration environment. The first of these is a R145-million project, which is being undertaken by the Council for Geoscience CGS and funded by the National Treasury, to resurvey and map selected metallogenic provinces using modern technologies and techniques. To date, CGS has completed the geophysical survey of northern KwaZulu-Natal and is in the process of collecting the last of the soil samples from the area.
3.9 CoNCLUSIoN
This chapter has considered the economic performance of the MMS in South Africa. Using the framework of sustainable development, the various competing demands that are being placed on the sector by shareholders, consumers, governments, employees, communities, human rights activists and environmental organisations were outlined, highlighting the major challenges facing mining houses who seek to obtain a “social licence to operate”.
In addition to this, a wide range of factors also impact directly on the economic performance of the sector and hence on its ability to operate profitably. While some of these have had a positive impact on the local demand for MMS products (such as the impact of the demand for electricity on coal production, and government’s infrastructure development programme on the demand for steel and products from the CLAS subsector), many factors (including those on the demand side and the supply side, as well as the regulatory framework) have over the past decade undermined the economic performance of the sector.
91 Chamber of Mines. Annual Report 2009/2010.
92 Ibid.
78

This pressure is evident in the fact that, from an economic perspective, the MMS in South Africa performed worse than the rest of the economy. This sector has been particularly hard hit by the economic crisis of 2008 and 2009 and it experienced the worst contraction in 2009, but started growing again in 2010. Global commodity prices rebounded again in the second quarter of 2009, and by 2010, the prices of most minerals had returned to pre-recession levels. The new record gold price and the increased demand for gold have also contributed to growth in the MMS.
Widespread industrial action in 2013 has carried over into 2014 and could have a significant impact on sectoral growth prospects for the foreseeable future – potentially signalling long-term change in the sector.
A range of recent policy documents place a renewed focus on beneficiation as a primary means of improving the economic performance of the sector. However, these have as yet been unable to successfully address the complex set of challenges that obstruct beneficiation within the local economy. The finalisation of the Beneficiation Strategy for the Minerals Industry of South Africa in June 2011 and its implementation may give impetus to beneficiation as a mechanism for growth in the MMS.
With the New Growth Path and subsequent National Development Plan, government aims to stimulate growth and job creation in the mining industry and refers to the potential of the sector to create some 140 000 new jobs. Studies undertaken for the Chamber of Mines and by MIGDETT confirm this growth and job creation potential of the sector, but only in the absence of constraining factors, of which human capital is one. The recent strikes will have a detrimental effect on the growth and job creation potential, although the real impact can only be quantified once the labour disputes have settled.
79

4 deMANd for LABoUr
4.1 INTrodUCTIoN
This updated Sector Skills Plan (SSP) focuses on skills development solutions for the next five years.
It is driven by the labour demand in the MMS. The SSP is discussed and outlined from different perspective. The total employment and changes based on labour demands are the fundamental issues in this SSP. They are followed by an analysis of the MQA framework of occupations. The framework depicts the specific skills demands and remuneration trends in the mining sector including the needed quantities.
The penultimate section indicates a forecast of future demand derived from a labour demand projection model developed for the Mining and Minerals Sector (MMS). The demand projections span the period covered by the National Skills Development Strategy (NSDS) III – the period 2011 to 2016, which is reviewed and updated in terms of the revised forecast horizon of 2014–2020. The final section considers the range of factors that are driving changes in the need for particular types of skills, as well as the overall levels of labour required by the sector. Insights gathered in the research period necessitated a brief review of developments in the external and operating environment, which will be discussed in paragraph 4.5.
4.2 TreNdS IN eMPLoYMeNT
4.2.1 Total employment
According to the latest Quarterly Employment Survey by Stats SA, formal non-agriculture sector employment totalled 8 495 000 at the end of 2013. Of this total, 499 000 people (5.9% of the total) were employed in the mining and quarrying sector. Totals per mining subsector are shown in Figure 4.1 which also depicts the long-term decline in employment in the gold and uranium ore mining sub-sector. Employment in the mining industry increased from approximately 789 000 in 1980 to almost 836 000 in 1986. It then fell to its lowest point of 407 000 in 2001 before gradually recovering to nearly 525 000 in 2012. In 2013, mining sector employment averaged around 510 000, implying a drop of 2.7% on the previous year.
Figure 4.2 depicts the five year average growth rates of mining sector employment up to 2013, with a forecast for 2014-202093 What is noteworthy, is the fact that mining sector employment growth averaged 0.8% p.a. over the period 1970 to 1990, while total formal sector employment in the economy increased by 1.9% p.a. Over the period 1990 to 2013, mining sector employment growth amounted to -1.8% p.a., while total employment growth in the economy averaged 0.9% p.a. Although the trend in mining sector employment growth is anticipated to improve marginally to 0.5% p.a. over the forecast period, this will still be below the 1.4% increase p.a. envisaged for the economy as a whole.
80

Figure 4.1 Employment in mining in South Africa: 1970–2020
93 This longitudinal analysis of employment trends is not possible for the whole MMS because information on the MMS as it is constituted for the purposes of the Skills Development Act
has only been available since the inception of the SETA system.
83
The mining sector employment over years has been fluctuating and is influenced by global demands and volatility. The gold mining sector shows significant incline and decline over the years due to the gold volatility demands. Other mining sectors have experienced a steady growth, whilst the coal mining sector has maintained its linear and slight deviation growth.
0
100,000
200,000
300,000
400,000
500,000
600,00019
70
1972
1974
1976
1978
1980
1982
1984
1986
1988
1990
1992
1994
1996
1998
2000
2002
2004
2006
2008
2010
2012
2014
2016
2018
2020
Source: Quantec Research/Ecoquant
Figure 4.2 Employment in mining in South Africa: Average growth rates since 1990
-15.0%
-10.0%
-5.0%
0.0%
5.0%
10.0%
1990-1995 1995-2000 2000-2005 2005-2010 2010-2015 2015-2020
Source: Quantec Research/Ecoquant
81

From the figures, the declining trend of employment in gold and uranium mining is quite noticeable, with the subsector being particularly hard hit by the recession as well as structural factors. In 2008, this subsector employed more than 166 000 people, but from 2009 to 2013, this figure had shrunk to less than 134 000. Over the period 1990-2013 gold and uranium ore mining employment declined by 5.4% p.a. Fortunately there was a significant increase in employment in other mining sectors, showing a rise of 1.5% p.a.
The coal mining industry employment growth has been fairly stable at -0.2% p.a. but is expected to decline by around 1% p.a. over the forecast period. The decline in gold and uranium ore sector mining employment growth my subside to -0.2% during 2013-2020, while other mining employment growth may continue to expand at a rate of around 1.3% p.a., on average, over the forecast period. Figure 4.3 reflects formal employment in the mining sector as a percentage of the total economy.
Figure 4.3 Formal mining sector employment as a percentage of the total economy
Source: Quantec Research / Ecoquant
82
Source: Quantec Research/Ecoquant
0%
1%
2%
3%
4%
5%
6%
2001 2002 2003 2004 2005 2006 2007 2008 2009 2010 2011 2012 2013 2014 2015 2016 2017 2018 2019 2020
1.6% 1.7% 1.9% 2.2% 2.3% 2.3% 2.5% 2.7% 2.6% 2.7% 2.8% 2.9% 2.8% 2.9% 2.9% 2.9% 2.9% 2.9% 2.9% 2.9%
2.0% 1.9% 1.9% 1.7% 1.6% 1.5% 1.6% 1.6% 1.6% 1.6% 1.4% 1.4% 1.3% 1.3% 1.3% 1.3% 1.3% 1.3% 1.2% 1.2%
0.5% 0.5% 0.5% 0.5% 0.6% 0.6% 0.6% 0.6% 0.7% 0.7% 0.8% 0.8% 0.8% 0.8% 0.8% 0.8% 0.8% 0.8% 0.8% 0.8%
It is therefore proposed that members enhance their understanding of the skills development environment of the MMS.
• Skills development research
Conduct relevant research into skills development-related issues in the MMS as per the annual research agenda.
• workplace skills plan/annual training report
The above graph also reflects the same annual upward trend in formal employment in the other mining category, and a downward trend in the gold and uranium category. The coal mining category seems to have stabilised.

Source: Calculated from MQA data system, May 2014.
Figure 4.4 shows that the subsectoral composition of the demand for labour has remained relatively stable since the inception of the Sector Education and Training Authority (SETA) system. The only exceptions are the decline in the labour demand of the gold mining subsector and the growth of labour demand by the PGM mining subsector referred to earlier in this section.
4.2.2 Occupational demand
The latest occupational composition of the MMS can be seen in Table 4.1. As mentioned above, the demand for highly skilled and skilled workers is limited compared to the need in the rest of the economy. Managers comprised approximately 2% and professionals 5% of total employment in 2014. Technicians and associate professionals formed 12% of the workforce and trade workers 7%.
PGMMining
CLASCoal
mining
Diamond
Mining
Diamond
Processing
GoldMining
Jewellery
Manufacturing
OtherMining
ServicesIncident
al toMining
147746 11398 50152 7892 5227 110198 7198 63152 9153
050000
200000
83
As indicated in Chapter 2, the MMS also includes three downstream manufacturing activities: diamond processing, jewellery manufacturing and cement manufacturing, as well as the services incidental to mining subsector. In 2011, total employment in the sector was estimated to be approximately 628 000. The total number of employees per subsector is summarised in Figure 4.4.
Figure 4.4 The total number of employees per subsector
Table 4.1 Occupational composition of the MMS
Source: Calculated from MQA data system, July 2014
The occupation groups shows that the greatest demand in the number of skills are Plant and Machine operators, Elementary workers and Technicians and Associate professionals. Normally this may lead one to believe that the MMS is a ‘low skill’ based environment. However, this is not really the case. While the

86
majority of these occupations do not require much in the way of formal education, there are specific industry related skills that are required. Therefore from a skills development point of view the sector is a highly skills intensive sector. This matter is discussed in more detail under the Occupational Framework.
Table 4.2 provides a list of the different types of professional engineers employed in the MMS. The different engineering disciplines are mining, mechanical, industrial, metallurgical, electrical, civil, electronics, telecommunications, chemical and environmental. A number of electrical engineers are also employed in the MMS. The total number of engineering professionals is 4 078 and they constitute 16% of all professionals employed in the MMS. They represent a small percentage of employees but the supply and demand of these skills need to be closely monitored because of the key role they play within the sector.
Table 4.2 Engineering professionals employed according to race
Source: Calculated from MQA data system, July 2014.
Top 12 Positions Breakdown per population and occupational group are indicated in table 4.3 below. Note must be taken that Mining Managers occupy a total of 1630 followed by Manufacturing Managers at 1137 of these management occupations.
84

Table 4.3: Managers employed according to race
Source: Calculated from MQA data system, July 2014.
Table 4.4 provides information on the occupations in which most of the professionals are employed. The largest group of professionals are employed as Human Resource Advisors (2597), followed by safety, health, environment and quality (SHE&Q) practitioners (2382) Training and development professionals comprise of 2282. Surveyors comprise 1297 of the total number of professionals employed, geologists 1128 and mining engineers at 918. A steady shift from line functions to support functions is noticeable. Mechanical engineers, mining engineers and accountants are still dominated by whites
The number of professionals employed in the industry per population group is summarised in Table 4.4.
85

Source: Calculated from MQA data system, July 2014.
Professionals are also employed in non-line function areas such as human resources and accountants.
It is also important to evaluate the semi-skilled and unskilled labour intensity per subsector, as set out in Figure 4.5.
Table 4.4 Professionals employed according to race
86

Figure 4.5 The semi-skilled and unskilled labour intensity per subsector
The gradual decline of semi- and unskilled labour intensities across subsectors correspond with increased skill levels observed in both the total economy and the mining sector.
The skilled labour intensity per subsector can be summarised as follows:
Figure 4.6 The skilled labour intensity per subsector
With the exception of the gold mining sector, there was generally an increase in skilled labour intensity in mining. This increase calls for increased skills interventions to cater for future demand. Highly skilled labour intensity in mining has also increased, as illustrated in figure 4.7.
Source: Quantec Research/Ecoquant
Source: Quantec Research/Ecoquant
0%
5%
10%
15%
20%
25%
30%
35%
40%
45%
30%
40%
50%
60%
70%
80%
90%
100%
Coal mining
87

Figure 4.7 The highly-skilled labour intensity per subsector
The majority of technicians and associate professionals working in the MMS are miners and production or operations supervisors (see Table 4.5). Other technicians or associate professionals include mining technicians, metal manufacturing process control technicians, chemistry technicians, mines safety inspectors, mineral beneficiation process controllers, physical science technicians, mechanical and electrical engineering technicians, and draughtsman. Technicians and associate professionals are also employed in non-line function areas such as office administrative practices (purchasing officers, office administrators and personal assistants).
Table 4.5 Technicians and associate professionals employed according to race
Source: Calculated from MQA data system, July 2014.
Trades workers include artisans. The artisan occupations that occur most frequently in the MMS are electricians, metal fabricators, diesel mechanics, millwrights, fitters and turners, riggers, automotive motor mechanics, welders, electronic instrument trades workers, industrial machinery mechanics, goldsmiths, precision instrument makers and repairers, automotive electricians and bricklayers. These workers are typically trained through further education and training (FET) institutions, and through apprenticeships and learnerships.
0%
2%
4%
6%
8%
10%
12%
14%
16%
18%
20%
Source: Quantec Research/Ecoquant
88

A breakdown per population group of trades’ workers is summarised in Table 4.6 below.
Table 4.6 Skilled agricultural, forestry, fishery, craft and related trades workers employed according to race
Source: Calculated from MQA data system, July 2014.
Service and sales workers can be summarised as follows per population group:Table 4.7 Service and sales workers employed according to race
Other workers, namely agricultural, forestry, fishery, craft and related trades workers are summarised in the following table:There are more plant and machine operators employed as mining operators, crane or hoist operators, drillers, train drivers, loader operators, mineral processing machine operators and bulldozer operators (see Table 4.8).
Table 4.8 Plant and machine operators employed according to race
Source: Calculated from MQA data system, July 2014.
89
Source: Calculated from MQA data system, July 2014.

Two thirds of elementary workers are employed as mining support workers. Other elementary workers employed in the MMS are metal engineering process workers, electrical or telecommunications trades assistants, builder’s workers, surveyor’s assistants, commercial cleaners, mineral beneficiation plant workers, driller’s assistants, mechanic’s assistants, store persons, handypersons and chemical plant workers. Most of these workers are black and make up 97.5% of the total plant and machine operator workforce.Elementary occupations can be summarised as follows according to race:
Table 4.9 Percentage of people employed in elementary occupations according to race
Source: Calculated from MQA data system, July 2014.
At this stage, it is not possible to determine the changes in the occupational structure of the MMS. These changes are normally gradual and can only be tracked through relatively long time series data. Although the MQA has been collecting occupational information over the last ten years, the occupational classification system was changed in 2008 from the Standard Occupational Classification (SOC) to the Organising Framework for Occupations (OFO). The OFO underwent substantial changes over the last few years, which affected the occupational categories, making it difficult to track changes in the occupational structure.
4.3 reMUNerATIoN TreNdS
As mentioned in Chapter 2, the MMS is highly unionised. Wage levels are to a large extent the result of collective bargaining processes and are therefore not indicative of market demand. Unfortunately, no sector-specific information is available on salary trends in particular occupations.
Past and future expected remuneration trends are shown in figure 4.8.
90

Figure 4.8 Comparative total real labour remuneration per subsector
In comparison to the above graph, if compared to those depicted earlier in this chapter on employment trends, it is clear that there is a definite correlation that all role-players in the mining sector should consider.
The relative decline in output and value added by mining in general, but by the gold mining sector in particular, has had important implications for employment and remuneration in the sector.
Over the period 1982 to 1990, the average income earned by people working in the mining industry remained more or less the same – between R80 000 and R85 000 per year (at 2005 constant prices). However, from 1994 to 2001, real per capita income in mining increased by around 1% p.a. to nearly R95 000 p.a. Since then, average real remuneration levels per employee has eased to around R88 000 by 2013. Over the past five years up to 2013, real remuneration per employee in the “other mining” subsector rose by 1.3% p.a. which was in line with the rise recorded for the economy as a whole. Real per capita remuneration in coal mining averaged -1.6% p.a. although the absolute levels in this subsector remained significantly above the levels recorded for both other mining sectors and the total economy.
Several factors could have contributed to pressure for higher real wages in the mining sector: an increase in the membership and bargaining power of the unions, an increase in the educational levels of the workers (see Section 2.5.3) and the Social and Labour Plan requirements that oblige employers to recruit locally, instead of using foreign migrant labour.
Source: Quantec Research/Ecoquant
0
5,000
10,000
15,000
20,000
25,000
30,000
35,000
40,000
1970
1972
1974
1976
1978
1980
1982
1984
1986
1988
1990
1992
1994
1996
1998
2000
2002
2004
2006
2008
2010
2012
2014
2016
2018
2020
91
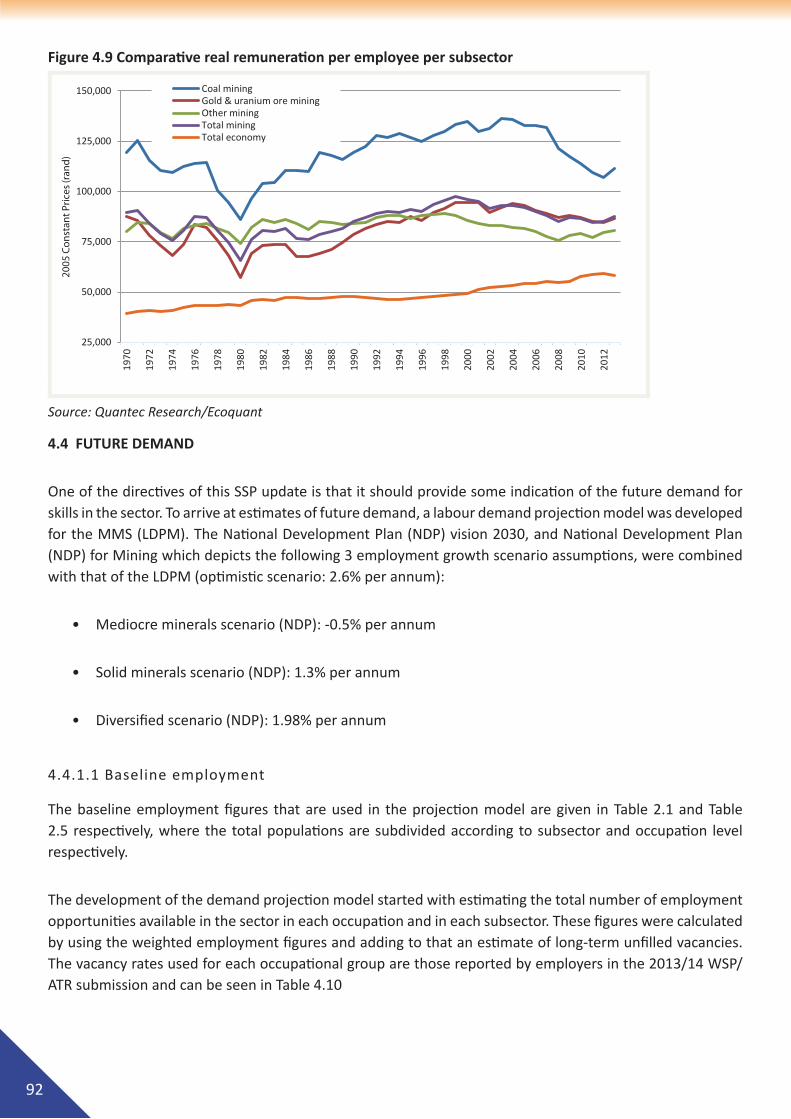
Figure 4.9 Comparative real remuneration per employee per subsector
4.4 fUTUre deMANd
One of the directives of this SSP update is that it should provide some indication of the future demand for skills in the sector. To arrive at estimates of future demand, a labour demand projection model was developed for the MMS (LDPM). The National Development Plan (NDP) vision 2030, and National Development Plan (NDP) for Mining which depicts the following 3 employment growth scenario assumptions, were combined with that of the LDPM (optimistic scenario: 2.6% per annum):
• Mediocre minerals scenario (NDP): -0.5% per annum
• Solid minerals scenario (NDP): 1.3% per annum
• Diversified scenario (NDP): 1.98% per annum
4.4.1.1 Baseline employment
The baseline employment figures that are used in the projection model are given in Table 2.1 and Table 2.5 respectively, where the total populations are subdivided according to subsector and occupation level respectively.
The development of the demand projection model started with estimating the total number of employment opportunities available in the sector in each occupation and in each subsector. These figures were calculated by using the weighted employment figures and adding to that an estimate of long-term unfilled vacancies. The vacancy rates used for each occupational group are those reported by employers in the 2013/14 WSP/ATR submission and can be seen in Table 4.10
25,000
50,000
75,000
100,000
125,000
150,000
1970
1972
1974
1976
1978
1980
1982
1984
1986
1988
1990
1992
1994
1996
1998
2000
2002
2004
2006
2008
2010
2012
Source: Quantec Research/Ecoquant
92

Table 4.10 Vacancy rate per OFO main groups’ vacancy rates
Source: Calculated from WSP/ATR submissions 2013.
It is clear that the highest vacancy rates exist in the following groups:
• Professionals (2.99%)
• Skilled agricultural, forestry, fishery and related trade workers (3.18%)
• Managers (1.86%)
For the purposes of the future SSP Projection Model, it was assumed that the above vacancy rates will persist throughout the projection period.
Table 4.11 Number of positions, according to occupational group: 2014
Source: Calculated from MQA data system, July 2014.
Note: For the purposes of this projection model, the figures in the above table include vacant positions, as calculated from the vacancy rates in the preceding table. Hence, this table represents total available positions.
4.4.2 Assumptions used in the creation of the model
The labour demand projection model uses assumptions that relate to growth in employment or the creation
93

of new job opportunities and assumptions that relate to replacement demand – i.e., mortality, retirement and people leaving the sector.
a) Assumptions regarding the occupational structure of demand
As mentioned earlier in this chapter, historical changes in the occupational structure of the MMS could not be tracked – not even the occupational group level – because of all the changes in the occupational classification system that SETAs have to use. In the absence of information on historical trends, the demand projection model assumes that the occupational distribution of positions in the sector will remain the same over the forecasting period. It should also be taken into account that new jobs that never existed before are continuously created due to technological innovation. Ideally, a demand projection model should take this and other trends into account. However, due to limited available data and uncertainty about how it may unfold in future, the assumptions above are used.
b) Assumptions regarding production and employment growth
In this SSP update, the model is used to determine the numbers of people that would be needed in specific occupations if the sector were to meet the employment growth objectives set by the New Growth Path. As mentioned in the previous chapter, the Mining Industry Growth, Development and Employment Task Team (MIGDETT) came to the conclusion that it would be possible to create 100 000 new jobs in the mining component of the MMS if the production of the sector as a whole grows by 3% per year over the period 2011 to 2020. However, the decline in gold production (with the use of current production methods) seems to be inevitable. The MIGDETT concluded that if gold is left out of the equation, the other mining subsectors should grow production by 3.9% per year in order to create 100 000 jobs. The growth in employment needed each year to reach that goal is 2.6%. In this labour demand model, it was assumed that all the subsectors in the MMS (with the exception of gold mining) would grow their production by 3.9% per year and that employment would grow by 2.6% per year. This implies an employment coefficient (production elasticity of employment) of 0.67, i.e., for each percentage point growth in production, employment will grow by 0.67%. This elasticity figure implies relatively labour-intensive production processes. Gold production and employment in the gold mining subsector were kept constant throughout the forecasting period. The employment growth figure of 2.6% was also used for the non-mining subsectors: services incidental to mining, diamond processing and jewellery manufacturing. It was argued that the services incidental to mining subsector will grow along with the mining subsectors. In Chapter 3 of this SSP, the factors that are constraining the two beneficiation subsectors were mentioned. A 2.6% growth in employment in these subsectors will only be possible if those factors are effectively dealt with by government and if the Minerals Beneficiation Strategy is implemented.
c) Assumptions regarding mortality
Mortality rates were calculated for each occupational group using the age distribution of people in each occupational group, mortality figures reported in Statistics South Africa’s 2007 mortality report 93 and Statistics South Africa’s 2007 mid-year population estimates,94 It was assumed that crude mortality rate improvements of the South African population, as reported in the Statistics South Africa 2013 mid-year population estimates, apply uniformly across the mining sector occupational levels and subsectors for the period 2007 to 2013. This
93 Statistics South Africa.Mortality and causes of death in South Africa, 2007: Findings from death notification. Statistical release PO0309.3. This was the most recent mortality report
available at the time of writing this report.
94 Statistics South Africa. 2007. Mid-year population estimates. Statistical release PO302.
94

enabled the model to incorporate the previous mortality into the current model and also update it to reflect more recent rates. For the purposes of the future projection model, it was assumed that the above vacancy rates will persist throughout the projection period.
The assumed mortality rates used in the model can be seen in Table 4.12.
Table 4.12 Annual mortality rates per occupational group
Sources: As described in the text, together with Statistics South Africa’s 2013 Mid-year Report.
Note: Due to mortality improvements, as reflected in Statistics South Africa’s 2013 Mid-year Report, the mortality rates were adjusted accordingly.
a) Assumptions regarding retirement
Calculation of retirement rates was based on the age distribution of people in each occupational group. Retirement age was taken as 60. The retirement rates used for the respective occupational groups are shown in Table 4.13 below
Table 4.13 Number of retirees per OFO major groups
Source: Calculated from MQA data system, July 2014.
95

Note: For the purposes of the future projection model, it was assumed that the above vacancy rates would persist throughout the projection period.
a) Assumptions regarding people leaving the sector
There are various reasons for people leaving the labour market or leaving the sector, including illness or permanent disability, emigration, or to find employment elsewhere in the economy. In the absence of any statistical information on these movements, estimates were made for each occupational group. The percentage of professionals and technicians, and trades workers leaving the sector was taken to be higher than in the other occupational groups because of the high demand for these types of skills in the economy in general and even in the rest of the world (Table 4.14).
Table 4.14 People leaving the mining sector annually as per OFO major group
Source: Calculated from MQA data system, August 2013.
As stated earlier, more professionals migrate between industries due to the impact of technological innovation.
4.4.3 Interaction between the demand and supply sides of the labour market
The model looks at the demand side of the labour market only and it assumes that there will be no supply-side constraints. However, if the supply-side of the market cannot keep up with demand, various coping mechanisms may be used, rendering some of the assumptions used in the model invalid. For example: Employers may increase the workload of certain categories of workers – even if they have to pay more to retain their services. This will change the occupational structure of the sector. Similarly, if severe shortages are experienced, people may be enticed to remain economically active beyond the age of 60 and the assumption of retirement at the age of 60 will then be incorrect.
4.4.4 Results of 4 scenarios: MQA Demand Projection Model (NDPL), National Development Plan (NDP) vision 2030, and National Development Plan (NDP) for Mining
The outcome of the 4 scenarios approach relevant to the number of positions that need to be filled by 2020 is as follows:
96

Figure 4.10 Four Scenarios: Total number of positions to be filled by 2020
Projections for future demand relevant to new and replacement demand for the period 2013-2020 is as follows:
Figure 4.11 Projections for future demand: new and replacement demand 2013-2020
Given the assumptions described above, the total number of people needed each year to take up positions in the MMS starts with 52 500 in 2013 and increases to 62 800 in 2020.
02013 2014 2015 2016 2017 2018 2019 2020
02013 2014 2015 2016 2017 2018 2019 2020
97

Figure 4.12 Positions to be filled as per OFO major group
Source: Information and assumptions as stated in this section, together with calculations from MQA data system, August 2013.
Note: Figures rounded to nearest 100.
From Figure 4.12, it can be seen that the model projects a typical linear increase in new employees needed over the projection period.
In order to attain the 2.6% employment growth, the MMS will have to create 12 300 new jobs in 2011. This figure will increase gradually every year and by 2020 it will have to create 15 500 new employment opportunities (Figure 4.13).
Figure 4.13 Sector replacement positions compared to new positions
Source: Information and assumptions as stated in this section, together with calculations from MQA data system, August 2013.
Note: Figures rounded to the nearest 100.
Please note that the 2020 horizon is more appropriate as a planning period than the SETAs’ five-year planning period. Skills that will be need by 2020 need to be developed as soon as possible.
2013 2014 2015 2016 2017 2018 2019 2020
02013 2014 2015 2016 2017 2018 2019 2020
98

Table 4.15 Total number of employees per OFO occupational group
Source: Information and assumptions as stated in this section, together with calculations from MQA data system, August 2013.
Figures were rounded to the nearest 10. Rounding may cause slight discrepancies between projected values in the various tables.
Table 4.16 Projected annual number of additional engineering professionals needed in the sector: 2013-2020
Source: Information and assumptions as stated in this section, together with calculations from MQA data system, August 2013.
Note: Due to rounding, all the figures appear the same – indicating that the figures do not increase rapidly over time. The figures in the table represent the additional employees needed per category per year. For example, approximately 100 new mechanicals engineers will be needed every year over the projection period. Due to rounding, as well as the fact that the projection model gives an approximately linear trend, the figures appear the same – confirming that the figures do not increase rapidly over time.
Similar considerations apply to the next two tables.
4990
99

Table 4.17 Projected annual number of additional technicians and associate professionals needed in the sector: 2013-2020 (selected occupations)
Source: Information and assumptions as stated in this section, together with calculations from MQA data system, August 2013.
Note: Due to rounding, all the figures appear the same – indicating that the figures do not increase rapidly over time.
Table 4.18 Projected annual number of additional skilled agricultural, forestry, fishery, craft and related trades workers in the sector: 2013–2020 (selected occupations)
Source: Information and assumptions as stated in this section, together with calculations from MQA data system, August 2013.
Note: Due to rounding, all the figures appear the same – indicating that the figures do not increase rapidly over time.
100

4.5 New deVeLoPMeNTS IN THe MINING ANd MINerAL SeCTor THAT wILL IMPACT oN SKILLS deMANd
4.5.1 Overview
This SSP update also briefly explores new developments beyond the planning horizon to determine possible new developments that could have an impact on future skills required. This longer term view is of critical importance, especially from a critical skills perspective. The following question needs to be answered in this SSP: What skills will be required to empower the mining and mineral sectors at all levels?
Drivers of change are normally classified as industry-specific and non-industry-specific. For example, policy imperatives such as employment equity and HIV/AIDS are normally non-industry-specific, since all sectors are implied.
The development of drivers of change towards 2020, with specific reference to items that will be discussed below, as necessary to direct skills development over the longer term, should probably be included at a later stage. The 2020 landscape should be exploited in general with specific focus on the mining and minerals industry-sensitive parameter, such as the green agenda. The MQA is aware of the fact that all new directions and areas of exploitation should be consulted with key stakeholders, such as organised labour and government.
The remainder of this section will focus on possible new challenges that could have an impact on the demand and supply of skills required by the mining and minerals sector. The Mineral Resources Strategic Plan 2010/2011–2012/2014 of the Department of Mineral Resources was studied as a basis to understand the future landscape of the minerals industry. In addition, up to date industry information was sourced.
All policies that have an impact on the SSP, such as the New Growth Path, the Skills Accord and the National Skills Development Strategy (NSDS) should be considered in detail to further contextualise future challenges and opportunities.
· Drivers of change that are normally significant
4.5.2 Technology
Rapid changes in technology have an impact on most sectors, and especially in the mining sector. Continuous SSP updates should always focus on its impact on future skills needs and strategies to develop these skills. Clearly, technological developments do not have a uniform effect on the demand for labour. On the one hand, the mechanisation and computerisation of processes may reduce the demand for labour. On the other hand, technology also saves jobs, for example, by improving exploration, facilitating mining at deeper levels, and lengthening the lifespan of mines. At the same time, technological changes are the biggest drivers of skills demand in the industry and all levels of workers have to continuously upgrade their skills if they are to keep up with technological changes.
4.5.3 Growing middle class
Various credible sources identified a growing middle class worldwide. In South Africa, this trend should be exploited from a mining and minerals perspective, especially in view of the fact that the “middle class” can be considered the “consumer class”, and therefore society’s economic driver. Subsectors such as the jewellery industry should also target this age group, which is a significant client base, since they will be the consumers
101

with the money to spend. South Africa is witnessing a rapid rise of a black middle class that was held back by years of apartheid. A growing black middle class has seen increased participation of black people in the economy.
The growing black middle class is a product of the South African government’s black economic empowerment (BEE) programme that kicked off in post-1994 after the end of the apartheid era. These people form approximately 10% of the 22 million black South Africans who are over-18-years of age and they contribute up to 40% of the spending in this group. This segment is growing rapidly. Figures at the end of 2008 show that this group’s numbers were growing at 15%.
4.5.4 Declining birth rates and ageing population
The ageing situation in South Africa can be described as follows: “Concern about population in Africa traditionally has focused on relatively high rates of fertility and mortality, expansion of basic health programmes, and, more recently, on the devastation resulting from the HIV/AIDS pandemic. Overlooked in the face of these pressing issues is the fact that most African populations are ageing, albeit at slower rates than in much of the developing world.” Although the situation is not yet so severe in South Africa, the mining industry should closely monitor the global trend. It was found that older customers should be approached in another way, since they have different tastes and preferences.
4.5.5 Social media
Relative few industries (as demarcated by SETAs) have assessed the need for empowerment of their organisations in relationship with their employees on the aspect of social media. “Is social media commentary going to change the way mining companies around the world do business? Can an industry participating in a blog or forum discussions affect their bottom line or share pricing? These are just some of the questions today’s mining companies need to answer.” (Grouch 2013)
Sector organisations should assess the value of using social media as part of their long-term strategy, in which the MQA can play a significant role relevant to skills development and the communication thereof to the youth as potential employees in the sector.
4.5.6 Black empowerment and affirmative action
The most important political driver is the changing political landscape in South Africa and the importance of accelerated Broad-based black economic empowerment (B-BBEE). There are political imperatives that would seek to address this imbalance. Black economic and state administrative empowerment has become an important aspect of the political terrain and is a major driving force in South African society.
It is imperative that skills development includes measures to address the representativity of black people in senior management positions. Measures must therefore be put in place to equip black people to perform at this level. The MQA should set specific targets on B-BBEE in its skills development strategy.
4.5.7 SMME development
Accelerated development of small, medium and micro enterprises (SMMEs) is high on the agenda of all sectors of the economy. The mining and minerals industry needs to carefully consider an acceleration of the SMME sector. Appropriate skills solutions should be included in this SSP.
102

4.5.8 Social drivers of change
The major social drivers are unemployment and the requirement to create decent work, as well as HIV/AIDS and crime. An important driver that relates to South Africa’s skewed income distribution is the unemployed and the number of people surviving below the poverty line. An unemployment rate above 20% is deemed to pose excessive political risk for most economies, but especially for South Africa, where the populace has been conditioned into believing that things would get better with a new government. The African ethnic group is also the group that bears the burden of this income inequality.
It is essential that HIV programmes be included in skills programmes and learnerships.
4.5.9 Hydraulic fracturing
Hydraulic fracturing in South Africa is an energy creation strategy in early stages of development using high-pressure drilling techniques to release natural gas trapped in shale rock. After initially imposing a moratorium on hydraulic fracturing (also known as “fracking”) in April 2011, the South African government lifted the moratorium in September 2012 after determining that fracking was in the best interest of the country. Several energy companies were subsequently granted exploration licenses. Fracking in South Africa is a current topic of debate, with proponents pointing to substantial economic and energy benefits and opponents voicing concerns about potentially adverse environmental impacts.Amid much debate, draft regulations for hydraulic fracturing in South Africa were published in October 2013 by South Africa’s cabinet. Mineral Resources Minister Susan Shabangu proposed a two-year extension of the moratorium in February 2014 and has also banned fracking until the release of final regulations before governmental elections on May 7, 2014. A news report on March 23, 2014, reported that the final regulations for hydraulic fracturing in South Africa would be released in the middle of April 2014.
In March 2014, state legislation was passed that allowed for the state to claim 100% of mining ventures, which drastically changed the 20% claim that was initially envisioned in previous negotiations. Regardless of the controlling party, the exploration process will last for approximately 2 years. If results of the exploration process promise worthwhile benefits, environmental impacts will be assessed and commercial fracking will occur although it could take a decade to produce results. This will need new skills sets to be developed for the mining sector95
4.6 CoNCLUSIoN
This chapter analysed the demand for labour in the MMS from different perspectives, based on the latest available data. First it looked at total employment and found that the mining industry’s employment plummeted from almost 830 000 in 1985 to just over 400 000 in 2001. However, despite the poor economic performance of the sector described in Chapter 3, employment increased by over 100 000 workers between 2000 and 2008. In 2008 and 2009, the contraction of the industry due to the impact of the global economic crisis became evident in the employment figures, with around 27 000 job losses reported. Job losses continued in 2010 and by March 2010, some 45 000 unemployed mine workers were reported in the Labour Force Survey (LFS). This figure decreased to 41 000 in March 2011.
The analysis of labour demand further shows that mining in South Africa is relatively labour intensive and is likely to remain so in the near future. However, technological advancements have brought about changes in the skills required of people in the industry and will continue to drive skills needs into the medium- to longer-term future.
95 http://en.wikipedia.org/wiki/Hydraulic_fracturing_in_South_Africa
103

This chapter includes projections of the demand for labour over the period 2014 to 2020. For the first time, after the 2011/12 WSP submissions, the MQA had enough detailed information on employment in the sector to develop a demand projection model that can project demand at the detailed occupational level. The demand projections presented in this SSP update look specifically at the skills that will be needed if the mining sector were to reach the employment creation potential identified by the MIGDETT on the competitiveness of the mining industry, i.e., the creation of another 100 000 jobs by 2020, as well as fulfilling the replacement demand caused by the natural attrition of skills from the sector. Demand projections are given in terms of total employment, occupational groups and the selection of specific occupations. The model itself contains projections for each of approximately 700 occupations found in the MMS.
Overall, it is clear that replacement demand exceeds new demand by far – even under the very optimistic growth scenario on which the projections are based. Therefore, even if the production growth required for the specified employment growth cannot be met, the sector still needs to train relatively large numbers of people in order to replace workers who leave the sector and to contain skills shortages.
The challenge for the MQA is to balance out the prevailing market forces influencing the sector (local and international, political, social, economical and humanitarian) with the achievement of the MQA’s proposed strategic objectives in job creation and skills development in the South African mining sector and create a waterfall effect to the rest of the African continental states. It is therefore a reality that the MQA should, in cooperation with the mining sector tripartite system, advance the efforts of the government to create massive job opportunities for the youth of South Africa.
The demand for skills has been proved without a doubt in the foregoing discussions through effective statistical analysis of various relevant criteria. All that must be done is to take advantage of this opportunity.
This effort will demand commitment from every role-player in the mining sector to make beneficiation work in view of creating a self-help kind of industry. Such an achievement will be recognised worldwide.
The rightful advancement of females in all of the MQA’s occupation groupings should be a priority as the view is held that this is still a massive untapped resource that can benefit the sector tremendously
104

5 THe SUPPLY of SKILLS To THe SeCTor
5.1 INTrodUCTIoN
The main aim of this chapter is to describe the supply of skills to the Mining and Minerals Sector (MMS) as per updated information. The supply of skills is viewed from different perspectives.
Of particular importance is the education and training of professionals, technicians and artisans. In many instances, the training of these occupational groups takes place before the learners take up permanent employment in the sector. It is therefore necessary to ensure that bursary schemes and other incentive schemes are sufficient to provide an adequate flow of learners through the educational system and into the MMS, which is in competition with other sectors for these skills.
It was indicated in Chapter 4 that professional people in particular are recruited and employed by all sectors due to the fact that specialists such as IT and accounting specialists do not need as much industry knowledge.
A third aspect of skills supply that is dealt with in this chapter is the development of skills among those who are already in the workplace. This is also the area where the effects of training interventions add the most immediate value. The profile of the sector sketched in previous chapters clearly indicates the predominance of the occupational categories of machinery operators and drivers, and elementary workers in the sector. These categories of workers are typically trained for their specific positions after entering into employment contracts. Their training thus becomes the primary responsibility of employers. This applies equally to clerical and administrative and sales workers. At the same time, it is critical that all categories of workers stay abreast of changes in the work environment and of health and safety regulations. Consequently, in-service training is a large and important aspect of the supply of skills to the MMS.
From a skills supply perspective, the MQA should ensure a system to maintain the quality of registered unit standards, qualifications and learning provision, including learnerships. Quality assurance is a process aimed, inter alia, at the following:
· Accrediting training providers, · Registering assessors and moderators, · Auditing the quality of learning provision and assessment, and · Certificating learners.
Training providers in the MMS are required to implement the ISO 9001:2008 Quality Management System together with other requirements stated by the South African Qualifications Authority (SAQA) to become accredited as training providers. Details of these requirements can be found in the accreditation of providers section. It must also be noted that the recently established Quality Council for Trades and Occupations (QCTO) is responsible for the development, maintenance and quality assurance of qualifications within its sub-Framework.
Assessors, who do assessment of any mining and minerals registered unit standards, are required, by law, to be registered with the MQA as assessors. Requirements for assessor registration can be found in the assessor registration section.
105

When learners have successfully been assessed against all the unit standards of competence, the MQA is responsible for issuing a certificate for that learner. This certificate will only be issued for qualifications registered on the National Qualifications Framework (NQF)96
According to the National Qualifications Framework (NQF) Act no. 67 of 2008 as amended, the NQF is a single integrated system which comprises of three co-ordinated qualifications sub-frameworks, for-
(a) General and Further Education and Training, contemplated in the GENFETQA Act; (b) Higher Education, contemplated in the Higher Education Act; and (c) Trades and Occupations, contemplated in the Skills Development Act.
The Quality Council for Trades and Occupations (QCTO) was established in 2010 in terms of section 26G of the Skills Development Act, of 1998 as a juristic person. It was listed as a public entity in Government Gazette No. 33900 of 31 December 2010 - effective from 1 April 2010 - to establish the sub-Framework for Trades and Occupations. The QCTO is responsible for the development, maintenance and quality assurance of qualifications within its sub-Framework.
An integral and critical component of the QCTO’s quality assurance system is the issuing of certificates to learners who have demonstrated competence against occupational qualifications and part qualifications registered on the National Qualifications Framework (NQF). The QCTO will play an important role in the development of occupational qualifications in the MMS.
The final sections of this chapter consider the MQA’s interventions to alleviate skills shortages within the sector, as well as the issue of perceptions of inadequate quality of training for the sector.
5.2 CUrreNT SUPPLY
5.2.1 Current employment
The stock of skills available to the sector consists of the people currently employed, as well as those that are unemployed but available for work. The previous chapters gave an overview of the people currently employed in the MMS. According to Table 2.4 above, the majority of the employees in the Sector have a lower educational level as opposed to the minority with a higher educational level. Therefore the skills-mix in the Sector gravitates towards lower skills levels.
Another aspect of the educational profile of the current workforce that needs to be mentioned is the fact that many workers have attained certain skills and literacy levels that are not reflected in their educational qualifications. For this reason recognition of prior learning (RPL) is very important – especially at times when mines are reducing worker numbers and workers have to find employment elsewhere.
5.2.2 Unemployment
The decline in employment that took place over the last two decades created excess capacity in the labour market and left large numbers of previous employees of the MMS unemployed. The March 2001 Labour Force Survey (LFS) recorded almost 140 000 unemployed mineworkers/ex-mineworkers97 As employment
96 http://www.mqa.org.za/97 The term “unemployed mineworker” refers to a person who is currently unemployed, but whose previous work was in the mining industry.The expanded definition of unemployment was used to determine unemployment figures among workers previously employed in this industry. This means that people who were not working and who were available for work, but who were not actively looking for employment in the four weeks preceding the survey (i.e., discouraged work seekers), were included in the definition.
106

increased, the number of unemployed mine workers decreased, and in March 2008, the LFS reported only 30 000 mine workers that were unemployed.
One of the possible reasons why the reduction in employment is not directly reflected in the unemployment statistics is that mines tend to first reduce the number of contractors that they employ, many of whom are foreign nationals who may return to their countries of origin after termination of their contracts.
Figure 5.1 summarises the number of unemployed/ex mineworkers from 2001 to 2013. For the purposes of interpreting the graph, an “unemployed/ex mineworker” is someone who is currently employed and whose previous employment was in the mining sector. In March 2013, the LFS reported 39 000 unemployed/ex mine workers, 18 000 more than the March 2012 figure, but about 2 000 less than the March 2011 figure.
Figure 5.1 Unemployed/Ex mine workers: 2001–2013
406650 416150 433700 450990 444130 456330 495470
518570 499710 479510 498140
524630 523177
137820 128730 118130 129300 114020 90423 76231
30672 31789 45429 41176 21000 39000
Ave employed Unemployed
Source: Labour force Survey 2001-2013
Table 5.1 Unemployed/Ex-mine workers: 2001–2013
Sources for Figure 5.1 and Table 5.1: Unemployment of mine workers calculated from Statistics South Africa, LFSs of February/March 2001 to 2008 and the quarterly LFSs of March 2001 and 2013.
5.3 THe SUPPLY of New SKILLS To THe SeCTor
5.3.1 Higher education and training
The fields of study relevant to this sector have been identified in Chapter 2 as mining engineering, metallurgy, chemical engineering, geology, electrical engineering, mechanical engineering, analytical chemistry, environmental management, mine surveying, and jewellery design and manufacturing. (Computer-aided Design (CAD) is a component of many qualifications in these study areas.) Further information on these speciality areas was also discussed in Chapter 4.
Ave employed
107

Mining engineering is offered at the University of the Witwatersrand, the University of Pretoria, the University of Johannesburg and the University of South Africa. Mine surveying is offered at the University of Johannesburg. The student output in entry-level engineering qualifications (three-year diplomas and first degrees) over the period 1999 to 2012 can be seen in Figure 5.2.
Output, over the past decade, increased substantially in all fields of study, which is viewed as a very positive trend. Table 5.2 shows that in terms of absolute numbers, the output of higher education institutions has grown tremendously and is much better placed to fulfil the demand of the MMS. However, according to the Adcorp Holdings Annual Labour Report as at June 2013 reports of difficulty to fill posts remain. Two key points need to be highlighted in this regard:
· Firstly, the supply pipeline in terms of the amount of experience required for a graduate to become productive is significant and so many of these reports are likely for engineers with a certain level of industry specific experience and knowledge.
· Secondly, there is a growing demand for engineers in other sectors of the economy and the relative attractiveness of the MMS (competing against other sectors) and the South African MMS (competing against global employers) as an employer is also a factor. Anecdotal evidence suggests that a difficult working environment and the rural location of the mines are key drivers in this regard. However, since the rural agenda is high on the government agenda, rural development could be viewed as an opportunity.
Figure 5.2 Entry-level qualifications awarded in the relevant fields of study: 1999–2012
0
1000
2000
3000
4000
5000
6000
7000
8000
1999
2000
2001
2002
2003
2004
2005
2006
2007
2008
2009
2010
2011
2012
Mining Engineering
Metallurgical Enginering
Mechanical Engineering
Geology
Electrical Engineering
Chemical Engineering
Source: Department of Higher Education and Training (DHET), Higher Education Management Information System (HEMIS), Table 2.13, 1999 to 201298
98 Note that the 2012 HEMIS data is the latest available data, i.e., the above figure represents the most recent information.
108

Table 5.2 The supply and demand of engineering occupations 1999 and 2012
Current Employment output 1999 output 2011 output 2012
Chemical Engineering 80 305 1169 1352
Electrical Engineering 347 1225 2567 2579
Geology 1160 97 906 45
Mechanical Engineering 1251 531 1892 2064
Metallurgical Engineering 393 79 367 335
Mining Engineering 1184 148 418 431
Source: MQA data system and Department of Higher Education and Training (DHET), Higher Education Management Information System (HEMIS), 2013
In the MMS, the racial and gender representation among new entrants and the transformation of the occupational fields has changed over time, albeit more slowly from a gender perspective and in some occupations. Table 5.3 below illustrates the population group composition of the graduates who qualified from universities and universities of technology in the relevant fields in 2012. In all fields of study, the majority of graduates were black (African, Coloured and Indian) representing most of the graduates especially in Mechanical Engineering and Metallurgical Engineering). Across all 6 occupations most of the graduates were Black.
Figure 5.3 Population Group Composition of 2013 Engineering graduates
Source: Department of Higher Education and Training (DHET), Higher Education Management Information System (HEMIS), 2013
0
200
400
600
800
1000
1200
1400
ChemicalEngineering
ElectricalEngineering
Geology MechanicalEngineering
MetallurgicalEngineering
MiningEngineering
White
Indian
Coloured
African
M F M F M F M F M F M F
109

Table 5.3 Graduates in Engineering fields 2013
Chemical
EngineeringElectrical
EngineeringGeology
Mechanical Engineering
Metallurgical Engineering
Mining Engineering
M F M F M F M F M F M F
White 175 80 512 37 9 2 778 68 36 12 61 6
Indian 74 91 161 28 1 0 138 24 5 3 4 2
Coloured 40 26 95 10 0 0 99 8 2 0 3 1
African 469 373 1265 433 16 18 748 182 168 109 242 113
Male and Female Total 758 570 2033 508 26 20 1763 282 211 124 310 122
Total 1328 2541 46 2045 335 432
Source: Department of Higher Education and Training (DHET), Higher Education Management Information System (HEMIS), 2013
Figure 5.4 shows the gender distribution of the 2012 graduates. In some of the fields of study, women formed a substantial percentage. In chemical engineering, geology and metallurgical engineering, women formed more than 50% of the total graduates. Substantial numbers of women are also qualifying in electrical engineering (20%) and mining engineering (28%).
Figure 5.4 Gender distribution of graduates* according to field of study: 2013
758 570
2033
508
26 20
1763
282 211 124 310
122
0
500
1000
1500
2000
2500
ChemicalEngineering
ElectricalEngineering
Geology MechanicalEngineering
MetallurgicalEngineering
MiningEngineering
Source: Calculated from DHET, HEMIS, and Table 2.13, 2013.
In the MMS-specific disciplines of mining and metallurgical engineering, both the number of black and female graduates increased steadily over the period 2003 to 2012.
Black and women graduates in mining engineering showed the highest annual growth rates over the period as evidenced in Table 5.4 below
110

Table 5.4 Racial and gender distribution of graduates* according to field of study: 2003–2012
Source: Calculated from DHET, HEMIS, and Table 2.13, 2003 to 2012.
Figure 5.5 Racial and gender distribution of Black and Black female graduates according to field of study 2003-2012
0
500
1000
1500
2000
2500
Chemical Engineering Black
Chemical Engineering Blackfemale
Electrical Engineering Black
Electrical Engineering Blackfemale
Geology Black
Geology Black female
Mechanical EngineeringBlack
Mechanical EngineeringBlack female
Source: Calculated from DHET, HEMIS, and Table 2.13, 2003 to 2012.
The reported shortage of engineering skills in the South African labour market is aggravated by the large numbers of engineers leaving South Africa for better career prospects elsewhere. Government’s Joint Initiative on Priority Skills (JIPSA) (now incorporated into the Human Resources Development Strategy) identified engineering as one of its five priority skills areas, working with engineering faculties at institutions of higher education to increase the number of engineering graduates in the country.
111

A study undertaken by the Human Sciences Research Council (HSRC) found that the engineering skills development pipeline is long and is being negatively impacted on by a number of factors. Fundamental to the challenge of growing the national pool of engineers is the country’s poor quality schooling system, with low enrolment and pass rates, combined with low quality teaching, in the critical subject areas of Mathematics and Physical Science. Engineering faculties also compete with other faculties for enrolments from a small pool of eligible school-leavers, whose demographics are not yet reflective of the country’s population. Poor school preparation, together with other issues, such as increased class sizes, the difficulty some students have in accessing study finance and limited workplace training opportunities that are compulsory for students from the universities of technology to graduate, all contribute to poor engineering throughput rates99
Besides changing the funding formula to tertiary institutions to promote the education of engineers, government’s New Growth Path aims to strengthen measures that promote a greater and more equitable access to Physical Science and Mathematics education at secondary school level and expand bridging programmes to tertiary courses as the primary means to train at least 30 000 additional engineers for the national labour force by 2014100
The South African mining sector competes for engineering skills, not only with other sectors in the national economy, but also with the global mining industry. While the percentage of mining engineering graduates that join the industry is 75% for the USA and 80% for Australia, only 15% of South African mining engineers remain in the industry for a long-term career, choosing instead to move to the higher remuneration options of financial services companies or becoming consultants, contractors or equipment service providers to the industry101 .South Africa also continuously loses general and mining engineering skills to other countries like Australia and Canada who are active recruiters. While the country produces more mining engineers than all other English-speaking countries combined, the supply pipeline is too small and the output still insufficient to counter international losses and at the same time replace the ageing engineering and artisan population. This places the industry at a severe disadvantage in respect of future growth.
Engineering graduates are also a primary feeder into mining management positions. Graduates require up to 15 years of work in the sector before they are sufficiently experienced to serve in any basic managerial capacity. Given this situation, it is increasingly important that the MMS takes a long-term view of the training and development of engineers – not only to meet the direct need for their professional skills in the short- to medium-term, but also to meet the demand for their skills in a managerial capacity in the longer term102
In addition to the above, the Graduate Development Programme should also be mentioned as a skills intervention.
“In the process of forging ahead with skills development initiatives and the transformation of the MMS, the MQA established a Graduate Development Programme in 2005.
The MQA Graduate Development Programme is aimed at increasing the number of technical graduates with the necessary training and qualifications required for professional employment in the MMS.
99 Du Toit, R & Roodt, J. 2009.Engineers in a developing Country: The profession and professional education of engineers in South Africa, HSRC Press, Pretoria.
100 Republic of South Africa. The New Growth Path: The Framework, November 2010.
101 “A combination of factors contributes to engineering professionals leaving the technical environment. The adaptability of engineering skills in many environments, insufficient
incentives, appointment policies, lack of opportunities to get the required experience, lack of continuing professional development, insufficient career paths, underutilisation of engineers
(because of too few technicians and artisans available) in some environments, and under-qualified engineering staff in other environments, such as at local government level because of a
shortage in engineers, all contribute to the migration of technical skills to more lucrative environments.” Du Toit, R & Roodt, J. 2009.Engineers in a developing Country: The profession and
professional education of engineers in South Africa, HSRC Press, Pretoria, 2009, p. 16.
102 Landelahni Business Leaders, Fast Facts. Mining Research Report, 2010: Local mining industry mirrors global skills crisis, http://www.landelahni.co.za/industry_reports/Mining%20
Research%20Summary%20Report%202010.pdf, accessed 18 November 2010.
112

The target group for the programme is young unemployed historically disadvantaged South Africans (HDSAs) who have completed degrees or diplomas in the scarce skills disciplines as identified in the MQA SSP. These include mechanical engineering, electrical engineering, electromechanical engineering, mining engineering, jewellery design and manufacturing, metallurgical engineering, chemical engineering and mineral processing, analytical chemistry, geology, environmental management, mine survey and industrial engineering.
In the interest of presenting a good product to the sector, the MQA put together a task team of industry experts, including experts from the Department of Mineral Resources and organised labour to develop programme requirements for each discipline (i.e., exit requirements, outcomes and the assessment criteria for each discipline).
Candidates are required to complete two years structured with an industry host employer. To date, 110 candidates are placed with different companies in the sector undergoing training. A grant of R165 000 per candidate per annum over the two-year period is made available to the host employer to cover the costs for training, allowances, travel, accommodation, medical cover, unemployment insurance fund, insurance, personal protective clothing, etc. The grant is paid out in advance by the MQA on a quarterly basis provided that:
· A tripartite contract between the MQA, the employer and the candidate is signed
· Quarterly progress reports are submitted to the MQA signed by both the candidate and the employer103
On completion of the programme, candidates are required to find employment in the sector and work for a period that is not less than the period of training. If they cannot find employment within six months of completion, they are released from their contractual obligations.
Bursaries
The MQA has a bursary scheme for tertiary studies. The MQA Bursary Scheme applies to the following:
· Students entering their first year of study who possess a South African matriculation certificate (or an evaluated equivalent qualification) in the subjects and with subject grades that are required by the academic institution (or such equivalent qualification as that the institution may determine) for undergraduate studies.
· Bursars entering their second or third year of study, who meet the requirements as specified under the bursary continuation, suspension and reinstatement principles contained in this policy.
· In addition to the above, students who meet any other entrance criteria as prescribed by the academic institution.
· Students studying towards a university or university of technology qualification (degree, diploma and BTech).
The bursaries awarded over the period 2002 to 2013 in the respective fields of study can be seen below in Table 5.5 Bursaries awarded by the MQA: 2002–2013. The figures refer to the number of awards made per year for studies in that particular year. The total number of awards made over the total period was 3 425. The bursary scheme was discontinued in 2006 and 2007, but re-introduced in 2008.
103 http://www.mqa.org.za
113

Source: Statistics from 2002 to 2005 provided by Career Wise, an institution contracted to administer the MQA’s bursary scheme at that time and, from 2006 onwards, the MQA data system, May 2014.
Many employers in the MMS provide bursaries to their own employees, as well as to students who are not in their employ. These bursaries are viewed as a positive skills development practice.
workplace experience
In addition to the bursary scheme, the MQA has programmes in place that provide work experience for students (the 12-month P1 and P2 practical programmes) that is required by the universities of technology for graduation. The scheme aims to facilitate the provision of P1 and P2 training to students of universities of technology and the provision of vacation work projects for university students. Students have specific requirements which should be fulfilled in terms of meeting certain training objectives on site before they are able to graduate.
The MQA provides a grant of R12 000 per student hosted per month directly to host companies that they then use for the provision of training. The scheme not only allows students to graduate once they have fulfilled all the requirements, but it also allows companies to receive and host students for up to one year at little or no cost while they assess these learners for potential employment after completion of their training.
The MQA Work Experience Scheme has been in place since 2005. During this time, the scheme has grown considerably as more hosts have joined. This scheme provides an excellent window period, where companies
Table 5.5 Bursaries awarded by the MQA: 2002–2013
114

can employ and provide experience to trainees at very little expense with a view to taking them on as employees after graduation. It essentially closes the gap between unemployed graduates and companies facing a skills shortage by allowing the learners to be trained and continually assessed for a full year with no obligation to employ them. To date there has been 2139 learners who have benefitted from the programme.
Table 5.6 Work experience opportunities facilitated by the MQA: 2006–2013
discipline 2008 2009 2010 2011 2012 2013
Analytical Chemistry 12 13 13 6 24 14
Geology and Mining Geology 6 6 50
Electrical Engineering 24 33 77 42 86 96
Mechanical Engineering 37 46 50 56 65 63
Metallurgical Engineering 4
Metallurgy 25 26 70 81 80 51
Jewellery Design 0
Electromechanical 1 72
Mining Engineering 22 29 62 43 115 58
Industrial Engineering 12 2
Chemical Engineering 28 73 95 27 65 81
Mechatronics 15 24
Mine Surveying 7 7 33 3
Environmental Engineering 2 20 4
Engineering-related Design 27
Other 3 4 49
Total 148 220 386 287 673 425
MQA data system May 2014
Internships
The MQA also supports the Work-Integrated Learning (WIL) that is required for university qualification achievement through an internship project.
The MQA internship is aimed at providing structured on-the-job training to unemployed graduates who have completed degrees from universities and diplomas from universities of technology. The Internship Programme was established to increase the number of technical graduates with the necessary training and qualifications required for professional employment in the scarce skills areas of the MMS.
The selection process for the Internship Programme is aimed at identifying graduates in the disciplines considered as scarce skills in the sector, those who are interested in working in the industry, but who have been unable to secure employment, and those who are unable to complete their training due to lack of experience.
115

In addition to the above, companies that host these graduates should have adequate infrastructure, be financially viable, and have sufficient and qualified coaches and mentors in the relevant disciplines to deliver the programme in line with the MQA’s Internship Programme guidelines. Host companies must have their own sites for the practical exposure of learners to the world of work. MQA has constantly increased the number of interns every year with the most interns hosted in 2013. There have been 1484 learners supported on the internship programme since 2013.
Table 5.7 Interns placed in host companies by the MQA: 2005-2013
discipline 2005 2006 2008 2009 2010 2011 2012 2013
Analytical Chemistry 4 14 7 7 1 14 18
Geology and Mining Geology 4 15 26 20 22 43 53 90
Electrical Engineering 4 4 24 2 2 9 40 16
Mechanical Engineering 5 10 15 5 3 6 15 15
Metallurgical Engineering 3 4 11 9 7 28 56 2
Metallurgy 4 12 66
Jewellery Design 1 6 11 28 38 36 53 80
Electromechanical 1
Mining Engineering 3 8 21 1 3 19 40 37
Industrial Engineering 2 6 1
Chemical Engineering 1 5 23 3 2 10 38 47
Methatronics 1
Mine Surveying 1 2 17 8
Environmental Engineering 1 6 6 5 9 45 23
Engineering-related Design 23
Other 4 3 1 86
Total 30 61 159 82 94 163 406 489
MQA data system, May 2014
5.3.2 FET colleges
FET college programmes in engineering have traditionally been very limited and narrow in content as they were designed to meet the demands of manual low-skills, low-wages industries. Because of this, there have been challenges for universities and universities of technology in recognising these qualifications for articulation purposes. Furthermore, as the work experience component of the training cannot be enforced, the uptake of students by employers has been very low.104
In response to the demand of the Engineering Council of South Africa (ECSA) that the FET college engineering education curriculum should be reviewed, the MQA has entered into collaboration with FET colleges with the aim to do the following:105
104 Du Toit, R & Roodt, J. 2009.Engineers in a developing Country: The profession and professional education of engineers in South Africa, HSRC Press, Pretoria.105 Information supplied by the MQA.
116

· Review national certificate vocation (NCV) courses to align them with the mining and minerals industry needs.
· Provide national technical education (NATED) programmes’ theory to support apprenticeships’ delivery mode and access to trade testing.
· Map the NCV with the MQA’s trade qualifications for horizontal articulation and learning pathways.· Add other relevant MQA programmes to the NCV as additional subjects.· Collaborate jointly on the curriculum assessment specifications development for occupational
qualifications.· Consider a form of RPL for learners with NATED trade qualifications, but without language subjects. · Deliver foundational learning.
Thus, while the contribution of FET colleges to skills supply for the MMS has been limited, a multi-pronged strategy by the Department of Higher Education and Training (DHET) is afoot to make FET colleges achieve their renewed objectives and function as high-quality institutions that produce critical middle-level skills and are integrated with the NQF.
Having identified weaknesses in this sector at systemic and institutional levels, immediate-impact interventions have been launched to turn colleges around. Other tactics are planned to take effect in the medium and longer terms.
FET colleges are well positioned to provide the theoretical qualification component of artisan, as well as other occupational training requirements.
The change in FET college management from regional to national government, as well as a set of multi-pronged initiatives that will ultimately see the 50 public FET colleges spread across South Africa achieve the following:
· Offer full qualifications.
· Align programme offerings with local and regional industry needs.
· Ensure effective articulation with both general and higher education.
· Improve programme quality.
· Increase the enrolment of youths and adults.
· Develop and attract qualified, full-time teaching staff.
· Create positive perceptions about colleges as institutions of choice for vocational post-school learning.
Similarly, arrangements for articulation between higher education institutions and FET colleges have been poor, with few learners on vocational programmes progressing directly to higher education. When these proposed changes are fully implemented, the negative perceptions about FET colleges will be a thing of the past.
MQA’s collaboration with FET colleges is covered in more detail in chapters 7 and 8106
106 Information supplied by the MQA.
117

5.4 TrAINING ANd deVeLoPMeNT of THe CUrreNT worKforCe
Companies in the MMS are involved in a range of training and development initiatives that focus on developing the skills of their current workforce. These initiatives both supplement and build on the training that supplies new skills to the sector, and are a critical source of skills supply, particularly for the mining industry. In chapter 4 the key occupations as identified in the Qualifications Framework were listed and the appropriate qualifications discussed. In this section, the intensity of training on these key occupations are shown for each major occupational group on the OFO.
In terms of the specific skills and qualifications demanded by the mining sector, the WSP/ATR data was compared against the MQA Qualifications framework in order to identify the key occupations in the sector, how many people are required and what skills / qualifications need to be obtained in order to qualify.
The MQA is responsible for developing and reviewing the framework for registered and envisaged qualifications, learnerships and skills programmes for the MMS. The qualifications framework is a guideline that presents the range of qualifications, skills programmes and possible learnerships identified by the sector to meet the competency needs in various fields and levels. This qualifications framework represents the efforts of the MQA to integrate education and training into a unified structure of recognised qualifications that encourage life-long learning.
Purpose
The purpose of the framework is to do the following:
· Define various recognition needs at sectoral level within the national framework.
· Provide a quality specification and a basis for the formal recognition of individual ability.
· Provide a common currency for learners, providers and other users, and provide a consistent and transparent basis for comparison of qualifications to ensure that the integrity of the NQF is maintained.
This framework is intended to ensure that the various training and development needs of the sector are addressed at the required levels. The framework will guide the sector on the requirements and opportunities available to learners and workers, and for career planning purposes. The framework will also assist in the planning of skills programmes and learnerships for the sector.107 Refer to Appendix 8 for MQA Qualifications Framework.
According to the WSP / ATR database, there are 715 occupations demanded by the sector. The MQA qualifications Framework shows 36 key occupations representing employees of the MMS sector. The key point that needs to be noted is that the occupations are well covered by mining specific qualifications. Of particular note are:
Managers:
· There are 2 management occupations highlighted in the framework of occupations namely Engineering Managers (933) and Production / Operations Managers (968). Again it is important
107 http://www.mqa.org.za.
118

to note that in addition to the generic occupation related training there are many specific courses that are ideally required for an effective incumbent.
Professionals and technicians
· In addition to the engineering occupations, the following professional occupations are considered key. With safety always of the highest importance within the sector, Safety, Health, Environment and Quality SHE&Q Practitioners play a vital role. Currently there are 1302 employees demanding a number of qualifications surrounding health, hygiene and safety in the mining sector. Mine safety inspectors are of paramount importance.
· Accountants have been identified as a key occupation demanding 573 employees
· Chemical and Mining Technicians are important and the sector currently demands 538 and 621 employees respectively. The qualifications revolve around laboratory testing, sampling, testing and ventilation (mining).
Mining Specific
· Miners, Supervisors, Mining Operators, Drillers, Rock Drill Operators and mining support workers account for 232852 or 40% of all employees. Since these occupations are fundamental to the operations of the sector combined with the fact that the MMS is the sole employer for these occupations, they are obviously a point of focus in terms of developing suitable qualifications and learnerships. This is evidenced by the large number of industry specific and even subsector specific qualifications. Miners alone have 74 qualifications in the occupational framework.
· Processing Operators and various Plant Operators account for a further 17438 (2.6%) employees with qualifications surrounding the operational elements of processing and beneficiation of minerals.
Artisans play a key role in the MMS with a grand total of 14,495 people or 3.0% of employment. Most notable are:
· Rigger (2188)
· Fitter / Turner (4823)
· Mechanical Fitter (3992)
· Millwright (1268)
· Diesel Mechanic (3417)
5.4.1 Managers and Professionals
There are 5 occupations that were highlighted in Chapter 4. Table 5.8 below shows the number of managers
119

and professionals in the sector and the number of programmes that were completed in 2014. Note, while the figure will include individuals that received multiple interventions, the overall figure does give an indication of the training intensity within the sector. For the purposes of this document, intensity is defined as the number of training programmes per full time employees.
As can be seen there is a massive amount of training being conducted in the sector. With the exception of Accountants, the key managerial and professional occupations as per the Framework receive on average between 2 and 6 programmes each per year. These programmes are predominantly:
· Other
· Short Course
· Refresher / Ex Leave Training + Induction
· Certificate
· Operator Licence Renewal
Table 5.8 Number of Managers and Professional and Programmes Completed in 2014
Source: MQA dataset, July 2014
5.4.2 Technicians
There were 5 occupations highlighted in the framework that fall under the 3rd major OFO group. Again training intensity was high with the number of programmes more than doubling the number of employees. Within this group, the most active training types were:
· Refresher / Ex Leave Training + Induction
· Short Course
· Other
· Skills Programme
Operator Licence Renewal
120

Table 5.9 Number of Technicians and Programmes Completed in 2014
Source: MQA data set, July 2014
5.4.3 Clerical and Support workers
There was only 1 occupation identified in the frameworks and that was a General Clerk. Currently there are 6,590 clerks employed in the MMS who received a total of 10,405 programmes equating to a training intensity of 158%. These courses were predominantly:
· Short courses (40%)
· Refresher / Ex Leave Training + Induction (31%)
· Other (16%)
5.4.4 Trades workers
Seven occupations were identified under the 6th OFO major category. Combined they represent 38,238 employees and receive much attention in terms of training and development. On average, each employee accesses at least 2 – 3 programmes. These programmes are made up by:
· Short Courses
· Refresher / Ex Leave Training + Induction
· Operator License Renewal
· Skills Programmes + Job specific development programme
· Certificate
· MQA Learnerships
121

Table 5.10 Number of Trades Workers and Programmes Completed in 2014
Source: MQA data set, July 2014
5.4.5 Plant and Machine Operators
This occupational group is the single biggest contributor to the employment in the MMS. The 13 occupations listed in the framework contribute over 238,700 employees to the sector. There is a criticism in many sectors of the economy that companies tend to focus training away from the lower skilled occupational groups. This however is not the case in the MMS with 406 393 programmes being given to the 13 plant and machine operator occupations. The training intensity ranges from 128% to 354%. The main training types in this group are:
· Short Courses
· Refresher / Ex Leave Training
· Induction
· Other
· Operator License Renewal
· Skills Programmes
122

Table 5.11 Number of Plant and Machine Operators and Programmes Completed in 2014
Source: MQA data set, July 2014
5.4.6 Elementary Occupations
Finally the elementary occupations receive a similarly intense level of training with an average of more than two programmes per employees. The focus of the training tends towards the initial skills required to do a specific job, induction and first aid training. The most common training types for elementary occupations are:
· Short Courses
· Refresher / Ex Leave Training
· Induction
· Other
· Operator License Renewal
· Skills Programmes
· Certificates
123

Table 5.12 Number of Elementary Workers and Programmes Completed in 2014
Source: MQA data set, July 2014
In summary, the MMS conducts a significant amount of training. The type of training tends towards initial skills development, induction training and other short courses. That is not to say that more long term programmes are not being supported but rather the number is relatively low when compared with the high number of employees requiring shorter courses. For example there were 165 employees receiving higher education from First Degree to Doctorate and another 726 employees receiving a Diploma, Higher Diploma, National Higher Certificate or Further Diploma.
Similarly, while the absolute number are relatively low when compared with the total volume of training provided, ABET programmes, workplace experience, internship and learnerships are very important to development of the sector and are discussed in more detail below. Mining overall is a highly regulated sector, and this extends to its training activities. Skills competencies are required by law for practice in many occupations and professions in the sector, with formal qualifications representing competency. Over time, the old mining certification system has been incorporated into the new system of qualifications developed by the MQA.
These qualifications, which are attained through either learnerships or skills programmes, which are comprised of a group of registered unit standards, have been specifically developed by the MQA to support requirements that emanate from the regulations of the Mine Health and Safety Act (MHSA), which prescribes the competency requirements of people in certain positions in the mining industry.
5.4.7 ABET
It should be stated that the MQA fully supports the objectives and aims of ABET. Adult basic education and training is the general conceptual foundation towards lifelong learning and development, comprising of knowledge, skills and attitudes required for social, economic and political participation and transformation applicable to a range of contexts. ABET is flexible, developmental and targeted at the specific needs of particular audiences and ideally, provides access to nationally recognised certificates108
The need for ABET in the MMS has been stated in earlier chapters of this report. In 2009, the educational profile indicated that almost half of the workers in the sector are at qualification levels lower than ABET Level 4. These workers could benefit from ABET programmes.
Employers reported that, in 2010, more than 5 129 workers had completed ABET programmes (at different levels) in that year. This figure is much lower than for 2009. The MQA is currently using a more robust method
108 abet.co.za.
124

than in the past to obtain data of this nature. In 2011, employers submitted individual employee records with all the demographic variables used in the construction of the sector profile, as well as information on the training that those individuals received. This may explain the difference in the ABET figures between 2009 and 2010.
For 2012, employers reported that more than 11 500 workers completed ABET programmes. This is still lower than the 2009 figure, but more than double the reported figures for 2011. Over the longer term, as literacy and basic education improves, the overall number of ABET completions can be expected to decrease. This is indeed confirmed by the downward trend that is clear from Figure 5.6.
Figure 5.6 shows the numbers of ABET learners who completed programmes between 2006/07 and 2011/13
Figure 5.6 Employees who completed ABET: 2006/07 to 2013/14
Source: MQA Source Data 2013
5.4.8 Learnerships
The MQA’s learnerships span National Qualifications Framework (NQF) levels 2 to 4, and are mostly presented by private training providers, which include training centres on the mines. While some learnerships (such as those at Level 2 and 3 for underground hard rock mining, which have essentially replaced the old Blasting Certificate for Scheduled Mines) are targeted at employed miners, a significant proportion of learnerships, especially those focused on artisan training, are targeted at unemployed learners. Learnerships thus provide an important mechanism for the training of new entrants to the MMS.
Figure 5.7 shows the number of learnership enrolments and completions from 2001 to 2013. For the period 2001 to 2009 there is a marked annual increase in the number of enrolments and completions. From 2011 to
06/07 07/08 08/09 09/10 10/11 11/12 12/13 13/142577 4424 2188 5167 1206 3271 438 1513176 4037 2725 3763 1156 3721 923 18682448 2502 2532 3465 1002 2011 847 17061948 2147 2505 3755 1030 1644 866 17491030 1237 1460 2282 825 895 547 1075
125

2013 there is a drop in the entrance and completions of 50 and 20% respectively, and in 2013 there are more completions than entrants, based on more learners completing programmes from previous years109
Figure 5.7 Learnership enrolments and completions: 2001 to 2013
2003 2004 2005 2006 2007 2008 2009 2010 2011 2012 2013
Enrolments 1493 82 8209 62 2420 2003 1689 1905 3737 3857 2575
Comple ons 1213 13 6979 09 2173 1711 7147 07 1423 1442 1827
0
500
1000
1500
2000
2500
3000
3500
4000
4500
Source: MQA data system, May 2014.
Table 5.13 below summarises the number of learner registrations and completions on trade-related learnerships:
109 Information obtained from the MQA’s data system,2014.
126

Table 5.13 Number of learner registrations and completions on trade-related learnerships: 2003–2013
Source: MQA data system, May 2014.
While these learnerships are multi-year learnerships, with significant numbers of learners still in the system and therefore not reflected in the completion figures given in the table above, low trade test pass rates present a major challenge to achieving the various targets set in terms of artisan training.
5.4.9 Certificates of competency
5.4.9.1 Chamber of Mines certificates
In addition to the qualifications developed by the MQA, both the Chamber of Mines and the DMR issue certificates of competency to specific categories of workers, which essentially serve as a licence to practise. The training for and assessment of the Chamber of Mines certificates are administrated by the University of South Africa (Unisa). The number of certificates awarded over the period 2010 to 2013 can be seen in Table 5.14 below. The total number of certificates awarded in 2010 dropped significantly by 37% to 787 in 2013.
127

Table 5.14 Chamber of Mines certificates awarded: 2010-2013
Source: Chamber of Mines, August 2013
5.4.9.2 DMR certificates
The certificates issued by the DMR are generally referred to as government certificates of competency and are prerequisites for the performance of certain functions in mines. These certificates therefore play a very important role in the supply of skills to the MMS. The number of certificates issued from 2000/01 to 2012/13 can be seen in Appendix 6 of this document. The numbers are quite small and did not increase significantly over the time period. The 2012/13 year shows a decrease in the number of certificates issued for both males and female candidates. A major concern for the industry is still the extremely high drop-out rate and failure rate in the assessment of these certificates, which represents a severe constraint to the supply of these critical high-level skills to the sector.
5.4.9.3 Management and supervisory development
Managers and supervisors in the MMS need a combination of industry-specific knowledge and understanding, i.e., technical knowledge of and skills in the functional area to be managed, as well as supervisory and management skills. In most instances, managers and supervisors are drawn from the workforce (and therefore already have technical and functional knowledge) and are developed through combinations of formal training programmes such as MBA programmes, short courses, and in-service training. The following consolidated table (5.15) below demonstrates certification for the period 2000/01 to 2012/13 (Appendix 6 provides detail):
128

Tabl
e 5.
15 C
onso
lidat
ed ta
ble:
Eng
inee
ring
cer
tific
ates
issu
ed fr
om 2
000/
2001
-201
2/20
13
Sour
ce: D
epar
tmen
t of M
iner
al R
esou
rces
, Oct
ober
201
3
129

5.4.10 Development of mining communities
MMS organisations, particularly mines, support skills development programmes in the community, generally as part of the corporate social investment programme or their Social and Labour Plan Local Economic Development (LED) commitments.
Information from the WSP/ATR submissions show that in the 2009/10 financial year, 90 organisations in the sector provided support to 482 skills development projects or programmes. The largest number of interventions supported post-schooling education, schools and learners at school level, small business development, and early childhood development and jewellery projects. Interventions to support HIV/AIDS awareness, home-based care and environmental awareness were also reported110 Many of these programmes formed part of organisations’ Social and Labour Plan contributions.
5.4.11 In-service training
Finally, in-service training also forms a very important component of skills development in the MMS. In-service training spans a wide array of skills areas and skills needs, and takes place through a variety of training methods that range from structured courses offered in classroom-type environments to informal on-the-job training. In-service training is generally not linked to formal qualifications.
5.5 THe MQA INTerVIeNTIoNS To ALLeVIATe SKILLS SHorTAGeS
Since its inception (i.e., prior to the development of the SETA system) the MQA has deliberately intervened to alleviate skills shortages in the MMS. The specific interventions into the occupations that were most often cited by employers in terms of skills shortages and the type of training interventions that received financial and other support from the MQA are listed below.
Apart from bursaries and grants, the MQA has ensured that the necessary qualifications and learnerships were registered. It also has accredited providers, supports the training and registration of assessors and moderators, verifies assessments and awards qualifications. The MQA has also supported the development of learning material in some instances. The publication by the MQA of a career guide, in which scarce skills are flagged, was developed to stimulate the supply-side of the market.
5. 6 THe QUALITY of TrAINING
While the volume of training within the MMS is positive, there is currently great concern in the sector about the quality of training on offer. Quality concerns span a wide range of issues, including the quality of training material and classroom offerings, the qualifications and actual competence of mentors and assessors, the language(s) of instruction and assessment, low throughput rates in critical areas, such as the government certificates of competence, and the high drop-out rates in ABET. These concerns do not only relate to private providers, but also to the public FET colleges, which are set to play an increasingly important role in artisan and other technical training111 These concerns need to be addressed by the MQA and are reflected in the current MQA Strategic Plan.
110 EE Research Focus, Analysis of the WSP and ATRs submitted to the MQA Year 2010/11.111 Viewpoints raised in most of the workshops conducted in preparation of this SSP.
130

5.7 oTHer fACTorS THAT wILL IMPACT oN SKILLS SUPPLY
5.7.1 Rationale
As outlined in paragraph 4.5 of the previous chapter, drivers of change will have an impact on skills demand. It is also important to note that skills supply should be monitored against the supply of skills, especially from a curriculum and training content perspective. It is possible to do a search function to see if key emerging themes are addressed in unit standards and qualifications. As stated, there is a need to extend the skills planning horizon to 2020 and to research drivers of change that will have an impact on required skills.
Note is taken of the SMME assistance already in place. The South African mining industry has shed as many as 300 000 jobs over the last decade. The MQA has set aside funds to support 13 district municipalities in former labour-sending areas to the mining industry for skills development training for former mine workers and their communities. The training programmes are in line with the social plan initiatives and are linked to the district municipalities’ LED programmes. Existing and innovative strategies need to be expanded to provide former mine workers (some of whom are disabled) with needs-driven skills that include ABET and small business development (SMMEs).
The MQA has identified the provision of ABET programmes and business skills training and support to former mine workers as a priority in supporting the Social Plan because of its direct linkage with government’s integrated rural development strategy and its wider reach across all provinces of South Africa. An awareness programme on HIV/AIDS would also be integrated into the training programme.
The MQA has successfully implemented the District Municipalities Partnership Project with NSF funding. During the 2002–2005 financial years, R145 million was spent.
The District Municipalities Partnership Project is intended to support the LED programmes in the district municipalities by providing skills development and support to former mine workers in South Africa. The initiative sought to provide economic growth, poverty reduction and job creation through skills development112
5.7.2 Assessment of learning material
It would be necessary to assess existing qualifications and learning material for compliance with the anticipated future environment.
5.8 CoNCLUSIoN
The downsizing that occurred in the MMS up to 2001, left more than 100 000 workers unemployed. However, most of them were re-absorbed into the industry and, by 2009, the number of unemployed mine workers dropped to approximately 30 000. Retrenchments started to occur again in the first two quarters of 2009, and in March 2010.
The number of new graduates in the fields of study relevant to the MMS grew substantially between 1999 and 2013. The transformation of the higher education sector is also visible in the educational statistics. By 2010, the majority of graduates in all the relevant fields were black. Substantial numbers of women are also
112 http://www.mqa.org.za.
131

graduating in fields of study that have historically been male dominated. It will, however, take time for this transformation to have a significant effect on the pool of professionals available in the labour market.
The skills development provision of the MMS is comprehensive and covers many aspects. The MQA has registered a wide spectrum of learnerships and the uptake of these learnerships is significant. Another important training offering is skills programmes. These programmes provide workers (especially those at lower educational levels) with the opportunity to obtain recognition for some of the skills attained in the work environment. Skills programmes are also important vehicles for training in terms of health and safety requirements.
The most significant challenges facing the improved supply of currently scarce artisan and professional skills to the MMS include the poor quality of secondary schooling, particularly in the areas of Mathematics and Physical Science, the poor image of the sector that does not attract high-quality school leavers, the poor articulation of the FET programme with other qualifications, the difficulties that many HDSA students face in accessing study financing, the difficulties that university of technology students face in accessing the workplace-based training necessary for graduation, the low throughput rates for both artisan learnerships and engineering qualifications, and the extremely high drop-out rates and low pass rates for the DMR certificates of competency. MQA interventions aimed at addressing these challenges span ABET-level training in the workplace, formal collaboration with FET colleges, the development and delivery of the FLC programme, the focus of artisan learnerships on unemployed learners, the provision of bursaries for higher education qualifications, and the development of a career guide for the sector. These interventions will be ongoing throughout the period covered by this SSP. Finally, the MQA acknowledges the challenges faced by the sector in respect of the variable quality of training providers.
Long-term skills requirements need to be further researched to ensure that existing curricula and learning content address these requirements. It is assumed that existing curricula and learning material are not suitable to develop future skills needs and more attention to this sensitive matter is required.
A great opportunity exists for the MQA to ensure quality service standardisation of training providers. It is suggested that the MQA should investigate a position of setting and applying specific criteria to service providers by means of direct assessment, even on a sampling basis. The success with which the service providers succeed will be a reflection of the value that their learners add to the industry. Maybe an approach of internship should be considered, as this will get more commitment from the employer towards such learning programmes.
132

6. SKILLS NeedS of THe MMS
6.1 INTrodUCTIoN
It is widely believed that the development of skilled human resources and the strengthening of the technological infrastructure are two of the key factors in improving the competitiveness of the Mining and Minerals Sector (MMS). It can be argued that the general availability of quality education and the equitable access to new technology are necessary, but not sufficient to enable a South African mining and minerals sector to become and stay competitive in the global market. There is a need to enhance the capacity and effectiveness of the human capital of the sector. There are a number of elements that affect the capacity and effectiveness of the human capital in the MMS. These are education, skills development, training, governance, management capacity, financial resources, service delivery, human resources, and the promotion of knowledge and skills required by the sector to acquire greater prosperity. From a macroeconomic viewpoint, human capacity development is required for better management of the industry, including the ability to mobilise, allocate and utilise human and material resources in a productive manner across different institutions, organisations or companies in the sector. At a micro level, human capacity is very important for different activities across segments of the mining value chain (such as mineral extraction, processing, beneficiation, project management and administration). It is important to take cognisance of these issues in the assessment of skills needs.113
Chapter 4 described the demand for labour in the MMS, while Chapter 5 provided an overview of the supply of skills to the sector. This chapter seeks to bring the discussion of skills demand and supply together in a more structured and interconnected approach.
The first section summarises the skills needs of the sector according to broad categories, as these emerge from the discussions of the previous chapters of this Sector Skills Plan (SSP). These broad categories include core skills (the basic skills necessary for safe and efficient production within the sector), mine health and safety skills, HIV/AIDS awareness and prevention, adult basic education and training (ABET), recognition of prior learning (RPL), scarce skills, historically disadvantaged South African (HDSA) managers, environmental skills, training of retrenched employees, the development of mining communities and communities in labour-sending areas, supporting the development of beneficiation in local areas through skills development, and strengthening government capacity. This section provides a context and framework for the more detailed discussions of the specific skills shortages within the MMS, which is the subject of the second section.
While it is not currently possible to make direct quantitative comparisons between future demand and supply of skills within the MMS, the final section of this chapter presents a qualitative comparison of skills demand and skills supply according to the seven primary occupational groups in the sector. Scarce skill occupations are included for each group, as well as the reasons for imbalances in the marketplace, any special factors influencing the demand for these skills, the main sources of education and training, factors relating to the responsiveness of supply to demand, and any problems related to skills supply that require ongoing attention.
6.2 BroAd CATeGorIeS of SKILLS deVeLoPMeNT NeedS
6.2.1 Core skills
Core skills refer to the skills that are essential for the basic functioning of the sector. These include the
113 Economic Commission for Africa, 2009.
133

skills that new entrants to the sector need in order to safely and efficiently support sector production. Core skills also include the additional skills that workers in the sector need in order to stay abreast of changes, for example the impact of new technology developments. Covering all the basic mining skills, core skill requirements form the bulk of skills needs in the MMS. Depending on the nature of the occupation, these skills can be developed through short courses, learnerships or higher education qualifications. Chapter 5 highlighted the efforts of the MQA and the industry to develop the suitable skills required for the sector. The current gaps as highlighted by employers in the WSP submission is listed under the Scarce Skills section.
6.2.2 Mine health and safety
Part of the core sector skills is incorporating mine health and safety into every aspect of job content and skills training in all job categories. This is the only way that the hazards and risks involved in mine work is to be managed in line with the Mine Health and Safety Act (MHSA), other legislation and in support of tripartite members. Normally, health and safety training includes induction and refresher training, as well as training towards qualifications required for specific positions in the sector. This remains a huge focus for the MMS. As was discussed in the previous chapter, over a third of all training conducted in the sector has to do with induction and refresher training.
The training of mine health and safety officers, health and safety representatives, as well as mine inspectors, is critical, but proved not to be the total solution to accidents and incidents in the mining industry. Attention is required to the terms of Article 22, Chapter 2 of MHSA114
This legal requirement opens up a unique opportunity for the incorporation of occupational health and safety in the MQA’s skills development programme. This will require some “thinking outside the box”, which can add huge value to achieve the “zero tolerance” objective on accidents and incidents in the mining sector.
6.2.3 HIV/AIDS awareness and prevention
Although organisations in the sector have instituted various interventions to curb the spread of HIV infections and to treat HIV-positive and AIDS-sick workers, infection rates remain very high and therefore the sector, with some assistance from the MQA, needs to continue with HIV/AIDS awareness and prevention programmes.
6.2.4 Adult Basic Education and Training (ABET)
Increasing the sector’s basic educational levels also forms part of the sector’s focus to improve its core skills, and is to a large extent the result of ongoing ABET (as shown in Chapter 5). Through the Mining Charter commitments and the Social and Labour Plan requirements, role-players in the MMS remain committed to the improvement of the educational levels of the workers, with ABET remaining high on the list of skills needs.
6.2.5 Recognition of Prior Learning (RPL)
Although many of the workers in the MMS have very little formal schooling and few formal qualifications, most of them have many years of work experience and skills acquired in the work situation. These skills have not yet been assessed in the context of awarding formal recognition of skills.
114 DMR Mine Health and Safety Act 1993
134

Although the assessment of the skills of all individual workers is essential for skills development, there are numerous challenges in implementing such initiatives, especially on the scale required in the MMS. Despite these challenges, RPL remains imperative to the sector and ways of addressing the difficulties need to be found and implemented.
6.2.6 Scarce skills
As the sector’s skills development intermediary, the MQA has two key responsibilities in respect of identifying and reporting scarce and critical skills across the sector. The first is to provide a reliable set of skill shortage signals to the sector. The second is to direct strategic interventions and activities to address these shortages.
In respect of the second, the MQA will implement a set of strategies that will support the development of skills against the identified MMS scarce skills.
For more details about these strategy issues, please follow the discussion in Chapter 7 of this document.
6.2.7 The development of HDSA managers
There is a high skills shortage within the MMS, specifically in the professional, associate professional, and technician and trades worker categories. These shortages are not only the result of general shortages in the labour market (i.e., absolute shortages), but are often related to factors specific to the industry that deter people with these skills from taking up employment in the sector (i.e., relative shortages). These factors include the relative unattractiveness of the mining industry in relation to other industries in the economy, the fact that many mining operations are situated in remote rural areas, and the generally limited supply of HDSAs with the requisite skills necessary to meet employment equity targets. The Mining Charter stresses the need for the development and operational exposure of HDSAs in core and critical skills areas. More often than not, these skills areas coincide with areas in which skills shortages are experienced. Therefore, the MQA’s skills development interventions aimed at the alleviation of skills shortages will focus mainly on the development of HDSAs. This will include Management development of HDSA and entails the development of the technical competencies required in management positions (and thus places a focus on the development of professional skills), as well as the subsequent development of managerial skills.
6.2.8 Environmental skills
The importance of skills that will support sustainable natural resource use and environmental conservation and rehabilitation was emphasised in Chapter 2 and Chapter 4. As these skills are likely to become increasingly important in the future, they need to be incorporated into the skills development priorities and interventions of the MQA.
6.2.9 Training and development of retrenched employees
The training of employees who have already been retrenched or who stand to be retrenched is also a priority for the MMS. It is important to start the training for positions outside the MMS as early as possible before retrenchment, while the workers are still in employment. The main aim would be to provide these employees with skills for life beyond mining, which are in demand in other sectors, and with entrepreneurial skills. In terms of the Social and Labour Plan, employers have a responsibility in this regard. A more realistic approach might be to assist such employees in the MMS as it will save the industry millions in retraining and other related employee costs.
135

6.2.10 Development of mining communities and communities in labour-sending areas
In line with its broader social mandate and in support of sustainable development, it is a priority for the MMS to support the economic and social development of those communities where mining takes place and those based in the main labour-sending areas of the country. In Chapter 2, the close relationship between mining companies and the surrounding communities was explained. By stimulating other economic activities through skills development in the mining communities and in communities from which migrant workers originate, the potential for job creation is enhanced, as well as the potential for absorbing retrenched mine workers into the local labour markets. The opportunities discussed regarding beneficiation should be targeted as a priority in this regard.
6.2.11 Supporting beneficiation in local areas through skills development
The relatively low levels of beneficiation and the fact that most of our mineral production is exported remain a concern to the MMS. Although the bulk of beneficiation activities would fall outside the MMS – for example in the Manufacturing Sector – the MMS needs to support skills development in terms of beneficiation in general and specifically where it ties in with local community development and job creation for retrenched workers of the MMS. The components of beneficiation that fall within the MMS – jewellery manufacturing, diamond processing and aspects of the cement, lime, aggregates and sand (CLAS) subsector – need special attention. Please see the discussion and diagram under the same heading in Chapter 2.
6.2.12 Strengthening government capacity
The DMR is important to the MMS through the various aspects of regulation in which it is involved. In the consultative workshops, the need for a well-resourced and effective department was emphasised repeatedly, while stakeholders requested that urgent attention be given to the skills shortages experienced by the DMR. The DMR itself participated in the SSP development process and outlined its skills needs to the MQA. These skills needs are and will continue to be addressed in the planning period covered by this SSP.
6.3 SCAre SKILLS
There are a number of key drivers of scarcity that have been identified and all data from the WSP submissions reflect one of these drivers as the main reason why a given employers reports difficulty in fulfilling a post. These drivers are:
6.3.1 Absolute scarcity (suitably skilled people are not available in the labour market)
6.3.2 Relative scarcity (suitably skilled people available but do not meet other employment criteria)
Employers are asked as part of the WSP process to identify occupations in which they experienced difficulty in filling. They identified the driver as detailed above and how many posts are affected by the scarcity. Furthermore employers were requested to identify what type of learning interventions they were planning to use to address the skills shortage and at what National Qualifications Framework (NQF) level the interventions would be. Lastly, employers were asked to indicate if they were planning to import the skills from outside South Africa and, if so, the number of people they would bring into the country.
136

The 2014 WSP submission identified 181 occupations that are experiencing shortages affecting 5 328 posts. The list was then narrowed down to a list of the top 25 scarce occupations based on the following 2 criteria.
1. Total Scarcity (the sum of all vacancies identified in the WSP submission for a given occupation). The underlying principle here is that the higher the reported vacancies that are difficult to fill, the greater the scarcity. However, this is dependent on point 2 below.
2. Scarce Intensity: The number of scarce skills identified as a percentage of total employment within the occupation. Rock Drill Operators had one of the highest numbers of vacancies at 412. However, since there are over 28 966 rock drill operators in the sector, the reported vacancies represent only 1% of total employment. Therefore this particular reported scarcity is unlikely to have a significant impact on the sector. Grader Operator on the other hand had only 40 reported vacancies. The difference is that the total employment in the sector is only 515 which means that 8% of posts are reported vacant and are difficult to fill. Finally, there are instances where a specific subset of an occupation was experiencing scarcity but not the occupation as a whole. In these cases, the intensity of the scarce skills was not calculated since the number of employees in the specific subset is not known. For example, there is no shortage within the broader occupation of Mining Support Worker (OFO 831101) but there is a reported shortage on Diesel mechanic and Electrician.
137

OFO Code
Occupation
Specialisation Listed
Absolute - lack of skilled people
Absolute - new or em
erging occupation
Absolute - replacement dem
and
Other
Relative scarce skill - employm
ent equity
Relative scarce skill - geographic location
Relative scarce skill - industry attractiveness
Relative scarce skill - replacement dem
and
Total Scarcity
Total Employm
ent
Intensity
134916
Operations
Foreman (Non
Manufacturing)
Seed
Processing
Plant
Foreman -
134916
714 3 717 168 427%
711302Rock Drill
Operator
Rock Drill
Operator -
711302
372 40 412 28966 1%
734301Crane or Hoist
Operator
Winding
Engine Driver
(Materials) -
734301
273 2 5 3 4 54 341 36059 1%
312102 MinerSinker -
31210273 2 2 7 17 38 97 236 19372 1%
312101
Production /
Operations
Supervisor
(Mining)
Production /
Operations
Supervisor
(Mining) -
312101
58 12 2 18 12 15 43 161 16877 1%
651302 Boiler MakerBoilermaker -
65130273 14 0 15 7 5 132 4107 3%
653306Diesel
Mechanic
Diesel
Mechanic -
653306
60 19 3 11 12 26 131 3287 4%
733208
Mobile Mining
Equipment
Operator
Vacuum
Sweeper
Operator -
733208
44 69 113 4133 3%
Table 6.1 Absolute and Relative scarcity
138

671101 ElectricianElectrician -
67110143 2 1 3 22 27 13 111 6138 2%
711101Mining
Operator
Mining
Operator -
711101
24 22 10 7 6 39 108 33931 0%
652302Fitter and
Turner
Industrial
Mechanician -
652302
49 2 12 19 9 91 3113 3%
132201
Production /
Operations
Manager
(Mining)
Production /
Operations
Manager
(Mining) -
132201
19 14 3 1 5 38 4 85 1299 7%
215101Electrical
Engineer
Electrical
Engineer -
215101
17 34 2 2 10 6 4 75 236 32%
132104Engineering
Manager
Engineering
Maintenance
Manager –
132104
48 2 3 7 1 2 8 71 634 11%
214601Mining
Engineer
Metalliferous
Mining
Engineer -
214601
45 2 12 1 3 5 69 732 9%
651501 RiggerRigger -
65150129 13 1 4 9 11 67 1947 3%
684202 Blaster
Mining /
Quarrying
Blaster -
684202
11 37 14 62 169 37%
671208Transportation
Electrician
Vehicle
Electrician -
671208
36 1 1 3 15 5 61 385 16%
216502 Surveyor
Topographer
and
Hydrographer
- 216502
34 2 2 3 6 9 4 60 1034 6%
139

672105Instrument
Mechanician
Instrument
Mechanician
(Process
Control
Systems) -
672105
46 5 1 4 2 1 59 807 7%
711301 Driller
Drill Rig
Operator -
711301
33 4 6 2 11 56 17428 0%
671202 MillwrightMillwright -
67120237 0 3 16 56 1812 3%
214101Industrial
Engineer
Industrial
Engineer -
214101
39 2 2 2 5 4 2 56 561 10%
214401Mechanical
Engineer
Mechanical
Engineer -
214401
34 2 0 2 11 4 2 55 899 6%
122201
Advertising and
Public Relations
Manager
Media
Advisor /
Manager -
122201
53 53 38 139%
653303Mechanical
Fitter
Mechanical
Fitter -
653303
36 2 4 5 47 3446 1%
311701Mining
Technician
Mine Planner
- 31170136 1 4 3 1 45 756 6%
312202Maintenance
Planner
Maintenance
Scheduler -
312202
8 1 26 6 41 1070 4%
734205Grader
Operator
Grader
Operator -
734205
15 3 20 2 40 515 8%
226302
Safety, Health,
Environment
and Quality
(SHE&Q)
Practitioner
Occupational
Hygienist -
226302
19 0 1 2 6 10 39 1899 2%
Source: MQA dataset July 2014
140

Managers and Professionals
There are 2 managerial occupations identified, i.e. Production/Operations manager (mining) and Engineering manager in the top 25 but there are 5 that fall within the Professionals major grouping of the OFO. They are Electrical Engineer, Mining Engineer, Industrial Engineer, Mechanical Engineer (mines), and Surveyor.
The reasons given by employers focus around:
· Lack of experienced candidates. Therefore the shortage is not merely related to the number of candidates but with the required experience levels. Often this will include specific sub-sector experience such as Diamond Exploration, Open Cast Mining or Underground Mining.
· Lack of specific skills within the occupation. For example mining engineers with explosives experience, shaft geologists, Section Engineers with GCC qualification
· High levels of attrition and turnover. This is largely a symptom of the scarcity rather than a driver but worthy of mention. Where specific skills are in a state of under-supply, the market creates incentivise to move around.
Technicians and Associate Professionals / Clerical and Support Worker
There are 2 identified Technicians and Associate Professionals as well as 1 Support Worker identified in the top 25. They are: Instrument Mechanic, Mining Technician and mobile mining equipment operator.
· Industry attractiveness was not a reported driver. Instead the focus was on replacement demand
· Lampman is a new occupation with a newly registered qualification and therefore there is an identified shortage
· The main driver seems to be related to relevant experience. Examples of reasons given include:
o A lack of practical experience in qualifications
o Specific mining experience
Skilled craft and related trades workers
Eight of the top 25 scarce occupations come from the sixth major OFO group. They are: Diesel Mechanic, Electrician, Rigger, Fitter and turner, Millwright, Mechanical fitter, Boiler maker and Instrument Mechanician.
· Although many of vacancies are due to a reported absolute lack of skilled people with low percentage related to industry attractiveness, there is a shortage of mining specific skills within the broader trade occupations.
· Staff turnover, poaching and market forces are discussed at length by employers but again these are symptoms rather than underlying causes.
141

Plant and Machine Operators and Assemblers / Elementary Occupation
There is one identified scarce occupation within the plant and machine operators. , Mobile mining equipment operator, (OFO 733208). , Mobile Mining Equipment Operator.
· Within OFO 733208 (Mobile Mining Equipment Operator), there are a number of specialised occupations that were identified. This included:
o Trackless Mobile Machine Operator
o Roof Bolter Operator
· Shortage of experience candidates especially when related to specific machinery. SA draglines are different in South Africa and therefore there are supply difficulties for Dragline Operators.
· Shortage of specific skills including Drill & Blast engineers, Reverse circulation percussion drillers, Marine specific skills and Operator Roof Bolter Rig
· Again attrition, turnover and competition in the labour market were mentioned.
6.4 CoMPArING SKILLS dIAMANd To SKILLS SUPPLY
Although the demand projections presented in Chapter 4 are made at the detailed occupational level, a direct quantitative comparison between future demand and supply of skills in the MMS is not possible. In the occupational group “professionals” and to some extent in the group “associate professionals and technicians”, the main source of new supply is the public higher education system. The MMS shares this supply with the rest of the economy.
6.4.1 Occupational group: Managers
In the current period, there have been 2 managerial occupations identified in the top 25 scarce skills. These are Production/Operations manager (mining) and Engineering managers.
The identified drivers of scarcity were
· high replacement demand due to retirement and;
· the need for greater transformation at top management levels
Therefore MQA can continue its focus on tertiary education (including postgraduate management courses), accelerated management development courses and special executive training programmes. In general, training opportunities for the development of managers are sufficient with a possible obstacle that there is limited sector specific training available.
142

6.4.2 Occupational group: Professionals
In 2014, 5 of the top 25 scarce occupations were considered scarce.
It is important to note that the supply of skills chapter shows that there are a fair number of graduates emerging from HEI institutions. On the face of it, it may appear that there should be more than enough of the professionals mentioned. However, there are 2 key forces acting on the supply:
1. Anecdotal evidence suggests a perceived “unattractiveness” of the local mining sector relative to international mining opportunities as well as other sectors of the economy.
There is often a disjuncture between the level of experience in the available candidates and the posts where scarcity is experienced. Therefore the current supply of professional skills may need to be supported by a more structured mentoring / coaching programme where the pipeline of professionals are being developed from graduate to experienced expert. It also needs to be noted that poor scholastic performance results in the limitation of the availability of professionals for the MMS both in terms of their quantity and their quality. This emphasises the two points discussed above.
6.4.3 Occupational group: Technicians and associate professionals
The technicians and associate professionals follow a similar sort of pattern as the professional occupations. The numbers under the Professional group is focused on “Absolute Scarcity – Lack of Skilled People” whereas the scarcity under the Technicians focus on “Relative Scarcity – Replacement Demand”. The underlying driver however based on the qualitative feedback is that the scarcity is due to a shortage of specific experience that is relevant to the function of that particular job. The exception here is that of Lampman which it is an entirely new occupation.
6.4.4 Occupational group: Clerical support workers
The impact of shortages in occupations within the group clerical and administrative staff is not really relevant as this is the easiest demand to fulfil. Sector- and company-specific training for those employed within the clerical support category is generally achieved through in-service training.
6.4.5 Occupational group: Service and sales workers
The demand for service and sales workers in the MMS is also generally met by people with a matric qualification, of which there is an oversupply in the general labour market. Additional in-service training provides the necessary sector- and company-specific training that is required for competence in the workplace.
6.4.6 Occupational group: Skilled agricultural, forestry, fishery, craft and related trades workers
This occupational group includes artisans and as mentioned in the previous section includes 8 of the top 25 scarce occupations. What is most notable is that the primary reason for the scarcity is given as an absolute shortage of skills. This implies an insufficient supply of graduates from training institutions. This however seems inconsistent with what one might expect given the focus placed on artisan training by DHET and other interested stakeholders. Therefore if one digs deeper into the reasons given by employers it again seems
143

more related to a shortage of a specific skill or level of experience within the broader occupation. In this case:
· Riggers with Mining Experience
· Mechanics for Mining Equipment
Based on the information on hand, there perhaps is a need for additional qualifications to be designed for these specialised mining skills or the possibility that the existing qualifications are inadequate.
The occupations in this group tend to be very technical (rather than generic) and the skills tend to relate to a specific operation or piece of equipment. Some of these skills will be commonly used across the MMS and some will be unique to a given operation. In the case of the former, formalised qualifications as a means to supply the required skill is feasible. Dragline Operators for example is a scarce occupation and while there is a level of specialisation required within South Africa (as opposed to an international standard), additional focus on supply will have an effect on the scarcity. That latter on the other hand relies almost solely on in house training and continuous development.
There are occupations in the 2014 submissions where the scarcity is actually being experienced in a subset of the 6 digit OFO occupation. For example there is no real shortage within Crane / Hoist Operators but employers did identify “Winch Operator” as a scarce skill. This is an important point because there might be sufficient supply of the general skills for an occupation but insufficient supply of a certain speciality within that occupation. Therefore skills planning (even at the 6th digit OFO level) may not always present the optimal findings in terms of matching supply and demand. This would become clearer through a skills audit process where individual occupations and skills profiles are mapped and measured.
Higher levels of literacy are considered necessary to improve the overall health and safety of this group, with education and training initiatives focusing on learnerships, skills programmes, in-service training and ABET. Skills programmes, in particular, are well suited to the needs of the sector as they address necessary technical skills, and health and safety skills in a work environment that in reality provides little time for training. There has thus been a large uptake of skills programmes concurrent with large-scale involvement in ABET across the sector. Despite this, ABET suffers from high drop-out rates and the impact of ABET is still slow. Finally, the critical need to formally assess and recognise informally acquired knowledge (through RPL) remains.
6.4.7 Occupational group: Elementary workers
Skills programmes, in-service training, and ABET are the primary means through which an increase in literacy levels is sought, with the sector involved in these initiatives on a relatively large scale. It needs to be noted that even though the category implies predominantly unskilled work, there are occupations that require specific mining competencies. The supply of these skills will mostly be generated in house but there is scope for formal training as well.
SCArCe SKILLS IdeNTIf Ied BY STAKeHoLder CoNSULTATIoNS
MQA held stakeholder consultation sessions from 17 June to 20 June 2014 in the provinces of Gauteng, Limpopo, Free State, Mpumalanga, North West, Northern Cape and Eastern Cape and the delegates identified the following scarce skills:
144

Table 6.2 Stakeholder scarce skills identification
Electrical Foreman. Need heavy current. Winder ElectriciansDiesel Mechanic Electrical Engineers Boilermaker Draughts person Millwright Surveyor Production/0peration supervisor Winch operatorMining supervisor Rock engineerMultiskilling GeologistComputer aided designer – skills gap for plumber and electrician
Lubricator chemist/analytical
Blaster Metallurgical engineerKiln Burner Mining underground training officerCommunication Coordinator Learning material developersGeo-technical Quality control officersInstrument technician Mining environmental safety officersRigger and Ropesman Mining certificates – Need competenciesGoldsmith Rock mechanicMining engineer L&D Practitioners
Diesel mechanics
Source: MQA dataset July 2014
6.5 CoNCLUSIoN
While data and other constraints prohibit a direct quantitative comparison of the future demand for skills within the MMS to the future supply of such skills, a qualitative analysis does, however, provide useful and directive information.
There were clear trends emerging from the 2014 scarce skills submissions. They are:
· Scarcity as highlighted in the 2014 WSP submissions is rarely related to an absolute shortage of available people with a given qualification but rather due to a specific skill or experience that is lacking in the labour market. This includes mining specific versions of certain skills
· Scarcity can be felt in an occupation where there is more than enough candidates (over supply) but a subset or specialisation has not been adequately addressed by the labour market.
· The lack of experience is a key driver of scarcity. Therefore initiatives to transfer skills within the workforce and expose graduates to relevant work will develop a pipeline of skills within the identified occupations.
· High turnover and poaching is often cited as a driver of scarcity rather than a symptom.
It needs to be made clear that these trends are derived from feedback to the scarce skills requests in the WSP and do not necessarily translate to the broader labour pool for skills in the MMS.
145

7 STrATeGIC IMPerATIVeS
7.1 INTrodUCTIoN
The MQA is expected to facilitate the delivery of sector-specific skills interventions that help achieve the goals of the National Skills Development Strategy (NSDS) III, address employer demand and deliver results. Following the release of the NSDS III in January 2011, numerous important developments have taken place to give effect to enhancing skills development in the country. The Green Paper for Post-school Education and Training, released in April 2012, outlines a vision for the post-school system and proposes measures to improve further education and training (FET) colleges, higher education and training (HET) institutions, work-based learning, state institutions and the regulatory environment. The occupational learning system is progressing with the Quality Council for Trades and Occupations (QCTO) having published various policies, including policies on development quality partners (DQPs), assessment quality partners (AQPs) and curriculum and assessment.
The White Paper 4 No. 37229 Government Gazette, 15 January 2014 sets out strategies to improve the capacity of the post-school education and training system to meet South Africa’s needs. It outlines policy directions to guide the DHET and the institutions for which it is responsible in order to contribute to building a developmental state with a vibrant democracy and a flourishing economy. Its main policy objectives are:
· A post-school system that can assist in building a fair, equitable, non-racial, non-sexist and democratic South Africa;
· A single, coordinated post-school education and training system; · Expanded access, improved quality and increased diversity of provision; a stronger and more cooperative
relationship between education and training institutions and the workplace; · A post-school education and training system that is responsive to the needs of individual citizens, employers
in public and private sectors, as well as broader societal and developmental objectives.
According to the White Paper 4, the SETAs have a crucial role to play in facilitating such workplace learning partnerships between employers and educational institutions.
The roles of the SETAs and the NSF will be simplified and clarified, and their capacity built in line with their core functions. SETAs will focus on developing the skills of those in existing enterprises and the development of a skills pipeline to such workplaces. Their focus will be narrowed to engaging with stakeholders in the workplace, establishing their needs, and ensuring that providers have the capacity to deliver against these. The NSF will be responsible for skills development aligned to national development strategies and priorities, including building linkages within the skills system and providing funds for government strategies such as youth programmes, building small businesses and cooperatives, and rural development. It will also fund research and innovation that is not confined to a particular sector.
The DHET will consolidate initiatives towards developing a central skills planning system. It will establish a planning unit that will work with key public institutions to develop a national skills planning system. The SETAs will supply sector-specific, reliable quantitative data to the national central planning process, engage with key stakeholders to test scenarios that emerge from the central skills planning process, and plan to
115 The White Paper 4 No. 37229 Government Gazette, 15 January 2014
146

support provision in priority areas. The DHET, with the SETAs, will use the national and sectoral information on skills demand to plan supply115
Various Skills Development Act and Skills Development Levies Act regulations, such as those on grant regulations, learning programme regulations and the listing of occupations as trades, are in the process of being revised or have already been updated. As new developments unfold, the MQA is making the necessary adjustments.
This chapter represents the core of this SSP: In essence it presents the action plan for the MQA in respect of skills development in the Mining and Minerals Sector (MMS) over the period 2011–2017, but with specific reference to the strategic objectives set for the 2014/15 financial year. Considerable attention is also dedicated in this chapter to linking the MQA’s planned interventions with various national policies and strategies. The ways in which this Sector Skills Plan (SSP) will contribute to the national skills development agenda are also highlighted.
7.2 SeCTorAL CoNTrIBUTIoN To STrATIC AreAS of foCUS for NedS 111116
This section focuses on the contribution of the MMS (through this SSP) to the strategic areas of focus for the NSDS III. The section starts with the seven key developmental and transformational imperatives that will guide the NSDS and against which the NSDS will be measured. The way in which the MMS will focus on and the contribution that the MQA will make with regard to these imperatives are first discussed. This is followed by a tabular alignment of the MQA’s goals and objectives, as reflected in the Strategic Plan, to the NSDS III goals, outcomes and outputs.
7.2.1 Key developmental and transformation imperatives
a) Race
As mentioned in previous parts of this SSP, the correction of racial imbalances is an important component of the Mining Charter and the integrated transformation processes that are currently implemented in the MMS. In support of these initiatives, the MQA programmes and projects will have a strong focus on the training of HDSAs – especially in the occupational categories in which they are underrepresented (such as managers). The MQA records and reports on its learners in terms of the racial categories prescribed by employment equity legislation.
b) Class
The MMS is one of the largest providers of employment to people with low levels of formal education. The huge emphasis that is placed on ABET and the development of core industry skills should provide access to education and training to people who were previously excluded from such opportunities. It is suggested that this sector’s contribution in terms of this aspect of equity should be measured and reported on in terms of the level of education of the employees in the sector, as well as the numbers of workers within each occupational category as defined by the Organising Framework for Occupations (OFO)117
116 The comments and targets stated in this section are referenced to the detailed MQA Strategic Plan Implementation Schedules as reflected on pages 12 to 17 of the MQA Strategic
Plan for 2011-2012.
117 It may also be useful to monitor wage differentials in the sector. However, at this stage, such information is not available.
147

c) Gender
Another imperative set in the Mining Charter is the increased numbers of women in mining. The sector profile presented in Chapter 2 clearly shows the progress made in this regard. The MQA has in the past supported women’s entry into the sector and will continue to do so in the planning period. It will also report on its learners in terms of their gender. The MQA will strive to ensure that at least 10% of all learners on MQA programmes are women, as this is consistent with the targets set by the MMS.
d) Geography
The NSDS III places special emphasis on skills development that will support the economic development of rural areas. As mines are generally situated in rural areas (labour-sending areas as well as mining areas), the MMS is intensely involved in rural development. Conversely, mine closures or the downscaling of operations has a profound negative effect on rural development and on unemployment in rural areas. It is for this reason that mining companies are bound to the submission of a Social and Labour Plan to the DMR. As indicated in Chapter 2, these plans have to include local economic development programmes that focus on how the mine or production operation will address the socioeconomic needs of the area within which it operates and the area from where it sources its workforce. The plans also have to include processes to address situations that may negatively affect the employment of workers – i.e., processes that will mitigate the effect of possible downscaling or job losses at the operation. The MQA’s role is to provide access to, information on and general support regarding learning programmes to be utilised in these processes.
An increased focus is on skills for rural development to support government’s prioritisation of rural development. The MQA will support the process for mine community development through support for a customised mining community capacity-building programme aligned with municipal LED plans. In addition, the MQA will support learners in rural mining community schools with additional Mathematics and Physical Science tuition so that acceptable results are obtained in their matric year. This will contribute to an acceptable pipeline for careers within the industry and the nation at large. The MQA Board, at its sitting in February 2012, gave an in-principle approval to establish a provincial presence in five identified provinces: Limpopo, Free State, North West, Northern Cape and Mpumalanga. Inroads have been made in the following areas in terms of engagements and investigation: Northern Cape (Kgalakgadi), North West (Brits/Rustenburg/Modikwa), Free State (Goldfields in Welkom) and Mpumalanga (Siyabuswa in Nkangala District).
The physical presence of the MQA in these mining provinces will also be aligned to the strategy of government, which requires SETAs to be located at public FET colleges.
The MQA has provided for offices in the following provinces:
· North West – Orbit FET College, Mankwe· Free State – Goldfields FET College· Mpumalanga – Nkangala FET College· Northern Cape – Kathu FET College· Limpopo – Sekhukune FET College· Eastern Cape – King Hintsha FET College
e) Age
Most of the learning programmes supported by the MQA focus on the youth. Learners’ ages are recorded by the MQA and reporting can take place in terms of the ages of learners.
148

f) Youth assistance with employment
The MQA is currently using all its funded learnerships (artisan and non-artisan), workplace experience and work-integrated learning programmes, bursaries and internships to assist the youth with placement at mining companies. The placement of learners with host employers is inextricably interwoven into all MQA programmes. All MQA-funded graduates exit the learning programmes with workplace components embedded in all their programmes. The unemployed MQA graduates are further assisted through an internship programme to acquire competences and skills legislated in the schedule of competencies under the MHSA to sit successfully for specified government certificates of competence (GCC).
The MQA’s strategy with regard to supporting youth development in order to contribute towards reduced levels of unemployment will focus on the following:
· All unemployed learners for artisan learnerships, non-artisan learnerships, bursaries, internships and HET work placements for graduates will be supported through the MQA’s discretionary funding mechanisms.
Labour Appeal Court president, Judge Basheer Waglay, highlighted the issue of youth unemployment and raised concern that South African youths found it very difficult to secure employment of any kind. He noted that a joint attempt by youth organisations, government, business and labour would be required to tackle the issue. The partnership would have to work towards improving the skills of youth, improving their work exposure through internships, apprenticeships and open days, and creating jobs. “The Youth Employment Accord provides for businesses and government to set aside jobs for young people and to give a substantial number of all new jobs created to the youth. This is one initiative I hope will be thoroughly supported,” Judge Waglay said. While there had been a small increase in employment in the first quarter of 2013, the number of unemployed people has increased even more. There were 4.6 million unemployed persons in the South African labour market and, of these; about 2.3 million were discouraged work seekers. At the end of March, unemployment in South Africa was at 25.2%, while youth unemployment was at 41%. The International Labour Organisation’s Global Employment Report of 2012 indicated that 400 million jobs would be needed over the next decade to avoid a further increase in global unemployment. The MQA is committed to its role of job creation in South Africa.
g) Disability
It is acknowledged that the MMS, because of the nature of the work, high accident rates and high prevalence of occupational diseases, contributes to disability in the country. However, the sector is committed to the reduction of accidents that cause injury and mortality and the reduction in the prevalence of occupational disease such as tuberculosis, silicosis and noise-induced hearing loss. This commitment was formalised and reiterated at the various health and safety summits held by stakeholders over the past decade.
The retention and retraining of people who become disabled for their original occupations through exposure to the work environment also remains an important objective for the sector. The MQA reports on all learners with disabilities in all of its programmes.
149

h) HIV and AIDS
The MMS is aware of the high HIV-infection rate in the sector and the fact that it is an above-average contributor to the national infection rate. As mentioned in Chapter 2, many of the mines have instituted HIV-awareness programmes and testing and antiretroviral treatment programmes that enable workers to continue to work and to remain economically active. HIV and AIDS awareness will remain part of the educational agenda of the MMS. The MQA will analyse and report on the number of programmes on the MMS Qualifications Framework for the sector, which includes HIV- and AIDS-awareness learning material. Furthermore, the MQA will encourage the inclusion of programmes that support HIV- and AIDS-awareness and prevention in its qualifications.
An additional national imperative is recognition of prior learning (RPL).
i) Recognition of prior learning (RPL)
The MQA has identified RPL as a strategic initiative to fast-track artisan development within the MMS. The MQA Education and Training Quality Assurance (ETQA) Committee has approved an RPL Implementation Framework for the MMS. In order to pilot the implementation of RPL in the mining industry, the MQA commissioned a pilot RPL study for artisan or engineering aides with five mining companies to collectively register a total of 100 artisan aides on mining-designated engineering programmes. The pilot has revealed that the training of artisan aides in the mining industry is competency- and assessment-based and not time-based. Secondly, there are no formalised OFO codes and definitions for artisan aides in the mining industry. Different mining companies use their own internal or in-house programmes to train the artisan aides. Learners who complete these programmes successfully are awarded an internal company certificate which is equivalent to NQF Level 1. Successful learners are then registered on a formalised National Certificate in Engineering Maintenance, at NQF Level 2. Companies require that learners obtain the requisite N2 certificate from an FET College in order for qualifying learners to be registered on the relevant MQA artisan learnership at NQF levels 3 and 4. The MMS Standards Generating Body (SGB) has approved the Seven-step Artisan Development Process, which includes RPL for the training of artisans in the mining industry, and the necessary alignment is taking place.
Based on the results of the pilot, the MQA Board approved an Artisan Aides/RPL Project for employed engineering workers in the mining industry. An estimated target of 500 has been set for the 2013/14 financial year. The MQA reviewed the artisan aides’ data in line with the WSP/ATR submissions that were due on 30 June 2012 to determine the appropriate and accurate target setting. Through the pilot study, three programmes have been identified, namely the Artisan Aides programme (NQF Level 1), Maintenance Operator (NQF Level 2) and Artisan Learnerships (NQF levels 3 and 4), including RPL.
150

7.2.2 NSDS III Goals
The following diagram represents the NSDS III contents:
figure 7.1 NSdS III goals
The above diagram also specifies what NSDS III SETA achievements must be achieved and measured.
Refer to Appendix 9 for the MQA’s alignment of skills development priorities and its objectives and qualitative targets to the NSDS III goals alignment to the NSDS III objectives.
7.3 SeCTorAL CoNTrIBUTIoN To THe PreSIdeNT`S oUTCoMeS APProACH To PLANNING GoVerNMeNT`S worK
The MQA fully supports and endorses the President’s outcomes approach to planning government’s work, as is evidenced by the detailed Strategic Plan and Annual Performance Plan of the MQA. Although there is no skills implications and role for the MQA for the implementation of the President’s Outcomes, the MQA management and Board continuously monitor and report on progress against the MQA’s Strategic Plan.
Through the implementation of the Strategic Plan, the MQA will contribute directly to the Presidential outcomes for the Minister of Mineral Resources and the Minister of Higher Education and Training.
151

7.3.1 MQA’s contribution to Presidential outcomes for the Minister of Mineral Resources
The MQA will (albeit indirectly) contribute to the outcomes of the Minister of Mineral Resources. The specific contributions will be outlined once more detail regarding these outcomes is made available to the MQA.
The following Presidential priorities, among other issues, need to be kept in mind when stakeholders formulate strategic decisions.
Creating decent jobsThe Department of Labour seeks to register 600 000 work seekers by 2013 using the Public Employment Services (PES). The Department plans to procure a set of buses that will roam the country to register job seekers. This will form part of a campaign to ramp up and keep up-to-date national data of job seekers. The Minister of Labour, Mrs Mildred Oliphant, introduced the concept of a Jobs Fair as a first step towards building a working relationship with social partners and providing a link between job seekers and potential job opportunities. The Mid-term Review Report, released on 1 June 2012, indicates that although government has not created sufficient jobs to meet the demand, significant advances have been made in the coordination of growth strategies, the New Growth Path and stakeholder agreements. Government has made progress with labour, absorbing industrial development strategies into manufacturing, mineral products, procurement reform and the Jobs Fund.
Budget for jobs
Job creation remains a central priority of government, Minister of Finance, Pravin Gordhan, said in the Budget Speech for 2012. He provided an additional R4.8 billion over the 2012 MTEF period for the Expanded Public Works Programme (EPWP), bringing its allocations to a total of R77.8 billion.
· The community work programme received an additional R3.5 billion, which gives it a total of R6.2 billion, enabling the number of people employed to increase to 332 000 in 2014/15 from 90 000 in March 2011.
· Working for Water and Working on Fire received an additional R1.1 billion (a total of R7.7 billion), providing for a total of 135 000 jobs over the medium term.
· The non-state sector programme received an additional R345 million (a total of R1.1 billion). · The National Rural Youth Service Corps received an additional R200 million (a total of R900 million)
over the next three years. · An amount of R300 million was added to the arts and culture sector for job creation.
Looking back on 2011 in his State of the Nation Address on 9 February 2012, President Jacob Zuma said that the results of the jobs drive were encouraging, although South Africa was not out of the woods yet, given the global economic situation. In Government’s Year of Delivery 2011/12, produced to coincide with the State of the Nation Address, government looks back at the achievements regarding job creation.The National Development Plan, released in August 2012, proposes the creation of 11 million more jobs by 2030, among others, by expanding the Public Works Programme, lowering the cost of doing business and costs for households, and helping to match unemployed workers to jobs.In the mid-year Lekgotla of 26 to 28 July 2011, Cabinet adopted a 12-point Implementation Plan on job creation, within the ambit of the New Growth Path. This does not mean that other programmes will be halted. These areas are being singled out because they are urgent and effective.
152

The drive to create jobsPresident Zuma announced in the State of the Nation Address for 2011 that all government departments will align their programmes with the job creation imperative. The provincial and local government spheres were requested to do the same, and 2011 was declared a year of job creation through meaningful economic transformation and inclusive growth.The 2011 Budget proposed a range of measures to accelerate employment creation over the period ahead, including R9 billion that was set aside over the next three years for a Jobs Fund to co-finance innovative public and private sector employment projects. The Presidential Job Summit on 18 March 2011 created an opportunity to explore the role that the business sector can play in achieving key deliverables of government’s job creation plans. This was followed by a Presidential Labour Summit on job creation on 19 April 2011. The parties involved agreed to take these issues forward. In the first phase of discussions, the focus was on immediate deliverables that can be rapidly implemented, and laying the foundation for deeper dialogue on the systemic and structural issues that would need to be addressed to achieve the goal of five million new jobs by 2020. In the State of the Nation Address for 2011, President Zuma said that research had indicated that jobs could be created in six priority areas:
· Infrastructure development
· Agriculture
· Mining and beneficiation
· Manufacturing
· The green economy
· Tourism
Improve the quality of basic education
“Our intensive focus on education is paying off,” President Jacob Zuma said in his State of the Nation Address of 2012.
A major achievement in 2011 was the doubling of Grade R enrolment, from 300 000 in 2003 to 705 000. President Zuma said South Africa appeared poised to meet the target of 100% coverage for Grade R by 2014. Per capita spending on Grade R increased from R2 158 in 2008/09 to R3 109 in 2009/10.
Government’s Year of Delivery 2011/12 details the achievements in education in 2011/12.
Despite challenges, there is progress in education. The system is more equitable and pro-poor than it was before 1994, Minister of Basic Education, Angie Motshekga, said at a media briefing on 17 February 2012.
South Africa has a relatively stable schooling system that has extended the right to basic education to over 12 million learners in about 24 365 public schools by employing no less than 365 447 educators.
Achievements for 2011/12 include the fact that, in less than three years ahead of the 2015 target, the Department of Basic Education (DBE) is set to fulfil the Millennium Development Goals on expanding access to education.
Minister Motshekga set out the focus in basic education for 2011 as Triple T: Teachers, Textbooks and Time. In the State of the Nation Address of 2011, President Zuma reiterated the call that teachers must be at school, in class, on time, teaching for at least seven hours a day. The administration must ensure that every child has a textbook on time, and that teachers are assisted to create the right working environment for quality teaching to take place.
To track progress, annual national assessments in Literacy and Numeracy, that are internationally benchmarked,
153

are set for grades 3, 6 and 9.
Teacher training, especially in Mathematics and Physical Science, is another goal. The DBE is strengthening the campaign to attract young people to the teaching profession through the Funza Lushaka bursary programme.
The Department is committed to improving the literacy and numeracy skills of all learners, with specific targets set from now until 2014. A key part of this strategy is the introduction of workbooks for every learner. In 2011, around six million learners received high-quality workbooks. Some 24 million books were provided in all South African languages and in 2012 the National Workbook Programme was extended from grades 1 to 6 to grades 7, 8, and 9.53 million books are distributed to learners, free of charge.
The School Governing Body elections from 1 to 31 March 2012 provided an opportunity for parents to get involved in the schooling of their children.
Create a skilled and capable workforce to support an inclusive growth path
The focus of higher education is on expanding access, especially for children of the poor. This includes the conversion of loans into bursaries for qualifying final-year students.
The DHET has launched a campaign – Kheta Apply Now! ZZ to encourage the matriculants to apply early to the post-school institution of their choice in order to ensure that they are placed.
Significant progress has been made in turning around South Africa’s adult education system with enrolment figures reaching 233 000 in 2012. The Mid-term Review Report, released on 1 June 2012, also notes that the DHET had increased access to higher education programmes by expanding spaces and options available at FET colleges and universities.
In his 2012/13 Budget Vote Speech, Minister Blade Nzimande announced that an amount of R499 million had been allocated to all universities for teaching development grants to assist in improving graduate outputs, and R194 million for foundation programmes to improve the success rates of students from disadvantaged educational backgrounds.
Over the next two years, R3.8 billion has been earmarked for universities’ overall infrastructure development, prioritising historically disadvantaged institutions. Two new universities are envisaged for Mpumalanga and the Northern Cape.
FET colleges are at the centre of skills delivery to drive the South African economy, thereby reducing unemployment and improving the livelihoods of millions of South Africans. Government has invested resources in public FET colleges to ensure that they deliver quality higher education and become institutions of choice for learners, parents and employers.
The Green Paper on Post-school Education and Training was published for public comment and consultation early in 2012. The Green Paper provides a vision for the post-school education and training system, and sets the foundation for building a coherent system and a broad policy for the following:
· Expanding post-school provision to improve access
· Strengthening institutions to improve quality
· Setting out a vision and pathways for achieving a coherent post-school system with articulation, collaboration and coordination between the different components, as well as alignment between education and training institutions and the labour market
· Establishing a post-school education and training system that is equitable, accessible and affordable to all sections of the population, including free education and training for the poor
The National Development Plan, released on 11 November 2011, proposes, among others, to do the following:
· Increase the number of university graduates and the number of people doing their doctorates
154

· Build two new universities in Mpumalanga and the Northern Cape
· Build a new medical school in Limpopo and a number of new academic hospitals
· Extend the length of first degrees to four years on a voluntary basis
· Provide full funding assistance covering tuition, books, accommodation and living allowance (in the form of loans and bursaries) to deserving students
· Grant seven-year work permits to all foreigners who graduate from a registered South African university
Youth Development
Government has established a range of support programmes and strategies to empower the youth in the various sectors, such as the following:The Minister of Arts and Culture, Paul Mashatile, reported in his budget vote speech for 2012/13 that as part of the Mzansi Golden Economy Strategy, a number of high impact programmes targeting youth and women in the arts have been identified. These include the following:The Indoni, My Heritage My Pride programme, which aims to provide young people with life skills training, education and encouragement in appreciating who they are, their heritage and their culture. The Trendsetter Initiative, through which the Department encourages youths to participate in the arts and thus contribute to the development of their communities. The Public Art Programme, skilling young people and employing them to beautify their communities using their artistic abilities. The Emerging Creative programmes, providing an opportunity for 40 young designers to showcase their designs alongside established designers at the Design Indaba in Cape Town.
· An EPWP initiative sees young people involved in the refurbishment, rehabilitation and maintenance of community infrastructure across the country.
The following learnerships and internships are focused on raising the skills capacity of young people through SETAs:The National Rural Youth Service Corps Programme aims to enhance skills development by providing unemployed youths in the rural areas with opportunities to work in their communities and to be trained to provide the necessary services for local socioeconomic development. A total of 7 398 youths were enrolled in the programme in 2010. The enrolment number will gradually increase by recruiting a further 5 000 youths during 2011/12, and a further 10 000 during 2012/13.The Western Cape Provincial Government has several initiatives for young people. The Gauteng Provincial Government announced the following youth employment programmes for 2012: a Youth Placement Programme, Township Enterprise Hubs and a Youth Entrepreneurship Development Programme (Y-Age).
National Youth Development Agency
The National Youth Development Agency (NYDA) is a government agency, whose role it is to initiate, facilitate, implement, coordinate and monitor youth development interventions aimed at reducing youth unemployment and promoting social cohesion.
The NYDA’s mandate is to do the following:
· Advance youth development through guidance and support to initiatives across all sectors of society and spheres of government.
· Embark on initiatives that seek to advance the economic development of young people.
155

Develop and coordinate the implementation of the Integrated Youth Development Strategy for the country.
Government services for the youth
Government has a number of services that benefit the youth.Youth camps: In its effort to launch projects that provide the South African youth with opportunities for experiential learning, the National Youth Camps Project took place from 29 September to 5 October 2012. Personal identification: It is essential to have an identity document when you want to register for writing the matric exams or getting a drivers licence. Youths are therefore encouraged to apply for an identity document and to get citizenship by descent.Voting: Youths can register on the national voter’s roll when they are 16, but may only vote once they have turned 18. Youths are therefore encouraged to register to vote.
· Driving: Youths can get a drivers’ licence at 18. They are therefore encouraged to get a learner’s license, and then a driver’s license.
Tertiary education
Tertiary education is becoming more important. Government supports students who cannot afford the fees. Youths are therefore encouraged to enter to study and apply for funding, to register with a tertiary institution, to apply for financial assistance with the National Student Financial Aid Scheme (NSFAS) or to apply for the Funza Lushaka Bursary scheme.
Employment
Once youths have completed their education, they need to start looking for a job. They can find information on employment opportunities and vacancies in government, get an application form for a position in government, find information on other employment opportunities, apply for a work permit or visa for South Africa, write a winning CV, look for opportunities on a job seekers’ database, and apply for an internship.
Tax
With a job comes the responsibility to pay tax: Citizens are encouraged to register as taxpayer and to submit tax returns online.
7.3.2 MQA’s contribution to Presidential outcomes for the Minister of Higher Education and Training
The Minister of Higher Education and Training is accountable for Outcome 5: A skilled and capable workforce to support an inclusive growth path, which has the following five outputs and measures:
Establish a credible institutional mechanism for skills planning
· Develop a standardised framework for the assessment of skills shortages and vacancies in the country.
In support of Output 1, the MQA has submitted an SSP to the DHET that is well-researched and supported by stakeholders, including government’s line department. Furthermore, the MQA has included research and information management in its Strategic Plan, which will link to the national DHET system. Finally, the MQA has contributed directly to the development of the NSDS III.
Increase access to programmes leading to intermediate and high-level learning
· Provide young people and adults with foundational learning qualifications and increase ABET Level 4 entrants from a baseline of 269 229 to 300 000 per year.
156

· Improve National Certificate (Vocation) (NCV) success rates, prior to massification of the programme. NCV enrolments across Levels 2 and 3 were 122 921 in 2009, of which 8.9% achieved certification at Level 2, 9.9% at Level 3 and 21.5% at Level 4.
· Create “second-chance” bridging programmes (leading to a matric equivalent) for youths who do not hold a senior certificate.
· Provide a range of learning options to meet the demand of those with matric, but who do not meet requirements for university entrance.
In support of Output 2, the MQA will continue to support ABET training in the sector, improve the quality of ABET by supporting the training of ABET practitioners, support the delivery of Foundational Learning Competency (FLC) by training FLC facilitators and providing grants to MMS organisations to train FLC learners. Details, including targets, are contained in the Strategic Plan 2013/14.
Increase access to occupationally directed programmes in needed areas and thereby expand the availability of intermediate-level skills (with a special focus on artisan skills)
· Increase the number of learnerships to at least 20 000 annually by 2014.
· Produce at least 10 000 artisans annually by 2014.
· Put in place measures to improve the trade test pass rate from its 2009 level of 46% to 60% by 2014.
· Increase the placement rate of learners from learnership and apprenticeship programmes, as well as learners from NCV programmes, who require workplace experience before being able to take trade tests or other summative assessments. At least 70% of learners should be placed every year.
· By 2011, establish a system to distinguish between learnerships up to and including Level 6 and above.
· Increase the proportion of unemployed people, as compared to employed people, entering learnerships from the current level of 60% to 70%.
In support of Output 3, the MQA continues to support learnerships/apprenticeships for artisans and learnerships for non-artisans. Details, including targets, are contained in the Strategic Plan 2013/14.
Increase access to high-level occupationally directed programmes in needed areas
· Increase the graduate output in engineering sciences to 15 000 per year by 2014.
· Increase the graduate output in animal and human health to over 15 000 per year by 2014.
· Increase the graduate output in natural and physical sciences to 8 000 annually by 2014.
· Increase the graduate output in teacher education to 12 000 per year by 2014.
In support of Output 4, the MQA continues to support bursaries at public HET institutions with mining- and mineral-related faculties, workplace experiential learning linked to public HET diplomas, and internships linked to public HET degrees.
Research, development and innovation in human capital for a growing knowledge economy
· Increase the output of:
- Honours graduates to 20 000 annually by 2014
- Research master’s degrees to 4 500 annually by 2014
157

- Doctoral graduates to 1 350 annually by 2014
- Postdoctoral graduates to 100 annually by 2014
· Provide increased support to industry/university partnerships.
· Increase investment in research and development, especially in the science, engineering and technology sector.
Firstly, through the MQA bursary scheme, the MQA will fund postgraduate studies in rock engineering and support postgraduate students who undertake MMS-related research topics. Secondly, the MQA is in the process of developing learning materials for postgraduate rock engineering qualifications. Thirdly, the MQA has developed and implemented a public HET institution support programme to develop university lecturers from historically disadvantaged backgrounds to work at institutions that have mining- and minerals-related faculties. Furthermore, the MQA has, over the years, built strong partnerships with HET institutions, FET colleges and private providers for the delivery of education and training for the sector.
7.4 SUPPorT of GoVerNMeNT`S MTSf oBJeCTIVeS
This section highlights the ways in which this SSP supports government’s MTSF policy objectives, by discussing its contribution to each of the ten objectives listed in the policy document.
7.4.1 Speeding up growth and transforming the economy to create decent work and sustainable livelihoods
The MMS is a large contributor to the South African economy but, as indicated in Chapter 3, it has contracted over a relatively long period of time as a result of a number of factors – many of which are outside the control of the sector itself. One of the constraining factors is, however, the shortage of skills. By focusing on skills areas where shortages are experienced and by stimulating, facilitating and supporting skills development for and in the sector, the MQA will endeavour to reduce the impact of this particular factor on the growth of the sector and contribute to the growth of the total economy in this way.
Similarly, the support for the transformation of the sector mentioned in Section 7.2.1 will ultimately impact on the transformation of the economy and the broader participation of HDSAs in the economy.
7.4.2 Massive programme to build economic and social infrastructure
The MMS, and specifically the CLAS subsector, plays a pivotal role in the provision of raw materials for the infrastructural development of the country. The operations that provide cement, lime, aggregates and sand are relatively small and are scattered across the country. In cooperation with the Aggregates and Sand Producers Association of Southern Africa (ASPASA), the MQA has identified the specific needs of these operations and will support skills development for and in them.
In Chapter 2, it was stressed that most mining operations are located in rural areas and that they attract labour from rural areas across the country. Many of the mining companies are extensively involved with their surrounding communities and contribute to their development. The Social and Labour Plan also binds mining operations to involvement with their local communities. The MQA supports skills development in this regard through continuously engaging with communities that live and work in rural mining areas.
158

7.4.3 Strengthen the skills and human resources base
All the work undertaken in the planning period will focus on strengthening the skills and human resources base of the sector and ultimately that of the country.
7.4.4 Improve the health profile of all South Africans
As mentioned above, the MMS is committed to the containment and reduction of HIV infection in the industry and the reduction of occupational diseases that are currently undermining the health of the workforce. In the planning period, the MQA will, in collaboration with the MHSC, the DMR and other stakeholders, explore ways in which it can actively contribute to these sectoral imperatives.
7.4.5 Intensify the fight against crime and corruption
Unfortunately crime has also permeated the mining sector. Illegal mining poses huge economic, environmental and safety problems to mining operations. Many of the small-scale mining operations start off informally without the necessary licensing and compliance with DMR regulations. In the MQA’s training programmes designed for small-scale mining, special attention will be given to the legal requirements and to assisting new entrants to the sector to become compliant.
7.4.6 Build cohesive, caring and sustainable communities
The MQA, in partnership with the Department of Environmental Affairs (DEA) and other role players, will explore possible ways in which to support communities living on the fringes of poverty and unemployment. This could include DEA input into the proposed MQA Mine Community Capacity-Building Programme.
The MQA currently only operates within the borders of South Africa, although many stakeholder organisations supported by the MQA operate within the Southern African Development Community (SADC) region. Foreign workers that are employed by the MMS are, however, entitled to the same training opportunities as local workers, with the development of their skills contributing to African advancement.
7.4.7 Sustainable resource management and use
This is a critically important area for the MMS, given the need to protect the environment and conserve non-renewable resources. Section 2.8 of the amended Mining Charter states that: “Mineral resources are non-renewable in nature, (and that) forthwith, exploitation of such resources must emphasise the importance of balancing concomitant economic benefits with social and environmental needs without compromising future generations, in line with Constitutional provisions for ecological, sustainable development and use of natural resources”.
The MQA supports the training and development of learners on environmentally-related programmes and will engage with the Environmental Sector Skills Plan of the DEA in this regard.
159

7.4.8 Build a developmental state, including improvement of public services and the strengthening of democratic institutions
The DMR plays a crucial role in the regulation and the advancement of the MMS. During the development of this SSP, the capacity constraints of the Department and the negative effect of these on the sector were highlighted by various stakeholders. The DMR also participated in this process and identified skills needs in and in support of its work. These needs will receive support from the MQA during the planning period.
7.5 SUPPorT of GoVerNMeNT`S INdUSTrIAL PoLICY ACTIoN PLAN (IPAP)
In support of the IPAP’s focus on downstream metals beneficiation (see Section 3.7), the MQA will continue to support beneficiation that falls within the scope of the MQA. The Beneficiation Subcommittee will guide the activities, which support IPAP’s key action plans.
IPAP’s transversal interventions are depicted in the following diagram:
Figure 7.2 Mapping the field: IPAP transversal interventions
160

IPAP’s sectoral interventions 2 and 3 are as follows:
Figure 7.3 IPAP sectoral interventions 2 and 3
161

An important aspect for the MQA is the IPAP Key Action Programme relevant to downstream mineral beneficiation. This set out in the following case studies:
162

The MQA is committed to the central objective of IPAP to create jobs, as symbolised below:
Figure 7.4 Fitting it all together
7.6 SUPPorT of NATIoNAL BeNefICIATIoN STrATeGY for SoUTH AfrICA
The Beneficiation Strategy for South Africa is aligned with IPAP and the NGP, which identifies mineral beneficiation as one of the priority growth nodes for job creation. It aims to develop sustainable final-stage beneficiation level for 10 minerals for five value chains, namely security of energy, industrial minerals (e.g. steel and stainless steel), advanced metal (e.g. Ti pigment production), auto-catalyst and diesel particulate, and jewellery fabrication. It is envisioned that the MQA will focus on the following approach in skills needs assessment and development relevant to downstream beneficiation in support of IPAP:
163

Figure 7.5 Beneficiation as a consequence of mineral extraction and processing activities
Figure 7.6 The SETA landscape 2011–2016
The Resources Goods Cluster is, for obvious reasons, inter-dependent on the following clusters:
164

7.7 SUPPorT of THe New GrowTH PATH ANd THe NATIoNAL SKILLS ACCord
The National Skills Accord119 is one of the first outcomes of social dialogue on the New Growth Path. This accord was entered into between government, business, labour and civil society, and was signed in July 2011. The accord consists of the following eight commitments and includes inter-SETA cooperation:
1) Expand the level of training using existing facilities more fully.
2) Make internship and placement opportunities available within workplaces.
3) Set guidelines of ratios of trainees: artisans, as well as across the technical vocations, in order to improve the level of training.
119 The New Growth Path: Accord 1 National Skills Accord.
Figure 7.9 Financial Cluster
165

4) Improve the funding of training and the use of funds available for training and incentives for companies to train.
5) Set annual targets for training in state-owned enterprises.
6) Improve SETA governance and financial management, as well as stakeholder involvement.
7) Align training with the New Growth Path and improve SSPs.
8) Improve the role and performance of FET colleges.
Not all the commitments have a direct bearing on the skills planning of the sector –Commitment 5 sets targets for training in state-owned enterprises. Those that are relevant to this SSP are discussed in more detail below:
7.7.1 Commitment 1: Expand the level of training using existing facilities more fully
Under this commitment, the stakeholders agreed that 30 000 new artisan learners will enter training in this financial year. About 56% (16 800) of these should come from the private sector. The MQA has set an artisan learnership target of 2 500 per year (2 000 employed and unemployed plus 500 artisan aides, including RPL), and therefore aims to contribute 15% of the new artisan learners.
7.7.2 Commitment 2: Make internship and placement opportunities available within workplaces
According to this commitment, companies will annually make 12 000 placements/internship spaces available for students who complete their certificates at FET colleges, 5 000 internships for third-year students at universities of technology who need the work experience as part of their qualifications. These companies will provide opportunities for training exposure in a work environment to at least 16 000 lecturers at FET colleges. This will be phased in, with 20% of the target to be achieved in 2011, 50% in 2012 and 100% from 2013. The parties also agree to work together to improve both the capacity and quality of FET colleges.
As indicated in this SSP, the MQA has already taken the initiative to work together with a number of FET colleges to strengthen their capacity and enable them to deliver on the skills development needs of the MMS. The steps taken so far include the following:
· The revision of NCV courses to align them with mining and minerals industry needs· The provision of National Technical Education (NATED) programmes’ theory to support apprenticeships’
delivery mode and access to trade testing· Mapping the NCV with MQA trade qualifications for horizontal articulation and learning pathways· Adding other relevant MQA programmes to the NCV as additional subjects· Collaborating jointly on the curriculum assessment specifications development for occupational
qualifications· Considering a form of RPL for learners with NATED trade qualifications but without language subjects · Delivering foundational learning
166

7.7.3 Commitment 3: Set guidelines of ratios of trainees: artisans, as well as across the technical vocations, in order to improve the level of training
Under this commitment, SETAs should set targets of the ratios of trainees: qualified personnel for coaching/mentoring purposes.
The MQA will develop a guideline on the ratio of trainees: coaches/mentors.
7.7.4 Commitment 4: Improve the funding of training and the use of funds available for training and incentives on companies to train
This commitment includes various provisions, the most relevant of which is business’s commitment to improve spending on training that companies undertake beyond the 1% compulsory training levy. Business will urge companies to spend between 3% and 5% of their payroll (total salary bill) on training, with as many companies as possible at the high end of this range.
Companies in the MMS have already committed to such an increase in training spent under the Mining Charter. As indicated in that section of the SSP update, the MQA’s role in this regard is to ensure that the necessary programmes are in place, that there is a sufficient supply of accredited training providers and that good quality training takes place.
7.7.5 Commitment 6: Improve SETA governance and financial management, as well as stakeholder involvement. The improvement of SETA governance is one of the strategic objectives of the MQA.
7.7.6 Commitment 7: Align training with the New Growth Path and improve SSPs
The stakeholders came to seven undertakings pertaining to the SSPs and their linkages to the New Growth Path. These undertakings are listed in the table below, along with commentary on how this SSP conforms to the respective undertakings.
Table 7.1 Seven undertakings pertaining to SSP’s
Undertaking Conformation of current SSP update
The framework of all SSPs will be aligned with the NGP and its manufacturing-driver, IPAP II.
This SSP update looks specifically at the skills requirements if the sector had to increase job creation in line with the expectations set out in the NGP.
The SSPs should support growth and jobs in the sectors by ensuring that relevant skills are developed, and by significantly stepping up production of key skills. Quantitative targets will be set for training particularly for scarce and key skills to improve industrial and workplace performance. This will also include clear targets on the number of apprentices to be enrolled in each sector and systems to track progress against targets.
Clear targets for the development of core skills have been set under Strategic Objective 4.
167

Undertaking Conformation of current SSP update
Business and labour commit to ensuring that the funding of New Growth Path: Accord 1.1.4 training through the SDL is directed towards the training that meets the skills needs of the economy, including the training of professionals and training programmes leading to a qualification.
The training of professionals is covered in the provision of core skills as set out in Chapter 7 of this SSP.
Workplace skills plan requirements will be incorporated into the SSPs to ensure that these are aligned with the national goals set out herein and that training practices are transformed in South Africa’s workplaces.
The SSP uses the information obtained through the WSPs/ATRs extensively. Notably, the development of core skills for the sector takes into account the scarce skills reported annually through the WSPs/ATRs.
A funding plan will be developed to support the targets set out in SSPs and WSPs.
The MQA’s budget forms part of the strategic documentation handed in with this SSP. The way in which additional funding from the NSF can be accessed is not clear yet.
Structures that exist should be used where possible and parties will work closely with relevant government departments, including the departments of Higher Education, Economic Development, Trade and Industry, Mineral Resources, Agriculture, Forestry and Fisheries, and Labour.
Government, represented by the DMR, forms part of the tripartite structure of the MQA. The DMR also formed part of the task team responsible for the development and revision of this SSP. Other departments’ inputs were utilised in the development of the SSP.
Sectors will develop these new SSPs by September 2011 for submission to the DHET by 30 September 2011 for consideration by the Minister of Higher Education and Training.
The previous SSP update was submitted to the DHET on 30 November 2013.
7.7.7 Commitment 8: Improve the role and performance of the FET colleges
The MQA’s contribution in this regard has been discussed under Commitment 2 above.
7.8 SUPPorT of THe NATIoNAL deVeLoPMeNT PLAN VISSIoN 2030
The President of South Africa appointed the National Planning Commission (NPC) in 2010 to draft a vision and a plan for the country. The National Planning Commission Diagnostic Report, released in June 2011, sets out South Africa’s achievements, shortcomings since 1994, and elements of a vision statement. Subsequently, the NPC released the vision statement and plan for consideration and approval by Cabinet.
The core focus of the National Development Plan Vision for 2030, 11 November 2011, is to eliminate poverty and reduce inequality. The overall targets of the plan are as follows:
· By 2030, the number of households living below R418 a month (in 2009 rands) should fall from 39% to zero.
· The level of inequality as measured by the Gini coefficient should fall from 0.7 in 2009 to 0.6 in 2030.
The plan covers priority areas, key targets and implementable actions, including those pertaining to the MMS. Once approved by Cabinet, the MQA will give further consideration to the plan and its implications for the MMS and skills development.
168

7.9 SUPPorT of THe GoVerNMeNT`S INfrASTrUCTUre PLAN ANd STrATeGIC INTeGrATedProJeCTS
The Presidential Infrastructure Coordinating Commission assessed the infrastructure gaps in the country through spatial mapping, which analyses future population growth, projected economic growth and areas of the country that are not served by water, electricity, roads, sanitation and communication. Based on this work, a common infrastructure plan has been developed with 18 Strategic Integrated Projects (SIPs) to support economic development and address service delivery in the poorest provinces. A typical layout of the 18 SIPs is as follows:
Figure 7.11 The Strategic Integrated Projects
The following SIPS are of significant importance to MQA in relation to both mining and beneficiation:
SIP 1: Unlocking of the northern mineral belt, with Waterberg as the catalyst in Limpopo This entails investment in rail, water pipelines, energy generation and transmission to tap Limpopo’s rich mineral reserves.
SIP 4: Unlocking economic opportunities in the North West This entails acceleration of identified investments in roads, rail, bulk water and water treatment, and transmission infrastructure, as well as further development of the mining, agricultural and tourism sectors in the province.
SIP 5: Saldanha-Northern Cape Development Corridor This entails the expansion of the rail and port infrastructure in the Saldanha area, construction of industrial capacity at the back of these ports (including a possible industrial development zone), strengthening
169

maritime support for the gas and oil activities along the West Coast, and expansion of iron ore mining production.
SIP 6: Supporting sustainable green energy initiatives nationally using options envisaged in theIntegrated Resource Plan and supporting biofuel production
The work is now being aligned with cross-cutting areas, including human settlement planning and skills development planning. The MQA will participate in the relevant SIP processes aimed at aligning skills development requirements as they unfold.
7.10 CoNCLUSIoN
The MQA formulated its strategic imperatives within a framework that suits the needs of the sector, the priorities were also formulated with due consideration of the requirements set out in NSDS III, with evidence presented of the ways in which this SSP supports each of eight strategic focus areas of NSDS III. Due consideration was given to government’s MTSF and IPAP policy documents, as well as the Beneficiation Strategy of South Africa, with this SSP directly supporting the wider programme of sustainable economic and social development that these policies seek to implement.
This SSP update took full view of the employment growth expectations posed by the NGP and the National Skills Accord that followed on government’s release of the NGP. This chapter shows the SSP’s alignment with the National Skills Accord. Furthermore, the National Development Plan Vision 2030 and the Infrastructure Plan will be given further consideration regarding the implications for skills development in the MMS.
170

8. STrATeGIC oBJeCTIVeS ANd ProGreSS oN THe deVeLoPMeNT PrIorITIeS
8.1 INTRODUCTION
This chapter provides information on the progress made towards meeting the targets set out for the five skills development priorities of the MQA as described in Chapter 7 of the Sector Skills Plan (SSP) 2012–2017 and the Strategic Plan 2014/14. The NSDS III period commenced on 1 April 2011 and therefore this chapter provides mainly narrative information on the actions taken by the MQA to deliver on its skills development priorities in the 2013/14 financial year.
In 2010/11, the MQA embarked on a process of re-engineering all its business processes and systems with the aim of having a user-friendly, well-maintained and well-resourced management information system. (This process is the first step towards the objectives set out under Priority 3: Enhance information management for skills development in the sector.)
In this chapter, each priority area is described in terms of its goal, objective, strategy and planned project activities. The targets set for each priority area include quantitative, qualitative, cost benefit and impact targets. Although it is not possible at this early stage to comment fully on the achievement of targets, progress is reflected as far as possible, and concerns or aspects for further consideration are flagged where applicable. Most of the MQA projects are multi-year projects and the detailed breakdown is depicted in Appendix 7 attached hereto.
8.2 SKILLS deVeLoPMeNT PrIorITY 1: SUPPorT TrANSforMATIoN of THe THroUGH SKILLS deVeLoPMeNT
8.2.1. Goal and objective
The goal of Priority 1 is to support the Mining Charter to increase the pool of historically disadvantaged South Africans (HDSAs) with the relevant skills required to fill managerial positions.
8.2.2. Targets and progress
MDP Project
The project is aimed at developing the skills of employees in the mining sector through management development programmes (MDPs) to assume roles in supervisory and managerial positions within their companies. It was envisaged that after undergoing the programme, mining organisations would afford their HDSA employees opportunities to demonstrate their newly acquired management skills within a two-year period of completing the MDP.
In 2012/13, a total of 135 employees (an excess of 85 over the target of 50) were successfully trained in numerous MDP programmes. Five organisations who participated in these programmes in the sector have created a pool of potential managerial staff members.
For the 2013/14 financial year, the target of learners has been set at 130, target was met.
171

Community Training in Mining
The mining industry’s involvement with and responsibilities towards the communities surrounding the mines have been mentioned in Chapter 2. As a pilot project, the MQA assists mining communities with training interventions in order for them to gain employment. This intervention also supports the Social and Labour Plan programmes of the sector.
The target for the 2013/14 financial year is 2 000 learners. 1000 young people have been trained in skills that can assure’ them attraction to employment. 400 young people will be trained in Entrepreneurship skills in the first quarter of 2014/15 financial year.
Foundational Learning Grant Incentive Project
A target of 500 learners has been set for this financial year. A total of 191 completed the Foundational Learning Competency Programme in 2012/13. Eighty-five learners have been enrolled on the programme for the first quarter of 2013/14.
Facilitator Development
The objective of this project is to support the development of facilitators for programmes that are required in the MMS. In 2013/ 14 financial year; 84 of a target of 100 were supported through this project.
Workplace Coaches Project (on-the-job learning)
The objective of this project is to provide structured on-the-job coaching in the scarce and/or critical skills areas required by learners in the sector. To this end, only Western Lonmin was appointed to develop, implement and manage the piloting of the Occupational Coaches Programme, based on a tender process. The pilot project was interrupted by the unrest of the Lonmin Marikana mine, which affected the successful implementation of the project. This led to six coaches being utilised to coach 48 learners. The target for 2013/14 financial year was 50 coaches and 100 learners in learnerships, due to labour unrest at some parts of the mining sector, targets were not met for this financial year.
Minerals beneficiation
The MQA signed a MoU with the Jewellery Council of South Africa during the 2011/12 financial year. An extension of this MoU was signed in 2012/13. The MoU was not extended in this financial year 2013/14. A total of 193 learners have been registered on the jewellery manufacturing and diamond processing programmes. A further target of 50 learners for skills programmes has been set, of which 50 have been registered in the following interventions:
· Jewellery project – rural development with symbolic and indigenous jewellery, using semi-precious minerals
· Implementation of skills programs
· Occupational trainer (KwaZulu-Natal and Western Cape)
172

· National Institute of Design (NID) project
· Technical top-up training
· Workplace coaches
· Moderators forum
· Workplace training for diamonds
· FLC customisation
Small-scale Miners Skills Development Support
This project comprises two parts: Small-scale Mining and Support for NGOs, CBOs, Cooperatives and non-levy-paying enterprises (NLPEs).The focus of these projects is to train and build capacity of small-scale miners (SMEs) and support NGOs, Cooperatives and non levy paying enterprises. Through this project, 350 learners, including women in mining, received small-scale mining technical training across all nine of South Africa’s provinces in the 2013/14 financial year. Learners were not trained due to the decision taken by the MQA Executive based on the impact that it has on the sector. The Executive wants us to conduct an impact study on this project.
Mine Environmental Control Programmes
The objective of this project is to facilitate and support learners on the mining environmental control programme. The target for the 2013/14 financial year was to support 50 learners. All 50 learners were trained in various levels of the programme.
Lecturer Support
This programme focused on assisting the mining and minerals departments of nine universities to achieve employment equity and transformation targets among lecturing staff. For this financial year, a total of 27 lecturers were appointed to lecture in the Mining, Geology and Mine Survey departments of the following participating universities:
• University of South Africa: (one lecturer)• University of the Witwatersrand: (seven lecturers)• University of Johannesburg: (five lecturers)• University of Venda: (two lecturers)• University of Fort Hare: (two lecturers)• Rhodes University: (two lecturers)• University of Pretoria: (three lecturers)• University of Limpopo: (two lecturers)• University of Cape Town: (two lecturers)
In the 2014/15 financial year, the number of lecturers will be capped at 27 and nine universities.
173

Bursaries
This on-going project aims at creating a pool of qualified graduates, putting them in a position to pursue careers within the sector, in support of the Mining Charter and NSDS III. The bursary scheme, which is funded through the MQA discretionary budget, has assisted 784 bursars (against a target of 750) from HET institutions in the 2013/14 financial year. In line with the Green Economy Accord MQA undertakes green skills development through its support of Environmental Scientists through its bursary project and integrates an environmental component to all its learnerships.
work experience
The MQA assists learners to obtain qualifications from universities and universities of technology and FET colleges by placing them in host companies to acquire practical work experience. During the 2013/14 financial year, 410 students (against a target of 400) were placed with 41 mining companies to gain workplace experiential training.
Internships
This project aims at providing structured two-year work experience to young unemployed graduates from HET institutions, to complement qualifications in the scarce and/or critical skills required by the sector. In the 2013/14 financial year, 600 graduates were placed at different mining companies, where they could gain workplace experience. The MQA met its target of 600 graduates for this project.
Mine Inspector Training
This project contributed to strengthening mine health and safety by developing well-rounded mining inspectorate expertise in the management of legal risk exposure, root cause analysis, occupational health and hygiene, surface safety, underground safety, SH&EQ management, international SH&EQ management standards and practical visits. During the 2013/14 financial year, 50 DMR employees from the regional offices of the DMR received training at the different mining companies to complete their internship programmes for Sustainability in Mining and Industry.
Promoting the growth of public FETs
The MQA has continued to engage in various interventions with 23 FETs linked to the MMS. Quarterly forums are held, focusing primarily on artisan development. Approximately 10 lecturers were trained on the FLC by the MQA. Plans are in place to formalise collaboration with more FETs.
Maths and Science
The MQA has continued to support young people with Maths and Science support, the aim is to support young people doing Maths and Science to improve their results for entry at the Universities. For 2013/14 financial year the MQA supported 1324 Learners (target 1000) across 8 provinces.
174

8.3 SKILLS deVeLoPMeNT PrIorITY2: SUPPorT oBJeCTIVe deCISSIoN-MAKING for SKILLS deVeLoPMeNT THroUGH reSeArCH IN THe SeCTor
8.3.1. Goal and objective
The goal of Priority 2 is to continually improve skills development planning and decision-making through research. The objective of Priority 2 is to contribute to the body of skills development knowledge within the sector and nationally through the dissemination of research reports and collaboration with relevant partners.
8.3.2. Targets and progress
The research strategy of the MQA relates to the NSDS III requirement of ensuring that skills development data is accurate and usable. The strategy refers to an ongoing process of continuous improvement of information.
Research needs for and 2013/14 were identified and the research agenda was adopted by the responsible standing committee of the MQA Board (the Skills Research and Planning Committee). Progress reports on research activities are submitted to the committee and the Board quarterly.
The MQA has, from the onset, acknowledged the importance of the WSP/ATR submissions and designed WSPs/ATRs that go beyond the minimum compliance requirements. Firstly, the WSP/ATR serves as a mandatory grant release mechanism if the MQA’s criteria are met. Secondly, it encourages good skills planning and reporting within organisations. Thirdly, it provides a valuable source of data annually to the MQA for skills planning and reporting purposes.
Organisations were required to submit their WSPs/ATRs to the MQA by 30 April 2014 and, in the case of approved extensions, by 31 May 2014. The source data submissions provided more detailed information on employees and actual training undertaken. This was useful in enabling a better analysis of current employment within the sector, together with more accurate labour-demand projections and skills needs identification (including scarce skills). Furthermore, a general improvement in the quality of data received in the submissions was evident.
In order to support SDFs and Skills Development Committees (SDCs) in the sector in their skills planning and reporting role, the MQA provided the following material: Organising Framework for Occupations (OFO) toolkit (the latest version of the OFO, mapping tables, OFO Guide booklet) and a WSP/ATR Requirements booklet (including guidelines for SDCs). Further support was provided in the form of two national SDF forums, workshops on OFO and WSP/ATR capacity-building workshops for organisations.
In addition to the research undertaken for the SSP update, the MQA has commissioned a systematic annual analysis of the WSPs and ATRs every year since 2002 (available in individual reports annually). This allowed for the development of time series data on the profile of the sector and skills development initiatives in the sector. It also formed an important source of information for the development and the updating of the SSP. 13-year WSP/ATR analysis was completed in 2014/15.
The occupational profiling done in the 2011/12 financial year enabled the MQA to produce an occupational profile dictionary, primarily of occupations that fall within the scope of the MQA. The dictionary, aims to support future skills audits, as well as the Quality Council for Trades and Occupations (QCTO)-aligned
175

qualifications development process in the sector. In 2013-14 the MQA did not undertake an occupational profiling and skills audit project and it has been rolled over into 2014-15. Other research projects MQA started as part of the 2013/14 research agenda that will continue in 2014-15 are an impact assessment framework, that will be employed to conduct four impact assessments (recognition of prior learning (RPL), adult basic education and training (ABET), learnerships and occupational health and safety representatives). Furthermore, research into the skills requirements of the Mineral Beneficiation Strategy which was due for completion in 2013-14 will be rolled over in 2014-15
The MQA aims to prioritise and implement the recommendations from research projects. After completion of each research project, the reports are sent to the Board’s Standing Committee, the Skills Research and Planning Committee. This committee approves the final reports, reviews the recommendations and makes proposals regarding the implementation of the research, if applicable. One of the MQA’s recent research projects, Language policy implementation and implications in the MMS with specific reference to the role of Fanagalo, is informing the current review of the MQA’s language policy on skills development. Monitoring the progress of the projects on the research agenda is an ongoing process. The research information is used for decision-making regarding skills development issues in the sector.
8.4 SKILLS deVeLoPMeNT PrIorITY 3: eNHANCe INforMATIoN MANAGeMeNT SKILLS deVeLoPMeNT IN THe SeCTor
8.4.1 Goal and objective
The goal of Priority 3 is to provide accurate and current skills development information, and make it available and accessible to all stakeholders in the sector. The objective is to have a user-friendly, well-maintained and well-resourced management information system that is fully functioning. The information system should maintain high data integrity.
8.4.2 Targets and progress
The target is to design and develop a Management Information System (MIS) for the core operations of the MQA. The MQA business processes have been re-engineered and will form the specifications for the MIS. The MQA has appointed a service provider for the design and development of MIS. Stakeholders (including employers, labour and DMR representatives) have been given the opportunity to submit inputs regarding the development of the new MIS through the formation of an MIS Stakeholder Steering Committee. The MIS project commenced with the development of a data warehouse to house all MQA data from year 0. The data warehouse has been built using open relational database technology to ensure easy data migration and accessible accurate data that will be available to the sector. To ensure the security of data, the MQA has identified a Disaster Recovery (DR) site. The implementation of the secondary site will be used to ensure business continuity in case of an incident at the primary site at Head Office.
The MQA is also in the process of revamping its website. This will provide additional access to information for the sector and the general public. The MQA Customer Relationship Management (CRM) system will also be linked to the new website to assist with the efficient handling of all stakeholder queries. Investigations into the use of social media on the site are also underway.
176

8.5 SKILLS deVeLoPMeNT PrIorITY 4: fACILATATe ANd SUPPorT THe IMPLeMeNTATIoN of Core SeCTor SKILLS ANd deVeLoP ProGrAMMeS ALIGNed wITH THe SeCTor QUALIfICATIoN frAMeworK
8.5.1 Goal and objective
The goal of Priority 4 is to facilitate and support the development and implementation of core skills for the MMS. The objective is to review the sector qualifications framework and register learners on OFO-aligned core MMS programmes.
8.5.2 Targets and progress
The development of core skills for the MMS is supported by the MQA through a suite of projects that are aimed at the specific sector skills needs outlined in Chapter 6 of this SSP. The projects are funded from the discretionary funds available in the MQA. Quantitative targets have been set for each of the projects, which are specified in the Strategic Plan.
Qualifications design
The MMS Qualifications Framework has been updated and aligned with OFO 2012 (version 12). This framework contains sector-specific occupations and qualifications, as well as cross-sectoral learning programmes. The MQA has completed the following 14 QCTO qualifications:
· Mining Technician: Strata Control Observer (UHR)· Mining Technician: Strata Control Practitioner (UHR)· Mining Technician: Strata Control Practitioner (Coal)· Mining Technician: Ventilation Observer· Mining Technician: Ventilation Officer· Mining Technician: Surveyor · Mining Technician: Miner· Mine Planning Practitioner· Adult Education Teacher: FLC Facilitator (Mathematical Literacy)· Adult Education Teacher: FLC Facilitator (Communication in English)· Mines Rescue Service Worker· Goldsmith· Electrician (collaborative qualification)· Chemical Laboratory Analyst (collaborative qualification)
The following qualifications are still under development:
Table 8.1 Qualifications under development
· Miner (UHR, Coal & Surface Excavations)· Shift Overseer (UHR, Coal & Surface Excavations)· Mine Overseer (UHR, Coal & Surface Excavations)· Safety Officer/Practitioner· Safety Coordinator· Full-time Safety Representative· Workplace Safety Representative (Safety Steward
177

· Mine Health and Safety Inspector· Certificated Engineer · Certificated Manager
The following new occupational qualification development is in progress:
· Crane/Hoist Operator : Winding Engine Driver : Onsetter
: Small Winder Operator : Winch Operator
· Driller (Exploration & Directional Driller)· Rock Drill Operator· Geological Technician : Surface Mining & Exploration
: Underground Mining : Marine Mining
· Mineral Beneficiation Process Controller : Pyro-metallurgy : Extraction metallurgy : Lump Ore BeneficiationMining Equipment Operator (Underground Coal)Mobile Mining Equipment Operator (Underground Hardrock)Machine Operators (Surface Excavations) : Dragline Operator : Excavator Operator : Dump truck Operator : Loader Operator
: Skid Steer Loader Operator
Cluster Occupation
Engineering trades approved for development and for which an artisan qualification is required under the QCTO
Automotive Motor Mechanic: 653101Diesel Mechanic: 653102Diesel Fitter, 653304Earthmoving Equipment Mechanic, 653307Rigger, 651401Planned for completion in the March 2013/14 financial year.Non-core occupations (Motorcycle and Scooter Mechanic, 653103; Motor Mechanic-Small Engine Mechanic, 653104) will also be developed as part of this cluster of occupations.
Beneficiation trades occupations Goldsmith, 661301 – completed and submitted to the QCTO.
The following new occupations are approved for development:Diamond and Gemstone Setter, 661302Horologist (Watchmaker), 661101Diamond Cutter and Polisher, 711203
In terms of Section 26I of the Skills Development Act of 1998 (as amended in 2008) and the NQF Act of 2008, the QCTO has delegated the functions of qualification design and development to the MQA as a development quality partner (DQP). The MQA is thereby required to supply the MMS-related occupational qualifications in accordance with QCTO requirements and by OFO Code. The OFO informs the development of qualifications in the new QCTO and provides a useful basis for determining skills requirements.
Table 8.1 Qualifications under development
178

The MQA is collaborating with other relevant DQPs for the design and development of other occupations relevant to the mining industry.
For the current financial year, a budget of R3 852 000 has been allocated for the various activities.
A further 15 qualifications and specialisations will be developed in the 2014/15 financial year.
Learning material development
The MQA learning material initiative has been executed in collaboration with the Chamber of Mines. The initiative has focused on the development of learning packs that support registered MMS-registered standards.
Since its inception, the MQA has developed a total of 1 689 learning packs, which have all been approved. These learning packs serve as a benchmark and minimum standard for the provisioning of the standards within the sector.
Indicated below is the number of learning packs developed in the specified year:
Table 8.2 Number of learning packs developed in the specified year
2011-20122012-2013 2013-2014
Target Achieved Target Achieved
Learning packs for 202 unit standards were developed for use in the sector.
80 unit standard-based learning packs
99 developed 85 unit standard-based learning packs
85 unit standard- based learning packs
Occupational QCTO qualification: Mines Rescue Services Worker
22 modules 15 QCTO qualifications learning materials
20 modules for QCTO qualifications
Occupational QCTO qualification: Goldsmith
In process 18 Goldsmith learning materials developed
Customisation of the MQA Level 3 jewellery manufacturing and design qualification learning packs to suit learners with special needs
In process In process
179

Cement, Lime, Aggregates and Sand (CLAS) Support
The following have been done:
· A qualifications framework for the CLAS subsector was developed and the subsector participates in the development of QCTO surface mining-related qualifications.
· The CLAS subsector participated in the development of the following QCTO qualifications:
- Production Supervisor, Shift Boss Supervisor, Miner/ Rockbreaker and Miner (Including associated competencies: Examine and Make safe, etc.)
- Chemistry Technician/ Laboratory Analyst/ Laboratory Assistant- Occupational Health and Safety Practitioner and Representative- Certificated Engineer/ Manager- Rockbreaker/ Blasting Certificate Task team
· Ten learning packs have been reviewed and approved.
· A CLAS advocacy workshop was held in July to promote the MQA, its projects and the work of CLAS subsector.
Certificated Engineer/Manager
The Certificated Engineer/Manager Steering Committee has been established for the development of higher education and training (HET) practical programmes linked to the Registered National Certificate in Certificated Engineering, NQF Level 7. The development of the programme is progressing well. It is envisaged that two workshops are required to finalise this curriculum. An application to the QCTO has also been submitted. However the Council on Higher Education (CHE) is now responsible for all qualifications at Level 6 and above.
Rock Breaker Task Team
The Standards Generating Body (SGB) Committee took the decision to progress this work further, facilitated by an independent facilitator. A special SGB committee meeting was held whereby the DMR would develop a position paper on the practicability of reverting back to the Blasting Certificate, including the possible implications of reverting back to it. Constituencies where invited to contribute to this paper. The DMR was to submit the position paper to the SGB Office in May. The position paper from the DMR is still awaited.
Adult Basic Education and Training
The MMS continues to have one of the lowest levels of education in the economy. Some 32.7% of the employees in the sector have an educational level below NQF Level 1. The MQA has therefore continued to support the delivery of adult basic education and training (ABET) within current and estimated budget constraints.
The MQA’s target is a relatively small figure in comparison to the need. This support augments employers’ investments in ABET.
180

A total of 6 339 learners entered ABET programmes and 1 544 completed the programmes in the 2012/13 financial year. The target was for 8 800 people to enter, and 4 400 completed the programmes.
The target for the 2013/14 financial year remains 8 800 learners to enter the programmes and 4 400 to complete the programmes. In the first quarter, 1 763 learners have entered programmes and 320 have completed their programmes.
ABET practitioners
The aim of this project is to upskill 100 AET practitioners and to improve the quality of AET provision. In the 2012/13 financial year, the target of 100 registered learners was achieved. The target for the 2013/14 financial year remains 100. In the first quarter, no new learners were registered.
Intermediate (FET) level core programmes through learnerships
Non-artisan learnerships
The objective of this programme is to develop employed and unemployed learners in core non-artisan programmes.
For this financial year, the target is 3 000 learners to be registered. For the reporting period, a total of 2542 Learners, employed and unemployed were registered. A total of 2814 Learners completed relevant qualifications.
Learnerships for people with disabilities
The MQA Disability Project was implemented to encourage mining companies to take on learners with disabilities in learning programmes. The MQA has compiled a Disability and Reasonable Accommodation Toolkit.
For the 2013/14 financial year, the target is 68. For the reporting period, the achievement was 137 in total.
OHS representatives
In 2009, the MQA started supporting the training of occupational health and safety (OHS) representatives in line with the Mining Sector Tripartite Agreement of 2008. The MQA supports this initiative by making a grant available to employers for the training of their OHS representatives. A total of 6 438 learners registered for the OHS representative programme for the 2012/13 financial year, against a set target of 8 000.
A total of 5 000 learners are to be assisted in the 2013/14 financial year. In this quarter, 1 023 learners have completed the programme.
Foundational Learning Grant Incentive Project
A target of 500 learners has been set for this financial year. A total of 302 completed FLCENG and 149
181

completed FLMATH (Foundational Learning Competency Programme in 2013/2014).
Legislative Framework Governing Government Certificates of Competency
In accordance with an MQA board decision, the examination analysis is first to be completed for the Government Certificate of Competency (GCC) (the new competency model) prior to taking the legislative framework forward.
Artisan development
There continues to be a need for qualified artisans to support and grow the South African economy. To this end, the MQA has undertaken several initiatives.
· The MQA/UIF Artisan Development Project is a partnership with the Unemployment Insurance Fund to facilitate and support the registration of 1 000 artisan learners on the MQA Artisan Programmes. This programme will continue until 2016, when the learners will have completed their programmes. No new target has been set for the next financial year.
· The MQA/NSF2 Artisan Development Project aims to support a total of 1 000 registered unemployed artisan learners with grants. A total of 877 learners were supported. The MQA supports the learners towards completion of their programme in 2014.
· The MQA-Artisan Development Project aims to facilitate and support artisan development in the sector. For the 2013/14 financial year, 2 464 learners were registered against a target of 2500. For the 2013/14 financial year, the target is 1 200 completions. 1671 learners completed the programme.
· The MQA-Artisan RPL /Aides Development Programme is geared towards preparing artisan aides to access artisan programmes. For the 2013/14 financial year, the target was 500 learners to be registered on various programmes. Only 302 were registered in the 2013/14 financial year. In the first quarter, 196 learners completed the artisan aides skills programmes, and various programmes aimed at the artisan aides project.
· The MQA/Mpumalanga Artisan Development Project is a partnership between the MQA, the Department of Labour, Nkangala FET College and the Colliery Training College in Mpumalanga. It is aimed at facilitating and registering a total of 220 unemployed learners on N2 Engineering and MQA Artisan Programmes. For the 2013/14 financial year, the target was met.
182

Table 8.3 Artisan Development Performance
Project Target Performance Comments
MQA/UIF Artisan Development Project
1000 1001There was no intake for 2013/2014 FY; the target was met then in 2011/2012 FY.
The MQA/NSF2 Artisan Development Project
1000 887There was no intake for 2013/2014 FY; the target was met then in 2010/2011 FY.
The MQA-Artisan Development Project
2500 2464The current status in the mining industry affected training,
The MQA-Artisan RPL /Aides Development Programme
500 196
Labour unrest also contributed to targets not being met, as large numbers were expected from 2 mines in the affected areas.
The MQA/Mpumalanga Artisan Development Project
220 220 The target was met
8.6 SKILLS deVeLoPMeNT PrIorITY 5: eNHANCe THe MoNITorING, eVALUATIoN ANd reVIew of THe deLIVerY CAPACITY ANd QUALITY of SKILLS IN THe SeCTor
8.6.1. Goal and objective
The goal of Priority 5 is to support the MMS to develop sufficient training and development capacity and continuously improve the delivery of quality programmes. The objective is to ensure sufficient training and development capacity, and quality programmes for core mining and minerals occupations.
8.6.2. Targets and progress
The MQA ETQA as an AQP, jointly with the SGB as a DQP, conducts the development process of the external assessment strategy and specifications for various qualifications. Once these qualifications are accepted by the QCTO, the external assessment tools have to be developed. The MQA was recognised as the Assessment Quality Partner (AQP) to apply for quality assurance of these qualifications.
In line with the QCTO progress on process of policy and procedures development of required standard, a guideline document has been prepared for the currently recognised AQPs to supplement the external assessment development process for all qualifications.
A panel assessment process has been put in place where line management form part of an evaluation panel for the declaration of competence. In addition, the workplace experience logs are submitted to the ETQA for scrutiny and verification. Six training providers were monitored by the office in collaborations with DMR on conducting this process during the 2013/2014 financial year. There is marked improvement in the quality of learning provision for rock breakers.
183

The MQA has also continuously analysed trends regarding their accredited training providers. This activity provides the opportunity to identify arrears that require further attention in terms of accreditation. One of the areas identified as an area that needs focused attention was the skills of OETDPs and assessors in the sector. The MQA identified a project to support development of facilitators and 82 practitioners from various training providers and levy payer employers benefited 2013/14. However this project has been phased out.
The system for the monitoring of training providers is in place and the monitoring schedule is on track. All the sites where training providers conduct training and assessment are quality assured by the ETQA. At this stage, the MQA apply different models of utilisation of subject matter experts for quality assurance audits and is in the process of increasing the pool that should be provincially or regionally based. This model is cost effective as the subject matter experts do not have to travel to different areas. The intention is to increase the pool of subject matter experts (SMEs) and ensure that they are capacitated as required. At least sixty-five new subject matter experts were capacitated in financial year 2013/2014 through various sessions, whilst mostly were of the HDSA as aligned to the approved principle of 80/20.
In the 2013/14 financial year, 160 accredited and programme-approved training providers were monitored/checked for compliance/quality assurance of learner achievements. Furthermore, 73 providers were for site and/or scope extensions with at least contracts been awarded to training providers.
All the MQA-registered programmes have learner uptake within various accredited providers. However, there is a need to increase the number of accredited providers for certain qualifications, such as those in the mineral processing qualification and mining technical support fields. Twenty-five (25) providers have been accredited for OHS, thirty-three (33) for the mineral processing qualification and only two for mining technical support for the period of financial year 2013/2014. At least four (04) training providers have been granted the OHS qualification scope. One (01) provider has been audited for the mining technical support qualifications and upgraded to full accreditation status. Large numbers of learners are participating in the skills programmes in the mineral processing field, but a drive towards the achievement of qualifications is required in the sector.
The MQA’s process for improving capacity development in the sector also involves the continuous registration of assessors and moderators. Assessors are required to have the relevant technical qualification, as well as the assessor skills, together with a minimum of two years’ experience in the relevant field before they are considered for assessing MQA’s qualifications, skills programmes and/or unit standards. Once an assessor is registered and has obtained the moderator skills, they are eligible to become registered as a moderator. This implies that a moderator is also a subject matter expert (SME). In the 2013/14 financial year, 559 assessors and 213 moderators were registered for various MQA qualifications, skills programmes and unit standards, while 170 assessors were granted scope extensions and further 106 assessors moved from one training provider to another.
There is also a concern regarding the lack of learner uptake, specifically in respect of the replacement qualifications for the current Chamber of Mines certificates of competency. The MQA plans to introduce new qualifications to replace these certificates of competency. The Level 2 mine ventilation qualification has been registered. However, it remains a concern that, there has not yet been any leaner uptake on this qualification. The MQA qualifications and the Chamber of Mines certificates will be offered concurrently until 2015 when the issuing of Chamber of Mines certificates will end. This transition is an area of focus for the MQA ETQA division. Very important is the fact that the MQA needs to develop the capacity to assess approximately
184

1 000 learners per year in the competency areas covered by the Chamber of Mines certificates. There is also a need for larger numbers of accredited providers in this area.
The MQA is monitoring trends in terms of training providers retaining their accreditation status, needing improvements to retain their accreditation and opting out of accreditation. Four training providers have lost their accreditation and/or programme approval status. During monitoring visits, relatively large numbers of providers receive reports indicating the need for improvements. This is an area that needs continued monitoring and focused attention from the MQA. At the same time, there is a new approach to accreditation needs that to be developed in line with the accreditation philosophy and requirements of the QCTO.
Once the records of assessment data of all learners are recorded on the MQA database, learners are certificated by the MQA within three weeks. The MQA has improved on aspect of certificate issuing as there is no backlog on this regard.
The MQA upload to the National Learners’ Records Database (NLRD) was successful for all required uploading during financial year 2013/2014.
The numbers of learners’ certification that were awarded in the 2013/14 financial year are as follows:
Table 8.4 Number of learners’ certification (2013/14)
Types Numbers
Skills Programmes’ statement of attainments 42958
The MQA Level 1 qualification 822
Non-artisan qualifications 2676
Artisan qualifications 901
Career guidance
The MQA’s Qualification Framework guides the learning pathways for occupations in the MMS. The MQA has undertaken a range of career guidance activities, particularly with young people.
The MQA has developed a very detailed MMS careers brochure with an accompanying DVD that it has distributed across the entire sector, as well as to numerous schools and career guidance structures. Moreover, the MQA participated in many skills development exhibitions in the country. Furthermore, various workshops and/or road shows on programme development in the sector were held during the year. The MQA provided career guidance, in partnership with the DHET, as part of Mandela Day, and also participated in the DMR’s Learner Focus Week and Department of Labour career interventions and career exhibitions.
To further improve the quality of the MQA’s SSP, the following additional research projects are recommended:
185

Table 8.5 Additional recommended research projects
Research required Essence of the proposed research project
Time frame Update
1. Understanding the 2020 operating environment of the mining and mineral industries
Although drivers of change indicate major changes in learning content, further research is required to estimate what skills will be required by whom.
To be done as soon as possible since it will lay a solid foundation for other research projects and skills development initiatives.
Process is being reviewed by MQA
2.Updating curricula
Chapter 4 and 5 of the updated SSP clearly identified a need to update curricula and learning material to be aligned with future requirements. Drivers of change clearly indicate specific skills clusters that will be required in areas such as social media, marketing, multiskilling and the Green Agenda. These themes do not form part of existing curricula and learning material, or are not sufficiently addressed.
Due to the time required to develop new learning material, it is essential that the research commences as soon as possible, within the next three to six months.
MQA together with QCTO are looking at the development of new qualifications
3. SMME research
Although research has been done on SMMEs in the MMS, further research will be required to include rural areas. If SMME empowerment can be successfully extended to rural areas, two government policies are addressed simultaneously. Rural development should be viewed as an opportunity due to the fact that there are mining and mineral activities in these areas.
6 months to 1 year
The ToRs for a impact study of Small Scale Mining has been drafted
4. Toolkit for SMME operators
Sufficient classroom training is not always possible to attract SMMEs. A toolkit based on the “how to” principle, for example, how to develop a business plan, how to budget, will make a substantial contribution. The toolkit should have templates for all activities, such as a strategic plan, appointment letter, etc.
3 to 6 months
MQA is reviewing the development of a toolkit
186

Research required Essence of the proposed research project
Time frame Update
5 Develop a toolkit to empower staff members to comply with e-learning and new curricula
It is anticipated that this intervention could result in major changes on the future learning landscape and it might be necessary to reassess all curricula of both sectors. Further research into e-learning as an alternative to face-to-face instruction may be required to offset the process. This research should address the need for alternatives to classroom training due to the difficulty for learners to attend formal training due to work responsibilities, transport, etc.
As soon as possible, since e-learning is viewed as the ideal solution, especially to empower people in the rural areas.
This will form part of staff development within MQA
6. Research to accelerate B-BBEE
Acceleration of B-BBEE is essential in view of most government policies implemented after 1994. A research project is proposed where historically disadvantaged citizens are identified and placed on individual development programmes that include education, training courses, job exposure and practical assignments that are controlled by means of a log book.
As soon as possible, but preferably within the next two to three months.
The MQA has implemented such a programme and has commissioned an impact study
7 RPL
Since RPL has made slow progress across industries, the MQA can play a leading role in researching the most viable intervention to ensure that people who can do the work are credited with appropriate qualifications.
Preferably before the next SSP update.
The MQA is in the process of compiling RPL research
187

refereNCeS
Adcorp Holdings; Annual Labour Report, June 2013.
Ally, I. 2012. Safety report for the mining industry. Johannesburg: Centre for Sustainability in Mining and Industry, University of the Witwatersrand. ANC. SIMS report. Available at http://www.anc.org.za/docs/reps/2012/simsreport.pdf (Accessed on 9 August 2012). African National Congress.
Bezuidenhout, A. 2008.New patterns of exclusion in the South African mining industry. In: Racial redress and citizenship in South Africa. Pretoria: HSRC Press.
Bezuidenhout, A., Bischoff, C. & Masondo, T. 2010.Meeting expectations? A research report on the state of servicing in the National Union of Mineworkers. Johannesburg: Society, Work and Development Institute, University of the Witwatersrand, p 99.
Bezuidenhout, A., Buhlungu, S., Hlela, H., Modisha, G. & Sikwebu, D. 2005.Members first: A research report on the state of servicing in the National Union of Mineworkers. Johannesburg: Sociology of Work Unit, p 12.
Buhlungu, S. & Bezuidenhout, A. 2007. Old victories, new struggles: The state of the National Union of Mineworkers. In: State of the Nation, 2006-2007, S. Buhlungu, J. Daniel, J. Lutchman & R. Southall (eds.). Pretoria: HSRC Press.
Cawood, F. 2005. Social change through mineral law in South Africa. Paper presented at the Annual Mining Seminar organised by the Centre for Energy, Petroleum and Mineral Law and Policy, University of Dundee, and held in the Natural History Museum, London, 21 June 2005.
Centre for Sustainability in the Mining Industry (CSMI). 2004. Coaltech 2020 study: Human and social issues influencing the incorporation of women into the mining workforce. CSMI.
Centre for Sustainability in the Mining Industry (CSMI). 2010. The socio-economic aspects of mine closure and sustainable development: Literature overview and lessons for the social-economic aspects of closure, Report 1 of 1, Coaltech Project 7.8.5. CSMI.
Chamber of Mines. 2003. Bringing the underground AIDs fight to surface. Available at www//http.bullion.org.za, published 20 June 2003.
Chamber of Mines. 2008. South African mining industry – statistical tables.
Chamber of Mines. 2009. Annual Report 2007/08.
Chamber of Mines. 2011. Facts & figures booklet.
Chamber of Mines. Chamber’s Memorandum to the National Treasury on the Draft Mineral and Petroleum Royalty Bill. Available at www.bullion.org.za (accessed on 1 June 2009).
Chamber of Mines.2010a.Annual Report 2008/09.
Chamber of Mines.2010b. Facts & figures booklet.
188

Chamber of Mines.2012. Annual Report 2011.
Department of Environmental Affairs and Tourism. 2008. People, planet and prosperity – a framework for sustainable development in South Africa. Pretoria: Department of Environmental Affairs and Tourism.
Department of Environmental Affairs. 2010. Integrating the environmental driver into Sector Skills Plans: An enabling document for all SETAs. Pretoria: Department of Environmental Affairs.
Department of Higher Education and Training. Framework for the National Skills Development Strategy 2011/12–2015/16, p.22. Pretoria: Department of Higher Education and Training.
Department of Mineral Resources. 2010b. Stakeholders’ Declaration of Strategy for the Sustainable Growth and Meaningful Transformation of South Africa’s Mining Industry. Pretoria: Department of Mineral Resources.
Department of Mineral Resources. 2011. Sustainable development through Mining Strategic Framework. Pretoria: Department of Mineral Resources.Department of Mineral Resources. Available at http://www.dme.gov.za/minerals/minreg_social.stm (accessed on 1 June 2010). Pretoria: Department of Mineral Resources.Department of Mineral Resources. Available at http://www.dmr.gov.za/beneficiation-economics.html. (Accessed on 9 August 2012). Pretoria: Department of Mineral Resources.Department of Mineral Resources. Available at http://www.info.gov.za/speeches/2010/10012509251001.htm (accessed on 9 June 2010). Pretoria: Department of Mineral Resources.Department of Mineral Resources. Scorecard for the Broad-Based Socio Economic Charter for the South African Mining Industry. Available at http://www.dmr.gov.za/Policie_And_Promotion/Documents/Documents/Scorecard/scorecard.pdf (accessed on 22 September 2010).
Department of Mineral Resources.2009a. Draft Beneficiation Strategy. Pretoria: Department of Mineral Resources.
Department of Mineral Resources.2009b. Mining Charter impact assessment report. Available at http://www.dmr.gov.za/Policie_And_Promotion/Documents/Documents/Mining_Charter_Impact.pdf (accessed on 22 September 2010). Pretoria: Department of Mineral Resources.Department of Mineral Resources.2010a. Amendment of the Broad-Based Socio Economic Charter for the Mining and Minerals Sector. Available at http://www.dmr.gov.za/Policie_And_Promotion/Documents/Documents/Amended_of_BBSEE_Charter.pdf (accessed on 22 September 2010). Pretoria: Department of Mineral Resources.Department of Minerals and Energy. 2006. Annual Report of the Mine Health and Safety Inspectorate 2004/2005. Pretoria: Department of Minerals and Energy.
Department of Minerals and Energy. 2009. Annual Report of the Mine Health and Safety Inspectorate 2007/2008. Pretoria: Department of Minerals and Energy.
Department of Minerals and Energy. Undated. Presidential Mine Health and Safety Audit. Pretoria: Department of Minerals and Energy.
Department of Trade and Industry. 2005. Metals Sector Development Strategy. Pretoria: Department of Trade and Industry.
189

Department of Trade and Industry. 2010. Industrial Policy Action Plan (IPAP). Pretoria: Department of Trade and Industry.
Du Plessis, A. 2010. Personal interview with Prof Du Plessis at the Centre for Mechanised Mining Systems, University of the Witwatersrand, 12 November 2010.
Du Toit, R. & Roodt, J. 2009.Engineers in a developing country: The profession and professional education of engineers in South Africa. Pretoria: HSRC Press.
EE Research Focus. 2010a. Analysis of WSPs and ATRs Year 9, Report prepared for the MQA.EE Research Focus. 2010b. Mine Health and Safety – an exploratory study. Mining Qualifications Authority.EE Research Focus. 2010c. The impact of the 2008/9 economic crisis on merSETA firms.EE Research Focus. 2011a. Analysis of WSPs and ATRs Year 10, Report prepared for the MQA.EE Research Focus. 2011b. Small companies survey: Diamond processing, jewellery manufacturing, and cement, lime, aggregates and sand (CLAS) subsectors, Report to the MQA.EE Research Focus. 2011c. The MQA’s Language Policy: Research into the MQA’s Language Policy with specific reference to the phasing out of Fanagalo, Report to the MQA.Essentials Jewellery. Available at: http://www.essentialsjewelry.com/southafrica-gem-jewelry/south-africa-rough-diamond.html (accessed on 11 November 2010).Goldprice.org. Available at http://goldprice.org/ (accessed on 30 August 2012).http://en.wikipedia.org/wiki/Hydraulic_fracturing_in_South_Africa (Accessed 21 September 2014).http://www.sanews.gov.za/south-africa/draft-framework-agreement-sustainable-mining-industry-entered-organised-labour. (Accessed on 10 August 2013).
Human Sciences Research Council (HSRC) and Povey, Mulvenna & Associates. 2003. A skills analysis of the jewellery manufacturing and gemstone processing industries in South Africa. Johannesburg: MQA and GTZ.
Human Sciences Research Council (HSRC). 2004a. A skills analysis of the cement, lime, aggregates and sand (CLAS) sector in South Africa. MQA.
Human Sciences Research Council (HSRC). 2004b. Skills and training analysis in the small-scale mining and minerals subsector. MQA.
Landelahni Business Leaders. 2010. Local mining industry mirrors global skills crisis. In Fast facts: Mining Research Report, 2010. Available at http://www.landelahni.co.za/industry_reports/Mining%20Research%20Summary%20Report%202010.pdf (accessed on 18 November 2010).
Law and Tax News.com. 2010. South African moratorium on new mining licences, 24 August 2010. Available at http://www.lawandtaxnews.com/asp/South_Arican_Moratorium_On_New_Mining _Licences____44911.html (accessed on 14 November 2010).
Migogo, B. 2010.Written communication with the CEO of the Diamond Council, 7 June.
Mine Health and Safety Council. 2008. Mine Health and Safety Tripartite Leadership Summit, 5 September 2008.
Mine Health and Safety Council. 2011. Strategic Plan for the period 2011/12–2013/14.
190

Mining Matters. 2010. The revised Mining Charter 2010. Mining Matters, Spring.
MmegiOnline. 2010. De Beers criticises state diamond trader. Available at www.mmegi.bw/index.php?sid=4&aid=710&dir=2010/March/Friday5 (accessed on 17 November 2010).
MQA-CSMI. Small-scale Mining Colloquium, Johannesburg, South Africa, Report and Analysis of Outputs, September 2010.
MQA. 2010. MQA FLC Forum, 30 July 2010. Available at http://www.mqa.org.za/siteimgs/J%20Moodley%20FLC%20Forum%20-%20Consolidated.pdf (accessed on 19 November 2010).MQA. Available at http://www.mqa.org.za/division.asp?contID=54&mdivID=11 (accessed on 16 June 2010).
Mwape, P., Roberts, M.J., Mokwena, E., Musi, L., Tjatjie, T., Mnguni, M., Mashaba, P. & Kwata, P.G. Part One: South Africa’s Mineral Industry – General Review, Department of Minerals and Energy, South Africa’s Mineral Industry, 2007/2008.
National Planning Commission. 2011. National Development Plan: Vision 2030, 11 November.
National Qualifications Framework Act 67 Of 2008
National Skills Development Act 97 of 1998.
National Skills Development Strategy 2011-2016.
Pickering, R.G.B. 1996. Deep level mining and role of R&D. The Journal of the South African Institute of Mining and Metallurgy, September/October 1996. Available at http://www.saimm.co.za/Journal/v096n05p173.pdf (accessed on 14 November 2010).
Presidential Audit Report 2008. Challenge of Communication.
Quality Council for trades and occupations (QCTO) Certification policy, 2013
Rees, D., Murray, J., Nelson, G. & Sonnenberg, P. Oscillating migration and the epidemics of silicosis, tuberculosis, and HIV infection in South African gold miners. Wiley InterScience. Available at www.interscience.wiley.com.
Republic of South Africa. 2010. The New Growth Path: The Framework.
Republic of South Africa. Broad-based Socio-economic Charter for the South African Mining Industry (Mining Charter).Section 4.4.
Republic of South Africa. Mineral and Petroleum Resources Development Act (Act 28 of 2002). Section 2, 58.
Section 14 of the Diamonds Amendment Act.
Skills Development Act of 1998, Section 261.
Sloan Career Cornerstone Center. Career planning resources in mining. Available at http://www.careercornerstone.org/industries/mining.htm (accessed 14 November 2010).South Africa.info. 2009. South Africa needs 40 new coal mines, 12 August. Available at http://www.southafrica.info/news/business/832012.htm (accessed on 14 November 2010).South African Diamond and Precious Metals Regulator. Available at www.sadpmr.co.za (accessed on 17
191

November 2010).South African Government News Agency. Over 100 cases against illegal miners and syndicates. Available at http://list.gcis.gov.za/mailman/listinfo/sanews (accessed on 2 July 2012).South African Government News Agency. Shabangu meets platinum industry over challenges. Available at http://list.gcis.gov.za/mailman/listinfo/sanews (accessed on 2 August 2012).Southern African Institute of Mining and Metallurgy. 2012. The rise of resource nationalism, June 2012 Report: A resurgence of state control in an era of free markets or the legitimate search for a new equilibrium? Mining Dialogue, p 360.Statistic South Africa. 2013. Mid-year Population estimates.
Statistic South Africa. 2014 Quarterly Labour Force Survey, Quarterly 4. 2013.
Statistic South Africa. LFS of February/March 2011 to 2008 and quarterly LFS of March 2001 and 2013.
Statistics South Africa. 2007. Mortality and causes of death in South Africa.
Statistics South Africa. Mid-Year population estimates, 2007. Statistical release PO302.
Statistics South Africa. Mid-year Population Estimates, 2011.
TEBA development, data collection on recent, current and planned retrenchments in the mining sector. A report compiled for the Human Resource Development Committee of the Minerals and Mining Development Board and the Mining Qualifications Authority, June 2009.
The Economist Intelligence Unit. World commodity forecast 2014.The Economist Intelligence Unit Limited. May 2014. World commodity forecast: industrial raw materials.The National Planning Commission Diagnostic Report, released June 2011.The New Growth Plan: Accord 1 National Skills Accord. Thomson Reuters, GFMS Platinum & Palladium Survey 2014. Available at: https://thomsonreutereikon.com/markets/metal-trading/. University of Cape Town. A perspective on the South African Mining industry in the 21st century. Available at www.bullion.co.za (accessed on 10 June 2010).University of the Witwatersrand. Gold Fields New Way of Communication Project. Wits Language School Available at http://www.witslanguageschool.com/Newsroom.aspx (accessed on 9 August 2012).Vogt, D. 2010. Personal interview with the Mining Technology Research Development Manager at the Council for Scientific and Industrial Research (CSIR), 15 November.
Wait, M. 2009. Codes of good practice clash with Mining Charter. Business Day, 13 November.
Wholesale and Retail Seta SSP 2011-2016.
World Business Council for Sustainable Development. 2002. Breaking new ground – Final report of the Mining, Minerals and Sustainable Development Project.
World Business Council for Sustainable Development. 2010. Mining, Minerals and Sustainable Development, Executive Brief, March 2010.
192

APPeNdICeS
APPeNdIX 1: MeTHodoLoGY USed IN THe deVeLoPMeNT of SeCTor ProfILeS
There is no single database that provides a complete and comprehensive profile of the MMS as it has been defined for the purposes of the Skills Development Act. In order to develop such a profile, a variety of data sources were used. For each of the subsectors and for each of the variables needed in the profile, the sources that provided the best data were selected.
Mining
For five of the mining subsectors (coal mining, gold mining, PGM mining, diamond mining and other mining), the LFS (employment in the first quarter of 2014) was used to establish total employment in each subsector.
Information on population group, gender, occupational distribution and educational levels was not available from the LFS database. However, the MQA has a relatively high return of WSPs/ATRs every year and the WSPs contain comprehensive information on the workforce of the sector. The WSPs/ATRs submitted for the financial year 2012/13 represented approximately 75% of the workers in the sector. Thus, for the purpose of establishing a sector profile, the individual records in the source data were weighted using the following formula:
Wa =Ea(DMR)/Ea(source data)
Where
Wa = the weight applied to records belonging to a particular subsector
Ea(DMR) = total employment in that subsector as reported by the DMR
Ea(source data) = total employment in that subsector in the WSP/ATR submissions in 2012/13
Services incidental to mining, CLAS, diamond processing and jewellery manufacturing
The WSP/ATR data of the CLAS subsector was weighted, using SDL payment information. Similarly, to arrive at an estimate of total employment in the services incidental to mining, diamond processing and jewellery manufacturing subsectors, SDL payments were used in weighting the source data. It was assumed that there is a direct relationship between the amount of levies paid by an organisation and the number of people employed. It was also assumed that organisations in a particular subsector would have similar wage structures and that the employment-levy relationship of companies that submitted WSPs/ATRs would be the same as for those in the same subsector that did not submit WSPs/ATRs. Thus, the weights applied to individual employee records in these four subsectors were calculated using the following formula:
193

Wa=La/Law
where
Wa = the weight applied to records belonging to a particular subsector
La = total levies paid by organisations in the subsector in 2014/2015
Law = total levies paid by organisations in the subsector in 2014/2015 that submitted WSPs
The weights calculated were also applied to the individual records in the source data.
194

SubsectorSIC code(Department of Labour)
Description of activity
Coal mining 21000 Mining of coal and lignite
Gold mining
23000 Mining of gold and uranium ore
23001 Thin tabular operations
23002 Thick tabular operations
23003 Massive mining operations
PGM mining 24240 Platinum group metals
Diamond mining
25200 Mining of diamonds (including alluvial diamonds)
25201 Marine mining operations
25202 Coastal mining operations
Other mining
24000 Mining of metal ores, except gold and uranium
24100 Mining of iron ore
24200Mining of non-ferrous metal ores, except gold and uranium
24210 Chrome
24220 Copper
24230 Manganese
24290Other metal ore mining, except gold and uranium
25000 Other mining and quarrying
25102 Open cast/strip mining operations
25103 Open-pit operations
25300 Mining and quarrying not elsewhere classified
25310 Mining of chemical and fertilizer minerals
25311 Phosphates
25319 Other chemical and fertilizer mineral mining
25320 Extraction and evaporation of salt
25390Other mining and quarrying not elsewhere classified
25391Mining of precious and semi-precious stones, except diamonds
25392 Asbestos
25399Other minerals and materials not elsewhere classified
APPeNdIX 2: SIC CodeS ANd SUBSeCTorS USed IN THe MMS
195

Cement, lime, aggregates and sand (CLAS)
34240 Manufacturing of cement, lime and plaster
25100 Stone quarrying, clay and sandpits
25110Dimension stone (granite, marble, slate and wonderstone)
25101 Quarrying/dimension stone operations
25120 Limestone and lime works
25190 Other stone quarrying, including stone crushing and clay and sandpits
Services incidental to mining
92004Education by technical colleges and technical institutions
87000 Research and development
29000 Service activities incidental to mining of minerals
Diamond processing
39212 Diamond cutting and polishing
39219Other precious and semi-precious stone cutting and polishing
Jewellery manufacturing
39210 Manufacturing of jewellery and related articles
39211Jewellery and related articles composed of precious metals, precious and semi-precious stones and pearls
196

APPeNdIX 3: MMS SCArCe SKILLS LIST SUBMITTed BY THe MINING QUALIfICATIoNS AUTHorITY oN 5 JULY 2014
ofo
Code
Occupati
on
Specialisation Listed
Absolute - lack of
skilled people
Absolute - new
or em
erging occupation
Absolute - replacem
ent dem
and
Other
Relative scarce skill -
employm
ent equity
Relative scarce skill -
geographic location
Relative scarce skill -
industry attracti
veness
Relative scarce skill -
replacement dem
and
Total Scarcity
Total Employm
ent
Intensity
134916Operations Foreman (Non Manufacturing)
Seed Processing Plant Foreman - 134916
714 3 717 168 427%
711302Rock Drill Operator
Rock Drill Operator - 711302
372 40 412 28966 1%
734301Crane or Hoist Operator
Winding Engine Driver (Materials) - 734301
273 2 5 3 4 54 341 36059 1%
312102 Miner Sinker - 312102 73 2 2 7 17 38 97 236 19372 1%
312101
Production / Operations Supervisor (Mining)
Production / Operations Supervisor (Mining) - 312101
58 12 2 18 12 15 43 161 16877 1%
651302 Boiler MakerBoilermaker - 651302
73 14 0 15 7 5 132 4107 3%
653306 Diesel MechanicDiesel Mechanic - 653306
60 19 3 11 12 26 131 3287 4%
733208Mobile Mining Equipment Operator
Vacuum Sweeper Operator - 733208
44 69 113 4133 3%
671101 ElectricianElectrician - 671101
43 2 1 3 22 27 13 111 6138 2%
711101 Mining OperatorMining Operator - 711101
24 22 10 7 6 39 108 33931 0%
652302 Fitter and TurnerIndustrial Mechanician - 652302
49 2 12 19 9 91 3113 3%
132201
Production / Operations Manager (Mining)
Production / Operations Manager (Mining) - 132201
19 14 3 1 5 38 4 85 1299 7%
215101Electrical Engineer
Electrical Engineer - 215101
17 34 2 2 10 6 4 75 236 32%
132104Engineering Manager
Engineering Maintenance Manager - 132104
48 2 3 7 1 2 8 71 634 11%
197

ofo
Code
Occupati
on
Specialisation Listed
Absolute - lack of
skilled people
Absolute - new
or em
erging occupation
Absolute - replacem
ent dem
and
Other
Relative scarce skill -
employm
ent equity
Relative scarce skill -
geographic location
Relative scarce skill -
industry attracti
veness
Relative scarce skill -
replacement dem
and
Total Scarcity
Total Employm
ent
Intensity
214601 Mining Engineer Metalliferous Mining Engineer - 214601
45 2 12 1 3 5 69 732 9%
651501 Rigger Rigger - 651501 29 13 1 4 9 11 67 1947 3%
684202 BlasterMining / Quarrying Blaster - 684202
11 37 14 62 169 37%
671208Transportation Electrician
Vehicle Electrician - 671208
36 1 1 3 15 5 61 385 16%
216502 SurveyorTopographer and Hydrographer - 216502
34 2 2 3 6 9 4 60 1034 6%
672105Instrument Mechanician
Instrument Mechanician (Process Control Systems) - 672105
46 5 1 4 2 1 59 807 7%
214101Industrial Engineer
Industrial Engineer - 214101
39 2 2 2 5 4 2 56 561 10%
671202 MillwrightMillwright - 671202
37 0 3 16 56 1812 3%
711301 DrillerDrill Rig Operator - 711301
33 4 6 2 11 56 17428 0%
214401Mechanical Engineer
Mechanical Engineer - 214401
34 2 0 2 11 4 2 55 899 6%
122201Advertising and Public Relations Manager
Media Advisor / Manager - 122201
53 53 38 139%
653303Mechanical Fitter
Mechanical Fitter - 653303
36 2 4 5 47 3446 1%
311701Mining Technician
Mine Planner - 311701
36 1 4 3 1 45 756 6%
312202Maintenance Planner
Maintenance Scheduler - 312202
8 1 26 6 41 1070 4%
734205 Grader OperatorGrader Operator - 734205
15 3 20 2 40 515 8%
198

ofo
Code
Occupati
on
Specialisation Listed
Absolute - lack of
skilled people
Absolute - new
or em
erging occupation
Absolute - replacem
ent dem
and
Other
Relative scarce skill -
employm
ent equity
Relative scarce skill -
geographic location
Relative scarce skill -
industry attracti
veness
Relative scarce skill -
replacement dem
and
Total Scarcity
Total Employm
ent
Intensity
226302
Safety, Health, Environment and Quality (SHE&Q) Practitioner
Occupational Hygienist - 226302
19 0 1 2 6 10 39 1899 2%
211401 GeologistGeologist - 211401
27 4 2 1 4 38 899 4%
214201 Civil EngineerGeotechnical Engineer - 214201
15 15 2 3 2 37 179 21%
132102
Production / Operations Manager (Manufacturing)
Operations Manager (Production) - 132102
14 15 3 1 1 34 906 4%
214603Metallurgical Engineer
Metallurgical Engineer - 214603
2 3 2 1 2 24 34 297 11%
734206 Loader OperatorLoad-haul-dump (LHD) Operator - 734206
9 5 0 20 34 10845 0%
661301 GoldsmithPlatinumsmith - 661301
15 18 33 147 22%
243201Communication Coordinator
Coordinator External / Internal Communication - 243201
28 28 118 24%
121202Business Training Manager
Training Manager - 121202
25 1 26 265 10%
652301 Metal MachinistVertical Borer - 652301
9 12 5 26 582 4%
734204Excavator Operator
Excavator Driver - 734204
26 26 1874 1%
311801 DraughtspersonTopographic Draughting Officer - 311801
17 1 3 4 0 25 604 4%
642701Air-conditioning and Refrigeration Mechanic
Air Conditioning Technician - 642701
25 25 6 417%
132404Warehouse Manager
Warehouse Manager - 132404
21 1 22 43 51%
215202Electronics Engineering Technologist
Instrumentation Technologist - 215202
13 1 4 3 21 141 15%
199

ofo
Code
Occupati
on
Specialisation Listed
Absolute - lack of
skilled people
Absolute - new
or em
erging occupation
Absolute - replacem
ent dem
and
Other
Relative scarce skill -
employm
ent equity
Relative scarce skill -
geographic location
Relative scarce skill -
industry attracti
veness
Relative scarce skill -
replacement dem
and
Total Scarcity
Total Employm
ent
Intensity
831301 Builder's Worker
Maintenance Person / Coordinator - 831301
21 21 3249 1%
214402Mechanical Engineering Technologist
Mechanical Engineering Technologist - 214402
18 2 20 82 24%
734213Road Roller Operator
Road Roller Operator - 734213
20 20 27 74%
311301Electrical Engineering Technician
Electrical Engineering Technician - 311301
12 1 2 4 19 610 3%
215102Electrical Engineering Technologist
Power Engineering Technologist - 215102
15 2 17 21 81%
243103Marketing Practitioner
Sales Promotion Officer - 243103
17 17 128 13%
313301Chemical Plant Controller
Chemical Process Technician - 313301
17 17 425 4%
734203Bulldozer Operator
Scraper Operator (Earthmoving) - 734203
4 13 17 1279 1%
242401Training and Development Professional
Training Officer - 242401
5 1 9 1 16 1824 1%
121206Health and Safety Manager
Health and Safety Manager - 121206
12 1 1 1 15 309 5%
132202Mineral Resources Manager
Mineral Resources Manager - 132202
6 0 1 2 3 3 0 15 713 2%
133102ICT Project Manager
ICT / IT / Computer Support Manager - 133102
15 15 27 56%
242402Occupational Instructor / Trainer
Mechanical Instructor - 242402
4 1 2 8 15 1331 1%
311501Mechanical Engineering Technician
Mechanical Engineering Technician - 311501
11 1 2 1 15 713 2%
200

ofo
Code
Occupati
on
Specialisation Listed
Absolute - lack of
skilled people
Absolute - new
or em
erging occupation
Absolute - replacem
ent dem
and
Other
Relative scarce skill -
employm
ent equity
Relative scarce skill -
geographic location
Relative scarce skill -
industry attracti
veness
Relative scarce skill -
replacement dem
and
Total Scarcity
Total Employm
ent
Intensity
325707Mines Safety Inspector
Mines Safety Officer - 325707
3 2 1 9 15 1365 1%
831101Mining Support Worker
Ventilation Observer - 831101
15 15 80293 0%
242204Corporate Treasurer
Financial Risk Manager - 242204
14 14 11 127%
112101Director (Enterprise / Organisation)
Managing Director - 112101
9 4 13 696 2%
311502Boilers and Pressure Vessels Inspector
Boilers and Pressure Vessels Inspector - 311502
13 13 2 650%
241104 External Auditor Auditor - 241104 11 11 38 29%
215201Electronics Engineer
Instrumentation Engineer - 215201
10 10 43 23%
311702Metallurgical or Materials Technician
Non Destructive Testing Technician - 311702
6 4 10 870 1%
311707Strata Control Officer
Strata Control Officer - 311707
2 8 10 217 5%
441903Program or Project Administrators
Project Programme Specialist - 441903
8 1 1 10 1143 1%
441905
Account Clerk (Public Relations / Communication)
Account Clerk (Public Relations / Communication) - 441905
10 10 13 77%
651202 Welder Welder - 651202 3 1 6 10 464 2%
653307Heavy Equipment Mechanic
Earthmoving Equipment Mechanic - 653307
6 4 10 93 11%
733201Truck Driver (General)
Dumper Truck Driver - 733201
5 5 10 3814 0%
214102Industrial Engineering Technologist
Industrial Engineering Technologist - 214102
8 8 135 6%
214605 MetallurgistMetallurgist - 214605
4 2 1 1 8 408 2%
201

ofo
Code
Occupati
on
Specialisation Listed
Absolute - lack of
skilled people
Absolute - new
or em
erging occupation
Absolute - replacem
ent dem
and
Other
Relative scarce skill -
employm
ent equity
Relative scarce skill -
geographic location
Relative scarce skill -
industry attracti
veness
Relative scarce skill -
replacement dem
and
Total Scarcity
Total Employm
ent
Intensity
222109Registered Nurse (Medical Practice)
Registered Nurse (Medical Practice) - 222109
8 8 226 4%
263101 EconomistMineral Economist - 263101
6 1 1 8 55 15%
661302Diamond and Gemstone Setter
Diamond and Gemstone Setter - 661302
2 6 8 25 32%
671206Electrical Equipment Mechanic
Electrical Equipment Mechanic - 671206
8 8 3 267%
731101 Train DriverTrain Driver - 731101
0 8 8 16793 0%
242208Organisational Risk Manager
Risk Compliance Manager - 242208
7 7 147 5%
653101Automotive Motor Mechanic
Auto Engineer / Mechanic - 653101
5 1 7 222 3%
711201
Mineral Processing Machine Operator
Stone Turner Lathe - 711201
1 2 4 7 8378 0%
734211Dragline Operator
Dragline Operator - 734211
2 0 2 1 2 7 216 3%
121904Contract Manager
Contract Manager - 121904
2 4 6 147 4%
121908Quality Systems Manager
Quality Manager - 121908
6 6 194 3%
122102 Sales ManagerSales Manager - 122102
6 6 205 3%
133104Application Development Manager
ICT Development Manager - 133104
6 6 33 18%
214202Civil Engineering Technologist
Civil Engineering Technologist - 214202
6 6 23 26%
241101Accountant (General)
Accountant (General) - 241101
1 1 2 2 6 774 1%
311201Civil Engineering Technician
Civil Engineering Technician - 311201
6 6 165 4%
202

ofo
Code
Occupati
on
Specialisation Listed
Absolute - lack of
skilled people
Absolute - new
or em
erging occupation
Absolute - replacem
ent dem
and
Other
Relative scarce skill -
employm
ent equity
Relative scarce skill -
geographic location
Relative scarce skill -
industry attracti
veness
Relative scarce skill -
replacement dem
and
Total Scarcity
Total Employm
ent
Intensity
311705Mine Ventilation Observer
Mine Ventilation Officer - 311705
3 3 6 466 1%
711202
Jewellery Processing and Finishing Machine Operator
Wax Injector (Jewellery) - 711202
6 6 72 8%
831102 Driller's AssistantDrillers Assistant - 831102
6 6 2437 0%
134902Laboratory Manager
Laboratory Manager - 134902
2 3 5 69 7%
211301 ChemistLaboratory Chemist - 211301
5 5 307 2%
213302Environmental Scientist
Environmental Officer - 213302
4 1 0 5 370 1%
214604Metallurgical Engineering Technologist
Metallurgical Engineering Technologist - 214604
2 2 1 5 83 6%
216303Jewellery Designer
Jewellery Industrial Designer - 216303
5 5 13 38%
221101General Medical Practitioner
Medical Practitioner - 221101
5 5 96 5%
311704Geophysical Technician
Geotechnician - 311704
5 5 283 2%
718905Engineering Production Systems Worker
Engineering Production Systems Worker - 718905
2 3 5 5047 0%
121101 Finance Manager
Revenue Assessment Manager - 121101
4 4 820 0%
132401Supply and Distribution Manager
Procurement Manager - 132401
1 2 1 4 253 2%
242303Human Resource Advisor
Hr Officer - 242303
2 1 1 4 2070 0%
251101ICT Systems Analyst
ICT Systems Specialist - 251101
3 1 0 4 210 2%
203

ofo
Code
Occupati
on
Specialisation Listed
Absolute - lack of
skilled people
Absolute - new
or em
erging occupation
Absolute - replacem
ent dem
and
Other
Relative scarce skill -
employm
ent equity
Relative scarce skill -
geographic location
Relative scarce skill -
industry attracti
veness
Relative scarce skill -
replacement dem
and
Total Scarcity
Total Employm
ent
Intensity
312201
Production / Operations Supervisor (Manufacturing)
Production Plant Supervisor - 312201
2 2 4 1623 0%
313201Water Plant Operator
Pumping-station Operator - 313201
4 4 147 3%
411101 General Clerk
Operation Services / Support Officer - 411101
4 4 6393 0%
684101 Diver Diver - 684101 3 1 4 6 67%
711203 Diamond CutterDiamond Grader - 711203
2 2 4 480 1%
832901Metal Engineering Process Worker
Fitters Assistant - 832901
4 4 11356 0%
121201Personnel / Human Resource Manager
Transition Manager - 121201
3 3 501 1%
121901Corporate General Manager
Business Operations Manager - 121901
3 3 466 1%
122101Sales and Marketing Manager
Sales and Marketing Manager - 122101
1 1 1 0 3 134 2%
122301Research and Development Manager
Research Director - 122301
3 3 34 9%
132203Rock Engineering Manager
Rock Engineering Manager - 132203
3 3 45 7%
214501Chemical Engineer
Chemical Engineer - 214501
0 3 3 65 5%
235102Education or Training Reviewer
School Inspector - 235102
3 3 8 38%
242101Management Consultant
Business Analyst - 242101
1 2 3 295 1%
331201Credit or Loans Officer
Finance Clerk / Officer - 331201
3 3 291 1%
331301 BookkeeperBookkeeper - 331301
2 1 3 303 1%
204

ofo
Code
Occupati
on
Specialisation Listed
Absolute - lack of
skilled people
Absolute - new
or em
erging occupation
Absolute - replacem
ent dem
and
Other
Relative scarce skill -
employm
ent equity
Relative scarce skill -
geographic location
Relative scarce skill -
industry attracti
veness
Relative scarce skill -
replacement dem
and
Total Scarcity
Total Employm
ent
Intensity
351302
Geographic Information Systems Technicians
Technical Support Specialist - 351302
3 3 25 12%
431204Insurance Claims Administrator
Insurance Claims Administrator - 431204
3 3 6 50%
431301 Payroll ClerkPayroll Clerk - 431301
2 1 3 529 1%
432201Production Coordinator
Production Foreman - 432201
3 3 2625 0%
441301 Coding ClerkCoding Data Processing Clerk - 441301
3 3 21 14%
441902Contract Administrator
Contract Administrator - 441902
3 3 128 2%
522301Sales Assistant (General)
Sales Person / Consultant - 522301
3 3 46 7%
641201 BricklayerBricklayer - 641201
3 3 129 2%
641502 CarpenterCarpenter - 641502
3 3 248 1%
642601 PlumberPlumber - 642601
3 3 96 3%
831103Mineral Beneficiation Plant Worker
Mineral Beneficiation Plant Worker - 831103
3 3 3813 0%
134901Environmental Manager
Environmental Manager - 134901
0 2 2 107 2%
211402 GeophysicistGeophysicist - 211402
0 2 2 17 12%
214301Environmental Engineer
Environmental Engineer - 214301
2 2 22 9%
214902Explosive Ordnance Engineer
Explosive Ordnance Engineer - 214902
2 2 1 200%
221211 Surgeon
Occupational Medicine Specialist - 221211
2 2 5 40%
205

ofo
Code
Occupati
on
Specialisation Listed
Absolute - lack of
skilled people
Absolute - new
or em
erging occupation
Absolute - replacem
ent dem
and
Other
Relative scarce skill -
employm
ent equity
Relative scarce skill -
geographic location
Relative scarce skill -
industry attracti
veness
Relative scarce skill -
replacement dem
and
Total Scarcity
Total Employm
ent
Intensity
226902Occupational Therapist
Occupational Therapist - 226902
2 2 5 40%
241106Accountant in Practice
Accountant in Practice - 241106
1 1 2 12 17%
241107Financial Accountant
Financial Accountant - 241107
1 1 2 310 1%
242302
Skills Development Facilitator / Practitioner
Workforce Planning Analyst - 242302
2 2 124 2%
265203Musician (Instrumental)
Instrumentalist - 265203
1 1 2 1 200%
311101Chemistry Technician
Chemistry Technician - 311101
2 2 764 0%
311706Rock Engineering Technician
Rock Engineering Technician - 311706
0 2 2 123 2%
332301 Retail BuyerGeneral / Company Buyer - 332301
2 2 248 1%
341110Associate Legal Professional
Legal Officer - 341110
2 2 49 4%
641501Carpenter and Joiner
Woodworker - 641501
2 2 38 5%
642302 PlastererPlasterer - 642302
2 2 1 200%
643101 Painter Painter - 643101 2 2 72 3%
653109Automotive Engine Mechanic
Automotive Engine Mechanic - 653109
2 2 3 67%
661303Jewellery Evaluator
Jewellery Evaluator - 661303
2 2 81 2%
711401
Concrete Products Machine Operator
Concrete Pump Operator - 711401
2 2 116 2%
711405Concrete Batching Plant Operator
Concrete Batching Plant Operator - 711405
2 2 293 1%
111207Senior Government Manager
Superintendent-general - 111207
1 1 39 3%
206

ofo
Code
Occupati
on
Specialisation Listed
Absolute - lack of
skilled people
Absolute - new
or em
erging occupation
Absolute - replacem
ent dem
and
Other
Relative scarce skill -
employm
ent equity
Relative scarce skill -
geographic location
Relative scarce skill -
industry attracti
veness
Relative scarce skill -
replacement dem
and
Total Scarcity
Total Employm
ent
Intensity
121203Compensation and Benefits Manager
Remuneration and Benefits Manager - 121203
1 1 34 3%
121905Programme or Project Manager
Project Director - 121905
0 1 1 413 0%
121909Sustainability Manager
Sustainability Manager - 121909
1 1 15 7%
134402Community Development Manager
Community Development Manager - 134402
1 1 49 2%
143905Call or Contact Centre Manager
Contact Centre Manager: Resource Planner - 143905
1 1 3 33%
211404 GemologistDiamond Gemologist - 211404
1 1 5 20%
214104Production Engineering Technologist
Automation and Control Technologist - 214104
1 1 24 4%
222104Registered Nurse (Community Health)
Occupational Health Nurse - 222104
1 1 103 1%
226301Environmental Health Officer
Environmental Health Officer - 226301
1 1 32 3%
235101Education or Training Advisor
Teaching Aids Specialist - 235101
1 56 2%
235205Adult Education Teacher
Teacher of Gifted Children - 235205
1 1 183 1%
242202 Policy AnalystSpecial Projects Analyst - 242202
1 1 73 1%
242203Company Secretary
Company Secretary - 242203
1 1 71 1%
243102Market Research Analyst
Marketing Analyst - 243102
1 1 42 2%
251201Software Developer
Software Engineer - 251201
1 1 24 4%
252101Database Designer and Administrator
Database Architect - 252101
1 1 125 1%
207

ofo
Code
Occupati
on
Specialisation Listed
Absolute - lack of
skilled people
Absolute - new
or em
erging occupation
Absolute - replacem
ent dem
and
Other
Relative scarce skill -
employm
ent equity
Relative scarce skill -
geographic location
Relative scarce skill -
industry attracti
veness
Relative scarce skill -
replacement dem
and
Total Scarcity
Total Employm
ent
Intensity
262202Information Services Manager
Knowledge Management Officer - 262202
1 1 64 2%
263204 SociologistSociologist - 263204
1 1 100%
311601Chemical Engineering Technician
Energy Technician - 311601
1 1 5 20%
313912
Mineral Beneficiation Process Controller
Mineral Beneficiation Process Controller - 313912
1 1 918 0%
341201Community Worker
Community Development Officer - 341201
1 1 91 1%
431101 Accounts ClerkSettlement Clerk / Officer - 431101
1 1 912 0%
432101Stock Clerk / Officer
Stores Clerk / Officer - 432101
1 1 1552 0%
641301 Stonemason
Masonry Carver / Cutter / Setter Monumental - 641301
1 1 31 3%
734201Earthmoving Plant Operator (General)
Earthmoving Plant Operator (General) - 734201
1 1 1231 0%
833401 Shelf FillerWarehouse Worker / Shelver - 833401
1 1 127 1%
862918Electrical or Tele-communications Trades Assistant
Measurement, Control and Instrumentation MC&I) Assistant - 862918
1 1 3993 0%
Grand Total 25 2272 867 174 51 135 271 996 537 5328 391690
208

APP
eNd
IX 4
: MIN
ING
CH
ArT
er S
eCo
reCA
rd
Elem
ent
Des
crip
tion
Mea
sure
Com
plia
nce
targ
et b
y 20
14
Prog
ress
ach
ieve
d by
Wei
ghti
ng20
1020
1120
1220
1320
14
1Re
porti
ngH
as th
e co
mpa
ny re
port
ed th
e le
vel o
f co
mpl
ianc
e w
ith th
e Ch
arte
r fo
r th
e ca
lend
ar y
ear?
Doc
umen
tary
pro
of o
f re
ceip
t fro
m th
e de
part
men
tA
nnua
llyM
arch
20
11M
arch
20
12M
arch
20
13M
arch
20
14M
arch
20
15Y/
N
2O
wne
rshi
pM
inim
um ta
rget
for
effec
tive
HD
SA
owne
rshi
pM
eani
ngfu
l eco
nom
ic
parti
cipa
tion
26%
15%
26%
Y/N
Full
shar
ehol
der
righ
ts26
%15
%26
%
3H
ousi
ng
and
livin
g co
nditi
ons
Conv
ersi
on a
nd u
pgra
ding
of h
oste
ls to
att
ain
the
occu
panc
y ra
te o
f one
per
son
per
room
Perc
enta
ge re
ducti
on o
f oc
cupa
ncy
rate
tow
ards
201
4 ta
rget
Occ
upan
cy ra
te
of o
ne p
erso
n pe
r ro
omBa
selin
e25
%50
%75
%10
0%Y/
NCo
nver
sion
and
upg
radi
ng o
f hos
tels
to
fam
ily u
nits
Perc
enta
ge c
onve
rsio
n of
ho
stel
s in
to fa
mily
uni
tsFa
mily
uni
ts
esta
blis
hed
Base
line
25%
50%
75%
100%
4
Proc
urem
ent
and
ente
rpri
se
deve
lopm
ent
Proc
urem
ent s
pent
from
BEE
enti
tyCa
pita
l goo
ds40
%5%
10%
20%
30%
40%
5%
Serv
ices
70%
30%
40%
50%
60%
70%
5%Co
nsum
able
goo
ds50
%10
%15
%25
%40
%50
%2%
Mul
tinati
onal
sup
plie
rs’ c
ontr
ibuti
on to
the
soci
al fu
nd
Ann
ual s
pend
on
proc
urem
ent f
rom
m
ultin
ation
al s
uppl
iers
0.5%
of
proc
urem
ent
valu
e0.
50%
0.50
%0.
50%
0.50
%0.
50%
3%
5Em
ploy
men
t eq
uity
Div
ersi
ficati
on o
f the
wor
kpla
ce to
refle
ct
the
coun
try’
s de
mog
raph
ics
to a
ttai
n co
mpe
titive
ness
Top
man
agem
ent
(Boa
rd)
40%
20%
25%
30%
35%
40%
3%Se
nior
man
agem
ent (
Exco
)40
%20
%25
%30
%35
%40
%4%
Mid
dle
man
agem
ent
40%
30%
35%
40%
40%
40%
3%Ju
nior
man
agem
ent
40%
40%
40%
40%
40%
40%
1%Co
re S
kills
40%
15%
20%
25%
30%
40%
5%
6H
uman
re
sour
ce
deve
lopm
ent
Dev
elop
men
t of r
equi
site
ski
lls, i
nclu
ding
su
ppor
t for
Sou
th A
fric
an-b
ased
rese
arch
an
d de
velo
pmen
t ini
tiativ
es in
tend
ed to
de
velo
p so
lutio
ns in
exp
lora
tion,
min
ing,
pr
oces
sing
, tec
hnol
ogy
effici
ency
(ene
rgy
and
wat
er u
se in
min
ing)
, ben
efici
ation
as
wel
l as
envi
ronm
enta
l con
serv
ation
HRD
exp
endi
ture
as
perc
enta
ge o
f tot
al a
nnua
l pa
yrol
l (ex
cl. m
anda
tory
ski
lls
deve
lopm
ent l
evy)
5%3%
3.5%
4.0%
4.5%
5.0%
25%
7M
ine
com
mun
ity
deve
lopm
ent
Cond
uct e
thno
grap
hic
cons
ulta
tive
and
colla
bora
tive
com
mun
ity p
roce
sses
to
delin
eate
com
mun
ity n
eeds
ana
lysi
s
Impl
emen
t app
rove
d co
mm
unity
pro
ject
s
Up-
to-d
ate
proj
ect
impl
emen
tatio
n
Impl
emen
tatio
n of
pro
ject
s w
ill s
erve
to e
nhan
ce
rela
tions
hips
am
ong
stak
ehol
ders
, lea
ding
to
com
mun
ities
taki
ng o
wne
rshi
p of
pro
ject
s15
%
209

Elem
ent
Des
crip
tion
Mea
sure
Com
plia
nce
targ
et b
y 20
14
Prog
ress
ach
ieve
d by
Wei
ghti
ng20
1020
1120
1220
1320
14
8Su
stai
nabl
e de
velo
pmen
t an
d gr
owth
Impr
ovem
ent o
f the
indu
stry
’s
envi
ronm
enta
l man
agem
ent
Impl
emen
tatio
n of
app
rove
d EM
Ps10
0%A
nnua
l pro
gres
s ag
ains
t app
rove
d EM
Ps12
%
Impr
ovem
ent o
f the
indu
stry
’s m
ine
heal
th
and
safe
ty p
erfo
rman
ce
Impl
emen
tatio
n of
trip
artit
e ac
tion
plan
on
heal
th a
nd
safe
ty10
0%A
nnua
l pro
gres
s ac
hiev
ed a
gain
st c
omm
itmen
ts in
th
e tr
ipar
tite
actio
n pl
an o
n he
alth
and
saf
ety
12%
Util
isati
on o
f Sou
th A
fric
an-b
ased
rese
arch
fa
ciliti
es fo
r an
alys
is o
f sam
ples
acr
oss
min
ing
valu
e
Perc
enta
ge o
f sam
ples
in
Sout
h A
fric
an fa
ciliti
es10
0%Es
tabl
ish
base
line
25%
50%
75%
100%
5%
9Be
nefic
iati
onCo
ntri
butio
n of
a m
inin
g co
mpa
ny to
war
ds
bene
ficia
tion
(thi
s m
easu
re is
effe
ctive
from
20
12)
Add
ition
al p
rodu
ction
vo
lum
e co
ntri
butin
g to
loca
l va
lue
addi
tion
beyo
nd th
e ba
selin
e
Secti
on 2
6 of
th
e M
PRD
A
(per
cent
age
abov
e ba
selin
e)
The
bene
ficia
tion
stra
tegy
and
its
mod
aliti
es
of im
plem
enta
tion
outli
ne th
e be
nefic
iatio
n re
quire
men
ts p
er c
omm
odity
ext
ract
ed in
Sou
th
Afr
ica
-
ToT A
L SC
ore
100%
Y/N
app
lies
to p
illar
s th
at a
re r
ing-
fenc
ed.
210

APP
eNd
IX 5
: LeA
der
SHIP
eN
roLM
eNTS
AN
d A
CHIe
VeM
eNTS
200
1 T0
201
2
Lear
ners
hip
enro
lmen
ts fr
om 2
001
to 2
012
acco
rdin
g to
qua
lifica
tion
Qua
lifica
tion
2001
2002
2003
2004
2005
2006
2007
2008
2009
2010
2011
2012
Tota
l
Nati
onal
Cer
tifica
te D
iam
ond
Proc
essi
ng –
Aut
omati
c Po
lishi
ng
1
1
Nati
onal
Cer
tifica
te D
iam
ond
Proc
essi
ng –
Bott
om P
olis
hing
5
5
Na ti
onal
Cer
tifica
te D
iam
ond
Proc
essi
ng –
Top
Pol
ishi
ng
5
5
Nati
onal
Cer
tifica
te D
iam
ond
Proc
essi
ng O
pera
ting
– O
pera
tor
Bott
om M
akea
ble
2
2
Na ti
onal
Cer
tifica
te D
iam
ond
Proc
essi
ng O
pera
ting
– O
pera
tor
Bott
om S
awn
2
3
63
8
76
Nati
onal
Cer
tifica
te D
iam
ond
Proc
essi
ng O
pera
ting
– O
pera
tor
Top
Mak
eabl
e
1
1
Nati
onal
Cer
tifica
te D
iam
ond
Proc
essi
ng O
pera
ting
– O
pera
tor
Top
Saw
n
253
560
Nati
onal
Cer
tifica
te D
iese
l Mec
hani
c –
Coal
1
1
2
Na ti
onal
Cer
tifica
te D
iese
l Mec
hani
c –
Met
allif
erou
s
2
2
1
5
Nati
onal
Cer
tifica
te D
iese
l Mec
hani
c –
Ope
ncas
t
1
1
Nati
onal
Cer
tifica
te E
lect
rica
l – M
etal
lifer
ous
2
1
4
21
10
Nati
onal
Cer
tifica
te E
lect
rica
l – O
penc
ast
1
5
1
7
Nati
onal
Cer
tifica
te E
lect
rica
l – S
urfa
ce C
oal
1
1
2
Nati
onal
Cer
tifica
te E
lect
rica
l – U
nder
grou
nd C
oal
28
10
Nati
onal
Cer
tifica
te E
lect
ro M
echa
nics
– E
ngin
eeri
ng a
nd T
echn
olog
y
1
1
Nati
onal
Cer
tifica
te F
itter
and
Tur
ner
– O
penc
ast
1
1
Nati
onal
Cer
tifica
te F
itting
(inc
ludi
ng m
achi
ning
) – O
penc
ast
1
1
1
3
211

Qua
lifica
tion
2001
2002
2003
2004
2005
2006
2007
2008
2009
2010
2011
2012
Tota
l
Nati
onal
Cer
tifica
te F
itting
(inc
ludi
ng m
achi
ning
) – S
urfa
ce C
oal
1
2
3
Nati
onal
Cer
tifica
te F
itting
(inc
ludi
ng m
achi
ning
) – M
etal
lifer
ous
1
13
36
54
23
Nati
onal
Cer
tifica
te F
itting
and
Tur
ning
– M
etal
lifer
ous
1
1
2
Nati
onal
Cer
tifica
te F
itting
and
Tur
ning
– U
nder
grou
nd C
oal
1
1
2
Nati
onal
Cer
tifica
te in
Aut
otro
nics
L4
1
1
Na ti
onal
Cer
tifica
te in
Jew
elle
ry M
anuf
actu
re in
a P
rodu
ction
Env
ironm
ent
1
2
64
13
Nati
onal
Cer
tifica
te i
n M
inin
g O
pera
tions
for
Und
ergr
ound
Har
d Ro
ck –
Nar
row
Ta
bula
r
11
2
Nati
onal
Cer
tifica
te In
stru
men
tatio
n M
echa
nici
an
13
4
Nati
onal
Cer
tifica
te L
ump
Ore
Ben
efici
ation
– Ji
g Co
ncen
trati
on (v
ersi
on 2
)
15
15
Nati
onal
Cer
tifica
te M
illw
righ
t – C
oal
1
1
Na ti
onal
Cer
tifica
te M
illw
righ
t – O
penc
ast
11
1
44
11
Nati
onal
Cer
tifica
te M
iner
al P
roce
ssin
g –
Base
Met
al
2
2
Na ti
onal
Cer
tifica
te M
inin
g O
pera
tions
Und
ergr
ound
Har
d Ro
ck (
V2)
2
2
Nati
onal
Cer
tifica
te P
late
r/Bo
ilerm
aker
– C
oal
1
1
Nati
onal
Cer
tifica
te P
late
r/Bo
ilerm
aker
– M
etal
lifer
ous
2
2
Nati
onal
Cer
tifica
te P
late
r/Bo
ilerm
aker
– O
penc
ast
12
3
Nati
onal
Cer
tifica
te P
late
r/W
elde
r –
Coal
4
4
Nati
onal
Cer
tifica
te P
late
r/W
elde
r - M
etal
lifer
ous
1
4
5
Nati
onal
Cer
tifica
te P
late
r/W
elde
r –
Ope
ncas
t
2
1
2
712
Nati
onal
Cer
tifica
te R
igge
r Ro
pesm
an –
Sur
face
/Und
ergr
ound
1
1
Nati
onal
Cer
tifica
te R
ockb
reak
ing
Und
ergr
ound
Har
droc
k –
Conv
entio
nal M
inin
g
1
1
212

Qua
lifica
tion
2001
2002
2003
2004
2005
2006
2007
2008
2009
2010
2011
2012
Tota
l
Nati
onal
Ce
rtific
ate:
En
gine
erin
g M
aint
enan
ce
for
Und
ergr
ound
H
ard
Rock
(M
etal
lifer
ous)
– S
topi
ng a
nd D
evel
opm
ent
1
1
2
Nati
onal
Cer
tifica
te: J
ewel
lery
Man
ufac
turi
ng
2
2
Team
Lea
der
5
5
Aut
otro
nics
L2
4
11
6
Com
mun
ity H
ouse
Bui
lder
(En t
repr
eneu
rial
)
5
4
9
Cons
truc
tion
Carp
ente
r (F
orm
wor
k)
1
1
Cons
truc
tion
Mas
on (F
ace
Bric
k La
ying
)
1
1
Cons
truc
tion
Plum
ber
64
1
11
Die
sel M
echa
nic
– U
nder
grou
nd D
iam
onds
1
1
FETC
(Fur
ther
Edu
catio
n an
d Tr
aini
ng C
ertifi
cate
) Dia
mon
d Pr
oces
sing
– B
rutin
g
1
1
FETC
Dia
mon
d Pr
oces
sing
– C
ross
wor
king
1021
31
FETC
Dia
mon
d Pr
oces
sing
– B
rilli
ante
erin
g
5
5
Firs
t Lin
e M
anag
er
1
1
FET C
Car
bona
te M
ater
ials
Man
ufac
turi
ng P
roce
ss –
Cem
ent M
anuf
actu
ring
1413
27
FET C
Car
bona
te M
ater
ials
Man
ufac
turi
ng P
roce
ss –
Lim
e M
anuf
actu
ring
21
3
FETC
Jew
elle
ry M
anuf
actu
ring
Ope
ratio
ns
6
6
FETC
Min
eral
s Su
rvey
ing
1
1
Lear
ners
hip
Tow
ards
Nati
onal
Cer
tifica
te –
Sup
ervi
sor
1
12
24
37
Na ti
onal
Cer
tifica
te D
iam
ond
Proc
essi
ng –
Aut
omati
c Po
lishi
ng
3
3
Nati
onal
Cer
tifica
te D
iam
ond
Proc
essi
ng –
Bott
om P
olis
hing
188
5585
7240
2
Na ti
onal
Cer
tifica
te D
iam
ond
Proc
essi
ng –
Pre
para
tion
1
2220
43
213

Qua
lifica
tion
2001
2002
2003
2004
2005
2006
2007
2008
2009
2010
2011
2012
Tota
l
Nati
onal
Cer
tifica
te D
iam
ond
Proc
essi
ng –
Top
Pol
ishi
ng
39
913
212
130
1
Nati
onal
Cer
tifica
te D
iam
ond
Proc
essi
ng O
pera
ting
– O
pera
tor
Bott
om M
akea
ble
1
4
5
Nati
onal
Cer
tifica
te D
iam
ond
Proc
essi
ng O
pera
ting
– O
pera
tor
Bott
om S
awn
93
3113
929
7
560
Nati
onal
Cer
tifica
te D
iam
ond
Proc
essi
ng O
pera
ting
– O
pera
tor
Top
Saw
n
8
131
4197
240
51
7
Nati
onal
Cer
tifica
te D
iese
l Mec
hani
c –
Coal
3
2039
3856
7163
5513
1
359
Nati
onal
Cer
tifica
te D
iese
l Mec
hani
c –
Met
allif
erou
s
1138
2212
4790
4527
182
31
2
Nati
onal
Cer
tifica
te D
iese
l Mec
hani
c –
Ope
ncas
t
28
4646
4957
5746
301
36
0
Nati
onal
Cer
tifica
te E
lect
rica
l – M
etal
lifer
ous
28
100
7411
220
731
731
417
947
1711
1406
Nati
onal
Cer
tifica
te E
lect
rica
l – O
penc
ast
1
4263
8377
114
9696
384
61
4
Nati
onal
Cer
tifica
te E
lect
rica
l – S
urfa
ce C
oal
5
1314
2625
1121
191
135
Nati
onal
Cer
tifica
te E
lect
rica
l – S
urfa
ce D
iam
ond
1
511
31
4
25
Nati
onal
Cer
tifica
te E
lect
rica
l – U
nder
grou
nd C
oal
1
2880
4167
104
8169
386
552
0
Nati
onal
Cer
tifica
te E
lect
rica
l – U
nder
grou
nd D
iam
onds
2
2
55
1
15
Nati
onal
Cer
tifica
te E
lect
ro-m
echa
nics
– E
ngin
eeri
ng a
nd T
echn
olog
y
1
1
Nati
onal
Cer
tifica
te E
lect
ro-m
echa
nics
– E
ngin
eeri
ng a
nd T
echn
olog
y (V
2)
3421
2075
Nati
onal
Cer
tifica
te E
ngin
eeri
ng M
aint
enan
ce fo
r U
nder
grou
nd H
ard
Rock
(M
etal
lifer
ous)
– H
oriz
onta
l Tra
nspo
rt (V
2)
2
224
2732
926
12
2
Nati
onal
Cer
tifica
te E
ngin
eeri
ng M
aint
enan
ce fo
r U
nder
grou
nd H
ard
Rock
M
etal
lifer
ous
– H
oriz
onta
l Tra
nspo
rt S
ervi
ces
1
6
7
Nati
onal
Cer
tifica
te E
ngin
eeri
ng M
aint
enan
ce fo
r U
nder
grou
nd H
ard
Rock
M
etal
lifer
ous
– St
opin
g an
d D
evel
opin
g
318
4366
3616
961
33
429
Nati
onal
Cer
tifica
te F
itter
and
Tur
ner
– O
penc
ast
2220
2814
4326
405
4
202
Nati
onal
Cer
tifica
te F
itting
(inc
ludi
ng m
achi
ning
) – O
penc
ast
1746
4651
5975
5447
144
440
214

Qua
lifica
tion
2001
2002
2003
2004
2005
2006
2007
2008
2009
2010
2011
2012
Tota
l
Nati
onal
Cer
tifica
te F
itting
(inc
ludi
ng m
achi
ning
) – S
urfa
ce C
oal
3
1320
3425
1723
172
154
Nati
onal
Cer
tifica
te F
itting
(inc
ludi
ng m
achi
ning
) – U
nder
grou
nd C
oal
1441
3251
6643
5017
314
Nati
onal
Cer
tifica
te F
itting
(inc
ludi
ng m
achi
ning
) – U
nder
grou
nd D
iam
onds
12
3
Nati
onal
Cer
tifica
te F
itting
(inc
ludi
ng m
achi
ning
) – M
etal
lifer
ous
35
6137
6612
323
315
710
136
611
866
Nati
onal
Cer
tifica
te F
itting
and
Tur
ning
– M
etal
lifer
ous
246
147
3625
227
141
Nati
onal
Cer
tifica
te F
itting
and
Tur
ning
– S
urfa
ce D
iam
onds
2
21
31
1
10
Nati
onal
Cer
tifica
te F
itting
and
Tur
ning
– U
nder
grou
nd C
oal
3
1
4
Nati
onal
Cer
tifica
te F
itting
and
Tur
ning
– U
nder
grou
nd D
iam
onds
2
3
4
9
Nati
onal
Cer
tifica
te in
Aut
otro
nics
L3
1
21
1
5
Nati
onal
Cer
tifica
te in
Aut
otro
nics
L4
2
1
3
Nati
onal
Cer
tifica
te in
Jew
elle
ry M
anuf
actu
re in
a P
rodu
ction
Env
ironm
ent
42
380
3213
913
717
318
21
200
1286
Nati
onal
Cer
tifica
te in
Mea
sure
men
t Con
trol
and
Inst
rum
enta
tion
1
1
Nati
onal
Cer
tifica
te in
Min
ing
Ope
ratio
ns –
Bla
sting
Ope
ratio
n U
nder
grou
nd C
oal
1
432
145
114
4945
390
Nati
onal
Cer
tifica
te i
n M
inin
g O
pera
tions
for
Und
ergr
ound
Har
d Ro
ck –
Nar
row
Ta
bula
r
123
3447
39
121
15
7
Nati
onal
Cer
tifica
te in
Min
ing
Ope
ratio
ns –
Und
ergr
ound
Coa
l Wal
l Min
ing
10
75
22
Na ti
onal
Cer
tifica
te In
Min
ing
Ope
ratio
ns –
Con
tinuo
us M
inin
g U
nder
grou
nd C
oal
1512
2365
2419
150
Nati
onal
Cer
tifica
te in
Roc
kbre
akin
g fo
r U
nder
grou
nd H
ard
Rock
– N
arro
w T
abul
ar
47
21
3
53
Nati
onal
Cer
tifica
te In
stru
men
tatio
n M
echa
nici
an
1128
4236
6392
8547
292
43
5
Nati
onal
Cer
tifica
te L
ump
Ore
Ben
efici
ation
– D
iam
onds
(v2)
7
7
Nati
onal
Cer
tifica
te L
ump
Ore
Ben
efici
ation
– Ji
g Co
ncen
trati
on (v
ersi
on 2
)
36
162
4246
286
Nati
onal
Cer
tifica
te M
illw
righ
t – C
oal
4428
7048
128
123
3315
3
492
215

Qua
lifica
tion
2001
2002
2003
2004
2005
2006
2007
2008
2009
2010
2011
2012
Tota
l
Nati
onal
Cer
tifica
te M
illw
righ
t – D
iam
ond
1
1
Nati
onal
Cer
tifica
te M
illw
righ
t – M
etal
lifer
ous
4
513
1268
2116
1
140
Nati
onal
Cer
tifica
te M
illw
righ
t – O
penc
ast
1554
4935
5948
6637
363
Nati
onal
Cer
tifica
te M
iner
al P
roce
ssin
g –
Base
Met
al
830
38
Nati
onal
Cer
tifica
te M
inin
g O
pera
tions
for
Und
ergr
ound
Har
d Ro
ck –
Mec
hani
sed
Min
ing
2
2715
083
101
363
Na ti
onal
Cer
tifica
te M
inin
g O
pera
tions
Und
ergr
ound
Har
d Ro
ck –
Con
venti
onal
M
inin
g
37
1313
471
688
449
341
225
2210
Nati
onal
Cer
tifica
te M
inin
g O
pera
tions
Und
ergr
ound
Har
droc
k (V
2)
559
1428
128
429
833
216
4
9313
86
Nati
onal
Cer
tifica
te P
late
r/Bo
ilerm
aker
– C
oal
1
1
2
Nati
onal
Cer
tifica
te P
late
r/Bo
ilerm
aker
– M
etal
lifer
ous
24
3614
3955
9384
2014
1
380
Nati
onal
Cer
tifica
te P
late
r/Bo
ilerm
aker
– O
penc
ast
14
14
819
52
44
Na ti
onal
Cer
tifica
te P
late
r/W
elde
r –
Coal
2
821
1826
3538
174
169
Nati
onal
Cer
tifica
te P
late
r/W
elde
r –
Met
allif
erou
s
210
1513
3033
1714
2
13
6
Nati
onal
Cer
tifica
te P
late
r/W
elde
r –
Ope
ncas
t
24
4850
5354
6262
397
39
9
Nati
onal
Cer
tifica
te P
late
r/W
elde
r –
Und
ergr
ound
Dia
mon
ds
1
25
3
1
12
Nati
onal
Cer
tifica
te P
late
r/W
elde
r –
Dia
mon
d O
penc
ast
1
2
11
1
6
Nati
onal
Cer
tifica
te R
igge
r Ro
pesm
an –
Ope
ncas
t
4
65
42
6
27
Nati
onal
Cer
tifica
te R
igge
r Ro
pesm
an –
Sur
face
/Und
ergr
ound
8
68
1438
3330
1813
2
170
Na ti
onal
Cer
tifica
te R
ockb
reak
ing
– Q
uarr
ying
: Qua
rrie
s
11
11
Na ti
onal
Cer
tifica
te R
ockb
reak
ing
Und
ergr
ound
Har
d Ro
ck
185
466
8513
614
443
56
4
Nati
onal
Cer
tifica
te R
ockb
reak
ing
Und
ergr
ound
Har
d Ro
ck –
Mec
hani
sed
Min
ing
1
1116
277
8133
2
Nati
onal
Cer
tifica
te R
ockb
reak
ing
Und
ergr
ound
Har
d Ro
ck –
Con
venti
onal
Min
ing
1
7
510
950
442
731
331
416
80
216
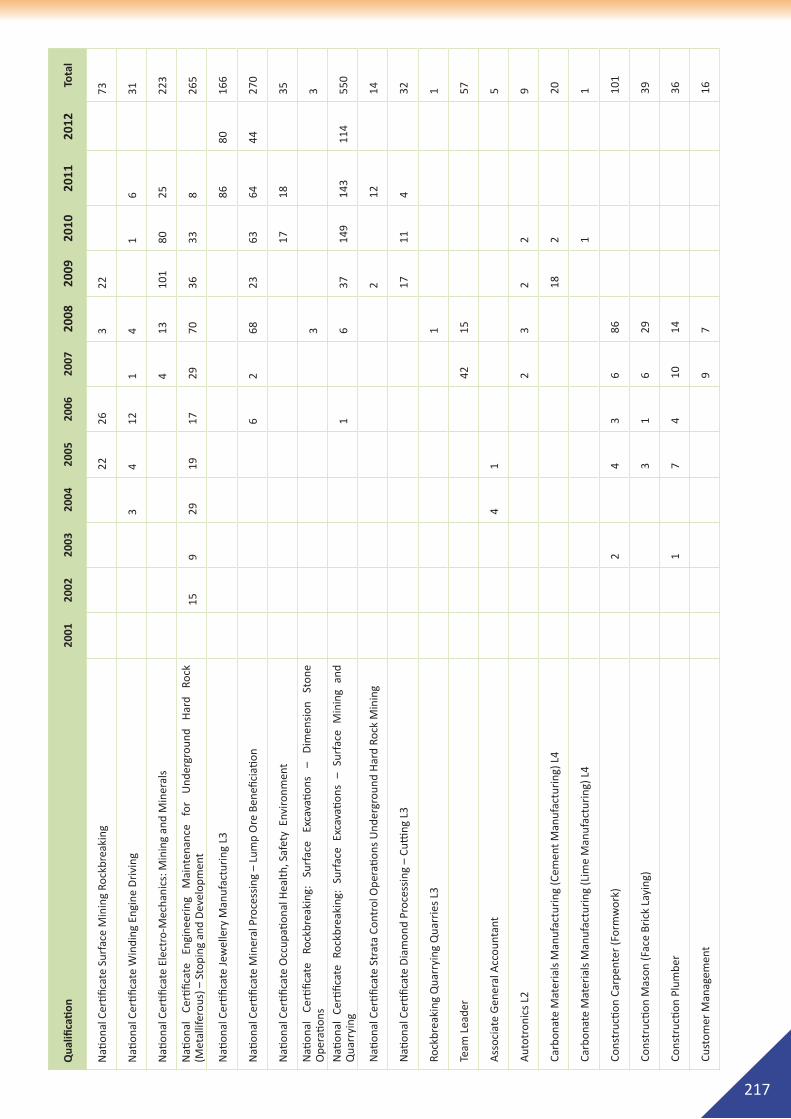
Qua
lifica
tion
2001
2002
2003
2004
2005
2006
2007
2008
2009
2010
2011
2012
Tota
l
Nati
onal
Cer
tifica
te S
urfa
ce M
inin
g Ro
ckbr
eaki
ng
22
26
322
73
Nati
onal
Cer
tifica
te W
indi
ng E
ngin
e D
rivi
ng
34
121
4
16
31
Nati
onal
Cer
tifica
te E
lect
ro-M
echa
nics
: Min
ing
and
Min
eral
s
4
1310
180
25
223
Nati
onal
Ce
rtific
ate
Engi
neer
ing
Mai
nten
ance
fo
r U
nder
grou
nd
Har
d Ro
ck
(Met
allif
erou
s) –
Sto
ping
and
Dev
elop
men
t
159
2919
1729
7036
338
26
5
Nati
onal
Cer
tifica
te Je
wel
lery
Man
ufac
turi
ng L
3
86
8016
6
Nati
onal
Cer
tifica
te M
iner
al P
roce
ssin
g –
Lum
p O
re B
enefi
ciati
on
62
6823
6364
4427
0
Nati
onal
Cer
tifica
te O
ccup
ation
al H
ealth
, Saf
ety
Env
ironm
ent
17
18
35
Nati
onal
Ce
rtific
ate
Rock
brea
king
: Su
rfac
e Ex
cava
tions
–
Dim
ensi
on
Ston
e O
pera
tions
3
3
Nati
onal
Cer
tifica
te R
ockb
reak
ing:
Sur
face
Exc
avati
ons
– Su
rfac
e M
inin
g an
d Q
uarr
ying
1
6
3714
914
311
455
0
Nati
onal
Cer
tifica
te S
trat
a Co
ntro
l Ope
ratio
ns U
nder
grou
nd H
ard
Rock
Min
ing
2
12
14
Na ti
onal
Cer
tifica
te D
iam
ond
Proc
essi
ng –
Cutti
ng L
3
17
114
32
Rock
brea
king
Qua
rryi
ng Q
uarr
ies
L3
1
1
Team
Lea
der
4215
57
Ass
ocia
te G
ener
al A
ccou
ntan
t
41
5
Aut
otro
nics
L2
23
22
9
Carb
onat
e M
ater
ials
Man
ufac
turi
ng (C
emen
t Man
ufac
turi
ng) L
4
18
2
20
Carb
onat
e M
ater
ials
Man
ufac
turi
ng (L
ime
Man
ufac
turi
ng) L
4
1
1
Cons
truc
tion
Carp
ente
r (F
orm
wor
k)
2
4
36
86
10
1
Cons
truc
tion
Mas
on (F
ace
Bric
k La
ying
)
3
16
29
39
Cons
truc
tion
Plum
ber
1
74
1014
36
Cust
omer
Man
agem
ent
97
16
217

Qua
lifica
tion
2001
2002
2003
2004
2005
2006
2007
2008
2009
2010
2011
2012
Tota
l
Die
sel M
echa
nic
– U
nder
grou
nd D
iam
onds
1
3
4
Engi
neer
ing
Fabr
icati
on L
2
2
1
3
FETC
Dia
mon
d Pr
oces
sing
– B
rutin
g
4
4
FETC
Dia
mon
d Pr
oces
sing
– C
ross
wor
king
7
7
FETC
: Dia
mon
d Pr
oces
sing
– B
rilli
ante
erin
g
4
4
Firs
t-lin
e M
anag
er
46
46
FETC
Car
bona
te M
ater
ials
Man
ufac
turi
ng P
roce
ss –
Cem
ent M
anuf
actu
ring
24
110
17
FETC
Car
bona
te M
ater
ials
Man
ufac
turi
ng P
roce
ss –
Lim
e M
anuf
actu
ring
11
2
FETC
Jew
elle
ry M
anuf
actu
ring
Ope
ratio
ns
1
31
21
8
FETC
Aut
otro
nics
5
11
16
FET C
Min
ing
Ope
ratio
ns
4
4
Lear
ners
hip
Nati
onal
Cer
tifica
te F
urni
ture
Mak
ing
Woo
d
8
8
Lear
ners
hip
Tow
ards
Nati
onal
Cer
tifica
te –
Sup
ervi
sor
26
2714
2
15
84
Nati
onal
Cer
tifica
te D
iam
ond
Proc
essi
ng –
Bott
om P
olis
hing
7
7
Nati
onal
Cer
tifica
te D
iam
ond
Proc
essi
ng –
Top
Pol
ishi
ng
5
2
7
Nati
onal
Cer
tifica
te D
iam
ond
Proc
essi
ng O
pera
ting
– O
pera
tor
Bott
om S
awn
2
2
4
Nati
onal
Cer
tifica
te D
iam
ond
Proc
essi
ng O
pera
ting
– O
pera
tor
Top
Mak
eabl
e
106
106
Na ti
onal
Cer
tifica
te D
iam
ond
Proc
essi
ng O
pera
ting
– O
pera
tor
Top
Saw
n
1
31
5
Na ti
onal
Cer
tifica
te D
iese
l Mec
hani
c –
Coal
1
53
86
2046
8487
260
Nati
onal
Cer
tifica
te D
iese
l Mec
hani
c –
Met
allif
erou
s
24
23
26
420
5097
4523
5
Nati
onal
Cer
tifica
te D
iese
l Mec
hani
c –
Ope
ncas
t
14
13
11
54
3044
4413
8
218

Qua
lifica
tion
2001
2002
2003
2004
2005
2006
2007
2008
2009
2010
2011
2012
Tota
l
Nati
onal
Cer
tifica
te D
iese
l Mec
hani
c –
Surf
ace
Dia
mon
ds
1
11
3
Nati
onal
Cer
tifica
te E
lect
rica
l – M
etal
lifer
ous
15
910
88
2251
4618
629
120
485
0
Nati
onal
Cer
tifica
te E
lect
rica
l – O
penc
ast
2
41
31
188
1882
153
110
400
Nati
onal
Cer
tifica
te E
lect
rica
l – S
urfa
ce C
oal
21
11
2
918
9
43
Nati
onal
Cer
tifica
te E
lect
rica
l – S
urfa
ce D
iam
ond
1
1
Nati
onal
Cer
tifica
te E
lect
rica
l – U
nder
grou
nd C
oal
1
6
32
39
1833
4529
149
Nati
onal
Cer
tifica
te E
lect
rica
l – U
nder
grou
nd D
iam
onds
1
1
24
2
10
Nati
onal
Cer
tifica
te E
lect
ro-m
echa
nics
– E
ngin
eeri
ng a
nd T
echn
olog
y
3
10
13
Nati
onal
Cer
tifica
te E
lect
ro-m
echa
nics
– E
ngin
eeri
ng a
nd T
echn
olog
y
132
2255
Nati
onal
Cer
tifica
te E
lect
ro-m
echa
nics
– E
ngin
eeri
ng a
nd T
echn
olog
y (V
2)
43
4790
Na ti
onal
Cer
tifica
te E
ngin
eeri
ng F
abri
catio
n
72
9
Nati
onal
Cer
tifica
te E
ngin
eeri
ng M
aint
enan
ce a
nd R
epai
ring
for U
nder
grou
nd C
oal
Min
ing
– Br
eaki
ng S
ervi
ces
2
2
Nati
onal
Cer
tifica
te E
ngin
eeri
ng M
aint
enan
ce a
nd R
epai
ring
for U
nder
grou
nd C
oal
Min
ing
– Co
nven
tiona
l Min
ing
12
0
12
0
Nati
onal
Cer
tifica
te E
ngin
eeri
ng M
aint
enan
ce a
nd R
epai
ring
for U
nder
grou
nd C
oal
Min
ing
– W
all M
inin
g
9
9
Nati
onal
Cer
tifica
te E
ngin
eeri
ng M
aint
enan
ce a
nd R
epai
ring
for U
nder
grou
nd C
oal
Min
ing
– Co
ntinu
ous
Min
ing
57
57
Nati
onal
Ce
rtific
ate
Engi
neer
ing
Mai
nten
ance
fo
r U
nder
grou
nd
Har
d Ro
ck
(Met
allif
erou
s) –
Hor
izon
tal T
rans
port
(V2)
312
22
12
7
Nati
onal
Ce
rtific
ate
Engi
neer
ing
Mai
nten
ance
fo
r U
nder
grou
nd
Har
d Ro
ck
Met
allif
erou
s –
Hor
izon
tal T
rans
port
Ser
vice
s
13
1
24
11
Nati
onal
Ce
rtific
ate
Engi
neer
ing
Mai
nten
ance
fo
r U
nder
grou
nd
Har
d Ro
ck
Met
allif
erou
s –
Stop
ing
and
Dev
elop
ing
1
12
13
Na ti
onal
Cer
tifica
te F
itter
and
Tur
ner
– O
penc
ast
1
13
212
65
2843
4024
9
Nati
onal
Cer
tifica
te F
itting
(inc
ludi
ng m
achi
ning
) – O
penc
ast
1
1
2
63
943
135
128
328
Nati
onal
Cer
tifica
te F
itting
(inc
ludi
ng m
achi
ning
) – S
urfa
ce C
oal
1
2
1117
12
43
219

Qua
lifica
tion
2001
2002
2003
2004
2005
2006
2007
2008
2009
2010
2011
2012
Tota
l
Nati
onal
Cer
tifica
te F
itting
(inc
ludi
ng m
achi
ning
) – S
urfa
ce D
iam
onds
5
5
Nati
onal
Cer
tifica
te F
itting
(inc
ludi
ng m
achi
ning
) – U
nder
grou
nd C
oal
2
1
12
54
326
4831
123
Nati
onal
Cer
tifica
te F
itting
(inc
ludi
ng m
achi
ning
) – U
nder
grou
nd D
iam
onds
1
11
1
4
Nati
onal
Cer
tifica
te F
itting
(inc
ludi
ng m
achi
ning
) – M
etal
lifer
ous
4
14
24
1023
3178
194
101
452
Nati
onal
Cer
tifica
te F
itting
and
Tur
ning
– M
etal
lifer
ous
1
13
3
428
2420
84
Nati
onal
Cer
tifica
te F
itting
and
Tur
ning
– S
urfa
ce D
iam
onds
1
1
2
Nati
onal
Cer
tifica
te F
itting
and
Tur
ning
– U
nder
grou
nd C
oal
5
5
Nati
onal
Cer
tifica
te F
itting
and
Tur
ning
– U
nder
grou
nd D
iam
onds
2
2
Nati
onal
Cer
tifica
te G
ener
al S
ecur
ity P
racti
ces
25
25
Nati
onal
Cer
tifica
te in
Aut
otro
nics
L3
1
1
2
Na ti
onal
Cer
tifica
te in
Aut
otro
nics
L4
4
99
22
Nati
onal
Cer
tifica
te in
Ele
ctri
cal E
ngin
eeri
ng (E
lect
rica
l Con
stru
ction
)
3
3
Nati
onal
Cer
tifica
te in
Jew
elle
ry M
anuf
actu
re in
a P
rodu
ction
Env
ironm
ent
2018
123
3523
249
411
1027
7
Nati
onal
Cer
tifica
te in
Mea
sure
men
t Con
trol
and
Inst
rum
enta
tion
3
3
Nati
onal
Cer
tifica
te in
Min
ing
Ope
ratio
ns –
Bla
sting
Ope
ratio
n U
nder
grou
nd C
oal
10
1526
6960
180
Nati
onal
Cer
tifica
te i
n M
inin
g O
pera
tions
for
Und
ergr
ound
Har
d Ro
ck –
Nar
row
Ta
bula
r
39
111
32
136
75
Nati
onal
Cer
tifica
te in
Min
ing
Ope
ratio
ns U
nder
grou
nd C
oal W
all M
inin
g
24
24
Na ti
onal
Cer
tifica
te In
Min
ing
Ope
ratio
ns –
Con
tinuo
us M
inin
g U
nder
grou
nd C
oal
17
15
1110
44
Na ti
onal
Cer
tifica
te in
Roc
kbre
akin
g fo
r U
nder
grou
nd H
ard
Rock
– N
arro
w T
abul
ar
137
1
2
41
Nati
onal
Cer
tifica
te In
stru
men
tatio
n M
echa
nici
an
3
34
13
1412
5913
010
133
0
Nati
onal
Cer
tifica
te L
ump
Ore
Ben
efici
ation
– D
iam
onds
(V2)
1
1
220

Qua
lifica
tion
2001
2002
2003
2004
2005
2006
2007
2008
2009
2010
2011
2012
Tota
l
Nati
onal
Cer
tifica
te L
ump
Ore
Ben
efici
ation
– Ji
g Co
ncen
trati
on (V
2)
2
89
11
30
Nati
onal
Cer
tifica
te L
ump
Ore
Ben
efici
ation
: Den
se M
ediu
m S
epar
ation
– C
oal
21
3
24
Nati
onal
Cer
tifica
te M
illw
righ
t – C
oal
1
13
2
530
227
1110
92
Nati
onal
Cer
tifica
te M
illw
righ
t – M
etal
lifer
ous
3
2
12
36
95
7
38
Nati
onal
Cer
tifica
te M
illw
righ
t – O
penc
ast
61
3
1
753
105
7425
0
Nati
onal
Cer
tifica
te M
iner
al P
roce
ssin
g –
Base
Met
al
19
52
26
Nati
onal
Cer
tifica
te M
inin
g O
pera
tions
for
Und
ergr
ound
Har
d Ro
ck –
Mec
hani
sed
Min
ing
2
1312
5033
110
Nati
onal
Cer
tifica
te M
inin
g O
pera
tions
Und
ergr
ound
Har
d Ro
ck –
Con
venti
onal
M
inin
g
1
21
2
1530
8349
430
062
8
Nati
onal
Cer
tifica
te M
inin
g O
pera
tions
Und
ergr
ound
Har
d Ro
ck (
V2)
22
251
8621
212
529
500
Nati
onal
Cer
tifica
te O
ccup
ation
al H
ygie
ne a
nd S
afet
y (V
2)
6
6
Na ti
onal
Cer
tifica
te P
late
r/Bo
ilerm
aker
– C
oal
1
3
4
Nati
onal
Cer
tifica
te P
late
r/Bo
ilerm
aker
– M
etal
lifer
ous
5
45
121
1224
342
8960
257
Nati
onal
Cer
tifica
te P
late
r/Bo
ilerm
aker
– O
penc
ast
24
1
48
2511
55
Nati
onal
Cer
tifica
te P
late
r/W
elde
r –
Coal
1
36
52
31
419
2830
102
Nati
onal
Cer
tifica
te P
late
r/W
elde
r –
Met
allif
erou
s
1
35
618
2643
4014
2
Nati
onal
Cer
tifica
te P
late
r/W
elde
r –
Ope
ncas
t
1
24
310
24
5075
5020
1
Nati
onal
Cer
tifica
te P
late
r/W
elde
r –
Und
ergr
ound
Dia
mon
ds
2
3
11
7
Na ti
onal
Cer
tifica
te P
late
r/W
elde
r –
Dia
mon
d O
penc
ast
2
2
4
Na ti
onal
Cer
tifica
te P
rofe
ssio
nal D
rivi
ng L
3
38
1
1
40
Nati
onal
Cer
tifica
te R
igge
r Ro
pesm
an –
Ope
ncas
t
1
66
720
Nati
onal
Cer
tifica
te R
igge
r Ro
pesm
an –
Sur
face
/Und
ergr
ound
1
1
24
529
5844
144
221

Qua
lifica
tion
2001
2002
2003
2004
2005
2006
2007
2008
2009
2010
2011
2012
Tota
l
Nati
onal
Cer
tifica
te R
ockb
reak
ing
– Q
uarr
ying
: Qua
rrie
s
4
4
Nati
onal
Cer
tifica
te R
ockb
reak
ing
Und
ergr
ound
Har
d Ro
ck
11
26
1417
53
1
2290
Nati
onal
Cer
tifica
te R
ockb
reak
ing
Und
ergr
ound
Har
d Ro
ck –
Mec
hani
sed
Min
ing
21
3030
63
Nati
onal
Cer
tifica
te R
ockb
reak
ing
Und
ergr
ound
Har
d Ro
ck –
Con
venti
onal
Min
ing
1
812
1928
183
101
356
Nati
onal
Cer
tifica
te S
urfa
ce M
inin
g Ro
ckbr
eaki
ng
2
2
1
3
8
Nati
onal
Cer
tifica
te W
indi
ng E
ngin
e D
rivi
ng
3
9
691
86
96
Nati
onal
Cer
tifica
te E
lect
ro-m
echa
nics
: Min
ing
and
Min
eral
s
514
1552
5414
0
Nati
onal
Ce
rtific
ate
Engi
neer
ing
Mai
nten
ance
fo
r U
nder
grou
nd
Har
d Ro
ck
(Met
allif
erou
s) –
Sto
ping
and
Dev
elop
men
t
22
1334
186
9215
4258
4034
0
Nati
onal
Cer
tifica
te Je
wel
lery
Man
ufac
turi
ng
37
3168
Nati
onal
Cer
tifica
te Je
wel
lery
Man
ufac
turi
ng L
3
920
1039
Na ti
onal
Cer
tifica
te M
etal
s Pr
oduc
tion
19
19
Nati
onal
Cer
tifica
te M
iner
al P
roce
ssin
g –
Lum
p O
re B
enefi
ciati
on
3
2
429
1250
Nati
onal
Cer
tifica
te M
iner
al P
roce
ssin
g –
Lum
p O
re
0
Nati
onal
Cer
tifica
te M
iner
al P
roce
ssin
g –
Min
eral
San
ds
6
6
Nati
onal
Cer
tifica
te M
iner
al P
roce
ssin
g –
Plati
num
11
11
Nati
onal
Cer
tifica
te M
inin
g Te
chni
cal S
uppo
rt –
Geo
logy
19
19
Nati
onal
Cer
tifica
te O
ccup
ation
al H
ealth
, Saf
ety
and
Env
ironm
ent
118
1720
56
Nati
onal
Cer
tifica
te R
ockb
reak
ing:
Sur
face
Exc
avati
ons
– Su
rfac
e M
inin
g an
d Q
uarr
ying
1
1150
102
4420
8
Na ti
onal
Cer
tifica
te S
trat
a Co
ntro
l Ope
ratio
ns U
nder
grou
nd H
ard
Rock
Min
ing
4722
69
Nati
onal
Cer
tifica
te D
iam
ond
Proc
essi
ng –
Cutti
ng L
3
1
1
NQ
F 4
Nati
onal
Dip
lom
a in
ABE
T Pr
actic
es
3
10
13
222

Qua
lifica
tion
2001
2002
2003
2004
2005
2006
2007
2008
2009
2010
2011
2012
Tota
l
Occ
upati
onal
ly D
irect
ed E
duca
tion
and
Trai
ning
Pra
ctice
s
5
5
Payr
oll A
dmin
istr
ation
9
13
22
Rock
brea
king
Qua
rryi
ng Q
uarr
ies
L3
12
12
Team
Lea
der
1
97
1
99
Ass
ocia
te G
ener
al A
ccou
ntan
t
4
4
Aut
otro
nics
L2
1
1
21
5
Carb
onat
e M
ater
ials
Man
ufac
turi
ng (C
emen
t Man
ufac
turi
ng) L
4
3
3
Com
mun
ity H
ouse
Bui
lder
(Ent
repr
eneu
rial
)
35
8
Cons
truc
tion
Carp
ente
r (F
orm
wor
k)
9
46
1
20
Cons
truc
tion
Mas
on (F
ace
Bric
k La
ying
)
3
16
10
Cons
truc
tion
Plum
ber
33
95
1
21
Die
sel M
echa
nic
– U
nder
grou
nd D
iam
onds
1
1
FETC
Dia
mon
d Pr
oces
sing
– B
rutin
g
1
1
FETC
Dia
mon
d Pr
oces
sing
– C
ross
wor
king
1
1
FETC
Car
bona
te M
ater
ials
Man
ufac
turi
ng P
roce
ss –
Cem
ent M
anuf
actu
ring
2
2
FETC
Jew
elle
ry M
anuf
actu
ring
Ope
ratio
ns
1
1
FETC
Aut
otro
nics
1
1
Lear
ner s
hip
Tow
ards
Nati
onal
Cer
tifica
te –
Sup
ervi
sor
3
53
1
57
Na ti
onal
Cer
tifica
te In
stru
men
tatio
n M
echa
nici
an
1
1
Nati
onal
Cer
tifica
te D
iam
ond
Proc
essi
ng –
Bott
om P
olis
hing
708
24
84
Nati
onal
Cer
tifica
te D
iam
ond
Proc
essi
ng –
Pre
para
tion
1
1
2
223

Qua
lifica
tion
2001
2002
2003
2004
2005
2006
2007
2008
2009
2010
2011
2012
Tota
l
Nati
onal
Cer
tifica
te D
iam
ond
Proc
essi
ng –
Top
Pol
ishi
ng
44
19
1064
Nati
onal
Cer
tifica
te D
iam
ond
Proc
essi
ng O
pera
ting
– O
pera
tor
Bott
om M
akea
ble
13
13
Nati
onal
Cer
tifica
te D
iam
ond
Proc
essi
ng O
pera
ting
– O
pera
tor
Bott
om S
awn
15
1032
129
17
7
Nati
onal
Cer
tifica
te D
iam
ond
Proc
essi
ng O
pera
ting
– O
pera
tor
Top
Mak
eabl
e
4
4
Nati
onal
Cer
tifica
te D
iam
ond
Proc
essi
ng O
pera
ting
– O
pera
tor
Top
Saw
n
1
29
34
1982
13
8
Nati
onal
Cer
tifica
te D
iese
l Mec
hani
c –
Coal
1
14
19
79
195
55
66
Nati
onal
Cer
tifica
te D
iese
l Mec
hani
c –
Met
allif
erou
s
1
4
97
172
40
Nati
onal
Cer
tifica
te D
iese
l Mec
hani
c –
Ope
ncas
t
14
3
32
25
154
39
Nati
onal
Cer
tifica
te D
iese
l Mec
hani
c –
Surf
ace
Dia
mon
ds
3
3
Nati
onal
Cer
tifica
te E
lect
rica
l – M
etal
lifer
ous
13
43
612
2429
2727
1410
60
Nati
onal
Cer
tifica
te E
lect
rica
l – O
penc
ast
179
1112
1117
617
2213
135
Nati
onal
Cer
tifica
te E
lect
rica
l – S
urfa
ce C
oal
1
16
53
87
31
Nati
onal
Cer
tifica
te E
lect
rica
l - S
urfa
ce D
iam
ond
2
45
1
12
Nati
onal
Cer
tifica
te E
lect
rica
l – U
nder
grou
nd C
oal
1
1
35
915
44
44
50
Nati
onal
Cer
tifica
te E
lect
rica
l – U
nder
grou
nd D
iam
onds
1
1
Nati
onal
Cer
tifica
te E
lect
ro-m
echa
nics
– E
ngin
eeri
ng a
nd T
echn
olog
y
7
1
8
Nati
onal
Cer
tifica
te E
lect
ro-m
echa
nics
– E
ngin
eeri
ng a
nd T
echn
olog
y
3
1
4
Na ti
onal
Cer
tifica
te E
ngin
eeri
ng F
abri
catio
n
1
9
10
Nati
onal
Ce
rtific
ate
Engi
neer
ing
Mai
nten
ance
fo
r U
nder
grou
nd
Har
d Ro
ck
(Met
allif
erou
s) –
Hor
izon
tal T
rans
port
(V2)
1
1
Nati
onal
Ce
rtific
ate
Engi
neer
ing
Mai
nten
ance
fo
r U
nder
grou
nd
Har
d Ro
ck
Met
allif
erou
s –
Hor
izon
tal T
rans
port
Ser
vice
s
1
20
21
Nati
onal
Cer
tifica
te F
itter
and
Tur
ner
– O
penc
ast
45
35
1
18
224

Qua
lifica
tion
2001
2002
2003
2004
2005
2006
2007
2008
2009
2010
2011
2012
Tota
l
Nati
onal
Cer
tifica
te F
itting
(inc
ludi
ng M
achi
ning
) – O
penc
ast
816
86
1210
819
1920
126
Nati
onal
Cer
tifica
te F
itting
(inc
ludi
ng M
achi
ning
) – S
urfa
ce C
oal
15
32
83
1
23
Nati
onal
Cer
tifica
te F
itting
(inc
ludi
ng M
achi
ning
) – S
urfa
ce D
iam
onds
2
2
Nati
onal
Cer
tifica
te F
itting
(inc
ludi
ng M
achi
ning
) – U
nder
grou
nd C
oal
21
32
1410
33
2
40
Nati
onal
Cer
tifica
te F
itting
(inc
ludi
ng M
achi
ning
) – U
nder
grou
nd D
iam
onds
3
1
4
Nati
onal
Cer
tifica
te F
itting
(inc
ludi
ng M
achi
ning
) – M
etal
lifer
ous
22
119
2534
3422
47
150
Nati
onal
Cer
tifica
te F
itting
and
Tur
ning
– M
etal
lifer
ous
1
2812
127
1
61
Nati
onal
Cer
tifica
te F
itting
and
Tur
ning
– S
urfa
ce C
oal
1
1
Nati
onal
Cer
tifica
te F
itting
and
Tur
ning
– U
nder
grou
nd C
oal
1
1
Nati
onal
Cer
tifica
te F
itting
and
Tur
ning
– U
nder
grou
nd D
iam
onds
1
3
1
5
Na ti
onal
Cer
tifica
te in
Aut
otro
nics
L3
1
1
Nati
onal
Cer
tifica
te in
Aut
otro
nics
L4
1
1
Nati
onal
Cer
tifica
te in
Jew
elle
ry M
anuf
actu
re in
a P
rodu
ction
Env
ironm
ent
12
231
2935
108
126
810
343
Nati
onal
Cer
tifica
te in
Mea
sure
men
t Con
trol
and
Inst
rum
enta
tion
2
5
7
Nati
onal
Cer
tifica
te in
Min
ing
Ope
ratio
ns –
Bla
sting
Ope
ratio
n U
nder
grou
nd C
oal
7
2
86
23
Nati
onal
Cer
tifica
te i
n M
inin
g O
pera
tions
for
Und
ergr
ound
Har
d Ro
ck –
Nar
row
Ta
bula
r
1
81
1524
49
Nati
onal
Cer
tifica
te in
Min
ing
Ope
ratio
ns U
nder
grou
nd C
oal W
all M
inin
g
11
1
3
Na ti
onal
Cer
tifica
te In
Min
ing
Ope
ratio
ns: C
ontin
uous
Min
ing
Und
ergr
ound
Coa
l
61
7
Na ti
onal
Cer
tifica
te in
Roc
kbre
akin
g fo
r U
nder
grou
nd H
ard
Rock
– N
arro
w T
abul
ar
3
89
20
Nati
onal
Cer
tifica
te In
stru
men
tatio
n M
echa
nici
an1
3
21
210
1517
99
69
Nati
onal
Cer
tifica
te L
ump
Ore
Ben
efici
ation
– D
iam
onds
(V2)
3
3
225

Qua
lifica
tion
2001
2002
2003
2004
2005
2006
2007
2008
2009
2010
2011
2012
Tota
l
Nati
onal
Cer
tifica
te L
ump
Ore
Ben
efici
ation
– H
eavy
Min
eral
s (V
2)
1
1
Nati
onal
Cer
tifica
te L
ump
Ore
Ben
efici
ation
– Ji
g Co
ncen
trati
on (V
2)
3
12
15
Nati
onal
Cer
tifica
te M
illw
righ
t – C
oal
26
38
2530
175
96
Nati
onal
Cer
tifica
te M
illw
righ
t – M
etal
lifer
ous
1
24
61
7
21
Nati
onal
Cer
tifica
te M
illw
righ
t – O
penc
ast
1
4
21
34
613
1
35
Nati
onal
Cer
tifica
te M
iner
al P
roce
ssin
g –
Base
Met
al
12
1449
116
790
Nati
onal
Cer
tifica
te M
inin
g O
pera
tions
for
Und
ergr
ound
Har
d Ro
ck –
Mec
hani
sed
Min
ing
1
217
1110
41
Nati
onal
Cer
tifica
te M
inin
g O
pera
tions
Und
ergr
ound
Har
d Ro
ck –
Con
venti
onal
M
inin
g
2
21
1221
920
2423
303
Nati
onal
Cer
tifica
te M
inin
g O
pera
tions
Und
ergr
ound
Har
d Ro
ck (
V2)
116
253
2071
4820
292
138
256
Nati
onal
Cer
tifica
te O
ccup
ation
al H
ygie
ne a
nd S
afet
y (V
2)
1
1
Na ti
onal
Cer
tifica
te P
late
r/Bo
ilerm
aker
– D
iam
ond
Ope
ncas
t
1
1
Nati
onal
Cer
tifica
te P
late
r/Bo
ilerm
aker
– M
etal
lifer
ous
14
12
1216
146
45
65
Nati
onal
Cer
tifica
te P
late
r/Bo
ilerm
aker
– O
penc
ast
1
1
2
4
Nati
onal
Cer
tifica
te P
late
r/W
elde
r –
Coal
2
4
43
3
1
17
Nati
onal
Cer
tifica
te P
late
r/W
elde
r –
Met
allif
erou
s
11
1
15
23
10
24
Nati
onal
Cer
tifica
te P
late
r/W
elde
r –
Ope
ncas
t
3
129
1410
33
134
71
Nati
onal
Cer
tifica
te P
late
r/W
elde
r –
Und
ergr
ound
Dia
mon
ds
1
3
4
Na ti
onal
Cer
tifica
te P
late
r/W
elde
r –
Dia
mon
d O
penc
ast
1
1
Na ti
onal
Cer
tifica
te R
igge
r Ro
pesm
an –
Ope
ncas
t
1
1
2
Nati
onal
Cer
tifica
te R
igge
r Ro
pesm
an –
Sur
face
/Und
ergr
ound
1
1
1
14
1
9
Nati
onal
Cer
tifica
te R
ockb
reak
ing
Und
ergr
ound
Har
d Ro
ck1
12
59
76
116
6
63
226

Qua
lifica
tion
2001
2002
2003
2004
2005
2006
2007
2008
2009
2010
2011
2012
Tota
l
Nati
onal
Cer
tifica
te R
ockb
reak
ing
Und
ergr
ound
Har
d Ro
ck –
Mec
hani
sed
Min
ing
11
511
1
19
Nati
onal
Cer
tifica
te R
ockb
reak
ing
Und
ergr
ound
Har
d Ro
ck –
Con
venti
onal
Min
ing
9
1814
1411
66
Nati
onal
Cer
tifica
te S
urfa
ce M
inin
g Ro
ckbr
eaki
ng
3
2
10
15
Nati
onal
Cer
tifica
te W
indi
ng E
ngin
e D
rivi
ng
163
12
22
Nati
onal
Cer
tifica
te: E
lect
ro-m
echa
nics
: Min
ing
and
Min
eral
s
21
1927
41
54
Na ti
onal
Ce
rtific
ate:
En
gine
erin
g M
aint
enan
ce
for
Und
ergr
ound
H
ard
Rock
(M
etal
lifer
ous)
– S
topi
ng a
nd D
evel
opm
ent
2
56
27
3
25
Nati
onal
Cer
tifica
te: J
ewel
lery
Man
ufac
turi
ng
34
2256
Nati
onal
Cer
tifica
te: J
ewel
lery
Man
ufac
turi
ng L
3
10
10
Nati
onal
Cer
tifica
te: M
iner
al P
roce
ssin
g –
Lum
p O
re B
enefi
ciati
on
1
311
1025
Nati
onal
Cer
tifica
te: O
ccup
ation
al H
ealth
, Saf
ety
and
Envi
ronm
ent
2614
2
42
Nati
onal
Cer
tifica
te R
ockb
reak
ing:
Sur
face
Exc
avati
ons
– Su
rfac
e M
inin
g an
d Q
uarr
ying
1
4
2222
47
Nati
onal
Cer
tifica
te D
iam
ond
Proc
essi
ng –
Cutti
ng L
3
3
11
14
NQ
F 5
Nati
onal
Dip
lom
a in
ABE
T Pr
actic
es
40
10
50
Occ
upati
onal
Saf
ety,
Hyg
iene
and
Env
ironm
ent L
2
20
7
61
88
Payr
oll A
dmin
istr
ation
1
1
Rock
brea
king
Qua
rryi
ng Q
uarr
ies
L3
1
1
Team
Lea
der
278
35
Tota
l11
314
1154
1174
2714
2873
3686
5194
5624
4422
5067
4019
3594
8
227

APPENDIX 6: GOVERNMENT CERTIFICATES ISSUED BY DMR
The tables below demonstrates certification for the period 2000 to 2013:
Certificates issued from 2000 to 2012: Mine Engineers (Electrical and Mechanical)
Source: Department of Mineral Resources, August 2012.
75 74 1
2002 52 52 0
2003 40 39 1
2004 43 41 2
2005 49 48 1
2006 56 54 2
2007 75 73 2
2008 50 47 3
2009 51 50 1
2010 141 133 8
2011 61 56 5
2012 71 70 1
788 28
228

Certificates issued from 2000 to 2012: Winding-engine drivers
Source: Department of Mineral Resources, August 2012
Source: Department of Mineral Resources, August 2012
Certificates issued from 2000 to 2012: Overseers (Coal and Metal)
173 173 0
149 149 0
135 135 0
262 262 0
188 188 0
205 205 0
220 220 0
197 194 3
213 210 3
217 210 7
154 147 7
187 176 11
158 152 6
- 123 123 0
68 68 0
81 80 1
73 72 1
42 42 0
86 85 1
96 91 5
28 25 3
123 116 7
96 93 3
104 87 17
100 85 15
62 49 13
229

Source: Department of Mineral Resources, August 2012
Certificates issued from 2000 to 2012: Mine Surveyors
2000 9 9 0
2001 8 8 0
2002 11 11 0
2003 3 3 0
2004 4 4 0
2005 9 9 0
2006 6 6 0
2007 10 10 0
2008 13 13 0
2009 13 9 4
2010 10 10 0
2011 8 8 0
2012 14 14 0
230

Certificates issued from 2000 to 2012: Winding-engine drivers
Source: Department of Mineral Resources, August 2012
37 31 6
37 32 5
36 27 9
55 50 5
87 72 15
44 14
26 21 5
69 44 25
51 33 18
51 42 9
22 14 8
31 24 7
18 14 4
-
58
YEAR
231

TIMeLINeS MQA ProJeCTS 2013/2014
ProJeCT Timeframes
Start Finish
MQA-001-Lecturer (HET) Jul-05 2016
MQA-002-Bursaries 2012 2016
MQA-003-Work Experience 2013 2014MQA-005-Minerals Beneficiation (Diamond & Jewellery) 2013 2014
MQA-007-Standard Setting Grant (TRGs) Ongoing.
MQA-009-Learning Materials Development Ongoing.
MQA-010-Internships (GDP) 2013 2015
MQA-011-Learnerships On-going till the last learner completes. Targets are set for each financial year
MQA-012-SME Skills Development Support 2013 2014MQA-018-Skills Development Facilitator Support Ongoing until end of NSDS 3 in March 2016
MQA-019-ABET Ongoing till the last learner completes. Targets are set for each financial year
MQA-020-Skills Development Research & Impact Analysis
Ongoing and revised annually until end of NSDS 3 in March 2016
MQA-023-Literacy Promotion 01-Apr-13 Oct-13
The event took place on 7 September 2013. Close off report submitted.
MQA-024-OHS Rep Development Ongoing till the last learner completes. Targets are set for each financial year
MQA-026-NSF 2 - Artisan Development Ongoing till the last learner completes. Targets are set for each financial year
MQA-027 MQA Artisan Development-Employed
Ongoing till the last learner completes. Targets are set for each financial year
MQA-030-Maths & Science 2013 2014
MQA-031-Mine Inspector Training 2013 2014
MQA-035-Learners with Disability Ongoing till the last learner completes. Targets are set for each financial year
MQA-036-External Assessment Tools Development Ongoing Ops requirement (Functional)
MQA-037-Facilitator Development 01-Apr-13 31-Mar-14
MQA-038-FLC Grant Incentive Ongoing till the last learner completes. Targets are set for each financial year
MQA-040-Standard Setting HET Ongoing but dependant on legislative changes
MQA-041-HDSA Development 2013 2014
MQA-042-UIF 1 Learnerships Artisan Ongoing till the last learner completes. Targets are set for each financial year
MQA-043-ABET Practitioner Career Progression 2013-10-22 2014-01-01
APPeNdIX 7: TIMeLINeS for MQA ProJeCTS
232

MQA-045-Mine Community Capacity Building
Ongoing till the last learner completes. Targets are set for each financial year
MQA-049-Mining Environmental Control Programme
Ongoing till the last learner completes. Targets are set for each financial year
MQA-050-Mpumalanga FET Artisan Ongoing till the last learner completes. Targets are set for each financial year
MQA-051-MQA Artisan Development-Unemployed
Ongoing till the last learner completes. Targets are set for each financial year
MQA-052-RPL / Artisan Aides - Employed Ongoing till the last learner completes. Targets are set for each financial year
233

ofo 10 OccupationNumber of Employees
Qualification Learnership
132104Engineering Manager
2427NC Certificated Engineering
(120 Credits, Stage 2)
132201
Production / Operations Manager Mining
1626
FETC Mining Operations Non-blasted Operations
16Q160149291604
FETC Mining Operations Small Scale Mining
16Q160150301624
FETC Mining Operations Surface Excavations Blasting Operations
16Q160156311634
FETC Mining Operations Underground Coal
FETC Mining Operations Underground Hardrock
NC Certificated Engineering Stage 2 NHC Mining Practice Surface Excavations
NHC Mining Practice Underground Coal
NHC Mining Practice Underground Hardrock
214602Mining Engineering Technologist
91 PrEng Technologist Stage 2
APPENDIX 8: MQA Qualifications Framework
226302
Safety, Health, Environment and Quality SHE & Q Practitioner
2122
FETC Occupational Hygiene and Safety
16Q160068541443
NC Occupational Hygiene and Safety 16Q160070381454NC Occupational Hygiene and Safety Occupational Hygiene
NC Occupational Hygiene and Safety - Occupational Safety
NC Occupational Safety
ND Occupational Safety Mining and Minerals
241101 Accountant (General) 1171
NC Associate General Accountant 01Q010002004807
NC Chartered Accountant Financial Management 01Q010003003606
234

311101 Chemistry Technician 934
FETC Laboratory Analysis 16Q160144541202NC Construction Materials Testing 16Q160145541202NC Laboratory Practice 16Q160146541202NC Laboratory Practice Coal NC Laboratory Practice General NC Laboratory Practice Precious Metal
SP Fire Assay SP Basic Construction Materials Testing
SP Determine the Physical Properties of a Coal Sample in a Laboratory
SP Handling of Chemicals Version 1 SP Primary sample preparation in an Analytical Laboratory
SP Primary Sample Preparation in an analytical laboratory Analytical Services
SP Secondary sample preparation in an Analytical Laboratory
SP Secondary sample preparation in an Analytical Laboratory Analytical Services
SP Separation of Precious Metals by means of the Fire Assay Technique
SP Water Analysis in a Laboratory
311701 Mining Technician 1045
FETC Minerals Surveying
16Q160069441484
NC Mining Technical Support SamplingNC Mining Technical Support - SurveyingFETC Mine VentilationNC Mine VentilationNHC Mine Ventilation
312101
Production / Operations Manager Mining
17336
FETC Generic Management
FETC ManagementFETC New Venture Creation SMMENC Generic Management Mining ManagementNC ManagementNC New Venture Creation SMMESP Advanced Generic ManagementSP Basic Generic SupervisionSP Generic Management for Middle Managers in the South African Mining and Minerals Sector
312102
Miner + Production / Operations Supervisor Mining
21707 See table XX
23Q23002856140423Q23003334152523Q2300638138223Q230065381382
23Q230074261504
235

312201
Production / Operations Supervisor Manufacturing
1984 SP Intermediate Generic Management 16Q160125221625
325707 Mines Safety Inspector 1668
FETC Radiation Protection
NC Radiation Monitoring
NC Radiation Protection
411101 General Clerk 7624 FETC Business Administration Services 23Q230032541404
651501 Rigger 2188
FETC Mechanical Handling Rigging Mining and Minerals 03Q030078301272
NC Mechanical Handling Rigging 16Q160009001273NC Mechanical Handling Rigging 16Q160010001273NC Rigging Ropesman Surface/ Underground
Rigging Ropesman Opencast
SP Lifting and moving of a load in Surface Operations
652302 Fitter and Turner 4077
NC Fitting and Turning Metalliferous 16Q160023001273NC Fitting and Turning Opencast Coal 16Q160024001533NC Fitting and Turning Surface Coal 16Q160025001283NC Fitting and Turning Surface Diamonds 16Q160026002443
NC Fitting and Turning Underground Coal 16Q160027001203
NC Fitting and Turning Underground Diamonds 16Q160032001593
NC Fitting including Machining Hardrock Metalliferous 16Q160033001853
NC Fitting including Machining Surface Diamonds 16Q160034001463
NC Fitting including Machining Opencast 16Q160035002763
NC Fitting including Machining Surface Coal 16Q160036001403
NC Fitting, including Machining Underground Coal 16Q160053001463
NC Fitting, including Machining Underground Diamonds 16Q160054001463
NC Mechanical Engineering Fitting and Machining
653303 Mechanical Fitter 3992
FETC Mechanical Engineering Fitting Mining and Minerals
03Q030082351302Mechanical Engineering NC Mechanical Engineering Fitting
SP Fabrication and Repair Equipment in Surface Operations
236

653306 Diesel Mechanic
3743
FETC Diesel Electric and Electric Fitting 16Q160011001303
NC Diesel Elec and Elec Fitting, Locomotive 16Q160012001623
NC Diesel Electric and Electric Fitting 16Q160013001493NC Diesel Mechanic Coal 16Q160014001373NC Diesel Mechanic Metalliferous 16Q160052001463NC Diesel Mechanic Opencast NC Diesel Mechanic Surface Diamonds
NC Diesel Mechanic Underground Diamonds
671101 Electrician 7323
FETC Electrical Engineering 08Q080031321562NC Electrical Engineering 08Q080044371632NC Electrical Engineering Electrical Construction 16Q160037003134
NC Electrical Engineering Mining Marine 16Q160038003494NC Electrical Engineering Transmission 16Q160039003444
NC Electrical Metalliferous 16Q160040003294NC Electrical Surface Coal 16Q160041003404NC Electrical Surface Diamonds 16Q160042003014NC Electrical Underground Coal 16Q160137391402NC Electrical Underground Diamonds 16Q160138381333 NC Electrical Opencast 16Q160139421304
SP Operation and Maintenance of Medium Volt Switchgear and Distribution Networks
671202 Millwright 2060
FETC Electro-Mechanics Mining and Minerals 16Q160028003394
NC Electro-Mechanics 16Q160029004094NC Electro-Mechanics Mining and Minerals 16Q160030004444
NC Millwright Coal 16Q160031003814NC Millwright Diamonds 16Q160077471413NC Millwright Metalliferous 16Q160083471662NC Millwright Opencast 16Q160084441413 16Q160085291714
672105 Instrument Mechanician 1021
FETC Measurement, Control and Instrumentation Mining and Minerals
08Q080034281392
NC Instrumentation Mechanician 08Q080035251503NC Measurement, Control and Instrumentation 16Q160008001764
NC Measurement, Control and Instrumentation Mining and Minerals
16Q160119211344
NC Measurement, Control and Instrumentation Mining and Minerals 16Q160120211203
16Q160121321332
237

711101 Mining Operator 55230
Skills Programme in: Operate Mining Machinery in an Underground Coal Mine: Cut a coalface using an arc wall type coal cutter in an underground coal mine
SP Gathering Arm Loader Operation in an Underground Coal MineSP Operate Mining Machinery in an Underground Coal Mine
SP Operate mining machinery in an underground coal mine: Cut a coalface using a universal type coal cutter in an underground coal mine
SP Operate mining machinery in an underground coal mine: Cut and load coal surface using a continuous miner in an underground coal mineSP Operate mining machinery in an underground coal mine: Deliver compressed air using a mobile compressor in an underground coal mineSP Operate mining machinery in an underground coal mine: Feed and break coal using a feeder breaker in an underground coal mine
SP Operate mining machinery in an underground coal mine: Pump water using pumping equipment in an underground coal mine
SP Operate mining machinery in an underground coal mine: Transport coal using shuttle mining equipment in an underground coal mine
SP Operate mobile machinery in an underground coal mine: Place and operate and auxiliary fan in an underground coal mine
SP Operating Mobile Equipment for Surface Excavation Operations
238
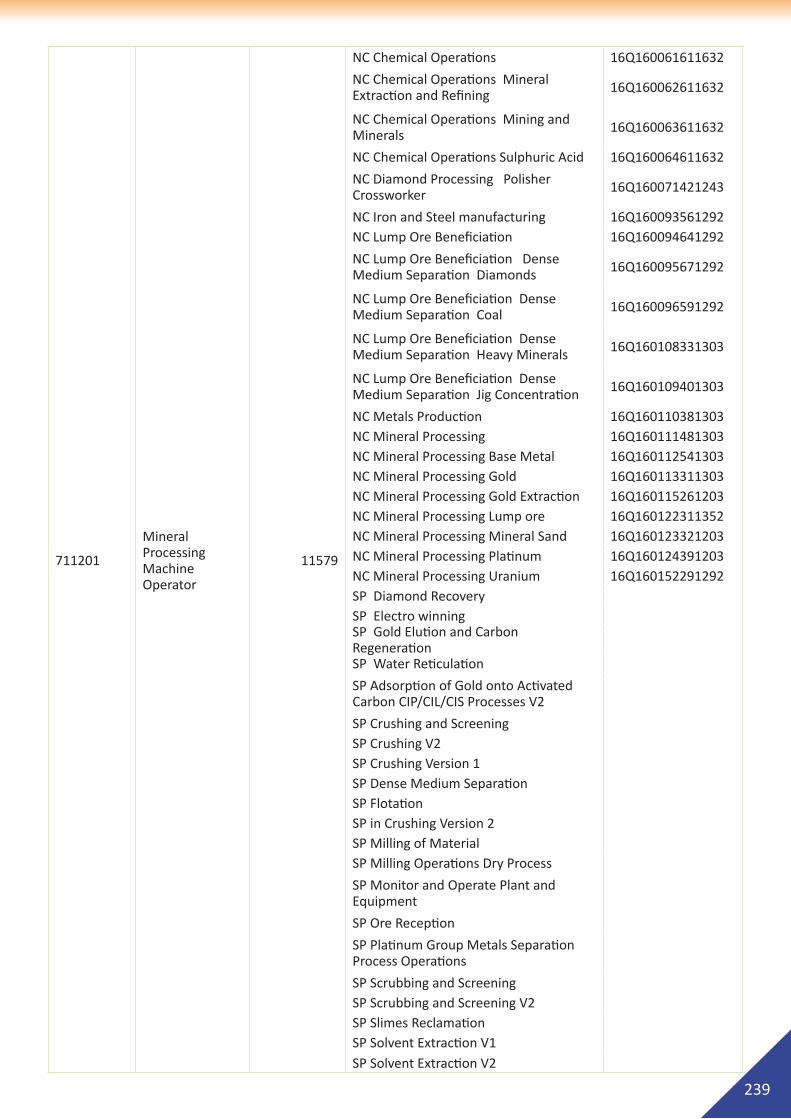
711201
Mineral Processing Machine Operator
11579
NC Chemical Operations 16Q160061611632
NC Chemical Operations Mineral Extraction and Refining 16Q160062611632
NC Chemical Operations Mining and Minerals 16Q160063611632
NC Chemical Operations Sulphuric Acid 16Q160064611632
NC Diamond Processing Polisher Crossworker 16Q160071421243
NC Iron and Steel manufacturing 16Q160093561292NC Lump Ore Beneficiation 16Q160094641292
NC Lump Ore Beneficiation Dense Medium Separation Diamonds 16Q160095671292
NC Lump Ore Beneficiation Dense Medium Separation Coal 16Q160096591292
NC Lump Ore Beneficiation Dense Medium Separation Heavy Minerals 16Q160108331303
NC Lump Ore Beneficiation Dense Medium Separation Jig Concentration 16Q160109401303
NC Metals Production 16Q160110381303NC Mineral Processing 16Q160111481303NC Mineral Processing Base Metal 16Q160112541303NC Mineral Processing Gold 16Q160113311303NC Mineral Processing Gold Extraction 16Q160115261203NC Mineral Processing Lump ore 16Q160122311352NC Mineral Processing Mineral Sand 16Q160123321203NC Mineral Processing Platinum 16Q160124391203NC Mineral Processing Uranium 16Q160152291292SP Diamond Recovery SP Electro winning SP Gold Elution and Carbon Regeneration
SP Water Reticulation
SP Adsorption of Gold onto Activated Carbon CIP/CIL/CIS Processes V2
SP Crushing and Screening SP Crushing V2 SP Crushing Version 1 SP Dense Medium Separation SP Flotation SP in Crushing Version 2 SP Milling of Material SP Milling Operations Dry Process
SP Monitor and Operate Plant and Equipment
SP Ore Reception
SP Platinum Group Metals Separation Process Operations
SP Scrubbing and Screening SP Scrubbing and Screening V2 SP Slimes Reclamation SP Solvent Extraction V1 SP Solvent Extraction V2
239

711301 Driller 14282
SP Drilling Operations
SP Operate mining machinery in an underground coal mine: Drill a coalface using mobile drilling equipment in an underground coal mine
SP Operating Mobile Equipment for Surface Excavation Operations
711302 Rock Drill Operator 41876
SP Operate mining machinery in an underground coal mine: Drill a coalface using a hand held drilling equipment in an underground coal mine
SP Operate mining machinery in an underground coal mine: Drill holes using a hand held rock drill in an underground coal mine
SP Rock Drill Operator in Underground Hardrock Mines
718906Bulk Materials Handling Plant Operator
769
SP Operate mining machinery in an underground coal mine: Operate a belt conveyor unit to convey coal in an underground coal mine
731101 Train Driver 21021SP Operate mining machinery in an underground coal mine: Operate a diesel locomotive underground
733201 Truck Driver General 4638 NC Professional Driving
26Q260009212053
26Q260042441223
733208Mobile Mining Equipment Operator
5428
SP Operate mining machinery in an underground coal mine: Apply stone dust using stone dusting equipment in an underground coal mine
SP Operate mining machinery in an underground coal mine: Transport personnel, material or equipment using flameproof diesel machines in an underground coal mine
734203 Bulldozer Driver 3086SP Dozing Operations
SP Operating Mobile Equipment for Surface Excavation Operations
734204 Excavator Operator 2087 SP Operating Mobile Equipment for
Surface Excavation Operations
734206 Load-haul-dump (LHD) Operator 12698
SP Operate mining machinery in an underground coal mine: Transport material and equipment using a load haul dumper in an underground coal mine
734214Dump Truck Operator Off-road
5762 SP Operating Mobile Equipment for Surface Excavation Operations
240

734301 Crane, Hoist or Lift Operator 40698
NC Winding Engine Driving
16Q160007351763
SP Transportation of men, material and ore to and from an Underground Workplace Onsetter
SP Transportation of men, material and ore to and from an Underground Workplace Onsetter/ Banksman
831101 Mining Support Worker 97773
Flame proofing in Underground Fiery Coal Mines
GETC Mining and Minerals Processes Mining
NC Introduction to Mining and Minerals sector
SP Gas Testing Operations in Underground Coal Mines
SP Gasbay Attendant
SP Gases and Gas Testing in Underground Fiery Coal Mines
SP Lamproom AssistantSP Lamproom Equipment RepairerSP Lamproom Shift Supervisor
831103Mineral Beneficiation Plant Worker
5090
GETC Chemical Operations Mining and Minerals
GETC Mining and Minerals Processes Metallurgy
GETC Mining and Minerals Processes - Cement, Lime, Aggregates and Sand
GETC Mining and Minerals Processes - Diamond Processing
SP Adsorption of Gold onto activated carbon Version 2
SP Gold LeachingSP Grading Room OperatorSP Handling of ChemicalsSP Preparation of Slimes for BackfillingSP Thickening of a Slurry V2SP Thickening of a Slurry V3
831301 Builder's Worker 7053 NC Community House Building Entrepreneurial 05Q050061251552
831310 Surveyor’s Assistant 2988
NC Mining Technical Support Surveying 16Q160117321252NC Mining Technical Support Geology 16Q160118321252
NC Mining Technical Support Sampling 16Q160142361252
241

Alignment of MQA strategic objectives with NSDS III
A B C d
Outcome output Strategic objective Comments
4.1 Establishing a credible institutional mechanism for skills planning
4.1.1: National need in relation to skills development is researched, documented and communicated to enable effective planning across all economic sectors.
4.1.1.1: Capacity is established within the DHET to coordinate research and skills planning.
MQA participates fully in DHET processes if and when required.
4.1.1.2: Sector skills plans are professionally researched, provide a sound analysis of the sector and articulate an agreed sector strategy to address skills needs.
2 Development of research capability will support skills planning.
4.1.1.3: Sector and nationally commissioned research and data are analysed, validated and captured in an integrated database that is accessible to stakeholders.
2
Research information is held in the MQA database.Where possible, research data will be made available for inclusion in national system.
4.2 Increasing access to occupationally-directed programmes
4.2.1: Middle-level skills needs are identified and addressed in all sectors.
4.2.1.1: SETAs research and identify middle level skills needs in their sectors and put in place strategies to address them, particularly through the use of the public FET colleges and universities of technology working in partnership with employers providing workplace-based training.
2
4
Research and monitoring will include middle-level skills needs. The MQA’s Qualifications Framework is to be adapted continuously, based on research.
Learnerships focus on middle-level skills needs. Existing partnerships will continue.
4.2.1.2: Projects are established to address middle-level skills in each sector.
4 Artisan and non-artisan learnerships.
APPENDIX 9: ALIGNMENT OF MQA`S SKILLS DEVELOPMENT PRIORITIES WITH NSDS
The alignment of the MQA’s skills development priorities and its objectives and qualitative targets to the NSDS III goals are summarised. Column A in the table describes the NSDS III outcomes relating to each of the goals. Column B describes the outputs related to each outcome. Column C refers to the MQA strategic objective that addresses the NSDS output, and Column D refers to the specific parts of Section 7.2 above, in which the relevant MQA skills development priorities and strategies are discussed. The comments in Column E summarise the MQA’s response to the specific NSDS III outputs.
242

A B C d
Outcome output Strategic objective Comments
4.2.2: 10 000 artisans per year qualify with relevant skills and find employment.
4.2.2.1: SETAs establish projects and partnerships to enable the relevant number of artisans for their sector to be trained, to qualify and become work ready.
4Artisan learnerships.
4.2.2.2: The national Artisan Development Project developed by JIPSA, and now located in the DHET and M&E Framework, is planned, managed and reported on, with interventions made where blockages occur.
4MQA participates in artisan development forums and processes.
4.2.3: High-level national scarce skills needs are being addressed by work- ready graduates from higher education institutions.
4.2.3.1: Sector skills plans identify the supply challenges in relation to high-level scarce skills gaps and set out strategies for addressing them.
Some challenges and strategies have been identified, which will be elaborated on further in the future SSP annual updates. For example, scarce skills may be due to the unattractiveness of the location of the mine as opposed to a skills shortage.
4.2.3.2: Agreements are entered into between SETAs, university faculties and other stakeholders on appropriate interventions to support improved entry to priority programmes, increased work experience and experiential learning for students and access to postgraduate work.
4
High-level scarce skills to be addressed through bursaries, workplace experiential learning and internships.
243

A B C d
Outcome output Strategic objective Comments
4.2.4: Relevant research and development and innovation capacity is developed and innovative research projects are established
4.2.4.1: SSPs identify the focal areas for research, innovation and development.
2Areas to be identified in SSP updates.
4.2.4.2: Agreements are entered into between SETAs, university faculties and other stakeholders on flagship research projects linked to sector development in a knowledge economy.
2
Exploration of opportunities for collaboration in progress, including postgraduate bursaries to support relevant MMS research.
4.2.4.3: Programmes are put in place that focus on the skills needed to produce research that will be relevant and have an impact on the achievement of economic and skills development goals.
2
MQA is already involved in programmes that build the academic profession. Further engagement will focus specifically on the development of research capabilities in higher education institutions.
244

A B C d
Outcome output Strategic objective Comments
4.3 Promoting the growth of a public FET college system that is responsive to sector, local, regional and national skills needs and priorities
4.3.1: The National Certificate (Vocational) and N-courses are recognised by employers as important base qualifications through which young people obtain additional vocational skills and work experience, entering the labour market with marketable skills, and obtaining employment.
4.3.1.1: The NCV is reviewed with inputs from stakeholders and the curriculum is revised to ensure that it provides a sound foundational basis for building labour market-relevant skills.
4
The MQA will continue and possibly expand its relationships with FET colleges and assist with the revision of programmes relevant to the sector.
4.3.1.2: The programmes offered to meet industry needs, including those supporting apprenticeships and N-courses, are reviewed, updated and made available to and accessed by employers.
4
245

A B C d
Outcome output Strategic objective Comments
4.3.2: Partnerships between DHET, SETAs, employers, private providers and public FET colleges are creating increased capacity to meet industry needs throughout the country.
4.3.2.1: The capacity of FET colleges to provide quality vocational training is reviewed. Each college has a strategic plan in place to build capacity and engage in skills development programmes, including programmes offered in partnership with employers.
The MQA will participate fully if and when required.
4.3.2.2: SETAs identify FET colleges with relevant programmes and put in place partnerships to offer vocational courses and work experience for college learners.
4 The MQA will continue and possibly expand its relationships with FET colleges and assist with the revision of programmes relevant to the sector, support lecturer development and engage on partnership agreements with employers. FET lecturers will be supported in gaining workplace experience.
4.3.3: The academic staff at colleges is able to offer the relevant education and training of the required quality.
4.3.3.1: The capacity of college educators to deliver programmes is reviewed. Skills development programmes, including work placement opportunities, are devised to meet the needs of the college educators.
4
4.4 Addressing the low level of youth and adult language and numeracy skills to enable additional training
4.4.1: A national strategy is in place to provide all young people leaving school with an opportunity to engage in training or work experience, and improve their employability.
4.4.1.1: A DHET-led process, including stakeholders, develops a strategy supported by all stakeholders.
The MQA will participate in the DHET-led process to develop strategy, and track learners in the sector.
4.4.1.2: A national database tracks training and work opportunities, and reports on the implementation of the strategy.
4.4.1.3: The DHET partners and stakeholders in the youth sector will put in place training and work experience projects for young people.
The MQA has in place training and work experience for youth. The MQA will participate in DHET and other processes and discussions.
246

A B C d
Outcome output Strategic objective Comments
4.5 Encouraging better use of workplace-based skills development
4.5.1: Training of employed workers addresses critical skills, enabling improved productivity, economic growth and the ability of the workforce to adapt to change in the labour market.
4.5.1.1: SETA stakeholders agree on the provision of substantial quality programmes for employed workers and report on the impact of the training.
4
Skills programmes form part of the MQA’s Qualifications Framework, which is continuously researched and updated.
4.5.1.2: Sector projects are put in place to address specific sector skills gaps.
4 Skills programmes address critical skills needs of the sector.
4.5.1.3: Cross-sectoral projects are established to address skills needs along local supply chains aimed at supporting local economic development.
Cross-sectoral collaboration is sought in areas of overlap with other sectors, e.g. mineral beneficiation, including jewellery manufacturing.
4.6 Encouraging and supporting cooperatives, small enterprises, worker initiated, NGO and community training initiatives
4.6.1: Cooperatives supported with skills training and development expand and contribute to the sector’s economic and employment growth.
4.6.1.1: SETAs identify established and emergent cooperatives and their skills needs in their skills planning research.
2
The MQA has completed research into training needs of small enterprises. Research initiatives will be repeated when necessary.
4.6.1.2: Sector projects are established by sector stakeholders and supported by the NSF.
4Small-scale mining projects address, inter alia, the needs of cooperatives in the sector.
4.6.1.3: A national database of cooperatives supported with skills development is established and the impact of training is reported on.
3 MQA-supported cooperatives will be recorded in the MIS.
247

A B C d
Outcome output Strategic objective Comments
4.6.2: Partnership projects to provide training and development support to small businesses are established in all sectors and their impact is reported on.
4.6.2.1: SETAs identify the skills needs of small and emerging businesses in their sector, and promote relevant programmes through their skills planning research.
2
The MQA has completed research into training needs of small enterprises. Research initiatives will be repeated when necessary.
4.6.2.2: Sector projects are developed that are piloted by SETAs and expanded through partnership funding.
4 Small enterprises are included in all core skills development projects and programmes.
4.6.2.3: A national database of small businesses supported with skills development is established and the impact of training reported on.
3 Small business information is included in the MIS.
4.6.3: Worker, NGO and community-based education programmes are supported and their impact measured and reported on.
4.6.3.1: SETAs engage with trade unions, NGOs and community-based organisations in their sector and identify skills needs and strategies to address needs.
The MQA runs capacity-building workshops for labour representatives on a regular basis.A labour coordinator is funded from the administrative budget of the MQA.Research into the skills needs of non-governmental organisations (NGOs) and community-based organisations (CBOs) in the sector has been conducted in the NSDS II period. Currently these needs are catered for in various projects – including the projects aimed at skills development of small-scale miners.
4.6.3.2: SETAs establish quality pilot projects.
4.6.3.3: Stakeholders expand successful projects with support from the NSF.
248

A B C d
Outcome output Strategic objective Comments
4.7 Increasing public sector capacity for improved service delivery and supporting the building of a developmental state
Outcome 4.7.1: A thorough analysis and reflection is conducted on the provision of education and training by the public sector and the contributions of the various role-players.
4.7.1.1: SETAS with responsibility for public sector training conduct analysis and reflection on achievements and challenges.
The DMR identified specific training needs in the SSP development process, which are being and will continue to be addressed.
4.7.1.2: DHET leads a discussion on factors impacting on provision and publishes proposals on improving the institutional framework for public sector education and training.
The MQA will participate fully as and when required.
4.7.2: Education and training plans for the public sector are revised and programmes are implemented to build capacity.
4.7.2.1: SSPs set out the capacity needs of relevant departments and entities.
4 Capacity needs of the DMR are referred to in Chapter 6.
Projects are underway to support DMR’s skills needs. The MQA is committed to the training of mine inspectors and the support of DMR bursars.
4.7.2.2: Plans and funding arrangements are agreed upon between the relevant departments/entities and the SETAs, and are reported on.
4
4.8 Building career and vocational guidance
Outcome 4.8.1: Career paths are mapped to qualifications in all sectors and subsectors, and communicated effectively, contributing to improved relevance of training and greater mobility and progression.
4.8.1.1: Career guides are developed with labour market information from SETAs, addressing subsectors in their sectors.
4
The MQA has developed a career guide and other career guidance materials. It will continue with their revision and regularly participate in career guidance interventions.
4.8.1.2: Sector stakeholders are engaged and programmes are adjusted to meet the skills and qualification needs in order to promote comprehensive career development.
4
The MQA’s Qualifications Framework is revised on an ongoing basis with the active involvement of stakeholders.
249