Morphological and molecular variation in tiger beetles of the Cicindela hybrida complex: is an...
17
Molecular Ecology (2009) 18, 648–664 doi: 10.1111/j.1365-294X.2008.04048.x © 2009 The Authors Journal compilation © 2009 Blackwell Publishing Ltd Blackwell Publishing Ltd Morphological and molecular variation in tiger beetles of the Cicindela hybrida complex: is an ‘integrative taxonomy’ possible? A. CARDOSO,*† A. SERRANO† and A. P. VOGLER*‡ *Department of Entomology, Natural History Museum, Cromwell Road, London SW7 5BD, UK, †Departamento de Biologia Animal/ Centro de Biologia Ambiental, Faculdade de Ciências da Universidade de Lisboa, Rua Ernesto Vasconcelos, Campo Grande, 1749-016 Lisboa, Portugal, ‡Division of Biology, Imperial College London, Silwood Park Campus, Ascot SL5 7PY, UK Abstract Current taxon assignments at the species level are frequently discordant with DNA-based analyses. Recent studies on tiger beetles in the Cicindela hybrida complex identified discordance between mtDNA patterns and the entities currently defined by the taxonomic literature. To test the accuracy of morphologically delimited groups, five named taxa (species) from 24 representative sampling sites across Europe were scored for 41 external morphological characters. Three of the named taxa were ‘diagnosable’, that is, defined by between one and three characters unique to each group. Newly sequenced ITS1 and existing mito- chondrial cox1 markers established 20 and 22 different haplotypes, respectively, but only cox1 produced (four) diagnosable units. Phylogenetic analysis and statistical parsimony networks showed poor congruence of character variation with the taxonomic entities (and each other). Variation in morphological characters was therefore tested directly for association with DNA-based nesting groups at various hierarchical levels using permutational con- tingency analysis. Significant statistical associations of 11 (of 13 variable) morphological characters were observed with nesting groups from ITS1 and mitochondrial DNA markers, predominantly at the 4-step level. The analysis demonstrates the need for formal tests of congruence with morphological variation at the level of individual characters, a step that is omitted from recent studies of ‘integrative taxonomy’. In addition, statistical correlation of particular morphological characters with DNA-based nesting groups can identify the lowest hierarchical level at which various character sets show congruence, as a means to define evolutionarily separated entities supported by diverse data sources. Keywords: association tests, integrative taxonomy, internal transcribed spacer, nested clades, species concepts, statistical parsimony analysis Received 30 April 2008; revision revised 26 October 2008; accepted 2 November 2008 Introduction DNA sequences are employed increasingly to resolve problems in taxonomy and species delimitation, but their use frequently results in conflict with the traditional taxon boundaries and morphological data. To resolve taxonomic problems in the face of such disagreement, recent debates have called for an ‘integrative taxonomy’ that utilises all character information, including morphological and molecular characters, in a unified analysis. However, it remains unclear from the conceptual papers on the issue (Dayrat 2005; Will et al. 2005; Valdecasas et al. 2008) how such ‘integrated’ approach would be applied to establish firm Linnean species designations, in particular if molecular marker distribution and traditional taxonomy prove to be incongruent. It is assumed frequently that delayed lineage sorting and secondary gene flow result in incongruence of gene trees with the lineage phylogeny (Funk & Omland 2003; Hey & Nielsen 2004; Carstens & Knowles 2007) while these Correspondence: Anabela Cardoso, Fax: +34 93 230 9555; E-mail: [email protected]
Transcript of Morphological and molecular variation in tiger beetles of the Cicindela hybrida complex: is an...
Molecular Ecology (2009) 18, 648–664 doi: 10.1111/j.1365-294X.2008.04048.x
© 2009 The AuthorsJournal compilation © 2009 Blackwell Publishing Ltd
Blackwell Publishing LtdMorphological and molecular variation in tiger beetles of the Cicindela hybrida complex: is an ‘integrative taxonomy’ possible?
A. CARDOSO,*† A. SERRANO† and A. P. VOGLER*‡*Department of Entomology, Natural History Museum, Cromwell Road, London SW7 5BD, UK, †Departamento de Biologia Animal/Centro de Biologia Ambiental, Faculdade de Ciências da Universidade de Lisboa, Rua Ernesto Vasconcelos, Campo Grande, 1749-016 Lisboa, Portugal, ‡Division of Biology, Imperial College London, Silwood Park Campus, Ascot SL5 7PY, UK
Abstract
Current taxon assignments at the species level are frequently discordant with DNA-basedanalyses. Recent studies on tiger beetles in the Cicindela hybrida complex identifieddiscordance between mtDNA patterns and the entities currently defined by the taxonomicliterature. To test the accuracy of morphologically delimited groups, five named taxa (species)from 24 representative sampling sites across Europe were scored for 41 external morphologicalcharacters. Three of the named taxa were ‘diagnosable’, that is, defined by between oneand three characters unique to each group. Newly sequenced ITS1 and existing mito-chondrial cox1 markers established 20 and 22 different haplotypes, respectively, but onlycox1 produced (four) diagnosable units. Phylogenetic analysis and statistical parsimonynetworks showed poor congruence of character variation with the taxonomic entities (andeach other). Variation in morphological characters was therefore tested directly for associationwith DNA-based nesting groups at various hierarchical levels using permutational con-tingency analysis. Significant statistical associations of 11 (of 13 variable) morphologicalcharacters were observed with nesting groups from ITS1 and mitochondrial DNA markers,predominantly at the 4-step level. The analysis demonstrates the need for formal tests ofcongruence with morphological variation at the level of individual characters, a step thatis omitted from recent studies of ‘integrative taxonomy’. In addition, statistical correlationof particular morphological characters with DNA-based nesting groups can identify thelowest hierarchical level at which various character sets show congruence, as a meansto define evolutionarily separated entities supported by diverse data sources.
Keywords: association tests, integrative taxonomy, internal transcribed spacer, nested clades,species concepts, statistical parsimony analysis
Received 30 April 2008; revision revised 26 October 2008; accepted 2 November 2008
Introduction
DNA sequences are employed increasingly to resolveproblems in taxonomy and species delimitation, but theiruse frequently results in conflict with the traditional taxonboundaries and morphological data. To resolve taxonomicproblems in the face of such disagreement, recent debateshave called for an ‘integrative taxonomy’ that utilises
all character information, including morphological andmolecular characters, in a unified analysis. However, itremains unclear from the conceptual papers on the issue(Dayrat 2005; Will et al. 2005; Valdecasas et al. 2008) howsuch ‘integrated’ approach would be applied to establishfirm Linnean species designations, in particular if molecularmarker distribution and traditional taxonomy prove to beincongruent.
It is assumed frequently that delayed lineage sortingand secondary gene flow result in incongruence of gene treeswith the lineage phylogeny (Funk & Omland 2003; Hey &Nielsen 2004; Carstens & Knowles 2007) while these
Correspondence: Anabela Cardoso, Fax: +34 93 230 9555; E-mail: [email protected]
I N T E GR AT I V E TA X O N O M Y I N C I C I N D E L A 649
© 2009 The AuthorsJournal compilation © 2009 Blackwell Publishing Ltd
processes are considered less problematic for the expressionof morphological traits. This might suggest that Linneanspecies designations, which are usually based on morpho-logical differences, may constitute a more secure estimateof species boundaries (Will et al. 2005; Valdecasas et al.2008). However, morphology-based taxa frequently havebeen designated without explicit tests of grouping(Brower et al. 1996), as morphological characters may lackclearly circumscribed states and discrete variation (Wiens2001) that are required for the application of most quantita-tive procedures of species delimitation (Sites & Marshall2004). Incongruence of Linnean species designationswith DNA-based entities might be resolved by explicitinvestigations at the level of the characters, rather thanat the level of the groups derived from the variation inmorphological and molecular character suites. There-fore, more specific tests are needed to establish ifincongruence is the result of imprecise character selectionand coding, poorly chosen criteria for grouping, or trueincongruence of character variation in morphology andmolecules.
Unlike quantitative population genetics and coalescenceapproaches applicable to molecular characters (Hey &Nielsen 2004; Maddison & Knowles 2006; Pons et al. 2006;Knowles & Carstens 2007), most procedures for numericalspecies delimitation using morphological characters(Sites & Marshall 2004) establish groupings based on fixedcharacter states. These tests include various implemen-tations of the phylogenetic species concept to ‘aggregate’populations that exhibit unique character states uniformlypresent in all members of a (set of) population(s) (Cracraft1983). This is implemented in Davis & Nixon’s (1992)population aggregation analysis (PAA) and relatedprocedures (Brower 1999; Wiens & Penkrot 2002). Theseprocedures have also been applied successfully inspecies delimitation using mitochondrial DNA (mtDNA)markers. Sequence variation generally shows greatdivergences between groups that broadly match geo-graphically or taxonomically defined entities and can bedefined by multiple diagnostic characters (Hebert &Gregory 2005; Pons et al. 2006; Abellán et al. 2007; Ahrenset al. 2007).
A highly appropriate method for dissecting the spaceof sequence variation along these subdivided groups isthe application of ‘statistical parsimony’ which separatesgroups based on long branches (thereby increasing theprobability of including homoplastic characters that areused as the cut-off for individual networks) (Templetonet al. 1992). These networks generally correlate with theboundaries between species or species complexes (see Hart& Sunday 2007). While these networks are powerful toseparate distant groupings, they also provide the hierarchicalstructure at various levels of nesting that may be correlatedwith other information. This approach has been applied
regularly to correlate hierarchical groups and geographicaldistribution for scenarios of historical population sub-division and dispersal (Posada et al. 2000). The networkscan equally be correlated with the distribution of othertraits including enzyme function (for which the methodwas designed originally; Templeton et al. 1987).
Here we implement this technique for correlating theinternal structure of parsimony networks in mitochondrialand nuclear DNA markers with morphological charactersused to distinguish closely related lineages. Specifically,we studied tiger beetles in the taxonomically complexCicindela hybrida group, in which we previously observeddiscordance between mtDNA-based groups and the tradi-tional (sub)species taxonomy (Cardoso & Vogler 2005). TheC. hybrida group consists of several geographical formsdistributed across Europe and the western Palaearcticregion that has been revised several times (Horn 1926;Mandl 1935, 1936; Gebert 1995; Matalin 1998; Gebert 1999;Matalin 1999). The group has been subdivided intobetween three and seven named species based on externalmorphological characters, male and female genitalia, andgeographical distributions. Our recent attempts to clarifythe relationships and species boundaries in this groupbased on some 1900 bps of mtDNA (Cardoso & Vogler2005) revealed strongly structured sequence variation inline with those studies that split taxonomic groupingsmore finely, but two widespread species C. hybrida andC. transversalis were not separable and also were para-phyletic for C. lusitanica from the Portuguese coast.
This leaves uncertainty as to the exact delineation ofthese taxa and the validity of various conflicting revi-sionary studies. We therefore investigated the pattern ofvariation in an additional marker, the internal transcribedspacer region 1 (ITS1), that could arbitrate between the twoexisting data sets. In addition, as the conflict betweenmolecular markers and the morphology-based taxonomicgroups may be due to the incorrect interpretation of thecharacters, we conducted an explicit analysis of themorphological characters and tested their association withDNA-based groups. Congruence and conflict of differentmarkers can be at any hierarchical level. Therefore, wetested the correlation of each character state with the n-stepnetworks from statistical parsimony analysis which pro-vided nested sets of hierarchical groupings based onmtDNA and ITS1. Equally, association can be assessedagainst the diagnosable groups from PAA and relatedtechniques, that is, the phylogenetic species formallydelimited based on the molecular data. Conducting thetests of associations at the levels of individual morphologicalcharacters, rather than Linnean groups (= names), avoidsthat the use of groups defined in the earlier studies wouldobscure any hitherto unrecognised entities. In turn, newentities may be evident from congruent morphological andmolecular data.
650 A . C A R D O S O , A . S E R R A N O and A . P. V O G L E R
© 2009 The AuthorsJournal compilation © 2009 Blackwell Publishing Ltd
Materials and methods
Sampling and assignment of groupings
Morphological analysis was performed on the samespecimens used for molecular study. Only in two cases(Cicindela transversalis specimen TA24–347, TB22–338) werespecimens used for the morphological analysis substitutedby another specimen from the same or nearby locality. TheDNA analyses included 53 specimens of the C. hybridacomplex from 24 sampling sites (each represented by oneto eight specimens) and the closely related C. majalis asoutgroup (Table 1). Samples were mostly those alreadyused in Cardoso & Vogler (2005) but with several individualsadded while others were not included if the correspondingITS sequences could not be obtained. Taxon identification,collection data and mtDNA group assignments accordingto Cardoso & Vogler (2005) are presented in Table 1.
Outgroup choice was based on the taxonomy of the groupand empirical evidence based on ITS1 sequences from arange of Cicindela species, with only C. majalis preservingsufficient sequence similarity to establish alignments.
In the most recent revisions, up to seven species-levelnames (Matalin 1998, 1999) have been applied in theC. hybrida group, including C. lagunensis, C. iberica andC. lusitanica (= C. lagunensis sensu Gebert 1995), C. hybridaand C. transversalis (= C. hybrida sensu Gebert 1999), andC. sahlbergi and C. monticola (= C. sahlbergi sensu Gebert1995). The latter two are distributed in southeasternEurope and Asia and were not analysed in the presentstudy. Species identifications were based on the identificationkey of Gebert (1995) and the character tables presented inMatalin (1998, 1999). The identification of a few specimensof C. hybrida or C. transversalis (considered subspecies ofC. hybrida in Gebert 1999) was ambiguous, in which casewe used the collectors’ identifications.
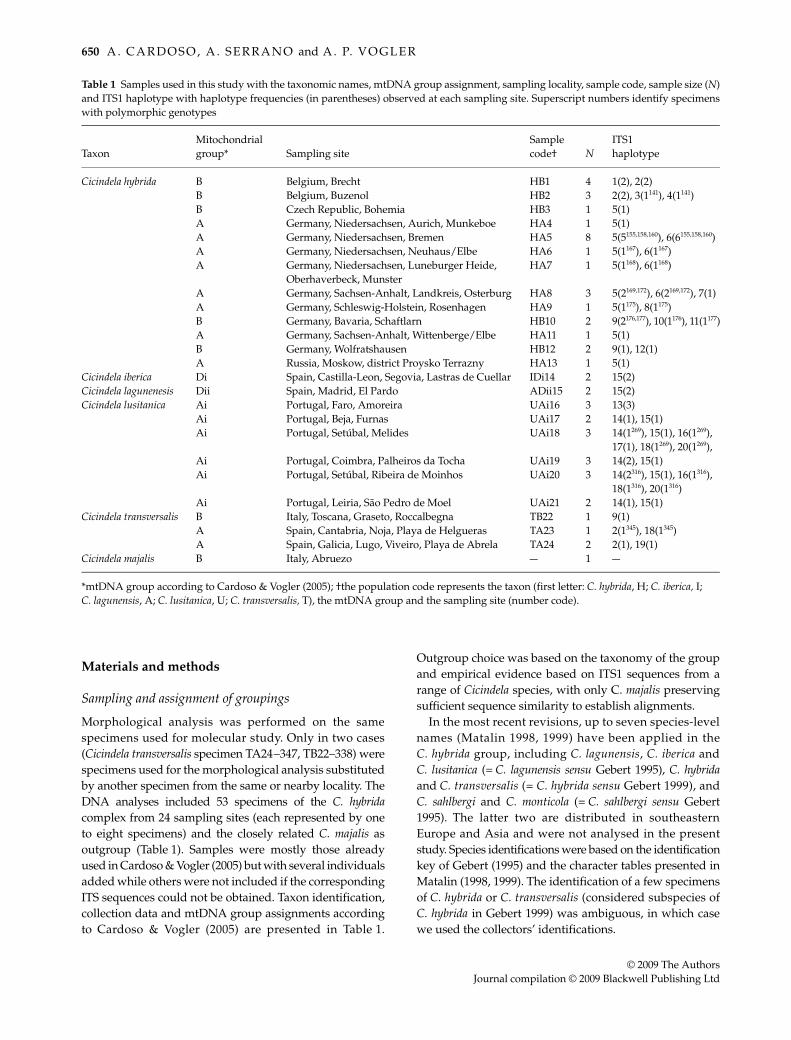
Table 1 Samples used in this study with the taxonomic names, mtDNA group assignment, sampling locality, sample code, sample size (N)and ITS1 haplotype with haplotype frequencies (in parentheses) observed at each sampling site. Superscript numbers identify specimenswith polymorphic genotypes
TaxonMitochondrial group* Sampling site
Sample code† N
ITS1 haplotype
Cicindela hybrida B Belgium, Brecht HB1 4 1(2), 2(2)B Belgium, Buzenol HB2 3 2(2), 3(1141), 4(1141)B Czech Republic, Bohemia HB3 1 5(1)A Germany, Niedersachsen, Aurich, Munkeboe HA4 1 5(1)A Germany, Niedersachsen, Bremen HA5 8 5(5155,158,160), 6(6155,158,160)A Germany, Niedersachsen, Neuhaus/Elbe HA6 1 5(1167), 6(1167)A Germany, Niedersachsen, Luneburger Heide,
Oberhaverbeck, MunsterHA7 1 5(1168), 6(1168)
A Germany, Sachsen-Anhalt, Landkreis, Osterburg HA8 3 5(2169,172), 6(2169,172), 7(1)A Germany, Schleswig-Holstein, Rosenhagen HA9 1 5(1175), 8(1175)B Germany, Bavaria, Schaftlarn HB10 2 9(2176,177), 10(1176), 11(1177)A Germany, Sachsen-Anhalt, Wittenberge/Elbe HA11 1 5(1)B Germany, Wolfratshausen HB12 2 9(1), 12(1)A Russia, Moskow, district Proysko Terrazny HA13 1 5(1)
Cicindela iberica Di Spain, Castilla-Leon, Segovia, Lastras de Cuellar IDi14 2 15(2)Cicindela lagunenesis Dii Spain, Madrid, El Pardo ADii15 2 15(2)Cicindela lusitanica Ai Portugal, Faro, Amoreira UAi16 3 13(3)
Ai Portugal, Beja, Furnas UAi17 2 14(1), 15(1)Ai Portugal, Setúbal, Melides UAi18 3 14(1269), 15(1), 16(1269),
17(1), 18(1269), 20(1269),Ai Portugal, Coimbra, Palheiros da Tocha UAi19 3 14(2), 15(1)Ai Portugal, Setúbal, Ribeira de Moinhos UAi20 3 14(2316), 15(1), 16(1316),
18(1316), 20(1316)Ai Portugal, Leiria, São Pedro de Moel UAi21 2 14(1), 15(1)
Cicindela transversalis B Italy, Toscana, Graseto, Roccalbegna TB22 1 9(1)A Spain, Cantabria, Noja, Playa de Helgueras TA23 1 2(1345), 18(1345)A Spain, Galicia, Lugo, Viveiro, Playa de Abrela TA24 2 2(1), 19(1)
Cicindela majalis B Italy, Abruezo — 1 —
*mtDNA group according to Cardoso & Vogler (2005); †the population code represents the taxon (first letter: C. hybrida, H; C. iberica, I; C. lagunensis, A; C. lusitanica, U; C. transversalis, T), the mtDNA group and the sampling site (number code).

I N T E GR AT I V E TA X O N O M Y I N C I C I N D E L A 651
© 2009 The AuthorsJournal compilation © 2009 Blackwell Publishing Ltd
Based on the species designation and cox1 haplotypegroup, each specimen was assigned a name code thatincorporates the taxonomic and mtDNA information. Thefirst letter code refers to the species identity (H, C. hybrida;T, C. transversalis; U, C. lusitanica; A, C. lagunensis; I, C. iberica).The subsequent letters of the specimen code refer to themain mtDNA haplotype groups established in Cardoso &Vogler (2005), including haplotype group A (mainly foundin C. hybrida and C. transversalis), haplotype group Ai (inC. lusitanica), haplotype group B (in C. hybrida and C. trans-versalis), haplotype group Di (in C. iberica) and haplotypegroup Dii (in C. lagunensis). The codes therefore representspecies membership and major mtDNA cluster for theindividuals included in the ITS1 analysis, but the popula-tions are not necessarily uniform for the composition ofmtDNA groups (Cardoso & Vogler 2005). Individuals ofhaplotype group C (Cardoso & Vogler 2005) were notincluded here.
Sequencing and sequence editing
Information on DNA extraction procedures can be obtainedfrom Cardoso & Vogler (2005). Single-copy nuclear markersfor the analysis of population-level variation are poorlydeveloped in tiger beetles. The availability of expressedsequence tag (EST) libraries for three species of tiger beetles(Hughes et al. 2006) resulted in the development of theMp20 gene as single-copy marker in Cicindela (Pons et al.2004) but variation within species is low (unpublished) andinitial attempts for amplification in the C. hybrida grouphad mixed success. Hence, the ITS1 region was selectedhere for its ease of polymerase chain reaction (PCR)amplification, despite known problems of reconstructinglineage phylogeny from this locus due to concerted evolutionand pseudogene formation. Previous studies using ITSvariation in the North American C. dorsalis complexshowed that this marker was highly appropriate to detectthe historical signal of Pleistocene population separation,for example, strongly supporting the well-establishedvicariance of populations from the Atlantic Ocean and Gulfof Mexico coastlines (Avise 1992; Vogler & DeSalle 1994).PCR amplification was carried out with standard primersITS1 and ITS2 (White et al. 1990) under the followingconditions: 4 min at 95 °C, followed by 35 cycles ofdenaturation at 95 °C for 30 s, annealing at 50 °C for 1 minand extension at 72 °C for 2 min, with a final single extraextension step at 72 °C for 10 min. PCR products werepurified using the GENECLEAN II Kit (BIO 101 Inc.) andsequenced in both directions (directly, without cloning ofPCR products) with the same PCR primers using BigDyechemistry and an ABI 3700 DNA Analyser (AppliedBiosystems). Sequences were manually edited and comple-mentary strands assembled using Sequencher 4.1.2 (GeneCodes Corporation). The corresponding mtDNA data set
for the same specimens included 45 sequences of cytochromeoxidase subunit I (cox1) from Cardoso & Vogler (2005) andeight new sequences obtained specifically for this study(specimens HB1-352, HB2-353, 354, UAi16-215, 216,217, UAi18-269 and UAi20-319). All new sequences aredeposited in the European Molecular Biology Laboratory(EMBL) Nucleotide Sequence Database with the accessionnos AJ833778–780, 832, 882, AM992727–729 (for cox1) andAM998639–710 (for ITS1).
Molecular phylogenetic analyses
ITS1 sequences were aligned using Clustal_X (Thompsonet al. 1997). Parsimony analyses were performed withpaup* 4.0b10 (Swofford 2002) conducting heuristic searcheswith 10 random sequence addition replicates and tree-bisection–reconnection (TBR) branch-swapping, withgaps coded as a fifth character state. Gapped characterswere either given equal weight or were downweighted inmultiresidue indels to give less weight per nucleotideproportional to indel size (e.g. for an indel with fournucleotides each would be weighted 0.25). Nodal supportwas assessed based on bootstrap proportions from 1000replicates of a heuristic search each with 10 randomsequence addition replicates and TBR branch swapping.Congruence between the ITS1 and the cox1 data sets wasassessed using the incongruence length difference (ILD)test of (Farris et al. 1994) as implemented in paup* byperforming 1000 homogeneity replicates with 10 randomsequence addition replicates each. Bremer support (Bremer1988) and partitioned Bremer support (Baker & DeSalle1997) were obtained by generating constraint files withTreeRot 2.0 (Sorenson 1999).
Statistical parsimony networks (Templeton et al. 1992)were obtained with tcs 1.13 (Clement et al. 2000). The ITS1data were analysed with the long indels re-coded apply-ing the above weighting scheme. Intrapopulation andintraspecific nucleotide diversity values were calculatedwith DnaSP 4.0 (Rozas et al. 2003). Measures of ITS1mean sequence divergences were obtained with mega 3.1(Kumar et al. 2004) excluding gapped positions and applyinga Kimura 2-parameter correction.
DNA-based species delimitation
Formal tests for species delimitation under the phylogeneticspecies concept (see above) were performed separatelyfor the ITS1 and cox1 data sets. We applied PAA (Davis &Nixon 1992; Brower 1999) and cladistic haplotype analysis(CHA) (Brower 1999) whereby the Linnean species namesprovided the initial hypotheses of entities which weretested for ‘diagnosability’, that is, the presence of charactersunique to the hypothesised groups that are absent fromall others. PAA can either be conducted on the complete
652 A . C A R D O S O , A . S E R R A N O and A . P. V O G L E R
© 2009 The AuthorsJournal compilation © 2009 Blackwell Publishing Ltd
haplotypes (PAA1) or on each variable nucleotide position(PAA2) (Brower 1999). Grouping under CHA is based onthe test for diagnosability in the context of a phylogenetictree, that is, characters shared among a monophyleticgroup of individuals may be diagnostic even if thecharacter changes are homoplastic elsewhere in thetree. CHA is considered superior over PAA due to itsmore efficient use of the sequence information (Brower1999).
Scoring and coding of morphological data
Each specimen included in the molecular analyses wasscored for 41 morphological characters, out of a set of 99characters used by Matalin (1998, 1999). Characters notused here were gender specific and quantitative charactersand were omitted because of the uneven representation ofboth sexes at each sampling site and the overall smallsample sizes. Other excluded characters were the colour ofthe abdominal sternites which did not match the variationdescribed in Matalin (1998), and their chaetotaxy whichwas difficult to score because of the loss of setae in ourspecimens. Characters were coded according to Matalin(1998) with slight modifications in the kind and number ofcharacter states (Table 2).
Association tests
Permutational contingency analysis was applied usingChiperm 1.2 (D. Posada; University of Vigo, Spain). Thesignificance of the chi-squared value was obtained witha Monte Carlo procedure using the algorithm of (Roff &Bentzen 1989). The test was used for assessing the signific-ance of associations of each morphological characterwith the n-step nesting groups and aggregation groupsobtained for both molecular markers.
Results
ITS1 and cox1 sequence variation
ITS1 fragments were obtained for 53 specimens ofthe Cicindela hybrida group and C. majalis. Some 27% ofspecimens were polymorphic for ITS1 sequences, resultingin a total of 71 scorable ‘haplotypes’ (see Table 1). Thesevaried in length from 289 to 297 nucleotides and afteralignment resulted in a matrix of 300 characters. In total, 20different ITS1 sequences were identified which differed at29 variable sites (Table S1). After recoding of multiresidueindels, 25 variable characters were defined which comprised13 nucleotide substitutions, 10 insertions/deletions andtwo characters with both substitutions and indels. Intra-individual variation affected no more than a singlenucleotide position (or a four-A indel in one specimen,
HB2-141) allowing an unambiguous separation of geneticvariants. Only in two specimens (UAi18–269 and UAi20–316), two polymorphic sites resulted in theoretically fouralternative haplotypes. Without cloning to confirm thephase of allelic sites, each of these four alternatives wasincluded in the analyses.
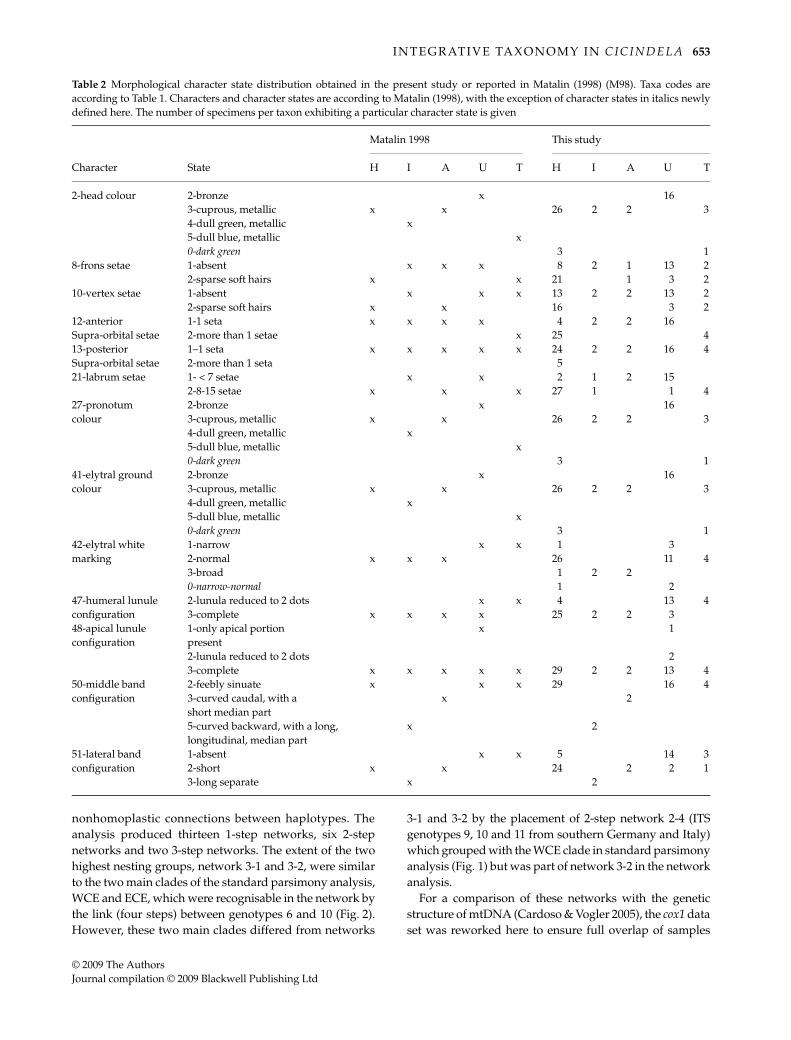
Most ITS1 haplotypes were exclusive to a particularLinnean species, with the exception of haplotypes 2 and 9present in both C. hybrida and C. transversalis; haplotype15 present in the three Iberian endemics, C. iberica,C. lagunensis and C. lusitanica; and haplotype 18 present inC. transversalis and C. lusitanica. Similarly, each of the ITS1haplotypes was exclusive to a single mtDNA group exceptfor a few cases where major mtDNA types occurred inclose proximity, such as haplotype 15 represented ingroups Ai, Di and Dii (Table 1). Where ITS1 were poly-morphic for a specimen, multiple copies were exclusive to aparticular species as well as to a mtDNA group (with theexception of haplotype 18; Table 1). Genetic variability wasgenerally low in ITS1 and nucleotide diversity for theentire data set was about 1.5 times lower (π = 0.00955) thanin cox1 (π = 0.01406). The values within each species werealso generally lower in ITS than cox1 (π = 0.00712 vs.π = 0.00921 in C. hybrida; π = 0 vs. π = 0.00418 in C. iberica;π = 0.00578 vs. π = 0.00958 in C. transversalis and π = 0.00495vs. π = 0.00316 in C. lusitanica; both markers invariable inC. lagunensis). Intrapopulational nucleotide diversity wasup to an order of magnitude lower than that obtained forcox1 (Table 3). Pairwise sequence divergences amongpopulations and among named species were also up tofour times lower for the nuclear marker compared tomtDNA (Table S2).
ITS1 and cox1 phylogenetic groups and relationships
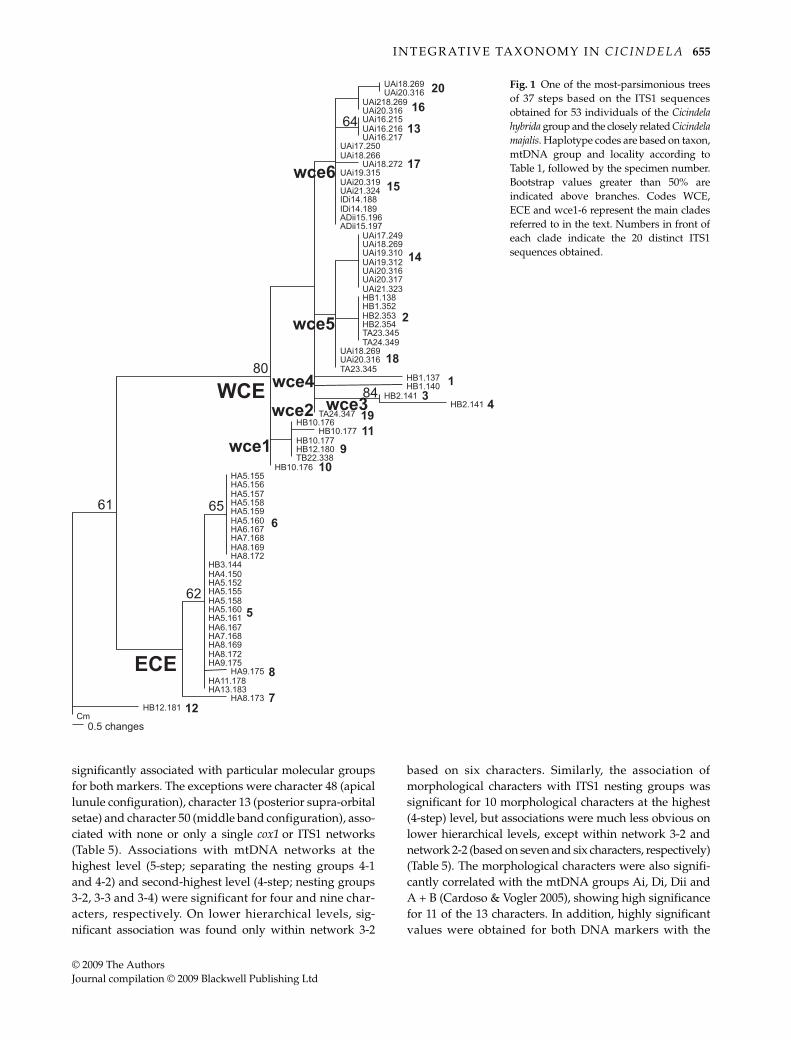
Phylogenetic analysis of ITS1 haplotypes was performedwith either all indels weighted equally or downweightedaccording to indel length (in parentheses; see Methods).This resulted in most parsimonious cladograms of 42 (37)steps and CI = 0.74 and RI = 0.96 (CI = 0.73 and RI = 0.96)(Fig. 1). Two highly supported (bootstrap support = 80%)major clades were obtained corresponding to an allopatricwestern group (WCE) including localities from Portugal toBelgium, southern Germany and Italy, and an easterngroup (ECE) represented by sampling sites from NorthernGermany, Czech Republic and Russia. The WCE groupwas further subdivided into a clade corresponding togenotypes from Italy and southern Germany (wce1) whichwas sister to a poorly resolved clade representing themajority of populations. The latter included five subclades(wce2-6) of various range sizes (Fig. 1).
Statistical parsimony performed on the ITS1 data (Fig. 2)resulted in a single network, as all connections were belowthe threshold of seven steps for the 95% probability of
I N T E GR AT I V E TA X O N O M Y I N C I C I N D E L A 653
© 2009 The AuthorsJournal compilation © 2009 Blackwell Publishing Ltd
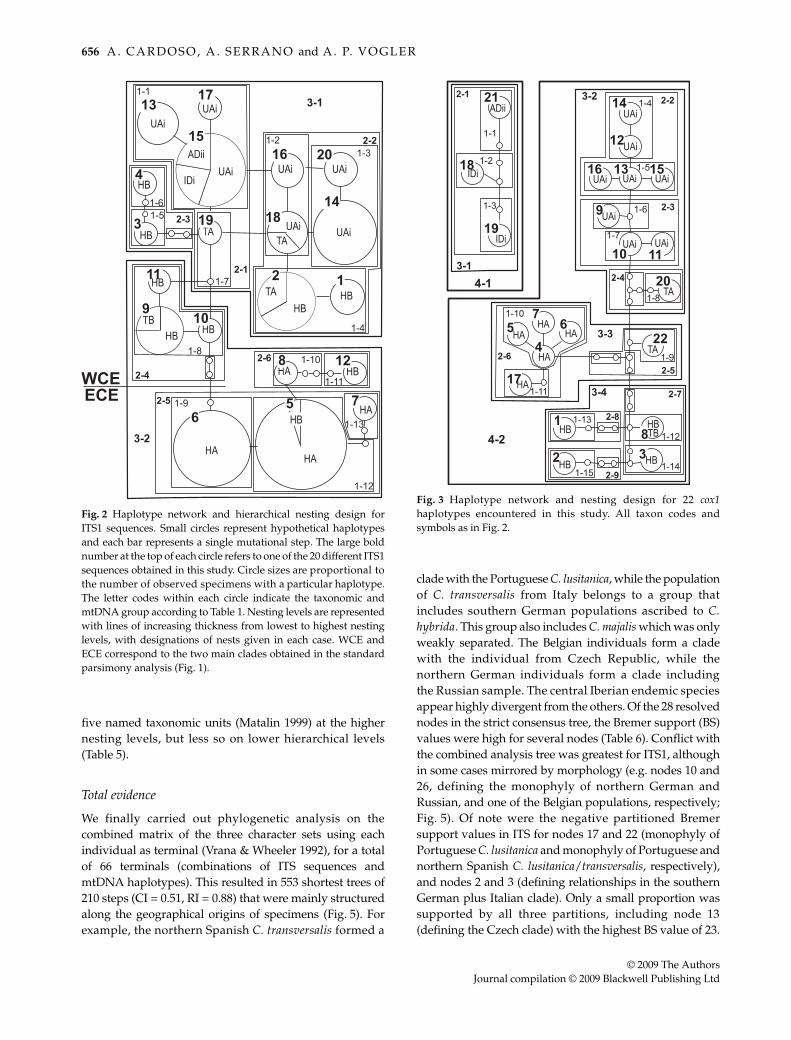
nonhomoplastic connections between haplotypes. Theanalysis produced thirteen 1-step networks, six 2-stepnetworks and two 3-step networks. The extent of the twohighest nesting groups, network 3-1 and 3-2, were similarto the two main clades of the standard parsimony analysis,WCE and ECE, which were recognisable in the network bythe link (four steps) between genotypes 6 and 10 (Fig. 2).However, these two main clades differed from networks
3-1 and 3-2 by the placement of 2-step network 2-4 (ITSgenotypes 9, 10 and 11 from southern Germany and Italy)which grouped with the WCE clade in standard parsimonyanalysis (Fig. 1) but was part of network 3-2 in the networkanalysis.
For a comparison of these networks with the geneticstructure of mtDNA (Cardoso & Vogler 2005), the cox1 dataset was reworked here to ensure full overlap of samples
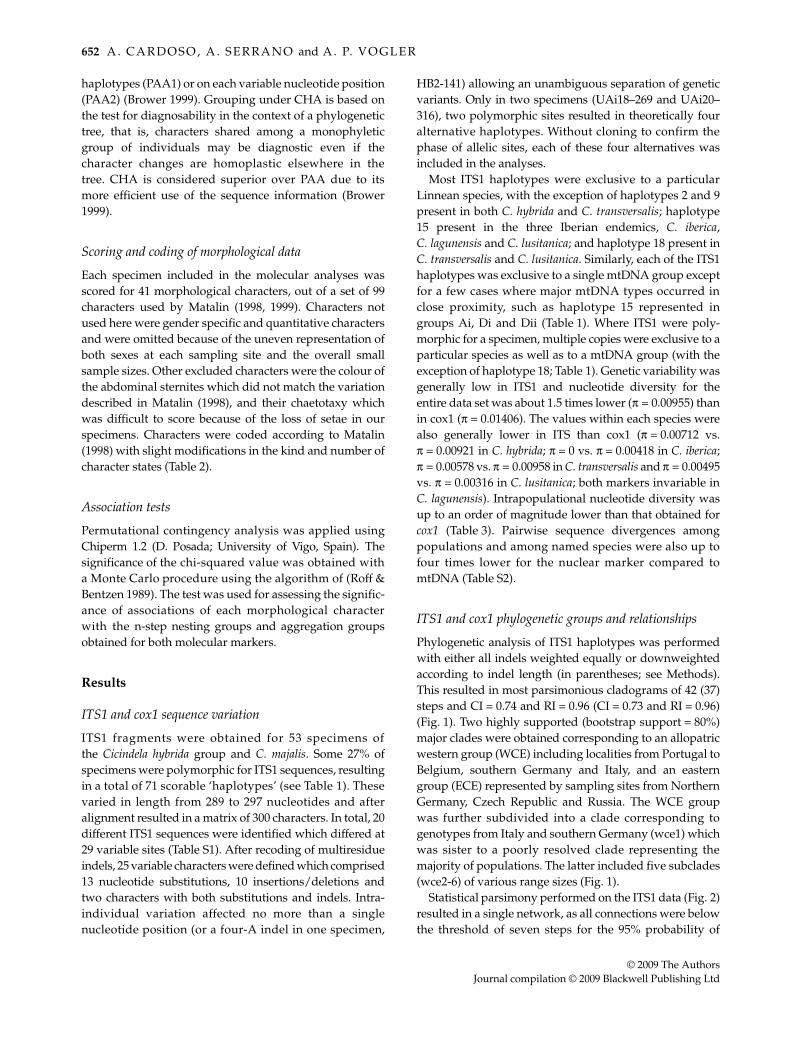
Table 2 Morphological character state distribution obtained in the present study or reported in Matalin (1998) (M98). Taxa codes areaccording to Table 1. Characters and character states are according to Matalin (1998), with the exception of character states in italics newlydefined here. The number of specimens per taxon exhibiting a particular character state is given
Matalin 1998 This study
Character State H I A U T H I A U T
2-head colour 2-bronze x 163-cuprous, metallic x x 26 2 2 34-dull green, metallic x5-dull blue, metallic x0-dark green 3 1
8-frons setae 1-absent x x x 8 2 1 13 22-sparse soft hairs x x 21 1 3 2
10-vertex setae 1-absent x x x 13 2 2 13 22-sparse soft hairs x x 16 3 2
12-anterior 1-1 seta x x x x 4 2 2 16Supra-orbital setae 2-more than 1 setae x 25 413-posterior 1–1 seta x x x x x 24 2 2 16 4Supra-orbital setae 2-more than 1 seta 521-labrum setae 1- < 7 setae x x 2 1 2 15
2-8-15 setae x x x 27 1 1 427-pronotum 2-bronze x 16colour 3-cuprous, metallic x x 26 2 2 3
4-dull green, metallic x5-dull blue, metallic x0-dark green 3 1
41-elytral ground 2-bronze x 16colour 3-cuprous, metallic x x 26 2 2 3
4-dull green, metallic x5-dull blue, metallic x0-dark green 3 1
42-elytral white 1-narrow x x 1 3marking 2-normal x x x 26 11 4
3-broad 1 2 20-narrow-normal 1 2
47-humeral lunule 2-lunula reduced to 2 dots x x 4 13 4configuration 3-complete x x x x 25 2 2 348-apical lunule 1-only apical portion x 1configuration present
2-lunula reduced to 2 dots 23-complete x x x x x 29 2 2 13 4
50-middle band 2-feebly sinuate x x x 29 16 4configuration 3-curved caudal, with a x 2
short median part5-curved backward, with a long, longitudinal, median part
x 2
51-lateral band 1-absent x x 5 14 3configuration 2-short x x 24 2 2 1
3-long separate x 2
654 A . C A R D O S O , A . S E R R A N O and A . P. V O G L E R
© 2009 The AuthorsJournal compilation © 2009 Blackwell Publishing Ltd
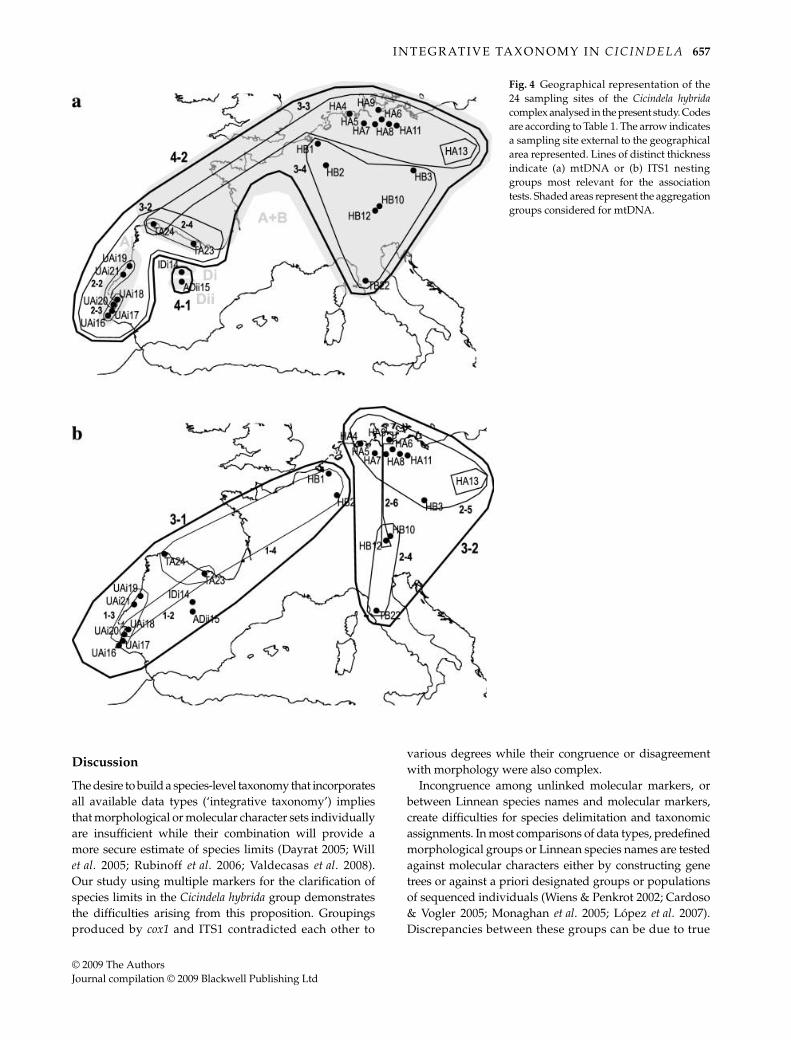
with the ITS data. The mtDNA revealed two separatenetworks corresponding to mtDNA clades A + B and cladeD (Fig. 3). The ILD test between the two molecular partitions(cox1 and ITS1) was highly significant (P = 0.001), andmajor topological differences and inconsistent geographicaldistributions in the two markers were easily apparent.These discrepancies included (i) the deepest split in mtDNA(separating the two independent networks) separates thecentral Iberian endemics, C. iberica and C. lagunensis, fromall others, while the coastal Portuguese C. lusitanica werelinked to populations of C. transversalis in northern Spain(Fig. 3). In contrast, ITS1 grouped C. lusitanica closely withthe central Iberian species (network 1-1); these combinedare linked to other populations from the western WCEclade at the 2-step level. (ii) The two main groups of ITS1(networks 3-1 and 3-2) separate western and easternpopulations on either side along a line in Central Europe,dividing all populations from Belgium through centralSpain from those in Germany, Italy and Russia (Fig. 4). Incontrast, eastern haplotypes in mtDNA (network 3-3)extended much further west to the Pyrenees, where theymix with the western haplotypes (network 3-2). (iii) Thepopulations of C. transversalis from Italy and northernSpain were not grouped together by either marker, butaffinities of the disjunct populations were different in theITS1 and cox1 markers, as each grouped with theirgeographically closest relatives. (iv) The delimitation ofC. hybrida s. str. was affected by slight discrepancies in the
east–west subdivision in Central Europe whereby ITS1removed the Belgian populations from those further east,unlike the mtDNA.
DNA-based species limits
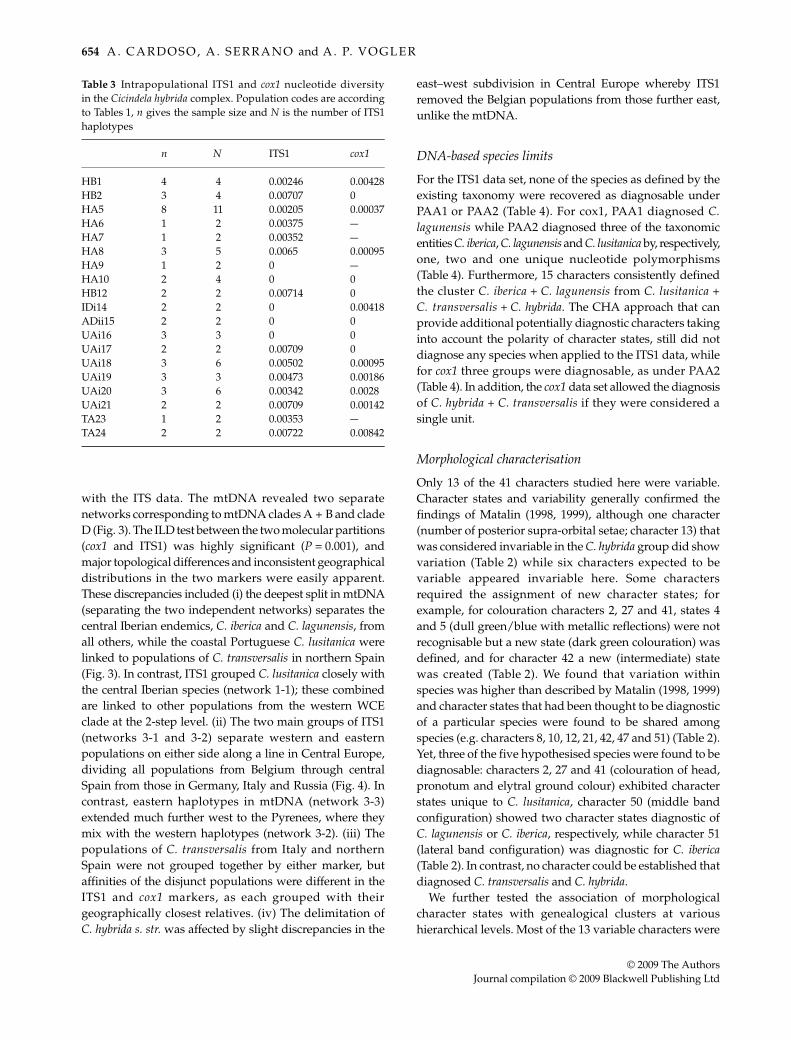
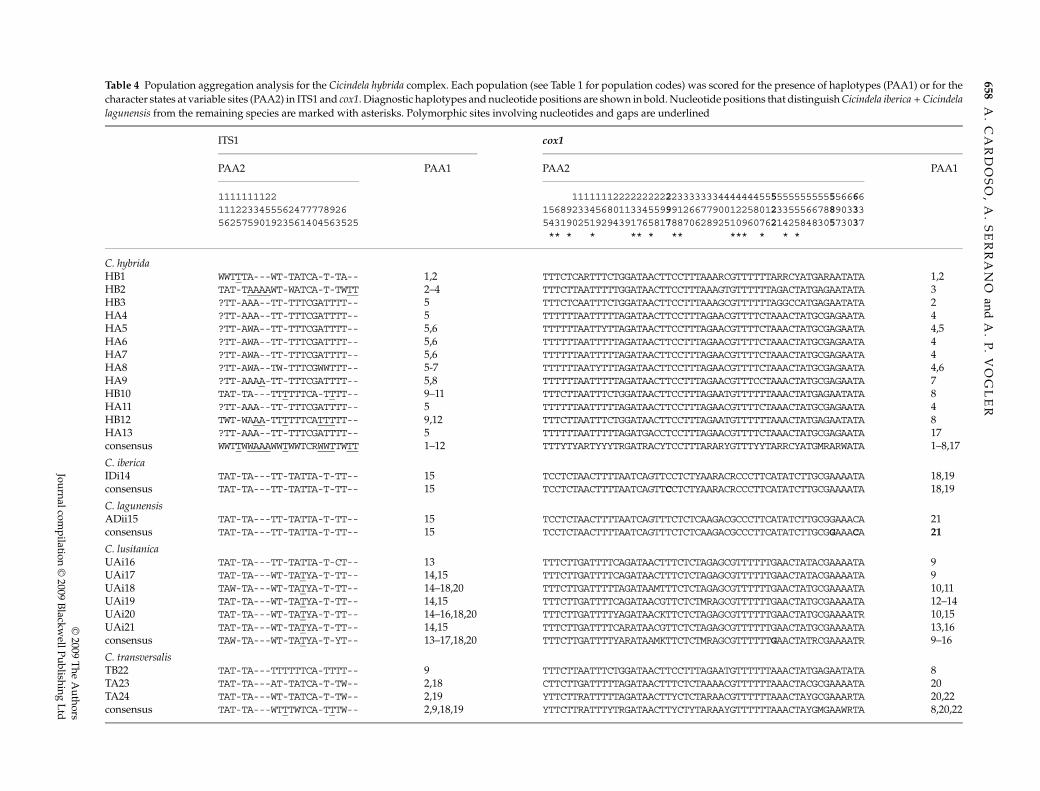
For the ITS1 data set, none of the species as defined by theexisting taxonomy were recovered as diagnosable underPAA1 or PAA2 (Table 4). For cox1, PAA1 diagnosed C.lagunensis while PAA2 diagnosed three of the taxonomicentities C. iberica, C. lagunensis and C. lusitanica by, respectively,one, two and one unique nucleotide polymorphisms(Table 4). Furthermore, 15 characters consistently definedthe cluster C. iberica + C. lagunensis from C. lusitanica +C. transversalis + C. hybrida. The CHA approach that canprovide additional potentially diagnostic characters takinginto account the polarity of character states, still did notdiagnose any species when applied to the ITS1 data, whilefor cox1 three groups were diagnosable, as under PAA2(Table 4). In addition, the cox1 data set allowed the diagnosisof C. hybrida + C. transversalis if they were considered asingle unit.
Morphological characterisation
Only 13 of the 41 characters studied here were variable.Character states and variability generally confirmed thefindings of Matalin (1998, 1999), although one character(number of posterior supra-orbital setae; character 13) thatwas considered invariable in the C. hybrida group did showvariation (Table 2) while six characters expected to bevariable appeared invariable here. Some charactersrequired the assignment of new character states; forexample, for colouration characters 2, 27 and 41, states 4and 5 (dull green/blue with metallic reflections) were notrecognisable but a new state (dark green colouration) wasdefined, and for character 42 a new (intermediate) statewas created (Table 2). We found that variation withinspecies was higher than described by Matalin (1998, 1999)and character states that had been thought to be diagnosticof a particular species were found to be shared amongspecies (e.g. characters 8, 10, 12, 21, 42, 47 and 51) (Table 2).Yet, three of the five hypothesised species were found to bediagnosable: characters 2, 27 and 41 (colouration of head,pronotum and elytral ground colour) exhibited characterstates unique to C. lusitanica, character 50 (middle bandconfiguration) showed two character states diagnostic ofC. lagunensis or C. iberica, respectively, while character 51(lateral band configuration) was diagnostic for C. iberica(Table 2). In contrast, no character could be established thatdiagnosed C. transversalis and C. hybrida.
We further tested the association of morphologicalcharacter states with genealogical clusters at varioushierarchical levels. Most of the 13 variable characters were
Table 3 Intrapopulational ITS1 and cox1 nucleotide diversityin the Cicindela hybrida complex. Population codes are accordingto Tables 1, n gives the sample size and N is the number of ITS1haplotypes
n N ITS1 cox1
HB1 4 4 0.00246 0.00428HB2 3 4 0.00707 0HA5 8 11 0.00205 0.00037HA6 1 2 0.00375 —HA7 1 2 0.00352 —HA8 3 5 0.0065 0.00095HA9 1 2 0 —HA10 2 4 0 0HB12 2 2 0.00714 0IDi14 2 2 0 0.00418ADii15 2 2 0 0UAi16 3 3 0 0UAi17 2 2 0.00709 0UAi18 3 6 0.00502 0.00095UAi19 3 3 0.00473 0.00186UAi20 3 6 0.00342 0.0028UAi21 2 2 0.00709 0.00142TA23 1 2 0.00353 —TA24 2 2 0.00722 0.00842
I N T E GR AT I V E TA X O N O M Y I N C I C I N D E L A 655
© 2009 The AuthorsJournal compilation © 2009 Blackwell Publishing Ltd
significantly associated with particular molecular groupsfor both markers. The exceptions were character 48 (apicallunule configuration), character 13 (posterior supra-orbitalsetae) and character 50 (middle band configuration), asso-ciated with none or only a single cox1 or ITS1 networks(Table 5). Associations with mtDNA networks at thehighest level (5-step; separating the nesting groups 4-1and 4-2) and second-highest level (4-step; nesting groups3-2, 3-3 and 3-4) were significant for four and nine char-acters, respectively. On lower hierarchical levels, sig-nificant association was found only within network 3-2
based on six characters. Similarly, the association ofmorphological characters with ITS1 nesting groups wassignificant for 10 morphological characters at the highest(4-step) level, but associations were much less obvious onlower hierarchical levels, except within network 3-2 andnetwork 2-2 (based on seven and six characters, respectively)(Table 5). The morphological characters were also signifi-cantly correlated with the mtDNA groups Ai, Di, Dii andA + B (Cardoso & Vogler 2005), showing high significancefor 11 of the 13 characters. In addition, highly significantvalues were obtained for both DNA markers with the
Fig. 1 One of the most-parsimonious treesof 37 steps based on the ITS1 sequencesobtained for 53 individuals of the Cicindelahybrida group and the closely related Cicindelamajalis. Haplotype codes are based on taxon,mtDNA group and locality according toTable 1, followed by the specimen number.Bootstrap values greater than 50% areindicated above branches. Codes WCE,ECE and wce1-6 represent the main cladesreferred to in the text. Numbers in front ofeach clade indicate the 20 distinct ITS1sequences obtained.
656 A . C A R D O S O , A . S E R R A N O and A . P. V O G L E R
© 2009 The AuthorsJournal compilation © 2009 Blackwell Publishing Ltd
five named taxonomic units (Matalin 1999) at the highernesting levels, but less so on lower hierarchical levels(Table 5).
Total evidence
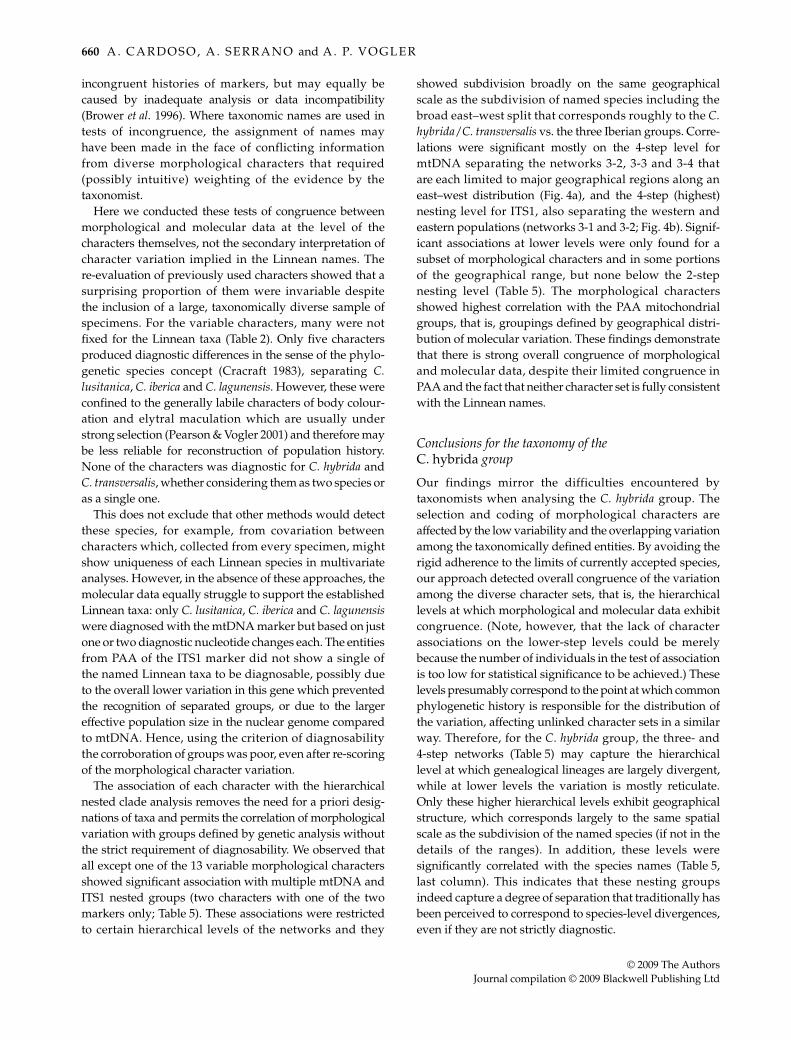
We finally carried out phylogenetic analysis on thecombined matrix of the three character sets using eachindividual as terminal (Vrana & Wheeler 1992), for a totalof 66 terminals (combinations of ITS sequences andmtDNA haplotypes). This resulted in 553 shortest trees of210 steps (CI = 0.51, RI = 0.88) that were mainly structuredalong the geographical origins of specimens (Fig. 5). Forexample, the northern Spanish C. transversalis formed a
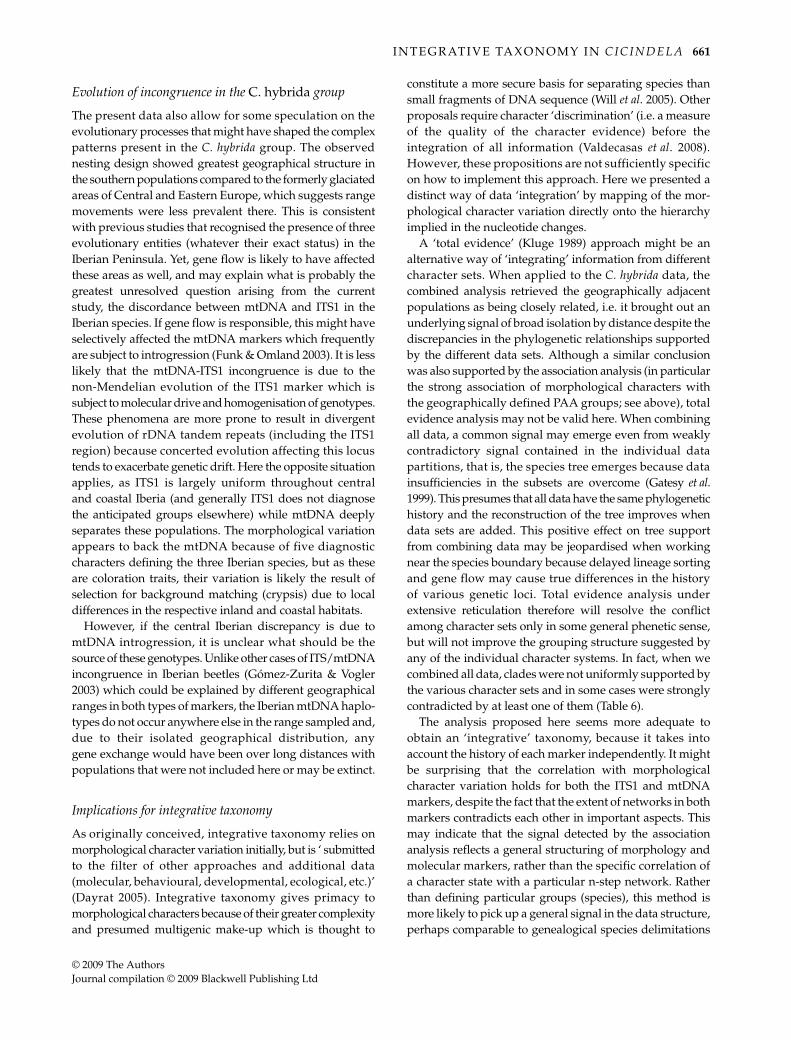
clade with the Portuguese C. lusitanica, while the populationof C. transversalis from Italy belongs to a group thatincludes southern German populations ascribed to C.hybrida. This group also includes C. majalis which was onlyweakly separated. The Belgian individuals form a cladewith the individual from Czech Republic, while thenorthern German individuals form a clade includingthe Russian sample. The central Iberian endemic speciesappear highly divergent from the others. Of the 28 resolvednodes in the strict consensus tree, the Bremer support (BS)values were high for several nodes (Table 6). Conflict withthe combined analysis tree was greatest for ITS1, althoughin some cases mirrored by morphology (e.g. nodes 10 and26, defining the monophyly of northern German andRussian, and one of the Belgian populations, respectively;Fig. 5). Of note were the negative partitioned Bremersupport values in ITS for nodes 17 and 22 (monophyly ofPortuguese C. lusitanica and monophyly of Portuguese andnorthern Spanish C. lusitanica/transversalis, respectively),and nodes 2 and 3 (defining relationships in the southernGerman plus Italian clade). Only a small proportion wassupported by all three partitions, including node 13(defining the Czech clade) with the highest BS value of 23.
Fig. 2 Haplotype network and hierarchical nesting design forITS1 sequences. Small circles represent hypothetical haplotypesand each bar represents a single mutational step. The large boldnumber at the top of each circle refers to one of the 20 different ITS1sequences obtained in this study. Circle sizes are proportional tothe number of observed specimens with a particular haplotype.The letter codes within each circle indicate the taxonomic andmtDNA group according to Table 1. Nesting levels are representedwith lines of increasing thickness from lowest to highest nestinglevels, with designations of nests given in each case. WCE andECE correspond to the two main clades obtained in the standardparsimony analysis (Fig. 1).
Fig. 3 Haplotype network and nesting design for 22 cox1haplotypes encountered in this study. All taxon codes andsymbols as in Fig. 2.
I N T E GR AT I V E TA X O N O M Y I N C I C I N D E L A 657
© 2009 The AuthorsJournal compilation © 2009 Blackwell Publishing Ltd
Discussion
The desire to build a species-level taxonomy that incorporatesall available data types (‘integrative taxonomy’) impliesthat morphological or molecular character sets individuallyare insufficient while their combination will provide amore secure estimate of species limits (Dayrat 2005; Willet al. 2005; Rubinoff et al. 2006; Valdecasas et al. 2008).Our study using multiple markers for the clarification ofspecies limits in the Cicindela hybrida group demonstratesthe difficulties arising from this proposition. Groupingsproduced by cox1 and ITS1 contradicted each other to
various degrees while their congruence or disagreementwith morphology were also complex.
Incongruence among unlinked molecular markers, orbetween Linnean species names and molecular markers,create difficulties for species delimitation and taxonomicassignments. In most comparisons of data types, predefinedmorphological groups or Linnean species names are testedagainst molecular characters either by constructing genetrees or against a priori designated groups or populationsof sequenced individuals (Wiens & Penkrot 2002; Cardoso& Vogler 2005; Monaghan et al. 2005; López et al. 2007).Discrepancies between these groups can be due to true
Fig. 4 Geographical representation of the24 sampling sites of the Cicindela hybridacomplex analysed in the present study. Codesare according to Table 1. The arrow indicatesa sampling site external to the geographicalarea represented. Lines of distinct thicknessindicate (a) mtDNA or (b) ITS1 nestinggroups most relevant for the associationtests. Shaded areas represent the aggregationgroups considered for mtDNA.
658A
. CA
RD
OS
O, A
. SE
RR
AN
O and
A. P
. VO
GL
ER
© 2009 T
he Authors
Journal compilation ©
2009 Blackw
ell Publishing Ltd
Table 4 Population aggregation analysis for the Cicindela hybrida complex. Each population (see Table 1 for population codes) was scored for the presence of haplotypes (PAA1) or for thecharacter states at variable sites (PAA2) in ITS1 and cox1. Diagnostic haplotypes and nucleotide positions are shown in bold. Nucleotide positions that distinguish Cicindela iberica + Cicindelalagunensis from the remaining species are marked with asterisks. Polymorphic sites involving nucleotides and gaps are underlined
ITS1 cox1
PAA2 PAA1 PAA2 PAA1
1111111122 111111122222222222333333344444445555555555555566661112233455562477778926 1568923345680113345599912667790012258012335556678890333562575901923561404563525 5431902519294391765817887062892510960762142584830573037
** * * ** * ** *** * * *
C. hybridaHB1 WWTTTA---WT-TATCA-T-TA-- 1,2 TTTCTCARTTTCTGGATAACTTCCTTTAAARCGTTTTTTARRCYATGARAATATA 1,2HB2 TAT-TAAAAWT-WATCA-T-TWTT 2–4 TTTCTTAATTTTTGGATAACTTCCTTTAAAGTGTTTTTTAGACTATGAGAATATA 3HB3 ?TT-AAA--TT-TTTCGATTTT-- 5 TTTCTCAATTTCTGGATAACTTCCTTTAAAGCGTTTTTTAGGCCATGAGAATATA 2HA4 ?TT-AAA--TT-TTTCGATTTT-- 5 TTTTTTAATTTTTAGATAACTTCCTTTAGAACGTTTTCTAAACTATGCGAGAATA 4HA5 ?TT-AWA--TT-TTTCGATTTT-- 5,6 TTTTTTAATTYTTAGATAACTTCCTTTAGAACGTTTTCTAAACTATGCGAGAATA 4,5HA6 ?TT-AWA--TT-TTTCGATTTT-- 5,6 TTTTTTAATTTTTAGATAACTTCCTTTAGAACGTTTTCTAAACTATGCGAGAATA 4HA7 ?TT-AWA--TT-TTTCGATTTT-- 5,6 TTTTTTAATTTTTAGATAACTTCCTTTAGAACGTTTTCTAAACTATGCGAGAATA 4HA8 ?TT-AWA--TW-TTTCGWWTTT-- 5-7 TTTTTTAATYTTTAGATAACTTCCTTTAGAACGTTTTCTAAACTATGCGAGAATA 4,6HA9 ?TT-AAAA-TT-TTTCGATTTT-- 5,8 TTTTTTAATTTTTAGATAACTTCCTTTAGAACGTTTCCTAAACTATGCGAGAATA 7HB10 TAT-TA---TTTTTTCA-TTTT-- 9–11 TTTCTTAATTTCTGGATAACTTCCTTTAGAATGTTTTTTAAACTATGAGAATATA 8HA11 ?TT-AAA--TT-TTTCGATTTT-- 5 TTTTTTAATTTTTAGATAACTTCCTTTAGAACGTTTTCTAAACTATGCGAGAATA 4HB12 TWT-WAAA-TTTTTTCATTTTT-- 9,12 TTTCTTAATTTCTGGATAACTTCCTTTAGAATGTTTTTTAAACTATGAGAATATA 8HA13 ?TT-AAA--TT-TTTCGATTTT-- 5 TTTTTTAATTTTTAGATGACCTCCTTTAGAACGTTTTCTAAACTATGCGAGAATA 17consensus WWTTWWAAAWWTWWTCRWWTTWTT 1–12 TTTYTYARTYYYTRGATRACYTCCTTTARARYGTTTYYTARRCYATGMRARWATA 1–8,17
C. ibericaIDi14 TAT-TA---TT-TATTA-T-TT-- 15 TCCTCTAACTTTTAATCAGTTCCTCTYAARACRCCCTTCATATCTTGCGAAAATA 18,19consensus TAT-TA---TT-TATTA-T-TT-- 15 TCCTCTAACTTTTAATCAGTTCCTCTYAARACRCCCTTCATATCTTGCGAAAATA 18,19
C. lagunensisADii15 TAT-TA---TT-TATTA-T-TT-- 15 TCCTCTAACTTTTAATCAGTTTCTCTCAAGACGCCCTTCATATCTTGCGGAAACA 21consensus TAT-TA---TT-TATTA-T-TT-- 15 TCCTCTAACTTTTAATCAGTTTCTCTCAAGACGCCCTTCATATCTTGCGGAAACA 21
C. lusitanicaUAi16 TAT-TA---TT-TATTA-T-CT-- 13 TTTCTTGATTTTCAGATAACTTTCTCTAGAGCGTTTTTTGAACTATACGAAAATA 9UAi17 TAT-TA---WT-TATYA-T-TT-- 14,15 TTTCTTGATTTTCAGATAACTTTCTCTAGAGCGTTTTTTGAACTATACGAAAATA 9UAi18 TAW-TA---WT-TATYA-T-TT-- 14–18,20 TTTCTTGATTTTTAGATAAMTTTCTCTAGAGCGTTTTTTGAACTATGCGAAAATA 10,11UAi19 TAT-TA---WT-TATYA-T-TT-- 14,15 TTTCTTGATTTTCAGATAACGTTCTCTMRAGCGTTTTTTGAACTATGCGAAAATA 12–14UAi20 TAT-TA---WT-TATYA-T-TT-- 14–16,18,20 TTTCTTGATTTTYAGATAACKTTCTCTAGAGCGTTTTTTGAACTATGCGAAAATR 10,15UAi21 TAT-TA---WT-TATYA-T-TT-- 14,15 TTTCTTGATTTTCARATAACGTTCTCTAGAGCGTTTTTTGAACTATGCGAAAATA 13,16consensus TAW-TA---WT-TATYA-T-YT-- 13–17,18,20 TTTCTTGATTTTYARATAAMKTTCTCTMRAGCGTTTTTTGAACTATRCGAAAATR 9–16
C. transversalisTB22 TAT-TA---TTTTTTCA-TTTT-- 9 TTTCTTAATTTCTGGATAACTTCCTTTAGAATGTTTTTTAAACTATGAGAATATA 8TA23 TAT-TA---AT-TATCA-T-TW-- 2,18 CTTCTTGATTTTTAGATAACTTTCTCTAAAACGTTTTTTAAACTACGCGAAAATA 20TA24 TAT-TA---WT-TATCA-T-TW-- 2,19 YTTCTTRATTTTTAGATAACTTYCTCTARAACGTTTTTTAAACTAYGCGAAARTA 20,22consensus TAT-TA---WTTTWTCA-TTTW-- 2,9,18,19 YTTCTTRATTTYTRGATAACTTYCTYTARAAYGTTTTTTAAACTAYGMGAAWRTA 8,20,22
I N T E GR AT I V E TA X O N O M Y I N C I C I N D E L A 659
© 2009 The AuthorsJournal compilation © 2009 Blackwell Publishing Ltd
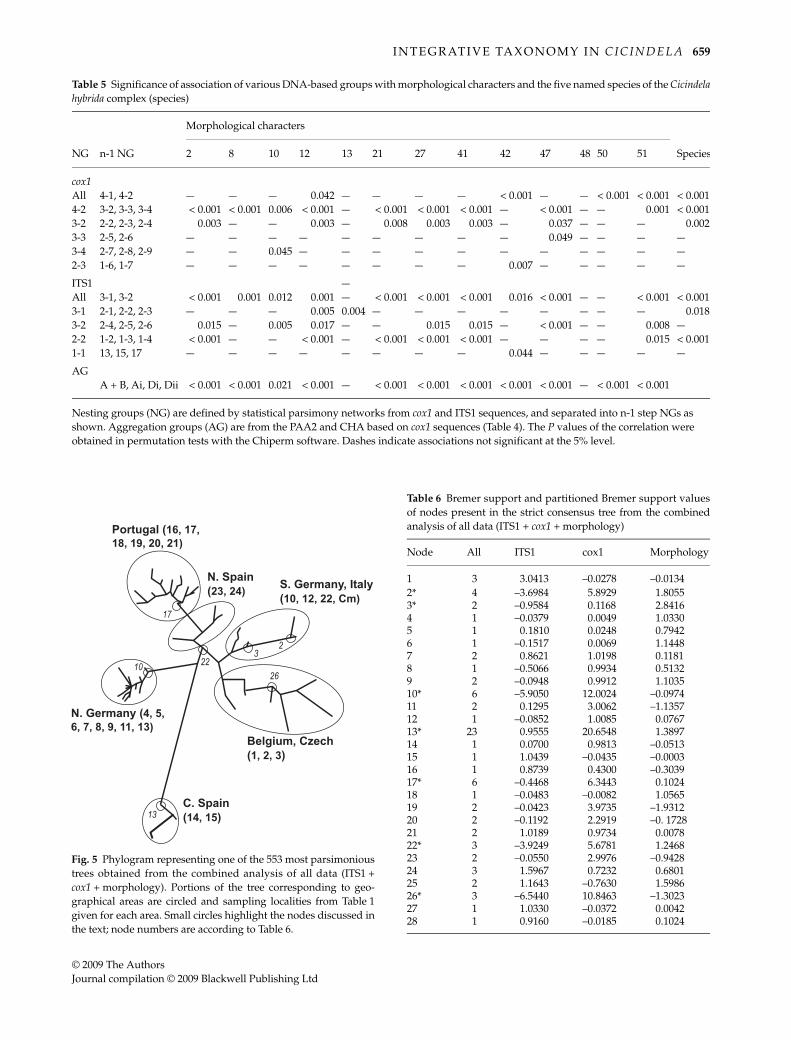
Table 5 Significance of association of various DNA-based groups with morphological characters and the five named species of the Cicindelahybrida complex (species)
NG n-1 NG
Morphological characters
Species2 8 10 12 13 21 27 41 42 47 48 50 51
cox1All 4-1, 4-2 — — — 0.042 — — — — < 0.001 — — < 0.001 < 0.001 < 0.0014-2 3-2, 3-3, 3-4 < 0.001 < 0.001 0.006 < 0.001 — < 0.001 < 0.001 < 0.001 — < 0.001 — — 0.001 < 0.0013-2 2-2, 2-3, 2-4 0.003 — — 0.003 — 0.008 0.003 0.003 — 0.037 — — — 0.0023-3 2-5, 2-6 — — — — — — — — — 0.049 — — — —3-4 2-7, 2-8, 2-9 — — 0.045 — — — — — — — — — — —2-3 1-6, 1-7 — — — — — — — — 0.007 — — — — —
ITS1 —All 3-1, 3-2 < 0.001 0.001 0.012 0.001 — < 0.001 < 0.001 < 0.001 0.016 < 0.001 — — < 0.001 < 0.0013-1 2-1, 2-2, 2-3 — — — 0.005 0.004 — — — — — — — — 0.0183-2 2-4, 2-5, 2-6 0.015 — 0.005 0.017 — — 0.015 0.015 — < 0.001 — — 0.008 —2-2 1-2, 1-3, 1-4 < 0.001 — — < 0.001 — < 0.001 < 0.001 < 0.001 — — — — 0.015 < 0.0011-1 13, 15, 17 — — — — — — — — 0.044 — — — — —
AGA + B, Ai, Di, Dii < 0.001 < 0.001 0.021 < 0.001 — < 0.001 < 0.001 < 0.001 < 0.001 < 0.001 — < 0.001 < 0.001
Nesting groups (NG) are defined by statistical parsimony networks from cox1 and ITS1 sequences, and separated into n-1 step NGs as shown. Aggregation groups (AG) are from the PAA2 and CHA based on cox1 sequences (Table 4). The P values of the correlation were obtained in permutation tests with the Chiperm software. Dashes indicate associations not significant at the 5% level.
Fig. 5 Phylogram representing one of the 553 most parsimonioustrees obtained from the combined analysis of all data (ITS1 +cox1 + morphology). Portions of the tree corresponding to geo-graphical areas are circled and sampling localities from Table 1given for each area. Small circles highlight the nodes discussed inthe text; node numbers are according to Table 6.
Table 6 Bremer support and partitioned Bremer support valuesof nodes present in the strict consensus tree from the combinedanalysis of all data (ITS1 + cox1 + morphology)
Node All ITS1 cox1 Morphology
1 3 3.0413 –0.0278 –0.01342* 4 –3.6984 5.8929 1.80553* 2 –0.9584 0.1168 2.84164 1 –0.0379 0.0049 1.03305 1 0. 1810 0.0248 0.79426 1 –0.1517 0.0069 1.14487 2 0.8621 1.0198 0.11818 1 –0.5066 0.9934 0.51329 2 –0.0948 0.9912 1.103510* 6 –5.9050 12.0024 –0.097411 2 0.1295 3.0062 –1.135712 1 –0.0852 1.0085 0.076713* 23 0.9555 20.6548 1.389714 1 0.0700 0.9813 –0.051315 1 1.0439 –0.0435 –0.000316 1 0.8739 0.4300 –0.303917* 6 –0.4468 6.3443 0.102418 1 –0.0483 –0.0082 1.056519 2 –0.0423 3.9735 –1.931220 2 –0.1192 2.2919 –0. 172821 2 1.0189 0.9734 0.007822* 3 –3.9249 5.6781 1.246823 2 –0.0550 2.9976 –0.942824 3 1.5967 0.7232 0.680125 2 1.1643 –0.7630 1.598626* 3 –6.5440 10.8463 –1.302327 1 1.0330 –0.0372 0.004228 1 0.9160 –0.0185 0.1024
660 A . C A R D O S O , A . S E R R A N O and A . P. V O G L E R
© 2009 The AuthorsJournal compilation © 2009 Blackwell Publishing Ltd
incongruent histories of markers, but may equally becaused by inadequate analysis or data incompatibility(Brower et al. 1996). Where taxonomic names are used intests of incongruence, the assignment of names mayhave been made in the face of conflicting informationfrom diverse morphological characters that required(possibly intuitive) weighting of the evidence by thetaxonomist.
Here we conducted these tests of congruence betweenmorphological and molecular data at the level of thecharacters themselves, not the secondary interpretation ofcharacter variation implied in the Linnean names. There-evaluation of previously used characters showed that asurprising proportion of them were invariable despitethe inclusion of a large, taxonomically diverse sample ofspecimens. For the variable characters, many were notfixed for the Linnean taxa (Table 2). Only five charactersproduced diagnostic differences in the sense of the phylo-genetic species concept (Cracraft 1983), separating C.lusitanica, C. iberica and C. lagunensis. However, these wereconfined to the generally labile characters of body colour-ation and elytral maculation which are usually understrong selection (Pearson & Vogler 2001) and therefore maybe less reliable for reconstruction of population history.None of the characters was diagnostic for C. hybrida andC. transversalis, whether considering them as two species oras a single one.
This does not exclude that other methods would detectthese species, for example, from covariation betweencharacters which, collected from every specimen, mightshow uniqueness of each Linnean species in multivariateanalyses. However, in the absence of these approaches, themolecular data equally struggle to support the establishedLinnean taxa: only C. lusitanica, C. iberica and C. lagunensiswere diagnosed with the mtDNA marker but based on justone or two diagnostic nucleotide changes each. The entitiesfrom PAA of the ITS1 marker did not show a single ofthe named Linnean taxa to be diagnosable, possibly dueto the overall lower variation in this gene which preventedthe recognition of separated groups, or due to the largereffective population size in the nuclear genome comparedto mtDNA. Hence, using the criterion of diagnosabilitythe corroboration of groups was poor, even after re-scoringof the morphological character variation.
The association of each character with the hierarchicalnested clade analysis removes the need for a priori desig-nations of taxa and permits the correlation of morphologicalvariation with groups defined by genetic analysis withoutthe strict requirement of diagnosability. We observed thatall except one of the 13 variable morphological charactersshowed significant association with multiple mtDNA andITS1 nested groups (two characters with one of the twomarkers only; Table 5). These associations were restrictedto certain hierarchical levels of the networks and they
showed subdivision broadly on the same geographicalscale as the subdivision of named species including thebroad east–west split that corresponds roughly to the C.hybrida/C. transversalis vs. the three Iberian groups. Corre-lations were significant mostly on the 4-step level formtDNA separating the networks 3-2, 3-3 and 3-4 thatare each limited to major geographical regions along aneast–west distribution (Fig. 4a), and the 4-step (highest)nesting level for ITS1, also separating the western andeastern populations (networks 3-1 and 3-2; Fig. 4b). Signif-icant associations at lower levels were only found for asubset of morphological characters and in some portionsof the geographical range, but none below the 2-stepnesting level (Table 5). The morphological charactersshowed highest correlation with the PAA mitochondrialgroups, that is, groupings defined by geographical distri-bution of molecular variation. These findings demonstratethat there is strong overall congruence of morphologicaland molecular data, despite their limited congruence inPAA and the fact that neither character set is fully consistentwith the Linnean names.
Conclusions for the taxonomy of the C. hybrida group
Our findings mirror the difficulties encountered bytaxonomists when analysing the C. hybrida group. Theselection and coding of morphological characters areaffected by the low variability and the overlapping variationamong the taxonomically defined entities. By avoiding therigid adherence to the limits of currently accepted species,our approach detected overall congruence of the variationamong the diverse character sets, that is, the hierarchicallevels at which morphological and molecular data exhibitcongruence. (Note, however, that the lack of characterassociations on the lower-step levels could be merelybecause the number of individuals in the test of associationis too low for statistical significance to be achieved.) Theselevels presumably correspond to the point at which commonphylogenetic history is responsible for the distribution ofthe variation, affecting unlinked character sets in a similarway. Therefore, for the C. hybrida group, the three- and4-step networks (Table 5) may capture the hierarchicallevel at which genealogical lineages are largely divergent,while at lower levels the variation is mostly reticulate.Only these higher hierarchical levels exhibit geographicalstructure, which corresponds largely to the same spatialscale as the subdivision of the named species (if not in thedetails of the ranges). In addition, these levels weresignificantly correlated with the species names (Table 5,last column). This indicates that these nesting groupsindeed capture a degree of separation that traditionally hasbeen perceived to correspond to species-level divergences,even if they are not strictly diagnostic.
I N T E GR AT I V E TA X O N O M Y I N C I C I N D E L A 661
© 2009 The AuthorsJournal compilation © 2009 Blackwell Publishing Ltd
Evolution of incongruence in the C. hybrida group
The present data also allow for some speculation on theevolutionary processes that might have shaped the complexpatterns present in the C. hybrida group. The observednesting design showed greatest geographical structure inthe southern populations compared to the formerly glaciatedareas of Central and Eastern Europe, which suggests rangemovements were less prevalent there. This is consistentwith previous studies that recognised the presence of threeevolutionary entities (whatever their exact status) in theIberian Peninsula. Yet, gene flow is likely to have affectedthese areas as well, and may explain what is probably thegreatest unresolved question arising from the currentstudy, the discordance between mtDNA and ITS1 in theIberian species. If gene flow is responsible, this might haveselectively affected the mtDNA markers which frequentlyare subject to introgression (Funk & Omland 2003). It is lesslikely that the mtDNA-ITS1 incongruence is due to thenon-Mendelian evolution of the ITS1 marker which issubject to molecular drive and homogenisation of genotypes.These phenomena are more prone to result in divergentevolution of rDNA tandem repeats (including the ITS1region) because concerted evolution affecting this locustends to exacerbate genetic drift. Here the opposite situationapplies, as ITS1 is largely uniform throughout centraland coastal Iberia (and generally ITS1 does not diagnosethe anticipated groups elsewhere) while mtDNA deeplyseparates these populations. The morphological variationappears to back the mtDNA because of five diagnosticcharacters defining the three Iberian species, but as theseare coloration traits, their variation is likely the result ofselection for background matching (crypsis) due to localdifferences in the respective inland and coastal habitats.
However, if the central Iberian discrepancy is due tomtDNA introgression, it is unclear what should be thesource of these genotypes. Unlike other cases of ITS/mtDNAincongruence in Iberian beetles (Gómez-Zurita & Vogler2003) which could be explained by different geographicalranges in both types of markers, the Iberian mtDNA haplo-types do not occur anywhere else in the range sampled and,due to their isolated geographical distribution, anygene exchange would have been over long distances withpopulations that were not included here or may be extinct.
Implications for integrative taxonomy
As originally conceived, integrative taxonomy relies onmorphological character variation initially, but is ‘ submittedto the filter of other approaches and additional data(molecular, behavioural, developmental, ecological, etc.)’(Dayrat 2005). Integrative taxonomy gives primacy tomorphological characters because of their greater complexityand presumed multigenic make-up which is thought to
constitute a more secure basis for separating species thansmall fragments of DNA sequence (Will et al. 2005). Otherproposals require character ‘discrimination’ (i.e. a measureof the quality of the character evidence) before theintegration of all information (Valdecasas et al. 2008).However, these propositions are not sufficiently specificon how to implement this approach. Here we presented adistinct way of data ‘integration’ by mapping of the mor-phological character variation directly onto the hierarchyimplied in the nucleotide changes.
A ‘total evidence’ (Kluge 1989) approach might be analternative way of ‘integrating’ information from differentcharacter sets. When applied to the C. hybrida data, thecombined analysis retrieved the geographically adjacentpopulations as being closely related, i.e. it brought out anunderlying signal of broad isolation by distance despite thediscrepancies in the phylogenetic relationships supportedby the different data sets. Although a similar conclusionwas also supported by the association analysis (in particularthe strong association of morphological characters withthe geographically defined PAA groups; see above), totalevidence analysis may not be valid here. When combiningall data, a common signal may emerge even from weaklycontradictory signal contained in the individual datapartitions, that is, the species tree emerges because datainsufficiencies in the subsets are overcome (Gatesy et al.1999). This presumes that all data have the same phylogenetichistory and the reconstruction of the tree improves whendata sets are added. This positive effect on tree supportfrom combining data may be jeopardised when workingnear the species boundary because delayed lineage sortingand gene flow may cause true differences in the historyof various genetic loci. Total evidence analysis underextensive reticulation therefore will resolve the conflictamong character sets only in some general phenetic sense,but will not improve the grouping structure suggested byany of the individual character systems. In fact, when wecombined all data, clades were not uniformly supported bythe various character sets and in some cases were stronglycontradicted by at least one of them (Table 6).
The analysis proposed here seems more adequate toobtain an ‘integrative’ taxonomy, because it takes intoaccount the history of each marker independently. It mightbe surprising that the correlation with morphologicalcharacter variation holds for both the ITS1 and mtDNAmarkers, despite the fact that the extent of networks in bothmarkers contradicts each other in important aspects. Thismay indicate that the signal detected by the associationanalysis reflects a general structuring of morphology andmolecular markers, rather than the specific correlation ofa character state with a particular n-step network. Ratherthan defining particular groups (species), this method ismore likely to pick up a general signal in the data structure,perhaps comparable to genealogical species delimitations
662 A . C A R D O S O , A . S E R R A N O and A . P. V O G L E R
© 2009 The AuthorsJournal compilation © 2009 Blackwell Publishing Ltd
from the coalescence point of multiple markers (Baum &Shaw 1995). Thus, in cases where the stringent divergenceimplied by Linnean names and the phylogenetic speciesconcept is not fulfilled, the association analysis may stillreveal largely congruent, hierarchical structuring of thevariation.
Under this perspective, the morphological charactersmainly serve to define the extent of the taxonomic groupswhich may then be named. Groups defined in this way canbe subjected to further tests of coherence, including breedingstudies, although reproductive isolation is not necessarilyassumed here, as we only investigate the existing patternswithout recourse to the underlying mechanisms of separa-tion or micro-evolutionary processes. Our character-basedapproach to taxonomy follows the view that ‘taxa belongto the characters’, rather than that the characters are aproperty of taxa (Nelson 1989; Vrana & Wheeler 1992). Thisconcept of a taxon calls for the use of the character variationitself as the basis for taxonomy, instead of the groupingsgenerated by taxonomists who are interpreting this variation(or groupings defined by inferences about the micro-evolutionary processes involved in speciation). The approachproposed here extends this idea by applying statistical testsfor the association of characters with hierarchical groups,using Templeton et al.’s (1987) established technique forassociating variation to hierarchical parsimony networks.Where this correlation of morphological character distribu-tion and DNA-based hierarchical groups exists, it can beascribed to the historical separation of groups. In the caseof the C. hybrida group, and possibly many other groupswhere species boundaries are not strongly discrete, thebroad association of morphological characters and variousgene markers serves to define the hierarchical level in thesequence variation at which to recognise separate species.Yet, the example of C. hybrida also demonstrates that therecent calls for an ‘integrative taxonomy’ (Dayrat 2005;Will et al. 2005; Valdecasas et al. 2008) underestimate thedifficulties of such proposition.
Acknowledgements
We are grateful to two anonymous referees and the AssociateEditor for useful comments. We thank J. Gómez-Zurita for helpwith several analyses and for valuable discussions and comments.Funding was provided by Fundação para a Ciência e a Tecnologia(PRAXIS XXI/BD/18409/98 to A.C.) and a grant by the NaturalEnvironment Research Council (NE/C510908/1) to study geneticdiversity in European beetles.
References
Abellán P, Gómez-Zurita J, Millán A et al. (2007) Conservationgenetics in hypersaline inland waters: mitochondrial diversityand phylogeography of an endangered Iberian beetle (Coleoptera:Hydraenidae). Conservation Genetics, 8, 79–88.
Ahrens D, Monaghan MT, Vogler AP (2007) DNA-based tax-onomy for associating adults and larvae in multi-speciesassemblages of chafers (Coleoptera: Scarabaeidae). MolecularPhylogenetics and Evolution, 44, 436–449.
Avise JC (1992) Molecular population structure and the biogeo-graphic history of a regional fauna: a case history with lessonsfor conservation biology. Oikos, 63, 62–76.
Baker RH, DeSalle R (1997) Multiple sources of molecularcharacteristics and the phylogeny of Hawaiian drosophilids.Systematic Biology, 46, 654–673.
Baum DA, Shaw KL (1995) Genealogical perspectives on thespecies problem. In: Experimental and Molecular Approaches toPlant Biosystematics. Monographs in Systematic Botany from theMissouri Botanical Garden, Vol. 53 (eds Hoch PC, Stephenson AG),pp. 289–303. Missouri Botanical Garden, St. Louis, Missouri.
Bremer K (1988) The limits of amino-acid sequence data inangiosperm phylogenetic reconstruction. Evolution, 42, 795–803.
Brower AVZ (1999) Delimitation of phylogenetic species withDNA sequences: a critique of Davis and Nixon’s populationaggregation analysis. Systematic Biology, 48, 199–213.
Brower AVZ, DeSalle R, Vogler A (1996) Gene trees, species trees,and systematics: a cladistic perspective. Annual Review ofEcology and Systematics, 27, 423–450.
Cardoso A, Vogler AP (2005) DNA taxonomy, phylogeny andPleistocene diversification of the Cicindela hybrida species group(Coleoptera: Cicindelidae). Molecular Ecology, 14, 3531–3546.
Carstens BC, Knowles LL (2007) Estimating species phylogenyfrom gene-tree probabilities despite incomplete lineage sorting:an example from Melanoplus grasshoppers. Systematic Biology,56, 400–411.
Clement M, Posada D, Crandall KA (2000) tcs: a computerprogram to estimate gene genealogies. Molecular Ecology, 9,1657–1659.
Cracraft J (1983) Species concept and speciation analysis. CurrentOrnithology, 1, 159–187.
Davis JI, Nixon KC (1992) Populations, genetic variation, and thedelimitation of phylogenetic species. Systematic Biology, 41, 421–435.
Dayrat B (2005) Towards integrative taxonomy. Biological Journal ofthe Linnean Society, 85, 407–415.
Farris JS, Källersjö M, Kluge AG, Bult C (1994) Testing significanceof incongruence. Cladistics, 10, 315–319.
Funk DJ, Omland KE (2003) Species-level paraphyly andpolyphyly: frequency, causes, and consequences, with insightsfrom animal mitochondrial DNA. Annual Review of Ecology andSystematics, 34, 397–423.
Gatesy J, O’Grady P, Baker RH (1999) Corroboration among datasets in simultaneous analysis: hidden support for phylogeneticrelationships among higher level Artiodactyl taxa. Cladistics, 15,271–313.
Gebert J (1995) Revision der Cicindela (s. str.) hybrida-Gruppe(sensu Mandl 1935/6) und Bemerkungen zu einigen äußerlichähnlichen paläarktischen Arten. Mitteilungen der MunchenerEntomologischen Gesellschaft, 86, 3–32.
Gebert J (1999) Erster Nachtrag und Berichtigung zur ‘Revisionder Cicindela (s. str.) hybrida-Gruppe (sensu Mandl 1935/36)’.Nachrichtenblatt der Bayerischen Entomologen, 48, 86–87.
Gómez-Zurita J, Vogler AP (2003) Incongruent nuclear andmitochondrial phylogeographic patterns in the Timarcha goettin-gensis species complex (Coleoptera, Chrysomelidae). Journal ofEvolutionary Biology, 16, 833–843.
I N T E GR AT I V E TA X O N O M Y I N C I C I N D E L A 663
© 2009 The AuthorsJournal compilation © 2009 Blackwell Publishing Ltd
Hart MW, Sunday J (2007) Things fall apart: biological species formunconnected parsimony networks. Biology Letters, 3, 509–512.
Hebert PDN, Gregory TR (2005) The promise of DNA barcodingfor taxonomy. Systematic Biology, 54, 852–859.
Hey J, Nielsen R (2004) Multilocus methods for estimatingpopulation sizes, migration rates and divergence time, withapplications to the divergence of Drosophila pseudoobscura and D.persimilis. Genetics, 167, 747–760.
Horn WH (1926) Pars 86: Carabidae: Cicindelidae. ColeopterumCatalogous. Junk and Schenkling, Berlin.
Hughes J, Longhorn SJ, Papadopoulou A et al. (2006) Densetaxonomic EST sampling and its applications for molecularsystematics of the Coleoptera (beetles). Molecular Biology andEvolution, 23, 268–278.
Kluge AG (1989) A concern for evidence and phylogenetichypothesis of relationships among Epicrates (Boidae, Serpentes).Systematic Zoology, 38, 7–25.
Knowles LL, Carstens BC (2007) Delimiting species withoutmonophyletic gene trees. Systematic Biology, 56, 887–895.
Kumar S, Tamura K, Nei M (2004) mega3: integrated softwarefor molecular evolutionary genetics analysis and sequencealignment. Briefings in Bioinformatics, 5, 150–163.
López H, Contreras-Díaz HG, Oromí P, Juan C (2007) Delimitingspecies boundaries for endangered Canary Island grasshoppersbased on DNA sequence data. Conservation Genetics, 8, 587–598.
Maddison WP, Knowles LL (2006) Inferring phylogeny despiteincomplete lineage sorting. Systematic Biology, 55, 21–30.
Mandl K (1935) Vorarbeiten für eine monographische Neubearbe-itung der paläarktischen Cicindelen. Revision der Cicindelahybrida-Gruppe (C. hybrida, coerulea, transbaicalica, altaica,maritima). Arbeiten Über Morphologische und TaxonomischeEntomologie Aus Berlin-Dahlem, 2, 283–306.
Mandl K (1936) Vorarbeiten für eine monographische Neubear-beitung der paläarktischen Cicindelen. Revision der Cicindelahybrida-Gruppe (C. hybrida, coerulea, transbaicalica, altaica,maritima). Arbeiten Über Morphologische und TaxonomischeEntomologie Aus Berlin-Dahlem, 3, 5–32.
Matalin AV (1998) The tiger-beetles of ‘hybrida’-species group(Coleoptera, Carabidae, Cicindelinae). III. A taxonomic reviewof the Iberian Cicindela lagunensis Gautier, 1872 complex. Graellsia,54, 75–96.
Matalin AV (1999) The tiger-beetles of the hybrida species-group. II.A taxonomic review of subspecies of Cicindela sahlbergii Fischervon Waldheim, 1824 (Coleoptera Carabidae Cicindelini). In:Advances in Carabidology (eds Zamotajlov A, Sciaky R), pp. 13–66. MUISO Publishers, Krasnodar, Russia.
Monaghan MT, Balke M, Gregory TR, Vogler AP (2005) DNA-based species delineation in tropical beetles using mitochondrialand nuclear markers. Philosophical Transactions of the RoyalSociety of London. Series B: Biological Sciences, 360, 1925–1933.
Nelson G (1989) Species and taxa: systematics and evolution. In:Speciation and its Consequences (eds Otte D, Endler JA), pp. 60–81.Sinauer & Associates, Sunderland, Massachusetts.
Pearson DL, Vogler AP (2001) Tiger Beetles: The Evolution, Ecologyand Diversity of the Cicindelids. Cornell University Press, Ithaca,New York.
Pons J, Barraclough TG, Theodorides K, Cardoso A, Vogler AP(2004) Using exon and intron sequences of the gene Mp20 toresolve basal relationships in Cicindela (Coleoptera: Cicindelidae).Systematic Biology, 53, 554–570.
Pons J, Barraclough TG, Gomez-Zurita J et al. (2006) Sequence-based
species delimitation for the DNA taxonomy of undescribedinsects. Systematic Biology, 55, 595–609.
Posada D, Crandall KA, Templeton AR (2000) GeoDis: a programfor the cladistic nested analysis of the geographical distributionof genetic haplotypes. Molecular Ecology, 9, 487–488.
Roff DA, Bentzen P (1989) The statistical analysis of mitochondrialDNA polymorphisms: chi-2 and the problem of small samples.Molecular Biology and Evolution, 6, 539–545.
Rozas J, Sanchez-De I, Barrio JC, Messeguer X, Rozas R (2003)DnaSP, DNA polymorphism analyses by the coalescent andother methods. Bioinformatics, 19, 2496–2497.
Rubinoff D, Cameron S, Will K (2006) Are plant DNA barcodes asearch for the Holy Grail? Trends in Ecology & Evolution, 21, 1–2.
Sites JW, Marshall JC (2004) Operational criteria for delimiting species.Annual Review of Ecology Evolution and Systematics, 35, 199–227.
Sorenson MD (1999) TreeRot version 2.0. Boston University,Boston, Massachusetts.
Swofford DL (2002) PAUP*: Phylogenetic Analysis using Parsimony,version 4.0b. Sinauer & Associates, Sunderland, Massachusetts.
Templeton AR, Boerwinkle E, Sing CF (1987) A cladistic analysisof phenotypic associations with haplotypes inferred fromrestriction endonuclease mapping. I. Basic theory and an analysisof alcohol dehydrogenase activity in Drosophila. Genetics, 117,343–351.
Templeton AR, Crandall KA, Sing CF (1992) A cladistic analysisof phenotypic associations with haplotypes inferred fromrestriction endonuclease mapping and DNA sequence data. III.Cladogram estimation. Genetics, 132, 619–633.
Thompson JD, Gibson TJ, Plewniak F, Jeanmougin F, Higgins DG(1997) The Clustal_X windows interface: flexible strategies formultiple sequence alignment aided by quality analysis tools.Nucleic Acids Research, 25, 4876–4882.
Valdecasas AG, Williams D, Wheeler QD (2008) ‘Integrativetaxonomy’ then and now: a response to Dayrat (2005). BiologicalJournal of the Linnean Society, 93, 211–216.
Vogler AP, DeSalle R (1994) Evolution and phylogenetic informa-tion content of the ITS-1 region in the tiger beetle Cicindeladorsalis. Molecular Biology and Evolution, 11, 393–405.
Vrana P, Wheeler WC (1992) Individual organisms as terminalentities: laying the species problem to rest. Cladistics, 8, 67–72.
White TJ, Bruns T, Lee S, Taylor J (1990) Amplification and directsequencing of fungal ribosomal RNA genes for phylogenetics.In: PCR Protocols: A Guide to Methods and Applications (eds InnisMA, Gelfand DH, Sninsky J, White TJ), pp. 315–322. AcademicPress, San Diego, California.
Wiens JJ (2001) Character analysis in morphological phylogenetics:problems and solutions. Systematic Biology, 50, 689–699.
Wiens JJ, Penkrot TA (2002) Delimiting species using DNA andmorphological variation and discordant species limits in spinylizards (Sceloporus). Systematic Biology, 51, 69–91.
Will KW, Mishler BD, Wheeler QD (2005) The perils of DNAbarcoding and the need for integrative taxonomy. SystematicBiology, 54, 844–851.
This work is part of A. Cardoso’s PhD thesis carried out at theNational History Museum of London and at the University ofLisbon. Our work focuses on questions related to the taxonomy,evolutionary history and ecological diversification of tiger beetlesand other insects.
664 A . C A R D O S O , A . S E R R A N O and A . P. V O G L E R
© 2009 The AuthorsJournal compilation © 2009 Blackwell Publishing Ltd
Supporting information
Additional supporting information may be found in the onlineversion of this article:
Table S1 Variable positions of ITS1 haplotypes in the Cicindelahybrida complex and Cicindela majalis (Cm)
Table S2 Population (a) and species (b) pairwise sequencedivergence comparisons for ITS1 (below diagonal) and cox1(above diagonal)
Please note: Wiley-Blackwell are not responsible for the contentor functionality of any supporting information supplied by theauthors. Any queries (other than missing material) should bedirected to the corresponding author for the article.