More about - FSCAmymoney
10
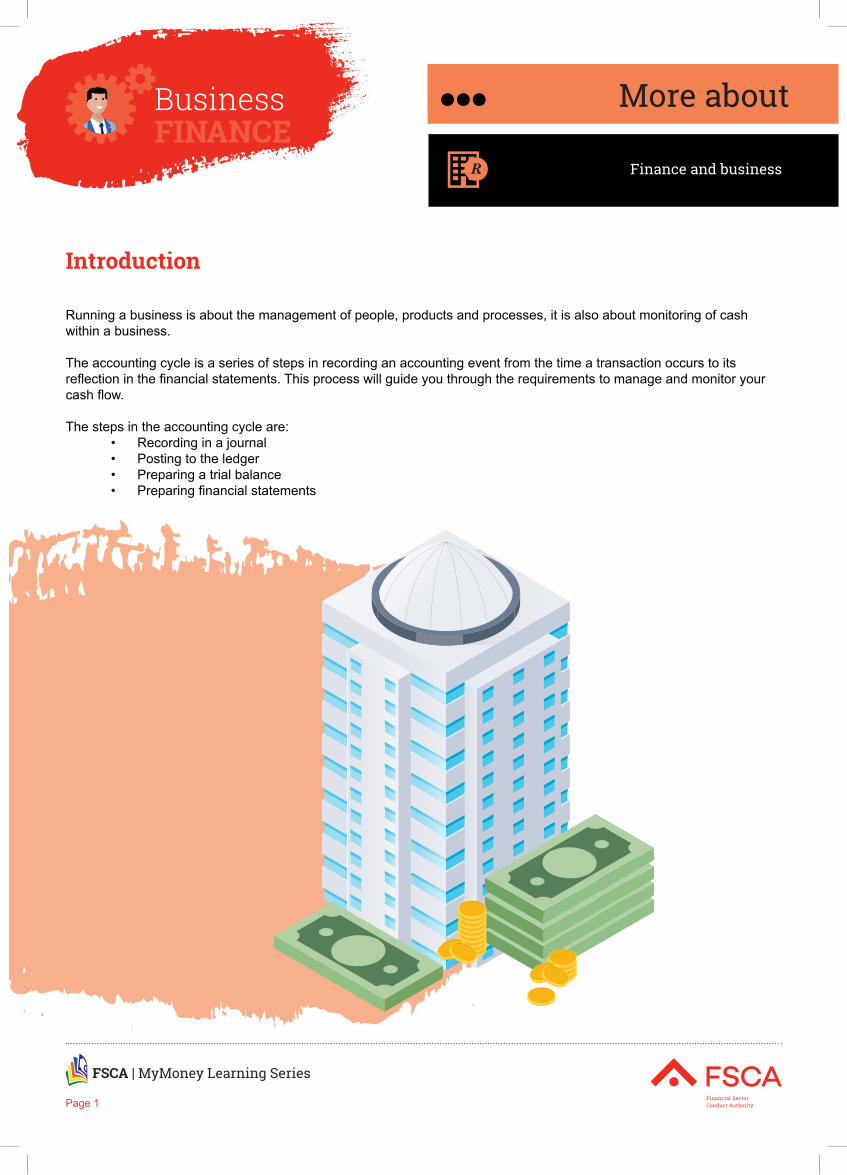
Finance and business More about Page 1 Introduction Running a business is about the management of people, products and processes, it is also about monitoring of cash within a business. The accounting cycle is a series of steps in recording an accounting event from the time a transaction occurs to its reflection in the financial statements. This process will guide you through the requirements to manage and monitor your cash flow. The steps in the accounting cycle are: • Recording in a journal • Posting to the ledger • Preparing a trial balance • Preparing financial statements
-
Upload
khangminh22 -
Category
Documents
-
view
1 -
download
0
Transcript of More about - FSCAmymoney
Finance and business
More about
Page 1
Introduction
Running a business is about the management of people, products and processes, it is also about monitoring of cash within a business.
The accounting cycle is a series of steps in recording an accounting event from the time a transaction occurs to its reflection in the financial statements. This process will guide you through the requirements to manage and monitor your cash flow.
The steps in the accounting cycle are:• Recording in a journal• Posting to the ledger• Preparing a trial balance• Preparing financial statements
Finance and business
More about
Page 2
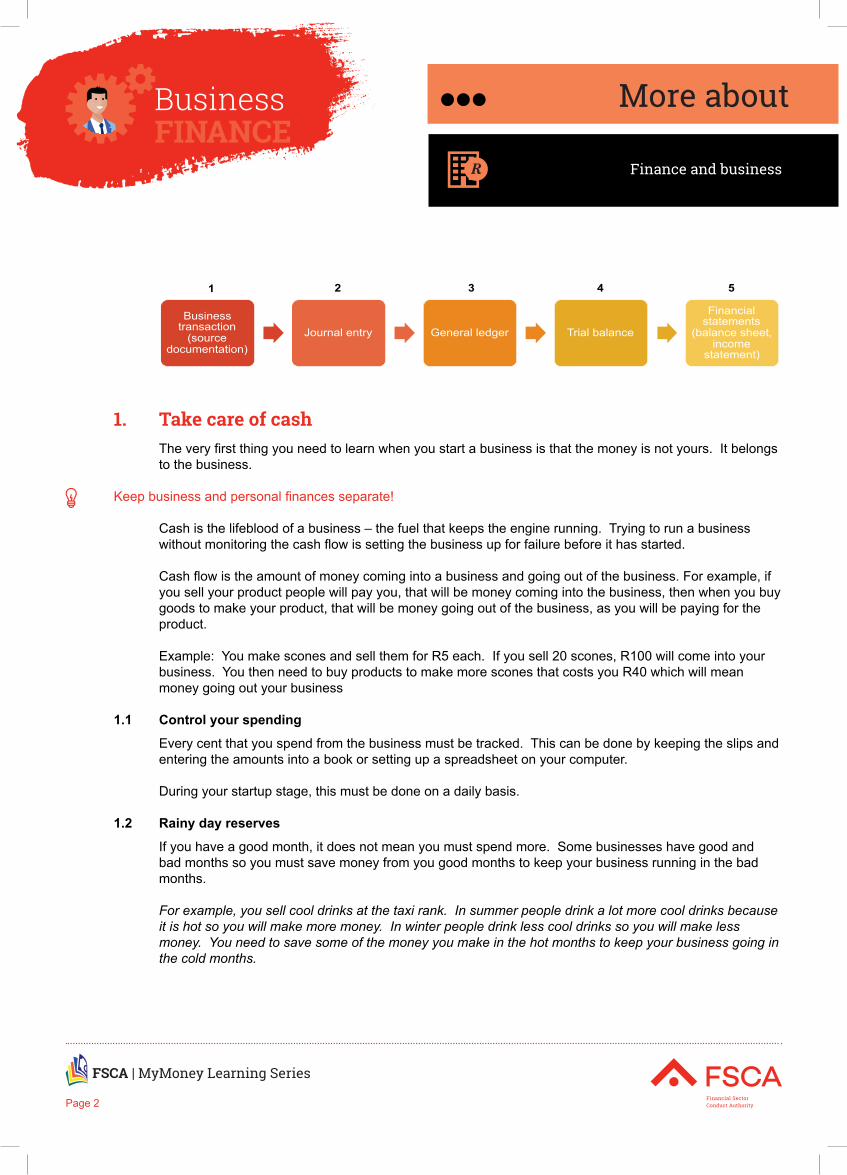
Business transaction
(source documentation)
Journal entry General ledger Trial balance
Financial statements
(balance sheet, income
statement)
1 2 3 4 5
1. Take care of cashThe very first thing you need to learn when you start a business is that the money is not yours. It belongs to the business.
Keep business and personal finances separate!
Cash is the lifeblood of a business – the fuel that keeps the engine running. Trying to run a business without monitoring the cash flow is setting the business up for failure before it has started.
Cash flow is the amount of money coming into a business and going out of the business. For example, if you sell your product people will pay you, that will be money coming into the business, then when you buy goods to make your product, that will be money going out of the business, as you will be paying for the product.
Example: You make scones and sell them for R5 each. If you sell 20 scones, R100 will come into your business. You then need to buy products to make more scones that costs you R40 which will mean money going out your business
1.1 Control your spending
Every cent that you spend from the business must be tracked. This can be done by keeping the slips and entering the amounts into a book or setting up a spreadsheet on your computer.
During your startup stage, this must be done on a daily basis.
1.2 Rainy day reserves
If you have a good month, it does not mean you must spend more. Some businesses have good and bad months so you must save money from you good months to keep your business running in the bad months.
For example, you sell cool drinks at the taxi rank. In summer people drink a lot more cool drinks because it is hot so you will make more money. In winter people drink less cool drinks so you will make less money. You need to save some of the money you make in the hot months to keep your business going in the cold months.
Finance and business
More about
Page 3
1.3 Get help
If you are not sure how to manage the finances in your business seek professional help.
1.4 Prioritise your spending
Being able to prioritise spend is crucial and knowing what’s necessary vs. “nice to have” can make the difference between success and going bust. Buying in bulk is always a good idea, but if you only have enough cash for a few products, it is better to buy only what you need.
1.5 Follow up on money owed to you
We fell into the trap of letting customers get away with paying us late in the very beginning. As a brand new business, we were so happy to have customers and so eager to please that we ended up allowing them to pay later. This is not a good thing to do – unless you are a bank.
1.6 Pricing
Make sure your goods and services are priced correctly. It is no good selling a lot of products if you are not making money.
1.7 Keep your cash safe
It seems like every week there’s another story about a small business owner who’s been scammed / ripped off by someone they trusted with their hard earned cash. Keep your cash safe and locked away. If your turnover increases the safest place to keep you cash is in a bank.
You must have controls in place in your business to protect what you have worked so hard to achieve!
1.8 Hire smart
We all want to protect and support our own. It could be your niece, nephew, neighbour, friend’s husband or wife, trusted colleague, etc. or someone who you have known for a good long time. They are someone you trust. But that does not mean you can skip the steps to make sure they are a good fit for your business. No matter who you are hiring, you need to conduct a background check to ensure there are no surprises. And you need to conduct an interview to confirm their values are the kind you want demonstrated in your business.
Remember you are not hiring them, the business is hiring them!
Finance and business
More about
Page 4
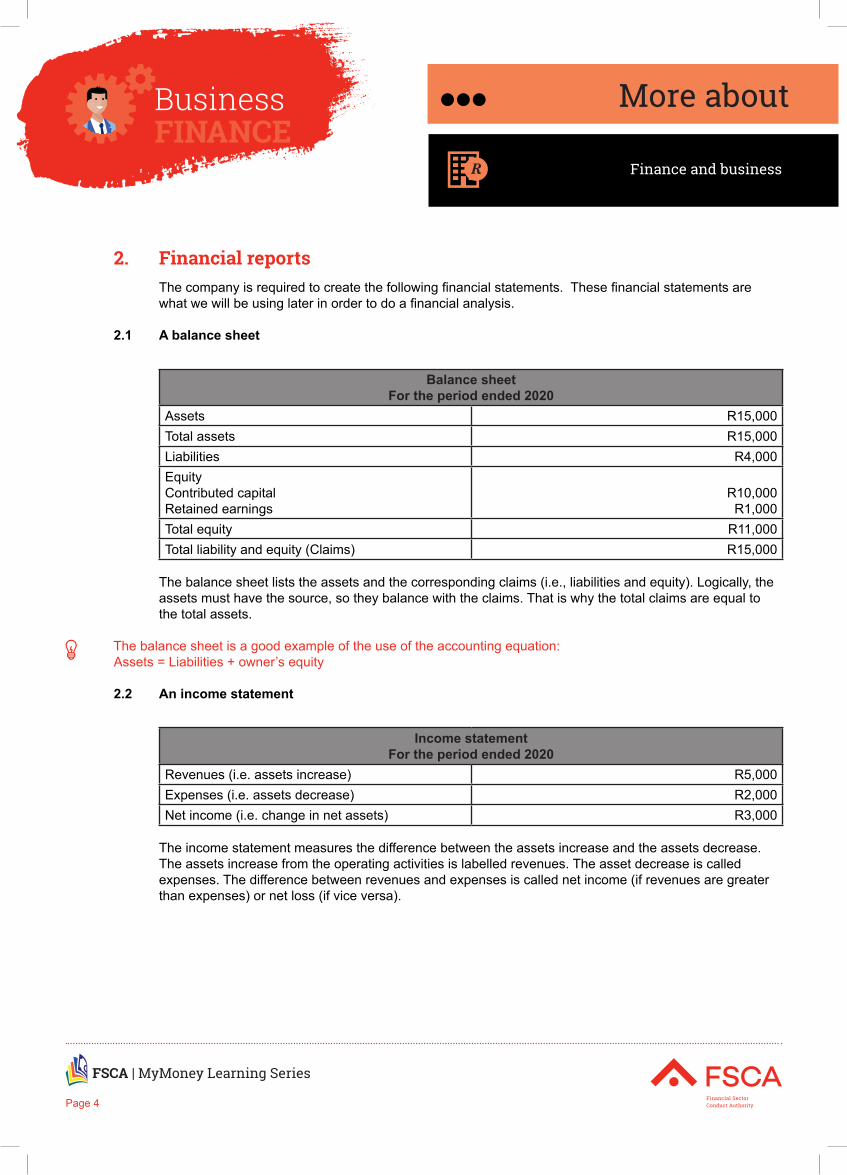
2. Financial reports The company is required to create the following financial statements. These financial statements are what we will be using later in order to do a financial analysis.
2.1 A balance sheet
Balance sheetFor the period ended 2020
Assets R15,000Total assets R15,000Liabilities R4,000EquityContributed capitalRetained earnings
R10,000R1,000
Total equity R11,000Total liability and equity (Claims) R15,000
The balance sheet lists the assets and the corresponding claims (i.e., liabilities and equity). Logically, the assets must have the source, so they balance with the claims. That is why the total claims are equal to the total assets.
The balance sheet is a good example of the use of the accounting equation:Assets = Liabilities + owner’s equity
2.2 An income statement
Income statementFor the period ended 2020
Revenues (i.e. assets increase) R5,000Expenses (i.e. assets decrease) R2,000Net income (i.e. change in net assets) R3,000
The income statement measures the difference between the assets increase and the assets decrease. The assets increase from the operating activities is labelled revenues. The asset decrease is called expenses. The difference between revenues and expenses is called net income (if revenues are greater than expenses) or net loss (if vice versa).
Finance and business
More about
Page 5
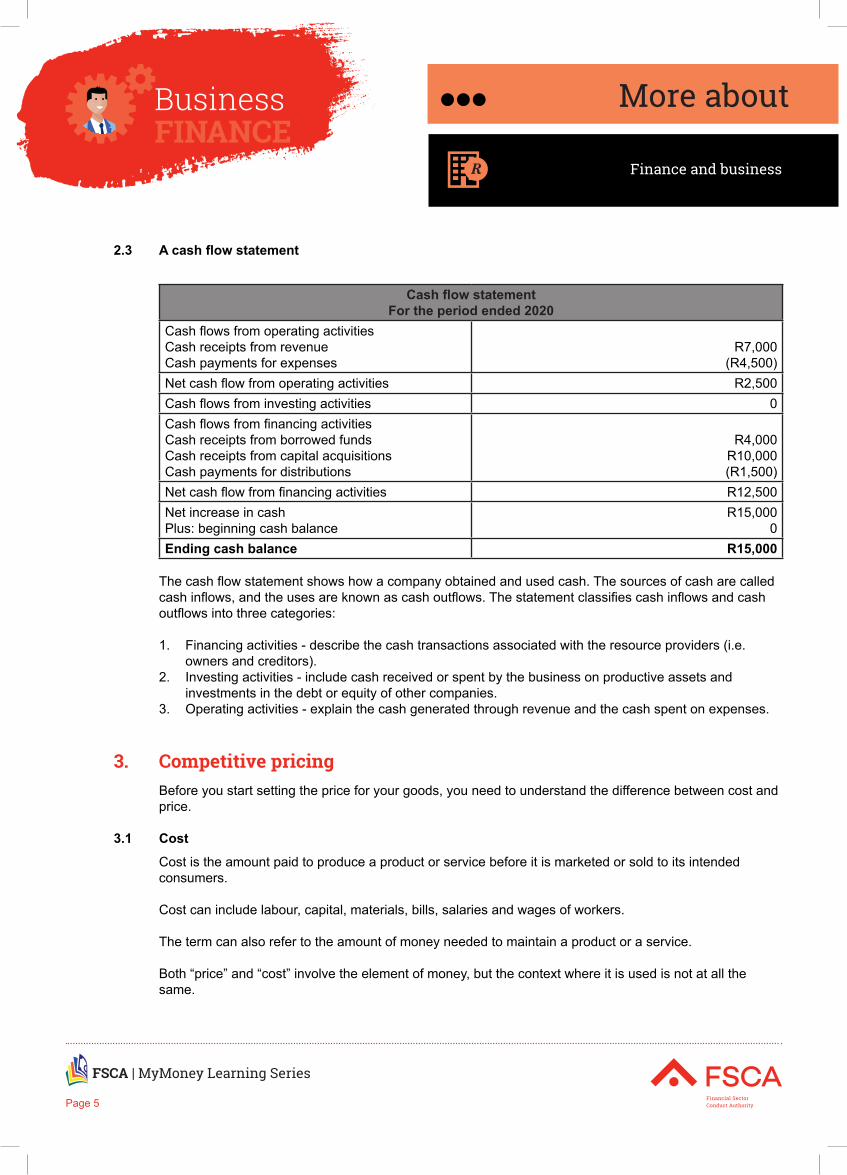
2.3 A cash flow statement
Cash flow statementFor the period ended 2020
Cash flows from operating activitiesCash receipts from revenueCash payments for expenses
R7,000(R4,500)
Net cash flow from operating activities R2,500Cash flows from investing activities 0Cash flows from financing activitiesCash receipts from borrowed fundsCash receipts from capital acquisitionsCash payments for distributions
R4,000R10,000(R1,500)
Net cash flow from financing activities R12,500Net increase in cashPlus: beginning cash balance
R15,0000
Ending cash balance R15,000
The cash flow statement shows how a company obtained and used cash. The sources of cash are called cash inflows, and the uses are known as cash outflows. The statement classifies cash inflows and cash outflows into three categories:
1. Financing activities - describe the cash transactions associated with the resource providers (i.e. owners and creditors).
2. Investing activities - include cash received or spent by the business on productive assets and investments in the debt or equity of other companies.
3. Operating activities - explain the cash generated through revenue and the cash spent on expenses.
3. Competitive pricingBefore you start setting the price for your goods, you need to understand the difference between cost and price.
3.1 Cost
Cost is the amount paid to produce a product or service before it is marketed or sold to its intended consumers.
Cost can include labour, capital, materials, bills, salaries and wages of workers.
The term can also refer to the amount of money needed to maintain a product or a service.
Both “price” and “cost” involve the element of money, but the context where it is used is not at all the same.
Finance and business
More about
Page 6
3.2 Price
“Price” refers to the money given to the seller for the product while “cost” involves the seller’s money to produce value.
3.3 Fixed and variable costs
When you start your own business, you will have a lot of bills you have to pay. These bills are called costs to your business
You get two types of costs• Variable costs• Fixed costs
3.3.1. Variable costsVariable costs are those costs that vary depending on a company’s production volume; they rise as production increases and fall as production decreases
Examples of variable costs are:• Telephone• Electricity• Casual labour• Raw material
3.3.2. Fixed costsFixed costs are costs that tend to remain the same regardless of production output.
Examples of fixed costs are:• Rent• Advertising• Insurance
3.4 Factors Affecting Price Setting
3.4.1. Internal Factors Remember the cost of your product or service is the amount it costs to make your product.
The internal factors that will influence the cost you have to charge are:• Business running costs• Your market position• Business objectives• Marketing strategy• Market share
3.4.2. External FactorsThe external factors that will influence the cost you have to charge are:• The demand for your product or service• Consumer expectations• Competition (same product, related products)• Government regulations
Finance and business
More about
Page 7
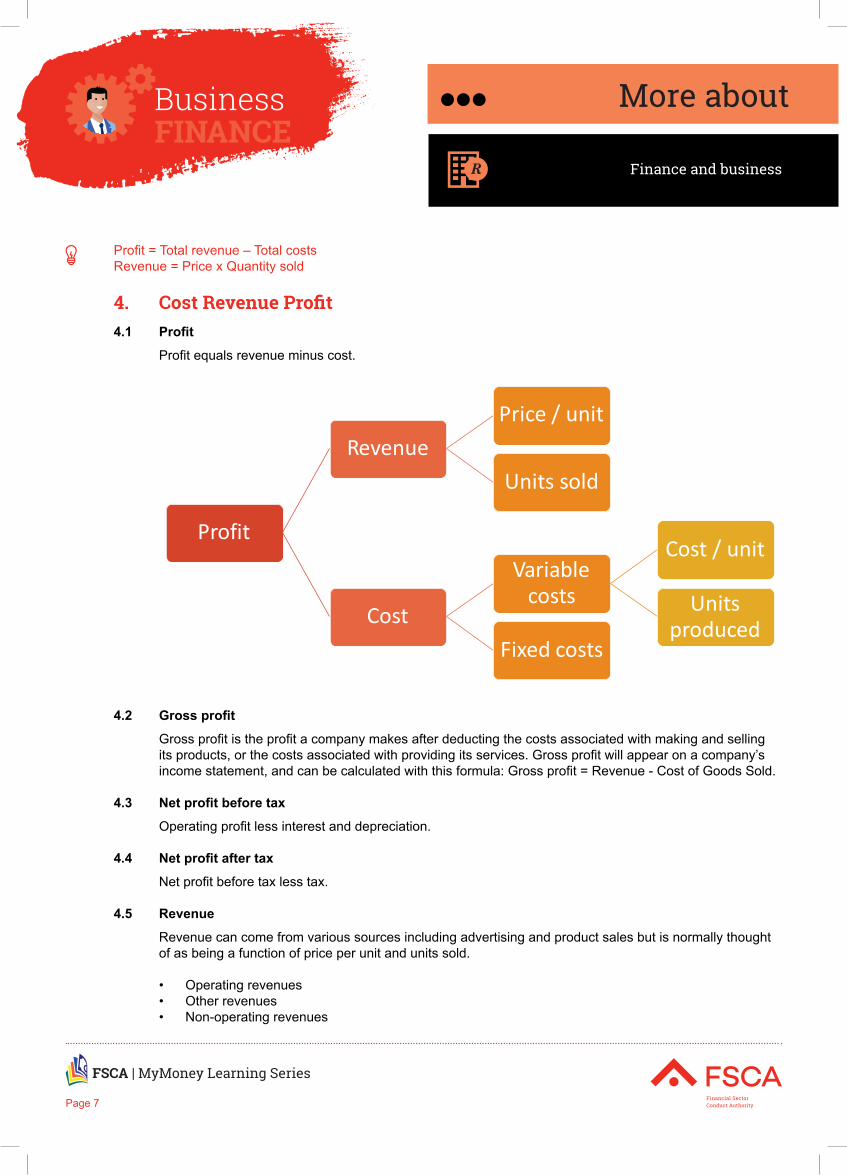
Profit = Total revenue – Total costsRevenue = Price x Quantity sold
4. Cost Revenue Profit4.1 Profit
Profit equals revenue minus cost.
Profit
RevenuePrice / unit
Units sold
Cost
Variable costs
Cost / unit
Units produced
Fixed costs
4.2 Gross profit
Gross profit is the profit a company makes after deducting the costs associated with making and selling its products, or the costs associated with providing its services. Gross profit will appear on a company’s income statement, and can be calculated with this formula: Gross profit = Revenue - Cost of Goods Sold.
4.3 Net profit before tax
Operating profit less interest and depreciation.
4.4 Net profit after tax
Net profit before tax less tax.
4.5 Revenue
Revenue can come from various sources including advertising and product sales but is normally thought of as being a function of price per unit and units sold.
• Operating revenues• Other revenues• Non-operating revenues
Finance and business
More about
Page 8
4.6 Cost
4.6.1. Operating costsGross profit less costs such as wages, rent, fuel, raw materials but before the deduction of interest payment and tax.
4.6.2. Expenses• Operating expenses• Capital expenditure• Financial expenses
4.6.3. Economic profitNet profit after tax minus the equity charged.
4.6.4. AmortisationThe amount you pay off on loans.
4.6.5. Equity charge added backThe “virtual” amount that you calculate to see if you are really doing as well as you should.
4.6.6. Assessing suppliersWhen deciding to use a supplier, you need to consider a number of factors:
• Price• Reliability• Relevance
Your suppliers must contribute to the profit and market share of your business.
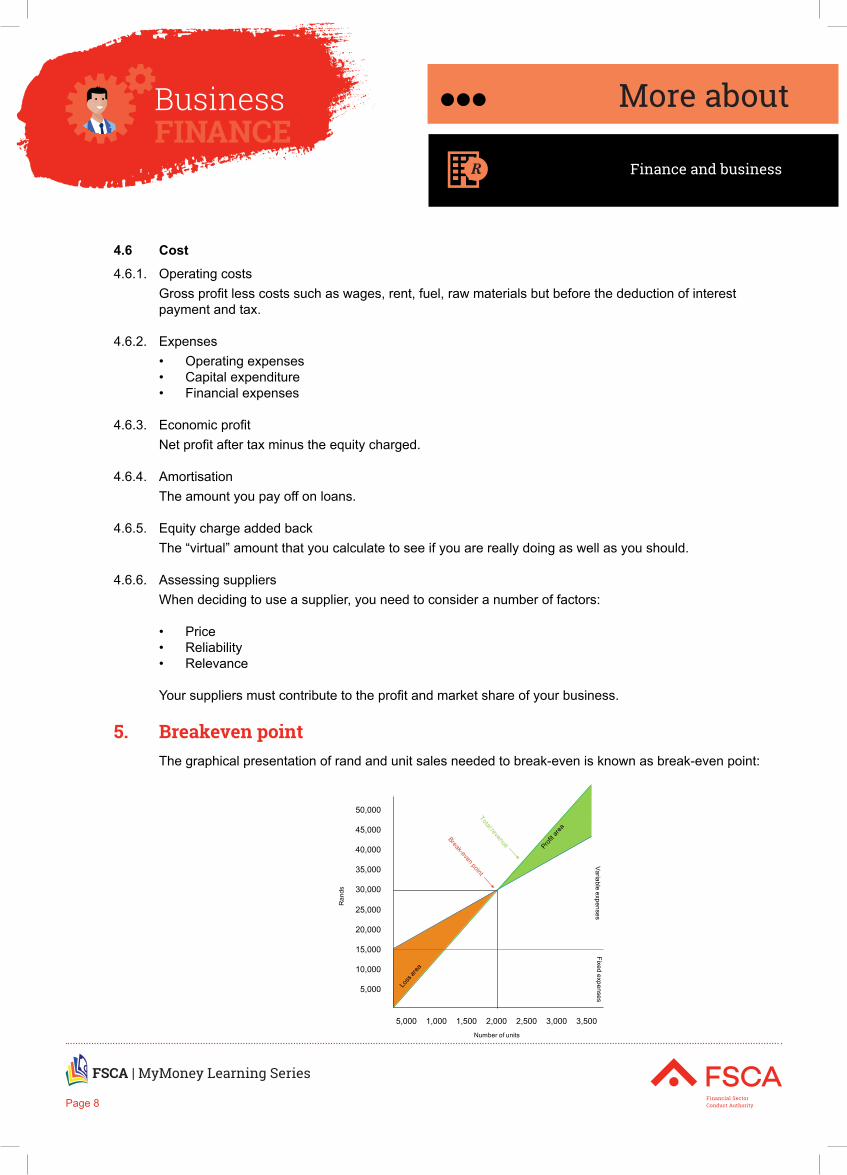
5. Breakeven pointThe graphical presentation of rand and unit sales needed to break-even is known as break-even point:
50,000
45,000
40,000
35,000
30,000
25,000
20,000
15,000
10,000
5,000
5,000 1,000 1,500 2,000 2,500 3,000 3,500
Loss
area
Profit
area
Variable expensesFixed expenses
Ran
ds
Number of units
Break-even pointTotal revenue

Finance and business
More about
Page 9
5.1 Understanding the graph
The number of units has been presented on the X-axis (horizontally) whereas rand has been presented on Y-axis (vertically).
The straight line in red colour represents the total annual fixed expenses of R15,000.
The blue line represents the total expenses. Notice that the line has a positive or upward slope that indicates the effect of increasing variable expenses with the increase in production.
The green line with positive or upward slope indicates that every unit sold increases the total sales revenue.
The total revenue line and the total expenses line cross each other. The point at which they cross each other is the break-even point. Notice that the total expenses line is above the total revenue line, before the point of intersection and below after the point of intersection. It tells us that the business suffers a loss before the point of intersection and makes a profit after this point. The break-even point in the above graph is 2,000 units or R30,000 and that agrees with the break-even point computed using the equation and contribution margin methods above.
The difference between the total expenses line and the total revenue line before the point of intersection (BE point) is the loss area. The loss area has been filled with orange colour. Notice that this area reduces as the number of units sold increases. It means every additional unit sold before the break-even point reduces the loss.
The difference between the total expenses line and the total revenue line after the point of intersection (BE point) is the profit area. The profit area has been filled with green colour. Notice that this area increases as the number of units sold increases. It means every additional unit sold after the break-even point increases the profit of the business.
5.2 Break-even point
How soon will your business be profitable? The Break-even analysis lets you determine what you need to sell, monthly or annually, to cover your costs of doing business--your break-even point. The Break-even Analysis calculates a break-even point based on fixed costs, variable costs per unit of sales, and revenue per unit of sales.
Conducting an accurate break-even analysis requires a careful examination and study of costs and prices in your business. You must know what your product or service costs in total to deliver to the final customer, as well as the price you can charge for the product or service. Include and deduct all miscellaneous expenses involved in operating your business.
To get started, analyse every product or service you produce and sell on a regular basis. Make a list of these products or services, starting from the largest volume seller. Next, calculate the average sales price of each unit, and then calculate the total cost of each unit.
Then, calculate the net profit that you earn on the sale of each unit, and calculate the cost of the investment to produce and sell each unit. Determine the percentage of return/profit that you earn from the sale of each unit.
Finance and business
More about
Page 10
It’s important to organise each of your products and services by priority, in terms of their contribution to profitability. The analysis should be done on each of your important products or services.
Get started by determining:• Your most profitable product/service.• The volume of sales of each product.• The total profit per unit of each product sold, after deducting every direct and indirect expense.• The total profit contribution to the company of each product.
Here’s a simple example:• The total costs of operating the business each month are R10,000.• Each product the company produces can be sold for R1,000.• Each product costs an average of R800 per unit to produce, sell and deliver.• The profit contribution per unit is, therefore, R200 each.• The amount R200 is divided into R10,000 to determine the break-even point.• Next, R10.000 divided by R200 equals 50 units. The company must, therefore, sell 50 units per
month to break even or approximately two units per business day.• Only after the company has sold 50 units in one month does it begin to earn a profit of R200 per unit.