SmartBin Using Netduino 3 WiFi & ClicksendSMS ... - Instructables
Upload
independentCategory
view
0download
0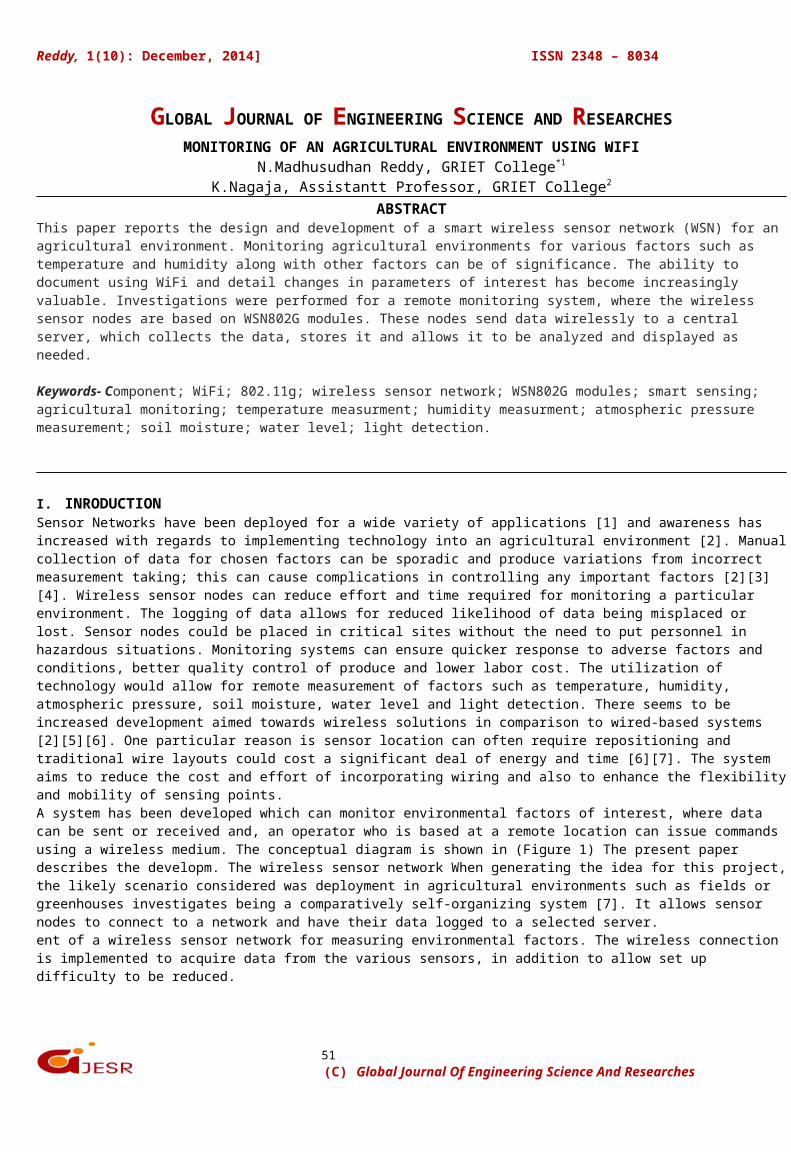
51
Reddy, 1(10): December, 2014] ISSN 2348 – 8034
GLOBAL JOURNAL OF ENGINEERING SCIENCE AND RESEARCHESMONITORING OF AN AGRICULTURAL ENVIRONMENT USING WIFI
N.Madhusudhan Reddy, GRIET College*1
K.Nagaja, Assistantt Professor, GRIET College2
ABSTRACTThis paper reports the design and development of a smart wireless sensor network (WSN) for an agricultural environment. Monitoring agricultural environments for various factors such as temperature and humidity along with other factors can be of significance. The ability to document using WiFi and detail changes in parameters of interest has become increasingly valuable. Investigations were performed for a remote monitoring system, where the wireless sensor nodes are based on WSN802G modules. These nodes send data wirelessly to a central server, which collects the data, stores it and allows it to be analyzed and displayed as needed.
Keywords- Component; WiFi; 802.11g; wireless sensor network; WSN802G modules; smart sensing; agricultural monitoring; temperature measurment; humidity measurment; atmospheric pressure measurement; soil moisture; water level; light detection.
I. INRODUCTIONSensor Networks have been deployed for a wide variety of applications [1] and awareness has increased with regards to implementing technology into an agricultural environment [2]. Manualcollection of data for chosen factors can be sporadic and produce variations from incorrect measurement taking; this can cause complications in controlling any important factors [2][3][4]. Wireless sensor nodes can reduce effort and time required for monitoring a particular environment. The logging of data allows for reduced likelihood of data being misplaced or lost. Sensor nodes could be placed in critical sites without the need to put personnel in hazardous situations. Monitoring systems can ensure quicker response to adverse factors and conditions, better quality control of produce and lower labor cost. The utilization of technology would allow for remote measurement of factors such as temperature, humidity, atmospheric pressure, soil moisture, water level and light detection. There seems to be increased development aimed towards wireless solutions in comparison to wired-based systems [2][5][6]. One particular reason is sensor location can often require repositioning and traditional wire layouts could cost a significant deal of energy and time [6][7]. The system aims to reduce the cost and effort of incorporating wiring and also to enhance the flexibilityand mobility of sensing points. A system has been developed which can monitor environmental factors of interest, where data can be sent or received and, an operator who is based at a remote location can issue commands using a wireless medium. The conceptual diagram is shown in (Figure 1) The present paper describes the developm. The wireless sensor network When generating the idea for this project,the likely scenario considered was deployment in agricultural environments such as fields or greenhouses investigates being a comparatively self-organizing system [7]. It allows sensor nodes to connect to a network and have their data logged to a selected server. ent of a wireless sensor network for measuring environmental factors. The wireless connection is implemented to acquire data from the various sensors, in addition to allow set up difficulty to be reduced.
(C) Global Journal Of Engineering Science And Researches

52
Reddy, 1(10): December, 2014] ISSN 2348 – 8034
Figure 1. Concept of Wireless Monitoring of Agricultural Environment.
(C) Global Journal Of Engineering Science And Researches
53
Reddy, 1(10): December, 2014] ISSN 2348 – 8034
II.SYSTEM CONFIGURATION The key considerations made during initial system development: Ability for battery operation.
Integration with various sensors for monitoring environmental factors of interest.
Simple setup.
Adjustable times for communications and reporting.
Portability.
Security.
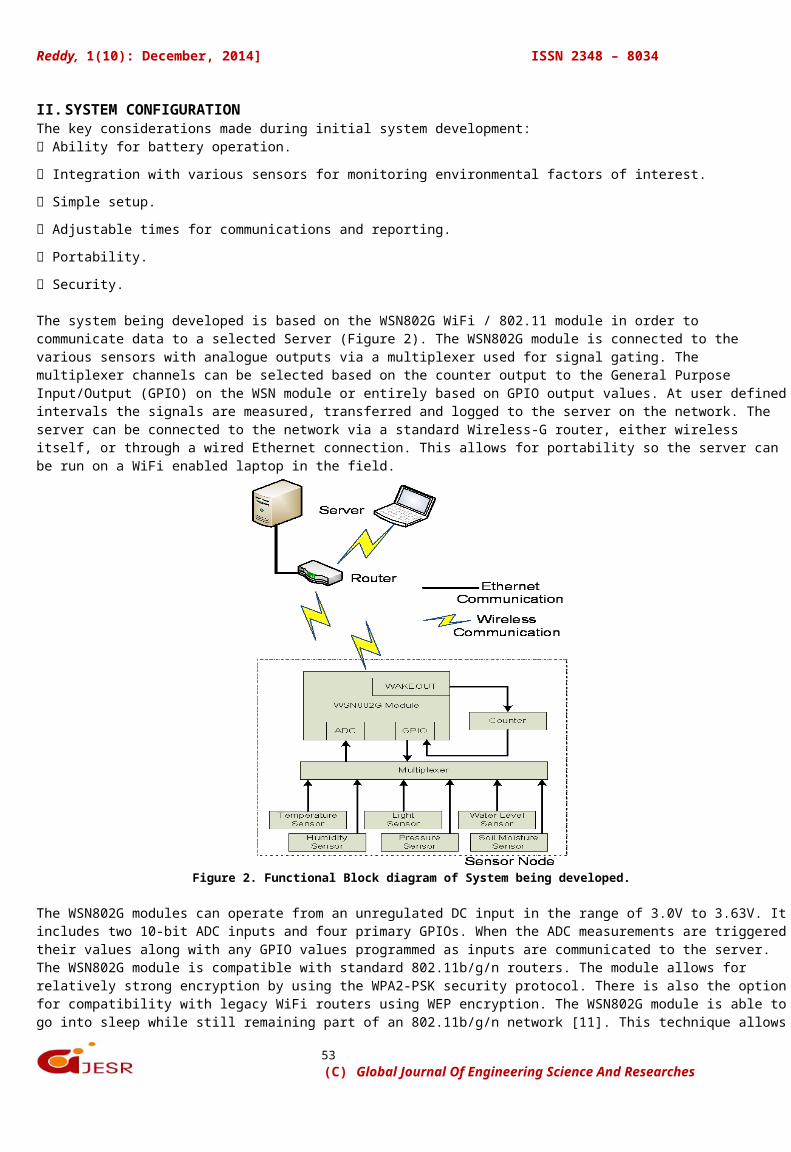
The system being developed is based on the WSN802G WiFi / 802.11 module in order to communicate data to a selected Server (Figure 2). The WSN802G module is connected to the various sensors with analogue outputs via a multiplexer used for signal gating. The multiplexer channels can be selected based on the counter output to the General Purpose Input/Output (GPIO) on the WSN module or entirely based on GPIO output values. At user definedintervals the signals are measured, transferred and logged to the server on the network. The server can be connected to the network via a standard Wireless-G router, either wireless itself, or through a wired Ethernet connection. This allows for portability so the server can be run on a WiFi enabled laptop in the field.
Figure 2. Functional Block diagram of System being developed.
The WSN802G modules can operate from an unregulated DC input in the range of 3.0V to 3.63V. Itincludes two 10-bit ADC inputs and four primary GPIOs. When the ADC measurements are triggeredtheir values along with any GPIO values programmed as inputs are communicated to the server. The WSN802G module is compatible with standard 802.11b/g/n routers. The module allows for relatively strong encryption by using the WPA2-PSK security protocol. There is also the optionfor compatibility with legacy WiFi routers using WEP encryption. The WSN802G module is able togo into sleep while still remaining part of an 802.11b/g/n network [11]. This technique allows
(C) Global Journal Of Engineering Science And Researches

54
Reddy, 1(10): December, 2014] ISSN 2348 – 8034
for energy saving suited for battery operation. The sensor nodes can be used with routers thatare serving other applications and it is possible to have applications running on a server or PC, communicating with one or more WSN802G sensor nodes.
III. FACTORS OF INTEREST AND SENSOR OUTPUT The system investigates some essential factors for measurement: Temperature
Humidity
Light
Atmospheric Pressure
Water Level
Soil Moisture
Depending on the agricultural product being grown temperature can affect growth, germination, sprouting, flowering and fruit development [8]. Measurements acquired by the system and loggedfor temperature within an enclosed Hydroponics greenhouse can be seen over an approximately 24hour period (Figure 3).
Figure 3. Logged Data for Temperature Sensor Output.
Humidity is of importance, as when levels are too low or high agricultural products can suffer. If humidity is kept below 50 percent for extended periods, growth can suffer as loss of water from leaves can be more rapid than replacement. Similarly, if humidity is above 80 percent for extended periods, risk of disease can increase [8].
Measurements acquired by the system and logged for humidity within an enclosed area can be seen over a 24 hour period (Figure 4).
Figure 4. Logged Data for Humidity Sensor output.
The presence of light and duration is of significance as it has an effect on growth processes
(C) Global Journal Of Engineering Science And Researches
55
Reddy, 1(10): December, 2014] ISSN 2348 – 8034
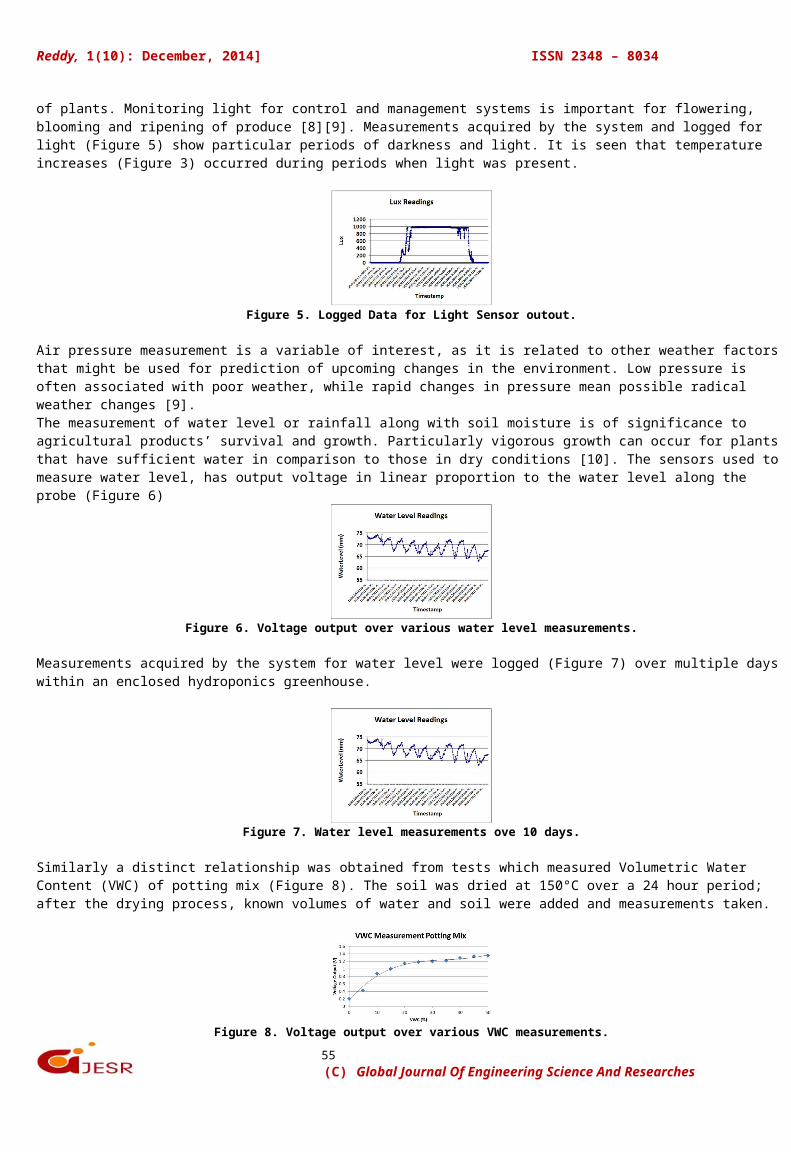
of plants. Monitoring light for control and management systems is important for flowering, blooming and ripening of produce [8][9]. Measurements acquired by the system and logged for light (Figure 5) show particular periods of darkness and light. It is seen that temperature increases (Figure 3) occurred during periods when light was present.
Figure 5. Logged Data for Light Sensor outout.
Air pressure measurement is a variable of interest, as it is related to other weather factors that might be used for prediction of upcoming changes in the environment. Low pressure is often associated with poor weather, while rapid changes in pressure mean possible radical weather changes [9]. The measurement of water level or rainfall along with soil moisture is of significance to agricultural products’ survival and growth. Particularly vigorous growth can occur for plants that have sufficient water in comparison to those in dry conditions [10]. The sensors used to measure water level, has output voltage in linear proportion to the water level along the probe (Figure 6)
Figure 6. Voltage output over various water level measurements.
Measurements acquired by the system for water level were logged (Figure 7) over multiple days within an enclosed hydroponics greenhouse.
Figure 7. Water level measurements ove 10 days.
Similarly a distinct relationship was obtained from tests which measured Volumetric Water Content (VWC) of potting mix (Figure 8). The soil was dried at 150°C over a 24 hour period; after the drying process, known volumes of water and soil were added and measurements taken.
Figure 8. Voltage output over various VWC measurements.
(C) Global Journal Of Engineering Science And Researches
56
Reddy, 1(10): December, 2014] ISSN 2348 – 8034
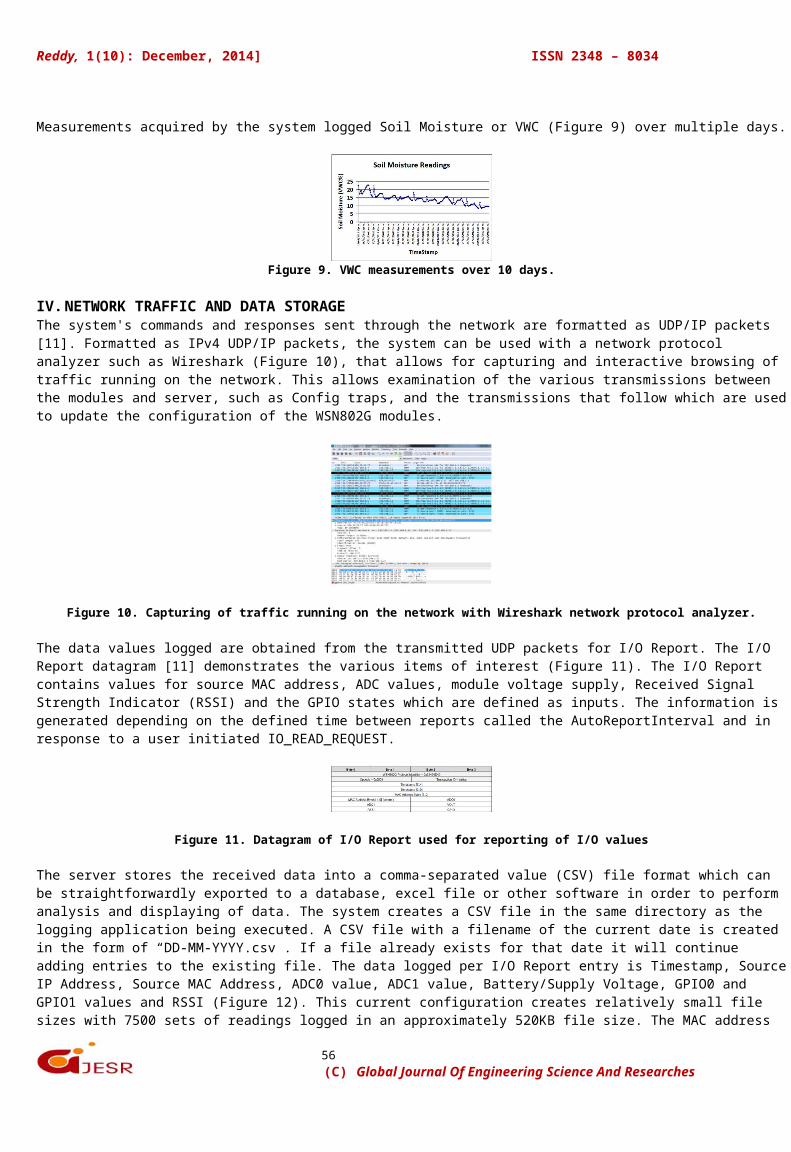
Measurements acquired by the system logged Soil Moisture or VWC (Figure 9) over multiple days.
Figure 9. VWC measurements over 10 days.
IV.NETWORK TRAFFIC AND DATA STORAGE The system's commands and responses sent through the network are formatted as UDP/IP packets [11]. Formatted as IPv4 UDP/IP packets, the system can be used with a network protocol analyzer such as Wireshark (Figure 10), that allows for capturing and interactive browsing of traffic running on the network. This allows examination of the various transmissions between the modules and server, such as Config traps, and the transmissions that follow which are usedto update the configuration of the WSN802G modules.
Figure 10. Capturing of traffic running on the network with Wireshark network protocol analyzer.
The data values logged are obtained from the transmitted UDP packets for I/O Report. The I/O Report datagram [11] demonstrates the various items of interest (Figure 11). The I/O Report contains values for source MAC address, ADC values, module voltage supply, Received Signal Strength Indicator (RSSI) and the GPIO states which are defined as inputs. The information is generated depending on the defined time between reports called the AutoReportInterval and in response to a user initiated IO_READ_REQUEST.
Figure 11. Datagram of I/O Report used for reporting of I/O values
The server stores the received data into a comma-separated value (CSV) file format which can be straightforwardly exported to a database, excel file or other software in order to perform analysis and displaying of data. The system creates a CSV file in the same directory as the logging application being executed. A CSV file with a filename of the current date is created in the form of “DD-MM-YYYY.csv”. If a file already exists for that date it will continue adding entries to the existing file. The data logged per I/O Report entry is Timestamp, SourceIP Address, Source MAC Address, ADC0 value, ADC1 value, Battery/Supply Voltage, GPIO0 and GPIO1 values and RSSI (Figure 12). This current configuration creates relatively small file sizes with 7500 sets of readings logged in an approximately 520KB file size. The MAC address
(C) Global Journal Of Engineering Science And Researches

57
Reddy, 1(10): December, 2014] ISSN 2348 – 8034
is logged along with the IP address, as data can be sent unsolicited and the uniqueness of theMAC address provides a way to identify the sender. This is particularly useful in the current situation as DHCP is used and the IP address is initially unknown for modules, or can change over time.
Figure 12. Logged data from CSV file displayed in Microsoft Excel where each node sends data at regular10 second intervals.
V. APPLICATION FOR GRAPHICALLY PLOTTING THE DATA
There are existing systems that could be used for plotting of data. However, it is seen that they were designed and aimed at mainly skilled and experienced operators. Therefore, new operators would often be required to undergo additional training in order to plot and save thedata results from the system. Therefore, a simple but effective plotting application was designed to tackle this problem. The designed application is straightforward and convenient so that inexperienced users should be able to effectively operate it to allow future referencing and analysis.
Figure 13. Plot of temperature using written Program
The application allows for graphing of historical data stored in the CSV log file (Figure 13).It has ten Tabs for the various factors of interest such as: Temperature, Humidity, Light, Pressure, Water Level, Soil Moisture, Battery, RSSI, as well as the ADC values of the 2 free inputs that may be used in the future. Upon selecting the file for graphing, the sought after time period can easily be chosen by setting the “Start Date/Time” and “End Date/Time” values in the dropdown boxes. When the “Draw” button is clicked the various line graphs are updated with the results for the selected time period. Clicking the “Save” button saves the ten existing graphs into separate .png image files. The saved images have resolutions of 300dpi and allow for future reference, analysis and can be selected for printing by the user.
VI.DATA EXPORTING TO ACCESS The CSV file also allows for straightforward exporting into Microsoft Access (Figure 14). Onceexported into Microsoft Access the data can be queried, have calculations performed and graphed. Using the MAC address and GPIO values, queries can be performed to distinguish between the different modules and sensors measurements.
(C) Global Journal Of Engineering Science And Researches

58
Reddy, 1(10): December, 2014] ISSN 2348 – 8034
Figure 14. Exporting Logged data from CSV file into Microsoft Access.
Depending on the data exported, queried and calculations performed in Microsoft Access, graphscan be created and averaged over various periods based upon TIMESTAMP (Figure 15).
Figure 15. Options in Microsoft Access for graphing of logged data based on TIMESTAMP.
VII. CONCLUSIONS AND FURTHER INVESTIGATION The current system performs well for transferring and logging of values from the various sensor nodes. It allows for relatively easy connection to nodes and communication. Further work is required on protective casing of nodes under extreme weather conditions. Battery and powering from renewable sources requires investigation. The system allows for additional or interchangeable sensors to be connected as the need occurs. Further investigation is planned for integrating the measurement of nitrates in water sources near agricultural environments [12]. This is of special interest due to health concerns connected with nitrates, such as Methemoglobinemiaas. There is also opportunity to merge the logging and graphing applications,so that there would be minimal user intervention. The system allows for relatively easy use and can be operated with standard commercial products that are commonly implemented allowing users to utilize equipment already in use.
REFERENCES [1] I. F. Akyildiz, W. Su, Y. Sankarasubramaniam, and E. Cayirci, “A Survey on Sensor Networks,” IEEE Communications Magazine, Vol. 40, No.9, pp. 102-114, August 2002.
[2] I. A. Aziz, M. H. Hasan, M. J. Ismail, M. Mehat, and N. S. Haron, “Remote monitoring in agricultural greenhouse using wireless sensor and short message service (SMS),” International Journal of Engineering & Technology IJET Vol: 9 No: 9
[3] A. D, S. Roy, and S. Bandyopadhyay, “Agro-sense: precision agriculture using sensor-based wireless mesh networks,” First ITU-T Kaleidoscope Academic Conference.
[4] J. S. Lin, and C. Liu, "A monitoring system based on wireless sensor network and an SoC platform in precision agriculture," 11th IEEE International Conference on Communication Technology Proceedings, 2008
[5] G. W. Irwin, J Colandairaj, and W. G. Scanlon, “An overview of wireless networks in control and monitoring,” International Conference on Intelligent Computing, Kunming , CHINE (2006), Vol. 4114, 2006, pp. 1061-1072.
[6] R.F.M. Inc., “Wireless temperature sensor, application note AN80201, 2009,” http://www.RFM.com/.
(C) Global Journal Of Engineering Science And Researches

59
Reddy, 1(10): December, 2014] ISSN 2348 – 8034
[7] T. Chi, M. Chen, and Q. Gao, “Implementation and study of a greenhouse environment surveillance system based on wirelesssensor network,” The 2008 International Conference on Embedded Software and Systems Symposia (ICESS2008)
[8] O. Books, All about Greenhouses, LASTOrtho, Meredith Books, 2001, pp. 60-70
[9] M. Hawfke, S. C. Mukhopadhyay, and H. Ewald, "A zigbee based smart sensing platform for monitoring environmental parameters," IEEE Instrumentation and Measurement Technology Conference (I2MTC), 2011
[10] F J Veihmeyer, and A H Hendrickson, "Soil Moisture in Relation to Plant Growth," Annual Review of Plant Physiology, Vol. 1, 1950, pp. 285-304,
[11] R.F.M. Inc., “WSN802G series 802.11g wireless sensor network modules integration guide, 2010,” http://www.RFM.com/.
[12] M. A. M. Yunus, G. R. Mendez, and S. C. Mukhopadhyay, “Development of a Low Cost System for Nitrate and ContaminationDetections in Natural Water Supply based on a Planar Electromagnetic Sensor,” Proceedings of IEEE I2MTC 2011 conference,IEEE Catalog number CFP11MT-CDR, ISBN 978-1-4244-7934-4, May 10-12, 2011, Hangzhou China, pp. 1557-1562.
(C) Global Journal Of Engineering Science And Researches
Copyright © 2022 FDOKUMEN