
Monitoring High-Risk Sex Offenders With GPS Technology
114
The author(s) shown below used Federal funds provided by the U.S. Department of Justice and prepared the following final report: Document Title: Monitoring High-Risk Sex Offenders With GPS Technology: An Evaluation of the California Supervision Program, Final Report Author: Stephen V. Gies, Randy Gainey, Marcia I. Cohen, Eoin Healy, Dan Duplantier, Martha Yeide, Alan Bekelman, Amanda Bobnis, Michael Hopps Document No.: 238481 Date Received: April 2012 Award Number: 2007-IJ-CX-0048 This report has not been published by the U.S. Department of Justice. To provide better customer service, NCJRS has made this Federally- funded grant final report available electronically in addition to traditional paper copies. Opinions or points of view expressed are those of the author(s) and do not necessarily reflect the official position or policies of the U.S. Department of Justice.
-
Upload
khangminh22 -
Category
Documents
-
view
0 -
download
0
Transcript of Monitoring High-Risk Sex Offenders With GPS Technology

The author(s) shown below used Federal funds provided by the U.S. Department of Justice and prepared the following final report: Document Title: Monitoring High-Risk Sex Offenders With GPS
Technology: An Evaluation of the California Supervision Program, Final Report
Author: Stephen V. Gies, Randy Gainey, Marcia I. Cohen,
Eoin Healy, Dan Duplantier, Martha Yeide, Alan Bekelman, Amanda Bobnis, Michael Hopps
Document No.: 238481
Date Received: April 2012 Award Number: 2007-IJ-CX-0048 This report has not been published by the U.S. Department of Justice. To provide better customer service, NCJRS has made this Federally-funded grant final report available electronically in addition to traditional paper copies.
Opinions or points of view expressed are those of the author(s) and do not necessarily reflect
the official position or policies of the U.S. Department of Justice.
Monitoring High-Risk Sex Offenders With GPS Technology: An Evaluation of the California Supervision Program
ii
MONITORING HIGH-RISK SEX OFFENDERS
WITH GPS TECHNOLOGY: AN EVALUATION OF
THE CALIFORNIA SUPERVISION PROGRAM
FINAL REPORT
March 31, 2012
Prepared for
Office of Research and Evaluation
National Institute of Justice
810 Seventh Street NW
Washington, DC 20531
Prepared by
Stephen V. Gies
Randy Gainey
Marcia I. Cohen
Eoin Healy
Dan Duplantier
Martha Yeide
Alan Bekelman
Amanda Bobnis
Michael Hopps
Development Services Group, Inc.
7315 Wisconsin Avenue, Suite 800E
Bethesda, MD 20814
www.dsgonline.com
This project was supported by Grant No. 2007–IJ–CX–0048 awarded by
the National Institute of Justice, Office of Justice Programs, U.S.
Department of Justice. Points of view in this document are those of the
authors and do not necessarily represent the official position or policies
of the U.S. Department of Justice.

This document is a research report submitted to the U.S. Department of Justice. This report has not been published by the Department. Opinions or points of view expressed are those of the author(s)
and do not necessarily reflect the official position or policies of the U.S. Department of Justice.
Monitoring High-Risk Sex Offenders With GPS Technology: An Evaluation of the California Supervision Program
iii
Monitoring High-Risk Sex Offenders
With GPS Technology: An Evaluation of
the California Supervision Program
Final Report
2012
Authors:
Stephen V. Gies
Randy Gainey
Marcia I. Cohen
Eoin Healy
Dan Duplantier
Martha Yeide
Alan Bekelman
Amanda Bobnis
Michael Hopps
Development Services Group, Inc.
7315 Wisconsin Avenue, Suite 800E
Bethesda, MD 20814
http://www.dsgonline.com/
This project was supported by Grant No. 2007–IJ–CX–0048 awarded by the National Institute of
Justice, Office of Justice Programs, U.S. Department of Justice. Points of view in this document are
those of the authors and do not necessarily represent the official position or policies of the U.S.
Department of Justice.
This document is a research report submitted to the U.S. Department of Justice. This report has not been published by the Department. Opinions or points of view expressed are those of the author(s)
and do not necessarily reflect the official position or policies of the U.S. Department of Justice.

This document is a research report submitted to the U.S. Department of Justice. This report has not been published by the Department. Opinions or points of view expressed are those of the author(s)
and do not necessarily reflect the official position or policies of the U.S. Department of Justice.

Monitoring High-Risk Sex Offenders With GPS Technology: An Evaluation of the California Supervision Program
v
Authors’ Contact Information
Stephen V. Gies
Development Services Group, Inc. (DSG)
7315 Wisconsin Avenue, Suite 800E
P: 301.951.6600; f: 301.951.3324
Randy Gainey
Old Dominion University
5115 Hampton Boulevard
Norfolk, VA 23529
P: 757.683.4794; f: 757.683.5634
Marcia I. Cohen
DSG
P: 301.951.0056
Eoin Healy
DSG
P: 301.951.5373
Dan Duplantier
DSG
P: 301.951.6602
Martha Yeide
DSG
P: 301.951.6619
Alan Bekelman
DSG
P: 301.951.0056
Amanda Bobnis
DSG
P: 301.951.5382
Michael Hopps
DSG
P: 301.951.5375
This document is a research report submitted to the U.S. Department of Justice. This report has not been published by the Department. Opinions or points of view expressed are those of the author(s)
and do not necessarily reflect the official position or policies of the U.S. Department of Justice.

This document is a research report submitted to the U.S. Department of Justice. This report has not been published by the Department. Opinions or points of view expressed are those of the author(s)
and do not necessarily reflect the official position or policies of the U.S. Department of Justice.

Monitoring High-Risk Sex Offenders With GPS Technology: An Evaluation of the California Supervision Program
vii
Abstract
Despite the increasing number of high-risk sex offenders (HRSOs) who are being placed on electronic
monitoring programs, little is known about how effective these programs are in increasing offender
compliance and in reducing recidivism. The purpose of this evaluation is to determine the
effectiveness of the global positioning system (GPS) monitoring of HRSOs who are released onto
parole.
This study integrates outcome, cost, and process evaluation components. The outcome component
assesses the impact of the California Department of Corrections and Rehabilitation’s GPS
supervision program by employing a nonequivalent-group quasi-experimental design with a multilevel
survival model. We also use a propensity score matching procedure to account for the differences
between the treatment and comparison groups. The study population is drawn from all HRSOs who
were released from prison between January 2006 and March 2009 and residing in the state of
California. The final sample includes 516 subjects equally divided between the treatment and control
groups. The treatment group consists of HRSOs who were placed on GPS monitoring. The control
group is made up of similar offenders who were not placed on the GPS system during the study
period. The resulting sample shows no significant differences between the groups on any of the
propensity score matching variables.
The effectiveness of the program is assessed using an intent-to-treat (known as ITT) approach. The
two main outcomes of interest are compliance and recidivism. Compliance is measured through
violations of parole. Recidivism is assessed in a variety of ways, including 1) rearrest, 2) reconviction,
and 3) return to prison custody. Each outcome is assessed with a survival analysis of time-to-event
recidivism data, using a Cox proportional hazards model. In addition, we use frailty modeling to
account for the clustering of parole agents within parole districts.
The findings indicate, despite the baseline similarities, a clear pattern of divergence in outcomes
during the 1-year study period. The subjects in the GPS group demonstrate significantly better
outcomes for both compliance and recidivism. In terms of compliance, the multivariate model shows
that the hazard ratio of a sex-related violation is nearly three times as great for the subjects who
received traditional parole supervision as for the subjects who received the GPS supervision. In
terms of recidivism, compared with the subjects who received the GPS monitoring supervision, the
hazard ratio for any arrest is more than twice as high among the subjects who received traditional
parole supervision. Similarly, for both a parole revocation and any return-to-custody event, the
hazard ratio suggests that these events are about 38 percent higher among the subjects who
received traditional parole supervision.
The cost analysis indicates that the GPS program costs roughly $35.96 per day per parolee, while
the cost of traditional supervision is $27.45 per day per parolee—a difference of $8.51. However, the
results favor the GPS group in terms of both noncompliance and recidivism. In other words, the GPS
monitoring program is more expensive but more effective.
Finally, the process evaluation reveals that the GPS program was implemented with a high degree of
fidelity across the four dimensions examined: adherence, exposure, quality of program delivery, and
program differentiation.
This document is a research report submitted to the U.S. Department of Justice. This report has not been published by the Department. Opinions or points of view expressed are those of the author(s)
and do not necessarily reflect the official position or policies of the U.S. Department of Justice.

This document is a research report submitted to the U.S. Department of Justice. This report has not been published by the Department. Opinions or points of view expressed are those of the author(s)
and do not necessarily reflect the official position or policies of the U.S. Department of Justice.

Monitoring High-Risk Sex Offenders With GPS Technology: An Evaluation of the California Supervision Program
ix
Contents Acknowledgments ........................................................................................................................... xi
Executive Summary ......................................................................................................................... xiii
1. Background ............................................................................................................................... 1–1
A. Introduction ............................................................................................................................ 1–1
B. Literature Review ................................................................................................................... 1–3
C. The California Department of Corrections and Rehabilitation’s Global Positioning
System Supervision Program .............................................................................................. 1–12
D. The Study Goals ..................................................................................................................... 1–17
2. Methodology ............................................................................................................................. 2–1
A. Overview .................................................................................................................................. 2–1
B. Participants ............................................................................................................................. 2–1
C. Data Sources .......................................................................................................................... 2–3
D. Measures ................................................................................................................................ 2–5
E. Statistical Overview ................................................................................................................ 2–9
3. Results ...................................................................................................................................... 3–1
A. Baseline Characteristics .......................................................................................................... 3–1
B. Supervision ............................................................................................................................... 3–5
C. Outcome Analysis ..................................................................................................................... 3–8
D. Cost Analysis ........................................................................................................................... 3–20
4. Process Evaluation ................................................................................................................... 4–1
A. Overview ................................................................................................................................... 4–1
B. Data Sources ............................................................................................................................ 4–1
C. Program Fidelity ....................................................................................................................... 4–4
D. GPS Monitoring ....................................................................................................................... 4–14
E. Summary ................................................................................................................................. 4–18
5. Discussion ................................................................................................................................. 5–1
A. Summary .................................................................................................................................. 5–1
B. Policy Implications ................................................................................................................... 5–2
C. Limitations ................................................................................................................................ 5–9
D. Next Steps ............................................................................................................................... 5–11
References ...................................................................................................................................... R–1
ATTACHMENTS
A. Static–99 Instrument
B. CDCR Map
C. Parole Agent Survey
D. Parole Violations
This document is a research report submitted to the U.S. Department of Justice. This report has not been published by the Department. Opinions or points of view expressed are those of the author(s)
and do not necessarily reflect the official position or policies of the U.S. Department of Justice.

This document is a research report submitted to the U.S. Department of Justice. This report has not been published by the Department. Opinions or points of view expressed are those of the author(s)
and do not necessarily reflect the official position or policies of the U.S. Department of Justice.

Monitoring High-Risk Sex Offenders With GPS Technology: An Evaluation of the California Supervision Program
xi
Acknowledgments
evelopment Services Group, Inc. (DSG), has many people to thank for helping us complete
this study. First and foremost, Dan Stone, former Parole Administrator of the Electronic
Monitoring Unit (EMU), was our original contact with the Division of Adult Parole Operations
(DAPO), California Department of Corrections and Rehabilitation (CDCR), and was
instrumental in securing the funding and getting this project off the ground. In addition, we thank
Denise Milano, who replaced Dan as the Parole Administrator EMU DAPO after his much deserved
promotion to Regional Administrator, for her cooperation and support throughout the course of this
project. Denise made all CDCR resources available to us; without them, this project would not have
been possible. In addition, we thank Titus Quinn, Parole Agent II, and Jeff Green, Parole Agent III, who
generously gave their time and effort to facilitate this project throughout the years.
We also owe a debt of gratitude for the tremendous assistance and cooperation given by numerous
other CDCR staff. These individuals include Adela Gonzalez, Parole Agent III EMU DAPO; Denise
LeBard, Parole Agent III EMU; Steve Marshall, Parole Agent III EMU; Jill Rivera, Parole Agent II EMU;
Rugina Garcia, Parole Service Associate; and Carrie Daves, Customer Service and Field Operations
Manager. Adela, Denise, and Steve helped arrange each of our site visits and were gracious enough
to accompany our modest entourage from unit to unit throughout the state to track down parolee
case files. Rugina personally printed each and every RAP sheet that was used in this study and
diligently sent them to us on a regular basis. Carrie obtained and transmitted the vast majority of
electronic data used in this report and patiently humored and effectively responded to all of our
inquiries. Overall, CDCR was a true partner in this research, taking part in everything from the design
of the study to the provision of a vast array of data to the facilitation of effective communication
through regular conference calls and electronic communication. We cannot thank them enough. We
would also like to thank both GPS monitoring vendors: Satellite Tracking of People (STOP) LLC and
Pro Tech for both providing the data for the study and entertaining our staff during the GPS parole
agent training activity.
Early on in this study, we convened a methodology panel to review the research design as well as
make suggestions for improvements. The suggestions offered by this panel greatly strengthened the
design of this study. We thank each panel member for his or her individual contributions. The
members included Jeffrey Alwang (Virginia Polytechnic Institute and State University), Ryken Grattet
(University of California, Irvine), David Greenberg (New York University), and David McDowall
(University at Albany, State University of New York). One of us (Gainey) also utilized his graduate
students for the coding and data entry of the RAP sheets. We thank these young scholars for their
valuable contributions and wish them well in their careers. These Old Dominion University graduate
students include Jesse McKee, Maryann Stone, and Jeff Toussaint.
We appreciate the support of the National Institute of Justice (NIJ) leadership in allowing us to
complete this important study. We thank NIJ for its backing and support—especially current Program
Manager Marie Garcia and former Program Manager Marlene Beckman.
Last but not in any way least we thank our own staff and colleagues at DSG—particularly Research
Associate Eoin Healy, Research Assistant Dan Duplantier, writer–editors Martha Yeide and Michael
Hopps, and Research Assistant Amanda Bobnis. Finally, Marcia Cohen, Vice President for Research
and Evaluation and Alan Bekelman, President, kept us all on task throughout the process and
contributed to the thinking and writing of this report. All of these people helped in the analysis,
writing, rewriting, and reviewing of multiple iterations of the chapters herein and stayed with us as
we put sections into a coherent narrative.
D
This document is a research report submitted to the U.S. Department of Justice. This report has not been published by the Department. Opinions or points of view expressed are those of the author(s)
and do not necessarily reflect the official position or policies of the U.S. Department of Justice.

Monitoring High-Risk Sex Offenders With GPS Technology: An Evaluation of the California Supervision Program
xii
It was a privilege to work with CDCR, attend the GPS training, and watch the program in action, and
to be able to apply the science and tools of evaluation on such a strong program.
— Stephen V. Gies, Principal Investigator,
Randy Gainey, Co–Principal Investigator
This document is a research report submitted to the U.S. Department of Justice. This report has not been published by the Department. Opinions or points of view expressed are those of the author(s)
and do not necessarily reflect the official position or policies of the U.S. Department of Justice.

Monitoring High-Risk Sex Offenders With GPS Technology: An Evaluation of the California Supervision Program
xiii
Executive Summary
PURPOSE A great deal of controversy surrounds the management of sex offenders. Moral outrage and fear on the part of the public have set the stage for the growth of strict laws, restrictive policies, and severe sentences for sex offenders. The monitoring and supervision of this population is particularly important because of the irrefutable harm that sexual victimization causes and the potentially volatile community responses to the release of sex offenders (Center for Sex Offender Management 2001). The purpose of this evaluation is to determine the effectiveness of the global positioning system (GPS) monitoring of high-risk sex offenders (HRSOs) who are placed on parole. The California Department of Corrections and Rehabilitation (CDCR) began using GPS to monitor sex offenders in June 2005 when CDCR implemented a 2-year pilot program using a 500-unit system to monitor and track the movement of HRSO parolees. In November 2006 with the passage of California Proposition 83, better known as Jessica’s Law, the state mandated that all sex offenders be placed on GPS supervision for life and that CDCR parole agents be responsible for enforcing the terms and conditions while a parolee is under the state’s jurisdiction. CDCR completed the implementation of the program in December 2008 by equipping a total of 4,800 sex offenders with GPS monitoring units. This figure nearly triples the 1,800 GPS units used by Florida, the second-leading state to use the devices. As of August 2011, there were 9,912 sex offenders on parole in California (9 percent of all parolees under the jurisdiction of the CDCR). Roughly 7,022 of these sex offenders were living in the community, and 6,968 (99.2 percent) were monitored by GPS technology. With the sheer volume of devices deployed, it is critically important to criminal justice agencies and the public to learn whether the integration of GPS with electronic monitoring technology into the traditional supervision of sex offenders reduces victimization, in general, and sex crime victimization, specifically.
STUDY GOALS AND OBJECTIVES Despite the increasing number of high-risk sex offenders being placed on electronic monitoring programs, little is known about the effectiveness of electronic monitoring in reducing recidivism and
Highlights
Purpose: The purpose of this evaluation is to determine the effectiveness of the global positioning system (GPS) monitoring of high-risk sex offenders (HRSOs) who are placed on parole. Design: This study integrates both outcome and process evaluation components. The outcome component assesses the impact of the CDCR GPS supervision program by employing a nonequivalent-group quasi-experimental design with a multilevel survival model. In addition, a propensity score matching procedure was used to account for the differences between the treatment and comparison groups. Outcomes: The subjects in the GPS group demonstrate significantly better outcomes. In terms of compliance, the multivariate model shows that the hazard ratio of a sex-related violation is nearly three times as great for the subjects who received traditional parole supervision as for the subjects who received the GPS supervision. In terms of recidivism, compared with the subjects who received the GPS monitoring supervision, the hazard ratio for any arrest was more than twice as high among the subjects who received traditional parole supervision. Cost: The cost of GPS program is roughly $8.51 per day per parolee more expensive than traditional supervision. However, the outcome results favored the GPS group in terms of both compliance and recidivism. In other words, the GPS monitoring program is more expensive but more effective. Fidelity: The GPS program was implemented with a high degree of fidelity.
This document is a research report submitted to the U.S. Department of Justice. This report has not been published by the Department. Opinions or points of view expressed are those of the author(s)
and do not necessarily reflect the official position or policies of the U.S. Department of Justice.

Monitoring High-Risk Sex Offenders With GPS Technology: An Evaluation of the California Supervision Program
xiv
increasing offender compliance with specialized treatment and supervision conditions. Specifically, the goals and objectives of this study are to
• Assess the fidelity of the program. • Assess the cost of the GPS program. • Assess the effectiveness of the GPS program in reducing the criminal behavior of HRSO parolees.
1. Assess the Fidelity of the GPS Program.
• Determine the program adherence to all core components (i.e., program staffing qualifications, caseload restrictions, HRSO parolee screening, parolee enrollment and orientation specifications, and parole supervision specifications).
• Determine the degree to which the prescribed level of program exposure was obtained. • Determine the quality of program delivery (e.g., skill of the staff in using the techniques or
methods prescribed by the program, and preparedness or attitude of staff toward the program). • Determine the degree to which program components were reliably differentiated from one
another.
2. Assess the Cost of the Program.
• Determine the cost of monitoring HRSOs with the GPS system. • Determine the cost of monitoring HRSOs without the GPS system.
3. Assess the Effectiveness of the GPS Program in Reducing the Criminal Behavior of HRSOs.
• Determine the effect of GPS monitoring on offenders’ subsequent occurrence of noncompliance with parole conditions.
• Determine the effect of GPS monitoring on offenders’ subsequent occurrence of criminal behavior (including a rearrest, reconviction, and return to prison custody).
• Determine the effect of GPS monitoring on offenders’ subsequent time to noncompliance with parole conditions.
• Determine the effect of GPS monitoring on offenders’ subsequent time to criminal behavior (including a rearrest, reconviction, and return to prison custody).
• Determine whether GPS monitoring is more effective in reducing criminal behavior in certain sex offender subgroups (i.e., rapists and child molesters).
• Determine whether GPS monitoring is more effective in reducing criminal behavior of risk behavior subgroups (i.e., high risk and moderate–high).
DATA AND METHODOLOGY To accomplish our goals and objectives, this study integrates both outcome and process evaluation components. The outcome component assesses the impact of the CDCR GPS supervision program by employing a nonequivalent-group quasi-experimental design with a multilevel survival model. We also use a propensity score matching procedure to account for the differences between the treatment and comparison groups. The study population is drawn from all high-risk sex offenders (as determined by the STATIC–99 risk assessment instrument) who were released from prison between January 2006 and March 2009 and residing in the state of California. The final sample includes 516 subjects equally
This document is a research report submitted to the U.S. Department of Justice. This report has not been published by the Department. Opinions or points of view expressed are those of the author(s)
and do not necessarily reflect the official position or policies of the U.S. Department of Justice.

Monitoring High-Risk Sex Offenders With GPS Technology: An Evaluation of the California Supervision Program
xv
divided between the treatment and control groups. The treatment group consists of HRSOs who were placed on GPS monitoring. The control group is made up of similar offenders who were not placed on the GPS system during the study period. The resulting sample showed no significant differences between the groups on any of the propensity score matching variables (including all parole districts), indicating a successful mitigation/elimination of bias in the sample. The effectiveness of the program is assessed using an intent-to-treat (known as ITT) approach. The two main outcomes of interest are compliance and recidivism. Compliance is measured through violations of parole. Recidivism is assessed in a variety of ways, including 1) rearrest, 2) reconviction, and 3) return to prison custody. Each outcome is assessed with a survival analysis of time-to-event recidivism data, using a Cox proportional hazards model. However, since each parolee is monitored by agents who operate within an explicit parole district, the data in this study are clustered. In other words, each parolee is clustered or nested within a parole district. For continuous-time survival data that are clustered (as in this study), frailty models offer a practical solution. A frailty model is a random-effects model, where the frailty—an unobserved cluster-specific univariate component—has a multiplicative effect on its hazard function. The frailty approach provides a means to examine the heterogeneity among subjects and to estimate the distribution of subsequent failure time with the use of failure times and covariate information from other members in the cluster. The outcome component also includes a cost-effectiveness analysis of each outcome. The process component uses both quantitative and qualitative methods to provide a rich context to the program treatment and structure and to assess program fidelity.
DATA SOURCES We used six primary sources to collect data: 1) the CDCR data management system, 2) official arrest records, 3) parole supervision records, 4) GPS monitoring data, 5) a CDCR parole agent survey, and 6) CDCR cost information. California operates a data management system that houses numerous databases relevant to the supervision of HRSO parolees. The majority of data used for this study were derived from three databases: Cal–Parole, the Revocation Scheduling and Tracking System (RSTS), and the Offender-Based Information System (OBIS). The Cal–Parole tracking system stores a variety of information on offenders released from prison and placed on parole, including birth date, gender, race, residency information, the date the parolee was released from prison, the date the parolee is scheduled to be discharged from parole, any special conditions linked to parole, and the unit and agent to which the parolee is assigned. RSTS stores a vast array of data regarding parole revocations, including information on the date and type of parole violation and the result of the parole revocation hearing. OBIS maintains a rich database of information concerning prior criminal history (date of arrest, arrest charges, disposition date, disposition charges, disposition, and length of sentence) of all adult offenders in California. Another principal data source for this study was the official record of arrests, convictions, and custody (commonly known as a RAP sheet) of each study subject. These data were provided in a hardcopy format and coded by hand into a database developed specifically for the study. A third data source included the record of supervision for each parolee. Specifically, the parole agent notes the date and the specific type of contact. These data were collected to measure the level of
This document is a research report submitted to the U.S. Department of Justice. This report has not been published by the Department. Opinions or points of view expressed are those of the author(s)
and do not necessarily reflect the official position or policies of the U.S. Department of Justice.
Monitoring High-Risk Sex Offenders With GPS Technology: An Evaluation of the California Supervision Program
xvi
supervision received by each offender and to assess the California GPS program model. The fourth data source was the GPS monitoring data from the two vendors: Satellite Tracking of People (or STOP) LLC and Pro Tech. These data were used for descriptive purposes and to assess the California GPS program model. Each vendor provided the following data: a profile of the offender; a record of each event (inclusion/exclusion zone, strap tamper, low battery, cell communication gap, and no GPS communication) that includes the event start and stop times and duration during a specified period; and the assignment history of the device. A survey instrument was also developed to collect process data from CDCR parole agents. The final version contained questions in eight areas: 1) overview of the GPS system, 2) reduction of caseload, 3) screening of HRSO parolees, 4) enrollment and orientation, 5) integration of GPS monitoring into the intensive supervision regime, 6) synthesis of parole GPS and law enforcement data, 7) program staffing, and 8) general summary. The survey yielded a response rate for GPS parole agents of 67 percent. The distribution across districts was comprehensive. The final category of data was cost information. The primary sources for such data were written reports, observations, and interviews. To facilitate the identification and specification of each cost, all expenditure items were divided into four broad categories that have common properties: 1) personnel (all fulltime and parttime staff and consultants), 2) facilities (i.e., the physical space required for the program), 3) equipment and materials (furnishings, instructional equipment, etc.), and 4) other inputs (all other costs that do not fit the other categories).
RESULTS 1. Assess the Fidelity of the GPS Program. This study provides evidence regarding the degree to which the program services were delivered as designed. Overall the process evaluation reveals that the GPS program was implemented with a high degree of fidelity across the four dimensions examined: adherence, exposure, quality of program delivery, and program differentiation. A summary of each dimension is provided below: Adherence refers to whether the program service or intervention is being delivered as it was designed. In this case, the program was composed of five core components: program staffing requirements, caseload restrictions, HRSO parolee screening, parolee enrollment and orientation specifications, and parole supervision specifications. The findings demonstrate that, while there was some variation across districts, the overall program fidelity was high.
Exposure refers to the measured quantity of a program. The GPS tracking data revealed that offenders were placed on and removed from GPS supervision frequently during the course of the yearlong study period (M=4.84; SD=2.66). The program demonstrated a high degree of fidelity in terms of exposure, with subjects on average receiving 92 percent of the prescribed treatment dosage. Quality of program delivery is the manner in which a teacher, volunteer, or staff member delivers a program (e.g., skill in using the techniques or methods prescribed by the program, enthusiasm, preparedness, or attitude). The findings indicate that more than 70 percent of the agents polled thought they were excellent or above average with the system, and more than 80 percent of the agents who responded demonstrated a positive attitude toward the GPS supervision program. Taking these two
This document is a research report submitted to the U.S. Department of Justice. This report has not been published by the Department. Opinions or points of view expressed are those of the author(s)
and do not necessarily reflect the official position or policies of the U.S. Department of Justice.

Monitoring High-Risk Sex Offenders With GPS Technology: An Evaluation of the California Supervision Program
xvii
scores together, the program demonstrated a high degree of fidelity in terms of quality of program delivery. Program differentiation identifies the unique features of different components or programs that are reliably differentiated from one another. The findings indicate that GPS parolees spent a significant amount of time (242 days) under GPS supervision while the control group was not monitored by GPS supervision at all. Again, the program demonstrated a high degree of fidelity in that the program was visibly differentiated from traditional supervision. 2. Assess the Effectiveness of the GPS Program in Reducing the Criminal Behavior of HRSOs. The GPS and control groups were well matched in this study after the use of propensity score adjustments. At baseline, mean scores on a wide range of demographic and pretreatment characteristics were remarkably similar between the groups. Despite these baseline similarities, a clear pattern of divergence in outcomes emerged during the 1- year study period. The subjects in the GPS group demonstrated significantly better outcomes for both compliance and recidivism. In terms of compliance, the multivariate model showed that the hazard ratio of a sex-related violation was nearly three times as great for the subjects who received traditional parole supervision as for the subjects who received the GPS supervision. In terms of recidivism, compared with the subjects who received the GPS monitoring supervision, the hazard ratio for any arrest was more than twice as high among the subjects who received traditional parole supervision. Similarly, for both a parole revocation and any return-to-custody event the hazard ratio suggests that these events were about 38 percent higher among the subjects who received traditional parole supervision. In addition, there was some evidence that the number of days until a new conviction was greater for the GPS–monitored parolees. Finally, there was no evidence of differential effects for offender type or risk level. Overall, while one might have hypothesized that the greater the supervision the more likely and quicker the detection of noncompliance and recidivism, it appears the GPS acts as a useful supervision tool, reducing the likelihood and increasing the time until these events. 3. Assess the Cost of the Program. This study also provides details on the cost of the GPS monitoring program in comparison with the cost of traditional supervision. The analysis found that the cost of GPS program is $35.96 per day per parolee, while the cost of traditional supervision is $27.45 per day per parolee—a daily difference of $8.51. In addition, the GPS monitoring program demonstrated a 12-percentage-points reduction (from 26.36 percent to 14.34 percent, as shown in table 3.14) in arrests. However, the results favored the GPS group in terms of both noncompliance and recidivism. In other words, the GPS monitoring program is more expensive but more effective. Specifically, compared with traditional parole supervision, GPS monitoring costs less than $1.00 per day per offender to obtain a 1 percent decrease in arrests. Similarly, GPS monitoring costs about $11.00 per day per offender to obtain a 1 percent decrease in custody returns.
POLICY IMPLICATIONS Any time a parolee commits a crime while on GPS monitoring, the story makes newspaper headlines. Even more dramatic is when the released subject is a sex offender and commits a heinous sex crime while on GPS monitoring. While each one of these stories is emotionally wrenching on an individual level and should not be disregarded, it would be poor public policy to base the supervision of HRSOs on a
This document is a research report submitted to the U.S. Department of Justice. This report has not been published by the Department. Opinions or points of view expressed are those of the author(s)
and do not necessarily reflect the official position or policies of the U.S. Department of Justice.

Monitoring High-Risk Sex Offenders With GPS Technology: An Evaluation of the California Supervision Program
xviii
handful of horrific cases that are perhaps aberrations from the norm. Moreover, unless policymakers are prepared to place these offenders in prison for the rest of their lives, the question is not whether GPS monitoring is better than prison. The real policy question is whether GPS monitoring is better than other supervision options in maintaining public safety—and at what cost. The results of this study suggest that in its current form GPS monitoring is a useful tool in the supervision of HRSOs. Nevertheless, numerous policy recommendations borne from the observations and findings of this study could improve the effectiveness and/or reduce the costs of the program to make it more cost effective and thus more attractive to policymakers. These recommendations include the following: Reexamine the Identification of HRSOs The findings from this evaluation suggest that while almost all parolees convicted of a sex offense and scheduled to be released into the community are screened with the Static–99 risk instrument, the use of the instrument as the sole criteria for the determination HRSO status is insufficient. While the use of such a tool predicts recidivism with a fair amount of accuracy, it does little to guard the public against the more predatory criminals for which the use of GPS monitoring was designed. Consequently, we recommend incorporating a classification system that addresses the need for public safety by accounting for the differential risk of recidivism among sex offenders. Such a system allows parole agents to devote their time and energy to the offenders who pose the greatest risk. Strictly Monitor Sex Offender Treatment Attendance While numerous treatment options are available for sex offenders, the research on the effectiveness of treatment has produced mixed results, with some reviews concluding positive benefits and others concluding that there is little evidence for the effectiveness of sex offender treatment. The research, however, does seem to agree that sex offenders who stop attending treatment or leave the program before completion have an increased risk of recidivism (Brooks–Gordon and Bilby 2006; Lösel and Schmucker 2005; Marques et al. 2005). Consequently, given that the process evaluation found only about 75 percent of the parole agents indicated that their parolees attend sex offender treatment at least once a week, we recommend that CDCR diligently monitor and strictly enforce parolee attendance of sex offender treatment classes. Use a Graduated Sanctions System for Dealing With Parole Violations One of the more important findings in this study is that HRSOs on GPS monitoring supervision are returned to custody less often than HRSOs on traditional parole supervision. However, in both cases, when the parolees do fail, they are most often returned to custody. This return to custody has a tremendous impact on the cost of supervision, as the difference in cost between GPS supervision ($35.96 per day per parolee) and prison ($129.00 per day per parolee) is quite significant. Consequently, we recommend the implementation of a graduated sanctions system where a response or sanction to a violation is balanced by the gravity of the offense and by the need for public safety. In the case of the California GPS monitoring program for HRSOs, a natural and easily implemented restriction would be to impose a home curfew on the offender. Under such a system, rather than merely issuing blanket parole revocations and sentencing violators to go back to prison for a few months at a time, this approach helps target precious correctional resources. Conduct Study to Assess Supervision Fees Another major finding from the study is that the GPS program costs about $8.51 more per day per
This document is a research report submitted to the U.S. Department of Justice. This report has not been published by the Department. Opinions or points of view expressed are those of the author(s)
and do not necessarily reflect the official position or policies of the U.S. Department of Justice.
Monitoring High-Risk Sex Offenders With GPS Technology: An Evaluation of the California Supervision Program
xix
offender than traditional supervision. One way to offset these additional costs would be to apply supervision fees. While there is some valid opposition to the use of supervision fees, we recommend that CDCR conduct an analysis to investigate a) the utility of a supervision fee to offset the cost of the GPS supervision program and b) the optimal level at which to set such a fee. Mandate the Use of Inclusion and Exclusion Zones Another major finding was that parole agents were underusing inclusion and exclusion zones. The process evaluation found that only about 60 percent of the agents always or frequently discuss inclusion zone restrictions and even fewer (about 50 percent) discuss exclusion zone restrictions. These lower figures are the result of the discretionary nature in which parole agents create zones. Unfortunately, this prudence on the part of the agents is counterintuitive, given that the use of zones are arguably the most important GPS tool—as the application of zones enables the agents to be alerted to specific offender movements. Consequently, we recommend that CDCR require the use of zones. Convert to Monitoring Center System Despite a reduction in the number of equipment problems since the initial implementation of the GPS program, this study found that the majority of agents (89 percent) still reported that GPS monitoring is more time intensive than traditional supervision. By some estimates, GPS parole agents spend 44 percent of their time monitoring sex offender movements through GPS and only 12 percent of their time in the field. In response to this issue, CDCR recently converted to a monitoring center approach. We support this modification to alleviate the demand on agents of responding to “technical alerts” so they may concentrate more closely on direct supervision and on responding to alerts that pose real threats to community safety. Maintain Small Caseload Size The introduction of GPS technology as a monitoring tool has considerably increased the amount of information available to agents to supervise offenders in the community, but the review of these data is very time intensive and substantially decreases the amount of time available for the direct supervision of HRSOs. The best way to ensure that parole agents have sufficient time to sustain the direct supervision of these offenders is by limiting the size of GPS parole agent caseloads. In fact, we found caseload size to be highly correlated with parole violations and return-to-custody events. Consequently, we recommend that parole agent caseloads be maintained at an agent-to-offender ratio of no greater than 20:1.* Continue to Emphasize the Use of GPS Monitoring as a Tool The final recommendation is to bear in mind that GPS monitoring is merely a tool useful in the larger context of parole practice. It is not a panacea for all things criminal. This recommendation is borne from the inflated expectations of GPS monitoring attributable to the misconceptions about what GPS monitoring can actually accomplish (Payne and DeMichele 2011). While California recognizes this concept and integrates this principle into its training, its importance cannot be overstated.
*Similar recommendations were offered in the CDCR’s Sex Offender Supervision and GPS Monitoring Task Force report (CDCR 2010) and the UC Irvine pilot study report (Turner and Jannetta 2007).
This document is a research report submitted to the U.S. Department of Justice. This report has not been published by the Department. Opinions or points of view expressed are those of the author(s)
and do not necessarily reflect the official position or policies of the U.S. Department of Justice.

This document is a research report submitted to the U.S. Department of Justice. This report has not been published by the Department. Opinions or points of view expressed are those of the author(s)
and do not necessarily reflect the official position or policies of the U.S. Department of Justice.

Monitoring High-Risk Sex Offenders With GPS Technology: An Evaluation of the California Supervision Program
1–1
1. Background
A. INTRODUCTION Purpose The purpose of this evaluation is to determine the effectiveness of the global positioning system (GPS) monitoring of high-risk sex offenders (HRSOs) who are placed on parole. The criminal justice system manages most convicted sex offenders with some combination of incarceration, community supervision, and specialized treatment. While the likelihood and length of incarceration for sex offenders has increased recently, most are at some point released into the community (Center for Sex Offender Management 2001). The monitoring and supervision of this population is particularly important because of the irrefutable harm that sexual victimization can cause and the potentially volatile community responses to the release of sex offenders (Center for Sex Offender Management 2002). As a result, it is critically important for criminal justice agencies and the public to learn whether the integration of GPS monitoring technology into the traditional supervision of sex offenders increases compliance, reduces recidivism in general, and reduces sex-related recidivism specifically. Background The California Department of Corrections and Rehabilitation (CDCR) began using GPS to monitor sex offenders in June 2005 when CDCR implemented a 2-year pilot program using a 500-unit system to monitor and track the movement of high-risk sex offender (HRSO) parolees. The pilot provided for 80 sex offenders in San Diego County to be included in the program at any given time and was designed to allow CDCR to obtain an initial level of experience with the GPS monitoring system and resolve as many implementation issues as possible before expanding the program throughout the remainder of the state (Turner and Jannetta 2007). But the real impetus for this project occurred in November 2006 with the passage of California Proposition 83, better known as Jessica’s Law. The most significant provisions of this law
• Prohibited sex offenders from residing within 2,000 feet of any school and park where children congregate
• Mandated that all sex offenders be placed on GPS supervision for life
• Increased the sentences for some sex crimes, including life sentences for some offenses that victimize children
• Modified the criteria for Sexually Violent Predators, thereby increasing the number of sex offenders who are eligible for a civil commitment to the California Department of Mental Health for treatment rather than being released on parole
• Made CDCR parole agents responsible for enforcing the terms and conditions of Jessica’s Law while a parolee is under the state’s jurisdiction
CDCR was also charged with the responsibility of implementing this program. With a limited amount of GPS units, CDCR prioritized its HRSO population of approximately 2,500 on parole to be equipped with
This document is a research report submitted to the U.S. Department of Justice. This report has not been published by the Department. Opinions or points of view expressed are those of the author(s)
and do not necessarily reflect the official position or policies of the U.S. Department of Justice.

Monitoring High-Risk Sex Offenders With GPS Technology: An Evaluation of the California Supervision Program
1–2
ankle monitors first. This first phase was completed in April 2008. CDCR completed the implementation of the program in December 2008 (6 months ahead of schedule) by equipping another 2,300 non–HRSOs with GPS monitoring units, bringing the total to 4,800. This figure nearly triples the 1,800 GPS units used by Florida, the second-leading state to use the devices. As of August 2011, there were 9,912 sex offenders on parole in California (9 percent of all parolees under the jurisdiction of the CDCR). Roughly 7,022 of these sex offenders were living in the community, and 6,968 (99.2 percent) were monitored by GPS technology. How GPS Works GPS is a space-based global navigation satellite system that provides location and time information in all weather, anywhere on or near the earth. The initial GPS project was developed in 1973 as a military application to overcome the limitations of previous navigation systems, integrating ideas from several predecessors, including numerous classified engineering design studies from the 1960s. However, in the 1980s, the government made the system available for civilian use, and GPS became fully operational in 1994. The system is freely accessible by anyone with a GPS receiver (although some of the more sophisticated technologies are reserved for military users). The GPS system consists of three major segments. These are 1) the space segment (SS), 2) the control segment (CS), and 3) and the user segment (US). The U.S. Air Force developed, maintains, and operates the space and control segments. The SS segment is composed of 24 to 32 satellites orbiting the earth at an altitude of approximately 20,000 kilometers. The CS is composed of a master control station, an alternate master control station, and six monitoring stations around the globe. Finally, the US is composed of hundreds of thousands of U.S. and allied military users of the secure GPS Precise Positioning Service and tens of millions of civil, commercial, and scientific users of the Standard Positioning Service. These three segments work in concert to produce accurate time and position information. The GPS satellites (SS) circle the earth twice a day in a precise orbit and continuously transmit signal information (i.e., the time the message was transmitted, precise orbital information, and general system health). Notably, all GPS satellites synchronize operations so that these repeating signals are transmitted at the same instant. The synchronized signals, moving at the speed of light, arrive at the GPS receiver (US) at slightly different times because some satellites are farther away than others. The distance to the GPS satellites can be determined by estimating the amount of time it takes for their signals to reach the receiver. When the receiver estimates the distance to at least four GPS satellites, it can calculate its position in three dimensions (latitude, longitude, and altitude). However, a receiver can determine a two-dimensional position (latitude and longitude) from only three satellites. Regardless of method, this position is then displayed on a map for the user. Many GPS receivers also show derived information such as direction and speed, which are calculated from position changes. Finally, the monitoring stations (CS) are used to precisely track each satellite’s orbit and synchronize the signals. The flight paths of the satellites are tracked by dedicated U.S. Air Force monitoring stations in Hawaii; Kwajalein in the West Pacific; Diego Garcia in the Indian Ocean; Ascension Island in the South Atlantic; Cape Canaveral, Fla.; and Colorado Springs, Colo. The tracking information is sent to the Air Force Space Command in Colorado Springs, which contacts each satellite regularly with a navigational update. These updates synchronize the atomic clocks on board the satellites to within a few nanoseconds of one another and adjust the orbital information of each satellite.
This document is a research report submitted to the U.S. Department of Justice. This report has not been published by the Department. Opinions or points of view expressed are those of the author(s)
and do not necessarily reflect the official position or policies of the U.S. Department of Justice.

Monitoring High-Risk Sex Offenders With GPS Technology: An Evaluation of the California Supervision Program
1–3
ACCURACY. The accuracy of a position determined with GPS depends on the type of GPS receiver. Most handheld GPS units are accurate to within 15 meters on average. Other types of receivers use enhancement methods such as Differential GPS (DGPS) to obtain much higher accuracy. DGPS requires a network of fixed, ground-based reference stations to broadcast the difference between the positions indicated by the satellite systems and the known fixed positions. Observations made by the stationary receiver are used to correct positions recorded by the roving units, producing an accuracy greater than 1 meter. Other methods such as Real Time Kinematic and Post Processing can enhance accuracy even further but at a significantly increased cost. Consequently, these enhancement methods are typically used only in more advanced applications such as land surveying. When used properly under ideal conditions, the accuracy of each method is approximated as follows:
• Autonomous: <10m • Differential GPS: 0.3–2.0m • Real Time Kinematic: 0.05–0.5m • Post Processing: 0.02–0.25m
LIMITATIONS. GPS receivers require an unobstructed view of the sky and often do not perform well because of interference from buildings, terrain, electronics, or sometimes even dense foliage. These obstructions can cause position errors or possibly no position reading at all. Consequently, GPS units typically do not work well indoors, underwater, or underground. Other factors that can degrade the GPS signal and thus affect accuracy include the following:
• Atmospheric disturbances. This error occurs when the satellite signal slows as it passes through the atmosphere. The GPS system uses a built-in model that calculates an average amount of delay to partially correct for this type of error.
• Signal multipath. This error occurs when the GPS signal is reflected off objects such as tall
buildings or large rock surfaces before it reaches the receiver. This increases the travel time of the signal, thereby causing errors.
• Receiver clock errors. This error occurs when the receiver’s built-in clock is not as accurate as
the atomic clocks onboard the GPS satellites, resulting in very slight timing errors.
• Orbital errors. This error is due to inaccuracies of the satellite’s reported location.
• Satellite geometry/shading. This error refers to the relative position of the satellites at any given time. Ideal satellite geometry exists when the satellites are located at wide angles relative to each other. Poor geometry results when the satellites are located in a line or in a tight grouping.
B. LITERATURE REVIEW A great deal of controversy surrounds the management of sex offenders. Moral outrage and fear on the part of the public have set the stage for the growth of strict laws, restrictive policies, and severe sentences for sex offenders. While the likelihood and length of incarceration for sex offenders has increased recently, most are at some point released into the community (Center for Sex Offender Management 2001). The monitoring and supervision of this population is particularly important because
This document is a research report submitted to the U.S. Department of Justice. This report has not been published by the Department. Opinions or points of view expressed are those of the author(s)
and do not necessarily reflect the official position or policies of the U.S. Department of Justice.

Monitoring High-Risk Sex Offenders With GPS Technology: An Evaluation of the California Supervision Program
1–4
of the irrefutable harm that sexual victimization can cause and the potentially volatile community responses to the release of sex offenders (Center for Sex Offender Management 2001). Sex Offender Recidivism A common assumption persists that sex offenders, once released, will soon be on the prowl again. But how frequently do sex offenders reoffend? Contrary to popular perceptions, the recidivism rates for sex offenders are generally lower than for other offenders, though accurate rates are difficult to calculate. Studies provide a wide range of recidivism estimates, from 0 percent to over 50 percent (Furby, Weinrott, and Blackshaw 1989). A comprehensive study by the U.S. Department of Justice’s Bureau of Justice Statistics on the recidivism of sex offenders released from prison in 15 states found that 43 percent of sex offenders released in 1994 were rearrested within 3 years, but only 5.3 percent were rearrested for a sex crime (Langan et al. 2003). By contrast, 68.4 percent of nonsex offenders released in the same 15 states were rearrested within 3 years, but only 1.3 percent for a sex crime. In other words, a sex offender released from prison is 37 percent less likely than a nonsex offender to be rearrested within 3 years but 4 times as likely as a nonsex offender to be arrested for a sex offense (Langan et al. 2003). A review by Hanson and Morton–Bourgon (2004) of 95 studies that included a total of 31,216 sex offenders found that 13.7 percent of sex offenders committed a new sex offense. But they also found that sex offenders are more likely to reoffend with a nonsexual offense than a sexual offense.* This wide range of estimates stems from the variety in recidivism rates for certain subgroups, the different ways recidivism is measured, and the varying length of the follow-up periods. For instance, sexual recidivism for offenders with exclusively female child victims is lower than for offenders with male child and adult victims (Vess and Skelton 2010). For a small subgroup of sex offenders, the rates of recidivism may reach between 70 percent and 80 percent (Hanson 1998). Similarly, many studies follow offenders for 5 years or less, but reoffense rates increase over longer periods of time, particularly for certain subgroups (Vess and Skelton 2010). Thus, repeat rapists will recidivate within a shorter timeframe than extrafamilial male child molesters (Office of Criminal Justice Services 2006). Most researchers acknowledge that estimates are probably low, since many recidivism crimes remain undetected. Additionally, judicial practices can contribute to this underestimate, since practices such as plea bargaining sometimes lead to the reclassification of a sex offense as a nonsex offense (Vess and Skelton 2010). Releasing and Supervising Sex Offenders Upon release from prison, few sex offenders are allowed to return to the community without supervision. Multiple mechanisms have been developed to supervise and handle sex offenders upon their release. These include assessment, civil commitment, treatment, and specific tools for supervision, such as specialized caseloads and electronic monitoring. ASSESSMENT. Accurate assessment is key to handling sex offenders and determining the conditions for their release. This assessment process is particularly important given the wide variation in recidivism risk that exists among subgroups of sex offenders. Assessments need to be made at multiple points during the corrections process, including in prison, at release, and at the beginning of and during treatment.
*The violent nonsexual recidivism rate was 14.0 percent, the violent recidivism rate (including sexual and nonsexual violence) was 25.0 percent, and the general (any) recidivism rate was 36.9 percent.
This document is a research report submitted to the U.S. Department of Justice. This report has not been published by the Department. Opinions or points of view expressed are those of the author(s)
and do not necessarily reflect the official position or policies of the U.S. Department of Justice.

Monitoring High-Risk Sex Offenders With GPS Technology: An Evaluation of the California Supervision Program
1–5
Numerous actuarial risk instruments exist that can be used by qualified mental health professionals to predict the risk of recidivism, which can in turn be used to determine appropriate treatment and release plans. These include the Violence Risk Appraisal Guide (VRAG), the Sex Offender Risk Appraisal Guide (SORAG), Static–99, the Rapid Risk Assessment of Sexual Offence Recidivism Scale (RRASOR), the Minnesota Sex Offender Screening Tool—Revised (MnSOST–R), and Sexual Violence Risk (SVR). In their meta-analysis of predictors of sexual recidivism, Hanson and Morton–Bourgon (2004) found that unguided clinical opinion was predictive of recidivism but that the actuarial risk instruments were consistently more accurate in predicting sexual, violent nonsexual, and general recidivism. For sexual recidivism, the predictive accuracies of the actuarial risk scales were in the moderate to large range. Actuarial measures designed to predict general (any) criminal recidivism were strong predictors of general recidivism among sexual offenders. Hanson and Morton–Bourgon’s results confirmed previous research on important predictors of sexual recidivism and identified some new predictor variables. The following factors have been found to be predictive of sexual offending (Hanson and Morton–Bourgon 2004; Office of Criminal Justice Services 2006):
• Sexual preoccupations (high rates of sexual interests and activities) • Deviant sexual interests (e.g., exhibitionism, cross-dressing) • Antisocial orientation (e.g., instability, lack of employment, unstable lifestyle, history of rule
violation) • Prior sexual offense convictions • History of rule violations (such as noncompliance with supervision) • Sexual attitudes (that is, being tolerant of sexual crime) • Emotional identification with children (having children as friends, emotionally closer to children
than adults) • Conflicts with intimate partners or lack of an intimate partner
Other variables have no or little association with sexual reoffending. These include the following:
• Adverse child environment (that is, a history of physical, emotional, or sexual abuse) • General psychological problems • Social skill deficits or loneliness • Clinical presentation variables (e.g., denial, low victim empathy, low motivation for treatment) • Degree of sexual intrusiveness of the offense
Predictors of sexual offenders committing a nonsexual violent offense include
• History of nonsexual and violent crimes • Antisocial orientation • General self-regulation problems • Employment instability • Substance abuse • Degree of force used in the sexual offense
This document is a research report submitted to the U.S. Department of Justice. This report has not been published by the Department. Opinions or points of view expressed are those of the author(s)
and do not necessarily reflect the official position or policies of the U.S. Department of Justice.

Monitoring High-Risk Sex Offenders With GPS Technology: An Evaluation of the California Supervision Program
1–6
While these predictors provide valuable information that can be helpful in the assessment and supervision of sex offenders, Hanson and Morton–Bourgon caution that there is still substantial variability across studies regarding what constitutes predictors or which serve as the strongest predictors of future behavior. CIVIL COMMITMENT. Sometimes, sex offenders move directly from confinement in prison to confinement through civil commitment. Civil commitment entails the indefinite confinement in dedicated institutions of selected sex offenders deemed too dangerous to be released into the community. The first civil commitment law was passed in Washington state in 1990, but this type of law has become increasingly popular since the U.S. Supreme Court determined in 1997 that civil commitment programs are constitutional, as long as they provide treatment during the course of the commitment (Iacone 2011). Civil commitment is a very expensive option: the average cost per offender can be more than $100,000 each year, compared with the $26,000 it costs to imprison an offender (Davey and Goodnough 2007). The expense in part stems from the costs of building separate facilities to house the civilly committed and the programming that must be provided to those confined. These costs continue to climb since those who are committed civilly are rarely released, leading to increasing numbers committed and an aging population with increased medical needs. For instance, the number of sexual offenders in Virginia has risen to 300 at the state facility since the program began in 2003 (Iacone 2011). Nationally, about 3,000 sex offenders have been sent to civil facilities since 1990. Fewer than 500 have been released for various reasons (such as graduating from the program, poor health, legal technicalities) [Davey and Goodnough 2007]. The costs of civil commitment in Kansas rose from $1.2 million in 2001 to $6.9 million in 2005. Critics also note that the assessment process can be influenced by emotions and politics, so that those offenders best suited for continued confinement may go free and those who could be released under supervision are committed (Davey and Goodnough 2007). Field supervision and conditions of supervision. Fieldwork practices can vary dramatically across departments, but there is growing recognition of the value of supervising criminal offenders beyond the confines of correctional facilities. A 2001 survey of Texas departments found variability in the frequency of field contacts and the dedication of resources to field supervision. For instance, 8 percent reported weekly contacts, 53 percent reported monthly contacts, 17 percent once every 2 months, and 10 percent once every 3 months. More than 10 percent reported contact frequency of less that once every 3 months or never (McKay 2002). Resources provided to the supervising agents also can vary between departments, with some officers having access to two-way radios, cell phones, or firearms. Similarly, there can be great variation in the conditions imposed for release and supervision on an individual sex offender. Such conditions can include the imposition of a “child safety zone” (where the offender cannot enter), testing for sexually transmitted diseases, child contact conditions, monitoring of online activities, and treatment (McKay 2002). TREATMENT. Often as part of their release conditions, sex offenders are required to participate in treatment. Various types of treatment are available and are often available in prison, as well as postrelease.
This document is a research report submitted to the U.S. Department of Justice. This report has not been published by the Department. Opinions or points of view expressed are those of the author(s)
and do not necessarily reflect the official position or policies of the U.S. Department of Justice.

Monitoring High-Risk Sex Offenders With GPS Technology: An Evaluation of the California Supervision Program
1–7
Castration. There are two types of castration: surgical and chemical. The former entails the surgical removal of the testes and is irreversible. The latter, also known as pharmacological castration, involves the use of anti-androgen medications to reduce the offender’s libido and sexual activity. Although chemical castration can be “reversed” through the cessation of medication, the use of such medications can have permanent effects on the body chemistry, such as bone density loss and increased risk of bone fractures, increased body fat and risk of diabetes mellitus, and an increased risk of cardiovascular diseases and depressive symptoms (Rice and Harris 2011). Some researchers have concluded that there is enough scientific evidence to support the use of androgen deprivation therapy (ADT). For instance, Lösel and Schmucker concluded in their review of chemical castration that “hormonal medication… shows a relatively good outcome” (2005, 135). However, Rice and Harris (2011) point out that little research, much less rigorous research, is available on the long-term effects of ADT on sexual behavior in general and sexual recidivism in particular or about long-term health effects. Behavioral interventions. These interventions have an explicit emphasis on changes in behavior. Behavioral therapy concentrates on specific actions and environments that either change or maintain behaviors (Skinner 1974; Bandura 1977). Usually these interventions include the application of a stimulus, the measurement of a physical reaction (for instance, through the use of penile plethysmography), and a positive or negative reinforcement of that behavior. For instance, in aversion therapy, an individual may be exposed to deviant material, followed by an aversive stimulus; with olfactory conditioning, a high-risk sexual situation is accompanied by an unpleasant odor (Brooks–Gordon, Bilby, and Wells 2006). Cognitive–behavioral interventions. Cognitive–behavioral treatment (CBT) is a problem-focused approach to helping people identify and change the dysfunctional beliefs, thoughts, and patterns of behavior that contribute to their problems. Its underlying principle is that thoughts affect emotions, which then influence behaviors. CBT combines two very effective kinds of psychotherapy: cognitive therapy and behavioral therapy. Cognitive therapy concentrates on thoughts, assumptions, and beliefs. With cognitive therapy, people are encouraged to recognize and to change faulty or maladaptive thinking patterns. For instance, in sex offender treatment, cognitive therapy would target the beliefs, for instance, that children are sexual beings, that sexual activity does not harm children, or that women are game-playing and deceitful individuals (Schaffer et al. 2010). Cognitive therapy is a way to gain control over inappropriate repetitive thoughts that often feed or trigger various presenting problems (Beck 1995). Psychodynamic interventions. These interventions include psychoanalysis, which focus individual therapy sessions on the infantile sexual relations level. These interventions also deal with transference, the unconscious transfer of feelings from one person to another (Brooks–Gordon, Bilby, and Wells 2006). Treatment effectiveness. While numerous treatment interventions are available for sex offenders, the research on its effectiveness has produced mixed results, with some reviews concluding positive benefits of treatment and others concluding that there is little evidence for the effectiveness of sex offender treatment. For instance, a recent Cochran meta-analysis that examined randomized controlled trials of treatment found that, of the included studies, 7 found statistically significant treatment effects, 10 found no treatment effects, and 4 could not be analyzed (Brooks–Gordon and Bilby 2006). Lösel and Schmucker (2005) concluded, on the basis of 69 studies, that the majority confirmed the benefits of treatment. But Hanson and colleagues (2009) point out that the methodological quality of the studies
This document is a research report submitted to the U.S. Department of Justice. This report has not been published by the Department. Opinions or points of view expressed are those of the author(s)
and do not necessarily reflect the official position or policies of the U.S. Department of Justice.
Monitoring High-Risk Sex Offenders With GPS Technology: An Evaluation of the California Supervision Program
1–8
included suggests that caution should be used in accepting overall conclusions. They assessed how treatment effects varied with the degree to which the treatment applied the risk–need–responsivity (RNR) principle in the treatment of sex offenders, concluding that programs adhering to the RNR principles showed the largest reductions in sexual and general recidivism. Research has also shown that, in general, treatment is more effective with high-risk, high-need offenders than with low-risk offenders (Office of Criminal Justice Services 2006). SUPERVISION TOOLS. Numerous tools are available to help manage sex offenders effectively. These include specialized caseloads, clinical polygraph, penile plethysmography, and electronic monitoring.
• Specialized caseloads. Often, sex offenders are assigned to supervision officers who have been trained in managing this particular population. This trend has accelerated in recent decades, and several professional organizations, such as the American Probation and Parole Association and the Center for Sex Offender Management, have espoused this practice (McKay 2002). In 2001, 66 percent of the Texas community supervision and corrections departments had implemented specialized sex offender supervision caseloads.
• Clinical polygraph. The polygraph is a tool used to break through the denial, manipulation, and
deceit of offenders. In Texas, polygraph testing has been authorized as a condition of supervision (McKay 2002).
• Penile plethysmograph. This medical device measures erectile response to various categories of
stimuli, such as sexually suggestive movies, pictures, and audio.
• Electronic monitoring devices. Electronic monitoring (EM) devices have increasingly been used in prison diversion programs over the past decades. Such devices include polygraphs, random calling and voice verification, remote alcohol monitoring, sleep pattern analysis, motion detection analysis, check-in kiosks, and GPS systems (IACP 2008). EM—particularly GPS devices—has become a popular tool for monitoring paroled sex offenders.
Electronic monitoring. EM has emerged as an important tool in the handling of sex offenders. According to the most recent Interstate Commission on Adult Offender Supervision (ICAOS 2006) GPS Government Survey, 23 states currently have some sort of GPS monitoring program for sex offenders. Some states (such as California, Colorado, Florida, and Missouri) have enacted legislation requiring the lifetime monitoring of sex offenders (IACP 2008).
• Background: The first electronic monitoring devices were developed in the 1960s by a group of researchers at Harvard University, with the main purpose of providing feedback to the offenders fitted with the units; the feedback was meant to provide social support and facilitate rehabilitation (Burrell and Gable 2008). However, this device failed to gain acceptance, and it was not until the 1980s that EM reemerged. The climate had changed considerably, with the emergence of a more punitive model of offender treatment. Technology made possible increased surveillance and enforcement in the community setting.
The decision of New Mexico State District Judge Jack Love in 1983 to sentence three offenders to home detention with EM has taken on an almost mythic status. To fulfill his vision, he first had
This document is a research report submitted to the U.S. Department of Justice. This report has not been published by the Department. Opinions or points of view expressed are those of the author(s)
and do not necessarily reflect the official position or policies of the U.S. Department of Justice.
Monitoring High-Risk Sex Offenders With GPS Technology: An Evaluation of the California Supervision Program
1–9
to convince someone to manufacture the transmitter devices. Since those early days, the pool of manufacturers and service providers has been in flux (Burrell and Gable 2008), but part of the dramatic growth in the use of EM is due to the aggressive marketing of these private companies (Black and Smith 2003; Lilly 2006). From those first three offenders in 1983, it has been estimated that approximately 100,000 offenders were on EM in 2006 (Conway, 2006, as cited in Burrell and Gable 2008). The usability of these units was enhanced considerably when the military discontinued the policy in 2000 of “selective availability,” which had made civilian receivers significantly less accurate than military receivers (Florida Senate Committee on Criminal Justice 2004).
Radio frequency and GPS monitoring. Two types of EM are used most frequently for monitoring offenders. The first, radio frequency monitoring (RF), is used to determine whether an offender on house arrest is at home. The offender wears a tamper-resistant small transmitter that communicates with a small receiving unit connected to the phone line. If the signal is lost, the receiving unit communicates with the monitoring station, which in turn can notify the probation officer. These systems can accommodate work or religious schedules, so that offenders can be off site at scheduled times. Officers also can use a “drive by” monitoring device to check whether the offender is at home or in treatment as scheduled. An RF unit is the least expensive form of monitoring and costs about $2.75 per day (Florida Senate Committee on Criminal Justice 2004). The second system, GPS monitoring, uses a network of satellites to calculate the physical position of the offender. The offender wears a tamper-resistant bracelet that receives transmissions from the satellites and calculates the offender’s location. With a passive GPS system, this information is stored and transmitted at appointed times to the monitoring station. With the active GPS system, information on the individual’s location is transmitted to the monitoring station in near “real time.” This allows the station to alert the probation officer immediately when a violation occurs. Both active and passive GPS systems allow certain zones to be excluded (such as schools or other places where children congregate) or included (such as a work zone) and provides information on where and when an individual has been throughout the course of the day. The passive GPS system costs about $4.00 per day, and the active costs about $9.00 per day (Florida Senate Committee on Criminal Justice 2004). GPS has garnered an increasing amount of attention. But while there are multiple benefits to its use, officials in the justice and corrections systems, as well as the general public, need to be aware of potential shortcomings. The International Association of Chiefs of Police (IACP) has identified four main benefits of GPS:
1. Flexibility. GPS offers an alternative to incarceration, which is expensive. It also can be tailored for individual offenders so that specific geographic areas can be selected for inclusion (the offender can visit that area) or exclusion (the offender must avoid that area to avoid a violation alert being sent).
2. Reintegration. GPS may promote compliance with the conditions of supervision and treatment,
since locations can be tracked.
This document is a research report submitted to the U.S. Department of Justice. This report has not been published by the Department. Opinions or points of view expressed are those of the author(s)
and do not necessarily reflect the official position or policies of the U.S. Department of Justice.

Monitoring High-Risk Sex Offenders With GPS Technology: An Evaluation of the California Supervision Program
1–10
3. Control. The criminal justice system retains the ability to track and respond to the movement patterns of offenders, and the equipment provides a tangible and continuing reminder to the offender that monitoring is ongoing.
4. Investigation. It is possible to use location information to confirm that an individual is or is not a
suspect for a particular crime. While these benefits make GPS attractive, there still are concerns about GPS. IACP has identified the following four issues:
1. Limited empirical support. The findings from research studies on the impact of EM on recidivism are mixed (see below).
2. Increased officer workload. Though early advocates of EM believed that this tool could increase
the manageable caseload under supervision, experience with the technology has suggested the opposite. This workload increase stems from multiple factors, such as the need for officers to monitor GPS equipment, to respond to alerts (many of which can be “false” alerts [Elzinga and Nijboer 2006]), to teach offenders how the equipment works, and to ensure that the equipment is maintained and replaced when it fails. Sachwald (2007) noted that in Maryland’s experience of implementing GPS, hardware failures occurred for about half of the offenders placed on GPS, and sometimes the equipment had to be replaced two or even three times before it worked. In light of such realities, the Florida Department of Corrections recommended that the total caseload burden diminish with the introduction of EM, so that supervising officers have a caseload of 25:1 with no EM, 22:1 for radio frequency monitoring, 17:1 for active GPS monitoring, and 8:1 for passive GPS monitoring (Florida Senate Committee on Criminal Justice 2004).
3. False sense of security. The public may not understand the limitations of this technology but
assume it is a panacea (Bishop 2010). In truth, GPS is a tool—and one that can fail. For instance, in a pilot study, some intentional violations on the part of volunteers were not detected by the system (Elzinga and Nijboer 2006). There are also documented instances of “false” readings, such as when offenders were recorded in one place when officers knew them to have been elsewhere (Sachwald 2007). Also, while GPS units may be able to track where offenders are, they cannot provide information on what they are doing. Thus, when it comes to sex offenders, GPS may not provide the kind of information that is helpful since almost 95 percent of sex offenses against minors involve an offender known to the victim (Demichele, Payne, and Button 2008).
4. Legal concerns. Courts have not yet decided on how challenges to the use of GPS will be
resolved. If equipment malfunctions and a crime is committed, will departments be held responsible? What happens if the department fails to respond to an alert? Lawsuits over such matters could cost departments millions of dollars in court costs and damages.
To this can be added unresolved questions deriving from the legislation requiring GPS monitoring for life. These laws have enormous implications for law enforcement, such as who should monitor the offenders after parole and who will pay for these costs. For these reasons, GPS should not be considered a
This document is a research report submitted to the U.S. Department of Justice. This report has not been published by the Department. Opinions or points of view expressed are those of the author(s)
and do not necessarily reflect the official position or policies of the U.S. Department of Justice.

Monitoring High-Risk Sex Offenders With GPS Technology: An Evaluation of the California Supervision Program
1–11
panacea to the issue of supervision but be viewed instead as one tool of a comprehensive sex offender supervision program. Uses of EM. EM can be used at different points in the judicial system—for example, for pretrial supervision as an alternative to jail, as an alternative to incarceration for selected offenders, or as part of a mandated supervision program after release from prison. It also can be used for different purposes, including
• Public safety • Safety of individual victims • Accountability of offenders • Behavior change and recidivism reduction • Reduction of jail or prison populations • Reducing costs
Notably, not all of the purposes are mutually compatible (Florida Senate Committee on Criminal Justice 2004). Thus, departments using EM should clarify their goals at the start of the program. Some critics (e.g., Lilly 2006, Nellis 2006) have noted the absence of rehabilitation as an overall goal for the use of EM, contrary to the intent of its earliest developers. In response to this absence, Burrell and Gable (2008) have proposed the development of an incentive-based model of EM that could integrate a rehabilitation component through the use of positive reinforcement. They note that this type of model fits into the framework of evidence-based practices and point to the success of drug courts in using positive reinforcement to shape offender behavior and facilitate rehabilitation. Effectiveness of EM. The research on the effectiveness in reducing recidivism has been, at best, mixed. This result stems in large part from the limitations of most extant studies. For instance, the 1997 report to the U.S. Congress (Sherman et al. 1997) categorized home detention with EM as an approach that “doesn’t work.” This conclusion, however, was based on the only two studies deemed to have adequately rigorous designs (Burrell and Gable 2008). A 2005 meta-analysis of 119 studies on the use of EM with moderate- to high-risk offenders, conducted by Marc Renzema and Evan Mayo–Wilson, faced a similar problem with study limitations. They concluded that “all studies [of EM] in moderate- to high-risk populations have serious limitations and matched studies of EM in moderate- to high-risk populations are of very low quality.” Only 3 of the 119 studies considered by Renzema and Mayo–Wilson incorporated a control or comparison group in their research design, and all 3 of these produced inconclusive results on the value of EM. (For example, Finn and Muirhead–Steves’s 2002 study of the EM program in Georgia did find that sex offenders on EM were less likely to reoffend than their counterparts in the comparison group, but Renzema and Mayo–Wilson also “found evidence that EM may not have produced the observed differences.”) However, some recent studies, with rigorous research designs, are suggesting that the optimism about the potential of EM may not be groundless. For instance, a 2006 study conducted by researchers at the University of Florida makes a slightly stronger case for EM. Padgett, Bales, and Blomberg analyzed data from 75,661 serious offenders in Florida who had been placed on home confinement between 1998 and 2002 and found that “Both radio frequency and global positioning system monitoring significantly reduce
This document is a research report submitted to the U.S. Department of Justice. This report has not been published by the Department. Opinions or points of view expressed are those of the author(s)
and do not necessarily reflect the official position or policies of the U.S. Department of Justice.

Monitoring High-Risk Sex Offenders With GPS Technology: An Evaluation of the California Supervision Program
1–12
the likelihood of technical violations, reoffending, and absconding for this population of offenders.” This positive effect was particularly noteworthy since the population placed on EM was a significantly higher risk population. However, Padgett and colleagues also found that EM had a smaller impact on sex offenders than on other offender groups. While violent offenders on GPS monitoring were 91.5 percent less likely to commit a new offense than violent offenders who were not electronically monitored, sex offenders were only 44.8 percent less likely to commit a new offense. This small treatment effect is probably the result of most sex offenders’ relatively low tendency to be rearrested. They also noted that, given the efficacy of both RF and GPS, the price differential for their use is substantial—something that would be important for policymakers to consider. A 2010 study conducted by researchers at Florida State University also offers evidence for the effectiveness of EM. For their quantitative analysis, Bales and colleagues analyzed data on 5,034 medium- and high-risk offenders on EM and 266,991 offenders not placed on EM over a 6-year period; they used propensity score matching to minimize selection bias. The researchers found that EM reduced offenders’ risk of failure by 31 percent; they found that, within the EM group, GPS monitoring resulted in 6 percent fewer supervision failures, compared with RF. They noted that all categories of offenders, regardless of offense type, experienced fewer supervision violations as a result of EM; however, the effect was reduced for violent offenders. For their qualitative analysis, the researchers conducted interviews with 105 offenders, 36 supervising officers, and 20 administrators from across Florida. They found that offenders and their families suffered negative consequences, including poorer relationships with significant others and children and the offenders’ more frequent inability to obtain and retain employment. They also concluded that EM appeared to be a cost-effective method for dealing with offenders. While these findings provide promising evidence that EM can reduce recidivism, none of the existing studies on EM, including the 2006 and 2010 studies, has shown that EM does more than postpone recidivism. Parolees appear to be compliant while subject to monitoring, but, in the words of Peckenpaugh and Petersilia (2006), “when the bracelets come off, other studies have found that monitored offenders perform no better than offenders [who] were never subject to monitoring.” Gainey, Payne, and O’Toole (2000) have raised the related issue of whether time spent on EM affects recidivism. Their review of the limited research on the relationship between recidivism and time served and the relationship between time on EM and program completion found mixed findings. Their own study found that the longer the time offenders spent on EM, the lower the likelihood of recidivism. However, this result varied by type of offender. These findings are provocative but provide only a starting point for answering questions about the impact of EM on recidivism after the removal of EM. They also suggest the need for further research about the impact of EM when it is part of a comprehensive program and is not studied—as do Padgett and colleagues and Bales and colleagues—in isolation from other program components.
C. THE CALIFORNIA DEPARTMENT OF CORRECTIONS AND REHABILITATION’S GLOBAL POSITIONING SYSTEM SUPERVISION PROGRAM CDCR is charged with the responsibility of administering the program to monitor with GPS technology all sex offenders released from prison and living in the community. The goals of this program are to
1. Use the technology to gather information that can enhance supervision.
This document is a research report submitted to the U.S. Department of Justice. This report has not been published by the Department. Opinions or points of view expressed are those of the author(s)
and do not necessarily reflect the official position or policies of the U.S. Department of Justice.

Monitoring High-Risk Sex Offenders With GPS Technology: An Evaluation of the California Supervision Program
1–13
2. Provide parole agents and local law enforcement with the ability to monitor the location and movement of targeted parolees.
3. Aid in the investigation of parole violations and criminal investigations. 4. Strengthen the partnerships with local law enforcement agencies.
As of August 2011, this program included roughly 7,000 sex offenders. These offenders are designated as either high risk or non–high risk. An offender classified as an HRSO is placed on an actively GPS–monitored caseload, while an offender designated as a non–HRSO is placed on a passively GPS–monitored caseload. In both caseload types, the GPS system transmits its location at near-real-time intervals. However, tracks are reviewed more frequently in the active system than in the passive system. Eligibility and Designation of High-Risk Sex Offender In California, all persons convicted of a crime under Penal Code section 290 or other specifically defined sexually motivated offenses are eligible to be placed on the GPS monitoring system for the rest of their lives.* Parolees are designated as either high risk or non–high risk through the use of the Static–99 risk assessment instrument. The Static–99 is a brief actuarial instrument designed to estimate the probability of sexual and violent recidivism among adult males who have already been convicted of at least one sexual offense against a child or nonconsenting adult (see attachment A). The scale contains 10 items:
1. Prior sexual offenses 2. Prior sentencing dates 3. Any convictions for noncontact sex offenses 4. Current convictions for nonsexual violence 5. Prior convictions for nonsexual violence 6. Unrelated victims 7. Stranger victims 8. Male victims 9. Age 10. Length of domestic relationship
It classifies offenders into four categories: low, moderate–low, moderate–high, and high. The Static–99 has been shown to be as accurate as, or more accurate than, other sex-offender prediction tools in identifying offenders who are subsequently reconvicted of sexual or violent offences. The Static–99 is administered in an interview setting by probation/parole officers, correctional case managers, and mental health professionals. In California, offenders complete the instrument at least 120 days before release or as soon as practical. Offenders who score a 4 or higher on the STATIC–99 are considered moderate–high (4–5) or high-risk (6+) offenders. Upon release, the parole unit supervisor will review the score for validation. In addition,
*While California law requires sex offenders to be placed on GPS monitoring for the rest of their lives, a loophole in the law allows for offenders eventually to be removed from GPS monitoring. Under the law, CDCR is charged with the authority and responsibility of monitoring with GPS technology all sex offenders on parole. However, the authority to monitor the offender expires when the parolee is discharged. CDCR does notify local law enforcement about a month in advance that the parolee is about to be discharged, but because of local budget constraints few if any local agencies have chosen to continue GPS monitoring. As a result, the vast majority of offenders are released from GPS monitoring upon the successful completion of parole (typically between 3 and 5 years).
This document is a research report submitted to the U.S. Department of Justice. This report has not been published by the Department. Opinions or points of view expressed are those of the author(s)
and do not necessarily reflect the official position or policies of the U.S. Department of Justice.

Monitoring High-Risk Sex Offenders With GPS Technology: An Evaluation of the California Supervision Program
1–14
the unit supervisor may exercise an override option by adding one point to the score of any individual with a score between 0 and 4 who exhibits any combination of three of the following four factors:
• Criminal history includes a sex offense (arrest or conviction) as a juvenile and as an adult. • Sex offender treatment dropout or expulsion. • Parole violation/new offense while under supervision. • Criminal offense history (arrest or conviction) includes two victims under age 12, one of whom
was unrelated to the offender. The unit supervisor may also consider aggravating and mitigating factors that support a high-risk designation. These aggravating factors include
• The offender qualified to be evaluated by the Department of Mental Health as a Sexually Violent Predator but was not eligible for a hospital commitment.
• The offender has at least two prior convictions, with at least one of the two being a registerable offense and the other being a serious or violent offense.
• The offender has a forcible rape conviction that is predatory in nature. The mitigating factors include
• The age of the inmate (the offender is over 60) • The time of the last sex offense (the last sex crime was a minimum of 20 years ago) • The health of the offender (chronic medical condition and/or physical disability that
incapacitates the offender) • Successful completion of sex offender treatment at any time in the past
Finally, the unit supervisor may also consider any and all factors that pertain to the offender posing a risk of future violent sexual offenses. Specifically, the unit supervisor may consider factors that would justify more intensive monitoring, such as
• The parolee is a flight risk based on objective reasons such as history of absconding. • The parolee has a sexually motivated kidnapping conviction. • The parolee has arrests or convictions for sex crimes against strangers and unrelated victims.
The Program Components The CDCR HRSO Monitoring Program is composed of three distinct components: GPS monitoring, traditional intensive supervision, and sex offender treatment. GPS MONITORING. The GPS monitoring component currently employs the tracking system of two different vendors: Satellite Tracking of People (STOP) LLC and Pro Tech. STOP is used in the southern portion of California (Regions 3 and 4),* and Pro Tech is responsible for the northern areas (Regions 1 and 2).
*CDCR is organizational and operationally divided up into four distinct regions, with numerous districts within each region and numerous parole units within each district. Region 1 consists of the Central Valley, ranging from Bakersfield to the Oregon border, while Region 2 encompasses the coastal counties from Ventura to the Oregon border. Region 3 includes Los Angeles County alone, and Region 4 consists of the southern counties of Imperial, Orange, Riverside, San Diego, and San Bernardino. (See attachment B for a map of CDCR regions.)
This document is a research report submitted to the U.S. Department of Justice. This report has not been published by the Department. Opinions or points of view expressed are those of the author(s)
and do not necessarily reflect the official position or policies of the U.S. Department of Justice.

Monitoring High-Risk Sex Offenders With GPS Technology: An Evaluation of the California Supervision Program
1–15
While the terminology of the vendors differs, the capabilities of hardware and software are virtually identical. Each vendor employs an active monitoring system that combines cellular and GPS technology to automatically track the location of a parolee. The unit takes a data point every minute and transmits the location data every 10 minutes. The tracking device is a single-piece GPS unit that weighs about six ounces and is roughly the size of a computer mouse. The device is worn flush around the left ankle, secured by a tamper-resistant, fiber-optic technology strap and specialized security screws to secure the strap to the device. The battery can operate longer than 48 hours on a single charge, and recharging takes roughly 1 hour from any standard 110-volt electrical outlet. The battery’s lifespan typically is 1 to 2 years. The software system of each vendor employs a combination of data integration, geomapping, and GPS technology to monitor parolees. Each vendor tracks the information about parolee activities supplied by the GPS technology and transmits it to the supervising parole agent (PA) through the monitoring center. The monitoring center provides the PA with information in two basic forms: daily reports (DRs) and immediate alert (IA) notification. For each parolee, a DR is emailed to the PA each morning. The notification details all the activity recorded by the GPS unit, including charging activity, zone violations, strap tampers, and other violations. The PA must review all recorded activity and note any actions that stem from the notification. The notification also includes a direct link to a Web-based data system for a review of the “tracks” or movement patterns of any offender on any GPS caseload. The software plots the location and movement on an interactive Web mapping service application, allowing the PA to see the movements of a parolee and investigate any unusual or suspicious movement patterns. PAs are provided with laptops enabled with wireless Internet cards to allow access to software from the field. An IA notification is automatically generated by the monitoring center and transmitted to the supervising parole agent through a text message whenever the GPS unit records any of the following violations: inclusion/exclusion zone, strap tamper, low battery, cell communication gap, and no GPS communication. Upon receipt of an IA notification, the supervising PA must analyze and appropriately respond to the information contained within the notification. This investigation typically begins with the transmission of a signal that forces the unit to beep or vibrate, indicating that the offender must either telephone or physically appear before the PA immediately. If these methods fail to resolve the problem and the event is regarded as a serious threat to public safety, the PA may contact local law enforcement to locate the offender. The GPS monitoring technology includes numerous other features that aid the PA in monitoring the offender. Some of these features include the following:
• Inclusion zone: A geographic location that an offender is required to occupy during certain times of the day. The application of an inclusion zone enables the PA to be alerted to a parolee’s movement out of the specific location. Inclusion zones may include but are not limited to the parolee’s residence, employment, or treatment location.
• Exclusion zone: A geographic location that an offender is prohibited from entering ever or during
certain times of the day. Converse to the inclusion zone, the application of an exclusion zone enables the PA to be alerted to a parolee’s movement into a specific location. Exclusion zones may include but are not limited to the victim’s residence, areas of known narcotic activity, prior arrest locations, or areas of restricted travel.
This document is a research report submitted to the U.S. Department of Justice. This report has not been published by the Department. Opinions or points of view expressed are those of the author(s)
and do not necessarily reflect the official position or policies of the U.S. Department of Justice.
Monitoring High-Risk Sex Offenders With GPS Technology: An Evaluation of the California Supervision Program
1–16
• Track mapping: Tools and procedures for analyzing an offender’s movements on a map.
• Status call button: A feature that initiates an audible tone and/or a vibration from the receiver.
• Crime scene correlation: The intersection of crime incident data with GPS tracks to determine
whether any offender was in the vicinity of a crime.
INTENSIVE SUPERVISION. The intensive supervision component involves recurrent contact with HRSOs by parole agents. The PA meets face-to-face with the parolee on the first working day after release and informs the parolee that GPS monitoring technology is being added as a special condition of parole and that participation in the program is mandatory (refusal will result in immediate revocation of parole and a return to prison). The PA also explains to the parolee how the GPS unit functions, the parolee’s responsibilities for caring for the unit, the conditions of compliance, and the consequences for noncompliance. Specifically, the PA is also required to
• Meet face to face at the parolee’s residence within a specific number* of days after release.
• Perform all necessary enrollment tasks (e.g., prepare the GPS device for use, enroll the parolee
in the software system, update the parolee’s profile, install the GPS device on the parolee). • Instruct the parolee on the components of the system and the procedures to be followed, to care
for the unit, and the specific behaviors that constitute noncompliance. • Recognize behaviors that constitute noncompliance. • Conduct a minimum number* of face-to-face contacts with each parolee each month.
• Conduct a minimum number* of face-to-face contacts at the offender’s residence each quarter. • Conduct a minimum number* of collateral contacts (i.e., contact with a treatment provider or
other individual who has significant knowledge of the parolee) each month.
• Place a minimum number* of zones around each GPS parolee, one of which is an inclusion zone around the parolee’s residence.
• Physically inspect the GPS device at regular intervals.* • Conduct a track review of each parolee in the community at regular intervals.* • Conduct a case review with the unit supervisor before removal of GPS (arrest or discharge is the
only exception).
*The exact number is known to the researchers. However, at the request of CDCR and to preserve the integrity of the parole program, this figure is omitted from the final report.
This document is a research report submitted to the U.S. Department of Justice. This report has not been published by the Department. Opinions or points of view expressed are those of the author(s)
and do not necessarily reflect the official position or policies of the U.S. Department of Justice.

Monitoring High-Risk Sex Offenders With GPS Technology: An Evaluation of the California Supervision Program
1–17
• Perform all necessary unenrollment tasks.
All PAs involved in the GPS program (whether or not directly supervising parolees) must be trained by the Division of Adult Parole Operations’ electronic monitoring unit in the use of GPS technology as a parole supervision monitoring tool. The training program covers a variety of information including policies, procedures, and protocols when using GPS as a supervision tool. PAs must attend GPS training before supervising parolees using GPS.
SEX OFFENDER TREATMENT. The treatment component requires as a condition of parole that HRSO parolees attend sex offender treatment classes weekly through the Parole Outpatient Clinic, where clinicians provide psychological evaluations, assessments, and individual and group therapy to HRSO parolees.
D. THE STUDY GOALS Goals Despite the increasing number of high-risk sex offenders being placed on electronic monitoring programs, little is known about the effectiveness of electronic monitoring in reducing recidivism and increasing offender compliance with specialized treatment and supervision conditions. The overall purpose of this study is to conduct a quasi-experimental evaluation of the CDCR GPS monitoring program of HRSOs. Specifically, the goals of this study are to
• Assess the fidelity of the program. • Assess the cost of the GPS program. • Assess the effectiveness of the GPS program in reducing the criminal behavior of HRSO parolees.
Objectives To meet these goals, this project has set several highly specific objectives to measure the success of each goal. The specific objectives of the project organized by goal are as follows: 1. Assess the Fidelity of the GPS Program.
• Determine the program adherence to all core components (i.e., program staffing qualifications, caseload restrictions, HRSO parolee screening, parolee enrollment and orientation specifications, and parole supervision specifications).
• Determine the degree to which the prescribed level of program exposure was obtained.
• Determine the quality of program delivery (e.g., skill of the staff in using the techniques or
methods prescribed by the program, and preparedness or attitude of staff toward the program).
• Determine the degree to which program components were reliably differentiated from one another.
2. Assess the Cost of the Program.
• Determine the cost of monitoring HRSOs with the GPS system. • Determine the cost of monitoring HRSOs without the GPS system.
This document is a research report submitted to the U.S. Department of Justice. This report has not been published by the Department. Opinions or points of view expressed are those of the author(s)
and do not necessarily reflect the official position or policies of the U.S. Department of Justice.

Monitoring High-Risk Sex Offenders With GPS Technology: An Evaluation of the California Supervision Program
1–18
3. Assess the Effectiveness of the GPS Program in Reducing the Criminal Behavior of HRSOs.
• Determine the effect of GPS monitoring on offenders’ subsequent occurrence of noncompliance with parole conditions.
• Determine the effect of GPS monitoring on offenders’ subsequent occurrence of criminal behavior (including a rearrest, reconviction, and return to prison custody).
• Determine the effect of GPS monitoring on offenders’ subsequent time to noncompliance with
parole conditions.
• Determine the effect of GPS monitoring on offenders’ subsequent time to criminal behavior (including a rearrest, reconviction, and return to prison custody).
• Determine whether GPS monitoring is more effective in reducing criminal behavior in certain sex
offender subgroups (i.e., rapists and child molesters).
• Determine whether GPS monitoring is more effective in reducing criminal behavior of risk behavior subgroups (i.e., high risk or moderate–high).
This document is a research report submitted to the U.S. Department of Justice. This report has not been published by the Department. Opinions or points of view expressed are those of the author(s)
and do not necessarily reflect the official position or policies of the U.S. Department of Justice.

Monitoring High-Risk Sex Offenders With GPS Technology: An Evaluation of the California Supervision Program
2–1
2. Methodology A. OVERVIEW This study integrates both outcome and process evaluation components. The outcome component assesses the impact of the California Department of Corrections and Rehabilitation (CDCR) GPS supervision program by employing a nonequivalent-group quasi-experimental design with a multilevel survival model. We also use a propensity score matching procedure to account for the differences between the treatment and comparison groups. The study population is drawn from all high-risk sex offenders (HRSOs) [as determined by the STATIC–99 risk assessment instrument] who are released from prison and residing in the state of California. The effectiveness of the program is assessed using an intent-to-treat approach. The outcome of interest is recidivism. Recidivism is assessed in a variety of ways, including 1) violation of parole, 2) rearrest, 3) reconviction, and 4) return to prison custody. Each outcome is assessed with a survival analysis of time-to-event recidivism data, using a Cox proportional hazards model. The outcome component also includes a cost-effectiveness analysis of each outcome. The process component (see chapter 4) uses both quantitative and qualitative methods to provide a rich context to the program treatment and structure and to assess program fidelity (i.e., whether the program was designed well and implemented as intended).
B. PARTICIPANTS California leads the nation in tracking sex offenders by GPS technology, with nearly 7,000 sex offenders equipped with GPS units living in communities throughout the state. In fact, California’s total number of GPS units more than triples the nation’s second-leading state, Florida, which has 1,800 units. The initial sample included more than 18,000 offenders (all sex offenders released from prison from August 1984 through April 2009). This sample was initially narrowed down by eliminating duplicate records (10 records) and subjects who were ineligible. Ineligible subjects included offenders who were 1) non–HRSOs (12,293 subjects), 2) paroled outside the timeframe of the study—from January 2006 through March 2009—(2,429 subjects), and paroled out of state, deported, or outside the purview of CDCR (54 subjects). In addition, offenders who were classified as Sexually Violent Predators (SVPs*) or failed to appear† before the parole agent for the initial parole visit were also removed from the study (33 subjects). The sample was further refined because of financial constraints by excluding parole units with fewer than 30 HRSOs, as it was cost prohibitive to visit all units in the state to collect data. The treatment group was then restricted to parolees whose elapsed time between release from prison and placement onto GPS was fewer than 7 days. The rationale for this restriction was twofold. First, the design of the program is to place parolees on GPS immediately on their release from prison. However, because of the retroactive nature of the program as well as typical program implementation obstacles, numerous offenders were placed on GPS monitoring well after their release from prison. Including these offenders would offer an evaluation of a counterfeit version of the CDCR program. Second, the risk of recidivism is highest during the first year after release (Petersilia 2003; Langan and Levin 2002). Consequently, including offenders who are placed on GPS monitoring after they make a seemingly *SVP is a legal term used to identify persons previously convicted of specified sex offenses against two or more victims, determined to have a diagnosed mental disorder, and evaluated as likely to reoffend if released into the community. A person found to be an SVP is placed under a civil commitment in a state hospital for a term of 2 years and thus not appropriate for the study. †If a parolee does not appear for the initial interview, he cannot be placed on GPS and would systematically be assigned to the control group, thus biasing the control group with noncompliant offenders.
This document is a research report submitted to the U.S. Department of Justice. This report has not been published by the Department. Opinions or points of view expressed are those of the author(s)
and do not necessarily reflect the official position or policies of the U.S. Department of Justice.

Monitoring High-Risk Sex Offenders With GPS Technology: An Evaluation of the California Supervision Program
2–2
successful adjustment to living in the community in the study as treatment group subjects would introduce bias in favor of the GPS group. Given that the comprehensive nature of the GPS program dictated that all HRSO offenders would eventually be placed on GPS, the control group included all HRSO offenders who were not placed on GPS monitoring during the study period.* As a result of these exclusions and restrictions, this transitional sample consisted of 747 subjects. Propensity Score Adjustment To identify comparison individuals likely to have pretreatment risk characteristics similar to those in the treatment group, a propensity score procedure was performed using the transitional sample to match the HRSOs who were placed on GPS monitoring technology (i.e., the treatment group) to a similar group of HRSOs who were not placed on the GPS system during the study period (i.e., the control group). The matching procedure, using the STATA program PSMATCH2 (Leuven and Sianesi 2003), employed nearest-neighbor matching with a caliper. To eliminate selection bias in the sample while retaining the largest number of possible cases for analysis, various calipers were experimented with. The propensity score was generated using logistic regression, including numerous ‘matching variables.’ The variables used were gender, race, age at parole, risk assessment (Static 99) score, prior time incarcerated, number of prior incarcerations, number of prior arrests, parole district, drug registration requirement, drug testing requirement, alcohol testing requirement, violent offender registration requirement, type of controlling offense, new admission parole status, number of prior sex offenses, and number of prior violent offenses. A propensity score was generated for each parolee. The PSMATCH2 program for STATA matched control and treatment group parolees to unique nearest neighbors whose propensity score was within a certain caliper. Because parolees’ were assigned a single match, the data were sorted randomly before the procedure was run. Parolees who could not be matched were dropped. The sample before matching included 747 parolees: 427 potential treatment parolees and 320 potential control parolees. Independent samples t–tests run for differences between control and treatment group showed significant differences in several variables used in the matching process: number of Hispanic parolees, age at parole, prior time incarcerated, prior number of incarcerations, requirement to sign on the violent offender register, and the number of parolees in several districts. The treatment group was significantly less Hispanic, older when released on parole, previously incarcerated for a longer length of time, had fewer previous incarcerations, and was more likely to be required to sign on the violent offender register. The propensity score matching procedure successfully matched 518 parolees (259 treatment and 259 control parolees), using nearest-neighbor matching with a caliper. The resulting sample showed no significant differences between the groups on any of the matching variables (including all parole districts), indicating a successful mitigation/elimination of bias in the sample. A total of 229 parolees—168 treatment and 61 control subjects—were not matched. Independent samples t–tests were run to
*It could be argued that including an offender who is eventually placed on GPS monitoring as a control subject introduces bias in favor of the control group, since such an offender would most likely demonstrate less inclination than other offenders toward criminal behavior. While this may be true to an extent, it translates into a more conservative approach—making it more difficult to find positive effects for the treatment group.
This document is a research report submitted to the U.S. Department of Justice. This report has not been published by the Department. Opinions or points of view expressed are those of the author(s)
and do not necessarily reflect the official position or policies of the U.S. Department of Justice.

Monitoring High-Risk Sex Offenders With GPS Technology: An Evaluation of the California Supervision Program
2–3
investigate the differences between the matched sample and the parolees who were not selected in the matching process. The matched sample had significantly fewer American Indian, Filipino, and ‘other’ parolees. It had more prior incarceration events and fewer parolees requiring violent offender registration. Its subjects were less likely to be new admissions to the parole system and more likely to be parole violators with a new term, and were more likely to have a controlling property offense than subjects in the unmatched group. There were also significant differences between the matched and unmatched group in some parole districts. The final sample included 516 subjects* equally divided between the treatment and control groups.
C. DATA SOURCES We used six primary sources to collect data: 1) the CDCR data management system, 2) official arrest records, 3) parole supervision records, 4) GPS monitoring data, 5) a CDCR parole agent survey, and 6) CDCR cost information. CDCR Data Management System California operates a data management system that houses numerous databases relevant to the supervision of HRSO parolees. These databases include, but are not limited to, the Automated Release Date Tracking System, Correctional Offender Management Profiling for Alternative Sanctions (known as COMPAS), Cal–Parole, the Parole Law Enforcement Automated Data System, the Revocation Scheduling Tracking System (RSTS), the Offender-Based Information System (OBIS), Distributed Data Processing Systems, and the California Law Enforcement Telecommunications System. Most data used for this study were derived from three databases: Cal–Parole, RSTS, and OBIS. The Cal–Parole tracking system stores a variety of information on offenders released from prison and placed on parole, including birth date, gender, race, residency information, the date the parolee was released from prison, the date the parolee is scheduled to be discharged from parole, any special conditions linked to parole, and the unit and agent to which the parolee is assigned. RSTS stores a vast array of data regarding parole revocations, including information on the date and type of parole violation and the result of the parole revocation hearing. OBIS maintains a rich database of information concerning prior criminal history (date of arrest, arrest charges, disposition date, disposition charges, disposition, and length of sentence) of all adult offenders in California. A central feature of the California system is that offenders are linked across all three of these systems through a unique identifier that permits users to identify the same individual in different contexts or data systems. Official Arrest Records Another principal data source for this study was the official record of arrests, convictions, and custody (commonly known as a RAP sheet) of each study subject. Official records are frequently used in research on recidivism. However, there are many methodological issues involved in assembling and interpreting the data from RAP sheets. These sources of error in the use of RAP sheets include, but are not limited to, linking dispositions to arrests, false-negative errors in arrest records, definitional problems in interpreting RAP sheets, handling events with multiple charges, and dealing with technical violations. To minimize
*The initial matching procedure resulted in a sample of 518 subjects. Subsequent analyses revealed that one subject was released from a juvenile placement into an adult placement and thus not immediately released into the community. This subject and his matched partner were removed from the study, reducing the sample to 516. Subsequent analyses (not shown) revealed no significant differences between the groups.
This document is a research report submitted to the U.S. Department of Justice. This report has not been published by the Department. Opinions or points of view expressed are those of the author(s)
and do not necessarily reflect the official position or policies of the U.S. Department of Justice.

Monitoring High-Risk Sex Offenders With GPS Technology: An Evaluation of the California Supervision Program
2–4
these errors the researchers in this study worked closely with CDCR staff to correctly interpret the RAP sheets. All records were manually entered into a database specifically developed for this study. Parole Supervision Records Each parole agent maintains a record of supervision for each parolee under his supervision. Specifically, the parole agent notes the date and the specific type of contact. A contact may be categorized as follows: a) initial interview, b) office, c) residence, or d) collateral contact. The record of supervision (ROS) is stored only in hardcopy format in the parolee case file, which typically is located in the parole unit of record. Consequently, a set of site visits was conducted to obtain the record of supervision data from the parole agent case files. Again, all data were keyed directly into a database specifically developed for this study. These data were collected to measure the level of supervision received by each offender and to assess the California GPS program model. GPS Monitoring Data The GPS monitoring data were used to categorize the subjects in groups as well as for descriptive purposes and to assess the California GPS program model. The GPS monitoring system into which HRSO parolees are enrolled is operated by two vendors: Satellite Tracking of People (STOP) LLC and Pro Tech. STOP is used in the southern portion of California (Regions 3 and 4*), and Pro Tech is responsible for the northern areas (Regions 1 and 2). While the terminology of the venders differs, the capabilities of hardware and software are virtually identical. As described in chapter 1, each vender employs an active monitoring system that combines cellular and GPS technology to automatically track the location of a parolee. Each vendor provided the following data: a profile of the offender; a record of each event (inclusion/exclusion zone, strap tamper, low battery, cell communication gap, and no GPS communication) that includes the event start and stop times and duration during a specified period; and the assignment history of the device. CDCR Parole Agent Survey A survey instrument was developed to collect process data from CDCR parole agents (see attachment C). The final version contained questions in eight areas:
1. Overview of the GPS system 2. Reduction of caseload size 3. Screening of HRSO parolees 4. Enrollment and orientation 5. Integration of GPS monitoring into the intensive supervision regime 6. Synthesis of parole GPS and law enforcement data 7. Program staffing 8. General summary
The instrument was emailed to all parole agents in fall 2008. The parole agents were sent numerous requests to complete the survey during the next few months. They were also asked to fill out the survey during training and other events hosted by CDCR. The survey was closed at the end of November 2008.
*CDCR is organizationally and operationally divided up into four distinct regions, with numerous districts within each region and numerous parole units within each district. Region 1 consists of the Central Valley, ranging from Bakersfield to the Oregon border, while Region 2 encompasses the coastal counties from Ventura to the Oregon border. Region 3 includes Los Angeles County alone, and Region 4 consists of the southern counties of Imperial, Orange, Riverside, San Diego, and San Bernardino.
This document is a research report submitted to the U.S. Department of Justice. This report has not been published by the Department. Opinions or points of view expressed are those of the author(s)
and do not necessarily reflect the official position or policies of the U.S. Department of Justice.

Monitoring High-Risk Sex Offenders With GPS Technology: An Evaluation of the California Supervision Program
2–5
The survey received 747 responses from a population of roughly 1,000 parole agents (including supervisors with no caseloads and assistant supervisors with limited caseloads). A subsequent review of the responses indicated that 120 of the 747 responses (16 percent) contained no data,* resulting in 627 survey responses. The main sections of the survey deal specifically with GPS parole agents and their experiences with using the system in the supervision of sex offenders, so it was important to obtain responses from GPS parole agents with HRSO caseloads. Consequently, supervisors (125 surveys), agents without GPS caseloads (315 surveys), and agents without HRSO caseloads (24 surveys) were removed from the sample. Finally, 10 duplicate surveys were removed, resulting in 153 unique surveys from GPS agents with HRSO caseloads. Currently, there are roughly 230 level-1 GPS parole agents with existing sex offender caseloads, yielding an acceptable response rate for GPS parole agents of 67 percent. In addition, the preliminary analysis of the survey data suggested that the responses were distributed relatively equally across the state, with Region 1 representing 36 percent of respondents, Region 2 representing 23 percent of the respondents, Region 3 representing 16 percent of the respondents, and Region 4 representing 27 percent of the respondents.† (Notably, Region 3 [Los Angeles County] is the smallest geographic unit). The distribution across districts is comprehensive, with at least two responses (most have many more) from each of the 25 districts. Cost Information The cost information elements used in the analysis are grouped into four broad categories: 1) personnel (all fulltime and parttime staff and consultants), 2) facilities (i.e., the physical space required for the program), 3) equipment and materials (furnishings, instructional equipment, etc.), and 4) other inputs (all other costs that do not fit the other categories). This information was obtained through communications with CDCR staff and from a review of budget documents. A cost-effectiveness analysis worksheet was developed that divided all cost elements into one of the four broad categories. This worksheet was transmitted to CDCR by electronic communication, along with a request to add the monetary values to each category as well as explicit instructions to add any cost element that was missing from the initial draft. Follow-up discussions by electronic communication were used to refine the cost elements and associated monetary values. The State of California Legislative Analyst’s Office analysis of the 2007–08 budget bill (LAO 2007) was used to estimate cost elements that were not readily available by CDCR staff. For verification and to correct each of the cost elements, a final version of the worksheet was transmitted to a CDCR budget analyst.
D. MEASURES The two main outcomes of interest were compliance and recidivism. Compliance was measured through violations of parole. Recidivism was assessed in a variety of ways, including 1) rearrest, 2) reconviction, and 3) return to prison custody. The outcome of interest was recidivism. Each outcome was measured in terms of time to the first event. Outcomes Studies of reoffending typically use one or more of four measures to assess reoffending: 1) violation of parole, 2) rearrest, 3) reconviction, and 4) return to prison custody. These measures are indicators of the occurrence of offending behavior. Each of these measures has strengths and weaknesses. Violations of *One respondent logged into the survey but recorded no responses. †These totals exceed 100 percent because of rounding.
This document is a research report submitted to the U.S. Department of Justice. This report has not been published by the Department. Opinions or points of view expressed are those of the author(s)
and do not necessarily reflect the official position or policies of the U.S. Department of Justice.

Monitoring High-Risk Sex Offenders With GPS Technology: An Evaluation of the California Supervision Program
2–6
parole may or may not constitute a new crime, because offenders may commit acts that violate only the technical aspects of parole (i.e., missing an appointment with a parole agent). Arrests are the most popular and convenient measure of crime available, but an arrest does not imply that a new offense actually occurred—as occasionally the charges against an offender are dropped and the offender is released without further incident. Convictions indicate that a new offense did occur, but may not always reflect the seriousness of the offense since prosecutors may prefer a plea bargain to trying the case on its merits. Finally, a return to custody is the narrowest measure of recidivism, as it accounts for only the most serious crimes that result in a prison term. This report uses all four measures to assess the GPS monitoring of HRSOs. Rearrest and reconviction were measured using data obtained from official records (RAP sheets). Parole violations and returns to custody were measured using data obtained from the CDCR Data Management System. Each outcome was measured in terms of time to the first event. Each subject was tracked for 1 year subsequent to the initial parole date. Independent and Control Variables The main variable of interest is the use of GPS monitoring (i.e., GPS status). Group differences between GPS and control condition subjects were minimized on a range of pretreatment characteristics, including both sociodemographic and criminal history measures through the use of the aforementioned propensity score adjustment procedure. However, subsequent analyses of the supervision-level data revealed statistically significant differences between the groups in terms of parole agent supervision. In addition, caseload size was deemed to be a potentially important second-level variable, as it can influence the level of supervision. Thus these two control variables were added to the model. GPS STATUS. The main variable of interest is the use of GPS monitoring (i.e., GPS status). GPS status is measured dichotomously, by noting group membership (0=control group; 1=GPS group). The GPS group includes HRSOs who received traditional parole supervision plus placement on GPS monitoring technology, while the control group includes HRSOs who received only traditional parole supervision during the study period (though offenders may have been placed on the GPS monitoring system after the study period). It should be noted that while this approach makes group comparisons straightforward, the real-world application did not result in an uninterrupted duration of GPS supervision. The actual GPS tracking data revealed that offenders were placed on and removed from GPS supervision frequently during the course of the yearlong study period. The vast majority of these gaps in supervision were the result of replacing GPS consumable equipment such as the strap or receiver. These equipment exchanges resulted in infinitesimal gaps in service, as the swap was completed within minutes in the presence of the GPS agent but nonetheless tracked by the software. Another major source of breach in service was caused by an arrest or other event that resulted in the offender being placed into custody, as the GPS receiver unit is removed during any custody event and then replaced upon release. These gaps typically lasted several days, generally from the arrest date to the custody date. There were, however, some instances when the removal of the GPS receiver could not be corroborated with any known custody event.* Consequently, this study takes an intent-to-treat (ITT) approach where all offenders who begin the study under supervision with GPS technology are considered to be part of the GPS group, regardless of whether the
*This study tracks only custody events that are under the supervision of CDCR. Episodes in a local jail do not fall under the purview of the CDCR and thus are not accounted for in the analysis.
This document is a research report submitted to the U.S. Department of Justice. This report has not been published by the Department. Opinions or points of view expressed are those of the author(s)
and do not necessarily reflect the official position or policies of the U.S. Department of Justice.
Monitoring High-Risk Sex Offenders With GPS Technology: An Evaluation of the California Supervision Program
2–7
parolee finishes the study period still under GPS supervision. In general, this ITT approach is a more conservative estimate of the treatment effect, for a subject may be arrested while removed from GPS but still assigned to the GPS group. LEVEL OF SUPERVISION. Parolees are released into the community under highly specific conditions of parole, which often include things such as obeying the law, refraining from drug and alcohol use, avoiding contact with the parolee’s victims, obtaining employment, and maintaining required contacts with a parole agent. To optimize the level of supervision for a population of HRSOs, CDCR standardized the minimum number of specific contact types to which parole agents are required to adhere (see chapter 5 for more details on adherence). Specifically, each parole agent is required to
• Meet face to face with the parolee within a specific number* of days after release. • Meet at the parolee’s residence within a specific number* of days after release. • Meet face to face with each parolee a specific number* of days each month. • Meet face to face at the offender’s residence a specific number* of times each quarter. • Establish a specific number* of collateral contacts per month.
A face-to-face contact is any visit or contact in which the parole agent meets directly with the parolee. As such, the initial interview, office visits, and residence visits are all considered face-to-face contacts. Collateral contacts are any contacts in which the parole agent checks up on the parolee indirectly through family, friends, associates, and neighbors. In addition, case reviews are conducted by parole unit supervisors to ensure that parole agents are adhering to the guidelines set forth. The level of supervision is an important variable, as it relates to recidivism because in theory offenders who are monitored more closely in the community are less likely to engage in illegal behavior. In practice, this may not always be the case. A recent study by the Urban Institute found that parole supervision has little effect on rearrest rates of released prisoners. Specifically, the study found that mandatory parolees fared no better on supervision than similar prisoners released without supervision. In fact, in some cases they fared worse (Solomon, Kachnowski, and Bhati 2005). Nevertheless, given the theoretical importance of parole agent contacts with parolees, we include the level of supervision as a control variable. The level of supervision is derived from the number of face-to-face and collateral contacts reported by the parole agent during the study period. We first transformed the prescribed number of contacts specified in the CDCR policy manual into a rate of prescribed contacts per day. Next we summed the number of contacts for each contact category and divided it by the number of days the offender was living in the community (i.e., not in custody), to create an actual rate of contacts per day. Then we divided the actual rate by the prescribed rate to obtain the percentage of prescribed supervision for each offender. Finally, to capture the influence of each type of contact and yet avoid the issue of multicollinearity, we used the mean of each supervision measure (face to face, collateral, and residency) to create an overall measure of supervision level. CASELOAD. The caseloads of parole agents are often compared with the size of the classroom for teachers. Caseloads must be of a size that provides agents with enough time to devote to each offender to achieve all objectives of supervision. Teachers with overly large classes can do little more than just
*The exact number is known to the researchers. However, at the request of CDCR and to preserve the integrity of the parole program, this figure is omitted from the final report.
This document is a research report submitted to the U.S. Department of Justice. This report has not been published by the Department. Opinions or points of view expressed are those of the author(s)
and do not necessarily reflect the official position or policies of the U.S. Department of Justice.

Monitoring High-Risk Sex Offenders With GPS Technology: An Evaluation of the California Supervision Program
2–8
maintain order and send misbehaving students to the principal’s office. Similarly, parole agents with overly large caseloads can do little more than monitor the offenders and return the noncompliant offenders to custody (Burrell 2006). Consequently, the yearly mean caseload size of each parole district was included in the model as a control variable. This measure was obtained from monthly caseload reports. Each monthly report includes the total number of specialized cases and the total number of specialized agents available during the month. Two reports for each year of the study period (2006, 2007, and 2008) were used to calculate a yearly average where for each year the summed number of cases was divided by the summed number of agents.* SEX OFFENDER TREATMENT. All sex offenders in California are required to attend sex offender treatment. It is reasonable to assume that offenders who regularly attend treatment outside of prison may be less inclined to recidivate. In fact, current research demonstrates that sex offender treatment in the community may in fact lower the risk of recidivism (Gallagher et al. 1999; Hanson et al. 2002; MacKenzie 2000). The total number of treatment hours and appointments attended were calculated for each offender during the follow-up period. Then the number of treatment hours was divided by the number of days in the community to obtain the average number of treatment hours per day in the community to account for the differing lengths on parole. Roughly 100 subjects had no record of attending treatment during the follow-up period. These offenders were coded as attending 0 treatment sessions with 0 hours of treatment. OFFENDER TYPE. It is possible that the GPS supervision program is more effective with some types of offenders than with others. While sex offenders are a heterogeneous population, there are some ways in which researchers and practitioners attempt to identify similar groups and subgroups. Perhaps the most common way (see Groth 1979) is to catalog sex offenders into two groups:† rapists and child sex abusers. This categorization was designed to cluster sex offenders on the basis of their primary sexual interests. Rapists are focused on the sexual abuse of adults, while child abusers target children. In practice, however, offenders do not necessarily fall cleanly into any one category. Rather, it may be more accurate to interpret the typology as a continuum, with these categories representing the anchors of the continuum (Center for Sex Offender Management N.d.). Giving credence to these noteworthy limitations of categorization, it is still intriguing to examine the differentiation by offender type. To categorize each offender we began by taking each sex charge and classified it as a rape charge, a child abuse charge, or other (prostitution, indecent exposure, sex registry, possession of pornographic material, etc.) charge. Next we pooled all previous sex charges for each offender and summed the severity scores of each charge type (rape, child abuse, other). For example, if a subject had two rape charges and two child abuse charges, the severity scores for the two rape and two child abuse charges were summed separately to produce a rape score and a child abuse score. A subject was identified as a rapist if the rape score was greater than the child abuse score, and vice versa. A subject with a greater other score was identified neither as a rapist nor as a child abuser, but categorized as other.
*CDCR was in the midst of implementing the GPS monitoring program during this period, which resulted in the reorganization of many parole units. Consequently, in some months there were no specialized agents assigned to a district despite the existence of specialized cases. For statistical purposes, the number of specialized agents was set to 0.5 in any district that had at least one specialized case but no assigned agents. †The Groth typology further subdivides rapists (anger, power, and sadist rapists) and child abusers (fixated and regressed).
This document is a research report submitted to the U.S. Department of Justice. This report has not been published by the Department. Opinions or points of view expressed are those of the author(s)
and do not necessarily reflect the official position or policies of the U.S. Department of Justice.
Monitoring High-Risk Sex Offenders With GPS Technology: An Evaluation of the California Supervision Program
2–9
OTHER MEASURES. Numerous subjects moved across parole districts during the study period. Consequently, a dichotomous measure was introduced to control for this movement.
E. STATISTICAL OVERVIEW Missing Data No baseline item included in the propensity score matching procedure contained missing data. The demographic information described in the matching procedure was collected for all subjects. In addition, while the official records did not contain out-of-state and juvenile criminal histories, these events were corroborated in other CDCR data sources. Thus all subjects were confirmed to have been arrested, convicted, and placed in prison at least one previous time. For matching purposes, each offender who for some reason had no previous arrest, conviction, or custody event in the official record (despite confirmation of a prison record) was recoded as having a single previous event. In addition, despite prescribed protocol claims to the contrary, analyses subsequent to the matching procedure suggested that the two groups differed significantly on the level of supervision. While every effort was made to locate and code the ROS file for each subject in the study to control for supervision, roughly 25 percent of the sample were missing ROS records. The reasons for these missing data varied, but the majority were no longer available because parole administrators either purged the data from the file after a return-to-custody event or completely destroyed the entire file shortly after discharge. Consequently, we performed a multiple imputation procedure using STATA’s Imputation by Chained Equations (or ICE) command to assign supervision level values for the missing observations. Data imputation uses existing information on other variables to construct a regression equation and make an educated guess for the value of the missing variable (Allison 2002). In this case, we imputed the level of parole supervision (described in more detail above). Specifically, for each record with missing supervision-level data we modeled the expected value of the variable as a function of demographic characteristics, criminal history, prior imprisonment, parole district, and parole requirements and used the observed data to fit the model. Following the suggestions of Graham, Olchowski, and Gilreath (2007), we conducted 20 imputations to account for the amount of missing data in our sample. That is, instead of simply running the equation once and imputing a single value, we ran the equation 20 times and generated 20 possible values. With the imputed data, we were able to conduct the remaining analyses as if there were no missing data (Allison 2002). This was done by specifying that the data have multiple imputations with the mi command in STATA allowing the software to preserve the sample size while pooling estimations of the supervision variable. Treatment Outcome Analyses A series of analyses were performed in sequential phases to assess the impact of the CDCR GPS supervision program. The first phase of analyses explores the differences (or lack thereof) between groups on numerous pretreatment characteristics as well as outcomes at baseline. Independent samples t–tests were used to test for significance between the groups. The second phase assesses the impact of the GPS program on each measure of recidivism and takes into account factors other than the GPS program (e.g., the level of supervision) that may affect the outcome variables. Here we used logistic regression to predict whether the subject was violated, arrested, reconvicted, or returned to custody and a Cox proportional hazards model to predict time until each event. Both models have become the standards for analyzing recidivism data (Allison 1984; Baumer 1997; Schmidt and Witte 1988). The latter technique—known as survival or event history
This document is a research report submitted to the U.S. Department of Justice. This report has not been published by the Department. Opinions or points of view expressed are those of the author(s)
and do not necessarily reflect the official position or policies of the U.S. Department of Justice.

Monitoring High-Risk Sex Offenders With GPS Technology: An Evaluation of the California Supervision Program
2–10
analysis—is particularly useful for arrest and other types of data where offenders cannot be followed indefinitely (Gainey, Payne, and O’Toole 2000). Basically, because the subjects cannot be followed indefinitely, the subjects who have not been rearrested or reconvicted are technically still at risk of failure. Because they have not failed yet, however, there is no “time until rearrest.” Rather than excluding these cases where an event does not take place, survival analysis provides an effective method for maximizing the available data. Moreover, the bias associated with right-censoring (i.e., when the event does not take place within the follow-up period) is taken into account and adjusted. (For more information on these techniques, see Allison 1984 and Allison 1995.) Survival analysis has gained widespread popularity and support. The Cox regression model is perhaps the most popular technique because it is conducive to both discrete and continuous independent variables and is statistically robust (Allison 1995). Indeed, Allison (1995) has suggested that if there were only one survival model he would choose the Cox regression model. However, researchers are encouraged to test the assumptions of the model. We did this in two ways. First, for discrete variables such as group status, we graphically examined the proportional hazards for the two groups. Visual inspections of these curves supported the use of the Cox regressions. For continuous independent variables (i.e., level of supervision) we divided the variables into thirds and again inspected the hazard curves visually. In addition, we created interaction terms with time to assess whether the effect of the variable changed over time (see Allison 1995). In all, the proportional hazard assumption was met. However, since each parolee is monitored by agents who operate within an explicit parole district, the data in this study are clustered. In other words, each parolee is clustered or nested within a parole district. In clustered data, it is usually important to allow for dependence or correlations among the responses observed for units belonging to the same cluster (Rabe–Hesketh and Skrondal 2008). For example, in the present application, it is possible that the recidivism outcomes of parolees from the same parole district are correlated because the parolees have been supervised within the political and regulatory environment of the same district. To account for the data clustering, random-effects models (also called multilevel, hierarchical linear, or mixed models) provide a useful approach for simultaneously estimating the parameters of the regression model and the variance components that account for the data clustering. For continuous-time survival data that are clustered (as in this study), frailty models offer a practical solution. A frailty model is a random-effects model, where the frailty, an unobserved cluster-specific univariate component, has a multiplicative effect on its hazard function. The frailty approach provides a means to examine the heterogeneity among subjects and to estimate the distribution of subsequent failure time with the use of failure times and covariate information from other members in the cluster. For these reasons, frailty models have been widely used for the analysis of clustered survival data (Hougaard 1995; Duchateau and Jansen 2008). Among frailty models, Cox’s proportional hazards model, with a gamma frailty, is the most popular (Klein 1992; Parner 1998; Wienke 2010). This model assumes that, conditional on the value of the unobserved frailty, the failure times follow the usual proportional hazards model. Discussions on the use of this model can be found in Hougaard (2000), Therneau and Grambsch (2000), and Wienke (2010). In the present application, we specify a Cox model using the stcox command in STATA with a shared frailty option. Observations of the district measure with equal value are assumed to have shared (the same) frailty. Across groups, the frailties are assumed to be gamma-distributed latent random effects that affect the hazard multiplicatively, or equivalently, thus the logarithm of the frailty enters the linear predictor as a random offset.
This document is a research report submitted to the U.S. Department of Justice. This report has not been published by the Department. Opinions or points of view expressed are those of the author(s)
and do not necessarily reflect the official position or policies of the U.S. Department of Justice.

Monitoring High-Risk Sex Offenders With GPS Technology: An Evaluation of the California Supervision Program
2–11
The third phase takes into account the possibility of interactions. Specifically, we use the same baseline model described above but introduce interaction terms to assess whether the GPS program works better with an explicit type of offender or risk group. Specifically, we assess whether GPS monitoring is more effective in reducing subsequent criminal behavior of offenders who exhibit the criminal behavior characteristics of a rapist or child molester and offenders with a lower or higher risk of recidivism. The next chapter examines the results of these analyses.
This document is a research report submitted to the U.S. Department of Justice. This report has not been published by the Department. Opinions or points of view expressed are those of the author(s)
and do not necessarily reflect the official position or policies of the U.S. Department of Justice.

This document is a research report submitted to the U.S. Department of Justice. This report has not been published by the Department. Opinions or points of view expressed are those of the author(s)
and do not necessarily reflect the official position or policies of the U.S. Department of Justice.

Monitoring High-Risk Sex Offenders With GPS Technology: An Evaluation of the California Supervision Program
3–1
3. Results
A. BASELINE CHARACTERISTICS Several of the demographic and baseline characteristics of the sample are displayed in table 3.1. In addition, the groups were compared on parole district to account for the geographic diversity of the state of California. There was no significant difference between the groups on any baseline measure.
Table 3.1. Comparison of Baseline Characteristics: GPS and Control Groups
MEASURE CONTROL GROUP GPS GROUP T–VALUE Sex
Male 99% 99% .000
Female 1% 1% .000
Race
African American 32% 31% .285
Hispanic 24% 21% .951
White 41% 47% –1.33
Other 4% 2% .583
Age at Parole
Age 40.89 yrs 42.40 yrs –1.53
Controlling Offense
Sex 67% 66% .186
Violent 7% 8% –.166
Drugs 9% 9% –.153
Property 13% 13% .131
Other 4% 4% –.222
Registrations
Narcotics Register 12% 14% –.780
Drug Testing 83% 79% 1.01
Alcohol Testing 52% 49% .791
Violent Offender Register 28% 32% –.958
Arrest
Any Arrests 18.36 17.36 .709
Sex Arrests 3.75 3.51 .927
Violent Arrests 2.86 2.86 .011
Prior Custodya
Days in Prison 2,321.17 2,649.14 –1.826
Years in Prison 6.36 7.26 –1.826
Custody Events 5.36 4.89 1.478
Risk
Static–99b 4.03 4.17 –.848
Offender Status
New Admit 71% 69% .383
Other 29% 31% .383 Note: Sample size: GPS group=258; control group=258. aCustody includes only prison (i.e., jail events are excluded). bFemale sex offenders are not assessed with the Static–99, reducing the sample to 512 subjects.
This document is a research report submitted to the U.S. Department of Justice. This report has not been published by the Department. Opinions or points of view expressed are those of the author(s)
and do not necessarily reflect the official position or policies of the U.S. Department of Justice.

Monitoring High-Risk Sex Offenders With GPS Technology: An Evaluation of the California Supervision Program
3–2
Gender, Race, and Age Overall, the sample was 99 percent male and consisted more of white offenders (44 percent) than any other race but also included substantial proportions of African American (31 percent) and Hispanic (22 percent) offenders. The mean age of the full sample was 42 years at the time of parole (see table 3.2). There were no statistically significant differences between the groups on any of these characteristics. Controlling Offense and Registrations The majority of the sample had a sexual controlling offense (66 percent), while 13 percent had a property controlling offense, 9 percent had a drug controlling offense, and only 8 percent had a violent controlling offense. The most frequent condition of parole was drug testing, which was a condition for 81 percent of the sample, with 51 percent having to submit to alcohol testing and 30 percent being required to register as violent offenders. Thirteen percent of the sample were required to sign on to the narcotics registry. There were no statistically significant differences between the groups on any of these characteristics. Prior Custody Table 3.3 shows that, overall, 42 percent of the sample had been in prison from 2 to 5 times before our study period, with 28.3 percent incarcerated from 5 to 10 times previously. Only 12.4 percent of the parolees were incarcerated only once, while 7.6 percent of the sample had more than 15 previous prison events. Overall, our sample was on average incarcerated 5.25 times previously. The sample was on average incarcerated for 2,485.2 days before being paroled into our study. There were no statistically significant differences between the groups on any of these characteristics.
Table 3.2. Comparison of Age at Parole: GPS and Control Groups
MEASURE CONTROL GROUP GPS GROUP
Age
<25 8.9% 7.4%
25–40 35.7% 31.0%
40–50 39.5% 36.0%
50–60 10.1% 20.9%
60+ 5.8% 4.7%
Notes: Sample size: GPS group=258; control group=258. No significant differences.
Table 3.3. Comparison of Prior Prison Events: GPS and Control Groups
MEASURE CONTROL GROUP GPS GROUP
Prison Events
1 13.2% 11.6%
2–5 39.1% 45.3%
5–10 27.5% 29.1%
10–15 10.9% 8.1%
15+ 9.3% 5.8%
Notes: Sample size: GPS group=258; control group=258. Custody includes only prison (i.e., jail events are excluded). No significant differences.
This document is a research report submitted to the U.S. Department of Justice. This report has not been published by the Department. Opinions or points of view expressed are those of the author(s)
and do not necessarily reflect the official position or policies of the U.S. Department of Justice.
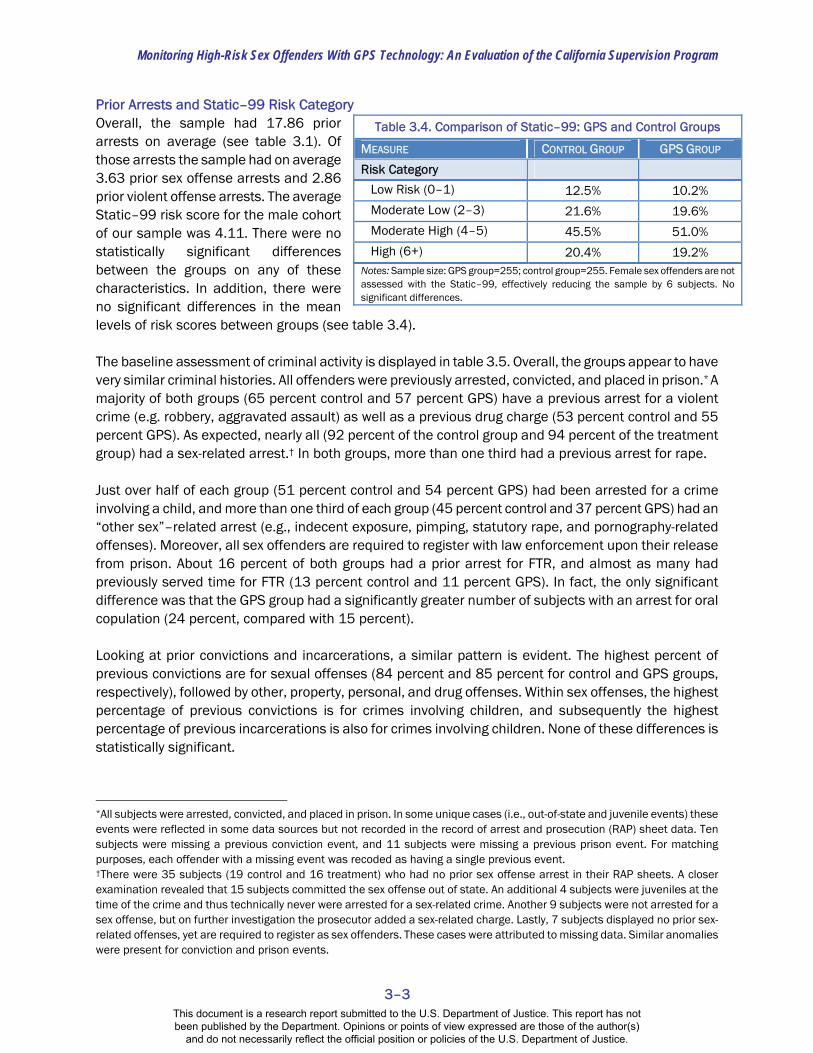
Monitoring High-Risk Sex Offenders With GPS Technology: An Evaluation of the California Supervision Program
3–3
Prior Arrests and Static–99 Risk Category Overall, the sample had 17.86 prior arrests on average (see table 3.1). Of those arrests the sample had on average 3.63 prior sex offense arrests and 2.86 prior violent offense arrests. The average Static–99 risk score for the male cohort of our sample was 4.11. There were no statistically significant differences between the groups on any of these characteristics. In addition, there were no significant differences in the mean levels of risk scores between groups (see table 3.4). The baseline assessment of criminal activity is displayed in table 3.5. Overall, the groups appear to have very similar criminal histories. All offenders were previously arrested, convicted, and placed in prison.* A majority of both groups (65 percent control and 57 percent GPS) have a previous arrest for a violent crime (e.g. robbery, aggravated assault) as well as a previous drug charge (53 percent control and 55 percent GPS). As expected, nearly all (92 percent of the control group and 94 percent of the treatment group) had a sex-related arrest.† In both groups, more than one third had a previous arrest for rape. Just over half of each group (51 percent control and 54 percent GPS) had been arrested for a crime involving a child, and more than one third of each group (45 percent control and 37 percent GPS) had an “other sex”–related arrest (e.g., indecent exposure, pimping, statutory rape, and pornography-related offenses). Moreover, all sex offenders are required to register with law enforcement upon their release from prison. About 16 percent of both groups had a prior arrest for FTR, and almost as many had previously served time for FTR (13 percent control and 11 percent GPS). In fact, the only significant difference was that the GPS group had a significantly greater number of subjects with an arrest for oral copulation (24 percent, compared with 15 percent). Looking at prior convictions and incarcerations, a similar pattern is evident. The highest percent of previous convictions are for sexual offenses (84 percent and 85 percent for control and GPS groups, respectively), followed by other, property, personal, and drug offenses. Within sex offenses, the highest percentage of previous convictions is for crimes involving children, and subsequently the highest percentage of previous incarcerations is also for crimes involving children. None of these differences is statistically significant.
*All subjects were arrested, convicted, and placed in prison. In some unique cases (i.e., out-of-state and juvenile events) these events were reflected in some data sources but not recorded in the record of arrest and prosecution (RAP) sheet data. Ten subjects were missing a previous conviction event, and 11 subjects were missing a previous prison event. For matching purposes, each offender with a missing event was recoded as having a single previous event. †There were 35 subjects (19 control and 16 treatment) who had no prior sex offense arrest in their RAP sheets. A closer examination revealed that 15 subjects committed the sex offense out of state. An additional 4 subjects were juveniles at the time of the crime and thus technically never were arrested for a sex-related crime. Another 9 subjects were not arrested for a sex offense, but on further investigation the prosecutor added a sex-related charge. Lastly, 7 subjects displayed no prior sex-related offenses, yet are required to register as sex offenders. These cases were attributed to missing data. Similar anomalies were present for conviction and prison events.
Table 3.4. Comparison of Static–99: GPS and Control Groups
MEASURE CONTROL GROUP GPS GROUP
Risk Category
Low Risk (0–1) 12.5% 10.2%
Moderate Low (2–3) 21.6% 19.6%
Moderate High (4–5) 45.5% 51.0%
High (6+) 20.4% 19.2% Notes: Sample size: GPS group=255; control group=255. Female sex offenders are not assessed with the Static–99, effectively reducing the sample by 6 subjects. No significant differences.
This document is a research report submitted to the U.S. Department of Justice. This report has not been published by the Department. Opinions or points of view expressed are those of the author(s)
and do not necessarily reflect the official position or policies of the U.S. Department of Justice.

Monitoring High-Risk Sex Offenders With GPS Technology: An Evaluation of the California Supervision Program
3–4
Summary The previous tables provided information on several pretreatment characteristics of the sample. The group comparison of these characteristics indicates that the two groups are very similar. In fact, the only significant difference is that the GPS group had a greater number of subjects with an arrest for oral copulation (24 percent, compared with 15 percent).
Table 3.5. Comparison of Baseline Criminal Activity: GPS and Control Groups
ARREST CONVICTIONS PRISON
OFFENSE CONTROL GPS T–VALUE CONTROL GPS T–VALUE CONTROL GPS T–VALUE
Any 100 100 n/a 100 100 n/a 100 100 n/a
Sexa 91.9 93.8 –0.85 84.1 85.6 –0.49 77.1 82.6 –1.54
Rape 35.7 35.7 0.00 20.2 18.2 0.56 21.3 20.5 0.22
Oral 15.1 23.6 –2.46* 8.5 13.2 –1.70 10.5 16.3 –1.94
Sodomy 8.9 8.1 3.15 1.6 3.9 –1.63 2.7 4.3 –0.96
Penetration 13.5 14.3 –.254 3.4 6.2 –1.43 3.9 7.4 –1.72
Childb 50.8 54.3 –0.79 37.6 42.3 –1.08 34.5 38.4 –0.91
Other sexc 45 36.8 1.88 34.5 31 0.84 19.4 19.8 –0.11
FTRd 15.9 15.5 0.12 11.6 11.6 0.00 12.8 10.9 0.68
Violent 68.6 60.5 1.93 48.8 40.3 1.95 28.9 24.4 1.00
Persons 65.1 57.4 1.81 48.8 40.3 1.95 28.3 24.4 1.00
Property 72.1 65.1 1.71 50.8 46.9 0.88 35.7 32.2 0.84
Drugs 52.7 55 –0.53 39.5 39.2 0.09 20.2 22.9 –0.75
Othere 81.4 77.9 0.98 57.0 55.8 0.27 28.3 26 0.59
Notes: N=516: 258 control, 258 GPS. All measures are dichotomous. aAny offense required under the California penal code that requires the offender to register as a sex offender (e.g., rape, oral copulation, sodomy, sexual penetration). bAny offense where the victim was a child, except for statutory rape—which was classified as “other sex.” cAny sex-related offense not represented by another category (e.g., indecent exposure, unlawful sex). dFailure to register as a sex offender. eAny nonsex offense not represented by another category (e.g., DUI, carrying a firearm). * p < .05. ** p < .01. *** p < .001.
This document is a research report submitted to the U.S. Department of Justice. This report has not been published by the Department. Opinions or points of view expressed are those of the author(s)
and do not necessarily reflect the official position or policies of the U.S. Department of Justice.

Monitoring High-Risk Sex Offenders With GPS Technology: An Evaluation of the California Supervision Program
3–5
B. SUPERVISION Parole Standing Parole is the supervised release of a prisoner before the completion of a prison sentence. The parole status of an offender, however, is not static. It may change over the course of the observation period, and, in turn, the standing in which a parolee is placed may influence the time spent under supervision in the community. For instance, when parolees are released from prison, they are placed on HRSO supervision status; many of these parolees are also placed on GPS supervision status. However, some of these offenders avoid the required contact with parole agents (i.e., abscond) and are suspended from parole. Others may commit a technical or nontechnical violation of parole for which they are revoked and returned to custody for several months. Parolees also could commit an entirely new crime for which they are arrested, tried, and incarcerated for a new prison term. As a result, not all parolees remain in the community under supervision during the 1-year observation period. Table 3.6 examines the average amount of time each group existed within the different parole standings. For instance, street time is defined as any time after the initial release in which the parolee is not in custody. As expected, parolees spend most of their time on the street after a release from prison. Moreover, parolees placed on GPS spend slightly more days on the street than parolees in the control group (265 days, compared with 260), although the difference is not statistically significant. Interestingly, however, an examination of the HRSO supervision status (which excludes absconding time) suggests that parolees who are placed on GPS are significantly more likely to remain under supervision (i.e., not abscond) during the 1-year observation period (259 days, compared with 238). This finding is further confirmed by an examination of the number of days in which a parolee absconds. The data show that offenders under GPS supervision abscond on average 17 fewer days than offenders in the control group (5 days, compared with 22). Parolees placed under GPS supervision also spent less time on average in CDCR custody compared with the parolees in the control group (100 days, compared with 105), but the difference was not statistically significant. Finally, as expected, the GPS parolees spent a significant amount of time (241 days) under GPS supervision, while the control group was not monitored by GPS supervision at all.
Table 3.6. Comparison of Parole Standings: GPS and Control Groups CONTROL GPS
MEASURE MEAN SD MEAN SD T–VALUE
HRSO Parolea 237.83 123.7 259.19 115.7 2.03*
GPS Supervisionb 0 0 241.47 124.1 n/a
Street Timec 259.83 113.4 264.56 111.3 .478
Abscondingd 22.01 61.9 5.36 24.4 –4.02***
CDCR Custodye 105.17 113.4 100.44 11.3 –.478
Note: Sample size: GPS group=259; control group=259. aNumber of days under supervision of a CDCR parole agent (i.e., not in custody and not absconding). bNumber of days on GPS. cNumber of days on the street (i.e., not in CDCR custody). dNumber of days in avoidance of legal authorities. eNumber of days in CDCR custody (excludes time spent in local jail). * p < .05. ** p < .01. *** p < .001.
This document is a research report submitted to the U.S. Department of Justice. This report has not been published by the Department. Opinions or points of view expressed are those of the author(s)
and do not necessarily reflect the official position or policies of the U.S. Department of Justice.

Monitoring High-Risk Sex Offenders With GPS Technology: An Evaluation of the California Supervision Program
3–6
Record of Supervision Parolees are released into the community under very specific conditions of parole, which often include things such as obeying the law, refraining from drug and alcohol use, avoiding contact with the parolee’s victims, obtaining employment, and maintaining required contacts with a parole agent. To optimize the level of supervision for a population of HRSOs, CDCR standardized the minimum number of specific contact types to which parole agents are required to adhere (see chapter 5 for more details on adherence). Specifically, parole agents are required to
• Meet face to face with the parolee within a specific number* of days after release. • Meet at the parolee’s residence within a specific number* of days after release. • Meet face to face with each parolee on a specific number* of days each month. • Meet face to face at the offender’s residence a specific number* of times each quarter. • Establish a specific number* of collateral contacts per month.
A face-to-face contact is any visit or contact in which the parole agent meets directly with the parolee. As such the initial interview, office visits, and residence visits are all considered face-to-face contacts. Collateral contacts are any contacts in which the parole agent checks up on the parolee indirectly through family, friends, associates, and neighbors. In addition, case reviews are conducted by parole unit supervisors to ensure that parole agents are adhering to the guidelines set forth. Table 3.7 provides a comparison of the control and GPS groups in terms of supervision level. For each contact type, the table displays the percent of subjects in each group who had at least one contact and the percent of prescribed contacts (the actual rate divided by the prescribed rate of supervision) for both the offenders who received GPS supervision and those who received traditional parole supervision. While every effort was made to locate and code the record of supervision (ROS) file for each subject in the study, ROS information for 125 subjects was no longer available—as parole administrators either purged the data from the file after a return to custody event or completely destroyed the entire file shortly after discharge.† Nevertheless, for those subjects whose ROS information was obtained, the data demonstrate a significantly greater number of face-to-face, residential, and collateral contacts than the control group
*The exact number is known to the researchers. However, at the request of CDCR and to preserve the integrity of the parole program, this figure is omitted from the final report. †CDCR has amended this policy and currently maintains the parole files of all sex offenders permanently.
Table 3.7. Comparison of Supervision Record: GPS and Control Groups PERCENT CONTACTA CONTACT PER SUPERVISION DAYB
CONTACT TYPE CONTROL GPS T–VALUE CONTROL GPS T–VALUE
Supervision 65.5 83.3 –4.73 1.03 1.43 –2.68**
Face to Face 64.0 83.0 –4.99 1.23 1.77 –3.20***
Residence 58.3 77.5 –4.72 .96 1.31 –2.28*
Collateral 60.8 81.0 –5.16 .91 1.20 –2.24**
Note: N=391: 175 control, 216 GPS; 125 subjects were excluded from the supervision analysis because of the unavailability of ROS data. ROS data are often purged from the file after a return-to-custody event and completely destroyed shortly after discharge from parole. aThe percent of subjects that had any contact type. bThe number of contacts divided by the number of days under supervision in the community (i.e., not in custody nor absconding).
* p < .05. ** p < .01. *** p < .001.
This document is a research report submitted to the U.S. Department of Justice. This report has not been published by the Department. Opinions or points of view expressed are those of the author(s)
and do not necessarily reflect the official position or policies of the U.S. Department of Justice.
Monitoring High-Risk Sex Offenders With GPS Technology: An Evaluation of the California Supervision Program
3–7
both in terms of the percent of offenders with a single contact and the percent of contact. These findings suggest that the GPS group received an overall higher level of supervision compared with the subjects in the control group. Consequently, the level of supervision is included in the analysis as a control variable. Summary The previous tables in this section provide information on the supervision of HRSOs in California. The group comparison of these supervision elements indicates that (perhaps not surprisingly) the subjects in the GPS group are supervised more closely than the control group in terms of face-to-face, office, residential, and collateral contacts. In addition, subjects in the GPS group are more likely to remain under supervision in the community (i.e., not abscond) during the 1-year observation period and less likely to abscond. Finally, the subjects in the GPS group appear to receive more supervision compared with the subjects in the control group. Consequently, the level of supervision will be included in the survival analysis as a control variable, to which we now turn.
This document is a research report submitted to the U.S. Department of Justice. This report has not been published by the Department. Opinions or points of view expressed are those of the author(s)
and do not necessarily reflect the official position or policies of the U.S. Department of Justice.
Monitoring High-Risk Sex Offenders With GPS Technology: An Evaluation of the California Supervision Program
3–8
C. OUTCOME ANALYSIS Studies of criminal behavior typically use one or more of the following four measures to assess reoffending:
• Violation of parole • Rearrest • Reconviction • Return to prison custody
These measures are indicators of the occurrence of offending behavior. Each of these measures has strengths and weaknesses. Violations of parole typically used to measure parolee noncompliance may or may not constitute a new crime because offenders may commit acts that violate only the technical aspects of parole (i.e., missing an appointment with a parole agent). Arrests are the most popular and convenient measure of crime available, but an arrest does not imply that a new offense actually occurred as occasionally the charges against an offender are dropped and the offender is released without further incident. In addition, arrest accounts only for crimes that have been detected by law enforcement. Convictions indicate that a new offense did occur but may not always reflect the seriousness of the offense, since prosecutors may prefer a plea bargain to trying the case on its merits. Finally, a return to custody is the narrowest measure of recidivism, as it accounts for only the most serious crimes that result in a prison term. This report uses all four measures to assess the offending behavior of HRSO parolees. Each outcome is measured in terms of time to the first event. As an initial assessment of the outcome, we compare the two groups without any covariates (not shown). We then run the same model controlling for the level of supervision, treatment hours, and geographic mobility across districts at level 1, and parole district caseload size at level 2. (See chapter 2 for a detailed description of each measure.) We use the Cox proportional-hazards regression model, a broadly applicable and the most widely used method of survival analysis, to assess the time-to-event data and report the hazard ratio for each outcome. The hazard ratio is an estimate of the ratio of the hazard rate in the GPS versus the control group. Noncompliance PAROLE VIOLATIONS. During the course of a supervision period, an offender may commit one or more acts that violate the specific conditions of parole (technical violation) or commit a new crime (nontechnical violation).* This is known as noncompliance with the conditions of parole. Table 3.8 provides information on noncompliance among those assigned to GPS monitoring compared with the control group. Specifically, the table reports the percent of control and GPS parolees who committed any parole violation, a technical violation, a nontechnical violation, and a sex-related violation following release. In addition, the mean survival times and associated confidence intervals are provided as well as the hazard ratio for time to violation following their release. As an initial assessment of the outcome, we compared the two groups in terms of compliance (any, technical, nontechnical, or sex-related violations) during the year following release from prison without any covariates. Interestingly, while there are no differences between the groups in terms of technical, nontechnical, or any violation, sex-related parole violations demonstrate a statistically significant difference where non–GPS offenders are more than twice as likely *See attachment D for the percentage of parolees charged with a violation as well as the mean number of violations by violation type and group.
This document is a research report submitted to the U.S. Department of Justice. This report has not been published by the Department. Opinions or points of view expressed are those of the author(s)
and do not necessarily reflect the official position or policies of the U.S. Department of Justice.

Monitoring High-Risk Sex Offenders With GPS Technology: An Evaluation of the California Supervision Program
3–9
as GPS offenders (12.4 percent, compared with 5.0 percent) to commit a parole violation in the year following release from prison (χ²=8.79, p < .003). In addition, an examination of the mean survival time indicates that on average the first sex-related violation for the control group was about 11.7 months, whereas the average time until the first sex-related parole violation for the treatment group was 11.3 months—a difference of about 13 days. Further, controlling for level of supervision, treatment hours, geographic mobility across districts at level 1, and parole district caseload size at level 2, the hazard ratio for the GPS offenders is about 65 percent lower than that of the matched control group of parolees. That is, the hazard of a sex-related violation is nearly three times as great (1/.35 = 2.86). This effect holds even when failure-to-register incidents are removed, albeit at a slightly higher probability level (p=.06). Figure 3.1 shows the hazard function curves for sex-related parole violations. The figure shows a clear graphical illustration of the differences in hazard function of both the GPS and control groups. Specifically, figure 3.1 indicates that parolees in both groups start committing sex-related violations almost immediately; by about 45 days (roughly 1½ months to 2 months), the violations for the GPS offenders appear to level off while the control offenders continue to fail at relatively high rates. Finally, although not significant by conventional standards (p<.05), the hazard ratios for both parole violations and nontechnical violations were significant at a less-conservative level (p<.10) and maybe worthy of further investigation. In both cases, despite shorter mean survival times at baseline, the trends favor the GPS group with hazard ratios 21 percent and 24 percent lower than the non–GPS control group.
Table 3.8. Survival on Parole of GPS and Control Parolees: Parole Noncompliance
CONTROL GPS HAZARD RATIO
MEASURE N=258 N=258 (95% CI) P VALUE
Parole Violation 0.79 (0.62, 1.02) 0.064
Rate (%) 65.1 64.3
Mean Survival Time 211.22 194.70
Nontechnical Violation 0.76 (0.55, 1.05) 0.097
Rate (%) 43.0 38.0
Mean Survival Time 264.99 263.03
Technical Violation 0.94 (0.63, 1.42) 0.781
Rate (%) 22.1 26.0
Mean Survival Time 311.24 297.22
Sex Violationa 0.35 (0.22, 0.55) 0.000***
Rate (%) 12.4 5.0
Mean Survival Time 338.17 351.40
Notes: All models control for level of supervision, treatment hours, and geographic mobility across districts at level 1 and caseload size at level 2. Offender survival times were censored at 365 days if the event did not occur in the first year. If the offender was returned to custody without a parole violation, survival times were censored at the time of a readmission. aSex violations include failure to register violations as well as other nontechnical sexual violations such as indecent exposure, oral copulation, and sexual battery.
* p < .05. ** p < .01. *** p < .001.
This document is a research report submitted to the U.S. Department of Justice. This report has not been published by the Department. Opinions or points of view expressed are those of the author(s)
and do not necessarily reflect the official position or policies of the U.S. Department of Justice.

Monitoring High-Risk Sex Offenders With GPS Technology: An Evaluation of the California Supervision Program
3–10
Figure 3.1
This document is a research report submitted to the U.S. Department of Justice. This report has not been published by the Department. Opinions or points of view expressed are those of the author(s)
and do not necessarily reflect the official position or policies of the U.S. Department of Justice.

Monitoring High-Risk Sex Offenders With GPS Technology: An Evaluation of the California Supervision Program
3–11
Recidivism ARREST. A parolee may also commit an illegal act for which the offender is not violated but rather treated as a new crime. Table 3.9 compares those assigned to GPS monitoring with those in the control group in terms of any arrest and then disaggregates arrests for an explicit examination of sex-related arrests. The table reports the percent of control and GPS parolees who were arrested for any offense and for a sex-related offense following release. In addition, the mean survival times and associated confidence intervals are provided as well as the hazard ratio for time to arrest following their release. Again as an initial assessment of the outcome, we compared the two groups in terms of arrests during the year following release from prison. The findings indicate that parolees in the control group were about 12 percentage points more likely (or nearly double as likely) to be arrested in the year following release than those monitored on GPS (26 percent, compared with 14 percent; χ²=11.49, p <.001) and the mean survival times indicate that on average the time to first arrest for the control group was about 10.3 months, whereas the average time until the first arrest for the treatment group was 11.2 months—a difference of about 26 days. Similarly, those monitored on GPS also appeared less likely to be arrested for a sex offense (3 percent, compared with 5 percent), with survival times favoring the GPS–monitored offenders by about 4 days, but the difference was not statistically significant (χ²=1.87, p <.171). After controlling for the level of supervision, treatment hours, and geographic mobility across districts at level 1 and parole district caseload size at level 2, the hazard ratio shows that the time to any arrest was about 57 percent less among the parolees on GPS. Put differently, the hazard ratio was more than twice as high among the control group (1/.43=2.32). The hazard ratio for sex-related arrests remained nonsignificant in the fully specified model.
Figure 3.2 shows the hazard function of both the GPS and control groups. Specifically, figure 3.2 depicts significantly longer time to rearrest for the treatment group beginning almost immediately from the date of release and continuing throughout the yearlong study period. Note that there were no significant GPS versus non–GPS differences in the hazard ratio for sex arrests (p=1.07).
Table 3.9. Survival on Parole of GPS and Control Parolees: Arrests
CONTROL GPS HAZARD RATIO
MEASURE N=258 N=258 (95% CI) P VALUE
Arrest 0.43 (0.26, 0.70) 0.001***
Rate (%) 26.4 14.4
Mean Survival Time 309.03 335.09
Sex Arresta 0.49 (0.21, 1.16) 0.107
Rate (%) 5.0 2.7
Mean Survival Time 355.44 359.38
Note: All models control for level of supervision, treatment hours, and geographic mobility across districts at level 1 and caseload size at level 2. Offender survival times were censored at 365 days if the event did not occur in the first year. If the offender was returned to custody without an arrest, survival times were censored at the time of a readmission. aSex arrest includes failure-to-register violations as well as other nontechnical sexual violations such as indecent exposure, oral copulation, and sexual battery.
* p < .05. ** p < .01. *** p < .001.
This document is a research report submitted to the U.S. Department of Justice. This report has not been published by the Department. Opinions or points of view expressed are those of the author(s)
and do not necessarily reflect the official position or policies of the U.S. Department of Justice.

Monitoring High-Risk Sex Offenders With GPS Technology: An Evaluation of the California Supervision Program
3–12
Figure 3.2
This document is a research report submitted to the U.S. Department of Justice. This report has not been published by the Department. Opinions or points of view expressed are those of the author(s)
and do not necessarily reflect the official position or policies of the U.S. Department of Justice.
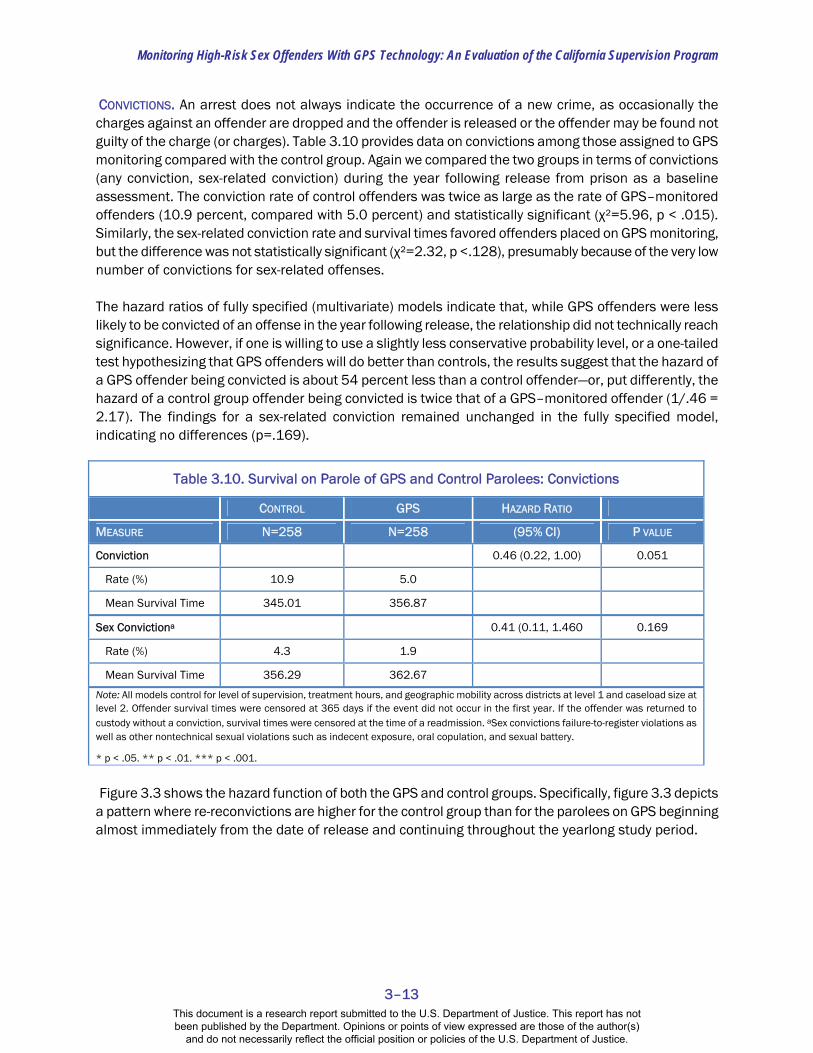
Monitoring High-Risk Sex Offenders With GPS Technology: An Evaluation of the California Supervision Program
3–13
CONVICTIONS. An arrest does not always indicate the occurrence of a new crime, as occasionally the charges against an offender are dropped and the offender is released or the offender may be found not guilty of the charge (or charges). Table 3.10 provides data on convictions among those assigned to GPS monitoring compared with the control group. Again we compared the two groups in terms of convictions (any conviction, sex-related conviction) during the year following release from prison as a baseline assessment. The conviction rate of control offenders was twice as large as the rate of GPS–monitored offenders (10.9 percent, compared with 5.0 percent) and statistically significant (χ²=5.96, p < .015). Similarly, the sex-related conviction rate and survival times favored offenders placed on GPS monitoring, but the difference was not statistically significant (χ²=2.32, p <.128), presumably because of the very low number of convictions for sex-related offenses. The hazard ratios of fully specified (multivariate) models indicate that, while GPS offenders were less likely to be convicted of an offense in the year following release, the relationship did not technically reach significance. However, if one is willing to use a slightly less conservative probability level, or a one-tailed test hypothesizing that GPS offenders will do better than controls, the results suggest that the hazard of a GPS offender being convicted is about 54 percent less than a control offender—or, put differently, the hazard of a control group offender being convicted is twice that of a GPS–monitored offender (1/.46 = 2.17). The findings for a sex-related conviction remained unchanged in the fully specified model, indicating no differences (p=.169).
Figure 3.3 shows the hazard function of both the GPS and control groups. Specifically, figure 3.3 depicts a pattern where re-reconvictions are higher for the control group than for the parolees on GPS beginning almost immediately from the date of release and continuing throughout the yearlong study period.
Table 3.10. Survival on Parole of GPS and Control Parolees: Convictions
CONTROL GPS HAZARD RATIO
MEASURE N=258 N=258 (95% CI) P VALUE
Conviction 0.46 (0.22, 1.00) 0.051
Rate (%) 10.9 5.0
Mean Survival Time 345.01 356.87
Sex Convictiona 0.41 (0.11, 1.460 0.169
Rate (%) 4.3 1.9
Mean Survival Time 356.29 362.67
Note: All models control for level of supervision, treatment hours, and geographic mobility across districts at level 1 and caseload size at level 2. Offender survival times were censored at 365 days if the event did not occur in the first year. If the offender was returned to custody without a conviction, survival times were censored at the time of a readmission. aSex convictions failure-to-register violations as well as other nontechnical sexual violations such as indecent exposure, oral copulation, and sexual battery.
* p < .05. ** p < .01. *** p < .001.
This document is a research report submitted to the U.S. Department of Justice. This report has not been published by the Department. Opinions or points of view expressed are those of the author(s)
and do not necessarily reflect the official position or policies of the U.S. Department of Justice.

Monitoring High-Risk Sex Offenders With GPS Technology: An Evaluation of the California Supervision Program
3–14
Figure 3.3
This document is a research report submitted to the U.S. Department of Justice. This report has not been published by the Department. Opinions or points of view expressed are those of the author(s)
and do not necessarily reflect the official position or policies of the U.S. Department of Justice.

Monitoring High-Risk Sex Offenders With GPS Technology: An Evaluation of the California Supervision Program
3–15
RETURN TO CUSTODY. A return to custody is yet another measure of recidivism, typically the most conservative measure. Parolees may be returned to custody for a parole violation (RTC) or a new offense (PVWNT). Table 3.11 reports the percentage of control and GPS parolees who were returned to custody for an RTC violation, a PVWNT violation, or any violation following release. In addition, the mean survival times and associated confidence intervals are provided, as is the hazard ratio for time to a return to custody following their release, controlling for the measures discussed earlier. The initial assessment indicates the most common reason for return to custody was for a parole violation (56 percent of both groups). Conversely, very few parolees were returned for a new offense (3.9 percent of the control and 3.5 percent of the GPS parolees). There were no differences between control and GPS parolees in terms of a return to custody for either a parole violation (χ²=.008, p <.929), a new offense (χ²=.054, p <.815), or any violation (χ²=.032, p <.858) in the 1 year following the initial release from prison. In addition, the mean survival times are virtually identical for both groups in each return-to-custody category, although, like the parole violations, slightly higher for the control group subjects. Interestingly, however, in the fully specified model (multivariate frailty model) the hazard ratios are significant for both any return and RTC return events. In both cases, the data appear to favor the GPS–monitored offenders. The hazard rate was 27 percent to 28 percent lower among GPS–monitored offenders, suggesting that these events were 38 percent higher among the control group (1/.72 = 1.38). These findings stand in stark contradiction to the mean survival times depicted in the baseline model. Further analyses suggest that this suppression effect (MacKinnon, Krull, and Lockwood 2000) is due to the strong correlation between treatment status and caseload size, with controls being placed on caseloads with nearly 10 (9.5) more parolees (on average) per agent at any one time (t=10.96 with 414 d.f., p<.000), and the strong effect of caseload size on revocations and RTCs. In models predicting any returns and RTC returns, supervision hours is the only significant control variable other than treatment status, and in both cases the effect is quite strong (p<.000).
Table 3.11. Survival on Parole of GPS and Control Parolees: Return to Custody
CONTROL GPS HAZARD RATIO
MEASURE N=258 N=258 (95% CI) P VALUE
Any Return 0.72 (0.55, 0.94) 0.016*
Rate (%) 58.9 58.1
Mean Survival Time 232.74 222.88
RTC Return 0.73 (0.56, 0.96) 0.024*
Rate (%) 56.6 56.2
Mean Survival Time 237.93 227.57
PVWNT Return 0.77 (0.26, 2.23) 0.628
Rate (%) 3.9 3.5
Mean Survival Time 358.11 358.93
Note: All models control for level of supervision, treatment hours, geographic mobility across districts at level 1, and caseload size at level 2.
* p < .05. ** p < .01. *** p < .001.
This document is a research report submitted to the U.S. Department of Justice. This report has not been published by the Department. Opinions or points of view expressed are those of the author(s)
and do not necessarily reflect the official position or policies of the U.S. Department of Justice.

Monitoring High-Risk Sex Offenders With GPS Technology: An Evaluation of the California Supervision Program
3–16
Figure 3.4
Figure 3.5
This document is a research report submitted to the U.S. Department of Justice. This report has not been published by the Department. Opinions or points of view expressed are those of the author(s)
and do not necessarily reflect the official position or policies of the U.S. Department of Justice.

Monitoring High-Risk Sex Offenders With GPS Technology: An Evaluation of the California Supervision Program
3–17
Basically, when accounting for the fact that the non–GPS subjects are on average supervised by agents with larger caseloads, status emerges as a significant predictor. Another way of interpreting this is, if the two groups had equivalent caseloads, parolees not on GPS would be revoked and returned to custody much more frequently than the GPS parolees. This again suggests that electronic monitoring with GPS appears to control offenders in the community more effectively than standard parole activity. Figures 3.4 and 3.5 show the hazard functions of both the GPS and control groups for each outcome. Although the hazards’ ratios for group status is significant, as previously described, the graphic depiction without the control variables appears as though the GPS parolees are initially revoked and returned to custody at a higher rate, only to converge in the later months. Interactions The previous table examined the return to custody of all parolees as if their probability of return were equal. However, some offenders are more likely than others to return to custody. These subjects are identified in California by the Static–99 risk assessment instrument. The Static–99 is a brief actuarial instrument designed to estimate the probability of sexual and violent recidivism among adult males who have already been convicted of at least one sexual offense against a child or nonconsenting adult. It classifies offenders into four categories: low, medium–low, medium–high, and high. Table 3.12 examines a return to custody by the control and GPS groups within the four Static–99 risk categories. While the GPS offenders returned to custody less frequently than the control offenders in the 1 year following the initial release from prison within most risk categories (medium–high was the lone exception), the differences are not statistically significant in terms of a return to custody for either a parole violation or a new offense. But, as expected, there is a general pattern of increased recidivism as risk level increases. Specifically, while there is little differentiation between the medium categories, low-risk parolees demonstrate the lowest rates of custody returns (43 percent of control parolees and 42 percent of GPS parolees were returned for any reason), while the high-risk offenders demonstrate the highest rates of return (79 percent of control parolees and 63 percent of GPS parolees were returned for any reason). To assess whether GPS monitoring had a differential effect by risk of recidivism, we recoded risk into a dichotomous variable (low and medium–low risk=1; high and medium–high risk=0) and examined their interaction with GPS status (GPS and control parolees) on each of the dependent variables (noncompliance and recidivism) discussed above. We detected only one significant interaction term predicting days to first sex-related parole violation. The interaction was highly significant (t=–13.45, p<.000) but the coefficient and standard errors quite small. For ease of interpretation we ran separate models for the low- and high-risk groups. The effect of GPS on time to first sex-related violation was significant and negative for the high-risk group (b=–.654, s.e. = .227, p=.004). However, the model could not be fully estimated for the low-risk group because there were no failures among the parolees placed on GPS monitoring—hence no variation in the time to the event. Nevertheless, zero violations would suggest an even stronger effect among the low-risk offenders. In other words, GPS monitoring was effective in reducing the days to first sex-related parole violation, but there was no differential effect by risk.
This document is a research report submitted to the U.S. Department of Justice. This report has not been published by the Department. Opinions or points of view expressed are those of the author(s)
and do not necessarily reflect the official position or policies of the U.S. Department of Justice.

Monitoring High-Risk Sex Offenders With GPS Technology: An Evaluation of the California Supervision Program
3–18
We also assessed whether GPS monitoring had a differential effect by offender type. We categorized each parolee by sex offender type (i.e., rapist, child abuser, or other) and again examined the interaction with GPS status on each of the dependent variables. However, we detected no evidence of an interaction. Treatment The goal of this study was to assess the effects of GPS monitoring on compliance and recidivism. In so doing, we isolated the impact of GPS monitoring by controlling for the differences in treatment attendance among the parolees as well as the variability in treatment practice across parole districts. Thus, the specific effect of sex offender treatment was outside the scope of this project. However, a bivariate analysis of treatment hours and various outcomes indicated that parolees who were arrested (t=–3.01, p <.002) or had any sex violation (t=–1.97, p <.049) attended significantly fewer treatment sessions than parolees who neither were arrested nor violated for a sexual offense. In addition, the bivariate group comparison of treatment hours suggests that the GPS group received significantly more hours of treatment than the control group subjects (t=1.98, p <.048), indicating that GPS monitoring may encourage parolees to attend the treatment sessions on a regular basis. However, in the fully specified multivariate model, the hours of sex offender treatment were significantly associated with subsequent
Table 3.12. Comparison of a Return to Prison by Risk Level: GPS and Control Groups
CONTROL GPS MEASURE PERCENT SD PERCENT SD T–VALUE
Low (n=58)
Parole Violationa 43.8 .50 38.5 .50 .40
New Offenseb 0 0 3.9 .20 –1.00
Any Returnc 43.8 .50 42.3 .50 .11
Medium Low (n=105)
Parole Violationa 58.1 .50 48.0 .50 1.04
New Offenseb 1.8 .13 2.0 .14 –.07
Any Returnc 60.0 .49 50.0 .51 1.03
Medium High (n=247)
Parole Violationa 49.1 .50 60.3 .49 –1.76
New Offenseb 4.3 .20 2.3 .15 .89
Any Returnc 53.4 .50 62.6 .49 –1.45
High (n=102)
Parole Violationa 75.5 .43 61.2 .49 1.54
New Offenseb 3.8 .19 2.0 .14 .51
Any Returnc 79.3 .41 63.3 .48 1.77
Note: Sample size: GPS group=256; control group=256. Six subjects missing Static–99 score. Low risk was indicated by a Static–99 score of 0–1. Low risk was indicated by a Static–99 score of 0–1. Medium–low risk was indicated by a Static–99 score of 2–3. Medium–high was indicated by a Static–99 score of 4–5. High risk was indicated by a Static–99 score above 6. aParole violation is a dichotomous measure (0=no; 1=yes). bNew offense is a dichotomous measure (0=no; 1=yes). cAny return is a dichotomous measure (0=no; 1=yes). * p < .05. ** p < .01. *** p < .001. All values are two-tailed test. 1 tail is sig.
This document is a research report submitted to the U.S. Department of Justice. This report has not been published by the Department. Opinions or points of view expressed are those of the author(s)
and do not necessarily reflect the official position or policies of the U.S. Department of Justice.

Monitoring High-Risk Sex Offenders With GPS Technology: An Evaluation of the California Supervision Program
3–19
arrests—indicating that, regardless of GPS status, regular sex offender treatment was associated with fewer arrests. Arrest, though, was the only outcome for which sex offender treatment hours was significant. While these results should be interpreted with caution, it is possible that GPS supervision is a useful stimulus to encourage more regular sex offender treatment attendance. Summary Overall, the results appear to favor the GPS group in terms of both noncompliance and recidivism. Cox proportional hazards models (controlling for level of supervision, treatment hours per day while not incarcerated, and geographic mobility across districts at level 1, and caseload size at level 2) show that the number of days until an event of noncompliance for a sex-related violation—or recidivism as measured by an arrest, a parole revocation, or any return to custody—was greater for the GPS–monitored offenders than for the traditional parole offenders. In addition, there was some evidence (p=.051) that the number of days until a new conviction was greater for the GPS–monitored parolees. While one might have hypothesized that the greater the supervision the more likely and quicker the detection of noncompliance and recidivism, it appears that the GPS acts as a useful supervision tool, reducing the likelihood and increasing the time until these events.
This document is a research report submitted to the U.S. Department of Justice. This report has not been published by the Department. Opinions or points of view expressed are those of the author(s)
and do not necessarily reflect the official position or policies of the U.S. Department of Justice.
Monitoring High-Risk Sex Offenders With GPS Technology: An Evaluation of the California Supervision Program
3–20
D. COST ANALYSIS This section performs a cost effectiveness (CE) analysis based on the findings above to ascertain which program alternative (GPS monitoring supervision or traditional supervision) can achieve the most efficient result (i.e., the most effective outcome at the lowest cost). The underlying assumption is that different program alternatives are associated with different costs and different results. By choosing those with the least cost for a given outcome, policymakers can use their resources more effectively (Levin and McEwan 2001). The basic technique of CE is to derive results for the effectiveness of each alternative by using standard evaluation procedures (Rossi and Freeman 1985) and to combine such information with cost data that are derived from the ingredients approach to provide a systematic way for evaluators to estimate the costs of social interventions (Levin 1983). The strength of this approach is in its simplicity. Most important is that it merely requires combining cost data with effectiveness data that are ordinarily available to create a cost-effectiveness comparison. Further, it lends itself well to an evaluation of alternatives that are being considered. The major disadvantage is that one can compare costs only among alternatives with similar goals. Fortunately, this drawback does not have any bearing on the current study, as both alternatives focus on noncompliance and recidivism. The costs of an intervention are defined as the value of the resources that are dedicated to an intervention. These are referred to as the ingredients of the intervention, and it is the social value of these ingredients that constitute its overall cost. The ingredients approach entails three distinct phases:
1. Identification of ingredients 2. Determination of the value or cost of the ingredients and the overall costs of an intervention 3. An analysis of the costs in an appropriate decision-oriented framework
Step 1. Identification of Ingredients The first step in applying the ingredients method is to identify the ingredients that are used to generate and manage the program. In other words, every ingredient that is used to produce the effects that are captured in the evaluation must be identified and included in the cost calculation. As suggested by Levin and McEwan (2001), we divided the potential ingredients into four broad categories that have common properties to facilitate the identification and specification of each cost. These categories were 1) personnel (all fulltime and parttime staff and consultants), 2) facilities (i.e., the physical space required for the program), 3) equipment and materials (furnishings, instructional equipment, etc.), and 4) other inputs (all other costs that do not fit the other categories). The primary sources for such data are written reports, observations, and interviews. Consequently, we reviewed documents and communicated electronically with CDCR staff to document the program elements associated with both the GPS supervision program and the traditional supervision alternative. Specifically, a cost-effectiveness analysis worksheet was developed that divided all cost elements into one of the four broad categories. This worksheet was transmitted to CDCR by electronic communication along with a request to add the monetary values to each category as well as explicit instructions to add any cost element that was missing from the initial draft. Follow-up discussions by electronic communication were used to refine the cost elements and associated monetary values. The State of California Legislative Analyst’s Office analysis of the 2007–08 budget bill (LAO 2007) was used to estimate cost elements that were not readily available by CDCR staff. To verify and, if necessary, correct each of the cost elements, a final version of the worksheet was transmitted to a CDCR budget analyst.
This document is a research report submitted to the U.S. Department of Justice. This report has not been published by the Department. Opinions or points of view expressed are those of the author(s)
and do not necessarily reflect the official position or policies of the U.S. Department of Justice.

Monitoring High-Risk Sex Offenders With GPS Technology: An Evaluation of the California Supervision Program
3–21
Step 2. Determination of the Cost of the Ingredients and the Overall Costs of the Intervention Once the ingredients have been identified and stipulated, it is necessary to ascertain their value or costs. Again, the primary sources for these data were written reports and communications with CDCR staff to document the costs associated with each ingredient of both the GPS supervision program and the traditional supervision alternative. Table 3.13 provides a breakdown of the cost of each ingredient category as well as the subingredient category. The personnel category ($25.4 million) was estimated by obtaining the expenditures on salaries and fringe benefits as well as overtime costs. The facilities category ($4.5 million) included the annual cost of the building that houses the parole units—estimated by using the annual leasing cost—as well as an estimation of the office supplies used during routine program operation. The equipment and supplies category ($13.9 million) concentrated on the GPS supervision–related equipment used by parole agents. It was calculated in much the same way as the cost of facilities. In cases where the equipment was leased, the leasing value was obtained to estimate the annual cost value of the equipment. In cases where the equipment was purchased, the cost was annualized over a typical length of use. For instance, a typical laptop computer costs roughly $2,500.00. It was estimated that the laptop would be functional for 5 years at an annualized rate of .2310. Consequently, the annualized cost of laptops for 225 agents is roughly $130,000. Finally, other program inputs ($44.7 million) concentrated on training the parole agents in the use of GPS monitoring, administering risk assessments to all sex offenders, providing sex offender treatment to all sex offenders released into the community, and managing the GPS data. Each of these ingredients was added into the cost of the GPS program as well as the traditional supervision alternative* (where applicable). Overall, the GPS supervision program was estimated to cost roughly $88 million. As one might expect, the program is labor intensive ($25.4 million a year), but the single largest ingredient category was other inputs, the lion’s share of which was the cost of sex offender treatment ($42 million). Based on an average number of parolees (6,744) in a given year, the yearly cost per parolee is $13,126 ($88,523,494 / 6744), which translates into $35.96 per parolee per day. The GPS equipment alone costs roughly $5.65 per parolee per day ($13,904,009 / 6,744) / 365). The comparative daily cost of traditional supervision per parolee is $27.45. Obviously the cost of the GPS equipment is zeroed out for traditional supervision. Consequently, in pure financial terms, the GPS supervision program costs roughly $8.51 per day more than traditional supervision. Both of these figures, incidentally, are much less costly than the cost of prison. While calculating the cost of prison is outside the scope of this study, the California Legislative Analyst’s Office (LAO 2007) recently concluded that in 2008–09 it cost an average of about $47,000 per prisoner per year to incarcerate an inmate in California, which translates into about $129.00 per day. To assess the cost of GPS and taking into account the number of days spent in prison because of a return-to-custody event, we calculated 1) the total number of days each parolee spent in the community (i.e., street days) and 2) the total number of days each group spent in prison. We then multiplied the number of street days by the daily cost of either GPS supervision or traditional parole supervision, depending on the group to which the subject was assigned, to calculate the cost of community supervision for each offender. We also multiplied the number of days spent in prison by the cost of a single day in prison to calculate the cost of prison for
*There were only four main differences in the costs of the two alternatives. These are 1) the GPS equipment, 2) the management contract with the GPS vendors, 3) the GPS training of parole agents, and 4) the larger caseloads of non–GPS agents’ results in the need for fewer agents to manage the volume of HRSOs.
This document is a research report submitted to the U.S. Department of Justice. This report has not been published by the Department. Opinions or points of view expressed are those of the author(s)
and do not necessarily reflect the official position or policies of the U.S. Department of Justice.

Monitoring High-Risk Sex Offenders With GPS Technology: An Evaluation of the California Supervision Program
3–22
each offender. Finally, we summed these two figures to estimate the total cost for each parolee. On average, during the year study period, a treatment group parolee cost $5.09 dollars more per day in supervision and custody than a control parolee ($61.60, compared with $56.50). This difference is mostly due to the GPS supervision costs, but not statistically significant (t=–1.93, p=.054).
Table 3.13. Costs of GPS and Traditional Parole Supervision
INGREDIENTS GPS TRADITIONAL PAROLE
Personnel $25,426,125 $19,097,845
HRSO Agents $24,173,325 $18,156,853
Agent Overtime $1,252,800 $940,992
Facilities $4,471,360 $4,471,360
Office Lease $4,325,400 $4,325,400
Accessories (phones, data, etc.) $145,960 $145,960
Equipment and Supplies $13,904,009 $0
Installation Supplies $0 $0
Chargers $0 $0
Straps $0 $0
Units $13,538,580 $0
Handheld GPS Unit $19,491 $0
Cell Phone $216,000 $0
Laptops $129,938 $0
Other Inputs $44,722,000 $44,000,000
Training $522,000 $0
Risk Assessments $2,000,000 $2,000,000
Sex Offender Treatment $42,000,000 $42,000,000
Data Contract Management $200,000 $0
Cost $88,523,494 $67,569,205
Subsidies $0 $0
User Fees $0 $0
Other $0 $0
Net Cost $88,523,494 $67,569,205
Number of Parolees 6744 6744
Number of Agents 225 169
Cost (per Parolee) $13,126 $10,019
Cost (per Parolee) (per Day) $35.96 $27.45
Equipment (per Parolee) (per Day) $5.65 n/a
This document is a research report submitted to the U.S. Department of Justice. This report has not been published by the Department. Opinions or points of view expressed are those of the author(s)
and do not necessarily reflect the official position or policies of the U.S. Department of Justice.

Monitoring High-Risk Sex Offenders With GPS Technology: An Evaluation of the California Supervision Program
3–23
Step 3. Combining Costs and Effectiveness Once estimates of costs and effectiveness* are obtained, they can be combined to calculate a cost effectiveness ratio (CER) to help analyze the cost of each alternative. Computation of the CER is the cost of a given alternative C divided by its effectiveness (E):
CER=(C/E) The ratio can be interpreted as the cost required to obtain a single unit of effectiveness. However, when a program is evaluated against current practice (as in this case), this computation must be augmented to account for the baseline, which is the alternative program. The ratio that evaluates an intervention against its baseline option (e.g., no program or current practice) is known as an incremental cost effectiveness ratio (ICER). ICER is defined as the ratio of the change in costs of an intervention (compared with the alternative, such as doing nothing or current practice) to the change in effects of the intervention. Computation of the ICER is similar in that it is calculated by dividing the net cost of the intervention by the net outcome:
ICER=(C2–C1/E1–E2) For example, as discussed above, the cost of GPS program is $35.96 per day per parolee, while the cost of traditional supervision is $27.45 per day per parolee—a daily difference of $8.51. In addition, the GPS monitoring program demonstrated a 12-percentage-points reduction (from 26.36 percent to 14.34 percent, as shown in table 3.14) in arrests. In other words, the GPS monitoring program is more expensive but more effective. These findings (see table 3.14) translate into an ICER of .71 (or .48 including the cost of prison). In other words, compared with traditional parole supervision, GPS monitoring costs less than $1.00 per day per offender to obtain a 1 percent decrease in arrests. Similarly, GPS monitoring costs $11.00 per day per offender to obtain a 1 percent decrease in custody returns.
*Effectiveness estimates were obtained from the outcome analyses in the previous section.
Table 3.14. Incremental Cost-Effectiveness Ratio
MEASURE GPS CONTROL ICER
(WITHOUT PRISON COSTS) ICER
(WITH PRISON COSTS)
Any Parole Violation 64.34% 65.12% $10.91 $7.38
Any Arresta 14.34% 26.36% $0.71 $0.48
Any Conviction 5.04% 10.85% $1.47 $0.99
Any Return to Custodyb 58.14% 58.91% $11.06 $7.48
aThis measure demonstrated a significant effect (see table 3.9). bThis measure demonstrated a significant effect (see table 3.11).
This document is a research report submitted to the U.S. Department of Justice. This report has not been published by the Department. Opinions or points of view expressed are those of the author(s)
and do not necessarily reflect the official position or policies of the U.S. Department of Justice.

Monitoring High-Risk Sex Offenders With GPS Technology: An Evaluation of the California Supervision Program
3–24
The incremental cost and incremental effect can also be represented visually (see figure 3.6), using the incremental cost-effectiveness plane (Black 1990). The horizontal axis divides the plane according to incremental cost (positive above, negative below), and the vertical axis divides the plane according to incremental effect (positive to the right, negative to the left). This divides the incremental cost-effectiveness plane into four quadrants through the origin. Each quadrant has a different implication for the decision. If the ICER estimate falls into the southeast quadrant (negative costs and positive effects), GPS monitoring would be more effective (more compliance and/or less recidivism) and less costly than traditional parole supervision. Interventions falling into this quadrant are always considered cost effective. If the ICER falls into the northwest quadrant (positive costs and negative effects), GPS monitoring would be more costly and less effective than traditional parole. Interventions falling into this quadrant are never considered cost effective. If the ICER falls into the southwest quadrant (negative costs and negative effects) or, as in the current case (the red dot represents the cost of GPS and its effect on arrests), into the northeast quadrant (positive costs and positive effects), tradeoffs between costs and effects need to be considered.
Figure 3.6
$100
NW$80
NE
$60
$40
$20
-100 -80 -60 -40 -20 20 40 60 80 100
-$20
-$40
-$60
SW -$80 SE
-$100
Incremental Effect (Recidivism)
Incr
emen
tal C
ost (
$)
This document is a research report submitted to the U.S. Department of Justice. This report has not been published by the Department. Opinions or points of view expressed are those of the author(s)
and do not necessarily reflect the official position or policies of the U.S. Department of Justice.
Monitoring High-Risk Sex Offenders With GPS Technology: An Evaluation of the California Supervision Program
3–25
To decide whether the GPS monitoring program offers “good” value for the money, the ICER must be compared with a specified monetary threshold. This threshold represents the maximum amount that policymakers are willing to pay for effects on compliance and recidivism (maximum acceptable ceiling ratio). The intervention is deemed cost effective if the ICER falls below this threshold and not cost effective otherwise. For example, if a decision-maker is willing to pay $100.00 for a 1 percent decrease in recidivism, the intervention is considered cost effective if the ICER is below $100.00. This decision, however, is outside the scope of this study.
This document is a research report submitted to the U.S. Department of Justice. This report has not been published by the Department. Opinions or points of view expressed are those of the author(s)
and do not necessarily reflect the official position or policies of the U.S. Department of Justice.

This document is a research report submitted to the U.S. Department of Justice. This report has not been published by the Department. Opinions or points of view expressed are those of the author(s)
and do not necessarily reflect the official position or policies of the U.S. Department of Justice.

Monitoring High-Risk Sex Offenders With GPS Technology: An Evaluation of the California Supervision Program
4–1
4. Process Evaluation
A. OVERVIEW We conducted a process evaluation to provide a comprehensive understanding of the program context and to determine whether the program was delivered as designed. More specifically, the process evaluation was designed to a) assess whether GPS program services were delivered as planned* and b) identify any gaps between program design and delivery. In general, there are five primary components examined when considering program fidelity (Dane and Schneider 1998):
1. Adherence (or integrity) refers to whether the program service or intervention is being delivered as it was designed or written (i.e., with all core components being delivered to the appropriate population; staff trained appropriately; using the right protocols, techniques, and materials; and in the locations or contexts prescribed).
2. Exposure (or dosage) refers to the measured quantity of a program. It may include any of the following: the number of sessions implemented, the length of each session, or the frequency with which program techniques were implemented.
3. Quality of program delivery is the manner in which a teacher, volunteer, or staff member delivers a program (e.g., skill in using the techniques or methods prescribed by the program, enthusiasm, preparedness, or attitude).
4. Participant responsiveness is the extent to which participants are engaged by and involved in the activities and content of the program.
5. Program differentiation identifies the unique features of different components or programs that are reliably differentiated from one another.
This study concentrates on adherence, exposure, quality of program delivery, and program differentiation as a means of assessing overall fidelity. Though participant responsiveness may be an important function of program fidelity, it was outside the scope of this study.
B. DATA Sources We used two sources to collect data for the process evaluation: 1) a California Department of Corrections and Rehabilitation (CDCR) parole agent survey and 2) GPS monitoring data. GPS Parole Agent Survey The main source of data for the process evaluation was the parole agent survey. The survey instrument was developed to collect process data from CDCR parole agents. To facilitate comparisons between the two studies, it was adapted from the survey instrument used in the University of California, Irvine, pilot study (Turner and Jannetta 2007). The final version contained questions in eight areas: *At the time of the study, the CDCR GPS program was moving from its pilot stage into a full-scale statewide implementation of the GPS program. As such, the protocols in place during the pilot phase were augmented for the full-scale program based on the lessons learned. Moreover, the protocols were further refined as new information became available from the experiences of initial phases of the full-scale program. Thus, it was problematic to assess the implementation of each of the components as they changed over the course of the study. As a practical matter, this study measured program fidelity based on the protocols in place at the start of the study period. However, some of these protocols may have been antiquated at the time of the parole agent survey, leading to errors in the measurement of fidelity.
This document is a research report submitted to the U.S. Department of Justice. This report has not been published by the Department. Opinions or points of view expressed are those of the author(s)
and do not necessarily reflect the official position or policies of the U.S. Department of Justice.

Monitoring High-Risk Sex Offenders With GPS Technology: An Evaluation of the California Supervision Program
4–2
1. Program staffing 2. Overview of the GPS system 3. Reduction of caseload size 4. Screening of high-risk sex offender (HRSO) parolees 5. Enrollment and orientation 6. Integration of GPS monitoring into the intensive supervision regime 7. Synthesis of parole GPS and law enforcement data 8. General summary
The instrument was emailed to all parole agents in fall 2008. The parole agents were sent numerous requests to complete the survey during the next few months. They were also asked to respond to the survey during training and other events hosted by CDCR. The survey was closed at the end of November 2008. The survey request received 747 responses from a population of roughly 1,000 parole agents (including supervisors with no caseloads and assistant supervisors with limited caseloads). A subsequent review of the responses indicated that 120 of the 747 responses (16 percent) contained no data, resulting in 627 survey responses. The main sections of the survey deal specifically with GPS parole agents and their experiences with using the system in the supervision of sex offenders. So it was important to obtain responses from GPS parole agents with HRSO caseloads. Consequently, supervisors (125 surveys), agents without GPS caseloads (315 surveys), and agents without HRSO caseloads (24 surveys) were removed from the sample. Finally, 10 duplicate surveys were removed, resulting in 153 unique surveys from GPS agents with HRSO caseloads. Currently, there are roughly 230 level-1 GPS parole agents* with existing sex offender caseloads, yielding an acceptable response rate for GPS parole agents of 66.5 percent. Overall, the survey provided a good representation of the GPS parole agents (see table 4.1). An analysis of the survey data suggests that the responses were distributed relatively equally across the state,† with Region 1 representing 29 percent of respondents, Region 2 representing 22 percent of the respondents, Region 3 representing 23 percent of the respondents, and Region 4 representing 26 percent of the respondents. Notably, Region 3 (Los Angeles County) is the smallest geographic unit. The distribution across districts was comprehensive, with at least two responses (most have many more) from each of the 25 parole districts.
*Level-1 parole agents directly supervise parolees. †CDCR is organizationally and operationally divided into four distinct regions, with numerous districts within each region and numerous parole units within each district. Region 1 consists of the Central Valley, ranging from Bakersfield to the Oregon border, while Region 2 encompasses the coastal counties from Ventura to the Oregon border. Region 3 includes Los Angeles County alone, and Region 4 consists of the southern counties of Imperial, Orange, Riverside, San Bernardino, and San Diego.
This document is a research report submitted to the U.S. Department of Justice. This report has not been published by the Department. Opinions or points of view expressed are those of the author(s)
and do not necessarily reflect the official position or policies of the U.S. Department of Justice.

Monitoring High-Risk Sex Offenders With GPS Technology: An Evaluation of the California Supervision Program
4–3
GPS Monitoring Data The GPS monitoring data were used to categorize the subjects in groups as well as for descriptive purposes and to assess the California GPS program model. The GPS monitoring system into which HRSO parolees are enrolled is operated by two vendors: Satellite Tracking of People (STOP) LLC and Pro Tech. STOP is used in the southern portion of California (Regions 3 and 4); Pro Tech is responsible for the northern areas (Regions 1 and 2). While the terminology of the vendors differs, the capabilities of hardware and software are virtually identical. As described in chapter 1, each vendor employs an active monitoring system that combines cellular and GPS technology to automatically track the location of a parolee. Each vendor provided the following data: a profile of the offender; a record of each GPS event (inclusion/exclusion zone, strap tamper, low battery, cell communication gap, and no GPS communication) that includes the event start and stop times and duration during a specified period; and the assignment history of the device.
Table 4.1. GPS Parole Agent Survey Responses, by District Region District N Percent
Region 1 Central 10 6.5 Region 1 Delta 6 3.9 Region 1 Northern 3 2.0 Region 1 Sac Metro 8 5.2 Region 1 Southern 9 5.9 Region 1 Valley 8 5.2 Region 2 Central Coast 8 5.2 Region 2 East Bay 7 4.6 Region 2 North Bay 6 3.9 Region 2 South Bay 9 5.9 Region 2 West Bay 4 2.6 Region 3 Eastern 3 2.0 Region 3 Northern 14 9.2 Region 3 San Fernando Valley 2 1.3 Region 3 San Gabriel Valley 5 3.3 Region 3 South Central 5 3.3 Region 3 Southcoast 4 2.6 Region 3 Southwest 2 1.3 Region 4 Inland 10 6.5 Region 4 Orange 2 1.3 Region 4 Riverside 4 2.6 Region 4 Riverside Southeast 7 4.6 Region 4 San Bernardino 7 4.6 Region 4 Seaport 7 4.6 Region 4 West End 3 2.0
Note: The totals exceed 100 percent because of rounding.
This document is a research report submitted to the U.S. Department of Justice. This report has not been published by the Department. Opinions or points of view expressed are those of the author(s)
and do not necessarily reflect the official position or policies of the U.S. Department of Justice.

Monitoring High-Risk Sex Offenders With GPS Technology: An Evaluation of the California Supervision Program
4–4
C. PROGRAM FIDELITY Adherence According to the interim CDCR policy and procedures manual, there are five* core program components of the GPS program:
1. Program staffing qualifications 2. Caseload restrictions 3. HRSO parolee screening 4. Parolee enrollment and orientation specifications 5. Parole supervision specifications: GPS monitoring† and field contacts
Questions regarding each of these components were included in the GPS agent survey (see attachment C for survey questions). While many of the questions had multiple response categories, each question in reference to a core program component was recoded into a dichotomous response (1=response met the program requirement; 0=response did not meet program requirement). For instance, to assess the HRSO screening component, the agents were asked, “About what percent of parolees that you currently supervise were determined HRSO using the STATIC–99?” The question was open ended, and the agents were requested to record a numeric response. The CDCR program protocol indicates that all HRSO parolees are required to be assessed with the STATIC–99. Allowing for the possibility of some exceptions to this rule, responses of 95 percent and above were coded as meeting the requirement, while all other responses were coded as not meeting the requirement. These dichotomous measures of fidelity were then aggregated at the district level and divided by the number of valid responses to generate a percentage of adherence for each core component. The following sections detail and assess the adherence to each program component. GPS PROGRAM STAFFING QUALIFICATIONS. The GPS supervision program staffing protocol restricts eligible personnel to those with the following qualifications:
• GPS parole agents must be at the level of a journeyman who has completed an apprenticeship. • GPS parole agents must receive 16 hours of training on sex offender management. • GPS parole agents must complete GPS training.
Table 4.2 displays the results of the survey questions regarding the background of GPS agents. The survey reveals the mean age of parole agents was 46.5 years. The majority of parole agents are male (78 percent) and have a college degree (42 percent). While the majority (56 percent) of agents volunteered for a GPS caseload, a sizable portion (41 percent) were assigned by the department. The vast majority of agents (78 percent) have a mixed caseload.‡ As one would expect with a relatively new program, few
*The pilot study noted the synthesis of GPS and law enforcement data as an additional program component. However, after consultation with CDCR representatives, it was determined that this element was in truth a program goal and not a critical program component. †GPS monitoring has always included the capability of zone creation. Originally, however, its use was discretionary, thus there was significant variation on how parole agents used the function. Consequently, the creation and operationalization of three zones for each GPS parolee was added as a core program component subsequent to the development and execution of the GPS survey. Nevertheless, this component was not included as a measure of fidelity, for it was not active at the time of this study. ‡A mixed caseload is an agent with both active and passive cases. Active cases require the agent to review tracks daily. Passive cases require agents to review tracks a minimum of 2 days each month. All HRSOs are classified as active cases.
This document is a research report submitted to the U.S. Department of Justice. This report has not been published by the Department. Opinions or points of view expressed are those of the author(s)
and do not necessarily reflect the official position or policies of the U.S. Department of Justice.

Monitoring High-Risk Sex Offenders With GPS Technology: An Evaluation of the California Supervision Program
4–5
agents had a great deal of experience as GPS agents. In addition, the data suggest this type of technology-driven program attracts a younger, less experienced agent. Overall, among GPS, the average length of service was 6 years. However, comparing the agents who were assigned with those who volunteered suggests that those who volunteered were slightly younger (42 years old, compared with 43) and less experienced (6 years’ experience, compared with 7 years’). Finally, on average, agents had about 1½ years’ experience with a sex offender caseload (17 months) and less than a year’s experience with a GPS caseload (11 months). Overall, the data suggest that GPS agents with a sex offender caseload were around 46 years old with a 4-year college degree, but with less experience as an agent compared with all agents. The program staffing component was assessed through the agent survey. In terms of fidelity, the vast majority of agents who responded had completed their apprenticeship (88 percent), and the GPS training provided by CDCR (82 percent).* Interestingly, however, only about two thirds (68 percent) of the agents reported completing sex offender management training. These findings indicate that the fidelity to the program staffing qualifications component was relatively high (0.79), suggesting that 79 percent of the program component was implemented according to protocol. Moreover, there was minimal variation across districts (scores ranged from 0.65 to 1.00, SD 0.09). The coefficient of variation is 11.3 percent. The
*While this latter figure is relatively high in terms of the proportion of agents, it is unexpectedly low given the requirement that CDCR mandates that all GPS agents complete the GPS training. The incongruity suggests that either the wording of the question was misleading or that some of the agents did not read the question carefully.
Table 4.2. GPS Program Staffing Qualifications Sex N Percent
Male 120 78.4 Female 30 19.6 Missing 3 2.0
Level of Education Some college 33 21.6 Two-year college degree 33 21.6 Four-year college degree 63 41.2 Graduate degree 22 14.4 Missing 2 1.3
Selection for GPS Unit Assigned 63 41.2 Volunteered 86 56.2 Not applicable 1 0.7 Don’t Know 3 2.0
Caseload Composition Active 21 13.7 Passive 9 5.9 Mixed 120 78.4 Not applicable 1 0.7 Don’t know 2 1.3
Experience N Mean
How long as a parole agent (years)? 150 6.24
Time with GPS caseload (months)? 153 10.95
Time with a sex offender caseload (months)? 153 17.29
This document is a research report submitted to the U.S. Department of Justice. This report has not been published by the Department. Opinions or points of view expressed are those of the author(s)
and do not necessarily reflect the official position or policies of the U.S. Department of Justice.

Monitoring High-Risk Sex Offenders With GPS Technology: An Evaluation of the California Supervision Program
4–6
results in terms of fidelity by district are reported in table 4.5. CASELOAD RESTRICTIONS. Conventional wisdom suggests that having small caseloads provides agents with more time to dedicate to supervision efforts and better overall recidivism rates (Burrell 2006). Consequently, the GPS supervision protocol restricted caseloads in the following manner:
• GPS agents will maintain a caseload that cannot exceed 20 active cases, 40 passive cases, or an equitable combination of both, as outlined in the GPS caseload matrix.
• GPS parole agents supervise only GPS–monitored parolees. The caseload restriction component was also assessed through the agent survey. The first requirement of this component is that the caseloads for the agents must not exceed 20 active cases, 40 passive cases, or an equitable combination of both. Table 4.3 indicates that overall agents reported a maximum caseload size on any given day in the last month of 28 cases. This figure corresponds relatively well with the caseload size data reported by CDCR where the average caseload size over the 3-year study period was 27 (SD=11.9) cases per agent. More specifically, however, agents with only active caseloads reported a maximum of 21 cases during the last month; agents with mixed caseloads reported a maximum of 34.4 cases; and agents with only passive caseloads reported a maximum of 40 cases. The second requirement is that GPS agents supervise only GPS–monitored parolees. The table indicates that this is true for the vast majority of parolees (89 percent). In terms of fidelity to the program protocol, these findings suggest that the caseload component displayed an extremely high degree of fidelity (0.95) with little variation across districts, as the scores ranged from 0.75 to 1.00 (SD=0.11). The results in terms of fidelity by district are reported in table 4.5. HRSO SCREENING. As discussed in chapter 1, CDCR uses the STATIC–99 risk assessment instrument to estimate the probability of sexual and violent recidivism among adult males who have already been convicted of at least one sexual offense against a child or nonconsenting adult. In California, offenders complete the instrument at least 120 days before release or as soon as practical. Offenders who score a 4 or higher on the STATIC–99 are considered moderate–high (4–5) or high-risk (6+) offenders. The GPS supervision program protocol indicates that all HRSOs must be assessed using the STATIC–99. Specifically, the protocol states that
• All GPS parolees are screened using the STATIC–99.
Table 4.3. Caseload Restrictions of GPS Parole Agents Caseload Size N Mean
Active 21 21.3 Mixed 118 34.4 Passive 9 40.3
Only GPS paroleesa Percent Yes 132 88.5 No 17 11.4
aThe percent reported is the valid percent. Two agents did not respond to the question, and two agents reported that the question was not applicable.
This document is a research report submitted to the U.S. Department of Justice. This report has not been published by the Department. Opinions or points of view expressed are those of the author(s)
and do not necessarily reflect the official position or policies of the U.S. Department of Justice.
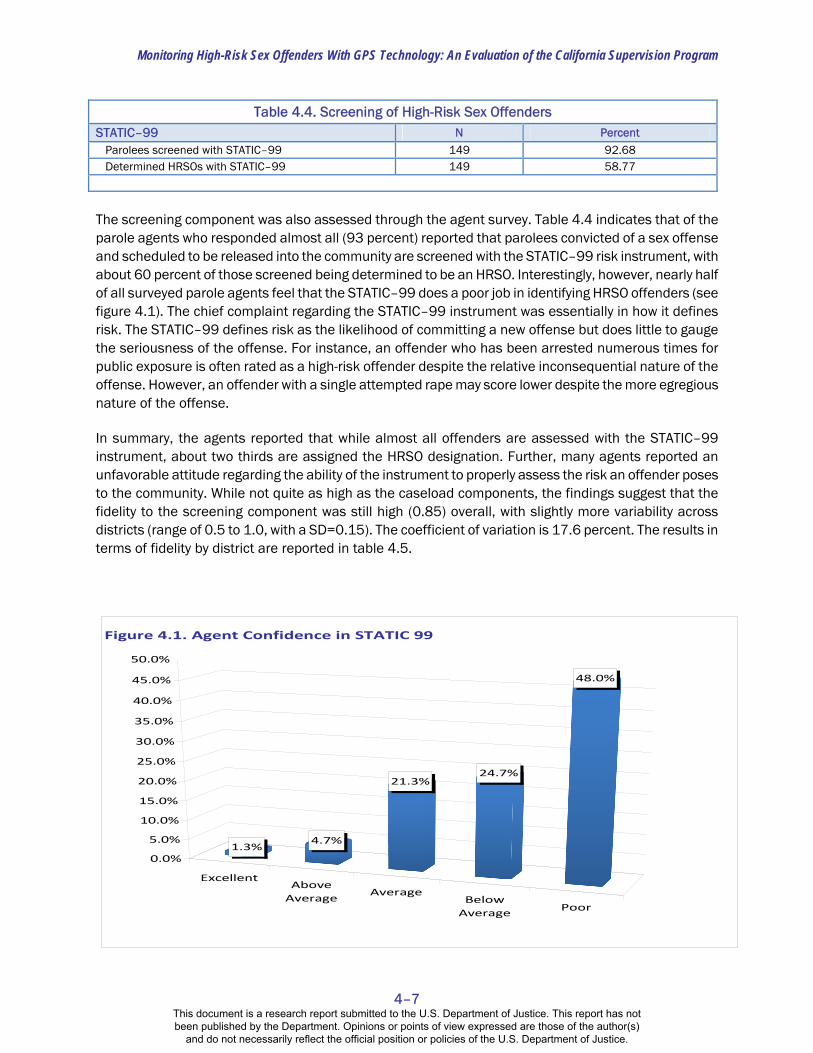
Monitoring High-Risk Sex Offenders With GPS Technology: An Evaluation of the California Supervision Program
4–7
The screening component was also assessed through the agent survey. Table 4.4 indicates that of the parole agents who responded almost all (93 percent) reported that parolees convicted of a sex offense and scheduled to be released into the community are screened with the STATIC–99 risk instrument, with about 60 percent of those screened being determined to be an HRSO. Interestingly, however, nearly half of all surveyed parole agents feel that the STATIC–99 does a poor job in identifying HRSO offenders (see figure 4.1). The chief complaint regarding the STATIC–99 instrument was essentially in how it defines risk. The STATIC–99 defines risk as the likelihood of committing a new offense but does little to gauge the seriousness of the offense. For instance, an offender who has been arrested numerous times for public exposure is often rated as a high-risk offender despite the relative inconsequential nature of the offense. However, an offender with a single attempted rape may score lower despite the more egregious nature of the offense. In summary, the agents reported that while almost all offenders are assessed with the STATIC–99 instrument, about two thirds are assigned the HRSO designation. Further, many agents reported an unfavorable attitude regarding the ability of the instrument to properly assess the risk an offender poses to the community. While not quite as high as the caseload components, the findings suggest that the fidelity to the screening component was still high (0.85) overall, with slightly more variability across districts (range of 0.5 to 1.0, with a SD=0.15). The coefficient of variation is 17.6 percent. The results in terms of fidelity by district are reported in table 4.5.
ExcellentAboveAverage Average
BelowAverage Poor
1.3%4.7%
21.3%24.7%
48.0%
0.0%
5.0%
10.0%
15.0%
20.0%
25.0%
30.0%
35.0%
40.0%
45.0%
50.0%
Figure 4.1. Agent Confidence in STATIC 99
Table 4.4. Screening of High-Risk Sex Offenders STATIC–99 N Percent
Parolees screened with STATIC–99 149 92.68 Determined HRSOs with STATIC–99 149 58.77
This document is a research report submitted to the U.S. Department of Justice. This report has not been published by the Department. Opinions or points of view expressed are those of the author(s)
and do not necessarily reflect the official position or policies of the U.S. Department of Justice.

Monitoring High-Risk Sex Offenders With GPS Technology: An Evaluation of the California Supervision Program
4–8
0.0%
10.0%
20.0%
30.0%
40.0%
50.0%
60.0%
70.0%
80.0%
90.0%
100.0%
Always Frequently Sometimes Rarely Never
Figure 4.2. Parole Orientation
GPS as a specialcondition of parole
Unit charging
Unit care
Inclusion zonerestrictions
Exclusion zonerestrictions
Consequences of non‐compliance
ENROLLMENT AND ORIENTATION. Parole agents are required by statute to present general information to parolees on the laws and policies regarding parole release (i.e., conditions of parole, supervision practices, revocation policies, panel hearings, and any other information that the board deems relevant). The GPS program protocol specifies that 1) agents must explain the conditions of parole, 2) GPS supervision is a condition of parole, and 3) agents must explain to parolees how to care for the GPS unit. Specifically, the protocol states that
• GPS parole agents are responsible for describing the GPS monitoring system as a special condition of parole.
• GPS parole agents are responsible for describing the maintenance of the GPS monitoring system.
• GPS parole agents are responsible for describing the inclusion and exclusion zones in general.* • GPS parole agents are responsible for describing what constitutes noncompliance.
The orientation component was also assessed through the agent survey. Figure 4.2 indicates that the vast majority of agents report that they always or frequently (90 percent or more) explain 1) that GPS supervision is a condition of parole, 2) how to charge the unit, 3) how to care for the unit, and, to a lesser extent, 4) the consequence for noncompliance (89 percent). Interestingly however, only about 60 percent of the agents always or frequently discuss inclusion zone restrictions, and even fewer (about 50 percent) discuss exclusion zone restrictions. These lower figures are the result of the creation of zones being at the discretion of the agent. As noted earlier, agents are now required to create at least three zones for each parolee on their caseload, with one zone required to be an inclusion zone around the residence of the parolee, one inclusion zone that restricts travel to within 25 to 50 miles, and one exclusion zone
*To maintain public safety, GPS parole agents may not describe each zone restriction in explicit detail. For example, agents will inform a parolee that he is to have no contact with the victim and place an exclusion zone around the residence of the victim, but the agent will not disclose the address of the victim and thus the exact location of the exclusion zone.
This document is a research report submitted to the U.S. Department of Justice. This report has not been published by the Department. Opinions or points of view expressed are those of the author(s)
and do not necessarily reflect the official position or policies of the U.S. Department of Justice.

Monitoring High-Risk Sex Offenders With GPS Technology: An Evaluation of the California Supervision Program
4–9
restricting travel outside the state of California. Consequently, the fidelity scores for parole orientation are slightly lower than the previous two components. Nevertheless, the results still translate into a high overall fidelity score (0.83) with very little variability across districts (scores ranged from 0.63 to 0.91; SD=0.08). The coefficient of variation is 9.6. The results in terms of fidelity by district are reported in table 4.5. PAROLE SUPERVISION SPECIFICATIONS. Though early advocates of EM believed that this tool could increase the manageable caseload under supervision, experience with the technology has suggested the opposite. This workload increase stems from multiple factors, such as the need 1) for officers to monitor GPS equipment, to respond to alerts (many of which can be “false” alerts [Elzinga and Nijboer 2006]), 2) to teach offenders how the equipment works, and 3) to ensure that the equipment is maintained and replaced when it fails. In addition, there are many well-documented limitations of this technology. As noted in chapter 1, GPS receivers require an unobstructed view of the sky and often do not perform well because of interference from buildings, terrain, electronics, or sometimes even dense foliage. These obstructions can cause position errors or possibly no position reading at all (see chapter 1 for more detail on limitations). Finally, while GPS units may be able to track where offenders are, they cannot provide information on what they are doing. Consequently, the use of GPS is considered a tool of the sex offender supervision program. It is not designed to replace traditional parole supervision but rather to augment it with additional information otherwise unavailable to the agent. To integrate these two approaches, the GPS program protocol details specific GPS and field contact responsibilities for the agents. The responsibilities for each category are as follows in parts A and B below: Part A. GPS supervision
• GPS parole agents must review the notification reports at regular intervals.* • GPS parole agents must conduct a track review of each parolee in the community at regular
intervals.* • GPS parole agents must respond to all GPS alert notifications.
Part B. Field contact supervision
• A GPS agent must meet face to face with the parolee within a specific number* of days after release.
• A GPS agent must meet at the parolee’s residence within a specific number* of days after release.
• A GPS agent must conduct a minimum number* of face-to-face contacts with the parolee each month.
• A GPS agent must conduct a minimum number* of face-to-face contacts at the offender’s residence each quarter.
• GPS agents must conduct a minimum number* of collateral contacts per month. • GPS parolees must attend sex offender treatment (individual and group therapy) weekly.
The use of GPS monitoring (part A) of the integrated supervision component was assessed through the agent survey. The first requirement of this component is that the parole agents must review the Daily Notification Report (DNR) for each offender on their caseload at regular intervals. Ninety-one percent of the parole agents who responded reported that they review the DNR on a daily basis. Interestingly, *The exact number is known to the researchers. However, at the request of CDCR and to preserve the integrity of the parole program, this figure is omitted from the final report.
This document is a research report submitted to the U.S. Department of Justice. This report has not been published by the Department. Opinions or points of view expressed are those of the author(s)
and do not necessarily reflect the official position or policies of the U.S. Department of Justice.

Monitoring High-Risk Sex Offenders With GPS Technology: An Evaluation of the California Supervision Program
4–10
0.0%
10.0%
20.0%
30.0%
40.0%
50.0%
60.0%
70.0%
80.0%
Within 15 minutes Within 30 minutes Within 1 hour Within 6 hours More than 6 hours
Figure 4.3. Responding to GPS Alerts
Exclusion zone alert
Inclusion zone alert
Strap tamper not cleared in 5 minutes
Message gap exceeding 24 hours
despite the fact that the agents review the DNR daily, only 68 percent of the parole agents reported that the DNR was “quite a bit helpful” in supervising parolees. The second requirement of this component is that the parole agents must review the tracks for each offender on their caseload at regular intervals. The percent who review tracks at least once a day, however, drops to 80 (compared with the DNR report), and as many as 5 percent reported that they review tracks only once a week or less. Interestingly, despite the fact that most agents review the DNR daily, only 79 percent of the parole agents reported that the DNR was “quite a bit helpful” in supervising parolees. The third requirement is that the parole agents must respond to all GPS alert notifications.* Figure 4.3 indicates how quickly parole agents reported that they respond to various alerts. A plurality of parole agents reported that they respond to each alert type within 15 minutes. However, the responses varied by event (consistent with program protocol). Almost all agents (91 percent) reported that they responded to exclusion zone alerts within 30 minutes, but this percentage decreases significantly for inclusion (77 percent), strap tamper (82 percent), and cell communication gap (57 percent) alerts. The reason for this decline is that the protocols differ for each alert type. For instance, the system protocol for a cell communication gap event provides a specified grace period† to permit the parolee to get within range of a cell tower (see section D of this chapter for more detailed information) before the agent is notified of the alert. In addition, many inclusion zone events do not generate an alert, as they are purely for informational purposes where agents can monitor the movements of a subject. As a result, roughly half of the agents reported that a response to an inclusion zone alert was not applicable (not shown). These results translate into a fidelity score that was slightly less than previous components (0.71) yet still indicates that 71 percent of the program component was implemented according to protocol, albeit with a fair degree of variability across districts (range of 0.49 to 1.00; SD=0.11). The results in terms of fidelity by district appear in table 4.5.
*The protocol at the time of the study did not require a log of specific actions be taken to clear the alert. The revised protocol (currently in place) remedies this issue by requiring agents to resolve all GPS alerts by clearing and noting actions for resolution in the vendor database. †The exact grace period is known to the researchers. However, at the request of CDCR and to preserve the integrity of the parole program, this figure is omitted from the final report.
This document is a research report submitted to the U.S. Department of Justice. This report has not been published by the Department. Opinions or points of view expressed are those of the author(s)
and do not necessarily reflect the official position or policies of the U.S. Department of Justice.
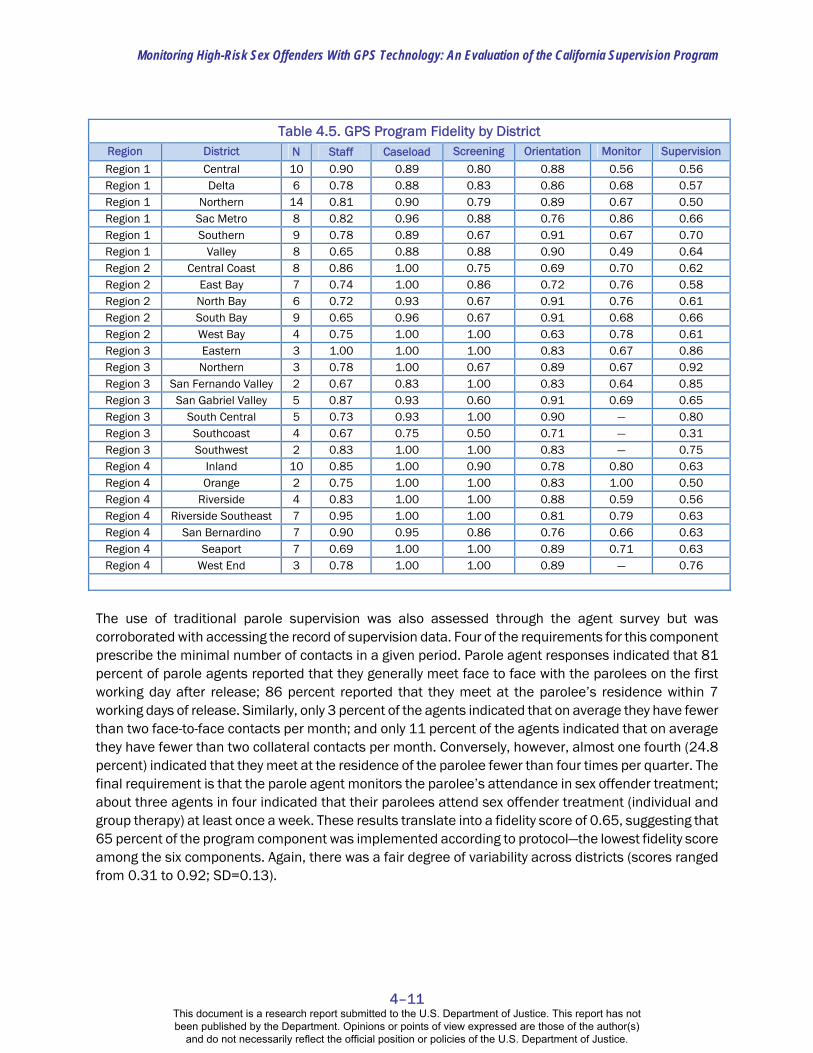
Monitoring High-Risk Sex Offenders With GPS Technology: An Evaluation of the California Supervision Program
4–11
The use of traditional parole supervision was also assessed through the agent survey but was corroborated with accessing the record of supervision data. Four of the requirements for this component prescribe the minimal number of contacts in a given period. Parole agent responses indicated that 81 percent of parole agents reported that they generally meet face to face with the parolees on the first working day after release; 86 percent reported that they meet at the parolee’s residence within 7 working days of release. Similarly, only 3 percent of the agents indicated that on average they have fewer than two face-to-face contacts per month; and only 11 percent of the agents indicated that on average they have fewer than two collateral contacts per month. Conversely, however, almost one fourth (24.8 percent) indicated that they meet at the residence of the parolee fewer than four times per quarter. The final requirement is that the parole agent monitors the parolee’s attendance in sex offender treatment; about three agents in four indicated that their parolees attend sex offender treatment (individual and group therapy) at least once a week. These results translate into a fidelity score of 0.65, suggesting that 65 percent of the program component was implemented according to protocol—the lowest fidelity score among the six components. Again, there was a fair degree of variability across districts (scores ranged from 0.31 to 0.92; SD=0.13).
Table 4.5. GPS Program Fidelity by District Region District N Staff Caseload Screening Orientation Monitor Supervision
Region 1 Central 10 0.90 0.89 0.80 0.88 0.56 0.56 Region 1 Delta 6 0.78 0.88 0.83 0.86 0.68 0.57 Region 1 Northern 14 0.81 0.90 0.79 0.89 0.67 0.50 Region 1 Sac Metro 8 0.82 0.96 0.88 0.76 0.86 0.66 Region 1 Southern 9 0.78 0.89 0.67 0.91 0.67 0.70 Region 1 Valley 8 0.65 0.88 0.88 0.90 0.49 0.64 Region 2 Central Coast 8 0.86 1.00 0.75 0.69 0.70 0.62 Region 2 East Bay 7 0.74 1.00 0.86 0.72 0.76 0.58 Region 2 North Bay 6 0.72 0.93 0.67 0.91 0.76 0.61 Region 2 South Bay 9 0.65 0.96 0.67 0.91 0.68 0.66 Region 2 West Bay 4 0.75 1.00 1.00 0.63 0.78 0.61 Region 3 Eastern 3 1.00 1.00 1.00 0.83 0.67 0.86 Region 3 Northern 3 0.78 1.00 0.67 0.89 0.67 0.92 Region 3 San Fernando Valley 2 0.67 0.83 1.00 0.83 0.64 0.85 Region 3 San Gabriel Valley 5 0.87 0.93 0.60 0.91 0.69 0.65 Region 3 South Central 5 0.73 0.93 1.00 0.90 — 0.80 Region 3 Southcoast 4 0.67 0.75 0.50 0.71 — 0.31 Region 3 Southwest 2 0.83 1.00 1.00 0.83 — 0.75 Region 4 Inland 10 0.85 1.00 0.90 0.78 0.80 0.63 Region 4 Orange 2 0.75 1.00 1.00 0.83 1.00 0.50 Region 4 Riverside 4 0.83 1.00 1.00 0.88 0.59 0.56 Region 4 Riverside Southeast 7 0.95 1.00 1.00 0.81 0.79 0.63 Region 4 San Bernardino 7 0.90 0.95 0.86 0.76 0.66 0.63 Region 4 Seaport 7 0.69 1.00 1.00 0.89 0.71 0.63 Region 4 West End 3 0.78 1.00 1.00 0.89 — 0.76
This document is a research report submitted to the U.S. Department of Justice. This report has not been published by the Department. Opinions or points of view expressed are those of the author(s)
and do not necessarily reflect the official position or policies of the U.S. Department of Justice.
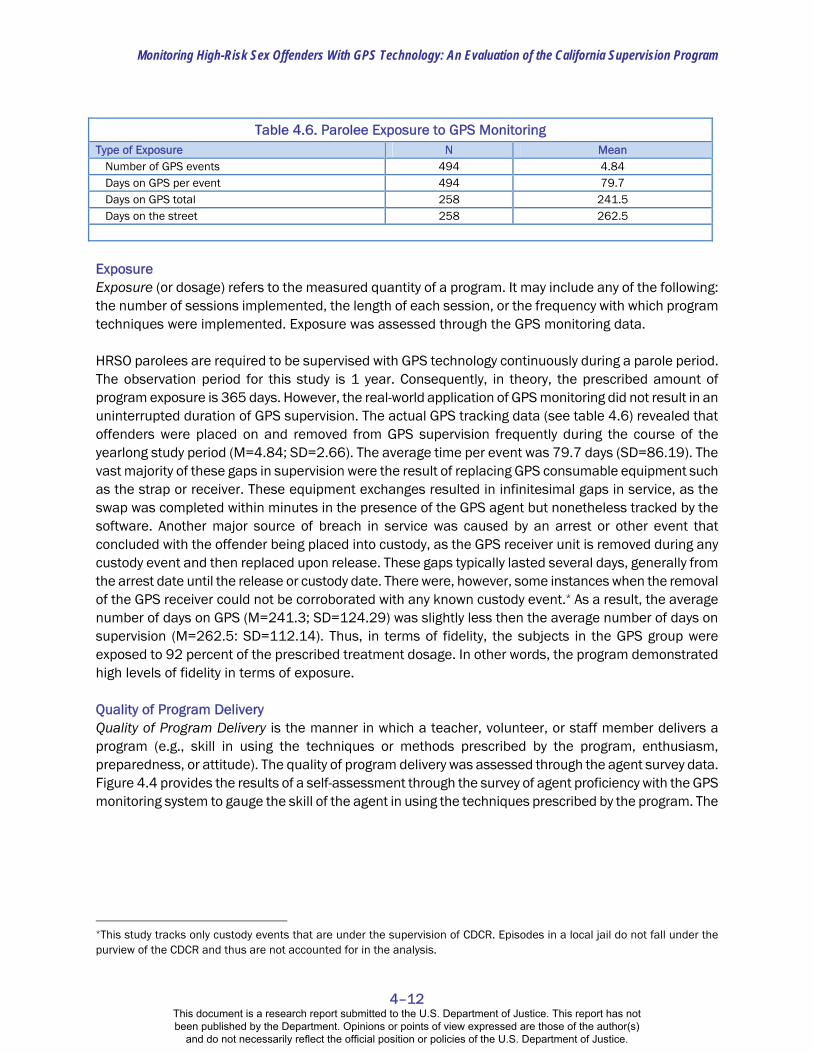
Monitoring High-Risk Sex Offenders With GPS Technology: An Evaluation of the California Supervision Program
4–12
Exposure Exposure (or dosage) refers to the measured quantity of a program. It may include any of the following: the number of sessions implemented, the length of each session, or the frequency with which program techniques were implemented. Exposure was assessed through the GPS monitoring data. HRSO parolees are required to be supervised with GPS technology continuously during a parole period. The observation period for this study is 1 year. Consequently, in theory, the prescribed amount of program exposure is 365 days. However, the real-world application of GPS monitoring did not result in an uninterrupted duration of GPS supervision. The actual GPS tracking data (see table 4.6) revealed that offenders were placed on and removed from GPS supervision frequently during the course of the yearlong study period (M=4.84; SD=2.66). The average time per event was 79.7 days (SD=86.19). The vast majority of these gaps in supervision were the result of replacing GPS consumable equipment such as the strap or receiver. These equipment exchanges resulted in infinitesimal gaps in service, as the swap was completed within minutes in the presence of the GPS agent but nonetheless tracked by the software. Another major source of breach in service was caused by an arrest or other event that concluded with the offender being placed into custody, as the GPS receiver unit is removed during any custody event and then replaced upon release. These gaps typically lasted several days, generally from the arrest date until the release or custody date. There were, however, some instances when the removal of the GPS receiver could not be corroborated with any known custody event.* As a result, the average number of days on GPS (M=241.3; SD=124.29) was slightly less then the average number of days on supervision (M=262.5: SD=112.14). Thus, in terms of fidelity, the subjects in the GPS group were exposed to 92 percent of the prescribed treatment dosage. In other words, the program demonstrated high levels of fidelity in terms of exposure. Quality of Program Delivery Quality of Program Delivery is the manner in which a teacher, volunteer, or staff member delivers a program (e.g., skill in using the techniques or methods prescribed by the program, enthusiasm, preparedness, or attitude). The quality of program delivery was assessed through the agent survey data. Figure 4.4 provides the results of a self-assessment through the survey of agent proficiency with the GPS monitoring system to gauge the skill of the agent in using the techniques prescribed by the program. The
*This study tracks only custody events that are under the supervision of CDCR. Episodes in a local jail do not fall under the purview of the CDCR and thus are not accounted for in the analysis.
Table 4.6. Parolee Exposure to GPS Monitoring Type of Exposure N Mean
Number of GPS events 494 4.84 Days on GPS per event 494 79.7 Days on GPS total 258 241.5 Days on the street 258 262.5
This document is a research report submitted to the U.S. Department of Justice. This report has not been published by the Department. Opinions or points of view expressed are those of the author(s)
and do not necessarily reflect the official position or policies of the U.S. Department of Justice.

Monitoring High-Risk Sex Offenders With GPS Technology: An Evaluation of the California Supervision Program
4–13
29.5%
44.5%
70.0%
1.4% 0.0%0.0%
20.0%
40.0%
60.0%
80.0%
Excellent Above Average Average Below Average Poor
Figure 4.4. Agent Proficiency With GPS Monitoring
data indicate that more than 70 percent of the agents polled considered themselves excellent or above average with the system. In addition, Figure 4.5 reports the assessment of the degree to which agents had a positive attitude toward the GPS supervision program. The data indicate an overwhelming positive support for the use of GPS technology as a monitoring tool. Specifically, more than 80 percent of the agents who responded agreed or strongly agreed that the GPS monitoring system is a reliable tracking tool, and more than 90 percent felt that GPS enhanced traditional parole supervision. Moreover, more than 75 percent felt that GPS supervision provided more public safety than traditional parole supervision. Interestingly, this positive attitude toward GPS supervision was found in lieu of the majority of agents (89 percent) reporting that GPS monitoring is more time intensive than traditional supervision. Overall, these findings suggest that in terms of quality of delivery, the GPS program was delivered with proficient skill and a positive attitude. In other words, again, the program demonstrated a high level of fidelity.
0.0%
10.0%
20.0%
30.0%
40.0%
50.0%
60.0%
70.0%
Strongly Agree Agree Undecided Disagree Strongly Disagree
Figure 4.5. Feelings Regarding the GPS Monitoring System
GPS monitoring is a reliable trackingtool for parole agents.
GPS monitoring is more time intensivethan traditional parole supervision.
GPS monitoring enhances traditionalparole supervision.
GPS monitoring diminishes the need forface to face parole supervision.
GPS monitoring of parolees providesmore pubic safety than traditionalparole supervision.GPS monitoring decreases the criminalbehavior of parolees.
GPS monitoring increases theprobability that the criminal behaviorof parolees is detected.
This document is a research report submitted to the U.S. Department of Justice. This report has not been published by the Department. Opinions or points of view expressed are those of the author(s)
and do not necessarily reflect the official position or policies of the U.S. Department of Justice.

Monitoring High-Risk Sex Offenders With GPS Technology: An Evaluation of the California Supervision Program
4–14
Program Differentiation Program Differentiation identifies the unique features of different components or programs that are reliably differentiated from one another. As noted above, there are five core program components of the GPS program. However, the subjects in the control groups were subject to all of the program components save one: GPS monitoring. The single difference between traditional parole supervision and GPS supervision is the use of GPS technology as a monitoring tool. Consequently, traditional parole supervision should be differentiated from GPS supervision by the absence of GPS monitoring. We use GPS monitoring data to assess program differentiation. Table 4.7 indicates, as expected, that GPS parolees spent a significant amount of time (242 days) under GPS supervision while the control group was not monitored by GPS supervision at all. Again, the program demonstrated a high degree of fidelity in that the program was visibly differentiated from traditional supervision.
D. GPS Monitoring GPS Events and Notifications As indicated in chapter 1, there are numerous different events recorded by the monitoring center and subsequent reports of GPS rule violations that are transmitted to the supervising parole agent through a text message. These event types include a low battery, a strap/device tamper, an inclusion/exclusion zone, a cell communication gap, and no GPS communication. A low-battery event indicates that the battery must be charged. A strap/device event denotes a tamper with the strap or receiver itself. An inclusion event indicates a breach of an inclusion zone parameter. The most common inclusion zone is a curfew within the parolee’s residence at night. An exclusion event points to the presence of the parolee within an excluded area, for example a school or strip club. A cell communication gap indicates an interruption in the communication signal between the cell towers and the device. Finally, a no-GPS-communication event indicates a problem in the communication signal between the satellite system and the device. The following section first examines the prevalence and duration of each event type and then the notifications generated by these events. The total number of events and notifications are described in table 4.8, and the events per parolee as well as the duration of each event type are described in table 4.9.
Table 4.7. Program Differentiation Between GPS and Traditional Supervision Control GPS Mean SD Mean SD T–Value GPS Supervisiona 0 0 241.5 124.1 n/a
Note: Sample size: GPS group= 258; control group=258. aNumber of days on GPS.
* p < .05. ** p < .01. *** p < .001.
This document is a research report submitted to the U.S. Department of Justice. This report has not been published by the Department. Opinions or points of view expressed are those of the author(s)
and do not necessarily reflect the official position or policies of the U.S. Department of Justice.

Monitoring High-Risk Sex Offenders With GPS Technology: An Evaluation of the California Supervision Program
4–15
Data regarding events and the notifications were obtained from the GPS vendors for the study period.* Table 4.8 indicates that overall there were 30,136 GPS–related events† recorded for the GPS sample (N=257) over the 1-year study period. The most frequent events were inclusion zone events, which at 17,961 accounted for 59.6 percent of all events. The rarest GPS events were exclusion violations. These accounted for fewer than 1.0 percent of all events. While the low number of exclusion zone violations is not surprising given the initial discretionary handling of zone creation (see section on program fidelity), in comparison, the number of inclusion zone events is relatively high. This makes intuitive sense, however, given the knowledge that parole agents use inclusion zones to monitor many functional areas—but often for purely informational purposes, where agents can monitor compliance without the system generating an official notification. These areas can include but are not limited to work or study locations during the day, residence of record during the night, and required treatment sessions. Moreover, the median duration of inclusion zone events is just under 3 minutes (see table 4.9), indicating how short many of these events are. They may be due to numerous factors, not excluding technical malfunction, related to the specific information entered by the GPS parole agent. They may also be due to short unforeseeable spells outside a certain zone (e.g., to lunch at a worksite, or to a corner shop from the residence), or the parolee may not even be aware of the zone. In any event, the GPS monitoring system will monitor and record all these movements and breaches without discrimination. Subsequent to the recording of an event, the monitoring system can send an alert notification to a supervising parole agent to analyze and appropriately respond to the information contained within the notification. In total, there were 7,104 text notifications sent to parole agents during the study period—nearly half of which (47.4 percent) were in relation to a strap/device tamper event, and just over one fifth in relation to a low-battery event. These figures can be transformed into a notification rate (i.e., the proportion of each event type that results in a notification) to gauge which event triggers the most notifications. For example, of the 30,140 events overall, 23.6 percent resulted in a parole agent alert notification. The event most likely to result in a notification was a strap/device tamper (85.3 percent). Other occurrences with a high agent notification rate were exclusion zone and low-battery events, with 67.2 percent and 61.2 percent respectively. Interestingly, despite the prevalence identified in the previous table, occurrences of GPS communication errors generated an extremely low notification rate,
*While all assignment history records were obtained, the notification history of a single offender was missing. †This figure does not include a substantial number of charger alerts (N=143,000), signifying that the subject was charging the unit. The charger alerts were excluded from the analysis because it was reasoned that the low-battery alert captured a similar activity and that simply charging the device added little substantive knowledge to an analysis of GPS monitoring.
Table 4.8. GPS Events and Notifications
GPS Event Type Number of Events (%) Number of
Notifications (%) Notification Rate
Inclusion 17,961 (59.6%) 1,868 (26.3%) 10.4% Exclusion 290 (1.0%) 195 (2.7%) 67.2%
Battery 2,363 (7.8%) 1,442 (20.3%) 61.2%
Strap/Device 3,944 (13.1%) 3,365 (47.4%) 85.3%
Cell Communication Gap 1,545 (5.1%) 158 (2.2%) 10.2%
No GPS Communication 4,033 (13.4%) 76 (1.1%) 1.9%
Total 30,136 (100%) 7,104 (100%) 23.6%
Note: GPS data for the study period were available for all but one treatment group parolee (N=257).
This document is a research report submitted to the U.S. Department of Justice. This report has not been published by the Department. Opinions or points of view expressed are those of the author(s)
and do not necessarily reflect the official position or policies of the U.S. Department of Justice.

Monitoring High-Risk Sex Offenders With GPS Technology: An Evaluation of the California Supervision Program
4–16
as did cell communication gaps and inclusion events, with 10.23 percent and 10.40 percent respectively. The lower-than-expected notification rates for some of these event types must be tempered by the protocol and practical application that governs each event. In some cases, the mere recording of an event does not signify a violation, and thus no notification is transmitted; some events must exceed a specified duration to qualify as an actual violation and thus generate a notification. For instance, the CDCR protocol at the start of the study period required that a low-battery event exceed 10 minutes in duration to qualify as a violation. This protocol was established to relieve the agents from responding to the high number of events generated by offenders’ forgetting to charge the battery of the device. Taking this duration specification into account, 1,773 low-battery events lasted longer than 10 minutes, resulting in 1,353 notifications, raising the level of low-battery notifications from 61.2 percent to 76.4 percent. Similarly, as mentioned above, the CDCR protocol required that a cell communication gap must exceed an explicit timeframe* to qualify as a violation. Of the 1,545 cell communication gap events, only 202 lasted long enough to be considered violations. Of these violations, 150 (74 percent) resulted in an agent notification. In other cases, as described above, the events are generated purely for informational purposes, where agents can monitor the movements of a subject without the system generating an official notification. For instance, only 10 percent of inclusion events result in a notification. While it is not possible to be certain with the available data, it is likely that many of the inclusion zone events not associated with an alert notification are solely informational and do not constitute an actual violation. Another example of an informational event stems from interruptions in the communication between the receiver and the satellite, where only 2 percent of all no GPS communication events resulted in an alert being sent to an agent. Again, this low figure is expected, as the protocol does not specify a notification requirement because of the frequency with which an offender can enter and exit an area where no GPS service is available. In fact, GPS communication events are the second-most-frequent event (13.4 percent), exceeded only by inclusion events. The result of these protocol-based adjustments reveals that three of the six event types (low battery, strap/device, and cell communication gap) resulted in a notification rate of 70 percent or better.† Unfortunately, it was not feasible to calculate a practical notification rate for the other three alert types (inclusion, exclusion alerts, and GPS), as they are skewed by the real-world application of the alerts. Table 4.9 displays the GPS data per parolee. The mean number of GPS events per parolee was 117.3, with a median of 77 events. Not surprisingly, the most prevalent type of event recorded by the software for each offender was a no-GPS-communication event (91.1 percent), indicating that most offenders entered at one time or another a position where no GPS service was available (i.e., an indoor structure where the GPS signal could not penetrate). The least common event (again, not terribly surprisingly) was for an exclusion zone violation, which was recorded for 10.1 percent of parolees. All parolees had at least one event recorded by the GPS software. Unfortunately, there are no data available to interpret *Again, the exact timeframe is known to the researchers. However, at the request of CDCR and to preserve the integrity of the parole program, this figure is omitted from the final report. †The refinement of the program protocol to adjust for the real-world application during the course of the study (noted above) was problematic in the assessment of alert notification. In addition, it is possible that programming issues and data entry mistakes led to errors in the notification alert system. Consequently, the notification rate did not as expected approximate 100 percent even after accounting for the protocol-based adjustments.
This document is a research report submitted to the U.S. Department of Justice. This report has not been published by the Department. Opinions or points of view expressed are those of the author(s)
and do not necessarily reflect the official position or policies of the U.S. Department of Justice.

Monitoring High-Risk Sex Offenders With GPS Technology: An Evaluation of the California Supervision Program
4–17
whether the cause of these events was the consequence of parole behavior, an equipment malfunction, or another innocuous origin. The duration of GPS events varied widely within each event type (as can be seen by the differences between the means and median in table 4.9) as well as across event types. Overall, the Winsorized mean length of all events was just under 178 minutes (or just under 3 hours).* The median length of any event was a mere 6.18 minutes. As one would expect, a cell communication gap event was the type with the longest median duration (583 minutes). This figure translates to roughly 10 hours, which (perhaps not coincidently) roughly matches the length of time spent indoors during a typical work day or at home during the night. Conversely, a strap/device event (which can often be caused by accidently striking the device) was the shortest type, with a median duration of roughly 2 minutes. Finally, the mean number of devices placed on GPS subjects during the study period was 2.89 (SD=1.46), suggesting that roughly three GPS devices were used to monitor each parolee during the 1-year study period (not shown). Equipment Problems The pilot study reported a plethora of equipment malfunctions and problems. The report found that the “dominant implementation challenge for the GPS agents in San Diego County in the early months of the GPS program was problems with the equipment…. Agents were devoting most of their time to calling parolees, verifying that they had not cut the units off, addressing charging problems, and switching straps” (Turner and Jannetta 2007, 10) rather than monitoring the parolees. This study examined the degree to which the equipment issues had been resolved in the months following the pilot study. Figure 4.6 reports the level of problems currently being experienced by parole agents. The table suggests that, as one would expect, the level of equipment problems has decreased significantly since the implementation of the pilot program. The majority of agents reported rarely or never experiencing the following problems: Internet access (74 percent); cellular service (77 percent); unit failure (65 percent); unit charging (61 percent). Nevertheless, problems with the equipment still exist. The biggest equipment problems stem from strap failures and drift. In fact, 16 percent of the agents reported always or frequently experiencing problems with strap tampers, while 37 percent of the agents reported always or frequently experiencing programs with drift. The latter is perhaps less surprising, as drift is caused less by hardware failure and more by geographical anomalies that the current equipment cannot overcome (see chapter 1 for more details on the limitations of GPS technology).
*Notably, the ‘raw’ mean duration of events was just over 26 hours, which was due mainly to a small number of extremely lengthy no-GPS-communication events.
Table 4.9. Percentage of Parolees With GPS Events and Duration of Event by Event Type Parolees Number of Events Duration of Events GPS Event Type Percent Mean Median Mean Median
Inclusion 66.9 69.90 26 65.1 2.98 Exclusion 10.1 1.13 0 12.31 4.13
Battery 61.5 9.19 1 170.43 44.83
Strap/Device 83.7 15.35 3 28.45 2.02
Cell Communication Gap 74.7 6.01 1 707.5 583.63
No GPS Communication 91.1 15.69 4 636.64 572.4
Any Event 100 117.28 77 177.51 6.18 Note: GPS data for the study period were available for all but one treatment group parolee (N=257). The mean durations are Winsorized for the top and bottom 2.5 percent of values (95 percent Winsorization).
This document is a research report submitted to the U.S. Department of Justice. This report has not been published by the Department. Opinions or points of view expressed are those of the author(s)
and do not necessarily reflect the official position or policies of the U.S. Department of Justice.

Monitoring High-Risk Sex Offenders With GPS Technology: An Evaluation of the California Supervision Program
4–18
0.0%
10.0%
20.0%
30.0%
40.0%
50.0%
60.0%
Always Frequently Sometimes Rarely Never
Figure 4.6. GPS Equipment Problems
Internet Access
Cellular Service Access
Unit Failure
False Strap Tamper Alert
Unit Chargin Malfunction
Drift
E. Summary This process evaluation was designed to determine whether the program was delivered as designed and to provide an understanding of the program context. This chapter concentrated on adherence, exposure, quality of program delivery, and program differentiation as means of assessing overall fidelity. Overall, the GPS program demonstrated a high degree of fidelity across each dimension. A summary of each dimension is provided below: Adherence refers to whether the program service or intervention is being delivered as it was designed. In this case, the program was composed of five core components: program staffing requirements, caseload restrictions, HRSO parolee screening, parolee enrollment and orientation specifications, and parole supervision specifications. The findings demonstrate that while there was some variation across districts, the overall program fidelity was high* in terms of adherence to program staffing requirements (0.75), caseload restrictions (0.95), parolee screening (0.85), and parolee enrollment and orientation (0.83). In terms of parole supervision specifications, the overall program fidelity was average. It was estimated that roughly 71 percent of the GPS supervision requirement and 65 percent of the field contact requirement was implemented as designed. It should be noted, however, that the incompatibility of the zone creation requirement in the protocol and the discretionary use in practice likely lowered the GPS supervision score. As CDCR has corrected this anomaly in a new protocol, it is likely that fidelity to the current practice is much higher. Exposure refers to the measured quantity of a program. The GPS tracking data revealed that offenders were placed on and removed from GPS supervision frequently during the course of the yearlong study period (M=4.84; SD=2.66). The vast majority of these gaps in supervision were the result of replacing GPS consumable equipment such as the strap or receiver and arrests or other events that resulted with the offender being placed into custody. As a result, the average number of days on GPS (M=241.3; SD=124.29) was slightly less then the average number of days on supervision (M=262.5: SD=112.14).
*High equals above 75 percent. Average is 50 percent to 74 percent. Poor is less than 50 percent.
This document is a research report submitted to the U.S. Department of Justice. This report has not been published by the Department. Opinions or points of view expressed are those of the author(s)
and do not necessarily reflect the official position or policies of the U.S. Department of Justice.

Monitoring High-Risk Sex Offenders With GPS Technology: An Evaluation of the California Supervision Program
4–19
Nevertheless, the program demonstrated a high degree of fidelity in terms of exposure, with subjects on average receiving 92 percent of the prescribed treatment dosage. Quality of program delivery is the manner in which a teacher, volunteer, or staff member delivers a program (e.g., skill in using the techniques or methods prescribed by the program, enthusiasm, preparedness, or attitude). The findings indicate that more than 70 percent of the agents polled considered themselves excellent or above average with the system, and more than 80 percent of the agents who responded demonstrated a positive attitude toward the GPS supervision program. Taking these two scores together, the program demonstrated a high degree of fidelity in terms of quality program delivery. Program differentiation identifies the unique features of different components or programs that are reliably differentiated from one another. The single difference between traditional parole supervision and GPS supervision is the use of GPS technology as a monitoring tool. The findings indicate that GPS parolees spent a significant amount of time (242 days) under GPS supervision, while the control group was not monitored by GPS supervision at all. Again, the program demonstrated a high degree of fidelity in that the program was visibly differentiated from traditional supervision. Finally, an analysis of the GPS monitoring data was relatively consistent; the conclusions of the pilot study suggest that the alert levels are constant over time. Both studies found that the strap/device alerts were among the most prevalent alerts.* Conversely, while the pilot study reported a plethora of equipment malfunctions and problems, the level of equipment issues has decreased significantly. Most agents reported rarely or never experiencing problems such as Internet access, cellular service, unit failure, or unit charging. Even so, some problems with the equipment persist. The biggest equipment problems stem from strap failures and from drift. The latter is not unexpected, as drift is caused not by hardware failure but by geographical anomalies that the current equipment cannot overcome.
*The pilot study did not assess the prevalence of GPS alerts.
This document is a research report submitted to the U.S. Department of Justice. This report has not been published by the Department. Opinions or points of view expressed are those of the author(s)
and do not necessarily reflect the official position or policies of the U.S. Department of Justice.

This document is a research report submitted to the U.S. Department of Justice. This report has not been published by the Department. Opinions or points of view expressed are those of the author(s)
and do not necessarily reflect the official position or policies of the U.S. Department of Justice.

Monitoring High-Risk Sex Offenders With GPS Technology: An Evaluation of the California Supervision Program
5–1
5. Discussion
A. SUMMARY Only a few earlier studies have carefully examined the effectiveness of global positioning system (GPS) monitoring, and even fewer have concentrated on its effects on sex offenders. The results of this study suggest that the use of GPS monitoring integrated into a traditional parole supervision regime and combined with treatment is associated with lower recidivism and fewer compliance problems than the average expected outcome, had the same subjects received traditional supervision and sex offender treatment alone. As one of the most rigorous evaluations yet reported on the effectiveness of GPS monitoring, this study provides evidence that similar programs may be effective in reducing recidivism. The GPS and control groups were well matched in this study after the use of propensity score adjustments for numerous pretreatment characteristics. At baseline, mean scores on a wide range of demographic and pretreatment characteristics were remarkably similar between the groups. Despite these baseline similarities, a clear pattern of divergence in outcomes emerged during the 1-year study period. The subjects in the GPS group demonstrated significantly better outcomes for both compliance and recidivism. In terms of compliance, the multivariate model showed that the hazard ratio of a sex-related violation was nearly three times as great for the subjects who received traditional parole supervision as for the subjects who received the GPS supervision. In terms of recidivism, compared with the subjects who received the GPS monitoring supervision, the hazard ratio for any arrest was more than twice as high among the subjects who received traditional parole supervision. Similarly, for both a parole revocation and any return-to-custody event, the hazard ratio suggests that these events were about 38 percent higher among the subjects who received traditional parole supervision. In addition, there was also some evidence that the number of days until a new conviction was greater for the GPS monitored parolees. There was no evidence of differential effects for offender type or risk level. Overall, while one might have hypothesized that the greater the supervision the more likely and quicker the detection of noncompliance and recidivism, it appears that GPS acts as a useful supervision tool, reducing the likelihood and increasing the time until these events. This study also provides details on the cost of the GPS monitoring program in comparison with the cost of traditional supervision. The analysis found that the cost of the GPS program is $35.96 per day per parolee, while the cost of traditional supervision is $27.45 per day per parolee—a difference of $8.51. However, the results favored the GPS group in terms of both noncompliance and recidivism. In other words, the GPS monitoring program is more expensive but more effective. Specifically, compared with traditional parole supervision, GPS monitoring costs less than $1.00 per day per offender to obtain a 1 percent decrease in arrests. Similarly, GPS monitoring costs about $11.00 per day per offender to obtain a 1 percent decrease in custody returns in the year following release. Finally, this study also provides evidence regarding the degree to which the program services were delivered as designed. The results show that that the California Department of Corrections and Rehabilitation (CDCR) developed a protocol for the program and, for the most part, followed the protocol while implementing the program. Overall the process evaluation reveals that the GPS program was implemented with a high degree of fidelity across the four dimensions examined: adherence, exposure, quality of program delivery, and program differentiation.
This document is a research report submitted to the U.S. Department of Justice. This report has not been published by the Department. Opinions or points of view expressed are those of the author(s)
and do not necessarily reflect the official position or policies of the U.S. Department of Justice.

Monitoring High-Risk Sex Offenders With GPS Technology: An Evaluation of the California Supervision Program
5–2
B. POLICY IMPLICATIONS Any time a parolee commits a crime while on GPS monitoring, the story makes newspaper headlines. Even more dramatic is when the released subject is a sex offender and commits a heinous sex crime while on GPS monitoring. For instance, in 2009 California Inspector General David Shaw issued a 40-page indictment of the state’s parole system for its failure to keep track of Phillip Garrido, the convicted sex offender arrested for the 1991 kidnapping of Jaycee Lee Dugard. Despite his criminal history, Garrido was placed in April 2008 on the passive GPS monitoring program so his movements were not as closely monitored as those of HRSOs. Moreover, the report indicated that agents ignored numerous no-signal alerts from Garrido’s monitoring system and that the agents should have investigated the cause of this abnormality and documented their findings in the parole file (Shaw 2009). While each and every one of these stories is emotionally wrenching on an individual level and should not be disregarded, it would be poor public policy to base the supervision of HRSOs on a handful of horrific cases that are perhaps aberrations from the norm. Moreover, a case such as Garrido’s is really an unfair indictment of the GPS monitoring system. While the likelihood and length of incarceration for sex offenders has increased recently, most are at some point released into the community (Center for Sex Offender Management 2001). Upon release from prison, few sex offenders are allowed to return to the community without supervision, as multiple mechanisms have been developed to supervise and handle sex offenders upon their release. These include assessment, civil commitment, treatment, and specific tools for supervision, such as specialized caseloads and electronic monitoring (see chapter 1 for more details on these mechanisms). So, unless policymakers are prepared to place these offenders in prison for the rest of their lives, the question is not whether GPS monitoring is better than prison. The real policy question is whether GPS monitoring is better than these other options in maintaining public safety—and at what cost. Specifically, in this study the question is whether GPS monitoring in combination with traditional parole and sex offender treatment can supervise HRSOs in the community better than traditional parole combined with sex offender treatment alone. While the results of this study suggest that in its current form GPS monitoring is a useful tool in the supervision of HRSOs, we also found that the GPS monitoring program is more expensive—costing about $8.51 more per offender per day than traditional parole supervision. Policymakers can be left to decide if the cost of this iteration is worth the benefit. Nevertheless, numerous policy recommendations borne from the observations and findings of this study could improve the effectiveness and/or reduce the costs of the program to make it more cost effective and thus more attractive to policymakers. These recommendations begin below. Reexamine the Identification of HRSOs The findings from this evaluation suggest that, while almost all parolees convicted of a sex offense and scheduled to be released into the community are screened with the Static–99 risk instrument, the use of the instrument as the sole criteria for the determination of HRSO status is insufficient. Specifically, the use of the Static–99 to predict the level of supervision was the chief complaint of the parole agents we surveyed and why nearly half of them felt the Static–99 does a poor job of indentifying high-risk sex offenders. This problem has been noted by the California Sex Offender Supervision and GPS Monitoring Task Force (henceforth referred to as the Task Force), which has stated that the “current reliance on the Static–99 alone is insufficient to identify the risk of reoffense” (CDCR 2010). We support the conclusion of the Task Force and recommend incorporating a classification system that addresses the need for public safety by accounting for the differential risk of recidivism among sex offenders.
This document is a research report submitted to the U.S. Department of Justice. This report has not been published by the Department. Opinions or points of view expressed are those of the author(s)
and do not necessarily reflect the official position or policies of the U.S. Department of Justice.

Monitoring High-Risk Sex Offenders With GPS Technology: An Evaluation of the California Supervision Program
5–3
The deficiency of the Static—99 is due in part to the items used in determining an offender’s score. As noted in chapter 1, the Static–99 actuarial tool uses a 10-item scale to estimate the probability of recidivism among adult males who have been convicted of a prior sexual offense and has demonstrated a moderate to large accuracy rate (Hanson and Morton–Bourgon 2004; Office of Criminal Justice Services 2006). As its name suggests, most of these factors are static and stem from a parolee’s past behavior. Prior sexual offenses and any conviction for noncontact sex offenses are included, yet the severity of the offense is not. For example, an exhibitionist—particularly a subject with numerous arrests for public exposure—may score higher on the Static–99 than a rapist with a single victim, despite the more serious nature of the offense because the exhibitionist is generally more likely to recidivate than the rapist. While the use of such a tool predicts recidivism with a fair amount of accuracy, it does little to guard the public against the more predatory criminals for which the use of GPS monitoring was designed. There is simply not enough weight placed on dynamic factors that “take into account a parolee’s life circumstances or the risk for violent behavior” (CDCR 2010). In short, the Static–99 treats all sex offenders with the same ‘one size fits all’ approach, but not all sex offenders pose the same public safety threats. In fact, recent evidence suggests there is a need to move beyond this broad classification scheme (Andrews and Bonta 2010; McGrath, Lasher, and Cumming 2011), as there are different types of sex offenders who have differential risks of reoffending. A possible alternative or complement to the Static–99 is the Violence Risk Scale–Sexual Offender (VRS–SO) version (Wong, Olver, Nicholaichuk, and Gordon 2003). The VRS–SO is a sexual offender risk assessment and treatment planning tool consisting of 7 static and 17 dynamic items. Research supports the predictive accuracy of the VRS–SO for sexual violence and has demonstrated change scores to be associated with reductions in sexual and violent recidivism (Beggs and Grace 2010; Beggs and Grace 2011; Olver, Wong, Nicholaichuk, and Gordon 2007). Another alternative is the Stable–2007/Acute–2007. The original Stable–2000/Acute–2000 instruments showed acceptable levels of reliability and validity. However, the revised versions have higher predictive accuracy and are able to associate current social and personal characteristics of sexual offenders that were meaningfully related to sexual, violent, and general recidivism. Consequently, a classification system that takes into account the differential risk of recidivism as well as the safety of the public may warrant serious consideration. For instance, despite the considerable responsibility of ensuring community safety, California may wish to consider using GPS monitoring only with rapists and child molesters, as they clearly pose a larger threat to the public than an offender with a propensity for indecent exposure or other noncontact offenses. Such a system allows parole agents to focus their time and energy on the offenders who pose the greatest risk. This is not to say, however, that sex offenders who pose a relatively low risk of recidivism should go unsupervised. Rather, it indicates that—when faced with the challenges of a growing number of sex offenders in the community, combined with limited resources—governmental agencies will be best served by reserving GPS monitoring for those who pose the greatest risk of reoffending.* This proposal is both supported in the literature and concurrent with the sentiment of the Task Force. The literature indicates that when supervision level is matched to the risk level of offenders it has been found to be more effective than applying a uniform approach to all sex offenders (Hanson et al. 2009; Lovins, Lowenkamp, and Latessa 2009). Meanwhile the Task Force recommended the implementation of a complementary instrument to “allow parole to more accurately determine an offender’s current risk
*A similar but alternative approach is to use tiered supervision where parole agents devote more time to those sex offenders who pose the greatest danger to the community and less time to those who pose less danger.
This document is a research report submitted to the U.S. Department of Justice. This report has not been published by the Department. Opinions or points of view expressed are those of the author(s)
and do not necessarily reflect the official position or policies of the U.S. Department of Justice.

Monitoring High-Risk Sex Offenders With GPS Technology: An Evaluation of the California Supervision Program
5–4
to the community” (CDCR 2010). Strictly Monitor Sex Offender Treatment Attendance While numerous treatment options are available for sex offenders, the research on its effectiveness has produced mixed results, with some reviews concluding positive benefits of treatment, others concluding that there is little evidence for the effectiveness of sex offender treatment. For instance, a recent meta-analysis that examined randomized controlled trials of treatment found that of the included studies, seven found statistically significant treatment effects, 10 found no treatment effects, and 4 could not be analyzed (Brooks–Gordon and Bilby 2006). Moreover, it is unclear what type of treatment is most effective. The meta-analysis also found that studies on behavioral treatments were too small to be informative; cognitive–behavioral therapy reduced reoffending at 1 year for child molesters, but the offenders had poor attitudes toward treatment during the sessions; and psychodynamic therapy reduced the number of rearrests 10 years later, but the effect did not reach statistical significance. The research, however, does seem to agree that sex offenders who stop attending treatment or leave the program before completion have an increased risk of recidivism (Brooks–Gordon and Bilby 2006; Lösel and Schmucker 2005; Marques et al. 2005). This trend in the literature appears to correspond with the results of this study that show the number of sex offender treatment hours is significantly related to compliance and recidivism, as offenders who did not complete treatment would have fewer treatment hours. Taking into account the totality of the research and the uncertainty regarding the effectiveness of different types of sex offender treatment, it would be inappropriate to recommend a standardized treatment protocol across the state. Nevertheless, we recommend that CDCR diligently monitor and strictly enforce parolee attendance of sex offender treatment classes. Though we recognize and commend the fact that CDCR mandates sex offender treatment, there appears to be a disconnect between the agents and the service providers in terms of tracking attendance, for roughly 100 subjects had no record of attending treatment during the follow-up period. Moreover, the process evaluation revealed that only about 75 percent of the agents reported that their parolees attend sex offender treatment at least once a week. The cause of the disconnect, however, is unclear. It may be a simple record-keeping anomaly. Or, more problematically, there may be vague lines of responsibility regarding the roles of agents and service providers in managing parolee attendance. In either case, research indicates that the meticulous monitoring of sex offender treatment is an important facet of sex offender supervision. Use a Graduated Sanctions System for Dealing With Parole Violations One of the more important findings in this study is that HRSOs on GPS monitoring supervision are returned to custody less often than HRSOs on traditional parole supervision. However, in both cases, when the parolees do fail, they are most often returned to custody. This return to custody has tremendous impact on the cost of supervision, as the difference in cost between GPS supervision ($36.00 per day per parolee) and prison ($129.00 per day per parolee) is quite significant. Unfortunately, this situation in California is not unique to HRSOs. In addition to having the largest prison population of any state, California has an enormous parolee population. The Bureau of Justice Statistics
This document is a research report submitted to the U.S. Department of Justice. This report has not been published by the Department. Opinions or points of view expressed are those of the author(s)
and do not necessarily reflect the official position or policies of the U.S. Department of Justice.
Monitoring High-Risk Sex Offenders With GPS Technology: An Evaluation of the California Supervision Program
5–5
reports that on any given day in 2006 the state had about 120,000 parolees under its supervision (Glaze and Bonczar 2007), amounting to 15 percent of all parolees in the United States. In fact, Grattet and colleagues found that the magnitude of the situation stems from California’s unique compulsory parole system, in which almost all prisoners are placed on mandatory parole upon release. Effectively, this means that parole in California is an extended period of out-of-custody supervision—where offenders go into and out of prison for parole violations and, therefore, are never fully discharged from the system (Grattet et al. 2008). This constant in-and-out of prison contributes to California’s overcrowding crisis and the high cost of keeping so many offenders in custody and under supervision. Consequently, we recommend the implementation of a graduated sanctions system where a response or sanction to a violation is balanced by the gravity of the offense as well as the need for public safety. In other words, a graduated system increases the likelihood that a parolee with a serious violation will be incarcerated, while one who presents less danger is still sanctioned but in a less restrictive, less costly manner. Typical sanctions include more restrictive conditions on parole, increased structured supervision, substance abuse testing and monitoring, reprimands, and halfway house placement. In the case of the California GPS monitoring program for HRSOs, a natural and easily implemented restriction would be to impose a home curfew on the offender. Under such a system, rather than merely issuing blanket parole revocations and sentencing violators to go back to prison for a few months at a time, this approach helps target precious correctional resources. Such a system often incorporates a structured decision-making tool to assist parole agents in selecting the appropriate sanction. In fact, research demonstrates that the use of structured decision-making tools significantly reduced reliance on revocation hearings and sanctions, and kept offenders out of local jails. Additionally, offenders were less likely to return to prison for technical violations under the new guidelines (Martin and Van Dine 2008). Interestingly, after recommendations made by Gov. Arnold Schwarzenegger’s Rehabilitation Strike Team, the Expert Panel on Adult Offender and Recidivism Reduction Programming (in 2007), the California Independent Review Panel (2004), the Little Hoover Commission (in 1993 and in 2007), and the National Council on Crime and Delinquency (in 2005) [CDCR 2008], California is in the process of piloting a new structured decision-making system for dealing with parole violations. This new system will allow parole agents to scientifically weigh an offender’s risk level and the benefits of alternatives to prison as part of their decision-making process. The centerpiece of the system is a new Parole Violation Decision-Making Instrument that is specifically designed and tested for California parolees (see Murphy and Turner 2009 for details on the instrument). We support this model, for it will help CDCR apply its custody resources to higher-risk offenders while targeting less-serious offenders with proven treatment programs that seek to address the root of their problems. Conduct Study to Assess Supervision Fees Another major finding from the study is that the GPS program costs about $8.51 more per day per offender than traditional supervision. One mechanism that could be used to offset these additional costs would be a user fee, which places more of the cost burden for the service on those who use it. This practice has been widely adopted for many types of government services, such as waste removal, maintenance of roads, and the provision of water, electricity, and other utilities (Olsen and Ramker 2001). In the criminal justice system, user fees are frequently called supervision fees where the probationer or the parolee pays for various aspects of his or her supervision in the community.
This document is a research report submitted to the U.S. Department of Justice. This report has not been published by the Department. Opinions or points of view expressed are those of the author(s)
and do not necessarily reflect the official position or policies of the U.S. Department of Justice.

Monitoring High-Risk Sex Offenders With GPS Technology: An Evaluation of the California Supervision Program
5–6
In the early 1980s and late 1990s, the number of states authorizing the imposition of supervision fees increased dramatically. In fact, a 1995 U.S. Department of Justice, Bureau of Justice Statistics, study revealed that more than 98 percent of all probation sentences imposed included some special conditions and these conditions most frequently included the payment of supervision fees (Bonczar 1997). The research examining the impact of supervision fees, however, has been mixed. For example, probation departments in some jurisdictions report becoming financially self-sufficient through the collection of supervision fees (Weiss 1991), while others indicate the practice covers only a portion of their operating costs (Williams 1987). This revenue shortfall can generally be traced back to a poor financial situation in which parolees find themselves, making the fee largely uncollectible. In fact, a 2009 study concluded that while supervision fees for parolees raises a small amount of revenue, the fiscal benefit is outweighed by the risk that the fee contributes to recidivism (Diller, Greene, and Jacobs 2009). Opponents of supervision fees argue that these fees not only put a price on parole but also induce offenders with limited resources to commit new crimes, and thereby result in higher incarceration costs. While supervision fees pose some organizational and administrative challenges, particularly if parole agents are charged with responsibility for collecting fees (see APPA 2001 for a more detailed discussion on the pros and cons of supervision fees), we recommend that CDCR conduct an analysis to investigate a) the utility of a supervision fee to offset the cost of the GPS supervision program and b) the optimal level at which to set such a fee. It may be obvious, but it is worth emphasizing, that the fee should not be so high as to force the parolees to fund the entire cost of the program nor so low that the cost of collection outweighs the revenue from the fee itself. Such a fee should also include exemptions for individuals who were unemployed, disabled, or enduring other extenuating circumstances; and nonpayment should not result in a return to custody. Mandate the Use of Inclusion and Exclusion Zones Another major finding was that parole agents were underusing inclusion and exclusion zones. The process evaluation found that only about 60 percent of the agents always or frequently discuss inclusion zone restrictions, and even fewer (about 50 percent) discuss exclusion zone restrictions. These lower figures are the result of the discretionary nature in which parole agents create zones. Unfortunately this prudence on the part of the agents is counterintuitive given that the use of zones is arguably the most important GPS tool, as the application of zones enables the agents to be alerted to specific offender movements. For instance, an inclusion zone can be used to determine if an offender remains in or leaves a designated area during a specific time. Inclusion zones may include but are not limited to the parolee’s residence, employment, or treatment location. An exclusion zone is a location where the offender is restricted from entering or that can be used to determine if the offender enters a specific location during a specified time. Exclusion zones may include but are not limited to the victim’s residence, areas of known narcotic activity, prior arrest locations, or areas of restricted travel. Consequently, we recommend that CDCR require the use of zones. While an increase in the use of zones may increase the time commitment of agents dedicated to the monitoring and response of GPS supervision, we believe such an investment generates safety benefits (particularly for exclusion zones) that make the additional time committed well worthwhile. Interestingly, however, internal reviews of policy and procedures has led CDCR to note this problem and take recent steps to address the issue. The new protocol requires agents to create at least three zones
This document is a research report submitted to the U.S. Department of Justice. This report has not been published by the Department. Opinions or points of view expressed are those of the author(s)
and do not necessarily reflect the official position or policies of the U.S. Department of Justice.

Monitoring High-Risk Sex Offenders With GPS Technology: An Evaluation of the California Supervision Program
5–7
for each parolee on their caseload, with one zone required to be an inclusion zone around the residence of the parolee, one inclusion zone that restricts travel to within 25 to 50 miles, and one exclusion zone restricting travel outside the state of California. In addition the protocol requires the placement of an exclusion zone around all known victims’ residence/work locations, if applicable. We support the protocol modifications regarding the use of zones. Convert to Monitoring Center System Despite a reduction in the number of equipment problems since the initial implementation of the GPS program, this study found that the large majority of agents (89 percent) still reported that GPS monitoring is more time intensive than traditional supervision. As noted in chapter 4, parole agents must analyze and respond appropriately to the information contained within an alert notification. In addition, the agent must note the response in the vendor software package. Unfortunately, the GPS supervision of HRSOs can generate an overwhelming amount of information. For instance, from January 2009 until December 2010 paroled sex offenders in California generated 1.5 million alert notifications (Thompson 2011). However, only a small portion of these alerts required a real response. This in turn has forced parole agents to spend more time looking at computer screens than in the field. According to an internal CDCR document, this level of verification caused parole agents to spend 44 percent of their time monitoring sex offender movements by GPS and only 12 percent of their time in the field (Thompson 2011). In response to this issue, based on a recommendation in a 2010 report by the Sex Offender Supervision and GPS Monitoring Task Force, CDCR recently converted to a monitoring center approach. The California GPS monitoring program initiated a vendor-operated monitoring center in June 2011. The two vendors that operate the GPS monitoring system serve jointly as the monitoring center and screen the thousands of GPS events that inundate parole agents each month. The vendors then forward the most serious ones to parole agents, thus weeding out those that signal more mundane problems such as a low battery or lost cell phone signal (Thompson 2011). The companies that provide the GPS equipment also will screen the events in selected areas and attempt to contact parolees if, for example, their bracelets have lost contact or the battery has run low. Parole agents will be contacted if the parolee cannot be reached or if an event signals a danger, such as a parolee coming too close to a victim’s home. We support this modification to alleviate the demand on agents of responding to “technical alerts” so they may concentrate more closely on direct supervision and on responding to alerts that pose real threats to community safety. In fact, several large states with a considerable number of sex offenders—including Texas, Florida, and Michigan—use monitoring centers to screen GPS–generated events. Moreover, Bales and colleagues (2010) found that a statewide monitoring center is one of the most dramatic improvements to the Florida Department of Corrections’ electronic monitoring program. The strategy resulted in dramatic reductions in the number of minor alerts that officers must address, which enables them to devote more time to matters related directly to the supervision of offenders in the community. The report goes on to recommend that electronic monitoring programs nationwide “should consider including this strategy in their operation” (Bales et al. 2010, xiii). Lastly, it should be noted that there are numerous ways to configure a monitoring center. The main difference separating the various methods is in who receives and reviews the alerts and the associated alert flow processes. There are three basic options for receiving alerts (Brown, McCabe, and Wellford 2007):
This document is a research report submitted to the U.S. Department of Justice. This report has not been published by the Department. Opinions or points of view expressed are those of the author(s)
and do not necessarily reflect the official position or policies of the U.S. Department of Justice.
Monitoring High-Risk Sex Offenders With GPS Technology: An Evaluation of the California Supervision Program
5–8
• Option 1. Vendor operates monitoring center. In this scenario, the vendor’s service
representatives review and analyze each event and then contact the applicable agency personnel in the event of a legitimate violation. Additionally, the vendor software may send automatic alerts by pager to specified agency personnel for resolution.
• Option 2. Third party operates monitoring center. In this scenario, a third-party company
conducts the event review and analysis and then contacts the applicable agency personnel as appropriate. When the third party receives the event for review and analysis, the agency personnel may also be contacted simultaneously by pager.
• Option 3. Internal monitoring center. In this scenario, the monitoring center is internal to the
agency and not accessible to a third party. Also in this situation, agency personnel may be contacted by pager at the same time as the monitoring center.
In addition, some agencies use a hybrid of options 1 and 3 by having agency personnel receive alerts directly from the software during regular duty hours (option 1) and during off-duty hours use an in-house monitoring center (option 3). Maintain Small Caseload Size Community expectations and public safety compel parole agents to spend substantial time in the direct supervision of sex offenders. Perhaps the most influential factor on the time of direct supervision contact is caseload size. In California, the introduction of GPS technology as a monitoring tool has considerably increased the amount of information available to agents to supervise offenders in the community, but the review of this data is very time intensive and substantially decreases the amount of time available for the direct supervision of HRSOs (as noted above, agents spent only about 12 percent of their time in the field). The best way to ensure that parole agents have sufficient time to meet these increased demands is by limiting the size of GPS parole agent caseloads. In fact, we found caseload size to be highly correlated with parole violations and return-to-custody events. Consequently, we recommend that parole agent caseloads be set at an agent-to-offender ratio of no greater than 20:1.* Continue to Emphasize the Use of GPS Monitoring as a Tool The final recommendation is to bear in mind that GPS monitoring is merely a tool useful in the larger context of parole practice. It is not a panacea for all things criminal. This recommendation is borne from the inflated expectations of GPS monitoring attributable to the misconceptions about what GPS monitoring can actually accomplish (Payne and DeMichele 2011). While California recognizes this concept and integrates this principle into its training, its importance cannot be overstated. As described in chapter 1, parole departments have many tools available to them to supervise HRSOs. Among other tools, they make use of specialized caseloads, clinical polygraph, and penile plethysmography. Unlike most of these other tools, however, the utility of GPS if often overstated. In truth, GPS can fail. GPS receivers require an unobstructed view of the sky and often do not perform well because of interference from buildings, terrain, electronics, or sometimes even dense foliage. These obstructions can cause position errors or possibly no position reading at all. In addition, there have been
*Similar recommendations were offered in the 2010 Sex Offender Supervision and GPS Monitoring Task Force report (CDCR 2010) and the UC Irvine pilot study report (Turner and Jannetta 2007).
This document is a research report submitted to the U.S. Department of Justice. This report has not been published by the Department. Opinions or points of view expressed are those of the author(s)
and do not necessarily reflect the official position or policies of the U.S. Department of Justice.

Monitoring High-Risk Sex Offenders With GPS Technology: An Evaluation of the California Supervision Program
5–9
documented cases of false negatives—where actual violations may not be detected by the system (Elzinga and Nijboer 2006) and instances of false positives—when offenders were recorded in one place but agents knew them to be elsewhere (Sachwald 2007). In addition, an overload of false positives or technical alerts can cause agent complacency, which may in turn result in a failure to act during actual violations. Finally, GPS units may be able to track where offenders are, but they cannot provide information on who the offender is with or what he is doing. Nevertheless, these limitations do not make the technology ineffective. To draw an analogy, compared with the screwdriver the hammer is not very useful in applying torque to drive screws. Should one consider the hammer ineffective? Probably not, as the hammer clearly has value as a tool for striking nails, forging metal, and breaking objects where the screwdriver is of little value. Instead, the screwdriver and the hammer are complementary tools that work effectively together in assembling and joining parts or materials in construction projects. Similarly, GPS technology should be viewed as a distinct tool with a specific purpose (tracking offender movement) among a set of supervision tools including direct contact supervision rather than the be all and end all of supervision approaches.
C. LIMITATIONS Several limitations of this study should be noted. The chief among these are those caused by the all-inclusive nature of the legislation that drives the GPS monitoring program. As discussed in chapter 1, the passage of California Proposition 83 mandated that all sex offenders be placed on GPS supervision for life. While this provision presented an excellent opportunity to study the effects of GPS monitoring on a large population, it presented challenges as well. The first was in the creation of a control group. Random assignment was clearly not an option as all sex offenders would eventually be placed on GPS monitoring supervision. Consequently, it was necessary to construct a comparison group from historical controls (i.e., subjects who were observed at some time in the recent past and for whom data are available through records). Such a group could be subject to a history threat. In addition, because we adopted a propensity score matching procedure rather than random assignment, the possibility exists that the comparison subjects differed in important and unobserved ways from GPS supervised subjects, and we cannot be certain that any observed differences in outcomes are attributable to treatment rather than to systematic differences in the subjects. For instance, we would have liked to but did not control for education level, because this information was not available from CDCR. This measure was of interest because some research (Duwe and Donnay 2010) suggests that higher-educated offenders are less likely to be revoked for failure-to-register violations. Nevertheless, we note that the two groups were similar on most measures, and we included statistical controls for other factors: supervision level, parole unit caseload size, sex offender treatment, and movement between districts. A third limitation is that we compared the outcomes of the subjects monitored with GPS technology not with a cohort of untreated subjects, but with subjects who received traditional parole supervision combined with sex offender treatment. If the subjects in the GPS group and the comparison parolees both had substantial and positive treatment effects of roughly equivalent magnitudes, this would register in the model as an observation of no difference in outcomes between groups. The design cannot comment on the absolute treatment effect but only on the apparent effect relative to that of the comparison group. This sets a difficult standard for demonstrating program effectiveness and likely results in a misleadingly conservative characterization of the GPS supervision program. However, if not
This document is a research report submitted to the U.S. Department of Justice. This report has not been published by the Department. Opinions or points of view expressed are those of the author(s)
and do not necessarily reflect the official position or policies of the U.S. Department of Justice.

Monitoring High-Risk Sex Offenders With GPS Technology: An Evaluation of the California Supervision Program
5–10
placed on GPS monitoring, HRSO parolees in this study typically receive traditional parole supervision. Thus, the comparison is quite relevant for policymakers trying to determine the best supervision approach to take with HRSOs. A fourth limitation deals with sex offender treatment. While this study controlled for the number of treatment hours, the GPS and traditional parole subjects received a range of sex offender treatment options, making it difficult to determine the precise impact of treatment on the outcomes. This range of services likely varied in terms of quality, as some sex offender treatment providers may have been better than others—given that there were no guidelines in the state of California at the time of this study for treatment providers who work with sex offenders, other than to be licensed by the state or to be supervised by a licensed clinician (CSOMB 2008). Moreover, the treatment options may have varied across counties as many counties either did not have known treatment providers who are members of the professional associations that focus on sex offender treatment and management or did not have enough treatment providers to service the existing number of parolees who require treatment (CSOMB 2008). As noted above, however, we did account for the data clustering by parole districts in the frailty models. A fifth limitation is in reference to the observed gaps in the GPS tracking data. The GPS data revealed that offenders were placed on and removed from GPS supervision frequently during the course of the yearlong study period. The vast majority of these gaps in supervision were the result of replacing GPS consumable equipment such as the strap or receiver. These equipment exchanges resulted in infinitesimal gaps in service, as the swap was completed within minutes in the presence of the GPS agent but nonetheless was tracked by the software. Another major source of breach in service was caused by an arrest or other event that resulted in the offender being placed into custody, as the GPS receiver unit is removed during any custody event and then replaced upon release. These gaps typically lasted several days, generally from the arrest date to the custody date. There were, however, some instances when the removal of the GPS receiver could not be corroborated with any known custody event.* While no arrests or other observed criminal justice events occurred within these gaps, this study took an intent to treat (ITT) approach where all offenders who begin the study under supervision with GPS technology are considered to be part of the GPS group, regardless of whether the parolee finishes the study period still under GPS supervision. In general, this ITT approach is a more conservative estimate of the treatment effect, for a subject may be arrested while removed from GPS but still assigned to the GPS group. A final limitation common to most research in this area is that the data used in the analyses were collected through official arrest statistics collected by the state of California. The primary weakness of arrest data is that the data are collected only for those criminal and delinquent events that come to the attention of the police and result in an arrest (Hawkins et al. 2000). Crimes that do not come to the attention of public officials go undocumented, resulting in a clear underreporting of crime. In addition, changes in organization activities or policy can have an effect on official data, which should not be mistaken for changes in crime. As long as the evaluator is aware of the potential pitfalls of these data and represents them in the report, official records are a valuable source of evaluation data.
*This study tracks only custody events that are under the supervision of CDCR. Episodes in a local jail do not fall under the purview of the CDCR and thus are not accounted for in the analysis.
This document is a research report submitted to the U.S. Department of Justice. This report has not been published by the Department. Opinions or points of view expressed are those of the author(s)
and do not necessarily reflect the official position or policies of the U.S. Department of Justice.

Monitoring High-Risk Sex Offenders With GPS Technology: An Evaluation of the California Supervision Program
5–11
D. NEXT STEPS The results of the present study suggest the possibility of some further investigation. While research (Petersilia 2003; Langan and Levin 2002) demonstrates that the first year after release accounts for nearly two thirds of all subjects who recidivate in the first 3 years, a final third will recidivate in the following 2 years. It would be fascinating to extend the study period an additional 2 years to account for these events in the analysis. The reason this was not done for this study was that extending the study period would have reduced the number of potential control subjects and thus reduced the ability to effectively match the parolees. But a distinctive development during the course of the study has presented a solution to this dilemma. Interestingly, despite the enactment of legislation mandating the GPS monitoring of sex offenders for life, these offenders are being removed from GPS monitoring when they complete the terms of parole. As it currently stands, CDCR has the responsibility of administering the program to monitor with GPS technology all sex offenders released from prison and living in the community. However, that responsibility ends when the offender completes the term of parole. Jessica’s Law does not identify what agency or units of government are responsible for the GPS monitoring of sex offenders after parole release. Neither state parole nor local governments (probation departments or law enforcement agencies) have been funded to take on this activity. Local governments in particular, have expressed an inability to absorb the potentially substantial labor commitment and cost that postparole GPS supervision may pose (CSOMB 2008). Instead, the modus operandi is for CDCR to notify local law enforcement about the impending release of a sex offender living in the local community and the interest of the local government agency in funding the continued GPS supervision of the offender. While the responses from local governments have acknowledged the unsupervised release of the offender in the community, few have accepted the financial responsibility of continued GPS monitoring. The result of this unique legal loophole is the opportunity to conduct a natural interrupted time series experiment with removed treatment where subjects are exposed to a treatment (GPS monitoring) for a certain length of time, and then at least some subjects have the treatment removed. The design is essentially two interrupted time series. The first assesses the effects of the presence of the GPS monitoring; the second tests the effects of its absence (Cook and Campbell 1979). The obvious advantage to this type of design would be to see what may happen to offenders once the GPS monitoring technology is removed. In fact, this is one of the most important outstanding questions regarding the use of GPS monitoring. In the words of Peckenpaugh and Petersilia (2006), when the bracelets come off, studies have found “that monitored offenders perform no better than offenders [who] were never subject to monitoring.” Another avenue for future research is the impact of sex offender treatment. The goal of this study was to assess the effects of GPS monitoring on compliance and recidivism. In so doing, we isolated the impact of GPS monitoring by controlling for the differences in treatment attendance among the parolees as well as the variability in treatment practice across parole districts. Thus, the specific effect of sex offender treatment was beyond the scope of this project. Nevertheless, as mentioned above, the research demonstrates that sex offenders who stop attending treatment or leave a program before completion have an increased risk of recidivism (Brooks–Gordon and Bilby 2006; Lösel and Schmucker 2005; Marques et al. 2005). Accordingly, despite the aforementioned data limitations, this study found that parolees who were arrested or had any sex violation attended significantly fewer treatment sessions than parolees who neither were arrested nor violated for a sexual offense, suggesting that parolees who regularly attend sex offender treatment recidivate less often than those parolees who do not attend treatment. Moreover, the group comparisons revealed that the GPS group received significantly more hours of treatment than the control group subjects, indicating that GPS monitoring may encourage parolees to attend the treatment sessions on a regular basis. Consequently, it would be of interest to
This document is a research report submitted to the U.S. Department of Justice. This report has not been published by the Department. Opinions or points of view expressed are those of the author(s)
and do not necessarily reflect the official position or policies of the U.S. Department of Justice.
Monitoring High-Risk Sex Offenders With GPS Technology: An Evaluation of the California Supervision Program
5–12
further investigate the impact of GPS monitoring on sex offender treatment attendance. It is possible that GPS supervision is a useful stimulus to encourage more regular sex offender treatment attendance. Finally, it would also be of interest to test the application of GPS monitoring with other types of offenders. As such, California currently uses GPS monitoring with high-risk gang offenders.* Gang offenders, however, are not the only other type of offenders who may be appropriate for GPS monitoring. Some other offender types who warrant further investigation include drunk drivers, spousal abusers, offenders with substance abuse problems, and offenders with mental disorders. In addition, GPS monitoring can and has been used as a pretrial supervision alternative to jail and as an alternative to incarceration for selected offenders. In pretrial situations, many of these same offender types can warrant GPS. However, this is often done in an effort to provide assurance of the offender’s return to court, using the least restrictive means of supervision that is consistent with victim and public safety, rather than as an approach to reintegrate the offender into the community. Similarly, GPS supervision may be used in conjunction with probation as an alternative to a prison or jail term. In any event, the research on these topics is sparse and warrants further investigation.
*DSG has been awarded a competitive grant (grant no. 2009–SQ–B9–K018) by the National Institute of Justice to study the effects of GPS monitoring on high-risk gang offenders. This study is being conducted currently and is scheduled to be completed in fall 2013.
This document is a research report submitted to the U.S. Department of Justice. This report has not been published by the Department. Opinions or points of view expressed are those of the author(s)
and do not necessarily reflect the official position or policies of the U.S. Department of Justice.

Monitoring High-Risk Sex Offenders With GPS Technology: An Evaluation of the California Supervision Program
R–1
References Allison, Paul D. 1984. Event History Analysis: Regression for Longitudinal Event Data. Beverly Hills,
Calif.: Sage. ———. 1995. Survival Analysis Using the SAS System: A Practical Guide. Cary, N.C.: SAS Institute. ———. 2002. “Missing Data.” Quantitative Applications in the Social Sciences. Thousand Oaks, Calif.:
Sage. Andrews, Donald A., and James Bonta. 2010. The Psychology of Criminal Conduct (Fifth Edition).
Cincinnati, Ohio: Anderson. (APPA) American Parole and Probation Association. 2001. “Supervision Fees.” Issue Paper. Lexington,
Ky.: Council of State Governments. http://www.appa-net.org/eweb/Dynamicpage.aspx?site=APPA_2&webcode=IB_IssuePaper&wps_key=bbe810ce-4464-4519-a1d7-4993574a8d61.
Bales, William D., Karen Mann, Thomas G. Blomberg, Gerald G. Gaes, Kelle Barrick, Karla Dhungana, and Brian McManus. 2010. “A Quantitative and Qualitative Assessment of Electronic Monitoring.” Tallahassee, Fla.: Florida State University, College of Criminology and Criminal Justice, Center for Criminology and Public Policy Research.
Bandura, Albert. 1977. Social Learning Theory. Englewood Cliffs, N.J.: Prentice–Hall, Inc. Baumer, Eric P. 1997. “Levels and Predictors of Recidivism: The Malta Experience.” Criminology
35(4):601–28. Beck, Judith S. 1995. Cognitive Therapy: Basics and Beyond. New York, N.Y.: Guilford. Beggs, Sarah M., and Randolph C. Grace. 2010. “Assessment of Dynamic Risk Factors: An
Independent Validation Study of the Violence Risk Scale: Sexual Offender Version. Sexual Abuse: A Journal of Research and Treatment 22:234–51.
———. 2011. “Treatment Gain for Sexual Offenders Against Children Predicts Reduced Recidivism: A Comparison Validity Study.” Journal of Consulting Clinical Psychology 79:182–92.
Black, Matt, and Russell G. Smith. 2003. “Electronic Monitoring in the Criminal Justice System.” Trends & Issues in Crime and Criminal Justice 254. Canberra, Australia: Australian Institute of Criminology. http://www.aic.gov.au/publications/current%20series/tandi/241-260/tandi254.aspx.
Black, William C. 1990. “The CE Plane: A Graphic Representation of Cost-Effectiveness.” Medical Decision-Making 10:212–14.
Brooks–Gordon, Belinda, and Charlotte Bilby. 2006. “Psychological Interventions for Treatment of Adult Sex Offenders: Treatment Can Reduce Reoffending Rates but Does Not Provide a Cure.” British Medical Journal 333(7557):5–6.
Brooks–Gordon, Belinda, Charlotte Bilby, and Helene Wells. 2006. “A Systematic Review of Psychological Interventions for Sexual Offenders 1: Randomised Control Trials.” The Journal of Forensic Psychiatry & Psychology 17(3):442–66.
Brown, Tracy M.L., Steven A. McCabe, and Charles Wellford. 2007. Global Positioning System (GPS) Technology for Community Supervision: Lessons Learned. Washington, D.C.: U.S. Department of Justice, National Institute of Justice.
Burrell, William D. 2006. Caseload Standards for Probation and Parole. http://www.appanet.org/about/ip/Caseload_Standards_PP_0906.pdf.
Burrell, William D., and Robert S. Gable, 2008. “From B.F. Skinner to Spiderman to Martha Stewart: The Past, Present, and Future of Electronic Monitoring of Offenders.” Journal of Offender Rehabilitation 46(3–4):101–18.
This document is a research report submitted to the U.S. Department of Justice. This report has not been published by the Department. Opinions or points of view expressed are those of the author(s)
and do not necessarily reflect the official position or policies of the U.S. Department of Justice.

Monitoring High-Risk Sex Offenders With GPS Technology: An Evaluation of the California Supervision Program
R–2
(CDCR) California Department of Corrections and Rehabilitation. 2008. “California to Launch Parole Violation Decision-Making Instrument to Help Agents Assess Risk and Needs in Determining Sanctions.” Press Release. http://www.cdcr.ca.gov/News/Press_Release_Archive/2008_Press_Releases/Oct_3.html, Oct. 3.
———. 2010. Sex Offender Supervision and GPS Monitoring Task Force: Final Report http://www.cdcr.ca.gov/News/docs/Sex_Offender_and_GPSTask_Force_Report.pdf, October.
Center for Sex Offender Management. N.d. Understanding Sex Offenders: An Introductory Curriculum. http://www.csom.org/train/etiology/index.html.
———. 2001. Recidivism of Sex Offenders. Center for Sex Offender Management: Silver Spring, Md. ———. 2002. Managing Sex Offenders in the Community: A Handbook to Guide Policymakers Through
a Planning and Implementation Process. Silver Spring, Md. Conway, P. 2006. Personal communication with William Burrell, June 13. Cook, Thomas Dixon, and Donald T. Campbell. 1979. Quasi-Experimentation: Design and Analysis
Issues for Field Settings. Boston, Mass.: Houghton Mifflin Company. (CSOMB) California Sex Offender Management Board. 2008. An Assessment of Current
Management Practice of Adult Sex Offenders in California: Initial Report. Sacramento, Calif. http://www.casomb.org/docs/SOMBReport1.pdf, January.
Dane, Andrew V., and Barry H. Schneider 1998. “Program Integrity in Primary and Early Secondary Prevention: Are Implementation Effects Out of Control?” Clinical Psychology Review 18:23–45.
Davey, Monica, and Abby Goodnough. 2007. “Doubts Rise as States Hold Sex Offenders After Prison.” New York Times. http://www.njisj.org/documents/SexOffenderSeries_NYT.doc, March 4.
DeMichele, Matthew, Brian K. Payne, and Deeanna M. Button. 2008. “Electronic Monitoring of Sex Offenders: Identifying Unanticipated Consequences and Implications.” Journal of Offender Rehabilitation 46(3–4):119–35.
Duchateau, Luc, and Paul Janssen. 2008. “The Frailty Model.” International Statistical Review 76(3):438–39.
Duffie, Hank, and Gail Hughes. 1989 “Fees for Supervision, Debating the Issues for Probation and Parole.” Perspectives, Winter.
Duwe, Grant, and William Donnay 2010. “The Effects of Failure to Register on Sex Offender Recidivism.” Criminal Justice and Behavior 37:520–36.
Elzinga, Hanny, and Jan A. Nijboer. 2006. “Probation Supervision Through GPS.” European Journal of Criminology, Criminal Law, and Criminal Justice 14(4):366–81.
Fialkoff, David. 2009. “Standardizing Parole Violation Sanctions.” NIJ Journal 263. Washington, D.C.: U.S. Department of Justice, National Institute of Justice.
Finn, Mary A., and Suzanne Muirhead–Steves. 2002. “The Effectiveness of Electronic Monitoring With Violent Male Parolees.” Justice Quarterly 19(2):293–312.
Florida Senate Committee on Criminal Justice. 2004. “Global Positioning System (GPS) Technology Use in Monitoring the Activities of Probationers.” In The Florida Senate Interim Project Report 2005–126. Tallahassee, Fla. http://archive.flsenate.gov/data/Publications/2005/Senate/reports/interim_reports/pdf/2005-126cj.pdf.
Furby, Lita, Mark R. Weinrott, and Lyn Blackshaw. 1989. “Sex Offender Recidivism: A Review.” Psychological Bulletin 105:3–30.
Gainey, Randy R., Brian K. Payne, and Mike O’Toole. 2000. “The Relationships Between Time in Jail, Time on Electronic Monitoring, and Recidivism: An Event History Analysis of a Jail-Based Program.” Justice Quarterly 17(4):733–52.
Gallagher, Catherine A., David B. Wilson, P. Hirschfield, Mark B. Coggeshall, and Doris Layton MacKenzie. 1999. “A Quantitative Review of the Effects of Sex Offender Treatment on Sexual Reoffending.” Corrections Management Quarterly 3:19–29.
This document is a research report submitted to the U.S. Department of Justice. This report has not been published by the Department. Opinions or points of view expressed are those of the author(s)
and do not necessarily reflect the official position or policies of the U.S. Department of Justice.

Monitoring High-Risk Sex Offenders With GPS Technology: An Evaluation of the California Supervision Program
R–3
Gaylene S. Armstrong, and Beth C. Freeman. 2011. “Examining GPS Monitoring Alerts Triggered by Sex Offenders: The Divergence of Legislative Goals and Practical Application in Community Corrections.” Journal of Criminal Justice 39 (2):175–82.
Glaze, Lauren E., and Thomas P. Bonczar. 2007. “Probation and Parole in the United States, 2006.” Bulletin. Washington, D.C.: U.S. Department of Justice, Bureau of Justice Statistics.
Graham, John W., Allison E. Olchowski, and Tamika D. Gilreath. 2007. “How Many Imputations Are Really Needed? Some Practical Clarifications of Multiple Imputation Theory.” Prevention Science 8:206.
Grattet, Ryken, Joan Petersilia, and Jeffery Lin. 2008. “Parole Violations and Revocation in California.” Final Report to the National Institute of Justice, Washington D.C.
Groth, A. Nicholas, and H. Jean Birnbaum. 1979. Men Who Rape: The Psychology of the Offender. New York, N.Y. : Plenum.
Hanson, R. Karl. 1998. “What Do We Know About Sex Offender Risk Management?” Psychology, Public Policy, and Law 4(½):50–72.
Hanson, R. Karl, Guy Bourgon, Leslie Helmus, and Shannon Hodgson. 2009. “The Principles of Effective Correctional Treatment Also Apply to Sexual Offenders: A Meta-Analysis.” Criminal Justice and Behavior 36(9):865–91.
Hanson, R. Karl, Arthur Gordon, Andrew J.R. Harris, Janice K. Marques, William Murphy, Vernon Quinsey, and Michael Seto. 2002. “The 2001 ATSA Report on the Effectiveness of Treatment for Sexual Offenders.” Sexual Abuse: A Journal of Research and Treatment 14(2):169–94.
Hanson, R. Karl, and Kelly Morton–Bourgon. 2004. “Predictors of Sexual Recidivism: An Updated Meta-Analysis.” Public Works and Government Services 2004–02.
Hawkins, Darnell Felix, John H. Laub, Janet L. Lauritsen, and Lynn Cothern. 2000. “Race, Ethnicity, and Serious and Violent Juvenile Offending,” Washington, D.C.: U.S. Department of Justice, Office of Justice Programs, Office of Juvenile Justice and Delinquency Prevention. NCJ 181202.
Hougaard, Philip. 1995. “Frailty Models for Survival Data.” Lifetime Data Analysis 1:255–73. ———. 2000. Analysis of Multivariate Survival Data. New York, N.Y.: Springer–Verlag. Iacone, Amanda. 2011. “Questions Linger Over Fate of State’s Sexual Violent Predator Program.”
Virginia Statehouse News. http://virginia.statehousenewsonline.com/4082/questions-linger-over-fate-of-state%E2%80%99s-sexual-violent-predator-program/, July 8.
(IACP) International Association of Chiefs of Police. 2008. “Tracking Sex Offenders With Electronic Monitoring Technology: Implications and Practical Uses for Law Enforcement.” http://www.ojp.usdoj.gov/BJA/pdf/IACPSexOffenderElecMonitoring.pdf.
(ICAOS) Interstate Commission on Adult Offender Supervision. 2006 GPS Supervision Update. http://www.interstatecompact.org/Tools/SurveyResults.aspx.
Klein John P. 1992. “Semiparametric Estimation of Random Effects Using the Cox Model Based on the EM Algorithm.” Biometrics 48:795–806.
Langan, Patrick A., and David J. Levin. 2002. Recidivism of Prisoners Released in 1994. Washington, D.C.: U.S. Department of Justice, Bureau of Justice Statistics.
Langan, Patrick A., Erica L. Schmitt, and Matthew R. Durose. 2003. Recidivism of Sex Offenders Released From Prison in 1994. Washington, D.C.: U.S. Department of Justice, Bureau of Justice Statistics.
(LAO) State of California Legislative Analyst’s Office. 2007. Analysis of the 2007–08 Budget Bill (Judicial and Criminal Justice). Sacramento, Calif. http://www.lao.ca.gov/analysis_2007/crim_justice/cj_05_anl07.aspx.
Leuven, Edwin, and Barbara Sianesi. 2003. “PSMATCH2: Stata Module to Perform Full Mahalanobis and Propensity Score Matching, Common Support Graphing, and Covariate Imbalance Testing.” Statistical Software Components S432001. Boston, Mass.: Boston College Department of Economics. http://ideas.repec.org/c/boc/bocode/s432001.html.
This document is a research report submitted to the U.S. Department of Justice. This report has not been published by the Department. Opinions or points of view expressed are those of the author(s)
and do not necessarily reflect the official position or policies of the U.S. Department of Justice.

Monitoring High-Risk Sex Offenders With GPS Technology: An Evaluation of the California Supervision Program
R–4
Levin, Henry M. 1983. Cost Effectiveness: A Primer (New Perspectives on Evaluation). Sage Publications, Inc.
Levin, Henry M., and Patrick J. McEwan. 2001. Cost-Effectiveness Analysis (Second Edition). Thousand. Oaks, Calif.: Sage.
Lilly, J. Robert. 2006. “Issues Beyond Empirical EM Reports.” Criminology & Public Policy 5(1):93–102.
Lösel, Friedrich, and Martin Schmucker. 2005. “The Effectiveness of Treatment for Sexual Offenders: A Comprehensive Meta-Analysis.” Journal of Experimental Criminology 1:117–146.
Lovins, Brian, Christopher T. Lowenkamp, and Edward J. Latessa. 2009. “Applying the Risk Principle to Sex Offenders: Can Treatment Make Some Sex Offenders Worse?” The Prison Journal 89:344–57.
MacKenzie, Doris Layton. 2000. “Evidence-Based Corrections: Identifying What Works.” Crime & Delinquency 46:457–71.
MacKinnon, David P., Jennifer L. Krull, and Chondra M. Lockwood. 2000. “Equivalence of the Mediation, Confounding, and Suppression Effect.” Prevention Science 1:173–81.
McGrath, Robert J., Michael P. Lasher, and Georgia F. Cumming. 2011. “A Model of Static and Dynamic Sex Offender Risk Assessment.” Final Report presented to National Institute of Justice. Washington, D.C.
McKay, Brian. 2002. “The State of Sex Offender Probation Supervision in Texas.” Federal Probation 66(1).
Marques, Janice K., Mark Wiederanders, David Martin Day, Craig Nelson, and Alice van Ommeren. 2005. “Effects of a Relapse Prevention Program on Sexual Recidivism: Final Results From California’s Sex Offender Treatment Evaluation Project (SOTEP).” Sex Abuse 17:79–107.
Martin, Brian, and Steve Van Dine. 2008. “Examining the Impact of Ohio’s Progressive Sanction Grid.” Final Report submitted to the National Institute of Justice, U.S. Department of Justice. Washington, D.C. NCJ 224317.
Murphy, Amy, and Susan Turner. 2009. Parole Violation Decision-Making Instrument (PVDMI) Process Evaluation. Irvine, Calif.: University of California, Irvine, Center for Evidence-Based Corrections.
Nellis, Mike. 2006. “Surveillance, Rehabilitation, and Electronic Monitoring: Getting the Issues Clear.” Criminology & Public Policy 5(1):103–08.
Oakes, David. 1992. “Frailty Models for Multiple Event Times.” In Survival Analysis: State of the Art. John P. Klein and Prem K. Goel (eds.). Dordrecht, Netherlands: Kluwer, 371–79.
Office of Criminal Justice Services. 2006. Sex Offenders: Report to the Ohio Criminal Sentencing Commission. Columbus, Ohio.
Olver, Mark E., Stephen C.P. Wong, Terry P. Nicholaichuk, and Audrey Gordon. 2007. “The Validity and Reliability of the Violence Risk Scale—Sexual Offender—Version: Assessing Sex Offender Risk and Evaluating Therapeutic Change.” Psychological Assessments 19(3):318–29.
Padgett, Kathy G., William D. Bales, and Thomas G. Blomberg. 2006. “Under Surveillance: An Empirical Test of the Effectiveness and Consequences of Electronic Monitoring.” Criminology & Public Policy 5(1):61–92.
Parner, Erik T. 1998. “Asymptotic Theory for the Correlated Gamma–Frailty Model.” Annals of Statistics 26:183–214.
Payne, Brian K., and Matthew T. DeMichele. 2011. “Sex Offender Policies: Considering Unanticipated Consequences of GPS Sex Offender Monitoring.” Aggression and Violent Behavior 16:117–87.
Peckenpaugh, Jason, and Joan Petersilia. 2006. “Sex Offender Reentry: Jessica Law Measures in California.” Working Paper for the Stanford Criminal Justice Center. Palo Alto, Calif: Stanford University School of Law. http://www.law.stanford.edu/program/centers/scjc/workingpapers/JPeckenpaugh_06.pdf.
Petersilia, Joan. 2003. When Prisoners Come Home. New York, N.Y.: Oxford University Press.
This document is a research report submitted to the U.S. Department of Justice. This report has not been published by the Department. Opinions or points of view expressed are those of the author(s)
and do not necessarily reflect the official position or policies of the U.S. Department of Justice.

Monitoring High-Risk Sex Offenders With GPS Technology: An Evaluation of the California Supervision Program
R–5
Rabe–Hesketh, Sophia, and Anders Skrondal. 2008. Multilevel and Longitudinal Modeling Using Stata (Second Edition). College Station, Texas: Stata Press.
Renzema, Marc, and Evan Mayo–Wilson. 2005. “Can Electronic Monitoring Reduce Crime for Moderate to High-Risk Offenders?” Journal of Experimental Criminology 1:215–37.
Rice, Marnie E., and Grant T. Harris. 2011. “Is Androgen Deprivation Therapy Effective in the Treatment of Sex Offenders?” Psychology, Public Policy, and Law 17(2):315–32.
Rossi, Peter H., and Howard E. Freeman. 1985. Evaluation: A Systematic Approach (Third Edition). Beverly Hills, Calif.: Sage. http://www.publicsafety.ohio.gov/links/ocjs_SexOffenderReport.pdf.
Sachwald, Judith. 2007. “Electronic Monitoring of Sex Offenders.” Presentation for the National Legislative Briefing on Sex Offender Management Policy. http://www.csg.org/knowledgecenter/docs/pubsafety/Sachwald.pdf.
Schaffer, Megan, Elizabeth L. Jeglic, Aviva Moster, and Dorota Wnuk. 2010. “Cognitive–Behavioral Therapy in the Treatment and Management of Sex Offenders.” Journal of Cognitive Psychotherapy: An International Quarterly 24(2):92–103.
Schmidt, Peter, and Ann D. Witte. 1988. Predicting Recidivism Using Survival Models. New York, N.Y.: Springer–Verlag.
Shaw, David R. 2009. The California Department of Corrections and Rehabilitation’s Supervision of Parolee Phillip Garrido. Special Report. Sacramento, Calif.: California Office of the Inspector General. http://www.oig.ca.gov/media/reports/BOI/Special%20Report%20on%20CDCRs%20Supervision%20of%20Parolee%20Phillip%20Garrido.pdf, November.
Sherman, Lawrence W., Denise C. Gottfredson, Doris Layton MacKenzie, John E. Eck, Peter Reuter, and Shawn D. Bushway. 1997. Preventing Crime: What Works, What Doesn’t, What’s Promising. Report to Congress. Washington, D.C.: U.S. Department of Justice, National Institute of Justice.
Skinner, Burrhus Frederic. 1974. About Behaviorism. New York, N.Y.: Random House. Solomon, Amy L., Vera Kachnowski, and Avinash Bhati. 2005. Does Parole Work? Analyzing the
Impact of Postprison Supervision on Rearrest Outcomes. Washington, D.C.: Urban Institute. Therneau, Terry M., and Patricia M. Grambsch. 2000. Modeling Survival Data. Extending the Cox
Model. Berlin, Germany: Springer–Verlag. Thompson, Don. 2011. “California to Change Sex-Offender Tracking.” The Daily Journal.
http://smdailyjournal.com/article_preview.php?id=159753&title=California%20to%20change%20sex-offender%20tracking, May 27.
Turner, Susan, and Jesse Jannetta. 2007. “Implementation and Early Outcomes for the San Diego High-Risk Sex Offender GPS Pilot Program.” CEBC Working Papers. Irvine, Calif.: University of California at Irvine, Center for Evidence-Based Corrections.
Vess, James, and Alex Skelton. 2010. “Sexual and Violent Recidivism by Offender Type and Actuarial Risk: Reoffending Rates for Rapists, Child Molesters, and Mixed-Victim Offenders.” Psychology, Crime & Law 16(7):541–54.
Wienke, Andreas. 2010. Frailty Models in Survival Analysis. Halle–Wittenberg, Germany: Chapman & Hall.
Wong, Stephen C.P., Mark E. Olver, Terry P. Nicholaichuk, and Audrey. Gordon. 2003. Violence Risk Scale—Sex Offender Version. Saskatoon, Saskatchewan: University of Saskatchewan, Department of Psychology.
This document is a research report submitted to the U.S. Department of Justice. This report has not been published by the Department. Opinions or points of view expressed are those of the author(s)
and do not necessarily reflect the official position or policies of the U.S. Department of Justice.