
Evaluating environmental programs: The perspective of modern evaluation research
Upload
khangminh22Category
view
2download
0
WTP- 53WORLD BANK TECHNICAL PAPER NUMBER 53
Monitoring and EvaluatingUrban Development ProgramsA Handbook for Program Managers and Researchers
Michael Bamberger and Eleanor Hewitt
fILE çQ?1
r~~~~~~~1o
t Q w_ g111 SO ! k2\i,::::
Pub
lic D
iscl
osur
e A
utho
rized
Pub
lic D
iscl
osur
e A
utho
rized
Pub
lic D
iscl
osur
e A
utho
rized
Pub
lic D
iscl
osur
e A
utho
rized

WORLD BANK TECENICAL PAPERS
No. 1. Increasing Agricultural Productivity
No. 2. A Model for the Development of a Self-Help Water Supply Program
No. 3. Ventilated Improved Pit Latrines: Recen:- Developme-nts in Zimbabwe
No. 4. The African Trypanosomiases: Methods and Concepts of Control and Eradication
in Relation to Development
'No. 5.) Structural Changes in World Industry: A Quantitative Analysis of Recent Developments
No. 6. Laboratorv Evaluation of Fand-Operated Water Pumps for Use in Developing Countries
No. 7. Notes on the Design and Operation of Waste Stabilization Ponds in Warm Climates
of Developing Countries
No. 8. Institution Building for Traffic Management
(No. 9.) Meeting the Needs of the Poor for Water Supply and Waste Disposal
No. 10. Appraising Poultry Enterprises for Profitability: A Manual for Investors
No. 11. Opportunities for Biological Control of Agricultural Pests in Developing Countries
No. 12. Water Supplv and Sanitation Project Preparation Handbook: Guidelines
No. 13. Water Supply and Sanitation Project Preparation Handbook: Case Studies
No. 14. Water Supplv and Sanitation Project Preparation Handbook: Case Study
(No. 15.)Sheep and Goats in Developing Countries: Their Presant and Potential Role
(No 16.)Managing Elephant Deoredation in Agricultural and Forestry Projects
(No. 17.)Energy Efficiencv and Fuel Substitution in the Cement Industry with Emphasison Developing Countries
No. 18. Urban Sanitation Planning Manual Based on the Jakarta Case Study
No. 19. Laboratorv Testing of Handpumps for Developing Countries:- Final Technical Report
No. 20. Water Ouality in Hydroelectric Projects: Considerations for Planning in Tropical
Forest Regions
No. 21. Industrial Restructuring: issues and Expaeriences in Selected Developed Economies
No. 22. Energy Efficiencv in the Steel Industrv w:ith Emphasis on Developing Countries
No. 23. The Twinning of Institutions: Its Use as a Technical Assistance Delivery System
No. 24. World Sulphur Survev
No. 25. Industrialization in Sub-Saharan Africa: Strategies and Performance (also in French, 25F)
No. 26. Small Enterprise Development: Economic Issues from African Experience(also in French, 26F)
No. 27. Farming Systems in Africa: The Great Lakes Highlands of Zaire, Rwanda, and Burundi(also in French, 27F)
No. 28. Technical Assistance and Aid Agency Staff: Alternative Techniques for Greater Effectiveness
No. 29. Handpumps Testing and Development: Progress Report on Field and Laboratory Testing
No. 30. Recvcling from Municipal Refuse: A State--of-the-Art Review and Annotated Bibliography
No. 31. Remanufacturing: The Experience of the United States and Implicationsfor Developing Countries
No. 32. World Refinerv Industry: Need for Restructuring
( ) Indicates number assigned after publication. (List continues on the inside back cover.)
WORLD BANK TECHNICAL PAPER NUMBER 53
Monitoring and EvaluatingUrban Development Programs
A Handbook for Program Managers and Researchers
Michael Bamberger and Eleanor Hewitt
The World BankWashington, D.C., U.S.A.
Copyright (O 1986The International Bank for Reconstructionand Development/THE WORLD BANK1818 H Street, N.W.Washington, D.C. 20433, U.S.A.
All rights reservedManufactured in the United States of AmericaFirst printing May 1986
This is a document published informally by the World Bank. In order that theinformation contained in it can be presented with the least possible delay, thetypescript has not been prepared in accordance with the procedures appropriate toformaI printed texts, and the World Bank accepts no responsibility for errors. Thepublication is supplied at a token charge to defray part of the cost of manufacture anddistribution.
The World Bank does not accept responsibility for the views expressed herein, whichare those of the author(s) and should not-be attributed to the World Bank or to itsaffiliated organizations. The findings, interpretations, and conclusions are the resuitsof research supported by the Bank; they do not necessarily represent official policy ofthe Bank- The designations employed, the presentation of material, and any maps usedin this document are solely for the convenience of the reader and do not imply theexpression of any opinion whatsoever on the part of the World Bank or its affiliatesconcerning the legal status of any country, territory, city, area, or of its authorities, orconcerning the delimitation of its boundaries or national affiliation.
The most recent World Bank publications are described in the annual spring and falllists; the continuing research program is described in the annual Abstracts of CurrentStudies. The latest edition of each is available free of charge from the Publications SalesUnit, Department T, The World Bank, 1818 H Street, N.W., Washington, D.C. 20433,U.S.A., or from the European Office of the Bank, 66 avenue d'Iéna, 75116 Paris, France.
Michael Bamberger is a regional training coordinator for the Economic DevelopmentInstitute and Eleanor Hewitt a research assistant in the Water Supply and UrbanDevelopment Department, both at the World Bank.
Library of Congress Cataloging-in-Publication Data
Bamberger, Michael.Monitoring and evaluating urban development programs.
(World Bank technical paper, ISSN 0253-7494 ; no. 53)Bibliography: p.1. City planning--Developing c)untries--Evaluation--
Randbooks, manuals, etc. 2. City planning--Evaluation---Handbooks, manuala, etc. I. Hewitt, Eleanor,1950- . II. Title. III. Ser:Les.HT169.5.B36 1986 351.8'18'091724 86-9231ISBN 0-8213-0775-4

iii
ABSTRACT
This volume is a comprehensive but easily understood Handbook. forurban policy makers, managers and evaluation practitioners in developingcountries. It provides guidance on all stages of the design andimplementationof a monitoring and evaluation system and presents the main options with respectto scope, key research issues and organization. Monitoring and evaluatlonsystems are described which can be applied to both individual projects and tointegrated multl-component urban developmentprograms.
Urban development projects vary widely in scope and complexity, and interms of the resources which are available for monitoring and evaluation. ThèHandbook is designed to help managers and policy makers decide on the types andcomplexity of the studies which are most appropriate for their project, and toselect among the range of available research and analytical procedures. Adistinction is made throughout between basic monitoring and evaluationtechniques which are simple and economical to apply in any project, and morecomplex techniques which are only appropriate in certain circumstances.
Ail of the methods described in the Handbook have been field tested,many of them as part of World Bank projects. The unique contribution of theHandbook is to show how approaches taken from the fields of sociology,economics, anthropology and accountancy can be combined in an integratedmonitoring and evaluation strategy.


v
FOREWORD
This Monitoring and Evaluation Handbook provides usefuloperational guidelines for designing and implementing monitoring andevaluation systems for urban development projects and programs. It ilspartly the result of a cooperative research project supported jointly bythe World bank and the International Development Research Centre (IDRC) ofCanada which originally evaluated urban projects in El Salvador, Zambia,Senegal and the Philippines. In its present version, the Handbook has beenwidely field-tested and has been applied in managing urban developmentprojects in several countries, including Bolivia, Brazil, Cameroon,Colombia, El Salvador, Indonesia, Jordan, Kenya, Philippines, Senegal, andThailand. The Handbook has also been used in training programs in LatinAmerica, Africa, South Asia and China. The methods and systems offered inthis Handbook can be used as they are presented, but ideally, they shouldbe tailored to meet the specific implementation and management needs ofindividual urban development projects.
Anthony ChurchillDirectorWater Supply and UrbanDevelopment DepartmentThe World Bank.

vi
ACKNOWLEDGEMENTS
Work on the Handbook began as part of a collaborative evaluationproject between the International Development Research Center (IDRC) ofCanada and the World Bank. Many of the cited studies were produced as partof this project. The authors would like to thank IDRC for their supportthroughout this cooperative venture.
Guidance and comments have been received from many people within theBank. Special thanks are expressed to D>uglas Keare who was Chief of theUrban Regional Economics Division, where work on the Handbook began in1980. Within the Water Supply and Urban Development Department, helpfulcomments have been received from Michael Cohen, Andrew Hamer, FriedrichKahnert, Robert Satin, Stephen Mayo, Kyu Sik Lee, Stephen Malpezzi andRonald Parlato. Comments and suggestions have also been received atvarious points from colleagues in the Evaluation and Sociology Groups, inparticular Dennis Casley, Barbara Searle, Michael Cernea, Teresa Ho andRonald Ng. The authors are also grateful to their urban projectscolleagues, Evan Rotner, Alberto Harth, Mario Rothschild, Edward Echeverria,Neil Boyle, Faye Johnson, Richard Westin, Aura Garcia, Thakoor Persaud andCarolyn Gochenour who commented on various drafts and helped with fieldtesting. Lawrence Salmen, a consultant with the Bank, has provided helpfulguidance on the role of qualitative evaltLation.
Many people vere involved in the preparation and revision of themany drafts of the manuscript. We would particularly like to thank RoseMalcolm for the preparation of the final document and Suzana Jesus for herwork on earlier drafts.
Finally, the authors would like to thank the following localresearchers and project staff who helped with field testing:Januario Flores and Antonio Jorge Araujo (Brazil), Jaime Medrano and FreddyQuiton (Bolivia), Eduardo Velez (Colombia), Mila Reforma (the Philippines)and Gibson Maina, Angela Kamau, Davinder Lamba and Diana Lee Smith (Kenya).

vii
TABLE OF CONTENTS
ACKNOWLEDGEMENTS: ............... ..... * * * * * * * * * * * * * * , * * *...... , viINTRODUCTION: A User's Guide to the Handbook....................... xxi
CHAPTER 1: THE MONITORING AND EVALUATION FRAMEWORK................
A. Monitoring and Evaluation: Essential Management Tools ...... 1B. Framework for Monitoring and Evaluation of Urban
Development Projects ...... .......... .............. 51. A model of the project implementation process........... 52. The functions of monitoring and evaluation ............ .8
C. Planning the Monitoring and Evaluation System ............... 91 Defining the issues to be studied....................... 102. Organizing the monitoring and evaluation................ il3. The scope and intensity of the studies .................. il4. Ensuring that the evaluation is 'user oriented"
and not "technique oriented".......................... Il5. Defining resource requirements ......................... il
D. Managing the Monitoring and Evaluation ............ ........... 121. The role of the project manager in monitoring
and evaluation .................................6. . 122. Defining the main users of monitoring
and evaluation ....................... 123. The outputs of monitoring and evaluation
and their practical utility ................... ......... 134. The importance of regular reviews of tonitoring
and evaluation outputs ..... . .... . ...... . * * * e. 155. Potential problems in the design and implementation
of a monitoring and evaluation system and somepossible solutions ... ........................ 15
CHAPTER 2: PERFORMANCE MONITORING ....................... ...... . 18
A. Performance Monitoring ..................... 18B. Designing the Performance Monitoring System ................ 19C. Monitoring Software Components.............................. 21D. Methods for Collecting and Analyzing Data
for Performance Monitoring. ................................ . 22E. Reports o..e.................... . . o*.................. 23

viii
F. Potential Problems and Possible Solutions in the Designand Implementation of a Monitoring System.. ................ 24
CHAPTER 3: PROCESS MONITORING - MONITORIING THE PROJECTDELIVERY SYSTEM ................................. .......... 26
A. Key Issues* *. ..................................... .. . 26B. When and Why to Monitor the Implermentation Process .......... 32C. Data Collection Methods .......... .......................... 34
1. The importance of a multi-method approach ............... 342. Modelling the process of project implementation ......... 363. Quantitative surveys ......... .......................... 364. Direct observation. .... ses .......... e .... ... ... ose 375. Secondary data ....... ........ ............. a.,.... ...... 376. Ethnographic methods ..................... ...... ,...... 38
D. Methods for Monitoring the Efficiency of theImplementation Process.... ....................... ,....... 381. Monitoring the overall efficiency of project
implementation ................. 382. Developing summary indicators. ............................................. 413. Indicators of the efficiency of individual
project components... ..... . .......... ..... est .... .... 424. Studying community level organizations ................. . 46
E. The Design of Continuous, Periodie and One-Time ProcessMonitoring** ...... #t#....se.*... oo............, 461. Continuous panel studies . ..................... 462. Periodic studies .. . ................................ . 493. One-time studies .......... a........................ 49
F. Defining the Strategy for Process Monitoring ................ 50
CHAPTER 4: IMPACT EVALUATION ... ......................................... . 51
A. Approaches to Impact Evaluation ................... 51B. Some Key Issues in the Design of Urban
Impact Evaluations. .................. ............................. 531. Is it necessary to evaluate project impacts? ............ 532. Is it possible to measure impacts and
assess causation? .............. .. ... ........... 543. Do cost-effective methods exist for
impact evaluation? .............................................. . 554. Quantitative versus qualitative methods ................. 57

ix
C. Examples of Impact Evaluations .........a tn.................... 581. A large-scale randomized experimental design:
the experimental housing allowance program . . 592. A quasi-experimental design: evaluating the
impact of a sites and services housingproject on employment and income in El Salvador .. 60
3. Rapid impact evaluation employing a multi-methodapproach: evaluating the social and eoconomicimpacts of a cooperative program in El Salvador .. 61
D. Alternatives to Large Scale Quantitative EvaluationDesigns .................................. 0....................... 621. The selection of the most appropriate research
techniques and the use of triangulation . . 622. Participant observation and related
ethnographic approaches .. 623. Rapid impact studies ................................. O.. 644. Simple quantitative methods ...........................to. 645. Using secondary data ...... ................................. . 65
E. Quantitative Estimates of Net Project Impacts ............... 651. Modelling the implementation process . . . 662. Operational definitions of expected impacts .. 673. Experimental and quasi-experimental designs:
the adaptation of textbook evaluation designsto the realities of the urban context .................. 69
4. The use of panel and independent samples . . 715. Sample design ........................................... 726. Analysis and interpretation of the
survey data . ............ .. 73F. Comparing the Effectiveness of Different Projects ........... 75
1. Issues in the definition and measurementof costs ...... .. 77
2. Issues in the definition and measurementof benefits and effectiveness .......................... 78
3. Cost benefit analysis ....... ................ 794. Cost-effectiveness analysis..........y.... ............. 815. Cost-utility anayis.................... 81
G. Choosing the Appropriate Strategy for ImpactEvaluation ... 811. What are the future options currently being
considered and what are the key factors whichwill affect the deisions . .82
2. Time scale .............................................. 823. Available resources ........ ...................................... . 824. Scale and complexity of the project . . 835. The nature of the project and the complexity
of 6te objectives ..................................... 836. The need for a multi-method approach ....................................... 83
x
CHAPTER 5: MANAGING THE EVALUATION ................................. 84
A. The Monitoring and Evaluation Functions and Needs ofDifferent Organizations ... ..... 84
B. Organizing Monitoring and Evaluation at the ProjectImplementatlon Level ... 861. The use of consultants ......... . 862. Locating the evaluation unit in the organization ........ 91
C. Organization of Monitoring and Evaluation for theProject Coordinating Agency (PCA) ..... .. e..... 97
D. Monitoring and Evaluation by Sectoral Agencies ...... 102E. Organization of Monitoring and Evaluation at
the National Level .. .. .. .................................... 1031. National urban development agencies ..................... 1032. Finance ministries and legislative watchdogs ............ 104
F. Resource Requirements for Monitoring and Evaluation ......... 1061. Resource requirements for local implementing
agencies .............................................. 1062. Resource requirements for the local project
coordinating agency (PCA) ............................. 1113. Evaluation resources for the national development
agencies .............................................. 1134. Fitting staff into civil service categories ............. 1135. Staff training .......................................... 1146. Temporary assignment of other project staff
to the evaluation ............................. ........ 1147. Using consultants to overcome salary constraints ........ 114
G. The Role of Donor Agencies in the Evaluation ................ 114H. Potential Problems and Possible Solutions ................... 116
CHAPTER 6: ISSUES AND APPROACHES IN EVALUATING NON-SHELTERRELATED URBAN PROJECTS ................................. 118
A. New Directions in Urban Development Projects ................ 118B. Income and Employment Generation Project Components ......... 119
1. Key policy issues . . ..................................... 1192. Evaluation issues .. ........... . 1203. Applicability of the monitoring and evaluation
framework discussed in previous chapters ............. 121C. Family and Public Health Programs . . . . 122
1. Key policy issues . . . ......... 1222. Evaluation issues . . .................. . 1253. Applicability of the monitoring and
evaluation framework . ............... 127D. Urban Transport ............... ............................... . 127
1. Key policy issues . . . .................................... 1272. Evaluation issues . . . ......... 1293. Applicability of the monitoring and
evaluation framework ................................ . . 130
xi
E. Municipal and institutional development ..................... 1301. Key policy issues . .. ........... ........... . ......... . 1302. Evaluation issues .. ..................................... 1323. Applicability of the monitoring and
evaluation framework .... ....................... 134F. Summary and Conclusions ...................... 135
ANNEX A: DEFINING AND USING A MODEL OF THE PROJECTIMPLEMENTATION PROCESS ............................................... . 136
A. Defining the Project Model and its Assumptions .............. 136B. Defining measurable objectives ....................... ....... 141
ANNEX B: METHODS OF DATA COLLECTION FOR MONITORINGAND EVALUATION ......................... 149
A. The Importance of the Choice of ResearchMethods ........................................................ 149
B. The Use of Triangulation to Build inConsistency Checks ..... .................................. . 151
C. Participant Observation and Related EthnographicTechniques ............................................... 151
D. Direct Observation ................. ................... ... 155E. Informal Group Discussions . ................. 156F. Unstructured ("Open") Interviews . . . 157G. Structured Questionnaires . . . 158H. Secondary Sources ........................................... 161I. Further Reading ............................................ . 162
ANNEX C: MANAGERS GUIDE TO THE DESIGN AND IMPLEMENTATION0F A MONITORING AND EVALUATION SYSTEM ..................... 164
A. Initial Decisions on the Scope, Organizationand Objectives of the Evaluation . ............ 164
B. Definition of the Organizational Structure . .......... 168C. Defining and Mobilizing Financial and
Human Resources ...................... .* ........... ...... 169D. Research Design ........................... 169E. Integrating the Evaluation into the Project
Development Cycle .. ........ ........................... 170F. Defining the Main Users of the Studies and their
Information Requirements .................................. 172G. Defining the Planning and Review Cycles . ......... 174
ANNEX D: THE BASIC CONCEPTS OF SAMPLE DESIGN ....................... 176
A. Why are Samples Used? ............... ...................... . 176B. Sample Precision and Confidence Intervals ................... 176C. Methods of Sample Selection . ........ 177D. Related (Panel) and Independent Samples .................. ... 178

xii
E. Sample Designs for the Evaluation of Sitesand Services Projects .................... . ...... ........ 180
F. Sample Design for the Evaluation ofUpgrading Projects .... . .. ....... ............ . 180
G. Further Reading . ...... .. ......... . 183
ANNEX E: EXPERIMENTAL AND QUASI-EXPERIMENrTAL DESIGNS IN URBANIMPACT EVALUATION ........................ . ....... .................. . 184
A. The Logic of the True Experimental Design ............... .... 184B. Threats to Validity in the Interpretation of the
Analysis ...................................... ................... 18 5C. Problems in Applying the ExperimerLtal Design
to the Evaluation of Urban Projects .................. ..... 187D. Alternative Quasi-Experimental Designs ...................... 190E. Application of Quasi-Experimental Designs
in Upgrading and Sites and Services Projects ....... 194F. Further Reading ............ ...... ......... . 19 5
ANNEX F: METHODS OF DATA ANALYSIS................................. 196
A. Statistical Analysis of the True ExperimentalDesg.*.* ........ * i........ ,.... 19 6
B. Tests of Association and Differences for UseWith Some of the Simpler Evaluation Designs............... 197
C. The Use of Multiple Regression in the AnalysisOf Quasi-Experimental Designs.............. 197
D. The Use of Multiple Regression When not allParticipants Receive the Same Package ofServices or When There is No Control Group...........et... 201
E. Path Analysis ....... *. .è.. .......... ......... .. . 207F. Cost Benefit Analysis .......... .... ..... 209G. Hedonic Price Analysis ..................... . ............... . 213H. Further Reading ................... ...... . 215
ANNEX G: SAMPLE OUTLINE OF A QUARTERLY PROGRESS REPORT.... . 216
A. Introduction .......... . ................. ..... ... 6....à..... .... 216B. Contents of the Report ............. .. * .... . ............. .. 216C. Financial Performance ...................... 217D. Services and Programs ........................ 218E. Attitudes of Pro ject Beneficiariese .... n**tes*e...... 219
ANNEX H: DESIGNING A NETWORK BASED SYSTEMi TO MONITOR PROJECTIMPLEMENTATION ....................... ..... ....... ... . 228
A. Introduction and Objectves .. 228B. Designing the Systemm.. .. . 228C. Designing the Monitoring System ....................... 00*60-6 ..... O.. 231

xiii
ANNEX I: DESIGNING A SYSTEM FOR NETWORK-BASED FINANCIALMONITORING ............................................................ 240
A. The Elements of Network-Based Budgeting ..................... 240B. Definition of Cost-Bearing Activities...........*..a........ 240C. Estimation of Expenditure Schedules for Each
Component ............................................................. 240D. Monitoring Cost and Expenditure Schedules..*** .............. 241E. Cost Variation Analysis ....... ......................... . 241F. Revision of Cost and Implementation Schedules ............... 242
ANNEX J: A BASIC EVALUATION LIBRARY ................................ 249
A. General Textbooks ... e* ... . * .. *....*. . .......... . 249B. More Specialized Reference Books ............................ 250C. Basic Statistical Textbooks ................................. 251
ANNEX K: GLOSSARY OF TERMS USED IN THE HANDBOOK ................... .. 252
REFERENCES CITED IN THE TEXT .............. .. ....... ..... .. 257

xiv
TABLES AND CHARTS
Table 1-1: Evaluation outputs and the project cycle ................ 14
Table 3-1: Issues in evaluating the efficiency ofproject design and implementation .......... ............. 28-29
Table 3-2: Some key issues in process evaluationfor nonrshelter components .............................. 30
Table 3-3: Timing and uses of process evaluation(monitoring the project delivery system) ..........se...... 33
Table 3-4: Example of the application of ranks in themonitoring of overall project efficiency ..........et...... 43
Table 3-5: Indicators of efficiency for typicalproject components ........ .. .... ........... . 44-45
Table 4-1: Hypothetical example of the potential savingsfrom an impact evaluation of a pilot employmentproject ........ .** ............................. 56
Table 4-2: Examples of 6 micro-level project impactsand some indicators which could be used tomeasure them ...................... ..... . 68
Table 4-3: Main stages in the 3 approaches toeffectiveness analysis . ..... ......... 76
Table 4-4: Cost worksheet for cost-effectivenessanalysis ................................. ..................... 80
Table 5-1: Minimum monitoring resource requirementsfor a local project implementing agency ................. 107
Table 5-2: Resource requirements for the first roundof a typical impact study with a sample of600 househoIds ... 0..................... .6........................ 108
Table 5-3: Adequate staffing level for a one cityevaluation ..................................... ................ 110
Table 5-4: Staff requirements for program evaluation:requirements for implementing agencies andproject coordinating agency .................. 114
Table A-1: Conceptual framework for an impact evaluation:example of an artesan credit program .............. *...... 137

xv
Table A-2: The components of the project model which arestudied in different types of monitoring andevaluation ..................................................... 140
Table A-3: The specification of intended outputs -the example of the Lusaka upgrading andsites and services project .............................. 142
Table A-4: Simplified version of a logical networkshowing the main components (processes) .......... ........ 144
Table A-5: Examples of the definition of processobjectives for 2 components of a sitesand services project: selection ofparticipants and completion of habitable unit ........... 145
Table A-6: Examples of 6 micro-level project impactsand the indicators which could be used tomeasure them ......................... 147
Table B-1: Applications and limitations of some of theprincipal evaluation research methods . . L50
Table B-2: Use of triangulation to check the consistencyof estimates of project impact on householdincome ..... .................................................. 152
Table C-1: Main stages in the planning and implementationof an evaluation ....... .. ..................... . 165
Table C-2: Information requirements at each stage ofproject development ...... 171
Table C-3: The main types of information and issueswhich evaluation research can cover ................... 173
Table D-1: Features of sites and services and upgradingprojects which affect the design of an impactevaluation .................................................... 'L82
Table E-1: Typical fluctuations in housing investmentduring the first years of a sites andservices project ........................................ 189
Table E-2: Example of long-term trends and short-termand seasonal fluctuations in household incomein the years following the start of a shelterproject ...................................................... :L9 1
xvi
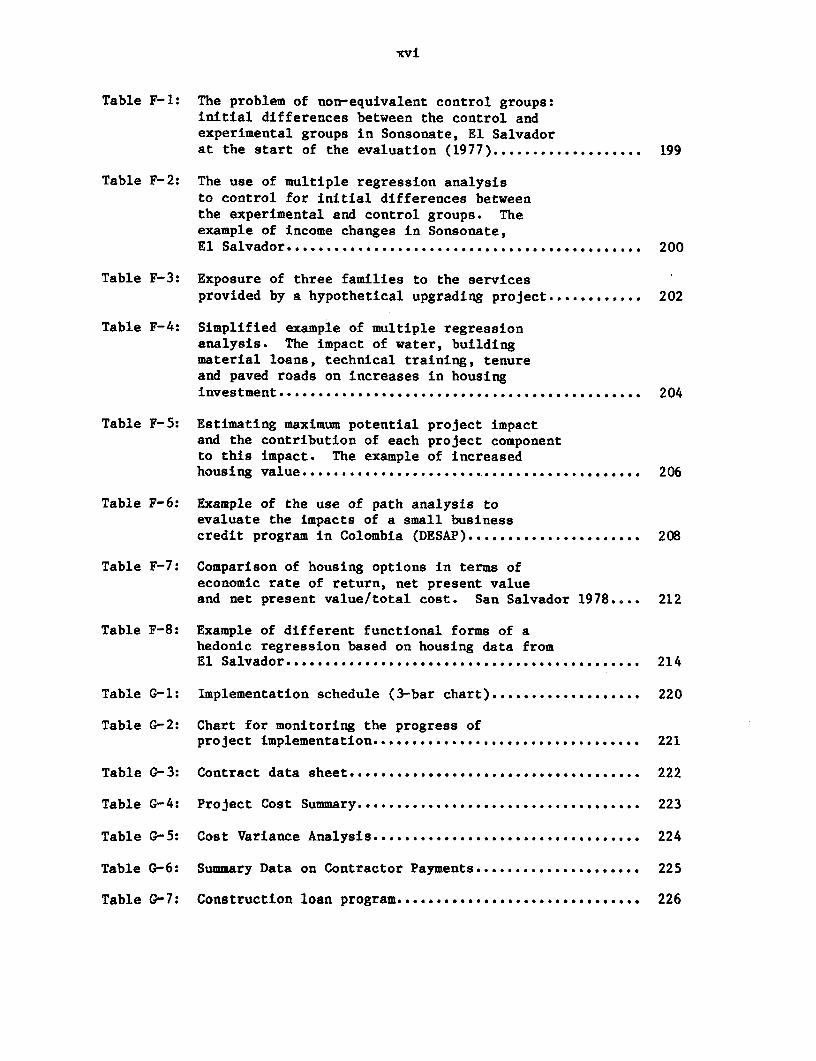
Table F-1: The problem of non-equivalent control groupe:initial differences between the control andexperimental groups in Sonsonate, El Salvadorat the start of the evaluation (1977) . . 199
Table F-2: The use of multiple regression analysisto control for initial differences betweenthe experimental and control groups. Theexample of income changes in Sonsonate,El Salvador .......................................................... 200
Table F-3: Exposure of three families to the servicesprovided by a hypothetical upgrading project ............ 202
Table F-4: Simplified example of multiple regressionanalysis. The impact of water, buildingmaterial loans, technical training, tenureand paved roads on increases in housinginvestment .............................................. 204
Table F-5: Estimating maximum potential project impactand the contribution of each project componentto this impact. The example of increasedhousing value . ............. . 206
Table F-6: Example of the use of path analysis toevaluate the impacts of a small businesscredit program in Colombia (DESAP) ................ 208
Table F-7: Comparison of housing options in terms ofeconomic rate of return, net present valueand net present value/total cost. San Salvador 1978 .... 212
Table F-8: Example of different functional forms of ahedonic regression based on housing data fromEl Salvador ........................................................... 214
Table G-1: Implementation schedule (3-bar chart) .................. . 220
Table G-2: Chart for monitoring the progress ofproject implementation ........... ........... . 221
Table G-3: Contract data sheet .............................. ........ 222
Table G-4: Project Cost Summary ..................... ............... 223
Table G-5: Cost Variance Analysis .................................. 224
Table G-6: Summary Data on Contractor Payments ......... ....... ...... 225
Table G-7: Construction loan program ............................... 226

xvii
Table G-8: Suumary of interviews on participantsatisfaction and information: project'La Esperanza" ................................... ...................... 227
Chart H-1: Listing components and steps of the project ............. 233
Chart H-2: Identification of main stages and estimating completiontime for sub-component: land acquisition ............... 234
Chart H-3: Identification of main stages and estimatingcompletion time for sub-component:participant selection. .. . ............................... . 235
Chart H-4: Example of a logical network chart ofproject implementation for a sites andservices project .................................................... . 236
Chart H-5: Example of table diagnosing estimatedproject duration and identifying potentialbottlenecks ...... ................................. 237
Chart H-6: Calendar of project implementation:design and land acquisition components(data from Chart H-4) ................................... 238
Chart H-7: Summary of delays in project implementationand their causes and consequences ....................... 239
Chart I-1: Defining cost-bearing activities (Exampleof the construction of a pedestrian subway) ............. 243
Chart I-2: Schedule of expenditures for each component ............. 244
Chart I-3: Project cost summary .................................... 245
Chart I-4: Summary of costs and expenditures for totalprogram broken down by project .......................... 246
Chart I-5: Integration of physical progress and coststatur analysis............... ........ a........... 247
Chart I-6: Cost variance analysis .................................................... 248
xviii
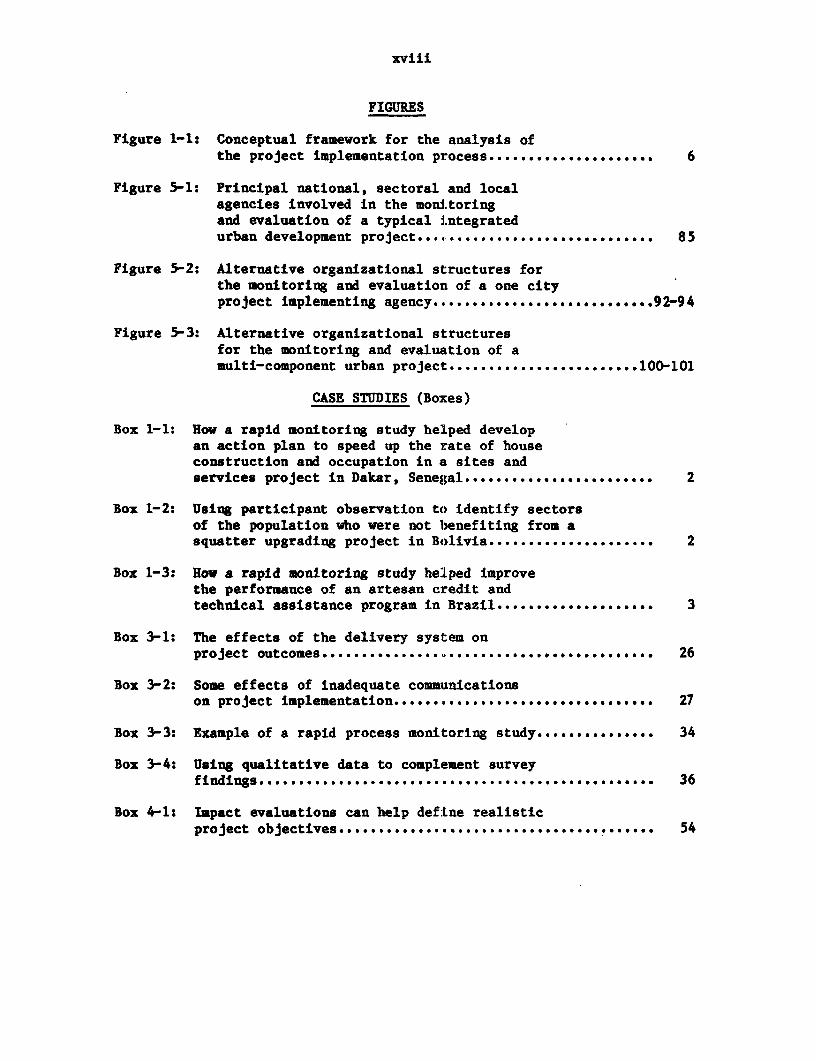
FIGURES
Figure 1-1: Conceptual framework for the analysis ofthe project implementation process..................... 6
Figure 5-1: Principal national, sectoral and localagencies involved in the moni.toringand evaluation of a typical iLntegratedurban development project..........*..Ooo ........... 85
Figure 5-2: Alternative organizational structures forthe monitoring and evaluation of a one cityproject implementing agency. ............ ............... 92-94
Figure 5-3: Alternative organizational structuresfor the monitoring and evaluation of amulti-component urban project ........................ 100-1
CASE STUDIES (Boies)
Box 1-1: How a rapid monitoring study helped developan action plan to speed up the rate of houseconstruction and occupation in a sites andservices project in Dakar, Senegal ........................ 2
Box 1-2: Using participant observation to identify sectorsof the population who vere not benefiting from asquatter upgrading project in Boivia..... ................ 2
Box 1-3: Hov a rapid monitoring study helped improvethe performance of an artesan credit andtechnical assistance program in Brazil .................... 3
Box 3-1: The effecte of the delivery sysltem onproject outcomes ....................... 26
Box 3-2: Somu effects of inadequate communicationson project implementation... ..... .... ...e e * * e e e e e s e..... 27
Box 3-3: Example of a rapid process moniitoring study................ 34
Box 3-4: Using qualitative data to complement surveyfindings ....... ..... e.... ...... ........ 36
Box 4-1: Impact evaluations can help defLne realisticproject objectives ......................................... 54

xix
Box 4-2: Using impact evaluations to compare thebenefit/cost ratios of alternative urban projects ......... 55
Box 4-3: An example of the benefits of combiningethnographic case studies and econometric methods ......... 58
Box 4-4: Example of a pre-test/post-testquasi-experimental design-* .... ....... ....... 70
Box 4-5: The use of multiple regression to statisticallymatch experimental and control groups ..................... 74
Box 5-1: Typical problems when monitoring and evaluationis subcontracted to outside consultants ..................a 88
Box 5-2: Problems which can arise when a longitudinalimpact evaluation is subcontracted to outsideconsultants ........................................................ 89
Box 5-3: An example of the use of long-term residentconsultants to assist in the design andimplementation of theevaluation.......................... 90
Box 5-4: The merits of separating or integratingmonitoring and evaluationunits........................... 96
Box 5-5: The organization of a monitoring and evaluationsystem for a complex, multi-city project .................. 98
Box 5-6: Example of an impact evaluation conducted bythe U.S. General Accounting Office ........................ 105
Box 6-1: Complexities of ensuring cost-recovery forpublic health services*..... ... a .......... o ............... . 123
Box 6-2: Cultural factors affecting access to publichealth programs ................................................. 125
Box 6-3: Some impacts of transport projects on thelow-income urban population............................... 128
Box 6-4: Examples of problems which arise whenmunicipalities try to develop new revenue sources......... 132
Box 6-5: Analysis of the impact of city characteristicson the performance of urban development projectsin 23 Colombian cities.......... .................... ...... 132


xxi
INTRODUCTION: A USERS GUIDE TO THE HANDBOOK
This Handbook is designed as an easily understandable guide to the
monitoring and evaluation of urban development projects. It is written
primarily for policy makers, managers and evaluation practitioners in
developing countries, but it will also be useful to international
development agencies and other readers involved in urban policy and
research.
Monitoring and evaluation are practical tools which should form
an essential part of good management practice. Monitoring is an internal
project activity which assesses (a) whether project resources (money,
materials, staff, etc) are being delivered and used in accordance with the
approved budget and timetable, (b) whether the intended outputs (numbers of
houses constructed, training courses given, patients treated etc) are being
produced in a timely cost-effective manner and, (c) assesses the efficiency
with which the project is being implemented.
The primary purposes of evaluation are (a) to assess the extent to
which the intended impacts (increases in income, reduced incidence of
certain infections, improved housing quality etc) have been produced and
(b) to compare the cost-effectiveness of a project with possible
alternatives.
The following examples, based on the experience of urban
development projects during the past decade, illustrate the importance of
effective monitoring and evaluation systems:
** Even the most carefully designed projects undergo substantialmodificacions during the process of implementation. Timely andappropriate decisions on project modification can only be made ifrapid feedback is received throughout the implementation process.
** Many projects have social objectives (reaching certain economic orcultural groups, developing community institutions etc.).Monitoring these social objectives requires the regularpresentation of socio-economic indicators which cannot be obtainedfrom the administrative reports produced by most programs.

xxii
** As urban development strategies increase their scope and
complexity it becomes increasingly difficult for a central
coordinating agency to monitor each project component and to have
a means of evaluating overall progress. Consequently there ls a
demand for a system which can rapidly provide a set of indicators
on the progress of each component and of the project in general.
** Most projects are part of an ongoing urban development strategy
in which lessons from one project: are used as inputs in the
design of subsequent projects. Development planners require
information on the contribution of particular projects to
overall development goals, the impacts on particular target
groups and a comparison of the cost-effectiveness of alternative
approaches.
A well designed monitoring and evaluation system can contribute to
all of these issues as well as providing most of the basic information
required for implementing the project anci for satisfying the reporting
requirements of government and international agencies.
The methods described in this Handbook are based on 10 years of
World Bank experience and a review of the extensive evaluation literature
produced since the early Seventies. The World Bank urban evaluation
experience began in 1975 with a cooperatiLve venture with the International
Development Research Centre (Ottawa) which supported a 5 year evaluation of
of the first World Bank financed urban shelter projects in El Salvador,
Zambia, Senegal and the Philippines. Since then the Bank has provided
assistance to governments in Asia, Africa and Latin America in the design
of their own monitoring and evaluation systems; and new evaluation
techniques designed to provide more rapici feedback or a better
understanding of the point of view of intended beneficiaries, have been
tested.
All of the methods described in the Handbook have already been
field tested. The unique contributions of the Handbook are (a) to bring
together, for the first time, and in an easily understandable form,
approaches taken from the fields of soctology, economics, anthropology and

xxiii
accountancy (b) to combine the experiences of both developing and
industrialized countries (c) present examples from studies which have been
conducted in all parts of the World and (d) to show how all of these
techniques can be combined in an integrated monitoring and evaluation
strategy.
One of the main problems in writing a comprehensive Handbook is
that readers have different interests and levels of research experience. A
number of methods have been used to help managers and other readers who
require a general overview of the system, to locate the sections of
interest and to avoid material which is too technical or detailed for their
purposes:
(a) A brief Managers Guide has been prepared which outlines the
essential elements of the proposed systems and which contains extensive
cross references to the appropriate sections of the Handbook.
(b) More technical and detailed material has been placed in
Annexes. The chapters contain cross references to these annexes.
(c) An extensive bibliography is included to guide readers
interested in a more detailed treatment of particular issues.
The Handbook has 6 chapters and 10 annexes containing more
detailed technical material. The subject areas of each chapter can be
summarized as follows:
Chapter 1: The Monitoring and Evaluation Framework
This chapter presents the framework within which the objectives,
scope and organization of a monitoring and evaluation system are defiLned.
Monitoring and evaluation are management tools and it is important that the
project manager be actively involved in the design, review and application
of the studies. The system should include performance monitoring (to
control the use of inputs and the production of outputs) process monitoring

xxiv
(to evaluate the efficiency and effectiveness with which the project is
implemented), impact evaluation to estimate the quantitative effects of the
project on the social and economic conditions of the target population; and
cost-effectiveness analysis to compare alternative projects in terms of the
outputs produced for a given cost. The key decisions which management must
take with respect to the planning and management of the studies are
discussed and finally a number of common problems in the design and
implementation of monitoring and evaluation are discussed, and some
possible solutions are proposed.
Chapter 2: Performance Monitoring
This chapter describes the design and implementation of a system to
provide periodic feedback on the progress of a project, the extent to which
inputs are being used in accordance with the approved budget and timetable,
and whether the intended outputs are being produced in a timely and cost-
effective manner. Two systems are described, a basic system which can be
simply and economically applied to any project; and a more complex system,
based on network analysis, which is more appropriate for larger and more
complex projects.
Chapter 3: Process Monitoring: Monitoring the Project Delivery System
This chapter reviews key issues and designs for monitoring the
efficiency and effectiveness of the project implementation process. Among
the issues discussed are the trade-offs between different indicators of
efficiency, and some of the organizational factors which have prevented
many projects from effectively monitoring the implementation process.
Process monitoring can either be used to provide regular information on the
progress of implementation, or to provide rapid feedback when problems
arise. The main data collection methods are presented, with the
recommendation that a multi-method approach should always be used in which
quantititative and qualitative methods are combined. Three study designs
are described: continuous observation throughout a project, periodic

xxv
studies, and studies conducted at only one point in time. Techniques are
described for monitoring the efficiency of the implementation process.
Finally recommendations are presented on how to define the appropriate
strategy for process monitoring.
Chapter 4: Impact Evaluation and Cost-Effectiveness Analysis
This chapter presents alternative research designs for the
evaluation of project impacts. The history of impact evaluation is reviewed
and the debate between the advocates of qualitative and quantitative
approaches is discussed. Key issues, including whether and when to conduct
impact evaluations, are discussed and examples of different research
designs are presented. A number of simple evaluation designs are presented
as alternatives to the large-scale quantitative approaches in those
situations where it is not necessary to obtain precise quantitative
estimates of project impacts. With respect to quantitative evaluation, a
distinction is made between approaches which estimate net project impacts
(the quasi-experimental design) and those which estimate cost-effectiveness
(cost-benefits analysis, cost-effectiveness analysis and cost-utility
analysis). Finally, guidelines are presented on how to choose the
appropriate impact evaluation strategy. The chapter includes
cross-references to technical material in the annexes on sampling, research
design and statistical analysis.
Despite efforts to simplify the presentation, this is the most
difficult chapter to follow for those readers with limited social science
research experience. Some readers may wish to skip parts of this chapter
and to leave the details to the researchers directly responsible for the
design of the impact evaluation studies.

xxvi
Chapter 5: Managing the Evaluation
This Chapter discusses the main issues involved in defining
the appropriate organizational structure for monitoring and evaluation at
the level of the implementing agencies, the local coordinating agency,
specialized sectoral agencies and national development and financial
agencies. Some of the issues include: defining who should conduct the
evaluation, the role of consultants, the appropriate organizational
location of the monitoring and evaluation units, the role of a steering
committee, and the distribution of evaluation responsibility between the
national, sectoral and local agencies. There is no single best
organizational structure and the location of the monitoring and/or
evaluation units is determined in each case by the scope and complexity of
the project and the relative size and research experience of the different
agencies involved. Guidelines are provided for estimating the financial
and human resource requirements for different types of monitoring and
evaluation programs. The final section discusses common problems in the
organization of an evaluation program and some of the possible solutions.
Chapter 6: Issues and Approaches in the Evaluation of New style Urban
Development Projects
This chapter reviews some of the new directions in urban
development which have evolved in recent years and discusses the extent to
which the monitoring and evaluation framework presented in earlier chapters
is applicable to them. The four types of projects which are discussed are:
income and employment generation, health, transport and urban and municipal
development. It is concluded that the techniques of performance monitoring
can be readily applied to all of these new types of projects, and that
process monitoring can be easily applied to the first three and with some
difficulty to municipal and institutional development. The main
difficulties occur in the evaluation of the impacts of the projects.
Problems arise because the size and scope of many of the projects makes it
difficult to identify a control group, because it is difficult to specify

xxvii
and measure impacts or because the project does not have a single sel: of
outcomes and impacts which can be clearly defined and measured. Strategies
are recommended for the application of each type of monitoring and
evaluation study to each of the four project areas.


!OE MOIT<NING AMD EVALUATION FRlMEIRK
A. Monitoring and Evaluation: Essential Management Tools
Monitoring and evaluation are essential management tools which helpimprove the efficiency of on-going projects and the selection and design offuture projects. Monitoring is an internal project activity designed toprovide constant feedback on the progress of a project, the problems it isfacing, and the efficiency with which it is being implemented. Projectswhich do not have an effective monitoring system are more likely to sufferdelays and cost overruns; to exclude or under-represent certain sectors ofthe target population; to have problems of quality control; or to takelonger to detect antagonisms among the implementing agencies or between theagencies and beneficiaries.
Evaluation, on the other hand, is mainly used to help in theselection and design of future projecte. Evaluation studies can assesa theextent to which the project produced the intended impacts (increases inincome, better housing quality etc) and the distribution of the benefitsbetween different groups, and can evaluate the cost-effectiveness of theproject as compared with other options. When a project does not have aneffective evaluation system the danger is increased of deciding to continuea project which is not producing the intended benefits; money may be wastedby not selecting the most cost-effective option; and it may be moredifficult to detect and correct some of the factors which are reducingproject impact.
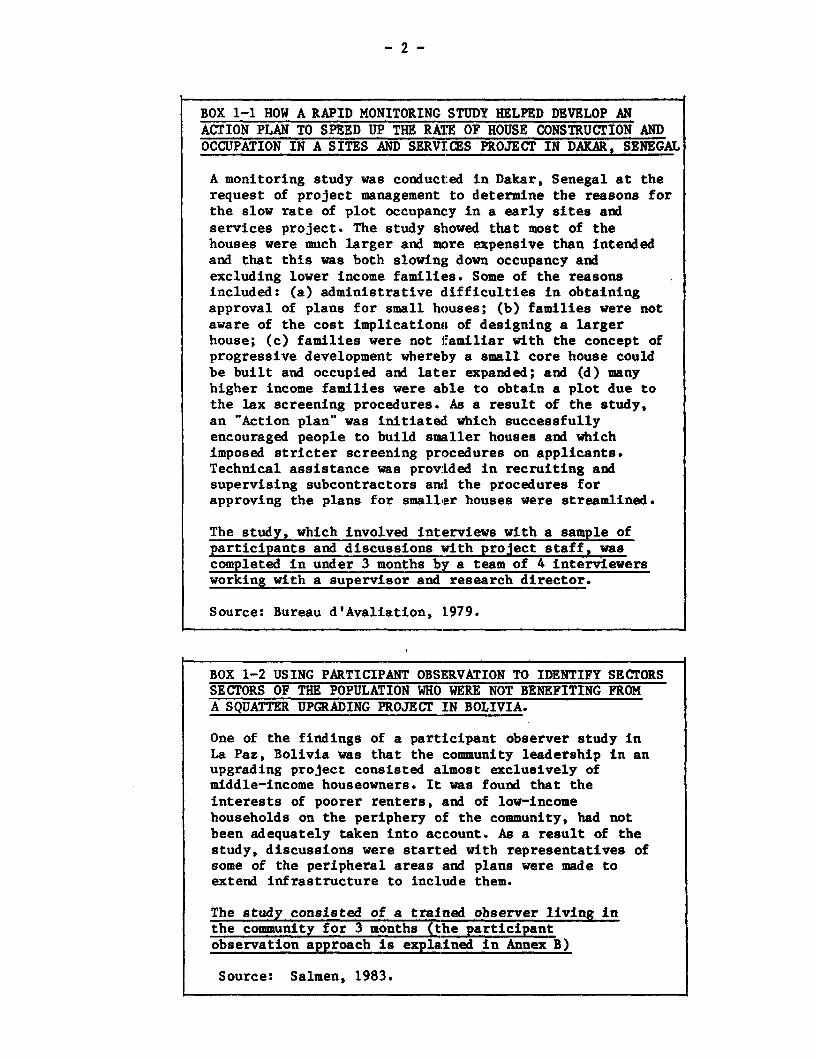
The following are examples of monitoring studies which were of directoperational utility to project managers. The first study (Box 1-1) examinedreasons for the slow rates of house construction and occupancy in Dakar,Senegal. An "Action Plan", based on the findings of this study, wassuccessful in getting families to build smaller houses which could becompleted more economically and rapidly. The second study (Box 1-2) foundthat renters and poor households living on the periphery of an upgradiLngproject in La Paz, Bolivia, were not sharing in most of the projectbenefits such as domestic water and paved roads. As a result of the studythe project began to require landlords to give tenants access to water, anddiscussions began vith families in some of the peripheral areas about waysin which they could be incorporated into the project. The third study (Box1-3) examined reasons for the poor performance of an artesan credit andassistance project in Campina Grande, Brazil. Weaknesses in the operatingmethods of the credit and training agencies were identified, and after somevery lively discussions, many of the problems were corrected. Each of theabove monitoring studies was conducted at the request of management arndeach of them provided operationally useful results economically and quickly(one of the studies was completed within 4 weeks and the other two within 3months).
- 2-
BOX 1-1 HOW A RAPID MONITORING STUDY HELPED DEVELOP ANACTION PLAN TO SPEED UP THE RATE OF HOUSE CONSTRUCTION ANDOCCUPATION IN A SITES AND SERVICES PROJECT IN DAKAR, SENEGAL
A monitoring study was conducted in Dakar, Senegal at therequest of project management to determine the reasons forthe slow rate of plot occupanc:y in a early sites andservices project. The study showed that most of thehouses vere much larger and more expensive than intendedand that this was both slowing down occupancy andexcluding lower income familltes. Some of the reasonsincluded: (a) administrative ,difficulties in obtainingapproval of plans for small houses; (b) families were notaware of the cost implications of designing a largerhouse; (c) families vere not familiar with the concept ofprogressive development whereby a small core house couldbe built and occupied and later expanded; and (d) manyhigher income families were able to obtain a plot due tothe lax screening procedures. As a result of the study,an "Action plan' was initiated which successfullyencouraged people to build smaller houses and whichimposed stricter screening procedures on applicants.Technical assistance vas provided in recruiting andsupervising subcontractors asud the procedures forapproving the plans for smaller houses were streamlined.
The study, which involved int,erviews wvth a sample ofparticipants and discussions with project staff, wascompleted in under 3 months by a team of 4 interviewersworking wlth a supervisor and research director.
Source: Bureau d'Avaliation, 1979.
BOX 1-2 USING PARTICIPANT OBSERVATION TO IDENTIFY SECTORSSECTORS OF THE POPULATION WHO WERE NOT BENEFITING FROMA SQUATTER UPGRADING PROJECT IN BOLIVIA.
One of the findings of a participant observer study inLa Paz, Bolivia vas that the community leadership in anupgrading project consisted almost exclusively ofmiddle-income houseowners. It was found that theinterests of poorer renters, and of low-incomehouseholds on the periphery of the community, had notbeen adequately taken into account. As a result of thestudy, discussions were started with representatives ofsome of the peripheral areas and plans vere made toextend infrastructure to include them.
The study consisted of a tralned observer living inthe community for 3 months (the participantobservation approach is explained in Annex B)
Source: Salmen, 1983.

- 3 -
BOX 1-3 HOW A RAPID MONITORING STUDY HELPED IMPROVETHE PERFORMANCE OF AN ARTESAN CREDIT AND TECHNICALASSISTANCE PROGAM IN BRASIL
A rapid survey was conducted in Campina Grande,Brazil, to determine the reasons for thedisappointing performance of an artesan credit andtechnical assistance program. It was found that mostartesans considered that the amount of credit was tooemall to permit purchases of machinery or the hiring ofmore workers. Very few had participated in trainingcourses offered by the project and the number oftechnical assistance visits from project staff had beenquite small. In addition to the smaller than expectednumber of credits, it was found that about 25% of thebeneficiaries were in occupational sectors the projectwas not intended to cover. As a result of the study anumber of important changes were made in the operatingprocedures of both the credit and training agencies.
The study, which involved interviews with 57 artesans,an analysis of secondary data and conversations withproject staff, was completed in 4 weeks.
Source: Unidade d'Avaliacao, 1984.
Chapter 4 presents examples of how impact evaluation andcost-effectiveness analysis can help improve the selection and design offuture projects. Box 4-1 (Chapter 4) describes how a rapid impact studydemonstrated the need to define much more precisely and realistically theintended beneficiaries and impacts of a small business credit program inFrancophone Africa. Box 4-2 describes a Cost-Benefit study which comparedthe social and economic efficiency of current approaches to the provisionof low-cost housing in El Salvador. It was shown that progressivedevelopment approaches such as sites and services and squatter upgradiingscored much higher on the indicators of economic and social efficiency(internal economic rate of return and the ratio of net present value 1eocosts) than did any of the conventional housing programs. Consequently, ifthe progressive development approach were implemented on a larger scale itcould significantly improve the efficiency of future housing strategies.

-4 -
The final example is the evaluation of the US Experimental HousingAllowance Program (described in Section C-i of Chapter 4). Although theevaluation cost around $50 million over a 10 year period, it has beenestimated that the recommendations which it produced could potentially Bavethe Federal Government up to $8 billion per year.
These examples show that a well designed and implemented monitoringand evaluation program can be a cost-effective way to:
* Provide constant feedback on the extent to which theprojects are achieving their goals.
* Identify potential problems at an early stage and proposepossible solutions.
* Monitor the accessibility of the project to all sectors ofthe target population.
* Monitor the efficiency with which the different componentsof the project are being implemented and suggestimprovements.
* Evaluate the extent to whiich the project is able toachieve its general objectives.
* Provide guidelines for the planning of future projects.
Many project managers have been discouraged from startingmonitoring and evaluation by the belief that these are highly technicalfields which should be left to research specialists or which are tooexpensive and complex to be of practical utility. Rowever, monitoring andevaluation need not be complicated or expensive, and the size andcomplexity of the studies can be adapted to suit the needs and resources ofeach project. For example, the monitoring studies described above were allsimple, short and economical. In some projects monitoring and evaluationmay be conducted by one part-time staff member whose main responsibility isto produce a quarterly report, whereas in other cases there may be aseparate monitoring and evaluation unit wiLth several full-timeprofessionals producing a wide range of studies. The role of the manager isto define the topics which need to be studied, to make sure thatresearchers use the most cost-effective methods, and to arrange for reportsto be reviewed, discussed and acted upon.

B. Framework for Monitoring and Evaluation of Urban DevelopmentProjects
1. A model of the project implementation processFor the purposes of this Handbook, an urban project is defined
as the set of urban development activities included in a government grantor authorization or in an agreement with an international developmentagency. A project will usually include a number of different sub-projectseach of which may be the responsibility of a different executing agency.Each sub-project may be further divided into components or stages. Aprogram refers to a long term development strategy and will usually ineludeseveral projects. For example, the First World Bank Urban Development Loanto Bolivia would be defined as a project. This comprised 6 sub-projects:squatter upgrading, 2 separate sites and services components managed bydifferent agencies, maternal and child health services and promotion ofsmall scale industries and artesan projects. These 6 sub-projects weremanaged by a total of 5 separate agencies. Each sub-project involved anumber of components or stages. For example, the artesan creditsub-project included: meetings and other forms of dissemination to informartesans about the project, visits and selection procedures, lectures andtraining, technical assistance, approval and supervision of credits. Theproject was intended to lay the groundwork for a long-term urbandevelopment program which would replicate successful components on a largerscale and which would initiate similar projects in other cities.
Urban development sub-projects can range from the provision ofbasic core housing units to the improvement of municipal tax collectionsystems. Despite their diversity, the implementation process of anysub-project can be represented by the simple model given in Fig 1-1. Ailproject components, whether solid waste disposal, municipal transport orsmall business development, begin with a project preparation stage in whichobjectives are defined and resource requirements are estimated. Duringthis stage, assumptions are made about the needs of certain sectors of thepopulation and about the relative attractiveness of alternativeimplementation methods. During this preparation stage technical, financialand economic analysis vill usually be conducted and a project proposal villbe prepared and submitted to the national or international agencies whovill be asked to approve and finance the project.
Once the project is approved, procedures are established for theprocurement and administration of inputs (money, equipment, staff, landetc) authorized in the project document (loan agreement in the case ofprojects with international funding). The project document also definesthe outputs which the project is intended to produce. Two types of outputscan be distinguished. The first are the specific implementation objectivesdefîned in the loan agreement or project document. These are usuallyquantifiable objectives such as the construction of a certain number ofhousing units or the approval of a certain number of building materialloans. Many banks and international lending agencies consider that theproject is completed once these implementation outputs have been produced.The second type of output is produced during the the operational stage ofthe project. Operational outputs include cost recovery, maintenance,increasing the tax base and institutional development at the community andmunicipal levels.

Fig 1-1 FRAMEWORK FOR MONITORING AND EVALUATION OF THE PROJECT IMPLEMENTATION PROCESS
TECHNICAL, FINANCIAL, MONITORING PROJECT COMPLETION EX POST PROJECT
AND ECONOMIC ANALYSIS REPORT EVALUATION
LOAN APPROVAL
PRCOJECT INPUTS IMPLEMENTATION OUTPUTS IMPACTS PLANNING AND DESIGNPREPARATION METHODS OF NEW PROJECTS
Planning and Procurement and Self-help house Implementation Operation Increased income Cost-effectivenessdesign. V administration v construction vs . " anaiusis, redefine
of money, use of contractors, Houses built. Maintenance. Improved health target population ar-Definition of materials, different methods delivery systemcomponents and equipment, and of administering Patients treated Developing Increasedtarget population. staff. building material community employrment
credit, etc. Industrial plots groups.sold
Cost recovery,
CONTEXTUAL FACTORS AND CHARACTERISTICS OF THE TARGET POPULATION
Macro-economic and political environment, natural disasters and thecharacteristics of the intended and actual project participants.

-7-
Once the inputs and outputs have been defined, a series ofimplementation methods are selected by which the inputs vill be used toproduce the outputs. For example, the designers of a low-cost housingproject must decide whether to organize self-help construction groups or tohire contractors to construct the housing units. Similarly, artesan creditcould be administered through regular banking channels, or special creditoffices could be established in the low-income areas where the artesanslive and work. It is important to monitor closely the implementationmethods as the success of a project in achieving the desired outputs issignificantly affected by the choice of implementation methods and the wayin which these methods are actually used.
Although the immediate concern of managers is to ensure thatthe outputs stated in the project agreement are successfully completed,almost all components have a set of impacts they are intended to produce.For example, project planners may hope that the provision of economicalcore housing will: increase household income (through subletting, becausethey are nearer to places of employment or because the new house-ownerswill increase their demand for certain goods and services); reducegeographical mobility (house-owners may have more incentive to remain inthe community as the value of their property is appreciating) and havebeneficial effects on health (due to better water supply and sanitation).The definition of impacts involves assumptions about how people willrespond to project outputs. It may be assumed, for example, that access tocredit will induce artesans to hire more labor or purchase more machinery;or that access to drinking water will change hygene practices and the wayin which food is prepared.
It is important to know how much importance will be given to thesuccessful production of impacts in decisions about future projects. Insome cases projects are judged mainly on their cost-effectiveness inproducing certain outputs (number of houses built, number of patientstreated), and relatively little importance is given to whether the projectalso produced the expected impacts on income, employment, health etc.Planners may argue, for example, that the provision of drinking water anÀdsanitation is an essential pre-condition for long term improvements inpublic health and that these components are justified irrespective ofwhether they produce short-term health impacts. In a case like this, wheredecisions on future projects do not depend on whether or not health impactshad been produced by the first project, there may be no justification forconducting a rigorous impact evaluation. In other cases where alternativeapproaches are being compared in order to select the most cost-effectiveoption, the ability of projects to produce certain impacts may be a keyfactor in deciding on future investment strategies. Before a decision canbe made on whether or not to conduct a quantitative impact evaluation, itis essential to understand the importance which policy makers attach to theproduction of impacts.
Many projects are intended to form part of an ongoing urbandevelopment program and frequently the results of the first project areintended to provide guidelines for the definition and design of futureprojects. If the first project is perceived to have been successful, futureprojects are more likely to adopt a similar approach; but, if it isperceived to have been unsuccessful, future projects in this field may be

-8-
cut back or modified. We stress the importance of the perceived results, asmost of the decisions on future project design are made without access tosystematic information on the results of earlier projects.
Projects do not develop in a vacuum, and success is significantlyaffected by the characteristics of the target population, and by thepolitical and economic context within which the project is implemented. Forexample, if identical core housing is provided in a fishing community andin an area where most household heads have permanent employment infactories, there may be significant differences in the outputs and impactsproduced by the two projects and in the amount of private housinginvestment which takes place. The fate of projects is also influenced bythe economic and political environment in which they operate. Highinflation and unemployment affect affordability; and the election of a newmayor, or a conflict between the central and local government may suddenlyincrease or decrease resources and support for the project. All of thesefactors must be taken into account when trying to understand why a projecthas been more or less successful than expected.
2. The functions of monitoring and evaluationMonitoring and evaluation are designed to provide project
management, and national and international development agencies with timelyand operationally useful information on how efficiently each stage of theproject is operating, the degree to which intended impacts are beingachieved and the lessons for future projects.
Monitoring is an internal project activity concerned to assesswhether project resources (inputs) are being administered and used asintended and whether they are producing the intended outputs. It is usefulto distinguish between performance monitoring and process monitoring.
a. The purpose of Performance Monitoring is to assess the extentto which project inputs are being used in accordance with the approvedbudget and timetable and whether the intended outputs are being produced îna timely and cost-effective manner. It may also assess whether projectbenefits are reaching the intended population groups. PerformanceMonitoring is intended to improve project supervision, and it is essentialthat management receive constant feedback on key indicators of projectperformance so that problems can be detected and corrections made. Themain approaches to Performance Monitoring are described in Chapter 2, andin Annexes G,H and I.
b. The purpose of Process Mcnitoring (referred to by someauthors as process evaluation) is to providte feedback to management on theefficiency and effectiveness of the project delivery system. Two areas ofparticular importance are the analysis of how the project is perceived by,and actually operates at the level of, the. intended beneficiaries; and theeffectiveness of the communication and organizational linkages between theimplementing agencies and beneficiaries. The speed and costs of thedelivery system and the quality of the outputs are measured, and wherepossible a comparison is made with alternative approaches. The effects mayalso be assessed. The methods of process monitoring are described inChapter 3.

- 9 -
Whereas monitoring is an internal project activity intended toimprove the performance of an ongoing project, the purpose of evaluation isto help with the selection and design of future projects. Evaluation canbe divided into impact evaluation and cost-effectiveness analysis.
Impact evaluation estimates the net impacts of a project on tNhetarget population by comparing the conditions of the affected groups afterthe project has taken place with what they would have been, had therBe notbeen a project. Depending on the types of information required for futureproject planning, studies can either be designed to provide generaldescriptive information on impacts, or to produce quantitative estimates ofthe magnitude of the impacts. The studies estimate the degree to which theobserved changes can be attributed to the effects of the project (have been"caused" by the project) and examine the factors which contribute to thedegree and direction of the impacts.
The purpose of Cost-effectiveness analysis is to compare alternativeprojects in terms of the cost of producing a given output. In the housingallowance program described in Chapter 4, output was defined in terms ofthe amount invested by households in upgrading their dwelling unit. It vasshown that providing loans which families could use to make their ownimprovements vas more cost-effective than alternative programs in whichfederal agencies were directly responsible for making housingimprovements. Both impact evaluation and cost-effectiveness analysis aredescribed in Chapter 4.
Although each of these four types of study has different purposes,they complement each other and should be used together in an integratedmonitoring and evaluation program. Let us assume, for example, that theevaluation of a water supply and sanitation project finds that the expectedimprovements in the height and weight of young children have not takenplace. The impact evaluation on its own cannot explain whether thisfinding means that the underlying assumptions of the project are invalid,or whether the problem is due to the way in which the project wasimplemented. In this case process monitoring could identify any problemswhich occurred during implementation and could assess the extent to whichthese problems have contributed to the lack of expected impacts. Ifserious problems occurred during implementation, it would clearly bedifficult to interpret the negative impact findings as evidence thatimproved water and sanitation do not affect child health. In this case themonitoring studies could greatly increase the operational utility of theimpact study. In other cases the impact study can be used to complementthe findings of monitoring studies by assessing whether a project which isbeing implemented very efficiently, is producing the intended impacts.For example, if an efficiently run job training program does not have anyImpact on income or employment there may be no justification for its beingcontînued.
C. Planning the Monitoring and Evaluation System
This section describes the main decisions and actions which amanager muet take in selecting and planning the appropriate types ofmonitoring and evaluation studies for a particular project. The issues arediscussed in more detail in Annex C.

- 10 -
1. Defining the issues to be studiedEvery study involves costs of money and staff time, and it is
therefore essential for management to select carefully the issues whichshould be covered by the monitoring and evaluation. There are usually anumber of different ways in which any topic can be studied, and as theapproaches vary considerably in terms of detail, complexity, time and costit is important for the manager to define carefully exactly what type ofinformation is needed. There are four main sets of issues on which thestudies can focus and managers must decide the relative importance of eachand how resources will be allocated between them:
a. Monitoring the use of project inputs and the production ofoutputs according to cost and time schedules. Although PerformanceMonitoring is an essential supervision and control procedure which must beincluded in all projects the manager must decide whether to use arelatively simple approach or to develop of one of the network based (andpossibly computerized) monitoring systems described in Annexes H and I.The basic operational procedures for monitoring are described in Chapter 2.
b. Monitoring the process of project implementation. It isstrongly recommended that resources are made available to monitor theimplementation process as this can contribute to project efficiency andensure that benefits are reaching the target population. Management mustdecide whether to only conduct studies when problems have been identifiedduring implementation, or to develop an ongoing program of processmonitoring which also studies projects which are going well. Chapter 3describes the varlous approaches which can be used.
c. Evaluating project impacts on the target population. Whereasall projects require relatively standardized monitoring procedures,managers have more flexibility in defining the scope and intensity of theimpact evaluation. The importance of precise estimates of impacts as afactor in the selection of future projects will usually determine whetherthe evaluation is designed to produce general, non-quantitative estimatesof project impacts (described in Chapter 3 and Annex B), or whethercarefully controlled experimental studies will be used to producequantitative estimates of project impacts. For example, project impact onhousehold income could be studied either through qualitative interviews andobservation of a small number of subjects, or through a longitudinal impactstudy which would require interviews with a large sample of projectparticipants and a control group at two or more points in time. The firstoption would be much cheaper and faster, b~ut much less precise. Themanager, not the researchers, must decide which approach will provide theinformation needed for future policy decisions. Chapter 4 describes thetechniques for conducting each type of study. The importance is stressedof combining quantitative and qualitative evaluation techniques and ofintegrating impact evaluation with process monitoring so as to understandthe way in which project implementation affects outputs and impacts.
d. Using cost-effectiveness analysis to compare alternativeprojects in terms of their costs for producing certain outputs. Thesetechniques are described in Chapter 4 section F.

- il -
2. Organizing the monitoring and evaluationDecisions have to be made about whether monitoring and
evaluation will be conducted within the executing agencies or whether someor all of the studies will be subcontracted to other organizations. Wheremonitoring and evaluation are conducted internally, decisions have to bemade on the location of the monitoring and/or evaluation units within theorganizational structure. The decision must also be made as to how and whento use consultants. All of these issues are discussed in Chapter 5.
3. The scope and intensity of the studiesFor large projects with many components, and possibly covering
many different geographical areas, research priorities must beestablished. It would be excessively expensive and time-consuming tointensively study every component in every area and consequently managementmust decide which components or areas are the most important to study. Asdiscussed previously, it is also important to define whether precisequantitative estimates of impact are required, or whether descriptivestudies will suffice.
4. Ensuring that the evaluation is "user oriented" and not"technique oriented"Many monitoring and evaluation researchers have become experts
in the use of particular research techniques, and some researchers are moreconcerned with the selection and refinement of techniques than withensuring that the studies satisfy the information needs of the projectmanager. All research methods have their strengths and their weaknessesand a good evaluation design should always include a number of differenttechniques so as to obtain a wider understanding of the problem and toavoid the types of bias which inevitably occur when only one method isused.
When talking to evaluators, the project manager will discoverthat there is a controversy between the advocates of quantitative("objective") methods, which seek to provide rigorous statistical est:Lmatesof project impacts; and the advocates of qualitative ("subjective")methods, which seek to understand the value systems of the affectedpopulations and the meanings they attach to the project. These issues arediscussed in Chapters 3 and 4. It is argued that both quantitative aundqualitative methods have their strengths and weaknesses, and that theevaluation design should include both.
5. Defining resource requirementsMonitoring and evaluation techniques vary widely in terms of
their scope, complexity and cost. One of the functions of the manager isto select the types of studies and the organizational structure which bestrespond to the needs and resources of the project. Resources should 'beallocated to high priority issues and care must be taken to avoid investingresources in studies with limited operational utility. Chapter 5 providesguidelines for estimating the likely resource requirements for differenttypes of monitoring and evaluation programs.

- 12 -
When addressing the issue of affordability of an evaluation itis important to keep in mind the concept of cost-effectiveness. In acomplex project there may be a justification for investing large sums ofmoney in order to conduct a rigorous evaluation of alternative investmentstrategies as this may permit very large cost savings in the design offuture projects (see the example in Chapter 4 Section C.1 and Table 4.1).
D. Managing the Monitoring and Evaluation
1. The role of the project manager in monitoring and evaluationMonitoring and evaluation are management tools, and in order for
them to be operationally useful the project manager must be activelyinvolved in all stages of the design and review of the studies and in theimplementation of the recommendations. Although the technical aspects ofthe studies are the responsibility of th,e research team or consultants, theproject manager must control the selection of studies and ensure theimportant operational questions are being addressed. When theresponsibility for the design and execution of monitoring and evaluation isleft to researchers, the studies may become too academic and theiroperational utility may be reduced.
2. Defining the main users of montitoring and evaluationIn order to ensure that the monitoring and evaluation reports
will be operationally useful, it is firs: necessary to define the potentialusers of the studies and their information needs. There are usually fourmain groups of users:
a. Project managers: who use the information to control theimplementation of the projects for which they are responsible; to ensurethat objectives are being reached and that the benefits are reaching thetarget population; and to help in the design of future projects or theextension of the project to new areas.
b. Urban development planners: who use the information toevaluate the project impacts on the overall development of the city; tocompare costs and performance with alternative investments and to plan newprojects.
c. National finance and planning ministries: who use theinformation to speed the receipt of future disbursements by internationallending agencies; to control internal cash-flow and to evaluate revenuegenerating impacts of the projects.
d. International lending agencies: who use the data as thebasis for their regular supervision and planning activities and to assistin planning future disbursements.
In addition to these groups of primary users, the informationis of utility to a vide range of researchers and academic institutions.

- 13 -
3. The outputs of monitoring and evaluation and their practicalutilityIt is important to ensure that the monitoring and evaluation
studies will produce reports which appear in a timely fashion, which aresimple to read and which address the key operational issues. In order toensure this, the studies and their outputs should be closely coordinatedwith the main stages of the project development cycle (see Table 1-1). Thefollowing are the main types of operationally useful studies and reportswhich can be produced at each stage of the project cycle.
a. Studies produced during the project planning and designstage
(i) The monitoring and evaluation system should bedeveloped and appraised during the project design stage in the same way asother project components. A detailed research design, stating objectives,methods and organization should be prepared and agreed to at this stage.
(ii) The preliminary findings of evaluation studies can bevery helpful in the planning of a new project. For example, participantobservation or other in-depth studies can estimate the likely reactions ofa community to a proposed project and can identify potential problems whichmay arise in certain communities.
(iii) Although they are potentially very useful, mostevaluation reports are not produced until towards the end of a project, bywhich time the second project may already have been designed. In order toensure that full use is made of the experience of the first project in thedesign of subsequent projects, special studies may need to be conducted.
b. Studies produced during the process of projectimplementation
(i) Regular monitoring reports are produced to assess theuse of resources and the production of outputs and to identify keyissues requiring more intensive study. The monitoring reports will often bepublished in the form of a Quarterly Progress Report (see Chapter 2). Thepurpose of this report, which is frequently required by the nationalgovernment or the lending agency, is to provide a summary of key indicatorson the progress of each project component, together with an indication ofkey problems and issues requiring attention. The report should providefeedback on community attitudes and interactions with other organizations,as well as summarizing information collected within the agency itself.
(ii) Continuous panel studies (or periodic studies) may beconducted on certain projects to provide continuous feedback onimplementation and to identify potential problems.
(iii) One-time studies are conducted whenever managementrequires help in the evaluation of problems or requires information to helpin making an important decision. These may either be rapid studiesdesigned to produced feedback within a few weeks or they may be moreintensive studies when the problem to be studied in more complex.

TABLE 1-1: EVALUATION OUTPUTS AND THE PROJECT CYCLE
Stage of Project Cycle Evaluation Output Comments
Regular Project supervision Quarterly Progress Report This will complement and be preparedat the same time as the QuarterlySupervision Report sent to the donoragency. Whereas the SupervisionReport is prepared for use inWashington, the Progress Report isdesigned for project management andfor the project officer.
Rapid feedback studies More detailed analysis of issuesidentified in the Quarterly ProgressReport.
Intensive studies Occasionally these will be requestedto assist with project supervision.
Mid-term project review Mid-term project review This will normally be a synthesis ofexisting studies although additionaldata rollcrtion mav hp rpnuirped
Intensive or rapid feedback These may be conducted to producestudies information required for the mid-term
review.
Project completion and audit Final report This will complement the projectcompletion report submitted to thedonor, or in some cases the tworeports may be merged.
Intensive or rapid feedback May be conducted to producestudies information required for the final
report.
Appraisal of second project Mid-term project review or Depending on the timing one or both offinal report these reports will provide inputs into
the appraisal and design of newprojects.
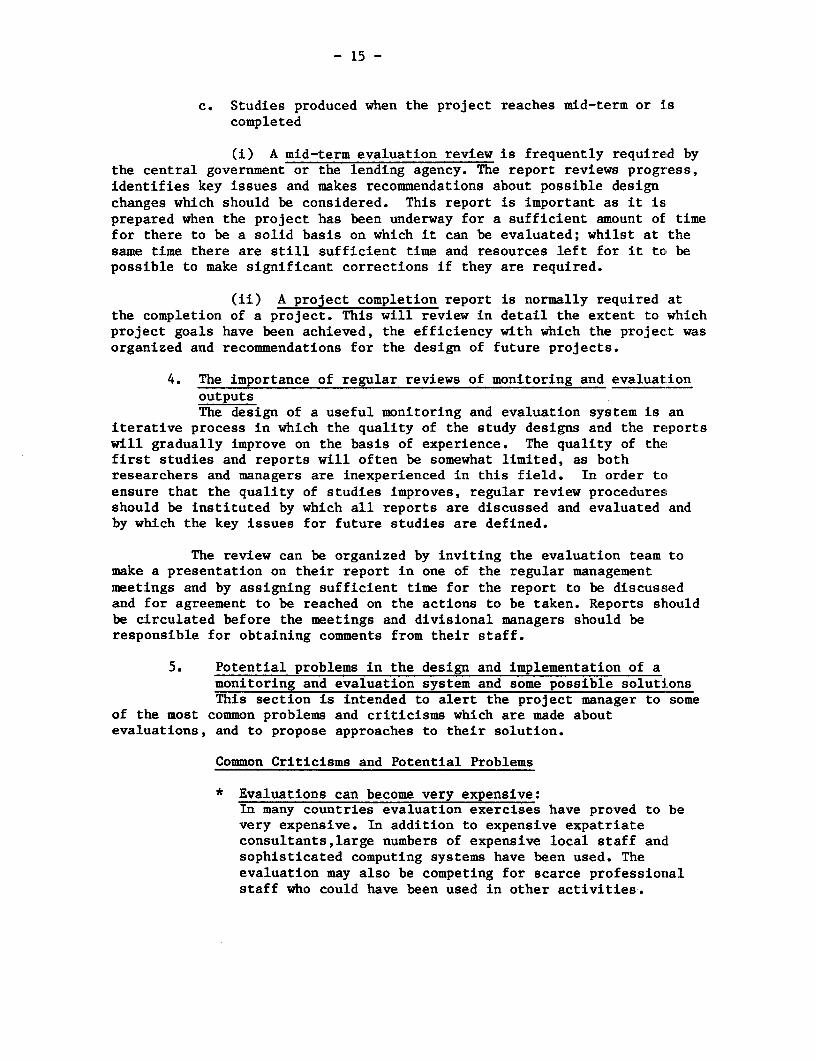
- 15 -
c. Studies produced when the project reaches mid-term or iscompleted
(i) A mid-term evaluation review is frequently require!d bythe central government or the lending agency. The report reviews progress,identifies key issues and makes recommendations about possible designchanges which should be considered. This report is important as it isprepared when the project has been underway for a sufficient amount of timefor there to be a solid basis on which it can be evaluated; whilst at thesame time there are still sufficient time and resources left for it toc bepossible to make significant corrections if they are required.
(ii) A project completion report is normally required atthe completion of a project. This will review in detail the extent to whichproject goals have been achieved, the efficiency with which the project wasorganized and recommendations for the design of future projects.
4. The importance of regular reviews of monitoring and evaluationoutputsThe design of a useful monitoring and evaluation system is an
iterative process in which the quality of the study designs and the reportswill gradually improve on the basis of experience. The quality of thefirst studies and reports will often be somewhat limited, as bothresearchers and managers are inexperienced in this field. In order toensure that the quality of studies improves, regular review proceduresshould be instituted by which all reports are discussed and evaluated andby which the key issues for future studies are defined.
The review can be organized by inviting the evaluation team tomake a presentation on their report in one of the regular managementmeetings and by assigning sufficient time for the report to be discussedand for agreement to be reached on the actions to be taken. Reports shouldbe circulated before the meetings and divisional managers should beresponsible for obtaining comments from their staff.
5. Potential problems in the design and implementation of amonitoring and evaluation system and some possible solutionsThis section is intended to alert the project manager to some
of the most common problems and criticisms which are made aboutevaluations, and to propose approaches to their solution.
Common Criticisms and Potential Problems
* Evaluations can become very expensive:In many countries evaluation exercises have proved to bevery expensive. In addition to expensive expatriateconsultants,large numbers of expensive local staff andsophisticated computing systems have been used. Theevaluation may also be competing for scarce professionalstaff who could have been used in other activities.

- 16 -
Limited involvement of program management in the design ofthe evaluation:Many evaluations are designed by consultants orresearchers with very limited input from management,either in the definition of the objectives or in thereview of the system once! it is operational. As a resultthe findings may be of limited operational utility.
* Too much emphasis on long-term studies which do not produceimmediate results for management:Many evaluation manuals place emphasis on longitudinalimpact studies designed t:o measure overall project impact.These long-term studies often become one of the majorcomponents of the evaluation and, as a result, too littleattention is given to short and medium run studies.
* Division of the research between separate and uncoordinatedunits:Monitoring and Evaluation are often set up as separateunits, with different staff reporting to different parts ofthe organization. Often t:here is very little coordinationbetween the Monitoring and Evaluation teams.
* Inadequate methods for the dissemination of findings:A high proportion of the research is never read by thepeople for whom it was intended. Decision-makers are verybusy and they do not have the time to read long reports.
* Very little feedback or control from the organization onthe way in which the research develops:Researchers complain that: they receive very little feedbackor guidance from the organization, so they do not knowwhether their studies are useful or how they should bechanged. Management, for its part, often complains aboutthe large amount of time which must be devoted to theresearch. As a result, the evaluation program oftendevelops in a vacuum.
It is important to emphasize that, in most cases, these problemshave arisen not from lack of interest. Usually, great time and effort havebeen devoted by managers and researchers to trying to make the evaluationuseful. Difficulties seem to arise not f rom disinterest, but from the wayin which the evaluation activities are perceived and how they areorganized.
Possible solutionsThe above problems have no simple solutions as can be seen from
the difficulties which efforts to improve evaluation performance have oftenencountered. A number of basic guidelines are proposed to ensure a moreefficient use of an organization's research activities:
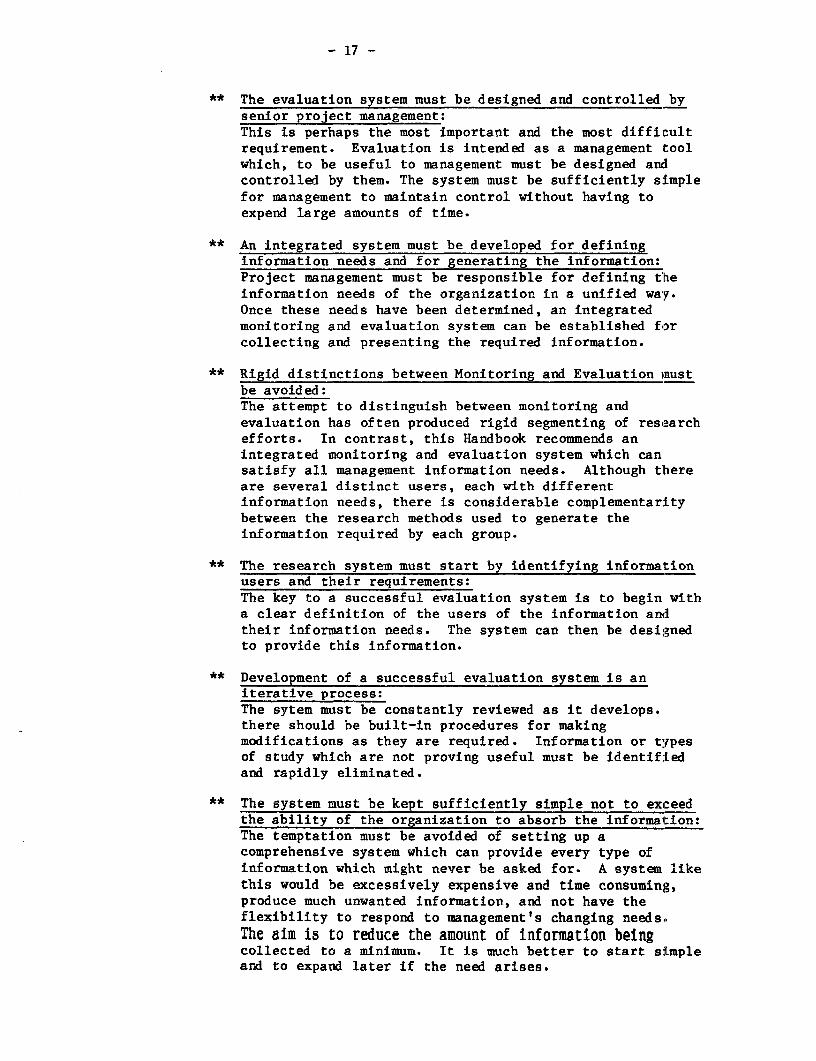
- 17 -
** The evaluation system must be designed and controlled bysenior project management:This is perhaps the most important and the most difficultrequirement. Evaluation is intended as a management toolwhich, to be useful to management must be designed andcontrolled by them. The system must be sufficiently simplefor management to maintain control without having toexpend large amounts of time.
** An integrated system must be developed for defininginformation needs and for generating the information:Project management must be responsible for defining tlheinformation needs of the organization in a unified way.Once these needs have been determined, an integratedmonitoring and evaluation system can be established forcollecting and presenting the required information.
** Rigid distinctions between Monitoring and Evaluation mustbe avoided:The attempt to distinguish between monitoring andevaluation has often produced rigid segmenting of researchefforts. In contrast, this Handbook recommends anintegrated monitoring and evaluation system which cansatisfy all management information needs. Although thereare several distinct users, each with differentinformation needs, there is considerable complementaritybetween the research methods used to generate theinformation required by each group.
** The research system must start by identifying informationusers and their requirements:The key to a successful evaluation system is to begin witha clear definition of the users of the information andtheir information needs. The system can then be designedto provide this information.
** Development of a successful evaluation system is aniterative process:The sytem must be constantly reviewed as it develops.there should be built-in procedures for makingmodifications as they are required. Information or typesof study which are not proving useful must be identifiedand rapidly eliminated.
** The system must be kept sufficiently simple not to exceedthe ability of the organization to absorb the information:The temptation must be avoided of setting up acomprehensive system which can provide every type ofinformation which might never be asked for. A system likethis would be excessively expensive and time consuming,produce much unwanted information, and not have theflexibility to respond to management's changing needseThe aim is to reduce the amount of information belngcollected to a minimum. It is much better to start simpleand to expand later if the need arises.

- 18 -
CHAPTER 2
PEFORMANCE MONITORING
A. Performance Monitoring and Process Monitoring
Successful accomplishment of a project's objectives requires a planthat identifies specific tasks to be done, the costs, the sequence in whichthey are to be done, the linkages of these activities and effectivemanagement of this plan.
The process of managing such a plan toward project completionembraces the concept of monitoring. As explained in Chapter 1, monitoringis an internal project activity designed to provide periodic feedback onthe progress of a project, the problems it is facing, and the efficiencywith which it is being implemented. Monitoring can be broken down intoperformance monitoring which assesses the extent to which inputs are beingprocured and used in accordance with the approved budget and timetable andwhether the intended outputs are being produced in a timely andcost-effective manner; and process monitoring which assesses the efficiencyof the methods used in project implementation. This chapter will discussperformance monitoring and the following chapter will discuss processmonitoring.
Monitoring is an essential management tool. Projects which do nothave an effective monitoring system are nfore likely to suffer delays andcost overruns; to exclude or under-represent certain sectors of the targetpopulation; to have problems of quality control; or to take longer todetect antagonisms among the implementing agencies or between the agenciesand project beneficiaries.
Performance monitoring helps management assess the progress ofimplementation and take timely decisions towards efficient and effectiveproject completion. Complex data collection systems are usually notrequired to achieve this. Neither does ukonitoring necessarily have toresult in voluminous reporting. The overall goal of a monitoring system isto make the data collection as relevant as possible, and to ensure that themeans exist for fast collection and summary of data so that it can bepresented as useful information to the decision-makers.
A monitoring system established early in the project cycle canserve as an effective project management tool by providing continuous,relevant, action-oriented information in order to make timely modificationsas necessary. A typical urban project lasts around seven years. Duringthis period there are likely to be significant changes in the economic,institutional and political environment Àhich are likely to affect theproject's performance.
Developments take place that were not foreseen at the time ofproject design: cost overruns occur, demand could be low, disbursementscan be delayed or reduced due to problems in negotiating counterpart funds,time delays in construction occur due to inclement weather conditions,consulting engineers could perform unsatisfactorily. All of these factors

- 19 -
could require adjustments in the scope and composition of the project tosuit changing conditions. It is indeed unrealistic to expect a proje!ct tobe completed exactly as planned. Effective monitoring of a project'sdevelopment based on a thorough understanding of its inputs, sequence ofactivities and their interrelationships can enable management to detectearly any unexpected situation so that corrective or adaptive measurescould be taken.
All urban projects undergo some form of monitoring whether by linemanagers or through a small unit designed explicitly for this purpose. Tothe extent that a project is managed it is monitored. Monitoring is an aidto project management. All implementing agencies submit quarterly ormonthly monitoring reports on a regular basis, in some cases to their owngovernment, in others to an international lending agency. Sometimesfinancial status reports on project accounts are submitted separately fromreports on physical progress. These two kinds of reports are usuallyprepared by different units of the implementing agency or by differentagencies altogether with little coordination in compiling these documents,with the effect that their usefulness as project management or projectcontrol tools is minimized. The system outlined below attempts to addressthis weakness. It integrates project budgets with actual project timning,costs and performance of a project's components.
B. Designing the Performance Monitoring System
The exercise of thinking through the design of a monitoringsystem for a particular project helps to internalize into the managementsystem the project's objectives, how these objectives will be accomplished,performance indicators for measuring progress, and available data sourcesfrom which the measures can be drawn. It also forces management to definehow the results should be disseminated to the coordinating agencies. It isthus preferable that the design be done by the project management, ratherthan by consultants, so that management information needs are adequatelyreflected.
Projects vary greatly in terms of their complexity and in terms ofthe resources available to monitor them. Consequently two alternativeperformance monitoring systems are presented. Annex G describes arelatively simple system which can be implemented in any project, andwhich requires very few additional financial and human resources. Thisbasic Performance Monitoring System can provide management with all of theessential information required for project control. Annexes H and Ipresent a somewhat more complex Network Based Monitoring System whichprovides a much more rigorous control of physical and financialimplementation, and which is recommended for larger and more complexprojects. Reference is made to both systems throughout this chapter.Annex G provides a set of pro forma monitoring tables which can be used asguidelines and adapted to suit the specific requirements of each project.
A project's schedule and budget will normally predict whencertain stages of physical progress should begin and end, whenexpenditures should be disbursed and when "software" project elementsshould begin. The charts given in Tables G-1 and G-2 of Annex G illustratehow this approach could be applied in planning a hypothetical project to

- 20 -
renovate the existing housing stock in a large city. The chart, byshowing the logical sequence of activities, provides a simple way toidentify those components which are falling behind schedule, and where someaction must be taken. Adherence to the suggested sequence is essential toensure that a project's objectives are met, and that when deviations dooccur they are identified early and correct:ive or adaptive measures aretaken.
Steps in developing a monitoring system
(1) Subdivide the project into its major physical, financial andsocial features. For example:
(a) Infrastructure(b) Equipment and vehicles(c) Community facilities--markets, workshop, dispensaries, etc.(d) Project management--salaries, office furniture and equipment(e) Technical assistance--consultants, contractors, studies, etc.(f) Construction loan program
(2) Using network scheduling (CPM) (Annex H, Charts H-1 through H-4)or a simple Gant bar chart (Annex G, Tables G-1 and G-2) set up theprojected relationships (which activities inust be completed before certainother activities can begin) between the various activities. Set up aproject financial schedule, including also parallel disbursements forprincipal physical features, showing the expected payment schedules foreach major item (Annex G, Tables G-2 and G-6 and Annex I, Charts I-1through I-3).
(3) Determine required staffing for the monitoring unit according tothe project composition, scope and the required tasks to be performed.UJsually an accountant (or assistant) and an engineer (or assistant) will berequired to monitor costs and the quality of physical progress. Sufficientauthority and facilities must be given to the project monitoring team earlyin the project cycle to allow supervision of project records to bemaintained and the collection and correlation of information to be providedregularly for the effective monitoring of physical progress and projectfunds.
(4) Design bar charts for physical progress and forms for budgetcontrol. As mentioned above (Step 2) a Gant Chart (2 or 3 bar type) canbe used and is usually adequate for most urban projects because of thelinear sequence of most activities. For projects which involve manysimultaneous activities, the network-based system described in Annex H maybe more appropriate.
(5) On the Gant Chart show (a) original estimated starting andcompletion dates for each principal item of physical work; (b) on secondbar actual or estimated starting and completion dates; (c) if the 3 barchart is used, a third bar will indicate the proportion of the work whichhas been completed at the time the report is prepared.
(6) Prepare a set of financial monitoring forms containing at leastthe following information:
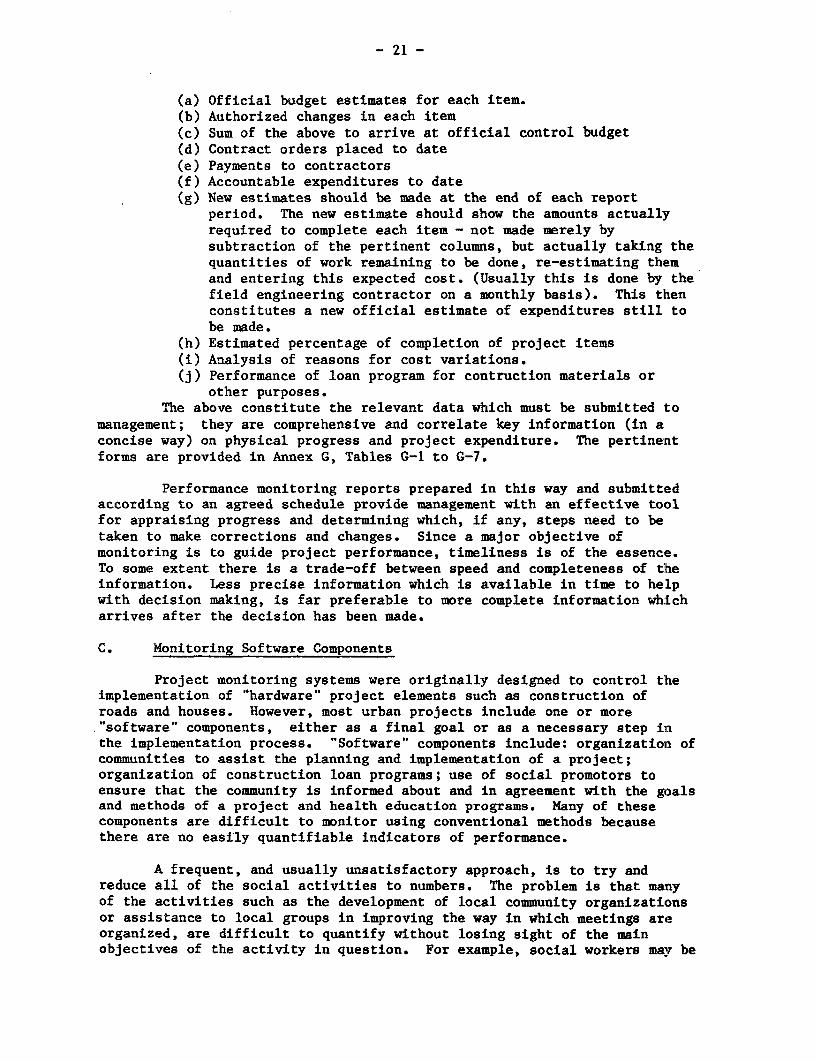
- 21 -
(a) Official budget estimates for each item.(b) Authorized changes in each item(c) Sum of the above to arrive at official control budget(d) Contract orders placed to date(e) Payments to contractors(f) Accountable expenditures to date(g) New estimates should be made at the end of each report
period. The new estimate should show the amounts actuallyrequired to complete each item - not made merely bysubtraction of the pertinent columns, but actually taking thequantities of work remaining to be done, re-estimating themand entering this expected cost. (Usually this is done by thefield engineering contractor on a monthly basis). This thenconstitutes a new official estimate of expenditures still tobe made.
(h) Estimated percentage of completion of project items(i) Analysis of reasons for cost variations.(j) Performance of loan program for contruction materials or
other purposes.The above constitute the relevant data which must be submitted to
management; they are comprehensive and correlate key information (in aconcise way) on physical progress and project expenditure. The pertinentforms are provided in Annex G, Tables G-1 to G-7.
Performance monitoring reports prepared in this way and submittedaccording to an agreed schedule provide management with an effective toolfor appraising progress and determining which, if any, steps need to betaken to make corrections and changes. Since a major objective ofmonitoring is to guide project performance, timeliness is of the essence.To some extent there is a trade-off between speed and completeness of theinformation. Less precise information which is available in time to helpwith decision making, is far preferable to more complete information whicharrives after the decision has been made.
C. Monitoring Software Components
Project monitoring systems were originally designed to control tlheimplementation of "hardware" project elements such as construction ofroads and houses. However, most urban projects include one or more"software" components, either as a final goal or as a necessary step inthe implementation process. "Software" components include: organization ofcommunities to assist the planning and implementation of a project;organization of construction loan programs; use of social promotors toensure that the community is informed about and in agreement with the goalsand methods of a project and health education programs. Many of thesecomponents are difficult to monitor using conventional methods becausethere are no easily quantifiable indicators of performance.
A frequent, and usually unsatisfactory approach, is to try andreduce all of the social activities to numbers. The problem is that manyof the activities such as the development of local community organizationsor assistance to local groups in improving the way in which meetings areorganized, are difficult to quantify without losing sight of the mainobjectives of the activity in question. For example, social workers may be

- 22 --
required to report on the number of houses visited, the number of meetingsheld, and the number of people who attended the meetings. If these numbersare used as a basis for evaluating the performance of the social workers,then staff will have an incentive to either falsify the numbers (not anuncommon occurrence) or to substitute quentity for quality in their work.Instead of spending several hours with a family which is in need of help,the social worker will have an incentive to make rapid calls on a largenumber of families. Several approaches are possible to obtain moremeaningful monitoring information on these software components:
(1) Rapid sample surveys of the actual and intended beneficiariesto determine their attitudes and knowledge about the project. Table G-8 inAnnex G provides an example of how such a survey can be conducted and howthe results can be presented. Beneficiary awareness is very important Bothat the community will understand the reasons for delays or changes in theoriginal project design or costs. It can be very useful to management tohave a simple table showing the proportion of families who have received,and understood, the basic information about the project. A project shouldalso have feedback mechanisms to keep management informed of beneficiaries'opinions about and satisfaction with the different aspects of the projectand its organization.
(2) Service Delivery Assessment C(Hendricks, 1981) can be used toobserve the effectiveness with which services are actually delivered to thetarget population. The method, which has been pioneered by the Departmentof Health and Human Services in the US, Lnvolves visits by agency staff(not consultants) to project sites to meet with clients, front-line serviceproviders, local administrators, program officials at the local and statelevel, and other people who are knowledgeable about how the projectactually operates. In this way, rapid, qualitative feedback can beobtained on the "soft" services which are actually delivered.
D. Methods for Collecting and Analyzing Data for Performance Monitoring
In order for the monitoring systein to provide timely and economicalfeedback it must use data which is either already available or which caneasily be obtained. Some of the main sources of data include:
(1) Financial information (expen,ditures, disbursements received,cost variation, etc) which already exists within the organization. In mostcases the preparation of these special tables does not involve much extrawork, as long as the table format is agreed to at the start of theproject. However, it is usually extremely difficult to restructure theformats once the project is underway.
(2) Credit information on loan disbursements and repayments andinformation on payment for service chargies can readily be obtained fromproject records or from the records of a cooperative or similarorganization supported by the project. A common problem is a long delaybefore the information is available.
(3) Information on the physical implementation of projectcomponents. This information is usually readily available from thedivision responsible for construction or supervision of construction.

- 23 -
(4) Observation guide to monitor house consolidation by residentsand the construction and maintenance of community infrastructure. Oftenthis information will not be available from project records, as thefamilies themselves are responsible for completing their houses. A simple-observation guide can be developed which includes questions on (a) whetherbuilding materials are on the plot, (b) whether construction has started,(c),how many rooms have been completed, (d) what kinds of materials areused, etc. The information can usually be obtained by direct observationwithout having to interview families, which means that it can be coll(ectedvery rapidly.
(5) Short survey of community residents to obtain their opinions ondifferent aspects of the project and to estimate the proportion ofhouseholds who have certain types of information about the project (seeSection C).
(6) Informal conversations with project staff, beneficiaries andothers to obtain opinions and suggestions about the project and how it isbeing implemented.
Depending on the complexities of the project, and the resources ofthe organization, the data can be processed in one of the following ways:
a. Hand-tabulation. This method is quite effective and rapid whenthe numbers and types of tables to be produced are relatively simple.
b. Automatic generation of tables through the project's computersystem. This is in many ways the ideal system, however, it is subject to anumber of potential dangers. First, the monitoring reports may have to usethe same tables, categories and formats as are being used by theorganization for other purposes, which may mean that certain types ofdesired information will not be available. Second, many managementinformation systems are subject to considerable delays, so that if themonitoring reports rely on this source, they too will be subject to delays.
c. Use of a micro-computer. This alternative permits much greaterflexibility and speed.
E. Reports
The monitoring system will usually produce all, or most, of thefollowing reports. The amount of detail, and the frequency of thereports will be largely determined by the level of resources assigned tothe monitoring exercise.
(1) Quarterly or Monthly Progress Report which can be used as aregular project control tool by managers.
(2) Interim Report which is to be prepared at critical points inthe project development. This report provides in depth technical analysisof major issues and problems which which might require projectrestructuring, scaling back, or early completion.

- 24 -
(3) Final Report which presents an ex post evaluation of projectperformance shortly after its completion. Costs, outputs and expectedbenefits are compared with appraisal estimates to assess the effectivenessof the project and of the executing agency,
The data base provided by the accumtulated quarterly reports shouldcontain most of the information needed for preparation of the interim andfinal reports.
F. Potential Problems and Possible Solutions in the Design andimplementation of a Monitoring System
The following are some of the typical problems which arise duringthe design and implementation of a MonitoriLng System. Possiblesolutions are proposed for each problem.
Problem No. 1: There are considerable delays in setting up the monitoringsystem so that the project has been underway for some time beforemonitoring reports begin to appear.
This is a common problem and is due to a number of causes. First,monitoring often has a low priority so thal: no attention is paidto it until major operational problems appear. Second, it is much moredifficult to obtain budget and authorization for hiring additional staffonce the project is underway as resources have already been committed forother purposes. Third, management will often reassign monitoring staff toother temporary duties, again delaying the production of monitoringreports. The following guidelines can help> overcome these problems:
(1) Decisions on organization, budget and staff for monitoringshould be made at the time of project appraisal. At this time thebudgetary line item for monitoring should be approved as well as the termsof reference and grades of all staff and consultants who must be hired orreassigned.
(2) It is the duty of management to ensure that monitoring is givena high priority.
(3) Management must enforce a timetable for the production ofreports. They must ensure that the reports are sufficiently short andsimple for the deadlines to be attainable.
Problem No 2: Monitoring reports are too 'Long and tend to be published toolate
This problem is due in part to management's lack of involvement inthe design of the monitoring system. The Eollowing approaches can be usedto address this problem:
(1) Management must thoroughly rev:Lew what types of information arereally needed, making an effort to reject unnecessary material.
(2) Management must insist on reports being produced on time.

- 25 -
Problem No. 3: Monitoring may only cover the 'hardware' components whichare easy to quantify and may ignore important "software" components
This is a common problem, particularly when project managershave previously worked in civil construction of similar programs. Section Cproposes methods which can be used for monitoring the software components.An important preliminary step is to increase the organization's awarenessof the importance of the 'software" components. This can be done tbLrough acombination of (a) training and seminars, (b) qualitative studies whichdescribe the importance and impacts of components such as communication,community participation in planning and decision making, (c) rapid Estudiesof beneficiary opinions and information about the project.

- 26 -
CHAPTER 3
PROCESS MONITORING - MNITORING TuE PROJECT DELIVERY SYSTEN
A. Key Issues
Although the final outcomes of a project are obviously affected bythe initial design and the availability of the necessary resources, inpractice an equally important determinant is the way in which the projectwas actually implemented. Many projects are developing new approaches andoften they are much less successful than expected simply because thedelivery system did not work as planned (see Box 3-1). In some cases thereare difficulties in hiring or retaining well qualified staff, while inothers the administrative procedures were more difficult to implementthan expected. Communication between implementing agencies and intendedbeneficiaries has proved to be particularly problematic (See Box 3-2). Insome cases the lack of adequate communication linkages prevented a projectfrom starting; in other cases leaders misrepresented the interests andvillingness to pay of certain sectors of the community, or only representedthe views of the wealthier beneficiaries. Due to all of these factors itis clear that the evaluation of the project delivery system is an essentialcomponent to understanding why a project was or was not able to achieve itsdesired objectives.
BOX 3-1 THE EFFECTS OF THE DELIVERY SYSTEM ON PROJECT OUTCOMES
The following are typical examples of ways in which the deliverysystem can affect project outcomes:
** Project planners in Zambia had assumed that following landnationalization, acquisition of land for squatter upgrading wouldnot present major problems. In fact lack of surveys, inexperiencein the implementation of the new legislation and problems ofinteragency coordination served to delay the project by almost 3years. This caused substantial increases in project costs and theconsequent elimination of a number of schools and communitycenters from the project.
** In order to use house construction as a means to developcommunity organizations, participants in a sites and servicesproject in El Salvador were required to participate in mutualhelp construction groups every weekend. Although this wassuccessful in developing grass-roots organizations,it may have discouraged people such as small shop-keepers andself-employed artesans from participating as the opportunity costof their labor during the weekend was much higher than for wagelaborers.

- 27 -
BOX 3-2 SOME EFFECTS OF INADEQUATE COMMUNICATIONS ON PROJECTIMPLEMENTATION
The following are examples of how poor communications can affectthe process of project implementation:
** It was several years before the executing agency inGuayaquil, Ecuador realized that community leaders, who werefrom one of the opposition parties, were deliberatelymisinforming the community about the services being offered. Dueto this the community showed no interest in the project and itwas never started.
** In a squatter relocation project in Recife, Brazil theimplementing agency believed that the community had beeninformed by their leaders as to the nature and costs of theproject and that most families were in agreement. A rapid studyrevealed that most families had not in fact been informed anddue to this were becoming hostile to the project.
** In Usulutan, El Salvador it was found that many low-incomeand illiterate households were not applying for houses as theyhad not been reached by the mass media communication techniqueswhich had relied on publicity through the cinema and radio orthrough written communications.
Despite the importance of understanding the way in which thedelivery system actually works, many monitoring and evaluation programs donot include process monitoring. One of the reasons for this is thatmonitoring and evaluation are frequently divided between a smalladministrative unit which uses secondary data to prepare performancemonitoring; and a separate unit which only conducts impact evaluations.Within this scenario there is frequently no institutional capacity to studythe delivery system.
Table 3-1 illustrates some of the key issues which arise whenmonitoring the efficiency of implementation of a typical shelter project.In addition to monitoring each indicator individually (for example thespeed and cost of the process of selecting beneficiaries, it is alsoimportant to assess the trade-offs between the different indicators. Forexample, household income is frequently measured in order to use "capacityto pay" as a selection criterion for a sites and services project. It isoften possible to speed up the selection process by only taking intoaccount formal labor market earnings which are easy to verify. However,this approach will tend to exclude people who work in the informal sectorand whose earnings are harder to verify. Thus there may be a trade-of'fbetween speed (and perhaps costs) and equity. Table 3-2 indicates some ofthe key issues in monitoring the efficiency of implementation of health,employment, transportation and municipal development projects.

dAbe 3-1: I INi AIJT'K I1 FICIRE« (I F1E1 1L< AM
Criteria for Evaluation of Project Efficiency
Project Speed ofElmn lilolnaio 0t QMulty Accœssibility Replir-ability
Fimamh Self-belp bods i. E* desM fe quaity ci i. Hli staxids, lea- i. cQuaex duai la1op offset If prigress la tndards raie autructkm wflm ta bh* asts c are mure astly to
is thia rEs oests. affe ctpitai result in pocer fidalli repirteaBts aMd &laye wbm, retail beig excluded.beeafit. il. Iue of laoi %alme al i. Project imterals ail
'M. i rtd rseer roetsnoteriSl 8y liait latge scale
i prtatt el,tieoe.
_ ~~~~~~~~~~~~~~~~~~s,Slae So eeca Secti poeu i. lr fadlls By Replticm y requre rooessm s pooerdues ae ar Mt Costle; falaify icoe ta be uEe cf cter
tiy Um aat-; furtbenore selected, forldxg aut tn spos up«aug. OEn vary earolderaby. poorer faili pooesslig of lager
mter off qWlcaits.il. Selectia procesa Ilurer of e limy r hilaed amiast oertain grasp tirouoertain groups. 1dWdi selection.
Qautrurtioe 1uitoelp co h- lijor coet diffe- 1Hw ixh super- Are se groups exclude Cam tfe oetld be1olxxIs slrtIn liafte renoes betst vlsio is requlred by the u;e et certaln repeatai en a larger
mich sliuer tlas axtrucion to ensure adequte atructimn -thlds. seal. (ibh is doelyslf-belp. ethxl; lmportanoe quality. relatai ta serviion
cf ti . mpln).
l}teriais ttiai de8ays i. 1etedlms fmra Qmlity (f i. Are lKoe lare allihitg inand Crelît my ccr i tbe project stores material frai eoagh. eentliUiy a question
distriibtIon et are nt aliys project stores cf cxuquexity, aat anlted.ais. «pdeer. is tmmlly ii. »ld project be aIhdnsUatiNe c%pedty.
better. mDre accessible ifil. Naterial stores poqle oeu]d buy
uaLy offier a a.terLal outsid.rUer oelectia.
Cont'd....
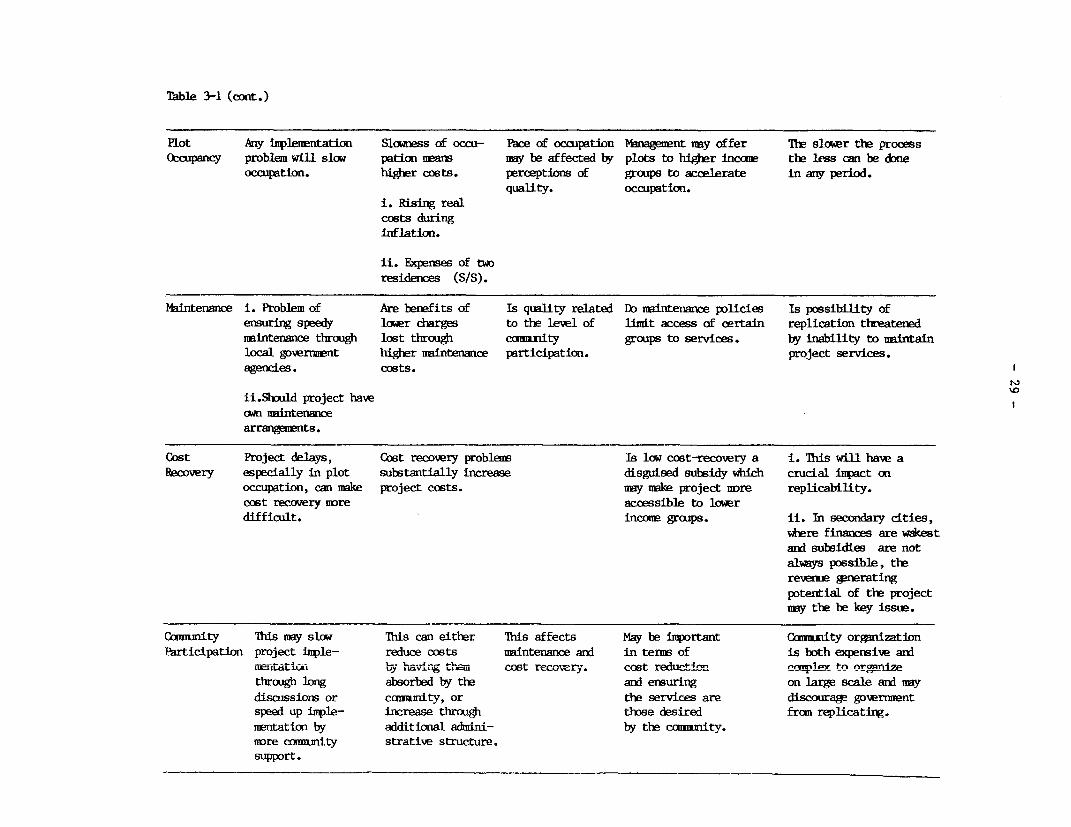
Table 3-1 (cont.)
Plot Any inplerentation Slowness of occu- Pace of occupation Magenaent may offer The sloler the proœss(ccupancy problem will slow pation seans may be affected 1y plots to higher income the less can be done
occupation. higher costs. perceptions of groups to accelerate in any period.quality. occupation.
i. Rising realcosts duringinflation.
il. Fxpenses of tworesidences (S/S).
Maintenance i. Problem of Are benefits of Is quality related Do maintezance policies Is possibility ofensuring speedy lawer charges to the level of limit access of certain replication threatenedmaintenance through lost through commînity groups to services. by inability to naintainlocal governnent higher maintenance participation. project services.agencies. cests.
ii.ShMld project havewn maintenance
arrangernts.
Cost Project delays, Cost recovery probleam Is low cost-recovery a i. This will have aRecovery especially in plot substantially increase disguised subsidy which crucial inçact on
occupation, can make project costs. may make project rare replicability.cost recovery mDre accessible to lowerdifficuit. incoen groups. il. In secondary cities,
where finances are wakestand subsidies are notalways possible, therevenre gneratingpotential of the projectmay the be key issoe.
Coenunity This may slow This can either Miis affects May be important Commnity organizationParticipation project inple- reduce costs nmintenance and in terns of is both expensive and
uentati - -i uav c0ot recowery. co^t reductio oea tl or" i ze
through long absorbed by the and ensuring on large scale and maydiscussions or canxmity, or the services are discourage governentspeed up imple- increase through those desired from replicating.mentation by additional aridni- by the cm«nity.uDre caxmunity strative structure.support.

- 30 -
IABLE 3-2: SCME IKEY ISSUES IN PROCESS EVAUIATION FKR N1N-MIEUTER CaffElNL'S
Incoe and Fiploymt (awratxim1. Db procedures for ensurlng speed and econcmy in the selection and operatîng
procedures , negatively affect the access of certain groups (such as thesmallest artesarn, female entrepreneurs) to credit and other services?
2. Hbw wel are credit and training institutions able to adapt to operating inthe informal sector of the economy?
3. Are the training programs adapted to the needs of smnll, informal sectorbusinesses?
4. H,w well are the business able to conipete for raw materials and markets?5. What type of internediary organizations are developed and how effective are
they as communication links and for representing the views of beneficiaries?
IEm1th1. How do traditional cultural belief s and practices affect tbe success of
child-care, health and sanitation programs?2. How effective are the oommnity proeDtion and out-reach procedures in ensuring
the project is understood by, and aæcessible to all sectors of the targetpopulation?
3. Are there any culturai or economic groups 'ho do not bave access to theprogram?
4. Hmw cost-effective are the programs in comparison with conventional health andchild care?
1. Cost-effectivexess comparison of cmnll scaLe transport programs withconventional public transport or large-scale private companies.
2. How effective are the projects in reachiing aiL sectors of the targetcomLmiity, and what are the main barriers to a wider coverage?
3. Effectiveness of cormunity involveoent in ,decisions on the transport routeswithin the oaminities and on the policies for relocation and compensation ofboiseholds w%t must be roved.
4. Effectiveness of caxmmity perticipation ini construction and mnintenance.
MMIKpal et1. Effectiveoess of oomunication and coordination linkages between the
implementing agencies and internded beneficLaries.2. Effectiveness of conmiicatin linkages betioen implementing agencies.3. I,mpacts of the economic and political environnent on the effectivenes of
project inplementation.4. Effectiveness of internaL mnnitorLng and mmnagement infornation systems.5. Staisfaction of intended beneficiaries with interagency coordination.6. Effectiveness of interagency meetings and IDroblem solving mRchanisms.7. Itndicators of internal organization efficiency and assessment of how they are
affected by the project.8. Project inpact on financial adidnistration and control.9. Inplications of the organizational structures for project impleuentation on
the institutional dvelopment at the munic-Lpal level.

- 31 -
The issue of trade-offs between different efficiency indicators isparticularly important when assessing the performance of agencies whotraditionally work with higher income groups in the formal sector (forexample financial and housing institutions) and who are required to adapttheir procedures to the characteristics of low-income households who ]Liveand work in the informal sector.
The method and effectiveness of the delivery system can also haveimportant consequences for final outcomes. For example, the pooresthouseholds often live in the least accessible parts of the community andmay be the last to receive water, roads, or sewage connections.Consequently delays in implementation, or reductions in scale, may have theseverest impact on the poor or may in fact mean that the projects neverreach them. Implementation delays, particularly during periods of highinflation, can also increase costs, so that poorer households may no longerbe able to afford the project.
The choice of delivery system can also affect the distribution ofbenefits. Box 3-1 showed how the requirement to participate in mutual helpconstruction may discourage certain groups from applying to the project.Similarly requirements about formal proof of earnings or certain types offinancial documentation may eliminate many types of small businesses f romaccess to credit. Legal requirements relating to property ownership mayalso make it difficult for women to acquire houses.
The success of most types of projects is very much affected by theeconomic and political environment within which they operate. For exaniple,low-cost housing projects tend to be politically controversial due toissues relating to land invasion and property titles, or becausepoliticians are concerned that the standard of housing is too low or thatthe projects will become slums. The issues of subsidies and cost recoveryoften create conflicts between implementing agencies who wish to use thethreat of eviction and service cut-offs to improve cost recovery, and localpoliticians who seek to protect the rights of their constituents and whooppose these measures. The interplay between political and administrativepressures is a crucial factor in monitoring project peformance.
Many impact evaluations are designed only to measure the extent towhich objectives are achieved, and consequently tend to overlook unexpectedoutcomes. It is essential to understand the causes and consequences ofthese unanticipated outcomes and to assess their implications for thedesign of future projects. For example: many community organizations becomeinvolved in projects which were not considered in the original projectdesign; low-income shelter projects may either stimulate the interest ofother agencies in similar low-cost approaches, or may create hostility andnegative reactions; small business credit programs may result in creditbeing withdrawn from other less glamorous projects so as to enjoy thepublicity generated by an international project.

- 32 -
B. When And Why To Monitor The Implementation Process
Process monitoring can be used to provide regular information on theefficiency and effectiveness of the delivery system, or as a means toprovide feedback to management when problems arise. The studies can beconducted on a continuous basis throughout a project's development, atseveral points in time or at one particular moment (see Table 3-3).
An example of a continuous study is the selection of a panel ofhouseholds who are observed, through quEstionnaires and direct observation,throughout the process of house construction and consolidation(FSDVM,1977). Information can be obtained on the sequence of construction(do they build extra bedrooms before upgrading the quality of the existingliving areas), about sources of building materials (where were they boughtand were they new or used), types of labor (hired or provided by the familyor neighbors) and sources of finance. 'his permits a much deeperunderstanding of the process of house construction than could be obtainedby simply asking questions at the end of the project. Continuousobservation can also be used to study project impact on income andexpenditure patterns (RAD,1978) or on the way in which a small businessdevelops.
Periodic studies can be conducted to observe a project during itsmain stages. For example, households can be observed at the point when anew sanitary system is being installed, after perhaps one year and againafter several years. In this way it is possible to assess whether theservices continue to be used and mainta:Lned when the implementing agency isno longer closely supervising the project. Maintenance is a major concernwith many types of projects (roads, community facilities etc) andconsequently it is important to be able to assess what happens after anumber of years. As many evaluations aire funded as part of the projectloan, they often end when the project is administratively completed whichusually occurs when the physical works are completed or the final loandisbursement has been made. Consequently it is often not possible to assessthe longer term impacts or the efficiency of maintenance and cost recovery.
One-time studies can either be conducted as a form of qualitycontrol in which projects are selected at random, or to provide feedbackwhen a problem has arisen. The one-time study can be used at the start ofa project to understand the community organization and likely responses tothe project. This can help select project sites or types of smallbusinesses or provide information on areas or types of enterprises whichhave already been selected. The studies may also be conducted during theimplementation of the project, for example when a certain number ofbusiness credits have been approved. Finally the studies can be used atthe end of a project to provide an overview of the implementation process.
In practice there is often an operational distinction between rapidstudies which are intended to provide f eedback as quickly as possible; andmore intensive studies which are used when the situation is more difficultto understand. A rapid study may be used to evaluate the management styleand efficiency of a fishing cooperative (Box 3-3); to review the progress
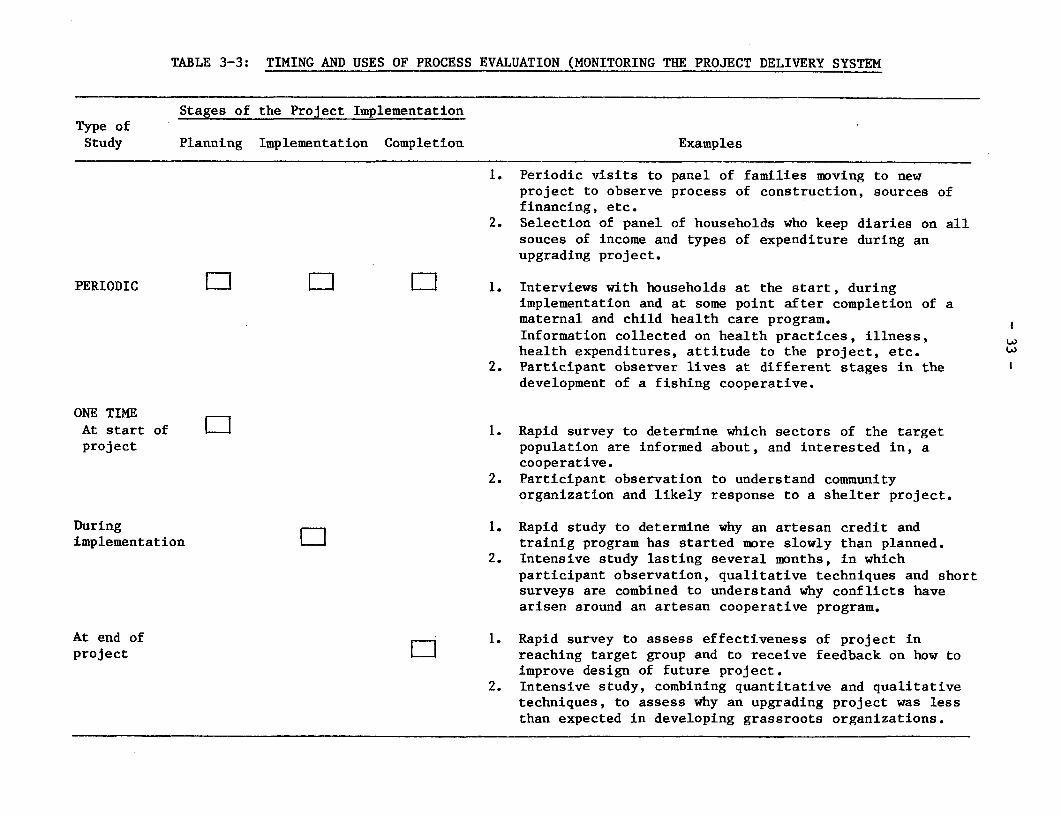
TABLE 3-3: TIMING AND USES OF PROCESS EVALUATION (MONITORING THE PROJECT DELIVERY SYSTEM
Stages of the Project ImplementationType ofStudy Planning Implementation Completion Examples
1. Periodic visits to panel of families mEving to newproject to observe process of construction, sources offinancing, etc.
2. Selection of panel of households who keep diaries on allsouces of income and types of expenditure during anupgrading project.
PERIODIC 1 L E 1. Interviews with households at the start, duringimplementation and at some point after completion of amaternal and child health care program.Information collected on health practices, illness,health expenditures, attitude to the project, etc.
2. Participant observer lives at different stages in thedevelopment of a fishing cooperative.
ONE TIMEAt start of I 1. Rapid survey to determine which sectors of the targetproject population are informed about, and interested in, a
cooperative.2. Participant observation to understand community
organization and likely response to a shelter project.
During 1. Rapid study to determine why an artesan credit andimplementation L trainig program has started more slowly than planned.
2. Intensive study lasting several months, in whichparticipant observation, qualitative techniques and shortsurveys are combined to understand why conflicts havearisen around an artesan cooperative program.
At end of 1. Rapid survey to assess effectiveness of project inproject 4 reaching target group and to receive feedback on how to
improve design of future project.2. Intensive study, combining quantitative and qualitative
techniques, to assess why an upgrading project was lessthan expected in developing grassroots organizations.
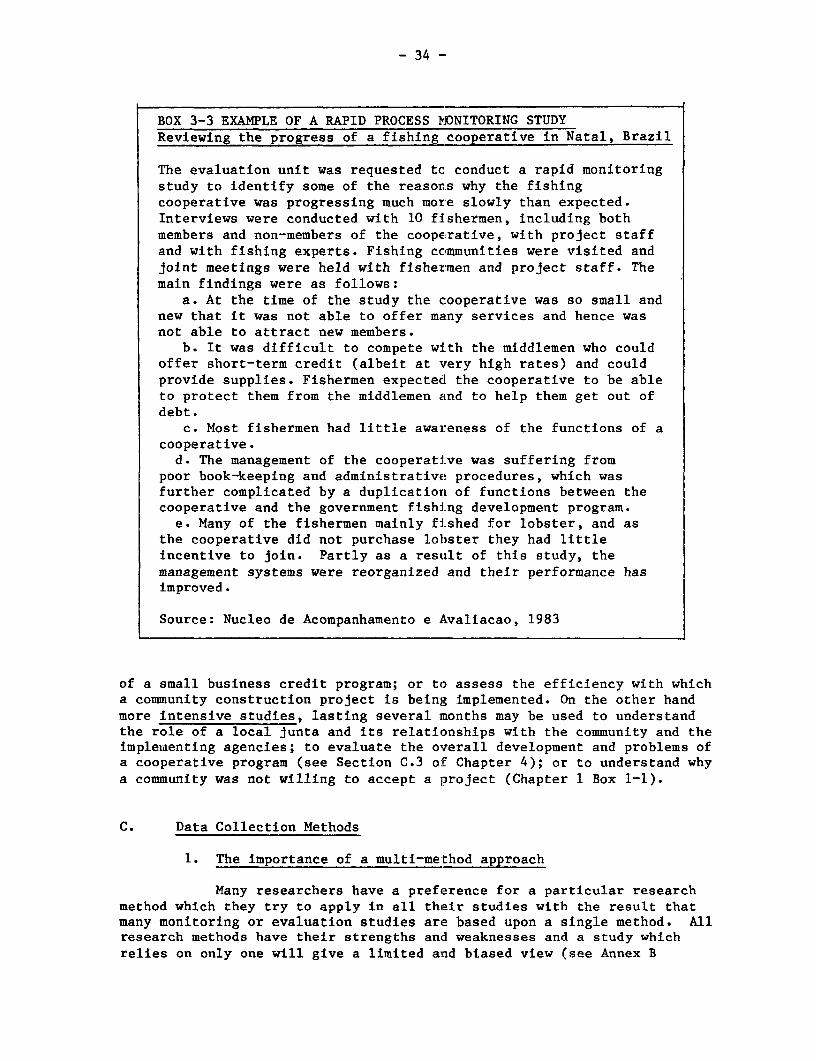
- 34 --
BOX 3-3 EXAMPLE OF A RAPID PROCESS MONITORING STUDYReviewing the progress of a fishing cooperative in Natal, Brazil
The evaluation unit was requested tc conduct a rapid monitoringstudy to identify some of the reasons why the fishingcooperative was progressing much more slowly than expected.Interviews were conducted with 10 fishermen, including bothmembers and non-members of the co0perative, with project staffand with fishing experts. Fishing communities were visited andjoint meetings vere held with fishermen and project staff. Themain findings were as follows:
a. At the time of the study the cooperative was so small andnew that it was not able to offer many services and hence wasnot able to attract new members.
b. It was difficult to compete with the middlemen who couldoffer short-term credit (albeit at very high rates) and couldprovide supplies. Fishermen expectecl the cooperative to be ableto protect them from the middlemen and to help them get out ofdebt.
c. Most fishermen had little awareness of the functions of acooperative.d. The management of the cooperative was suffering from
poor book-keeping and administrative procedures, which wasfurther complicated by a duplication of functions between thecooperative and the government fishi'ng development program.e. Many of the fishermen mainly fi'shed for lobster, and as
the cooperative did not purchase lobster they had littleincentive to join. Partly as a resalt of this study, themanagement systems were reorganized and their performance hasimproved.
Source: Nucleo de Acompanhamento e Avaliacao, 1983
of a small business credit program; or to assess the efficiency with whicha community construction project is being implemented. On the other handmore intensive studies, lasting several months may be used to understandthe role of a local junta and its relationships with the community and theimplemdenting agencies; to evaluate the overall development and problems ofa cooperative program (see Section C.3 of Chapter 4); or to understand whya community was not willing to accept a project (Chapter 1 Box 1-1).
C. Data Collection Methods
1. The importance of a multi-method approach
Many researchers have a preference for a particular researchmethod which they try to apply in all their studies with the result thatmany monitoring or evaluation studies are based upon a single method. Allresearch methods have their strengths and weaknesses and a study whichrelies on only one will give a limited and biased view (see Annex B

- 35 -
Sections 1 and 2). For example, when a structured questionnaire is used toestimate income and employment, it is difficult to obtain valid estimatesof income from people who work in the informal sector as their incomevaries constantly. They may also not wish to reveal their true income,particularly when a project has income eligibility criteria. Structuredquestionnaires are also widely used to obtain information on attitudes andbehaviour, and again there is extensive evidence of biases in theinformation. For example, in El Salvador, many people did not wish toadmit that they participated in community development or similarorganizations for fear of possible reprisals. Similarly many people do notlike to express negative views about organizations or people and so tend torespond very cautiously to survey questions.
Intensive ethnographic techniques such as participant observationand the preparation of in-depth case studies on individuals or famili(es,have the advantage of providing much more insight and reliable informationon particular individuals. However, these techniques are subject to anumber of problems. First, the number of cases tends to be very limited soit is difficult to generalize. Second, it is difficult to know whetherthere is any bias in the selection of cases. Frequently certain types ofpeople are willing, or even anxious to be interviewed, whereas others arevery reluctant. It is likely therefore that the cases selected will not berepresentative. Third there is a problem of evaluating the extent to whichthe results reflect a bias on the part of the researcher. As the study isbased on personal relationships between the observer and the community itis difficult to evaluate the results in the same objective way as can bedone with quantitative methods.
Many studies rely heavily on secondary data such as records ofcommunity organizations, credit information from cooperatives, reports ofcommunity organizers, records of the construction department etc. Most ofthese sources have an incomplete coverage of the community or includecertain biases.
For all of the above reasons it is important to ensure that aindependent research techniques are combined so as to provide consistencychecks and independent interpretations of the data. This approach is calledtriangulation (analogy from topography) in the sense that two or moreindicators are used to get a more accurate estimate of the true value. Asimple example of triangulation is the use of in-depth case studies with asmall number of households to check the information obtained in aquestionnaire. Another example is the use of direct observation (forexample the number of "to rent" signs in a street to check on questionnaireinformation about sub-letting). The use of a multi-method approach in whichat least two different methods are used to provide a consistency check, isstrongly recommended as a standard operating procedure in all theevaluations. Box 3-4 illustrates how verbatim reporting of statements in ameeting can provide a deeper understanding of the results of a samplesurvey.

- 36 -
BOX 3-4 USING QUALITATIVE DATA TO COMPLEMENT SURVEY FINDINGSSurvey of a fishing cooperative in Natal, Brazil
A rapid evaluation of a fishing cooperative, in addition topresenting statistical analysis, also included the followingverbatim comments of fishermen to help the reader understandthe meaning of the statistical findiLngs.
"The majority of the fishermen here don't own their boats,but are hired by a boat owner. He giLves us everything we need,and when we return everything is for him."
"When the cooperative arrived they said that they weregoing to help us by providing materilals and buying our fish..but this hasn't happened. We go on suffering and have to buysmaller quantities of everything elsewhere at higher prices andwe still have to sell our fish at lower prices."
"The cooperative has to offer us; something more attractiveif we are going to believe in it".
"This cooperative decides things without consulting with usfishermen. They even close the doors of the room where thefish are washed and we are not alloawed to enter".
Source: Nucleo de Acompanhamento e Avaliacao, 1983.
Unfortunately there are a number of reasons why a multi-methodapproach is not more frequently used. It is, of course, more expensive andtime consuming to use two (or three) methods than to use only one. Also,many researchers have a preference for a particular method and arereluctant to use others with which they are less familar. The mosttmportant reason, unfortunately, is that most researchers have not beenwilling to criticize their research methods and to admit the need tocomplement them with other techniques.
2. Modelling the process of project implementation
A helpful way to begin the design of an evaluation is toprepare a simple diagram illustrating how the project is expected to work(see Annex A) By illustrating the inputs, the main processes to be used,the expected outputs and impacts, it is easier to identify the points whereevaluation studies are likely to be neededr It also becomes easier tounderstand the ways in which project implemientation might be affected bythe characteristics of participants or by the external environment withinwhich the project operates.
3. Quantitative surveys (Annex B Section 7)
One of the most common methods for obtaining information onhow a project is operating is to design a questionnaire and to apply it toa sample of project participants (and possiLbly to a control group notaffected by the project). The questionnaire may contain the following typesof information (among many others):

- 37 -
a. Information on the socio-economic characteristics of'participants.
b. Information on how they participate in the project(frequency of attending meetings, amount of loans received, type ofparticipation etc.)
c. Knowledge about the project and its objectives.
d. Opinions on the project, its organization, the people andorganizations involved etc.
e. Changes which the project has produced (in income, health,access to services, operation of the business etc).
The surveys can be applied to different groups or at differentpoints in time so as to compare groups or to measure changes over time.
4. Direct observation (Annex B Section 5)
Many aspects of a project can be directly observed without theneed to ask questions. For example:
a. Progress of house construction or upgrading.
b. Numbers of people participating in community work groupsand the way in which the work is organized.
c. Attendance at meetings, the decision making process andthe level of group participation.
d. Indicators of changing economic conditions of thecommunity (for example, quality of housing, number of houses with cars orbicycles, products on sale in community stores, quality of clothing etc)
Annex B discusses some of the problems which can arise in theinterpretation of observational data.
5. Secondary data
Most projects produce large amounts of written and statisticaldocumentation which can be of great assistance in the evaluation. Somecommon examples include:
a. Information on the socio-economic characteristics ofsuccessful and unsucessful applicants for shelter and credit programs.
b. Financial information on approval and repayment of loans.
c. Records of health centers.
d. Records of cooperatives and other community or businessorganizations.

- 38 -
Care must be taken in the use of these secondary data sourcesas the information may be inaccurate, incomplete or contain certain biases.
6. Ethnographic methods (Annex B Section 3)
Many ethnographers have criticized quantitative methodsclaiming they are inappropriate for community studies and evaluation. It isargued that questionnaires cannot be used to study organizationalprocesses, to study how groups operate or to measure attitudes. Theethnographic methods proposed to overcome these problems involve thein-depth study of individuals, groups or the whole community. The methodsseek to understand the way in which the community operates and tounderstand the meanings which people place on their world and on theproject interventions.
A common technique is participant observation in which theresearcher lives in, or spends extended periods of time, in the communityor group. The purpose is to observe the natural behaviour of group membersand to understand how they interact withcut asking them to explain orverablize their feelings or behaviour. Another method is to intensivelystudy a particular person or family and to present a detailed descriptivemonograph (Oscar Lewis' "Children of Sanchez" is the classic).
Ethnographic techniques are extremely useful in the evaluationof urban development, as there are many barriers between low-incomeparticipants and the implementing agenciets which make it difficult tounderstand the feelings and behaviour of the population by using formalsurvey methods.
D. Methods for Monitoring the Efficiency of the Implementation Process
1. Monitoring the overall efficiency of project implementation
Many projects seek to develop institutions which can plan andimplement future projects, and consequently it is important to assess theeffecte of the project on developing the capacity of institutions at thecommunity, implementing and planning leve!ls. It is important to understandthe factors which affect institutional performance as well as to measureoutcomes. To achieve this it is necessary to combine qualitative anddescriptive techniques with the more usual quantitative indicators.
The evaluation will normally include a descriptive analysis offactors such as the following:
a. Achievement of program goals: Usually evaluated by usingthe management by objectives approaches explained in Chapter 2.
b. Satisfaction of participating agencies with interagencycoordination:
This is achieved through participant observation, informalinterviews and the use of formal questiornaires.
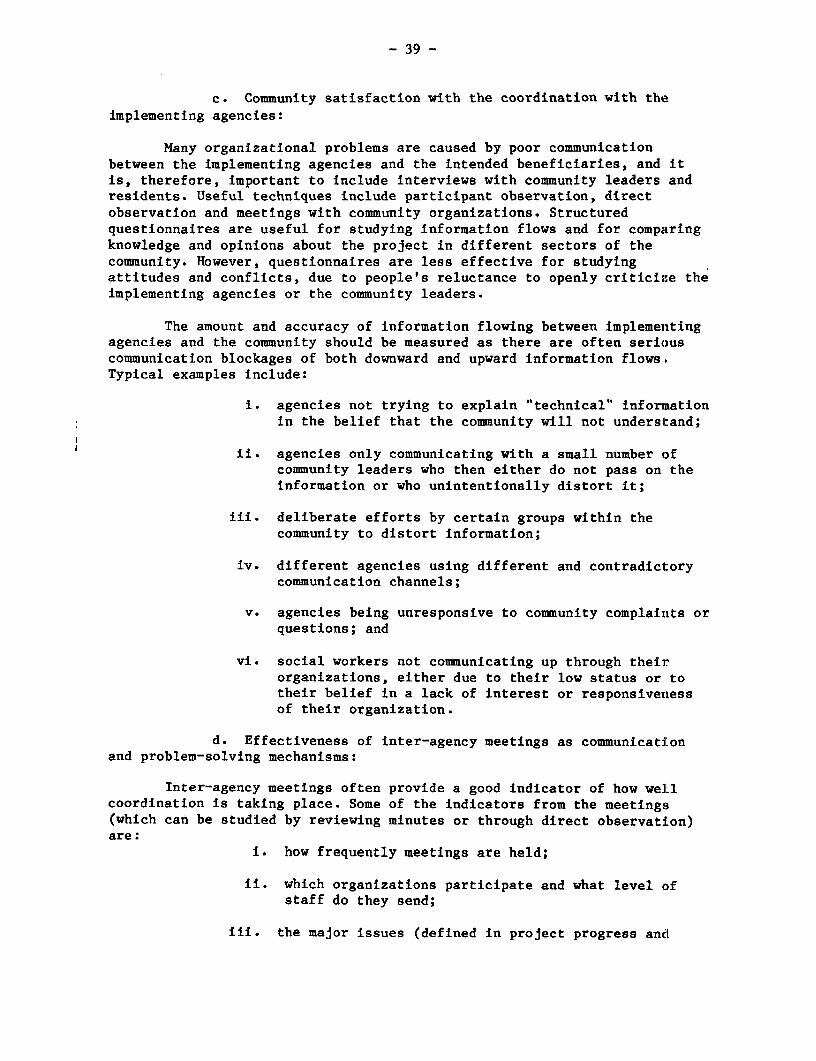
- 39 -
c. Community satisfaction with the coordination with theimplementing agencies:
Many organizational problems are caused by poor communicationbetween the implementing agencies and the intended beneficiaries, and itis, therefore, important to include interviews with community leaders andresidents. Useful techniques include participant observation, directobservation and meetings with community organizations. Structuredquestionnaires are useful for studying information flows and for comparingknowledge and opinions about the project in different sectors of thecommunity. However, questionnaires are less effective for studyingattitudes and conflicts, due to people's reluctance to openly criticize theimplementing agencies or the community leaders.
The amount and accuracy of information flowing between implementingagencies and the community should be measured as there are often seriouscommunication blockages of both downward and upward information flows.Typical examples include:
i. agencies not trying to explain "technical" informationin the belief that the community will not understand;
ii. agencies only communicating with a small number ofcommunity leaders who then either do not pass on theinformation or who unintentionally distort it;
Mi. deliberate efforts by certain groups within thecommunity to distort information;
iv. different agencies using different and contradictorycommunication channels;
v. agencies being unresponsive to community complaints orquestions; and
vi. social workers not communicating up through theirorganizations, either due to their low status or totheir belief in a lack of interest or responsivenessof their organization.
d. Effectiveness of inter-agency meetings as communicationand problem-solving mechanisms:
Inter-agency meetings often provide a good indicator of how wellcoordination is taking place. Some of the indicators from the meetings(which can be studied by reviewing minutes or through direct observation)are:
i. how frequently meetings are held;
ii. which organizations participate and what level ofstaff do they send;
iii. the major issues (defined in project progress and
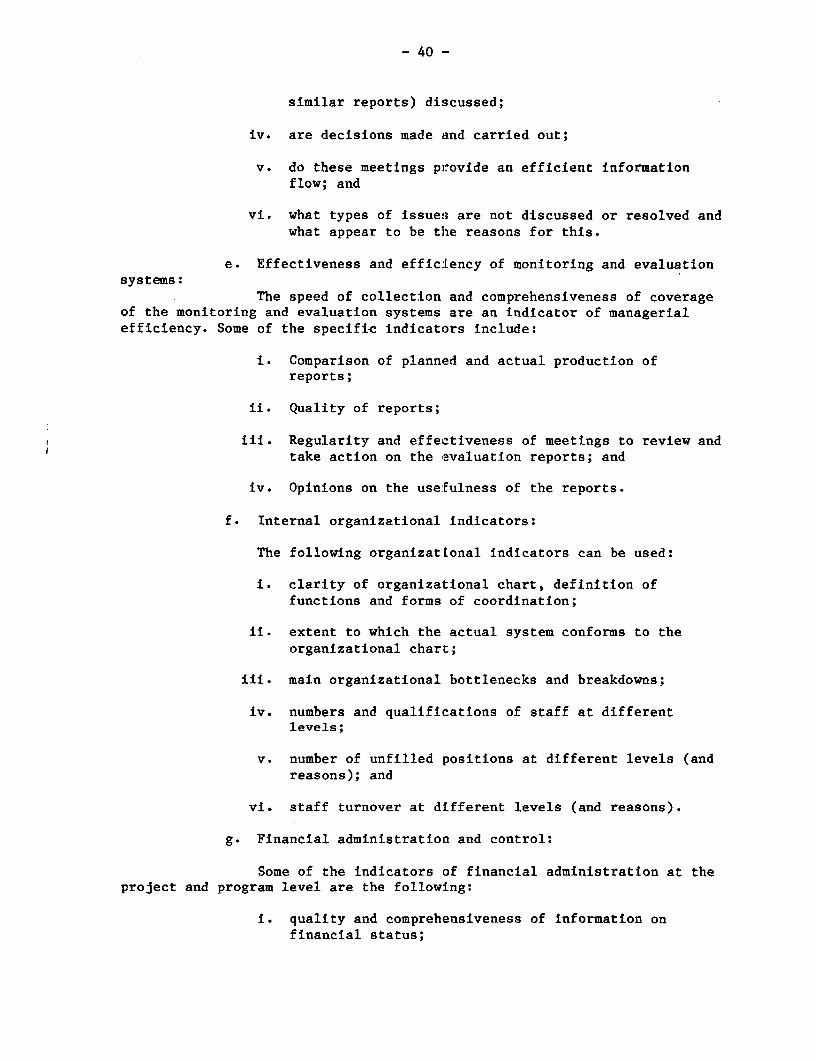
- 40 --
similar reports) discussed;
iv. are decisions made and carried out;
v. do these meetings provide an efficient informationflow; and
vi. what types of issues are not discussed or resolved andwhat appear to be the reasons for this.
e. Effectiveness and efficiency of monitoring and evaluationsystems:
The speed of collection and comprehensiveness of coverageof the monitoring and evaluation systems are an indicator of managerialefficiency. Some of the specific indicators include:
i. Comparison of planned and actual production ofreports;
ii. Quality of reports;
iii. Regularity and effectiveness of meetings to review andtake action on the evaluation reports; and
iv. Opinions on the usefulness of the reports.
f. Internal organizational indicators:
The following organizational indicators can be used:
i. clarity of organizational chart, definition offunctions and forms of coordination;
Mi. extent to which the actual system conforms to theorganizational chart;
iii. main organizational bottlenecks and breakdowns;
iv. numbers and qualifications of staff at differentlevels;
v. number of unfilled positions at different levels (andreasons); and
vi. staff turnover at different levels (and reasons).
g. Financial administration and control:
Some of the indicators of financial administration at theproject and program level are the following:
i. quality and comprehensiveness of information onfinancial status;

- 41 -
iM. speed with which financial information is obtained andreports prepared;
iii. time taken to prepare and process disbursementrequests and main bottlenecks;
iv. time between initiation of disbursement request andreceipt of funds; and
v. conformity to financial goals.
2. Developing summary indicators
Although the descriptive analysis outlined above is usefaul forunderstanding the dynamics of a particular institution, it is alsonecessary to develop summary indicators which can be used to compare theperformance of different institutions or to describe the evolution of oneinstitution over the life of the project.
The following are some of the key indicators which can be usedin this comparative analysis:
a. Achievement of project goals
b. General efficiency of organizational procedures andinter-agency interactions (including interactions withproject beneficiaries and affected communities)
c. Speed of project implementation
d. Cost (as compared with target)
e. Quality of the project outputs
f. Accessibility/affordability to the target population
g. Replicability
h. Flexibility and adaptability
Each of these indicators can be reviewed separately, and thtenthey can be combined to produce an overall index of project efficiency.Often there will be trade-offs between different indicators. For example,it may be possible to implement the project more quickly and cheaply ifless attention is paid to ensuring that selected families fall within thetargeted income ranges. Similar trade-offs may exist between replicaLbilityand speed/cost of implementation. Another common issue is that it may bepossible to complete the project more rapidly by setting up a special unitnot subject to normal administrative controls (and delays). However, oncethe first project is completed, the special unit will often be disbandedand no base will have been created for project replicability. In eachproject, management must decide the relative weighting to be given to eachcriterion in the overall evaluation.

- 42 -
The indicators can be used in various ways. The first is to presenta separate evaluation of project performance with respect to eachindicator, without necessarily trying to integrate them all into an overallindex. A second possibility is to develop a system of ranking. Forexample, each indicator could be ranked from 1 (poor) to 10 (very good).Independent rankings can alo be obtained from a number of different peopleand the average computed. If there is a high level of agreement betweenjudges, more reliance can be placed on the results.
A further refinement of the ranking system is to apply ranks toeach project component (using a list similar to that outlined in thefollowing section). An average is then calculated for each component. Table3-4 presents an hypothetical example of this system. Eight projectcomponents are ranked using these indicators and an average rank iscomputed for each component and for each indicator. Participant selection,the installation of infrastructure, house construction, and projectmaintenance all received the relatively high overall mean ranking of 7,suggesting they performed well on all indicators. On the other hand, costrecovery, land acquisition, and the administration of the material loanprograms received lower mean ranking of 4 or 5. Not all indicators wereapplied to all components as some were not appropriate. Care must be takenin the interpretation of these averages, and they should only be consideredas providing a very general comparison between components.
Overall rankings can also be obtained on each indicator. Thusquality, goal achievement, and overall organizational efficiency wereranked relatively highly (7 or 8), whereas speed, cost, accessibility tothe target and flexibility of implementation were ranked lower.
3. Indicators of the efficiency of individual project components
It is also important for management to obtain information onthe efficiency of each project component. Special criteria can be appliedto each component but it is also useful to develop a set of indicatorswhich can be used for comparative purposes. One set of such indicators isthe following:
a. Speed of implementation
b. Cost of implementation as compared to the originalestimates
c. Quality of the final product or service
d. Accessibility to the target population
e. Replicability of the procedures and design
A similar ranking procedure can be used to that describedabove. Table 3-5 identifies some of the factors which should be taken intoaccount in the application of these indicators to 8 typical projectcomponents.

- 43 -
TABLE 3-4: EXAMPLE OF THE APPLICATION OF RANKS IN THEMONITORING OF OVERALL PROJECT EFFICIENCY
Indicators of EfficiencyCOMPONENTS a b c d e f g h Mean
Land acquisition 2 3 8 3 7 - - - 5
Participant selection 8 7 8 7 8 8 - 4 7
Material loans program 5 3 8 4 7 7 - 4 5
Infrastructure 5 5 8 7 7 7 - - 7
House construction 6 4 9 6 9 8 - 9 7
Cost recovery 4 3 - - 4 4 - 3 4
Maintenance 8 7 8 - 7 7 - 7 7
Community participation 6 4 7 7 7 6 - 7 6
OVERALL RATING 6 5 8 6 7 6 7 6
Use of ranks: 1 Poor 5 = Average 10 = Excellent
(For example: if costs were higher than expectedranking would be low; if land acquisition wascompleted rapidly the rankings would be high)
In computing average ranks the average isrounded up to the nearest whole number.
Key: a. Achievement of goalsb. Efficiency of proceduresc. Speed of implementationd. Coste. Qualityf. Accessibility to target populatiog. Replicabilityh. Flexibility
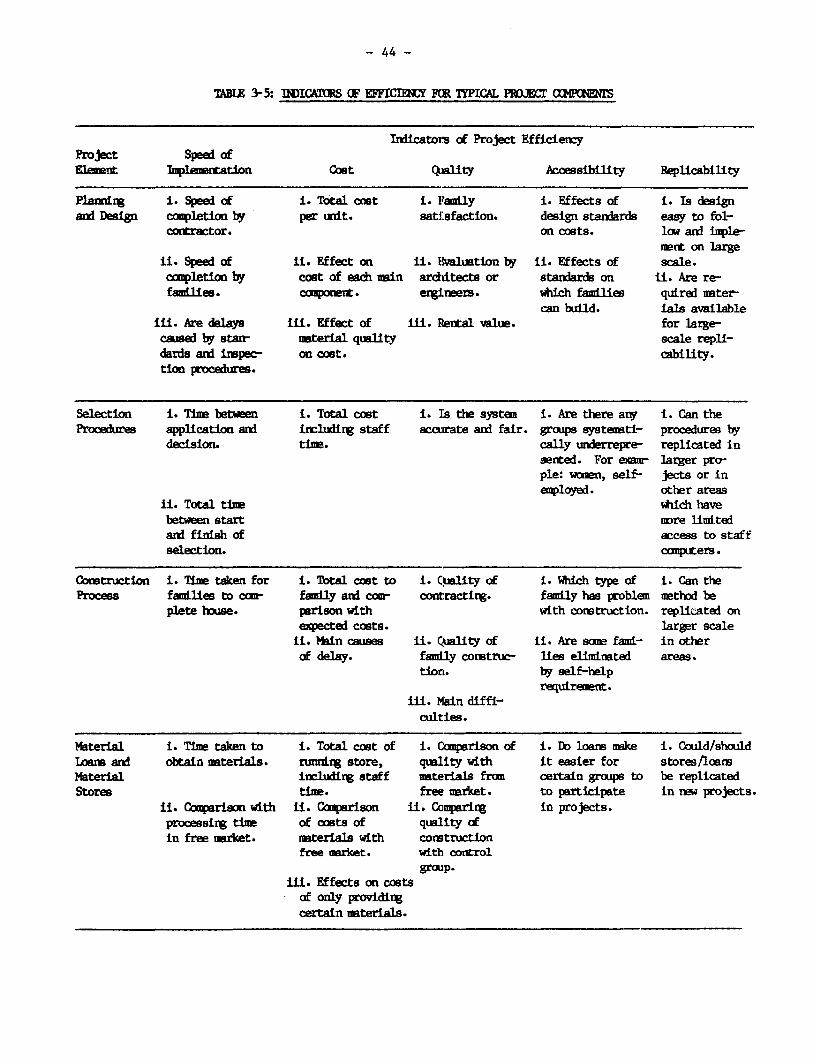
- 44 -
TABIE 3-5: IlDIIC S CF EFFICINlY (IR TYPICA PR1DC 02ME
Indicators cf Project EfficiencyPro ject Speed ofF.lnt a ti on Coet Qality Acoessibility Replicability
Plannixg i. Speed of i. Total. aut i. EanLly i. Effects of i. Is designai Design coeletion by per unit. satiLsfaction. design standards easy to fol-
contractor. on coots. 1lo and inp1e-mert on large
il. Speed of ii. Effect on il. Evaluation by ii. Effects of scale.capletioe by cost of eadh min ardcitects or stardards on ii. Are re-famLlies. coempor t - ergineers- which families qufred rater-
can build. ialas availableiii. Are delays iii. Effect of iii. Rietal value. for large-caused by stanr- mterial quality scale repli-dards ard inspec- on coot. cability.tion procedures.
Selection i. Tim between i. Total cost i. ]s the systez i. Are there ar i. Can theProcedures application and irncluding staff acoerate and fair. groupe systemati- procedures by
decision. time. cally underrepre- replicated insented. For enar larger pro-ple: wmen, self- jects or ineaployed. other areas
ii. Total tim iwhich havebetween start mre lmnitedard finish of access to staffselection. computers.
Ccoutruction i. Timn taken for i. Total cost to i. Cmplity of i. Which type of i. Can theProcesa fanilies to com- fad.ly and coer contractixg. family has problem method be
plete house. parison with with construction. replitated onexpected costs. larger scale
ii. Main causes ii. ÇuaJdty of ii. Are same fami- in otherof delay. fanfly construe- lies eliminated areas.
tioni. by self-helprequirement.
iii. Mbin diffi-culties.
Material i. Tin taken to i. Total coct of i. Coeçarison of i. Do loans make i. Coild/shouldLaiRs and obtain naterials. runnirg store, quality with it easier for stores/loensMaterial including staff materials fron certain groupe to be replicatedStores time. free nraket. to participate in ne projects.
il. Compariaso with hi. Compçrison ii. Coampadrg in projects.processing time of coats of quality <fin free uarket. materials with construction
free mnrket. with cootrolgrop.
iii. Effects on coitsof only providingcertain materials.

- 45 -
Table 3-5 (cont.)__
Project Speed ofEleeint Implnsemtation Coet Quality Accessibility Peplicability
Maintenance i. Speed wlth i. Effects of i. Hbw well are i. DO mainte- i. Shouldidbich repairs and project design services main- nance pollcies maintenarneother services are on cost of taioed. limit access policies/coetsperformed. mainterance. to certain be replicated
services, otr nmidfied.ii. Coets to ii. How well arefamily/governr- houses anid privatement of areas maintained.maintenance.
Cost i. Speed of col- i. CoIlection i. General i., Cbuld col-Recovery lection. costs. efficiency of lection pror
collection. cneures beil. Default rates. ii. Costs of replicated.
defaults.
Comanimty i. Effect on i. Effect on i. Effects on i. Are there i. Could theParticipation speed of projert project co6ts. quality of con- groups wCo are commniity
iimplementation. struction and helped to enter organizationmainterance. project through methods be repli-
cominmity action. cated in otherareas and in
ii. Effect on ii. Are there larger projects.consolidation of groups wtu areoemmuity and eliminated orobtainirg other discouraged.facilities andservices.
Projeet i. TIme from i. Effects of i. Which groups areOccupation start of project costs on occu- not occupyirg and why.
to occuparncy. pancy rates.
il. Main reason ii. Who is droppingfor delay. out.

- 46 --
4. Studying community level organizations
One of the objectives of marny projects is to develop orstrengthen community organizations, and consequently it is important toevaluate how these organizations are affe!cted by the project. Some of themethods which can be used include:
a. Studying communication linkages between the organizationand the community (how many people are informed about theorganization and its activities, are people consultedetc).
b. Studying participation cf different sectors of thecommunity in the organization.
c. Studying the internal efficiency of the organization.
d. Observing decision making processes and the form ofcommunity participation.
e. Studying the interactions between the communityorganization, the executing agency and other outsidegroups.
E. The design of Continuous, Periodic and One-Time Process Monitoring
1. Continuous panel studies
a. The panel methodology
The panel methodology consists of selecting a sample ofpeople, households, small businesses, etc. and maintaining contact withthem throughout the period of the study so as to record their response tothe project and to assess the factors which have affected this response.The panel sample may only cover potential project beneficiaries, or it mayalso include a control group made up of households (businesses, etc. withsimilar characteristics but who will not be affected by the project. Theinformation can be collected through the application of a formalquestionnaire, informal interviews, direct observation or by askingrespondents to record the information on their own behavior. In somecases, such as a cooperative, some of the information may be obtainablefrom secondary sources.
b. Initial diagnosis
Before designing a study, it is advisable to conduct aninitial diagnosis the purpose of which is to assess the issues which needto be studied, to test alternative research methods and to identifypotential problems and issues which are likely to arise during the courseof the study. The following are some of the steps commonly followed in thedesign and implementation of the diagnosis.
- 47 -
i. Define all of the groups likely to be affected by theproject and contact them all (or use other methods to determine theirlikely reactions).
ii. Contact all major organizations outside the community whoare involved in the project and determine their reactions.
iii. Conduct unstructured interviews with a small sample ofbeneficiaries to understand their perceptions and to test ways in which thestudy might be conducted.
iv. Review existing documentation on the project.
v. Spend time visiting the project areas and talking informallyto residents so as to obtain a "feel" for the situation.
c. Defining the universe and selecting cases
The objective of a panel study is normally to makegeneralizations to a wider population, such as all project beneficiaries orail households in a certain category living in the city. In order to makevalid generalizations it is essential to ensure that the cases are selectedto be representative of the total population. With respect to the projectpopulation a list can usually be obtained of all participants and a randomsample can easily be selected. Sometimes this can be made more difficultwhen records are not kept up to date.
The universe is more difficult to define for the control group.For example, if the study covers small businesses, should the controlsample cover all businesses of a certain size in the city, only those inareas close to the project, or only those with similar economicactivities? In practice the choice is also constrained by the cost anddifficulty of selecting and studying a completely random sample.
d. Some common measurement problems
A common problem is that of households who drop-out of thesample, either by moving or because they refuse to continue. In most areasof the city there are high population turnover rates so it is quite commonto find that 20% or more of a population group will move every year. Thispresents various problems for the study. The first is that the originalsample becomes progressively smaller unless replacements are chosen. Evenmore serious are the differences between households who move and those whoremain in the same place. As the study will only obtain information on thefamilies who have not moved, this is likely to provide a biased picture ofthe total population. It may be for example, that the businessmen who movedwere those who were least successful. Consequently, a sample of only thosewho have remained will have a bias towards the most successful businesses.It is important to note that increasing the sample size by replacingdrop-outs will not solve this problem of bias.

- 48 -
Respondent fatigue is another common problem. Even thoughrespondents may be willing to cooperate at the start of the study, they arelikely to become less willing to continue cooperating if the interviewerreturns every month (or three months) to ask them the same questions. Thismay either lead to drop-outs or to respondents providing less informationso as to end the interview more quickly.
The interview process itself may lead to distortion. The factthat a small businessman is constantly be:Lng asked to provide informationon stocks, sales, profits etc may lead him to rationalize his accountingand stock control systems. If this happens, some of the improvements in hismanagement system may be due to the interaction with the interviewer ratherthan to the effects of the program which îs being evaluated. A similarphenomenon has been observed in health studies, where child-care and healthpractices may improve as a result of the observation.
e. Data collection
Although the panel study will innevitably rely primarilyon one or two methods of data collection, it is essential to use themulti-method approach to check on the rel:Lability of the data and to helpwith its interpretation. Some of the main data collection methods include:
i. Structured questionnaire in which information isobtained on income, employment, housing investment etc. Questions may alsobe included on the reasons for certain actions (why did the respondentdecide to build another room etc) and on sources of finance and assistance.
ii. Observation guide: for example, observing the changeswhich have been made in the house. The melthod can also be used forobserving changes in the general economic or physical conditions of thecommunity. Photographs can provide a useful complement to the reportedinformation.
iii. Case studies in which a small sample of individuals,households, businesses etc is studied intiensively. An unstructuredinterview guide may be combined with observation and general conversation.
iv. Self-reporting by respondents. Keeping a record ofincome and expenditure is one common examile.
v. Use of secondary data is sometimes possible (forexample, credit or production/sales information from a cooperative).
f. Analysis
Statistical analysis can range from the presentation ofsimple graphs showing, for example, average investment in houseconstruction, business sales, proportion of children with parasites; tomore sophisticated types of multivariate analysis.

- 49 -
2. Periodic studies
Periodic studies follow a similar logic to the panel study inthat they observe a process of change over time, but a smaller number ofobservation periods are used. Often a larger sample, and more extensivedata collection methods are used in order to obtain a systematic comparisonbetween certain points in time. The most common periodic study is whereobservations are made at the start of a project, at some point during theimplementation process and again when the project is completed or nearingcompletion. For example:
A study to evaluate the effectiveness of the mutual help houseconstruction process. Observations were made at the beginning of theprocess when the groups were being formed and the initial orientationgiven. They were repeated when the process was well underway. A finalobservation was made when the process had been completed.
The same observations about choice and selection of datacollection techniques apply as for panel studies.
3. One-time studies
a. The approach
One-time studies may either be conducted as part of an overalland pre-planned evaluation design, or more commonly, to provide assistancewhen a problem has arisen or a decision has to be taken. A distinction canbe made between a rapid study which is specifically designed to provideresults within a given period of time (say a month), and a more intensivestudy where there is less time pressure and where the emphasis is onobtaining a more in-depth understanding of the processes involved. Thechoice between these two approaches is usually determined in part by i:henature of the problem being studied and in part by the information needs ofthe organization.
In general a rapid study will be used when:
i. The information is needed by a certain date.
ii. It is conducted as part of an ongoing evaluationprogram where the goal is to produce a certain number of studies per year(for example, in some projects the goal is to produce an average of onestudy per month).
iii. Where the issues to be studied are relatively specificand are not perceived to be excessively complex.
iv. Where the option exists of conducting a more completefollow-up study.
In contrast, a more intensive study will be preferred when:

- 50 -
- It is known that the issues being studied are complex ordelicate (for example, when a project has been rejected by a community;when relations between the community and the implementing agency are knownto be bad).
- When it is desired to obtain a more in-depth understandingof the processes of change and of how the beliefs and attitudes of thecommunity affect the project.
- When the study is used for quality control and to providefeedback on how the program is developing and what are some of the keypolicy issues to be addressed.
F. Defining the Strategy for Process Monitoring
Process monitoring should be given a much more central place in theoverall evaluation strategy than it has conventionally enjoyed in thepast. Although strategies must adapt to available resources, the followingare some general guidelines:
1. Resources should be reserved to permit the conducting ofone-time studies at fairly regularly intervals as they are a very valuableaid to project management. Mechanisms should be developed for selecting andreviewing these studies so that they became a regular part of projectplanning and review.
2. Given resource constraints, and the need for feedback tomanagement, most one-time studies should probably be rapid.
3. At least one or two longitudinal panel studies should beconducted as they help understand the complexities of the developmentprocess and identify key policy issues requiring further study. Thesestudies should always use a multi-method approach in which quantitative andqualitative methods are combined.

- 51 -
aHAPTER 4
IMPACT EVALUATION
A. Approaches to Impact Evaluation
At the time when urban development programs began to expand rapidlyin LDC's in the early seventies, many of the researchers responsible forthe evaluation of these programs looked for guidance to the United States.Following the massive social investments of the War on Poverty, evaluationresearch had become a growth industry and a large research literature wasbeing published. Two main approaches were recommended for the quantitativeestimation of project impacts. The first sought to estimate the net impactof a project on the target population, and the second to compare the"effectiveness" of two or more alternative strategies.
The first approach estimates the net impacts of a project bycomparing the conditions of beneficiaries after the project with what theywould have been if the project had not taken place. Most textbooks at thistime recommended the randomized experimental design in which subjects arerandomly assigned to receive "treatments" (project services) or to formpart of a "control group" which would not receive the treatments.Evaluations of this kind were implemented on several of the major War onPoverty programs in the Sixties, including the "negative income tax"programs; housing allowance programs; and comprehensive employment trainingprograms. Many of these evaluations were mandated by the U.S Congress toassess whether the programs offered cost effective ways to achieve certainquantifiable social and economic goals (such as improving housing qualityfor low income families). The reviews of these evaluations (see for exampleRossi and Wright,1984; Abt, 1976; and the Evaluation Studies Annual Reviewsfor 1979 and 1981) demonstrate that these types of experimental designs aretechnically feasible and can provide operationally useful recommendations -some of which are able to save billions of dollars (see below).
It was soon realized, however, that the randomized experimentalapproach is expensive and in many cases not technically or politicallyfeasible. For these reasons a number of quasi-experimental designs weredeveloped in which statistical rigour could be applied when randomassignment and other conditions of the experimental design could not be met(Campbell and Stanley, 1966 and Cook and Campbell, 1979). Designs coveredsituations in which participants were selected on a non-random basis andwhere a "patched up" control group had to be selected; or where it was notpossible to measure conditions before the program began.
The second approach compares the effects of alternative strategiesto determine which produces the greatest benefits for a given investment.In those cases where the benefits of each alternative can be given amonetary value (monetized), the most widely used technique is cost-benefitanalysis. One of the earliest large scale applications was the evaluationof Federal Manpower Training Programs (Glennan, 1972) where benefits weremeasured in terms of increased income of trainees. Where benefits cannotbe monetized (and this has proved to be the case with many social programs)then cost-effectiveness analysis is used to compare the costs of producing

- 52 --
a given output (increasing reading skills by a certain number of points,providing health care for a certain number of patients).
In 1975 the World Bank and the International Development ResearchCenter of Canada initiated a 5 year evaluation of four of the first Bankurban shelter projects in El Salvador, Zambia, Senegal and thePhilippines. All of these evaluations att:empted to implement aquasi-experimental design with before and after measurements beingconducted on a sample of participants and a control group. The initialobjective was to measure net impacts on variables such as income,employment, health, housing investment, fiamily size, and migration.
The usefulness of this approach soon began to be questioned by theexecuting agencies and World Bank project: staff. A first problem was thata longitudinal impact evaluation did not help managers to improve theperformance of their projects, and consequently additional ad hoc studieshad to be carried out to provide more rapid feedback on short and mediumrange problems related to project implementation. Second, delays andchanges in the project meant that by the time evaluation results wereavailable, many of the findings were either already known or no longerrelevant. Finally questions arose as to the validity of informationobtained through formal quantitative survey approaches.
Partly for these reasons interest was shown in qualitative,ethnographic techniques such as participant observation in which theresearcher lived in the community and sought to understand the ways inwhich intended beneficiaries perceived and responded to the project.Advocates of these approaches argued thalt they were much more flexible,produced results more rapidly, were able to investigate delicate orconflictive issues, produced more reliab:Le data and were able to studyprocesses as well as outcomes. Importance was also attached to evaluatingthe projects from the point of view of the intended beneficiaries as manydevelopment projects were perceived to have been imposed on beneficiarieswith very little attempt being made to ulnderstand their point of view.
For somewhat similar reasons, a number of rapid impact or rapidreconnaissance methods were developed wh:Lch could provide rapid andeconomical indicators of project progress and impacts. USAID, for example,has developed a rapid impact evaluation strategy which uses a multi-methodapproach to provide a quite comprehensive evaluation of a project's impactswith only about 4 weeks of fieldwork (see for example "Assisting smallbusinesses in Francophone Africa: the Entente Fund African EnterprisesProgram", USAID, 1982). Although less formalized than the USAID approachrapid evaluation techniques have been successfully applied in a number ofWorld Bank urban projects (see Chapter 3)
Initial experience with both ethnographic and rapid feedbacktechniques revealed some of their limitations as well as their strengths.The first problem is that in order to evaluate impacts and to comparedifferent groups it is necessary to have some basis for comparision andquantification. This cannot be achieved with most qualitative approaches,so that it is difficult to generalize from the particular cases studied. Italso became apparent that the claim of economy and speed is much less truewhen larger projects have to be evaluated. It is becoming clear that an

- 53 -
evaluation strategy must use a multi-method approach in which qualitativeand quantitative techniques are combined. Each method has its strengths andweaknesses, and an evaluation which relies on only one technique willinevitably give a limited and probably biased perspective. The combinationof techniques for the purpose of consistency is known as triangulation andwill be discussed later in this chapter.
B. Some Key Issues in the Design of Urban Impact Evaluations
The above review highlights a number of key issues which must beaddressed by management and researchers in the definition of an impactevaluation strategy:
1. Is it necessary to evaluate project impacts? While all projectmanagers accept the practical utility of performance and processmonitoring, many would question the necessity of conducting impactevaluations. It is argued that impact evaluations are too slow andexpensive and that managers are concerned with implementation issues suchas efficiency and the achievement of specific objectives, rather than withunderstanding whether their project has produced general changes in theconditions of the affected population. The success or failure of a projectdepends, it is argued, on a set of very specific circumstances and littleuseful information can be gained from the generalized statements producedby an impact evaluation.
In reply, defenders of quantitative impact evaluations point outthat projects are intended to improve the social and economic conditions ofthe target population, and it is essential to know whether they are able todo this. Development agencies seek to maximize the utility of scarceresources, and if investment decisions are based on wrong assumptions thenthese scarce resources may be used for projects which have a much lowerrate of return than one of the alternative strategies which could have beenused. If studies are not conducted on likely outcomes and impacts,decisions on future projects costing millions of dollars would be madewithout systematic information on their cost-effectiveness or ability toproduce the desired benefits. Decisions on future development strategiesshould make use of all useful sources of information which can be obtainedin a cost-effective manner.
Part of the confusion on the utility of impact evaluations hasarisen from a failure to clearly identify who are the audiences. Althoughmany types of cost-effectiveness and impact analysis may not be of interestto the project manager, they are important for finance ministries anddevelopment planning agencies. Impact evaluations can be useful in atleast three ways:
a. An impact report can assess the extent to which the projectobjectives have been achieved and the factors which have affected theoutcomes. The reports can be of direct assistance in the design of futureprojects by making goals more realistic or by defining more clearly thetarget population. (See Box 4-1).

- 54 -
BOX 4-I IMPACT EVALUATIONS CAN HELP DEFINE REALISTIC PROJECTOBJECTIVES
Project designs will often be overly ambitious in the way in whichthe objectives of a new project are specified. The followingexamples are typical of ways in which impact evaluations can helpmake project objectives more realistic:** An evaluation of small business development programs in
francophone Africa (USAID 1982) showed that many of theoriginal goals were unrealistic in terms of expected impactsand that a clearer definition of the target population wasneeded.
** An evaluation of a cooperative program in El SaIvador (seeSection 3 of this chapter) showed that the cooperatives wereunlikely to produce any major impact on employment of the low-income population, even though they significantiy improved theeconomic conditions of the small number of families directlyinvolved.
b. An impact evaluation can compare different projects, forexample in terms of their benefit/cost ratios, and provide guidance as towhich project or projects are likely to be most cost-effective. (See Box4-2).
c. Many projects, such as squatter upgrading, involve a largenumber of components (water, roads, sanitation, housing credit, communitycenters, technical assistance etc) which different families receive indifferent combinations. A well designed impact evaluation can estimate theoverall impact of the project and also assess the relative contribution ofeach component.
2. Is it possible to measure impacts and assess causation?
It is often argued that given the complexities of the urbanenvironment, it is not possible to identify the effects produced by aparticular set of project inputs. The urban environment is so differentfrom animal psychology and agricultural research, that the randomizedexperimental designs developed in these fields are much less appropriatefor urban research.
In reply, a number of examples can be cited from the U.S inwhich randomized experimental designs have been successfully conducted andwhere reasonably precise causal relationships have been established.Section C gives the example of the Experimental Housing Allowance Program.Another example is the evaluation of the effects of the U.S. NegativeIncome Tax Experiment on school performance (Maynard and Murname, 1981).In addition, the careful use of quasi-experimental designs in combinationwith qualitative techniques can provide operationally useful estimates ofthe degree of association between the project interventions and changes inthe conditions of the population for many projects where randomization isnot possible.

- 55 -
BOX 4-2 USING IMPACT EVALUATIONS TO COMPARE THE BENEFIT/COSTRATIOS OF ALTERNATIVE URBAN PROJECTS
A comparison was made in El Salvador of eight low-income housingoptions in terms of their costs and benefits to both the nationand the participating households. It has shown that progressivedevelopment approaches (sites and services and squatterupgrading) had higher rates of return for both the nation and theparticipating households, than any of the conventional housingprograms. The large scale implementation of progressivedevelopment would be very cost effective and would make projectsmore accessible to low-income households.
Source: Fernandez-Palacios and Bamberger, 1984
3. Do cost-effective methods exist for impact evaluation?
One of the most frequent criticisms of quantitative impactevaluations is that they are expensive in terms of both financial and humanresources. However, it is meaningless to claim that an evaluation is"expensive" without considering its cost-effectiveness with respect to thebenefits produced. For example, the evaluation of the experimmentalhousing Allowance Program described in Section C cost about $50 millionwhich would seem to be quite expensive. However, the evaluationdemonstrated that housing allowances were much more cost-effective thanconventional construction programs in improving the housing conditions oflow-income families. It has been estimated that the findings of theevaluation could save the federal government between $7 billion and $8billion per year. Assuming these estimates are correct, the evaluation wasclearly very cost-effective.
Although it is obviously not possible to predict the outcomes of anevaluation it is often possible to estimate the potential savings which theevaluation could produce. Table 4.1 presents a hypothetical example of apilot small business program costing around $10 million, whose purpose isto test the efficacy of technical assistance and innovative types of creditas means for generating new employment and increasing income of poor urbanhouseholds. If the project is successful it is intended that a secondproject, costing about $100 million would be implemented in 10 cities. Itis believed that the project will offer a more cost-effective way togenerate employment and income than conventional commercial credit. Agroup of local consultants were asked to submit a proposal for an impactevaluation of the pilot project. They estimated that the study, whichwould interview a sample of beneficiaries and a control group several timesthroughout the life of the project, would cost around $ 500,000. How couldthe cost-effectiveness of the proposed evaluation be assessed? It is knownthat it costs about $5,000 to create a job through commercial credit andthat on average each job will increase income by $4,500 over a period of 5years. A group of experts indicated that under the best possible scenario

MIBE 4.1: Eh!EOFICAL EffMR CF THEE FOTENITAL S&VINES MR!M AN RMWPC EVAUMTLII CF A PILOT IM W1JDIENT HRl§
A. iEuuJi:m (IJUIES PUR $100 MNILITn FRJKr AS) oN EEST AND ioR MSOe CF
Assuaptions by experts Projected outcomes for $100 million projectabout possible range
Cost per Income generatedjob per new job Income createdcreated over 5 years Jobs created over 5 years
BEESSŒNWRIO $1,000 $6,000 100,000 $600 million
ScŒARIO $20,000 $5,000 5,000 $25 million
a(XI*RCAL
CREIrr $5.000 $4,500 20,000 $90 million
B|. 16JKM MMil CF 1EN AMM WI TIO FR<)YE (UJICI! OR 1O 1 XE El AL BflZ
Cost to produce the Husehold income lostsame imtber of jobs over 5-year periodif alternative through not nrklngdecision had been alternative AIHPA
Decision taken taken decision EVAI NCI IIID SOM E1 EDISe $75-80 2IJIIIN
Approving project urder Loss of Loes of B! AM)ID)I A uEIC I;IONworst scenario $75 million $65 million 1) APPlEN A SIH:LL 1m)rr
Not approving project Loss of loss of <l AL 1Suiner best scenario $80 million $510 million

- 57 -
the new approach could reduce the cost of employment generation to around$1,000 per job and could generate $6,000 of additional income per job overthe 5 year period. The experts also indicated, however, that many programsof this kind have had very limited success and under the worst scenaria itcould cost as much as $20,000 to create a new job. Part A of the tableshows that under the best scenario, the second project could produce up to100,000 jobs and $600 million of additional income. Under the worstscenario only 5,000 jobs would be created and $25,000 of income. If,instead of approving a special project, the funds were made available tocommercial banks to expand small business credit, it is estimated that20,000 jobs could be created. Part B shows the costs of making a wrongdecision about whether to approve a second project. If a second project isapproved under the worst scenario it will cost $75 million more to createthe jobs than it would have cost through commercial credit. On the otherhand if under the best scenario the decision was made not to approve thesecond project, it would cost $80 million more to produce the 100,000 jobsthrough commercial credit. Under these circumstances it would seem verycost-effective to invest $500,000 in a careful evaluation if it couldsignificantly increase the likelihood of making the correct decision andsaving up to $75-80 million. Although information on impacts cansometimes be obtained cheaply and easily for small projects, large andcomplex projects usually require more rigorous analysis in order to assessthe likely outcomes of new types of programs and to compare the outcomeswith other investment options.
The purpose of this example is to show that the decision on whetheror not to conduct a rigorous impact evaluation should be based not simplyon its cost, but on its cost-effectiveness. The cost, complexity andduration of an impact evaluation depends on the types of information whichare required and the needed level of precision. A number of rapid impactevaluation methods exist which can provide operationally useful, but moregeneral, information in very short periods of time and at a low cost.Management must decide what information is really required so that theappropriate design can be developed.
4. Quantitative versus qualitative methods
There is a continuing discussion among evaluation practitionersas to whether quantitative or qualitative methods are better. The debate isoften conducted in quite heated terms as it involves philosophical andethical issues as well as methodology. Also, many researchers havespecialized in a particular technique and hence become very defensive whenit is criticized. The approach adopted in the present document is that alltechniques have their strengths and weaknesses and that a multi-methodapproach should always be used in which quantitative and qualitativemethods are combined. Box 4-3 illustrates the utility of combiningethnographic methods and econometric analysis in the evaluation ofinterhousehold transfer behaviour in Colombia.
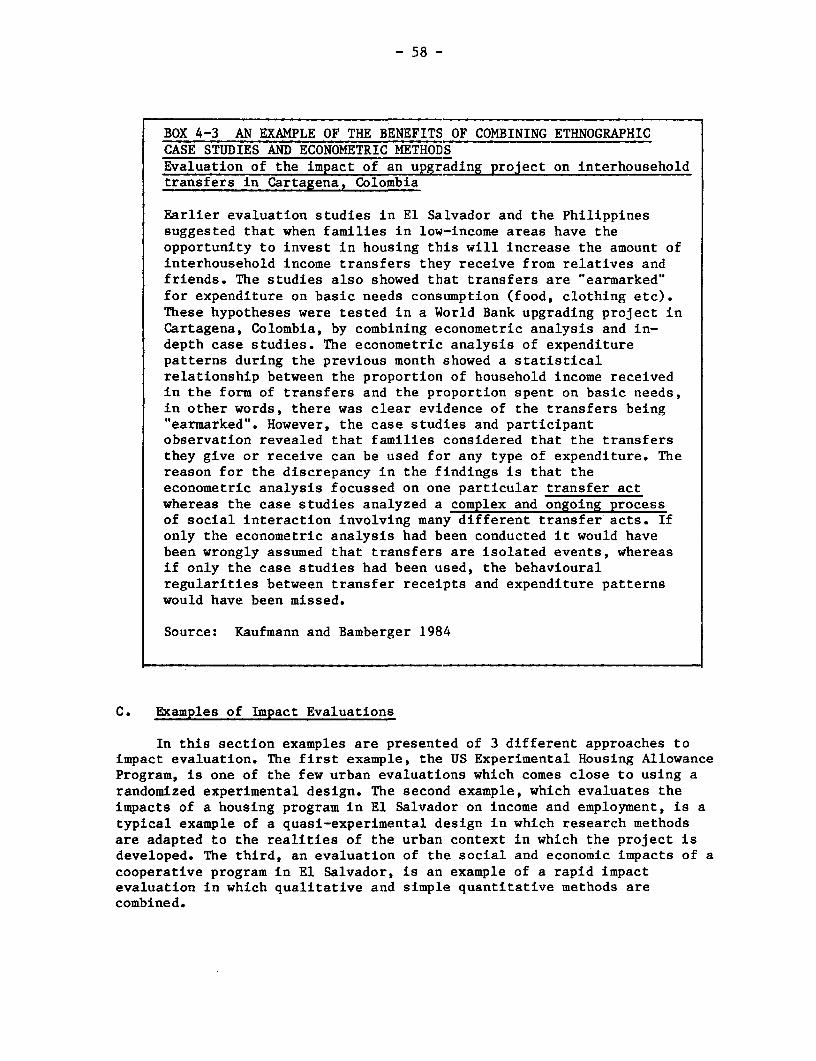
- 58 -
BOX 4-3 AN EXAMPLE OF THE BENEFITS OF COMBINING ETHNOGRAPHICCASE STUDIES AND ECONOMETRIC METHODSEvaluation of the impact of an upgrading project on interhouseholdtransfers in Cartagena, Colombia
Earlier evaluation studies in El Salvador and the Philippinessuggested that when families in low-income areas have theopportunity to invest in housing this will increase the amount ofinterhousehold income transfers they receive from relatives andfriends. The studies also showed tbat transfers are "earmarked"for expenditure on basic needs consumption (food, clothing etc).These hypotheses were tested in a World Bank upgrading project inCartagena, Colombia, by combining econometric analysis and in-depth case studies. The econometric analysis of expenditurepatterns during the previous month showed a statisticalrelationship between the proportion of household income receivedin the form of transfers and the proportion spent on basic needs,in other words, there was clear evidence of the transfers being"earmarked". However, the case studies and participantobservation revealed that families considered that the transfersthey give or receive can be used for any type of expenditure. Thereason for the discrepancy in the findings is that theeconometric analysis focussed on one particular transfer actwhereas the case studies analyzed a complex and ongoing processof social interaction involving many different transfer acts. Ifonly the econometric analysis had been conducted it would havebeen wrongly assumed that transfers are isolated events, whereasif only the case studies had been used, the behaviouralregularities between transfer receipts and expenditure patternswould have been missed.
Source: Kaufmann and Bamberger 1984
C. Examples of Impact Evaluations
In this section examples are presented of 3 different approaches toimpact evaluation. The first example, the US Experimental Housing AllowanceProgram, is one of the few urban evaluations which comes close to using arandomized experimental design. The second example, which evaluates theimpacts of a housing program in El Salvador on income and employment, is atypical example of a quasi-experimental design in which research methodsare adapted to the realities of the urban context in which the project isdeveloped. The third, an evaluation of the social and economic impacts of acooperative program in El Salvador, is an example of a rapid impactevaluation in which qualitative and simple quantitative methods arecombined.

- 59 -
1. A large-scale randomized experimental design: the experimentalHousing Allowance Program.
The Experimental Housing Allowance Program (EHAB) sought to testthe efficacy of providing poor households with allowances they could use toimprove their present housing or to find better rental accommodation. Itwas believed that stimulating the private housing market would be moreeffective than the government directly providing housing.
a. Design
A sample of approximately 1800 low income households wasselected in two US cities. The sample was randomly divided between anexperimental group which received housing allowances and a control groupwhich did not. A factorial design was used in which 19 treatment groupswere created. Groups varied in terms of whether payments were based on thedifference between their present housing conditions and the minimumsatisfactory standard defined by the researchers, or whether they were paida proportion of their rent.
Three experiments were conducted: a three year demand study toobserve the effect of increased income (housing allowance) and reducedprices (payment of a proportion of rent) on housing consumption; a ten yearsupply study to observe the impact of increased demand on prices andhousing supply; and a third experiment (conducted in other cities) toassess the efficacy of different methods of administering the program.Participating households were required to provide monthly information andto respond to periodic interviews. The control group received no assistancebut was asked to provide similar information, for which they received asmall payment.
b. Some findings
Participation rates (the proportion of families willing to makethe necessary repairs to their house in order to participate) wererelatively low with only 27% participating in the demand experiments andbetween 33 and 42% in the supply experiments. Where subsidies wereunconstrained, only 10% of the additional income in Pittsburg and 25% inPhoenix was used to increase housing consumption. The rent subsidytreatment significantly decreased the average proportion of income paid inrent from 40 to 25%. Virtually no impact was detected on housing prices andhousing supply.
Although the impacts were relatively small, the EHAP programappeared to be a cost-effective way of improving housing quality forspecific target groups. The observed improvements were producedsignificantly more cheaply than through conventional programs and it hasbeen estimated that the implementation of the evaluation recommendationscould potentially save federal housing agencies as much as $7-8 billion peryear.

- 60 --
c. Methodological issues
The 3 year cut-off point may be too early to assess some ofthe impacts. There is also the problem that participants' behaviour mayhave been affected by the knowledge that: the subsidies would only last for3 years.
The cost of the evaluation is another issue. Theexperimental program, including the housing subsidies, cost over $150million of which the evaluation component itself cost around $50 million.However, given the estimated potential annual savings of $7-8 billion, theevaluation appears to have been very cost-effective.
A final problem is that the United States experience suggeststhat randomized experimental designs can only be used with experimentalprograms which are not yet being implemented on a regular basis. It isdifficult to convince politicians or project managers to accept thatcertain people should be excluded from access to the benefits of a regularprograms so as to form part of a control group or that participants shouldbe selected randomly rather than according to need (or some politicalcriterion).
2. A quasi-experimental design: evaluating the impact of asites and services housing project on employment and incomein El Salvador
One of the objectives of the sites and services project was toincrease household income and labor force participation rates.
a. Design
A sample of 196 future participants in a sites and serviceeproject were chosen for the study. A control group was selected from amonghouseholds living in the 3 main types of low-income housing in the city,with aproximately 100 households being selected randomly from each of thethree types. A socio-economic questionnaire was administered to bothparticipant and control groups in 1976, Just before the project began andagain in 1979 and 1980. If a family moved it was replaced in the sample bythe new occupant of the same structure. Multiple regression analysis wasused to statistically match the experimenital and control samples in termsof a set of socio-economic characteristics.
b. Some findings
It was not possible to detect any difference between theexperimental and control groups in terms of the rates of change of totalhousehold income and in labor market earnings between 1976 and 1980. Theonly significant difference was that the labor force participation rate ofsecondary workers fell by 30% for the control group but remained unchangedfor participants. This suggested that during the very difficult economicand political period through which El Salvador was passing, secondaryworkers in project areas were more successful in keeping their jobs thanwere workers in the control areas. Two alternative hypotheses were advancedto explain these findings: (a) Employers gave preference to project

- 61 -
residents because they considered that people who are buying a house arelikely to be more reliable workers; (b) the need to keep up mortgagepayments gave secondary workers more incentive to remain in the laborforce.
c. Methodological issues
The political crisis in El Salvador meant that any economicbenefits the project might have produced were largely cancelled out by theeconomic depression. The inconclusive findings cannot therefore beinterpreted to mean that the project would not have produced economicbenefits under more favorable circumstances. As always with aquasi-experimental design the question arises as to how comparable theexperimental and control groups really were at the start of the project.Even though the groups were matched in terms of income and othercharacteristics, there was no way to control for differences in variablessuch as motivation. The issue also arises as to how well income andemployment were measured. It could happen, for example, that projectparticipants were more willing to cooperate and provide accurateinformation than the control group.
3. Rapid impact evaluation employing a multi-method approach:evaluating the social and economic impacts of a cooperativeprogram in El Salvador
The production cooperatives were designed to improve theeconomic conditions of communities in which housing programs were beingorganized and to promote grass-roots community organizations capable ofunderstanding and improving the social and economic conditions of thecommunities they represented.
a. Design
The study, which took about two months to complete, involvedone fulltime researcher and a part-time director. Interviews were conductedwith leaders and community organizers in six cooperatives and secondarydata was reviewed. The largest cooperative (dress-making and rug-making)was studied more intensively through: (a) participation in meetings andcooperative activities (b) preparation of intensive case studies on 12cooperative members (c) review of secondary data from the implementingagency and the cooperative (d) open interviews with members of thedirectorate (e) asking all 50 members to complete a form indicating theirincomes and work hours before the cooperative began and at the present timeand (f) interviews with project staff.
b. Some findings
The quantitative impact on the employment situation of thewhole community was relatively small with only 94 people out of a totalcommunity labor force of around 2700 being employed by the cooperative.Although the cooperatives significantly improved income and work conditionsfor their members the potential for growth was severely constrained by thelocal market.

- 62 -
The participatory organizational style of the cooperativemade members much more aware of the political and economic reality withinwhich they lived and increased their involvement in outside politicalactivities such as contacts with trade unions. Finally, the cooperativeincreased the self-confidence of its female members many of whom becamemore self-assertive in their domestic relations and gained moreindependence in the management of their own lives.
c. Methodological issues
The estimates of project impact on income were obtained byasking respondents to recall how much they had been earning three yearsago. This method is subject to considerable measurement error and possiblybias. It is also difficult to interpret the findings when there is nocontrol group with which they can be compared.
Several of the cooperatives also had a strained relationshipwith local landowners or large businesses which may have inhibited membersfrom freely expressing their opinions.
D. Alternatives to Large Scale Quantitative Evaluation Designs
1. The selection of the most appropriate research techniques andthe use of triangulation
Annex B points out that the social sciences have becomeincreasingly concerned with refining research techniques, but relativelylittle attention has been paid to the question of how to choose the besttechnique for a particular purpose. The choice of research methods has aprofound effect on the types of information which are obtained and thetypes of conclusions which are drawn about project impacts. For example,the use of a precoded questionnaire forces respondents to choose between alimited number of predetermined options (a list of community problems,reasons for migrating to the city, things they like and dislike about thecooperative). If, instead the researcher had lived in the community andhad tried to observe and understand the main concerns which peopleexpressed in their day-to-day activities and in community meetings, it isquite possible that different conclusions might have been reached. Astructured questionnaire is appropriate when information must be collectedon specific topics or when a hypothesis is being tested. However, it ismuch less effective for understanding the opinions of the community or foridentifying unexpected outcomes.
No research method is infallible and consequently the evaluationdesign should always use the principle of triangulation and combine severaldata collection methods to provide consistency checks (Annex B Section 1).
2. Participant observation and related ethnographic approaches
Considerable interest has been expressed in recent years in thetypes of qualitative and ethnographic approaches described in Annex B. Theparticipant observer becomes very closely involved in the community orgroup being studied, and either lives in the community or spends a greatdeal of time there. The approaches are intended to give the researcher a

- 63 -
deeper understanding of the culture of the group and of the meanings whichits members give to the subject being studied. In the case of an urbandevelopment project, the purpose is to understand how people perceive theproject, who does and does not benefit and what effects the project has onindividual families and the community in general.
There are three main ways in which qualitative techniques can beused in impact evaluation:
a. In those cases where it is not necessary to obtain precisequantitative estimates of impacts, use may be made of the rapid evaluationtechniques discussed in Chapter 3. These studies usually combinequalitative and simple quantitative techniques as in the evaluation of thecooperative program in El Salvador (Section C.3 of this chapter).
b. Unstructured interviews can be used at the start of a surveyto define hypotheses and to help develop instruments. They can also beused after the statistical analysis has been completed to help interpretthe findings and to provide a consistency check (triangulation). In thiscase the analysis is primarily quantitative with the qualitative techniqueshaving a supporting function.
c. A complementary design can be used in which quantitative andqualitative techniques have equal importance and are used to complementeach other at every stage of the research. Box 4-3 is an example of thisapproach.
Despite their recent popularity, qualitative methods have a numberof limitations when used for impact evaluation. A recent review articlesummarizes some of these issues with respect to the US evaluationexperience:
"It is however, equally clear that qualitativeevaluations have their limits as well. However inexpensivethey may be for single, small-scale projects, they are veryexpensive and not very sensible approaches to the evaluationof fully developed programs that have quite specific goals.Qualitative evaluations are very labor intensive and cannotbe used on very many sites except at considerable cost.Furthermore, qualitative approaches rarely provide estimatesof the effects that are either very precise or free and clearof possible confounding factors. Indeed, the only large-scaleprograms to which qualitative approaches were applied hadvaguely stated goals e.g. Model Cities(Kaplan 1973) andrevenue sharing (Nathan et al 1981). In these evaluations,the findings were composed more of descriptions of programoperation than of assessments of programs effects."
(Rossi and Wright,1984 page 343)
The issues relate to whether qualitative methods can assess impactsas well as processes, and whether they can control for possible confoundingeffects. There is also an issue of cost when the techniques are applied tolarge scale projects.

- 64 -
3. Rapid impact studies
Rapid studies are designed to produce rapid and economicalestimates of project impact. Most of the methods combine quantitative andqualitative techniques both as consistency checks and to use the cheapestmethod of obtaining the required information. These techniques arediscussed more fully in Annex B Sections 5,6 and 8 and in the Boxes givenin Chapter 3.
A number of rapid evaluation techniques have been developedwhich rely largely on easily observed indicators such as the materials usedin house construction or the range of products on sale in communitystores. Although these indicators can be used to generate hypotheses and asa consistency check, they are difficult to use on their own. One of themost difficult problems is to know how to interpret what is observed (seeAnnex B).
When rapid evaluations are constructed, it is advisable to use amulti-method approach which combines several techniques of which thefollowing are typical examples:
a. Informal interviews with representatives of all groupslikely to be affected by the project.
b. Direct observation of the socio-economic characteristics ofthe community.
c. Use of available secondary data sets.
d. Participant observation in which the researcher attendsmeetings, observes the program in action, etc.
e. Rapid sample survey.
4. Simple quantitative methods
Although it will frequently be necessary to use the morerigorous techniques discussed in Section E, in many cases it is sufficientto use much simpler (and more economical) statistical procedures. Forexample:
a. A cross-sectional survey can be conducted at the end of theproject in which a sample of project beneficiaries are compared with acontrol group which did not have access to the project. Annex F explainsthe statistical procedures such as regression analysis which can be used tomaximize the efficiency of this and similar designs. The results will bemore valid if qualitative techniques are also used and if questions areincluded on the causes of changes (for example, participants are asked whythey made investments in their house and whether the presence of theproject affected their decision).
- 65 -
b. In projects such as squatter upgrading, where it may not bepossible to identify an independent control group, it is possible toestimate project impact through the use of the regression procedures givenin Annex F.
Despite their theoretical limitations, both of these types ofanalysis can be useful in identifying: (i) whether the project has had anyidentifiable effects and; (ii) which groups seem to have been most andleast affected.
5. Using secondary data
Before embarking on an expensive and time-consuming datacollection exercise, the evaluator should determine whether estimates ofimpact can be obtained through the use of existing data. For example:
a. The records of a cooperative or small business creditprogram may provide detailed information on the number of new businessesstarted and changes in employment, income, productivity, etc. The problemwith the use of this data is that without a control group it is difficultto know whether the changes are due to the project or whether they areoccurring throughout the city.
b. Public health programs and clinics may keep records onchanges in levels and types of illness and on the quality of water supply,sanitary services, etc.
c. Community organizations may keep records on membership,financial resources, numbers and types of projects organized, etc.
d. Census data or studies conducted by other organizations mayprovide some control data against which to compare the changes observed inthe project areas.
E. Quantitative Estimates of Net Project Impact
The purpose of most types of quantitative impact evaluations is toestimate the net impacts produced by a project on the immediatebeneficiaries or on a wider target population. The objective is toestimate "how much better off" beneficiaries are as a result of havingparticipated in the project. As the urban environment is constantlychanging, the evaluation design must be able to isolate the effects of themany changes unrelated to the project which are taking place, so as todetermine the direct impact of the project interventions being studied. Inmany types of analysis, impacts or benefits will be compared with costs soas to estimate the return on the resources which have been invested. Inthis section we describe the main stages in the design and analysis of animpact evaluation of this kind.

- 66 -
1. Modeling the implementation process
Whenever an evaluation of project impact or effectiveness isplanned the first step should be to prepare a conceptual framework whichdescribes the project implementation process and the design assumptions onwhich it is based. Annex A describes the main stages in the definition ofthis model and illustrates them for an artesan credit program (See TableA-1 on page 137). Let us assume that when the second measurement was madetwo years after the project had begun, the! evaluation showed there had beenno significant increase in the output or e-arnings of the artesansparticipating in the program. What inferences can we make about thepotential utility of the program"? There are a number of differentreasons why the project might not have prcoduced the expected impacts:
a. The design assumptions of the project may have been wrong.Artesan credit is not an effective way to improve theeconomic conditions of the urban informal sector.
b. The amounts or types of inputs were insufficient.
c. There were problems with the processes through which theprogram was implemented. I'erhaps potential candidates werenot aware of the program, or the loan disbursementprocedures were slow and ctmbersome.
d. The expected linkages between outputs and impacts may nothave taken place. For example, artesans may use theircredit to increase their fixed capital but not tohire more labor.
e. The socio-economic characteristics of theparticipants may have been different from what had beenexpected. For example, they may have had less savings thanexpected or may have been involved in more capital intensivelines of production.
Only the first of these explanations would imply that the artesancredit program was not a potentially useful way to improve the economicconditions of the informal urban sector. All of the other explanationssuggest that the disappointing outcomes were the result of problems in theway the project was implemented or of external pressures.
If the study had only provided statistical information on impacts,the policy recommendation would have been that the project was noteffective and by implication should not be replicated. However, the aboveconceptual framework provides a great deal more information. Even when theexpected impacts are not achieved, in most cases the policy implicationwill not be to terminate the program but rather to make improvements in theway it is designed or implemented.
Annex F Section 5 explains how Path Analysis can be used tostatistically test the causal hypotheses described by the models.

- 67 -
2. Operational definitions of expected impacts
Once the model has been described, the next step is to definethe expected impacts and to specify how they can be measured. In manyprojects this is complicated by the fact that intended impacts have onlybeen defined in a very general way (for example "to improve the healt:h ofproject beneficiaries"), or because there was an overly ambitious statementof expected impacts (for example it may be claimed that a small creditprogram will improve the economic conditions of the whole projectpopulation).
The evaluators should also be aware that as a result of theproject intervention a number of unanticipated and often very significantoutcomes will occur. For example, work groups which were originallyorganized to build houses may become permanent community organizationswhich go on to implement other projects which were not originally planned.The evaluation design must have the flexibility to identify and measurethese unexpected outcomes. In order to do this it is essential to use amulti-method evaluation design, as many of the conventional designs ceLnonly measure intended effects.
Table 4-2 gives examples of six types of impacts the project mightwish to produce and of indicators which could be used to measure each one.The objectives must be related logicaliy to the project model and bedefined in terms of measurable indicators.
One of the objectives stated in Table 4-2 is to raise income ofproject households. Three measurable indicators of income change aresuggested:
a. Increased rental income from larger and better quality houseswith improved access to services.
b. Increased income transfers from relatives to help with houseconstruction and mortgage payments.
c. Through employment effects generated by increased houseconstruction.
If the researcher is given this type of information the evaluationdesign can measure whether the expected changes have taken place and alsoindicate why the outcomes are different than expected. For example, ifincreased employment opportunities do not occur, it will be possible toevaluate whether this is due to macro-economic factors affecting demand forlabor, to the location of the project site or to the fact that employersare less interested in hiring project participants than had been expected.Using this type of model, the information is much more useful to policymakers than a simple statement that "there was no significant impact onemployment".

- 68 -
TABLE 4.2: EXAMPLES OF SIX MICRCI-LEVEL PROJECT IMPACTS AND SOMEINDICATORS WHICH COULD BE USED TO MEASURE THEM
TYPE OF IMPACT QUANTIFIABLE INDICATORS1. Employment and Income 1. Total family income
2. Sources of income3. Income stability4. Type of employment5. Number of people working6. Labor force participation
rate of a particular group,eg. women
7. Proportion of self-employed
2. Demographic Characteristics 1. Family sizeof the Family 2. Age composition
3. Education of household head4. Proportion of children
attending school5. Civil status of household
head6. Geographical mobility
3. Housing Costs, 1. House valueQuality and Value 2. Construction quality
3. House size4. Access to services
4. Health 1. Infant mortality rate2. Types of intestinal infection3. Time lost from work or
school due to illness4. Access to medical services5. Amount spent on medical
services6. Weight and height
5. Consumption Patterns 1. Amount spent on housing2. Amount spent on food3. Amount spent on clothing4. Amount spent on
transportation5. Amount spent on health6. Amount saved
6. Community Participation 1. Number of friends in theproject
2. Participation in political,social and religiousorganizations
3. Participation in mutual help4. Satisfaction with the
community5. Satisfaction with economic
and political situation

- 69 -
In addition to their direct impacts on project participants, mostprojects are also intended to have some wider impacts on: the totallow-income population (improved access to housing, lower rents, etc.);management of the city (increased taxation, improved transport systems) andhousing and urban development policy (changed attitudes to sites andservices and upgrading; revision of housing subsidies; provision of newsources of housing finance; increased involvement of the private sector,etc.).
3. Experimental and quasi-experimental designs: the adaptationof textbook evaluation designs to the realities of the urbancontext.
In order to provide the information needed by managers anddevelopment planners, it is necessary not only to determine whether changeshave taken place in the project population, but also to determine whetherthe changes are due to the project or to other unrelated factors. Citiesare in a constant state of change so that project participants are subjectto many other factors in addition to the project. The separation of theproject impact from that of other factors requires a research design whichcan control for the effect of these external factors. The ideal way to dothis would be to use one of the true experimental designs described inAnnex E, but unfortunately the conditions required by the experimentalparadigm can usually not be met in the urban context. With a fewexceptions (such as the housing allowance experiments described earlier inthis chapter) it is almost never possible to randomly assign subjects tothe project and control groups. Subjects are either selected on the basisof need, qualification or some explicit or implicit politicalconsideration. It is also never possible to exclude external factors suchas flooding, political intervention, relocation of employment centers andmacro-economic trends. Consequently an urban impact evaluation, howevercarefully designed, can rarely approach the statistical exactitude of theanimal psychologist or the agricultural researcher.
Evaluation researchers disagree about the implications of this interms of the objectives of urban evaluations. Some, particularly theproponents of qualitative evaluation, argue that it is not possible tomeasure impact or causation in any statistical sense and that theobjectives of urban evaluations should be to understand project processesand the subjective reactions of beneficiaries. On the other hand many ofthe more quantitatively inclined researchers argue that policy makers needto know as much as possible about project impacts and the effectiveness ofdifferent components and services, and that the function of the evaluatoris to introduce as much statistical rigour as possible into the complexurban context.
In order to understand the associations between project inputs andimpacts on the target population, a number of quasi-experimental designshave been developed (see Box 4-4 for a typical example) which try toapproximate the experimental paradigms closely as possible, within therealities of the urban context. Annex E summarizes some of the most commonof these designs and uses the experimental paradigm as a yardstick againstwhich to evaluate their strengths and weaknesses. This enables the

- 70 -
BOX 4-4 EXAMPLE OF A PRE-TEST POST-TEST QUASI-EXPERIMENTAL DESIGNWITH A CONTROL GROUPEvaluating the effects of housing investments on foodexpenditures in El Salvador
A concern of housing planners is that the needs of poor familiesto mobilize resources for purchasing or upgrading their housingmay result in reduced expenditures on food and other basicnecessities. This hypothesis was tested on a sites and servicesproject in El Salvador by comparing food expenditures ofparticipants and a control group before the project began andwhen the project had been underway for around 18 months. Theresults were as follows:
Average monthly expenditures on food (pesos)1977 1979 % change
Participants 177.4 240.6 + 35.6Control group 155.2 241.5 + 64.2
The T-Test score of 4.63 (wlth 356 degrees of freedom) wasstatistically significant at the 0.0005 level, thus supportingthe hypothesis that project participation would negatively affectfood expenditures. The control group was essential to thisdesign, to provide information on generai trends in foodexpenditure and to control for the effects of inflation. Aveakness of the design is that it is not possibie to determinethe extent to which the slower rate of increase in foodexpenditures is due to the initial differences between the twogroups rather than to the effects of participating in theproject.
Source: Bamberger 1982.
researcher to identify the weaknesses and potential biases in eachevaluation design. Other techniques can then be used as consistency checksand to compensate for some of these weakrLesses.
There are a number of ways in which a badly designed evaluation canlead to wrong interpretations being made about project impacts or potentialreplicability. These have been classifiedl into four sets of "threats tovalidity. Statistical conclusion validity arises when the sample iswrongly designed or an inappropriate statistical test is used. When thishappens a project may appear to have no impact when in fact the sample wastoo small, or wrongly stratified, to have been able to detect impacts ifthey did exist. Internal validity problerns arise when a statisticalassociation (such as a correlation coefficient) is wrongly interpreted asproving that a causal relationship exists. Problems of construct validityof causal relations relate to the fact that different researchers may placedifferent interpretations on the statist:Lcal findings. In the earlierexample of an increase in indicators of middle class consumption patterns,

- 71 -
one researcher may interpret this as showing that poorer families have beenbought out and have left the community; whereas another may interpret thesame data as proving that poorer households have remained in the projectbut have adopted middle class consumption patterns. Finally, externalvalidity problems arise when generalizations have to be made from theresults of the project about how a similar program would perform on alarger scale. It may be that the first project has attracted the mostcompetent or ambitious households, and that if the program were applied ona larger scale it would probably produce less satisfactory results due tothe lower potential of new participants.
4. The use of panel and independent samples
Most discussions of quasi-experimental designs assume that itwill be possible to interview the same group of subjects before and afterthe project. Unfortunately there is a high population turnover rate inmany of the areas studied, particulariy among the control groups, with theresult that in practice it is often not possible to reinterview the samehouseholds. Many evaluations try to ignore this problem, which can lead toserious errors in the interpretation of the findings as families who havenot moved usually have quite different characteristics from movers. Forexample, the movers may be younger, have more education and perhaps higherincome. Clearly an analysis based only on those households who haveremained, will give a very misleading picture of what has happened to allfamilies studied at the start of the project. To overcome this problemthree alternative research designs can be used:
a. Panel design (sometimes called "related sample design") inwhich original households or subjects are reinterviewed. If a householdhas moved, it will not be replaced and the sample will become smaller. Thehouseholds who are reinterviewed are a representative sample of allhouseholds who have not moved, but they are not representative of allorginal households. This design can be strengthened by comparing thecharacteristics in T(1) of households who moved with those who stayed.This design can be used to estimate project impact on original householdsor subjects, but care must be taken in the types of inferences which aremade. The advantage of this design is that "before" and "after" scores areavailable on the same subjects so that more precise statistical estimatescan be made of project impact. This means that the statistical errorarising from the chance differences in age, education, etc., of the twogroups of subjects ("between group error") is eliminated and the level ofstatistical precision is consequently increased.
b. Independent samples in which a new sample is selected forthe second interview. This design has the advantage that the new sample isrepresentative of the total population being studied so that the errors ofinterpretation related to the previous design do not occur. Thedisadvantage is that the statistical analysis is more complex, and as theestimates are less precise larger samples may be required. Despite theanalytical difficulties it is possible to make reliable estimates with thisdesign.
- 72 -
c. Mixed sample design in which aspects of the two previousdesigns are combined. With this design a sample of structures, businesses,etc., is selected in T(I). For the design of the sample in T(2) the samestructures, businesses, etc. are revisited. If the same household orsubject is still there he/she will be reinterviewed. If the subject hasmoved a new subject vill be randomly selected. This can be considered as astratified sample, where one stratum is a random sample of originalsubjects, and the other stratum is a random sample of new subjects. Whenthe two strata are combined, this produces an approximately random sampleof all subjects in T(2). Separate analysis can be conducted of: originalsubjects (panel sample), new subjects and all subjects. In order to beable to conduct all three types of analys:Ls it is important to ensure thatthe sample design will include sufficient original and new subjects. Caremust also be taken with respect to the procedures for selecting the newsubjects.
5. Sample design
The principal objective in the design of a sample survey is toensure that valid inferences can be made about the characteristics of acertain population. If the sample is too small, or if there are biases inthe selection procedures, there is a danger of making incorrect inferencesabout the population. Some of the requirenments for a good sample are thefoilowing:
a. The sample must cover the entire project population. Manysamples inadvertently exclude groups such as renters, female headedhouseholds, the unemployed, artesans who are not registered with a certainorganization etc.
b. The sample must be selected randomly so that the results canbe generalized to the total population. A common error is to excludepeople who refuse to cooperate or who are never at home.
c. The sample must be sufficiently large to ensure that thefindings are statistically vaiîd. Sometimes the original sample size isreduced to save money with the result that the number of cases is too smallfor valid statistical analysis. Another common mistake is to assume thatif the sample covers 10% of the population this will be adequate. In factthe main determinant of sample size is the absolute number of interviewsand in most cases the proportion of the population covered does notguarantee that the sample is sufficiently large.
d. The sample design must ensure the adequate representation ofsub-groups of interest to project management. A simple random sample willfrequently under-represent certain groups which are numerically not verylarge but which are of particular interest to management. It is usuallynecessary to use a stratified sample to ensure that sufficient cases areincluded from these groups.
e. One or more control groups should be included so as toseparate the effect of the project from other extraneous factors.

- 73 -
In addition care should be taken to minimize costs by ensuringthat the sample is not larger than necessary. Annex D describes some ofthe procedures which can be used to meet these requirements. A numberaofstandard procedures exist for estimating sample size. Where possible astatistician should be consulted as the study may be almost worthless ifthe sample is wrongly designed.
6. Analysis and interpretation of the survey data (See Annex F)
This section presents a brief summary of the analyticalprocedures described in Annex F. It is strongly recommended that all of thestatistical techniques are complemented by one or more qualitativeprocedures so as to ensure consistency checks and to help in theinterpretation of the findings. The following procedures are presented inorder of increasing complexity:
a. Tests of association and difference (Annex F Section 2)
The simplest type of statistical tests compare participantsbefore and after the project with respect to variables such as householdincome, parasitic load or transport expenditures; or they compareparticipants and a control group after the project has been underway forsome time. These designs are very weak and can easily lead tomisinterpretation as there is no way to determine whether the observeddifferences are related to the project.
A more powerful design is to compare participants and acontrol group before and after the project (See Box 4-4). This design stillsuffers from the problem that the evaluator normally has no control overthe selection of participants. Consequently there will frequently beimportant differences between the experimental and control groups at thetime the project begins. When differences are found between the two groupsafter the project it is difficult to assess whether the differences areassociated wîth the project or are due to the continuing influence of theinitial differences between the groups (see Table F-1 in Annex F for anexample). The type of statistical test to be used will depend upon whethera panel or an independent sample design is used.
b. Use of regression analysis to statistically match thecontrol and experimental groups (Annex F Section 4)
A constant problem in the interpretation of the results ofthe previous types of quasi-experimental designs is the confounding effectof the initial differences in age, income, education, famiiy size, etc. ofthe control and experimental groups. If these intervening variables areincluded in a multiple regression analysis, it is possible to statisticallymatch the experimental and control groups on each variable so that thereeffect is "controlled". An additional dummy variable is then included toindicate whether the family was part of the control or the experimentalgroup (See Box 4-5). If the coefficient of the dummy variable isstatistically significant this means that the value of the dependentvariable is signficantly different for the two groups after controlling for
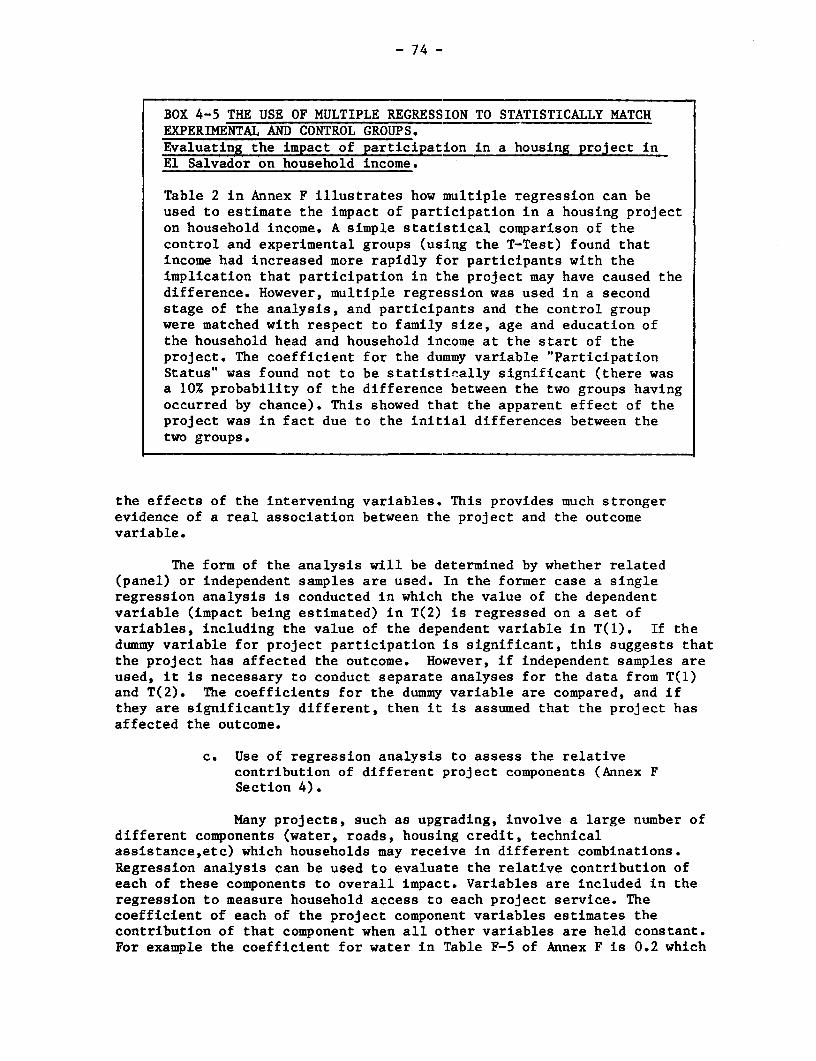
- 74 -
BOX 4-5 THE USE OF MULTIPLE REGRESSION TO STATISTICALLY MATCHEXPERIMENTAL AND CONTROL GROUPS.Evaluating the impact of participation in a housing project inEl Salvador on household income.
Table 2 in Annex F illustrates how multiple regression can beused to estimate the impact of participation in a housing projecton household income. A simple statistical comparison of thecontrol and experimental groups (using the T-Test) found thatincome had increased more rapidly for participants with theimplication that participation in the project may have caused thedifference. However, multiple regression was used in a secondstage of the analysis, and participants and the control groupwere matched with respect to family size, age and education ofthe household head and household income at the start of theproject. The coefficient for the dummy variable "ParticipationStatus" was found not to be statistically significant (there wasa 10% probability of the difference between the two groups havingoccurred by chance). This showed that the apparent effect of theproject was in fact due to the initial differences between thetwo groups.
the effects of the intervening variables. This provides much strongerevidence of a real association between the project and the outcomevariable.
The form of the analysis will be determined by whether related(panel) or independent samples are used. In the former case a singleregression analysis is conducted in which the value of the dependentvariable (impact being estimated) in T(2) is regressed on a set ofvariables, including the value of the dependent variable in T(1). If thedummy variable for project participation is significant, this suggests thatthe project has affected the outcome. However, if independent samples areused, it is necessary to conduct separate analyses for the data from T(1)and T(2). The coefficients for the dummy variable are compared, and ifthey are significantly different, then it is assumed that the project hasaffected the outcome.
c. Use of regression analysis to assess the relativecontribution of different project components (Annex FSection 4).
Many projects, such as upgrading, involve a large number ofdifferent components (water, roads, housing credit, technicalassistance,etc) which households may receive in different combinations.Regression analysis can be used to evaluate the relative contribution ofeach of these components to overall impact. Variables are included in theregression to measure household access to each project service. Thecoefficient of each of the project component variables estimates thecontribution of that component when all other variables are held constant.For example the coefficient for water in Table F-5 of Annex F is 0.2 which

- 75 -
means that when all other components are held constant, each additionalliter of water consumed will be associated with an increase of 0.2 pesos ofhousing investment.
This technique is potentialIy very powerful as it permits acost/effectiveness analysis in which the cost of providing each componentcan be compared with the benefits produced.
d. Interrupted time series analysis
Where time series data is available for a period beginningbefore the project started and continuing through the life of the project,it is possible to compare the trend (slope) before the project began andafter it has started to determine whether a "jump" can be detected. Thiscan either be done through simple observation, or if enough observationpoints are available, through the use of regression analysis.
e. Path analysis to describe the causal Drocess through whichimpacts are produced (Annex F Section 5)
Path analysis begins by developing a diagram to model thecausal process through which it is expected that impacts will be produced.Regression coefficients are obtained for each path, and in this way it ispossible to evaluate the direct and indirect contribution of each componentto the production of the final outcomes. Critics of path analysis stressthat it assumes a recursive model in which all causality is one way, andwhere there is no interaction between different components. Although thisis true path analysis is still a very useful first approximation and hasthe great advantage over more complex models that the analysis is very easyto conduct and intuitively simple for people who are not statisticians tounderstand.
f. Hedonic price analysis
Annex F describes ways in which Hedonic Price Analysis canbe applied to project evaluation. This can be used in the evaluation ofshelter projects to estimate the benefits produced by each projectcomponent.
F. Comparing the Effectiveness of Different Projects
One of the limitations of net impact evaluation for the policymakeris that it estimates benefits without regard to their cost. It isimplicitly assumed that any project which produces the desired benefitsshould be financed. This approach does not directly help the programplanners whose main concern is how to choose between alternatives so as tomaximize social utility with limited resources. Three approaches will bedescribed which can provide an objective basis for choosing betweenalternative projects: cost benefit analysis; cost-effectiveness analysisand cost-utility analysis. The reader is referred to Levin, 1984, for amore comprehensive discussion of the three approaches. Table 4.3summarizes the main stages in the design and application of each approach.Each approach implies a comparison of costs with a measure of effeetivenesa(benefits, output or subjective utility) and before describing each

- 76 -
TABLE 4.3: MAIN STAGES IN THE THREE AP:PROACHES TO EFFECTIVENESS ANALYSIS
Cost Benefit Cost-Effectiveness Cost-UtilityAnalysis Analysis Analysis
1. Define the discount rate 1 1 1
2. Define all costsIdentify project "ingredients" 2 2 2Define who pays each cost 3 3 3Compute shadow price (opportunity cost) 4Estimate cost streams by year 5 4 4Define policy for non-monetized costs 6 5 5Compute present value of each cost (PVC) 6 6
3. Define benefits/outputs/utilityIdentify all benefits 7Decide which benefits can be monetized 8Estimate benefit streams by year 9Monetize benefits 10Compute net benefits by year :1lDefine main outputs of project 7 7Decide which output to use 8Define how outputs will be scaled (O) 9 8Assign subjective weights to each`a output (W) gEstimate probability of occurence (P) 10Compute utility index (U) il
4. Compute effectiveness indicatorsCompute present value of net
benefits 12Compute internal rate of return 13Assign social weights and compute
social analysis 14Conduct sensitivity analysis where
required 15Compute cost-effectiveness indicator
as PVC/O 10Compute cost-utility index as
PVC/U 12

- 77 -
technique we will discuss some of the general issues involved in themeasurement of costs and effectiveness. It is important to appreciate thatthe purpose of these techniques is to provide guidance to the decisionmaker, but they should never be used as the only factor on which decisionsare based.
1. Issues in the definition and measurement of costs
a. It is important to define whether costs are estimated fromthe point of view of society (social or opportunity costs) or from thepoint of view of a particular organization or group. For example, the timeof a volunteer or the value of land donated by another agency, are notcosts for the implementing agency, although they do represent a cost forthe volunteer or the agency donating the land. The concept of sociaL oropportunity costs is important, as a project which is cost-effective forthe implementing agency may have a high social opportunity cost and thus beless desirable from the social point of view than another project.
b. The issue of costs which cannot be monetized is frequently aserious problem. For example, it is difficult to measure the impacts of anurban development project on health, or on the quality of the environment.Costs which cannot be monetized are frequently ignored with the result thatsome projects can appear more attractive than they really are.
c. Costs occur at different points in the project cycle so thatit is necessary to use a discounting procedure to estimate the presentvalue of all costs. The choice of discount rate, which is a policy ratherthan a technical decision, can have a significant effect on the results ofthe analysis.
d. The cost/effectiveness analysis is frequently conducted on apilot project to help management decide which option to chose for a largerfuture project. It is difficult to generalize from a pilot project ascosts are likely to be significantly different from the costs ofreplication on a larger scale. On the one hand the pilot project may berelatively more expensive as it must include research and development costswhich would not have to be repeated. On the other hand a pilot project mayappear to be relatively cheaper as there may be a number of social costsnot covered by the executing agency. Other agencies may provide freeservices such as architects or lawyers, and there may also be volunteersthe value of whose labor is not imputed to the project. Land or buildingsmay also be provided below cost, particularly if the government wishes touse this as a slow project. Finally there is the problem that many of thefactors of production (land, materials and some types of staff) are inshort supply so that theîr cost is likely to increase sharply if the scaleof operations increases. For all of these reasons it is difficult to usethe analysis of the pilot project to make inferences about the relativecost-effectiveness of the different options when they are implemented on alarger scale.

- 78 -
2. Issues in the definition and measurement of benefit_ andeffectiveness.
a. It is important to clariEy the difference between outputsand impacts. Outputs are usually the immediate products or objectives ofthe project (provision of credit, equiping of classrooms and provision ofteachers, meetings with community groups etc). These are intended toproduce certain benefits or impacts on thie target population (for example,generation of employment, improvement of reading skills, greater socialcohesion etc). The fact that the outputs lnave been produced does notnecessarily mean that the project will be successful in producing theintended benefits. As cost-effectiveness and cost-utility analysis bothuse measures of outputs, it is important to keep the distinction betweenoutputs and impacts clearly in mind.
Cost-benefit analysis requires that benefits be monetized sothat benefits and costs of different projects can be compared. Two sets ofproblems constantly occur. First, many benefits are difficult to monetizeand are either ignored or are included in a very arbitrary way. Benefitssuch as improved health, improved environinental conditions, psychologicalsatisfaction, reduced crime or violence are frequently left out of thecalculations, with the result that total benefits may be significantlyunderestimated. Second, economists frequ(ently use imputed rent as a proxyfor total benefits. This is based upon a set of assumptions about perfectconsumer knowledge and free markets which are usually far from true. Inmany cases it is also difficult to obtain a reliable estimate of rent asprojects operate in areas where there is not a free housing market. Forall of these reasons there is frequently a much greater margin of error inthe estimation of benefits than in the estimation of costs, so that theresults of the analysis may be seriously distorted.
c. There are also a number of problems in the measurement ofoutputs. First is the problem of scalability. The way in which cost-effectiveness is estimated usually assumes that outputs are measured on aninterval scale (for example that an increase from 5 to 10 points on areading aptitude test, is the same as an increase from 50 to 55 points).Many outputs are in fact measured on an ordinal scale where theseassumptions about equal intervals are not valid. Second, many projectshave multiple outputs and there is a problem of deciding which output orset of outputs to measure.

- 79 -
3. Cost benefit analysis( described in Annex F)
All costs and benefits are identified and their incidence foreach year of the project life plotted. Table 4.4 gives a simple worksheetwhich can be used with each of the three approaches to identify and assigncosts. A monetary value must then be assigned to each cost and benef'it, sothat net benefits can be computed for each year. A crucial step is then todecide the discount rate to be used to estimate the present value of thenet benefit stream. The choice of discount rate can significantiy affectthe results of the analysis so care must be taken in deciding theappropriate rate. The economic efficiency of each project is then definedeither as the Net Present Value (discounted net benefits) or as theEconomic Rate of Return (the discount rate which makes net benefits equalto zero). If a number of projects are being compared, the project with thehighest ERR or NPV will normally be recommended. If only one project isbeing studied it is considered economically viable if the ERR is higherthan the selected discount rate.
The analysis can be refined by using social weights to assess thedistribution of benefits between different population groups (rich andpoor, young and old etc) or between different types of expenditures(savings and consumption). It is also possible to use sensitivity analysisto assess the effect on ERR of changing the way in which costs or benefitsare measured.
Where it can be used, Cost Benefit Analysis (CBA) is a very powerfulanalytical tool. One of its greatest values is as a teaching device whichforces planners to think more carefully about the assumptions on which theproject is based and of how they define the costs and the benefits. One ofthe most common problems is that important benefits, and sometimesimportant costs, are excluded as they cannot be monetized. This can leadto spurious precision and very misleading results. In general it is moredifficult to estimate benefits than costs, and the outcomes of the analysiscan vary greatly depending on the set of assumptions used to measurebenefits. Because of the problems of measuring benefits CBA has had verylimited application in many social fields such as health, communitydevelopment and education.
Another serious problem relates to the interpretation of thefindings. The cost assumptions used for the pilot project will frequentlynot hold true for a much larger project so that the pilot project with thehighest ERR may not be the best option to choose for larger scalerepiication. The methodology has difficulty in coping with this problem ofreplication.
A final problem is that the methodology assumes a perfect market andperfect knowledge on the part of consumers. In the analysis of many typesof social programs, these assumptions are not valid and this can seriouslyaffect the application and interpretation of the analysis.
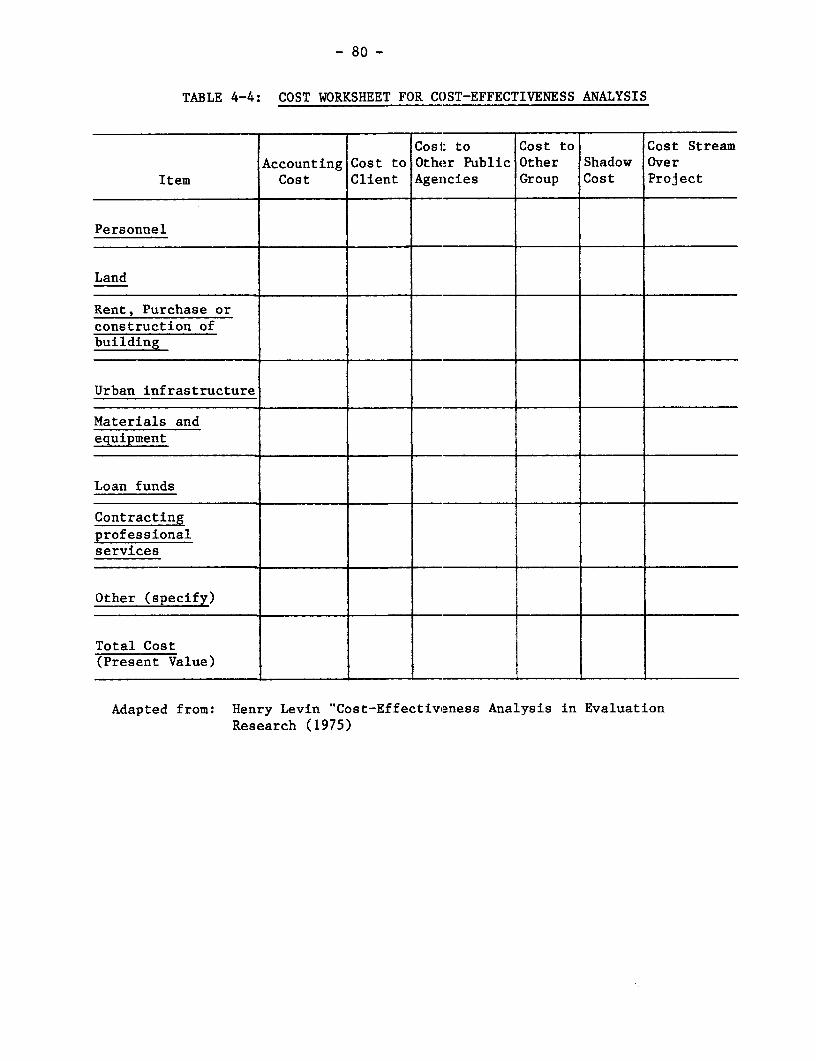
- 80 -
TABLE 4-4: COST WORKSHEET FOR COST-EFFECTIVENESS ANALYSIS
Cosi: to Cost to Cost StreamAccounting Cost to Other Public Other Shadow Over
Item Cost Client Agencies Group Cost Project
Personnel
Land
Rent, Purchase orconstruction ofbuilding
Urban infrastructure
Materials andequipment
Loan funds
Contractingprofessionalservices
Other (specify)
Total Cost(Present Value)
Adapted from: Henry Levin "Cost-Effectiveness Analysis in EvaluationResearch (1975)

- 81 -
4. Cost-effectiveness analysis
The crucial step in this analysis is the definition andmeasurement of the effectiveness indicator (output). It is normally onlypossible to use one indicator so it must be selected carefully. Ideally itshould be measurable on an equal interval scale. The present value ofcosts is computed in the same way as for CBA, and cost-effectiveness ratiosare computed by div'ding costs by the amount of output produced. It isassumed that the option with the highest effectiveness ratio is the onewhich should be selected.
One of the problems with this approach is the comparability of theoptions being studied. Most projects produce a number of differentoutputs, and to compare them in terms of only one output can bemisleading. Scalability is another serious problem. For example,televison might produce larger gains in reading scores for average andsuperior children, but the classroom situation might be more effective forbelow average children. If the project is concerned about backwardchildren, it might be necessary to give a higher weight to improvements inreading scores at the lover end of the scale. The problems of scale andthe difficulties of generalizing from small pilot projects also exist withthis approach.
5. Cost-utility analysis
Costs are computed in the same way as for the previousapproaches, but the method for estimating utility is different. All majorexpected outputs are identified for each project being compared. Managersand policy makers are asked to rate each outcome in terms of its importanceon a scale of (for example) 1 to 10. The weight assigned to each output isthe mean of all the ratings. In some cases the managers and policy makerswill also be asked to estimate the probability of the outcome beingachieved or the amount of improvement which is expected (for example theprobability that households will install a pit latrine). The utilityscore for each output is the weight multiplied by the probability. Someadvocates of this method recommend combining the utility scores for eachoutput so as to obtain a total utility score for each project. TheCost-Utility ratio is then computed as cost divided by utility.
The main advantage of this approach is that it provides a morerational way for planners to select between projects which have severaloutputs. The problem is that the concept of utility is by definitionsubjective and difficult to measure, so that the effects of multiplying andadding utility scores may produce a very misleading result. The danger isthat some policy makers may assign more credibility to the cost-utiiitycoefficients than they deserve.
G. Choosing the Appropriate Strategy for Impact Evaluation
The purpose of an impact evaluation is to assist policy makers onthe selection of future projects and the definition of investmentstrategies. In order to select the appropriate type of impact evaluationit is therefore essential to understand the future decisions which have to

- 82 -
be made and the types of information on which these decisions will bebased. The following are some of the key f'actors which affect the choice ofimpact evaluation design:
1. What are the future options currently being considered andwhat are the key factors which will affect the decision.
The following are some of future policy options which may beunder consideration, each of which has different implications for theevaluation design:
a. A decision is to be made whether to replicate the pilotproject on a larger scale or to discontinue it.
b. The project will be compared with other options in terms ofits ability to achieve one or more clearly defined objectives. The "best"option will be selected for replication in a second project.
c. A decision has already been made to continue the project andthe key issues relate to improving efficiency and effectiveness andensuring the benefits reach the target population.
lIn addition to knowing what types of decisions have to be made, itis also necessary to know some of the key factors on which the decisionwill be based. For example, how important: is the successful production ofimpacts in determining whether a project should continue? How important isthe cost-effectiveness of the project in producing certain types ofoutputs? How important are political decisions relating to, for example,the distribution of the programs throughout the country, or to theaccessibility of the project to certain population groups? All of thesefactors can affect the choice of evaluation design. If it is essential torigorously measure the externt to which certain impacts (increased income oremployment) have been achieved then one of the designs discussed in Section5 may be appropriate. If, on the other hend, the concern is mainly toassess the ability of the project to produce certain outputs (trainingcourses, administration of credit) at an economical cost, thencost-effectiveness may be more appropriate. In those cases where a numberof different projects are being compared i'n terms of their economic impactson a target population, cost benefit analysis may be an option to consider.
2. Time scale
Many evaluations are started when a project is nearingcompletion which obviously limits the types of design which can be used.It is also common for management to require the results within a very shortperiod of time (say three months) which leaves very little option otherthan to use one of the rapid evaluation approaches discussed in Section D.
3. Available resources
Many types of impact evaluation are relatively expensive, sothat where only a small evaluation budget is available, the options willagain be limited.

- 83 -
4. Scale and complexity of the project
The larger and more complex the project, the greater the needfor a rigorous statistical analysis. Whereas the likely impacts of a smallproject with limited geographical distribution can often be assessed with asimple and rapid study; this is usually not possible when the projectinvolves a number of different components and affects tens of thousands ofbeneficiaries with a wide geographical dispension.
5. The nature of the project and the complexity of its objectives.
Some projects are mainly concerned to produce a limited numberof easily measurable outputs (for example reading improvement or smallbusiness credit). On the other hand, other projects seek to produce abroad range of social and economic changes (for example a squatterrelocation program). In the latter case it is more important to include aqualitative component in the evaluation to ensure that the complex socialand psychological effects of the project are well understood.
6. The need for a multi-method approach
The need for a multi-method approach is as important for impactevaluation as for any other type of study. Many of the approaches userelatively sophisticated types of analysis (multiple regression, economicrates of return, cost-utility ratios, etc.) all of which are based on theassumption that impacts, benefits, outputs or utility have been accuratelymeasured. In most cases the indicators are extremely difficult to measureand estimates can vary widely according to the definitions and measurementtechniques used. It is strongly recommended that all key variables aremeasured by at least two independent methods. It is also recommended thatstatistical analysis always be complemented by qualitative techniques inorder to understand the meaning of the statistical results and theirimplications for the target populations affected by the project.

- 84 -
CHAPTER 5
MANAGING THE EV&LUATION
A. The Monitoring and Evaluation Functions and Needs of DifferentOrganizations
Figure 5.1 illustrates the main organizations involved in themonitoring and evaluation of a typical urban development project:
1. Most urban development projects come under the responsibilityof a government ministry (Planning, Interior, Urban Development) which isresponsible for coordination and supervision. In some cases the ministrymay be a passive recipient of monitoring data, but in others is activelyinvolved in designing and helping implement a wide range of monitoring andevaluation studies.
2. In all countries there is a government agency (usually theministry of finance) responsible for monitoring financial performance ofall projects. Monitoring is often limited to standard auditing but in somecases the cost-effectiveness techniques described in Chapter 4 are used. Ina number of developing countries the legislative branch is beginning tocreate its own watchdog agencies such as t:he Programme EvaluationOrganization in India (see World Development Report, 1983). As pressuregrows to achieve maximum utility from scarce resources, cost-effectivenesswill become an increasingly important tool for project monitoring.
3. Many projects involve a large number of specialized agencies inareas such as housing, low-cost sanitation, small business development,community health, transport and cooperatires, each with some monitoring andevaluation responsibilities.
4. Many government agencies subcontract all or part of theirevaluations to national or international consultants, and when interest inevaluation grows there will usually be a corresponding increase in thenumber of consulting organizations.
5. Multi-city urban projects are usually coordinated and managedby a local project coordinating agency (PCA) such as a municipaldevelopment corporation which, in a large project, may be responsible formonitoring several hundred project components. Once the performancemonitoring system is in place, PCA manageiment becomes interested inreceiving rapid feedback on problems arisiLng during the implementationprocess.
6. The execution of the project Ls the responsibility of a seriesof local implementing agencies (LIA) such as a small business developmentfoundation, the municipal sanitation department, local office of thenational housing bank etc. These agencies are required to providemonitoring reports to the coordinating ag,ency (PCA) and often to theappropriate sectoral agency.
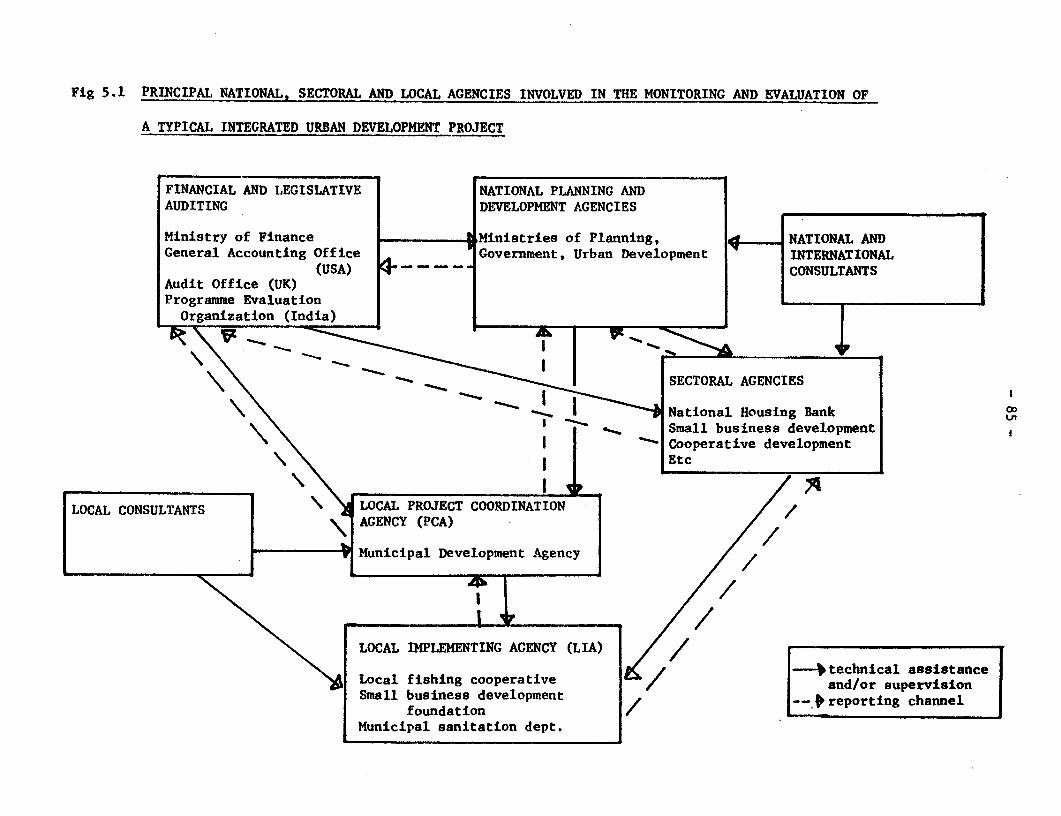
Fig 5.1 PRINCIPAL NATIONAL, SECTORAL AND LOCAL AGENCIES INVoLVED IN THE MONITORING AND EVALUATION OF
A TYPICAL INTEGRATED URBAN DEVELOPNENT PROJECT
FINANCIAL AND LEGISLATIVE NATIONAL PLANNING ANDAUDITING DhVELOPNENT AGENCIES
Ministry of Finance t,Ministries of Planning, NATIONAL ANDGeneral Accounting Office Government, Urban Development INTERNATIONAL
(USA) CONSULTANTSAudit Office (UK)Programme EvaluationOrganization (India)
SECTORAL AGENCIES
National Housing Bank CSmall business development
\ I _ Cooperative developmentEtc
LOCAL CONSULTANTS LCLPROJECT COORDINATION//\AGENCY (PCA) /
Municipal Development Agency
LOCAL IMPLEMENTING ACENCY (LIA)
Local\fihing cooperative technical assistance> Local f shing cooperative / and/or supervisionSmall business development -- f>reporting channel
foundationMunicipal sanitation dept.

- 86 -
7. Finally use is often made of locally hired consultants whoassist in the design of the monitoring system or who conduct evaluationstudies for the local implementing or coordination agencies.
The following sections will discuss the issues and options involvedin the design and organization of monitoring and evaluation for each ofthese groups. However, before beginning this discussion, the question mustbe asked as to whether it would be possible to centralize monitoring andevaluation in one specialized agency rathetr than having so many differentorganizations involved. There are several factors which make it difficultfor monitoring and evaluation to be completely centralized:
a. Each agency requires information it can trust and which itknows has been collected to respond to its own particular needs. Thecooperation required to study delicate isstues such as interagencyconflicts, poor organizational performance and lack of community support,will only be given if the agency is able to control how the informationwill be used and disseminated.
b. Experience has proved thaLt there is no such thing as acomprehensive objective study which can cover all issues in an unbiasedway. A study must be designed for a specif'ic purpose if it is to providethe information needed by a particular client. A general purpose studyusually does not fully satisfy the needs of any of the prospective clientsas the right information has not been collected and the right analysisprepared.
c. There are frequently potential areas of conflict betweenagencies due to competition for resources or different politicalallegiancies. Under these circumstances, each agency seeks to controlaccess to information on its performance.
d. Finally, the evaluation program must have the speed andflexibility to respond rapidly to the information needs of the organizationit services. In practice this cannot be done, unless the evaluation unit isdirectly controlled by the project manager.
B. Organizing Monitoring and Evaluation at the Project ImplementationLevel
Urban projects usually comprise a number of different componentssuch as sites and services, maternal and child health or artesan credit,each of which is implemented by a different project implementing agency(PIA). This section discusses how the monitoring and evaluation of eachcomponent should be organized.
i. The use of consultants(Note: the following discussion is equally applicable to theuse of consultants by other t:ypes of agencies)
a. General guidelines on the use of consultants
The manager must decide which parts of the monitoring andevaluation should be conducted in-house, aind which should be subcontracted

- 87 -
either to local consultants or to another government agency. It isrecommended that Performance and Implementation Monitoring should normallybe conducted in-house, although this does not preclude some involvement ofconsultants.
The use of consultants brings a number of advantages,including access to specialized research skills, a greater degree ofobjectivity, and greater flexibility in the employment of staff ard the useof financial resources. From the administrative point of view, the use ofconsultants also has the great advantage of avoiding the creation of alarge permanent staff. The benefits are discussed in more detail below.
However, the use of consultants also has a number ofpotential disadvantages (see Box 5-1). Outsiders are often perceived as athreat and it is difficult for external consultants to establish therapport and daily contact with the project staff which can be achieved byan internal unit. An external evaluation is usually much more expensive,and does not develop an internal research capability, hence creating acontinuing need for outside consultants in future projects. Finally, asconsultant contracts usually specify very precisely the scope and durationof work, many consultants do not have the flexibility to adapt to changingmanagement information needs (Box 5-2).
The following are some of the ways in which consultants can be usedwithin a general policy of developing in-house evaluation capability:
i. A full or part-time adviser may be contracted, often as partof the technical assistance package provided by a lending agency or donor.It is important to ensure that the advisor does not become the de factodirector of the evaluation unit. An advisor may impose his or her ownresearch scheme, which, although technically sound, does not respond to theneeds of the organization or the technical capabilities of the evaluationunit. The ability and willingness to train local staff should be animportant factor in the selection of the adviser. Box 5-3 gives an exampleof the use of long-term consultants in an IDRC-World Bank sponsored threecountry evaluation.
ii. Consultants may sometimes be contracted at the beginning of anevaluation to assist in the design of the instruments and the systems fordata analysis.
iii. A consultant may be contracted to provide technical assistanceon specific topics such as sample design, data analysis or report writing.The objective should again be for the consultant to help train local staffto take over these activities.
iv. Consultants may assist in the selection and training ofevaluation staff.

- 88 --
BOX 5-1 TYPICAL PROBLEMS WHEN MONITORING AND EVALUATION ISSUBCONTRACTED TO OUTSIDE CONSULTAITS
In one of the early World Bank urban projects, the design andimplementation of the monitoring ind evaluation system wassubcontracted to a newly formed group of local consultants. Thequality of many of the reports was technically very good, but inmost cases had very little operational impact for the followingreasons:
a) The executing and coordinating agencies had nomechanisms for reviewing the reports so that long delaysoccurred bef ore the recommendations were acted on.
b) The government agencies dicl not have an experiencedresearcher who could coordinate wiLth the consultants andinterpret their work for the executing agencies.
c) To avoid controversy the consultants avoided makingdirect recommendations or drawing attention to delicateissues. For example, they left it to the reader to assess thepolicy implications of the high level of illegal sublettingwhich was detected.
d) The reports vere not presented in a very operationalway and contained more detail than the average manager was ableto absorb.
e) The consulting group, which vas quite small,encountered personal and financia:L problems which resulted inthem losing some of their key staiEf. Due to this they were notable to complete their contractuaL obligations or toprepare a final report.
f) None of the staff of the executing or planningagencies received any training or guidance in evaluationtechniques f rom the consultants, and 5 years after theconsulting contract began, it was still necessary to look toprivate consultants to conduct ev(en the most basic evaluationstudies.
v. Specific studies may be sub-contracted. Examples of suchstudies include:
- Studies which require special methodologies such assophisticated economic or financial analysis.
- Studies which require the conducting of large samplesurveys which are beyond the experience or resources of theevaluation unit.
- In-depth anthropological studies of particular communities.- Studies intended to provide an independent "objective"
perspective on the project (see following section).
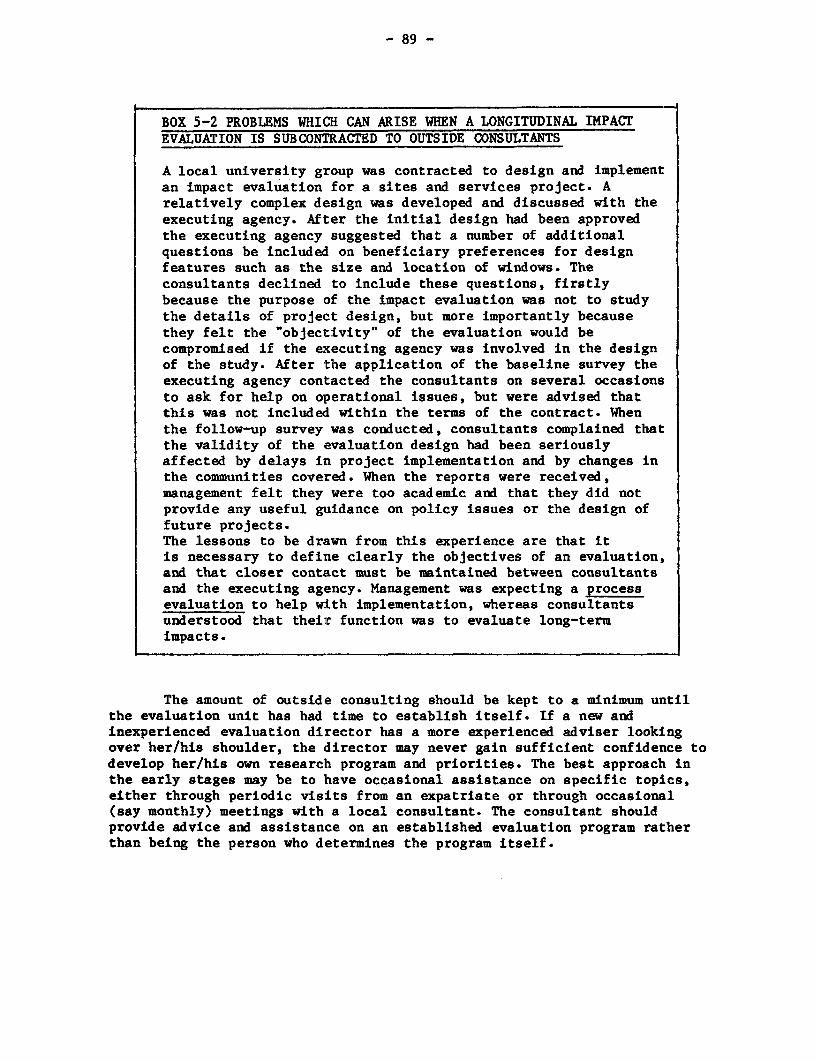
- 89 -
BOX 5-2 PROBLEMS WHICH CAN ARISE WHEN A LONGITUDINAL IMPACTEVALUATION IS SUBCONTRACTED TO OUTSIDE CONSULTANTS
A local university group was contracted to design and implementan impact evaluation for a sites and services project. Arelatively complex design was developed and discussed with theexecuting agency. After the initial design had been approvedthe executing agency suggested that a number of additionalquestions be included on beneficiary preferences for designfeatures such as the size and location of windows. Theconsultants declined to include these questions, firstlybecause the purpose of the impact evaluation was not to studythe details of project design, but more importantly becausethey felt the "objectivity" of the evaluation would becompromised if the executing agency was involved in the designof the study. After the application of the baseline survey theexecuting agency contacted the consultants on several occasionsto ask for help on operational issues, but were advised thatthis was not included within the terms of the contract. Whenthe follow-up survey was conducted, consultants complained thatthe validity of the evaluation design had been seriouslyaffected by delays in project implementation and by changes inthe communities covered. When the reports were received,management felt they were too academic and that they did notprovide any useful guidance on policy issues or the design offuture projects.The lessons to be drawn from this experience are that itis necessary to define clearly the objectives of an evaluation,and that closer contact must be maintained between consultantsand the executing agency. Management was expecting a processevaluation to help with implementation, whereas consultantsunderstood that their function was to evaluate long-termimpacts.
The amount of outside consulting should be kept to a minimum untilthe evaluation unit has had time to establish itself. If a new andinexperienced evaluation director has a more experienced adviser lookingover her/his shoulder, the director may never gain sufficient confidence todevelop her/his own research program and priorities. The best approach inthe early stages may be to have occasional assistance on specific topics,either through periodic visits from an expatriate or through occasional(say monthly) meetings with a local consultant. The consultant shouldprovide advice and assistance on an established evaluation program ratherthan being the person who determines the program itself.

- 90 -
BOX 5-3 AN EXAMPLE OF THE USE OF LONG-TERM RESIDENT CONSULTANTSTO ASSIST IN THE DESIGN AND IMPLEMENTATION OF THE EVALUATION
The IDRC-World Bank evaluation of urban shelter programs
In 1975 the IDRC ard World Bank agreed to finance a 5 yearevaluation of 3 of the first Bank financed urban shelterprograms. In each country (Zambia, Senegal and El Salvador) anevaluation unit was established wiLthin the project executingagency, and an expatriate consultant was contracted to beresident advisor for a period of between 1 and 3 years. Some ofthe consequences of the long-term involvement of the advisorsvere the following:
(a) More sophisticated evaluation designs were usedthan would have been developed by local researchers.
(b) The initial evaluation designs responded moreclosely to the interests of the World Bank than to those of theexecuting agencies. In particular more emphasis vas placed onlongitudinal impact studies and less on process evaluation.
(c) The presence of the advisor provided easier accessto senior management and gave the evaluation more prestige andinfluence than it would have had under the direction of a lesstrained local researcher.
(d) There was a feeling, in some, but not all, of thecountries, that the evaluation uniLt was reporting to the WorldBank and not to project management:, and in one case thisresulted in considerable distrust and marginalization of theevaluation.
(e) The advisors were able ta provide a more rigoroustraining to local researchers than would have been possiblethrough periodic visits. This als0 had considerable multipliereffects as the advisors became involved with local universitiesand in providing assistance to a wide range of nationalorganizations.
(f) The advisor was able to act as an intermediarybetween the executing agency and ithe World Bank on a number ofoperational and research issues.
b. Using consultants to provide an independent("objective")perspective
One of the potential dangers of an in-house evaluation is aloss of objectivity. Organizations tend ltO perceive the world in terms oftheir own objectives, and although they may conduct very rigorous analysisof how vell these objectives are achievedl, they may never question theirappropriateness. For example, a shelter project may rigorously evaluate the

- 91 -
speed and cost of production of shelter units, but may never question thevalue of these units as an effective way to improve the welfare oflow-income households. An important function of outside consultants iL toevaluate the objectives and underlying assumptions as well as theoperational procedures.
Another role of the consultant is to help assess the actual andpotential impacts of the project on the low-income population and on localand national development policies. Project management is frequently goinvolved in the day to day project activities, that they find it difficultto stand back and review potential replicability. For example, a specialproject unit may be set up to ensure that the pilot project is successful.This unit may create antagonisms (because of higher salaries or priorityattention) which may make it difficult for the project to be replicated. Anoutside consultant will often be able to see this conflict more clearlythan project management. Organizations often enter into alliances andconflicts with other agencies and groups, and it is easier for an outsiderto assess the implications for project implementation.
The consultant can also serve as a communication link betweenimplementing agencies and project beneficiaries. Managers frequentlyreceive limited and distorted feedback on beneficiary reactions oftenthrough the members of a small and unrepresentative community junta, orfrom project technical staff who see their job as selling the community onan already designed project rather than listening to the community.Managers frequently react defensively to any criticism and may discouragefeedback through bureaucratic procedures which make beneficiaries feeluncomfortable (for example all meetings may take place in the projectoffice in the city center). The consultant is not subject to theseorganizational constraints and is able to listen to and understand thepoint of view of all of the main sectors of the affected populations andcommunicate these views to management.
2. Locating the evaluation unit in the organization
a. Alternative organizational structures
Figure 5-2 presents 4 organizational options formonitoring and evaluation. In Model 1, there is a single monitoring andevaluation unit which reports to one of the operating divisions. Theproblem here is that the research will be subordinate to one division andwill not be able to examine broader issues affecting other divisions, or toinfluence general policy of the organization.
In Model 2, the monitoring and evaluation unit reports directly tothe general manager. This option permits the research unit to conductgeneral studies of a project's efficiency and impact. A potential problemis that the evaluation may become too remote from the operating divisions.
In Model 3, two separate units have been created; an impactevaluation unit reporting directly to the general manager and a monitoringunit under one of the departments. This has the advantage that themonitoring unit can respond directly to operational needs, while the impact

- 92 -
FIG 5-2: ALTIVe CeGN]«=Io6AL SI11LR FR THE IRURIM ANDEVAI1JfICN CF A QE{-C]r' PR 1«JE IDPI AGLUY
E1eral
Nmwger
Divisions
E±J± Li±E±
?t>nitoring and EvaluatioE (MMe) reporting to one of the operating divisions.
I~ IDivisioeu
Monitoring and Evaluation WUit (MID) reports directly to the (-neral Mnager.

-93 -
ig 5-2: (aet1.d)
MDdel~ 3
Generaltnù a"to
%hnager UJ *altatlonunit
Divisions
Evaluation Udit [EU] reports directly to GaCeral Mmnager and is saæt1ixguided by a Steerfrg omittee. The Mxnitorlng Ihit [MI reports toane of the operating divisions.

- 94 -
Flg 5-2: (conclurhd)
l i l _ SteeringTCOomittee
GeneralMiJager U Evaluation
Mlnitoring Unit Unit
Divisions fi
Separate Evaluation [EU] and Mbnitorlng [MU] units, each ofwhich reports directly to the Géneral M1nager.

- 95 -
evaluation unit can conduct more general and long-term studies. A potentialdanger is that the separation of functions may lead to a lack ofcoordination, with either a duplication of functions or certain importanttypes of study not being conducted. For example, potentially importantmedium-range studies such as reasons for poor cost recovery or efficiencyof mutual help construction groups, may be difficult to conduct becausethey do not fit into the terms of reference of either unit.
In Model 4, both the evaluation and monitoring units report directlyto the general manager. This model permits greater objectivity andflexibility of hiring staff, but it runs the risk of making the evaluationtoo remote from the operational needs of the organization. This model canalso be used when part of the evaluation (usually the impact studies) issubcontracted to consultants.
In selecting the appropriate organizational model, the followïngguidelines should be kept in mind:
** For the evaluation to be operationally useful, senior managementmust participate actively in the planning and review of theevaluation program. If the evaluation is relegated to a lowerlevel of the organization or is located within one of thespecialist divisions it vill automatically lose most of itseffectiveness.
** In a small organization the evaluation unit should probablyreport directly to the General Manager.
** In a larger organization, such as a national housing authority,which is responsible for a number of different housing projects,the decision is more difficult. If the evaluation unit reports tothe General Manager (or Executive Staff) it may be too farremoved from the project. If, on the other hand, it reports to aspecific project manager or department head, then access tosenior staff is reduced. Where there are two or more separateevaluation exercises relating to different projects, the solutionmay be to have a amall central advisory staff reporting to SeniorManagement, and a special evaluation unit reporting to themanager of each project being evaluated.
** A balance must be achieved between the requirement of objectivity(and, hence, a certain distance from the day-to-day activities)and the need to maintain close contact with operationalactivities.
** The evaluation must be able to conduct both basic monitoringstudies and more general impact and policy studies. This caneither be achieved by having two units, or by specializationwithin one unit. Where there is specialization it is important toavoid problems of coordination and communication.

- 96 -
** Autonomy may be required to provide the necessary administrativeflexibility to contract high grade staff, but it is essential toavoid forming an elite which creates resentment and which is hardto reintegrate into the organization in the future.
** Box 5-4 compares projects which combined and had separatemonitoring and evaluation units so as to demonstrate the relativemerits of each approach.
BOX 5-4 THE MERITS OF SEPARATING OR INTEGRATING MONITORINGAND EVALUATION UNITS
Comparing the experience of urban projects in Zambia andSenegal
** In the evaluation of the First Urban Project inZambia, an evaluation unit was established with World Bank-IDRCfunding. At the same time, an already existing monitoring unitreported directly to the project director. The main function ofmonitoring was to provide rapid studies, usually conductedwithin a month, which were a direct response to managementrequests. These studies tended to be descriptive with verylittle analysis, but were considered by management to be veryuseful. On the other hand, the evaluation unit, which had lessdirect contact with management, was more concerned withlongitudinal impact and more general studies. An advantage ofthe separation of the two units was that the functions of eachunit were clearly defined which helped develop expertise inparticular fields and the production of a high output in eacharea. Some of the disadvantages were a lack of coordinationbetween the two units, and relatively little cooperation onstudies or exchange of information. It also meant that neitherunit systematically monitored the efficiency of projectimplementation.
** In the First Sites and Services Project in Senegal,the Bureau d'Evaluation was responsible for both monitoring andevaluation, and was able to produce a considerable output ofboth types of study. Partly due to this integration, there werea number of process evaluations conducted, which in fact provedto be some of the most useful studies. Data from monitoringstudies was built into the impact evaluations, and vice versa.
b. Should a special evaluation unit be created?
It is sound organizational procedure to avoid the creation ofadditional units which increase overheads and produce bureaucratic delaysand problems of control. In addition, if a special evaluation unit iscreated with outside funding and special employment conditions, it mayprove difficult to re-integrate the staff of this unit into theorganization when the pilot project ends.

- 97 -
A further pro1lem is that the relative autonomy of an independentunit may also mean that it is financially weak, as it may not have directaccess to government funding. In several cases these special units haveexperienced long delays în paying staff and meeting other expenses whilewaiting for the special funding to arrive.
On the other hand, there are a number of reasons why an autonomousevaluation unit may be recommended. Where the evaluation program is verylarge it becomes almost essential to create a special unit. The autonomy ofthe special unit can also provide more independence and objectivity as theevaluation is not controlled by any one department. The greater auton,omymay also permit greater flexibility in hiring staff (offering moreattractive salaries, etc.). Although this may create long-run problems ifthe unit has to be re-integrated, there are many countries where it wouldbe impossible to attract good research staff if only public administrationsalaries could be offered.
c. The role of a steering committee
A Steering Committee, which oversees Monitoring and Evaluation,can have a number of important functions. The first is to provide technicalguidance in the design and review of studies by including representativesfrom the local universities as well as researchers from other governmentagencies. Second, many projects have four or more agencies involved indifferent stages of the Implementation process and the Steering Committeecan provide a way to ensure their interests are represented in theresearch. Third, representatives can be invited from organizationsinterested in using the evaluation findings (Ministry of Planning, etc.).Finally, the Steering Committee can ensure a certain degree of objectivityof the research. It is important not to make the Steering Committee solarge as to become ineffective; nor should it put unnecessary barriers inthe way of report publication.
C. Organization of Monitoring and Evaluation for the ProjectCoordinating Agency (PCA)
1. Distribution of monitoring and evaluation functions betweenthe project coordinating agency and the implementing agencies.
There is no single best way to distribute monitoring and evaluationfunctions between the PCA and the implementing agencies because projectsare organized in different ways; vary in size, areas covered, and in thenumber axnd research capacity of the organizations involved. (Box 5-5illustrates the organizational complexities of monitoring and evaluation ina large, multi-city project in Brazil, and identifies some of the manyfactors which influence the distribution of evaluation responsibîlities).Where implementing agencies have only a limited research capacity the PCAwill be required to assume a greater responsibility for monitoring andevaluation. This may be done by designing manuals and guidelines, bycontracting consultants or by directly conducting some of the studies.PCA's also vary in their research capacity 80 that in some cases they maybe a relatively passive recipient of monitoring studies, whereas in othersthey may initiate a wide range of impact and cost-effectivenessevaluations. The functions of the PCA are likely to include:

- 98 -
BOX 5-5 THE ORGANIZATION OF A MONITCIRING AND EVALUATION SYSTEMFOR A COMPLEX, MULTI-CITY PROJECT
The First Medium Cities Project in Brazil
The Medium Cities Project (CPM) is a, complex project coveringmore than 10 cities throughout Brazi.l. The project iscoordinated from Brasilia by the Urbian Development Council(CNDU) of the Ministry of the Interior, with technical inputsfrom various federal sectoral agencies in the fields of labor,fishing, small businesses etc. In each city there is anexecuting agency (UAS) which is responsible to a city or statelevel agency. Each UAS has an evaluation unit and a budgetallocation whose use has to be approved by CNDU. The evaluationstaff are directly responsible to thLe director of the UAS butreceive technical assistance and some supervision from CNDU.Consulting services are provided on design and analysis bylocally contracted consultants and through 2 World Bankconsultants who coordinate with CNDU. Some of the lessons fromthis experience are the following:
(a) Evaluation organization must be flexible and adaptto varying conditions at the city level.
(b) Flexibility and speed of implementation of theevaluation studies was considerably delayed by the need to seekapproval for all studies from CNDU and often one of the federalsectoral agencies, both in Brasilia. The studies would havebeen much more responsive to local management needs if the UAScould have had direct control over a discretionary budget.
(c) The Bank consultants had a useful role in givingpriority to more rapid, operationally useful studies and inspeeding up the approval process. Thteir role was also useful in"selling" many of the more controversial studies to managementand in giving support to the evaluation units.
(d) It proved difficult to establish clear evaluationpriorities as each UAS, federal agency and CNDU had their ownlist of priority issues. The latter two tended to independentlyrecommend studies to the UAS so that the evaluation unitstended to become overloaded with data collection and developeda back-log of unanalyzed data, and uncompleted reports.
(e) Conferences and periodic meetings of evaluatorsfrom each city vere organized by CNDU and proved useful inseeking uniformity of methods and procedures.

- 99 -
a. Assistance in designing the monitoring and evaluation system.
b. Providing technical assistance and possibly direct staff andfinancial support for conducting studies.
c. Assistance in selecting and supervising consultants.
d. Direct responsibility for conducting some of the more complexstudies, or other types of needed studies which are outside the capacity ofthe local agencies.
e. Training of evaluation staff.
f. Assistance with report preparation and dissemination.
Figure 5-3 presents two possible ways to organize monitoring andevaluation at the level of the PCA. In Model 1 each implementing agency hasits own monitoring and evaluation unit which conducts performance andimplementation monitoring, and possibly impact evaluation studies. Thescope and complexity of the studies is likely to vary considerably from oneagency to another within the same project. With this model the functions ofthe central evaluation unit (located in the PCA) may be limited tocoordination and the preparation of summary reports or the data from thePIA's may be used as part of a more complex monitoring and evaluationprogram conducted by the PCA.
In Model 2 the PCA plays a more active role and has both amonitoring and an evaluation unit. It may be more directly involved in thedesign and implementation of the monitoring studies, as well as with impactevaluations and cost-effectiveness studies.
The major issue with both of these models is to determine howevaluation responsibility should be divided between the coordinating agencyand the executing agencies. The decision will partly depend on thetechnical capacity and interest of each agency. The following guidelinesare suggested:

- 100 -
FHg 5-3: Alterntive a ti structures for the mnitoring andevaluation of a a l.gti-compoet urban projeet
LCooilinstir SteerirgAgency cauittee
CentralEvaluation
Unit
Unit ~ ~ ~ ~ Ui ui
A Central Evaluation Unit, gwdde by a Steexlig CoeËttee, is respooeiblefor the. desilp aid coordirmtl.oe of tii. emlahtlon of tii. program arid forthe. preparation cf tihe prograrL evlaltimo reports. This unit reportsdirectly to the Coordiatiog Agemiy. A MoniitoriiM [avd Evaluntion] Units1hiuld be establisah in leach inm1ountixg agercy. nei Mcxitorlog Unlteare Illkely to mry In size ani toehnioal caopetence atd thie CentralEulumtion Unit my be req~uirei to prom1e technlcal asslstace. ardIn mm oeae direct logistical support.

- 101 -
Fig 5-3: (cont1me)
EHfcoeenmti%l| Steerirlg
I MC l | |Caittoee
MaidtorinB Emalumtlnit Unit
Agmie8bb C
SimLIar to Malel 1 em:ept that two separate units, the umitoring mnitanl the inact evaluati«e unit, ns report to the Central Coodimtirg.ency. Ihis m=del viii typicaliy be use lan larer ard nDre caoplexcprograu were nrre celec lniact studies my be undertaken.

- 102 -
a. at least basic monitoring activities should be assigned toeach executing agency as it is important for them to considerthe evaluation as a management tool rather than as externalsupervision.
b. technical assistance and possibly staff may have to beprovi ed to help the executing agencies with the design,analysis and possîbly the implementation of monitoring andevaluation.
c. the amount of monitoring and evaluation activity is likely tovary from one agency to another. In some cases, only verybrief statistical documentation will be prepared, whereasother agencies may be able to undertake more complex research.
d. overall coordination and technical assistance should probablybe the responsibility of the central coordinating agency. Thisagency should also be responsible for any more complexstudies.
e. the guidelines presented in Section A can be applied.
D. Monitoring and Evaluation by Sectoral Agencies
Sectoral agencies such as a national housing bank, or small businessdevelopment agency, are responsible for design of new projects, monitoringof implementation and evaluation of performance. These agencies must bothmonitor and provide technical support to the implementing agencies andconduct comparative and impact studies to help define future policy. Insome cases they may initiate rigorous impact or cost-effectivenessstudies. Some of the alternative modes of operation are the following:
1. The agency vill have its own staff, including interviewers,who conduct and analyze the studies. This permits the agency to developspecialized skills, provide policy guidance to other organizations andconduct systematic comparisons of project performance in different citiesand economic contexts. In order to develop a standardized methodology thesectoral agency muet be prepared to take an active role and initiate acertain number of comparative studies. This approach has the problems thatcentrally designed studies tend not to be responsive to local conditions,and thaf local agencies resent not being sufficiently involved.
2. The agency subcontracts major studies to outside consultantssuch as local universities. This has the advantage of involvinguniversities in project development and can also provide access to expertsin particular fields. One potential problem is the lack of involvement oflocal implementing agencies which can lead to resentment as well asaffecting the quality of the work if the local experience is not used.Secondly there is a potential danger that the studies may become tooacademic and not sufficiently operational.

- 103 -
3. The studies are conducted by the local implementing agencieswith technical assistance and some direct staff inputs from the sectoralagency. This approach has the advantage of fully involving the localagencies and makes it more likely that the results vill be used. A commonproblem is that inadequate support is provided by the sectoral agency andthe local agency is not able to adequately conduct and analyze the study.The greatest difficulty is often in the analysis stage, and it is commonfor many reports never to be produced due to lack of experience orresources to conduct the analysis. Another problem is that scarce localagency resources may be diverted to the evaluation, vith the result thatproject implementation is negatively affected.
The best evaluation strategy will usually combine elements ofthese three approaches. The local agencies should be actively involved inthe design, supervision and review of all studies, but a careful reviewshould be made of their level of direct involvement in the implementation.Some involvement is a useful learning experience, but it is unrealistic toassume that local staff with limited research experience will be able tocompletely manage a complex study. It is particularly important for thesectoral agency to ensure that adequate provision is made for analysis andreport preparation. An important advantage of the independent outside studyis that it can permit a greater degree of objectivity, which can be veryimportant when the performance of the project is affected by a set of localcircumstances which it may be difficult for local staff to perceive orcomment on.
E. Organization of Monitoring and Evaluation at the National Level
1. National urban development agencies
The responsibility for urban development policy usuallyinvolves the Ministries of Planning, Interior and in some cases UrbanDevelopment. Traditionally the responsibilities of these agencies werelimited to the coordination and monitoring of ongoing projects with newprojects evolving as an uncoordinated response to current political andeconomic pressures. However, many countries are now seeking to develop morecoherent and integrated national development strategies and consequentlythe functions of these agencies are being broadened. In the example givenin Box 5-5 a National Urban Development Council, with overallresponsibility for the definition and supervision of a national urbandevelopment qtrategy, was established within the brasilian Ministry of theInterior. Some of the typical functions of these development agencies arethe folloving:
a. Developing and supervising a monitoring system to beimplemented by the PCA or implementing agencies and which can provide rapidfeedback to local and national management on all project components. Thishas been a difficult task as many monitoring systems have proved timeconsuming and cumbersome to use, vith the information being produced tooslowly to have much practical utility to project managers. A usefulfunction of the national agency can be to sponsor special studies to testnew approaches (such as participant observation or methods for conductingrapid feedback studies).

- 104 -
b. Where local resources and experience are very limited, anevaluation coordinator may be assigned by the national agency to work inthe PCA in a particular city. This person would be trained, paid, and, tosome extent, supervised by the national aLgency. It is important that thework of the coordinator is directly supervised by the local PCA and that asmuch data as possible is provided by staff of the local agency.
c. Coordination is a vital, but frequently neglectedfunction, which needs to be carried out at various levels. First, theefforts of the sectoral agencies must be coordinated to ensure uniformapproaches, avoid duplication and ensure that excessive numbers of studiesare not being requested from the local project units. Second, allevaluation efforts must be coordinated within each city to avoid eachcomponent being studied in isolation and without consideration of how itaffects, and is affected by, the other components. Third, meetings andother forms of interaction must be arranged between evaluation units ineach city.
d. Developing and implementing studies to evaluate the impactor cost-effectiveness of different projet-te. This is an essential functionif systematic information is to be obtained on which an urban developmentstrategy can be based. Examples of these studies can include:
i. Impact evaluations to determine whether projects areable to produce the intended effects on the socio-economic conditions ofthe target population. For example, a study to estimate the impacts ofsquatter upgrading on health, housing quality and household income.
ii. Cost-benefit analysis to compare the costs andbenefits of alternative strategies. An example ls the study of low-costhousing options in El Salvador in which ithe economie rates of return of 9projects were compared.
iii. Cost-effectiveness analysis in which projects arecompared in terms of their ability to achieve a stated output. For example,different methods of health delivery can be compared in terme of the coetper patient attended.
2. Finance ministries and legislative watchdogs
In all countries the ministry of finance or the treasury hasbasic mLnitoring functions related to costs and expenditures of projects,and to their implications for cash flow and receipts of disbursements frominternational loans. In some countries tlhese functions are conducted by theexecutive branch, but in an increasing nuamber of cases the legislature hascreated its own monitoring agency. Probalbly the most systematic legislativewatchdog, in this respect, is the US General Accounting Office (GAO) whichis charged with the responsibility of monitoring and evaluating the use ofall federally authorized expenditures. The GAO initially used traditionalaccounting and auditing approaches but since the Sixties has conductedrigorous program review to measure the impacts as well as thecost-effectiveness of government expenditures. Box 5-6 is an example of atypical GAO impact evaluation report. This evaluation, of the effects ofbudget reductions (Budget Reconciliation) on incomes and labor force
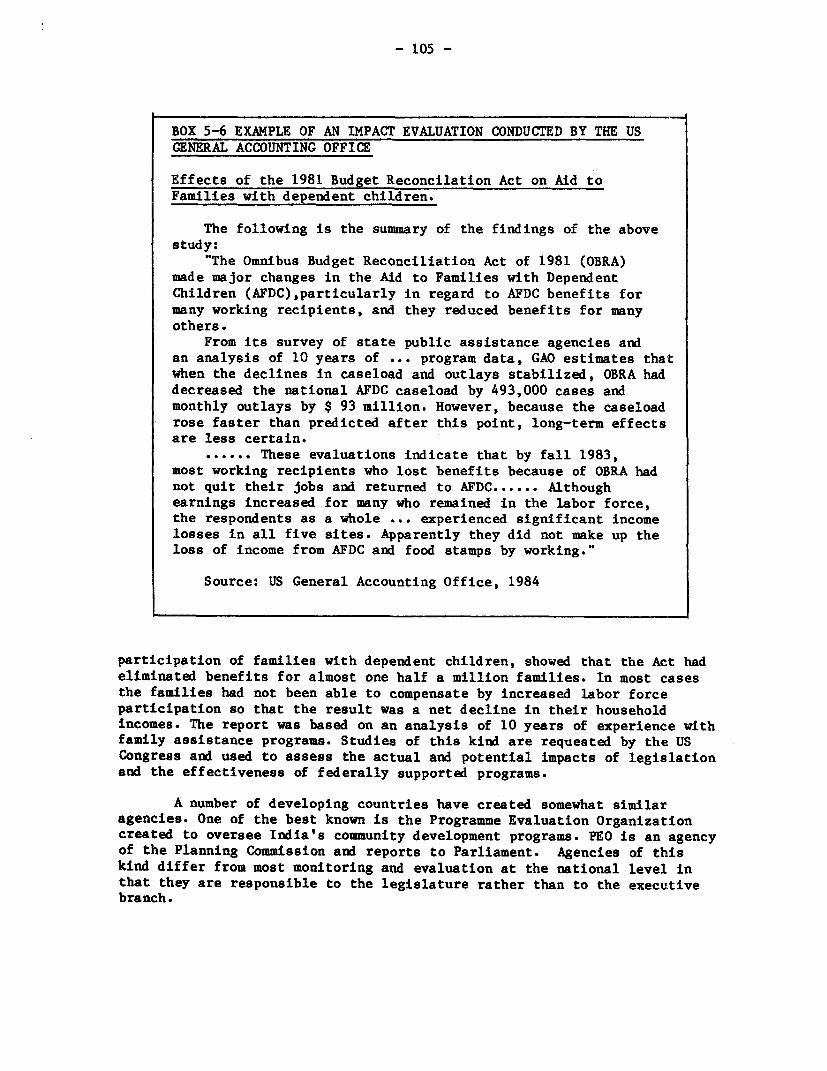
- 105 -
BOX 5-6 EXAMPLE OF AN IMPACT EVALUATION CONDUCTED BY THE USGENERAL ACCOUNTIN& OFFICE
Effects of the 1981 Budget Reconcilation Act on Aid toFamilies with dependent children.
The following is the summary of the findings of the abovestudy:
"The Omnibus Budget Reconciliation Act of 1981 (OBRA)made major changes in the Aid to Families with DependentChildren (AFDC),particularly in regard to AFDC benefits formany working recipients, and they reduced benefits for manyothers.
From its survey of state public assistance agencies andan analysis of 10 years of ... program data, GAO estimates thatwhen the declines in caseload and outlays stabilized, OBRA haddecreased the national AFDC caseload by 493,000 cases andmonthly outlays by $ 93 million. However, because the caseloadrose faster than predicted after this point, long-term effectsare less certain.
...... These evaluations indicate that by fall 1983,most working recipients who lost benefits because of OBRA hadnot quit their jobs and returned to AFDC ...... Althoughearnings increased for many who remained in the labor force,the respondents as a whole ... experienced significant incomelosses in all five sites. Apparently they did not make up theloss of income from AFDC and food stamps by working."
Source: US General Accounting Office, 1984
participation of families with dependent children, showed that the Act hadeliminated benefits for almost one half a million families. In most casesthe families had not been able to compensate by increased labor forceparticipation so that the result was a net decline in their householdincomes. The report was based on an analysis of 10 years of experience withfamily assistance programs. Studies of this kind are requested by the USCongress and used to assess the actual and potential impacts of legislationand the effectiveness of federally supported programs.
A number of developing countries have created somewhat similaragencies. One of the best known is the Programme Evaluation Organizationcreated to oversee India's community development programs. PEO is an agencyof the Planning Commission and reports to Parliament. Agencies of thiskind differ from most monitoring and evaluation at the national level inthat they are responsible to the legislature rather than to the executivebranch.

- 106 -
Unlike the urban development agencies which seek to developevaluation capacity within local coordination and implementation agencies,financial and general audits are usually conducted by the centralgovernment agency or its consultants. One of the purposes of the audits isto check on the performance of the impleinenting agencies and to do this itis necessary to obtain independent data to avoid any deliberate orunintended distortions in data produced 'by the agency being evaluated.
F. Resource Requirements for MonitoriLng and Evaluation
1. Resource requirements for local implementing agencies
Table 5-1 shows that a monito:ring system can frequently beimplemented by a local implementing agency with as little as one half timeprofessional and one part-time research assistant together with secretarialsupport. In addition several interviewers, who can often be borrowed fromanother department within the organization, will be required periodically.With this level of staffing it will usuaLly be possible to produce thequarterly progress report, to conduct occasional special studies and toprepare an interim and final report on the evaluation. It should bef easible to obtain this minimum level of staffing within almost every urbanproject. It is important, however, to ensure that these staff members arepermitted to work their assigned time on the evaluation and that they arenot constantly being diverted to other activities within the organization.
The staffing levels indicated iLn Table 5-1 will only permit thepreparation of the basic monitoring reports. Where there is a need for morereports or more detailed analysis it wilL be necessary to increase thestaff level. Table 5-2 estimates the numbers of staff weeks typicallyrequired to conduct an average size impact study with a sample of about 600households. It is suggested that the following resources will be required:
35-40 senior staff weeks50-55 assistant staff weeks55-60 interviewer and coder weeks
Secretarial assistanceComputer timePublication costsTravel costsPossibly consultants mNust also be hired.
The purpose of this table is to provide a checklist of the staff andfinancial costs which will typically be required for an impact evaluation.One important point to note is that the dlirect costs of interviewing willtypically only represent between one quarter and one third of the totalstudy budget and may only require between 6 and 8 weeks out of a totalestimated study time of between 9 and 12 months. The lesson from this tableis that large scale surveys tend to last longer and to cost more than theinexperienced researcher may expect.

- 107 -
TBI$E 5-1: MIMIM M FlNnll RESOEROE RE U NI3 FoR A ICWoElcr nmU= G
Persoml/Resource QCalifications Functions
1. Half-time professional Bachelors degree in one of the 1. Preparation of finarcalstaff member (Director cf social seces ard ideuliy status aid project statusf the Evaluation) some research experience ard/or reports.
experience in data analysis. 2. Coordination with otherdeparteMts, govermertagencies and comamities
3. Design ard irplmen±ataon ofoccasional special stuaies.
4. Preparation cf interlm ardfinal reports.
2. Researdh Maistant Cbmpleted h4ig school. 1. Assist with analysis <f surveys(at least balf-time) Ability to coiKuct basic ard fi eld data.
computatioxu. If possible 2. Help coaduct interviews withsoe experience with with cnmmunity leaders andfixunciagl axulysis. residents.
3. Anlysis cf fixunxicrl atd otberirntorirg data from within the
Or"niZEtion.
3. Secretary (at least Nnol secretarial skllls. Preparation <f reports aidhalf-time) Experience in preparation cf nornml secretarlal duties.
tables.
4. Interviewers (odten on COmpleted high school. Pbriodic interviews wthloan fram other Ideally prior experience with com.mity leaders aid residentsdepartaents). interview or social work. to detentine their opinions on
different aspects <f theproject. Interviews forspecial astdies.
5. Traxuportation aid In some cases it will also be To permlit visits to projects.driver necessary to transport
interviewers.

- 108 -
TABLE 5-2: RESOURCE REQUIREMENTS FOR THE FIRST ROUND OF A TYPICALIMPACT STUDY WITH A SAMPLE OF SIX HUNDRED HOUSEHOLDS
Phase Time Resources(Weeks)
1. Planning and design 4-8 4-8 senior staff weeks2. Sample design 4-12 4 senior staff weeks
4-12 assistant weeks3. Open interviews to 2-4 1-2 weeks senior staff
prepare instrument 2-4 interviewer weeks4. Drafting instrument 2-4 2 weeks senior staff
2-4 weeks assistant5. Pilot interviews 2-4 1 week senior staff
(25-50) 4 weeks interviewer6. Preparation final 2-4 1-2 weeks senior staff
instrument and guide 2-4 weeks interviewers7. Interviewer training 1 1 week senior staff
1 week assistant8. Interviewing (600) 4-5 1 week senior staff
10 supervisor/weeks200 interviewer/days
9. Developing coding frame 2-4 1 week senior staff2-4 weeks assistant
10. Coding 2-4 1 week senior staff2-4 weeks supervisor
11. Inputting data into computer 1-2 1-2 weeks computer operator12. File creation and data 2-4 1 week senior staff
cleaning 2-4 weeks assistant13. Basic descriptive analysis 4-8 2-4 weeks senior staff
2-4 weeks assistant14. Hypothesis testing and more 4-8 4-8 weeks senior staff
complex analysis 4-8 weeks assistant15. Draft report 4-6 4 weeks senior staff
4-6 weeks assistant16. Review and revision of 4-6 2 weeks senior staff
draft 2-4 weeks assistant17. Preparation of final report 2-6 2-6 weeks senior staff
2-6 weeks assistant
Additional Resources: Secretarial staffConsultantsTravel fundsPrinting and publicationcostComputer costs

-109 -
Table 5-3 presents the recommended staffing level for a morecomprehensive monitoring and evaluation program for a typical component ofan urban project in one city. With this level of staffing it will bepossible to prepare detailed quarterly progress reports, to conduct regularspecial studies and to carry out at least a simple longitudinal impactstudy. The characteristics and qualifications of the staff are describedbelow:
a. Research Director: Responsible for designing the researclh,supervising analysis, preparing reports and coordinating withthe different organizations involved. Ideally, an MA insociology or a related field is required, together with someprevious experience in research and evaluation. It isimportant to find someone with interest in operational issuesto avoid making the research too academic. If more complexstudies, such as longitudinal impact analysis, are to beconducted, the Director would also require experience insurvey design and analysis. Experience with electronic dataprocessing is useful.
b. Assistant Director: Responsible for coordination within theexecuting agency and for interviews with project staff andcommunity leaders. Responsible for supervision of dataanalysis which may involve the use of a computer, and may beinvolved in participant observation studies or otherqualitative studies. The success and utility of the evaluationwill depend on maintaining close relations with the differentdivisions of the executing agency, so it is important to findsomeone with good human relations and the ability tounderstand the point of view of technical staff in variousdifferent fields. A BA is required, with some experience indata analysis. An additional area of responsibility might bethe training and supervision of interviewers.
c. Clerical Assistant: Responsible for revision and tabulationof data from project records (numbers and types of applicantsand people selected, cost recovery, amount of material loansgiven, etc.). Also responsible for data processing, eithermanually or using a computer. The minimal requisite iscompletion of high school.
d. Interviewers: Two to five full-time interviewers wîllprobably be required. For more complex evaluation programs,this number may increase up to 10-12. They will be responsiblefor conducting regular interviews with community residents, aswell as for the application of observation guides andparticipant observation. The interviewers will also beinvolved in the coding and possibly basic analysis of thesurveys. There are no general rules for selecting a goodinterviewer, and a team will have to be built up by trial anderror. Students of architecture or engineering may be usefulin studies of house construction.

- 110 --
TABLE 5-3: ADEQUATE STAFFING LEVEL FOR A ONE CITY EVALUATION
Position Functions Qualifications
Director Coordination with maLnagement Preferably M.A.Supervision Minimun of BA with someReport preparation practical researchSupervision design Experience with surveyCoordination with other design and dataorganizations analysis will be
required for the morecomplex evaluations.
Assistant Director Coordination with divisions BA some background inof executing agency research and data
Interviews with pro'ect analysis.staff and community leaders
Supervision of data analysisand report preparation
Participant observation
Training and supervision ofinterviewers
Clerical Assistant Revision and tabulation of Completed high schooldata from project records
Basic data processing
Secretary Normal secretarial Completed High scoolactivities
2-5 Interviewers Interviewing projeci: Attending or completedparticipants high school
Application of observationguide
Coding/analyzing int:erview
Driver Taking staff to and fromproject sites

- 111 -
Trainee nurses often work well on studies of health andfamily-related matters, including household expenditurepatterns. Older women are sometimes the best people tointerview mothers, as many mothers do not like to discusshealth and children with a man or with younger women.
e. Driver: If some project sites are inaccessible, it may benecessary to hire a full or part-time driver.
2. Resource requirements for the local project coordinatingagency (PCA)
In planning staff requirements for Project Evaluation, Lt isnecessary to define the staff required for both the Coordinating Agency andthe Implementing Agencies. The numbers and levels of staff will depend bothupon the size and complexity of the project, and upon which of theorganizational scenarios is selected. The requirements for eachimplementing agency were discussed in the previous section.
There will be many projects in which the Coordinating Agency isonly able to assign very limited resources to the evaluation. The followingrepresents the minimum level of resources required to comply with the basicmonitoring and evaluation requirements (Table 5-4):
a. One full-time professional staff assigned exclusively towork on the evaluation.
b. One full-time assistant for both clerical analysis ofreports from the project agencies and for visits andinterviews in the communities and with staff of otheragencies.
c. Full-time secretary
d. Occasional access to interviewers
e. Access to transport
f. Small budget for hiring consultants.
With this level of resources, the Coordinating Agency should be ableto:
- Relp project agencies set up the basic reporting system- Prepare the quarterly progress report.- Organize regular meetings of the inter-agency coordinatingcommittee
- Conduct occasional special studies.- Prepare the interim special studies.
For larger or more complex programs, or where a more sophisticatedprogram of research is required, the types and numbers of staff will haveto be increased. Some of the typical appointments to be made as the programgrows include:
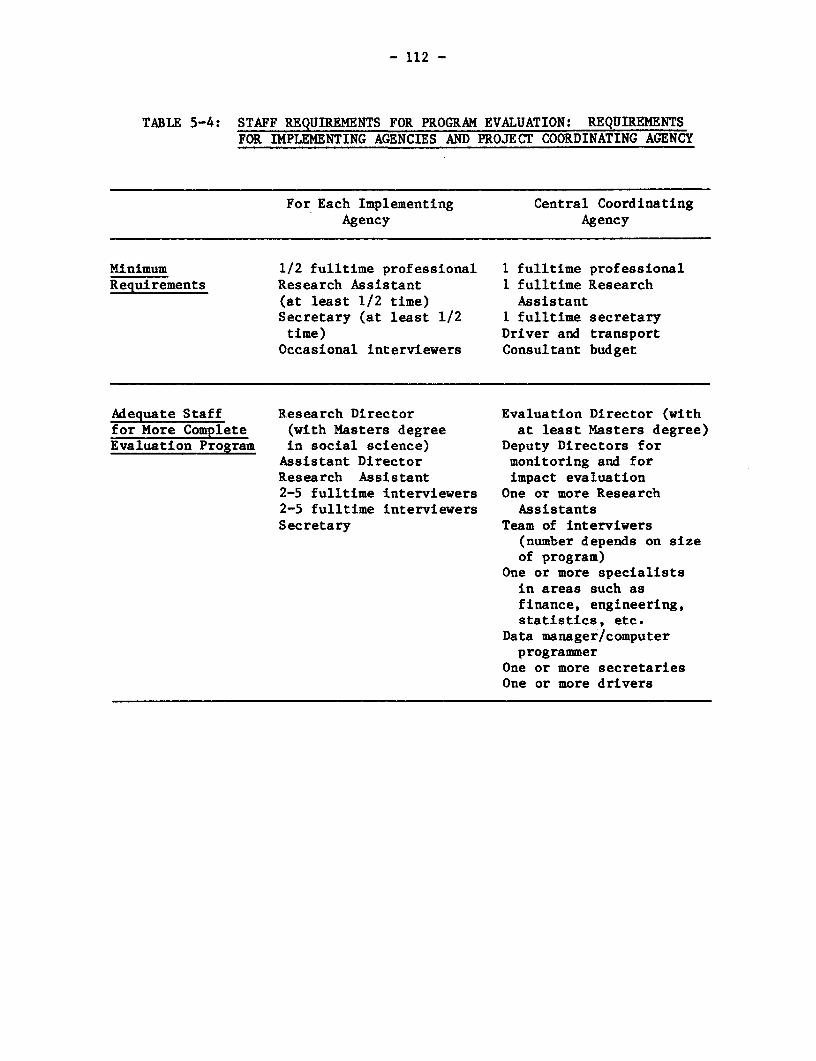
- 112 -.
TABLE 5-4: STAFF REQUIREMENTS FOR PROGRAM EVALUATION: REQUIREMENTSFOR IMPLEMENTING AGENCIES AND PROJECT COORDINATING AGENCY
For Each Implementing Central CoordinatingAgency Agency
Minimum 1/2 fulltime professional 1 fulltime professionalRequirements Research Assistant 1 fulltime Research
(at least 1/2 time) AssistantSecretary (at least 1/2 1 fulltime secretarytime) Driver and transportOccasional interviewers Consultant budget
Adequate Staff Research Director Evaluation Director (withfor More Complete (with Masters degree at least Masters degree)Evaluation Program in social science) Deputy Directors for
Assistant Director monitoring and forResearch Assistant impact evaluation2-5 fulltime interviewers One or more Research2-5 fulltime interviewers AssistantsSecretary Team of interviwers
(number depends on sizeof program)
One or more specialistsin areas such asfinance, engineering,statistics, etc.
Data manager/computerprogrammer
One or more secretariesOne or more drivers

- 113 -
a. Deputy directors for monitoring and impact evaluation.
b. Field directors/coordinators for each city of a multi-cityprogram.
c. Data manager. In most larger evaluations, the data will beprocessed by computer and the data manager will beresponsible for the collection and analysis of allquantitative data. In most cases the data manager willhave two sets of responsibilities. The first is to developa management information system so that monitoringinformation from the implementing agencies can beroutinely processed. In small programs, computer analysiswill probably be conducted by one agency, but in largerprograms, several agencies may have their own computersand the data manager vill be responsible for developingcomputer interfaces so that data can be transferred fromeach agency to the central computing facility. The secondresponsibility will be the analysis of surveys. Wherelongitudinal impact evaluations are conducted, surveyanalysis may become the main task of the data manager.
d. Permanent interviewers.
e. Specialist staff in fields such as financial analysis,engineering, sociology, and statistics.
3. Evaluation resources for the national developmentagencies
It is difficult to provide guidelines on evaluation resourcerequirements at the national level as the variation is 80 great. Someagencies, whose main function is to compile monitoring data received fromthe field, may only have 2 or 3 staff assigned to monitoring andevaluation. On the other hand, organizations such as the U.S GeneralAccounting Office and the Program Evaluation Organizations in India mayhave several hundred staff (the GAO, for example, produces an average of 4evaluation reports every working day!).
4. Fitting staff into civil service categories
hny evaluation positions are difficult to describe in termsof existing Civil Service grade levels, and this has often made itdifficult to offer competitive salaries to well-qualified staff. If salaryscales do not correspond with current salaries being paid to this type ofperson elsewhere, it may be necessary to consider special procedures toresolve the problem. The resolution of these personnel problems can take aconsiderable amount of time, and for this reason the discussions with thePersonnel Management Department should begin early in the project cycle.
Another related problem is that personnel departments areusually reluctant (with good reason) to create new permanent positions fora program which only lasts a few years. As posts once created arepermanent, this means that other positions would have to be found for these

- 114 -
staff members once the evaluation ends. Again, it will be necessary todiscuss this at an early stage so as to permit time for finding theappropriate solution. One method of circumventing this problem is tocontract consultants for certain key positions as there is usually moreflexibility in terms of their salary and enployment conditions.
5. Staff training
Evaluation research is a relatively new field, and as trainingprograms are frequently not offered in the universities the question oftenarises as to how to provide staff with the necessary training. Monitoringdoes not normally require exceptionally high skill levels so that theproblem is less severe. However, if the general upgrading of staff is aproject objective, it may be useful to consider a scholarship program toenable evaluation staff (as well, of course, as other staff) to participateeither in short three- to four-month courses, or to study for an advanceddegree in a field related to the evaluation.
6. Temporary assignment of other project staff to the evaluation
An effective way to reduce the evaluation budget is to makemaximum use of staff already in the organization. For example, communitypromoters can be used as interviewers. In addition to reducing costs, thisalso has the advantage of integrating the evaluation into on-going projectactivities.
Another possibility is to assign a new senior staff member towork with the evaluation team as a way of getting to understand theworkings of all aspects of the project. This could be a very goodintroduction for someone who will later assume a senior position in theorganization.
7. Using consultants to overcome salary constraints
A problem with staff recruitment in many countries has been thefact that civil service salaries are often not attractive to well-qualifiedresearchers. One reason for this is that university researchers often earnpart of their salary through outside consulting, something which willusually not be permitted while working full-time for the government.
A frequent solution has been to hire the research director or asenior staff member as a consultant as there are usually not the same typesof constraints on consultant salaries. This is not an ideal solution, asthe long term problem has not been resolved.
G. The Role of Donor Agencies in the Evaluation
Donor and lending agencies often have an important influence on thedesign and implementation of program evaluation. In many cases theimplementation of an evaluation will be one of the loan effectivenessconditions, and consequently the donor may have considerable influence onthe contents of the evaluation.

- 115 -
The role of the donor can be both beneficial and detrimental to theevaluation. The positive aspects arise from the incentives provided toinitiate an evaluation and often the provision of technical assistance. Inmany cases it is likely that the evaluation would not have started had itnot been for the donor's encouragement. The negative aspect is that theevaluation may be oriented more towards the interests of the donor than tothe needs of the borrover. The donor may require, for example, that anexpatriate consultant be appointed, and he or she will often impose a verydifferent approach than would have been used by the borrower. In somecases, for example, the evaluation has become more complex or has focusedmore on long term impact studies than would have been the cose had it beendesigned by the borrower. A related problem is that the evaluation unit maybe confused as to whom they report to. Although they may formally report tothe borrower, in practice they may receive more guidance and even directsupervision from the donor. This may also cause the evaluation unit to bemistrusted as they are perceived to be spying on behalf of the donor.
Another issue is the question of how the evaluation should befinanced. Although the evaluation may be financed by the borrower under theloan, the evaluation unit may be encouraged to conduct more complex andexpensive studies to respond to questions which are primarily of interestto the donor. In this case it can be argued that the donor should share thecost of the studies.
The following are some general guidelines which can be used todefine the role of the donor/lender in the evaluation:
a. A clear distinction should be made between the types ofinformation which must be collected as a loan requirement, and anyadditional studies which are proposed by the donor. The latter should onlybe conducted after careful review by the borrower and in many cases viththe donor covering at least part of the costs.
b. The management of the executing agencies should take anactive role in the design and implementation of the evaluation.
c. The borrower should not expand the scope of the evaluation atthe suggestion of the donor unless a very clear agreement is reached onhow the additional data will be analyzed and used. There are many cases inwhich expensive studies have been conducted at the suggestion of donors butwhere the d+a has never been analyzed as no resources were allocated forthis purpose.
d. Where a consultant is contracted, the guidelines suggestedearlier in this chapter should be followed.

- 116 -
H. Potential Problems and Possible Solutions
The following are some of the prob.lems which typically arise in themanagement of the evaluation. In each casie possible solutions are proposed(indicated by an *):
1. The process of recruiting staEf is very time consuming so thatby the time staff are hired the project is already well advanced. As aconsequence the earlier stages of the project are not evaluated.
* The organizational structure and staff requirements for theevaluation should be defined at the time of project appraisal andrecruitment should begin as soon as the loan is approved.
2. It is difficult to hire experienced researchers under normalcivil service salary and employment conditions.
* Informal consultations should be held with the appropriatepersonnel departments at the appraisal stage, and the possibility of makingspecial arrangements should be discussed. Some arrangements which have beenused in the past include the contracting of staff as consultants ratherthan permanent positions; special salary scales for the project unit;special payment arrangements etc. These requirements are much easier toarrange at the project negotiation stage than once the project is underway.
3. The evaluation unit often becomes isolated and loses contactwîth the other departments of the implementing and planning agencies.
* Care should be taken in defining the organizational structureto ensure that the evaluation unit reports directly to senior management. Areview process should also be instituted to ensure that all evaluationreports are discussed at management meetings.
4. Evaluation staff are frequently coopted to assist in a widerange of organizational activities unrelated to the evaluation, with theconsequence that evaluation studies fall behind schedule.
* There is no simple answer to this as crises and unexpectedactivities constantly arise. As the evaluation work is less urgent thanmany other activities there will be a strong temptation to draw on theevaluation staff. Ironically the more successful the evaluation studies,the more likely management is to draw on the evaluation team to help inother activities such as writing reports and proposals and meeting withvisitors.
* One advantage of using consultants is that they are not subjectto the same distractions as regular staff. If the resources are availableit may be a vise precaution to overbudget the evaluation staff on theassumption that a certain amount of time will be used in other activities.

- 117 -
5. The feasibility of conducting the evaluation studies may beaffected by interagency conflicts. Agencies frequently resent the fact thatthey are being "evaluated" by another ministry, and will consequently notcooperate.
* As far as possible the implementing agencies should beresponsible for preparing their own monitoring reports and the role ofother agencies should be to provide technical assistance.
6. The practical utility of the evaluations may be significantlyreduced by the slowness of receiving information from the differentimplementing agencies. By the time information has been received andcompiled, a number of months may have gone by so that the information isout of date before it is published.
* One of the best ways of avoiding this problem is to keep theinformation to be collected as simple as possible. The implementingagencies should also be provided with rapid feedback so they can see thatthe information is in fact being used. Collection and processing can alsobe streamlined if a study is conducted to identify the main bottlenecks andto propose alternative methode of collection and analysis.

- 118-
CHAPTKR 6
ISSUES AND APPROACHES IN EVALIJArING NON-SHELTER RELATEDUREAN PROJECTS
A. New Directions in Urban Development Projects
The first generation of World Bank financed urban projects,beginning in the early Seventies, were ma:Lnly small scale shelter projectsdesigned to demonstrate the feasibility o'E more economical approaches tothe provision of shelter. The two main approaches were sites and services,in which new units were provided, and squatter upgrading in which urbanservices, infrastructure and house construction credit were provided. Inmost of the countries where the first projects were developed, the conceptswere relatively new and the projects were designed to test the approachesand to convince policy makers of their practical utility. Part of theprocess of testing and replicating the projects involved the implementationof monitoring and evaluation systems whic]h would permit a more precisemeasurement and documentation of the results of these projects.
After a few years two things became apparent. First, well run sitesand services or upgrading projects were potentially able to provide shelterat a much more economical cost than conventional housing programs, and thatthese solutions were accessible to large sectors of the low-income urbanpopulation who had previously been excluded from public housing. Second,it also become clear that these approaches, however successful, were onlyone component of a general strategy for improving the living conditions ofthe urban poor.
There vere a number of reasons for this conclusion. First,intensive Bank involvement in the design and execution of specific projectswas too slow and cumbersome an approach to make any quantitative impact onthe shelter supply. Second, shelter is only one of a series of relatedservices which are needed to make significant improvements in the livingconditions of the urban poor. Income and employment generation, health,food distribution and marketing and transport are some of the other areasneeding to be addressed. Third was the need to improve the capacity ofmunicipal authorities to select, plan, finance and implement thedevelopment projects. Finally, and related to this, was the need to buildthe institutional capacity of regional and national agencies to plan andmanage multi-component projects, which could be implemented simultaneouslyin a number of different cities.
The purpose of this paper Chapter is to discuss some of the keyissues relating to non-shelter urban projects and to suggest some of themonitoring and evaluation approaches which can be used in theirevaluation. The discussion is by no means exhaustive, largely becausesufficient evaluation experienced does not yet exist. In each section wewill discuss some of the key research issues and will consider how far theyare unique to this particular type of project, and the extent to which thedesigns discussed in the previous chapters can be used. Four types ofprojects will be discussed: income and employment generation; health;transport; and municipal and institutional development.

- 119 -
B. Income and Employment Generation Projects
1. Key policy issues
Income and employment projects seek either to integrate workersinto the formal labor market (mainly through training and job placement) orto stimulate the growth of the informal sector. Programs to develop theinformal sector have been given more attention in urban projects. The mainapproaches have been to provide credit and technical assistance, servicedland for business purposes and access to new markets. The followingdiscussion will mainly address projects designed to develop informal sectorand micro-businesses.
One of the issues which continually arises is how to ensurethat projects are accessible to low income beneficiaries whilst developingrapid and economical techniques for selection, technical assistance andsupervision of credit. Most projects involve banks and other financial andtraining institutions who are used to working with much larger businesses.Their appraisal and processing procedures are designed for working withlarge companies and in most cases the procedures are not applicable tosmall businesses with very limited experiences in basic managementprocedures such as accounting, stock control and marketing. One of theconsequences is a tendency to exclude the smaller businesses and to workmainly with the larger and better organized applicants. A major evaluationissue is to determine how well the programs are reaching the targetpopulation, and what are the main factors limiting access.
The problems do not all lie with the lack of willingness ofbanks and other institutions to work with the small businesses. Anothersetof problems relate to the social and economic costs for a small business toparticipate in the project. Many businesses, due to their quasi-legalstatus, avoid many taxes and are not subject to many of the health andlabor regulations. In order to apply for a loan, the businesses would inmost cases be required to go through the process of legalization (which iscostly and complex) and would have to pay taxes and comply with otherregulations. For many businesses the costs of participation may outweighthe benefits. Project participation may also imply social costs. Forexample, for some families the money lender is an important resources intimes of family emergency and borrowing money from the project rather thanfrom the money lender may result in their losing access to the emergencyassistance which the money-lender could provide to his or her regularclients.
The social, economic and political world within which thesmall businesses operate, is often not well understood by the designers ofthe small business projects and this may lead to poor project design. Forexample, the political influences within a cooperative may exclude certaingroups or result in loans being directed towards larger businesses. Thepolitical contacts of suppliers and middlemen may affect access to marketsand may force the new business to seek some form of accommodation withthese groups.

- 120 -
Many projects involve intermrediary organizations such ascooperatives, community groups or federations of small businesses. It isessential to understand how well these function as intermediaries andcommunication links, as in many cases the intermediaries only representcertain sectors of the beneficiaries or provide inadequate information onthe opinions and needs of beneficiaries.
Another issue relates to the difficulties of conductingefficiency and cost-effectiveness analysis of many of the programs due toproblems of getting accurate information on costs, income and profits.
A final issue relates to the difficulties of projecting thepotential project impacts on the target population. Many businesses whichhave been successful on a small scale fit d that once their size increasesthey must enter directly into competition with much larger and betterorganized competitors and find their growth potential curtailed.Businesses directed to low-income households also confront the lowpurchasing capacity of this sector. It is much easier to train people tomake shoes than it is to increase consumer income so that demand for shoeswill also increase. Factors such as these make it difficult to projectfrom the findings of a pilot project to what would happen if the projectwere replicated on a larger scale.
2. Evaluation issues
a. Design issues
Most small businesses operate in an environment wherecosts, prices and markets are subject to continual fluctuations. In orderto evaluate the impacts of a small business development project it istherefore important to have a control group which can be used to provideinformation on market trends. Unfortunately, it is difficult to locate anduse control groups, and there are also political and ethical problemsinvolved in withholding project benefits from people in the control group.In most cases there is very little systematic information available on thenumbers, types and location of small businesses so that is is difficult tolocate a representative sample of businesses not affected by the project.It is also likely that the project will attract the most dynamic businessmen so that the socîo-economic characteristics of participants may be quitedifferent to those of the control groups. Finally, it is extremelydifficult to isolate and control for the impacts of external factors on theprogress of the project. For example, the production costs and salesprices of many products fluctuate continually, businesses may be affectedby the entry of new larger competitors, government agencies may decide toplace large orders at uneconomic prices for political reasons, andbusinesses are continually affected by changes in the macro-economicenvironment. Not all businesses are affected in the same way by thesefactors so that it is difficult to assess how much of observed changes canbe attributed to the project.

- 121 -
Another analytical problem is caused by the wide diversity inthe types of businesses. Even a small program may give credit andassistance to businesses as diverse as carpenters, shoemakers, dressmakers,food retailers and artesans working in metals. Each of these types ofbusinesses should ideally be examined separately to understand the factorsdetermining its success or failure. This makes it difficult to generalizefrom the findings of programs which only affect a few hundred businesses(this is not a problem for the few larger programs which affect largernumbers of businesses).
b. Measurement issues
The evaluation of the impacts of a small business programrequires that accurate information be obtained in expenditures, income,stock levels and profits. This information is frequently difficult toobtain, either because the business does not keep the necessary records orbecause the businessman does not wish to make the information available.Most small businesses do not keep accurate records. For example, smallfood stores, as well as other types of small businesses, frequently mix thehousehold budget with that of the store; basic necessities are purchasedwith whatever money is available at the end of the day, and if anything isleft over it is used to buy more stock or materials. No systematic recordsare kept and the owner would find it difficult to estimate how much profithad been made.
The problem of obtaining accurate information is particularlydifficult for the control group. Many projects seek to provide technicalassistance in book-keeping and stock control sa that the quality ofbeneficiary records is likely to improve as the project progresses.However, this assistance is not given to the control group so there may bedifferences in the accuracy of information from participants and controlgroup. Control businesses also have less incentive to cooperate, whichagain may affect the quality and detail of information provided.
Problems also exist in obtaining information on sources andcosts of credit. Many credit arrangements are informal and small tradersoften think in terms of how much has to be repaid at the end of the day orweek, rather than of interest terms. Similarly, the cost of providingshort term credit to customers may not be computed. Although interestrates can often be computed from this type of information, there is apotential for a larger margin of error in the estimations.
3. Applicability of monitoring and evaluation designs discussedin previous chapters
Although specific measurement issues exist, in general, themonitoring and evaluation strategies discussed in earlier chapters can beused. Some of the similarities and differences are as follows:
a. Business programs often require more extensive monitoringinformation from beneficiaries than is the case for many other types ofprojects and this facilitates conducting the types of performancemonitoring described in Chapter 2. The main problem is to ensure thereliability of the information.

- 122 -
b. The methods of process rnonitoring discussed in Chapter 3are directly applicable. It is important to develop a model of the processof project implementation, so as to be able to assess the weaknesses andpotential problems. Several of the examples given in Chapter 3 in factrefer to small business programs. In principle, it is easier to measureefficiency and cost-effectiveness of smaLl business programs as there isgeneral agreement on which indicators should be used.
c. The evaluation of project impacts can also use theapproaches discussed in Chapter 4. One of the problems in applyingquasi-exerimental designs is the effect which the wide diversity of typesof business has on sample size. Qualitative techniques are an importantcomplement to quantitative analysis given the diversity of types ofbusinesses and the importance of understanding social and politicalfactors.
d. Difficulties in obtaining reliable information on theperformance of the control group is likeLy to be a serious constraint onimpact evaluation. For reasons discussed above, the information is likelyto either not be available or for there t:o be serious questions about itsreliability.
C. Family and Public Health Programs
1. Key policy issues
There are 5 main types of urban health programs: (a) Maternal andchild care (b) Nutrition (c) Water supply and sanitation (d) Solid wastedisposal and (e) family planning.
A first general issue which re:Lates to all of these projects iscost-effectiveness. All projects have to be paid for, either directly bybeneficiaries or indirectly through locaL or central government. Costsaffect accessibility and replicability anld it is important to monitorcarefully the different cost components and to compare them withalternative programs. The application of conventional cost-effectivenesstechniques is extremely difficult. A major problem is the difficulty ofdefining and measuring the quality of outputs. There is no generallyaccepted way to define a good family plalning program or an effectivematernal and child care health project. This makes it extremely difficultto develop a standard measure of effectiveness and hence to be able tocompare the cost-effectiveness of different programs.
A second related issue is cost-recovery. The efforts to make theproject affordable and financially self-supporting are largely wasted ifthe beneficiaries are unwilling or unable to repay. The issue of costrecovery is complicated for many types o:F public health programs due to thedifference between social and private preferences. Many families areunwilling to pay for disease prevention iprograms such as improvedsanitation or solid waste disposal as th,ey do not perceive how theythemselves will benefit. Where cost recovery problems exist, it isimportant to assess whether these are mainly due to: (a) lack of capacityto pay (b) dissatisfaction with the services and lack of willingness to pay(c) political pressures discouraging an effective collection system or (d)

- 123 -
BOX 6-1 COMPLEXITIES OF ENSURING COST-RECOVERY FOR PUBLICBEALTH SERVICES.
Cost recovery in a water supply project in Lusaka.
The First Urban Development Project in Lusaka, Zambiaincluded filling-in insanitary wells and the construction ofcommunal standpipes to be shared by groups of 25 families. Inan attempt to use group pressures to encourage payment ofservice charges, the water would be cut-off if any one of thefamilies fell behind in their payments. With a few exceptions,the repayment rates were very low, despite the fact that waterwas cut off in some cases. Two negative effects of cutting offwater were that families made illegal connections and in somecases opened up the cholera infected wells.
The following were some of the reasons for poor costrecovery:(a) Many local politicians opposed poor familieshaving to pay for water and tried to stop water being cut off(b) The project accounts were several months in arrears so thatfamilies sharing a standpipe did not in fact know who had notpaid (c) the office where payments had to be made was poorlysupervised and was often not open when families tried to makepayments (d) the idea of group pressures to ensurecost-recovery was only introduced at a late stage when defaultshad already reached a high level. The process had not beenexplained to families and many neither understood nor acceptedthe concept of communal responsibility (e) Many families wererecent migrants from rural areas where water was considered tobe a gift from God which was obtained free from rivers orwells. Many did not understand why they should be expected topay for water.
Source: Bamberger, Sanyal and Valverde, 1982
inefficient adminstration. Box 6-1 illustrates the interaction betweenthese factors in a project to provide drinking water in Lusaka. Assumptionsabout capacity and willingness to pay vary greatly from one project toanother, and in many cases seem to be somewhat arbitrary. This is an areain which further research is clearly needed.
A third factor relates to the involvement of beneficiaries in thedesign, implementation and maintenance of the project. Many projects aredesigned without consulting the community and are then "sold" by technicalstaff to the community. Advocates of community participation argue thatthis lack of community involvement will often negatively affect usage, costrecovery and maintenance. The issue is complicated by the fact that manypeople question the efficacy of using free community labor in projectimplementation. It is difficult to supervise voluntary labor so that thequality of the project may suffer. There is also the question of whether it

- 124 -
is justified to make the poor work to obtain services which higher incomegroups may receive free. Many of the prob'Lems related to projectimplementation are due in part to inadequate communication links betweenthe community and the implementing agencies, and some of these problens maybe reduced by more effective community participation.
Fourth, technical problems frequently limit access to certainwater supply and sanitation systems. The efficient operation of the systemmay be determined by the water table, typoes of sub-soil, elevation andgradient, and consequently certain communities may be excluded on technicalgrounds.
A fifth issue relates to the accessibility of the project toall sectors of the target population. Access may be affected by costs,cultural and political factors or the way in which the project is designedand implemented (Box 6-2). Frequently project services are mainly enjoyedby the better off or more influential sectors of the community. Forexample, houseowners may receive improved water and sanititation, but thebenefits may not be shared with renters; ethnic or religious minoritiesmight be excluded; or benefits may go largely to the supporters of aparticular political group.
A sixth issue relates to the way in which the projects aremanaged. Many implementation agencies are not aware of the special problemsinvolved in the implementation of social projects and they are managed inthe same way as a civil works project. The effects of this approach ondesign, cost recovery and accessibility/acceptability for different sectorsof the target population, must be assessed.
A final, but extremely important issue is to assess theimpacts of the projects on health. Although the stated objective of mostprojects is to improve health, there are extremely few projects in whichany successful estimates of health impacts have been made. Although healthimpacts are extremely difficult to measure (see following section) the lackof adequate information is also due to the fact that very few studies havetried to measure health impacts in any systematic way. In some cases thisis because it is considered obvious that improved water supply orsanitation will improve health, in other cases it is because health impactsare considered too difficult or expensive to measure. For all of thesereasons a key issue is to determine what impacts the projects actually dohave on health, which groups do and do not benefit and what are the factorsaffecting outcomes. The key question for the development planner is toidentify the most cost-effective package of services to produce a given setof health outcomes.

- 125 -
BOX 6-2 CULTURAL FACTORS AFFECTING ACCESS TO PUBLIC HEALTHPROGRAMS
a) In Mombasa the traditional form of low-income housingis the Swahili household in which 10 or more families live in acompound and share toilets and water supply. In order to providea cost-effective sanitary unit, toilets and standpipes wereconstructed outside the compound. However, most of the familieswere strict Muslims and women were not allowed to leave thecompound after dark with the result that they were not able touse the new toilets.
b) In Indonesia difficulties were encountered with theacceptance of communal toilets, due to the fact that differentcultural and religious groups in the communities had differentsanitary practices and were not willing to share a toilet.
c) Water collection and washing of clothes are frequentlycommunal activities which provide an opportunity for women tomeet and exchange gossip. In traditional societies this may beone of the few times that women are permitted to leave theircompound, and consequently many women have not wished to acceptindividual water supply or washing facilities as this would cutthem off from an important social activity.
d) In a classic study in Peru (Rogers, 1962) slides wereshown to illustrate the types of bacteria which live in waterand to explain the importance of boiling drinking water. Theproject had very limited success, firstly because traditionallyonly sick people drank warm water, and secondly because thebacteria shown in the slides seemed very large and no one couldsee them when they examined their own water. The only people toinitially boil water were a small number of social outcasts suchas a woman who had been abandoned by her husband.
2. Evaluation issues
a. Design issues
The success of health programs appears to be verysensitive to the project delivery system, and for this reason the firststage of the evaluation design must be to develop a model of theimplementation process. Widely accepted efficiency indicators exist formany of the specific technical components (for example thecost-effectiveness of different types of water supply or the numbers ofpatients per doctor in different types of clinic), but issues relating tocommunity involvement, the effects of cultural and political factors, andthe access of different groups to the project, may be less wellunderstood. As mentioned earlier the management style of many healthprojects tends to focus on technical, rather than cultural and politicalissues.
Relatively little progress has been made in developing satisfactorymodels for evaluating the impacts of health programs. Some of the designissues include:

- 126 -
i. Defining an adequate set of indicators of healthoutcomes. For the evaluation of most types of health project a basicconceptual issue relates to the selection of indicators of projectsuccess. What should be measured? For example, which of the followingindicators of health impacts should be used?: days absent from work due toillness, infant mortality, morbidity rates for particular populationgroups, anthropometric measures, parasitic load etc. A clearer conceptualframework is often needed to decide on the appropriate set of indicators.The indicators must be reliable, cheap to apply, logically related to theproject and capable of detecting changes with the size and type of samplebeing used.
ii. Developing a model of the project implementation process,including the effects of household characteristics and the externalenvironment.
iii. Specification and quantification of project treatments(water, sanitation, health education etc).
iv. Specification and quantification of the interveningvariables (household and community attributes).
v. Development of a quasi-experimental design in whichparticipants are compared with a control group, and in which measurementsare made at several points in time.
vi. Application of multivariate techniques (see chapter 4) tocontrol for differences between the experimental and control groups and toestimate the contribution of each project component.
b. Measurement issues
Health indicators are subject to at least 3 types ofmeasurement related problems. First, a number of indicators on healthstatus, illnesses and causes of death are derived from information providedby a respondent. There is considerable evidence as to the large margins oferror in many of these indicators (particularly types of illness and causesof death). There is considerable disagreement among experts as to howreliable mothers reports are on the frequency of diarrhoea, which isunfortunate as this is a potentially economic way to obtain information onparasitic infection.
A second issue relates to cost, as many of the more reliableand analytically useful indicators, such as analysis of stool samples,medical inspections and measuring the height and weight of children, arerelatively expensive and time-consuming.
A third issue relates to the size and type of sample which isrequired for the use of different indicators. Infant mortality rates arepotentially a very good indicator of health status, but normally a sampleof several thousand households would be required to obtain statisticallyreliable indicators of project impact on mortality rates. Many otherindicators such as parasites, specific illnesses and height for weight are

- 127 -
subject to seasonal fluctuations so that ideally measurements should berepeated several times during the course of a year.
3. Applicability of the monitoring and evaluation framework
Monitoring and evaluation techniques can be applied in muchthe same way as described in Chapters, 2, 3 and 4. Issues of cost-effectiveness, accessibility and overall efficiency can be studied in theway described in Chapter 3. Similarly, the discussion of impact evaluationand the use of quasi-experimental designs is directly applicable to healthissues. Measurement and sample size need to be given special attentiLon butthe general principles are the same. It is again essential to combinequantitative and qualitative techniques and to develop a general model ofthe project implementation process.
One special issue is that in many projects most of theinformation for both monitoring and evaluation will be collected throughproject health staff such as health visitors, social workers and nurses.This means that the evaluation designs must be adapted to the level ofexperience and the time-availability of the staff. This contrasts with manyother evaluations which are conducted by specially hired interviewers.
D. Urban Transport
1. Key policy issues
Although forming a relatively small part of early urbanprojects, transport has come to represent a significant part of urbanlending. The main components include: upgrading and maintenance of existingroads, railway lines and stock, buses and buildings; construction of newroads, both community access and trunk roads; acquisition of new vehiclesfor road and rail transport; traffic management, including traffic lightsystems; stimulating the growth of private transport companies throughcredit, training and legislation; and measures to economize the use andimportation of fuel.
Urban transport is a field in which precise internalperformance indicators have been developed and one of the key issues is todetermine how well projects have performed in comparison with theseindicators. Some of the common indicators include: passengers per bus perday; kilometers per bus per day; total staff and staff per bus; light ordead mileage; breakdowns as percentage of buses in operation; buses inservice as percentage of total fleet; fuel consumption; and the ratio ofrevenues to total costs.
In addition most projects have a set of external objectivessuch as the proportion of the total urban population served, responding tourban growth patterns and economizing fuel costs. More complex objectivesmay relate to impacts of the transport on urban growth patterns, thedistribution of the population and location of employment.

- 128 --
BOX 6-3 SOME IMPACTS OF TRANSPORT PROJECTS ON THE LOW-INCOMEURBAN POPULATION
a) Low-income communities must frequently be relocatedto permit the construction of a road. As the agenciesresponsible for road construction often do not coordinate withhousing programs, many families wiLl not be provided affordablealternative accommodation. Frequently no records will be kept onwhat happens to these households so that no-one is even aware ofthe magnitude of the problem.
b) In Jakarta, a number of kampungs (urban villages) hadexisted for 50 years or more. Urban development programsfrequently included the construction of vehicular roads throughthese communities. Frequently the roads changed the wholecomposition of the community, making it dangerous for childrento play, bringing in many more outsiders, increasing land values(with possible negative impacts on poor renters) and providingeasier access to the city center. 11owever beneficialeconomically, the project impacts on the existing cultures weremore difficult to assess.
c) In Lusaka it was found that the construction ofpenetration roads had a number of Lmpacts on squattercommunities. Stores were able to sell a wider range of productsas larger vehicles could now deliver; garbage could be collectedby the city trucks and it became easier to work in the citycenter due to more rapid access.
An issue in many projects is the accessibility of thetransport programs to the urban poor. This involves factors such aspassenger costs, penetration of low-income areas, and directness oftransport routes between low-income residential areas and centers ofemployment.
Some projects seek to stimulate the entry or growth of privatetransport companies, particularly small bus operators. The evaluation muststudy the extent to which they do enter, the special problems faced bysmall private companies and also a cost-efEfectiveness comparison of publicand private bus companies.
A final set of issues relate to the evaluation of the impact ofdifferent types of transport projects on ithe low-income population(Box 6-3). A number of impacts should be assessed, including the following:
a. What happens to low-income families who are displaced as aconsequence of road construction? Are they given compensation? Where dothey move to, and how are their living conditions affected by the project?It is important to evaluate the impacts on1 renters and squatters as well ason house owners.
b. How do new transport systems affect the access of thelow-income population to centers of employment?

- 129 -
c. Many roads pass through or near to low-income communitiesand this will often affect land values. What impact does this have ondifferent sectors of the low-income population?
d. The construction of vehicular roads through communitieswhich previously only had footpaths, can have a dramatic impact on thecultural and economic life of the community. These impacts should beassessed.
2. Evaluation issues
a. Design issues
The nature of most transport projects makes it extremelydifficult to make a comparison with a control group. For example, the areasof the city affected by a trunk road are likely to be very different fromall other sectors of the city so that comparisons are difficult. Many ofthe projects are so large that it is impossible to isolate their effectsfrom the many other changes which are simultaneously taking place. This iscomplicated further because the projects are often a response to changeswhich are already underway. For example a trunk road is constructed becausethe city is already expanding in certain directions or because industry isbeginning to move out from the city center.
On the other hand, internal performance andcost-effectiveness comparisons of different transport systems and modes isoften easier to conduct as the required information is more accessible.
A difficult but important issue, which is usually notstudied, is the impact of major tranport projects on the low-incomepopulation. The construction of new roads will often require the relocationof low-income communities. Even though in some major cities low-incomehouseholds may have been forced to move three or four times as the cityexpands, there is usually no record of where they move to or how theirliving conditions have been affected by the move. An important evaluationdesign issue is to identify the families who are forced to move and todetermine where they move to and how their new living conditions comparewith their previous ones. The study can be done in two main ways. On themicro level the attempt can be made to follow individual households, and torevisit them in their new location. In practice this is extremely difficultto do on a large scale. The second option is to request the nationalstatistical office or one of the universities to include questions onmigration patterns within the city in future city-wide studies. In this wayit may be possible to determine (say 2 years later) in which sectors of thecity these families are now living. This approach can only be used when avery large number of families have been relocated, as the sample would notpick up a sufficient number of households from small communities.
- 130 -
In order to evaluate impacts on communities which have beenpenetrated by, or are close to new roads, a number of research options areavailable. One option is for a participant observer to live in thecommunity and describe the process of change. A second is to select a panelof households who will be periodically revisited over a period of years. Athird is to interview a sample of households before the project begins andthen once or twice after the project is underway. Where a quantitativeapproach is to be used, this should be combined with qualitative techniquesto help understand the meaning of the results and to ensure reliability ofthe data.
b. Measurement issues
Well established techniques exist for collecting andevaluating the types of data required for performance monitoring and cost-effectiveness analysis. Although care must be taken to check thereliability of data, it is expected that the quality of the data will ingeneral be more reliable for transportation than for many other types ofprojects.
More difficulties potentially exist in trying to obtain dataon the impacts of the projects on the affected populations. We have alreadymentioned the problems of locating families who have been forced to move.In many cases relocation is a controversial political issue so thatrespondents may be reluctant to give information for fear of reprisals.
3. Applicability of the monitoring and evaluation framework
With respect to monitoring, the standard procedures describedin Chapters 2 and 3 are directly applicable. As in previous cases it isimportant to develop a model of the project implementation process whichcan serve as the conceptual framework for design and interpretation of bothprocess monitoring and impact evaluation. It is likely to prove difficultto use a quasi-experimental design for impact evaluation, due to the sizeand complexity of many projects and the difficulties of locating acomparable control group. This means that in many cases, reliance will haveto be placed on qualitative and descriptive techniques.
In contrast to health and employment projects, major transportprojects are designed to affect the social and economic life of the wholecity. This means that greater attention must be paid to macro-levelanalysis than was the case with the previous types of project.
E. Municipal and Institutional Development
1. Key policy issues
As projects move out from the capital into secondary cities,the issues of the capacity of the municipality to manage and finance theprojects becomes crucial. A number of inter-related issues are involved:

- 131 -
a. How can the municipality generate the required counterpartfunding? Many municipalities have traditionally had very limited sources ofrevenue and have been largely dependent on transfers from the centralgovernment. This was often a deliberate policy to ensure control by thenational government. Consequently many cities have had limited experiencein how to generate and manage their own revenue sources. In many cases theavailable revenue sources are limited because central government haspre-empted many sources such as income tax and taxes on sales andbusinesses. Frequently the only option will be some type of land orproperty tax. The evaluation must study the effectiveness with which newrevenue sources are identified and the efficiency with which they areutilized.
b. The problems encountered in the attempt to use these newsources of revenue should be assessed (Box 6-4). In some cases the problemsare technical (for example lack of qualified land surveyers) but in manycases they are also political. Local politicians may oppose the applicationof land taxes to the poor, and the wealthy are often able to sabotage orevade efforts to tax them more heavily.
c. How can the incidence of new sources of revenue generationon different socio-economic groups, be assessed? Given high levels of taxevasion and the difficulties in developing effective collection systems,the incidence of the tax burden may be significantly different from whathad been intended.
.d. The technical capacity of the municipality to design andmanage complex development projects.
e. Problems in recruiting, training and retaining qualifiedstaff.
f. How can the technical capacity of a municipality beassessed, and do objective criteria exist for comparing the capacity ofdifferent municipalities? Can changes in municipal efficiency be assessedover time?
g. Is it possible to develop a typology of municipalities (basedon size, revenue etc) so as to facilitate more systematic comparisonsbetween municipalities?
Urban development projects also require that the nationalinstitutions responsible for planning and implementing projects bestrengthened. In many countries urban development policies have neverexisted in any practical sense and each ministry or agency has beenresponsible for developing its own sectoral programs with very littleoverall coordination between them. Often the Ministry of the Interior orthe office of the president is responsible for resolving conflicts betweenthe different ministries but does not take the initiative in developingoverall policies. One of the main problems in the implementation of morecomplex, multi-city programs has been the inability of the centralgovernment agencies to manage the projects and serious delays orbottlenecks have developed. Some of the issues involved in the promotion ofinstitutional development are the following:
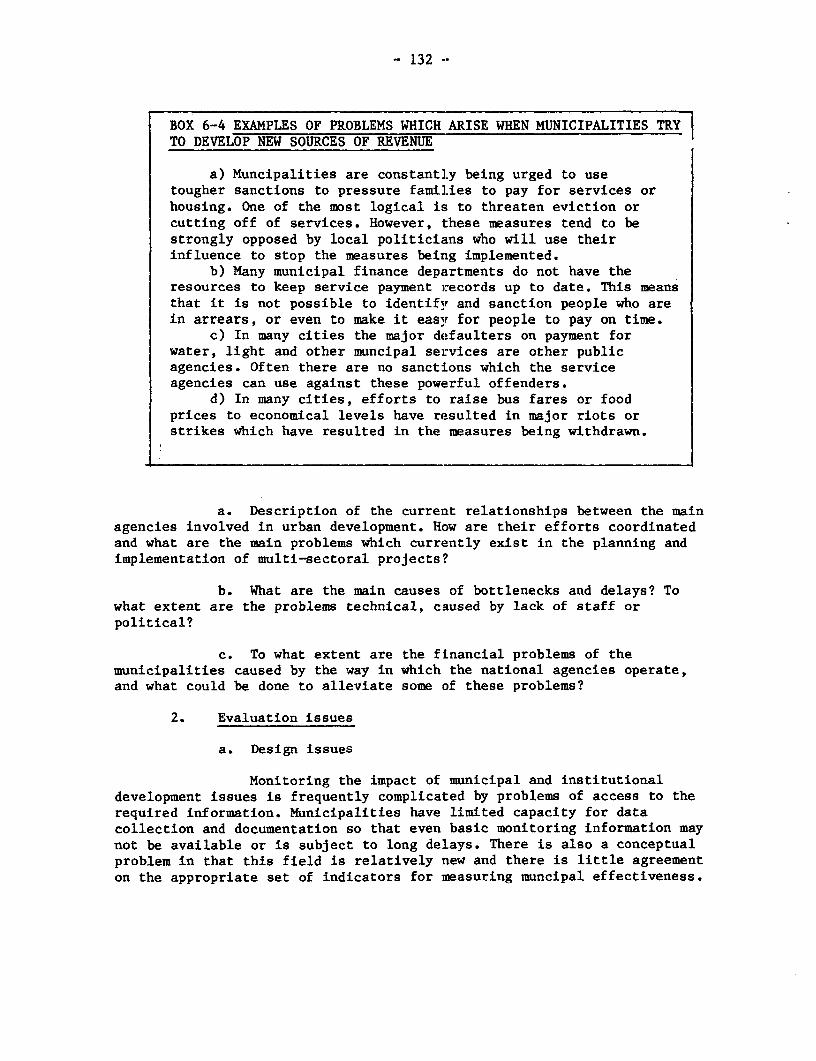
- 132 --
BOX 6-4 EXAMPLES OF PROBLEMS WHICH ARISE WHEN MUNICIPALITIES TRYTO DEVELOP NEW SOURCES OF REVENUE
a) Muncipalities are constantly being urged to usetougher sanctions to pressure families to pay for services orhousing. One of the most logical is to threaten eviction orcutting off of services. However, t:hese measures tend to bestrongly opposed by local politicians who will use theirinfluence to stop the measures being implemented.
b) Many municipal finance departments do not have theresources to keep service payment records up to date. This meansthat it is not possible to identify and sanction people who arein arrears, or even to make it easy for people to pay on time.
c) In many cities the major defaulters on payment forwater, light and other muncipal services are other publicagencies. Often there are no sanct:Lons which the serviceagencies can use against these powerful offenders.
d) In many cities, efforts to raise bus fares or foodprices to economical levels have resulted in major riots orstrikes which have resulted in the measures being withdrawn.
a. Description of the current relationships between the mainagencies involved in urban development. How are their efforts coordinatedand what are the main problems which currently exist in the planning andimplementation of multi-sectoral projects?
b. What are the main causes of bottlenecks and delays? Towhat extent are the problems technical, caused by lack of staff orpolitical?
c. To what extent are the financial problems of themunicipalities caused by the way in which the national agencies operate,and what could be done to alleviate some of these problems?
2. Evaluation issues
a. Design issues
Monitoring the impact of municipal and institutionaldevelopment issues is frequently complicated by problems of access to therequired information. Municipalities have limited capacity for datacollection and documentation so that even basic monitoring information maynot be available or is subject to long delays. There is also a conceptualproblem in that this field is relatively new and there is little agreementon the appropriate set of indicators for measuring muncipal effectiveness.

- 133 -
Assessing the impacts of municipal development projects is even moredifficult. A municipality is subject to many political and economicinfluences and is in a state of constant change. Consequently it isextremely difficult to identify the contribution made by any particular setof interventions. For example, to what extent is improved revenuegeneration a result of the training and technical assistance received underthe project, and to what extent is it caused by: the election of a newmayor, influx of new industries, a political conflict with the stategovernment, purchase of a new computer and a prolonged drought in theinterior of the state which has accelerated rural to urban migration? Whenonly one city is being studied, much of the analysis will innevitably bebased on descriptive and qualitative analysis. However, in projectscovering a large number of cities it is possible to isolate the impacts ofthese. factors. Box 6-5 gives an example of how this approach vas used forthe analysis of a 23 city project in Colombia. It then becomes possible toexamine the way in which variations in these factors affect indicators ofefficiency.
Techniques such as participant observation and intensive casestudies help understand the political dynamics of the city. However, iLnmany cases the techniques are moré difficult to apply than in theevaluation of shelter projects as it is much more difficult to obtainaccess to the subjecte being studied. Thus, although it may be relativelysimple for an observer to rent a room in a squatter settlement and becomepart of the community, it is much harder to gain access to the city counciland to participate in the political deliberations which are being studied.
b. Measurement issues
There is relatively little consensus on what are the bestindicators of municipal efficiency, and even less on how the informationshould be collected. Record keeping is frequently very poor and very slowso that it may be very difficult to obtain the quantitative information onindicators such as progress of cadastral surveys, tax collectionperformance and the registration of familles who will be relocated.
It is even harder to obtain reliable information on decisionmaking processes and the reasons for adopting particular policies. Manydecisions are highly political and the real reasons are likely to be verydifferent from the official ones. Tax authorities may not readily explainthe types of pressures put on them to provide tax exemption for certainindustries, nor will the mayor always admit the way in which his upeomingre-election affected decisions about which communities to upgrade. Theunravelling of these issues often requires the services of politicalscientiste or other specialists.

- 134 --
BOX 6-5 ANALYSIS OF THE IMPACT OF CITY CHARACTERISTICS ON THEPERFORMANCE OF URBAN DEVELOPMENT PROJECTS IN 23 COLOMBIAN CITIES
Most analyses of the performance of municipalgovernments focus on factors such as local political conflicts,the personality of the mayor and the historical and culturalcharacteristics of the city. The arLalyst often implicitlyassumes that the situation of each city is unique. In a projectcovering 23 medium sized cities in Colombia, socio-economiccharacteristics of each city (per capita income, literacy rate,economically active population etc) were compared withindicators of project performance (no. of houses constructed,children attending project schools, numbers of residentsparticipating in community organizations, no. of people employedin the production cooperatives etc). A number of statisticalregularities were found. For examp]e: there was a positivecorrelation between house construction and per capita cityincome, literacy rates and the proportion of houses havingaccess to piped water. Similarly there was a significantassociation between the economical]Ly active population and thenumber of patients treated by the community clinics. Theseexamples show that project performance is strongly influenced bysome of the s-$ructural characteristics of each city.
Source: Instituto Ser de Investigacion 1984
3. Applicability of the monitor:Lng and evaluation framework
The indicators and issues involved in evaluating municipal andinstitutional development are quite different from those discussed inprevious sections, and consequently it is necessary to develop a new set ofmonitoring and evaluation approaches.
Performance monitoring can be applied in the same way as inother types of projects although with prolblems and delays in obtaining theinformation, but the approaches to process monitoring are likely to bequite different. One of the main differences is that a municipality is nota single organization with a limited set of objectives. Consequently it isnot possible to apply the same type of »i dels to describe the projectimplementation process.
Municipalities have many different functions so that it is notpossible to define a specific set of quantitative objectives which themunicipality seeks to achieve, se it again becomes much more difficult toevaluate impacts. The evaluation must be conducted on a more descriptiveand policy oriented level.

- 135 -
F. Summary and Conclusions
Despite the specific characteristics and issues connected with eachtype of project, the monitoring and evaluation framework discussed in theearlier chapters would seem to be generally applicable. Municipal andinstitutional development programs offer the greatest difficulties in theapplication of the framework, as their objectives and methods cannot be s0precisely defined.
Performance monitoring can be applied relatively easily to all 4types of projects. In each case it involves the definition of inputs andthe specification of intended outputs (objectives).
Process monitoring can be applied relatively well to employment,health and transport but is more difficult to apply to municipal andinstitutional development, as the latter involves a wide range of differentactivities and cannot be easily reduced to a single model. It is possibleto study the implementation process for different municipal activities butis much more difficult to study for the overall process of municipalgovernment. This does not, however, mean that the analysis will not beuseful as important lessons can be learned from the analysis of particularmunicipal activities. One approach would be to select a number of typicalactivities such as: interaction with low-income communities; interagencycoordination; tax collection; and supervision of large infrastructureprojects. Analysis of these activities would throw very useful light on thegeneral management and organizational style of the municipality.
Impact evaluations face different issues and problems in eacharea. The quasi-experimental approach is relatively simple to apply insmall business programs as their scope is limited and their objectivesclearly definable. The main requirement is that the sample of businesses besufficiently large to adequately cover all of the different types ofbusinesses. The evaluation of health impacts presents more complexconceptual and measurement issues. There is relatively little agreement onindicators or desigas so that any evaluation design has relatively littleprevious experience to guide it. In the field of transport the maindifficulty is that most projects are intended to affect an area of the citywhich is either very large or which is unique, so that it is very difficultto design any type of control group. Also the types of changes which atransport project may produce are largely macro-economic and macro socialand are consequently much more difficult to evaluate as there are verylarge numbers of changes taking place simultaneously. Probably the mostdifficult area in which to conduct impact evaluation is for municipal andinstitutional development projects, as their objectives are very difficultto define and quantify.

- 136 - Anez A
DEFINING AND USIG A ME OF THE PROJECTIMPFEENKNATION PROCESS
A. Defining the Project Model and its Assumptions
1. The elements of the model
The design of every urban project is based on a model of howresources are used to achieve desired goals. In some cases, the model andits assumptions are clearly stated; in others, the model is implicit.Before a monitoring or evaluation system can be designed, it is essentialfor the researcher to have a clear definiLtion of the underlying model andits assumptions.
Table A-1 illustrates the essential elements of a project modelfor a small business credit program. The project is based on a number ofdesign assumptions about scope, geographiLcal coverage, types of businessesto be helped, etc. There are a certain number of financial, material andhuman resources which are the project inputs. In the present example theseinclude credit and technical assistance. It is intended that these inputswill produce a set of outputs which include purchase of fixed capital, newforms of organization and improved financial systems.
The project design specifies a number of processes through whichthe inputs are transformed to produce the outputs. For example, the loansmay be processed through banks or directLy by the agency and technicalassistance may be given individually or through courses. Although theyare often not made explicit, there are a number of assumptions which ledthe project designers to choose one set of implementation processes ratherthan another. For example, it may be assumed that providing technicalassistance through group sessions may have some additional social impacts(such as using group pressures to ensure loan repayments).
The project is not implemented in a vacuum, and the design alsoincludes assumptions about the ways in whlich the implementation process andthe final outcomes will be affected by tlhe project environment and by thecharacteristics of participating families. For example, designers oftenmake assumptions about the prior experience of participants in business,their need for certain type of technical assistance, and their ability andwillingness to pay for different types of services. Similarly, there areassumptions about the likely reaction of local political and communityorganizations, the forms of cooperation from other government agencies andthe effects of other market trends.
The physical and financial outputs are not the final objective ofthe project, but rather a means to achieve a certain set of impacts. Someof these impacts will occur at the level of the target population, (impacton income, employment, health, etc.) whereas others are intended to have amore general impact on the city. Examples of the latter are the impacts onthe low income population in general, on wholesale markets and on prices ofraw materials. Although many of these objectives will be explicitly statedin the project design, others are implicit and have to be identified andmade explicit by the researchers.

Table A-1 CONCEPTUJAL F'RAIlEWORK F'Oh) 11N I.I`ACIT EVALUATI'l.J1N: EXAM1PLE OF AN ARiESAN CREDIT PRUGRAM
_ __ _ _c~|tle Economic arid J'olitical Context
Scope dit Publicity Credits authorized IN TI-I FIlIN
Geographical Selection Investrnients innraeinqattcoverage vLoari autioriz- fixed capital Increase in quantity
coverage ~~~~~ation pro_____u__ed_
Types of Disbursemnents Increase in qualityartesans Cost recovery Increase in value of
procluction_____________ R~~~~~~~~~~~~Ieduction in man/hours
__ to produce a unitStability of' material
T'echniical New financial suppi y2 Technical l)assistance systems Increase in fixedassistance on: Reorganization capital
finance of-production Prolfitsproduction New lines of productionmarketing and/or services
CONIE}ECIALIZATION
Increased salesMore stable demand
SOCIO-FCONOMIC CHARACTEIIISTICS OF Changes in systems ofTHE AI?TESANS marketing.
Tinoine from artesan workHouselhold incomeHours workedIncoine stabilitySatisfaction with workNo. of people employed

- 138 -
The model also shows that there are assumptions about the ways inwhich these impacts vill be affected by the characteristics of participanthouseholds and by the external environment. For example, it may be assumedthat female and male headed households vLll respond differently to theproject or that household income will affect the types of outcome. Thereare similar assumptions about the ways in which the external environmentaffects outcomes.
Before the evaluation begins, it Ls essential to prepare a detailedand very explicit model. This model shouLd:
(i) List all inputs.
(ii) Identify underlying assumptions which guided the choice ofinputs.
(iii) Specify the processes by which the inputs vill betransformed into outputs.
(iv) Identify assumptions which led to the choice ofimplementation methods.
(v) Identify all assumptions about how the processes andoutcomes vill be affected by household characteristics andthe external environment.
(vi) Specify all outputs.
(vii) Specify all of the impacts the project is intended toproduce on the target population.
(viii) Identify assumptions abotut how project impacts will beaffected by household characteristics and the externalenvironment.
(ix) Specify all impacts which the project is expected to haveon the low-income populat:ion, urban development, andhousing policies.
(x) Identify the ways in which the impacts will be affected byhousehold characteristics and the external environment.
2. Sources for specifying the model and its underlying assumptions
Information on inputs and outputs, and to some extent, onimpacts and processes, can be obtained from project documents. In addition,it is necessary to conduct interviews with key project staff. In many casesstaff will find it difficult to make explicit many of the assumptions onwhich the project is based. It will usually prove helpful to construct amodel similar to that given in Table A-1 and to gradually fill in thedetails. At each stage,project planners are asked:

- 139 -
- why were these particular inputs chosen?- why did you decide to use this process rather than another?- how do you expect this particular impact to be produced?- how do you expect the characteristics of households to
affect their participation in the project or the impacts theproject produces on them?
Once the model and its assumptions have been outlined, ameeting should be held with planners to review the model and itsassumptions. Often this 'will be an iterative process with a number ofmodifications being made before general agreement is reached.
3. The use of the model in different types of evaluation
Table A-2 shows the different parts of the model which are usedin the main types of monitoring and evaluation:
(i) Performance monitoring is mainly concerned to monitor theuse of inputs (were contractors hired? vere materials delivered to thestores, etc.), and outputs (how many houses have been built, how many loansgiven, how many small business started, etc.).
In this case, there is no need to test assumptions but simwly tocheck on whether resources have been mobilized and the required outputsproduced. When it is found that either of the above have not happened (orhave not happened according to schedule) then other types of evaluationwill be required.
(ii) Process monitoring is concerned to assess the efficiencywith which project activities have taken place, and how this has affectedthe achievement of the specified outputs. Some of the typical questionswhich are asked in this type of study include:
* how efficiently were project participants selected?* did the selection criteria and procedures ensure that the
project was accessible to all sections of the targetpopulation.
* how efficient was the use of community labor in houseconstruction?
* how well did cost recovery operate and what were the maincauses of delays and defaults in repayments?
In the process evaluation it becomes necessary to look at theeffects of household characteristics and the external environment. Forexample:
* Are there any differences in loan repayment rates by maleand female headed households?
* Does household income affect willingness to request amaterials loan?
* How do the actions of local political groups affect the landacquisition process?

- 140 -
TABLE A-2: THE COMPONENTS OF THE PROJECT MODEL WHICH ARE STUDIEDIN DIFFERENT TYPES OF MONITORING AND EVALUATION
1. IMPLEMENTATION MONITORING
Inputs ~ut
2. PROCESS MONITORING
|Household char.>cteristics|
In ~ ~ ~ ~ ~ ~ uputs roess u
|External environm e
3. IMPACT EVALUATION
|Household characteristics
I Impacts on targetpopulation
4. COST-EFFECTIVENESS ANALYSIS
Theproject
Alternateprojects

- 141 -
(iii) Impact evaluation is concerned to estimate the impactswhich the project has produced on the social and economic conditions ofparticipating households. This type of evaluation tries to relate thedegree of access to project inputs and outputs on the changes produced. Italso focuses on the effects of household conditions on the degree anddirection of changes produced.
(iv) Cost-effectiveness analysis compares alternative projects interms of the amount of output produced for a given cost.
B. Defining Measurable Objectives
A frequent problem in performance monitoring is the lack of anyclearly defined objectives against which actual performance can bemeasured. In some cases, the organization may prefer its objectives to bekept vague in order to avoid accountability, but in most cases, the problemis that no one has ever tried to specify exactly what the program hopes toachieve. One of the first tasks of the evaluator must be to ensure thatagreement is reached on a clearly definable and measurable set ofobjectives.
The objectives should be defined with relation to the program modeldiscussed in the previous section. Based on this model, four main sets ofobjectives will be identified:
* Implementation objectives* Process objectives* Micro-level impact objectives* Macro-level impact objectives
1. Implementatlon objectives
Every project has a set of objectives related to: the use ofinputs, the production of outputs, and the time periods and costs relatedto the process implementation. Each of these sets of objectives should beclearly specified in terms of the model:
Inputs: Th project has available financial (money tosubcontract parts of the construction, credit lines for material loans,house purchase, etc.); physical (land, materials, vehicles, etc.); andhuman resources (administrators, advisers, community development workers,etc.). All of these have been authorized in specified amounts and overspecified periode of time. All of these resources should be listedtogether with the amounts of each and the periods over which they are to beused.
Outputs: Table A-3 gives an example of the way in which theintended project outputs are specified in the loan agreement.
Implementation timetable: For a project to be successful thespecified outputs must be achieved within the specified timetable. Delayswill increase costs or will slow down the efforts to increase scale to alevel commensurate with the city shelter deficit. For this reason, it is

- 142 --
TABLE A-3: THE SPECIFICATION OF INI'ENDED OUTPUTS - THE EXAMPLE OFTHE LUSAKA UPGRADING AND SITES AND SERVICES PROJECT
Component Target at the Time of Project Appraisal
PHYSICAL IMPLEMENTATION
1. Residential units serviced
a. Squatter upgrading 16,924 plotsb. Overspill areas 7,588c. Normal low-cost sites 1,204d. Normal medium cost sites 1,938
TOTAL 28,851
2. Community facilities
a. Schools 20b. Health centers 3c. Markets 17d. Community centers 17
SOCIO ECONOMIC IMPROVEMENT
1. Residential units allocated
a. Squatter upgrading 16,924b. Overspill areas 7,588c. Phased normal (basic sites) 1,197d. Normal low-cost sites 1,204
2. Allocations of sites and servicesplots to target group
% plots allocated to householdsearning less than Kwacha 70 permonth 50%
3. Core units erected
a. Overspill area 7,588b. Sites and services areas 4,339
4. Value of building material loans Kwacha 5,609,000
Source: Bamberger, Sanyal and Valverde, 1982.
- 143 -
eesential to specify the implementation timetable. Annex H proposes anetwork based monitoring system in which the time allotted to each activityis clearly specified, together with the amount of slippage which ispermitted before delays will be caused in other components.
2. Financial objectives: Annex I proposes methods for usingnetwork based monitoring to specify and monitor all cost-bearing projectactivities. The financial monitoring must be integrated with the physicalimplementation monitoring as delays have serious cost implications.
3. Process objectives
Table A-4 presents a simplified version of the logical networkpresented in Annex H. This shows the main stages in the implementation of asites and services project. The complete network contains 36 steps, butthey have been simplified for the present purpose to only include the 10main components:
* Project design* Land acquisition* Offsite infrastructure (roads, water and sevage trunk
systems,etc.)* Tendering for infrastructure and house construction* Construction of core unit* Selection of participants* Material loans* Completion of habitable units* Occupation* Start of cost recovery
Each of these components has a timetable, and delays in any one willcause delays in overall project implementation. In-addition, eachcomponent has its own specific objectives relating to questions such ascost, quality, accessibility to the target population. In some cases therewill also be objectives related to community participation. The objectivesof each component must be specified in a measurable way so that theirprogress can be monitored. Table A-5 gives examples of how objectives couldbe defined for the selection of participants and the completion of thehabitable unit. The criteria which are used are the same as those used tomeasure efficiency namely:
* Output* Speed* Cost* Accessibility to the target population* Replicability in future projects
In addition, organizational objectives, which may not bequantifiable, are included. For example, in the selection of participantsit may be an objective to hold group meetings so that participantsunderstand the social as well as the economic objectives of the project.The monitoring reports should address these organizational, ornonr-quantifiable, objectives.

Table A-4 SIMPLIFIED VERSION OF A LOGICAL NETWORK SHIOWING THiE liAIN COMPONENlTS (PliOCESSES)
OF A SITES AND SERVICES PROJECT
Offsiteservices la erial
loans
Landacquisition Construction Selection Occupation Cost
_ \ ~~~~of core unit _ of rcvy\ _ / ~~~~~participants re_c,v.e.y
_Projiect\/\/design \i-
\ \ / ~~~~~~~~~~Completion/o 1endering of/
. ~~~~~~~~habitable_ . ~~~~~~~~~unit

TABLE A-5: EXAMPLES OF THE DEFINITION OF PROCESS OBJECTIVES FOR TWO COMPONENTS OF SITES AND SERVICESPROJECT: SELECTION OF PARTICIPANTS AND COMPLETION OF HABITABLE UNIT
Component Timetable Output Speed Cost Accessibility Replicability
Selection of Weeks 101-114 15,00 applicants Average times 150 staff/ 25% selectees Developuent ofparticipants 5,000 pre- per applicant: weeks have » nthly computer processirg
selected * Pre-sel = Other direct income below and selection system2,000 selected 15 mins. costs = 250 pesos which could be500 reserves * Selection = 10,000 pesos - Maximum replicated with sane
90 mins income = time/speed/accessibility1,000 pesos constraints for projects
with 50,000 applicantsper year.
Elapsed weeks:* Receipt to
pre-sel = 4*Pre-sel tosel = 4
Completion Weeks 126-138 200 habitable Average of 24 Costs to No households Loan and technicalof habitable units all of weeks to household should fail assistance proceduresunits which occupied complete and should not to complete streamlined to reduce
occupy unit exceed 2,000 due to lack processing time andfrom approval pesos of own of finance cost in future projects.
resourcesplus loan

- 146 -
3. Micro-level impact objectives
Micro-level impacts are the changes the project hopes to producein participant households. Table A-6 gives examples of 6 types of impactsthe project might wish to produce and of indicators which could be used tomeasure each one. It is important in the formulation of impact objectivesthat the objectives are related logically to the project model and aredefined in terms of measurable indicators.
We vill take the example of employment and income to illustratethese two points. It is hypothesized that the project may affect incomethrough:
(i) Increased rental income from larger and better quality houseswith improved access to services.
(ii) Increased income transfers from relatives to help with houseconstruction and mortgage payments.
(iii) Through one of the employment effects described below.
The project may affect employment in the following ways:
(i) Short-term employment opportunities during the process ofhouse construction. It is expected that a high proportion ofhouseholds, particularly high income and self-employed, villsubcontract parts of the construction.
(ii) Increased business for local stores and services due to thehigher average income of households in the project areas.
(iii) Increased business due to improved vehicular access and, hence,more outside customers and easier delivery of supplies.
(iv) Project located closer to employment centers so that employmentopportunities increase.
(v) Local business may give preference to job applicants from theproject as they believe that house-owners are more reliableworkers.
The ways in which these changes can be measured are indicated in thetable. Once the researcher understands these objectives and assumptions itis possible to design a study to both measure whether the changes havetaken place and to indicate why the outcomes are different than expected.For example, if increased employment opportunities do not occur, it will bepossible to evaluate whether this is due to macro-economic factorsaffecting demand for labor, to the location of the project site or to thefact that employers are less interested in hiring project participants thanhad been expected. Using this type of model, the information is much moreuseful to policy makers than a simple statement that "there was nosignificant impact on employment."

- 147 -
TABLE A-6: EXAMPLES OF SIX MICRO-LEVEL PROJECT IMPACTS AND THEINDICATORS WHICH COULD BE USED TO MEASURE THEM
Type of Impact Quantifiable Indicators
1. Employment and Income 1. Total family income2. Sources of income3. Income stability4. Type of employment5. Number of people working6. Labor force participation rate of
a particular group, eg. women7. Proportion of self-employed
2. Demographic Characteristics 1. Family sizeof the Family 2. Age composition
3. Education of household head4. Proportion of children
attending school5. Civil status of
household head6. Geographical mobility
3. Housing Costs, 1. House valueQuality and Value 2. Construction quality
3. House size4. Access to services
4. Health 1. Infant mortality rate2. Types of intestinal infection3. Time lost from work or
school due to illness4. Access to medical services5. Amount spent on medical services6. Weight and height
5. Consumption Patterns 1. Amount spent on housing2. Amount spent on food3. Amount spent on clothing4. Amount spent on transportation5. Amount spent on health6. Amount saved
6. Community Participation 1. Number of friends in the-project2. Participation in political, social
and religious organizations3. Participation in mutual help4. Satisfaction with the community5. Satisfaction with economic
and political situation

- 148 -
4. Macro-level impact objectives
In addition to their direct impacts on project participants,most projects are also intended to have some wider impacts on:
(i) Total low-income population (improved access to housing,lover rents, etc)
(ii) Management of the city (increased taxation, improvedtransport systems, etc)
(iii) Housing and urban developmnent policy (changed attitudes'tosites and services and upgrading; revision of housingsubsidies; provision of new sources of housing finance;increased involvement of the private sector, etc.)

- 149 - Annex B
METHODS OF DATA COLLECTION FOR MONITORING AND EVALUATION
A. The Importance of the Choice of Research Methods
"A knowledge of technique needs to be complemented by anappreciation of the nature of research as a distinctivelyhuman process through which researchers make knowledge.Such appreciation stands in contrast to the more commonview of research as a neutral, technical process throughwhich researchers simply reveal or discover knowledge.Such appreciation requires that we reframe understandingand debate about research in a way that goes beyondconsiderations of method alone."
Morgan 1983, p.7.
Social science has become increasingly concerned with refiningresearch techniques, but relatively little attention has been paid to thequestion of how to choose the best technique for a particular purpose. Thedecisions about which research methods to use can have a profound effect onthe types of information which are obtained and the conclusions which aredrawn. For example, many studies, for reasons of convenience of analysis,use a precoded questionnaire in which respondents are asked to indicatewhether they agree or disagree with a particular statement, or to indicatewhich of a list of community problems they consider most important. Thistechnique forces respondents to choose between a limited number ofpredetermined options, and does not permit them to indicate that they aremore concerned with other issues or even that the question itself does notmake any sense to them. If, instead of using a questionnaire, theresearcher had lived in the community for three months and had tried todescribe the main concerns which people expressed in their day-to-dayactivities and in community meetings, it is quite possible that some verydifferent conclusions might have been reached.
In an interesting book edited by Morgan (1983), twenty one authorsdescribe the methods they would use for research on organizations and theassumptions underlying their choice of methods. The book shows how thechoice of research method influences the issues studied and determinesoutcomes, often in ways which are not intended or appreciated by theresearcher. As one of the authors states "We never talk about the world -social or physical - only about our construction of it." (Bourgon 1983).The researcher muet be aware of the strengths and weaknesses of each methodand must constantly seek ways to validate the conclusions drawn from usinga particular technique. In the following sections some of the main researchmethods are described, together with some of their strengths and weaknesses(See Table B-1).
Many researchers have their preferred methods which they seek toapply to whatever problem they are studying. It is essential that theevaluator adapt his/her methods to the problem rather than seeking aproblem which can be studied with the preferred research methods. There isno one ideal method and all techniques have their strengths andweaknesses. Consequently the evaluation researcher is strongly advised tocombine several different methods in the evaluation design.

- 150 -
TABLE B-1: APPLICATIONS AND LIMITATIONS OF SOME OF THE PRINCIPALEVALUATION RESEARCH METMODS
Method Applications Limitations
1. Quasi-experimental Statistical estimation of Difficult and expensivedesigns project impact. Eliminates to use in practice.
many of the spurious Does not provide in-claims of project impact formation on causationwhich can arise when no or the effects of thecontrol group is used. project implementation
process on outcomes.
2. Sample surveys using Statistically reliable A structured questionnairestructured estimates of the forces respondents to usequestionnaire attributes or attitudes a conceptual framework
of different groups. imposed by the researcher.Eliminates many of the There are many types ofincorrect inferences which information which cannot becan arise from studies obtained reliably with thisbased on non-randomly type of instrument.selected small groups.
3. Intensive case studies Provides a more complete The studies can be veryof households or groups understanding of how a time consuming. As the
group or household number of cases will oftenoperates and what they be very small it can befeel about key issues. difficult to generalize andIllustrates how the group/ to know how representativefamily interacts with the findings are. Validityother coummity groups problems exists as mich ofand with external the information will comeorganizations. from subjective opinions of
the observer.
4. Observational and Many of these techniques There is often a tendencyrelated techniques are economical and fast to to rely on whatever
apply. They can also indicators can be easilyprovide consistency checks observed, even though theseon survey and other may not be the best for amethods. particular purpose. There
are often difficultproblems in interpretingthe meaning of what hasbeen observed.
5. Secondary data Existing secondary data There are often problemscan often answer lany of of reliability or coveragethe questions which would and the information may bebe covered by a new and out of date.expensive survey.
6. Participant observation Living in, or mairntaining Can be relatively timeclose contact wit1L a consuming and expensive.community over a period of Problems of validity ofseveral weeks or umnths subjective perceptions ofcan provide an undlerstand- an observer. How re-ing of how the coumunity presentative are the smallperceives a project in a nuaber of cases selected.way which could never beobtained with othetr moreformal approaches. Can alsoprovide an understanding ofmany delicate or complexissues which wouldc not bedetected by surveys.

- 151 -
A continuing debate in the evaluation literature concerns therelative merits of quantitative and qualitative methods. Journal articlesand books have been devoted to advocating one of these methods over theother and many of the leading evaluation practitioners are identified withone or other of these two supposedly conflicting approaches. In a recentarticle Reichardt and Cook (1979) show that the supposed correspondancebetween qualitative and quantitative research paradigms and qualitative orquantitative methods does not in fact hold in practice. Advocates of thesubjectivist qualitative paradigm will frequently use small sample surveysto complement their participant observation and many practitioners of"hard" statistical analysis will use open interviews to help develop andvalidate their instruments and assist in interpreting their statisticalfindings. The two approaches complement each other and should be usedtogether for most evaluation purposes. Quantitative and qualitativemethods normally have different objectives as well as having differentstrengths and weaknesses.
Sections 3 onwards describe the principal methods, starting withqualitative methods and moving through the spectrum to the morequantitative approaches.
B. The Use of Triangulation to Build in Consistency Checks
No research method is infallible, and consequently the evaluationdesign should always include consistency checks in which at least twoindependent methods are used. This technique of developing consistencychecks through independent measures is called triangulation. The reason forthis name can seen in Table B-2. In example 1, changes in household incomeare estimated both from a sample survey and from observing changes in therange and quality of goods on sale in community stores. In this case bothestimates converge or triangulate towards the same conclusion - namely thathousehold income has increased.
In the second example, a sample survey and participant observationare used to estimate changes in the income of female headed households.According to the survey, the income of female headed households hasdeclined. However, the participant observation study reported that womenengaged in a number of illegal or quasi-legal forms of income generationsuch as beer brewing and running of bars. In this example, the twoestimates are divergent, with the survey stating that incomes have gonedown and the participant observation suggesting there may be importantsources of income which have not been reported. As beer brewing and theownership of unregistered bars are both illegal, it is not surprising thatneither of these sources of income was reported in the survey. This is anexample where the researcher would be advised to consider modifying hissurvey instrument or using alternative methods of estimation.
C. Participant Observation and Related Ethnographic Techniques
Partly as a reaction to some of the problems encountered in purelyquantitative evaluations, a number of qualitative evaluation approacheshave become popular in recent years. One of the best known is participantobservation which is defined by Bogdan and Taylor (1975) as:

Table t-2 Use of Triangulation to check the consistency of estimates of project impact on household income
Example 1: Survey and direct observation provide converging (consistent) estimates.
1. Administration ofquestionnaire to sampleof households. Conclusion
Income estimated to Both estimates areincrease by 25% |consistent and show
income has increasedBetter quality goodson sale suggestingincreased purchasing
2. Observation of goods on jcapacitysale in community stores
Example 2: Survey and direct observation provide diverging (inconsistent) estimates.
jResults show income of Conclusionfemale headed households has fallen as can no longer Women receive a considerable
1. Administration of sell goods from store in proportion of their incomequestionnaire to sample " ' the_house from illegal sources whichof female headed / they do not declare to^ households _ interviewers or project
management. This suggests2. Participant observation incomes of at least some
of community activities women have fallen less thanin the evenings it at first appears.
- w L~~~~~~~~~arge numers of illegalbars, largely run by women.

- 153 -
"Research characterized by a period of intense socialinteraction between the researcher and the subjects, inthe mileau of the latter. During this period, data areunobtrusively and systematically collected."
The evaluator lives in or is closely involved with the community or groupbeing studied over a considerable period of time in order to understand theculture of the group and the meanings its members give to the subject beingstudied. In the case of an urban development project, the purpose is tounderstand how people perceive the project, who does and does not benefitand what effects it has on individual families and the community ingeneral. The approach is based on a long sociological tradition of"verstehen" (the orginal term used by Max Weber), in which the researcherseeks to understand the subjective meanings which people give to theorganizations and activities in which they are involved and to the world inwhich,they live.
Most of the data is obtained through unstructured interviews andthrough direct participation in, and observation of, group activities. Theresearcher may relate to the community or group as a normal group member(for example the study by Lisa Peattie, 1969 on the way in which thecommunity in which she was living in Venezuela organized itself to combatthe construction of a sewage outlet); as a clearly identified outsider (forexample the study by SalmXen, 1984 in which he lived in a community in LaPaz which was in the process of being upgraded); or under some falsepretext (as when researchers pretend they wish to join a religious sectthey are studying).
An interesting approach to participant observation in urbanprojects is the study by Salmen (1983) in which he lived in World Bankupgrading and sites and services projects in La Paz and Guayaquil. Amongthe many insights his study was able to contribute are the following:
* It was found in one project that community leaderswere opposed to the project on political grounds andwere deliberately misinforming the community as tothe nature of the project. Project management had notbeen aware that this was the reason it had never beenpossible to initiate the project.
* In another project the community leaders, althoughwell intentioned, were all property owners fromhigher income groups and did not represent theinterests of poorer renters.
* A much higher level of frustration with projectdelays was found than had been expected by projectmanagement.
* In the unstable economic and political contexts ofthese two cities, property ownership offered one ofthe few opportunities to achieve a sense of personalsecurity. Consequently, an extremely high value was
- 154 -
placed on ownership.
* Living in one of the newly designed houses revealedmany of its design shortcomings (lack of ventilation,poor drainage, high noise level from neighbors) in away which was never appreciated from casual visits.
Participant observation has a number of advantages. First, theobserver is better able to understand the meanings which individuals andgroups give to the subjects being studied (for example, attitudes to theinstallation of piped drinking water, a community development center etc)and is less likely to fall into some of the kinds of misinterpretationwhich'may arise if the study is based simply on responses to a structuredquestionnaire. Second, the observer is better able to study delicate issues(such as attitudes to community leaders or the origins of communityconflicts) which people may be unwilling to respond to directly in aquestionnaire. Third, the observer is able to observe and evaluateprocesses as well as particular events. This is extremely difficult to dowith a questionnaire. Fourth, it is possible to study feelings andattitudes which respondents may have difficulty in verbalizing. Finally,the approach is flexible so that it is possible to adapt to changingcircumstances in a way which cannot be done with structured surveys.
Despite its recent popularity, participant observation also suffersfrom a number of limitations. First, it is difficult to identify andcontrol for observation bias introduced by the researcher. As the observerusually works alone it is much harder to introduce the kinds of consistencychecks which can b4 used to control for interviewer bias in samplesurveys. One aspect of this problem is that the researcher may bringbis/her preconceptions to the study and may inadvertently structure theconversations or the observations to support these preconceptions. Second,it is difficult to evaluate the distortions caused by the presence of theobserver. Behaviour is likely to be changed by the presence of an outsiderin ways which are difficult to assess. Third, the observer can only observepart of the reality being studied. It is not possible to attend allmeetings, or to be present during all activities of the subjects beingstudied. In fact there is likely to be selectivity as it is much easier toobserve certain activities (for example public meetings) than others(negotiations between the leaders of rival political groups for example).Again it is difficult to be aware of or to control for the biases whichoccur in this way. Fourth, the largely subjective way in which informationis collected and reported makes comparability difficult. Thus it isdifficult to systematically compare reports produced by differentobservers. This makes quantification difficult and limits the utility ofparticipant observation in large scale projects. Difficulties ofcomparability and quantification lead to a fifth problem which is theinability to use many of the statistical techniques to match groups andcontrol for spurious causality. For example, the observer may notice thattwo groups of residents respond in different ways to a project and he/shemay hypothesize that the differences are due to cultural factors. However,statistical analysis might have shown that after controlling forsocio-economic variables such as income, age and education the differencesno longer exist.
- 155 - !
A recent review article on the US experience in the evaluation ofsocial development projects during the past 20 years (Rossi and Wright,1984) highlighted some of the limitations on the use of qualitative methodsfor impact evaluation.
"It is however,equally clear that qualitative evaluationshave their limits as well. However inexpensive they may befor single, small-scale projects, they are very expensiveand not very sensible approaches to the evaluation offully developed programs that have quite specific goals.Qualitative evaluations are very labor intensive andcannot be used on very many sites except at considerablecost. Furthermore, qualitative approaches rarely provideestimates of the effects that are either very precise orfree and clear of possible confounding factors. Indeed,the only large-scale programs to which qualitativeapproaches were applied had vaguely stated goals e.g.Model Cities (Kaplan 1973) and revenue sharing (Nathan etal 1981). In these evaluations, the findings were composedmore of descriptions of program operation than ofassessments of programs effects."(Rossi and Wright,1984 page 343)
D. Direct Observation
In their classic study, Webb and Campbell (1966) suggested a widerange of "unobtrusive measures" which could be used as indicators of morecomplex processes or events. Examples of such indicators might include:
* The amount of wear on steps as an indicator of the use which ismade of a community facility.
* Analysis of garbage dumps as a source of information onconsumption patterns.
* Using the number of tin roofs or tin utensils as an indicator ofwealth.
* Using the types of washing left out to dry as an indicator ofconsumption patterns and wealth.
* Types of commodities on sale in local stores as an indicator ofthe economic level of the community.
The problem in the use of these indicators is: How do we know whatis a good indicator? For example, a common issue in urban housing projectsis to determine whether the project benefits are reaching the intendedincome groups or whether many of the benefite are going to higher incomegroupe. A number of indicators have been proposed which reflect theconsumption patterns and economic level of the project population. Some ofthe possible indicators which can be used to detect the presence of higherincome householde in the project include: iron window grilles, exoticplants which do not naturally grow in the region and which have beenpurchased, and exepensive furniture. The problem is that there are at least

- 156 -
two possible interpretations of the meaning of an increase in the number ofobservable middle class symbols. The first possible explanation is thatmiddle-class (higher income) households have moved into the project.However, a second possible explanation is that poorer households may havebegun to adopt some of the consumption palterns of their better offneighbors.
In cases such as this, it is usua:Lly necessary to investigatefurther in order to determine what the indicators really mean. This doesnot invalidate the usefulness of these inlicators, but simply points outthat their use and interpretation is often more complex and expensive thansome writers would suggest. The use of rapid observation techniques shouldnot be used as an excuse for avoiding scientific rigor. The researchershould always state the assumptions upon which the selection andinterpretation of indicators was based, tlhus permitting independentverification. Where a number of similar projects are planned it becomesworthwhile to invest resources in the careful selection and validation of aset of indicators which can then be used to evaluate a number of similarprojecto.
Observational indicators are useful for the evaluation of thephysical conditions of the community. An observation guide can beconstructed with items such as the follow:Lng:
* Conditions of the streets.* Cleanliness of streets and publ:Lc areas.* Maintenance and use of community facilities.* Construction materials used in houses.* Proportion of houses which are occupied, complete, in process ofconstruction.
* Frequency of public services such as street lights, bus stops,public telephones, etc.
When judgements have to be made, "Eor example on cleanliness of thestreets, it is important to give precise Lnstructions and if possible toprovide photographe illustrating what is meant by "clean", "reasonablyclean", etc.
The inclusion of photographs in the evaluation report is also auseful way to illustrate the conclusions. A good photograph is often muchmore effective than a table or a page of ltext. However, there is a dangerof selecting photographs which are dramatiLc rather than typical so caremust be taken to avoid the use of photographs which can misrepresent.
E. Informal Group Discussions
The organization of informal group meetings can often produceinformation not easily elicited from individual interviews. The groupdiscussions are less directed by the researcher and hence morespontaneous. Participants tend to stimulate and also correct or challengeeach other so that many issues are broughlt up which would not have beenaddressed in an individual interview. It also becomes easier to addressorganizational issues and group attitudes, as the information and points ofview of many different people can be compared.
- 157 -
One method is based on asking a set of "What if?" questions togradually foeus on the rules governing organizational or communitybehaviour. For example, the following questions could be use to provideinsights into the ways in which organization "X" interacts with thecommunity:
"What would happen if the roads in this sector were constantlyflooding"?
"Would you contact agency X"?
"What if the flooding was in sector Y; would that make anydifference"?
What if the flooding occurred in the year of an election"?Etc., etc.
F. Unstructured ("Open") Interviews
Unstructured or "open" interviews are a technique in which informalconversations are conducted without the use of a questionnaire. Theinterviewer has a checklist of questions which are covered during aninformal conversation rather than in a question and answer session. Theinterviewer may refer to the checklist and possibly even take a few notes,but usually the interview report will be written up afterwards so as tokeep the situation as natural and informal as possible. In those caseswhere it is necessary to analyze language usage, the interviewer may decideto use a tape recorder. Whenever a formal questionnaire is to be used,unstructured interviews should always be included as a preliminary stage ofthe research design to understand the key issues as they are perceived bythe population being studied and to ensure that the right questions arebeing asked. Further unstructured interviews may be conducted at the end ofthe study to help interpret the findings.
Unstructured interviews usually cover "key informants" representingmain groups involved in or affected by the project. A number of "ordinarypeople" should also be included so as to ensure that their point of view isincluded as well as that of the more vocal leaders. Typical key informantsmight include:
* local community and political leaders* local religious leaders* storekeepers and other local businessmen* local government officials* academics* newspaper reporters
The problem with the use of key informants is that informationalmost always contains a bias. Political leaders, for example, are likelyto praise programs when their party is in power, and criticize activitiesof the opposition. Similarly, government officials may play down communitydissatisfaction. Minorities and weak groups will tend to be under-

- 158 -
represented. The following are useful guLdelines in the interpretation ofdata from key informants:
* Always note the position of the informant (local politician,storekeeper, property owner, eltc.) and try to estimate how thisposition may bias the informat:Lon.
* Obtain several independent opinions on all major topics. Wherethe information is inconsistenit, try to understand why this isso.
* Randomly select people who are not key informants. Informationfrom these people should be coinpared with opinions of supposedcommunity leaders. Also try to learn from these respondents howthey feel about the leaders.
* Analyze the characteristics of key informants to determinewhich groups are not represented. For example:
- Have women been interviewed?- Do interviews include low-income as well as better-offrespondents
- Have all tribal, ethnic, or religious groups been covered?- Have people from all geographical sectors of the community/city been consulted?
* Remember that people who claim to be community leaders orspokesmen almost never represent the whole community but onlysome part of it. Never accept the opinions of leaders about aproject or similar issue as truly representing the opinions ofall of the community.
G. Structured Questionnaires
A structured questionnaire is one in which all or most of thequestions are precoded so that the respondent must select from among anumber of predetermined categories. For example, during an unstructuredinterview the respondent may be asked to state what he/she considers to bethe main problem facing the community; whereas the structured questionnairewould ask the respondent to indicate which of a list of predeterminedproblems he/she considers most important.
For an impact evaluation the questionnaire will usually contain fourtypes of questions:
(a) Classification information: participant status, type of projecthouse, who is being interviewed, etc.
(b) Exposure to project variables: indicators of the types andamounts of services received or to which exposed (for example, amount ofhousing credit, distance from communal water tap etc.).
(c) Outcome variables: indicators of project impact.

- 159 -
(d) Intervening variables: attributes of the household, thebusiness, the community, etc., which might affect project outcomes.
Questions can be asked in a number of different ways. They can beopen or closed; they can be asked verbally by the interviewers or therespondent can be asked to complete the information by indicating hischoice from a list or by writing replies on the questionnaire. In moresophisticated questionnaires it is possible to include an attitude scalewhere the respondent is asked to chose from a number of alternativeresponses which have been ranked or where he has to indicate the degree ofagreement or disagreement with a statement. A well constructed attitudescale permits a much greater degree of sophistication in the analysis.However, in order for the results to be valid and meaningful a great dealof time and effort must be put into the design of the scale. Many attitudescales appearing in evaluation questionnaires are of almost no use as theyhave not been designed properly.
The process of designing and validating a questionnaire is also timeconsuming. The main stages are the following:
(a) Define carefully the objectives of the study, the key issues andthe types of variables to be studied.
(b) Conduct unstructured interviews, participant observation anddirect observation to understand the meanings which respondents attach tothe concepts being studied, and to test out various ways of asking thequestions.
(c) Prepare a first draft of the questionnaire and check the list ofquestions against the objectives of the study. This is to ensure that allquestions are covered and also to eliminate any unnecessary information.
(d) Prepare an interview guide explaining how the survey is to beconducted and how each question is to be asked.
(e) Conduct a pilot test of the questionnaire. The survey designersmust conduct some of the interviews themselves.
(f) Discuss the results of the pilot study in detail with theinterviewers and make whatever changes are suggested in the instrument.
(g) With a complex questionnaire it may be necessary to conductseveral pilot tests.
(h) Organize a training session for the interviewers. This shouldinclude conducting a number of test interviews, the results of which willbe reviewed in the training session.
The use of a structured questionnaire offers a number of majoradvantages in evaluation research:

- 160 --
(i) It permits a rigorous comparison of responses obtained bydifferent interviewers or in different comLmunities or cities. Techniquesexist for testing the reliability of the information and for determiningwhether bias is being introduced by any of the interviewers.
(ii) The information can be quantified, thus permitting theuse of more sophisticated analytical procedures.
(iii) The comparability of responses means that changes can bemeasured over time or comparisons made between different groups.
(iv) Many types of spurious causal relationships can becontrolled for statistically in a way which is usually not possible withunstructured methods. For example, it is possible to control for socialand economic attributes of the household or community to determine whetherobserved differences are in fact due to the project or simply to theinitial differences between the groups.
Despite their wide use and potential advantages, structuredquestionnaires have a number of problems:
(i) The framework of the instrument is very rigid and it isusually not possible for the interviewer to record any deviations from thestandard questions. Respondents may wish to give replies other than thosein the list of options or they may wish to give information not included inthe survey at all. Usually this information cannot be analyzed. In extremecases this could mean that even though all. of the questions have beenanswered, the information is almost useless.
(ii) An interview is a very unnatural situation, not conducive togaining confidence. In many development situations the interviewer will beclassifed as a representative of the government who is collectinginformation which may be used to the disadlvantage of the respondent. Thesefactors make it difficult to gain the respondent's confidence and to obtainhis/her full cooperation.
(iii) Due to this lack of cooperation, some of the key informationmay be inaccurate or falsified. Respondents may not, for example wish togive accurate information on their incomes or how long they have beenliving in the city. Unless the interview is complemented with othertechniques, there is a danger of inaccurate information.
(iv) It is particularly difficult to obtain information onsubjects which are socially delicate (such as sexual behaviour or childrearing) or which are politically sensitive (such as opinions aboutcommunity leaders or political participation).
(v) A questionnaire forces people to verbalize their responses.This can be very difficult, particularly for groups with a low educationallevel. Consequently questions such as: " E[ow do you feel about ..........If you were able to choose between these types of house which would you
prefer ..... , "What are the main things you dislike about thiscommunity..." may,be very unreliable.

- 161 -
(vi) The questionnaire is not able to compare people's behaviourwith their verbal responses. A mother may assure the interviewer thatchildren are only fed the correct types of food. A participant observermight have observed that in fact childrens' diets were much less carefullycontrolled.
(vii) The design and application of a large scale survey will oftenbe expensive.
(viii) Analysis of the results may be very time consuming andexpensive. This can be particularly problematic in countries where surveyanalysis infrastructure does not exist.
H. Secondary Sources
Useful inforimation can frequently be obtained from sources such asproject records, government agencies and previously conducted studies. Insome cases, qiewspapers may also provide useful information (for example,prices of rental property, political, religious and social activities,etc.). The researcher should always check for the existence of secondarysources before planning to collect new information.
- 162 -
I. Further Reading
1., Participant Observation
Oscar Lewis. 1961. The Children of Sanchez.A classic study in which participant observation and tape recordedinterviews are used to describe the 11fe of a family in a Mexican slum.
Eliot Liebow. 1967. Talley's Corner.Study of the life of a group of black males in Washington, DC. Thestructure of the book around topics such as work and family lifeprovides an easily digestible way to present the findings of the study.
George McCall and J.L. Simmons (Editors). 1969. Issues inParticipant-Observation: A Text and Reader.Comprehensive review of methodological and validity issues as well asan extensive presentation of case material.
Lisa Peattie. 1969. The View from the Barrio.Description of the life and organization of a low-income community inVenezuela in which Peattie lived while working as a consultant on thedevelopment of a new city. She becomes involved in the efforts of thecommunity to obstruct the construction of a sewage outlet which wouldcontaminate their water supply. The study is interesting as she wasactively involved as a community resident rather than just as anoutside observer.
Lawrence Salmen. 1984. "Participant Observer Evaluation of UrbanProjects in La Paz, Bolivia, and Guayaquil, Ecuador".Summary of the experiences of the first systematic attempt by the WorldBank to use participant observation in the evaluation of urban shelterprojects
2. Unobtrusive measurement and direct observation
E. Webb and Donald Campbell. 1966. Unobtrusive Measures: Non-ReactiveResearch in the Social Sciences.Presentation of a wide range of unobtrusive methods which can be usedfor evaluation and other types of social research.
Michael Patton. 1980. Qualitative Evaluation.One of the leading, and most readable, exponents of qualitativeevaluation.
Joseph Valadez. 1982. "Non-Survey Techniques in the Evaluation of UrbanShelter Programs".An application of the Webb and Campbell approach to the evaluation ofurban projects.

- 163 -
3. Questionnaire design
Michael Bamberger and Julie Otterbein. 1982. " Designing a Questionnairefor Longitudinal Impact Studies".Explanation of the stages involved in the design, testing andapplication of an impact survey. Includes a model questionnaire.
Stephen Malpezzi, Michael Bamberger and Stephen Mayo. 1982. "Planning anUrban Housing Survey: Key Issues for Researchers and Program Managersin Developing Countries".Explanation of how to design an urban housing survey. Includes a modelquestionnaire.
David and Chava Nachmias. 1981. Research Methods in the Social Sciences.A good textbook covering the main data collection methods andanalytical procedures.
4. Quantitative versus Qualitative Issues
Charles Reichardt and Thomas Cook. 1979. "Beyond Qualitative VersusQuantitative Methods".Presentation of the main issues involved in the debate and ademonstration that quantitative and qualitative methods complement eachother much more than many people seem to believe.

- 164 -- Annex C
M&I&CERS GUIDE TO THE DESIGN AND IMPLEMENTATION OF ANONITOBIDG AND EVALUATION SYSTEN
This section provides a guide for the managers of project executingagencies on the main stages and decisions in the design andimplementation of a monitoring and evaluation system. Seven mainstages, which are approximately sequential, are defined. Most of theissues discussed in this Annex are also applicable at the level of thesectoral and national development agencies. These stages aresummarized in Table C-1.
A. Intitial Decisions on the Scope, Organization and Objectives of theEvaluation
1. When to begin planning thr Evaluation
Planning for the monitoring and evaluation should begin duringthe early stages of project appraisal. When the evaluation design is notdefined until the project launch, problems and serious delays often ariseas staff and budget have already been committed. In several cases theprocess of staff recruitment has taken over a year (due to the need tonegotiate and create new staff positions) so it is essential to begin theprocess as early as possible.
2. Defining the objectives of the evaluation
The following are some of the main ways in which evaluationdata can be used. The manager must decide the relative importance to begiven to each of these objectives:
(a) To provide regular information on the progress of eachelement of the project, and to compare the progress withstated objectives in terxs of time, volume and cost.
(b) To provide constant updates and revisions of completiondates and costs and disbursement schedules.
(c) To identify potential problems and to suggest possiblesolutions.
(d) To provide constant feedback on the efficiency of projectimplementation and to suggest improvements which could bemade.
(e) To provide constant feedback on the effectiveness of theproject in achieving its stated objectives.
(f) To provide estimates on project impact in areas such asincome generation and employment.
(g) To assist in the planning of future projects.

- 165 -
TABLE C-1: MAIN STAGES IN THE PLANNING AND IMPLEMENTATION OF AN EVALUATION
A CHECKLIST FOR PROGRAM MANAGERS
1. INITIAL NANAGEMENT DECISIONS* When to begin planning* Scope and objectives* Who should conduet theevaluation
* Position of the evalu-ation unit within theorganization
* Duration* Approximate estimates ofstaff and budget
2. DEFINITIO OF ORSAUNA» GSIONALsTRUcruIOsr Position of evaluation unit
descriptions and key issues* Discussions and negotiation * Methodologywith personnel management * Geographic coverage
* Submision and negotiation (For impact studies)of budget Model of project impact
5. WTEGEATING THE EVALUATION ITO 6. DEFININ NAM USERS AND THEIRTKPEDJECT DVLPKTCYCLE INFORNAION NIEU*Defining studies requiredat each stage of cycle
7. PLANNING AND RSVIEFI CYCLES* Defining the duration ofthe planning cycle
* Defining review cycles* Defining publications* Building in generalreview of the evaluation

- 166 -
(h) 'To assist management in obtaining additional informationon problems or particular aspects of project performancewhen the need arises.
3. Defining the level of complexit:y and the coverage of theevaluation
Organizations vary considerably, in terme of the size andcomplexity of their programs and information needs, as well as in terms ofthe professional and financial resources available for the evaluation. Theprogram manager must reconcile information needs with availableresources. If the monitoring and evaluaticon is too complex there is adanger of overloading the capacity of the organization to conduct andabsorb the studies. When this happens one or more of the followingproblems are likely to arise:
* Excessive delays before the results are published,thus reducing their operatic>nal utility.
* The quality of the studies suffers.
* The organization is not able to absorb and use all ofthe information so that much is wasted.
* Feedback between researchers and management becomes lessfrequent, again reducing the practical utility of thestudies.
* The evaluation becomes excessively expensive in terms ofmoney and demande on the timne of key staff.
* The cumulative effect is to create a negative image of theevealuation and hence reduce staff cooperation in conductingand reviewing studies.
When the studies begin, they should be kept as simple andeconomical as possible. In this way the evaluation team can gainexperience with the implementation of a set of basic studies and at thesame time avoid the danger of overloading the capacity of the organizationto review and use the results. The volume and complexity of the studiescan be increased at a later point if there is a need.
In this respect it is sometimes better not to include complexlongitudinal impact studies in the evaluaition of the firet project. For afirst project it is usually more importanit to develop an effective systemof performance and process monitoring as the main concern of management isto know how well the basic operating systiems are functioning. Impactstudiés become more important for a seconi project. By this time the basicoperational model has been tested and planners may now wish to know thepotential development impacts of the projects in areas such as employmentand income generation. The manager should try to define what are theminimum information requirements for the evaluation and to ensure that nounnecessary studies are included.

- 167 -
4. Who should conduct the evaluation
Monitoring should normally be conducted "in-house" although itis possible to use consultants for special tasks. On the other hand,impact evaluation studies will often be subcontracted. The manager shoulddecide:
(a) Can the complete monitoring and evaluation program beconducted in-house?
(b) If this is not possible, which parts should besubcontracted and who should do them?
(c) What use, if any, should be made of consultants orexpatriate advisers? (See Chapter 5 Section B).
5. Position of the evaluation in the organizational structure
The main options for the organization of the Monitoring andEvaluation at the level of the project executing agency are given inChapter 5 SectionW B. Some of the questions to be answered are:
(a) To whom should the evaluation report?
(b) Should a special evaluation unit be established?
6. Duration of the monitoring and evaluation program
The studies normally continue throughout the physicalimplementation of the project, but vill often end when the loandisbursements are completed and the infrastructure is installed.Monitoring and evaluation is often financed under the project loan andconsequently comes to an end when the project is administrativelycompleted. Many of the project impacts, however, can only be measuredwhen participants have had access to the new houses or services forseveral years. The issue of duration of the evaluation is thereforeimportant. The following are some of the questions to answer:
(a) Are the studies expected to continue throughout theimplementation of the project?
(b) Is there interest in measuring project impact? If so,can the impact evaluation continue beyond the terminationdate of the project?
(c) Will the evaluation unit become permanent and continue toworkon other projects, or vill its life end with thepresent project?

- 168 -
7. Estimates of staff and budgets
Chapter 5 Section F indicates typical staffing levels fordifferent types of monitoring and evaluation exercises. In estimatingbudgets it is necessary to distinguish between: (i) money available forhiring consultants; (ii)discretionary funds available within thedepartment (travel, etc.); (iii) authorization for use of certainresources (computer, vehicles, travelallowances, etc.); and (iv) budgetline items for hiring or assigning staff to the evaluation.
The following questions must be answered:
(a) How many staff positions are to be created at eachprofessional level?
(b) What temporary staff authorizations are required(interviewers, data coders and processors etc)?
(c) How much money will be requested for consulting servicesand how can these funds be used (can they pay forinterviewing or be used to pay for the research servicesof other government departments, for example)?
(d) How much discretionary funds vill be requested for usewithin the executing agency and for what purpose?
(e) What authorizations are requested for items such ascomputing and travel?
(f) Will funds be requested for scholarships, travel abroadand training?
(g) What budget line items are being requested for hiringpermanent staff?
B. Definition of the Organizational Structure (See Chapter 5Section B-2)
4tThree main issues have to be resolved by the project manager:
1. The position of the monitoring and evaluation unit, or units,in the organization.
2. Coordination between the monitoring and evaluation unit(s) andother divisions.
3. Role of the Steering Committee.

- 169 -
C. Defining and Mobilizing Financial and Human Resources
The negotiating and administrative procedures required to obtainstaff and budget should be started as early as possible as they caninvolve considerable time and effort on the part of program management. Itmay be necessary to lobby the Personnel Management and Planningauthorities to ensure they understand the program and the justificationfor the numbers and qualifications of the required staff. The followingare typical steps which must be taken:
1. Preparation of job descriptions.
2. Discussion and negotiation with Personnel Management.
This process can be very time consuming, as it will often befound that the types of staff required do not fit easily into civilservice categories. Consequently, it is necessary to discuss andnegotiate special ways of defining jobs and hiring the right types ofstaff.
3. Submission and negotiation of budget.
D. Research Design
Before the evaluation begins, it is essential to have a clearlydefined research design. Although much of the design is a technical matterfor the research team, it is essential to have guidance from management oncertain key issues, of which the following are some of the most important.
1. Definition of research objectives and key issues.
2. Methodology - the contribution of management is to ensureresources are being used in the right way. In particular, it is importantfor management to ensure that scarce resources are not being used onunimportant questions or to achieve unnecessary levels of precision.
3. Geographic coverage - if a project covers many sites or severalcities, it will be necessary to establish research priorities. Should allproject sites be covered or should the research concentrate on just a fewsites? This is an important issue, because if the coverage is too vide theanalysis will be much more superficial. On the other hand, if someprojects are not covered, the use of the evaluation as a management toolwill be greatly reduced. Often the best solution is to achieve a minimumcoverage of all project sites and to select a few sites for in-depthstudies.
For impact studies, two further issues may arise:

- 170 -
5. Determination of sample size - (Annex D).
Although the estimation of sample size muet be theresponsibility of sampling specialists, management must provide guidanceon the levels of precision which are required. This is determined by thetypes of decisions which will be made on the results of the studies. Ifguidance is not received from management, the samples may either be toosmall and not answer the important questiLons, or too large and wastemoney.
E. Integrating the Evaluation into the Project Development Cycle
Table C-2 presents a typical project development cycle. Five mainstages are shown:
(a) Planning(b) Design(c) Implementation(d) Cost recovery and maintenance(e) Planning new projects
At each of these stages, management requires different types ofmonitoring and evaluation information. A successful monitoring andevaluation program should respond to the different information needs ateach stage of the project cycle. Six ma:Ln types of studies can beidentified, each relating to one of these stages:
1. Planning studies
At the point when a project is being planned, managementrequires information on factors such as affordability, characteristics ofartesans, access to health services, factors determining project location,etc. Much of this information may not be available when the first projectis being planned. However, the studies produced during the first projectcan contribute to the design of future projects.
2. Design studies
These are similar to planning studies, but tend to be morespecific and related to matters such as project layout, choice ofmaterials, amount of artesan credit etc.
3. Performance monitoring
When project implementation begins, regular reports will berequired on the progress of physical impLementation, financial status andthe causes and possible solutions of delays or problems in theimplementation process. This information can be supplied through themonthly and quarterly project progress reports.

TABLE C-2: INFORMATION REQUIREMENTS AT EACH STAGE OF PROJECT UEVELOPMENT
FWPJEcr FL&MIlI- - - - - -IMPLENENTATION - - - -- - -LA NNTDEP
INFRASTRUCTURE REVIEW ANDMODIFICATION
CONTRACTOR CONSTRUCTION OF DESIGN AND COST PLANNINGOF SHELTER UNIT IMLEMENTATION RECOVERY NEW
PLANNING DESIGN POLICY PROJECTSSELECTION OF PARTICIPANTS MAINTENANCEPROGRESSIVE DEVELOPMENT
CONSTRUCTION
COMMUNITY ORGANIZATION
Type of Plannig Design Control of Ac| oumtabhity Quality Project PlannirgStudy Progresa to Donors Control Effectiw.ness Studies
Demand Materials Physical Comparison with Efficiency Impact on DemandAffordability Cost progress objectives and of imple- participants Afforda-Types of Form of con- Bottlenecks implementation mentation Impact on low- bility
service struction Problems schedule Quality of income families LocationLocation Service Disburse- Costs houses and Impact on the EmploymentEmployment layout ments Financial services city components
creation control Impact on housingpolicy
Accessibility totarget popula-tion
- 172 -
4. Accountability to lending agencies
Most lending agencies, whether they be national orinternational, require regular reporting on the progress of the projectsand particularly on their financial status. Some of the requiredinformation can be obtained from the Quarterly Progress Reports.
5. Quality control
Management will require regular information on the efficiencywith which the project is implemented and the quality of work. This can beprovided through the quarterly progress reports and through specialstudies.
6. Project effectiveness and impact
Project management and government planning agencies will alsorequire information on how well the project is achieving its more generalobjectives and its impacts on participants, the city and national housingpolicies. This information can be provided through impact studies andthrough interim and final evaluation reports.
F. Defining the Main Users of the Studies and their InformationRequirements
1. The main types of information required from the evaluation
It is helpful to think of 4 maLn types of information which canbe produced by evaluation studies (See Table C-3). The collection of eachtype of information has a cost and it is the responsibility of the managerto define which types of information are wiorth paying for.
(a) General indicators of project progress - Often these will besimple numerical indicators of the status of implementation of each of themain project components. These can include financial, physical andsocio-economic aspects of the program.
(b) Indicators of project effectiveness - These are indicators ofthe extent to which the project is achieving its goals, both specific(such as the construction of a number of shelter units) and more generalgoals (such as impact on national housing policies). These studies vary induration from a few weeks to several years.
(c) Indicators of project efficiency - These indicators arecomprised of assessments of overall project operation, and of itsindividual components such as material supply stores, cooperatives andselection of participants.
(d) General planning information The evaluation studies,particularly the more sophisticated surveys, generate statistical datawhich can be of value to a large number oa planning agencies. Althoughthese studies are not strictly evaluation, their preparation may become animportant function of the evaluation unit.

- 173 -
TABLE C-3: THE MAIN TYPES OF INFORMATION AND ISSUES WHICHEVALUATION RESEARCH CAN COVER
1. INDICATORS OF PROJECT PRRGRESS
selection progressconstructionoccupancyhouse consolidationdrop-outsmaintenancecost recovery
2. IMDIC&TORS OF PROJECT EFBECTIVENKSS
accessibility/affordabilityincreasing housing stock & access to urban servicesimpact on target populationeffect on urban housing market & development policy
3. PROJECT EFFICIENCY
I Efficiency of Individual General ProjectProject Couponents Efficiency
project planning and design efficiency in terms ofselection procedures project goalsconstruction methods designmaterial loans financemaintenance implementationcost recovery maintenancecommunity participation cost recoveryplot occupation
comparison with alternativeshelter programscost comparisonquality comparisonreplicability
4. GENERAL PLANNING INFORMATION
income and employmentexpenditure and consumptionhousing quality and access to serviceshealthcommunity organization

- 174 -
2. Main users of evaluation outputs and their information needs
To design an operationally useful evaluation system, it isnecessary to identify the main consumers of the studies and theinformation needs of each group. There are usually four main audiences:
(a) Project implementers such as the site manager, the director ofa cooperative program, and the director of the municipal tax collectiondepartment. Implementers are mainly interested in short term feedback onproject progress, and in the evaluation of the efficiency of thecomponents for which they are responsible.
(b) Project managers are responsible for the general management andexecution of a component or project such as the general manager of aspecialized low-cost housing program, or the city director of the Ministryof Health. Managers are interested in a wide range of information, but dueto time pressure and the wide areas of responsiblity, he or she willrequire brief summary reports.
(c) Central planning and finance ministries, are responsible foroverseeing all development projects, particularly those receiving outsidefunding. Often their priority concern relates to financial information ondisbursements, cost overruns and completion dates. However, in somecountries there is a national agency with responsibility for a generaloverview of a wide range of projects. This agency or ministry will requireinformation on project progress (particularly the financial aspects), anddepending on its mandate, issues related to efficiency and effectiveness.The general planning information will also be of interest.
(d) Donor and lending agencies are particularly interested inindicators of project progress. They may also be interested (depending onthe intensity of supervision) in the analysis of project efficiency andeffectiveness. Agencies interested in the planning of future projects mayalso be interested in the general planning information.
G. Defining the Planning and Review Cycles
For monitoring and evaluation to be operationally useful, reportsmust be produced in time to assist management with planning and controldecisions. This means that the planning cycles of the evaluation mustcorrespond to the project's planning cycles. The following are some of thekey decisions which must be taken to ensure this:
1. Every project has its monthly, quarterly or yearly planningcycles. Management normally meets at the end of each cycle to reviewprogress and to plan for the next cycle. It is essential that theproduction of evaluation reports corresponds to this cycle so that thefindings are available in time to assist management in reviewing progressand making future decisions.
2. Defining review cycles - Procedures must be developed to ensurethat all evaluation reports are reviewed and that feedback is provided tothe research team on the strengths and weaknesses of the reports.

- 175 -
3. Defining publications - Dissemination within and outside theorganization is an important way to ensure the results of the evaluationare known and acted upon. A publication plan should be developed.
4. Building in a general review of the evaluation - It isrecommended that approximately once a year there should be an independentoutside review of the progress of the evaluation. This can either be doneby a consultant or by technical assistance through one of theinternational donors or lending organizations. Arrangements for thisreview should be built into the evaluation program.

- 176 - Annex D
THE BASIC CONCEPTS OF SAMPLE DESIGN
Many of the evaluation methods described in this handbook requirethe selection of one or more samples of individuals, households orcommunities from whom information will be obtained. This annex brieflydescribes some of the basic concepts involved in sample design. All ofthese issues are discussed in more detail in "A methodology for impactevaluation in urban development projects." (Bamberger, 1984.)
A. Why are Samples Used?
A sample is a number of units (people, households, communities, etc.)which have been selected in a systematic way so as to permit estimates tobe made about the characteristics of the population from which these unitswere drawn. For many purposes a well chosen sample will be just as usefulas a census in which all households (persons, etc.) have been interviewed.Samples are often quite small compared to the population they come from,and consequently the information can be obtained much more cheaply andquickly.
A well designed sample will ensure that sufficient interviews areconducted to guarantee a required degree of precision of the estimates ofpopulation characteristics. The use of these procedures for estimatingsample size can avoid the use of larger than necessary samples whilst atthe same time ensuring that sufficient interviews are conducted to providethe required degree of precision.
The following example illustrates the differences in purpose of asample and a census. Assume that the possibility of starting a literacyprogram is being considered, and that it is decided that the program wouldonly be justified if at least 25% of the adult population were illiterate.It is a relatively simple task to design a sample survey which willestimate, with an acceptable level of confidence, the proportion of thepopulation which is illiterate. The sample could provide accurateinformation on the proportion of illiterates, but it could not be used toidentify each particular household who would like to take the literacyprogram. For this latter purpose it would be necessary to conduct a censusin which every family in the community was interviewed.
B. Sample Precision and Confidence Intervals
Suppose we wish to estimate the average income of a community inwhich approximately 5,000 familîes live, and that a sample survey of 100familles provides the following information:
Mean monthly income = 125 PESOS + 25
(0.05 level of confidence)
This signifies that the mean monthly income was 125 pesos for thesample of 100 households. What does this mean? First, it does not mean thatall households have this income, but rather that this was the average. Somehouseholds may have had incomes as low as 25 or 30 and others may have hadincome as high as 500 (or even 5,000) pesos.

- 177 -
Second, it does not imply that this is the true mean for allhouseholds in the community, but only for those included by chance in thesample. If another sample of 100 families were randomly selected it ispossible that the mean of this second saxmple might be 105 pesos or perhaps143 pesos. So what good is it to know the mean for this particular group offamilies if the result could have been different for another group?
The answer is that it is possible to obtain from this sample anestimate of the probable range within which the true mean of the wholepopulation lies. In the above example the figure of 25 pesos is thestandard deviation of the mean. We know that there is a 95% probabilitythat the true population mean lies within two standard deviations of thesample mean. In the present case the '95% confidence limits" for theestimate of the mean are 125 + (2x25) so that the lower confidence limit is75 and the upper limit is 175. This confidence range (also called the 0.05range in some texts) means that there is a 95% chance that the truepopulation mean lies within this range. It is important to understand thatsampling theory is always based on probabilities and confidence limits andnever on certainties. In calculating the sample size the researcher mustdecide what is an acceptable level of risk of being wrong. For mostevaluation purposes it is conventional to use the 95% or even the 90%limit.
Once the precision of the required estimates is known (theconfidence interval and the confidence level) it is possible to estimatethe number of interviews which must be conducted. The main determinant ofthe precision of the estimates is the sample size. Normally it is necessaryto make quite a substantial increase in the sample size in order tosignificantly reduce the confidence interval. For example, wîth a samplesize of 100 the confidence interval is 50 pesos. In order to reduce theinterval to 25 pesos, it would be necessary to increase the sample size to400. Similarly, a confidence interval of 10 pesos would require a samplesize of 2,500. It is clearly important to define the required level ofprecision before designing the sample.
C. Methods of Sample Selection
There are three main ways to select a sample. With a simple randomsample each unit of the population (household, person, etc.) is given anequal chance of being selected. This is the simplest type of sample todesign and is often quite adequate where the population to be studied isrelatively small and concentrated. The selection and application of asimple random sample can be very expensive and complex where the populationunits are difficult to identify or are widely scattered. In many cities nolist or map exists on which all households are located. Even if such a listdid exist, the costs of interviewing would increase very considerably ifthe sample was scattered throughout a city of the size of Sao Paulo orCalcutta. The interviewer would have to spend a great amount of timetravelling and his or her interviewing rate would drop considerably (not tomention the cost of transport).

- 178 -
Cluster sample. With this method, the population is divided intoclusters, with interviews only being conducted in a relatively small numberof clusters. If it is necessary to prepare maps, a limited number ofrelatively small sectors of the city will be selected and maps onlyprepared for these few areas. Even where maps do exist it is common tocluster the interviews so as to reduce travel time and costs. From thetheoretical point of view the estimates obtained from a cluster sample areless precise than those obtained from a simple random sample, but this isoffset by the very significant reductions in cost per interview. Ingeneral the greater the number of clusters which are used, the more precisewill be the estimates.
Stratified random sample. A frequent sampling problem is that someof the groups of interest to the survey only represent a small proportionof the total population. For example, if recent migrants only represent 5%of the population, a simple random sample of 1,000 households wouldprobably only include about 50 of this group. If it were decided (in termsof precision estimates) that a minimum of 100 recent migrants and 100established residents should be included, this would mean that anadditional 1,000 randomly selected interviews would have to be conducted inorder to locate the additional 50 recent migrants. This is obviously anextremely expensive and inefficient way ta proceed.
This problem can usually be resolved through the use of a stratifiedsample. The population is divided into strata - in the present examplerecent migrants and established residents. The required number ofinterviews for each stratum are then selected from among all households inthat stratum. By stratification it would be possible to achieve therequired precision (100 households from each group) with a sample of 200;instead of the 2,000 which would be required with a simple random sample.
A stratified sample can usually provide the most precise estimates.Unfortunately there may often be consideraible costs involved in theconstruction of the strata. In the presernt example, how do we locaterecent migrants? The decision whether or rnot to use a stratified samplewill often depend on a comparison of the costs of constructing the strataand the expected benefits to be derived ftom the use of stratification.
D. Related (Panel) and Independent Samiples
Although most textbooks assume that: the evaluation will be able touse a panel design in which the same subjects are interviewed before andafter the project, in practice this is frequently not possible. In manylow-income communities there is a high population turnover rate so that itwould be quite common to find that a quarter or more of the households hadmoved in the 2 or 3 years between the first and second interviews. Thismeans that in practice the evaluation researcher must choose between:panel or related samples in which the same subjects are reinterviewed;independent samples in which a new sample is selected in T(2) and a mixedsample which combines some of the elements of the previous two approaches.The following are some of the sampling issues involved in the use of eachof these designs:

- 179 -
Panel sample design: In this design the same households or subjectswill be reinterviewed in the second survey. In order to use this design itis important to prepare maps of the precise location of houses, or to useother similar techniques to ensure that the original households/subjectscan be relocated. In many cities the process of identifying the samehouseholds two years later can be very difficult. New houses are built,street names change and even the numbers and directions of streets caralter. Another problem is that household composition and the name of thehead can also change. For example, in the first survey a women may declarethat she is the household head. By the time of the second interview shemay have a male companion who is now declared to be the hosuehold head.This can be very confusing to the interviewer who is trying to establishwhether it is still the same family.
Another factor to be taken into account is the estimated drop-outrate and its impact on sample size. Assume for example that it isestimated that a sample of 200 households is required for valid estimatesto be made. Assume also that ut us expected that 25% of households may movebefore the time of the second survey. This means that the sample size inT(1) must be increased to 250 households, so that the final sample size inT(2) after 25% of households have moved, would be around 200. If a highdropout rate is anticipated it is also necessary to consider the effectswhich this will have on the representativity of the final sample. It isadvisable at the end of the second survey to conduct an analysis of theT(1) data to compare the characteristics of households who have moved andwho have remained in the community to determine the ways in which theydiffer. If, for example, the families who have left are richer than thosewho remained, this must be taken into account in interpreting the findingsof the analysis which is only conducted on households who remained in thecommunity.
Independent samples: With this design a new random sample isselected for the second survey in T(2). No particular sampling problemsexist.
Mixed sample design: This is the most complicated design toadminister. The same procedures are used as in the panel study except thatreplacements will be found for orginal families or subjects who cannot bereinterviewed. The simplest option is to replace the household with the newfamily living in the same structure. This has several potential biases.Firstly it means that families living in new structures built since thetime of the previous survey will be excluded. This produces a blas againstnew households. Secondly, it is difficult to define the population to whichnew occupants belong. Although most of them are probably new to thecommunity, it is possible that some may have moved from other structures inthe community.
A better approach is to select a new sample for the replacements.The sample should be selected from all households or subjects who havemoved to the community since the time of the previous survey. This can besomewhat cumbersome to select as a large number of screening interviews maybe required in order to identify new families. In practice it is relativelysimple to identify new households in sites and services shelter projects as

- 180 -
management will usually have records of new arrivals, but the process ofselection can be very cumbersome for the control areas.
The use of a mixed sample also raises issues related to theestimation of sample size. In order to make full use of the analyticalpotential of this sample, it is useful to be able to conduct separateanalysis of original households (panel) and new arrivals. In order to dothis it is necessary to make separate estimates of the required sample sizefor both groups.
E. Sample Designs for the Evaluation of Sites and Services Projects
It is easier to design samples for the evaluation of a sites andservices project than it is for an upgrading project. In the case of sitesand services, the affected population is clearly defined and relativelysmall. At the same time all participants receive the same package ofservices or one of a limited number of options. The sample of participantscan either be a simple random sample, or if there are different options, astratified sample which includes a sample of each option can be used.
Ideally the control group should be selected from all low-incomehouseholds in the city. In practice, this tends to be too expensive andnormally some type of cluster sampling is used with the selection of arelatively small number of areas which are considered to have similarcharacteristics to the participants. As participants usually represent arelatively small proportion of the total population, it is usually possibleto find control groups with relatively similar characteristics
F. Sample Designs for the Evaluation of Upgrading Projects
The sample design for the evaluation of an upgrading project tendsto be more complicated. First, it is more difficult to define who has beenaffected by the project. In a large upgrading project a number ofdifferent government agencies (water, education, transport, health,technical training, housing credit, etc.) all provide services. Not allhouseholds will receive the same package of services, and many householdsmay not directly benefit at all. This makes it difficult to define thelimits of the target population. Second, the wide spread of the programsmeans that the expected impact at the level of individual households may bequite low. Consequently a randomly selected group of households may reveala relatively low average impact, even though the project has affected largenumbers of households. In some cases the impact per household will be solow as to be statistically insignificant. Third, the fact that manyupgrading projects are intended to cover most of the low-income populationmeans that it will often be impossible to find a control group of similarlow-income households who have not been affected.
For all of these reasons it will often be necessary to use adifferent type of evaluation design which includes the followingcharacteristics:
- 181 -
* Instead of dividing the population into an experimental groupwhich has been affected, and a control group which has not, eachfamily will be classified in terms of its degree of access toproject benefits. Indicators will be used to measure degree ofaccess to water, schools, health programs, credit, etc.
* Often it will not be possible to have an external control group.In some cases the control group will be formed of families in theproject areas who have not yet received project benefits. In othercases the control group will be developed statistically withhouseholds who have not received a particular service being usedas a control group for families who have received this particularservice. The statistical procedures for the analysis of this typeof control are given in the discussion of multiple regression inAnnex F.

- 182 -
TABlE D-I: FEAIRS CF SrIS MD SERVEXS ND UtEADIMC 1RWS AFesc IM eSIGN CF AN fIMn EVAUJAICN
Sites/Services UpLrang Conxents
Selectloe of AUl prticipants mnt Ail famiMes -Ln upgraded xIn neither cases are prtici-participants satisfy criteria in areas are axtically pents ranlomly selected
tenr of incoee, ixEljded. so there are probles offauily, size, etc. locating an equivalentIhis v11l often control grcup. In tde case
eliuinate up to 25% of sites ari services tdeof the poorest problen is to control forfamles in the city. vaiables such as mDtivation.
With upgrading tde problnm isto fini simLlar soclo-ecmaunc areas when theproject my lrKlJnxe ailsquatter areas.
Speed <f My be a gap of three In large ar3 the proj- In both ceses tdu deProject years or usre betwen ect progresses ixn stages, iLMloemetation delays
timn elen first and wlth several :ears caplicate the designs.Lt famxlJ occupy betmen firat and last Easier to control in upgrad-tluir project bluses. stages reeiuirg tde ing as tdere is a phased
ervices. sequnoe whereas in sites andservices the ocwLpation istmpredlctable. In upgradingthe later areas can be usedas control groe for earlierareas.
Proportin of NIrnally las than Can co«r up to 75% of ih nDre diLfficult tocw income 10C the urban pooir. select a comparable control
familles groep for upgrading.
Standardiza- Faillies reeive smam Wide differenes in DLfficult to defimtim of tde packae, or oae of a servies actualy and standardize thepacwkge of aufl ruMer of reoeld. MiEficult "treatnDnt" for upgrading.services clarly defxied to measure vit esch
qptiooe family recelaed.
kuqxs of My simular faLUies Projects oftei coer Ditfficult to fiM equivalentproject areas almost ail poor, or only control groep for upgradirg.or participants affect a very specal
grop not easiLly mtcWad.
tkflnitioe of Area consists of new Ltmits <f project More ditfficult to defineproject housiilg and i clearly effective aremai y experinental grop forpopulation defined. be a 8igxs. upgeading.

- 183 -
G. Further Reading
Michael Bamberger. 1984."A Methodology for Impact Evaluation in Urban Shelter Progams". Moredetailed discussion of the issues presented in this annex.
Dennis Casley and Denis Lury. 1982.Monitoring and Evaluation of Agricultural and Rural DevelopmentProjects. Explanation of how samples are designed for the evaluationof agricultural and rural projects.
Lesley Kish. 1965."Survey Sampling". One of the standard textbooks on sample design.

- 184 - Aunez E
EXERIEmNTL AND QUASI-EXPKRDIKNTA, DESIGNS INURIAN IMPACT EVALUATION
Managers and development planners frequently require a quantitativeevaluation of the impact of their projects. This is necessary both forcomparison with alternative investment strategies, and for deciding whetherthe project is producing a satisfactory return on the investment. To makethis type of quantitative evaluation, it is necessary not only to determinewhether changes have taken place in the project population, but also todetermine whether the changes are due to the project or to other unrelatedfactors. Cities are in a constant state of change so that projectparticipants are subject to many other factors in addition to the projett.The separation of the project impact from that of other factors requires aresearch design which can control for the effect of these external factors.
The urban researcher is never able to achieve the closely controlledexperiments conducted in the natural sciences or in animal psychology. Inorder to provide the best possible estimates under the difficultcircumstances in which social science research is conducted, a number of"quasi-experimental" research designs have been developed which try toapproximate the true experimental design.
A. The Logic of the True Experimental Design
In order to understand the logic and some of the limitations of these"quasi-experimental" designs, it will be useful to begin vith a briefdiscussion of the true experimental design. Let us assume that anexperiment is being designed to evaluate the impact of a drug on the speedwith which rats can find their way through a maze. The time taken by therat to f ind its way to the end of the maze is called the "dependentvariable", and the amount and type of drug is called the "experimental" or"independent" variable. The action of the drug may be affected bycharacteristics of the rats such as age aLnd weight (interveningvariables). The effect of these intervening variables is controlled byrandomly assigning some rats to the experimental group and assigning othersto a control group which will not receive the drug. If the groups arereasonably large, it can be assumed that these intervening variables willbe randomly distributed between the control and experimental groups andwill, consequently, not influence the outcome of the experiment.
The experiment in its simplest form is designed as follows:
T(1) T(2)
Experimental group E(1) X E(2)Control group C(1) C(2)
T(1) and T(2) represent the time periods before and after theexperiment. E(1) and E(2) indicate the aLverage time taken by rats in theexperimental group to complete the maze in T(1) and T(2). C(1) and C(2)are the corresponding values for rats in the control group. X indicatesthe point at which the drug ("treatment"`) was applied.

- 185 -
The time of the two groups to complete the maze in T(1) ismeasured. The two groups are then kept in identical conditions except thatthe drug is administered to one group and not to the other. The two groupsvill then again run the maze and their average times will be measured. Theaverage times of the two groups in T(2) are then compared by using thefollowing, or a similar equation.
E(2) - E(1)I (Impact) =
C(2) - C(1)
If the difference is statistically significant then it wll beconcluded that the drug appears to have had an impact on the time taken torun the maze. A careful researcher will repeat the study a number of timeswith different groups of rats, and under slightly different experimentalconditions, so as to eliminate any chance factors which might haveinfluenced the outcome. For our present discussion it is important toemphasize the following aspects of this design:
(a) A relatively large number of rates are used.
(b) The rats are kept in identical conditions during theexperiment, with the only difference being that one groupreceives the drug and the other does not.
(d) Ideally the experiment is repeated a number of times withdifferent groups of rats.
(e) Only one carefully controlled treatment (in this case the drug)is used, and all experimental subjects receive exactly the samedose and at the same time.
(f) The experiment will often be repeated with carefully controlledchanges in the dosage and in the time period over which changeis measured.
B. Threats to Validity in the Interpretation of the Analysis
The immediate purpose of conducting an impact evaluation is toestimate the impacts which a project or set of project interventions havehad on a particular population. However, this analysis is usually only thefirst step towards estimating the potential impact which the project couldhave on some larger group. For example, the project being studied may haveprovided piped water for several hundred families in one low-incomecommunity. Assuming the project appears to have produced some beneficialhealth impacts on this community, the question of interest to policy makersis to estimate the likely impacts if the same type of project were extendedto cover all low-income families in the city. It is dangerous to assumethat the observed results in the pilot project would necessarily occur inthe same way if the project were replicated on a larger scale. There arefour main sets of factors which may affect the validity of the estimatesabout how the project could be expected to perform on a larger scale.These factors, which may have been called threats to validity aresummarized below. A more detailed explanation of how they apply in urbanprojects is given in Bamberger (1984).

- 186 -
1. Statistical conclusion validity
Problems of statistical conclusion validity arise when thesample is too small, or where it has not been properly designed. Underthese circumstances it may appear that the project has had no impact, whenin fact the sample was too small for it to have been possible to obtainstatistically significant differences between the experimental and controlgroups. Another common example is when project impacts only occur in acertain sub-group (such as houseowners or owners of large fishing boats)which has been undersampled so that the impact is not detected. A relatedproblem is caused when there is a high population turnover so that theoriginal households in the sample cannot be reinterviewed. This can havethe effect of reducing the size of a panel sample (in which the samehouseholds are reinterviewed at several points in time) by 30 or 40percent. In this case the original adequate sample size may have beenreduced so much that it becomes much more difficult to obtain statisticallysignificant results.
Another statistical problem can occur if the wrong analytical modelis used. Annex F shows the problems which can arise when a test such asthe T-Test is used to estimate differences between an experimental andcontrol group when the two groups were not equivalent at the start of thestudy. An example is given where the T-rest shows a statisticallysignificant difference between the two groups, but when the two groups arematched through the use of regression analysis, it is found that there isno longer a difference between them.
2. Internal validity
Once it is established that a statistical association existsbetween the project and the dependent va:riable being evaluated, the nexttask is to determine whether this association is evidence of a casualrelationship. It is important not to confuse a statistical relationshipwith causality.
The fact that the income of participants in a housing projectincreased faster that the income of a control group does not prove that theproject caused the increase. It might be that families who enter theproject are those most likely to increase their income (such as smallbusinessmen looking for new markets, or generally more ambitious people),or it might be that increased income is (lue to a third factor, such as theopening of a new factory near the project. A number of factors which mightbe responsible for a spurious casual relationship are the following (thelist is taken from Cook and Campbell (1979).
(i) History: an event occurred i:n one area and not the other afterthe project had begun.
(ii) Maturation: certain changes occur spontaneously after acertain period of time. For example, housing investment is related to timeliving in a community.
- 187 -
(iii) Testing: the effect of repeating the interview may causecertain changes to come about.
(iv) Instrumentation: a slightly different questionnaire or ioethodof measurement might have been used at different points in time, and thismight have produced different results.
3. Construct validity of casual relations
Different researchers may interpret the same findings indifferent ways. The example was given earlier of different interpretationswhich might be put on the fact that more houses exhibit middle classsymbols such as expensive iron grills on the windows, ornate plants orpatios. One person may interpret this as meaning there has been "middleclass encroachment" and poor families have been forced to leave. Anotherperson may argue that this shows that poor familles have remained in thecommunity but have begun to adopt middle class status symbols. The tworesearchers would draw quite different conclusions from the results of thestudy.
4. External validity
This refers to the problems of generalizing to a widerpopulation. It often happens that a first project attracts the Mostdynamic participants. In this case it is possible that the results of thefirst project will be greater than those of subsequent projects due to thedifferences in the level of ability, motivation or resources ofparticipants. Under these circumstances it would be dangerous to makeinferences from the first project about likely outcomes of future projects.
C. Problems in Applying the Experimental Design to the Evaluation ofUrban Projects
We will now consider what happens when we attempt to apply thisexperimental approach in a typical urban setting.
PROBLEN NO. 1 - Participants in urban projects are almost neverselected randomly. In the case of a small business credit programparticipants are selected from among those businessmen who took theinitiative to apply and consequently, who have different motivationalpatterns from those who did not apply. Frequently the project will alsotry to select those persons or groups most likely to be successful in theproject (for example, people willing to participate in self-help houseconstruction or transport cooperatives whose vehicles are best maintained)so that the selected group becomes even less representative of alllow-income families. In the case of upgrading, all families in a givenarea are automatically included, and consequently it is extremely difficultto select a control group of households with similar characteristics.
JIOBLEK NO. 2 - The high population turnover rates in many urbanareas mean that it is often not possible to use panel design in which thesame subjects are interviewed before and after the project. Theimplications of this are discussed in Chapter 4 and in Annexes D and F.

- 188 -
PROBLEN NO. 3 - Many projects provide a number of different inputs(infrastructure, credit, technical assistance, land tenure, communityservices, etc.). In addition to the large number of different inputs(treatments), a further complication is that different families willreceive different combinations and amounts of these inputs. This againmakes the design much more complex than the neat laboratory situation inwhich all rats receive exactly the same amount of the same drug.
PRMOBLE NO. 4 - In urban projects it is difficult both to selectand maintain a control group. An objective of many projects is to cover asgreat a proportion of the low-income population as possible or to includeall families living in certain areas of the city. In both case it will beextremely difficult to find a control group of families with similarcharacteristics. A further problem is thlat many of the selected controlareas are potentially unstable and likely to be eradicated by urbanrenewal, destroyed by flooding or upgraded. Even when the area itselfremains, it is common to find that between 25% and 50% of the familiesinterviewed in the baseline study will have moved during the two to threeyear period before the survey is repeated. The instability of the controlareas complicates considerably the analysis.
NOBLEN NO. 5 - Projects are often subject to long andunpredictable delays. It is quite common for a project to start eighteenmonths later than scheduled and in one project studied there was a delay ofalmost five years. Such delays make it extremely difficult to plan theevaluation and may mean that some treatments still cannot be evaluated evenat the end of a three or five year study.
MPOBLEK NO. 6 - Another serious problem is the fact that thechanges produced by most projects tend to be continuous rather than tooccur at one point in time, as in the case of rats. The pattern of changeis also not linear but likely to fluctuate.
Tables E-1 and E-2 give two typical examples. Table E-1 showspossible levels of housing investment in a sites and services project.When families first occupy the project the level of investment may berelatively low during the first six to nine months as many households havenot yet occupied their houses or are still paying off the down-payment onthe house. Investuent may then begin to increase as families complete thehouse according to their needs and resources. These high levels ofinvestment may continue for several years, but at some point investmentwill begin to decline once most families have completed the basicstructure. If monthly housing investuent before the project were comparedwith the level six to nine months after houses were assigned, it might befound that very little change had taken place. However, if the study wereconducted one year later the level of investment would probably haveincreased considerably. If, however, the study was repeated three yearslater, it might be found that invesSment per month was again not very muchhigher than the pre-project level. This emphasizes the point that levelsof housing investment should be measured at various points in time as acomparison between only two points is likely to be very misleading.
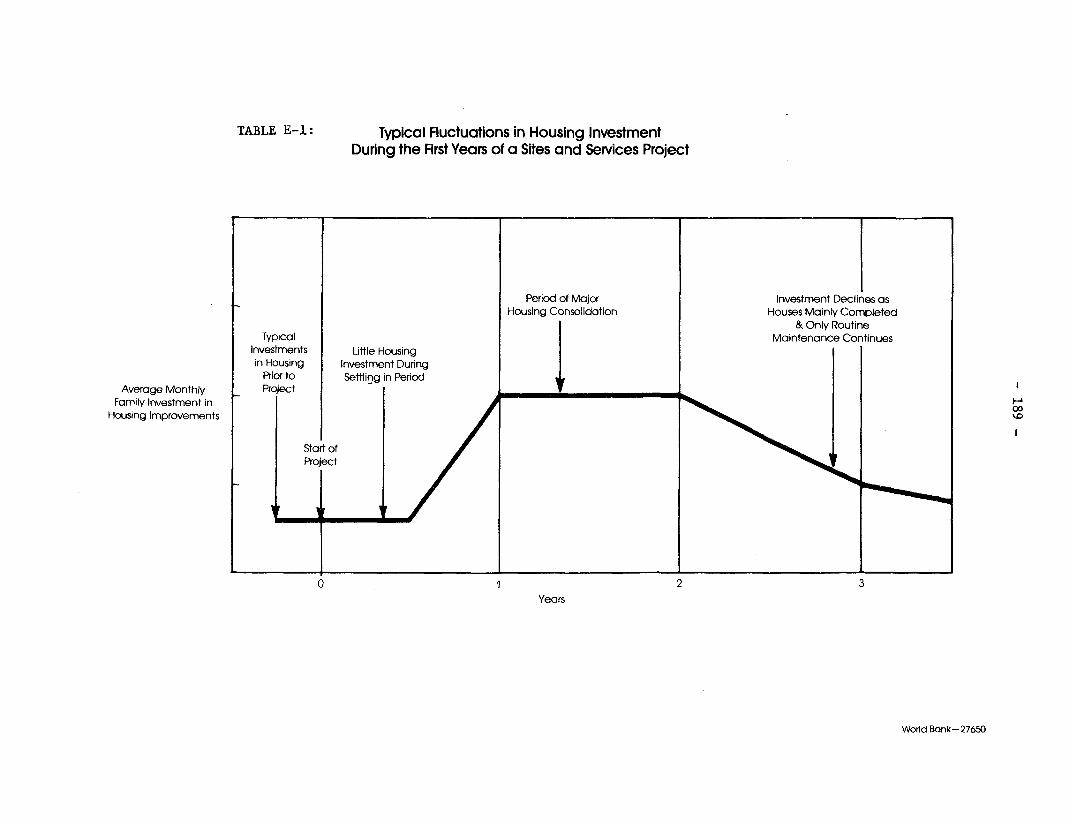
TABLE E-1: Typical Fluctuations in Housing InvestmentDurng the First Yeors of a Sites and Services Project
Period of Major lnvestment De Xines asHousing Consolidation Houses Mainly Completed
& Only RoutineTypical Maintenance Continues
Investments Littie Housingin Housing Investment During
Prior to Settling in PeriodAverage Monthly Project __ I_.__
Family Investment inHousing Improvements /O
Start of
Project
° 1 2 3Years
World Bank-27650

- 190 -
Table E-2 illustrates the typical patterns of fluctutations inhousehold income. In many areas there are strong seasonal fluctutations asincome may be higher during the harvest, the tourist season or the monthsin which most construction takes place. In other cases, as for example, afishing community, the fluctutations may take place over shorter periods.These fluctuations mean that household income in any given year will tendto be significantly lower in (say) June than in (say) December. On thebasis of this comparison the conclusion might be incorrectly drawn that theproject had had a negative effect on income. Even if income is comparedduring the same month in two different years, there are considerablefluctuations from one year to another. Thus although there is a gradualincrease in income during the years following the project, the income inyears two and five is lower than in the year in which the project began.Again a comparison between only two poinits in time could be verymisleading. The conclusion from both of these examples is that it isnecessary to study trends over time and t:hat reliance should never beplaced on a static comparison between two points.
An important related problem is that when a project is expected toproduce several different impacts, each impact may occur over a differenttime period. Thus it may be possible to detect some economic changes afteronly a year, whereas educational or health benefits may not be measurablefor five or even ten years. This complicates even further the selection ofthe time period over which measurements will be made.
PROBLEK NO. 7 - Perhaps the most: serious shortcoming of theexperimental design from the policy and operational point of view is thatthe simple design does not provide any insights into why expected impactsdid not occur. Let us return to the model presented in Table C-1. Theexperimental design would simply measure the amount produced by thebusinesses or the average household incomie before and after the provisionof credit and technical assistance. If rno statistically significant changewere observed, the analysis would not be able to explain why there was nochange nor would it be able to tell us mtLch about the potential utility ofthe program.
It is recommended that a statistical impact evaluation should alwaysbe complemented with at least a descriptive analysis of the operation ofeach stage of the project model.
D. Alternative Quasi-Experimental Designs
The characteristics of a project, and the context within which it isdeveloped, determine to a large extent the type of evaluation design whichcan be used. Some of the most common designs are presented below, togetherwith a brief discussion of some of their advantages and drawbacks.
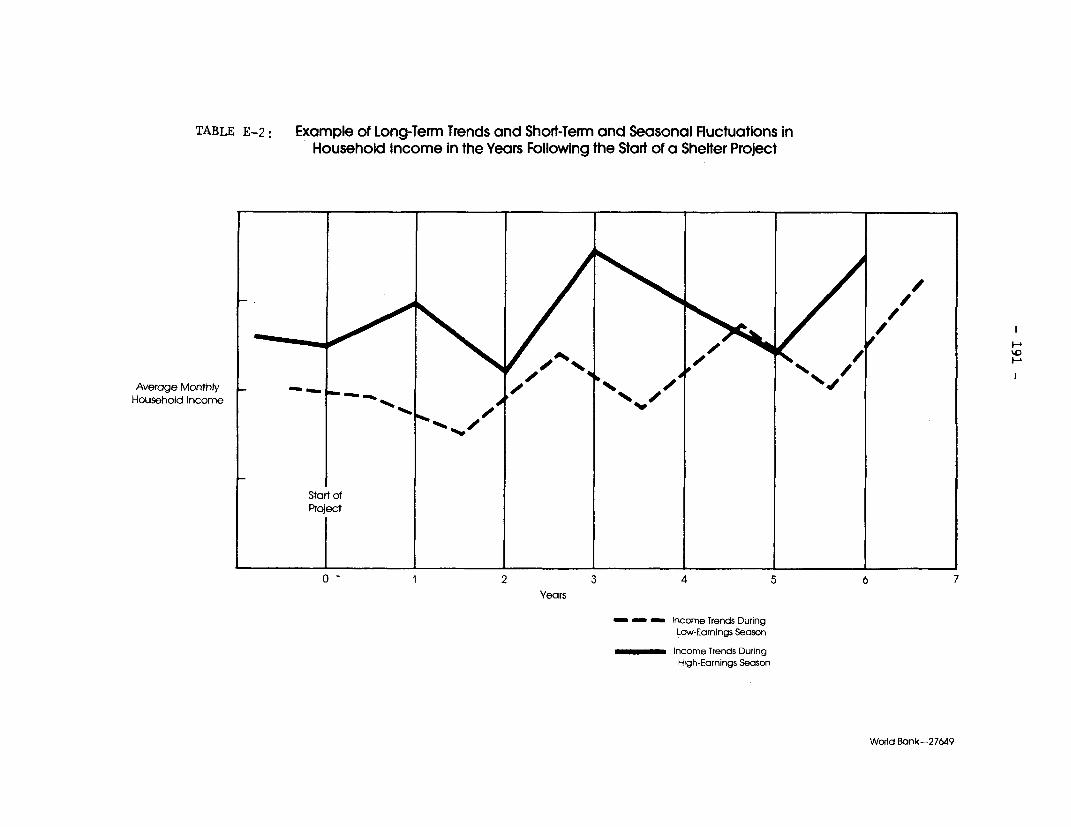
TABLE E-2: Example of Long-Term Trends and Short-Term and Seasonal Fluctuations inHousehold Income in the Years Following the Start of a Shelter Project
Average MonthlyHousehoid Income
Start ofProject
0 2 3 4 s 6 7Years
--- Iincome Trends DuringLow-Earnings Secson
Income Trends DuringHigh-Earnings Season
World Bank-27649

- 192 -
1. The Pre-test post-test control group design
In this design the experimental and control groups are comparedbef ore and after the project. The design can be represented as follows:
T(1) T(2)
Experimental E(1) X E(2)Control C(1) C(2)
In the simplest form of the analysis it is assumed that allparticipants receive the same package of services. With this assumption itis possible to conduct the analysis using multiple regression with a dummyvariable for Participant Status (Participant = 1; Control = 0). Thequestionnaire should include information on the socio-economiccharactersitics of the subjects so that the two groups can be matchedstatistically for the effect of these characteristics.
In those case where the project offers a number of differentservices or components, the questionnaire should measure exposure to theseservices. In this case the multiple regression equations will includevariables reflecting exposure to project components. The coefficients ofthese variables indicate their contribution to the impacts being studied.It is also possible to include interaction terms to measure the covariationbetween sets of components.
2. Extending the pre-test post-test design to include additionalpoints in time
This model is similar to the iprevious one except that one ormore additional observations are included. The design can be representedas follows:
T(1) T(2) T(3) T(n)
Experimental E(1) X E(2) __ _ E(3) E(n)Control C(1) C(2) C(3) C(n)
The points at which the observation will be made are determined bythe nature of the project. In some cases observations may be made everyyear or two years. Another option is to define T(2) as the point when theproject is administratively completed. T(3) would then be several yearslater.
This model can test whether the trends are linear or whether theyfluctuate or even reverse. The more observation points which are availablethe less the danger of making wrong inferetnces about trends based on onlytwo or three observations.
The analysis of this design can be conducted in various ways. Oneway is to conduct the analysis described in the previous section for T(1)and T(2); T(1) and T(3), etc., and then to compare the results. Another isto select two time periods for the basic analysis and to use informationfrom the other periods as a consistency check.
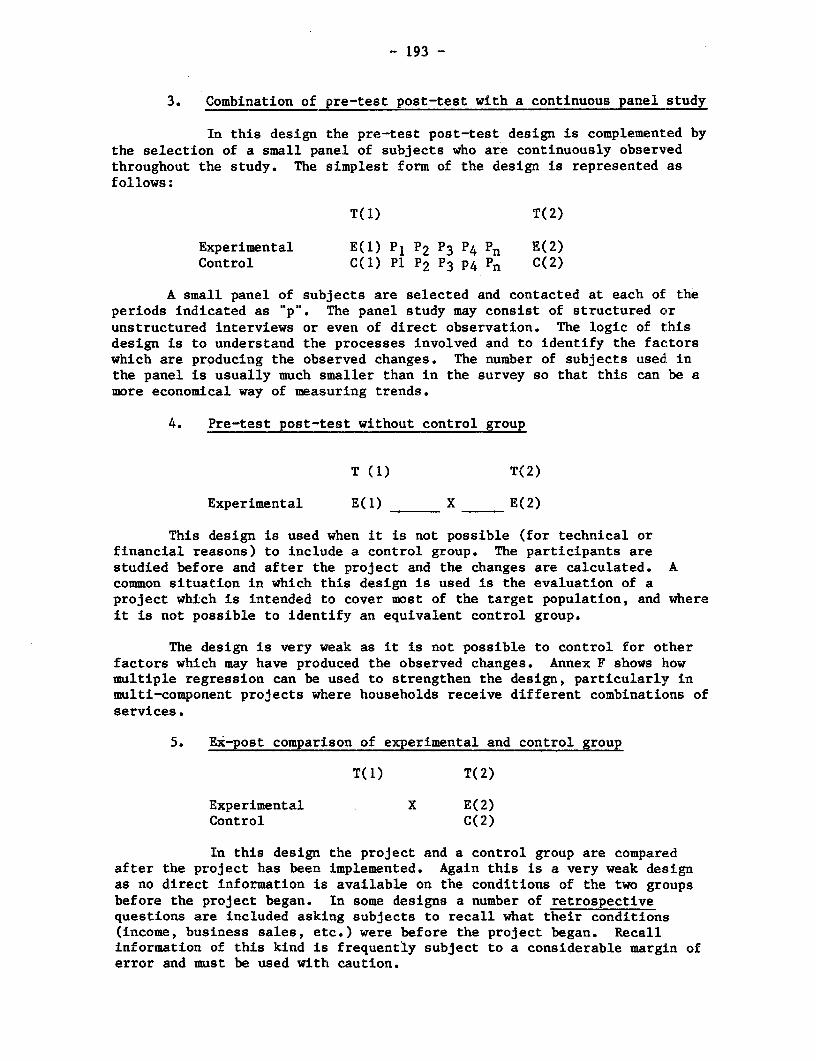
- 193 -
3. Combination of pre-test post-test wîth a continuous panel study
In this design the pre-test post-test design is complemented bythe selection of a small panel of subjects who are continuously observedthroughout the study. The simplest form of the design is represented asfollows:
T(1) T(2)
Experimental E(1) P1 P2 P3 P4 Pn E(2)Control C(1) Pl P2 P3 p4 Pn C(2)
A small panel of subjects are selected and contacted at each of theperiods indicated as "p". The panel study may consist of structured orunstructured interviews or even of direct observation. The logic of thisdesign is to understand the processes involved and to identify the factorswhich are producing the observed changes. The number of subjects used inthe panel is usually much smaller than in the survey sa that this can be amore economical way of measuring trends.
4. Pre-test post-test without control group
T (1) T(2)
Experimental E(1) X E(2)
This design is used when it is not possible (for technical orfinancial reasons) to include a control group. The participants arestudied before and after the project and the changes are calculated. Acommon situation in which this design is used is the evaluation of aproject which is intended to cover most of the target population, and whereit is not possible to identify an equivalent control group.
The design is very weak as it is not possible to control for otherfactors which may have produced the observed changes. Annex F shows howmultiple regression can be used to strengthen the design, particularly inmulti-component projects where households receive different combinations ofservices.
5. Ex-post comparison of experimental and control group
T(1) T(2)
Experimental X E(2)Control C(2)
In this design the project and a control group are comparedafter the project has been implemented. Again this is a very weak designas no direct information is available on the conditions of the two groupsbefore the project began. In some designs a number of retrospectivequestions are included asking subjects to recall what their conditions(income, business sales, etc.) were before the project began. Recallinformation of this kind is frequently subject to a considerable margin oferror and must be used with caution.
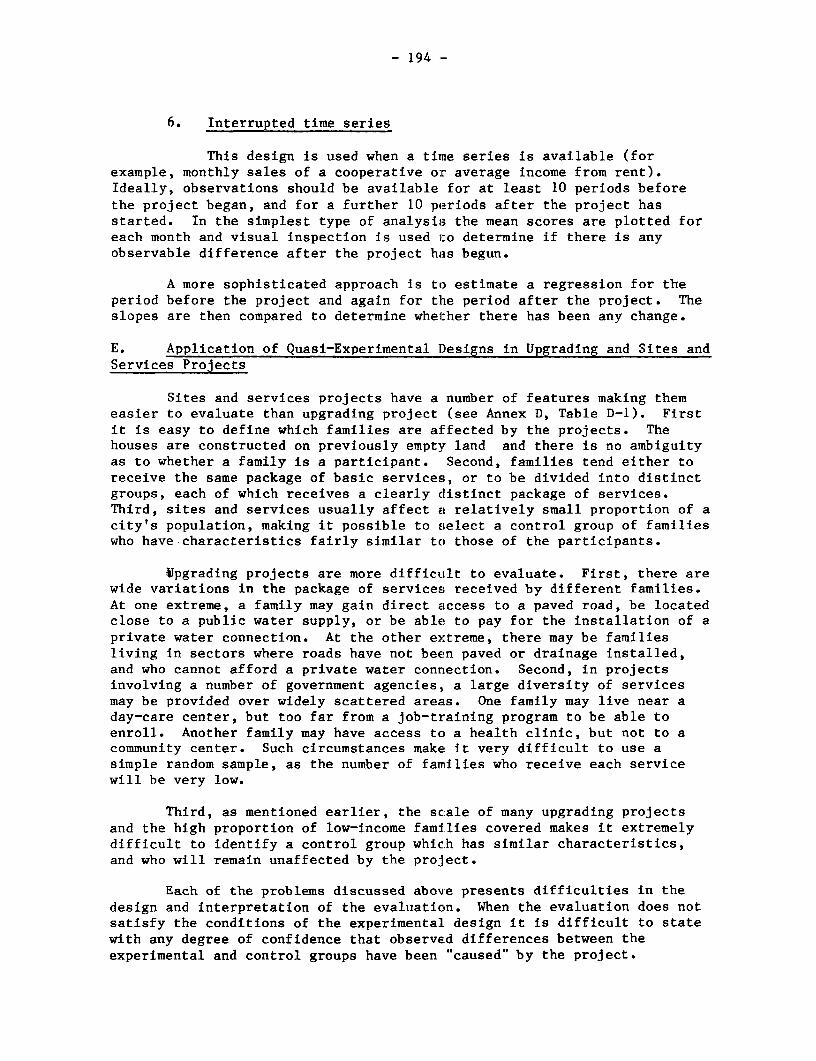
- 194
6. Interrupted time series
This design is used when a tiine series is available (forexample, monthly sales of a cooperative or average income from rent).Ideally, observations should be available for at least 10 periods beforethe project began, and for a further 10 periods after the project hasstarted. In the simplest type of analysis the mean scores are plotted foreach month and visual inspection is used izo determine if there is anyobservable difference after the project has begun.
A more sophisticated approach is to estimate a regression for theperiod before the project and again for the period after the project. Theslopes are then compared to determine whel:her there has been any change.
E. Application of Quasi-Experimental Designs in Upgrading and Sites andServices Projects
Sites and services projects have a number of features making themeasier to evaluate than upgrading project (see Annex D, Table D-1). Firstit is easy to define which families are affected by the projects. Thehouses are constructed on previously empty land and there is no ambiguityas to whether a family is a participant. Second, families tend either toreceive the same package of basic services, or to be divided into distinctgroups, each of which receives a clearly distinct package of services.Third, sites and services usually affect a relatively small proportion of acity's population, making it possible to select a control group of familieswho have characteristics fairly similar to those of the participants.
Upgrading projects are more difficult to evaluate. First, there arewide variations in the package of services received by different families.At one extreme, a family may gain direct access to a paved road, be locatedclose to a public water supply, or be able to pay for the installation of aprivate water connection. At the other extreme, there may be familiesliving in sectors where roads have not been paved or drainage installed,and who cannot afford a private water conrnection. Second, in projectsinvolving a number of government agencies, a large diversity of servicesmay be provided over widely scattered areats. One family may live near aday-care center, but too far from a job-training program to be able toenroll. Another family may have access tc a health clinic, but not to acommunity center. Such circumstances make it very difficult to use asimple random sample, as the number of families who receive each servicewill be very low.
Third, as mentioned earlier, the scale of many upgrading projectsand the high proportion of low-income families covered makes it extremelydifficult to identify a control group which has similar characteristics,and who will remain unaffected by the project.
Each of the problems discussed above presents difficulties in thedesign and interpretation of the evaluation. When the evaluation does notsatisfy the conditions of the experimental design it is difficult to statewith any degree of confidence that observed differences between theexperimental and control groups have been "caused" by the project.

- 195 -
A framework for understanding the precise nature of these analyticalproblems has been developed by Cook and Campbell (1979) in theirdiscussion of the main "Threats to Validity" in different quasi-experimental designs. The way in which these threats to validity affectthe design of urban evaluations has been discussed by Bamberger (1981),,Annex F presents some of the statistical techniques used to minimize theeffects of these threats to validity.
F. Further Reading
Michael Bamberger. 1984. "A Basic Methodology for Impact Evaluation inUrban Shelter Projects.
Thomas Cook and Donald Campbell. 1979. Quasi-experimentation: Designand analysis Issues for Field Settings. Detailed explanation of a widerange of evaluation designs and analytical procedures.

- 196 - Annex F
METHODS OF DATAL ANALYSIS
A. Statistical Analysis of the True Experimental Design
Although it is rarely possible to achieve a true experimental designin urban research, it is useful to mention briefly the types of analysiswhich are used with this design in order to illustrate the statisticaladjustments which must be used for the more common quasi-experimentaldesigns. With a true experimental desigrn, in which subjects are randomlyassigned to the experimental and control groups, the impact of theexperimental treatment can be defined as:
E(2) - E(1)Impact (I) = _
C(2) - C(1)
The statistical procedure which will be used for evaluating whetherthere is a significant difference between E(2) - E(1) and C(2) - C(1) willdepend on the type of variable and the "level of measurement".
(a) When the variable is a "Yes-No" binary (member or non-member ofthe cooperative) change will be measured as the difference betweenproportions. The appropriate statistical test will be the T-Test for thedifference of proportions.
(b) When the variable is nominal (variables such as type of house,occupation, etc) where one category cannot be defined as being greater thanor less than another) the appropriate test will be one of thenonr-parametric tests such as Chi-Square.
(c) When the variable is ordinal (categories can be ranked fromgreater to lesser but the intervals between the categories are not equal)the appropriate test will be one of the rank correlation tests such as theWilcoxon Matched Pairs Signed Ranks Test.
(d) When the variable is interval (variables such as income, age,value of the house, etc. where the intervals between each number areequal) the most appropriate test will probably be the T-Test.
A further complication in the selection of the appropriate test isto determine whether the samples are related or independent. Many of thestatistical tests assume that the samples being compared are independentof each other, and when a panel design is used in which the same subjectsare reinterviewed it is usually necessary to use different statisticaltests. (See Bamberger, 1982, for details.)
The purpose of the significance tests is to determine whether thereis a statistically significant difference in the amount or rate of changewhich has been observed between the experimental and the control groups.For example, it was found in El Salvador that monthly householdexpenditure on food in the control group increased from 155.2 pesos in1977 to 241.5 pesos in 1979 (an increase of 86.3 pesos). During the sameperiod, food expenditures by project participants increased from 177.4pesos to 240.6 pesos (an increase of 63.2). The T-Test showed that a

- 197 -
difference as large as this had only a 0.0005 possibility (5 chances in10,000) of occuring by chance. Consequently, it could be concluded thatthe increase in food expenditures by control households was statisticallygreater than for project households (see Bamberger, 1982, pages 179onwards for more details).
B. Tests of Association and Difference for use with some of theSimpler Evaluation Designs.
The simplest type of statistical analysis is to compare two or moregroups and to determine whether or not there is evidence that the groupaffected by the project is different from the control group. Examplesinclude:
(a) Comparison of project participants before the project has begunand after it is completed or has been underway for a certain time, todetermine whether there is a difference. A test such as T-Test candetermine whether there is a significant statistical difference betweenthe two time periods. The form of the test will depend upon whetherrelated or independent samples are used (Bamberger, 1982 Chapter 6). Thisdesign is very weak as without a control group it is not possible todetermine whether the changes are due to the project or to other factors.
(b) Comparison of the scores of participants and a control group todetermine whether there is any difference after the project. Again testssuch as T-Test will determine whether there is a statistical difference,but as there is no measurement before the project began, it is notpossible to assess how much the two groups differed before the projectbegan and consequently how much of the change might be due to the project.
(c) Comparison of the project group with a control group before andafter the project. It is again possible to use a test such as T-Test tocompare the difference in the difference of means (i.e has the mean of theproject group changed more or less than the control group). This method ismore powerful but still faces the problem that where there was no randomassignment to the control and experimental groups it is likely thatdifferences existed between the two groups at the start of the project andthat these initial differences explain part of the apparent projecteffect.
C. The Use of Multiple Regression in the Analysis of Quasi-ExperimentalDesigns
One of the major statistical problems in evaluating the impact ofurban projects is that the types of control groups which are availabletend to differ in some important ways from the project participant(experimental) group. In some cases the average household income will bedifferent; in other cases there will be differences in the number of yearsthe small businesses have been operating or in the number of vehiclesowned by each bus company.

- 198 -
Table F-1 shows the differences which were found between theexperimental and control groups at the start of the evaluation of the sitesand services project in El Salvador. The household heads in control areswere older and had significantly less education; control families were alsosmaller land had lower incomes. When the T-Test was used to compareincomes before and after the project, it was found that there had been astatistically greater increase in the income of participant than of controlfamilies. This would seem to indicate that the project had affectedincome. However, the question arises as to whether the more rapid increasein participant incomes might not be due to some of the initial differencesbetween the two groups with respect to income, family size, age of head,etc., rather than to the project.
This question can be partially answered through the use of MultipleRegression Analysis. Table F-2 shows the type of information which isprovided on the example we have been discussing. The column headed B(regression coefficient) indicates how much change in income is produced bya unit change in the indicated variable when all other variables remainconstant. The final column indicates whether the coefficient isstatisticlly significant (if the probability is equal to or less than 0.05it is assumed that the difference is significant). For example, thecoefficient for "Education of head" is 17.8. This means that for everyadditional year of education of the head, household income after theproject, defined as T(2) would increase by 17.8 pesos. Similarly, everyadditional household member would increase income by 21.9 pesos. The tableindicates that even without the presence of the project the existence ofdifferences in initial incoae, family size, education and sex of householdhead between the project and control groups would tend to producedifferences in household income between the two groups in T(2). The finalrow shows that when we control for the initial differences in these 4variables there is no longer a significant difference in post projectincome between participants and control group (defined as participantstatus). Thus, the apparent impact of the project was in fact due to theinitial differences between project and control households.
The form of the analysis will depend upon whether a panel sampledesign is used, with the same respondents being interviewed twice, orwhether separate samples were selected in T(1) and T(2). In the formercase, the analytical model can be specified as follows:
Y2 = a + blYl + b2 CI + b3C2+ .....bnPART
where: Y2 = value of the dependent variable (income) in T(2)
YI = value of the dependent variable (income) in T(1)Cl, C2, Cn = household characteristics (age, education, etc.)PART = Dummy Variable with Participant = 1 and Control = O
The purpose of the analysis is to determine project impact on adependent variable (say income). The dependent variable is income in T(2),and this is regressed on income in T(l), on a set of socio-economiccharacteristics of the household, and on a dummy variable indicatingwhether the family was a participant or member of the control group. If thecoefficient of PART is statistically significant this indicates that there

- 199 -
TABLE F-1: THE PROBLEM OF NON EQUIVALENT CONTROL GROUPS, INITIAL DIFFERENCESBETWEEN THE CONTROL AND EXPERIMENTAL GROUPS IN SONSONATE, ELSALVADOR AT THE START OF THE EVALUATION (1977)
Variable Participants Control Difference Test Score Probability
Years of education 4.52 3.05 +1.47 T 3.96 0.0001*
Weeks worked lastmonth 3.9 3.78 +.12 T 1.39 0.168
Months in presentjob 112 126 -14 T -1.01 0.339
Family size 5.67 4.82 +.85 T 2.89 0.004*
Household incomelast month 3.85 301 +84 T 3.52 0,001*
Age of head 37.2 43.5 -6.3 T -3.7 00001*
Sex of head (Z male) 60.3 66.7 -6.4 T .725 0.39
Branch of economicactivity X2 4.04 0.67
NOTE: For all calculations N 5 238
* = statistical difference between two groups at 0.05 level or beyond.
1

- 200 -
TABLE F-2: THE USE OF MULTIPLE REGRESSION ANALYSIS TO CONTROL FOR INITIALDIFFERENCES BETWEEN THE EXPERDIENTAL AND CONTROL GROUPS. THEEXAMPLE OF INCOME CHANGES IN SONSONATE, EL SALVADOR
IndependentVariables BETA B F Probability
Income in T(1) 0.49 0.83 67.9 0.01
Family size 0.14 21.9 5.9 0.05
Education of head 0.17 17.8 6.9 0.01
Age of head 0.13 3.58 4.1 0.05
Participant Status 0.01 68.2 3.31 0.10
NOTE: Other non-significant variables were not included in the table. Theseinclude: weeks worked last month, maonths in job, sex of head, type ofresidence.

- 201 -
is a difference in the value of income between the two groups aftercontrolling for household characteristics and income in T(1). In otherwords, project participation is associated with changes in income.
The analysis i more complicated in those cases where separatesamples are selected in T(1) and T(2). In this case ît is necessary toconduct 2 separate cross-sectional regression analyses. The first isconducted on the pre-test survey and the second is conducted on thepost-test survey. The form of the pre-test analysis is as follows:
Y1 a + blCl+b2C2+b3C34%..bnPART
where: Y2 = value of the dependent variable (income) in T(1)
CC1, C2, Cn = household characteristice (age, education, etc.)PART - Dummy Variable with Participant = 1 and Control = O
The post-test analysis will have the same form except that data fromthe second survey vill be used (and the dependent variable vill of coursebe Y.2 In its simplest form the analysis of project impact consists incomparing the coefficients for PART before and after the project. If theproject has had an effect on income, then there should be a statisticaldifference between the PART coefficients.
The same approach could be used in the analysis of smallbusinesses,transport companies or health programs.
D. The Use of Multiple Regression When Not All Participants Receive theSame Package of Services or When there is no Control Group
Two characteristics of many projects make it virtually impossibleto use the conventional analytical approaches to the evaluation of projectimpact. First, many projects such as upgrading, transport and smallbusiness development are intended to affect almost all of the low incomepopulations so it is impossible to find a comparable control group offamilies who will not be affected. Second, projects frequently comprise anumber of different componente which beneficiaries may receive in differentcombinations. One amall business may receive credit, whilst anotherreceives both credit and technical assistance. There are also differencesin the order in which services are received. Consequently, it is notpossible to divide the population into an experimental group affected bythe project and a control group not affected.
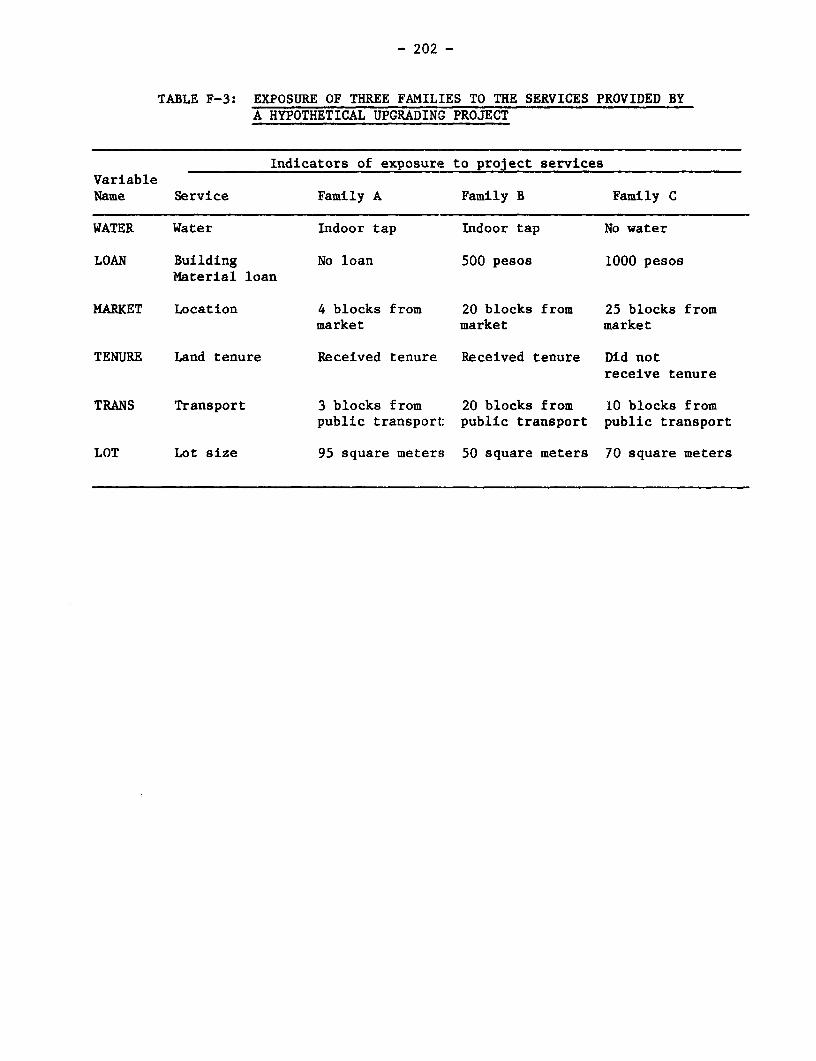
- 202 -
TABLE F-3: EXPOSURE OF THREE FAMILIES TO THE SERVICES PROVIDED BYA HYPOTHETICAL UPGRADING PROJECT
Indicators of exposure to project servicesVariableName Service Family A Family B Family C
WATER Water Indoor tap Indoor tap No water
LOAN Building No loan 500 pesos 1000 pesosMaterial loan
MARKET Location 4 blocks from 20 blocks from 25 blocks frommarket market market
TENURE Land tenure Received tenure Received tenure Did notreceive tenure
TRANS Transport 3 blocks from 20 blocks from 10 blocks frompublic transport: public transport public transport
LOT Lot size 95 square meters 50 square meters 70 square meters

- 203 -
The most effective approach to both of these problems is the use ofmultiple regression techniques discussed in the previous section. Insteadoreferring to an experimental and a control group, the analysis isconductedterms of the degree of exposure to each project component. TableF-3 illustthe way in which degree of exposure of 3 households can bemeasured with reto:
Water: Indoor tap (Score=l) v No indoor tap (Score=0)
Building materialsloan: Score = value of the loan
Access to market: Score = number of blocks from the market
Tenure: Received tenure (Score = 1)/Not received tenure (Score = 0)
Access to transport: Score = blocks from bus stop
With indicators such as these it is possible to measure in aquestionnaire degree of access of each household to all of the servicesprovided by project. Similar measures could be used for access to smallbusiness services or health programs.
Table F-4 shows how these measures of exposure are treated in themultiple regression analysis. In this example a number of importantsimplifying assumptions have been made. The most important is theassumption that there are no interactions between the project inputs (whichpermits the use of a simpler additive model). This assumes, for example,that the impact of water on housing investment is not affected by whetherthe family has received a material loan, has land tenure or the distancethey live from a paved road. If these types of interactions do exist, thespecification of the equation would become more complex as it would benecessary to include interaction terms to describe the way in which thelevel of one variable affects the impact of another. A second simplifyingassumption is to express all variables in their simplest linear form. Inmore complex forms some of the variables might be expressed as powers orroots. Although the researcher must be aware that these simplifyingassumptions have been made, they are justified for the first phase of theanalysis. In most studies a simple linear additive form will be used forthe first runs, and then more complex forms may be tested. In this examplethe objective is to evaluate the impact of each project component on thestimulation of housing investment. As in the previous example, the column"B" indicates the amount of change in housing investment produced by aunitincrease in each of the project variables given in the first column.Similarly the final column "probability" indicates whether the coefficientis statistically significant. It can be seen, for example, that when allother variables are held constant, a 1 peso increase in the materials loanwill produce a 2 peso increase in housing investment. Similarly,acquisition of land tenure produces an average increase of 200 pesos inhousing investment.

- 204 --
TABLE F-4: SIMPLIFIED EXAMPLE OF MULTIPLE REGRESSION ANALYSIS. THE IMPACTOF WATER, BUILDING MATERIAL LOANS, TECHNICAL TRAINING, TENUREAND PAVED ROADS ON INCREASES IN HOUSING INVESTMENT
Variable B F Probability
Xi Water 0.2 4.1 0.5
X2 Material loan 2 7.2 0.1
X3 Technical training 3 2.8 Greater than 0.5
X4 Land tenure 200 5.9 0.25
X5 Paved roads 0.1 4.9 .05
Constant
Multiple Correlation coefficient (R2) = .59F(4,120) = 3.8 Probability is less than .01Standard Error of R2 = 3.8
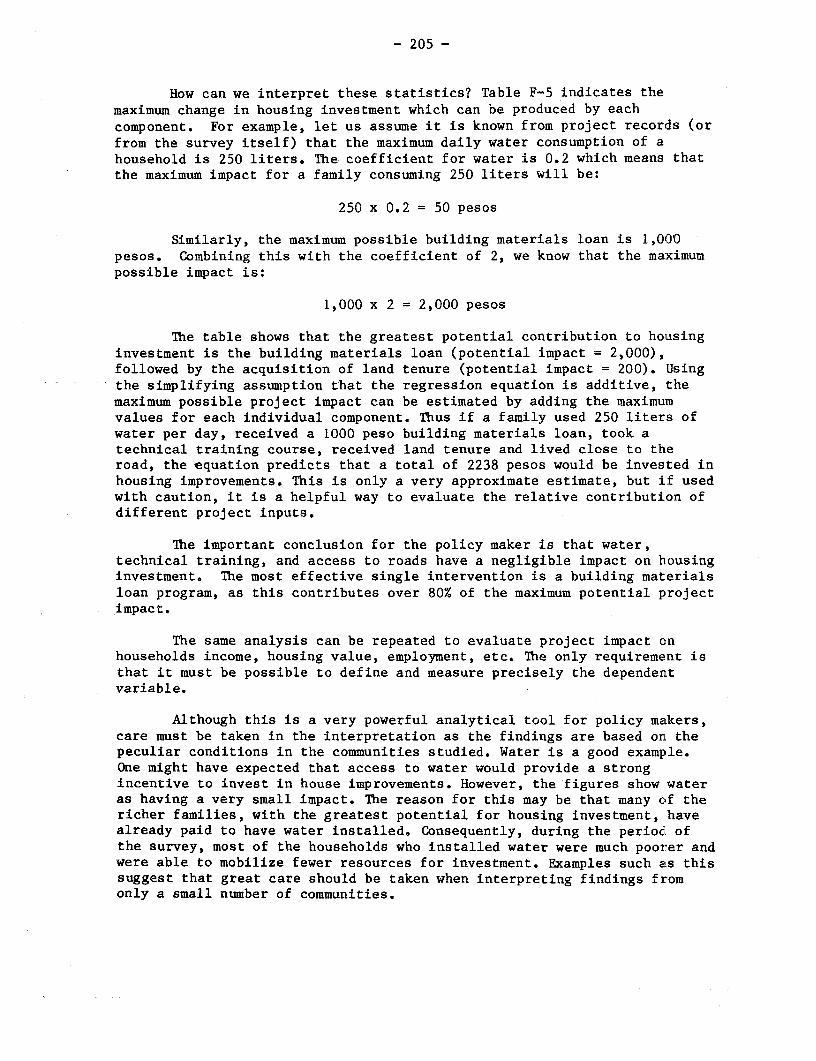
- 205 -
How can we interpret these statistics? Table F-5 indicates themaximum change in housing investment which can be produced by eachcomponent. For example, let us assume it is known from project records (orfrom the survey itself) that the maximum daily water consumption of ahousehold is 250 liters. The coefficient for water is 0.2 which means thatthe maximum impact for a family consuming 250 liters will be:
250 x 0.2 = 50 pesos
Similarly, the maximum possible building materials loan is 1,000pesos. Combining this with the coefficient of 2, we know that the maximumpossible impact is:
1,000 x 2 = 2,000 pesos
The table shows that the greatest potential contribution to housinginvestment is the building materials loan (potential impact = 2,000),followed by the acquisition of land tenure (potential impact = 200). Usingthe simplifying assumption that the regression equation is additive, themaximum possible project impact can be estimated by adding the maximumvalues for each individual component. Thus if a family used 250 liters ofwater per day, received a 1000 peso building materials loan, took atechnical training course, received land tenure and lived close to theroad, the equation predicts that a total of 2238 pesos would be invested inhousing improvements. This is only a very approximate estimate, but if usedwith caution, it is a helpful way to evaluate the relative contribution ofdifferent project inputs.
The important conclusion for the policy maker is that water,technical training, and access to roads have a negligible impact on housinginvestment. The most effective single intervention is a building materialsloan program, as this contributes over 80% of the maximum potential projectimpact.
The same analysis can be repeated to evaluate project impact onhouseholds income, housing value, employment, etc. The only requirement isthat it must be possible to define and measure precisely the dependentvariable.
Although this is a very powerful analytical tool for policy makers,care must be taken in the interpretation as the findings are based on thepeculiar conditions in the communities studied. Water is a good example.One might have expected that access to water would provide a strongincentive to invest in house improvements. However, the figures show wateras having a very small impact. The reason for this may be that many of thericher families, with the greatest potential for housing investment, havealready paid to have water installed. Consequently, during the period ofthe survey, most of the households who installed water were much poorer andwere able to mobilize fewer resources for investment. Examples such as thissuggest that great care should be taken when interpreting findings fromonly a small number of communities.
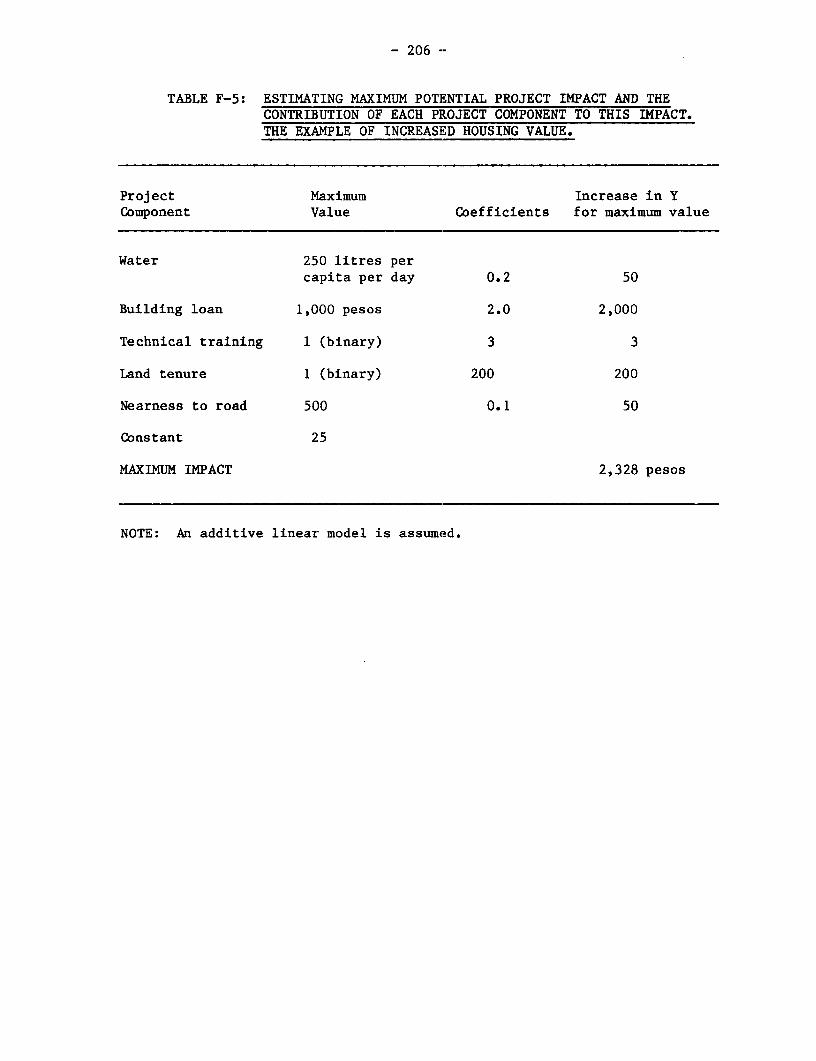
- 206 --
TABLE F-5: ESTIMATING MAXIMUM POTENTIAL PROJECT IMPACT AND THECONTRIBUTION OF EACH PILOJECT COMPONENT TO THIS IMPACT.THE EXAMPLE OF INCREASED HOUSING VALUE.
Project Maximum Increase in YComponent Value Coefficients for maximum value
Water 250 litres percapita per day 0.2 50
Building loan 1,000 pesos 2.0 2,000
Technical training 1 (binary) 3 3
Land tenure 1 (binary) 200 200
Nearness to road 500 0.1 50
Constant 25
MAXIMUM IMPACT 2,328 pesos
NOTE: An additive linear model is assumed.

- 207 -
How does this technique resolve the problem of an absence of acontrol group? The logic of the approach is to consider all households whohave not received a particular service as the control group for thatparticular component. For example, if 240 households have not receivedland tenure and 260 have received it, the 240 would be used as the controlgroup for analyzing the impact of this component. What the model permits usto say is: "When we compare households with the same level of access to allother project components, having access to land tenure will, on average,produce an increase of X pesos in housing investment". It is also possibleto introduce socio-economic characteristics of the households into theanalysis so that the impact of land tenure can be compared for householdsof different income levels, with different numbers of members, etc. Usingthese techniques it is possible to statistically produce a control groupwith similar characteristics to the experimental group. From thestatistical point of view this approach is weaker than the use of anexternal control group, but if used carefully it permits us to conduct animpact evaluation for many types of projects which conventional analyticalprocedures could not handle.
The above discussion is based on the simple case in which a paneldesign is used. In those cases where the analysis is based on independentsamples, the same procedures will be used as were discussed in the previoussection.
E. Path Analysis
Ailthough regression analysis can provide estimates of total projectimpact, it has the limitation of not helping the policymaker to understandthe dynamics of the project implementation process. A useful analyticaltechnique for this purpose is Path Analysis. Table F-6 illustrates the useof Path Analysis to evaluate the impacts of a small business developmentprogram in Colombia (DESAP). The DESAP program offered loans, technicalassistance and training courses. Five indicators of project impact weredeveloped (increase in number of workers, production, sales, profits andfixed capital). These indicators were combined into a summary index ofproject impact (PROGRESS). In addition, increases in knowledge (KNOWLEDGE)was defined as an intermediate project impact.
The Table indicates the paths which connect characteristics of thecompany, project inputs and project impacts. The numbers on each path arethe path coefficients which are the standardized regression coefficients.Thus the path coefficient between loans and PROGRESS is 0.14, and thecoefficient between loans and KNOWLEDGE is 0.11.
It is possible to derive the residual path coefficients whichindicate the proportion of the variance not explained by the variables inthe model. This is defined as:
r = 1-Ri2
where: n = the residual path coefficient for variable iRi2= the multiple correlation coefficient for variable i.

TABLE F-6 ExamPnle of the use of Path Analysis to evaluate the impacts of a
small business credit program lin Colombia (DESAP)
TECHNICAL #ASSISTANCE ls
EDUCATIN ^
_ , '8«~--__ TRAININ/\
X , COURSES SUMMAHY
INDIEX OF œ0
AGE OF l'11ECOMPANY

- 209 -
The diagram shows that the unexplained proportion of the variance ofPROGRESS is 0.83 (83%) which means that between them KNOWLEDGE, loans andage of the company explain 17% of the variance (100% - 83%). This meansthat although the factors we have studied in the model can explain asignificant part of the variance in PROGRESS there may be other importantfactors which are not included in the model.
One of the advantages of the path diagram is that it helps theproject manager to understand the relative influence of the various factorsbeing studied and the ways in which they interact. A one unit increase inKNOWLEDGE will produce a 0.34 unit increase in PROGRESS; whereas a one unitincrease in loans will produce a 0.14 unit increase in PROGRESS.
The diagram also helps management to understand the direct andindirect influences of each factor and hence to evaluate the most effectiveways to increase project impact. For example, it can be seen that loanshave both a direct effect on PROGRESS and also an indirect effect throughtheir influence on KNOWLEDGE.
It is very simple to construct a path analysis diagram as all of therequired information can be obtained from a set of standard regressionequations.
F. Cost-Benefit Analysis
Although an internal evaluation of a project can give us some idea ofhow efficiently it was organized and what types of impact it produced onbeneficiaries, it cannot tell us how this project compared in terms ofcosts, efficiency and accessibility with other options available in thehousing market. One way to make this type of comparison is throughcost-benefit analysis.
A cost-benefit analysis of housing projects will usually comprisethe following steps:
(a) A set of housing options are selected. Ideally these shouldinclude all types of formal and informal housing to which the low-incomepopulation could have access. In the case of the El Salvador study(Fernandez Palacios and Bamberger, 1984) the following housing options wereincluded in the analysis:
(1) Unregulated squatter settlements(ii) Public squatter upgrading programs(iii) Extra-legal subdivisions(iv) Tenement housing
(v) and (vi) 2 types of sites and services(vii) Public multi-family units(viii) Public single family units(ix) Private single family units
(b) For each option, information is obtained on all costs related tothe project. These costs typically include:

- 210 --
(i) Land(ii) Site preparation(iii) Installation of services(iv) Contractors labor costs(v) Contractors materials costs(vi) Administrative costs(vii) Additional labor costs for owner(viii) Additional material costs for owner
(c) The costs can be evaluated from the point of view of thenation (public costs) or of the individual household (private costs). Thecalculation of public costs requires the estimation of the opportunity costof the project in terms of the alternative uses of the resources. Forexample, the public cost of labor must take into account the unemploymentlevel. If unemployment levels are very hiLgh, then the opportunity cost ofthe labor is much lower (i.e., there is liLttle alternative demand). On theother hand, the private cost of labor is the foregone income. If astorekeeper could have earned 250 pesos in the time he spent working on hishouse, the cost to him fA 250 pesos.
In the evaluation of public costs, it is necessary to take intoaccount a series of explicit or disguised subsidies. Many of theadministrative costs of public housing agencies are not charged to theproject. Similarly, land may be provided firee by a local authority and itscost not charged to the project. One of the most time consuming parts ofthe cost-benefit analysis is the identification of all these costs and theestimation of their social cost.
(d) Identification and measurement of all project benefits. Whereasobjective measures of costs can usually be obtained, benefits must beimputed. The usual approach is to assume that the benefits obtained from ahouse are reflected in the market rent for this type of unit. Where a wellfunctioning housing market is in existence, it may be possible to observerents. However, in many low-cost housing projects rents must be imputed byasking households how much they think the house would rent for. Thisprocedure is likely to produce a greater mrargin of error than occurs withthe estimation of costs. There is also a question of whether rents reflectbenefits such as improved health of which families may not yet be aware.
(e) The flow of costs and of benefits is computed by estimating theyear in which each cost and benefit will c>ccur. For example, if a familymust pay a fixed purchase cost over a period of 15 years, this cost willoccur during each of these years. On the other hand, building materialsare usually paid for over a relatively short period of time.
(f) Costs or benefits which occur in the future have a lowerpresent value" than similar costs or benefits which occur at the presenttime. If a family has to pay 100 pesos in two years time, this has a lowerpresent value than 100 pesos which must be paid today. The reason is thatif a person owes 100 pesos but does not have to make the payment for twoyears, he could invest the money and earn interest during this period. Ifhe had to make the payment today he would lose this interest. Thus, futurecosts or benefits are discounted by an appropriate rate of interest.

- 211 -
For each year, costs are subtracted from benefits to obtain the netbenefits for that year. During the early years the net benefits willusually be negative as costs are higher than benefits, but during the lateryears the benefit streams will be positive. The net benefits are discountedby the appropriate rate of interest to obtain the present value of the netbenefits for each year. The present values for each year are added toobtain the Net Present Value (NPV) of the project. If the Net Present Valueis positive, this means that investment in the project yields a higher rateof return than could have been obtained from investing the money at thecurrent rate of interest. If NPV is negative, the project yields a lowerrate of return than could have been obtained from an alternativeinvestment.
(g) An alternative analytical approach is to estimate the "InternalRate of Return" (IRR). This is achieved by discounting the net benefitflows by different interest rates until a Net Present Value of 0 isobtained. For example, if an interest rate of 10.5% produces NPV=O, thismeans that investment in the project produces a rate of return of 10.5%.IRR produces results consistent with NPV in that:
(i) When IRR is less than the discount interest rate, NPV will benegative.
(ii) When IRR is equal to the discount interest rate, NPV will be 0.
(iii) When IRR is greater than the discount rate, NPV will bepositive.
In order to compare different projects, NPV must be divided by theNPV of the cost stream to take into account the fact that differentquantities of resources have been invested in each project. For example,in Table F-7 the NPV of the IVU rehabilitation project is significantlylower than that of the meson (1078 compared to 1674), but the NPV/Cost ofthe former is nearly 20 times as high as the latter (0.2640 compared to0.0141). It is advisable to conduct both IRR and NPV analyses as each cantell us slightly different things about the project.
Table F-7 presents the results of a cost benefit analysis in whichEl Salvador housing options were compared. In this case, a discount rateof 12% (the current market interest rate for housing loans) was used. TheIRR varies from a maximum of 33% for the FSDVM Basic Sites and ServicesUnit, to a minimum of 9% for the IVU multi-family unit. NPV is presentedin the second column. For projects with an IRR above 12% (the discountrate), NPV is positive; where IRR is less than 12%, NPV is negative. In thethird column, NPV is divided by total cost so as to control for thesubstantial differences in the magnitude of the cost of each project. Itcan be seen that the orders of magnitude of this ratio have the same rankorders as the other two indicators.
An interesting extension of the above analysis is to compare thecosts and benefits to the nation and to the household. For projects whichinclude significant subsidies, the relative rankings in terms of theirpublic and private cost-benefit ratios can be quite different. This isimportant information for the policymaker as it suggests that price

- 212 -
TABLE F-7: COMPARISON OF HOUSING OPTIONS IN TERMS OF ECONOMIC RATE OFRETURN, NET PRESENT VALUE AND NET PRESENT VALUE/TOTAL COST.SAN SALVADOR, 1978
Net Ranking on 3Rate of Present Value Indicators
Housing Option Return (Colones) NPV/Cost (1 = highest)
Upgrading and Sites and Services
FSDVM Basic Unit 33 4065 1.2016 1
FSDVM Serviced Lot 28 2329 0.7269 2
IVU Rehabilitation 18 1078 0.2640 4
Traditional Housing
IVU Multi-Family Unit 9 -1828 -0.1304 9
IVU Single Family2-Bedroom Unit il - 606 -0.0720 8
FSV Single-Family Unit 13 452 0.0641 5
Informal Market
Colonia Ilegal 22 1788 0.3509 3
Meson 12 1674 0.0141 7
Tugurio 20 373 0.2972 6
Source: Fernandez-Palacios and Bamberger, 1984.

- 213 -
distortions (subsidies) may encourage households to invest in shelteroptions which are not the most efficient from the point of view of thenation.
G. Hedonic Price Analysis
Housing is not a single product of which one purchases a certainnumber of units, but a package which includes varying numbers and sizes ofrooms, level of services, quality of construction, location in the city,and neighborhood characteristics. The purpose of hedonic price analysis isto estimate the amount which households are willing to pay for eachcomponent of the housing package. This is achieved through the use ofmultiple regression analysis where housing attributes are regressed onrent. The coefficients of each component can be interpreted as theadditional amount households are prepared to pay to obtain an extra unit ofthis component. Table F-8 presents the findings of an hedonic analysisconducted on low income housing in El Salvador (Quigley, 1980). Thecoefficient for number of rooms is given as 10.77. This can be interpretedas indicating that when all other components of the housing package are thesame, a family, would, on average, be prepared to pay an additional 10.77pesos of rent per month for each extra room. Similarly, they would pay0.66 pesos for each extra meter of space and 2.76 pesos for access to pipedwater. Hedonic prices can be used at the planning stage to estimatepotential demand and willingness to pay for different housing packages.The technique can also be used in an ex-post evaluation. This latterapplication is extremely useful in those cases in which there is not a wellfunctioning housing market and where, consequently, it is not possible toobtain directly information on the amount of rent paid for the shelterpackage offered by the project being evaluated. In the previouslymentioned study in El Salvador, the coefficients given in Table F-8 wereobtained from a study of the types of tenements in which participants livedbefore moving to the project. As is often done, various differentspecifications of the equation were compared to determine which formexplained the highest proportion of the variance. The R2 was found to behighest for the semi-logarithmic form. The coefficients were then appliedto the services provided by the project (lot size, water supply, roofconditions, etc.) to impute the amount which households would have beenprepared to pay for a shelter unit with this level of services. It wasfound that this hedonically imputed rent was higher than the monthlycharges participants were required to pay. The difference between theimputed rent and the actual payments was interpreted as a consumer surplusobtained by participants.

- 214-
TABLE F-8: EXAMPLE OF DIFFERENT FUNCTIONAL FORMS OF A HEDONICREGRESSION BASED ON HOUSING DATA FROM EL SALVADOR
Linear Form Semi Log Log-LogCoefficients 1 2 3 4 5
Number of Rooms 10.770 10.750 0.373 0.573 0.574(8.38) (8.41) (7.72) (7.71) (7.61)
Living Area 0.661 0.653 0.028 0.028 0.027(meters2 x 10) (2.01) (2.00) (2.22) (2.19) (2.16)
Lot size 0.528 0.477 0.034 0.033 0.412(meters2 x 10) (0.70) (0.64) (1.20) (1.15) (1.59)
Electricity 2.904 2.823 0.159 0.153 0.154(1 = available) (1.34) (1.34) (1.95) (1.91) (1.87)
Piped Water 2.759 2.669 0.184 0.178 0.173(1 = available) (1.14) (1.12) (2.02) (1.97) (1.84)
Sanitary Quality 3.465 3.501 0.093 0.095 0.178(3.52) (3.59) (2.51) (2.58) (2.50)
Floor Condition 1.365 0.077 0.067(0.52) (0.78) (0.47)
Wall Condition 0.753 0.075 0.142(0.39) (1.04) (1.04)
Roof Condition 3.875 0.205 0.258(0.75) (1.05) (0.715)
Aggregate Condition 1.233 0.088(0.89) (1.68)
Intercept -17.270 -12.550 1.224 1.419 2.070(1.43) (1.51) (2.68) (4.52) (7.44)
R2 0.363 0.363 0.358 0.357 0.345
R2 (In Original Space) 0.363 0.363 0.384 0.384 0.353
SEE/mean 0.438 0.436 0.124 0.124 0.125
SOURCE: Quigley, 1980. The table has been simplified.

- 215 -
H. Further Reading
Michael Bamberger. 1982. "Statistical Procedures for the Evaluation ofProject Impact". Explanation of the methods of statistical analysiswhich can be used with each evaluation design.
Hubert Blalock. 1972. Social Statistics. One of the best textbooks onstatistical analysis.
Maria Fernandez-Palacios and Michael Bamberger. 1984. "An EconomicAnalysis of Low Cost Housing Options in El Salvador." Example of theuse of cost-benefit analysis to compare housing options.
Emanuel Jimenez. 1982. "The Value of Squatter Dwellings in DevelopingCountries." Example of the application of hedonic price analysis tothe estimation of the benefits obtdlned from each component of asquatter upgrading project.
Stephen Malpezzi. 1984. "Analyzing an Urban Housing Survey: EconomicModels and Statistical Techniques". Explanation of how to analyze theresults of a housing survey. Includes a simple explanation of thelogic of regression analysis.
N.H. Nie and others. 1975. Statistical Package for the Social Science.Presentation of the most widely used statistical computer packagewhich contains all of the procedures referred to in this chapter.Also an easy to follow textbook on statistics.
S. Siegel. 1956. Non-Parametric Statistices for the Behavioral Sciences.Easy to follow explanation of the statistical procedures to use withordinal and nominal variables.

- 216 - Anmes G
_MP7dE OUTLINE OF A QUARTERLY PROGRESS REPORT
A. Introduction
The example presented in this Ann(ex refers to an urban shelterproject. However, all of the principles discussed can be applied equallywell to other types of project. The Quarterly Progress Report is designedfor project management. Its purpose is to present for management reviewkey information from the project monitoring system. To this end, theinformation contained in the reports should cover at least the followlngaspects of the project:
(a) comparison of actual progress with the original estimatedschedule of implementation;
(b) actual or contemplated major deviations from the original plansor schedules and reasons for these deviations. Changes whichwould require prior consultation with management should bereported immediately and included in a subsequent report;
(c) conditions which could signiiicantly affect construction andprocurement schedules and/or the cost of the project;
(d) the latest cost estimates, commitments and expenditures and theavailability of funds to meet: the cost of the project;
(e) progress made in community development activities.
B. Contents of the Report
The Quarterly Progress Report will normally contain the followingsections:
1. Summary
A brief overview of the progress of the project together with anidentification of the problems and key issues which must be addressed bymanagement. A brief (one page) summary may be included on several of thekey issues requiring immediate attention.
2. Physical implementation
This section should describe issues, events and changes concerningconstruction of civil works on each subproject, site by site. Where actualor expected problems become apparent, information should be given onmeasures taken or planned to correct them and the probable effects onscheduling and costs. The following tables should be included to summarizeprogress:
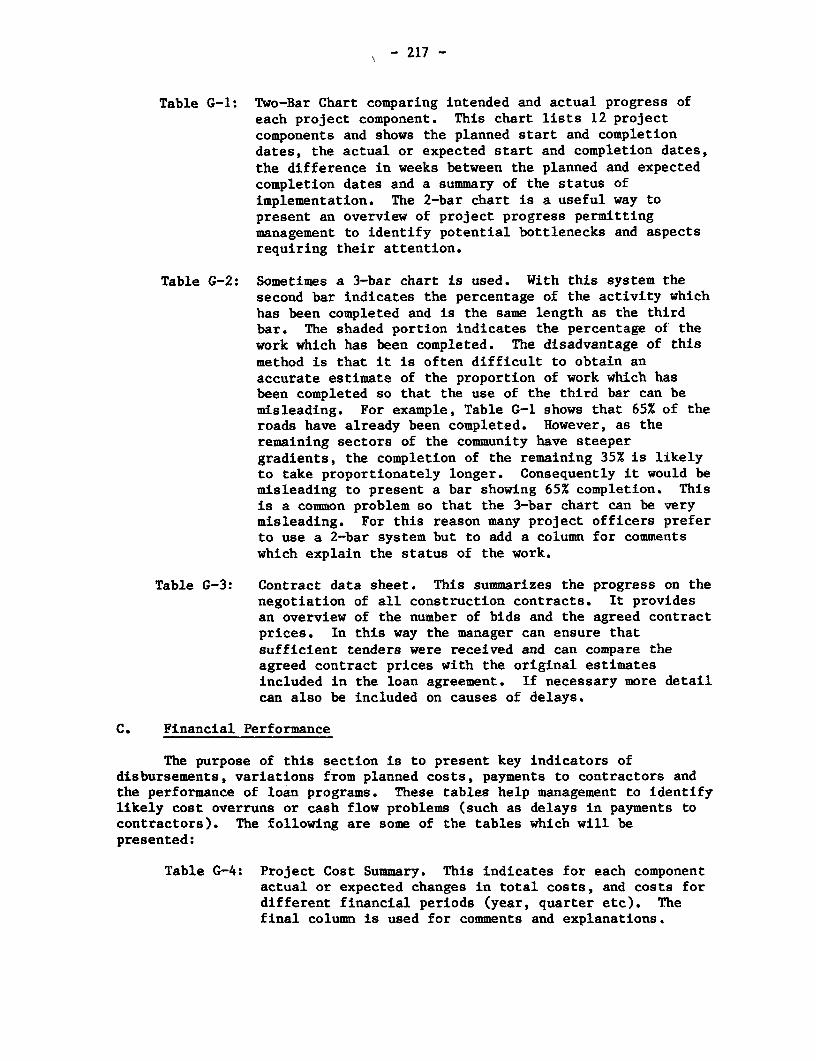
\ - 217 -
Table G-1: Two-Bar Chart comparing intended and actual progress ofeach project component. This chart lists 12 projectcomponents and shows the planned start and completiondates, the actual or expected start and completion dates,the difference in weeks between the planned and expectedcompletion dates and a summary of the status ofimplementation. The 2-bar chart is a useful way topresent an overview of project progress permittingmanagement to identify potential bottlenecks and aspectsrequiring their attention.
Table G-2: Sometimes a 3-bar chart is used. With this system thesecond bar indicates the percentage of the activity whichhas been completed and is the same length as the thirdbar. The shaded portion indicates the percentage of thework which has been completed. The disadvantage of thismethod is that it is often difficult to obtain anaccurate estimate of the proportion of work which hasbeen completed so that the use of the third bar can bemisleading. For example, Table G-1 shows that 65% of theroads have already been completed. However, as theremaining sectors of the community have steepergradients, the completion of the remaining 35% is likelyto take proportionately longer. Consequently it would bemisleading to present a bar showing 65% completion. Thisis a common problem so that the 3-bar chart can be verymisleading. For this reason many project officers preferto use a 2-bar system but to add a column for commentswhich explain the status of the work.
Table G-3: Contract data sheet. This summarizes the progress on thenegotiation of all construction contracts. It providesan overview of the number of bids and the agreed contractprices. In this way the manager can ensure thatsufficient tenders were received and can compare theagreed contract prices with the original estimatesincluded in the loan agreement. If necessary more detailcan also be included on causes of delays.
C. Financial Performance
The purpose of this section ie to present key indicators ofdisbursements, variations from planned costs, payments to contractors andthe performance of loan programs. These tables help management to identifylikely cost overruns or cash flow problems (such as delays in payments tocontractors). The following are some of the tables which will bepresented:
Table G-4: Project Cost Summary. This indicates for each componentactual or expected changes în total costs, and costs fordifferent financial periods (year, quarter etc). Thefinal column is used for comments and explanations.

- 218 -
Table G-5: Cost variance analysis. This permits an analysis of thereasons for variations from the original cost estimates.The table shows, for each component, the extent to whichcost variations are due to price changes, changes in thequantity or quality of the work required from thecontractor and changes in project design.
Table G-6: Summary data on contractors' payments. This is used tomonitor payments to contractors and compares actual andplanned (projected) payments on a yearly (or quarterly)basis to each contractor. This control is important asthe complicated administrative structure of many projectscan result in long delays in payments to contractors withresulting delays in the execution of work.
Table G-7: Construction loan program. This monitors the progress ofapproval and disbursement of construction loans toparticipant families. The table shows both the number ofloans approved and disbursed, and also their distributionamong income groups. This is important as an objectiveof many projects is to ensure that low-income householdshave access to loans and other project benefits.
D. Services and Progr ams
Key information relating to the "software" elements of the projectshould be discussed in this section. Events, issues, changes, difficultiesor delays should be discussed along with expected effects on theimplementation schedule and costs. Information should be presented on theprogress of each of the main services or programs. The information villoften be presented in the form of the type of 2 or 3 bar chart illustratedin Tables G-1 and G-2. The f ollowing are some of the most commoncomponents:
1. Plot allocationl/
The status of this phase should be discussed, including areview of the following steps in the process: advertisingplots, community outreach, processing applications andallocation of plots. Delays should be noted along with thereasons for the delays.
2. Construction loans
(Described above in Table G-3)
3. Income and business support
Compares planned and actual progress of income and businesscomponents such as markets, lorry parks, open-air garages, andsamall business credit programs.
1/ See also: Lauren Cooper 1981

- 219 -
4. Community development
This component can be difficult to monitor, both because manyproject staff are unfamiliar with these activities and becausemany community development activities are difficult toquantify. It is, however, important to develop a schedule orcalendar of the main activities (meetings, groups to be formed,community participation in construction activities etc) toprovide a basis for monitoring progress. However, it is alsoimportant to complement this data with qualitative reports,often presented verbally, by the community development workers.
5. Project management
This should reflect changes in the staffing situation,recruitment and staff training programs. Any actual orperspective changes in key personnel should also be reported.Chapter 3 Section D suggests some of the possible indicatorswhich can be used.
E. Attitudes of project beneficiaries
In addition to regular information on the physical and financialprogress of projects, managers also need regular feedback on the attitudesof targetted beneficiaries to assess the project's effectiveness inresponding to their needs. Experience has shown that serious problems canarise when effective communication linkages are not maintained withbeneficiaries, and for this reason the Quarterly Progress Report shouldregularly include a section on attitudes of actual and intendedbeneficiaries. One way to obtain feedback on beneficiary attitudes ïs toconduct a short survey every 3 months with a small sample ofbeneficiaries.
Table G-8: This shows how the results of such a survey can bepresented. In this example interviews were conductedwith 20 families already living in the project and 20who had been selected but had not yet moved. Questionswere included on their satisfaction with variousaspects of the project (toilets, electricity, garbagecollection etc). Questions were also included on theirknowledge of the services which were operating or beingplanned.
It is important to stress that although a rapid survey of this kindcan provide useful indicators, it should be complemented by informalinterviews and direct observation. Annex B describes some of the methodswhich can be used for this purpose.

TABLE G-1 Bar Chart for Controlling the Progress of Project Implementation:Example of a Sites and Serices Project
YEAR 1986 1987 1988 1989 1990 REV1SED
STAGE QUARTER 1 2 3 4 1 2 3 4 1 2 3 4 1 2 3 4 (WEEKS) STATUS
1 Approval of Contract + 8 Cornpteted
2 Ecrth Moving -._16 Completed
3 Instatotion of Water +18 82% of Donestic Water Connections Completed
4 Instalotion of Sewage System -15 73% of Sewage Pipes Laid
5 Instalotion of Drainage System +13 44% of Drains Laidt'a
6 Rood Construction . _ .___. _ t_ 6 65% Laid But Steop Terrain Will Siow Remaining WoEk O
7 Se!ectio-n of Participants :ô:6 6.000 od 10 000 Participants Aireody Selected
8 Completion of Core Units r-12 20% of Core Units Constructed
9. Group House Construction t 18 Lag Due to Delays in Earlier Stages
10. Construction Loon Approvai - 12
t 1 Plot Occupation _+ 17
12 Community Facilities +18
Kev
Plonned Start & Completion Dates
Actual or Re-estimated ston &Completion Dates
Wortd Bank-27668
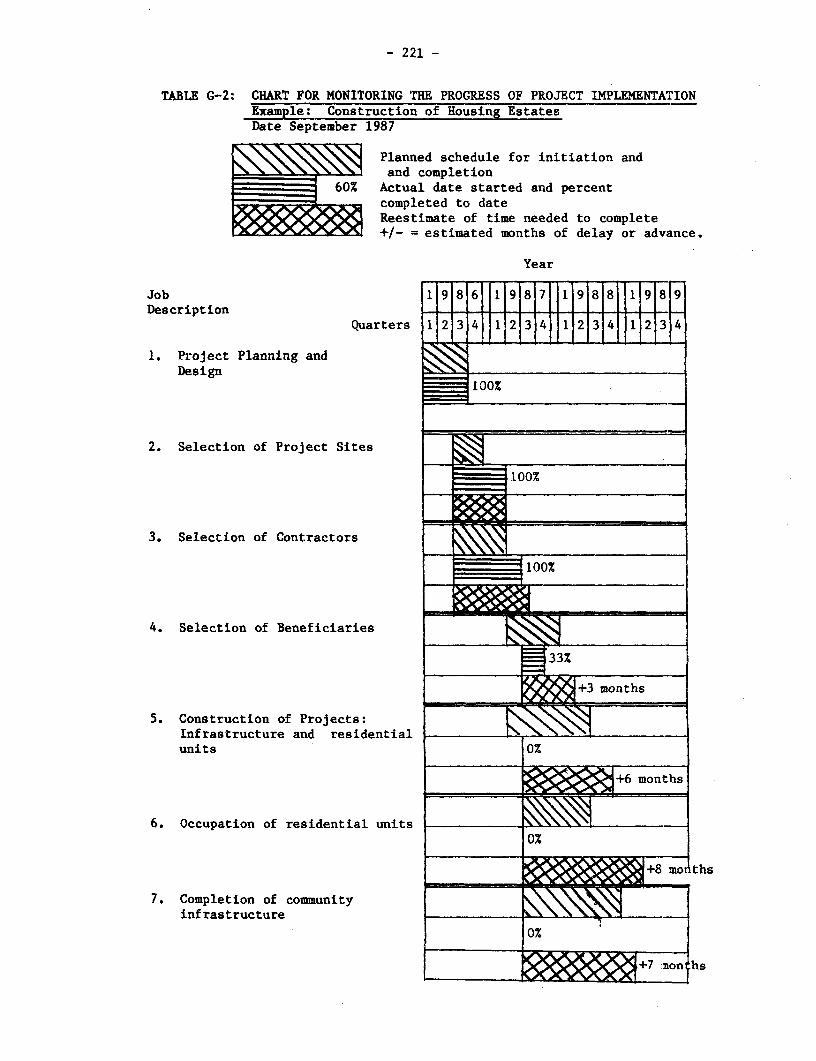
- 221 -
TABLE G-2: CHART FOR MONITORING THE PROGRESS OF PROJECT IMPLEMENTATIONExample: Construction of Housing EstatesDate September 1987
Planned schedule for initiation andand completion
60% Actual date started and percentcompleted to dateReestimate of time needed to complete
J ~4* 1 +t- =estiîated months of delay or advance.
Year
Job 9 6 9 9Description 1 1
Quarters 1 2 1l2tt 3 lT 434rlT
1. Project Planning andDesign
2. Selection of Project Sites
l 1~~100%
3. Selection of Contractors
-- - -100X
4. Selection of Beneficiaries
33%
+3 months
5. Construction of Projects:Infrastructure and residentialunits 0%
w ~~+6 months
6. Occupation of residential units -- -----0%
+8 ~~~mo .ths
7. Completion of commiunityinfrastructure
_ _ ~~~~~~+7 imonl :hs

TIIE G-3: CNMA r DM SHE:r
Ibteof Fc£eedNDO. of Bids Contract
Cmtract No./Package Incatio oe f ttbnk Bld Openfrig Bid Closing Award Reoeived Contractor Nais Màn ounemt Date Copeptlon DELte

TABLE G-4: PROJECT COST SUMMARY
ACTIVITY EXPECTED TOTAL BUDGET FOR EXPENDITURE DURING CUMULATIVE BUDGET NEXTCOST FINANCIAL YEAR REPORTING PERIOD EXPENDITURES QUARTER COMMENTS
Plan Action Z Plan Actual Z Plan Actual Z Plan Actual zchange change change change
____________________ _______________ ______________________________ _______________ ___________________._________
. .____ __________ ________________ __________ _____. ______________________

TABLE G-5: COST VARIANCE ANALYSIS
PROJECT/COMPONENT
ACTIVITY EXPECTED FINAL COST ANALYSIS OF COST VARIARTION SUMMARY OF VARIATIONPrice Variation Contractor Variation Project Design
Quality of Quality of ChangesWork work Percentage change from plan
Plan Current Plan Current Plan Current Plan Current Plan Current Price Quantity Quality Total
TOTAL __ _

TABLE G-6: SRY4 DM» LN oaNMt PAVfEfSDate : -
Comtract rid,er/ OrgialOge Orders ToL Conm- Ctractors Payent Sdeu3lePackaW Contract & Escalatiors tractors Pay- Expeed Rain rig
.naunt To Date Deres to Date C.tractors Payut 1984 1985 1986 1987
Actuel uPr- Actual Pro- Actual Pro- Actual Pro-j jected jected jeet

IABLE G-7: CONSTRUCTION LOAN PROGRAMRESIDENTIAL
Date:Town:Site:
Original Targetat Appraisal Loans in Process Loans Approved Loans Fully Disbursed
No. of Loans byCalendar No. of Loans to Cumulative Dist. Income_Group
Year be disbursed Amount No. Amount No. Amount No. Amount No. Amnunt Lowest Mid Highest3rd 3rd 3rd
1984 IlIII
IV
1985 III
IV
1986 I
IIIIII
TOTAL

- 227 -
TABLE G-8: SUIMARY OF INTERVIEWS ON PARTICIPANT SATISFACTION ANDINFORMATION PROJECT "LA ESPERANZA"
Families already living in Families who have not yetthe Project moved to the Project
(20 Interviews) (20 Interviews)
Partl: Satisfaction withthe Project
Not No Not NoSatîsfied Satisfied Reply Satisfied Satisfied Reply
General satisfactionwith the house 15 3 2 14 4 2
Satisfaction with the toilet 12 7 1 NotApplicable
Power supply (electricity) 8 9 3 NotApplicable
Garbage collection 9 7 4 il 5 6
Bus service 16 2 2 15 3 2
Drainage (flooding) 15 1 4 16 2 2
Security (need for nightwatcbman 12 5 3 8 8 4
Opening hours of projectoffice 4 8 8 5 7 8
Cost of building materials 2 15 3 4 13 3
Part 2: Knowledge aboutthis project know not know know not know
about about about about
1. Plans a cooperative 15 5 10 10
2. Organization and programof this junta 18 2 8 12
3. Sports club 10 10 4 16

- 228 -Annex H
DESIGNING A NETWOR1K BASED SYSTEN TO NONITOR PROJECTIMPLEKArE_ION
A. Introduction and Objectives
The system presented in this Annex is based on a modified PERT/CPMmodel and has the following objectives:
(a) To present a simple methodology which can be used in theinitial planning of the projEct. The System will indicatepotential bottlenecks and where the sequence of projectactivities should be rescheduled to reduce some of thesebottlenecks.
(b) Preparation of a calendar of activities for each projectcomponent.
(c) Indicate the impact of delays on overall project implementationand the need to re-estimate completion dates.
(d) Identify key aspects of project implementation on whichmanagement needs to take actions.
B. Designing the System
1. Defining the project components and their main stages
The first step in designing the system is to identify all of thecomponents of the Project and their main stages. Chart H-1 presents a listof components for a typical sites and services project. Ten components areidentified: Design; Land Acquisition; Tendering; Office Infrastructure;Construction of Core Unit by Contractor; Selection of Participants;Materials Loans Program; Completion of Habitable Unit; Occupation of Units;and Start of Cost Recovery.
Each component has a number of stages. In the example, the fourstages of the Land Acquisition component are: (i) identification ofpossible sites; (ii) identification of owner(s) and verification of title;(iii) topographical and other feasibility studies; and (iv) finalization ofpurchase agreement. Similarly, nine stages were identified for ParticipantSelection and Training. There is no firm rule on how many stages should beidentified, but the number should be small enough for each stage torepresent significant progress but sufficiently large to permit monitoringof progress. An arbitrary number of stages was given to each of the othercomponents for illustrative purposes.
The meaning of Nodes will become cLear in the discussion of theNetwork Chart.

- 229 -
2. Estimating the time required to complete each component
A chart should be prepared for each component indicating theestimated time for completion of,each stage. The chart should indicate boththe likely completion time and the possible delays which might occur.Obviously there is an element of unpredictability in many types of delay,but experience can often provide a general indication.
Charts H-2 and H-3 give examples of the estimation of completiontime for land acquisition and for the selection and training ofparticipants. In the case of land acquisition, all stages are sequentialso that one cannot be started until the previous one is completed.However, for selection of particiants a number of stages can be undertakenat the same time. Each chart indicates the preceding component which mustbe completed before this component can begin. There is also an indicationfor each stage of possible causes of delay and the amount of delay whichmight occur. The cumulative delay is indicated at the bottom of thechart. Finally, the component which follows that being studied isindicated.
3. Constructing a logical network of project implementation
Once the time required for each component has been estimated, itis then possible to construct a Logical Network which analyzes the linkagesbetween different components and estimates the time required for thecompletion of the total project. The proposed system is a simplifiedversion of PERT/CPM. Chart H-4 presents a typical network chart. Thestages in its construction are the following:
(a) A rough sketch is prepared of the logical sequence ofproject components and of the linkages between them. The sequence followsapproximately the order of components indicated in Chart H-1.
(b) Stage of completion of a component (as per Chart 1) isindicated on the Chart as a circle (called a Node). The left hand side ofthe Node indicates its number. Numbering approximately follows the logicalsequence of the Nodes.
(c) Nodes which logically follow each other are indicated byarrows. For example, Node 5 (identification of owners of land) logicallyfollows Node 4 (identification of possible project sites) and the two areconnected by an arrow.
(d) A number is placed on each arrow to indicate the estimatednumber of weeks to complete the stage following the arrow. For example itis estimated that four weeks will be required to complete stage 1 of theproject design (number 4 on the arrow leading to Node 1).
(e) The number in the upper right hand side of each Nodeindicates the shortest number of weeks from the start of the project inwhich this stage could be completed. This number is obtained by adding theestimated number of weeks for all stages leading to this one. Care must betaken in the estimation of this number. For example, the minimum number ofweeks to complete Node 4 is eight weeks. This is because it cannot be

- 230 --
completed until Node 2 (part of project design) has been completed, and itis estimated that eight weeks will be required to complete Node 2. Anystage whose completion is conditional upon the completion of two or moreseparate components, is indicated by a double circle, as this is a pointwhere a potential bottleneck could occur.
(f) The number in the bottom right corner of each Nodeindicates the maximum number of weeks which might be required for thecompletion of this stage if all anticipated delays actually do occur.
(g) At some points in the chart, two or more arrows connect toa single Node at the point where two components are completed (for examplewhere the Off-site Services end Tendering components merge at the start ofthe construction of core units at Node 15'. The arrow which represents thelongest time path has a number in the square box. This indicates the numberof weeks of Lag-Time available for the comipletion of this component withoutcausing delays in the start-up of the following component. For example, thearrow between Nodes 3 and 8 indicates there is a Lag-Time of five weeksbetween the estimated completion of Project Design and the start-up datefor Tendering.
The Lag-Time indicators are important because the smaller theLag-Time the greater the potential for delay in start-up of the followingComponent. For example, there is a Lag-Time of zero weeks between Nodes 27and 28. This means that any delay in the completion of either Selection ofParticipants or the implementation of the Materials Loan Program willautomatically produce a delay in the start-up of the Completion of aHabitable Unit. This point is, therefore, a potential bottleneck and willneed to be monitored carefully by management.
(h) In some cases one network loop may intersect with anotherin the middle of the implementation of a component. For example, Node 2 ofthe project design process must be completed before feasibility studies canbe conducted (Node 6) in the process of land acquisition. In this case,the link between Nodes 2 and 6 has the numxber -2 in a box, indicating thatthe completion of this stage of the design is delaying by two weeks theland acquisition process.
(i) Finally, it is possible te compute the total estimated timefor the completion of the project. If all steps are completed according totheir estimated time, the project will be completed in 146 weeks. If allof the possible delays were to take place, the total time would beincreased to 175 weeks.
(j) On the basis of the above computations, a Diagnosis ofImplementation Time and Potential Bottlenecks can be made (Chart H-5).This provides management with two sets of guidelines as to ways in whichproject implementation time could be reduced. Firstly, it indicates thecontribution of each component to total project implementation time. Thefirst column shows the number of weeks required to complete each componentwhile the second column indicates the number of additional weeks of elapsedtime required to complete each component. For example, the process of landacquisition requires 13 weeks, but much of this can be done at the same

- 231 -
time as project design so that only 3 weeks are added to elapsed time. Itis clear from this chart that any significant decrease in projectimplementation time can only be achieved by reducing the time of tendering,construction of the core unit or selection. Elapsed time can be reducedeither by completing a component more quickly or by altering thescheduling. For example, it might be possible to start the selectionprocess while the construction of the core unit is still underway.
Secondly, the potential bottlenecks are identified, together withthe time period in whih they are likely to occur. This suggests the needfor special attention to monitoring during these critical periods toidentify any potential delays or problems at an early stage.
4. Preparing the implementation calendar for each component
Chart H-6 gives an example of how the estimates produced in theearlier charts are used to produce an implementation calendar for eachproject component. This example shows a chart for Project Design and LandAcquisition. The two components, which have relatively few steps, have beencombined into a single chart. As by this stage the date for the start ofthe project will have been decided, it is possible to put dates on theimplementation calendars.
Project design has three steps which are sequential. The bar chartindicates the estimated number of weeks for each step and the starting andfinishing dates. The connecting arrows indicate that the start-up of astep is conditional on the completion of previous one.
Land acquisition has four steps, the first of which vill begin atthe same time as Project Design. However, it can be seen that step 3 cannotbegin until the completion of step 2 of project design. This causes a delayof two weeks in the start-up date for step 3. The spaces labled "Lag"indicate the number of weeks between the completion of a step and thestart-up of the next step which is conditional on it. This indicates amargin for delay which will not hold-up the overall project schedule.
The chart indicates the preceding steps which must be completedbefore the components can be implemented. These are blank in the presentcase, as the two components are the first in the project schedule. Thechart also indicates the following steps, which in the present case areTendering and the provision of off-site services.
C. Designing the Monitoring System
1. Monitoring the implementation schedule of each component
Chart H-7 presents a simple system for recording the delays inimplementation of each component and their effects. A chart of this kindshould be prepared for each component on which work has, or should have,begun. For each step the chart indicates the delays, if any, in start-updates, length of implementation and completion dates. An important featureof the chart is that it also indicates the causes of delays, their impactson the project, and possible actions which could be taken.

- 232 -
An important feature of the chart is to demonstrate theinteractions between the different project components and the cumulativeimpact of delays in any particular component. This is an important tool formanagement as project monitoring is often compartimentalized s0 that theinformation collected on each component is often not synthesized to presentan overall picture of the status of the project and the seriousness of thedifferent delays.
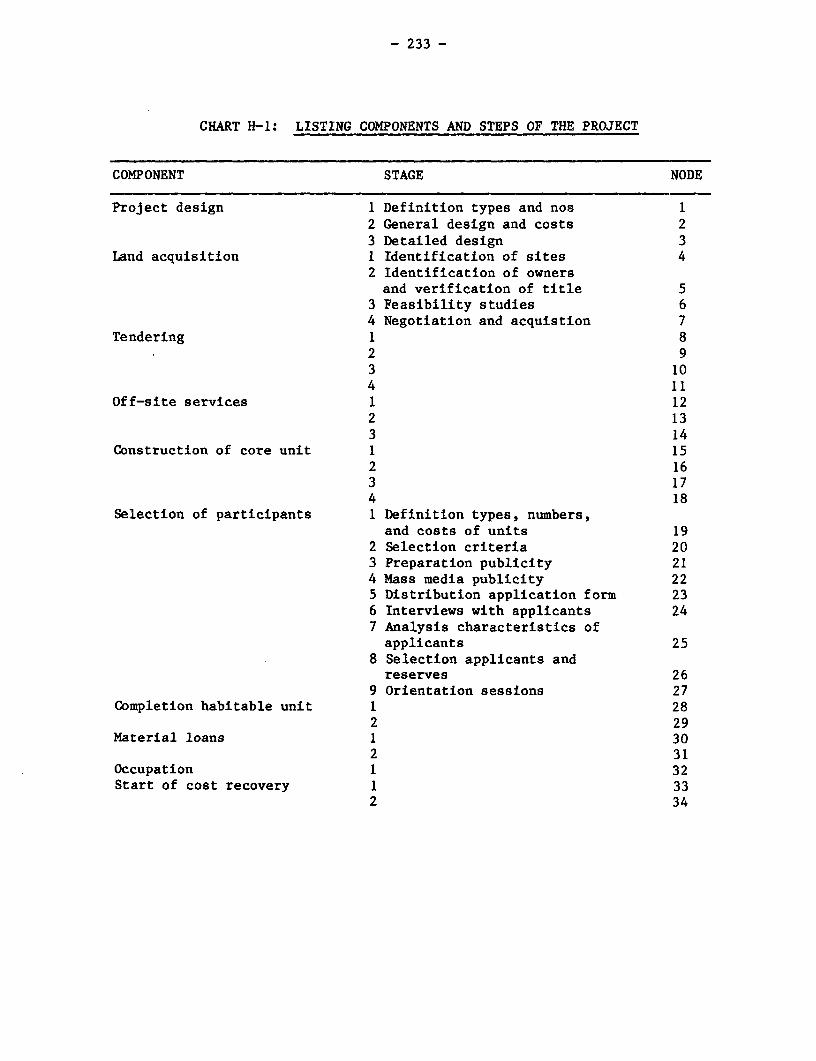
- 233 -
CHART H-1: LISTING COMPONENTS AND STEFS OF THE PROJECT
COMPONENT STAGE NODE
Project design 1 Definition types and nos 12 General design and costs 23 Detailed design 3
Land acquisition 1 Identification of sites 42 Identification of ownersand verification of title 5
3 Feasibility studies 64 Negotiation and acquistion 7
Tendering 1 82 93 104 il
Off-site services 1 122 133 14
Construction of core unit 1 152 163 174 18
Selection of participants 1 Definition types, numbers,and costs of units 19
2 Selection criteria 203 Preparation publicity 214 Mass media publicity 225 Distribution application form 236 Interviews with applicants 247 Analysis characteristics ofapplicants 25
8 Selection applicants andreserves 26
9 Orientation sessions 27Completion habitable unit 1 28
2 29Material loans 1 30
2 31Occupation 1 32Start of cost recovery 1 33
2 34

CHART H-2: IDENTIFICATION OF MAIN STAGES AND ESTIMATION OF CCMPLETION TIME FOR SUB COMPONENT: LAND ACQUISITION
Preced- Potent-ing ELAPSED WEEKS ialActiv- Slippage Followingity Stage 1 2 3 4 5 6 7 8 9 10 11 12 13 14 (weeks) Causes activity
Start of 1. Identificat-Project ion of possible
sites i
2. Identificat- /ion of ownersand checkingtitle 2
3. Sitefeasibilitystudy 2
4. Purchasenegotîatîons 2Offsite services
Tendering
CUMULATIVE SLIPPAGE
Total projected time 13 weeksTotal with slippage 20 weeks

CHART Hî-3: IDENTIFICATION OF MAIN STAGES AND ESTIMATION OF COMPLETION TIME FOR SUB COMPONENT: PARTICIPANT SELECTION
Preced-ing Potent- Follow-
Activ- ial ing
ity Stage 1 2 3 4 5 6 7 8 9 10 12 14 16 18 20 22 24 26 28 30 Slippage Act-
Il 13 15 17 19 21 23 25 27 29 (Weeks) Causes ivity
Con- 1. Define no./struct. types of unit 1
Coreunit 2. Selection
criteria 1
3. Publicat-inn material 1
4. Publicity 1
5. Distributeapplications 1
6. Interviewapplicants 2
7. Analysisapplications 2
8. Selectionparticipants 1 Material
loans
9. Orientation Completion
sessions 2 habitableunit
CUMULATIVE SLIPPAGE
Total projected time 19 weeksTotal with slippage 31 weeks

CIURT H-4: EXAMPLE OF A LOGICAL NETWORK CRART OF PROJECT ÇPSLEMENTATION FOR A SITES AND SERVICES YROJECT
l LECER Bode
L~~J La5 ti ~~ti. to Mwulet.
i~Estl.ted Ioter ... tion of two or mreVe ek s to coupoouocu. Potoutial bottl neckOFFSITSI SERVICES cmit
LAMD ACQUISITION /HAg7 SELECTION OF PARTICIP/OITS MATERIAL LOANS R4BITABLE UNIT START OF COST RECOC ISRI Y
TENDERiNY CONSTRUCTION OF CORE UNIT O OCCUPATION
DESIGIN

- 237 -
CHART H-5: EXAMPLE OF TABLE DIAGNOSING ESTIMATED PROJECTDURATION AND IDENTIFYING POTENTIAL BOTTLENECKS
(Data is used from Chart 4)
Comxponent Duration Contribution to TotalProject Duration
(Weeks) (Weeks)
Design 10 10Land acquisition 13 3Tendering 46 46Offsite services 42 0Construction of core units 38 38Participant selection 19 19Material loans 12 4Completion of habitable unit 12 12Occupation 4 4Start cost recovery 12 12
TOTAL 202 148
POTENTIAL BOTTLENECKS
Critical Weeks
Design and feasibility study for landacquisition (Nodes 2 and 6) 8-12
Completion of design and land acquisitionand tendering for core units (Node 8) 15-23
Completion of tendering and offsite serviceswith start of construction (Node 15) 37-66
Completion of various steps of selectionprocess at same time (Node 26) 110-114
Completion of selection and setting upmaterial loan program with completion ofhabitable unit (Node 28) 118-126

CHART H-6: CALENDAR OF PROJECT IMPLEMENTATION: DESIGN AND LAND ACQUISITION COMPONENTS (Data f rom Chart 4)
Preced-ingActiv- JAN 1984 FEB MARCH APRILity Component Stage Node 8 15 22 29 5 12 19 26 5 12 19 26 2 9 16 Following activity
Project Design Definestarts types and
nos. ofunits 1
Generaldesign 2
Detaileddesign 3 L F G Tendering
Landacquisit-i on Tdentif-
possiblesites 4
Identifyowners 5 '
Feasibil-itystudies 6
Negotiat-ion 7 Tendering
Offsite services

CHART H-7: SUMMARY OF DELAYS IN PROJECT IMPLEMENTATION AND THEIR CAUSES AND CONSEQUENCES
COMPONENT
STAGE START-UP DATE DURATION OF IMPLEMENTATION COMPLETION DATE O SUMMARY 0F DELAYS (weeks)
! Plan Actual|Expected Plan Actual Éxpected Plan Actual Expected I Start-up Implementing Total
1 - __ __ _ _ _ !
C. _ _ _ __ __ __ _ __ __ ___
_I-.__ E ____
_ _ t _ _ __ _
_ ___ _ __. _ _ _ _
Original date for completion of component:
Expected/actual date for completion:
Delay (weeks)
Main reasons for delay:
Effects of delay:
Recommended actions:

- 240 -Annex I
DESIGNING A SYSTEM FOR NETWORK-BASEDFINANCIAL MONITORING
A. The Elements of Network-Based Budgeting
A network-based budgeting system (NBB) is a financial planning andmonitoring system in which cost items and expenditure patterns are linkedto components and steps in the implementation process. This means thatchanges in the process or scheduling of project implementation willautomatically be reflected in estimates of costs, expenditures anddisbursements.
The main elements of the NBB system which will be described are:
- Definition of cost-bearing activities.- Estimation of expenditure schedules for each component.- Cost variance analysis.- Revision of cost and imnplementation schedules.
B. Definition of Cost-Bearing Activities
The first step in setting up the N3B system is to identify allcost-bearing activities. Chart H-1 presents an example of the definitionof cost-bearing elements in the construction of a pedestrian subway. Atotal of 14 items are defined, each with -its estimated base cost at thetime the project was appraised.
For the purposes of network planning, it is important to ensure thatthe listing of cost-bearing items is consistent with the steps defined inthe physical implementation process. This is important as it will benecessary to develop integrated charts which show both the progress ofphysical implementation and of expenditures.
A problem always arises in that not: all costs can be directlyassigned to specific project components. For example, it is usually notpossible to assign administrative overheads between particular components.The usual procedure is only to include direct costs which can be directlyassigned. Overheads and other indirect costs will then be distributed overtime in some logical way and will be included as a separate item.
C. Estimation of Expenditure Schedules for Each Component
The next stage is to estimate the schedule of expenditures overtime. The first step is to prepare a calendar of the physicalimplementation schedule of the project (see, for example, Charts H-2 andH-3 in Annex H). It is also necessary to obtain information on the paymentschedule as this may differ significantly from the implementationschedule. In some cases, expenditures will precede physical implementationas some contractors receive an advance payment before work begins. In

- 241 -
other cases, payments are made after work is completed. Expenditureschedules will also vary for different institutions as some funds areon-loaned or advanced from one organization to another.
A decision must also be made of how to define estimated start-upand completion dates. Early and late start-up and completion dates willoften have been estimated. One common approach is to use the mid-point ofthe early and late estimates.
D. Monitoring Cost and Expenditure Schedules
Chart I-3 presents a simple system for monitoring project costs.This provides, for each cost-bearing activity, the following information:
(a) Expected total cost at time of appraisal (Column 2).(b) Current expected total cost (Column 3).(c) Percentage difference between Columns 2 and 3 (Column 4).(d) Appraisal estimate of expenditure for current financial
year (Column 5).(e) Current estimate of expenditure for current financial
year (Column 6).(f) Percentage dîfference between Columns 5 and 6 (Column 7).(g) Appraisal estimate of expenditure during reporting
period (Column 8).(h) Current estimate of expenditure during reporting period
(Column 9).(1) Percentage difference between Columns 8 and 9 (Column 10).(j) Current estimate of cumulative expenditure to this
quarter (Column 11).(k) Percentage difference between Column 11 and appraisal
estimate (Column 12).(1) Current estimate of expenditure for next quarter
(Column 13).(m) Percentage difference between Column 13 and appraisal
estimate (Column 14).
Chart I-4 presents similar information, but where the cost statusof each project is combined to summarize the overall cost status of thecomplete Program.
Chart I-5 shows a convenient way to summarize the status ofphysical progress and costs in a single chart. This is often a very usefulchart as it demonstrates the relationship between delays in physicalimplementation and the expenditure and disbursement schedule.
E. Cost Variation AnalysisAn essential complement to the monitoring of costs is an analysis of
the causes of observed variations in costs. Variations in costs can becaused by three main factors:

- 242 -
(a) Price variations. These can either occur when the project hasbeen implemented according to its original schedule and whereunexpected price increases have taken place, or they can be dueto delays in project implementation which means that priceshave been affected by inflation.
(b) Contractor performance. Variations in the quantity or qualityof work performed by contractors. An example of a change ofquantity would be when the contractor uses more or lessmaterials than had been budgeted. A change in quality would bewhen the contractor changes the types of materials being used.
(c) Project design. Changes in the quantity or quality of workspecified by the project design.
Chart I-6 presents a system for sunmarizing cost variations and foridentifying the factors which have produced these changes. The chartpermits a percentage breakdown of cost variation for each activity betweenchanges in Prices, Quantity and Quality of Contractor Work and ProjectDesign.
F. Revision of Cost and Implementation SchedulesThe main purpose of monitoring costs and implementation schedules
is to assist management in defining actions needed to correct problems andto make the necessary revisions in cost, disbursement and implementationschedules. The minimum frequency for updating estimates is once everyfinancial year, but in most cases it will be necessary to do this everyquarter or semester.
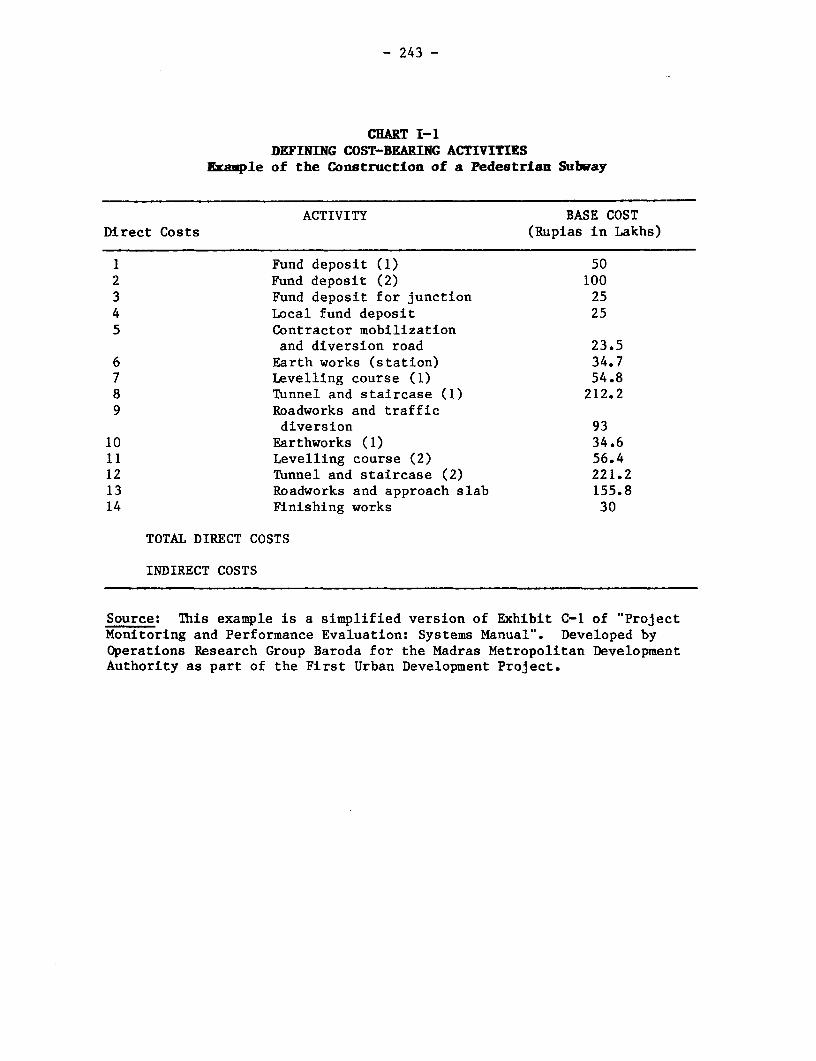
- 243 -
CHART I-1DEFINING COST-BEARING ACTIVITIES
Ezauple of the Construction of a Pedestrian Subvay
ACTIVITY BASE COSTDirect Costs (Rupias in Lakhs)
1 Fund deposit (1) 502 Fund deposit (2) 1003 Fund deposit for junction 254 Local fund deposit 255 Contractor mobilization
and diversion road 23.56 Earth works (station) 34.77 Levelling course (1) 54.88 Tunnel and staircase (1) 212.29 Roadworks and traffic
diversion 9310 Earthworks (1) 34.6il Levelling course (2) 56.412 Tunnel and staircase (2) 221.213 Roadworks and approach slab 155.814 Finishing works 30
TOTAL DIRECT COSTS
INDIRECT COSTS
Source: This example is a simplified version of Exhibit C-1 of "ProjectMonitoring and Performance Evaluation: Systems Manual". Developed byOperations Research Group Baroda for the Madras Metropolitan DevelopmentAuthority as part of the First Urban Development Project.

CHART 1-2: SCHEDULE OF EXPENDITURES FOR EACH COMPONENT
1983 , 1984 FINALSTAGE NODE JAN-MAR AP-JUN JUL-SEP OCT-DEC 1983 TOTAL JAN-MAR AP-JUN JUL-SEP OCT-DEC 1984 TOTAL TOTAL
_______ ____ _ _____________ _______________ _____________ ______ ____,,__ _____
l l l l l I < I 1 I S~~~~~~~~~~~~~~~~~~~~~~~~~~~~~~~~~~~~~~~~~~~~~~~~~~~~~~~s
l___________ ____________ _________ _______ _______________________________ I [ :X________ I________ __________ I________ L__________________
=L I ~~~~~~~~I i1 t-I >

CHART 1-3: PROJECT COST SUMMARY
Activity EXPECTED TOTAL COST BUDGET FOR FINAN- EXPENDITURE DURING CUMULATIVE BUDGET NEXT
________ _____ ______j CIAL YEAR REPORTING PERIOD EXPENDITURES QUARTER COMMENTS
Plan Actual % Plan Actual% Plan Actual %
___ ____ change _ change change change
__ ., i___.__ ,_ _ ___1 _ _,_._ . _.__ _ ___4. _____.________________
__ _ _ ___ _ _ _ __I__ ___ _ _ _ _ _ _
F ! I < ~~~ ~~I - _________tt 1____

CHART 1-4 SUMMARY OF COSTS AND EXPENDITURES FOR TOTAL PROGRAM BROKEN DOWN BY PROJECT
Component Implementing COST TO COMPLETION BUDGET FORAgency FINANCIAL YEAR EXPENDITURES
.Plan Actual x -Plan EActual % Current Cumulative to datechange change Quarter change Comments
s ~~ ~~ d __ _0 ____
._ ., , _ _ X_ . I ._ _ _
_____ - , . - -- -- -f - ___ _ _ _ ___X X ___I l l l
___ _____ _________ __________ ____________ i _____ ________~~~~~~~~~~~~~~~~~~~~~~~~~~~~~~~~~~~~~~~~~~~~~~~~~~~~~~~~~~~~~~~~~~
-_-k ~~~~~ -- - -1~~~~~~- _______ _________ ___________ ______ _______ ________________~~~~~~~~~~~~~~~~~~~~~~~~~~~~~~~~~~~~~

CHART I-5 INTEGRATION OF PHYSICAL PROGRESS AND COST STATUS ANALYSIS
COMPONENT OR PROJECT
i~ - U fost at completion Elxpenèiture
1983 1984 Thir quarter Cumulative
STAGE Node JAN FEB MAR AP MAY JUN JUL AUG SEP OCT NOV DEC JAN FEB Plan Actual change Plan ̂kctuàl Plan Actual
___ _____ .___ _ _ 1 i _ I __1
-- - __ t.--r- -_- _ _
!~~~~~~~~~~~~~~~~ _ __ _ __ L_ _ __
t - -_ 1- ;
1--- . -~~~~~~~~ - 1"z//Z-'. ._
[TOTAL | i
KEY
Original planActual dates
-Xt ^ bExpected completion -I

CHART 1-6: COST VARIANCE ANALYSIS
PROJECT/ COMPONENT
ANALYSIS OF COST VARIATION SUMMARY OF VARMTIONPrice Variation Contractor Variation roject Design
Activity EXPECTED FINAL COST Quantity of Quality of ChangesWork work Percentage change from plan
Plan |Current Plan urrent Plan Current Plan Curren rrent Price Quantity Quality total
____________ ~~~~~~~~__ _ ___ ___ _ _ __ ___ __==_= e __ _ _ _ _ _ __ _ __ _ _ _ __ _ __I__ _ _ _ _ _ _ _ _ _ _
~~~~~~~__ :_.__ _ ___ I_ - ---- a T_______________ I________ _______ ____ __ i ______ _____ j I______ I_________
TOTAL ____
0O
i

- 249 -Annex J
A BASIC EVALUATION LIBRARY
The purpose of this annex is to recommend books which could beincluded in a basic evaluation reference library. Many researchers do nothave easy access to libraries and research journals so it will often benecessary to acquire a basic set of books so as to be relativelyself-sufficient. There are a very large number of books and journals onevaluation and the list is intended to be suggestive rather thandefinitive.
A. General textbooks
1. Joseph Wholey Evaluation: Promise and Performance. The UrbanInstitute, Washington, D.C., 1979.This is a very clear and readable guide to the design andimplementation of evaluations. It is particularly good onthe policy and organizational aspects, but does not enterinto as much detail on the research design as some otherbooks. Like most other textbooks it refers primarily to theexperience in the evaluation of public programs in the U.S,so that many of the examples are not directly relevant tothe issues being faced in many developing countries.
2. Freeman, P. Rossi, and S. Wright. Evaluating Social Projects inDeveloping Countries. Organization for Economic Cooperationand Development, Paris, 1979.This draws a lot of material from an earlier book by Rossiand Williams on the evaluation of social programs in theU.S. It is an easily understandable overview with theadvantage that the case studies and bibliography are drawnfrom developing countries rather than the United States (asis the case with most of the other texts).
3. E. Struening and M. Brewer (Editors). Handbook of EvaluationResearch. Sage Publications, Beverley Hills, California,1983.This is a one volume selection from a very influentialhandbook which provides a useful overview of many of the keyissues and stages in the design, implementation and analysisof an evaluation. All of the articles are quite old, buteach chapter contains an updated bibliography.
4. Dennis Casley and Denis Lury. Monitoring and Evaluation ofAgricultural and Rural Development Projects. Johns HopkinsUniversity Press, Baltimore, MD., 1982.Although this refers to rural projects, most of the conceptsare equally applicable in urban areas. Clear and simple tof illow.

- 250 -
B. More Specialized but Easily Undeistandable References Books
1. T. Cook and D. Campbell. QuaLsi-experimentation: Designand Analysis. Issues for Field Setting. Rand McNally,1979.This book presents a very complete discussion of thedesign and analysis of all of the main types ofquasi-experimental designs. Several chapters are devotedto the use of multiple regression analysis to compensatefor problems of non-equiîvalency Df control groups.
2. E. Webb, and others. Unobtrusive Measures: Non-ReactiveResearch in the Social Sciences. Rand McNally, 1973.This is the classic on the way in which a wide range ofobservational and other non-reactive techniques can beapplied in evaluation research.
3. John Van Maanen (Editor). Qualitative Methodology. SagePublications, Beverley Hills, California, 1979.A comprehensive presentation of the use of qualitativemethods in the evaluation of organizations.
4. Gareth Morgan (Editor). Beyond Method: Strategies forSocial Research. Sage Publications, Beverley Hills,California, 1983.A comprehensive description of all of the main methodswhich can be used in organizational research. One of thepurposes of the book is to demonstrate how the choice ofresearch method is likely to influence the findings of theresearch and the conclusions which will be drawn. This isan extremely important Issue which is hardly discussed inmost textbooks.
5. Michael Patton. Qualitative 'valuation. Sage Publications,Beverley Hills, Californiia, 1980.A very readable and wel!L argued presentation of theimportance of qualitative methods by one of the leadingexponents of these approaches.
6. Lisa Peattie. The View from the Barrio. University ofMichigan, Ann Arbor Press, 1969.A very readable book on how to understand and describethe dynamics of a small urban community and how to studythe ways in which the community organizes itself to opposethe construction of a sewage outlet which would contamin-ate the water supply. It: is also a very good descriptionof an activist approach to participant observation.

- 251 -
7. Lyn Squire and Herman van der Tak. Economic Analysis ofProjects. Johns Hopkins University Press, Baltimore, Md.,1975.Comprehensive explanation of the World Bank's approach tocost-benefit analysis.
8. Michael Bamberger. "A Basic Methodology for Impact Evaluationin Urban Shelter Programs". Water Supply and UrbanDevelopment Department. Discussion Paper No. 59, The WorldBank, 1984.This is a more detailed presentation of the techniques forimpact evaluation which are described in the presenthandbook.
C. Basic Statistical Textbooks
1. H. Blalock. Social Statistics. McGraw Hill, New York, 1979.Clear and comprehensive coverage of most of the mainresearch procedures required in evaluation research.
2. H. Blalock and A. Blalock (Editors). Methodology in SocialResearch. McGraw Hill, New York, 1968.More advanced discussion of theory building and theconstruction of models.
3. Michael Lewis-Beek. Applied Regression: An Introduction. SagePublications, Beverley Hills, California, 1980.A clear, brief and low-priced presentation of the basicconcepts of regression analysis which are likely to beneeded in basic evaluation research.
4. Christopher Achen. Interpreting and Using Regression. SagePublications, Beverley Hills, California, 1982.A complement to the previous title.
5. N. Nie and others. Statistical Package for the SocialSciences. McGraw Hill, New York, 1975.This is probably still the most widely used statisticalcomputer package for the social sciences and includes allof the analytical procedures required for most types ofevaluation. This is also one of the most comprehensiveand easily understood explanations of how a wide range ofstatistical procedures are used and interpreted.

- 252 -Annex K
GLOSSARI OF TEINS USED IN THE HANDBOOK
COMPONENT A specific set of activities which form partof a project and which are conducted by one agency.For example, the construction of 5,000 serviced plotsmight be a component of an urban development project.
CONTROL GROUP A group of families, organizations or communitieswhich are used in impact evaluation. The controlgroup is selected to match as closely as possible thecharacteristics of the project beneficiaries in orderto estimate what would have been the conditions ofparticipants if the project had not taken place.
COST-EFFECTIVENESSANALYSIS Projects are compared in terms of the costs required
to produce a given output. The project with thehighest output/cost xratio is considered to be themost cost-effective. This method is particularlyuseful when policy makers wish to select betweenalternative projects, but when it is not possible tomeasure impacts,
EVALUATION Evaluation establishes criteria for definingsuccess and assesses the extent to which thesecriteria have been achieved by the project.Evaluation can be quantitative, in which casenumerical values are estimated for the net projectimpacts or for the cost-effectiveness ratios; or itcan be qualitative, in which case the purpose is tounderstand and describe the way in which the projecthas affected,. and been affected by, the populationgroups who have been exposed to it.
EXPERIMENTALDESIGN A true experimental design involves the random
assignment of subjects (persons, groups, etc.) toeither an experimental or a control group. Thecondition of both groups is measured before theexperiment begins. ibe "treatment" (drug, specialreading program etc) is then administered to theexperimental group. The conditions of the two groupsare then compared after the treatment, and statisticaltests are used to determine whether there is astatistically significant difference between the twogroups. If such a difference exists, it will be takenas evidence that the treatment had an effect. Thecareful researcher will, however, repeat theexperiment several times under slightly differentconditions to check whether the same results arefound.

- 253 -
IMPACT A social or economic change which is produced asa consequence of a project. Examples include: changesin household income and employment; lower rates ofcertain infectious diseases; jobs created by a smallbusiness program; reduced travel time to work. Impactsdiffer from outputs in that the latter are directlyproduced by the project whereas the former occur as aconsequence of the project outputs but are notdirectly under the control of the implementingagency. For example, the project is directlyresponsible for authorizing loans to small businesses,but the businessman himself (or herself) will make thedecision as to whether to hire more employees.Impacts can be positive or negative and can also beintended (planned in the project design) orunintended.
IMPACT EVALUATION The use of an experimental or quasi-experimentaldesign to estimate the net impact produced by theproject on the affected population. This is thedifference in income, height for weight ratio of achild etc., which exists between participants and thecontrol group after the project has taken place andafter controlling for all other socio-economiccharacteristics of the two groups.
INPUTS The resources allocated for the implementationof a project component. Money, materials andprofessional staff are some of the most commoninputs.
MONITORING Monitoring is an internal project activityconcerned to assess whether project resources(inputs) are being used and administered as intendedand whether they are producing the intended outputs.Monitoring can be divided into performance monitoringand process monitoring (see separate entries).
MULTI-METHODAPPROACH The combination of two or more independent
research techniques in the evaluation design so as toobtain consistency checks and to obtain a morecomplete understanding cf the meaning of the results.It is recommended that quantitative and qualitativetechniques should normally be combined in allevaluation designs.

- 254 -
OBJECTIVE A precisely defined output or impact which aproject intends to achieve. Objectives are the basison which performance monitoring is conducted, and mustbe clearly quantified and have a timetable.
OUTPUT A clearly definable direct product of a projectcomponent. For example, the number of serviced plotsprepared for sale; the number of patients treated in ahealth center; the number of small business loansapproved.
PARADIGM A model or approach which is considered to bethe ideal way to conduct a study or analysis. Oftenit is not possible to follow exactly the methodsrecommended by the paradigm but it serves as areference point for evaluating the strengths andweaknesses of the actual desîgn. The trueexperimental design is an example of a paradigm.
PERFORMANCEMONITORING Assesses the extent to which inputs are
being used in accor,lance with the approved budget andtimetable and whether the intended outputs are beingproduced in a timel, and cost-effective manner.
PROCESS MONITORING Assesses the efficiency of the project implementationprocess.
PROGRAM Long term urban development strategy whichusually includes a number of separate projects.
PROJECT A set of urban development activities includedin a government grant or authorization or in anagreement with an international development agency. Aproject will usually comprise a number ofseparate components (see separate entry).
QUALITATIVEEVALUATION Approaches which seek to understand the
processes through which a project is implemented andthe ways in which it is perceived by and affects theintended beneficiaries. Many advocates of theseapproaches question the feasibility of obtainingreliable and meaningful quantitative measures ofproject impact.
QIJANTITATIVEEVALUATION Approaches to evaluation which seek to
produce quantitative estimates of net projectimpact or cost-effectiveness. Many of theseapproaches use an experimental or quasi-experimentaldesign.

- 255 -
QUASI-EXPERIMENTALDESIGN In most urban development projects it is not
possible to use the true experimental design as it isnot possible to randomly assign subjects toexperimental and control groups, or to control t:heenvironment to ensure that other factors do notinterfere. A number of quasi-experimental designshave been developed to approximate as closely aspossible the true experimental design. Great caremust be used in interpreting the results of thesedesigns as there are a number of threats to validitywhich can make it appear that the project has producedthe impacts when in fact they were caused by externalfactors unrelated to the project (see Threats toValidity).
RANDOM SAMPLE A method for selecting a sample of persons, familiesor groups which ensures that all members (persons,families, etc.) in the population being studies havean equal chance of being selected. If a stratifiedrandom sample is used, members of different stratawill have different selection probabilities but eachmember of a particular stratum will have the samechance of selection.
SUB-COMPONENT A clearly defined activity which forms part of acomponent. Technical assistance to families on houseconstruction might be a sub-component of a sites andservices component.
THREATS TOVALIDITY There are four sets of factors which can mean that an
apparent project impact (or lack of impact) is causedby a factor unrelated to the project. These are:(a) Statistical conclusion validity (b) internalvalidity (c) construct validity of casual relationsand, (d) external validity. These factors aredescribed in Chapter 4, Section C.
TRIANGULATION The use of two or more independent methods to estimatea particular impact or value. If the estimates areconsistent, the researcher can have greater confidencein the validity of the estimates. If the results areinconsistent, it is necessary to investigate furtherto determine the reason for the discrepancies.


- 257 -
REFERENCES
ABT, Clark. 1976. Evaluation of Social Programs. Sage Publications,Beverly Hills, California.
ACHEN, Christopher, 1982. Interpreting and Using Regression. QuantitativeApplications in the Social Sciences, No. 29, Sage Publications,Beverly Hills, California.
BAMBERGER, Michael. 1979. "Problems of Sample Attritian in the Evaluationof Social and Economic Change: A Case Study "rom El Salvador."Paper presented to the Evaluation Research Zociety session on'Evaluation in Developing Countries."
. 1980. "Shelter Programs for the Urban Poor - AComparative Review." Urban Edge, December.
* 1981. "Quasi-Experiizlentationi in an Urban Context: AReview of Experiences in the Evaluatian of World Bank ShelterPrograms." Urban and Regional Report No. 81-5, Urban andRegional Economics Division, The World Bank, Washington, DA.C.
. 1982. "Statistical Evaluation of Project Impact throughLongitudinal Surveys." Urban and Regional Report No. 82-8, Urbanand Regional Economics Division, The World Bank, Washington, D.C.
. 1984. "A Basic Methodology for impact Evaluation inUrban Shelter Programs." Water Supply and Urban DevelopmentDepartment Discussion Paper No. 59, The World Bank, Washington,D.C.
, GONZALEZ-POLIO, Edgardo, and SAE-HAU, Umnuay. 1982.Evaluation of Sites and Services Projects: The Experience fromEl-Salvador. World Bank Staff Working Paper No. 549.Washington, D.C.
, and OTTERBEIN, Julie. 1982. "Designing a Questionnairefor Longitudinal Impact Studies." Urban and Regional ReportNo. 82-5, Urban and Regional Economics Division. The WorldBank, Washington, D.C.
,_ SANYAL, Bishwapura, and VALVERDE, Nelson. 1982.Evaluation of Sites and Services Projects: The Experience fromLusaka, Zambia. -World Bank Staff Working Paper No. 548,Washington, D.C.
BLALOCK, Hubert. 1979. Social Statistics. McGraw Hill, New York.
, and Ann. 1968. Methodology in Social Research. McGrawHill, New York.

- 258 -
BOGDAN, R., and TAYLOR, S. 1975. Introduction to Qualitative ResearchMethods. John Wiley, New York.
BUREAU D'EVALUATION. 1976. "Second Housing Survey - The Control Groupfrom Gran Dakar." Office D'Habitation de Loyer Modéré. Dakar,Senegal.
, 1977. "The Target Population of the Sites andServices Project: The Effect of the Selection Process on SomeSocial and Economic Variables." Report III-6, OfficeD'Habitation de Loyer Modéré. Dakar, Senegal.
BURNS, L., and GREBLER, L. 1977. The Housirg of Nations: Analysis andPolicy in a Comparative Framework. John Wiley, New York.
CAMPBELL, D. and STANLEY, J. 1966. Experimental and Quasi-ExperimentalDesigns for Research. Rand McNaLly.
CASLEY, Dennis, and LURY, Denis. 1982. Monitoring and Evaluation ofAgricultural and Rural Development Projects. Johns HopkinsUniversity Press, Baltlmore, Maryland.
CHAMBERS, R. 1979. "Shortcut Methods in Information Gathering for RuralDevelopment Projects." (Mlimeo).
CONNER, R. 1978. "Selecting a Control Group: An Analysis of theRandomization Process in Twelve Social Reform Projects."Evaluation Studies Annual Review. No. 3 (pp. 104-153).
COOK, T., and CAMPBELL, D. 1979. Quasi Experimentation: Design andAnalysis Issues for Field Setting. Rand McNally.
COOPER, Lauren. 1981. "Designing the Sites and Services Plot AllocationProcess: Lessons from Project Experience." Urban DevelopmentTechnical Paper No. 3, Washington, D.C.
EVALUATION STUDIES ANNUAL REVIEW. 1979. Sage Publications, Beverly Hills,California.
FERNANDEZ-PALACIOS, Marisa, and BAMBERGER, Michael. 1984. "An EconomicEvaluation of Low-Cost Housing Options in El Salvador." WaterSupply and Urban Development Department Discussion Paper No. 55,The World Bank, Washington, D.C.
FREEMAN, Howard, ROSSI, Peter and WRIGHT, Sonia. 1979. Evaluating SocialProjects in Developing Countries. Organization for EconomicCooperation and Development, Paris.
FUNDACION SALVADORENA DE DESARROLLO Y VIVI}iNDA MINIMA. 1977. "Analysis ofProgressive Development and Self-lHelp Housing." San Salvador, ElSalvador.
HAM-BIRF. 1983. "Design for an Evaluation of an Artesan Credit Program"(draft). Honorable Alcaldia MunLcipal. La Paz, Bolivia.

- 259 -
HATRY, H., WINNIE, R., and FISH, D. 1981. Practical Program Evaluationfor etate and Local Governments. The Urban Institute,Washington, D.C.
HENDRICKS, Michael. 1981. "Service Delivery Assessment: QualitativeEvaluations at the Cabinet Level." In N. Smith (Ed) FederalEfforts to Develop New Evaluation Methods. Jossey-Bass, SanFranc!sco.
HONADLE, G. 1979. "Rapid Reconnaissance Approaches to OrgenizationalAnalvsis for Development Administration." Presented at theConference on Rapid Rural Appraisal held at the Institute forDevelopment Studies. Sussex, December.
INTERNA.IONAL DEVELOPMENT RESEARCH CENTER. 1982. Low Income Urban ShelterProjects: An Annotated Bibliography of Research Funded byIDRC-IERD. Gttava.
INSTITUTO SER DE INVESTIGACION. 1981. "Modelo e evaluacion de impacto delprograma IPC. Linea de Base. 2 volumes, Bogota, Colombia.
- 1984. "Diagnostico Evaluativo del Avancedel Programa IPC." IFT-072, April, Bogota, Colombia.
JIMENEZ, Emanuel. 1982. "The Value of Squatter Dwelilngs in DevelopingCountries." Economic Development and Cultural Change. Vol. 30,No. 4, pp. 739-52.
KAPLAN, M. 1973. Urban Planning in the 1960's: A Design forIrrelevancy. Praeger, New York.
KAUFMANN, Daniel, and LINDAUER, David. 1980. "Basic Needs, InterhouseholdTransfers and the Extended Family. Urban and Regional ReportNo. 80-15, Urban and Regional Economics Division, The World Bank,Washington, D.C.
. 1982. "Social Interactions as a Strategy of SurvivalAmong the Urban Poor: A Theory and Some Evidence." DoctoralDissertation. Harvard University.
, and BAMBERGER, Michael. 1984. "Income Transfers andUrban Projects: Research Findings and Policy Issues." WaterSupply and Urban Development Department Discussion Paper No.56,The World Bank, Washington, D.C.
KEARE, D. and PARRIS, S. 1982. Evaluatîng Shelter Programs for the UrbanPoor: Principal Findings. Staff Working Paper, No. 547, TheWorld Bank, Washington, D.C.
KEARE, D. and JIMENEZ, E. 1983. Progressive Development and Affordabilityin the Design of Urban Shelter Projects. Staff Working Paper No.560, the World Bank, Washington, D.C.

- 260 -
KISH, Leslie, 1965. Survey Sampling. John Wiley, New York.
LEVIN, Henry. 1984. Cost Effectiveness Analysis. Sage Pdblications,Beverly Hills, California.
LEWIS-BECK, Michael. 1980. Applied Regression: An Introduction.Quantitiative Applications in the Social Sciences, No. 22, SagePublications, Beverly Hills, California.
LEWIS, Oscar. 1961. The Children of Sanchez. Random House, New York.
LIEBOW, Elliot. 1967. Tally's Corner. Little Brown.
LINDAUER, David. 1979. "Sources of Income, Selection Strategies andProject Affordability." Urban and Regional Economics Division,The World Bank, Washington, D.C.
MALPEZZI, Stephen. 1984. "Analyzing an Urban Housing Survey: EconomicModels and Statistical Techniques." Water Supply and UrbanDevelopment Department Discussion Paper No. 52, The World Bank,Washington, D.C.
, BAMBERGER, Michael, and MAYO, Stephen. 1982."Planning an Urban Housing Survey: Key Issues for Researchersand Program Managers in Developing Countries." Water Supply andUrban Development Department Discussion Paper No. 44, The WorldBank, Washington, D.C.
MAYNARD, R. and MURNAME, R. 1981. "The Effects of Negative Income Tax onSchool Performance: Results of an Experiment." EvaluationStudies Annual Review, Vol. 6.
MAYO, Stephen. 1983. "Housing Demand in Developing Countries." WaterSupply and Urban Development Department, The World Bank,Washington, D.C.
McCALL, George, and SIMMONS, J.L. Editors. 1969. Issues in ParticipantObservation: A Text and Reader. Addison-Wesley, Reading,Massachusetts.
McLEARY, R. et al. 1979. "How a Regression Artefact Can Make AnyDeliquency Interventional Program Look Effective." EvaluationStudies Annual Review, No. 4, pp. 626-653.
MORGAN, Gareth. Editor. 1983. Beyond Method: Strategies for SocialResearch. Sage Publications, Beverly Hills, California.
NACHMIAS, David and Chava. 1981. Research Methods in the SocialSciences. St. Martins Press, New York.
NATHAN, R. et al. 1981. Public Service Employment: A Field Evaluation.Brookings Institute, Washington, D.C.

- 261 -
NIE, N. et al. 1975. Statistical Package for the Social Sciences.(Second Edition). McGraw Hill, New York.
NUCLEO DE ACOMPANHAMENTO E AVALIACAO (Natal). 1983. "Desenvolvimento daPesca Artesanal." Unidade de Administracao do Projeto. WorldBank Nedium Cities Project. Natal, Brazil.
OPERATIONS RESEARCH GROUP BARODA. "Monitoring and Evaluation Design forthe First Madras Urban Project." Madras Metropolitan DevelopmentAuthority.
PASTEUR, David. 1979. The Management of Squatter Upgrading. Saxon House,England.
PATTON, Michael. 1980. Qualitative Evaluation. Sage Publications,Beverly Hills, California.
PEATTIE, Lisa. 1969. The View from the Barrio. University of MichiganPress. Ann Arbor.
_ 1981. "Marginal Settlements in Developing Countries."Annual Review of Sociology, pp. 157-175.
QUIGLEY, John. 1980. "The Distributional Consequences of Stylized HousingProjects: Theory and Empirical Analysis." Urban and RegionalReport No. 80-18, Urban and Regional Economics Department, TheWorld Bank, Washington, D.C.
PHILIPPINE NATIONAL HOUSING AUTHORITY, Research and Analysis Division.1978. "A Study of Income and Expenditure Patterns of Householdsin the Tondo Foreshore Area." Manila.
1979. "A Study of the CommunityParticipation Process in Tondo." Manila.
. 1979. " A Study of the Impact of theProject on the Physical Environment of Tondo. Manila.
. 1981. "The Reblocking Process inTondo Foreshore." Manila.
REFORMA, Mila, and OBUSAN, Ricci. 1981. "Housing Networks and SurvivalStrategies among the Urban Poor: Monetary and Non-MonetaryTransfers among Selected Families in Tondo." Urban and RegionalReport No. 81-82, Urban and Regional Economics Division, TheWorld Bank, Washington, D.C.
REICHARDT, Charles and COOK, Thomas. 1979. "Beyond Qualitative VersusQuantitative Methods." In Cook and Reichardt, Qualitative andQuantitative Methods in Evaluation Research. Sage Publications,Beverly Hill, California.

- 262 -
REICHARDT, C., 1979. "The Statistical Analysis Data fromNon-Equivalent Group Designs." In Cook, T., and Campbell, D.,Quasi-Experimentation: Design and Analysis for Field Settings.Rand McNally.
ROGERS, Everett. 1962. Diffusion of Innovations. Free Press, New York.
ROSSI, Peter and WRIGHT, James. 1984. "Evaluation Research: AnAssessment." Annual ReviLew of Sociology, Vol. 10, pp. 331-352.
SALMEN, Lawrence. 1983. "Participant Observer Evaluation of UrbanProjects in La Paz, Bolivia, and Guayaquil, Ecuador." WaterSupply and Urban Developmnent Department Discussion Paper No. 36,The World Bank, Washington, D.C.
SIEGEL, Sidney. 1956. Non-Parametric Statistics for the BehavioralSciences. McGraw Hill, New York.
SQUIRE, Lyn, and VAN DER TAK, Herma.n. 1975. The Economic Analysis ofProjects. Johns Hopkins University Press, Baltimore, Maryland.
STRASSMAN, Paul. 1982. The Transformation of Urban Housing. JohnsHopkins University Press, Baltimore, Md.
STRUENING, Elmer, and BREWER, Marilynn. Editors. 1983. Handbook ofEvaluation Research. Sage Publications, Beverly Hills,California.
UNIDADE D'AVALIACAO (CAMPINA GRANDE). 1984. "Estudo Rapido deAcompanhamento de Projeto de Apoio as Atividades Produtivas."Prefeitura Municipal de Campina Grande, Paraiba, Brazil.
UNITED STATES AGENCY FOR INTERNATIONAL DEVELOPMENT. 1982. "AssistingSmall Business in Francophone Africa - the Entente Fund AfricanEnterprise Program." PN-AAL-002. Washington, D.C.
UNITED STATES GENERAL ACCOUNTING OFFICE. 1984. "An Evaluation of the 1981AFDC Changes: Initial Analysis." Washington, D.C.
VALADEZ, Joseph. 1982. "Non-Survey Techniques in the Evaluation of UrbanShelter Programs." Urban and Regional Economics Division, TheWorld Bank, Washington, D.C.
VAN MAANEN, John. Editor. 1983. Qualitative Methodology. SagePublications, Beverly Hills, California.
WEBB, E. et al. 1965. Unobtrusive Measures: Non-reactive Research in theSocial Sciences. Rand McNally.
WEISS, C. 1972. Evaluation Research, Prentice Hall.
. Editor. 1972. Evaluating Action Programs: Readings in SocialAction and Education. Allyn and Bacon.

- 263 -
WHOLEY, Joseph. 1979. Evaluation: Promise and Performance. The UrbanInstitute, Washington, D.C.
WORLD BANK, Urban and Regional Economics Division. 1978. "Analysis ofthe Level of Demand for Low-Cost Housing in Usulutan (ElSalvador)." Urban and Regional Report No. ME-2, Washington, D.C.
. 1978. "TheEffectiveness of the Cooperative as a Means of Social andEconomic Change." Urban and Regional Report No. ME-5, Washington,D.C.
_ 1980. "a Study ofIncome and Expenditure Patterns of Households in the Tonda,Foreshore Area." Washington, D.C. (Summary of a Reportprepared by the Research and Analysis Division. NationalHousing, Authority, Philippines)
YAYHA, Saad. 1982. "House Registration Handbook: A Model for RegisteringHouses and Plots in Unplanned Settlements." Urban DevelopnentTechnical Paper No. 4, World Bank, Washington, D.C.


M-' The World Bank99 Publications Order Form
SEND TO: YOUR LOCAL DISTRIBUTOR OR TO WORLD BANK PUBLICATIONS(See rhe other side of hài tbrnr) P.O. BOX 37525
WASHINGTON, D.C. 20013 U.S.A.
Date .
Name Ship to: (Enter if different frorn purchaser)
Title Name
Firm Title
Address Firm
City State_ Postal Code Address
Country Telephone ) City State_ Postal Code_
Purchaser Reference No. Country Telephone ) _-
Check your method of pa ment.Enclosed is my E Check C International Money Order E Unesco Coupons E International Postal Coupon.Make payable to World Bank Publications for U. S. dollars unless you are ordering from your local distributor.
Charge my [ VISA E MasterCard E American Express E Choice. iCredit cards accepted only for orders addressedto World Bank Publications.)
Credit Card Account Number Expiration Date Signature
O Invoice me and please reference my Purchase Order No.
Please ship me the items listed below.
Customer Interna"Stock Number Author/ Titde Routing Code Quantity Unit Primo Total Amount S
Ali prices subject to change. Prices may vary by country. Allow 6-8 weeks for delivery.
Subtotal Cost S
'Ibtal copies __ Air mail surcharge if desired ($2.00 eachl $
Postage and handling for more than two complimentary items ($2.00 each) S
'Ibtal SIBRD4053 Thank you for your order.

DISTRIBUTORS OF WORLD BANK PUBLICATIONSALGERIA FINLAND KOREA, REPUBLIC OF SPAINOffice des Pubiications Akateeminen Kirjakauppa Pan Korea Book Corporation Mundi-Prensa Libros, S.A.
Unrversitaires O. Box 128 P. O. Box 101, Kwangwhamun Castello 37
1, place centrale de Ben-Aknoun SF-00101 Seoul 28001 Madrid
Algiers Helsinki 10 KUWAIT SRI LANKA AND THE
ARGENTINA FRANCE ME:vIRB MALDIVES
Carlos Hirsch, SRL World Bank Publicafions p.O Box 5465 Lake House BookshopGalena Guemes 66 Avenue d'lena MALAYSIA P Box 244
Flonda 5, 4thFiFoorOc 3 FEDERAL LniversityUniversity of Malava Cooperative 10,Sir Cliittampalam A.
1333 Buenos Auvx ~GERMANY, FEDERAL Bookshop, -imxited Grie aab
AUSTRALIA, PAPUA NEW REPUBLIC OF P O. Box 1127, Jalan Pantai Baru Colombo 2
GUINEA, F111, SOLOMON UNO-Verlag Kuala Lumpur SWEDENISLANDS, AND VANUATU D-5300 Bonn 1 For single titlesInfo-Line Simrockstrasse 23 MEXICO ABCE Fsntzes Kungt
OvresDocument Delîver-v GREENSFOTECACErizsun.Overseas Document Delivery GREECE San Lorenzo 153-11. Col. del Hovbokhandel
Box 506. GPO MER al ee.Bnt urz Attn: Mr. Eide SegerbackSydney, NSW 2001 MEMRB VaLpe0 Deleg cBenoto luarez Regeringsgatan 12, Box 16356
AUSTRIA Athens-11635 1027SokorGerold ann Co. MOiROCCO For Subscription orders:A-1011 Waen HONG KONG, MACAU MEMRB Wennergren-Williams ABGraben 31 Asia 2000 Ltd. 2 Rue Moliere Racine Box 30004Graben 6 FI., 146 Prmnce Edward Road, W Casablanca S-104 25 Stockholm
BAHRAIN Kowloong NETHERLANDS SWITZERLANDMEhlRB Hong Kong tMed:cal Books Europe, BV (MBE) Librairie PavotPO Box 22103 HUNGARY Noorderwal 38. 6 Rue GrenusManamr.a Town 37 DKuttusa 7241 BL Lochem Case postal 381
BANGLADESH PO. Box 139 NEUZEALAND CH 1211 Geneva ilMicro Industries Developrnent 1389 Budapest 62 R. Hil and Son, Ltd TANZANIA
Assistance Socxetyr (M AS) INDIA PFrvate Bag Oxford Universitv PressDh Bk L'BS Publishers Distrbutors Ltd. New Market P O. Box 5299
Dbaka Post Box 7015 Auckland Dar es Salaam
BELGIUM New Delhi 110002 NIGERIA THAILAND
Publications des Nations Unies 10 First Main Road University Press Limited Central Department StoreAv. du Rot 202 Gandhi Nagar Three Crowns Building jericho 306 Siom Road1060 Brussels Bangalore 56
000
9 Priva:e Mait gag 5095 Bangkok
BRAZIL Apeejay Chambers. PO. Box 736 Ibadan TRINIDAD&TOBAGOPublicacoes Tecnicas S Waliace Street NORWAY Svstematcs Studies U nit
Internacionais Ltdia. B3ombav 400001 N aR'uriArloan S S5EstemMatinsS adisUt
Rua Peixoto Gomide. 209 Sm1b-B, 4 1howringheeLane anuln Karleohan, A S. Curepeai Rad
01409 Sao Paulo, SP Calcutta 700016 P.l 0. Trinidad, SentrurnICdies
CANADA 7:188, I(CA>, Swarup Nagar OsoTida,~eLIisLe Diffuseur Karnpu 208002 PAKI`TAN TUNISIACl.P 85, 1501 Ampere Street ivgnaRoad Mirza Book Agenc' Societe Tunisienne de DiffusionBoCh.eP.v85, 150 uAmere Stre Sivaganga Road 65, Shahrah-e-Quaid-e- -,am 5 Avenue de CarthageBoucherville, QuebvecNugmakmP BoN.72Tnil4B Mars803 aos5E6 unaakaîP.O. Box No. 729 Tunis
SE6Madras 600034Lahore3TURKEYCEllE INDONESIA I PANAMA Haset Kitapevi AS.
Editornal Renacimiento Pt. Indira Limnted Ediciones Libreria Cultural 469, Istiklal Caddesi
Mîraflores 354 JI. Sam Ratulangi 37 Panarrmena, S.A. Bevoglu-Istanbul
Santiago lakarta Pusat Av. 7, Espana l6 UGANDA
COLOMBIA gO. Box 181 Panarra Zone) Uganda BookshopEnlace Ltda. IRELAND PERU PO. Box 7145
Apartado Aero 34270 TDC Publishers EditoRal Desarrollo SA Kampag a
Bogota D.E. 12 North Frederick Street Adrtor Dsr4 SA Kam ARAApartado Aereo 4430 Dublin 1 Apartiado 38_4 UNMR ARAB EMIRATES
Cali, Valle ~~~~~~Lima MEMRBCali, Valle ISRAEL PHILIPPINES P. O. Box 6f097COSTA RICA jerusalern Post National Book Store SharpahLibreria Trejos Jerusalerrn Post Building 701 Rizal Avenue UNIED KINGIOM ANDCalle 11-13 p.O Box 81 MandaAv. Femrandez Guell Romena Jerusalern 91000 Metro 'anla NORTHERN IRELANDSan Jose TALY PORT1JGAL Microirnfo Lîd.
CÔTE DeIVOIRE Licosa Comrn-issionaria Sansori Livraria Portugal 7Alton. Hapshire GU 34 2PG
Centre d'Edition et de Diffusion SPA Dc Ci -Aon Hapd
AIrcaines (CEDA) Via Lamarmora 4504 BP. 541 Casella P'ostale 552 SAUDI ARABIA VENEZUELA
Abidjan 04 Plateau 50121 Florence jarir Book Store Librena del Este*S JAA P. O. Box 31%6 Aptdo. 60.337
CYPRUS sAPAN Riyadh 11471 Caracas 1060-AMEMRB Eastern B3ook ServicePO. Box 2098 37-3. Hongo 3-Chome, SINGAPORE, TAIWAN, WESTERN SAMOA
Nicosia Bunkvo-ku 113 BURMA Weslev Bookshop
DENMARK Tokyo Informaition Publications PO. Box 207SarnfundsLitteratur JODNPrivate, Lîd. Apia
SernoerndsLAteratur MEMRB 02-06 ISt Fl., Pei-Fu Industral ZIMBABWE
DK-1970 Copenhagen V PO. Box 3143 Bldg., 24 New Industnal Road Textbook Sales Pvt. Ltd.
EGYPT, ARAS REPUBLIC OF Jabal ixore Box 37arAI Ahramn Ammnan SOUTHI AFRICA Harare
AI G,aîaa Street ENAOxford U'niversitv FretssAl Gdia Street I(~~ENYA Southern AfrncaCairo Afnca Book Service (E.A.) Ltd. PSOu Boe 1141
P. O. Box 45245 Cape Tcwr 8000Nairobi

WORLD BANK TECIHICAL PAPERS (continued)
No. 33. Guidelines for Calculating Financial and Economic Rates of Return for DFC Projects(also in French, 33F, and Spanish, 33S)
No. 34. Energy Efficiency in the Pulp and Paper Industry with Emphasis on Developing Countries
No. 35. Potential for Energy Efficiency in the Fertilizer Industry
No. 36. Aquaculture: A Component of Low Cost Sanitation Technology
No. 37. Municipal Waste Processing in Europe: A Status Report on Selected Materialsand Energy Recovery Projects
No. 38. Bulk Shipping and Terminal Logistics
No. 39. Cocoa Production: Present Constraints and Priorities for Research
No. 40. Irrigation Design and Management: Experience in Thailand
No. 41. Fuel Peat in Developing Countries
No. 42. Administrative and Operational Procedures for Programs for Sites and Servicesand Area Upgrading
No. 43. Farming Systems Research: A Review
No. 44. Animal Health Services in Sub-Saharan Africa: Alternative Approaches
No. 45. The International Road Roughness Experiment: Establishing Correlation and a CalibrationStandard for Measurements
No. 46. Guidelines for Conducting and Calibrating Road Roughness Measurements
No. 47. Guidelines for Evaluating the Management Information Svstems of Industrial Enterprises
No. 48. Handpumps Testing and Development: Proceedings of a Workshop in China
No. 49. Anaerobic Digestion: Principals and Practices for Biogas Systems
No. 50. Investment and Finance in Agricultural Service Cooperatives
No. 51. Wastewater Irrigation: Health Effects and Technical Solutions
No. 52. L'rban Transit Systems: Guidelines for Examining Options

The World Bank
Headquarters European Office Tokyo Office1518 H Street, N.W. 66, avenue d'Iéna Kokusai BuildingWashington, D.C. 20433, U.S.A. 75 116 Paris, France 1-I Marunouchi 3-chome
Telephone: (202) 477-1234 Telephone: (1) 47.23.54.21 Chiyoda-ku, Tokyo 100, JapanTelex: WUI 64145 WORLDBANK Telex: 842-620628 Telephone: (03) 214-5001
RCA 248423 WORLDBK Telex: 781-26838Cable Address: INTBAFRAD
WASHINGTONDC
ISSN 0253-7494Cover design by Bill Fraser ISBN 0-8213-0775-4
Copyright © 2022 FDOKUMEN