Exploring Robust Methods for Evaluating Treatment and Comparison Groups in Chronic Care Management...
11
Original Article Exploring Robust Methods for Evaluating Treatment and Comparison Groups in Chronic Care Management Programs Aaron R. Wells, PhD, Brent Hamar, DDS, MPH, Chastity Bradley, PhD, William M. Gandy, EdD, Patricia L. Harrison, MPH, James A. Sidney, MA, Carter R. Coberley, PhD, Elizabeth Y. Rula, PhD, and James E. Pope, MD Abstract Evaluation of chronic care management (CCM) programs is necessary to determine the behavioral, clinical, and financial value of the programs. Financial outcomes of members who are exposed to interventions (treat- ment group) typically are compared to those not exposed (comparison group) in a quasi-experimental study design. However, because member assignment is not randomized, outcomes reported from these designs may be biased or inefficient if study groups are not comparable or balanced prior to analysis. Two matching techniques used to achieve balanced groups are Propensity Score Matching (PSM) and Coarsened Exact Matching (CEM). Unlike PSM, CEM has been shown to yield estimates of causal (program) effects that are lowest in variance and bias for any given sample size. The objective of this case study was to provide a comprehensive comparison of these 2 matching methods within an evaluation of a CCM program administered to a large health plan during a 2-year time period. Descriptive and statistical methods were used to assess the level of balance between com- parison and treatment members pre matching. Compared with PSM, CEM retained more members, achieved better balance between matched members, and resulted in a statistically insignificant Wald test statistic for group aggregation. In terms of program performance, the results showed an overall higher medical cost savings among treatment members matched using CEM compared with those matched using PSM (-$25.57 versus -$19.78, respectively). Collectively, the results suggest CEM is a viable alternative, if not the most appropriate matching method, to apply when evaluating CCM program performance. (Population Health Management 20xx;xx:xx–xx) Introduction E ffective chronic care management (CCM) programs identify individuals diagnosed with a disease and help them to manage their disease(s) using interventions that monitor progression and provide education and coaching to encourage healthy behaviors. Evaluation of behavioral, clin- ical, and financial outcomes is necessary to determine the true value and effectiveness of a CCM program. Unfortunately, the accuracy of outcome evaluation is limited by inherent selection bias in CCM programs, and difficulties with im- plementing randomized controlled studies have resulted in a complex environment in which to apply statistical methods to assess CCM programs. 1 In order to gain a better under- standing of how evaluation methods within the CCM field have evolved over time and, in the interim, accommodated technical setbacks, a brief history of CCM research designs and recent methodological applications are presented. Historical CCM study designs Based on the Care Continuum Alliance (CCA) guidelines, incorporation of a valid study design is essential to (1) as- certain the value of disease management (DM) programs (referenced as CCM in this article) in achieving favorable outcomes for populations with chronic disease, (2) further improve the delivery of DM services and foster competition among industry participants based on objective criteria, (3) meaningfully advance the delivery of health care services through the reporting and dissemination of interventions Center for Health Research, Healthways, Inc., Franklin, Tennessee. POPULATION HEALTH MANAGEMENT Volume xx, Number xx, 2012 ª Mary Ann Liebert, Inc. DOI: 10.1089/pop.2011.0104 1
-
Upload
independent -
Category
Documents
-
view
5 -
download
0
Transcript of Exploring Robust Methods for Evaluating Treatment and Comparison Groups in Chronic Care Management...

Original Article
Exploring Robust Methods for Evaluating Treatmentand Comparison Groups in Chronic
Care Management Programs
Aaron R. Wells, PhD, Brent Hamar, DDS, MPH, Chastity Bradley, PhD,William M. Gandy, EdD, Patricia L. Harrison, MPH, James A. Sidney, MA,Carter R. Coberley, PhD, Elizabeth Y. Rula, PhD, and James E. Pope, MD
Abstract
Evaluation of chronic care management (CCM) programs is necessary to determine the behavioral, clinical,and financial value of the programs. Financial outcomes of members who are exposed to interventions (treat-ment group) typically are compared to those not exposed (comparison group) in a quasi-experimental studydesign. However, because member assignment is not randomized, outcomes reported from these designs may bebiased or inefficient if study groups are not comparable or balanced prior to analysis. Two matching techniquesused to achieve balanced groups are Propensity Score Matching (PSM) and Coarsened Exact Matching (CEM).Unlike PSM, CEM has been shown to yield estimates of causal (program) effects that are lowest in variance andbias for any given sample size. The objective of this case study was to provide a comprehensive comparison ofthese 2 matching methods within an evaluation of a CCM program administered to a large health plan during a2-year time period. Descriptive and statistical methods were used to assess the level of balance between com-parison and treatment members pre matching. Compared with PSM, CEM retained more members, achievedbetter balance between matched members, and resulted in a statistically insignificant Wald test statistic forgroup aggregation. In terms of program performance, the results showed an overall higher medical cost savingsamong treatment members matched using CEM compared with those matched using PSM (-$25.57 versus-$19.78, respectively). Collectively, the results suggest CEM is a viable alternative, if not the most appropriatematching method, to apply when evaluating CCM program performance. (Population Health Management20xx;xx:xx–xx)
Introduction
Effective chronic care management (CCM) programsidentify individuals diagnosed with a disease and help
them to manage their disease(s) using interventions thatmonitor progression and provide education and coaching toencourage healthy behaviors. Evaluation of behavioral, clin-ical, and financial outcomes is necessary to determine the truevalue and effectiveness of a CCM program. Unfortunately,the accuracy of outcome evaluation is limited by inherentselection bias in CCM programs, and difficulties with im-plementing randomized controlled studies have resulted in acomplex environment in which to apply statistical methods toassess CCM programs.1 In order to gain a better under-standing of how evaluation methods within the CCM field
have evolved over time and, in the interim, accommodatedtechnical setbacks, a brief history of CCM research designsand recent methodological applications are presented.
Historical CCM study designs
Based on the Care Continuum Alliance (CCA) guidelines,incorporation of a valid study design is essential to (1) as-certain the value of disease management (DM) programs(referenced as CCM in this article) in achieving favorableoutcomes for populations with chronic disease, (2) furtherimprove the delivery of DM services and foster competitionamong industry participants based on objective criteria, (3)meaningfully advance the delivery of health care servicesthrough the reporting and dissemination of interventions
Center for Health Research, Healthways, Inc., Franklin, Tennessee.
POPULATION HEALTH MANAGEMENTVolume xx, Number xx, 2012ª Mary Ann Liebert, Inc.DOI: 10.1089/pop.2011.0104
1

that reduce the burden of disease, and (4) help assess whichhealth plans or delivery systems are providing higher qualitycare at a more affordable cost.2
The CCA recommends the use of a randomized controlledstudy design to assess causality of DM in achieving out-comes.1 Randomized controlled trials (RCT), when properlydesigned, offer one of the most rigorous study designs and areconsidered to be the ‘‘gold standard’’ in other industries.When correctly performed, the random assignment of mem-bers to the treatment or control group will provide an equaldistribution of the unmeasured confounding variables, limit-ing study bias. Unlike other fields of study, however, RCTs inthe CCM field are often difficult to implement. Ethical issuesregarding random assignment of individuals to a CCM in-tervention group or control group remain a primary concern,particularly because purchasers rarely wish to deny treat-ment interventions to a subgroup of eligible members whenthey believe the treatment intervention is beneficial. Ad-ditionally, random assignment does not necessarily guaran-tee equivalent groups, as evidenced in the randomized blockdesign employed in the recent Medicare Health Support pi-lots.3,4 In these cases, the designs did not achieve equal dis-tribution of members with similar characteristics of age, sex,race, mortality likelihood, and medical expenditures. There-fore, it is possible to randomly assign individuals, whetherusing complete or block randomization, to treatment andcontrol and yet still have groups that are not equivalent orcomparable.5
Quasi-experimental study designs offer a practical alter-native to RCTs; however, the groups typically are selectedwithout using randomization or other efforts to ensuremember- and group-level comparability. Unfortunately,nonrandomly selected groups may not be proportionallyallocated (ie, imbalanced and heterogeneous) and may beevidenced to have observed and unobserved differencesassociated with the outcome of interest (ie, statistical bias).If either or both of these concerns are confirmed in the data,subsequent analyses and estimates of program effectiveness(causal effects) will be limited and potentially inaccu-rate. However, quasi-experimental designs that use effec-tive matching on critical variables related to the outcome ofinterest have the capability to minimize potential bias, im-balance, and inefficiency inherent to ‘‘after the fact’’ (ex postfacto) group identification.
Matching is a nonrandomized, quasi-experimental ap-proach commonly used to test CCM intervention effective-ness. These methods generally involve comparing memberswho are enrolled in the CCM program (ie, treatment or in-tervened group members) with members who have compa-rable attributes but are not enrolled in a CCM program (ie,comparison or nonintervened group members), with bothsets of members matched on an ex post facto basis using acommon set of factors. The direct comparison betweenmatched comparison and treatment groups has allowed re-searchers to quantify in a more robust and, potentially, ac-curate manner the true value of CCM programs,6–8 confirmassociations linking CCM participation with outcomes,6,7,9–11
and even offer insight into long-term outcomes associatedwith program involvement.12 Similar to other retrospectivestudy designs, matching is not without its limitations. Forinstance, the comparison group frequently is created after thetreatment group has been defined such that only the re-
maining nonparticipating members comprise the comparisongroup; this type of result can lead to significant selection biasregardless of the statistical means used to adjust for the in-tergroup differences. It may be impossible to overcome sucha strong selection bias, even with robust matching tech-niques, if the groups do not contain a sufficient proportion ofsimilar individuals. Therefore, caution should be used whenimplying causality of the CCM intervention when evaluat-ing study groups created using samples of convenience (eg,participant, nonparticipant), as failure to account for theoutlined limitations could lead to erroneous conclusions.
In this study, the authors present their experience evalu-ating outcomes from a CCM program over a 2-year periodusing observed administrative claims data for ex post factogenerated comparison and treatment groups. The goals ofthis case study were 3-fold: (1) evaluate comparability be-tween a comparison and treatment group based on objectivemetrics, (2) test the effectiveness of 2 matching methods increating valid study groups, thus improving the accuracy ofthe measurement of CCM programs, and (3) evaluate CCMprogram performance by determining the medical cost sav-ings during the evaluation period.
Methods
Study participants
This case study evaluated CCM program performance ofhealth plan members with 6 continuous months or more ofplan eligibility in each evaluation year, who were betweenthe ages of 18 and 64.9 years, and identified as having 1 ormore chronic conditions: coronary artery disease, congestiveheart failure, chronic obstructive pulmonary disease (COPD),and diabetes. The treatment group was defined from this setof members as those who were fully insured and enrolled inthe CCM program (n = 12,202); enrollment did not necessitatethe presence of intervention, which included telephonic in-teractions with clinicians and/or written material deliveredto the members during their enrollment. Conversely, thecomparison group (n = 7914) was defined as those membersselected ex post facto from the Administrative Services Only(ASO) groups of the same health plan that did not elect topurchase the CCM program; these members were not offeredinterventions.
Descriptive statistics
Member-level administrative claims and eligibility datafor the baseline (2005) and first program year (2008) wereutilized in this study. The temporal gap in data was becauseof contractual issues in which the health plan transitionedvendors, resulting in 2005 as the true nonintervened periodand 2008 as the first full year of 1 vendor-led program.Evaluated variables, derived from claims and eligibility data,are shown in Table 1 along with the corresponding meanbaseline values for the pre-matched treatment and compar-ison groups.
Quantitative statistics
Two quantitative measures were utilized to evaluate theextent of imbalance and heterogeneity between the studygroup members both prematching and postmatching—theL1 metric and the Wald test. Generally, imbalance is defined
2 WELLS ET AL.

Table 1. Comparison of Baseline (2005) Variables Prior to Matching*
Treatment ComparisonExplanatory Variable Description (n = 12,202) (n = 7,914) % D{
Age Age of the member, restricted to 18 to 64.9 years 51.38 50.47 - 1.8%(8.6018) (8.3921)
Sex If member is male, then 1; else 0 0.61 0.58 - 5.1%(0.4882) (0.4941)
Disease programCAD If member was identified through administrative
claims as having CAD, then 1; else 00.24 0.21 - 10.7%
(0.4255) (0.4088)CHF If CHF, then 1; else 0 0.03 0.03 12.2%
(0.1683) (0.1779)COPD If COPD, then 1; else 0 0.07 0.08 18.2%
(0.2514) (0.2715)Diabetes If Diabetes, then 1; else 0 0.67 0.68 1.4%
(0.4718) (0.4684)Base Member Months Total number of eligible member months during
baseline11.78 11.92 1.2%(1.0027) (0.5810)
2004 Allowed PMPMMedical Costs ($)
Average allowed monthly administrative claimsexpenditures in the pre-baseline period
570.87 489.34 - 14.3%(1,071.4987) (1,013.8602)
Allowed PMPM MedicalCosts ($)
Average allowed monthly administrative claimsexpenditures
629.11 561.75 - 10.7%(828.8645) (788.7325)
Exceed Average MedicalCosts
If member’s annual allowed medical costs exceedtheir group-specific average medical cost, then1; else 0
0.35 0.31 - 9.1%(0.4757) (0.4644)
Primary Plan State If member resides in the 2-state core network areaof the health plan, then 1; else 0
0.93 0.60 - 36.1%(0.2497) (0.4907)
Plan Type Ordinal variable denominated 1 to 8, with 1representing the most frequently reported typeof health insurance coverage (eg, HMO) and 8the least frequently reported
1.70 1.38 - 18.9%(0.8301) (1.3044)
Duration Since ChronicDisease IndicationDummy
If member is identified in administrative claims tohave been diagnosed with a chronic conditionfor less than 24 months prior to program year,then 1; else 0
0.37 0.44 17.7%(0.4830) (0.4959)
Inpatient Stays Total number of unique inpatient stays 0.52 0.60 16.7%(1.8275) (2.0025)
Emergency DepartmentVisits
Total number of unique emergency departmentvisits
0.22 0.26 19.0%(0.7782) (0.7292)
Outpatient Visits Total number of unique outpatient visits 12.79 12.56 - 1.8%(11.6860) (11.8912)
Physician Visits Total number of unique physician visits 19.75 13.04 - 34.0%(13.9824) (14.1139)
2004 ICD9 Count Count of the number of first position ICD9diagnoses (not unique) recorded inadministrative claims in the pre-baseline period
54.74 43.27 - 21.0%(50.8496) (49.2509)
ICD9 Count Count of the number of first position ICD9diagnoses (not unique) recorded inadministrative claims
70.57 70.12 1.3%(86.2643) (86.2194)
CPT4 Rank Indexed value based on the weighted averageranking of cost and frequency of recordedprocedures in administrative claims
15.88 15.49 - 2.5%(13.4794) (14.0804)
Prescription Medication(NDC) Count
Count of the number of prescriptions recorded inadministrative claims
35.22 22.59 - 35.8%(27.6712) (26.1818)
Clinical Risk Group (CRG)Score
Proprietary, customer computed measureof morbidity
227.90 235.96 - 6.7%(126.4608) (108.1854)
Weighted Average DiseaseSeverity
Indexed value based on the member’s chroniccondition(s) and the associated weightedaverage cost of the condition(s)
3.89 3.72 - 4.2%(1.3313) (1.3158)
*All values based on the average of 250 simple random samples taken with replacement, with the treatment group sampled (simplerandom with replacement) at a rate equal to the original comparison group (analyzed comparison group sampled up to 1.5 times the originalsize). Members were between the ages of 18 and 64.9 years, evidenced to have a chronic condition of coronary artery disease, congestive heartfailure, chronic obstructive pulmonary disease, and/or diabetes (based on administrative claims data), and excluded if medical costs inbaseline or program year exceeded the 99th percentile, or if their change in costs over these 2 periods exceeded the 99th percentile.
{Independent, relative percent difference in prematching values (by Explanatory Variable) between comparison and treatment groupmembers. As an example, for the explanatory variable Age, the delta is computed as: (50.47-51.38)/ 51.38 = - 1.8%.
CAD, coronary artery disease; CHF, congestive heart failure; COPD, chronic obstructive pulmonary disease; CPT, Current ProceduralTerminology; HMO, health maintenance organization; ICD9, International Classification of Diseases, Ninth Revision; NDC, National Drug Code;PMPM, per member per month.
3

in the context of nonparametric evaluation of the compara-bility of 2 groups of members, whereas heterogeneity is morerelevant to statistical tests of group comparability. For bothmeasures, the purpose is to assess quantitatively the extent towhich treatment and comparison members are unequallydistributed, or conversely, share a common attribute, for agiven set of evaluated factors such as those listed in Table 1.Relatively high levels of imbalance and heterogeneity sug-gest the study groups are not equivalent and are expected tohave differential impacts to the variance around the mean ofthe outcome (dependent) variable.
On the other hand, low levels of imbalance and hetero-geneity indicate the 2 groups are of similar composition andshould have similar variability around the outcome, allow-ing for aggregation of the data from each group into 1 dataset for analysis within a statistical model. The objective ofthis analysis would then be to compute the difference in themean value of the outcome (here, trend in medical expen-ditures) related to either having received interventions ornot, while controlling for all other relevant observable fac-tors. This calculated difference is the monetary measure ofthe effectiveness of the program, or causal effect.
The L1 metric, which is a nonparametric measure origi-nally developed within Coarsened Exact Matching (CEM) (tobe described),13 quantifies imbalance by comparing relativefrequencies of treatment and comparison group membersassigned across each of the bins (or strata) created withinCEM. For example, consider a simple case of 10 treatmentand 20 comparison members stratified based on 2 factors—age less than 40 or greater than or equal to 40 (2 strata de-noted ‘‘ < 40,’’ ’’ = 40’’) and sex (2 strata denoted ‘‘m’’ and ‘‘f’’).The distribution of these members is observed to be[n < 40_m = {3,7}, n < 40_ f = {4,10}, n > = 40_m = {1,3}, n > = 40_ f = {2,0}],where the first value in each set refers to the number oftreatment members and the latter to the comparison mem-bers. The L1 is computed as one-half the sum of the absolutedifference between the relative proportions across each of the4 strata; in the case of the first strata capturing men under40 the contribution to L1 is: [(3/10) – (7/20) = 0.05]; theremaining differences in proportions are n < 40_ f = 0.10,n > = 40_m = 0.05, and n > = 40_ f = 0.20. The resulting prematch L1for this stratification rule (age demarcated at 40 and sex) is0.20. In the postmatch case, the L1 would be computed foronly those strata in which 1 or more members are exactlymatched to at least 1 other member from either the treatmentor comparison group. In the example, the stratum denotingwomen greater than or equal to 40 would be excluded fromsubsequent analysis and the resulting post-CEM match L1would be 0.10. Values of L1 close to zero indicate a higherquality match (an equal number of treatment and compari-son members in each strata), whereas an L1 value of 1 in-dicates perfect dissimilarity or disproportionality betweenthe groups (no overlap between groups in the strata as-signment). Ideally, the goal is to achieve optimum balanceacross a given evaluated set of stratification criteria such thatL1 is minimized while retaining a relatively high proportionof the original set of members.
There are several statistical-based counterparts to L1 thatcan be utilized to ascertain balance and homogeneity. In thisstudy, 2 statistical tests are most relevant, the Chow and Waldtests, because the primary reason for specific member as-signment to a given study group is known (ASO purchasing
decision).14–16 The Chow and Wald tests are similar in regardto providing a statistical test of whether significant differencesare present between 2 sets of data in the magnitude, direction,and variability of influence of a given set of covariates on thesame dependent variable. More explicitly, and relevant to thecurrent study, the Chow and Wald tests can be used to de-termine whether observed data for treatment members can becombined with data for the comparison members such that adichotomous (explanatory) variable of group identity can beused to measure the influence of the intervention on theoutcome of medical costs over time (ie, the causal effect). If thenull hypothesis of homogeneity is rejected because of failureto achieve the critical value (F statistic in the case of the Chowtest and chi-square statistic in the case of Wald test), then thedichotomous variable of group identity may yield a biasedestimate of program effectiveness.
However, the Chow and Wald tests differ concerning ro-bustness in the presence of violation of the statistical modelingassumption of constant error variance (homoscedasticity). Ifthe assumption of homoscedasticity is met, then either theChow or Wald test can be applied, with selection dependentupon the econometric estimation technique applied. In thecase where this assumption is not met, the Wald test is morerobust.14–16
Matching techniques
To minimize potential imbalance between the treatmentand comparison groups, CEM and Propensity Score Matching(PSM) techniques were utilized. CEM is a nonparametricmatching method applicable in a quasi-experimental design forthe purpose of comparing an outcome between 2 groups overtime.13,17,18 Compared with PSM and in the context of acomparison group framework, CEM has been found to yieldestimates of the causal effect with the lowest variance and biasfor any sample size (G. King, R. Neilson, J. Pope, C. Coberley,A. Wells, unpublished data, 2011). The increased efficiency andlower bias properties of CEM are attributed to stratification andexact matching of the 2 study groups based on variables thatexplain variance in the outcome of interest, difference-in-difference computations, and strata-based weighting within anonparametric framework. Specifically, CEM distinctly assignseach member into one of a defined set of strata in which themembers are exactly matched on a set of ‘‘coarsened’’ variables(ie, variables divided into 2 or more meaningful ranges or ca-tegories). The matched members are then assigned a weightspecific to their stratum and representative of the proportion ofall members present in said stratum. Effectively, CEM is aquasi-experimental methodology that facilitates more compa-rable evaluation of study groups by creating proportionalityamong the factors contributing to the outcome of interestthrough blocking members into distinct strata.
The more widely applied PSM method19–25 consists ofestimating a logistic model to derive a propensity scoremeasuring the likelihood a given member is in the treatmentgroup compared to the comparison group based on a com-mon set of explanatory variables. A principal assumption ofPSM pertains to independence of irrelevant alternatives(IIA). For this study, the IIA assumption is assumed to bemet because an executive-level decision was made, as op-posed to member-level decision (where the member is theunit of measurement), to not purchase the CCM program.
4 WELLS ET AL.

Specific to the application of PSM in this study, the Greedyalgorithm was utilized within the SAS 9.2 statistical software(SAS Institute Inc., Cary, NC) to minimize the weighted sumof the absolute differences between the comparison andtreatment group propensity scores.26# More than 30 explan-atory variables were evaluated for inclusion in this PSMapplication, with the final set of variables chosen based uponuse of a forward selection algorithm.
Sampling design
Due to the considerable difference in number of treatment(n = 12,202) and comparison (n = 7914) members in additionto the restriction of the Greedy PSM algorithm that the numberof comparison members exceed treatment members, a 2-stepsampling plan was developed and applied in this study. Theplan consisted of first selecting a subset of treatment membersequal in number to the comparison group using simple randomsampling with replacement. The comparison group was thenaugmented by 50% through the inclusion of a subset of theoriginal comparison group sampled using simple randomsampling with replacement. This combined comparison group(original 7914 members with an additional 3957 members) wasthen matched to the sampled treatment group (n = 7914) in PSMand CEM. In both sampling plans, 250 iterations were applied.
Econometric estimation techniques
The estimate of causal effect or, alternatively, monetaryvalue of program effectiveness, was derived from multivar-iate statistical modeling using members matched throughapplication of CEM and PSM. The dependent (outcome)variable in these models was differenced-allowed medicalexpenditures computed at the member level; the differencewas computed as the average monthly allowed medical ex-penditures in program year less baseline year. Given thedifferenced-dependent variable, a negative coefficient forthe causal effect from the regression analysis indicated thecomparison group trend in medical expenditures exceededthe treatment group trend and thus reflects gross per mem-ber per month savings as a result of the intervention.
The multivariate statistical modeling methods ordinaryleast squares (OLS) and generalized estimating equations(GEE; normal distribution) were utilized. OLS is a commonestimation technique, whereas GEE is a more robust, in termsof estimated coefficient variance and model explanatorypower, yet complicated multivariate statistical method. Forpurposes of this analysis, both GEE and OLS were evaluatedto demonstrate the different econometric methods that maybe applied in matching studies; however, only GEE resultsare reported because of the presence of heteroscedasticity inthe OLS estimates.
Case Study
Comparability of unmatched study groups
Descriptive and statistical methods were used to assess thelevel of balance between comparison and treatment groupmembers. Descriptively, imbalance was observed to be mostpronounced (greater than 15% relative percent differencein mean baseline values between treatment and comparisonmembers) among members with residence outside of the 2states defining the health plan’s primary network, prescription
utilization, physician visits, count of pre-baseline diagnoses,type of health coverage, emergency department visits, COPDprevalence, proportion of members with less than 24 months ofchronic disease exposure prior to program start, and number ofinpatient stays (Table 1). Conversely, the groups were mostbalanced in regard to composition of the sexes, a disease se-verity measure, number of procedures, outpatient visits, age,number of eligible member months, count of diagnoses, anddiabetes prevalence. For the remaining descriptive measuresof the population, the average absolute relative percent dif-ference in mean baseline values between the 2 groups was 11%,with a standard deviation of 3%.
Reinforcing the descriptive results observed in Table 1, theprematch L1 value for the study groups was 0.42 (Table 2).This value is indicative of a relatively high level of imbalancebetween the groups and supports the use of matching.However, the Wald test showed a statistically insignificantdifference between the study groups in the estimated effect(within a multivariate statistical model) of evaluated explan-atory variables on the dependent variable. In other words, theWald test results indicated that heterogeneity was not ob-served between the treatment and comparison group mem-bers for the specified GEE econometric model. This was aninteresting result following the imbalance observed in the L1and highlights the need for multiple quantitative measures ofgroup comparability prior to assessing program effectiveness.
Effectiveness of two matching methodologies
Based on the qualitative and quantitative imbalance re-sults observed in Tables 1 and 2, CEM and PSM were em-ployed within the aforementioned sampling design. Table 2lists the postmatch L1 and Wald test results and Table 3shows a comparison of explanatory variable mean valuesfollowing application of CEM and PSM. To demonstrate themethodological differences between CEM and PSM, Table 2reports CEM results compared with PSM when the logitmodel of PSM was specified using the explanatory factorsused to create the CEM strata. Additionally, results areshown when CEM was applied to members selected throughthe use of the optimal PSM specification (based on forwardselection) as well as different specifications of the multivar-iate model using the propensity score.
The objective of including multiple CEM and PSM speci-fications within the comparison of matching methods was toenable analysis of the methods from inter (across methods)and intra (within method) perspectives, with the overarchinggoal to address design concerns surrounding matching cri-teria specification and matching method selection. In theintermatching method analyses, the objective was to evaluatethe extent to which the 2 methods differed in regard tomatching metrics (L1 and Wald test) and causal effects whenthe analyzed factors remained the same. With these analyses,the differential member reduction combined with CEMstratification (blocking) weights principally distinguished the2 matching methods. Similarly, the objective of the in-tramatching method analyses was to quantify the differencein matching metrics and causal effects when the method washeld fixed, yet alternative specifications of the matchingcriteria were applied.
Results of the intermatching and intramatching methodanalyses showed that CEM reported a lower postmatching
EXPLORING CCM EVALUATION METHODOLOGY 5

L1 value, failed to reject the Wald test, and demonstrated ahigher causal effect. On average, the significant estimatedcausal effects from CEM exceeded that of PSM by 29% (av-erage savings in terms of the trend in medical expendituresper treatment group member per month equal to -$25.57,compared to -$19.82, from CEM and PSM, respectively). Inthe intermatching analysis, significantly more members wereretained following the CEM matching process. The in-tramatching analyses indicated that PSM was relatively sta-ble to alternative specifications of the matching criteriawhereas CEM evidenced a higher causal effect when thePSM criteria were not imposed. These results indicate thatthe improved balance between treatment and comparisongroups achieved within CEM, regardless of the specifica-tion criteria, enabled the effect of the program to be morepronounced.
Findings from the intermethod comparisons showed thatthe member-level propensity score should not be used as aweighting instrument. The propensity score applied in aweighted GEE model yielded the highest, yet most variable,estimate of program effectiveness. This result indicates the
propensity score as a weighting instrument actually mayhave induced bias in the causal effect estimated with thematched members. On the other hand, use of the propensityscore as an additional explanatory variable did not alterconclusions drawn from the aforementioned comparativematching analyses.
In order to gain a better understanding of the differencebetween CEM and PSM, an ad hoc exploratory analysis wasconducted of the treatment and comparison group membersincluded in the CEM match yet not in the PSM match andvice versa (Table 4). In the former analysis, identical treat-ment group members were retained following CEM andPSM, whereas in the latter analysis CEM removed an addi-tional set (n = 49) of treatment members. From a CCM pur-chaser perspective as well as the researcher perspective, thegoal is to estimate the effectiveness of the program using ananalytical design in which balance is maximized with mini-mal removal of treatment group members while retainingonly those comparison group members who are most similarto the intervened population. In the analysis of comparisonmembers included in CEM (but excluded from PSM)
Table 2. Comparison of Matching Metrics and Causal Effects Estimated from Coarsened
Exact Matching (CEM) and Propensity Score Matching (PSM)*
L1 Metric** Wald Test
Matching Method{,{ n Pre Post Pre Post LL***Estimated CausalEffect (PCMPM){
CEM – A 15,027 0.42 0.00 0.81 0.84 - 125.2 - $26.46PSM – A 13,120 0.42 0.23 0.81 0.64 - 106.7 - $19.85PSM – B 13,151 0.42 0.23 0.81 0.71 - 106.9 - $19.68CEM – B 13,024 0.42 0.00 0.81 0.80 - 106.5 - $24.67PSM – C 13,151 0.42 0.23 0.81 0.76 - 106.9 - $19.93PSM – D 13,151 0.42 0.23 0.81 3.02 - 130.9 - $34.25
*All values based on the average of 250 simple random samples taken with replacement, with the treatment group sampled (simplerandom with replacement) at a rate equal to the original comparison group (analyzed comparison group sampled up to 1.5 times the originalsize). Members were between the ages of 18 and 64.9 years, evidenced to have a chronic condition of coronary artery disease, congestive heartfailure, chronic obstructive pulmonary disease, and/or diabetes (based on administrative claims data), and excluded if medical costs inbaseline or program year exceeded the 99th percentile, or if their change in costs over these 2 periods exceeded the 99th percentile.
{Letters denote specific CEM or PSM stratification criteria and are described below (note that all variables not denoted as ‘‘04’’ are derivedfrom the baseline period of 2005).
A = DURATION_SINCE_CHRONIC_DISEASE_INDICATION_DUMMY, AGE40_DUMMY, GENDER, IP_DUMMY, ED99_DUMMY,PLAN_STATE_DUMMY, PLAN_TYPE
B = BASE_MM, AGE, GENDER, IP_STAYS, IP_STAYS04, ED_VISITS, OP_VISITS, PHY_VISITS, PLAN_STATE_DUMMY, PLAN_TYPE,NDC_COUNT, WTAVGSEV, CPT_RANK, ICD_COUNT, ICD_COUNT04, SQRT_CLAIMS04, BASE_PMPM, EXCEED_AVG_COST, CRG,ASTHMA_IND, CAD_IND, CHF_IND, DM_IND (note that propensity score not included beyond use in creating the match)
C = B & propensity score as an explanatory variableD = B & propensity score as the weighting instrument{Corresponding Percent Concordant statistic (c-statistic) values for the propensity score generating model within the PSM-based Matching
Methods, by letter, are as follows (note that all values are based on the aforementioned random sampling plan):A: c–statistic = 0.76B: c–statistic = 0.79C: c–statistic = 0.79 (identical propensity score generating model as B)D: c–statistic = 0.79 (identical propensity score generating model as B)**Pre-L1 metric computed based on the stratification criteria listed as opposed to searching across the relevant parameter space to define
the matching variables, using Scott’s Binning Algorithm to determine the cut points (eg, age separated at cut points 25, 35, 45, and 55) andthen choosing the median L1 value from these specifications.
***Log likelihood values reported in thousands and based on use of generalized estimating equations (GEE) regression model (normaldistribution, identify link).
{Estimated Causal Effect is the difference in per chronic member per month (PCMPM) medical costs between the 2 study years andtreatment and comparison group members (referred to as the difference-in-difference value). Negative values imply the comparison grouptrend in medical expenditures exceeded the treatment group trend and thus reflect gross savings. For CEM and PSM, the Estimated CausalEffect is the coefficient for GROUP_TYPE from the GEE regression model (normal distribution, identify link). Note that for each result listedabove, the set of evaluated explanatory variables was comprised of the following: GROUP_TYPE, BASE_MM, AGE, GENDER, IP_STAYS,IP_STAYS04, ED_VISITS, OP_VISITS, PHY_VISITS, PLAN_STATE_DUMMY, PLAN_TYPE, NDC_COUNT, WTAVGSEV, CPT_RANK,ICD_COUNT, ICD_COUNT04, SQRT_CLAIMS04, BASE_PMPM, EXCEED_AVG_COST, CRG, MONTHS_AFTER_TRIGGER_DUMMY,ASTHMA_IND, CAD_IND, CHF_IND, DM_IND [COPD_IND was the reference variable].
6 WELLS ET AL.

Table 3. Comparison of Baseline (2005) Variables Following Application of Coarsened
Exact Matching (CEM) and Propensity Score Matching (PSM)*
Post CEM{ Post PSM
Treatment Comparison Treatment ComparisonExplanatory Variables (n = 7833) (n = 7221) (n = 7833) (n = 5295) % D{
Age 51.41 51.22 51.37 50.84 - 0.4% CEM k- 1% PSM(0.0579) (0.0408) (0.0572) (0.0276)
Sex 0.61 0.61 0.61 0.60 0% CEM k - 0.9% PSM(0.0033) (0.0033) (0.0034) (0.0018)
Disease programCAD 0.24 0.23 0.24 0.23 - 5% CEM k - 1.6% PSM
(0.0029) (0.0008) (0.0029) (0.0021)CHF 0.03 0.03 0.03 0.03 16.8% CEM k 11% PSM
(0.0011) (0.0002) (0.0011) (0.0005)COPD 0.07 0.08 0.07 0.08 14.4% CEM k 13.6% PSM
(0.0017) (0.0004) (0.0017) (0.0007)Diabetes 0.67 0.66 0.67 0.66 - 0.4% CEM k- 1.3% PSM
(0.0032) (0.0011) (0.0032) (0.0021)Base Member Months 11.78 11.93 11.78 11.89 1.3% CEM k 1% PSM
(0.0068) (0.0007) (0.0067) (0.0011)2004 Allowed PMPM Medical Costs ($) 564.44 532.63 567.76 523.48 - 5.6% CEM k- 7.8% PSM
(6.9170) (1.2736) (7.1124) (3.3224)Allowed PMPM Medical Costs ($) 622.24 575.17 626.62 594.26 - 7.6% CEM k- 5.2% PSM
(5.2277) (3.5667) (5.2750) (2.6700)Exceed Average Medical Costs 0.34 0.34 0.34 0.33 - 1.6% CEM k- 3% PSM
(0.0030) (0.0017) (0.0030) (0.0017)Primary Plan State 0.93 0.93 0.93 0.79 0% CEM k- 15.8% PSM
(0.0016) (0.0016) (0.0016) (0.0039)Plan Type 1.82 1.83 1.84 1.66 0.3% CEM k- 9.9% PSM
(0.0076) (0.0076) (0.0077) (0.0162)Duration Since Chronic Disease
Indication Dummy0.37 0.37 0.37 0.41 0% CEM k 10% PSM
(0.0033) (0.0033) (0.0033) (0.0019)Inpatient Stays 0.50 0.50 0.51 0.57 - 0.6% CEM k 11.2% PSM
(0.0119) (0.0094) (0.0120) (0.0066)Emergency Department Visits 0.20 0.21 0.21 0.24 4.9% CEM k 12.4% PSM
(0.0048) (0.0022) (0.0051) (0.0029)Outpatient Visits 12.71 13.24 12.76 13.14 4.1% CEM k 3% PSM
(0.0781) (0.0362) (0.0789) (0.0441)Physician Visits 19.71 15.99 19.73 15.27 - 18.9% CEM k- 22.6% PSM
(0.0965) (0.0438) (0.0957) (0.0571)2004 ICD9 Count 54.35 52.55 54.43 49.57 - 3.3% CEM k- 8.9% PSM
(0.3434) (0.1017) (0.3466) (0.1710)ICD9 Count 55.88 56.37 56.07 57.55 0.9% CEM k 2.6% PSM
(0.2703) (0.1358) (0.2719) (0.1764)CPT4 Rank 15.83 16.27 15.86 16.02 2.8% CEM k 1% PSM
(0.0882) (0.0354) (0.0888) (0.0464)Prescription Medication (NDC) Count 35.15 27.81 35.18 26.54 - 20.9% CEM k- 24.5% PSM
(0.1917) (0.0787) (0.1902) (0.1003)Clinical Risk Group (CRG) Score 233.81 231.85 233.83 229.02 - 0.8% CEM k- 2.1% PSM
(0.2242) (0.0790) (0.2227) (0.2912)Weighted Average Disease Severity 3.88 3.85 3.88 3.81 - 0.8% CEM k- 1.9% PSM
(0.0089) (0.0035) (0.0089) (0.0054)
*Results based on CEM stratification {DURATION_SINCE_CHRONIC_DISEASE_INDICATION_DUMMY, AGE40_DUMMY, GENDER,IP_DUMMY, ED99_DUMMY, PLAN_STATE_DUMMY, PLAN_TYPE}; all values based on the average of 250 simple random samples takenwith replacement, with the treatment group sampled (simple random with replacement) at a rate equal to the original comparison group(analyzed comparison group sampled up to 1.5 times the original size). Members were between the ages of 18 and 64.9 years, evidenced tohave a chronic condition of coronary artery disease, congestive heart failure, chronic obstructive pulmonary disease, and/or diabetes (basedon administrative claims data), and excluded if medical costs in baseline or program year exceeded the 99th percentile, or if their change incosts over these 2 periods exceeded the 99th percentile. Standard deviation in parentheses.
{CEM results are based on application of CEM-derived weights.{Independent, relative percent difference in postmatch values (by Explanatory Variable) for comparison and treatment group members by
matching method. As an example, for the explanatory variable Age, the delta is computed as: (51.22 - 51.41)/51.41 = - 0.4% [CEM] and(50.84 - 51.37)/51.37 = - 1 % [PSM].
CAD, coronary artery disease; CHF, congestive heart failure; COPD, chronic obstructive pulmonary disease; CPT, Current ProceduralTerminology; ICD9, International Classification of Diseases, Ninth Revision; NDC, National Drug Code; PMPM, per member per month.
EXPLORING CCM EVALUATION METHODOLOGY 7

Table 4. Comparison of Baseline (2005) Variables for Members Included or Excluded
between Coarsened Exact Matching (CEM) and Propensity Score Matching (PSM)*
Post-CEM Match (Includedin CEM, Excluded in PSM)
Post-PSM Match (IncludedIn PSM, Excluded in CEM)
Treatment{ Comparison Treatment ComparisonExplanatory Variables (n = .) (n = 1994) (n = 49) (n = 37) % D{
Age AMR 50.23 44.55 44.97 - 10%(0.2047) (0.9669) (1.3747)
Sex AMR 0.50 0.41 0.38 - 24%(0.0351) (0.0389) (0.0794)
Disease programCAD AMR 0.13 0.22 0.23 85%
(0.0155) (0.0364) (0.0545)CHF AMR 0.04 0.05 0.02 - 39%
(0.0018) (0.0194) (0.0229)COPD AMR 0.10 0.07 0.14 43%
(0.0037) (0.0219) (0.0334)Diabetes AMR 0.74 0.66 0.60 - 18%
(0.0160) (0.0405) (0.0612)Base Member Months AMR 11.87 11.36 11.79 - 1%
(0.0080) (0.1351) (0.0529)2004 Allowed PMPM Medical Costs ($) AMR 374.56 1,094.25 441.45 18%
(11.4938) (235.0966) (90.8875)Allowed PMPM Medical Costs ($) AMR 465.35 1,322.08 1,099.00 136%
(26.1465) (112.2179) (128.3874)Exceed Average Medical Costs AMR 0.26 0.68 0.72 178%
(0.0131) (0.0396) (0.0584)Primary Plan State AMR 0.27 0.75 0.41 52%
(0.0211) (0.0386) (0.0769)Plan Type AMR 2.40 4.78 3.85 60%
(0.0821) (0.1664) (0.3932)Duration Since Chronic Disease
Indication DummyAMR 0.54 0.34 0.61 13%
(0.0373) (0.0383) (0.0856)Inpatient Stays AMR 0.54 1.96 2.02 273%
(0.0677) (0.2651) (0.4067)Emergency Department Visits AMR 0.22 1.52 1.84 719%
(0.0090) (0.2077) (0.4763)Outpatient Visits AMR 11.13 19.33 20.07 80%
(0.2870) (1.5772) (1.3314)Physician Visits AMR 9.65 23.03 19.23 99%
(0.5128) (1.8850) (1.5928)2004 ICD9 Count AMR 29.59 67.47 45.37 53%
(0.7897) (7.5389) (5.6799)ICD9 Count AMR 53.35 86.63 98.51 85%
(1.3111) (4.7918) (6.5595)CPT4 Rank AMR 14.09 20.76 21.02 49%
(0.2699) (1.7155) (2.0439)Prescription Medication (NDC) Count AMR 16.73 40.06 30.57 83%
(0.8627) (3.3940) (2.7375)Clinical Risk Group (CRG) Score AMR 212.42 238.20 230.91 9%
(1.1264) (2.3102) (6.1218)Weighted Average Disease Severity AMR 3.49 4.01 4.23 21%
(0.0336) (0.1199) (0.1981)
*Results based on CEM stratification {DURATION_SINCE_CHRONIC_DISEASE_INDICATION_DUMMY, AGE40_DUMMY, GENDER,IP_DUMMY, ED99_DUMMY, PLAN_STATE_DUMMY, PLAN_TYPE}; all values based on the average of 250 simple random samples takenwith replacement, with the treatment group sampled (simple random with replacement) at a rate equal to the original comparison group(analyzed comparison group sampled up to 1.5 times the original size). Members were between the ages of 18 and 64.9 years, evidenced tohave a chronic condition of coronary artery disease, congestive heart failure, chronic obstructive pulmonary disease, and/or diabetes (basedon administrative claims data), and excluded if medical costs in baseline or program year exceeded the 99th percentile, or if their change incosts over these 2 periods exceeded the 99th percentile. Standard deviation in parentheses.
{AMR denotes ‘‘All Members Retained,’’ implying CEM and PSM retained identical treatment group members.{Independent, relative percent difference in postmatch values (by Explanatory Variable) between CEM and PSM for comparison group
members. As an example, for the explanatory variable Age, the delta is computed as: (44.97 - 50.23)/50.23 = - 10%.CAD, coronary artery disease; CHF, congestive heart failure; COPD, chronic obstructive pulmonary disease; CPT, Current Procedural
Terminology; ICD9, International Classification of Diseases, Ninth Revision; NDC, National Drug Code; PMPM, per member per month.
8 WELLS ET AL.
compared to members included in PSM (but excluded fromCEM), the results showed that the composition of the 2 setsof members was vastly different. On an absolute value basis,the members were most different in regard to emergencydepartment visits, inpatient stays, likelihood to exceedgroup-specific average costs, medical expenditures, andphysician visits. Overall, the results demonstrate that PSMwas more likely to include comparison group members whowere higher utilizers, of greater morbidity, and more costlyin terms of medical costs.
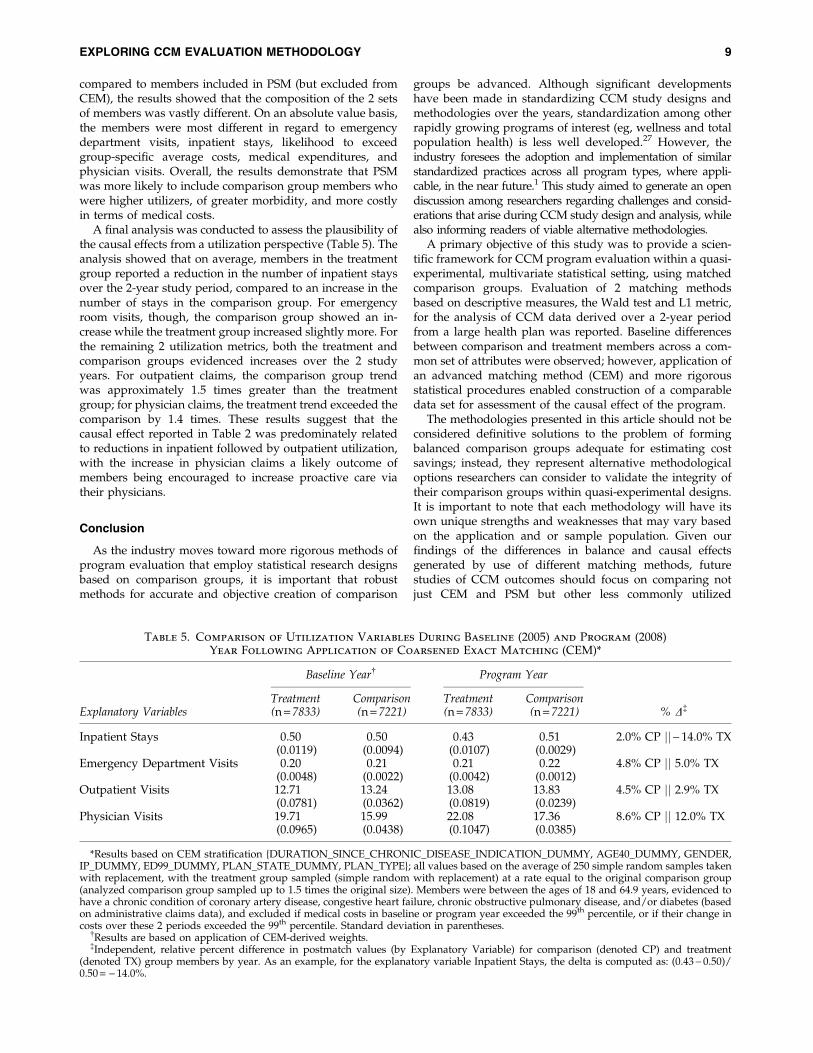
A final analysis was conducted to assess the plausibility ofthe causal effects from a utilization perspective (Table 5). Theanalysis showed that on average, members in the treatmentgroup reported a reduction in the number of inpatient staysover the 2-year study period, compared to an increase in thenumber of stays in the comparison group. For emergencyroom visits, though, the comparison group showed an in-crease while the treatment group increased slightly more. Forthe remaining 2 utilization metrics, both the treatment andcomparison groups evidenced increases over the 2 studyyears. For outpatient claims, the comparison group trendwas approximately 1.5 times greater than the treatmentgroup; for physician claims, the treatment trend exceeded thecomparison by 1.4 times. These results suggest that thecausal effect reported in Table 2 was predominately relatedto reductions in inpatient followed by outpatient utilization,with the increase in physician claims a likely outcome ofmembers being encouraged to increase proactive care viatheir physicians.
Conclusion
As the industry moves toward more rigorous methods ofprogram evaluation that employ statistical research designsbased on comparison groups, it is important that robustmethods for accurate and objective creation of comparison
groups be advanced. Although significant developmentshave been made in standardizing CCM study designs andmethodologies over the years, standardization among otherrapidly growing programs of interest (eg, wellness and totalpopulation health) is less well developed.27 However, theindustry foresees the adoption and implementation of similarstandardized practices across all program types, where appli-cable, in the near future.1 This study aimed to generate an opendiscussion among researchers regarding challenges and consid-erations that arise during CCM study design and analysis, whilealso informing readers of viable alternative methodologies.
A primary objective of this study was to provide a scien-tific framework for CCM program evaluation within a quasi-experimental, multivariate statistical setting, using matchedcomparison groups. Evaluation of 2 matching methodsbased on descriptive measures, the Wald test and L1 metric,for the analysis of CCM data derived over a 2-year periodfrom a large health plan was reported. Baseline differencesbetween comparison and treatment members across a com-mon set of attributes were observed; however, application ofan advanced matching method (CEM) and more rigorousstatistical procedures enabled construction of a comparabledata set for assessment of the causal effect of the program.
The methodologies presented in this article should not beconsidered definitive solutions to the problem of formingbalanced comparison groups adequate for estimating costsavings; instead, they represent alternative methodologicaloptions researchers can consider to validate the integrity oftheir comparison groups within quasi-experimental designs.It is important to note that each methodology will have itsown unique strengths and weaknesses that may vary basedon the application and or sample population. Given ourfindings of the differences in balance and causal effectsgenerated by use of different matching methods, futurestudies of CCM outcomes should focus on comparing notjust CEM and PSM but other less commonly utilized
Table 5. Comparison of Utilization Variables During Baseline (2005) and Program (2008)Year Following Application of Coarsened Exact Matching (CEM)*
Baseline Year{ Program Year
Treatment Comparison Treatment ComparisonExplanatory Variables (n = 7833) (n = 7221) (n = 7833) (n = 7221) % D{
Inpatient Stays 0.50 0.50 0.43 0.51 2.0% CP jj - 14.0% TX(0.0119) (0.0094) (0.0107) (0.0029)
Emergency Department Visits 0.20 0.21 0.21 0.22 4.8% CP jj 5.0% TX(0.0048) (0.0022) (0.0042) (0.0012)
Outpatient Visits 12.71 13.24 13.08 13.83 4.5% CP jj 2.9% TX(0.0781) (0.0362) (0.0819) (0.0239)
Physician Visits 19.71 15.99 22.08 17.36 8.6% CP jj 12.0% TX(0.0965) (0.0438) (0.1047) (0.0385)
*Results based on CEM stratification {DURATION_SINCE_CHRONIC_DISEASE_INDICATION_DUMMY, AGE40_DUMMY, GENDER,IP_DUMMY, ED99_DUMMY, PLAN_STATE_DUMMY, PLAN_TYPE}; all values based on the average of 250 simple random samples takenwith replacement, with the treatment group sampled (simple random with replacement) at a rate equal to the original comparison group(analyzed comparison group sampled up to 1.5 times the original size). Members were between the ages of 18 and 64.9 years, evidenced tohave a chronic condition of coronary artery disease, congestive heart failure, chronic obstructive pulmonary disease, and/or diabetes (basedon administrative claims data), and excluded if medical costs in baseline or program year exceeded the 99th percentile, or if their change incosts over these 2 periods exceeded the 99th percentile. Standard deviation in parentheses.
{Results are based on application of CEM-derived weights.{Independent, relative percent difference in postmatch values (by Explanatory Variable) for comparison (denoted CP) and treatment
(denoted TX) group members by year. As an example, for the explanatory variable Inpatient Stays, the delta is computed as: (0.43 - 0.50)/0.50 = - 14.0%.
EXPLORING CCM EVALUATION METHODOLOGY 9

methods. In exploring the applicability and effectiveness of amatching method, effort should be directed toward com-paring alternative specifications of the factors upon whichthe match is based. For example, age, sex, and baselinehealth risk severity are necessary but not sufficient matchingfactors; however, a definitive, sufficient set of matching fac-tors has yet to be defined, leaving CCM purchasers to con-sider various specifications from CCM providers withoutknowledge of the most robust option. In addition, futureefforts should consider different regression models and ex-planatory variables applied in these models to determineprogram savings estimates. Beyond CCM program evalua-tion, comparison of matching methods should be applied towellness program evaluation and, subsequently, programsthat seek to understand, manage, and improve health risksacross an entire population.
An important study limitation to note is that althoughthe results presented here demonstrate that, in addition tomatching, the inclusion of a comprehensive set of explana-tory variables improves study group comparability, onlyobservable differences are considered. Another limitation ofmatching techniques in general is that when members arematched based on similar variables into blocks or strata, as inCEM, reductions in the sample population usually occur,especially when the pool of comparison group members issmall relative to the treatment. Thus, researchers shouldconsider the trade-off of fewer analyzed members from theoriginal population and potential variance inflation relatedto sparse strata with the benefits of improved balance andhomogeneity in the matched cohorts.
In conclusion, the need for new and improved methodo-logical approaches is critical to continuously advance thedesign, implementation, and execution of scientifically rig-orous studies in the CCM field. While eager to share ourresearch experiences and methodology applications, we areaware that such applications should be cross-validatedamong different CCM providers, programs, and time peri-ods to standardize and ensure robustness. The hope is thatour findings will serve as a catalyst for more substantivediscussion so that, collectively, we can continue to advancethe field.
Acknowledgment
The Center for Health Research would like to acknowl-edge William Greene, Ph.D., Toyota Motor CorporationProfessor of Economics, at the New York University LeonardN. Stern School of Business for offering his expertise andinsight regarding Chow test analysis and data interpretation.We also would like to acknowledge Gary King, Ph.D., AlbertJ. Weatherhead III University Professor and Director of theInstitute for Quantitative Social Science at Harvard Uni-versity, Department of Government.
Disclosure Statement
Drs. Wells, Hamar, Gandy, Coberley, Rula, and Pope, andMr. Sidney are employed by Healthways, Inc., a provider ofpopulation health management programs. Dr. Bradley andMs. Harrison were employed by Healthways, Inc. at the timeof manuscript development. Neither Dr. Bradley nor Ms.Harrison disclosed a potential conflict of interest.
References
1. Disease Management Association of America. OutcomesGuidelines Report. Vol 4. Washington, DC: DMAA; 2009.
2. Disease Management Association of America. OutcomesGuidelines Report. Vol 3. Washington, DC: DMAA; 2008.
3. King G, Nielsen R, Coberley C, Pope JE, Wells A. Avoidingrandomization failure in program evaluation, with applica-tion to the Medicare Health Support program. Popul HealthManag 2011;14:S11–S22.
4. Atherly A, Thorpe KE. Analysis of the treatment effect ofHealthways’ Medicare Health Support phase 1 pilot onMedicare costs. Popul Health Manag 2011;14:S23–S28.
5. Stel VS, Zoccali C, Dekker FW, Jager KJ. The randomizedcontrolled trial. Nephron Clin Pract 2009;113:c337–c342.
6. Sirey JA, Bruce ML, Kales HC. Improving antidepressantadherence and depression outcomes in primary care: Thetreatment initiation and participation (TIP) program. Am JGeriatr Psychiatry 2010;18:554–562.
7. Lorig K, Ritter PL, Laurent DD, et al. On-line diabetes self-management program: A randomized study. Diabetes Care2010;33:1275–1281.
8. Ellis JL, Bayliss EA, Totsch J, Steiner JF. C-B2-01: Disease andcare management for multimorbid patients in an integratedsystem: How much is too much? Clin Med Res 2010;8:44.
9. Sawamura K, Ito H, Koyama A, Tajima M, Higuchi T. Theeffect of an educational leaflet on depressive patients’ atti-tudes toward treatment. Psychiatry Res 2010;177:184–187.
10. Patel DN, Lambert EV, da Silva R, et al. The associationbetween medical costs and participation in the vitality healthpromotion program among 948,974 members of a SouthAfrican health insurance company. Am J Health Promot2010;24:199–204.
11. Mudge A, Denaro C, Scott I, Bennett C, Hickey A, Jones MA.The paradox of readmission: Effect of a quality improve-ment program in hospitalized patients with heart failure. JHosp Med 2010;5:148–153.
12. Ramalho de Oliveira D, Brummel AR, Miller DB. Medicationtherapy management: 10 years of experience in a large in-tegrated health care system. J Manag Care Pharm 2010;16:185–195.
13. Iacus S, King G, Porro G. cem: Software for coarsened exactmatching. J Stat Software 2009;30:1- = 26.
14. Greene W. Econometric Analysis. 5th ed. Upper Saddle River:Prentice Hall; 2003.
15. Maddala G. Introduction to Econometrics. 3rd ed. New York:John Wiley & Sons; 2001.
16. Gujarati D. Basic Econometrics. 4th ed. Boston, MA: McGraw-Hill; 2003.
17. Iacus S, King G, Porro G. Causal inference without balancechecking: Coarsened exact matching. Pol Analysis 2012;20:1- = 24.
18. Iacus S, King G, Porro G. Multivariate matching methodsthat are monotonic imbalance bounding. J Am Stat Assn2011;106:345- = 361.
19. Hirano K, Imbens G. Estimation of causal effects usingpropensity score weighting: An application to data on rightheart catheterization. Health Serv Outcomes Res Methodol2001;2:259–278.
20. Lipkovic I, Adams D, Mallinckrodt C. Evaluating dose responsefrom flexible dose clinical trials. BMC Psychiatry 2008;8:1–9.
21. Allen-Ramey FC, Duong PT, Goodman DC, et al. Treatmenteffectiveness of inhaled corticosteroids and leukotrienemodifiers for patients with asthma: An analysis from man-aged care data. Allergy Asthma Proc 2003;24:43–51.
10 WELLS ET AL.

22. Perkins SM, Tu W, Underhill MG, Zhou XH, Murray MD.The use of propensity scores in pharmacoepidemiologic re-search. Pharmacoepidemiol Drug Saf 2000;9:93–101.
23. Shepardson LB, Youngner SJ, Speroff T, Rosenthal GE. In-creased risk of death in patients with do-not-resuscitate or-ders. Med Care 1999;37:727–737.
24. D’Agostino RB Jr. Tutorial in biostatistics: Propensity scoremethods for bias reduction in the comparison of a treatment to anon-randomized control group. Stat Med 1998;17:2265–2281.
25. Brandt S, Gale S, Tager IB. Estimated effect of asthma casemanagement using propensity score methods. Am J ManagCare 2010;16:257–264.
26. Bergstralh E, Kosanke J. Computerized Matching of Controls.Rochester, MN: Mayo Foundation; 1995. Technical Report 56.
27. Mattke S, Serxner SA, Zakowski SL, Jain AK, Gold DB.Impact of 2 employer-sponsored population health man-agement programs on medical care cost and utilization. AmJ Manag Care 2009;15:113–120.
Address correspondence to:Aaron R. Wells, Ph.D.
Center for Health ResearchHealthways, Inc.
701 Cool Springs Blvd.Franklin, TN 37067
E-mail: [email protected]
EXPLORING CCM EVALUATION METHODOLOGY 11