
Monitoring a flood event in a densely instrumented catchment, the Upper Eden, Cumbria, UK
10
Monitoring a flood event in a densely instrumented catchment, the Upper Eden, Cumbria, UK W. M. Mayes, C. L. Walsh, J. C. Bathurst, C. G. Kilsby, P. F. Quinn, M. E. Wilkinson, A. J. Daugherty & P. E. O’Connell School of Civil Engineering and Geosciences, University of Newcastle upon Tyne, UK Keywords catchment hydrology; CHASM; flood; catchment management; rainfall; scale effects. Correspondence C. L. Walsh, Newcastle University, Newcastle, UK. Email: [email protected] doi:10.1111/j.1747-6593.2005.00006.x Abstract Multi-day rainfall events appear to be an important cause of recent flooding in the UK. Hydrological data from an extensive, nested hydrometric network in the unregulated, predominantly rural Upper Eden catchment in northern England are presented for one such flood event. These highlight antecedent catchment conditions and the propagation of the multi-day flood event during February 2004. An assessment of flood response is provided over varying scales and land use between the upland Gais Gill catchment (1.1 km 2 ) and the larger Upper Eden catchment (616 km 2 ). Large spatial variations in rainfall totals are identified from a dense raingauge network during the flood event and are principally related to catchment elevation. High cumulative rainfall totals for the 6-day event, particularly at upland sites appear to be the exceptional feature of the flood event with return periods in the order of 100 years at some upland gauges. Resultant patterns of flood attenuation and translation are quantified in different areas of the catchment, highlighting the flashy response of the headwater catchments and the attenuated downstream response in the lowland environment. The study forms part of the national Catchment Hydrology And Sustainable Management (CHASM) programme. Introduction There is an estimated d220 billion worth of property and d7 billion worth of agricultural land located within po- tential flood risk areas in the UK (Ministry of Agriculture, Fisheries and Food 2001; Purnell 2002). Although recent investment by the UK government in flood and coastal defence is claimed to have reduced potential average annual losses from d3.5 billion to d0.8 billion (Purnell 2002), large areas of land and riparian settlements remain at risk from flood events. Recent projections suggest that average annual losses from flood damage could increase to up to d27 billion in the 2080s under a worst-case climate change scenario and unchanged government flood management policy and expenditure (Office of Science and Technology 2004). The intensity and duration of multi-day rainfall events are one of the principal controls on flood severity in the UK. Detailed monitoring and analysis of the development and response of such events from plot scale (o100 m 2 ) to catchment scale can aid the construction of the predictive tools (e.g. hydrological computer models) which under- pin the formulation of sustainable integrated land use and flood management strategies. The data presented here represent one such event for a densely instrumented catchment in northern England during early February 2004. The 322 km 2 Upper Eden catchment in Cumbria (above Appleby-in-Westmorland) is one of the four ex- perimental catchments in the UK Catchment Hydrology And Sustainable Management (CHASM) catchment hy- drology initiative (O’Connell 2003) (www.ncl.ac.uk/ chasm). The CHASM initiative endeavours to investigate many of the fundamental issues in catchment hydrology and management (e.g. land use, flooding, abstractions, water quality and ecology) and to bridge the gap between plot scale and meso-scale (100s of km 2 ) catchment re- sponse, using nested multi-scale monitoring networks. The ‘scale problem’ has been identified by many observers as a major unresolved issue in hydrology (National Re- search Council 1991; Newson 1994; Bl ¨ oschl & Sivapalan 1995; Sivapalan & Kalma 1995; Archer 2003). Catchment experiments are predominantly undertaken at a small scale (o10 km 2 ) but only limited aspects of the hydro- logical understandings obtained can be transferred to the larger scales at which river basin management is conducted. The multi-scale, dense network therefore provides an unusually detailed record of the development and progression of a flood sequence in a catchment. In Water and Environment Journal 20 (2006) 217–226 c 2006 The Authors. Journal compilation c 2006 CIWEM. 217 Water and Environment Journal. Print ISSN 1747-6585
Transcript of Monitoring a flood event in a densely instrumented catchment, the Upper Eden, Cumbria, UK

Monitoring a flood event in a densely instrumented catchment,the Upper Eden, Cumbria, UK
W. M. Mayes, C. L. Walsh, J. C. Bathurst, C. G. Kilsby, P. F. Quinn, M. E. Wilkinson, A. J. Daugherty & P. E. O’Connell
School of Civil Engineering and Geosciences, University of Newcastle upon Tyne, UK
Keywords
catchment hydrology; CHASM; flood;
catchment management; rainfall; scale effects.
Correspondence
C. L. Walsh, Newcastle University, Newcastle,
UK. Email: [email protected]
doi:10.1111/j.1747-6593.2005.00006.x
Abstract
Multi-day rainfall events appear to be an important cause of recent flooding in
the UK. Hydrological data from an extensive, nested hydrometric network in
the unregulated, predominantly rural Upper Eden catchment in northern
England are presented for one such flood event. These highlight antecedent
catchment conditions and the propagation of the multi-day flood event during
February 2004. An assessment of flood response is provided over varying scales
and land use between the upland Gais Gill catchment (1.1 km2) and the larger
Upper Eden catchment (616 km2). Large spatial variations in rainfall totals are
identified from a dense raingauge network during the flood event and are
principally related to catchment elevation. High cumulative rainfall totals for
the 6-day event, particularly at upland sites appear to be the exceptional
feature of the flood event with return periods in the order of 100 years at some
upland gauges. Resultant patterns of flood attenuation and translation are
quantified in different areas of the catchment, highlighting the flashy response
of the headwater catchments and the attenuated downstream response in the
lowland environment. The study forms part of the national Catchment
Hydrology And Sustainable Management (CHASM) programme.
Introduction
There is an estimated d220 billion worth of property and
d7 billion worth of agricultural land located within po-
tential flood risk areas in the UK (Ministry of Agriculture,
Fisheries and Food 2001; Purnell 2002). Although recent
investment by the UK government in flood and coastal
defence is claimed to have reduced potential average
annual losses from d3.5 billion to d0.8 billion (Purnell
2002), large areas of land and riparian settlements remain
at risk from flood events. Recent projections suggest that
average annual losses from flood damage could increase
to up to d27 billion in the 2080s under a worst-case
climate change scenario and unchanged government
flood management policy and expenditure (Office of
Science and Technology 2004).
The intensity and duration of multi-day rainfall events
are one of the principal controls on flood severity in the
UK. Detailed monitoring and analysis of the development
and response of such events from plot scale (o100 m2) to
catchment scale can aid the construction of the predictive
tools (e.g. hydrological computer models) which under-
pin the formulation of sustainable integrated land use and
flood management strategies. The data presented here
represent one such event for a densely instrumented
catchment in northern England during early February
2004. The 322 km2 Upper Eden catchment in Cumbria
(above Appleby-in-Westmorland) is one of the four ex-
perimental catchments in the UK Catchment Hydrology
And Sustainable Management (CHASM) catchment hy-
drology initiative (O’Connell 2003) (www.ncl.ac.uk/
chasm). The CHASM initiative endeavours to investigate
many of the fundamental issues in catchment hydrology
and management (e.g. land use, flooding, abstractions,
water quality and ecology) and to bridge the gap between
plot scale and meso-scale (100s of km2) catchment re-
sponse, using nested multi-scale monitoring networks.
The ‘scale problem’ has been identified by many observers
as a major unresolved issue in hydrology (National Re-
search Council 1991; Newson 1994; Bloschl & Sivapalan
1995; Sivapalan & Kalma 1995; Archer 2003). Catchment
experiments are predominantly undertaken at a small
scale (o10 km2) but only limited aspects of the hydro-
logical understandings obtained can be transferred to
the larger scales at which river basin management is
conducted. The multi-scale, dense network therefore
provides an unusually detailed record of the development
and progression of a flood sequence in a catchment. In
Water and Environment Journal 20 (2006) 217–226 c� 2006 The Authors. Journal compilation c� 2006 CIWEM. 217
Water and Environment Journal. Print ISSN 1747-6585
addition, the longer term findings of the CHASM initia-
tive will inform future sustainable river basin manage-
ment, through improved knowledge of catchment
processes, response and anthropogenic impact.
Integrated data from an extensive network of hydro-
metric equipment in the catchment (including river
gauges, raingauges, automatic weather stations, soil moist-
ure probes) are presented to describe: (1) the antecedent
catchment conditions leading up to the flood event from
the previous autumn, (2) the catchment response over
varying scales up to around the 600 km2 basin size during
the event and (3) variations in response between areas of
different land use within the catchment. The flood event,
which spanned 6 days from 30 January 2004, caused
widespread flooding of lowland farmland in the study
catchment and of the downstream riparian city of Carlisle.
More recent severe flooding in the catchment in January
2005 has further highlighted the flood risk issue in the
catchment and the need for an improved understanding of
the mechanisms controlling the development and propa-
gation of flood waves through the basin.
Study site
The Eden catchment covers an area of 2288 km2 to its
outlet via the Solway Firth to the Irish Sea, draining parts
of the Lake District and Pennine Hills of northern Eng-
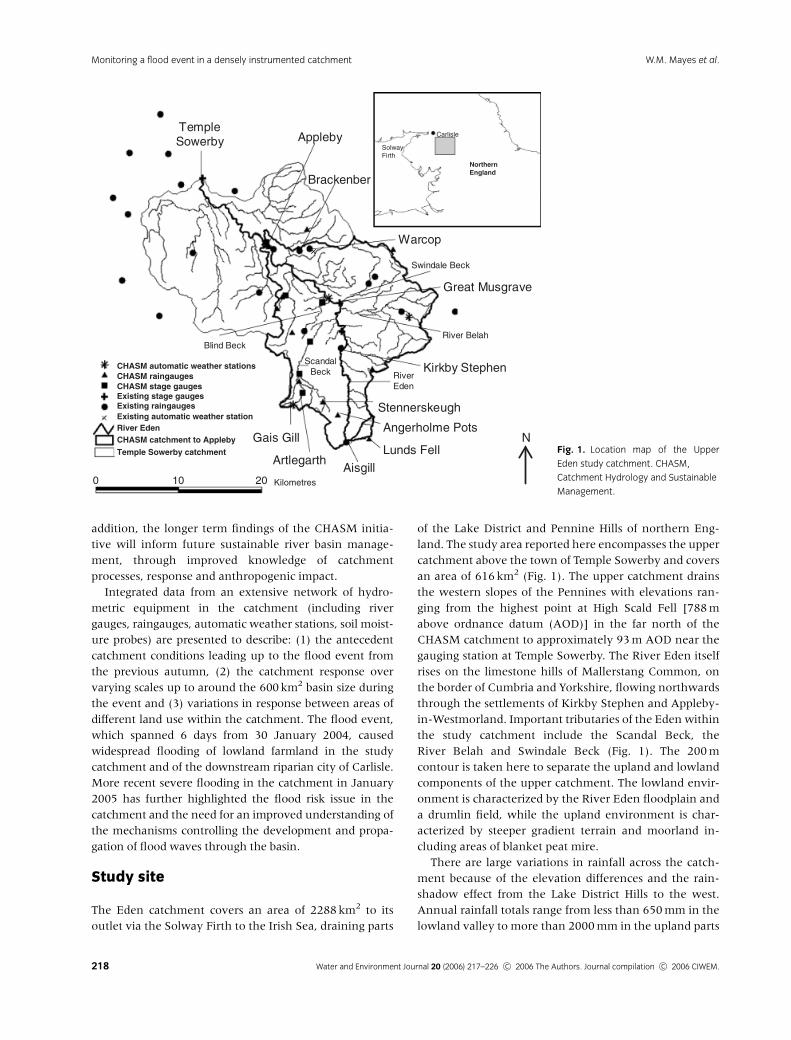
land. The study area reported here encompasses the upper
catchment above the town of Temple Sowerby and covers
an area of 616 km2 (Fig. 1). The upper catchment drains
the western slopes of the Pennines with elevations ran-
ging from the highest point at High Scald Fell [788 m
above ordnance datum (AOD)] in the far north of the
CHASM catchment to approximately 93 m AOD near the
gauging station at Temple Sowerby. The River Eden itself
rises on the limestone hills of Mallerstang Common, on
the border of Cumbria and Yorkshire, flowing northwards
through the settlements of Kirkby Stephen and Appleby-
in-Westmorland. Important tributaries of the Eden within
the study catchment include the Scandal Beck, the
River Belah and Swindale Beck (Fig. 1). The 200 m
contour is taken here to separate the upland and lowland
components of the upper catchment. The lowland envir-
onment is characterized by the River Eden floodplain and
a drumlin field, while the upland environment is char-
acterized by steeper gradient terrain and moorland in-
cluding areas of blanket peat mire.
There are large variations in rainfall across the catch-
ment because of the elevation differences and the rain-
shadow effect from the Lake District Hills to the west.
Annual rainfall totals range from less than 650 mm in the
lowland valley to more than 2000 mm in the upland parts
Appleby
Brackenber
Great Musgrave
Kirkby Stephen
Lunds Fell
Aisgill
Stennerskeugh
Angerholme Pots
Artlegarth
Scandal Beck River
Eden
River Belah
Swindale Beck
TempleSowerby
Blind Beck
Warcop×
CHASM automatic weather stationsCHASM raingaugesCHASM stage gaugesExisting stage gaugesExisting raingaugesExisting automatic weather stationRiver EdenCHASM catchment to Appleby Gais GillTemple Sowerby catchment
Kilometres
N
0 2010
Fig. 1. Location map of the Upper
Eden study catchment. CHASM,
Catchment Hydrology and Sustainable
Management.
Water and Environment Journal 20 (2006) 217–226 c� 2006 The Authors. Journal compilation c� 2006 CIWEM.218
Monitoring a flood event in a densely instrumented catchment W.M. Mayes et al.

of the catchment. Runoff is controlled by differences in
topography and geology, with flashy runoff and small
ephemeral streams characterizing the uplands where
there are steep slopes and little soil cover, and greater
groundwater contributions from the lowland limestone
and sandstone aquifers. Livestock farming is the domi-
nant land use in the catchment, particularly in the low-
land areas, while upland land use is dominated by lower
intensity livestock farming, with rough pasture and some
forestry.
Snow cover in the catchment can be significant during
the winter months and snowmelt, especially when
combined with heavy rain, can lead to flooding. The
Eden catchment as a whole has five formal flood warn-
ing zones, as well as flood alleviation schemes at
Appleby and downstream at Carlisle, highlighting the
importance of flood risk in the catchment. Important
recent floods in the catchment occurred in 1968 and
2005 severely affecting settlements from Appleby to
Carlisle, while less severe events affected the Eden Valley
in 1997, 1998 and 2000.
Extensive hydrometric instrumentation of the Upper
Eden catchment was carried out between 2002 and 2004
as part of the CHASM catchment hydrology initiative,
supplementing existing Environment Agency (EA) dis-
charge gauges (at three locations) and raingauges (at nine
locations). Eight stage gauges within nested catchments
monitor river levels in contrasting areas of land use (up-
land and lowland) at scales from micro-catchment
(1 km2), through mini-catchment (10 km2), up to meso-
scale (100 km2) as outlined in Fig. 1. Data from Gais Gill
(catchment area 1.1 km2), Artlegarth House on Artlegarth
Beck (2.7 km2), Smardale on Scandal Beck (36.6 km2)
and Blind Beck (9.2 km2) are presented here along
with data from the existing EA stations. All stage and
discharge gauges record at 15 min intervals. The Gais Gill,
Artlegarth House, Smardale and Blind Beck gauging
stations have been rated with current meter gauging by
wading, while the existing EA stations at Kirkby Stephen
(69.4 km2), Great Musgrave (222.5 km2) and Temple
Sowerby (616.4 km2) sites have been rated with current
meter gauging via wading and suspension cable.
A network of 11 event-recording tipping-bucket rain-
gauges across the catchment at a range of elevations (from
155 m AOD at Great Musgrave to 650 m AOD at Lunds
Fell) supplements the existing EA Eden raingauge net-
work (Fig. 1). This existing network comprises nine rain-
gauges covering a range of elevations (from 148 m AOD at
Appleby to 360 m at Aisgill) and recording at various time
frequencies from event to daily. Multi-parameter data
(including air temperature, relative humidity, wind speed
and direction and net radiation) from automatic
weather stations (AWS) at Gais Gill and Great Musgrave
provide meteorological data for calculating evapo-tran-
spiration.
Further hydrometric monitoring within the catchment
includes groundwater monitoring at three sites, the focus
of which consists of over 15 paired drift and sandstone
boreholes assessing river–aquifer interactions on the Riv-
er Eden at Great Musgrave. Additionally, soil moisture
and soil water table regime data are obtained from a series
of multi-level, shallow, water table piezometers (o2 m
depth) with 15 min recording pressure transducers
and soil moisture probes (Delta-T MLX Theta Probes,
Cambridge, UK). This instrumentation is concentrated
within a plot-scale (o100 m2) sampling design at three
hillslope and one floodplain location at Great Musgrave.
A series of nested multi-level piezometers at Gais Gill also
provide soil water table regime data from the upland
micro-catchment. The density of instrumentation is (gen-
erally) unequalled at this scale of catchment in the UK.
Results and discussion
Temporal context of the flood event
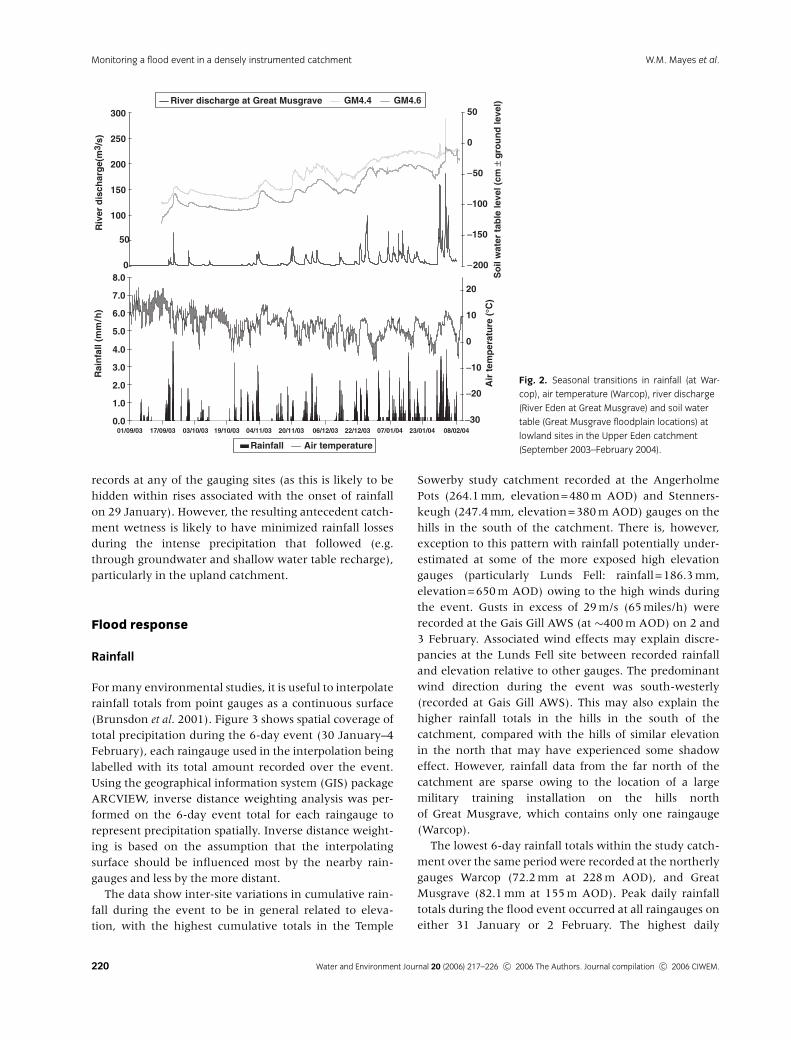
Figure 2 shows the fluctuations in rainfall, stream dis-
charge and soil water table levels in the lowland environ-
ment around the Great Musgrave site from the end of
summer 2003 to February 2004. The dry summer that
affected much of England during 2003 is apparent in the
low rainfall totals and baseflow-dominated regime for the
River Eden in September and October 2003, with isolated
storm events leading to rapid rise and recession of river
levels (e.g. 22/9, 4/11). Towards the end of 2003, the
frequency of storm events increases with several events
peaking around 20–100 m3/s at Great Musgrave in late
December to early January 2004. This seasonal transition
is particularly pronounced in the soil water table records
from floodplain locations at Great Musgrave. A general
rise in water levels in excess of 1 m is apparent between
September 2003 and January 2004. This recovery from
intense summer drawdown in soil water table levels
continues at the Great Musgrave floodplain locations up
to the overland flow conditions that occur during the
flood event.
Field observations during the week preceding the flood
event recorded moderate snow fall on 28 and 29 January,
with a light covering (o5 cm) of snow above �450 m
AOD, thawing on 30 January. These field observations are
corroborated in part by air temperature records (Fig. 2),
which show a rapid rise from daytime temperatures as
low as � 4.3 1C on 28 January up to daytime tempera-
tures in excess of 10 1C on 31 January during the second
band of intense rainfall at the Gais Gill upland catchment.
No clear signal of snowmelt can be seen within discharge
Water and Environment Journal 20 (2006) 217–226 c� 2006 The Authors. Journal compilation c� 2006 CIWEM. 219
Monitoring a flood event in a densely instrumented catchmentW.M. Mayes et al.
records at any of the gauging sites (as this is likely to be
hidden within rises associated with the onset of rainfall
on 29 January). However, the resulting antecedent catch-
ment wetness is likely to have minimized rainfall losses
during the intense precipitation that followed (e.g.
through groundwater and shallow water table recharge),
particularly in the upland catchment.
Flood response
Rainfall
For many environmental studies, it is useful to interpolate
rainfall totals from point gauges as a continuous surface
(Brunsdon et al. 2001). Figure 3 shows spatial coverage of
total precipitation during the 6-day event (30 January–4
February), each raingauge used in the interpolation being
labelled with its total amount recorded over the event.
Using the geographical information system (GIS) package
ARCVIEW, inverse distance weighting analysis was per-
formed on the 6-day event total for each raingauge to
represent precipitation spatially. Inverse distance weight-
ing is based on the assumption that the interpolating
surface should be influenced most by the nearby rain-
gauges and less by the more distant.
The data show inter-site variations in cumulative rain-
fall during the event to be in general related to eleva-
tion, with the highest cumulative totals in the Temple
Sowerby study catchment recorded at the Angerholme
Pots (264.1 mm, elevation=480 m AOD) and Stenners-
keugh (247.4 mm, elevation=380 m AOD) gauges on the
hills in the south of the catchment. There is, however,
exception to this pattern with rainfall potentially under-
estimated at some of the more exposed high elevation
gauges (particularly Lunds Fell: rainfall=186.3 mm,
elevation=650 m AOD) owing to the high winds during
the event. Gusts in excess of 29 m/s (65 miles/h) were
recorded at the Gais Gill AWS (at �400 m AOD) on 2 and
3 February. Associated wind effects may explain discre-
pancies at the Lunds Fell site between recorded rainfall
and elevation relative to other gauges. The predominant
wind direction during the event was south-westerly
(recorded at Gais Gill AWS). This may also explain the
higher rainfall totals in the hills in the south of the
catchment, compared with the hills of similar elevation
in the north that may have experienced some shadow
effect. However, rainfall data from the far north of the
catchment are sparse owing to the location of a large
military training installation on the hills north
of Great Musgrave, which contains only one raingauge
(Warcop).
The lowest 6-day rainfall totals within the study catch-
ment over the same period were recorded at the northerly
gauges Warcop (72.2 mm at 228 m AOD), and Great
Musgrave (82.1 mm at 155 m AOD). Peak daily rainfall
totals during the flood event occurred at all raingauges on
either 31 January or 2 February. The highest daily
0
50
100
150
200
250
300
Riv
er d
isch
arg
e(m
3 /s)
−200
−150
−100
−50
0
50
So
il w
ater
tab
le le
vel (
cm ±
gro
un
d le
vel)River discharge at Great Musgrave GM4.4 GM4.6
0.0
1.0
2.0
3.0
4.0
5.0
6.0
7.0
8.0
Rai
nfa
ll (m
m/h
)
−30
−20
−10
0
10
20
Air
tem
per
atu
re (
°C)
Rainfall Air temperature
Fig. 2. Seasonal transitions in rainfall (at War-
cop), air temperature (Warcop), river discharge
(River Eden at Great Musgrave) and soil water
table (Great Musgrave floodplain locations) at
lowland sites in the Upper Eden catchment
(September 2003–February 2004).
Water and Environment Journal 20 (2006) 217–226 c� 2006 The Authors. Journal compilation c� 2006 CIWEM.220
Monitoring a flood event in a densely instrumented catchment W.M. Mayes et al.

(midnight to midnight) totals recorded were again at the
high elevation raingauges in the south of the catchment
at Stennerskeugh (71.9 mm on 2 February) and Anger-
holme Pots (69.6 mm on 2 February). Peak daily rainfall
totals at the lowland raingauges Appleby Mill Hill
(22.9 mm on 31 January) and Brackenber (23.6 mm on
31 January) again highlight the variation in rainfall with
elevation across the catchment.
Data from the dense network of raingauges in the Upper
Eden catchment over this particular multi-day rainfall
event highlight the spatial heterogeneity in rainfall over a
relatively small catchment area. The differences between
cumulative 6-day totals in lowland and upland areas (low-
est value=27.3% of the highest value), and in peak daily
intensities recorded, underlines the necessity for consid-
eration of locations across the full altitudinal range in a
catchment during the installation of raingauge networks.
Table 1 presents return periods [using the Flood Estima-
tion Handbook (Institute of Hydrology 1999)] at selected
raingauges for the both peak daily rainfall and cumulative
totals over the 6-day event. At the high elevation upland
gauges in the south of the catchment (Stennerskeugh and
Angerholme Pots), peak daily rainfall totals recorded on 2
February are of a 4.6–7.4 year return period. At more
sheltered and lower elevation gauges (Gais Gill and Great
Musgrave, respectively), the daily rainfall totals are even
less significant, having a return period of only around 1
year. It is only when cumulative rainfall totals over the 6-
day event are considered that the magnitude of the event
becomes more apparent. Return periods for the 6-day
totals at Angerholme Pots and Stennerskeugh are in excess
of 100 years. Calculated catchment average rainfall values
reinforce the magnitude of the cumulative event, particu-
larly in the uplands, with return periods of 35, 23 and 13
years, respectively, for the Kirkby Stephen, Great Mus-
grave and Temple Sowerby catchments. Multi-day rainfall
events are considered to be an important cause of recent
severe flooding in the UK (Fowler & Kilsby 2003) and it
appears that it is the consecutive days of intense rainfall,
rather than the intensity of individual events that provide
the exceptional feature of this flood event.
Runoff
Figure 4 contrasts the catchment response at the upland
micro-catchment (Gais Gill: Fig. 4a) and lowland mini-
catchment (Blind Beck: Fig. 4b). Comparison is limited to
these micro- and mini-scales as the upland mini-catch-
ment gauge at Ravenstonedale was destroyed by the
floods. The data show preceding discharge at both sites to
be very low and baseflow-dominated. Rainfall is seen to
commence on 29 January, with five distinct peaks of
intense rainfall (with over 2 mm/h of rainfall) passing
over the 7 days to 4 February. The upland micro-catch-
ment exhibits a flashy response, as might be expected for
the steep terrain and largely thin soils, with peak dis-
charge recorded within 4 h of the peak rainfall. The peak-
to-peak lag times for the different flood pulses are seen to
0 10 20 Kilometres
65−100100−125125−150150−200200−300No data
RaingaugesSix-day rainfall total (mm)
65
123 64
72
10058
98
169
229
117 86 7280
13897146
83
8888
84
153127 119
126
175 151
174 247
264 222186
N
66
Fig. 3. Spatial representation of the 6-day precipitation totals for the
Temple Sowerby catchment using inverse distance weighting technique.
Labels indicate the 6-day total for each gauge.
Table 1 Estimated return periods using the Flood Estimation Handbook for daily and 6-day rainfall at selected gauges during the event
Gauge (elevation: m AOD) 6-day total (mm) Return period (years) 1-day maximum (mm) Return period (years)
Great Musgrave (155) 82.1 2.6 25.7 1.0
Gais Gill (400) 174.1 13.4 42.9 1.2
Stennerskeugh (380) 247.4 116 71.9 7.4
Angerholme Pots (480) 264.1 102 69.6 4.6
Catchment average rainfall
Kirkby Stephen 182.5 35 59.2 5.2
Great Musgrave 145.5 23.2 45.0 2.8
Temple Sowerby 118.8 12.9 38.0 2.4
Water and Environment Journal 20 (2006) 217–226 c� 2006 The Authors. Journal compilation c� 2006 CIWEM. 221
Monitoring a flood event in a densely instrumented catchmentW.M. Mayes et al.

differ markedly for the different flood pulses during the
event. A lag time as short as 15 min was recorded for the
high intensity peak rainfall pulse on 3 February, while
longer lag times of 3:45–4:00 (hr:min) were recorded for
the more isolated, lower intensity rainfall pulses on 1 and
4 February. Flow in the Gais Gill catchment typically
returns to a condition close to pre-flood baseflow between
each rainfall pulse from the second to fifth pulse, high-
lighting the rapid transmission of flow through the catch-
ment.
In contrast to the flashy response in the upland catch-
ment, Blind Beck exhibits the response typical of a low-
land catchment. Figure 4(b) illustrates a more attenuated
response as the lower gradient terrain and deeper soils
lead to a longer travel time of floodwaters through the
catchment. Flow is not observed to return to pre-storm
baseflow conditions in between rainfall pulses, with
much more gradual recession in flows after flood peaks
compared with the Gais Gill hydrograph. The gradual
recession in the Blind Beck hydrograph is particularly
pronounced over the 24 h following the final peak on 4
February. The lowland terrain in the Blind Beck catch-
ment, composed of the floodplain and drumlin field of the
Eden Valley and dominated by livestock farming, is prone
to flooding. Such storage and gradual rise and fall in
levels, typical of the lowland environment, is recorded in
the soil water table records at the adjacent Great Mus-
grave floodplain site (Fig. 4b). A gradual recession in
water table height toward pre-storm conditions is appar-
ent over the 5 days subsequent to the flood (e.g. piezo-
meters GM4.1 and GM4.8). The connection of the
floodplain piezometers to the River Eden is apparent in
the peaks in levels on 31 January and 3 February when
overbank flow occurred. In contrast, water table levels in
the upland catchment at Gais Gill show relatively rapid
drainage fitting with the flashy nature of the catchment.
Water table height in piezometers GGA2 and GGA5 are
seen to return to pre-flood condition within 24 h of the
final rainfall pulse on 4 February (see Fig. 4a). Peak
discharges at both Gais Gill and Blind Beck are seen to
occur on 3 February following a rainfall pulse less intense
than the peak-intensity rainfall pulse that occurred on 31
January. The increased saturation of the catchment fol-
lowing the initial three rainfall pulses is highlighted in the
lowland soil water table records at GM4.1 particularly and
this would have increased the proportion of incident
0
1
2
3
4
5
6
7
Rai
nfa
ll (m
m/h
)
0
2
4
6
8
10
12
14
Dis
char
ge
(cu
mec
s)
−10
−20
−30
−40
−50
−50
−100
−1−150
−200−60
0
010
20
30 50
Wat
er t
able
hei
gh
t (c
m ±
gro
un
d le
vel)Gais GillQ GGA2 GGA5
0
1
2
3
4
5
6
7
Rai
nfa
ll (m
m/h
)
0
2
4
6
8
10
12
14
Dis
char
ge
(m3
/s)
Wat
er t
able
hei
gh
t (c
m ±
gro
un
d le
vel)Blind Beck Q GM4.1 GM4.8(a) (b)
Fig. 4. (a) Flood response in the Gais Gill upland catchment, showing Gais Gill rainfall, discharge and selected piezometer records GGA2 and GGA5. (b)
Flood response in the Blind Beck lowland catchment, showing Great Musgrave rainfall, Blind Beck discharge and selected piezometer records from the
Great Musgrave floodplain (GM4.1 and GM4.8).
Water and Environment Journal 20 (2006) 217–226 c� 2006 The Authors. Journal compilation c� 2006 CIWEM.222
Monitoring a flood event in a densely instrumented catchment W.M. Mayes et al.

rainfall that contributed to runoff rather than recharge in
subsequent pulses.
Although the return periods of the peak discharge
values at the more recently installed sites cannot be
accurately defined (because of the restricted time series),
estimates of recurrence intervals from the long-term
River Eden gauges using the annual maximum series
(see Flood Estimation Handbook (Institute of Hydrology
1999) for method) with data records of over 14 years at
the Kirkby Stephen gauge, 30 years at Temple Sowerby
and 34 years at Great Corby near Carlisle, suggest an
increasing severity of event with catchment area. At the
Kirkby Stephen gauge, the return period was less than 2
years, at the catchment outlet at Temple Sowerby it was
roughly a 1 in 5-year event and approximately 45 km
downstream of the study catchment at Great Corby
(catchment area 1336.7 km2), the estimated recurrence
interval for the peak flow was in the region of a 1 in 10-
year event.
This increasing severity downstream may reflect the
greater influence of downstream tributaries (River Ea-
mont and River Lowther) which drain the higher eleva-
tion (up to 940 m AOD) Cumbrian Fells to the west of the
Upper Eden. Rainfall in the Upper Eden catchment may
have also experienced a rain-shadow effect from these
Fells, hence the reduced flood severity.
Scale effects
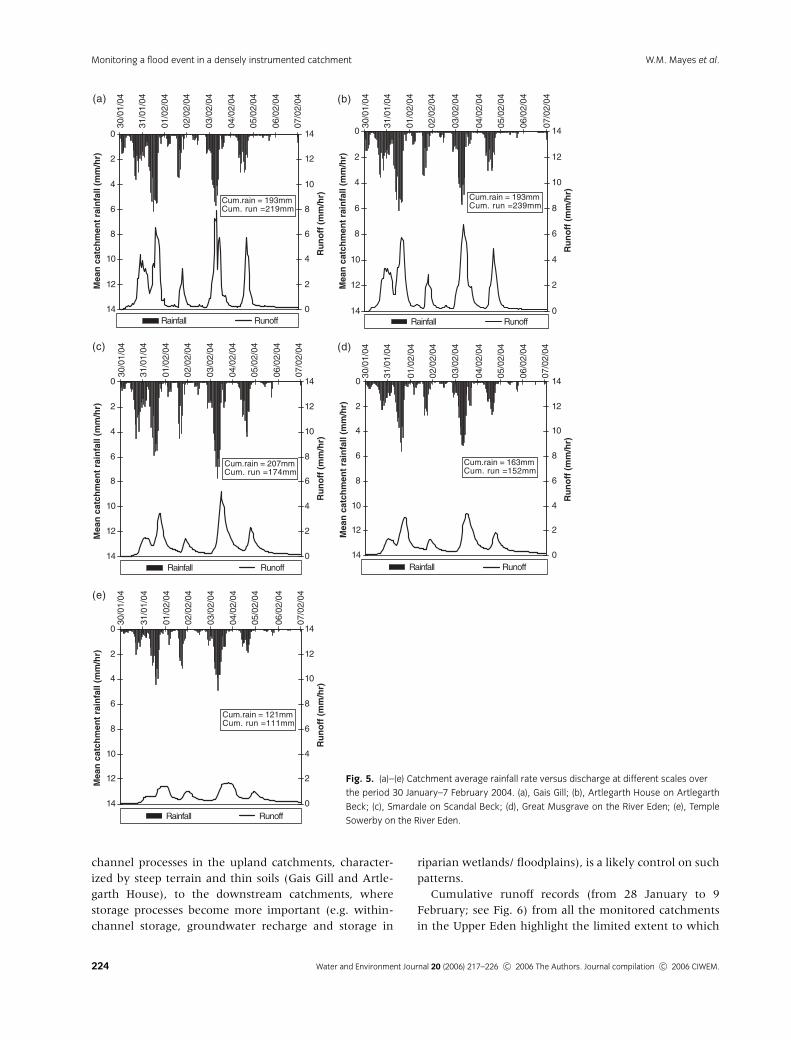
Figure 5(a)–(e) presents a comparison between catch-
ment average rainfall and runoff in a series of nested
catchments from the Gais Gill micro-catchment (area
1.08 km2) up to the catchment outlet at Temple Sowerby
(616.40 km2). Catchment average rainfall was calculated
by the Thiessen polygon approach (Thiessen 1911). Rain-
fall totals for the period 30 January 2004–7 February 2004
at each raingauge were weighted according to the frac-
tions of the catchment they contribute to. These contri-
buting fractions are determined through division of the
catchment into polygons by lines that are equidistant
between pairs of adjacent raingauges.
The resulting rainfall records reinforce the pattern of
increased rainfall with elevation identified in Fig. 3. The
upland catchments (Gais Gill, Artlegarth House) generally
show greater peak rainfall intensities relative to the low-
land locations (Great Musgrave and Temple Sowerby).
Interestingly, the catchment average rainfall for the Scan-
dal Beck catchment at Smardale exhibits peak rainfall
intensities greater than the Gais Gill and Artlegarth House
upland catchments. This is, however, a feature of the
extremely high intensity rainfall at the high elevation
Stennerskeugh gauge that lies outside the Gais Gill catch-
ment but within the catchment of an upland tributary to
the Scandal Beck, thus distorting the catchment average.
Runoff is calculated from the hourly stream discharge
records, which are converted into a total volume of water
expressed as a depth in millimetres over the individual
catchment area. The hydrographs display clear patterns of
attenuation with increasing scale (i.e. the peak runoff
values become less pronounced, but the flood peak takes
longer to travel through a particular location). Peak run-
off at Gais Gill reaches 6.0 mm/h during the largest flood
peak on 3 February, while at the catchment outlet at
Temple Sowerby, the runoff peak for the same pulse was
less than 2.0 mm/h. Translation of the flood peaks is also
clearly apparent in the hydrographs with downstream
propagation of the flood event. Average lag times for the
five flood pulses increase from 2:26 (h:min) at Gais Gill to
3:00 hours at Artlegarth house, 4:40 hours at Smardale,
5:34 hours at Great Musgrave, up to 10:10 hours at the
catchment outlet at Temple Sowerby.
Comparison of the rainfall and runoff totals in the
upstream catchments over the period 30 January 2004–
7 February 2004 shows the erroneous pattern of runoff
exceeding rainfall. Improvements to the calibration of the
rating curves at the upland catchments are a continuing
practice, which may overcome any potential overestima-
tion of runoff. However, the pattern is more likely a
feature of raingauge under-catch in such extreme events
and the limitation of deriving catchment average rainfall
from a solitary raingauge in the Gais Gill/Artlegarth
House catchments. Raingauge under-catch is a process
undergoing ongoing investigation in the Upper Eden with
the deployment of multiple rain and wind gauges along
elevation gradients in the upland catchments. Despite this
potential underestimation of catchment average rainfall,
clear patterns of flood peak attenuation and translation
with catchment scale are apparent downstream of the
upland catchments. Downstream of Artlegarth House,
runoff tends to remain above pre-storm baseflow condi-
tions for the duration of the 6-day event. This is a feature
of the gradient of recession curves after each flood pulse,
which becomes gentler as catchment size increases, so
that the recessions merge into the rising limb of the
subsequent pulse. Such patterns are consistent with the
physical transition in the catchments from the steep
terrain above Artlegarth House to the lowland environ-
ment that becomes more predominant below the settle-
ment of Ravenstonedale. During the period 30 January
2004–7 February 2004, cumulative runoff at the upland
Gais Gill and Artlegarth House catchments is effec-
tively 100% of rainfall, a percentage that diminishes
downstream to between 85 and 93% at Smardale, Great
Musgrave and Temple Sowerby. The shift from the
relatively high contribution of hillslope runoff-driven
Water and Environment Journal 20 (2006) 217–226 c� 2006 The Authors. Journal compilation c� 2006 CIWEM. 223
Monitoring a flood event in a densely instrumented catchmentW.M. Mayes et al.
channel processes in the upland catchments, character-
ized by steep terrain and thin soils (Gais Gill and Artle-
garth House), to the downstream catchments, where
storage processes become more important (e.g. within-
channel storage, groundwater recharge and storage in
riparian wetlands/ floodplains), is a likely control on such
patterns.
Cumulative runoff records (from 28 January to 9
February; see Fig. 6) from all the monitored catchments
in the Upper Eden highlight the limited extent to which
0
2
4
6
8
10
12
14 0
2
4
6
8
10
12
14
Rainfall Runoff
0
2
4
6
8
10
12
14 0
2
4
6
8
10
12
14
0
2
4
6
8
10
12
14 0
2
4
6
8
10
12
14 0
2
4
6
8
10
12
14 0
2
4
6
8
10
12
14
0
2
4
6
8
10
12
14 0
2
4
6
8
10
12
14
Cum.rain = 193mmCum. run =219mm
30/0
1/04
31/0
1/04
01/0
2/04
02/0
2/04
03/0
2/04
04/0
2/04
05/0
2/04
06/0
2/04
07/0
2/04
30/0
1/04
31/0
1/04
01/0
2/04
02/0
2/04
03/0
2/04
04/0
2/04
05/0
2/04
06/0
2/04
07/0
2/04
Mea
n c
atch
men
t ra
infa
ll (m
m/h
r)M
ean
cat
chm
ent
rain
fall
(mm
/hr)
Mea
n c
atch
men
t ra
infa
ll (m
m/h
r)
30/0
1/04
31/0
1/04
01/0
2/04
02/0
2/04
03/0
2/04
04/0
2/04
05/0
2/04
06/0
2/04
07/0
2/04
30/0
1/04
31/0
1/04
01/0
2/04
02/0
2/04
03/0
2/04
04/0
2/04
05/0
2/04
06/0
2/04
07/0
2/04
30/0
1/04
31/0
1/04
01/0
2/04
02/0
2/04
03/0
2/04
04/0
2/04
05/0
2/04
06/0
2/04
07/0
2/04
Mea
n c
atch
men
t ra
infa
ll (m
m/h
r)M
ean
cat
chm
ent
rain
fall
(mm
/hr)
Ru
no
ff (
mm
/hr)
Ru
no
ff (
mm
/hr)
Ru
no
ff (
mm
/hr)
Cum.rain = 193mmCum. run =239mm
Cum.rain = 163mmCum. run =152mm
Cum.rain = 207mmCum. run =174mm
Cum.rain = 121mmCum. run =111mm
Rainfall Runoff
Rainfall RunoffRainfall Runoff
Rainfall Runoff
Ru
no
ff (
mm
/hr)
Ru
no
ff (
mm
/hr)
(a) (b)
(d)(c)
(e)
Fig. 5. (a)–(e) Catchment average rainfall rate versus discharge at different scales over
the period 30 January–7 February 2004. (a), Gais Gill; (b), Artlegarth House on Artlegarth
Beck; (c), Smardale on Scandal Beck; (d), Great Musgrave on the River Eden; (e), Temple
Sowerby on the River Eden.
Water and Environment Journal 20 (2006) 217–226 c� 2006 The Authors. Journal compilation c� 2006 CIWEM.224
Monitoring a flood event in a densely instrumented catchment W.M. Mayes et al.
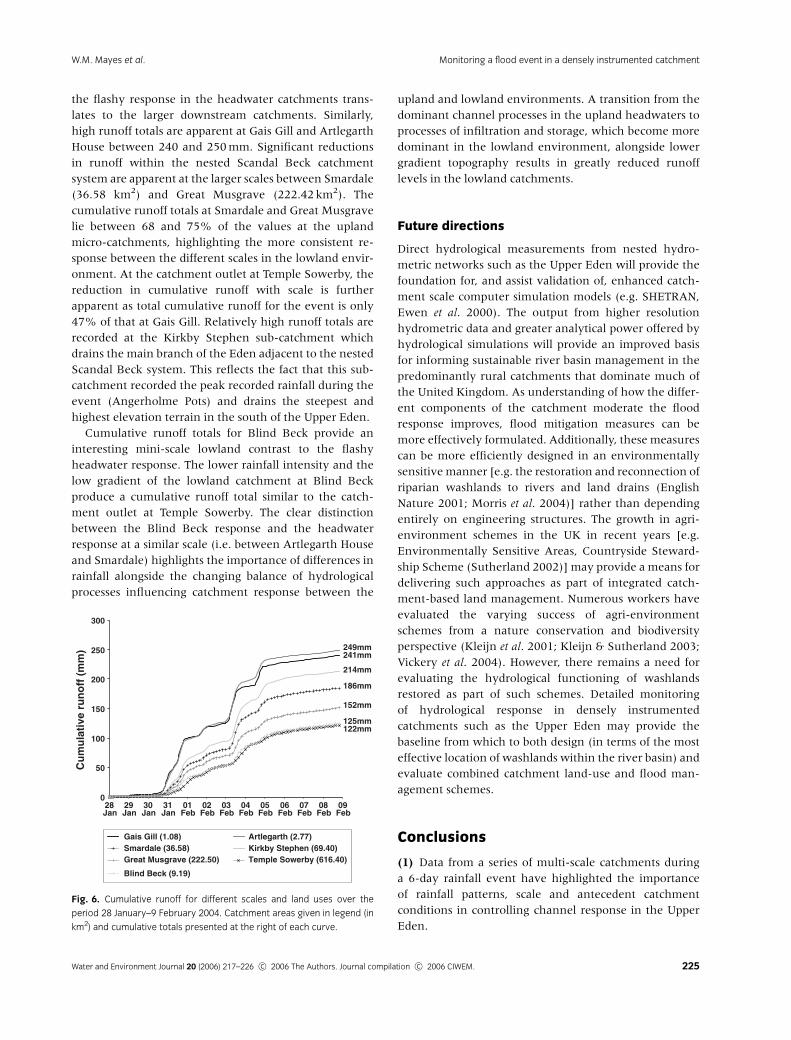
the flashy response in the headwater catchments trans-
lates to the larger downstream catchments. Similarly,
high runoff totals are apparent at Gais Gill and Artlegarth
House between 240 and 250 mm. Significant reductions
in runoff within the nested Scandal Beck catchment
system are apparent at the larger scales between Smardale
(36.58 km2) and Great Musgrave (222.42 km2). The
cumulative runoff totals at Smardale and Great Musgrave
lie between 68 and 75% of the values at the upland
micro-catchments, highlighting the more consistent re-
sponse between the different scales in the lowland envir-
onment. At the catchment outlet at Temple Sowerby, the
reduction in cumulative runoff with scale is further
apparent as total cumulative runoff for the event is only
47% of that at Gais Gill. Relatively high runoff totals are
recorded at the Kirkby Stephen sub-catchment which
drains the main branch of the Eden adjacent to the nested
Scandal Beck system. This reflects the fact that this sub-
catchment recorded the peak recorded rainfall during the
event (Angerholme Pots) and drains the steepest and
highest elevation terrain in the south of the Upper Eden.
Cumulative runoff totals for Blind Beck provide an
interesting mini-scale lowland contrast to the flashy
headwater response. The lower rainfall intensity and the
low gradient of the lowland catchment at Blind Beck
produce a cumulative runoff total similar to the catch-
ment outlet at Temple Sowerby. The clear distinction
between the Blind Beck response and the headwater
response at a similar scale (i.e. between Artlegarth House
and Smardale) highlights the importance of differences in
rainfall alongside the changing balance of hydrological
processes influencing catchment response between the
upland and lowland environments. A transition from the
dominant channel processes in the upland headwaters to
processes of infiltration and storage, which become more
dominant in the lowland environment, alongside lower
gradient topography results in greatly reduced runoff
levels in the lowland catchments.
Future directions
Direct hydrological measurements from nested hydro-
metric networks such as the Upper Eden will provide the
foundation for, and assist validation of, enhanced catch-
ment scale computer simulation models (e.g. SHETRAN,
Ewen et al. 2000). The output from higher resolution
hydrometric data and greater analytical power offered by
hydrological simulations will provide an improved basis
for informing sustainable river basin management in the
predominantly rural catchments that dominate much of
the United Kingdom. As understanding of how the differ-
ent components of the catchment moderate the flood
response improves, flood mitigation measures can be
more effectively formulated. Additionally, these measures
can be more efficiently designed in an environmentally
sensitive manner [e.g. the restoration and reconnection of
riparian washlands to rivers and land drains (English
Nature 2001; Morris et al. 2004)] rather than depending
entirely on engineering structures. The growth in agri-
environment schemes in the UK in recent years [e.g.
Environmentally Sensitive Areas, Countryside Steward-
ship Scheme (Sutherland 2002)] may provide a means for
delivering such approaches as part of integrated catch-
ment-based land management. Numerous workers have
evaluated the varying success of agri-environment
schemes from a nature conservation and biodiversity
perspective (Kleijn et al. 2001; Kleijn & Sutherland 2003;
Vickery et al. 2004). However, there remains a need for
evaluating the hydrological functioning of washlands
restored as part of such schemes. Detailed monitoring
of hydrological response in densely instrumented
catchments such as the Upper Eden may provide the
baseline from which to both design (in terms of the most
effective location of washlands within the river basin) and
evaluate combined catchment land-use and flood man-
agement schemes.
Conclusions
(1) Data from a series of multi-scale catchments during
a 6-day rainfall event have highlighted the importance
of rainfall patterns, scale and antecedent catchment
conditions in controlling channel response in the Upper
Eden.
0
50
100
150
200
250
300
28Jan
29Jan
30Jan
31Jan
01Feb
02Feb
03Feb
04Feb
05Feb
06Feb
07Feb
08Feb
09Feb
Cu
mu
lati
ve r
un
off
(m
m) 249mm
241mm
214mm
186mm
152mm
125mm122mm
Gais Gill (1.08) Artlegarth (2.77)Smardale (36.58) Kirkby Stephen (69.40)Great Musgrave (222.50) Temple Sowerby (616.40)
Blind Beck (9.19)
Fig. 6. Cumulative runoff for different scales and land uses over the
period 28 January–9 February 2004. Catchment areas given in legend (in
km2) and cumulative totals presented at the right of each curve.
Water and Environment Journal 20 (2006) 217–226 c� 2006 The Authors. Journal compilation c� 2006 CIWEM. 225
Monitoring a flood event in a densely instrumented catchmentW.M. Mayes et al.

(2) Rainfall totals during the 6-day event exceeded 13%
of the annual average totals in the upland environment.
The recorded cumulative rainfall at high elevation
gauges was over three times greater than at lowland
gauges.
(3) Return periods (in excess of 100 years for some
upland raingauges) for the 6-day event suggest that the
cumulative rainfall totals were the exceptional feature of
this flood event.
(4) Spatial disparities in rainfall were a major control
on channel response across the catchment, with up-
land headwaters exhibiting extremely flashy hydro-
graphs with per area runoff totals approximately two
times greater than in lowland catchments of a similar
scale.
(5) The flashy response indicative of the upland head-
waters was not seen to be transmitted far downstream to
the larger catchment scales. At basin sizes above�50 km2,
a more consistent response in terms of total runoff and lag
time was apparent as infiltration and storage processes
become more important.
(6) Further data from intermediate scales (�10 km2)
between the upland/lowland transition would be desir-
able to assess the changing influence of channel and
storage processes on catchment response at differing
scales. Future data from the expanding hydrometric net-
works in the CHASM experimental catchments offer
scope for such elucidation.
(7) The improved understanding of hydrological re-
sponse over a range of scales offered by densely instru-
mented river basins can be used to underpin sustainable
catchment management and land use strategies.
Acknowledgements
Jane Atkins at the Environment Agency (Penrith) is
thanked for supplying some of the rainfall and river flow
records. The CHASM project was funded by the Wellcome
Trust and administered by the Natural Environment
Research Council through the Joint Infrastructure Fund.
The many landowners of the Upper Eden who have
facilitated the installation and access to the extensive
network of instrumentation are also thanked.
References
Archer, D. (2003) Scale Effects on the Hydrological Impact of
Upland Afforestation and Drainage Using Indices of Flow
Variability: The River Irthing, England. Hydrol. Earth Syst.
Sci., 7, 325.
Bloschl, G. and Sivapalan, M. (1995) Scale Issues in Hydro-
logical Modelling: A Review. Hydrol. Proc., 9, 251.
Brunsdon, C., McClatchey, J. and Unwin, D.J. (2001) Spatial
Variations in the Average Rainfall–Altitude Relationship in
Great Britain: An Approach Using Geographically Weighted
Regression. Int. J. Climate, 21, 455.
English Nature (2001) Sustainable flood defence: the case for wash-
lands. English Nature Research Report 406. Peterborough.
Ewen, J., Parkin, G. and O’Connell, P.E. (2000) SHETRAN:
Distributed River Basin Flow and Transport Modelling
System. J. Hydrol. Eng., 5 (3), 250.
Fowler, H.J. and Kilsby, C.G. (2003) A Regional Frequency
Analysis of United Kingdom Extreme Rainfall from 1961 to
2000. Int. J. Climate, 23, 1313.
Institute of Hydrology (1999) Flood Estimation Handbook.
Volumes I–V. CEH, Wallingford, UK.
Kleijn, D. and Sutherland, W.J. (2003) How Effective are
European Agri-Environment Schemes in Conserving and
Promoting Biodiversity? J. Appl. Ecol., 40, 947.
Kleijn, D., Berendse, F., Smit, R. and Gilissen, N. (2001) Agri-
Environment Schemes do not Effectively Protect Biodiver-
sity in Dutch Agricultural Landscapes. Nature, 413 (6857),
723.
Ministry of Agriculture, Fisheries and Food (2001) Extension of
national appraisal of assets at risk from flooding and coastal
erosion. R&D Final Project Report.
Morris, J., Hess, T.M., Gowing, D.J., Leeds-Harrison, P.B.,
Wade, M. and Vivash, R.M. (2004) Integrated washland
management for flood defence and biodiversity. Report to DEFRA
and English Nature. Cranfield University at Silsoe,
Bedfordshire.
National Research Council (1991) Opportunities in Hydrologic
Sciences. Academy Press, Washington, DC.
Newson, M.D. (1994) Hydrology and the River Environment.
Oxford University Press, Oxford.
O’Connell, P.E. (2003) Catchment Scale Hydrological
Issues Relating to Land Use Management and River
Flows. ICE Conference on Land Use and Flood Management. ICE,
Westminster, London, UK.
Office of Science and Technology (2004) Future Flooding –
Executive Summary. Foresight Report for the OST.
Purnell, R. (2002) Flood Risk – A Government Perspective.
Proc. ICE, Civ. Eng., 150, 10.
Sivapalan, M. and Kalma, J.D. (1995) Scale Problems in
Hydrology: Contributions of the Robertson Workshop.
Hydrol. Proc., 9, 243.
Sutherland, W.J. (2002) Restoring a Sustainable Countryside.
Trends Ecol. Evol., 17 (3), 148.
Thiessen, A.H. (1911) Precipitation for Large Areas. Mon.
Weather Rev., 39, 1082.
Vickery, J.A., Bradbury, R.B., Henderson, I.G., Eaton, M.A.
and Grice, P.V. (2004) The Role of Agri-Environment
Schemes and Farm Management Practices in Reversing
the Decline of Farmland Birds in England. Biol. Conserv.,
119, 19.
Water and Environment Journal 20 (2006) 217–226 c� 2006 The Authors. Journal compilation c� 2006 CIWEM.226
Monitoring a flood event in a densely instrumented catchment W.M. Mayes et al.