Use of instrumented static load tests on deep foundations for ...
15
FMGM 2015 – PM Dight (ed.) © 2015 Australian Centre for Geomechanics, Perth, ISBN 978-0-9924810-2-5 FMGM 2015, Sydney, Australia 677 Use of instrumented static load tests on deep foundations for optimisation of geotechnical design WR Wood Fugro-Loadtest, USA J Sinnreich Fugro-Loadtest, USA AJ Simmonds Geokon Inc., USA Abstract The paper will describe through case history evidence of high and ultra-high capacity drilled shaft foundations how an integrated approach to site characterisation and site specific geotechnical design method calibration through full scale instrumented load tests will deliver significantly increased reliability and reduced cost of deep foundations for large capital infrastructure projects. Recent advances in ultra-high capacity load testing, in excess of 300 MN on a single shaft, when combined with comprehensive in situ strain and deflection monitoring, are allowing a new generation of large diameter foundations to be designed with confidence resulting in project benefits in terms of reduced construction times and cost. A case history from the US will be described to illustrate the key theme of the paper. The paper will also describe recent advances in the interpretation of strain gauge data obtained from underground concrete structures reviewing recently developed techniques for increasing confidence in the knowledge of section properties for the determination of load from such data. Improvements in the measurements of deflections particularly with respect to the provision of a stable reference datum will be examined. The paper will have direct application to all geotechnical engineers designing deep foundations helping to set the effective use of geomonitoring in the context of their primary responsibilities to manage ground risk into the twin desired project outcomes of increased certainty of outcome and value for money. 1 Introduction The geotechnical engineer’s role in delivery of society’s infrastructure and buildings can be defined quite simply ‘to manage ground risk for the benefit of all stakeholders to deliver value for money and certainty of outcome.’ To many, certainty of outcome and value for money represent a trade-off (commonly called the risk/reward ratio) where increased certainty of outcome requires additional expense and vice versa, where less expense increases the chance of unforeseen outcomes. Whilst many consider this to be true in the field of geotechnical engineering, the systematic analysis of components of uncertainty in the geotechnical design and construction process will usually result in a more economical foundation, which is constructed with fewer unforeseen events and has a better understood performance in service. Whilst this ‘managed reduction of uncertainty’ approach suggests an increase in the cost of the geotechnical engineering component of the project, this is not always the case. Generally, because the cost of geotechnical construction is more than 20 times the cost of the engineering component, savings released in the outturn cost of the geotechnical construction significantly outweigh the initial additional investment in the engineering. 2 Reducing geotechnical uncertainty and improving risk management In the geotechnical engineering and construction process, there are three primary areas of uncertainty that need to be managed to appropriately minimised levels, as follows: doi:10.36487/ACG_rep/1508_49_Wood
-
Upload
khangminh22 -
Category
Documents
-
view
0 -
download
0
Transcript of Use of instrumented static load tests on deep foundations for ...

FMGM 2015 – PM Dight (ed.) © 2015 Australian Centre for Geomechanics, Perth, ISBN 978-0-9924810-2-5
FMGM 2015, Sydney, Australia 677
Use of instrumented static load tests on deep foundations for optimisation of geotechnical design
WR Wood Fugro-Loadtest, USA
J Sinnreich Fugro-Loadtest, USA
AJ Simmonds Geokon Inc., USA
Abstract
The paper will describe through case history evidence of high and ultra-high capacity drilled shaft foundations how an integrated approach to site characterisation and site specific geotechnical design method calibration through full scale instrumented load tests will deliver significantly increased reliability and reduced cost of deep foundations for large capital infrastructure projects. Recent advances in ultra-high capacity load testing, in excess of 300 MN on a single shaft, when combined with comprehensive in situ strain and deflection monitoring, are allowing a new generation of large diameter foundations to be designed with confidence resulting in project benefits in terms of reduced construction times and cost. A case history from the US will be described to illustrate the key theme of the paper.
The paper will also describe recent advances in the interpretation of strain gauge data obtained from underground concrete structures reviewing recently developed techniques for increasing confidence in the knowledge of section properties for the determination of load from such data. Improvements in the measurements of deflections particularly with respect to the provision of a stable reference datum will be examined.
The paper will have direct application to all geotechnical engineers designing deep foundations helping to set the effective use of geomonitoring in the context of their primary responsibilities to manage ground risk into the twin desired project outcomes of increased certainty of outcome and value for money.
1 Introduction
The geotechnical engineer’s role in delivery of society’s infrastructure and buildings can be defined quite simply ‘to manage ground risk for the benefit of all stakeholders to deliver value for money and certainty of outcome.’ To many, certainty of outcome and value for money represent a trade-off (commonly called the risk/reward ratio) where increased certainty of outcome requires additional expense and vice versa, where less expense increases the chance of unforeseen outcomes. Whilst many consider this to be true in the field of geotechnical engineering, the systematic analysis of components of uncertainty in the geotechnical design and construction process will usually result in a more economical foundation, which is constructed with fewer unforeseen events and has a better understood performance in service.
Whilst this ‘managed reduction of uncertainty’ approach suggests an increase in the cost of the geotechnical engineering component of the project, this is not always the case. Generally, because the cost of geotechnical construction is more than 20 times the cost of the engineering component, savings released in the outturn cost of the geotechnical construction significantly outweigh the initial additional investment in the engineering.
2 Reducing geotechnical uncertainty and improving risk management
In the geotechnical engineering and construction process, there are three primary areas of uncertainty that need to be managed to appropriately minimised levels, as follows:
doi:10.36487/ACG_rep/1508_49_Wood

Use of instrumented static load tests on deep foundations for optimisation of geotechnical design WR Wood et al.
678 FMGM 2015, Sydney, Australia
The definition of the ground conditions beneath the project site.
Understanding the response of the foundation soils to the project loadings and ensuring that the design methods adopted do not result in unnecessarily high actual factors of safety for the field construction.
The uncertainties inherent in construction.
2.1 Ground conditions uncertainty
Despite more than five decades of significant technology development aimed at improving our abilities to characterise sub-surface geological and geotechnical conditions, many major infrastructure and building projects continue to be designed on the basis of a limited quantity of boreholes, antiquated in situ testing with the standard penetration test (SPT) and laboratory testing. These ‘sticks’ of data are then used to develop geological sections (‘slices’) by unconstrained interpolation of stratigraphic boundaries. Not only does the industry interpolate laterally between borehole positions, but the sampling and testing sequences adopted during the drilling of these holes means that significant interpolation is made vertically between information points within the borehole. A better approach would be to adopt techniques that develop longitudinal sections by site measurement and techniques that provide continuous information on strength and stratigraphy with depth.
A properly specified integrated ground investigation comprising geophysical exploration to ‘slice’ the site combined with continuous profiling with techniques such as the cone penetration test and a reduced quantity of boreholes will provide hugely increased information on the conditions that can be expected below the site and can often eliminate the risk of ‘unforeseen’ and certainly ‘unforeseeable’ ground conditions. Paradoxically, by using the initial ground model built from the advance geophysical exploration to target subsequent intrusive investigations, fewer of these may be necessary and this type of integrated investigation need not be more costly than the traditional approach; a true win-win for all stakeholders.
2.2 Design method uncertainty
All geotechnical design methods are based on concepts of reliability, i.e. rather than being formulated to provide a Class A prediction of behaviour (failure) they provide a foundation that will be safe at an acceptable level of reliability (i.e. the failure load of the foundation will be in excess of the value calculated by the method). Delivery of the high levels of reliability demanded and the inherent variability of the materials that we deal with means that for the majority of geotechnical designs the actual factors of safety achieved in construction will be higher than those adopted for design. In this context, it is useful to think of the actual Factor of Safety achieved in construction as the product of the design Factor of Safety and an unknown factor of uncertainty. Geotechnical engineers should turn their attention to the development of strategies to reduce the factor of uncertainty and semi-full scale and full scale foundation testing on the site can be used to make a site specific calibration of the design method, reducing this factor of uncertainty and unlocking valuable economic benefits in construction. Geotechnical instrumentation and monitoring has an indispensable role to play in the detailed understanding of the foundation’s behaviour and through this better understanding allows a much more effective site specific calibration of the design method to be achieved.
During the past twenty years or more, the authors’ organisations have been involved in many thousands of axial load tests on deep foundations. The Osterberg Cell technique (as described more fully later in the paper) provides an inherently greater overloading capability (often in excess of 1.5 × the specified test load) than alternative top-down axial load tests, where the foundation loading is applied against external reaction. This overload capability means that there are more occasions where deep foundation tests reach failure or reach loading levels sufficiently high to inform failure and a sample of these showing the comparison of measured ultimate capacity versus design ultimate capacity (the factor of uncertainty) for different generic geological conditions are illustrated in Figure 1.

Transport corridors
FMGM 2015, Sydney, Australia 679
Figure 1 Ratio of measured to estimated capacities (after Schmertmann & Hayes 1997)
The very high factors of uncertainty for drilled shaft load tests in hard rocks stem from past experiences whereby very little stress was actually applied to the rock sockets due to load shedding in shallower strata during conventional top-down load tests. Failure values for side shear were seldom determinable in such tests even with highly sensitive strain gauges at elevations within the rock socket. Designs were generally forced to adopt conservative design limiting values based on values actually measured in the field considerably lower than actual ultimate limiting values. The Osterberg Cell® (‘O-cell’, Osterberg 1989) bi-directional load test overcomes this limitation of the top down test by applying load directly into the material forming the rock socket that is of greatest interest to the optimisation of the deep foundation design. This principle is illustrated in Figure 2.
Figure 2 Schematic of top-down and Osterberg Cell test load distributions
Mea
sure
d F
acto
r o
f Sa
fety
Mea
sure
d/e
stim
ate
d (
un
cert
ain
ty)

Use of instrumented static load tests on deep foundations for optimisation of geotechnical design WR Wood et al.
680 FMGM 2015, Sydney, Australia
2.3 Construction uncertainty
Foundations designed by geotechnical engineers must be constructed to meet the engineering objectives of the design, and we develop specifications and control measures to ensure that these engineering objectives are met during construction. When design methods that include significant inherent conservatism for the majority of site conditions are used, this perhaps provides an unknown cushion of safety that can compensate for poor construction and less than appropriate levels of construction supervision. Optimising the design for the site by reducing factors of uncertainty means that the benefits this approach delivers must be matched by the relatively small costs of improved supervision, testing and monitoring. In this aspect, geo-structural monitoring has a very important role to play in the quality assurance of our built foundations and typically includes the monitoring of temperature profiles to assure construction integrity of deep foundations, construction instrumentation of embankments and deep excavations, proof loading of production deep foundations and in service monitoring of all of the aforementioned structures.
Selection of the proper type and configuration of instrumentation plays a crucial role in the execution of a high-quality load test and/or monitoring program. In static load tests and for long-term geomonitoring, vibrating wire strain gauges are generally used. The advantage of vibrating wire sensors over more conventional electrical resistance or semi-conductor types lies mainly in the sensor output, which is a frequency rather than a voltage or resistance. Frequency outputs are easier to transmit over long cables and are unaffected by voltage drops such as those which can be brought about by corrosion of terminal contacts, moisture penetration into the signal cable, or temperature effects on the cable, all of which would radically affect the output of electrical resistance and/or other analogue sensor types. Also, shortening or lengthening of the sensor cables does not affect the frequency signal. Vibrating wire gauges are, by design, very robust, allowing for quick and simple installations. Electrical resistance strain gauges, on the other hand, tend to be fragile and their installation requires great care and diligent waterproofing.
Recently fibre-optic strain gauges have been used, but they are relatively delicate and require careful handling during installation to avoid damage to the fibre-optic cables, which are difficult to repair (splice) in the field. In the authors’ opinion, one of the most exciting developments in the field of fibre-optics are distributed systems, which provide the ability to take measurements at 1 m (or less) increments along the entire length of a single fibre, so that total coverage over the entire length of a pile possible. Presently the associated readout equipment for such systems is comparatively expensive but, as time goes by, prices may well come down and we will likely see more widespread use of this technology. Vibrating wire gauges are read electronically using portable readout boxes or with dataloggers. In recent years dataloggers, have become miniaturised, less power demanding, more reliable and more affordable, and consequently are seeing more widespread use, even on relatively small scale projects such as pile tests. Dataloggers are able to gather data more quickly and with reduced manpower, and lighten the burden of data analysis. For long term monitoring, over extended periods of time, vibrating wire sensors are the sensors of choice. Properly constructed (McRae et al. 1991) they exhibit excellent long-term stability, far exceeding the best of bonded foil type strain gages and equalling or exceeding that of the unbonded (Carlson) type sensors. Until recently, the most widely used type of vibrating wire sensor (the ‘pluck and read’ type) was not suitable for dynamic measurements, where rapidly changing parameters needed to be monitored. However, electronic interfaces now exist capable of obtaining a dynamic response from these ‘pluck and read’ type vibrating wire sensors (Campbell Scientific 2012). This development now allows vibrating wire sensors to be considered for applications which were previously the realm of electrical resistance, semi-conductor and other analogue types.
The best-designed, properly instrumented pile load test can still fall victim to issues occurring during construction. One source of uncertainty in the test pile is shape of excavation. Strain gauge data is interpreted using the pile stiffness AE, a product of the composite Young’s modulus E and the cross-sectional area A. An accurate estimate of both these factors must be obtained in order properly convert measured strain into calculated load. If the test pile dimensions vary significantly from the nominal, the error in computing load from strain gauge data can increase exponentially (by a factor of diameter

Transport corridors
FMGM 2015, Sydney, Australia 681
squared). In the extreme case, cave-ins in the excavation can result in a pile shape which is not a prismatic cylinder and change the load-transfer mechanism. If the production piles are not excavated to the same shape as the test pile, the results of the test will not represent the true performance of the foundation system (Kort & Kostaschuk 2007).
Pile excavations (especially those of test piles) should therefore be profiled to determine shape. Concreting records may offer a crude estimate of pile shape. However, a more sophisticated tool, such as the ultrasonic sonar caliper, is better-suited for this purpose. Currently, the most advanced sonar caliper consists of a single transceiver mounted on a 360° rotating head. The unit, known by its trade name ‘SoniCaliper’, is lowered and raised by a signal cable over a guide wheel which is attached to a support frame at the surface of the excavation. The cable maintains the position of the unit along a plumb line throughout the length of the pile, allowing for accurate measurements of verticality in addition to shape data. Proprietary software is used to process the data generated by the sonar device within the excavation, to measure shaft diameter and verticality. The profile of the excavation is generated by positioning the head at discrete depth intervals and performing a 360° scan, producing a data set at each depth.
Figure 3 is a wire-frame rendering of an actual test pile excavation. The proposed location of the O-cell assembly was below the large bulge approximately two thirds of the length down the pile. Obviously, the results of a test carried out on such a pile would not be representative of the production piles.
Figure 3 Wire-frame rendering of calipered pile excavation

Use of instrumented static load tests on deep foundations for optimisation of geotechnical design WR Wood et al.
682 FMGM 2015, Sydney, Australia
2.4 Overview of uncertainty management
The three components of uncertainty discussed above are analogous to a three-legged stool; all three must be appropriately addressed to reap the benefits of an economically optimised and safer foundation. There is little value in calibrating the design method using a full-scale test at a location where the ground conditions have been well characterised if the rest of the site conditions are not well known. Similarly, if appropriate construction controls are not developed and implemented much of the optimisation benefits will be diminished by the need to add back factors of uncertainty to account for variabilities in the field construction process.
Modern design methods that adopt a partial factors approach such as the load and resistance factor design (LRFD) methods provide the geotechnical engineer with many opportunities. Well-executed design method calibration tests allow nominal resistances to be increased above those mandated by design codes and better characterisation of site ground conditions and well-written construction specifications and control measures allow resistance factors to be increased.
3 Case history — Ohio River Bridges Downtown Crossing
The Louisville-Southern Indiana Ohio River Bridges Project is a massive ongoing design-build infrastructure project intended to improve safety, alleviate traffic congestion, increase cross-river mobility, connect highways and provide a major economic stimulus to the metropolitan Louisville, Kentucky region in the USA. The project includes both the Downtown and East End Crossings over the Ohio River along with the associated highways that connect them, the reconstruction of the Kennedy Interchange and the reconstruction of ramps along Interstate 65 between I-264 and downtown (see Figure 4). The project budget is approximately USD 2.5 billion and will be the largest transportation project ever constructed between the two states of Indiana and Kentucky. The foundations for both the Downtown and the East End Crossings utilised the O-cell test for foundation design confirmation, economisation and risk management. The preliminary test pile construction commenced in 2013.
Figure 4 Rendering of Downtown Crossing (courtesy of http://kyinbridges.com/)
3.1 Project overview
The Downtown Crossing is being built roughly parallel to the existing John F. Kennedy Memorial Bridge, to accommodate six lanes of northbound I-65 traffic with separate pedestrian and bicycle lanes. The joint Indiana and Kentucky project is being managed by Kentucky Transportation Cabinet and delivered through a design-build contract with Walsh Construction Company and Jacobs Engineering. Geotechnical conditions throughout the bridge locations indicated the presence of a significant layer of high strength limestone into which the bridge foundations would be founded.

Transport corridors
FMGM 2015, Sydney, Australia 683
Accommodating the bridges’ lateral loading conditions required a minimum rock socket length. Using the standard geotechnical design approach, the axial design loads required socket lengths essentially double those required for the lateral loading conditions (approximately 12 versus 6 m). Recognising conventional geotechnical design’s inherent conservatism, the design-build team sought a means to address it for the large diameter high capacity drilled shafts. The O-cell’s bi-directional method was selected as the best solution for identifying the true capacity available in the limestone layer. Additionally, the SoniCaliper ultrasonic profiler was utilised to confirm verticality and dimensions of the pile excavation prior to cage installation and concreting. Use of the O-cell and SoniCaliper produced added advantages by confirming a less costly design with drilled shaft rock sockets whose length was controlled by lateral load rather than axial load, thus producing more economical foundations. This in turn managed project schedule and time risks for the design-build team.
3.2 Test pile construction and bi-directional load test arrangement
A test drilled shaft was required to be tested at the Downtown Crossing. The nominal 2,286 mm diameter rock socket was drilled into overburden and socketed into the underlying limestone to a depth of 14.75 m, under water. The pile was started by vibrating a 2,934 mm outside diameter (O.D.) outer casing and oscillating a 2,477 mm O.D. inner casing into the top of rock. A 1,219 mm pilot hole was bored to the pile base elevation. Next, a 2,134 mm auger was used to enlarge the bore to top of rock. The rock socket was cored with a 1,676 mm auger and then a 2,286 mm core barrel. After drilling was complete, the SoniCaliper was used to profile the excavation. The bottom of the shaft was cleaned using a 2,134 mm diameter cleanout bucket. After the pile was approved for concrete placement, the reinforcing cage with attached O-cell assembly was inserted into the excavation and concrete was pumped into the base of the pile until the top of the concrete reached the top of casing. The O-cell configuration in the test shaft used four 26.7 MN bi-directional load capacity, 870 mm diameter O-cells arranged in a single level located 1.2 m above the pile base to provide the maximum test load required of 214 MN. O-cell testing instrumentation included the following:
Eight Linear Vibrating Wire Displacement Transducers (LVWDTs, Geokon Model 4450) positioned between the lower and upper plates of the O-cell assembly to measure O-cell expansion.
Four levels of four sister bar vibrating wire strain gauges (SGs, Geokon Model 4911) attached at 90° spacing to the reinforcing cage above the top of the O-cell assembly.
Top of pile displacement was monitored using a pair of automated digital survey levels (Leica NA3000) from an average distance of 15.1 m.
Pile compression displacement was measured using two 6 mm steel telltale rods positioned inside 13 mm steel pipe casings and monitored by LVWDTs (Geokon Model 4450) attached to the top of pile.
Figure 5 is a schematic section of the test pile illustrating the positions of embedded O-cell load assembly and instrumentation. Figure 6 is a photograph of the load assembly attached to the reinforcing cage, about to be lowered into the excavation.

Use of instrumented static load tests on deep foundations for optimisation of geotechnical design WR Wood et al.
684 FMGM 2015, Sydney, Australia
Figure 5 Schematic section of test pile

Transport corridors
FMGM 2015, Sydney, Australia 685
Figure 6 O-cell assembly at the tip of reinforcement cage being installed into the test pile excavation
3.3 SoniCaliper profile results
The SoniCaliper excavation profile indicated a generally uniform pile bore, with no significant enlargements and maximum deviation from vertical of approximately 125 mm. These results confirmed that the construction technique was resulting in piles within the design specifications, and that the test pile did not have any significant or unusual enlargements which would influence the O-cell test results. Figure 7 is an extract of selected pages of the SoniCaliper report, illustrating the vertical section and some horizontal sections of the pile.
Figure 7 SoniCaliper profile results, vertical section of pile on left, selected pile horizontal sections on right

Use of instrumented static load tests on deep foundations for optimisation of geotechnical design WR Wood et al.
686 FMGM 2015, Sydney, Australia
The rock socket conditions at this site were such that a socket of highly uniform section could be excavated as demonstrated by the SoniCaliper results, lending confidence that uniform section properties could be assumed for the calculation of shaft load from the measured strain readings.
3.4 Testing procedure
The Osterberg cell load test was conducted as follows: The four 870 mm diameter O-cells were loaded to assess the combined end bearing and lower side shear resistance of the shaft section below the O-cells and the upper side shear above. The O-cells were loaded in 20 nominally equal increments to a bi-directional gross O-cell load of 161.6 MN. The load increments were applied in accordance with the quick load test method for individual piles (ASTM 2007). Each successive load increment was held constant for eight minutes by automatically adjusting the O-cell pressure. The loading was halted after the 20th increment because the rated capacity of the O-cell assembly had been exceeded by 50%. The O-cells were then unloaded in five decrements and the test was concluded. Figure 8 plots the load-displacement curves above and below the O-cell assembly.
Figure 8 O-cell test load-displacement curves
As a standard part of the O-cell test equipment, top of pile displacement was monitored remotely, using two Leica NA3003 automated digital levels from a distance of approximately 15 m (Figure 9).
Transport corridors
FMGM 2015, Sydney, Australia 687
Figure 9 Direct top of pile monitoring during O-cell test
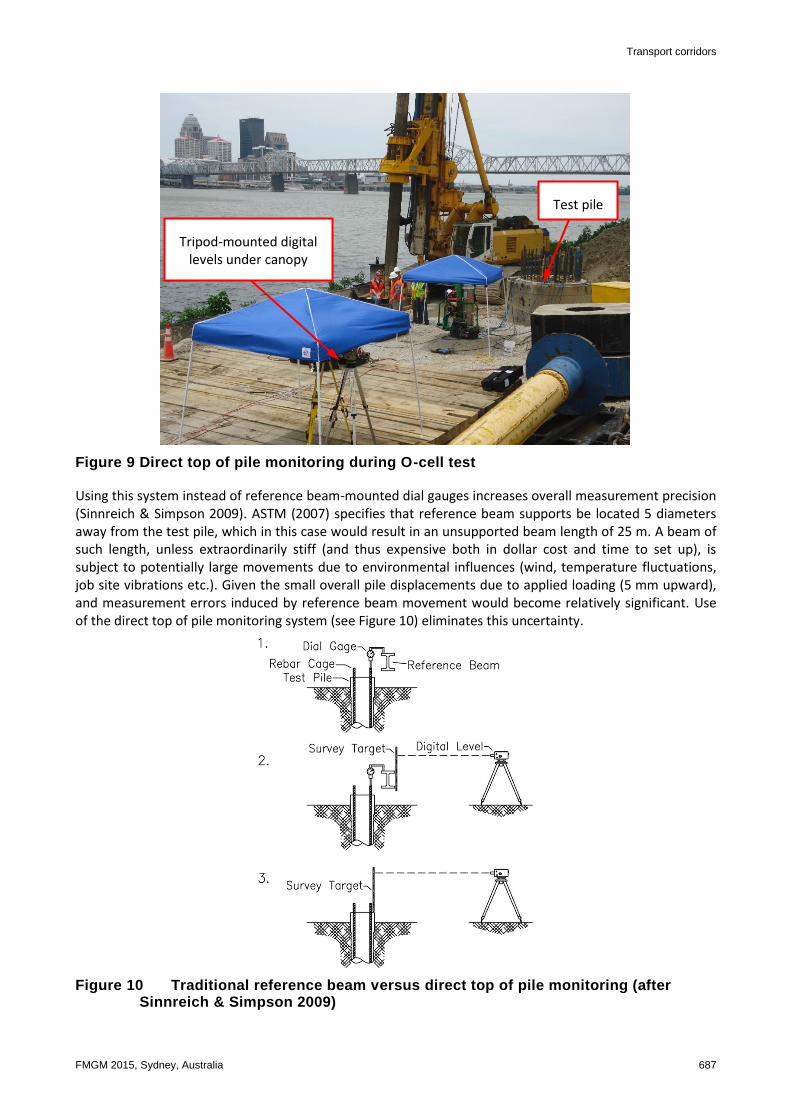
Using this system instead of reference beam-mounted dial gauges increases overall measurement precision (Sinnreich & Simpson 2009). ASTM (2007) specifies that reference beam supports be located 5 diameters away from the test pile, which in this case would result in an unsupported beam length of 25 m. A beam of such length, unless extraordinarily stiff (and thus expensive both in dollar cost and time to set up), is subject to potentially large movements due to environmental influences (wind, temperature fluctuations, job site vibrations etc.). Given the small overall pile displacements due to applied loading (5 mm upward), and measurement errors induced by reference beam movement would become relatively significant. Use of the direct top of pile monitoring system (see Figure 10) eliminates this uncertainty.
Figure 10 Traditional reference beam versus direct top of pile monitoring (after Sinnreich & Simpson 2009)
Tripod-mounted digital levels under canopy
Test pile

Use of instrumented static load tests on deep foundations for optimisation of geotechnical design WR Wood et al.
688 FMGM 2015, Sydney, Australia
3.5 O-cell test results
Analyses of strain gauge data indicate an average rock socket unit shear values of 2,678 kPa in the limestone material. A maximum unit end bearing pressure of 34,678 kPa was achieved. Calculation of pile stiffness included the calipered pile dimensions in order to best estimate the stiffness AE. Figure 11 plots the load distribution for selected load steps, as derived from O-cell load and strain gauge data. In order to illustrate the equivalent load at the pile head, the load distributions above the O-cell are mirrored (dashed lines).
Figure 11 O-cell test load distributions (solid lines) and equivalent top load distributions (dashed lines)
The test pile was loaded to a combined side shear and end-bearing load of 322.1 MN, a practically inconceivable figure for a top-down test. For a top loading of 100 MN, the test data indicate this shaft would displace approximately 10.4 mm. For a top loading of 200 MN, the test data indicate this shaft would displace approximately 20.6 mm. Figure 12 plots the equivalent top load displacement curve.

Transport corridors
FMGM 2015, Sydney, Australia 689
Figure 12 Equivalent top load-movement curve (settlement of pile head due to downward load applied at pile head)
4 Conclusion
A bi-directional static load test was performed using the patented Osterberg Cell method. The Quick Load Test Method for Individual Piles (ASTM D1143) was used to govern the O-cell’s load increments applied to the test shaft. This resulted in a bi directional gross load of 161.6 MN. The resulting maximum test load of 322.1 MN represents a new O-cell World Record for a static load test of a single foundation element! It exceeded the previous O-cell World Record, established in 2010 in St Louis, Missouri on the I-70 Mississippi River Bridge project by 2.4 MN. Although the old record wasn’t exactly shattered, proving once more that tests of this magnitude are achievable and that higher than average unit skin and end bearing resistances are possible in hard rock formations is a satisfying advancement of the drilled shaft industry. For the Ohio River Bridges project, the test results (along with a second Osterberg Cell test on the East End Crossing Bridge site) proved that the rock sockets could be reduced to the length controlled by lateral load, rather than axial load considerations, a reduction of approximately 50% on many of the sockets.
Actual foundation cost savings were not made available to the authors for this project but noting that the deepest metres of any drilled shaft are proportionately the most expensive, these savings would have been significant. The authors have been involved in more than 15 projects where the direct cost savings (net of the cost of testing) on the drilled shafts have been assessed and shown generally to be in the range of 15 to 25% of the original cost of the foundations as designed before optimisation.
The bi-directional load testing technique for axial load testing of drilled foundations is both the only economically viable and practicably available technique for load testing drilled shafts to loads in excess of around 50 MN. The availability of this technique and the development of reliable high capacity O-cells mean that the testing potential of drilled shafts is now only limited by the soil resistances supporting the shaft and a new era of designing and proof testing of ultra-high capacity deep foundations has commenced. Such ultra-high capacity foundations bring economic and construction execution benefits to many of the world’s signature infrastructure projects.

Use of instrumented static load tests on deep foundations for optimisation of geotechnical design WR Wood et al.
690 FMGM 2015, Sydney, Australia
Acknowledgement
We acknowledge the Kentucky Transportation Cabinet and Indiana Department of Transportation, and the design-build team (including Walsh Construction Company and Jacobs Engineering) for their approach in incorporating comprehensively instrumented O-Cell testing into the project.
References
ASTM 2007, D1143/D1143M: Standard Test Methods for Deep Foundations under Static Axial Compressive Load, American Society for Testing and Materials, West Conshohocken, PA.
Campbell Scientific 2012, Instrumentation for making high-precision dynamic vibrating-wire measurements using standard single-coil gages: White Paper, prepared by S Cornelsen & L Jacobsen, Campbell Scientific, Townsville.
Kort, DA & Kostaschuk, R 2007, ‘Sonar calipering of slurry constructed bored piles and the impact of pile shape on measured capacity’, Proceedings of the 60th Canadian Geotechnical Conference and the 8th Joint CGS/IAH-CNC Groundwater Conference (OttawaGeo2007), Canadian Geotechnical Society, Richmond, British Columbia, 9 p.
McRae, JB & Simmonds, T 1991, ‘Long-term stability of vibrating wire instruments: one manufacturer’s perspective’, in G Sorum (ed.), Proceedings of the 3rd International Symposium on Field Measurements in Geomechanics, Balkema, Rotterdam, pp. 283-293.
Osterberg, JO 1989, ‘Breakthrough in load testing methodology’, Foundation Drilling, vol. 28, no. 8, pp. 13-18. Schmertmann, JH & Hayes, JA 1997, ‘The Osterberg Cell and bored pile testing - a symbiosis’, Proceedings of the Third International
Geotechnical Engineering Conference, Cairo University, Cairo, pp. 139-166. Sinnreich, J & Simpson, RC 2009, ‘Evolution of top of pile measurement techniques in deep foundation static load testing’,
DFI Journal, vol. 3, no. 2, pp. 65-69.

Transport corridors
FMGM 2015, Sydney, Australia 691