MONASH Modelling of Post 2005 Assistance for PMV's
26
Conference Paper MONASH Modelling of Post 2005 Assistance Options for PMVs Philippa Dee Kevin Hanslow Terry Maidment The views expressed in this paper are those of the staff involved and do not necessarily reflect those of the Productivity Commission Productivity Commission Modelling Workshop on Post 2005 Assistance Options for the Automotive Manufacturing Sector Canberra, 27 May 2002
-
Upload
independent -
Category
Documents
-
view
0 -
download
0
Transcript of MONASH Modelling of Post 2005 Assistance for PMV's

��������������
� ����������������������������������
��������������
�������������� ������������������
������������������� �������������������������������� �������� ���� ��� ���������������������������������������������������� ��
���������������������������������������������������� �!��������"�������#������!������������#���������$�������%���&��'���������

MONASH MODELLING 1
MONASH modelling of post 2005assistance options for PMVs
This paper uses the MONASH model to examine the short and long term effects ofthe following indicative post 2005 assistance options for the passenger motorvehicle industry:
• tariffs on PMVs and components remaining at 10 percent, a continuation of theACIS scheme funded at the level prevailing in 2005, and no change to generaltariffs — the status quo in terms of delivered assistance;
• tariffs on PMVs and components remaining at 10 per cent, ACIS fundingdiscontinued in 2006 after the current arrangements expire, and no change togeneral tariffs — the policy status quo;
• phased reductions in tariffs on PMVs and components to 5 per cent in 2010 andthereafter, proportionate reductions in funding through an ACIS-type scheme,and no change to general tariffs;
• phased elimination of tariffs on PMVs and components by 2015, proportionatereductions in funding through an ACIS-type scheme, and phased elimination ofgeneral tariffs by 2015;
• phased elimination of tariffs on PMVs and components by 2010, proportionatereductions in funding through an ACIS-type scheme, and phased elimination ofgeneral tariffs by 2010;
• phased elimination of tariffs on PMVs and components by 2010, ACIS fundingdiscontinued in 2006 after the current arrangements expire, and phasedelimination of general tariffs by 2010.
The options encompass changes to tariffs on imported new PMVs and components,and to ACIS funding, but do not include changes to the other elements ofgovernment policy affecting the PMV industry — the tariff on second handvehicles, government procurement policies, or other generally available measuressuch as TRADEX and the 125 per cent tax concession on R&D. Nor do the optionsconsider the specifics of ACIS design. They do incorporate an assumption thatassistance to the PMV industry would not be reduced below that to other industries.

2 POST 2005ASSISTANCE OPTIONS
The MONASH model projects the effects of these future policy changes year-by-year, relative to a future ‘business as usual’ basecase. The basecase has beenprojected forward from a 1996-97 starting point, drawn from the latest ABS input-output tables.1 It incorporates the standard forward projections used by the Centreof Policy Studies for forecasting purposes, except that PMV exports are allowed torespond to their own price, rather than to the average price of all ‘non-traditional’exports.2 This implies annual basecase growth in PMV output of 2.9 per cent a year,falling between the 1.0 per cent and 3.6 per cent growth rates used by the Centre ofPolicy Studies in its modelling of the automotive industry’s contribution to theAustralian economy (Allen Consulting 2002). PMV employment declines in thebasecase by 2.8 per cent a year, worse than recent experience in the industry.
The basecase also incorporates the specific introduction of the GST in 20003 andthe planned reduction in tariffs on PMVs from 15 to 10 per cent in 2005 (and otherplanned tariff changes to 2005, primarily affecting TCF industries).
Thus the proposed post 2005 options are imposed on a basecase that in 2005accurately reflects the tariff assistance and general taxes prevailing at the time. Thisis important for accurately measuring the economic gains from subsequent changesin assistance.
After 2005, the basecase incorporates the status quo in terms of delivered assistance— the first of the policy options above. When results are presented as deviationsfrom the basecase, they are measured relative to this policy stance.
Care must be taken in interpreting results expressed as deviations from thisbasecase. Even if they show that some result falls below its business-as-usual valueat some point in the future, this need not mean it falls below its current, or even its2005 value, in absolute terms. To emphasise this point, absolute time paths, relativeto 2005, are also shown for some economic outcomes.
1 In the process, the ABS corrected the incidence of tariffs across different domestic users in the
1996-97 input-output tables. Average tariff levels faced by each industry were also adjusted sothat they accorded with detailed information built up by the Productivity Commission from thetariff line item level.
2 This alternative treatment of PMV exports differs from that presented at the Commission’smodelling workshop on 27 May 2002, and is also carried into the MONASH modelling of thepolicy scenarios presented later.
3 The wholesale sales tax was replaced by the GST using data on tax rates provided by Econtech.

MONASH MODELLING 3
MONASH framework
MONASH is an economy-wide model that traces through the impacts of assistancechanges on the immediately affected industry, on downstream using industries andon consumers. For each industry, it projects the effects on such things as prices andcosts, output and employment, as well as the mix of domestic and export sales. Theprojected effects on macroeconomic aggregates are obtained by adding up theseindustry impacts in a consistent fashion.
While the version used for this analysis has considerable industry detail,4 it has justone industry that represents all of PMV assembly activity and the bulk ofcomponent activity, as well as a portion of activity not under reference (see box A1in the attachment). The remainder of relevant component activity forms a portion ofother model industries. The single Motor Vehicle and Parts industry was notdisaggregated for this exercise. But the ‘first round’ changes in average importprices associated with each of the post 2005 assistance options were calculated fromdetailed tariff line item data, taking into account which individual line items wereaffected by which policy changes, and which model industries they mapped into(table A1 in the attachment).
It was not possible to establish the distribution of ACIS funding among the fullrange of model industries in which PMV assembly and component activity isrepresented. Instead, information from the Department of Industry, Science andTourism on the total production values of those receiving ACIS credits, and thevalues of those credits, was used to represent ACIS as a production subsidy in theunder-reference portion of the single Motor Vehicles and Parts industry (whichimplied a subsidy rate in 2005 of about 2.9 per cent for the industry as a whole).Thus the model accurately captures the quantum of ACIS funding available, but notits exact distribution, nor the fact that some is tied to investment or R&D rather thanproduction.
The starting ACIS subsidy rate in 2005 is a little higher than in the MONASHmodelling presented at the modelling workshop. The current treatment recognisesthat only that portion of ACIS funding tied to production will step down with thetariff at the beginning of 2005, while in the workshop modelling, all ACIS fundinghad been stepped down in 2005.
Other key features of the MONASH model relevant for this exercise are:
4 The model database is a 107 commodity version based on the 1996-97 ABS input-output tables,
provided by the Centre of Policy Studies.

4 POST 2005ASSISTANCE OPTIONS
• price-responsive substitution between domestic and imported sources for eachcommodity;
• price-responsive foreign demands for Australian exports;
• investment and capital accumulation responsive to changes in industry rates ofreturn;
• a facility for imputing labour adjustment costs to each of the estimated grosslabour market movements induced by any policy change; and
• a ‘tops-down’ regional facility, which can trace the effects of nationwidechanges (such as changes in assistance to the PMV industry) down to 57 distinctregional areas, called statistical divisions, based on the industry mix of activityin each statistical division.
Two further features are critical to these results.
First, in each policy scenario, it is assumed that aggregate employment is the sameas in the basecase throughout the entire period under review. All labour marketpressures are assumed to be absorbed by changes in the economy-wide real wage,rather than changes in aggregate employment. This view abstracts from cyclicalfactors and sees aggregate employment as being determined primarily by labourmarket, social or training policies that would affect the prevailing ‘non-acceleratinginflation rate of unemployment’ (NAIRU). The current treatment differs from thestandard MONASH treatment, in which aggregate employment can rise in the shortterm in response to tariff cuts.
Second, in each policy scenario, the government revenue lost from cuts to tariffs(net of that gained from cuts to budgetary assistance) is made up partially, but notfully, by increases in other taxes. Normally, changes in assistance would affect twodistinct dimensions of economic gain:
• aggregate real household consumption; and
• the aggregate real wealth of Australians.
With two distinct dimensions being affected, there is no single measure of economicgain. So it is assumed here that the government budget moves gradually into deficitover time (relative to the basecase) so that by a particular year — chosen somewhatarbitrarily to be 2016 — the real wealth of Australians is the same as in thebasecase. The reason the budget can move into deficit is that lowering PMV tariffswould lower the cost of investment goods, so that the national savings rate couldfall slightly while still maintaining real wealth constant.

MONASH MODELLING 5
One implication is that in 2016 (and in this year only), changes in real householdconsumption can be taken as a single unambiguous indicator of overall economicgain.5
Long term effects
The post 2005 assistance arrangements involve a mix of changes to tariffs and tobudgetary assistance. Each element would have slightly different flow-on effects tothe rest of the economy.
Lowering tariffs would reduce the price of imported PMVs and components. Thiswould have immediate benefits to consumers and to the cost structures ofdownstream using industries. It would particularly benefit those industries that werealso trade exposed (whether exporters or those competing against imports), sincethe demands for their products tend to be the most sensitive to cost changes.
Lower import prices would also encourage a switch away from domestic productiontowards imports, putting pressure on the profits and output of local PMV assemblersand component makers. To some extent, assemblers and component makers couldinsulate themselves by switching their input mix towards those things (such ascapital or imported components) that were relatively cheaper. This mechanism iscaptured in the model. They could also insulate themselves, as they have in the past,by finding product and process innovations to generate productivity improvementsand additional cost reductions. This mechanism is not captured in the model.6
Reducing budgetary assistance would create the same pressures for PMVassemblers and component producers to find offsetting savings in real resourcecosts, but would not bring the immediate extra benefit of reducing import prices.Thus it is expected that reducing budgetary assistance would be less beneficial inthe model than reducing tariffs by an equivalent amount, all other things beingequal.
This is confirmed when considering the main sources of increase in real householdconsumption.
5 This way of measuring economic gain is the same as in the PC’s (2000) review of Australia’s
general tariff arrangements. As in that exercise, the tax on labour income is chosen as theoffsetting budgetary instrument.
6 Nor does the modelling allow for the possibility that rationalisation of PMV activity could raisethroughput for individual firms, thereby generating productivity improvements through greatereconomies of scale.

6 POST 2005ASSISTANCE OPTIONS
• Allocative efficiency effects. Tariffs have a direct distorting effect on thedomestic-import sourcing of consumers and downstream using industries, soreducing them would be expected to provide greater improvements in allocativeefficiency.
• Effects on the size of the economy’s resource base. Aggregate employment isfixed (by assumption) and Australia’s capital stock can increase only if it isfinanced by foreigners (by the assumption that the real wealth of Australians isconstant). But Australia can still gain from a greater capital stock because ofdomestic taxes on repatriated profits. Tariff reductions would cause a greater fallin the replacement cost of capital in Australia, encouraging greater capitalaccumulation in the model and a greater benefit on this score.
• Terms of trade effects. In the MONASH model, Australian firms can only sellgreater volumes on world markets if they are prepared to accept a lower price forthem, all other things being equal. To the extent that policy changes raise theshare of resources devoted to exporting and thereby reduce export prices,Australians are worse off on this score — they face a reduction in the prices ofthings they produce (exports) relative to the things that they use (imports). Tariffreductions are likely to generate greater initial cost reductions, and are thereforelikely to encourage greater exports in the model. But this is at the cost of greaterdeclines in Australia’s terms of trade.
Therefore, tariff reductions are likely to generate greater economy-wide gains in themodel than equivalent reductions in budgetary assistance on two counts —allocative efficiency effects, and effects on the resource base of the economy. Butthey are also likely to generate greater terms of trade losses. The net outcome willdepend on the strength of these opposing effects.
These terms of trade effects have often been criticised as being inconsistent with theidea that Australia is a small country by world standards, unable to influence worldprices. But it is consistent with the notion that Australian firms sell differentiatedproducts into niche markets — greater sales may require a lower price of theAustralian product, even if all other overseas prices are unaffected.
The size of the terms of trade effects in the MONASH model is determined by thesize of the export demand elasticities, which govern the extent to which greaterexport volumes must come at the expense of price declines — the greater theelasticities, the smaller the price declines.
The central results in this paper assume a value of 10 for all export demandelasticities. This value is greater than the standard values in the MONASH model,and closer to the values adopted by Econtech in the MM 600+ model. TheProductivity Commission has argued in the past that the standard MONASH values

MONASH MODELLING 7
are too low (eg PC 2000). While low values might be appropriate for short runforecasting purposes, they are likely to overstate to some considerable degree theextent to which Australian firms can differentiate their products from those offoreign competitors in the longer term. There are two general pieces of evidence tosupport this.
• In models that treat economies of scale and product differentiation directly, thereis a direct link in equilibrium between the extent of economies of scale and theextent of product differentiation. Admittedly rather old engineering studies ofthe extent economies of scale across industries suggest scale effects are notpronounced, implying that product differentiation cannot be strong (eg Francois,McDonald and Nordstrom 1995).
• Multicountry models typically cannot reproduce historical changes in tradepatterns across countries unless they assume substantially higher export demandelasticities than the standard MONASH values (eg Gehlhar 1997, Hillberry et al.2001).
Table 1 shows the effects of the last five policy options, relative to a basecase thatincorporates the first. The results are presented as deviations from basecase valuesin 2016, the year in which changes in real household consumption can be taken asan unambiguous measure of economic gain.
The first column shows the effects of eliminating ACIS funding, while the secondshows the effects of halving both ACIS funding and the PMV tariff. Participantshave argued that the two have about equal effect currently. But with total ACISfunding in 2005 stepping down less than proportionately with the tariff, theremaining ACIS funding becomes a more important component of the overallassistance package. And eliminating ACIS funding after 2005 would be expected tohave a greater impact on PMV output and employment than halving both ACISfunding and the PMV tariff. This is borne out, with the effects on the PMV industryin the first column — output about 11 per cent lower than otherwise andemployment about 8 per cent lower than otherwise — being somewhat greater thanin the second column.
The last three columns show the effects of eliminating both ACIS funding and thePMV tariff (as well as general tariffs) over different time frames. In general terms,this would be expected to have twice the effect on the PMV industry as halvingPMV assistance (second column). Again, this is borne out. The effects of slowreductions are generally not as great, in 2016, as the effects of faster reductions,because less of the full effect has flowed through by then. But output is projected tobe between 12 and 18 per cent lower than otherwise, employment about 15 or 16per cent lower than otherwise, and imports between 6 and 8 per cent higher thanotherwise.

8 POST 2005ASSISTANCE OPTIONS
Table 1 Projected macroeconomic effects of post 2005 assistanceoptions — export demand elasticities of 10percentage deviation from basecase forecast in 2016
Scenarios
PMV tariffs:
ACIS funding:
General tariffs:
1
No change
Zero in 2006
No change
2
5% by 2010
Half by 2010
No change
3
0% by 2015
Zero by 2015
0% by 2015
4
0% by 2010
Zero by 2010
0% by 2010
5
0% by 2010
Zero in 2006
0% by 2010
National aggregates
Real h’hold consumption -0.03 0.00 0.01 0.00 0.00
Real investment -0.18 0.05 0.59 0.63 0.62Export volumes 0.24 0.26 0.92 1.00 1.02Import volumes 0.14 0.34 1.57 1.69 1.72
Real GDP -0.02 0.00 0.02 0.02 0.01
Real wage -0.20 0.10 0.96 0.96 0.94
Capital stock -0.06 0.02 0.14 0.17 0.16
Terms of trade -0.02 -0.03 -0.08 -0.09 -0.09
Real depreciation 0.02 0.08 0.28 0.24 0.24
PMV industryOutput -10.80 -7.59 -12.36 -16.34 -17.92Employment -8.44 -7.00 -15.46 -15.68 -15.95
Domestic sales –domestic production
-9.30 -7.29 -12.95 -16.24 -17.58
Domestic sales – total -1.71 -0.71 -0.46 -0.97 -1.21
Exports -29.61 -11.38 -4.92 -17.49 -22.24Imports 2.17 2.68 6.21 7.19 7.55Domestic supply price 3.89 1.40 0.81 2.33 2.97
Import price (incl duty) 0.01 -2.02 -5.87 -5.97 -5.98
Source: MONASH model projections.
These projected effects on PMV output and employment are more adverse thanthose presented in the Commission’s modelling workshop, for two reasons. First, asnoted, the quantum of ACIS funding to be eliminated after 2005 is greater thanbefore. Second, with PMV exports responding to changes in the domestic PMVsupply price (adjusted for the exchange rate), rather than to changes in an averageprice of all non-traditional exports, the projections for PMV exports are moreadverse than in the modelling workshop. This has flow-on effects to total output andemployment.
There is more differentiation among the scenarios when it comes to effects onnational aggregates, although in all cases, the effects are very small.
The negligible effect on real household consumption reflects the fact that:

MONASH MODELLING 9
• the allocative efficiency gains from reductions in tariffs or budgetary assistancedepend on the total height of the initial tariff or subsidy; while
• the terms of trade effects depend on the size of the tariff or subsidy reduction.
In the past, when tariffs were higher to start with, the efficiency gains from a givenreduction in assistance would have been greater than projected here, but the termsof trade losses would have been about the same magnitude.
One difference between cuts to tariff and budgetary assistance flows from theeffects on PMV prices in the model. Cuts in budgetary assistance put upwardpressure on the prices of locally produced vehicles and components.7 Tariff cutsreduce the cost of imports, and also put additional discipline on prices of localproduction. Thus scenarios involving tariff cuts are projected to spur investment,expanding the resource base of the economy.
When combined with the greater improvement in allocative efficiency, and similareffects on terms of trade, the model projects that a policy of halving PMV tariffsand budgetary assistance is superior to a policy of eliminating budgetary assistance.The ACIS-only policy is projected to cause a slight reduction in overall activity(real GDP) and real household consumption, while the mixed policy has negligibleeffects on both.
When the cuts to PMV assistance are greater, and when they are combined with cutsto general tariffs, both the allocative efficiency gains and effects on the resourcebase are bigger, but so too are the terms of trade declines. The projected net effecton overall economic activity (real GDP) is positive and bigger than before. There isalso an increase in real household consumption, but smaller than this increase inactivity.
Sensitivity analysis
As noted, the balance between gains to efficiency and the resource base of theeconomy on the one hand, and terms of trade losses on the other, depends on theassumed elasticities of export demand. Table 2 shows the projected long termeffects of the same policy scenarios using uniform export demand elasticities of 4,the value used for all non-traditional exports (including PMVs) in the standard
7 In the first column, the price increase in 2016 actually exceeds the initial subsidy equivalent of
ACIS funding because of the cyclical flow-on effects of the myopic investment behaviourassumed in the MONASH model. By 2016, the industry is undergoing a cycle of recovery inrates of returns, following an initial reduction and resulting contraction in investment.

10 POST 2005ASSISTANCE OPTIONS
MONASH model. Table 3 shows results using export demand elasticities of 20,which are closer to the preferred values now used in the GTAP model.
A comparison of tables 1, 2 and 3 confirms that the effects on real householdconsumption are sensitive to the values of the export demand elasticities. With thelow elasticities, all policy options are projected to reduce real householdconsumption by a small amount, although those involving tariff cuts still induce anincrease in economic activity. But low elasticities are likely to overstate the extentto which Australian firms can differentiate their products on world markets. Withhigh elasticities, all scenarios involving tariff cuts generate improvements in realhousehold consumption.
Table 2 Projected macroeconomic effects of post 2005 assistanceoptions — export demand elasticities of 4percentage deviation from basecase forecast in 2016
Scenarios
PMV tariffs:
ACIS funding:
General tariffs:
1
No change
Zero in 2006
No change
2
5% by 2010
Half by 2010
No change
3
0% by 2015
Zero by 2015
0% by 2015
4
0% by 2010
Zero by 2010
0% by 2010
5
0% by 2010
Zero in 2006
0% by 2010
National aggregates
Real h’hold consumption -0.05 -0.02 -0.04 -0.06 -0.07Real investment -0.19 0.03 0.54 0.57 0.56
Export volumes 0.32 0.31 1.00 1.13 1.17Import volumes 0.17 0.34 1.49 1.64 1.67Real GDP -0.02 0.00 0.02 0.01 0.00
Real wage -0.24 0.07 0.89 0.87 0.85Capital stock -0.06 0.02 0.13 0.16 0.14
Terms of trade -0.08 -0.08 -0.25 -0.28 -0.29Real depreciation 0.10 0.14 0.48 0.47 0.48
PMV industryOutput -9.31 -7.22 -12.09 -15.83 -17.01
Employment -7.09 -6.42 -15.06 -14.71 -14.76Domestic sales –domestic production
-9.03 -7.40 -12.91 -16.48 -17.61
Domestic sales – total -1.54 -0.69 -0.49 -1.00 -1.18Exports -12.78 -4.90 -1.77 -7.67 -9.47
Imports 2.44 2.83 6.17 7.38 7.73Domestic supply price 3.88 1.52 0.94 2.64 3.18Import price (incl duty) 0.08 -1.96 -5.71 -5.79 -5.79
Source: MONASH model projections.

MONASH MODELLING 11
A comparison of the tables also shows how remarkably insensitive most of the otherresults are to variations in the export demand elasticities. In particular, theprojections for output and employment in the PMV industry typically vary by lessthan three percentage points across the full range of elasticities. This variation isgreater than in the results presented at the modelling workshop, primarily becauseof the different treatment of PMV exports, but is still small, especially for thescenarios involving the elimination of both tariffs and ACIS funding.
This finding means that the projected short term adjustment pressures associatedwith the above policy scenarios can be examined without reference to any particularset of export demand elasticities. The short term effects in the next section assumethe central values of 10.
Table 3 Projected macroeconomic effects of post 2005 assistanceoptions — export demand elasticities of 20percentage deviation from basecase forecast in 2016
Scenarios
PMV tariffs:
ACIS funding:
General tariffs:
1
No change
Zero in 2006
No change
2
5% by 2010
Half by 2010
No change
3
0% by 2015
Zero by 2015
0% by 2015
4
0% by 2010
Zero by 2010
0% by 2010
5
0% by 2010
Zero in 2006
0% by 2010
National aggregates
Real h’hold consumption -0.03 0.00 0.02 0.02 0.02
Real investment -0.20 0.05 0.60 0.64 0.62Export volumes 0.18 0.22 0.89 0.93 0.95Import volumes 0.08 0.31 1.58 1.67 1.69
Real GDP -0.03 0.00 0.02 0.02 0.01
Real wage -0.19 0.12 0.99 1.00 0.97
Capital stock -0.06 0.02 0.14 0.18 0.16
Terms of trade 0.00 -0.01 -0.04 -0.04 -0.04
Real depreciation 0.00 0.06 0.22 0.18 0.18
PMV industryOutput -12.61 -8.04 -12.57 -16.78 -18.96Employment -10.12 -7.71 -15.83 -16.69 -17.28
Domestic sales –domestic production
-9.55 -7.10 -12.86 -15.81 -17.41
Domestic sales – total -1.94 -0.76 -0.46 -0.99 -1.31
Exports -51.07 -19.89 -8.93 -29.07 -38.47Imports 1.76 2.43 6.12 6.81 7.14Domestic supply price 3.91 1.27 0.71 2.03 2.78
Import price (incl duty) -0.01 -2.03 -5.91 -6.02 -6.04
Source: MONASH model projections.

12 POST 2005ASSISTANCE OPTIONS
Short term effects
In the above results, the worst adjustment pressures on the PMV industry areprojected to occur, not surprisingly, with total elimination of the remaining tariffand budgetary assistance. By 2016, output of the MONASH model’s Motor Vehicleand Parts industry could be up to about 18 per cent lower than it would under acontinuation of current delivered assistance, depending on the timing of theassistance cuts. As noted, the MONASH industry includes some activities not underreference, so the adjustment pressures on just the activities under reference wouldbe greater.
But having output lower than under business-as-usual does not imply an absolutecontraction in the industry. Figure 1 shows the absolute time paths of industryoutput under the five different policy options, as well as the path under the business-as-usual base case.
Figure 1 Projected changes in PMV output over time under post 2005assistance optionsa
basecase and five alternative policy scenarios
Base
1
2
3
4
5
-10
0
10
20
30
40
2006 2007 2008 2009 2010 2011 2012 2013 2014 2015 2016
Cum
ulat
ive
% c
hang
e
a Policy scenarios numbered the same as in table 1.
Data source: MONASH model projections.

MONASH MODELLING 13
Under the base case, PMV output would be 38 per cent higher than its 2005 valueby 2016, an annual compound growth rate of 2.9 per cent. Even under the mostsevere alternative policy scenario, PMV output is still projected to be 13 per centhigher in 2016 than in 2005, an annual compound growth rate of 1.1 per cent.8 Thesame policy option is projected to reduce PMV employment by 4.4 per cent a year,rather than the 2.8 per cent a year in the basecase. Either outcome looks excessiveagainst the reality check of recent experience.
Thus all of the post 2005 assistance options in this paper are projected to reduce therate of growth of PMV output over time, rather than to cause an absolutecontraction. They are projected to reinforce the contraction in PMV employmentover time. The labour market adjustment costs associated with these options areexamined shortly.
The above conclusion could be sensitive to the growth rate of PMV outputincorporated in the base case. As noted, the above base case is the current standardused by the Centre of Policy Studies for forecasting purposes (albeit with a differenttreatment of PMV exports). Its growth rate of PMV output, at 2.9 per cent a year, is:
• higher than the basecase rate of 1 per cent used by the Centre of Policy Studiesin its modelling of the Automotive industry’s contribution to the Australianeconomy (Allen Consulting 2002); but
• lower than that report’s maximum rate of 3.6 per cent, achievable throughproductivity and other improvements that were judged to be in line with currentindustry trends.
Starting from a more conservative basecase for PMV output growth of 1 per cent ayear, the rapid removal of PMV assistance and general tariffs could instead cause ancumulative absolute decline in PMV output of 8.1 per cent below its 2005 value by2016, equivalent to an absolute annual contraction of about 0.8 per cent a year, andwould further reduce PMV employment.
Labour market adjustment costs
The labour adjustments arising from lower assistance need to be assessed againstthe general level of structural adjustment already taking place in the economy.
8 With output in 2016 taking an index value of 138 in the base case, and a value of 113 under
scenario 5, the percentage reduction in output in 2016 as a result of scenario 5 is 18 per cent, thesame as reported in table 1.

14 POST 2005ASSISTANCE OPTIONS
• There may be some additional labour market adjustment costs associated withreducing assistance — such as job search, retraining of displaced workers andinterstate migration.
• Tariff-induced changes could also reduce total labour market adjustment costs,by ameliorating the effects of ongoing structural adjustments elsewhere.
To the extent that the net effects of these costs and benefits are not taken intoaccount within MONASH, the gains from reducing assistance would be over (orunder)-stated.
This section uses a labour input loss index (LILI) to provide information about thelikely impact of post 2005 assistance options on ongoing labour market adjustmentcosts. The index is used to impute a labour market adjustment cost to each year ofthe base case, and to each year of a policy alterative. The adjustment costsassociated with the policy are calculated as the difference between the two. Thepolicy option under consideration is the rapid removal of PMV and general tariffsand ACIS funding (policy 5 in table 1, assuming export demand elasticities of 10and a basecase growth rate of PMV output of 2.9 per cent a year). This policy isprojected to cause the highest reduction in PMV employment by 2016.
Box 1 outlines the scope of the adjustment cost calculations and key assumptionslying behind them. A detailed outline of the LILI is provided in Dixon, Parmenterand Rimmer (1997) and PC (2000).
While the LILI provides a measure of labour market adjustment, it does notmeasure any costs to the economy as a whole from the adjustment of capital. But tothe extent that assistance changes were anticipated, then investment plans couldlikely be adjusted so that these costs were reduced.
The LILI also does not include adjustment costs that affect individuals, but are notcosts to the economy as a whole. A key example would be the stamp duty paid onhouse purchase when people change location. This is a transfer to the governmentrather than a cost to the economy as a whole.
When LILI calculations are used to estimate the labour market adjustment costsassociated with the rapid removal of PMV assistance and general tariffs, theyproduce no change in adjustment costs in the first year, and a reduction inadjustment costs in each subsequent year, to average a very small reduction of justover 360 person-years in each year to 2016. Essentially, these numbers areindistinguishable from the noise produced by the lack of absolute machine accuracyin the computer used!

MONASH MODELLING 15
Box 1 Scope and key assumptions of the labour input loss index(LILI)
The LILI measures the person-years lost because of labour market adjustment. Itquantifies the annual costs of all gross changes in labour market states each year.
Information about the impact of economic growth and structural change on net labourmarket adjustment is drawn from MONASH model simulation results. This is convertedto estimates of gross labour market movements using information and assumptionsabout labour mobility. Costing each gross labour market movement according to thelikely impact on the amount of time withdrawn from employment provides an overallmeasure of labour market adjustment costs, measured in person-years. Labour marketadjustment costs so derived can be converted to a dollar values using estimates ofaverage annual earnings per person employed.
The index covers:
• the estimated cost of moving between employed, unemployed or not in the labourforce states (assumed to be 3 to 9 months depending on the change);
• the cost of remaining in unemployment (one year per person unemployed);
• the cost of moving voluntarily between jobs in the same occupation and State(assumed to be zero for each move); and
• the cost of moving between occupational group or State-based region (assumed tobe 3 person months for each move).
Labour market adjustment costs not quantified in the current analysis include: the costof moving between jobs in a given occupation within a sub-State region (ie statisticaldivision) and costs incurred while remaining in the same job.
Source: Dixon, Parmenter and Rimmer (1997), PC (2000).
One reason that the projected economy-wide labour market adjustment costs are sosmall is that eliminating PMV assistance tends to reallocate retrenchments in theeconomy, rather than add to their total number.
• The key industries projected to gain employment in relative terms from theelimination of PMV assistance — iron ores, other metal ores, fishing — alsoexperience absolute declines in employment in the basecase. Thus whileeliminating PMV assistance increases retrenchments in the PMV industry, itreduces retrenchments in these other industries by slightly more.
• Other industries projected to lose employment in relative terms from theelimination of PMV assistance — rubber products, iron and steel, fabricatedmetal products, paints — are still projected to have positive employment growthin absolute terms. Adjustment costs are minimal when an industry simply slowsthe rate at which it hires additional workers.

16 POST 2005ASSISTANCE OPTIONS
The effects on industry employment are examined in more detail shortly.
Starting from a more conservative basecase growth of 1 per cent a year in PMVoutput, the rapid removal of PMV assistance and general tariffs is projected toincrease adjustment costs slightly by up to 380 person-years in the first three years,but to reduce them thereafter, for an average reduction of 300 person-years in eachyear to 2016. Under low basecase growth, more regional moves need to be made,and as these are more difficult, there is also a slight increase in involuntaryunemployment in the short term. But the pattern of industry adjustment is the sameas in the higher growth basecase, so the longer term adjustment story is similar.Again, the magnitudes are indistinguishable from machine error.
The modelling suggests that the labour market adjustment costs associated with post2005 assistance options for the PMV industry are not significant at the economy-wide level. Even in circumstances where reducing PMV assistance would changethe direction of PMV output growth, it is not projected to add to adjustment costs inthe longer term because it would facilitate structural adjustments occurringelsewhere. If there is an adjustment issue at all, it will be concentrated in particularregions.
Regional employment effects
The MONASH model traces the effects of national changes down to the regionallevel, based on the regional distribution of each of the model’s industries.
To understand the regional employment projections, it is therefore useful to lookfirst at the detailed industry employment projections. Table 4 shows the projecteddeviations from the basecase for industry employment in 2016, under a policy ofrapid elimination of PMV assistance and general tariffs, assuming export demandelasticities of 10.
Employment is projected to be worst affected in the PMV industry and thoseindustries closely related to it — rubber products, iron and steel, fabricated metalproducts and paints. Employment is also adversely affected to a much smallerextent in those manufacturing industries affected by the general tariff reductions.
Employment gains are projected to occur in a range of other industries. Some, suchas Iron Ores and Other Metal Ores, are trade exposed and benefit from the inducedreduction in their cost structures (measured in table 1 by the induced realdepreciation). Others, such as wholesale and retail trade, benefit from the smallinduced increase in general economic activity.

MONASH MODELLING 17
Table 4 Projected changes in industry employment under rapidelimination of PMV assistance and general tariffs — exportdemand elasticities of 10percentage deviation from basecase forecast in 2016
Industry Industry Industry
OthMetalOres 3.24 OtherRepairs 0.18 ElecSupply -0.30Fishing 1.70 Grains 0.17 FibreWoven -0.33IronOres 1.49 StrucMetlPrd 0.07 Banking -0.33OtherMachnry 1.32 CommunicSrvc 0.06 CementLime -0.35LeatherProds 1.09 Defence 0.06 FinanceSrvce -0.38OthConstruct 1.01 GovAdmin 0.06 PrefabBuildn -0.39AgricSrvces 0.91 OthPrprtySvc 0.04 Pharmaceutic -0.39PhotogSciEqp 0.85 SugarSeaFood 0.01 RoadTransprt -0.42Confectionry 0.83 NonCompImps 0.00 PersonalSrvc -0.44OtherAgric 0.73 ForestryLogs -0.01 OwnerDwellng -0.46Footwear 0.66 Pigs -0.01 DairyProds -0.48WaterTranspt 0.61 Insurance -0.01 SoftDrinks -0.49RailwayEquip 0.59 Poultry -0.01 ONmtlMinProd -0.51Aircraft 0.59 LbryMseumArt -0.02 GasSupply -0.53MiningSrvces 0.56 SheetMetlPrd -0.04 Printing -0.53OtherManufac 0.54 OtherBusSrvc -0.04 FlourCereals -0.54ElectrnicEqp 0.52 Sheep -0.04 PaperProds -0.57CoalOilGas 0.50 CommunSrvces -0.06 Cosmetics -0.58AgrMinMachnr 0.46 HealthSrvces -0.07 WineSpirits -0.64RailTransprt 0.46 SportGambRec -0.09 BasicChemicl -0.68BasicNferMtl 0.45 PetrolCoalP -0.14 PulpPaper -0.69TechServices 0.43 TextileProds -0.14 PlasticProds -0.74KnittingMill 0.41 MeatProds -0.14 GlassProds -0.79WholesaleTrd 0.37 AirTransport -0.18 OthChemPrd -0.87OilsFats 0.37 HotelsCafes -0.19 HouseholdApp -0.88BeefCattle 0.35 MechRepairs -0.20 Furniture -0.98Clothing 0.33 Soaps -0.25 SawmillProds -1.00ShipsBoats 0.31 BeerMalt -0.25 CeramicProds -1.00RetailTrade 0.28 OtherServces -0.25 OthWoodProds -1.08OthElecEquip 0.28 WaterDrains -0.27 OtherMining -1.49DairyCattle 0.24 FruitVeg -0.27 Paints -2.09FilmRadioTV 0.23 TransprtSrvc -0.27 FabrcMetlPrd -2.14Education 0.23 PlasterEtc -0.27 IronSteel -2.27TobaccoProds 0.23 ResidBuildng -0.28 RubberProds -3.69LawAccMkting 0.20 NonBankFnanc -0.29 MVPOthTrnEq -15.95Bakery 0.19 Publishing -0.30
Source: MONASH model projections.

18 POST 2005ASSISTANCE OPTIONS
On balance, the employment gains balance the employment losses because of theassumption that labour market pressures are absorbed by real wages changes ratherthan by changes to aggregate employment. But table 1 shows that by 2016, thispolicy option is projected to cause an increase in real wages. The model is such that,were this real wage pressure kept in check, the result would be a projected increasein aggregate employment.
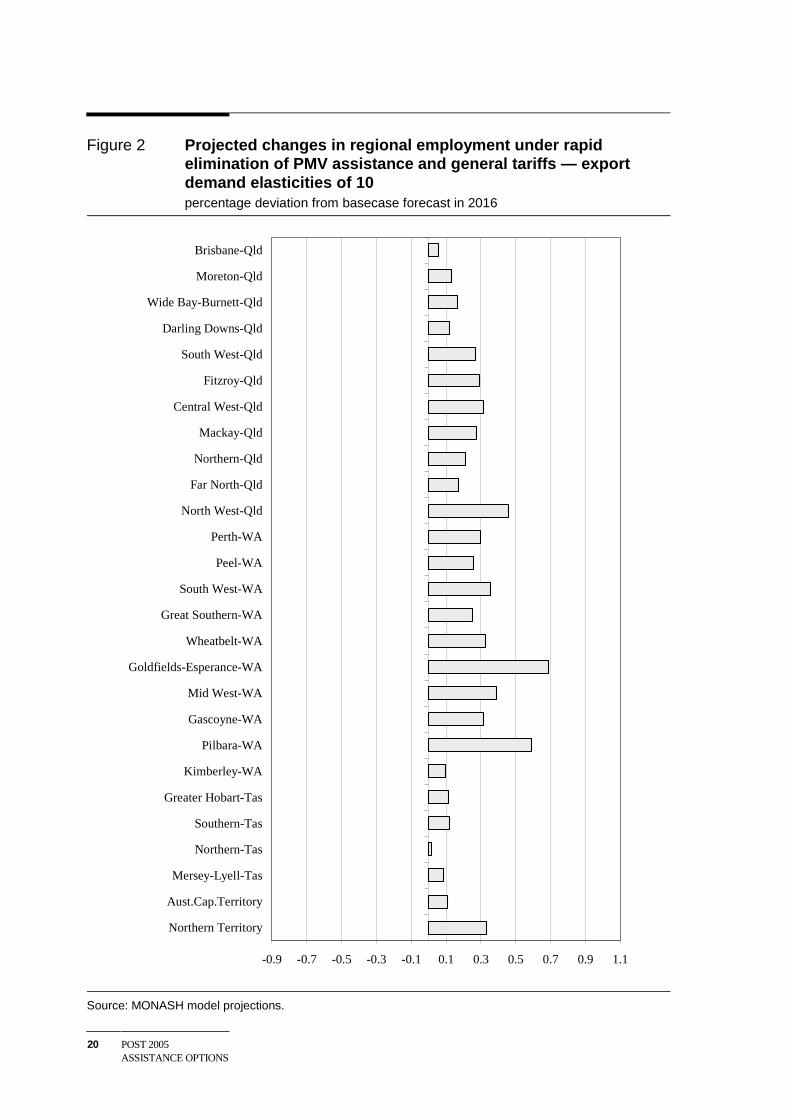
Figure 2 shows the resulting deviations from the basecase in 2016 for regionalemployment, by statistical division. Because each statistical division contains amajor urban conurbation, most contain a substantial, but varying, mix of primary,manufacturing and service activities. Diversity is one feature that can help preservea region from the employment effects of a shock to one particular industry. Smallerregional areas may be less diverse, and therefore more vulnerable.
Not surprisingly, among the statistical divisions projected to be adversely affectedare those in which PMV assembly and component production occurs — Adelaide,Melbourne and Barwon (encompassing Geelong). Also adversely affected are thosein which iron and steel production occurs — Illawarra (encompassing Wollongong)and Northern SA (encompassing Whyalla). Outer Adelaide is projected to beadversely affected, partly because of the impact on PMV component activity, andpartly because of the projected effects of general tariff reductions, including (in themodel) on the wine and spirits industry. South East of SA is projected to beadversely affected because of the impact of general tariff cuts on sawmilling.
Among the regions projected to gain in employment terms are those, such asSydney, with very diverse economic bases. Also projected to gain are regions inQueensland and Western Australia in which export oriented mining activity occurs.
But the cumulative deviations of regional employment from the basecase in 2016are all projected to be very small. Adelaide’s employment is projected to be about0.7 per cent lower than otherwise by 2016. In the other adversely affected regions,the cumulative deviations from the basecase are about 0.2 or 0.4 per cent. Theemployment gains, in regions where they occur, are generally a similar order ofmagnitude.
Reductions in employment from the basecase do not necessarily imply absolutecontractions in employment. For all those regions adversely affected in relativeterms, absolute employment growth over time is still projected to be positive.Employment in Adelaide and Melbourne is still projected to be about 16 per centhigher in 2016 than in 2005, even under a basecase with 1 per cent a year growth inPMV output. Employment in Barwon, Outer Adelaide and Illawarra is projected tobe about 11 or 12 per cent higher. Results for the other adversely affected regionsare similar.

MONASH MODELLING 19
Figure 2 Projected changes in regional employment under rapidelimination of PMV assistance and general tariffs — exportdemand elasticities of 10percentage deviation from basecase forecast in 2016
-0.9 -0.7 -0.5 -0.3 -0.1 0.1 0.3 0.5 0.7 0.9 1.1
Far West-NSW
Murray-NSW
Murrumbidgee-NSW
South Eastern-NSW
Central West-NSW
North Western-NSW
Northern-NSW
Mid-North Coast-NSW
Richmond-Tweed-NSW
Illawarra-NSW
Hunter-NSW
Sydney-NSW
Gippsland-Vic
East Gippsland-Vic
Ovens-Murray-Vic
Goulburn-Vic
Loddon-Vic
Mallee-Vic
Wimmera-Vic
Central Highlands-Vic
Western District-Vic
Barwon-Vic
Melbourne-Vic
Northern-SA
Eyre-SA
South East-SA
Murray Lands-SA
Yorke and Lower North-SA
Outer Adelaide-SA
Adelaide-SA
20 POST 2005ASSISTANCE OPTIONS
Figure 2 Projected changes in regional employment under rapidelimination of PMV assistance and general tariffs — exportdemand elasticities of 10percentage deviation from basecase forecast in 2016
-0.9 -0.7 -0.5 -0.3 -0.1 0.1 0.3 0.5 0.7 0.9 1.1
Northern Territory
Aust.Cap.Territory
Mersey-Lyell-Tas
Northern-Tas
Southern-Tas
Greater Hobart-Tas
Kimberley-WA
Pilbara-WA
Gascoyne-WA
Mid West-WA
Goldfields-Esperance-WA
Wheatbelt-WA
Great Southern-WA
South West-WA
Peel-WA
Perth-WA
North West-Qld
Far North-Qld
Northern-Qld
Mackay-Qld
Central West-Qld
Fitzroy-Qld
South West-Qld
Darling Downs-Qld
Wide Bay-Burnett-Qld
Moreton-Qld
Brisbane-Qld
Source: MONASH model projections.

MONASH MODELLING 21
ReferencesAllen Consulting 2002, The Automotive Industry’s Contribution to the Australian
Economy: A Modern Perspective, Report to the Federal Chamber of AutomotiveIndustries and the Federation of Automotive Products Manufacturers, The AllenConsulting Group and Deloitte Touche Tohmatsu, 26 February 2002.
Dixon, P., Parmenter, B.R. and Rimmer, M.T. 1997, The Australian Textiles,Clothing and Footwear Sector from 1986-87 to 2013-14: Analysis Using theMONASH Model, Centre of Policy Studies and the IMPACT Project, MonashUniversity, September 1997.
Francois, J.F., McDonald, B. and Nordstrom, H. 1995, ‘Assessing the UruguayRound’, in Martin, W. and Winters, L.A. (eds), The Uruguay Round and theDeveloping Economies, Discussion Paper No. 307, World Bank, WashingtonDC, pp. 117–214.
Gehlhar, M. 1997, ‘Historical analysis of growth and trade patterns in the PacificRim: An evaluation of the GTAP framework’, in Hertel, T. (ed), Global TradeAnalysis: Modelling and Applications, Cambridge University Press, Cambridge,pp. 349–63.
Hillberry, R., Anderson, M., Balistreri, E. and Fox, A. 2001, ‘The Determinants ofArmington Taste Parameters in CGE Models, or “Why You Love CanadianVegetable Oil”’, paper presented to Fourth Annual Conference on GlobalEconomic Analysis, 27–29 June, Purdue University, West Lafayette.
Productivity Commission (PC) 2000, ‘Modelling the effects of removing generaltariffs’, Supplement to Inquiry Report, Review of Australia’s General TariffArrangements, Productivity Commission, Canberra, July.

22 POST 2005ASSISTANCE OPTIONS
Attachment
Box A1 PMV industry in the MONASH model
The PMV industry in the MONASH model is taken directly from the input-outputindustry and product classification as follows:
2801 Motor vehicles and parts; other transport equipment
Mainly under reference
28110010-0060 Finished motor vehicles, finished trucks and utilities, unassembledvehicles, engines.
28130011-0017 Vehicle electric motors, air conditioners, wiring harnesses, startingequipment etc, gauges etc.
28190010-0026 Vehicle transmission assemblies, cylinder blocks etc, fuel pumps etc,cranks etc, gaskets, vehicle parts nec, vehicle body panels.
Mainly not under reference
28120011-0060 Vehicle bodies (coachwork), caravans etc, agricultural semi-trailers,other trailers, body panels for trucks and buses, parts nec for trailers.
28290010-8000 Transport equipment, parts and accessories nec, royalties, repairingand servicing, other income, increase in stocks, motor scooters and motor cyles.
In addition, there is some component activity that is under reference but included as apart of other input-output (and MONASH) industries. Some of the input-outputindustries and the relevant portions are as follows:
2508 Rubber products
25510050 New pneumatic, rubber tyres for motor cars and motor cycles.
25590060 Other rubber products.
2705 Fabricated metal products
2763 0010 Metal nuts, bolts, screws, rivets, washers, dowel pins, masonry anchorsand turnbuckles.
2806 Electronic equipment
28490065 Electronic equipment and parts nec.
2808 Other machinery and equipment
28690064 Industrial machinery and equipment nec.
Source: ABS (Input-Output Tables Product Details, Cat. no. 5215.0).

MONASH MODELLING 23
Table A1 Import price effects of post 2005 assistance optionsa
percentage deviation from 2005 prices once changes fully phased in
Scenarios
PMV tariffs:
ACIS funding:
General tariffs:
1
No change
Zero in2006
No change
2
5% by 2010
Half by2010
No change
3
0% by 2015
Zero by2015
0% by 2015
4
0% by 2010
Zero by2010
0% by 2010
5
0% by 2010
Zero in2006
0% by 2010
MONASH commodity:
Sheep 0.0 0.0 0.0 0.0 0.0
Grains 0.0 0.0 0.0 0.0 0.0Beef cattle 0.0 0.0 0.0 0.0 0.0Dairy cattle 0.0 0.0 0.0 0.0 0.0
Pigs 0.0 0.0 0.0 0.0 0.0Poultry 0.0 0.0 0.0 0.0 0.0Other agriculture 0.0 0.0 -0.2 -0.2 -0.2
Agricultural services 0.0 0.0 0.0 0.0 0.0Forestry and logging 0.0 0.0 -0.4 -0.4 -0.4Fishing 0.0 0.0 0.0 0.0 0.0
Coal, oil and gas 0.0 0.0 0.0 0.0 0.0Iron ore 0.0 0.0 0.0 0.0 0.0Other metal ores 0.0 0.0 0.0 0.0 0.0
Other mining 0.0 0.0 -0.3 -0.3 -0.3Mining services 0.0 0.0 0.0 0.0 0.0Meat products 0.0 0.0 -0.7 -0.7 -0.7
Dairy products 0.0 0.0 -10.2 -10.2 -10.2Fruit and vegetable products 0.0 0.0 -3.1 -3.1 -3.1Oils and fats 0.0 0.0 -0.5 -0.5 -0.5
Flour and cereal food 0.0 0.0 -2.9 -2.9 -2.9Bakery products 0.0 0.0 -4.2 -4.2 -4.2Confectionery 0.0 0.0 -2.5 -2.5 -2.5
Other food products 0.0 0.0 -0.9 -0.9 -0.9Soft drinks, cordials, syrups 0.0 0.0 -3.3 -3.3 -3.3Beer and malt 0.0 0.0 0.0 0.0 0.0
Wine and spirits 0.0 0.0 -4.4 -4.4 -4.4Tobacco products 0.0 0.0 -0.2 -0.2 -0.2Textile fibres, yarns etc 0.0 0.0 -0.1 -0.1 -0.1
Textile products 0.0 -0.1 -0.5 -0.5 -0.5Knitting mill products 0.0 0.0 0.0 0.0 0.0Clothing 0.0 0.0 0.0 0.0 0.0
Footwear 0.0 0.0 0.0 0.0 0.0Leather and leather products 0.0 0.0 -2.9 -2.9 -2.9Sawmill products 0.0 0.0 -3.5 -3.5 -3.5
Other wood products 0.0 0.0 -2.9 -2.9 -2.9Pulp, paper and paperboard 0.0 0.0 -2.3 -2.3 -2.3Paper bags and products 0.0 0.0 -2.1 -2.1 -2.1
Printing, services to printing 0.0 0.0 -1.6 -1.6 -1.6Publishing 0.0 0.0 0.0 0.0 0.0Petroleum and coal products 0.0 0.0 0.0 0.0 0.0
(continued next page)

24 POST 2005ASSISTANCE OPTIONS
Table A.1 (continued)
Scenarios
PMV tariffs:
ACIS funding:
General tariffs:
1
No change
Zero in2006
No change
2
5% by 2010
Half by2010
No change
3
0% by 2015
Zero by2015
0% by 2015
4
0% by 2010
Zero by2010
0% by 2010
5
0% by 2010
Zero in2006
0% by 2010
MONASH commodity:
Basic chemicals 0.0 0.0 -1.4 -1.4 -1.4Paints 0.0 0.0 -4.2 -4.2 -4.2Pharmaceuticals etc 0.0 0.0 -0.4 -0.4 -0.4
Soap and detergents 0.0 0.0 -4.0 -4.0 -4.0Cosmetics and toiletries 0.0 0.0 -4.4 -4.4 -4.4Other chemical products 0.0 0.0 -1.8 -1.8 -1.8
Rubber products 0.0 -2.2 -5.5 -5.5 -5.5Plastic products 0.0 -0.1 -3.7 -3.7 -3.7Glass and glass products 0.0 -0.4 -2.8 -2.8 -2.8
Ceramic products 0.0 0.0 -4.1 -4.1 -4.1Cement, lime and concrete slurry 0.0 0.0 0.0 0.0 0.0Plaster, other concrete products 0.0 0.0 -3.6 -3.6 -3.6
Other non-metallic products 0.0 0.0 -3.4 -3.4 -3.4Iron and steel 0.0 0.0 -1.8 -1.8 -1.8Basic non-ferrous metal etc 0.0 0.0 -2.0 -2.0 -2.0
Structural metal products 0.0 0.0 -4.1 -4.1 -4.1Sheet metal products 0.0 0.0 -3.8 -3.8 -3.8Fabricated metal products 0.0 -0.6 -4.0 -4.0 -4.0
Motor vehicles and parts etc 0.0 -2.0 -6.0 -6.0 -6.0Ships and boats 0.0 0.0 -1.0 -1.0 -1.0Railway equipment 0.0 0.0 -4.5 -4.5 -4.5
Aircraft 0.0 0.0 0.0 0.0 0.0Scientific etc equipment 0.0 0.0 -0.6 -0.6 -0.6Electronic equipment 0.0 0.0 -0.4 -0.4 -0.4
Household appliances 0.0 0.0 -3.4 -3.4 -3.4Other electrical equipment 0.0 -0.4 -3.1 -3.1 -3.1Agricultural, mining etc machinery 0.0 0.0 -2.4 -2.4 -2.4
Other machinery and equipment 0.0 -0.3 -2.5 -2.5 -2.5Prefabricated buildings 0.0 0.0 -4.3 -4.3 -4.3Furniture 0.0 -0.2 -4.1 -4.1 -4.1
Other manufacturing 0.0 -0.1 -2.0 -2.0 -2.0Electricity 0.0 0.0 0.0 0.0 0.0Gas 0.0 0.0 0.0 0.0 0.0
Water, sewerage and drainage 0.0 0.0 0.0 0.0 0.0Residential building 0.0 0.0 0.0 0.0 0.0Other construction 0.0 0.0 0.0 0.0 0.0
Wholesale trade 0.0 0.0 -2.6 -2.6 -2.6Retail trade 0.0 0.0 0.0 0.0 0.0Mechanical repairs 0.0 0.0 0.0 0.0 0.0
Other repairs 0.0 0.0 0.0 0.0 0.0Accommodation, cafes & restaurants 0.0 0.0 0.0 0.0 0.0
(continued next page)

MONASH MODELLING 25
Table A.1 (continued)
Scenarios
PMV tariffs:
ACIS funding:
General tariffs:
1
No change
Zero in2006
No change
2
5% by 2010
Half by2010
No change
3
0% by 2015
Zero by2015
0% by 2015
4
0% by 2010
Zero by2010
0% by 2010
5
0% by 2010
Zero in2006
0% by 2010
MONASH commodity:
Road transport 0.0 0.0 0.0 0.0 0.0Rail, pipeline, other transport 0.0 0.0 0.0 0.0 0.0Water transport 0.0 0.0 0.0 0.0 0.0
Air and space transport 0.0 0.0 0.0 0.0 0.0Services to transport & storage 0.0 0.0 0.0 0.0 0.0Communication services 0.0 0.0 0.0 0.0 0.0
Banking 0.0 0.0 0.0 0.0 0.0Non-bank finance 0.0 0.0 0.0 0.0 0.0Insurance 0.0 0.0 0.0 0.0 0.0
Services to finance etc 0.0 0.0 0.0 0.0 0.0Ownership of dwellings 0.0 0.0 0.0 0.0 0.0Other property services 0.0 0.0 0.0 0.0 0.0
Scientific research etc 0.0 0.0 0.0 0.0 0.0Legal, accounting etc services 0.0 0.0 0.0 0.0 0.0Other business services 0.0 0.0 0.0 0.0 0.0
Government administration 0.0 0.0 0.0 0.0 0.0Defence 0.0 0.0 0.0 0.0 0.0Education 0.0 0.0 0.0 0.0 0.0
Health services 0.0 0.0 0.0 0.0 0.0Community services 0.0 0.0 0.0 0.0 0.0Motion picture, radio etc 0.0 0.0 0.0 0.0 0.0
Libraries, museums, arts 0.0 0.0 0.0 0.0 0.0Sport, gambling etc 0.0 0.0 0.0 0.0 0.0Personal services 0.0 0.0 0.0 0.0 0.0
Other services 0.0 0.0 0.0 0.0 0.0Non-competing imports 0.0 0.0 0.0 0.0 0.0
a Estimates of import price changes are based on import-weighted tariff rates. Import clearances for individualitems in 1998-99 are used as weights. The percentage change in the landed duty paid import price isestimated for each commodity group using the general formula: PoT = - tm / (1 + to), where tm is the importprice-raising effect of selected interventions (eg the concessional rate, rate for general entry items) and t0 isthe import price-raising effect of all border interventions. The power of the tariff (PoT) is a measure of theimport price-raising effects of tariffs. A negative thus indicates that removing tariffs on items under referencewould lower the ldp price of imports.
Source: PC estimates.