Molecular marker records of land use change
15
Molecular marker records of land use change Elizabeth Fisher a , Frank Oldfield b , Rebecca Wake b , John Boyle b , Peter Appleby c , George A. Wolff a, * a Organic Biogeochemistry Group, Oceanography Laboratories, Department of Earth Sciences, University of Liverpool, Liverpool L69 7ZL, UK b Department of Geography, University of Liverpool, Liverpool, L69 7ZT, UK c Liverpool University Environmental Radioactivity Laboratory, Division of Applied Mathematics, Department of Mathematical Sciences, The University of Liverpool, Liverpool L69 7ZL, UK Received 2 April 2001; accepted 9 September 2002 (returned to author for revision 11 September 2001) Abstract Evidence of a changing environment in the catchment area of a small lake (Gormire, Yorkshire, UK) over the past 3000 years is provided by the mean carbon number of n-alkanes and the ratio of lignin thermochemolysis products, together with pollen analysis and bulk organic geochemistry. Periods of deforestation, which commenced at 600 BC and AD 1200, display a significant decrease in organic carbon contents of the lake sediments, which probably reflects dilution by enhanced influx of clastic material. The mean carbon number of waxy (C 27 –C 31 ) n-alkanes closely corre- sponds with the percentage of pollen derived from grass in the sediments. A higher-plant derived triterpenoid, tenta- tively identified from its mass spectrum as 28-carboxyursen-12-enol, appears exclusively in samples where tree and shrub-derived pollen is dominant. Thermochemolysis of lignin confirms that there was a significant change in the nature of material deposited in the lake sediments from woody to grass dominated. Changes in both the sedimentary C/N ratios and yields of lignin-derived phenols suggest that deforestation events led to enhanced aquatic productivity, initially through the development of reed-swamp vegetation. # 2002 Elsevier Science Ltd. All rights reserved. 1. Introduction The dominant sources of organic matter (OM) to lacustrine sediments are from aquatic production (autochthonous OM; including primary and secondary producers and heterotrophic bacteria) and/or from the residues of biota from the surrounding catchment (allochthonous OM, mainly plants). A key goal in the reconstruction of lake and catchment history, is to dis- cern the sources of OM to the lake and to assess any changing inputs that might be associated with environ- ment change (e.g. change in trophic status of the lake; Schelske et al., 1983; Schelske and Hodell, 1995; Ostrom et al., 1998; change in vegetation of the land in the catchment, either natural or anthropogenic; Ho and Meyers, 1994). Biological markers, particularly lipids, have often been employed to provide historical information of OM accumulation in lacustrine sediments (e.g. Cranwell, 1977, 1978, 1981; Meyers et al., 1984; Wu¨nsche et al., 1987; Ho and Meyers, 1994; Prartono and Wolff, 1998). Lipids only make up a small percentage of the bulk OM (Meyers, 1997). However, their structural diversity and different distributions in autochthonous and allochtho- nous OM inputs allow these sources to be distinguished (for reviews, see Meyers and Ishiwatari, 1993; Meyers and Lallier-Verge`s, 1999), and changes in the aquatic primary producers, for example through enhanced inputs of macrophytes, to be assessed (Ficken et al., 0146-6380/03/$ - see front matter # 2002 Elsevier Science Ltd. All rights reserved. PII: S0146-6380(02)00145-6 Organic Geochemistry 34 (2003) 105–119 www.elsevier.com/locate/orggeochem * Corresponding author. Tel.: +44-0151-794-4094; fax: +44-0151-794-4099. E-mail address: wolff@liv.ac.uk (G.A. Wolff).
Transcript of Molecular marker records of land use change
Molecular marker records of land use change
Elizabeth Fishera, Frank Oldfieldb, Rebecca Wakeb,John Boyleb, Peter Applebyc, George A. Wolffa,*
aOrganic Biogeochemistry Group, Oceanography Laboratories, Department of Earth Sciences,
University of Liverpool, Liverpool L69 7ZL, UKbDepartment of Geography, University of Liverpool, Liverpool, L69 7ZT, UK
cLiverpool University Environmental Radioactivity Laboratory, Division of Applied Mathematics,
Department of Mathematical Sciences, The University of Liverpool, Liverpool L69 7ZL, UK
Received 2 April 2001; accepted 9 September 2002
(returned to author for revision 11 September 2001)
Abstract
Evidence of a changing environment in the catchment area of a small lake (Gormire, Yorkshire, UK) over the past
3000 years is provided by the mean carbon number of n-alkanes and the ratio of lignin thermochemolysis products,together with pollen analysis and bulk organic geochemistry. Periods of deforestation, which commenced at �600 BCand AD 1200, display a significant decrease in organic carbon contents of the lake sediments, which probably reflects
dilution by enhanced influx of clastic material. The mean carbon number of waxy (C27–C31) n-alkanes closely corre-sponds with the percentage of pollen derived from grass in the sediments. A higher-plant derived triterpenoid, tenta-tively identified from its mass spectrum as 28-carboxyursen-12-enol, appears exclusively in samples where tree andshrub-derived pollen is dominant. Thermochemolysis of lignin confirms that there was a significant change in the
nature of material deposited in the lake sediments from woody to grass dominated. Changes in both the sedimentaryC/N ratios and yields of lignin-derived phenols suggest that deforestation events led to enhanced aquatic productivity,initially through the development of reed-swamp vegetation.
# 2002 Elsevier Science Ltd. All rights reserved.
1. Introduction
The dominant sources of organic matter (OM) tolacustrine sediments are from aquatic production
(autochthonous OM; including primary and secondaryproducers and heterotrophic bacteria) and/or from theresidues of biota from the surrounding catchment
(allochthonous OM, mainly plants). A key goal in thereconstruction of lake and catchment history, is to dis-cern the sources of OM to the lake and to assess any
changing inputs that might be associated with environ-ment change (e.g. change in trophic status of the lake;
Schelske et al., 1983; Schelske and Hodell, 1995; Ostrom
et al., 1998; change in vegetation of the land in thecatchment, either natural or anthropogenic; Ho andMeyers, 1994).
Biological markers, particularly lipids, have oftenbeen employed to provide historical information of OMaccumulation in lacustrine sediments (e.g. Cranwell,
1977, 1978, 1981; Meyers et al., 1984; Wunsche et al.,1987; Ho and Meyers, 1994; Prartono and Wolff, 1998).Lipids only make up a small percentage of the bulk OM
(Meyers, 1997). However, their structural diversity anddifferent distributions in autochthonous and allochtho-nous OM inputs allow these sources to be distinguished(for reviews, see Meyers and Ishiwatari, 1993; Meyers
and Lallier-Verges, 1999), and changes in the aquaticprimary producers, for example through enhancedinputs of macrophytes, to be assessed (Ficken et al.,
0146-6380/03/$ - see front matter # 2002 Elsevier Science Ltd. All rights reserved.
PI I : S0146-6380(02 )00145-6
Organic Geochemistry 34 (2003) 105–119
www.elsevier.com/locate/orggeochem
* Corresponding author. Tel.: +44-0151-794-4094; fax:
+44-0151-794-4099.
E-mail address: [email protected] (G.A. Wolff).
1998, 2000). More subtle changes in OM inputs, forexample from changes in catchment vegetation, havebeen less frequently observed, but potentially, differ-ences in distributions of certain compound classes can
be informative (e.g. n-alkanes; Cranwell et al., 1987; vanBergen et al., 1997). The coupling of biological markerdistributions with information on their isotopic compo-
sition may also be of value (Rieley et al., 1991), parti-cularly where C3 and C4 plant biomass changes haveoccurred in the catchment (Ficken et al., 1998).
Since individual lipid biological markers are relativelyminor components of OM, which have significantlydifferent rates of degradation, the characterisation of
the bulk macromolecular components of allochthonousOM, particularly of the lignins, has also been attempted.Chemical oxidation (Hedges and Parker, 1976; Hedgesand Mann, 1979) and thermochemolysis (Hatcher et al.,
1995; Clifford et al., 1995) of lignins and subsequent
analyses of the resultant phenols are useful methods,since they provide information on specific vascular plantsources (gymnosperm vs. angiosperm; woody vs. non-woody). Furthermore, quantification of the phenols
allows one to estimate the amount of lignin present(Ertel and Hedges, 1985), and potentially, therefore, ofvascular plant fluxes to the sediments.
The present study formed part of a larger projectbased in the UK (Land-Ocean Evolution PerspectiveStudy; LOEPS), which was concerned with the rela-
tionship between sediment fluxes between the land andocean and changes in sea level, climate, geomorphologyand land use in the Holocene. Here, we consider whe-
ther the distributions of molecular markers in lake sedi-ments reflect the sources of OM to the sediment andwhether molecular parameters can act as a proxy forchange in catchment vegetation. Gormire Lake (York-
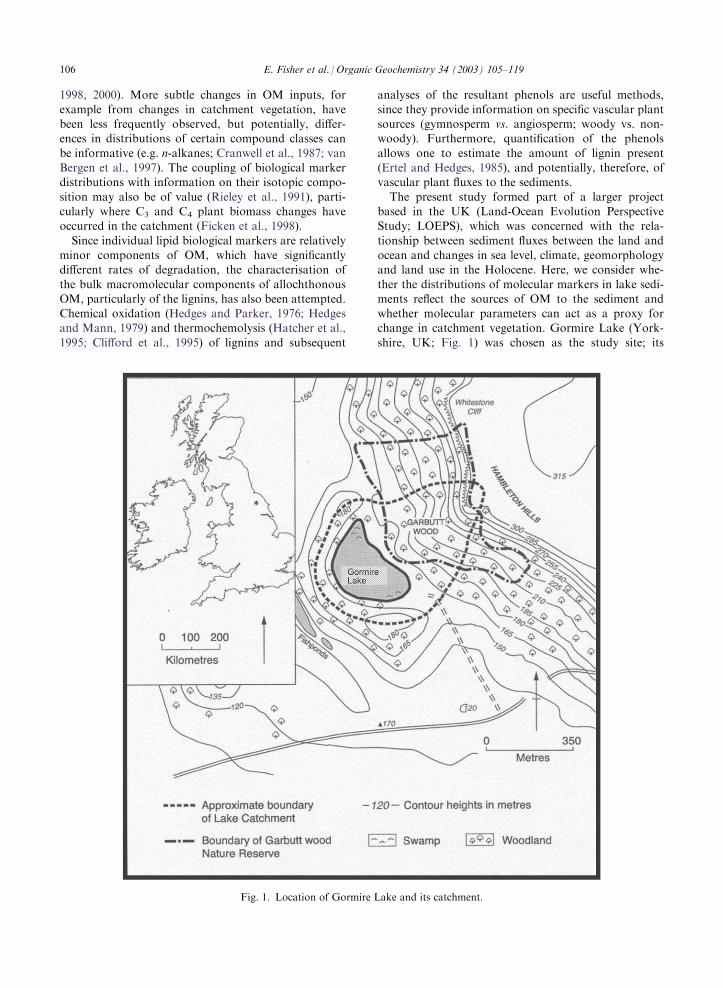
shire, UK; Fig. 1) was chosen as the study site; its
Fig. 1. Location of Gormire Lake and its catchment.
106 E. Fisher et al. / Organic Geochemistry 34 (2003) 105–119
catchment has undergone periods of land use changeand deforestation during the Holocene period. Simplebiomarker parameters, such as the mean carbon numberof n-alkanes and the ratio of lignin pyrolysis products
are employed, together with classical pollen analysis andbulk organic geochemistry, to assess qualitative andsemi-quantitative changes in OM inputs to the lake
sediments.
2. Materials and methods
2.1. Sample site, sediment collection and preparation
Gormire Lake (Fig. 1; Ordinance Survey Grid Refer-ence: SE 503832) is a small crescent-shaped closed basinwith a maximum water depth of 6.5 m and a surface
area of �0.06 km2 situated in the North YorkshireMoors at the northern edge of the Vale of Mowbray(part of the Vale of York), just below the scarp of the
Hambledon Hills at Whitestone cliffs. It has a steep,well-defined catchment (0.2 km2) with a maximum reliefof 150 m. The mean annual rainfall is 825 mm y�1.
Sediments were collected from the lake in August1995 using 1 and 3 m Mackareth corers (three cores arediscussed in this paper; 1-m cores, GCA and GCB; 3-m
core G3). The cores were packed in dry ice (�78 �C) andtransported to the laboratory where they were storedfrozen (�20 �C). Frozen sediment cores were defrostedslightly and sliced into sections (2 cm) using a heated
saw. The samples were then re-frozen, prior to freeze-drying (�60 �C; 10�2 Torr; 24–48 h). Lake sedimentsamples for lipid analysis (Section 2.7) were dry-sieved
(> and <63 mm) using a mechanically agitated all metalsieve system. Grassland and woodland soils and peatscollected from the catchment and analysed by quantita-
tive Curie-point pyrolysis-GC-MS (see Section 2.8;Table 4) were frozen and freeze dried as above.
2.2. Radiometric analyses
Sediment cores (1 m) from Gormire lake were ana-lysed for 210Pb, 226Ra, 137Cs and 241Am by direct
gamma assay. Ortec HPGe GWL series well-type coax-ial low background intrinsic germanium detectors wereused (Appleby et al., 1986).
2.3. AMS radiocarbon dating
Fifteen samples (macrofossil remains, sieved materialand untreated bulk sediments) from the 3-m cores weredated using AMS radiocarbon dating. Samples weredigested in HCl (6 M; 80 �C, 10 h), rinsed with distilled
water and digested in KOH (0.5 M; 80 �C, 10 h) toextract and discard humic material. Solid residues wererinsed with distilled water and digested in HCl (2 M;
80 �C; 10 h), before finally rinsing free of mineral acidswith distilled water, drying and homogenising. Thesamples were converted to graphite at the NERCRadiocarbon Laboratory, East Kilbride. 14C analysis
was carried out at the University of Arizona NSF AMSFacility.
2.4. Pollen analyses
Pollen analyses were carried out on sub-samples from
1 and 3 m cores using standard preparation techniques(Oldfield et al., in press), including acetolysis andhydrofluoric acid treatment. A minimum pollen sum of
300 non-aquatic grains was used.
2.5. Total organic carbon and total nitrogen
Concentrations of total organic carbon (TOC) andtotal nitrogen (TN) were determined on the carbonate-free samples (1 M HCl; left to stand 1 h; shaken 0.5 h)
using a Carlo Erba 1106 CHN Elemental Analyser. Thereproducibility of analysis for TOC was better than 2%(RSD for replicate analyses; n=5) for a homogenised
sediment sample.
2.6. Extraction, isolation, analysis and quantification of
lipids
All glassware and stainless steel items were soaked ina solution of hot detergent (Decon-90; 2%; BDH Che-
micals Ltd; 6 h), rinsed with deionised water (18.2 M�
cm�1 resistivity; MilliQ), wrapped in foil and dried in anoven. Finally, the glassware was heated in a muffle fur-
nace (400 �C, 4 h). Cellulose thimbles (Whatman), glasswool, Pasteur pipettes and anti-bumping granules werepre-extracted in a Soxhlet apparatus with dichloro-
methane (DCM; 24 h).Sieved sediment samples (<63 mm and >63 mm; 0.5–
20 g, depending on organic content) in a cellulose thim-ble were spiked with internal standards (2,21-dimethyl-
docosane, 200 mg; 5b(H)-cholanic acid, 200 mg) andwere extracted in a Soxhlet apparatus (10% methanol inDCM; 24 h). The extracts were then evaporated in
vacuo to a small volume (�1 mL) and treated with 6%KOH in methanol (w/v; 15 mL; 24 h). Water was added(15 mL) and the neutral fraction was extracted into
hexane (3�30 mL). The aqueous layer was then acid-ified to pH 2 (6 M HCl) and the acid fraction recoveredas above. After evaporation in vacuo (to 0.5 mL), BF3-
methanol was added (15 mL) and the solution left tostand (24 h). Excess methylating reagent was destroyedwith water (15 mL) and the methylated acid fractionwas recovered by extraction (hexane, 3�30 mL).
Prior to analysis by gas chromatography-mass spec-trometry, a quantification standard (5a(H)-cholestane;20 mg) was added to the sample (�0.5 mg), which was
E. Fisher et al. / Organic Geochemistry 34 (2003) 105–119 107
then derivatized [bis-(trimethylsilyl)-trifluoroacetamide,50 mL, 40 �C, 40 min].GC-MS analyses were performed on the derivatised
extracts using a Hewlett Packard 5890-A Gas Chroma-
tograph, fitted with an on-column injector, a fused hightemperature silica column (30 m�0.2 mm i.d.; 5%phenyl/95% methyl polycarborane siloxane, HT5), and
helium was used as the carrier gas (ca. 1.5–2 mL min�1).A retention gap of deactivated silica (1 m�0.32 mm i.d.)was used at the front of the column. Typically, the oven
temperature was programmed from 40 to 320 �C at 5 �Cmin�1 after 1 min, and held at 320 �C for 20 min. Thecolumn was fed directly into the EI source of a VG TS-
250 mass spectrometer. Typical GC-MS operating con-ditions were: ionisation potential 70 eV; source tem-perature 210 �C; trap current 300 mA. The instrumentwas operated in Full Data Acquisition mode, at a mass
resolution of 500, and cycled every 1 s (50–600 D). Datacollected on a VAX 3500 Workstation, and processedusing VG OPUS software.
Lipid identifications were made by comparison of rela-tive retention times and indices and mass spectra of theanalytes with standard compounds where available and
with literature data. Quantitative data were calculated bycomparison of the peak areas in the total ion current(TIC) chromatogram with the peak areas of the internal
standards. The precision of the analysis was better than6.5% (RSD, n=4), whilst reproducibility of extractionand analysis measured for a homogenised sediment sam-ple, was better than 10% for all analytes (RSD, n=4).
The mean carbon numbers of n-alkanes, n-alcoholsand n-alkanoic acids in the Gormire samples were cal-culated according to Pelzer and Gagosian (1989).
Mean Carbon Number MC#ð Þ ¼ � Ci½ �Cið Þ=� Ci½
where [Ci] is the concentration of the n-alkane with car-bon number Ci, over the range 27–31.Carbon Preference Index (CPI) for n-alkanes, n-alco-
hols and n-alkanoic acids were calculated according to
the formulae:
CPIn-alkanes ¼ � odd C21 � C29½ þ� odd C23 � C31½ ð Þ=
� even C20 � C28½ þ� odd C22 � C30½ ð Þ
CPIn-alcohols ¼ � even C20 � C28½ þ� even C22 � C30½ ð Þ=
� odd C19 � C27½ þ� odd C21 � C29½ ð Þ
CPIn�acids ¼ � even C20 � C28½ þ� even C22 � C30½ ð Þ=
� even C19 � C27½ þ� odd C21 � C29½ ð Þ
2.7. Quantitative Curie-point Pyrolysis-GC-MS
Pyrolysis wires (Curie point temperature of 610 �C)were cleaned by ultrasonication in nitric acid (2% v/v,
15 min), milli-Q water (15 min), redistilled acetone (15min) and DCM (15 min) and oven-drying (60 �C)Typically, an aliquot of homogenised sample (2 mg),
quantification standard (poly-(t-tetrabutyl)-styrene;
Sigma Chemicals Ltd, 20 mg in cyclohexane) and tetra-methyl ammonium hydroxide (TMAH, 25% in metha-nol, 250 mL) were placed into a vial and agitated
vigorously. The mixture was allowed to stand (20 min)and excess solvent was removed under a stream ofnitrogen. The sample and wire were placed between two
stainless steel discs and transferred to a hydraulic press(15 tonnes; 5 s). The wire was removed, suspended in thesample tube and transferred to the pyrolysis unit.
A Pi-rho Technology Curie-point Pyrolyser andControl Unit (Horizon Instruments Ltd) was used forall of the pyrolyses. The Pyrolysis Unit was interfacedwith the split/splitless injector of a Hewlett Packard
5890A Gas Chromatograph, with an interface tempera-ture of 250 �C. Typically, pyrolyses were carried outwith a rise time of <0.4 s, an equilibrium time of 2 s andradio-frequency power of 160 W. The GC-MS condi-tions were similar to those above except that the fusedhigh temperature silica column was a non-polar methyl
polycarborane siloxane (30 m�0.2 mm i.d.; HT1) andthere was no retention gap. The GC oven was pro-grammed from �40 �C to 280 �C at 6 �C min�1. Pyr-
olysis products were identified by their relative retentionindices and by comparison of their mass spectra withthose in the literature.The reproducibility of pyrolysis for 8 analytes: 1,2-
dimethoxybenzene; 3,4-dimethoxybenzaldehyde (vanil-lin); 3,4-dimethoxyacetophenone (acetoguaicone); 3,4,5-trimethoxybenzaldehyde (syringaldehyde); 3,4-dimeth-
oxycinnamic acid methyl ester (ferulic acid); n-icosanoicacid methyl ester; 1-nonacosene, selected randomly,were better than 7% (RSD; n=4).
3. Results and discussion
3.1. Chronology, pollen record, total organic carbon andtotal nitrogen
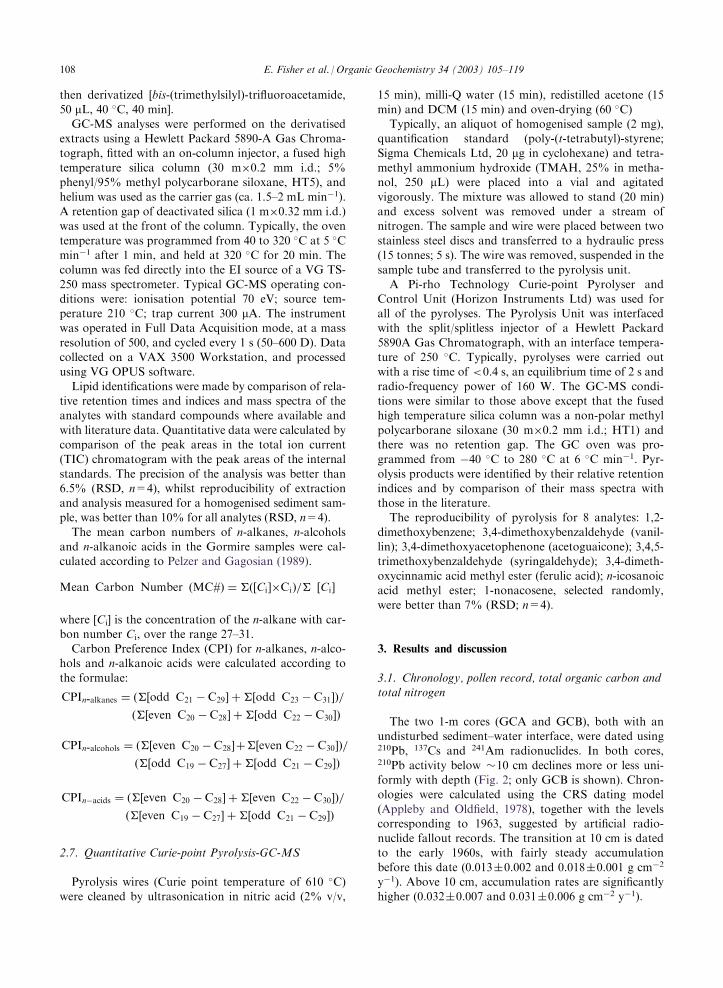
The two 1-m cores (GCA and GCB), both with anundisturbed sediment–water interface, were dated using210Pb, 137Cs and 241Am radionuclides. In both cores,210Pb activity below �10 cm declines more or less uni-formly with depth (Fig. 2; only GCB is shown). Chron-ologies were calculated using the CRS dating model
(Appleby and Oldfield, 1978), together with the levelscorresponding to 1963, suggested by artificial radio-nuclide fallout records. The transition at 10 cm is datedto the early 1960s, with fairly steady accumulation
before this date (0.013�0.002 and 0.018�0.001 g cm�2
y�1). Above 10 cm, accumulation rates are significantlyhigher (0.032�0.007 and 0.031�0.006 g cm�2 y�1).
108 E. Fisher et al. / Organic Geochemistry 34 (2003) 105–119
The radiometric chronologies for Cores GCA and
GCB indicate that the 8–10 cm missing from the top ofCore G3 is roughly the equivalent of the period sinceAD 1970. Both the magnetic (Oldfield et al., in press)
and pollen comparisons support a correlation between13 cm in Core G3 and 21 cm in the dated mini-cores.The calculated ages for sediments at this depth are AD
1853�18 years for GCA and AD 1890�30 years forGCB, giving a mean age of ca. AD 1870. Moving downcore, the next horizon identifiable for correlation ismarked by both a peak in Myriophyllum alterniflorum
and the first increase in Pinus pollen. This occurs at ca.32 cm in Core GCA and 24 cm in G3. Taking the meanage of the 21-cm horizon and the mean of the earliest210Pb-based sedimentation rates for the mini-cores, wederive an age of ca. AD 1770 for this feature, one that iscompatible with the strong probability that, as elsewhere
in the north of England, the Pinus pollen increase reflectsthe beginning of amenity plantations in country estatesfrom the second half of the 18th century onwards.AMS 14C dates were obtained on 15 samples. The
initial strategy was to select terrestrial macrofossils aswell as other organic components, so that both a securechronology and some estimate of the error associated
with different organic fractions could be obtained (Old-field et al., 1997). It proved impossible to achieve thisgoal as only one depth yielded enough terrestrial mate-
rial for a date, albeit with a large standard error, andmost of the initial set of picked plant macro-fossils andsieved material that was submitted for AMS 14C dating
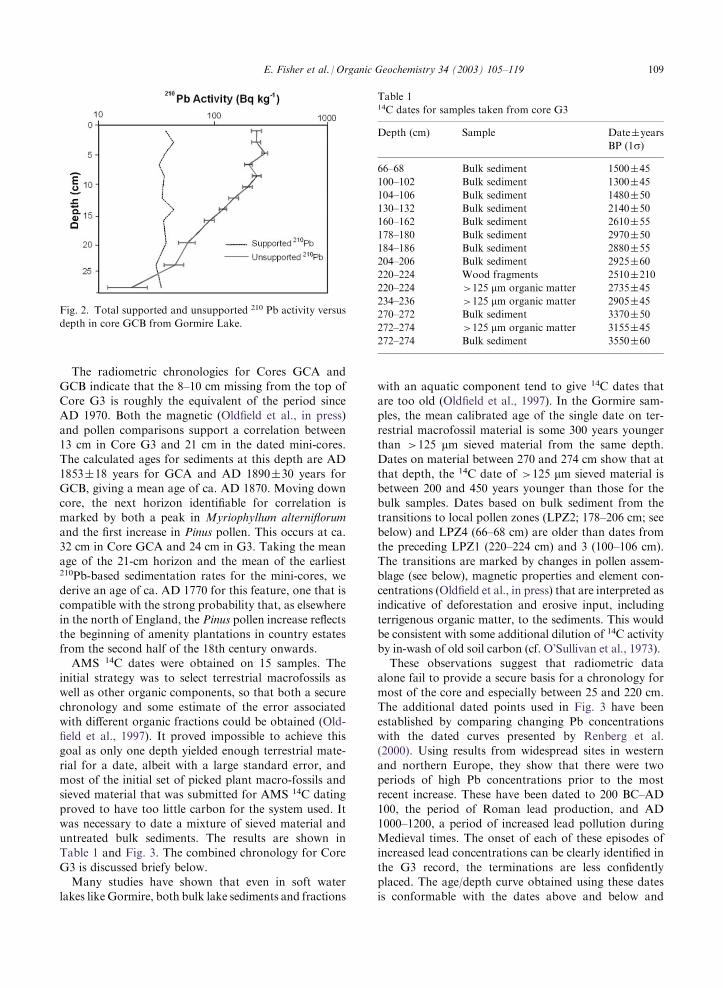
proved to have too little carbon for the system used. Itwas necessary to date a mixture of sieved material anduntreated bulk sediments. The results are shown inTable 1 and Fig. 3. The combined chronology for Core
G3 is discussed briefy below.Many studies have shown that even in soft water
lakes likeGormire, both bulk lake sediments and fractions
with an aquatic component tend to give 14C dates thatare too old (Oldfield et al., 1997). In the Gormire sam-ples, the mean calibrated age of the single date on ter-
restrial macrofossil material is some 300 years youngerthan >125 mm sieved material from the same depth.Dates on material between 270 and 274 cm show that at
that depth, the 14C date of >125 mm sieved material isbetween 200 and 450 years younger than those for thebulk samples. Dates based on bulk sediment from thetransitions to local pollen zones (LPZ2; 178–206 cm; see
below) and LPZ4 (66–68 cm) are older than dates fromthe preceding LPZ1 (220–224 cm) and 3 (100–106 cm).The transitions are marked by changes in pollen assem-
blage (see below), magnetic properties and element con-centrations (Oldfield et al., in press) that are interpreted asindicative of deforestation and erosive input, including
terrigenous organic matter, to the sediments. This wouldbe consistent with some additional dilution of 14C activityby in-wash of old soil carbon (cf. O’Sullivan et al., 1973).These observations suggest that radiometric data
alone fail to provide a secure basis for a chronology formost of the core and especially between 25 and 220 cm.The additional dated points used in Fig. 3 have been
established by comparing changing Pb concentrationswith the dated curves presented by Renberg et al.(2000). Using results from widespread sites in western
and northern Europe, they show that there were twoperiods of high Pb concentrations prior to the mostrecent increase. These have been dated to 200 BC–AD
100, the period of Roman lead production, and AD1000–1200, a period of increased lead pollution duringMedieval times. The onset of each of these episodes ofincreased lead concentrations can be clearly identified in
the G3 record, the terminations are less confidentlyplaced. The age/depth curve obtained using these datesis conformable with the dates above and below and
Fig. 2. Total supported and unsupported 210 Pb activity versus
depth in core GCB from Gormire Lake.
Table 114C dates for samples taken from core G3
Depth (cm) Sample Date�years
BP (1s)
66–68 Bulk sediment 1500�45
100–102 Bulk sediment 1300�45
104–106 Bulk sediment 1480�50
130–132 Bulk sediment 2140�50
160–162 Bulk sediment 2610�55
178–180 Bulk sediment 2970�50
184–186 Bulk sediment 2880�55
204–206 Bulk sediment 2925�60
220–224 Wood fragments 2510�210
220–224 >125 mm organic matter 2735�45
234–236 >125 mm organic matter 2905�45
270–272 Bulk sediment 3370�50
272–274 >125 mm organic matter 3155�45
272–274 Bulk sediment 3550�60
E. Fisher et al. / Organic Geochemistry 34 (2003) 105–119 109
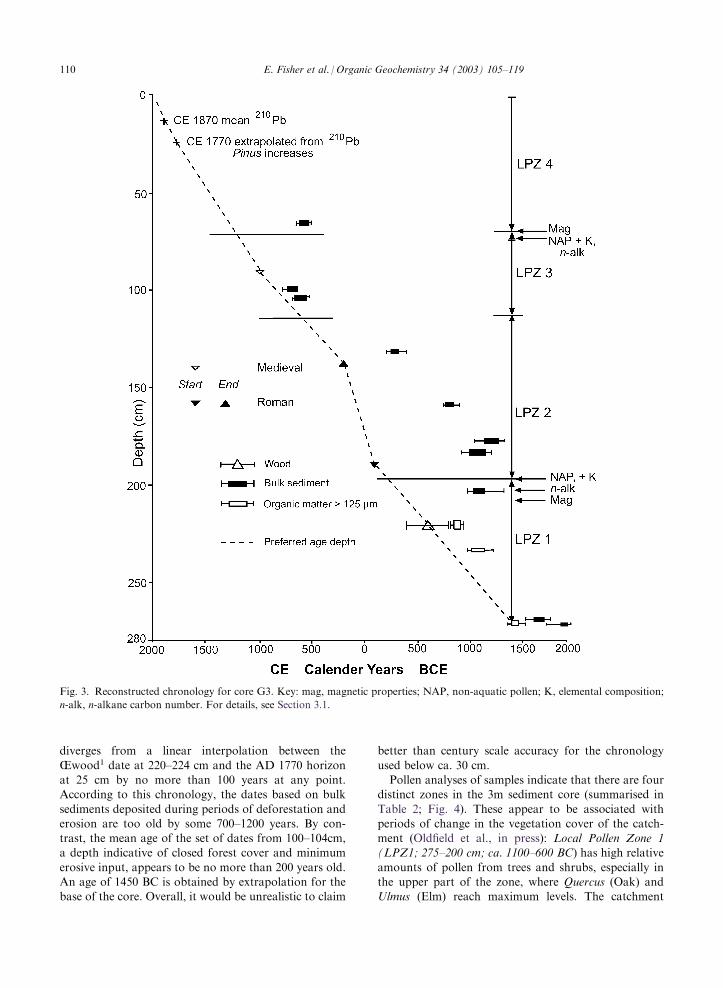
diverges from a linear interpolation between the
Œwood1 date at 220–224 cm and the AD 1770 horizonat 25 cm by no more than 100 years at any point.According to this chronology, the dates based on bulk
sediments deposited during periods of deforestation anderosion are too old by some 700–1200 years. By con-trast, the mean age of the set of dates from 100–104cm,a depth indicative of closed forest cover and minimum
erosive input, appears to be no more than 200 years old.An age of 1450 BC is obtained by extrapolation for thebase of the core. Overall, it would be unrealistic to claim
better than century scale accuracy for the chronology
used below ca. 30 cm.Pollen analyses of samples indicate that there are four
distinct zones in the 3m sediment core (summarised in
Table 2; Fig. 4). These appear to be associated withperiods of change in the vegetation cover of the catch-ment (Oldfield et al., in press): Local Pollen Zone 1(LPZ1; 275–200 cm; ca. 1100–600 BC) has high relative
amounts of pollen from trees and shrubs, especially inthe upper part of the zone, where Quercus (Oak) andUlmus (Elm) reach maximum levels. The catchment
Fig. 3. Reconstructed chronology for core G3. Key: mag, magnetic properties; NAP, non-aquatic pollen; K, elemental composition;
n-alk, n-alkane carbon number. For details, see Section 3.1.
110 E. Fisher et al. / Organic Geochemistry 34 (2003) 105–119
appears to have been stable at this time and no signs of
forest clearance are evident.Local Pollen Zone 2 (LPZ2; 200–110 cm; ca. 600 BC–
AD 800) shows a rapid decline in tree and shrub pollen.
Simultaneously, there is an increase in grass, cereal andother non-tree pollen. This suggests that deforestationoccurred during the time of deposition of these sedi-
ments. Aquatic taxa, e.g. Myriophyllum alterniflorumand Sparganium-type and finally Equisetum alsoincreased in relative abundance during this period.
Local Pollen Zone 3 (LPZ3; 110–75 cm; AD 800–AD1200), shows trees and shrubs apparently making analmost complete recovery, with the exception of Ulmus.The decline in grassland also suggests a period of
woodland recovery. Aquatics established in LPZ2, cer-eals, Calluna (ling) and Pteridium (bracken) are alsopresent in low relative abundance.
Local Pollen Zone 4 (LPZ4; 75–0 cm; AD 1200–AD
1970) again shows a decline in trees and shrubs,whereas pollens not derived from trees, such as thosefrom aquatic plants, ferns, cereals and grasses increasein relative abundance. In the uppermost section of the
sediment record however, there is an increase in Pinus(pine) and Betula (birch), indicating some forest regen-eration.
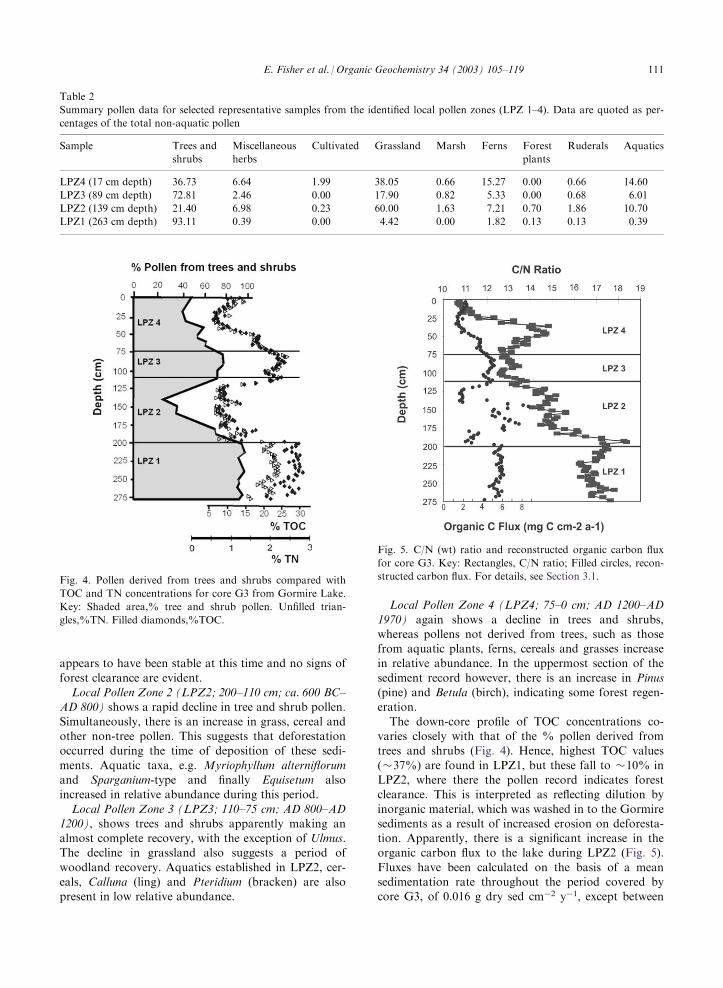
The down-core profile of TOC concentrations co-varies closely with that of the % pollen derived fromtrees and shrubs (Fig. 4). Hence, highest TOC values
(�37%) are found in LPZ1, but these fall to �10% inLPZ2, where there the pollen record indicates forestclearance. This is interpreted as reflecting dilution by
inorganic material, which was washed in to the Gormiresediments as a result of increased erosion on deforesta-tion. Apparently, there is a significant increase in theorganic carbon flux to the lake during LPZ2 (Fig. 5).
Fluxes have been calculated on the basis of a meansedimentation rate throughout the period covered bycore G3, of 0.016 g dry sed cm�2 y�1, except between
Table 2
Summary pollen data for selected representative samples from the identified local pollen zones (LPZ 1–4). Data are quoted as per-
centages of the total non-aquatic pollen
Sample Trees and
shrubs
Miscellaneous
herbs
Cultivated Grassland Marsh Ferns Forest
plants
Ruderals Aquatics
LPZ4 (17 cm depth) 36.73 6.64 1.99 38.05 0.66 15.27 0.00 0.66 14.60
LPZ3 (89 cm depth) 72.81 2.46 0.00 17.90 0.82 5.33 0.00 0.68 6.01
LPZ2 (139 cm depth) 21.40 6.98 0.23 60.00 1.63 7.21 0.70 1.86 10.70
LPZ1 (263 cm depth) 93.11 0.39 0.00 4.42 0.00 1.82 0.13 0.13 0.39
Fig. 4. Pollen derived from trees and shrubs compared with
TOC and TN concentrations for core G3 from Gormire Lake.
Key: Shaded area,% tree and shrub pollen. Unfilled trian-
gles,%TN. Filled diamonds,%TOC.
Fig. 5. C/N (wt) ratio and reconstructed organic carbon flux
for core G3. Key: Rectangles, C/N ratio; Filled circles, recon-
structed carbon flux. For details, see Section 3.1.
E. Fisher et al. / Organic Geochemistry 34 (2003) 105–119 111
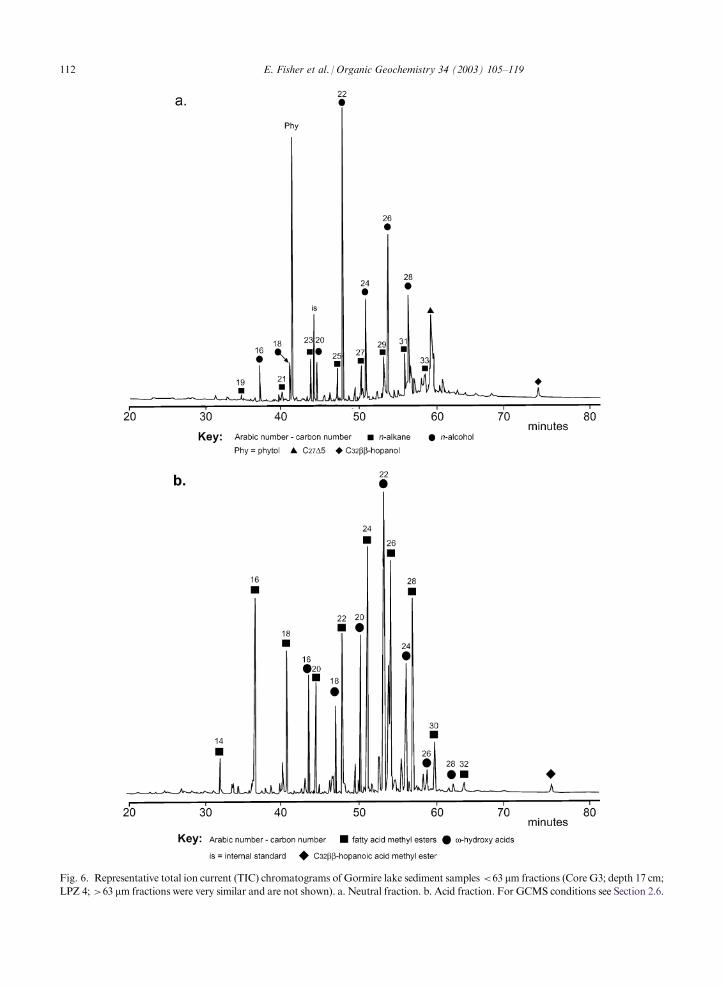
Fig. 6. Representative total ion current (TIC) chromatograms of Gormire lake sediment samples <63 mm fractions (Core G3; depth 17 cm;LPZ 4; >63 mm fractions were very similar and are not shown). a. Neutral fraction. b. Acid fraction. For GCMS conditions see Section 2.6.
112 E. Fisher et al. / Organic Geochemistry 34 (2003) 105–119
depths of 178 and 140 cm, where, from the preferredage/depth line, the sedimentation rate is estimated tohave been 0.051 g dry sed cm�2 y�1 (Fig. 3). It should benoted that the dips in flux at either side of the peak
values in LPZ2 are almost certainly artefacts of theuncertain chronology. On the other hand the changes inmean sedimentation rates of organic carbon, between
the inflexion points on the age/depth curve may reflectenhanced in wash of soil material. In LPZ3, where pol-len analyses suggest some recovery of woodland, TOCs
again increase, but then decrease dramatically in theuppermost section of the core. This decline again prob-ably reflects the enhanced influx of lithogenic material
to the uppermost sediments.C/N values for the Gormire sediments vary sig-
nificantly, from �10 in surficial sediments (LPZ4) to�17 in the deepest sediment (LPZ1) and they tend to
increase with increasing sediment depth (Fig. 5). This iscontrary to the change in C/N that is normally observedin lacustrine sediments, where C/N values decrease
through preferential utilisation of carbon and bacterialimmobilisation of nitrogen (Meyers and Ishiwatari,1993). For example Bourbonniere (1979) found that the
C/N ratio of living spruce was 46, whereas that ofspruce buried in lake sediments for 10,000 years was 20.Hence, the changes observed in the Gormire sediment
may rather reflect changes in the source of organicmaterial to the sediment. The decrease in C/N ratios inthe topmost part of the core (35–0 cm), most likelyreflects a gradual increase in the proportion of auto-
chthonous material in the sediments. Algal material,unlike higher-plant derived OM, contains little celluloseand therefore tends to have a lower C/N ratio (Meyers
and Ishiwatari, 1993). Furthermore, algal OM is rich inlabile nitrogen, which is degraded relatively rapidly andwould lead to an increase in C/N with increasing sedi-
ment depth.The sediments deposited in LPZ3 and 1 have rela-
tively stable C/N ratios, whereas in LPZ4 and 2, whichwere apparently influenced by deforestation, significant
decreases in the C/N ratios are apparent. This mayreflect a change in the inputs of catchment material.However, it could also arise from a change in the aqua-
tic ecosystem, involving increased productivity by phy-toplankton and reed-swamp development, both ofwhich could lead to lowering of C/N ratios (Meyers and
Ishiwatari, 1993). Indeed, comparison of TN values inLPZ 1 and 3, shows consistently higher concentrationsin the shallower sediments, which may reflect an
increased contribution of aquatic flora (Fig. 4; Table 2).Pollen data reinforce this hypothesis, since there is anincrease in the abundance of such plants (e.g. Myrio-phyllum alterniflora) above 200 cm. The enhanced
influx of catchment material through increased rates oferosion (Oldfield et al., in press), may have enriched thesediments and overlying waters with nutrients, for
example soil associated phosphorous (Schelske et al.,1983), and also have provided shallow marginal envir-onments, which allowed reed-swamp to take hold.
3.2. Response of molecular markers to environmentchange in the Gormire catchment
3.2.1. LipidsGormire core sediments were sieved to separate fine
(<63 mm) from coarse (>63 mm) fractions for analysisof molecular markers. The >63 mm sediment fractionmight be expected to reflect change in catchment vege-tation, which is more likely to be represented in the
coarse fractions during sediment deposition, whereasthe fine fraction most likely contains reworked/agedsoil-derived material as well as autochthonous algal andbacterial organic matter (Hedges and Oades, 1997; see
Section 3.1). Nevertheless, the lipid distributions of bothfine and coarse fractions were very similar and typical oflacustrine sediments, being complex mixtures of
n-alkanes and n-alcohols, methyl ketones, sterols, tri-terpenoids, n-alkanoic and n-alkenoic acids, hydroxyacids, branched acids and diacids (e.g. Fig. 6a and b;
>63 mm fractions not shown; Table 3). The relativeabundance of each group varied little and absoluteconcentrations of most of the compound classes did not
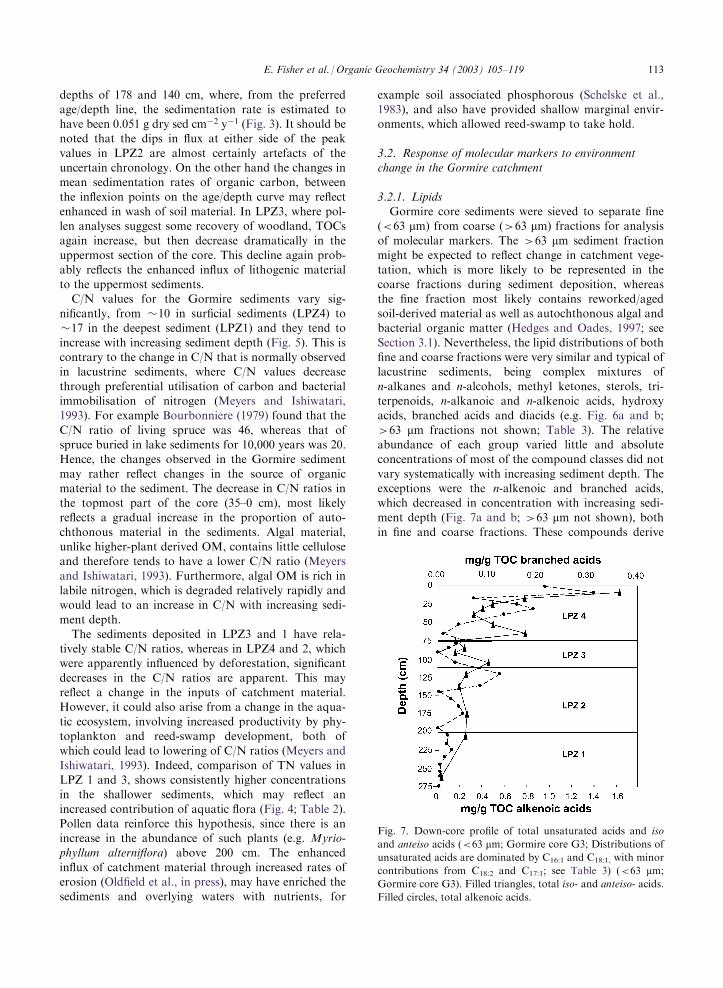
vary systematically with increasing sediment depth. Theexceptions were the n-alkenoic and branched acids,which decreased in concentration with increasing sedi-ment depth (Fig. 7a and b; >63 mm not shown), both
in fine and coarse fractions. These compounds derive
Fig. 7. Down-core profile of total unsaturated acids and iso
and anteiso acids (<63 mm; Gormire core G3; Distributions ofunsaturated acids are dominated by C16:1 and C18:1, with minor
contributions from C18:2 and C17:1; see Table 3) (<63 mm;Gormire core G3). Filled triangles, total iso- and anteiso- acids.
Filled circles, total alkenoic acids.
E. Fisher et al. / Organic Geochemistry 34 (2003) 105–119 113
largely from autochthonous algae and bacteria, respec-tively (e.g. Oliver and Colwell, 1973; Morris and Culkin,1976; Volkman and Johns, 1977; Perry et al., 1979;Volkman et al., 1980; Parkes and Taylor, 1983; Fre-
drickson et al., 1986; Cranwell et al., 1987). They arepresent in relatively higher concentrations in the finefractions of the sediments (Table 3) and their con-
centration profiles in the sediment cores probably reflectthe relative lability of the autochthonous OM. Hence,the unsaturated acids may be relatively rapidly degra-
ded, whilst decreasing concentrations of the bacterialmarkers may reflect a decreasing active population ofmicroorganisms with increasing sediment depth, which
in turn reflects the increasingly refractory nature of theaging sediment OM. Alternatively, the concentrationprofiles could also reflect recent gradually increasinglake productivity (Pratono and Wolff, 1998).
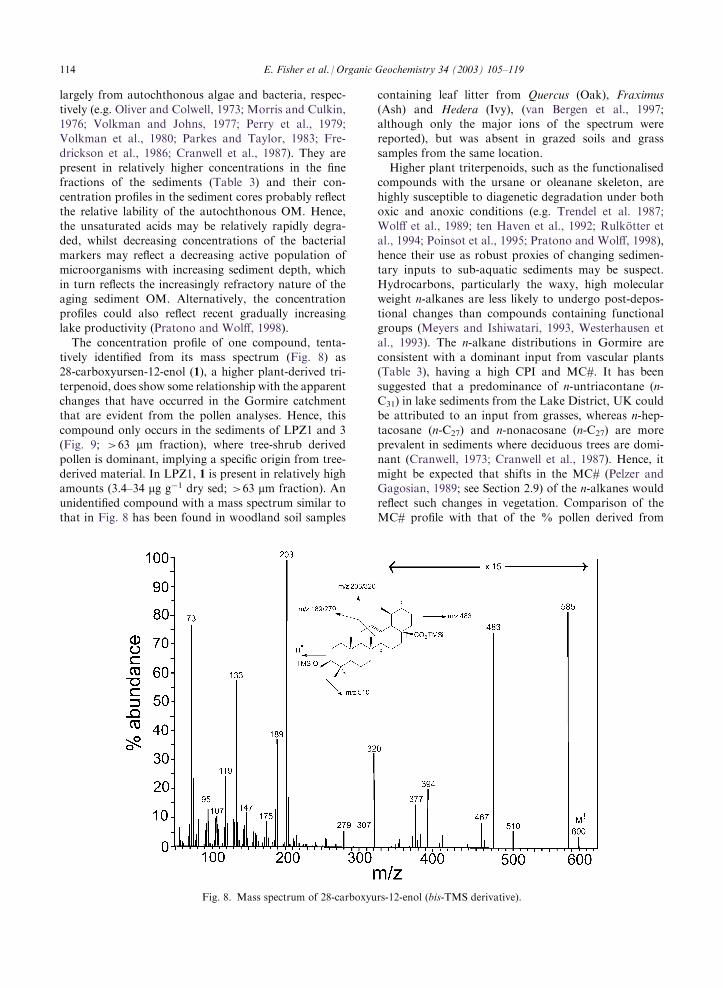
The concentration profile of one compound, tenta-tively identified from its mass spectrum (Fig. 8) as28-carboxyursen-12-enol (1), a higher plant-derived tri-
terpenoid, does show some relationship with the apparentchanges that have occurred in the Gormire catchmentthat are evident from the pollen analyses. Hence, this
compound only occurs in the sediments of LPZ1 and 3(Fig. 9; >63 mm fraction), where tree-shrub derivedpollen is dominant, implying a specific origin from tree-
derived material. In LPZ1, 1 is present in relatively highamounts (3.4–34 mg g�1 dry sed; >63 mm fraction). Anunidentified compound with a mass spectrum similar tothat in Fig. 8 has been found in woodland soil samples
containing leaf litter from Quercus (Oak), Fraximus(Ash) and Hedera (Ivy), (van Bergen et al., 1997;although only the major ions of the spectrum werereported), but was absent in grazed soils and grass
samples from the same location.Higher plant triterpenoids, such as the functionalised
compounds with the ursane or oleanane skeleton, are
highly susceptible to diagenetic degradation under bothoxic and anoxic conditions (e.g. Trendel et al. 1987;Wolff et al., 1989; ten Haven et al., 1992; Rulkotter et
al., 1994; Poinsot et al., 1995; Pratono and Wolff, 1998),hence their use as robust proxies of changing sedimen-tary inputs to sub-aquatic sediments may be suspect.
Hydrocarbons, particularly the waxy, high molecularweight n-alkanes are less likely to undergo post-depos-tional changes than compounds containing functionalgroups (Meyers and Ishiwatari, 1993, Westerhausen et
al., 1993). The n-alkane distributions in Gormire areconsistent with a dominant input from vascular plants(Table 3), having a high CPI and MC#. It has been
suggested that a predominance of n-untriacontane (n-C31) in lake sediments from the Lake District, UK couldbe attributed to an input from grasses, whereas n-hep-
tacosane (n-C27) and n-nonacosane (n-C27) are moreprevalent in sediments where deciduous trees are domi-nant (Cranwell, 1973; Cranwell et al., 1987). Hence, it
might be expected that shifts in the MC# (Pelzer andGagosian, 1989; see Section 2.9) of the n-alkanes wouldreflect such changes in vegetation. Comparison of theMC# profile with that of the % pollen derived from
Fig. 8. Mass spectrum of 28-carboxyurs-12-enol (bis-TMS derivative).
114 E. Fisher et al. / Organic Geochemistry 34 (2003) 105–119
trees and shrubs (Fig. 10) shows an extremely close fit.
Hence, samples from LPZ1 and 3, which according topollen analyses reflect periods when the catchment wasforested, have a significantly lower MC# (28–28.5) thansamples collected in LPZ2 and 4 (MC# 29–29.5), which
are associated with periods of deforestation. Similarobservations have been made in lake sediments (Ho andMeyers, 1994) and soils (van Bergen et al., 1997), where
subtle changes in n-alkane distributions have been
ascribed to changing land plant cover. The exceptionallyclose relationship between pollen and the n-alkane MC#suggests that the latter parameter is a very sensitiveindicator that mirrors rather subtle changes in the pol-
len abundance (Fig. 10, see LPZ2) and may be a valu-able tool in palaeoenvironmental studies in similar highlatitude, humid environments.
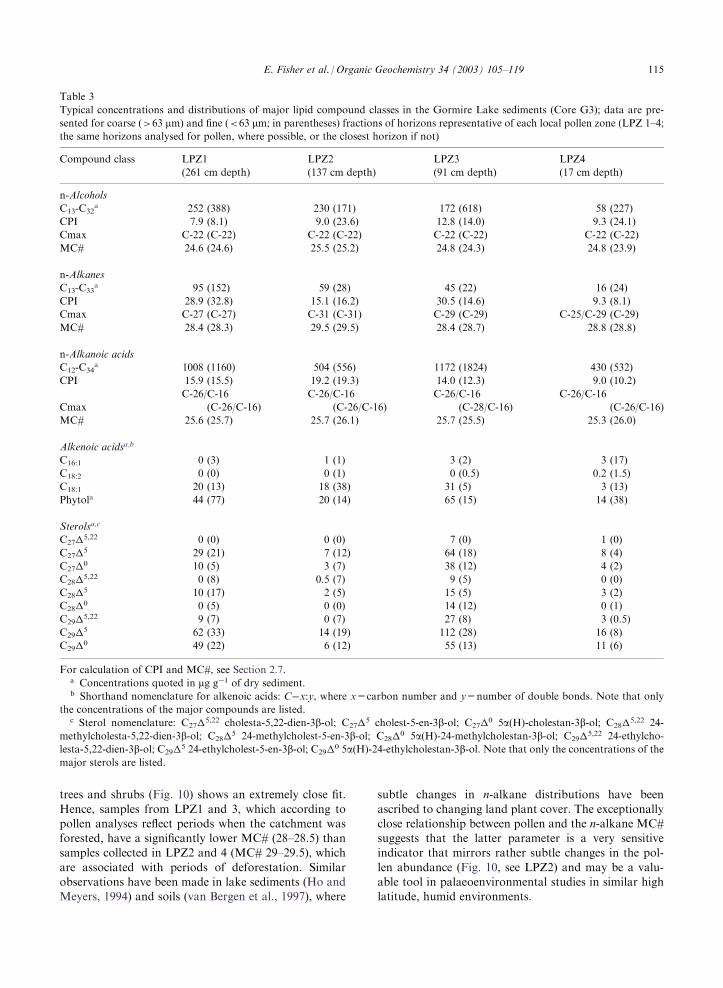
Table 3
Typical concentrations and distributions of major lipid compound classes in the Gormire Lake sediments (Core G3); data are pre-
sented for coarse (>63 mm) and fine (<63 mm; in parentheses) fractions of horizons representative of each local pollen zone (LPZ 1–4;the same horizons analysed for pollen, where possible, or the closest horizon if not)
Compound class LPZ1
(261 cm depth)
LPZ2
(137 cm depth)
LPZ3
(91 cm depth)
LPZ4
(17 cm depth)
n-Alcohols
C13-C32a 252 (388) 230 (171) 172 (618) 58 (227)
CPI 7.9 (8.1) 9.0 (23.6) 12.8 (14.0) 9.3 (24.1)
Cmax C-22 (C-22) C-22 (C-22) C-22 (C-22) C-22 (C-22)
MC# 24.6 (24.6) 25.5 (25.2) 24.8 (24.3) 24.8 (23.9)
n-Alkanes
C13-C33a 95 (152) 59 (28) 45 (22) 16 (24)
CPI 28.9 (32.8) 15.1 (16.2) 30.5 (14.6) 9.3 (8.1)
Cmax C-27 (C-27) C-31 (C-31) C-29 (C-29) C-25/C-29 (C-29)
MC# 28.4 (28.3) 29.5 (29.5) 28.4 (28.7) 28.8 (28.8)
n-Alkanoic acids
C12-C34a 1008 (1160) 504 (556) 1172 (1824) 430 (532)
CPI 15.9 (15.5) 19.2 (19.3) 14.0 (12.3) 9.0 (10.2)
C-26/C-16 C-26/C-16 C-26/C-16 C-26/C-16
Cmax (C-26/C-16) (C-26/C-16) (C-28/C-16) (C-26/C-16)
MC# 25.6 (25.7) 25.7 (26.1) 25.7 (25.5) 25.3 (26.0)
Alkenoic acidsa,b
C16:1 0 (3) 1 (1) 3 (2) 3 (17)
C18:2 0 (0) 0 (1) 0 (0.5) 0.2 (1.5)
C18:1 20 (13) 18 (38) 31 (5) 3 (13)
Phytola 44 (77) 20 (14) 65 (15) 14 (38)
Sterolsa,c
C27�5,22 0 (0) 0 (0) 7 (0) 1 (0)
C27�5 29 (21) 7 (12) 64 (18) 8 (4)
C27�0 10 (5) 3 (7) 38 (12) 4 (2)
C28�5,22 0 (8) 0.5 (7) 9 (5) 0 (0)
C28�5 10 (17) 2 (5) 15 (5) 3 (2)
C28�0 0 (5) 0 (0) 14 (12) 0 (1)
C29�5,22 9 (7) 0 (7) 27 (8) 3 (0.5)
C29�5 62 (33) 14 (19) 112 (28) 16 (8)
C29�0 49 (22) 6 (12) 55 (13) 11 (6)
For calculation of CPI and MC#, see Section 2.7.a Concentrations quoted in mg g�1 of dry sediment.b Shorthand nomenclature for alkenoic acids: C�x:y, where x=carbon number and y=number of double bonds. Note that only
the concentrations of the major compounds are listed.c Sterol nomenclature: C27�
5,22 cholesta-5,22-dien-3b-ol; C27�5 cholest-5-en-3b-ol; C27�0 5a(H)-cholestan-3b-ol; C28�5,22 24-methylcholesta-5,22-dien-3b-ol; C28�5 24-methylcholest-5-en-3b-ol; C28�0 5a(H)-24-methylcholestan-3b-ol; C29�5,22 24-ethylcho-lesta-5,22-dien-3b-ol; C29�5 24-ethylcholest-5-en-3b-ol; C29�0 5a(H)-24-ethylcholestan-3b-ol. Note that only the concentrations of themajor sterols are listed.
E. Fisher et al. / Organic Geochemistry 34 (2003) 105–119 115

3.2.2. Macromolecular componentsFlash pyrolysis with in situ methylation (thermo-
chemolysis) using tetramethylammonium hydroxide(TMAH) of selected Gormire sediment samples was
carried out in order to assess the influence of changingcatchment characteristics on the macromolecular OM,particularly the lignin. It should be noted that the yields
of phenol derivatives released by thermochemolysis aresimilar to the release of phenols by CuO oxidation ofplant tissues (Hatcher et al., 1995). Total yields of phe-
nol derivatives (�, concentration normalised per 100 mgTOC; Hatcher et al., 1995) from catchment peats, wood
and grassland soils analysed in the present study were�3.5, 2.2 and �3.9, respectively, which are of the sameorder as those determined for degraded wood samplesby Hatcher et al. (1995). Maximum values of � for the
lake sediments were �20. These values are clearly notabsolute, because they were determined with respect tothe pyrolysis of an internal standard polymer (t-butyl
polystyrene), which yields t-butylstyrene, as its domi-nant (>95%) pyrolysis product via C–C bond cleavage.The lignin phenol derivatives are, on the other hand,
produced via cleavage of ether linkages in lignin (Clif-ford et al., 1995), hence, relative response factors for thelignin phenols are unlikely to have been 1 (as assumed;
see 2.7). Nevertheless, the reproducibility of the pyr-olyses was satisfactory (see 2.7), so the relative changesbetween samples are likely to reflect real changes in lig-nin composition and concentration.
The yields of lignin products (relative to TOC) variedbetween zones (Fig. 11; Table 4), most notably theirlevels in LPZ2 were higher than in the other zones (� up
to �20). The relative concentrations of the cinnamyl(C), vanillyl (V) and syringyl (S) phenols decrease inproportion to the extent of dilution of vascular plant
remains by other types of non-lignified remains (Hedgesand Mann, 1979). Hence, the decrease in the overallproportion of total phenol methylated derivatives in
LPZ 3 and 4 may reflect the increase in the proportionof autochthonous material in these zones (see 3.1 and3.2.1). The relative proportions of C phenol derivativeswere highest in the LPZ 2 samples, which is consistent
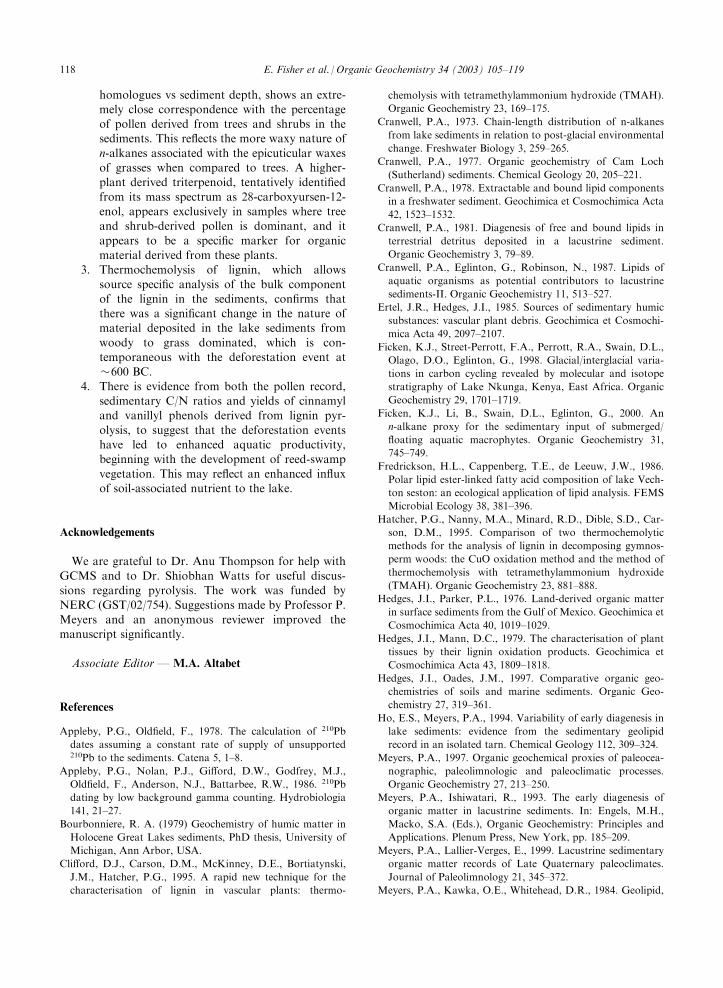
with the apparent increase in grasses in the catchmentarea during this period. This is also evident from the C/V profile (Fig. 12; high values reflect a relatively high
input of non-woody vs. woody OM; Hedges and Mann,
Fig. 9. Comparison of % pollen from trees and shrubs with the
concentration of 28-carboxyurs-12-enol (>63 mm sediment
fraction, Gormire Core G3).
Fig. 10. Down-core profile of mean carbon number (MC#) for
n-alkanes plotted against % pollen derived from grass (>63 mmsediment fraction, Gormire core G3).
Fig. 11. Down-core profile of syringyl, guaiacyl and cinnamyl
phenols (Table 4) in Gormire lake sediments.
116 E. Fisher et al. / Organic Geochemistry 34 (2003) 105–119
1979; Saiz-Jimenez and de Leeuw, 1985), which showselevated values in LPZ 2 (deforested catchment) when
compared to LPZ 1. However, C/V values remain highin LPZ 3 (reforestation of catchment) and decreaseagain in LPZ 4 (deforestation of catchment). As
non-lignin OM does not influence this parameter, it ispossible that the difference in C/V values between LPZ 1
and 3, when the catchment was dominated by wood-land, reflects the larger contribution of OM derivedfrom emergent reed swamp plants to the sediments in
LPZ 3.
4. Conclusions
The organic geochemistry of the Gormire Lake sedi-ments reflects its changing environment over the past
3000 years. The integration of data from detailed ana-lysis of the organic matter in the lake with that obtainedby classical palaeolimnology, leads to convincing evi-
dence of a changing environment in the catchment area.
1. Comparison with the pollen inputs shows that
during periods of deforestation, which com-menced at �600 BC and AD 1200, there was asignificant decrease in organic carbon contentsof the lake sediments, which probably reflects
dilution by an enhanced influx of clastic material.2. The mean carbon number of n-alkanes, which
are dominated by high molecular weight (>C25)
Fig. 12. Down-core profile of C/V (Table 4) ratio in Gormire
core G3.
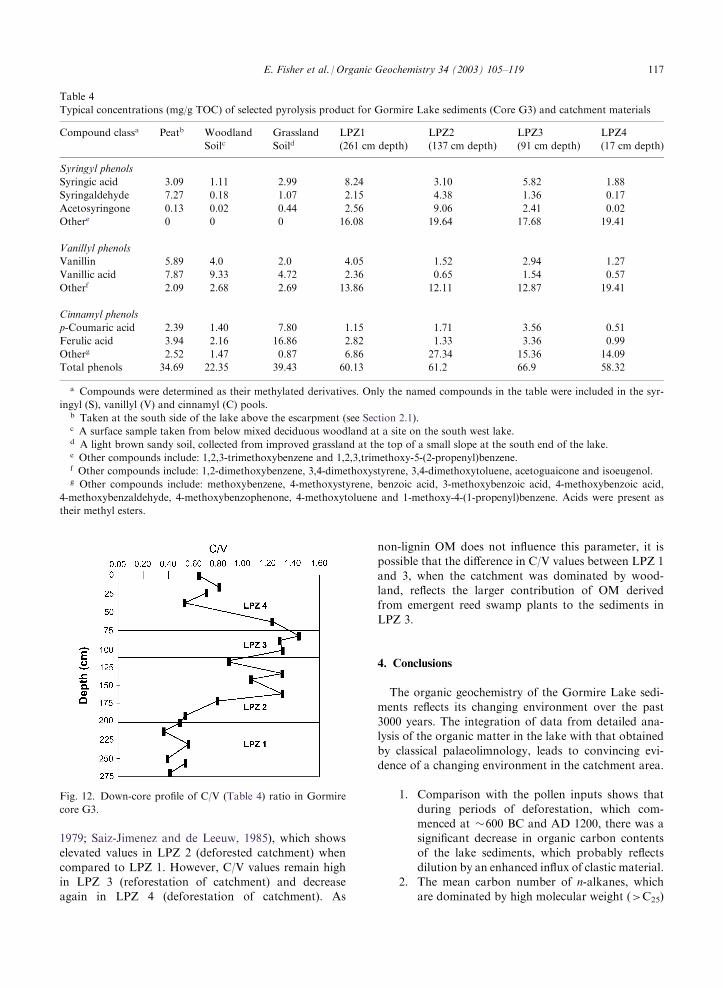
Table 4
Typical concentrations (mg/g TOC) of selected pyrolysis product for Gormire Lake sediments (Core G3) and catchment materials
Compound classa Peatb Woodland
SoilcGrassland
SoildLPZ1
(261 cm depth)
LPZ2
(137 cm depth)
LPZ3
(91 cm depth)
LPZ4
(17 cm depth)
Syringyl phenols
Syringic acid 3.09 1.11 2.99 8.24 3.10 5.82 1.88
Syringaldehyde 7.27 0.18 1.07 2.15 4.38 1.36 0.17
Acetosyringone 0.13 0.02 0.44 2.56 9.06 2.41 0.02
Othere 0 0 0 16.08 19.64 17.68 19.41
Vanillyl phenols
Vanillin 5.89 4.0 2.0 4.05 1.52 2.94 1.27
Vanillic acid 7.87 9.33 4.72 2.36 0.65 1.54 0.57
Otherf 2.09 2.68 2.69 13.86 12.11 12.87 19.41
Cinnamyl phenols
p-Coumaric acid 2.39 1.40 7.80 1.15 1.71 3.56 0.51
Ferulic acid 3.94 2.16 16.86 2.82 1.33 3.36 0.99
Otherg 2.52 1.47 0.87 6.86 27.34 15.36 14.09
Total phenols 34.69 22.35 39.43 60.13 61.2 66.9 58.32
a Compounds were determined as their methylated derivatives. Only the named compounds in the table were included in the syr-
ingyl (S), vanillyl (V) and cinnamyl (C) pools.b Taken at the south side of the lake above the escarpment (see Section 2.1).c A surface sample taken from below mixed deciduous woodland at a site on the south west lake.d A light brown sandy soil, collected from improved grassland at the top of a small slope at the south end of the lake.e Other compounds include: 1,2,3-trimethoxybenzene and 1,2,3,trimethoxy-5-(2-propenyl)benzene.f Other compounds include: 1,2-dimethoxybenzene, 3,4-dimethoxystyrene, 3,4-dimethoxytoluene, acetoguaicone and isoeugenol.g Other compounds include: methoxybenzene, 4-methoxystyrene, benzoic acid, 3-methoxybenzoic acid, 4-methoxybenzoic acid,
4-methoxybenzaldehyde, 4-methoxybenzophenone, 4-methoxytoluene and 1-methoxy-4-(1-propenyl)benzene. Acids were present as
their methyl esters.
E. Fisher et al. / Organic Geochemistry 34 (2003) 105–119 117
homologues vs sediment depth, shows an extre-mely close correspondence with the percentageof pollen derived from trees and shrubs in thesediments. This reflects the more waxy nature of
n-alkanes associated with the epicuticular waxesof grasses when compared to trees. A higher-plant derived triterpenoid, tentatively identified
from its mass spectrum as 28-carboxyursen-12-enol, appears exclusively in samples where treeand shrub-derived pollen is dominant, and it
appears to be a specific marker for organicmaterial derived from these plants.
3. Thermochemolysis of lignin, which allows
source specific analysis of the bulk componentof the lignin in the sediments, confirms thatthere was a significant change in the nature ofmaterial deposited in the lake sediments from
woody to grass dominated, which is con-temporaneous with the deforestation event at�600 BC.
4. There is evidence from both the pollen record,sedimentary C/N ratios and yields of cinnamyland vanillyl phenols derived from lignin pyr-
olysis, to suggest that the deforestation eventshave led to enhanced aquatic productivity,beginning with the development of reed-swamp
vegetation. This may reflect an enhanced influxof soil-associated nutrient to the lake.
Acknowledgements
We are grateful to Dr. Anu Thompson for help with
GCMS and to Dr. Shiobhan Watts for useful discus-sions regarding pyrolysis. The work was funded byNERC (GST/02/754). Suggestions made by Professor P.
Meyers and an anonymous reviewer improved themanuscript significantly.
Associate Editor— M.A. Altabet
References
Appleby, P.G., Oldfield, F., 1978. The calculation of 210Pb
dates assuming a constant rate of supply of unsupported210Pb to the sediments. Catena 5, 1–8.
Appleby, P.G., Nolan, P.J., Gifford, D.W., Godfrey, M.J.,
Oldfield, F., Anderson, N.J., Battarbee, R.W., 1986. 210Pb
dating by low background gamma counting. Hydrobiologia
141, 21–27.
Bourbonniere, R. A. (1979) Geochemistry of humic matter in
Holocene Great Lakes sediments, PhD thesis, University of
Michigan, Ann Arbor, USA.
Clifford, D.J., Carson, D.M., McKinney, D.E., Bortiatynski,
J.M., Hatcher, P.G., 1995. A rapid new technique for the
characterisation of lignin in vascular plants: thermo-
chemolysis with tetramethylammonium hydroxide (TMAH).
Organic Geochemistry 23, 169–175.
Cranwell, P.A., 1973. Chain-length distribution of n-alkanes
from lake sediments in relation to post-glacial environmental
change. Freshwater Biology 3, 259–265.
Cranwell, P.A., 1977. Organic geochemistry of Cam Loch
(Sutherland) sediments. Chemical Geology 20, 205–221.
Cranwell, P.A., 1978. Extractable and bound lipid components
in a freshwater sediment. Geochimica et Cosmochimica Acta
42, 1523–1532.
Cranwell, P.A., 1981. Diagenesis of free and bound lipids in
terrestrial detritus deposited in a lacustrine sediment.
Organic Geochemistry 3, 79–89.
Cranwell, P.A., Eglinton, G., Robinson, N., 1987. Lipids of
aquatic organisms as potential contributors to lacustrine
sediments-II. Organic Geochemistry 11, 513–527.
Ertel, J.R., Hedges, J.I., 1985. Sources of sedimentary humic
substances: vascular plant debris. Geochimica et Cosmochi-
mica Acta 49, 2097–2107.
Ficken, K.J., Street-Perrott, F.A., Perrott, R.A., Swain, D.L.,
Olago, D.O., Eglinton, G., 1998. Glacial/interglacial varia-
tions in carbon cycling revealed by molecular and isotope
stratigraphy of Lake Nkunga, Kenya, East Africa. Organic
Geochemistry 29, 1701–1719.
Ficken, K.J., Li, B., Swain, D.L., Eglinton, G., 2000. An
n-alkane proxy for the sedimentary input of submerged/
floating aquatic macrophytes. Organic Geochemistry 31,
745–749.
Fredrickson, H.L., Cappenberg, T.E., de Leeuw, J.W., 1986.
Polar lipid ester-linked fatty acid composition of lake Vech-
ton seston: an ecological application of lipid analysis. FEMS
Microbial Ecology 38, 381–396.
Hatcher, P.G., Nanny, M.A., Minard, R.D., Dible, S.D., Car-
son, D.M., 1995. Comparison of two thermochemolytic
methods for the analysis of lignin in decomposing gymnos-
perm woods: the CuO oxidation method and the method of
thermochemolysis with tetramethylammonium hydroxide
(TMAH). Organic Geochemistry 23, 881–888.
Hedges, J.I., Parker, P.L., 1976. Land-derived organic matter
in surface sediments from the Gulf of Mexico. Geochimica et
Cosmochimica Acta 40, 1019–1029.
Hedges, J.I., Mann, D.C., 1979. The characterisation of plant
tissues by their lignin oxidation products. Geochimica et
Cosmochimica Acta 43, 1809–1818.
Hedges, J.I., Oades, J.M., 1997. Comparative organic geo-
chemistries of soils and marine sediments. Organic Geo-
chemistry 27, 319–361.
Ho, E.S., Meyers, P.A., 1994. Variability of early diagenesis in
lake sediments: evidence from the sedimentary geolipid
record in an isolated tarn. Chemical Geology 112, 309–324.
Meyers, P.A., 1997. Organic geochemical proxies of paleocea-
nographic, paleolimnologic and paleoclimatic processes.
Organic Geochemistry 27, 213–250.
Meyers, P.A., Ishiwatari, R., 1993. The early diagenesis of
organic matter in lacustrine sediments. In: Engels, M.H.,
Macko, S.A. (Eds.), Organic Geochemistry: Principles and
Applications. Plenum Press, New York, pp. 185–209.
Meyers, P.A., Lallier-Verges, E., 1999. Lacustrine sedimentary
organic matter records of Late Quaternary paleoclimates.
Journal of Paleolimnology 21, 345–372.
Meyers, P.A., Kawka, O.E., Whitehead, D.R., 1984. Geolipid,
118 E. Fisher et al. / Organic Geochemistry 34 (2003) 105–119
pollen and diatom stratigraphy in postglacial lacustrine sedi-
ments. Organic Geochemistry 6, 727–732.
Morris, R.J., Culkin, F., 1976. Marine lipids: analytical tech-
niques and fatty acid ester analyses. Oceanography Marine
Biology Annual Review 14, 391–433.
Oldfield, F., Crooks, P.R.J., Harkness, D.D., Petterson, G.,
1997. AMS radiocarbon dating of organic fractions from
varved lake sediments: an empirical test of reliability. Journal
of Palaeolmnology 18, 87–91.
Oldfield F., Wake R., Boyle J., Jones R., Nolan S., Gibbs Z.,
Appleby P., Fisher E., Wolff G. The Late-Holocene history of
Gormire Lake (N.E. England) and its catchment: a multi-proxy
reconstruction of past human impact.Holocene, in press.
O’Sullivan P.E., Oldfield F., Battarbee R.W. (1973) Pre-
liminary studies of Lough Neagh sediments. I, Stratigraphy,
Chronology and Pollen-analysis. In Birks, J.B., West, R.G.
(Eds.), Quaternary Plant Ecology (British Ecological Society
Symposium Volume No. 14). Blackwells, pp. 267–278.
Oliver, J.O., Colwell, R.R., 1973. Extractable lipids of gram-
negative marine bacteria: fatty acid composition. Interna-
tional Journal of Systematic Bacteriology 23, 442–458.
Ostrom, P.H., Ostrom, P.E., Henry, J., Eadie, B.J., Meyers,
P.A., Robbins, J.A., 1998. Changes in trophic status of Lake
Erie: discordance between molecular d13C and bulk d13Csedimentary records. Chemical Geology 152, 163–179.
Parkes, R.J., Taylor, J., 1983. The relationship between fatty
acid distribution and bacterial respiration in contemporary
marine sediments. Estuarine, Coast and Shelf Science 16,
173–189.
Pelzer, E.T., Gagosian, R.B., 1989. Organic geochemistry of
aerosols over the Pacific Ocean. In: Duce, R.A. et al. (Ed.),
Chemical Oceanography, Volume 10. Academic Press, Lon-
don, pp. 281–338.
Perry, G.J., Volkman, J.K., Johns, R.B., Bavor Jr., H.J., 1979.
Fatty acids of bacterial origin in contemporary marine sedi-
ments. Geochimica et Cosmochimica Acta 43, 1715–1725.
Poinsot, J., Adam, P., Trendel, J.M., Connan, J., Albrecht, P.,
1995. Diagenesis of higher plant triterpenes in evaporitic
sediments. Geochimica et Cosmochimica Acta 59, 4653–
4661.
Prartono, T., Wolff, G.A., 1998. Organic geochemistry of
lacustrine sediments: evidence for the changing trophic status
of the lake, Rostherne Mere, UK. Organic Geochemistry 28,
729–747.
Renberg, I., Brannvall, M.L., Bindler, R., Emteryd, O., 2000.
Atmospheric lead pollution history during four millennia
(2000 BC to 2000 AD) in Sweden. Ambio 29, 150–156.
Rieley, G., Collier, R.J., Jones, D.M., Eglinton, G., Eakin,
P.A., Fallick, A.E., 1991. Sources of sedimentary lipids
deduced from stable carbon-isotope analyses of individual
compounds. Nature 352, 425–427.
Rullkotter, J., Peakman, T.M., ten Haven, H.L., 1994. Early
diagenesis of terrigenous triterpenoids and its implications
for peroleum geochemistry. Organic Geochemistry 21, 215–
233.
Saiz-Jimenez, C., De Leeuw, J.W., 1985. Lignin pyrolysis pro-
ducts: their structures and their significance as biomarkers.
Organic Geochemistry 10, 869–876.
Schelske, C.L., Stoermer, E.F., Conley, D.J., Robbins, J.A.,
Glover, R.M., 1983. Early eutrophication in the Lower
Great Lakes: new evidence from biogenic silica in sediments.
Science 222, 320–322.
Schelske, C.L., Hodell, D.A., 1995. Using carbon isotopes of
bulk sedimentary organic matter to reconstruct the history of
nutrient loading and eutrophication in Lake Erie. Limnology
and Oceanography 40, 918–929.
ten Haven, H.L., Peakman, T.M., Rullkotter, J., 1992. Early
diagenetic transformation of higher plant triterpenoids in
deep-sea sediments from Baffin Bay. Geochimica et Cosmo-
chimica Acta 56, 2001–2004.
Trendel, J.M., Lohmann, F., Kintzinger, J.P., Albrecht, P.,
1989. Identification of des-A-triterpenoid hydrocarbons
occuring in surface sediments. Tetrahedron 45, 4457–4470.
van Bergen, P.F., Bull, I.D., Poulton, P.R., Evershed, R.P.,
1997. Organic geochemical studies of soils from Rothamsted
Classical Experiments-I. Total lipid extracts, solvent inso-
luble residues and humic acids from Broadbalk Wilderness.
Organic Geochemistry 26, 117–135.
Volkman, J.K., Johns, R.B., 1977. The geochemical sig-
nificance of positional isomers of unsaturated acids from an
intertidal zone sediment. Nature 267, 693–694.
Volkman, J.K., Johns, R.B., Gillan, F.T., Perry, G.J., Bavor,
H.J., 1980. Microbial lipids of an intertidal sediment-I. Fatty
acids and hydrocarbons. Geochimica et Cosmochimica Acta
44, 1133–1143.
Westerhausen, L., Poynter, J., Eglinton, G., Erlenkeuser, H.,
Sarntheim, M., 1993. Marine and terrigenous origin of
organic matter in modern sediments of the equatorial east
Atlantic—the delta C-13 and molecular record. Deep-Sea
Research I 40, 1087–1121.
Wolff, G.A., Trendel, J.M., Albrecht, P., 1989. Novel mono-
aromatic triterpenoid hydrocarbons occuring in sediments.
Tetrahedron 45, 6721–6728.
Wunsche, L., Gulacar, F.O., Buchs, A., 1987. Several unex-
pected marine sterols in a freshwater environment. Organic
Geochemistry 11, 215–219.
E. Fisher et al. / Organic Geochemistry 34 (2003) 105–119 119