Molecular Evolution of Vertebrate Neurotrophins: Co- Option of the Highly Conserved Nerve Growth...
19
Molecular Evolution of Vertebrate Neurotrophins: Co- Option of the Highly Conserved Nerve Growth Factor Gene into the Advanced Snake Venom Arsenalf Kartik Sunagar 1,2 , Bryan Grieg Fry 3,4 , Timothy N. W. Jackson 3,4 , Nicholas R. Casewell 5,6 , Eivind A. B. Undheim 3,4 , Nicolas Vidal 7 , Syed A. Ali 3,8 , Glenn F. King 4 , Karthikeyan Vasudevan 9 , Vitor Vasconcelos 1,2 , Agostinho Antunes 1,2* 1 CIMAR/CIIMAR, Centro Interdisciplinar de Investigação Marinha e Ambiental, Universidade do Porto, Porto, Portugal, 2 Departamento de Biologia, Faculdade de Ciências, Universidade do Porto, Porto, Portugal, 3 Venom Evolution Lab, School of Biological Sciences, The University of Queensland, St. Lucia, Queensland, Australia, 4 Institute for Molecular Bioscience, University of Queenland, St Lucia, Queensland, Australia, 5 Molecular Ecology and Evolution Group, School of Biological Sciences, Bangor University, Bangor, United Kingdom, 6 Alistair Reid Venom Research Unit, Liverpool School of Tropical Medicine, Liverpool, United Kingdom, 7 Département Systématique et Evolution, Service de Systématique Moléculaire, UMR 7138, Muséum National d’Histoire Naturelle, Paris, France, 8 HEJ Research Institute of Chemistry, International Center for Chemical and Biological Sciences (ICCBS), University of Karachi, Karachi, Pakistan, 9 Wildlife Institute of India, Dehradun, Uttarakhand, India Abstract Neurotrophins are a diverse class of structurally related proteins, essential for neuronal development, survival, plasticity and regeneration. They are characterized by major family members, such as the nerve growth factors (NGF), brain-derived neurotrophic factors (BDNF) and neurotrophin-3 (NT-3), which have been demonstrated here to lack coding sequence variations and follow the regime of negative selection, highlighting their extremely important conserved role in vertebrate homeostasis. However, in stark contrast, venom NGF secreted as part of the chemical arsenal of the venomous advanced snake family Elapidae (and to a lesser extent Viperidae) have characteristics consistent with the typical accelerated molecular evolution of venom components. This includes a rapid rate of diversification under the significant influence of positive-selection, with the majority of positively-selected sites found in the secreted β-polypeptide chain (74%) and on the molecular surface of the protein (92%), while the core structural and functional residues remain highly constrained. Such focal mutagenesis generates active residues on the toxin molecular surface, which are capable of interacting with novel biological targets in prey to induce a myriad of pharmacological effects. We propose that caenophidian NGFs could participate in prey-envenoming by causing a massive release of chemical mediators from mast cells to mount inflammatory reactions and increase vascular permeability, thereby aiding the spread of other toxins and/or by acting as proapoptotic factors. Despite their presence in reptilian venom having been known for over 60 years, this is the first evidence that venom-secreted NGF follows the molecular evolutionary pattern of other venom components, and thus likely participates in prey- envenomation. Citation: Sunagar K, Fry BG, Jackson TNW, Casewell NR, Undheim EAB, et al. (2013) Molecular Evolution of Vertebrate Neurotrophins: Co-Option of the Highly Conserved Nerve Growth Factor Gene into the Advanced Snake Venom Arsenalf. PLoS ONE 8(11): e81827. doi:10.1371/journal.pone.0081827 Editor: Christine A. Kozak, National Institute of Allergy and Infectious Diseases, United States of America Received July 8, 2013; Accepted October 17, 2013; Published November 29, 2013 Copyright: © 2013 Kartik Sunagar. This is an open-access article distributed under the terms of the Creative Commons Attribution License, which permits unrestricted use, distribution, and reproduction in any medium, provided the original author and source are credited. Funding: KS was funded by PhD grant (SFRH/BD/61959/2009) from F.C.T (Fundação para a Ciência e a Tecnologia). BGF was funded by an Australian Research Council Future Fellowship and by the University of Queensland. TNWJ was funded by an Australian Postgraduate Award. NRC was funded by fellowship award (NE/J018678/1) from the Natural Environment Research Council, UK. EABU acknowledges funding from the University of Queensland (International Postgraduate Research Scholarship, UQ Centennial Scholarship, and UQ Advantage Top-Up Scholarship) and the Norwegian State Education Loans Fund. NV was funded by the 'Service de Systématique Moléculaire' of the Muséum National d'Histoire Naturelle [UMS 2700 (OMSI)]. GFK was funded by Australian Research Council Discovery Grant DP130103813. SAA was the recipient of postdoctoral fellowship (PDRF Phase II Batch-V) from Higher Education Commission (HEC Islamabad) Pakistan. AA was partially supported by the European Regional Development Fund (ERDF) through the COMPETE - Operational Competitiveness Programme and national funds through F.C.T under the projects PEst-C/MAR/LA0015/2013, PTDC/AAC- AMB/104983/2008 (FCOMP-01-0124-FEDER-008610) and PTDC/AAC-AMB/121301/2010 (FCOMP-01-0124-FEDER-019490). The funders had no role in study design, data collection and analysis, decision to publish, or preparation of the manuscript. Competing interests: The authors have declared that no competing interests exist. * E-mail: [email protected] PLOS ONE | www.plosone.org 1 November 2013 | Volume 8 | Issue 11 | e81827
Transcript of Molecular Evolution of Vertebrate Neurotrophins: Co- Option of the Highly Conserved Nerve Growth...

Molecular Evolution of Vertebrate Neurotrophins: Co-Option of the Highly Conserved Nerve Growth FactorGene into the Advanced Snake Venom ArsenalfKartik Sunagar1,2, Bryan Grieg Fry3,4, Timothy N. W. Jackson3,4, Nicholas R. Casewell5,6, Eivind A. B.Undheim3,4, Nicolas Vidal7, Syed A. Ali3,8, Glenn F. King4, Karthikeyan Vasudevan9, Vitor Vasconcelos1,2,Agostinho Antunes1,2*
1 CIMAR/CIIMAR, Centro Interdisciplinar de Investigação Marinha e Ambiental, Universidade do Porto, Porto, Portugal, 2 Departamento de Biologia, Faculdadede Ciências, Universidade do Porto, Porto, Portugal, 3 Venom Evolution Lab, School of Biological Sciences, The University of Queensland, St. Lucia,Queensland, Australia, 4 Institute for Molecular Bioscience, University of Queenland, St Lucia, Queensland, Australia, 5 Molecular Ecology and Evolution Group,School of Biological Sciences, Bangor University, Bangor, United Kingdom, 6 Alistair Reid Venom Research Unit, Liverpool School of Tropical Medicine,Liverpool, United Kingdom, 7 Département Systématique et Evolution, Service de Systématique Moléculaire, UMR 7138, Muséum National d’Histoire Naturelle,Paris, France, 8 HEJ Research Institute of Chemistry, International Center for Chemical and Biological Sciences (ICCBS), University of Karachi, Karachi,Pakistan, 9 Wildlife Institute of India, Dehradun, Uttarakhand, India
Abstract
Neurotrophins are a diverse class of structurally related proteins, essential for neuronal development, survival,plasticity and regeneration. They are characterized by major family members, such as the nerve growth factors(NGF), brain-derived neurotrophic factors (BDNF) and neurotrophin-3 (NT-3), which have been demonstrated here tolack coding sequence variations and follow the regime of negative selection, highlighting their extremely importantconserved role in vertebrate homeostasis. However, in stark contrast, venom NGF secreted as part of the chemicalarsenal of the venomous advanced snake family Elapidae (and to a lesser extent Viperidae) have characteristicsconsistent with the typical accelerated molecular evolution of venom components. This includes a rapid rate ofdiversification under the significant influence of positive-selection, with the majority of positively-selected sites foundin the secreted β-polypeptide chain (74%) and on the molecular surface of the protein (92%), while the core structuraland functional residues remain highly constrained. Such focal mutagenesis generates active residues on the toxinmolecular surface, which are capable of interacting with novel biological targets in prey to induce a myriad ofpharmacological effects. We propose that caenophidian NGFs could participate in prey-envenoming by causing amassive release of chemical mediators from mast cells to mount inflammatory reactions and increase vascularpermeability, thereby aiding the spread of other toxins and/or by acting as proapoptotic factors. Despite theirpresence in reptilian venom having been known for over 60 years, this is the first evidence that venom-secreted NGFfollows the molecular evolutionary pattern of other venom components, and thus likely participates in prey-envenomation.
Citation: Sunagar K, Fry BG, Jackson TNW, Casewell NR, Undheim EAB, et al. (2013) Molecular Evolution of Vertebrate Neurotrophins: Co-Option of theHighly Conserved Nerve Growth Factor Gene into the Advanced Snake Venom Arsenalf. PLoS ONE 8(11): e81827. doi:10.1371/journal.pone.0081827
Editor: Christine A. Kozak, National Institute of Allergy and Infectious Diseases, United States of America
Received July 8, 2013; Accepted October 17, 2013; Published November 29, 2013
Copyright: © 2013 Kartik Sunagar. This is an open-access article distributed under the terms of the Creative Commons Attribution License, which permitsunrestricted use, distribution, and reproduction in any medium, provided the original author and source are credited.
Funding: KS was funded by PhD grant (SFRH/BD/61959/2009) from F.C.T (Fundação para a Ciência e a Tecnologia). BGF was funded by an AustralianResearch Council Future Fellowship and by the University of Queensland. TNWJ was funded by an Australian Postgraduate Award. NRC was funded byfellowship award (NE/J018678/1) from the Natural Environment Research Council, UK. EABU acknowledges funding from the University of Queensland(International Postgraduate Research Scholarship, UQ Centennial Scholarship, and UQ Advantage Top-Up Scholarship) and the Norwegian StateEducation Loans Fund. NV was funded by the 'Service de Systématique Moléculaire' of the Muséum National d'Histoire Naturelle [UMS 2700 (OMSI)]. GFKwas funded by Australian Research Council Discovery Grant DP130103813. SAA was the recipient of postdoctoral fellowship (PDRF Phase II Batch-V)from Higher Education Commission (HEC Islamabad) Pakistan. AA was partially supported by the European Regional Development Fund (ERDF) throughthe COMPETE - Operational Competitiveness Programme and national funds through F.C.T under the projects PEst-C/MAR/LA0015/2013, PTDC/AAC-AMB/104983/2008 (FCOMP-01-0124-FEDER-008610) and PTDC/AAC-AMB/121301/2010 (FCOMP-01-0124-FEDER-019490). The funders had no role instudy design, data collection and analysis, decision to publish, or preparation of the manuscript.
Competing interests: The authors have declared that no competing interests exist.
* E-mail: [email protected]
PLOS ONE | www.plosone.org 1 November 2013 | Volume 8 | Issue 11 | e81827
Introduction
Venom, a complex biochemical cocktail of biologically activecomponents, such as proteins, peptides, amino acids,neurotransmitters and polyamines, has underpinned thediversification and evolutionary success of several animallineages [1]. This key evolutionary innovation is employed by aplethora of animals for predation, competitor deterrence anddefence [2–5]. The scientific consensus is that venomcomponents originate via toxin recruitment events, as part ofwhich physiological protein-encoding genes are duplicated andthe new copies are selectively expressed in the venom gland[5–15]. Over the years, our understanding of the origin anddiversification of snake venoms has greatly increased, largelydue to advances in transcriptomics and proteomics [16–22].However, the precise role of certain proteins, which aresecreted as part of the biochemical venom arsenal, stillremains to be elucidated. Nerve growth factor (NGF), a keymember of the neurotrophin family, is one such class of proteinwhose presence in snake venoms has been intriguing. Sinceits discovery in the late 1950s , NGF has been reported fromthe venoms of various caenophidian (advanced) snakes,including members of the front-fanged elapid and viperidfamilies as well as from venomous lizards [23–29], but itsfunction and relative importance in snake venoms remainsunknown [8].
Neurotrophins represent a family of structurally relatedproteins, crucial for neuronal development, survival, death,regeneration and plasticity. According to the classicalneurotrophic hypothesis, neurotrophins are produced in limitingamounts and the survival of the innervating neurons isdependent on winning the competition for sufficient quantitiesof these factors [30,31]. Neurotrophins contain gene familymembers such as nerve growth factor (NGF), brain-derivedneurotrophic factor (BDNF), neurotrophin-3 (NT-3) andneurotrophin-4/5 (NT-4/5) [32–35], all of which function byinteracting with the p75 neurotrophin receptor (NTR) in theirproneurotrophin forms and various structurally relatedtropomyosin-related kinase or Tyrosine kinase receptors (Trk)in their active cleaved form [36,37]. While NGF specificallyactivates TrkA [38], BDNF and NT-4/5 interact with TrkB[36,39]. NT-3 primarily interacts with TrkC and is unique in alsobeing capable of weakly binding to both TrkA and TrkB [36].
Neurotrophins have been extensively studied not onlybecause they are perceived as one of the primary factorsresponsible for the complexity of vertebrate nervous systems,but also because of their involvement in cognition and memory.Knockout of the genes encoding NGF, BDNF and NT-3 genesis fatal in mice, highlighting the importance of these proteins forsurvival and normal neuronal development. Not surprisingly,abnormalities associated with the production of neurotrophinshave been linked with neuropathies and neurodegenerativedisorders.
In order to investigate the role of NGF in the venom ofToxicofera reptiles [24], we have investigated the molecularevolution of these proteins in reptilian (turtles; squamates:Laterata, Scinciformata, Gekkota; Toxicofera lizards:Anguimorpha and Iguania; Henophidia snakes; advanced
snakes: Elapidae, Viperidae and ‘non-front-fanged’ advancedsnakes) and mammalian lineages, by employing sophisticatedprotein and codon-level selection assessments. We furthercompare the molecular evolution of NGF with the other majormembers of the neurotrophin family, namely BDNF and NT-3,in a wide array of reptilian and mammalian lineages. Molecularevolution analyses conducted on a dataset of 1183 nucleotidesequences revealed that these genes have remained largelyunchanged since their origin over 300 million years (the splitbetween mammals and reptiles: www.timetree.org) due to theextremely important functions they play in vertebratehomeostasis.
Results
Bayesian and maximum-likelihood analyses of NGF, BDNFand NT-3 genes retrieved trees with the same topology(Figures 1-3; Figure S1-S4), which were in concordance withthe earlier reported phylogenies of neurotrophins [40].
One ratio model (ORM), the simplest of the lineage-specificmodels, computed ω of less than 0.50, therefore indicating aninfluence of negative selection on NGF, BDNF and NT-3 genesin all of the mammalian and reptilian lineages examined(Tables S1-S3). This highly conservative model can only detectpositive selection when the ω ratio averaged over all the sitesalong the lineages in a phylogenetic tree is significantly greaterthan one. Nevertheless, the computed ω of 0.86 for theElapidae NGF highlights a relatively greater accumulation ofvariation in this lineage (Table S1).
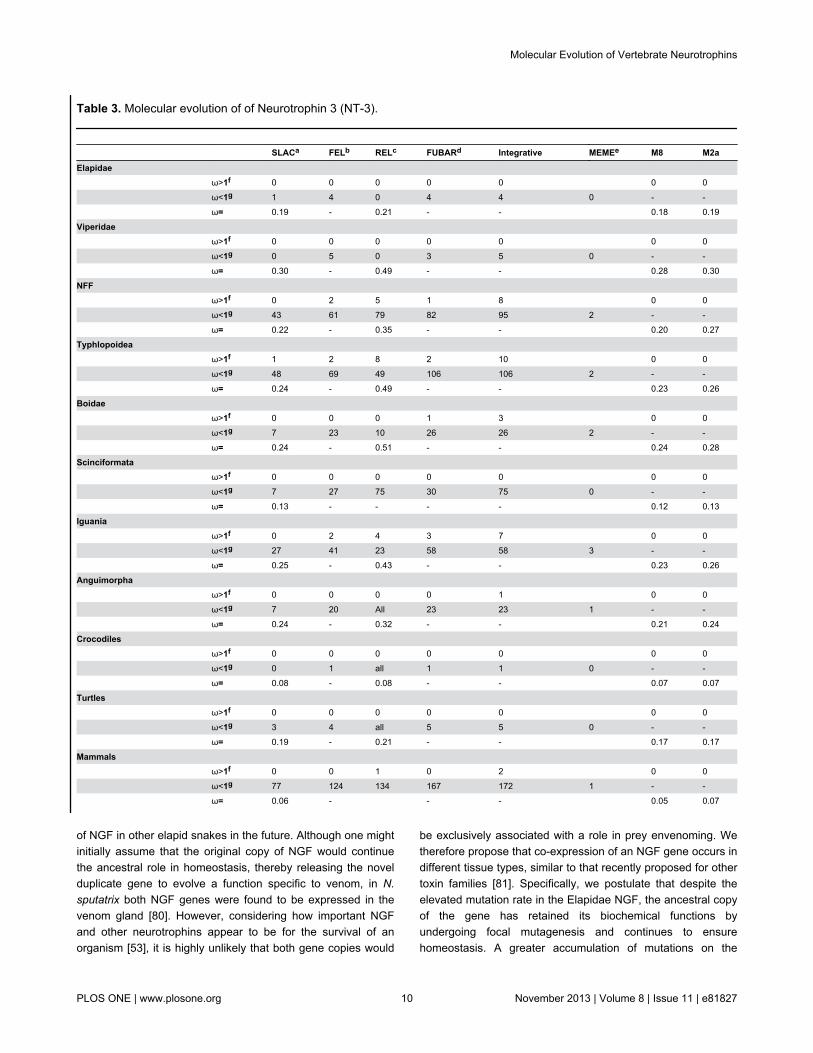
To detect episodic diversifying selection, which only affectscertain sites in the protein, we employed site-specific models(Tables 1-3; Tables S1-S3). Like ORM, site model 8 (M8) alsoindicated a strong influence of negative selection on variousreptilian and mammalian NGF, BDNF and NT-3 genes (Tables1-3; Tables S1-S3; Figures 4 and 5). However, Elapidae NGFwas found to be rapidly evolving (ω = 0.95). The BayesEmpirical Bayes (BEB) approach in M8 identified as many as19 positively-selected sites (13% of the total sites with ω of4.09) in Elapidae NGF, indicating the strong influence ofpositive selection on this lineage (Table 1 and Table S1).Although, M8 failed to detect variation in the Viperidae (ω =0.77) and ‘non-front-fanged’ advanced snake (ω = 0.58) NGFlineages, as many as 9% (ω = 2.40) and 8% (ω = 2.50) of thetotal codon sites were detected as rapidly diversifying in therespective lineages. Single Likelihood Ancestral Counting(SLAC), Fixed Effects Likelihood (FEL), Random EffectsLikelihood (REL), Mixed Effects Model of Evolution (MEME),Fast, Unconstrained Bayesian AppRoximation (FUBAR) andintegrative approach, conclusively supported these findingsand highlighted the complete lack of variations in NGF, BDNFand NT-3 genes in various reptilian and mammalian lineagesexamined (Tables 1-3). However, elapid venom NGF wasfound to be rapidly evolving under the influence of positiveselection (integrative analyses: 34 positively selected sites).Viperidae NGF was also found to accumulate relatively greatervariations (integrative analyses: 8 positively selected sites) incomparison to the non-venomous reptilian and mammalianNGF lineages. Analysis of NGF from the venom-glands of ‘non-
Molecular Evolution of Vertebrate Neurotrophins
PLOS ONE | www.plosone.org 2 November 2013 | Volume 8 | Issue 11 | e81827
front-fanged’ advanced snakes and venomous lizards(Anguimorpha and Iguania) was hampered by the scarcity ofsequences. Despite this, the integrative approach was able toidentify five positively selected sites in the ‘non-front-fanged’advanced snake lineages.
We further evaluated selection pressures along the elapidand viperid NGF lineages using two-ratio model (whichassesses selection pressures only across lineages) and thebranch-site test A (which assesses selection pressures acrossthe sites and along the lineages). The two-ratio model failed(p>0.05) to detect positive selection in elapid (ω=0.85) and
Figure 1. Bayesian molecular phylogeny of nerve growth factors (NGF). Branches with the Bayesian posterior probability(B.P.P) of less than 0.85 are highlighted in grey (remaining in colours). Site model 8 (M8) computed ω values for respectivelineages are presented. The number of positively selected sites (PP ≥ 0.95) detected by M8’s Bayes-Empirical Bayes (BEB)approach in Elapidae lineage is also indicated. Elapid sequences representing putative duplicate genes are indicated with red labels[NFF: “non-front-fanged” advanced snakes; SCI: Scinciformata].doi: 10.1371/journal.pone.0081827.g001
Molecular Evolution of Vertebrate Neurotrophins
PLOS ONE | www.plosone.org 3 November 2013 | Volume 8 | Issue 11 | e81827
viperid NGF (ω=0.82). However, branch-site test A indicated astrong influence of positive selection on elapid NGF [ω = 3.90;4.5% positively selected (PS) sites; significant at 0.001 afterBonferroni correction] and to a lesser extent on Viperidae NGF(ω = 2.01 and 8.1% of PS-sites; significant at 0.001 afterBonferroni correction: Table S4). We further employed theclade model c approach to simultaneously compute andcompare the ω values of various Toxicofera NGF lineages(Table 1). Clade model analyses indicated the influence of
positive selection in shaping the evolution of Elapidae NGF(ω=2.38), while the remaining lineages were found to beconstrained by negative selection (but again with the caveatthat fewer ‘non-front-fanged’ advanced snake and Toxicoferalizard venom-gland specific NGF sequences were available;Table 1).
To derive further support for the sites detected as positivelyselected by the nucleotide analyses of elapid NGF, weemployed a complementary amino acid-level approach
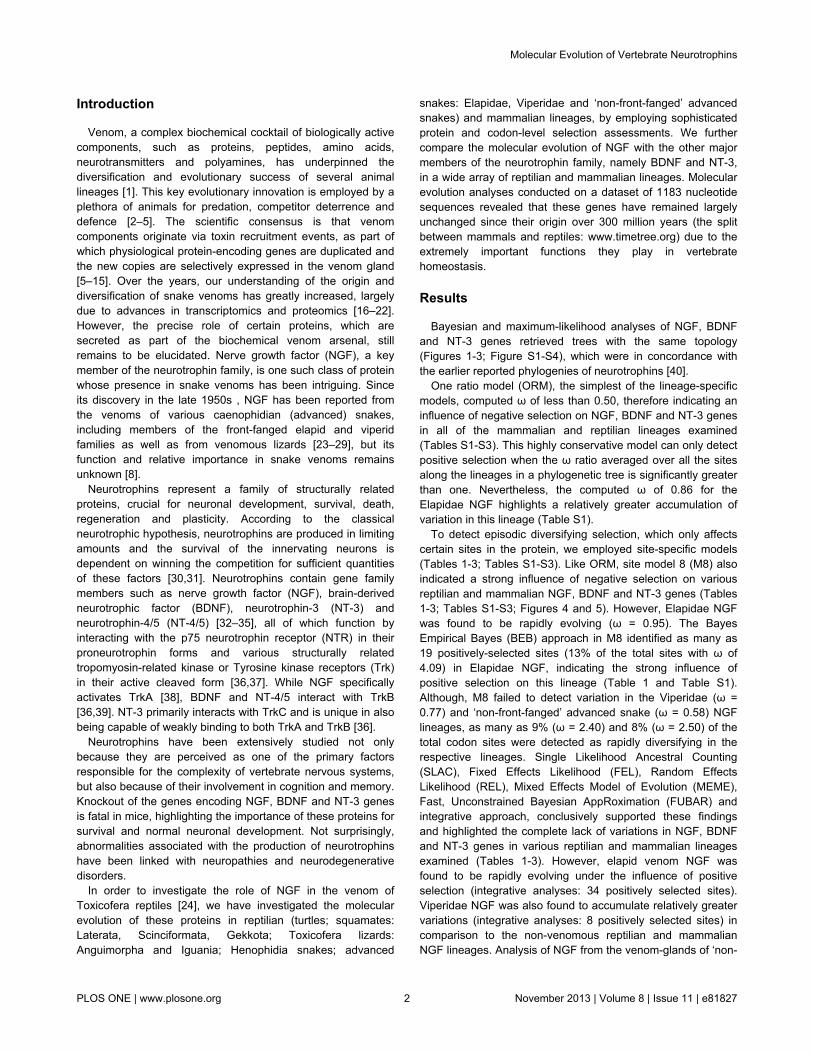
Figure 2. Bayesian molecular phylogeny of brain-derived neurotrophic factors (BDNF). Branches with the Bayesian posteriorprobability (B.P.P) of less than 0.85 are highlighted in grey (remaining in colours). Site model 8 (M8) computed ω values forrespective lineages are presented.doi: 10.1371/journal.pone.0081827.g002
Molecular Evolution of Vertebrate Neurotrophins
PLOS ONE | www.plosone.org 4 November 2013 | Volume 8 | Issue 11 | e81827
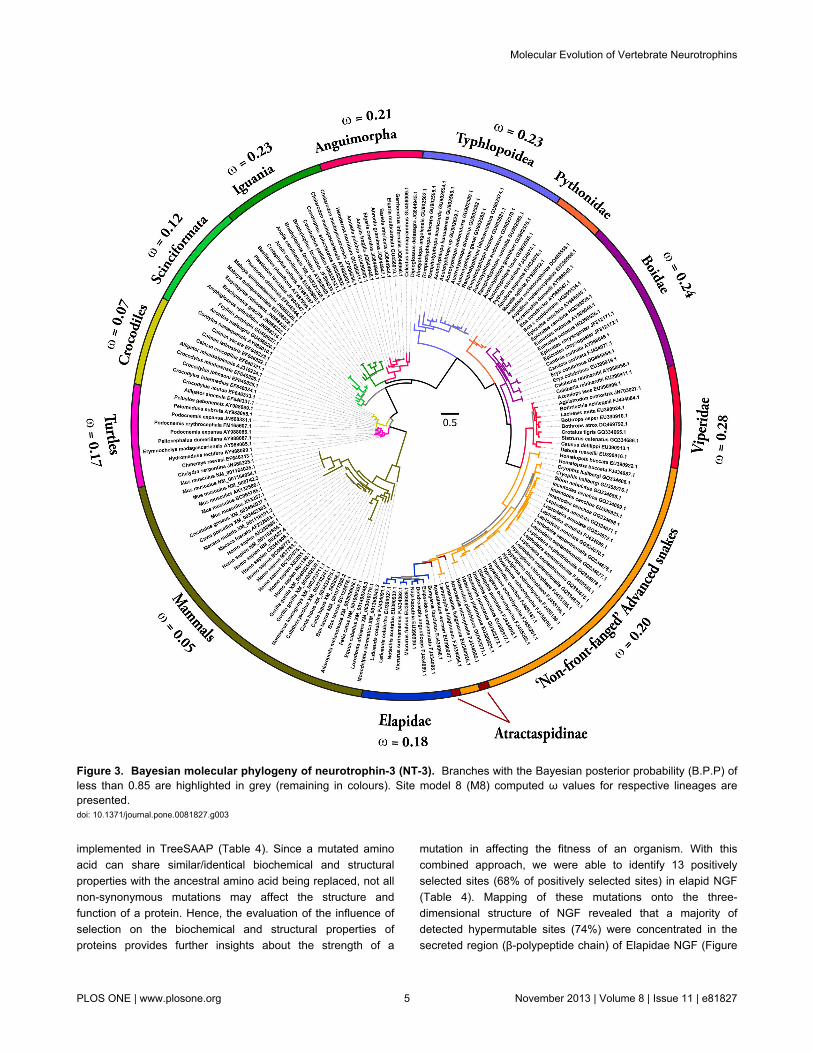
implemented in TreeSAAP (Table 4). Since a mutated aminoacid can share similar/identical biochemical and structuralproperties with the ancestral amino acid being replaced, not allnon-synonymous mutations may affect the structure andfunction of a protein. Hence, the evaluation of the influence ofselection on the biochemical and structural properties ofproteins provides further insights about the strength of a
mutation in affecting the fitness of an organism. With thiscombined approach, we were able to identify 13 positivelyselected sites (68% of positively selected sites) in elapid NGF(Table 4). Mapping of these mutations onto the three-dimensional structure of NGF revealed that a majority ofdetected hypermutable sites (74%) were concentrated in thesecreted region (β-polypeptide chain) of Elapidae NGF (Figure
Figure 3. Bayesian molecular phylogeny of neurotrophin-3 (NT-3). Branches with the Bayesian posterior probability (B.P.P) ofless than 0.85 are highlighted in grey (remaining in colours). Site model 8 (M8) computed ω values for respective lineages arepresented.doi: 10.1371/journal.pone.0081827.g003
Molecular Evolution of Vertebrate Neurotrophins
PLOS ONE | www.plosone.org 5 November 2013 | Volume 8 | Issue 11 | e81827

S5). Mutation mapping also revealed that a greater proportionof amino acid residues (92%; remaining sites couldn’t beassigned to exposed/buried class) were exposed to thesurrounding medium, indicating that these Elapid venomproteins evolve through focal mutagenesis (Table 4).
Evolutionary fingerprint analyses, which is based on theprobability distribution of site-to-site synonymous (α or dS) andnonsynonymous (β or dN) substitution rates in an alignment,
identified a significantly large proportion of sites in elapid NGFas evolving under the influence of positive selection, while theremaining reptilian and mammalian NGF, BDNF and NT-3lineages were depicted as constrained by extreme negativeselection pressures (Figure S6-S8). It is noteworthy that asmall fraction of sites in all snake lineages (Caenophidia andHenophidia) seem to have accumulated a greater proportion ofnon-synonymous to synonymous mutations, although these
Table 1. Molecular evolution of Nerve Growth Factor (NGF).
SLACa FELb RELc FUBARd Integrative MEMEe M8 M2a CladeElapidae ω>1f 2 13 28 22 34 19 15
ω<1g 12 20 11 18 22 21 (14+5) (13+2) 2.38
ω= 0.90 - 1.93 - - 0.95 0.94
Viperidae ω>1f 0 0 2 0 8 0 0
ω<1g 3 13 0 7 13 6 - - 1.03
ω= 0.65 - 0.88 - - 0.77 0.77
NFF ω>1f 0 1 3 2 5 0 0
ω<1g 1 2 0 3 3 2 - - 0.57
ω= 0.59 - 0.67 - - 0.58 0.58
Henophidia ω>1f 0 0 0 0 1 0 0
ω<1g 3 12 1 13 13 1 - - 0.0001
ω= 0.30 - 0.43 - - 0.30 0.30
Iguania ω>1f 0 0 0 0 4 0 0
ω<1g 35 55 73 83 87 4 - - 0.20
ω= 0.26 - 0.76 - - 0.25 0.29
Anguimorpha ω>1f 0 0 0 0 1 0 0
ω<1g 4 13 0 15 15 1 - - 0.20
ω= 0.33 - 0.48 - - 0.33 0.36
Gekkota ω>1f 0 0 3 1 5 0 0
ω<1g 1 15 0 16 16 1 - - -
ω= 0.24 - 0.34 - - 0.25 0.25
Scinciformata ω>1f 0 0 0 0 1 0 0
ω<1g 8 18 All 18 19 1 - - -
ω= 0.22 - 0.26 - - 0.22 0.25
Laterata ω>1f 0 0 0 0 0 0 0
ω<1g 5 12 0 14 15 0 - - -
ω= 0.26 - 0.36 - - 0.26 0.27
Turtles ω>1f 0 0 0 1 1 0 0
ω<1g 9 13 0 14 14 0 - - -
ω= 0.33 - 0.38 - - 0.32 0.34
Mammals ω>1f 0 1 0 0 4 0 0
ω<1g 24 54 All 86 86 3 - - -
ω= 0.21 - 0.22 - - 0.17 0.11
Molecular Evolution of Vertebrate Neurotrophins
PLOS ONE | www.plosone.org 6 November 2013 | Volume 8 | Issue 11 | e81827
observations lacked significant statistical support (indicated bythe density and compactness of the circles). Branch-site RELidentified four, three and two branches (p<0.05), respectively inelapid, viperid and ‘non-front-fanged’ advanced snake NGFs asevolving under the influence of episodic diversifying selection.This highlights the episodic nature of natural selection on theevolution of advanced snake venom-specific nerve growthfactors (Figure S9). This test failed to identify positivediversifying selection in other non-venomous reptilian ormammalian NGF and any BDNF and NT-3 gene lineages,including those of the advanced snakes.
Discussion
Distinct rates and trajectories of neurotrophin evolutionEvidence provided by various analyses (codeml site, branch,
branch-site and clade-specific models: M8, M2a, M3, M0, two-ratio model, branch-site test A, clade model c; HyPhy: SLAC,FEL, REL, MEME, FUBAR, integrative analyses, branch-siteREL; TreeSAAP: amino acid-level selection assessment andthe evolutionary fingerprint analysis) not only revealed thestrong influence of positive diversifying selection on Elapidaevenom NGF (and to a lesser extent on the venom NGF of otheradvanced snake lineages, particularly the Viperidae NGF), butalso highlighted the role of purifying selection pressures inshaping the molecular evolution of various non-venomousreptilian and mammalian NGF lineages (Tables 1-3; Figures1-5; Tables S1-S4; Figures 4 and 5; Figures S6-S9). Theaccumulation of variation in advanced snake NGFs, in afashion similar to other venom proteins [5,7,8] is suggestive ofa role in envenomation and prey-capture. As envenomation istheir primary method of prey subjugation, elapid and viperidsnakes rely on the swift and potent action of venom forforaging. Hence, most elapid and viperid venom componentsexperience extreme selection pressures, likely as a result of aco-evolutionary arms race with their prey [5,7]. Although NGFconstitutes a very small proportion (1-5 mg/g of venom) of thetotal venom in most snakes [29,41–43], the venom of snakes of
the genus Oxyuranus (Taipans) has been shown to containlarger quantities of NGF [44–46]. NGF seems to make upnearly 0.5% (w/w) of the total venom injected by these snakes[44–46]. Thus, NGF could be secreted in elevated amounts byseveral species of caenophidian snakes, which could beenough to cause toxicity in the prey. ‘Non-front-fanged’advanced snakes have been shown to possess several rapidlyevolving venom components that participate in preyenvenoming [47–52]. Selection analyses in the present studyidentify several residues and branches in both the ‘non-front-fanged’ and viperid advanced snake NGF lineages as evolvingunder positive Darwinian selection (Table 1: integrativeapproach; Table S4: branch-site and clade models; Figure S6,S9b and S9c). However, due to the scarcity of NGF sequencesfrom both these lineages, the extent to which NGF participatesin their envenoming remains elusive.
The aforementioned analyses also demonstrated theinfluence of negative selection on the evolution of all reptilianand mammalian BDNF and NT-3 gene lineages examined inthis study. The lack of variation in these genes despite theirorigin over 300 million years ago is probably due to theirsignificance in neuronal development, maintenance andsurvival. NGF, BDNF and NT-3 deficiencies have beencorrelated with severe peripheral neuropathy and death of theorganism [53].
Focal mutagenesis of venom nerve growth factorsThe synthesis and secretion of venom proteins is an
energetically expensive process [54–56]. Hence, mutations thatdisrupt the structure/function of proteins are filtered out of thepopulation by negative selection pressures, favouring theconservation of catalytic and structurally important coreresidues. As a result, most mutations in proteins can be foundconcentrated in structurally and/or functionally unimportantregions. Moreover, the accumulation of point mutations underthe influence of positive Darwinian selection in certain regionsof the toxin, such as the molecular surface (a phenomenon werefer to as focal mutagenesis), may confer adaptive
Table 1 (continued).
a: Single Likelihood Ancestor Counting
b: Fixed-effects likelihood
c: Random-effects likelihood
d: Fast, Unconstrained Bayesian AppRoximation
Integrative: Sites detected in common by SLAC, FEL, REL, FUBAR and MEME
e: Sites detected as experiencing episodic diversifying selection (0.05 significance) by the Mixed Effects Model Evolution (MEME)M8: Positively-selected sites detected
using the Bayes Empirical Bayes approach implemented in M8. Sites detected at 0.99 and 0.95 significance are indicated in the parenthesisM2a: Positively-selected sites
detected using the Bayes Empirical Bayes approach implemented in M2a. Sites detected at 0.99 and 0.95 significance are indicated in the parenthesisClade: Omegacomputed by the clade model
f: Number of positively selected sites at 0.05 significance (for SLAC, FEL) or 50 Bayes factor (for REL) / number of sites under pervasive diversifying selection at theposterior probability ≥0.9 (FUBAR)
g: Number of negatively selected sites at 0.05 significance (for SLAC, FEL) or 50 Bayes factor (for REL) / number of sites under pervasive purifying selection at the posteriorprobability ≥0.9 (FUBAR)
ω: mean dN/dSNFF: “non-front-fanged” advanced snakesdoi: 10.1371/journal.pone.0081827.t001
Molecular Evolution of Vertebrate Neurotrophins
PLOS ONE | www.plosone.org 7 November 2013 | Volume 8 | Issue 11 | e81827
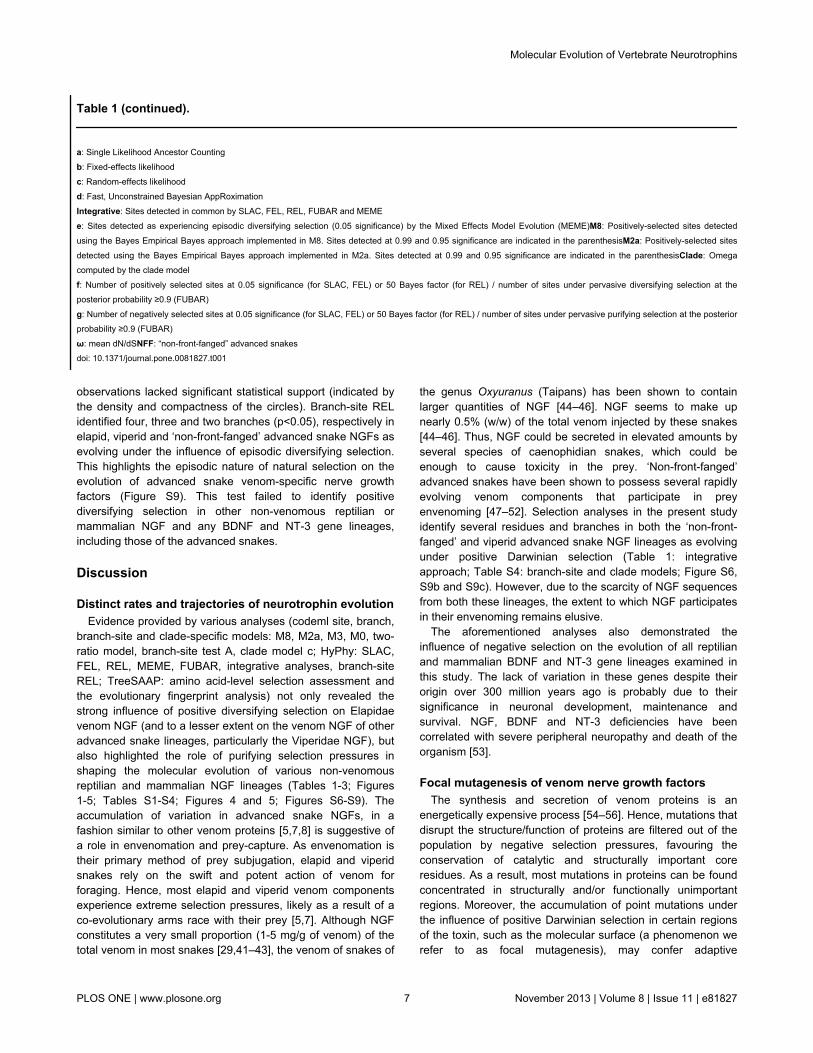
significance. We and others have postulated that predatoryvenom components undergo focal mutagenesis that results inthe generation of a diversity of novel amino acids (and theirside-chains) on the molecular surface, which could non-specifically interact with prey cells and cause a myriad ofpharmacological effects [11,52,57–61]. Mapping ofhypermutable sites onto the three-dimensional homologymodel of elapid NGFs and the calculation of accessible surface
area (ASA) ratio for each residue indicated that 92% of thepositively selected residues in these proteins are located on themolecular surface (Table 4; remaining sites couldn’t beconclusively assigned to exposed/buried class). Moreover, alarge proportion of these positively selected sites (74%) werefound concentrated in the β-chain of Elapidae NGF, which isthe only secreted region of the mature toxin and hence the onlyregion that is likely to experience a coevolutionary arms race
Table 2. Molecular evolution of Brain-derived Neurotrophic Factors (BDNF).
SLACa FELb RELc FUBARd Integrative MEMEe M8 M2aElapidae ω>1f 0 0 0 0 0 0 0
ω<1g 1 3 0 3 3 0 - -
ω= 0.09 - 0.25 - - 0.09 0.09
Viperidae ω>1f 0 0 0 0 0 0 0
ω<1g 1 3 13 4 13 0 - -
ω= 0.10 - - - - 0.11 0.11
NFF ω>1f 0 0 0 0 0 0 0
ω<1g 5 19 14 22 22 0 - -
ω= 0.08 - 0.35 - - 0.06 0.06
Typhlopoidea ω>1f 0 0 0 0 0 0 0
ω<1g 27 47 0 93 93 0 - -
ω= 0.07 - 0.11 - - 0.07 0.07
Boidae ω>1f 0 0 1 1 1 0 0
ω<1g 3 10 3 10 10 0 - -
ω= 0.0 - 0.28 - - 0.09 0.09
Pythonidae ω>1f 0 0 0 1 1 0 0
ω<1g 0 2 11 7 11 0 - -
ω= 0.21 - 0.23 - - 0.15 0.15
Iguania ω>1f 0 0 0 0 0 0 0
ω<1g 24 56 111 99 24 1 - -
ω= 0.05 - - - 0.05 0.05 0.05
Anguimorpha ω>1f 0 0 2 0 0 0 0
ω<1g 9 22 9 23 9 0 - -
ω= 0.08 - 0.15 - 0.08 0.06 0.06
Crocodiles ω>1f 0 0 0 0 0 0 0
ω<1g 0 8 20 1 0 0 - -
ω= 0.09 - - - 0.09 0.12 0.12
Turtles ω>1f 0 0 4 0 5 0 0
ω<1g 6 18 2 18 18 1 - -
ω= 0.10 - 0.14 - - 0.05 0.06
Mammals ω>1f 0 0 2 0 4 0 0
ω<1g 48 72 51 113 72 2 - -
ω= 0.05 - - - 0.05 0.06
Molecular Evolution of Vertebrate Neurotrophins
PLOS ONE | www.plosone.org 8 November 2013 | Volume 8 | Issue 11 | e81827

(Figure S5). Thus, it is highly likely that elapid NGFs follow theregime of focal mutagenesis and favour the accumulation ofhypermutable sites in specific regions of the secreted toxin thatare able to influence the fitness of the animal. Rapidly evolvingcaenophidian NGFs with a diversity of amino acids on theirmolecular surface could not only induce a plethora ofpharmacological effects by non-specifically interacting withnovel receptors of the prey, but could further aid in evading theprey immune response [62].
Putative role of nerve growth factors in venomNerve growth factors are known to inhibit venom
metalloproteinase-dependent proteolysis [63]. Hence, thepresence of large amounts of NGF, relative tometalloproteinases in viper venom [64,65] has been viewed asan indication of their role in prevention of venom autolysis [63].However, additional plausible mechanisms of action exist forboth the direct and indirect participation of rapidly evolvingcaenophidian NGF in prey envenoming, potentially resulting inan increase in the potency of the toxicoferan venom arsenal.The injection of large amounts of NGF into the lymphaticsystem of prey would result in NGF overdose, triggering avariety of reactions. Nerve growth factors are also known tocause apoptosis of cells lacking the expression of TrkAreceptors [66–68] and thus the caenophidian venom NGFscould act as cytotoxic proapoptotic factors, after beingintroduced into tissues where they are not typically found.Venom components like hyaluronidase have been shown todegrade hyaluronic acid in the extra-cellular matrix and functionas spreading factors, facilitating the easier diffusion of othervenom components [69]. NGF, which is known to trigger therelease of granules containing histamines, serotonins and otherchemical mediators from mastocytes [70,71], could perform asimilar ancillary venom function by facilitating the efficientabsorption of other venom components. The degranulation ofmast cells that are located primarily in perivascular spaces,often close to neurons and blood vessels, has been correlated
with increased vascular permeability and even neurogenicinflammations [72]. While controlled degranulation aids inorchestrating and mounting acute inflammatory reactions,massive releases can be associated with anaphylaxis,bronchoconstriction (suffocation) and vasodilation [73]. Overthe years, both glycosylated and non-glycosylated forms ofNGFs have been reported from snake venoms [44,74–76].Glycosylation has been proposed to prolong the circulationtime of serum proteins by increasing their stability [77].Interestingly, Asn 23, which has been postulated as a putativeglycosylation site in mature venom NGF [78,79], is highlyconserved in the entire squamate lineage (except in a fewelapid snakes: genus Naja, Notechis scutatus, Pseudechisaustralis, Pseudechis porphyriacus, etc.), while beingcompletely absent from mammalian and turtle NGFs (FigureS5). These observations are not surprising since mammalianNGFs are not known to undergo glycosylation. Snake venomNGFs could undergo posttranslational glycosylation in order tocirculate longer in the bloodstream of the prey and spreadfurther throughout the prey animal’s system. Thus,caenophidian NGFs could directly and/or indirectly participatein prey-envenoming through a number of plausiblemechanisms.
Putative duplication of nerve growth factors in ElapidaeGenes encoding venom proteins are known to evolve via the
birth-and-death model of evolution where new genes arecreated by repeated duplication events, and are subsequentlyeither maintained in the genome, deleted or become non-functional pseudogenes [7,8]. The molecular phylogeny ofNGFs clearly indicates the presence of two independent NGFgenes in Naja sputatrix, with very strong support for the nodeseparating them (915 bootstrap and 1.0 Bayesian posteriorprobability: Figure 1). The phylogenetic placement of these twogene homologues suggests that the gene duplication eventresponsible for their origin occurred in an early elapid ancestor(Figure 1) – we might therefore expect to find additional copies
Table 2 (continued).
a: Single Likelihood Ancestor Counting
b: Fixed-effects likelihood
c: Random-effects likelihood
d: Fast, Unconstrained Bayesian AppRoximation
Integrative: Sites detected in common by SLAC, FEL, REL, FUBAR and MEME
e: Sites detected as experiencing episodic diversifying selection (0.05 significance) by the Mixed Effects Model Evolution (MEME)
M8: Positively-selected sites detected using the Bayes Empirical Bayes approach implemented in M8. Sites detected at 0.99 and 0.95 significance are indicated in theparenthesis
M2a: Positively-selected sites detected using the Bayes Empirical Bayes approach implemented in M2a. Sites detected at 0.99 and 0.95 significance are indicated in theparenthesis
f: Number of positively selected sites at 0.05 significance (for SLAC, FEL) or 50 Bayes factor (for REL) / number of sites under pervasive diversifying selection at theposterior probability ≥0.9 (FUBAR)
g: Number of negatively selected sites at 0.05 significance (for SLAC, FEL) or 50 Bayes factor (for REL) / number of sites under pervasive purifying selection at the posteriorprobability ≥0.9 (FUBAR)
ω: mean dN/dSNFF: “non-front-fanged” advanced snakesdoi: 10.1371/journal.pone.0081827.t002
Molecular Evolution of Vertebrate Neurotrophins
PLOS ONE | www.plosone.org 9 November 2013 | Volume 8 | Issue 11 | e81827
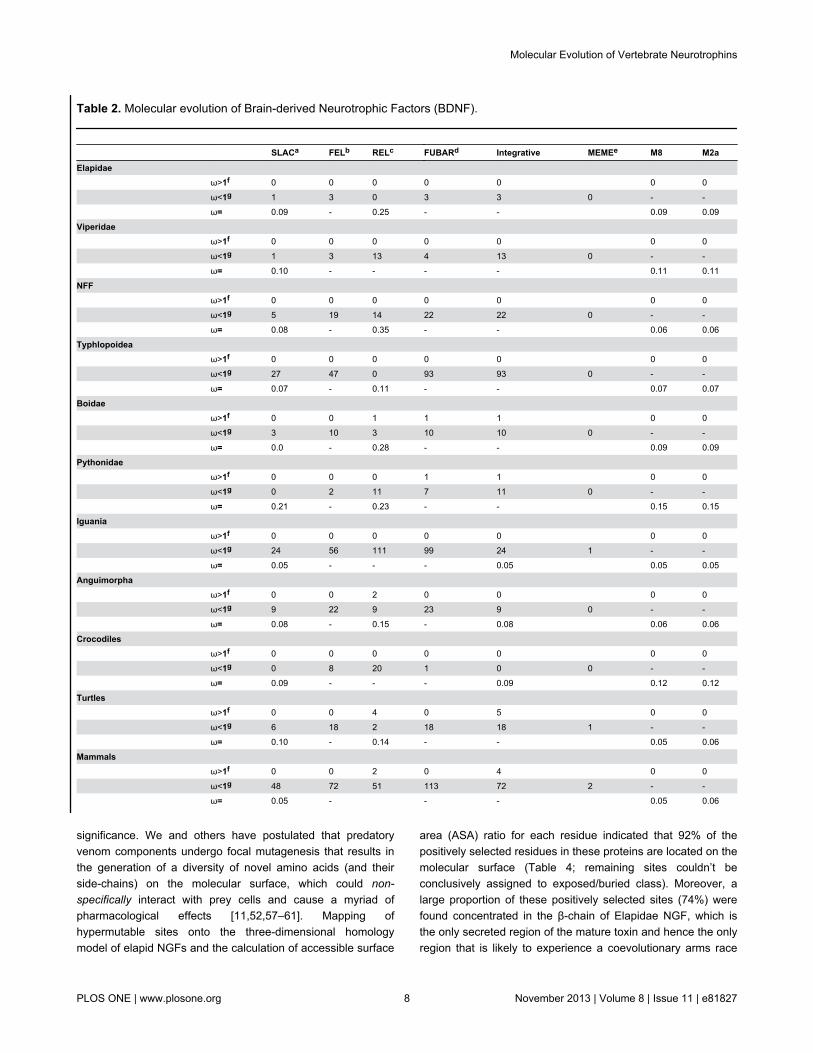
of NGF in other elapid snakes in the future. Although one mightinitially assume that the original copy of NGF would continuethe ancestral role in homeostasis, thereby releasing the novelduplicate gene to evolve a function specific to venom, in N.sputatrix both NGF genes were found to be expressed in thevenom gland [80]. However, considering how important NGFand other neurotrophins appear to be for the survival of anorganism [53], it is highly unlikely that both gene copies would
be exclusively associated with a role in prey envenoming. Wetherefore propose that co-expression of an NGF gene occurs indifferent tissue types, similar to that recently proposed for othertoxin families [81]. Specifically, we postulate that despite theelevated mutation rate in the Elapidae NGF, the ancestral copyof the gene has retained its biochemical functions byundergoing focal mutagenesis and continues to ensurehomeostasis. A greater accumulation of mutations on the
Table 3. Molecular evolution of of Neurotrophin 3 (NT-3).
SLACa FELb RELc FUBARd Integrative MEMEe M8 M2aElapidae ω>1f 0 0 0 0 0 0 0
ω<1g 1 4 0 4 4 0 - -
ω= 0.19 - 0.21 - - 0.18 0.19
Viperidae ω>1f 0 0 0 0 0 0 0
ω<1g 0 5 0 3 5 0 - -
ω= 0.30 - 0.49 - - 0.28 0.30
NFF ω>1f 0 2 5 1 8 0 0
ω<1g 43 61 79 82 95 2 - -
ω= 0.22 - 0.35 - - 0.20 0.27
Typhlopoidea ω>1f 1 2 8 2 10 0 0
ω<1g 48 69 49 106 106 2 - -
ω= 0.24 - 0.49 - - 0.23 0.26
Boidae ω>1f 0 0 0 1 3 0 0
ω<1g 7 23 10 26 26 2 - -
ω= 0.24 - 0.51 - - 0.24 0.28
Scinciformata ω>1f 0 0 0 0 0 0 0
ω<1g 7 27 75 30 75 0 - -
ω= 0.13 - - - - 0.12 0.13
Iguania ω>1f 0 2 4 3 7 0 0
ω<1g 27 41 23 58 58 3 - -
ω= 0.25 - 0.43 - - 0.23 0.26
Anguimorpha ω>1f 0 0 0 0 1 0 0
ω<1g 7 20 All 23 23 1 - -
ω= 0.24 - 0.32 - - 0.21 0.24
Crocodiles ω>1f 0 0 0 0 0 0 0
ω<1g 0 1 all 1 1 0 - -
ω= 0.08 - 0.08 - - 0.07 0.07
Turtles ω>1f 0 0 0 0 0 0 0
ω<1g 3 4 all 5 5 0 - -
ω= 0.19 - 0.21 - - 0.17 0.17
Mammals ω>1f 0 0 1 0 2 0 0
ω<1g 77 124 134 167 172 1 - -
ω= 0.06 - - - 0.05 0.07
Molecular Evolution of Vertebrate Neurotrophins
PLOS ONE | www.plosone.org 10 November 2013 | Volume 8 | Issue 11 | e81827
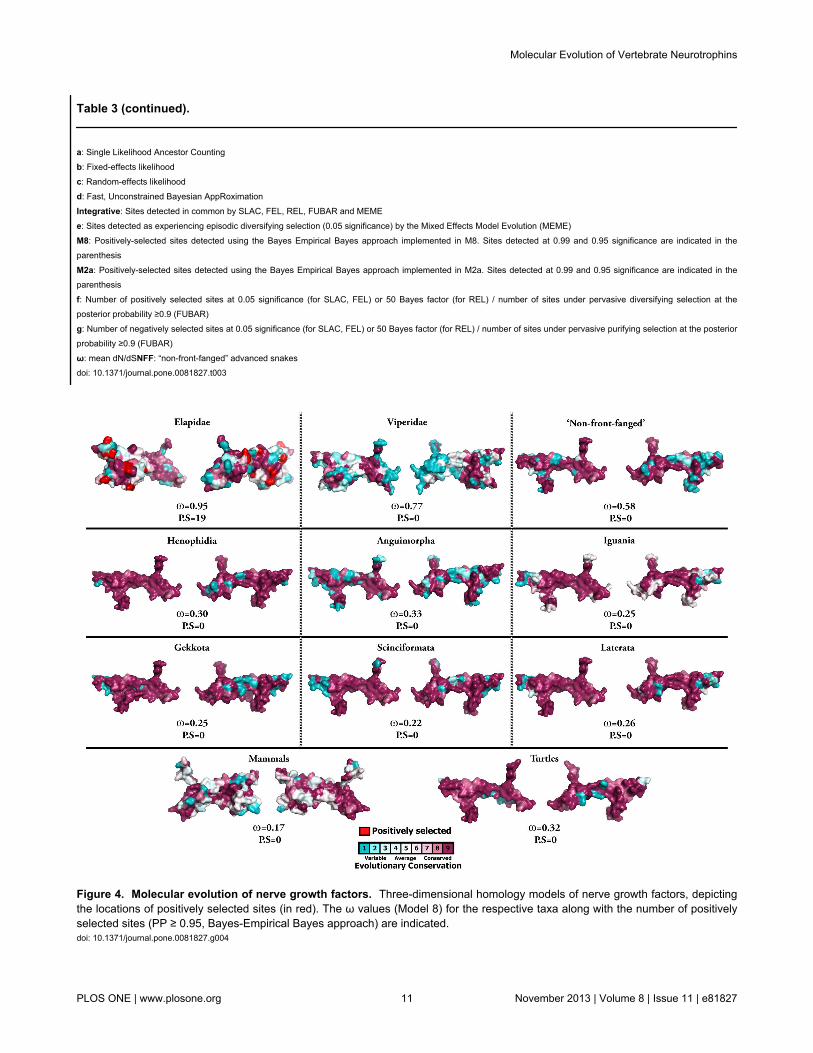
Table 3 (continued).
a: Single Likelihood Ancestor Counting
b: Fixed-effects likelihood
c: Random-effects likelihood
d: Fast, Unconstrained Bayesian AppRoximation
Integrative: Sites detected in common by SLAC, FEL, REL, FUBAR and MEME
e: Sites detected as experiencing episodic diversifying selection (0.05 significance) by the Mixed Effects Model Evolution (MEME)
M8: Positively-selected sites detected using the Bayes Empirical Bayes approach implemented in M8. Sites detected at 0.99 and 0.95 significance are indicated in theparenthesis
M2a: Positively-selected sites detected using the Bayes Empirical Bayes approach implemented in M2a. Sites detected at 0.99 and 0.95 significance are indicated in theparenthesis
f: Number of positively selected sites at 0.05 significance (for SLAC, FEL) or 50 Bayes factor (for REL) / number of sites under pervasive diversifying selection at theposterior probability ≥0.9 (FUBAR)
g: Number of negatively selected sites at 0.05 significance (for SLAC, FEL) or 50 Bayes factor (for REL) / number of sites under pervasive purifying selection at the posteriorprobability ≥0.9 (FUBAR)
ω: mean dN/dSNFF: “non-front-fanged” advanced snakesdoi: 10.1371/journal.pone.0081827.t003
Figure 4. Molecular evolution of nerve growth factors. Three-dimensional homology models of nerve growth factors, depictingthe locations of positively selected sites (in red). The ω values (Model 8) for the respective taxa along with the number of positivelyselected sites (PP ≥ 0.95, Bayes-Empirical Bayes approach) are indicated.doi: 10.1371/journal.pone.0081827.g004
Molecular Evolution of Vertebrate Neurotrophins
PLOS ONE | www.plosone.org 11 November 2013 | Volume 8 | Issue 11 | e81827
molecular surface and the loops of the protein ensures thepreservation of structurally and functionally important coreresidues. Clearly, a large number of residues across the entirevertebrate NGF lineage appear to be highly conserved (FigureS5). Moreover, it has been demonstrated on numerousoccasions that snake venom NGFs exhibit biological activitiessimilar to their mammalian counterparts [44,74]. This wouldseemingly free the duplicate elapid NGF gene to participateexclusively in prey envenoming. In contrast to the ElapidaeNGF, only one copy was found in the venom glands of theAnguimorpha lizard Abronia graminea, which was identical tothe one recovered from genomic sequencing for use intaxonomy studies [27]. Moreover, despite extensive BLASTsearches using sequence templates from a wide array ofmammalian and reptilian NGFs against the genomes of Anoliscarolinensis (Iguania) and Python molurus (Henophidia), wewere only able to retrieve a single copy of the NGF gene.Hence, we further speculate that the ancestral NGF gene is co-
expressed in physiological tissues and the venom-gland, whilethe new gene duplicates are more likely to be tissue-specifically expressed in the venom gland alone. Experimentalinvestigation in the future regarding the copy number of NGFshould reveal if the NGF duplication occurred in an early elapidancestral lineage or at the base of the Toxicofera phylogenetictree.
Note on the usage of NGF in the phylogeneticreconstructions of Toxicofera reptiles
NGF is a commonly used gene in reptilian phylogeneticstudies [82–85]. However, the detection of gene duplicationevents and the accelerated evolution of the advanced snakeNGFs indicate that these genes should not be employed inphylogenetic inferences of Toxicofera reptiles, as these factorscan undermine such analyses [86].
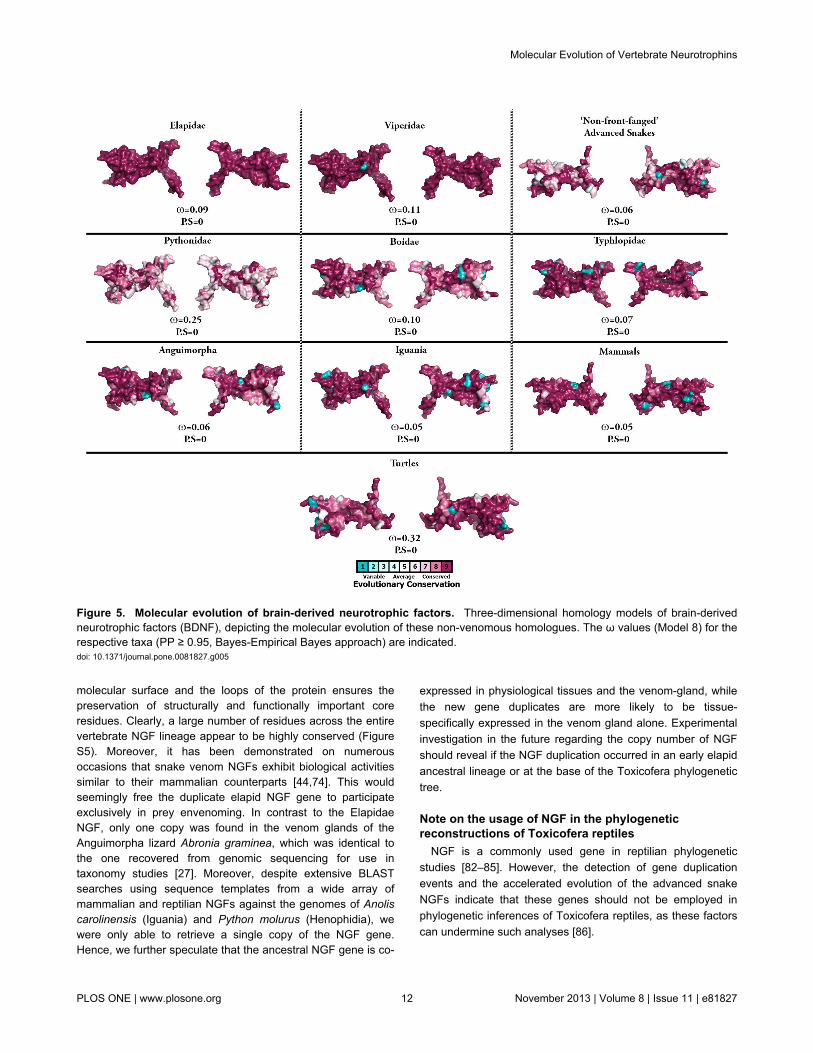
Figure 5. Molecular evolution of brain-derived neurotrophic factors. Three-dimensional homology models of brain-derivedneurotrophic factors (BDNF), depicting the molecular evolution of these non-venomous homologues. The ω values (Model 8) for therespective taxa (PP ≥ 0.95, Bayes-Empirical Bayes approach) are indicated.doi: 10.1371/journal.pone.0081827.g005
Molecular Evolution of Vertebrate Neurotrophins
PLOS ONE | www.plosone.org 12 November 2013 | Volume 8 | Issue 11 | e81827
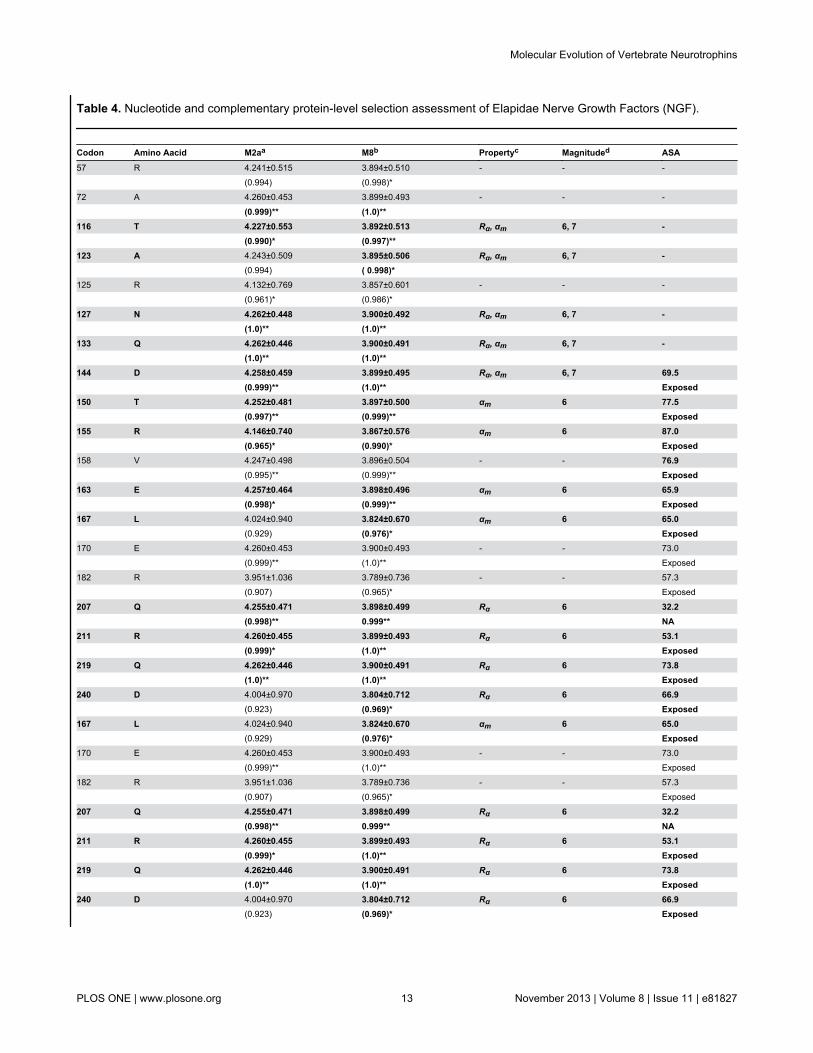
Table 4. Nucleotide and complementary protein-level selection assessment of Elapidae Nerve Growth Factors (NGF).
Codon Amino Aacid M2aa M8b Propertyc Magnituded ASA57 R 4.241±0.515 3.894±0.510 - - - (0.994) (0.998)* 72 A 4.260±0.453 3.899±0.493 - - - (0.999)** (1.0)**
116 T 4.227±0.553 3.892±0.513 Rα, αm 6, 7 - (0.990)* (0.997)**
123 A 4.243±0.509 3.895±0.506 Rα, αm 6, 7 - (0.994) ( 0.998)* 125 R 4.132±0.769 3.857±0.601 - - - (0.961)* (0.986)*
127 N 4.262±0.448 3.900±0.492 Rα, αm 6, 7 - (1.0)** (1.0)**
133 Q 4.262±0.446 3.900±0.491 Rα, αm 6, 7 - (1.0)** (1.0)**
144 D 4.258±0.459 3.899±0.495 Rα, αm 6, 7 69.5 (0.999)** (1.0)** Exposed150 T 4.252±0.481 3.897±0.500 αm 6 77.5 (0.997)** (0.999)** Exposed155 R 4.146±0.740 3.867±0.576 αm 6 87.0 (0.965)* (0.990)* Exposed158 V 4.247±0.498 3.896±0.504 - - 76.9 (0.995)** (0.999)** Exposed163 E 4.257±0.464 3.898±0.496 αm 6 65.9 (0.998)* (0.999)** Exposed167 L 4.024±0.940 3.824±0.670 αm 6 65.0 (0.929) (0.976)* Exposed170 E 4.260±0.453 3.900±0.493 - - 73.0 (0.999)** (1.0)** Exposed182 R 3.951±1.036 3.789±0.736 - - 57.3 (0.907) (0.965)* Exposed
207 Q 4.255±0.471 3.898±0.499 Rα 6 32.2 (0.998)** 0.999** NA211 R 4.260±0.455 3.899±0.493 Rα 6 53.1 (0.999)* (1.0)** Exposed219 Q 4.262±0.446 3.900±0.491 Rα 6 73.8 (1.0)** (1.0)** Exposed240 D 4.004±0.970 3.804±0.712 Rα 6 66.9 (0.923) (0.969)* Exposed167 L 4.024±0.940 3.824±0.670 αm 6 65.0 (0.929) (0.976)* Exposed170 E 4.260±0.453 3.900±0.493 - - 73.0 (0.999)** (1.0)** Exposed182 R 3.951±1.036 3.789±0.736 - - 57.3 (0.907) (0.965)* Exposed
207 Q 4.255±0.471 3.898±0.499 Rα 6 32.2 (0.998)** 0.999** NA211 R 4.260±0.455 3.899±0.493 Rα 6 53.1 (0.999)* (1.0)** Exposed219 Q 4.262±0.446 3.900±0.491 Rα 6 73.8 (1.0)** (1.0)** Exposed240 D 4.004±0.970 3.804±0.712 Rα 6 66.9 (0.923) (0.969)* Exposed
Molecular Evolution of Vertebrate Neurotrophins
PLOS ONE | www.plosone.org 13 November 2013 | Volume 8 | Issue 11 | e81827
Conclusions
In this study, we show that BDNF and NT-3, two majormembers of the neurotrophin family, lack variations completelyand evolve under the regime of negative selection, indicatingtheir extreme importance in the maintenance of homeostasis.In complete contrast, this study points for the first time towardsvenom-specific NGF evolving in a manner typical of toxicproteins and consequently suggests a hitherto unappreciatedrole in envenomation. We highlight an exquisite mechanism ofvenom evolution where focal mutagenesis has facilitated thetransformation of a key regulatory protein into a toxin, withouthampering its participation in homeostasis. Structure-functionstudies of mutant NGF may reveal a suite of novel activities,some of which may be of use in drug design and development.
Materials and Methods
Phylogenetic AnalysesPhylogenetic analyses were performed to allow the
reconstruction of the molecular evolutionary history ofvertebrate NGF, BDNF and NT-3 genes. Nucleotide sequenceswere downloaded from the National Center for BiotechnologyInformation database (NCBI: http://www.ncbi.nlm.nih.gov/) anda dataset of 1183 sequences (NGF: 308; BDNF: 434; NT-3:441) was compiled. Accession numbers of all sequencesanalysed in this study are available in Tables S5.1-S5.3.Unpublished sequences are available in the File S1. Resultantsequence sets were aligned using MUSCLE [87]. Thephylogenetic relationships were determined using Bayesianand maximum-likelihood approaches. MrBayes version 3.2 [88]was used for Bayesian inference. Tree searches were runusing four Markov chains for a minimum of 10 milliongenerations, sampling every 100th tree. The log likelihoodscore of each saved tree was plotted against the number ofgenerations to establish the point at which the log-likelihoodscores of the analyses reached their asymptote. 25% of thetotal trees sampled were conservatively discarded as burnin.The posterior probabilities for clades were established byconstructing a majority rule consensus tree for all treesgenerated after the completion of the burnin. The analyseswere repeated three times to make sure that the trees
generated were not clustered around local optima. An optimalmaximum likelihood phylogenetic tree was obtained usingPhyML 3.0 [89] and node support was evaluated with 1,000bootstrapping replicates.
Test for RecombinationTo overcome the effects of recombination on the
phylogenetic and evolutionary interpretations [90], weemployed Single Breakpoint algorithm implemented in theHyPhy package and assessed recombination on all the toxinforms examined in this study [91,92]. When potentialbreakpoints were detected using the small sample Akaikeinformation Criterion (AICc), the sequences werecompartmentalized before conducting selection analyses, so asto allow recombining units to have distinct phylogeny.
Selection AnalysesWe evaluated the influence of natural selection on various
members of vertebrate neurotrophins using maximum-likelihood models [93,94] implemented in CODEML of thePAML [95]. In order to detect evolutionary selection pressuresacting upon individual lineages, we employed the two-ratiomodel as well as the optimized branch-site test [96,97]. Thetwo-ratio model evaluates selection across the lineages alone,while the branch-site model allows ω to vary across the sites ofthe protein and along the branches in the tree. The latter isknown for its reasonable power and accuracy to detect shortbursts of episodic adaptations [97]. However, both the two-ratioand branch-site models require the foreground (lineages underpositive selection) and background lineages (lineages lackingpositive selection) to be defined a priori. Such predefinedbiological hypotheses are often unavailable and it becomesdifficult to define the foreground lineages. Therefore, wetreated each clade being compared as foreground branchesalternatively and tested multiple hypotheses. A likelihood-ratiotest was then conducted by comparing the model that allows ωto be greater than 1 in the foreground branch, with a null modelthat does not (ω constrained 1). It has been suggested thatwhile implementing multiple hypotheses using branch andbranch-site models, it is necessary to control the family-wiseerror rate (FWER or Type I error) [97]. We used Bonferronicorrection to account for such errors. It uses α/n as the
Table 4 (continued).
Amino-acid property symbols used: Power to be in the middle of α-helix (αm), Solvent accessible reduction ratio (Rα)PAML
a, b: Bayes Empirical Bayes (BEB) posterior probability and post-mean omega (indicated in brackets) for the sites detected as positively selected by the site models M2aand M8, respectively. Sites detected as positively selected at 0.95 and 0.99 posterior probability by the Bayes Empirical Bayes approach of M8 are represented by * and **,respectively.TreeSAAP
c: amino acid property experiencing positive diversifying selection
d: magnitude of selection on the amino acid property
ASA: Accessible surface area.Note: Codon sites with significant support from both nucleotide and protein-level selection analyses are highlighted in bold.doi: 10.1371/journal.pone.0081827.t004
Molecular Evolution of Vertebrate Neurotrophins
PLOS ONE | www.plosone.org 14 November 2013 | Volume 8 | Issue 11 | e81827

significance level to test each hypothesis; where ‘α’ is thesignificance level and ‘n’ is the number of independent true nullhypotheses. We further utilized branch-site REL implementedin HyPhy to identify lineages affected by positive selectionpressures. Unlike the aforementioned lineage-specific models,branch-site REL does not require the identification offoreground and background branches a priori.
Because lineage-specific models either assume a single ωfor the entire tree or assess the effects of selection only alongthe branches, they often fail to identify regions in proteins thatmight be affected by episodic selection pressures andultimately underestimate the strength of selection. Hence, weemployed site-specific models which estimate positiveselection statistically as a non-synonymous-to-synonymousnucleotide-substitution rate ratio (ω) significantly greater than1. We compared likelihood values for three pairs of models withdifferent assumed ω distributions as no a priori expectationexists for the same: M0 (constant ω rates across all sites)versus M3 (allows the ω to vary across sites within ‘n’ discretecategories, n ≥ 3); M1a (a model of neutral evolution) where allsites are assumed to be either under negative (ω < 1) orneutral selection (ω = 1) versus M2a (a model of positiveselection) which in addition to the site classes mentioned forM1a, assumes a third category of sites; sites with ω >1(positive selection) and M7 (β) versus M8 (β and ω), andmodels that mirror the evolutionary constraints of M1 and M2but assume that ω values are drawn from a β distribution [98].Only if the alternative models (M3, M2a and M8: allow siteswith ω >1) show a better fit in Likelihood Ratio Test (LRT)relative to their null models (M0, M1a and M7: do not allowsites ω >1), are their results considered significant. LRT isestimated as twice the difference in maximum likelihood valuesbetween nested models and compared with the χ2 distributionwith the appropriate degree of freedom (i.e., the difference inthe number of parameters between the two models). TheBayes empirical Bayes (BEB) approach [97] was used toidentify amino acids under positive selection by calculating theposterior probabilities that a particular amino acid belongs to agiven selection class (neutral, conserved or highly variable).Sites with greater posterior probability (PP ≥ 95%) of belongingto the ‘ω > 1 class’ were inferred to be positively selected.
SLAC, FEL, REL and FUBAR [99,100] implemented inHyPhy [101] were employed to provide additional support tothe aforementioned analyses and to detect sites evolving underthe influence of positive and negative selection. MEME [102]was also used to detect episodic diversifying selection. Furthersupport for the results of the nucleotide-level selectionanalyses was obtained and the radicalness of mutations wereassessed using a complementary protein-level approachimplemented in TreeSAAP [103].
Direct comparison of ω values computed from differentdatasets can be misleading, as they can have differentproportion of sites under selection. Hence, we assessed theselection pressures shaping the evolution of NGF along varioustoxicoferan reptilian lineages by employing clade modelanalyses implemented in codeml and simultaneously estimatedω values [104]. The significance of the analysis was tested bycomparing the likelihood of this model with that of model M1a.
To clearly depict the proportion of sites under different regimesof selection, an evolutionary fingerprint analysis was carried outusing the evolutionary selection distance (ESD) algorithmimplemented in datamonkey [91,105,106]. Evolutionaryfingerprint analysis fits a versatile general discrete bivariatemodel of site-to-site variation in selection pressures andcomprises a description of the number of selective classes, thedN/dS (ω) ratio for each class and the assignment of sites toclasses [91,106].
Structural AnalysesTo depict the natural selection pressures influencing the
evolution of various neurotrophins, we mapped the sites underpositive selection on the homology models created using Phyre2 webserver [107]. Pymol 1.3 [108] was used to visualize andgenerate the images of homology models. The consurfwebserver [109] was used for mapping the evolutionaryselection pressures on the three-dimensional homologymodels. GETAREA [110] was used to calculate the ASA ratioor the solvent exposure of amino-acid side chains. It uses theatom co-ordinates of the PDB file and indicates if a residue isburied or exposed to the surrounding medium by comparingthe ratio between side-chain ASA and the “random coil” valuesper residue. An amino-acid is considered to be buried if ASA isless than 20% and exposed if ASA is ≥ 50%.
Supporting Information
Table S1. (S1.1 – S1.11) Details of selection analyses ofnerve growth factors (NGF). a: dn/ds (weighted average). b:Significance of the model in comparison with the null model. c:Number of sites with ω > 1 under the Bayes empirical Bayesapproach with a posterior probability (PP) more than or equalto 0.99 and 0.95. * Models which allow ω > 1.(PDF)
Table S2. (S2.1 – S2.11) Details of selection analyses ofbrain-derived neurotrophic factors (BDNF). a: dn/ds(weighted average). b: Significance of the model in comparisonwith the null model. c: Number of sites with ω > 1 under theBayes empirical Bayes approach with a posterior probability(PP) more than or equal to 0.99 and 0.95. * Models which allowω > 1.(PDF)
Table S3. (S3.1-S3.11) Details of selection analyses ofneurotrophin-3 (NT3). a: dn/ds (weighted average). b:Significance of the model in comparison with the null model. c:Number of sites with ω > 1 under the Bayes empirical Bayesapproach with a posterior probability (PP) more than or equalto 0.99 and 0.95. * Models which allow ω > 1.(PDF)
Table S4. Lineage-specific selection analyses of nervegrowth factors (NGF). a: dn/ds (weighted average). b:Significance of the model in comparison with the null model. *Significant after Bonferroni correction. NS: Not significant.
Molecular Evolution of Vertebrate Neurotrophins
PLOS ONE | www.plosone.org 15 November 2013 | Volume 8 | Issue 11 | e81827
Significantly detected positively selected lineages arehighlighted in bold.(PDF)
Table S5. (S5.1-S5.3) Sequences analysed.(PDF)
Figure S1. Maximum-likelihood molecular phylogeny ofnerve growth factors (NGF). Branches with bootstrap supportof less than 850 (out of 1000 bootstrap replicates) arehighlighted in grey. [NFF: “non-front-fanged” advanced snakes;Atr: Atractaspidinae ; Sci: Scinciformata].(PDF)
Figure S2. Maximum-likelihood molecular phylogeny ofbrain-derived neurotrophic factors (BDNF). Branches withbootstrap support of less than 850 (out of 1000 bootstrapreplicates) are highlighted in grey.(PDF)
Figure S3. Maximum-likelihood molecular phylogeny ofneurotrophin-3 (NT3). Branches with bootstrap support of lessthan 850 (out of 1000 bootstrap replicates) are highlighted ingrey.(PDF)
Figure S4. Maximum-likelihood phylogeny ofneurotrophins. Branches with bootstrap support of less than850 (out of 1000 bootstrap replicates) are highlighted in grey.[NFF: ‘non-front-fanged’ advanced snakes; Pyt: Pythonidae;Mam: Mammals].(PDF)
Figure S5. Alignment of vertebrate nerve growth factors.(PDF)
Figure S6. Evolutionary fingerprint of nerve growthfactors (NGF). Estimates of the distribution of synonymous (a)and non-synonymous (b) substitution ratesinferred for variousreptilian and mammalian nerve growth factor (NGF) lineagesare shown here. The ellipses reflect a Gaussian-approximatedvariance in each individual rate estimate, and coloured pixelsshow the density of the posterior sample of the distribution for agiven rate. The diagonal line represents the idealized neutralevolution regime (ω = 1), points above and below the linecorrespond to positive selection (ω>1) and negative selection(ω<1), respectively. Site model 8 omega (w) along with thetotal number of positively selected sites detected by its BayesEmpirical Bayes (BEB) approach are also indicated below.(PDF)
Figure S7. Evolutionary fingerprint of brain-derivedneurotrophic factors (BDNF). Estimates of the distribution of
synonymous (a) and non-synonymous (b) substitution ratesinferred for various reptilian and mammalian brain-derivedneurotrophic factor (BDNF) lineages are shown here. Theellipses reflect a Gaussian-approximated variance in eachindividual rate estimate, and coloured pixels show the densityof the posterior sample of the distribution for a given rate. Thediagonal line represents the idealized neutral evolution regime(ω = 1), points above and below the line correspond to positiveselection (ω>1) and negative selection (ω<1), respectively. Sitemodel 8 omega (w) along with the total number of positivelyselected sites detected by its Bayes Empirical Bayes (BEB)approach are also indicated below.(PDF)
Figure S8. Evolutionary fingerprint of neurotrophin-3(NT3). Estimates of the distribution of synonymous (a) andnon-synonymous (b) substitution rates inferred for variousreptilian and mammalian neurotrophin-3 (NT-3) lineages areshown here. The ellipses reflect a Gaussian-approximatedvariance in each individual rate estimate, and coloured pixelsshow the density of the posterior sample of the distribution for agiven rate. The diagonal line represents the idealized neutralevolution regime (ω = 1), points above and below the linecorrespond to positive selection (ω>1) and negative selection(ω<1), respectively. Site model 8 omega (w) along with thetotal number of positively selected sites detected by its BayesEmpirical Bayes (BEB) approach is also indicated below.(PDF)
Figure S9. Branch-site REL: Caenophidian nerve growthfactors (NGF). The hue of each colour indicates strength ofselection, with primary red corresponding to ω > 5, primaryblue to ω = 0 and grey to ω=1. The width of each colourcomponent represents the proportion of sites in thecorresponding class. Thicker branches have been classified asundergoing episodic diversifying selection (indicated by arrows)by the sequential likelihood ratio test at corrected p ≤ 0.05.(PDF)
File S1. Unpublished sequences.(DOCX)
Acknowledgements
KS is thankful to Dr. Rohan Kolla and Dr. Krishna Mohan forthe useful discussions related to the pathology of envenoming.
Author Contributions
Conceived and designed the experiments: BGF NRC AA KS.Performed the experiments: TJ EU SA KS. Analyzed the data:NV BGF NRC KS. Contributed reagents/materials/analysistools: AA BGF VV GFK NV KV. Wrote the manuscript: KS BGFTJ NRC EU NV SA GFK KV VV AA.
Molecular Evolution of Vertebrate Neurotrophins
PLOS ONE | www.plosone.org 16 November 2013 | Volume 8 | Issue 11 | e81827
References
1. Fry BG, Roelants K, Champagne DE, Scheib H, Tyndall JDA et al.(2009) The toxicogenomic multiverse: Convergent recruitment ofproteins into animal venoms. Annu Rev Genomics Hum Genet 10:483–511. doi:10.1146/annurev.genom.9.081307.164356. PubMed:19640225.
2. Bush SP, Green SM, Moynihan JA, Hayes WK, Cardwell MD (2002)Crotalidae polyvalent immune fab (ovine) antivenom is efficacious forenvenomations by southern pacific rattlesnakes (Crotalus helleri). AnnEmerg Med 40: 619–624. doi:10.1067/mem.2002.129939. PubMed:12447339.
3. Heatwole H, Powell J (1998) Resistance of eels (Gymnothorax) to thevenom of sea kraits (Laticauda Colubrina): a test of coevolution.Toxicon 36: 619–625. doi:10.1016/S0041-0101(97)00081-0. PubMed:9643474.
4. Massey DJ, Calvete JJ, Sánchez EE, Sanz L, Richards K et al. (2012)Venom variability and envenoming severity outcomes of the Crotalusscutulatus scutulatus (Mojave rattlesnake) from Southern Arizona. JProteomics 75: 2576–2587. doi:10.1016/j.jprot.2012.02.035. PubMed:22446891.
5. Casewell NR, Wüster W, Vonk FJ, Harrison RA, Fry BG (2013)Complex cocktails: the evolutionary novelty of venoms. Trends EcolEvol 28: 219–229. doi:10.1016/j.tree.2012.10.020. PubMed: 23219381.
6. Olivera BM (2002) CONUS VENOM PEPTIDES: Reflections from theBiology of Clades and Species. Annu Rev Ecol Syst 33: 25–47. doi:10.1146/annurev.ecolsys.33.010802.150424.
7. Fry BG, Wüster W, Kini RM, Brusic V, Khan A et al. (2003) Molecularevolution and phylogeny of elapid snake venom three-finger toxins. JMol Evol 57: 110–129. doi:10.1007/s00239-003-2461-2. PubMed:12962311.
8. Fry BG (2005) From genome to “venome”: Molecular origin andevolution of the snake venom proteome inferred from phylogeneticanalysis of toxin sequences and related body proteins. Genome Res15: 403–420. doi:10.1101/gr.3228405. PubMed: 15741511.
9. Escoubas P (2006) Molecular diversification in spider venoms: a web ofcombinatorial peptide libraries. Mol Divers 10: 545–554. doi:10.1007/s11030-006-9050-4. PubMed: 17096075.
10. Weinberger H, Moran Y, Gordon D, Turkov M, Kahn R et al. (2010)Positions under positive selection--key for selectivity and potency ofscorpion alpha-toxins. Mol Biol Evol 27: 1025–1034. doi:10.1093/molbev/msp310. PubMed: 20018978.
11. Casewell NR, Wagstaff SC, Harrison RA, Renjifo C, Wüster W (2011)Domain loss facilitates accelerated evolution and neofunctionalizationof duplicate snake venom metalloproteinase toxin genes. Mol Biol Evol28: 2637–2649. doi:10.1093/molbev/msr091. PubMed: 21478373.
12. Chang D, Duda TF (2012) Extensive and continuous duplicationfacilitates rapid evolution and diversification of gene families. Mol BiolEvol 29: 2019–2029. doi:10.1093/molbev/mss068. PubMed: 22337864.
13. Kozminsky-Atias A, Zilberberg N (2012) Molding the business end ofneurotoxins by diversifying evolution. FASEB J 26 : 576–586. doi:10.1096/fj.11-187179. PubMed: 22009937.
14. Zhu S, Peigneur S, Gao B, Lu X, Cao C et al. (2012) Evolutionarydiversification of Mesobuthus α-scorpion toxins affecting sodiumchannels. Mol Cell Proteomics 11: M111: 012054. doi:10.1074/mcp.M111.012054. PubMed: 21969612.
15. Fry BG, Undheim EAB, Ali SA, Jackson TNW, Debono J et al. (2013)Squeezers and Leaf-cutters: Differential Diversification andDegeneration of the Venom System in Toxicoferan Reptiles. Mol CellProteomics 12: 1881–1899. doi:10.1074/mcp.M112.023143. PubMed:23547263.
16. Boldrini-França J, Corrêa-Netto C, Silva MMS, Rodrigues RS, De LaTorre P et al. (2010) Snake venomics and antivenomics of Crotalusdurissus subspecies from Brazil: assessment of geographic variationand its implication on snakebite management. J Proteomics 73: 1758–1776. doi:10.1016/j.jprot.2010.06.001. PubMed: 20542151.
17. Calvete JJ, Escolano J, Sanz L (2007) Snake venomics of Bitis speciesreveals large intragenus venom toxin composition variation: applicationto taxonomy of congeneric taxa. J Proteome Res 6: 2732–2745. doi:10.1021/pr0701714. PubMed: 17559253.
18. Casewell NR, Harrison Ra, Wüster W, Wagstaff SC (2009)Comparative venom gland transcriptome surveys of the saw-scaledvipers (Viperidae: Echis) reveal substantial intra-family gene diversityand novel venom transcripts. BMC Genomics 10: 564. doi:10.1186/1471-2164-10-564. PubMed: 19948012.
19. Fry BG, Wickramaratna JC, Hodgson WC, Alewood PF, Kini RM et al.(2002) Electrospray liquid chromatography/mass spectrometryfingerprinting of Acanthophis (death adder) venoms: taxonomic and
toxinological implications. Rapid Commun Mass Spectrom 16: 600–608. doi:10.1002/rcm.613. PubMed: 11870898.
20. Fry BG, Wüster W, Ryan Ramjan SF, Jackson T, Martelli P et al.(2003) Analysis of Colubroidea snake venoms by liquidchromatography with mass spectrometry: evolutionary and toxinologicalimplications. Rapid Commun Mass Spectrom 17: 2047–2062. doi:10.1002/rcm.1148. PubMed: 12955733.
21. Gutiérrez JM, Lomonte B, León G, Alape-Girón A, Flores-Díaz M et al.(2009) Snake venomics and antivenomics: Proteomic tools in thedesign and control of antivenoms for the treatment of snakebiteenvenoming. J Proteomics 72: 165–182. doi:10.1016/j.jprot.2009.01.008. PubMed: 19344652.
22. Terrat Y, Sunagar K, Fry BG, Jackson TN, Scheib H et al. (2013)Atractaspis aterrima Toxins: The First Insight into the MolecularEvolution of Venom in Side-Stabbers. Toxins (Basel) 5: 1948–1964.doi:10.3390/toxins5111948. PubMed: 24169588.
23. Fry BG, Scheib H, van der Weerd L, Young B, McNaughtan J et al.(2008) Evolution of an arsenal: structural and functional diversificationof the venom system in the advanced snakes (Caenophidia). Mol CellProteomics 7: 215–246. doi:10.1074/mcp.M700094-MCP200. PubMed:17855442.
24. Fry BG, Vidal N, Norman Ja, Vonk FJ, Scheib H et al. (2006) Earlyevolution of the venom system in lizards and snakes. Nature 439: 584–588. doi:10.1038/nature04328. PubMed: 16292255.
25. Fry BG, Winter K, Norman JA, Roelants K, Nabuurs RJa et al. (2010)Functional and structural diversification of the Anguimorpha lizardvenom system. Mol Cell Proteomics 9: 2369–2390. doi:10.1074/mcp.M110.001370. PubMed: 20631207.
26. Hogue-Angeletti RA, Frazier WA, Jacobs JW, Niall HD, Bradshaw RA(1976) Purification, characterization, and partial amino acid sequenceof nerve growth factor from cobra venom. Biochemistry 15: 26–34. doi:10.1021/bi00646a005. PubMed: 1247508.
27. Koludarov I, Sunagar K, Undheim EA, Jackson TN, Ruder T et al.(2012) Structural and molecular diversification of the Anguimorphalizard mandibular venom gland system in the arboreal species Abroniagraminea. J Mol Evol 75: 168–183. doi:10.1007/s00239-012-9529-9.
28. Oda T, Ohta M, Inoue S, Ikeda K, Furukawa S et al. (1989) Amino acidsequence of nerve growth factor purified from the venom of theFormosan cobra Naja naja atra. Biochem Int 19: 909–917. PubMed:2619756.
29. Siigur E, Neuman T, Järve V, Tara A, Siigur J (1985) Isolation andcharacterization of nerve growth factor from Vipera lebetina (snake)venom. Comp Biochem Physiol B 81: 211–215. PubMed: 4017541.
30. Hamburger V, Levi-Montalcini R (1949) Proliferation, differentiation anddegeneration in the spinal ganglia of the chick embryo under normaland experimental conditions. J Exp Zool 111: 457–501. doi:10.1002/jez.1401110308. PubMed: 18142378.
31. Jaaro H, Beck G, Conticello SG, Fainzilber M (2001) Evolving betterbrains: a need for neurotrophins? Trends Neurosci 24: 79–85. doi:10.1016/S0166-2236(00)01690-8. PubMed: 11164937.
32. Huang EJ, Reichardt LF (2001) Neurotrophins: roles in neuronaldevelopment and function. Annu Rev Neurosci 24: 677–736. doi:10.1146/annurev.neuro.24.1.677. PubMed: 11520916.
33. Korsching S (1993) The neurotrophic factor concept: a reexamination. JNeurosci 13: 2739–2748. PubMed: 8331370.
34. Lewin GR, Barde YA (1996) Physiology of the neurotrophins. Annu RevNeurosci 19: 289–317. doi:10.1146/annurev.ne.19.030196.001445.PubMed: 8833445.
35. Lindsay RM, Wiegand SJ, Altar CA, DiStefano PS (1994) Neurotrophicfactors: from molecule to man. Trends Neurosci 17: 182–190. doi:10.1016/0166-2236(94)90099-X. PubMed: 7520198.
36. Barbacid M (1994) The Trk family of neurotrophin receptors. JNeurobiol 25: 1386–1403. doi:10.1002/neu.480251107. PubMed:7852993.
37. Meakin SO, Shooter EM (1992) The nerve growth factor family ofreceptors. Trends Neurosci 15: 323–331. doi:10.1016/0166-2236(92)90047-C. PubMed: 1382329.
38. Kaplan DR, Hempstead BL, Martin-Zanca D, Chao M V, Parada LF(1991) The trk proto-oncogene product: a signal transducing receptorfor nerve growth factor. Science 252: 554–558.
39. Klein R, Nanduri V, Jing SA, Lamballe F, Tapley P et al. (1991) ThetrkB tyrosine protein kinase is a receptor for brain-derived neurotrophicfactor and neurotrophin-3. Cell 66: 395–403. doi:10.1016/0092-8674(91)90628-C. PubMed: 1649702.
40. Hallböök F, Lundin LG, Kullander K (1998) Lampetra fluviatilisneurotrophin homolog, descendant of a neurotrophin ancestor,
Molecular Evolution of Vertebrate Neurotrophins
PLOS ONE | www.plosone.org 17 November 2013 | Volume 8 | Issue 11 | e81827
discloses the early molecular evolution of neurotrophins in thevertebrate subphylum. J Neurosci 18: 8700–8711. PubMed: 9786977.
41. Koyama J, Inoue S, Ikeda K, Hayashi K (1992) Purification and amino-acid sequence of a nerve growth factor from the venom of Viperarusselli russelli. Biochim Biophys Acta 1160: 287–292. doi:10.1016/0167-4838(92)90090-Z. PubMed: 1477101.
42. Sanz L, Gibbs HL, Mackessy SP, Calvete JJ (2006) Venom proteomesof closely related Sistrurus rattlesnakes with divergent diets. JProteome Res 5: 2098–2112. doi:10.1021/pr0602500. PubMed:16944921.
43. Siigur J, Arumäe U, Neuman T, Siigur E, Saarma M (1987) Monoclonalantibody immunoaffinity chromatography of the nerve growth factorfrom snake venoms. Comp Biochem Physiol B 87: 329–334. PubMed:3621902.
44. Earl ST, Birrell GW, Wallis TP, St Pierre LD, Masci PP et al. (2006)Post-translational modification accounts for the presence of variedforms of nerve growth factor in Australian elapid snake venoms.Proteomics 6: 6554–6565. doi:10.1002/pmic.200600263. PubMed:17109379.
45. Morrison JJ, Pearn JH, Coulter AR (1982) The mass of venom injectedby two elapidae: the taipan (Oxyuranus scutellatus) and the Australiantiger snake (Notechis scutatus). Toxicon 20: 739–745. doi:10.1016/0041-0101(82)90121-0. PubMed: 6753241.
46. Morrison JJ, Tesseraux I, Pearn JH, Harris J, Masci PP (1984) Venomof the Australian rough-scaled snake, Tropidechis carinatus: lethalpotency and electrophysiological actions. Toxicon 22: 759–765. doi:10.1016/0041-0101(84)90158-2. PubMed: 6098054.
47. Ching AT, Paes Leme AF, Zelanis A, Rocha MM, Furtado Mde F et al.(2012) Venomics profiling of Thamnodynastes strigatus unveils matrixmetalloproteinases and other novel proteins recruited to the toxinarsenal of rear-fanged snakes. J Proteome Res 11: 1152–1162. doi:10.1021/pr200876c. PubMed: 22168127.
48. Ching AT, Rocha MM, Paes Leme AF, Pimenta DC, de Fatima DFM etal. (2006) Some aspects of the venom proteome of the Colubridaesnake Philodryas olfersii revealed from a Duvernoy’s (venom) glandtranscriptome. FEBS Lett 580: 4417–4422. doi:10.1016/j.febslet.2006.07.010. PubMed: 16857193.
49. Fry BG, Casewell NR, Wüster W, Vidal N, Young B et al. (2012) Thestructural and functional diversification of the Toxicofera reptile venomsystem. Toxicon 60: 434–448. doi:10.1016/j.toxicon.2012.02.013.PubMed: 22446061.
50. Fry BG, Scheib H, de LMJ de AI, Silva DA, Casewell NR (2012) Noveltranscripts in the maxillary venom glands of advanced snakes. Toxicon59: 696–708. doi:10.1016/j.toxicon.2012.03.005. PubMed: 22465490.
51. Fry BG, Lumsden NG, Wüster W, Wickramaratna JC, Hodgson WC etal. (2003) Isolation of a neurotoxin (alpha-colubritoxin) from anonvenomous colubrid: evidence for early origin of venom in snakes. JMol Evol 57: 446–452. doi:10.1007/s00239-003-2497-3. PubMed:14708577.
52. Sunagar K, Johnson WE, O’Brien SJ, Vasconcelos V, Antunes A(2012) Evolution of CRISPs associated with toxicoferan-reptilian venomand mammalian reproduction. Mol Biol Evol 29: 1807–1822. doi:10.1093/molbev/mss058. PubMed: 22319140.
53. Snider WD (1994) Functions of the neurotrophins during nervoussystem development: what the knockouts are teaching us. Cell 77:627–638. doi:10.1016/0092-8674(94)90048-5. PubMed: 8205613.
54. Nisani Z, Dunbar SG, Hayes WK (2007) Cost of venom regeneration inParabuthus transvaalicus (Arachnida: Buthidae). Comp BiochemPhysiol A Mol Integr Physiol 147: 509–513. doi:10.1016/j.cbpa.2007.01.027. PubMed: 17344080.
55. Nisani Z, Boskovic DS, Dunbar SG, Kelln W, Hayes WK (2012)Investigating the chemical profile of regenerated scorpion (Parabuthustransvaalicus) venom in relation to metabolic cost and toxicity. Toxicon60: 315–323. doi:10.1016/j.toxicon.2012.04.343. PubMed: 22564718.
56. Morgenstern D, King GF (2013) The venom optimization hypothesisrevisited. Toxicon 63: 120–128. doi:10.1016/j.toxicon.2012.11.022.PubMed: 23266311.
57. Brust A, Sunagar K, Undheim EAB, Vetter I, Yang DC et al. (2013)Differential evolution and neofunctionalization of snake venommetalloprotease domains. Mol Cell Proteomics 12: 651–663. doi:10.1074/mcp.M112.023135. PubMed: 23242553.
58. Kini RM, Chan YM (1999) Accelerated evolution and molecular surfaceof venom phospholipase A2 enzymes. J Mol Evol 48: 125–132. doi:10.1007/PL00006450. PubMed: 9929380.
59. Ruder T, Sunagar K, Undheim EAB, Ali SA, Wai T-C et al. (2013)Molecular phylogeny and evolution of the proteins encoded by coleoid(cuttlefish, octopus, and squid) posterior venom glands. J Mol Evol 76:192–204. doi:10.1007/s00239-013-9552-5. PubMed: 23456102.
60. Kini RM (2003) Excitement ahead: structure, function and mechanismof snake venom phospholipase A2 enzymes. Toxicon 42: 827–840. doi:10.1016/j.toxicon.2003.11.002. PubMed: 15019485.
61. Kini RM (2005) Structure-function relationships and mechanism ofanticoagulant phospholipase A2 enzymes from snake venoms. Toxicon45: 1147–1161. doi:10.1016/j.toxicon.2005.02.018. PubMed:15922780.
62. Low DHW, Sunagar K, Undheim EAB, Ali SA, Alagon AC et al. (2013)Dracula’s children: Molecular evolution of vampire bat venom. JProteomics 89: 95–111. doi:10.1016/j.jprot.2013.05.034. PubMed:23748026.
63. Wijeyewickrema LC, Gardiner EE, Gladigau EL, Berndt MC, AndrewsRK (2010) Nerve growth factor inhibits metalloproteinase-disintegrinsand blocks ectodomain shedding of platelet glycoprotein. Vi - J BiolChem 285: 11793–11799. doi:10.1074/jbc.M110.100479.
64. Cohen S (1959) Purification and metabolic effects of a nerve growth-promoting protein from snake venom. J Biol Chem 234: 1129–1137.PubMed: 13654333.
65. Wijeyewickrema LC, Gardiner EE, Shen Y, Berndt MC, Andrews RK(2007) Fractionation of snake venom metalloproteinases by metal ionaffinity: a purified cobra metalloproteinase, Nk, from Naja kaouthiabinds Ni2+-agarose. Toxicon 50: 1064–1072. doi:10.1016/j.toxicon.2007.07.006. PubMed: 17822731.
66. Frade JM, Barde YA (1999) Genetic evidence for cell death mediatedby nerve growth factor and the neurotrophin receptor p75 in thedeveloping mouse retina and spinal cord. Development 126: 683–690.PubMed: 9895316.
67. Frade JM, Barde YA (1998) Microglia-derived nerve growth factorcauses cell death in the developing retina. Neuron 20: 35–41. doi:10.1016/S0896-6273(00)80432-8. PubMed: 9459440.
68. Frade JM, Rodríguez-Tébar A, Barde YA (1996) Induction of cell deathby endogenous nerve growth factor through its p75 receptor. Nature383: 166–168. doi:10.1038/383166a0. PubMed: 8774880.
69. Girish KS, Jagadeesha DK, Rajeev KB, Kemparaju K (2002) Snakevenom hyaluronidase: an evidence for isoforms and extracellular matrixdegradation. Mol Cell Biochem 240: 105–110. doi:10.1023/A:1020651607164. PubMed: 12487377.
70. Lindholm D, Heumann R, Meyer M, Thoenen H (1987) Interleukin-1regulates synthesis of nerve growth factor in non-neuronal cells of ratsciatic nerve. Nature 330: 658–659. doi:10.1038/330658a0. PubMed:3317065.
71. Woolf CJ (1996) Phenotypic modification of primary sensory neurons:the role of nerve growth factor in the production of persistent pain.Philos Trans R Soc L B Biol Sci 351: 441–448. doi:10.1098/rstb.1996.0040.
72. Theoharides TC (1990) Mast cells: the immune gate to the brain. LifeSci 46: 607–617. doi:10.1016/0024-3205(90)90129-F. PubMed:2407920.
73. Payne V, Kam PC (2004) Mast cell tryptase: a review of its physiologyand clinical significance. Anaesthesia 59: 695–703. doi:10.1111/j.1365-2044.2004.03757.x. PubMed: 15200544.
74. Katzir I, Shani J, Goshen G, Sela J, Ninary E et al. (2003)Characterization of nerve growth factors (NGFs) from snake venoms byuse of a novel, quantitative bioassay utilizing pheochromocytoma(PC12) cells overexpressing human trkA receptors. Toxicon 42: 481–490. doi:10.1016/S0041-0101(03)00225-3. PubMed: 14529729.
75. Pearce FL, Banks BE, Banthorpe DV, Berry AR, Davies HS et al.(1972) The isolation and characterization of nerve-growth factor fromthe venom of Vipera russelli. Eur J Biochem 29: 417–425. doi:10.1111/j.1432-1033.1972.tb02004.x. PubMed: 4563340.
76. Pearce FL, Thompson HL (1986) Some characteristics of histaminesecretion from rat peritoneal mast cells stimulated with nerve growthfactor. J Physiol 372: 379–393. PubMed: 2425086.
77. Marshall RD (1972) Glycoproteins. Annu Rev Biochem 41: 673–702.doi:10.1146/annurev.bi.41.070172.003325. PubMed: 4563441.
78. Gavel Y, von Heijne G (1990) Sequence differences betweenglycosylated and non-glycosylated Asn-X-Thr/Ser acceptor sites:implications for protein engineering. Protein Eng 3: 433–442. doi:10.1093/protein/3.5.433. PubMed: 2349213.
79. Kornfeld R, Kornfeld S (1985) Assembly of asparagine-linkedoligosaccharides. Annu Rev Biochem 54: 631–664. doi:10.1146/annurev.bi.54.070185.003215. PubMed: 3896128.
80. Koh DC, Armugam A, Jeyaseelan K (2004) Sputa nerve growth factorforms a preferable substitute to mouse 7S-beta nerve growth factor.Biochem J 383: 149–158. doi:10.1042/BJ20040569. PubMed:15225125.
81. Casewell NR, Huttley GA, Wüster W, Wüster W (2012) Dynamicevolution of venom proteins in squamate reptiles. Nat Commun 3:1066. doi:10.1038/ncomms2065. PubMed: 22990862.
Molecular Evolution of Vertebrate Neurotrophins
PLOS ONE | www.plosone.org 18 November 2013 | Volume 8 | Issue 11 | e81827
82. Townsend TM, Mulcahy DG, Noonan BP, Sites JW Jr., Kuczynski CAet al. (2011) Phylogeny of iguanian lizards inferred from 29 nuclear loci,and a comparison of concatenated and species-tree approaches for anancient, rapid radiation. Mol Phylogenet Evol 61: 363–380. doi:10.1016/j.ympev.2011.07.008. PubMed: 21787873.
83. Wiens JJ, Hutter CR, Mulcahy DG, Noonan BP, Townsend TM et al.(2012) Resolving the phylogeny of lizards and snakes (Squamata) withextensive sampling of genes and species. Biol Lett 8: 1043–1046. doi:10.1098/rsbl.2012.0703. PubMed: 22993238.
84. Wiens JJ, Kuczynski CA, Smith SA, Mulcahy DG, Sites JW Jr. et al.(2008) Branch lengths, support, and congruence: testing thephylogenomic approach with 20 nuclear loci in snakes. Syst Biol 57:420–431. doi:10.1080/10635150802166053. PubMed: 18570036.
85. Wiens JJ, Kuczynski CA, Townsend T, Reeder TW, Mulcahy DG et al.(2010) Combining phylogenomics and fossils in higher-level squamatereptile phylogeny: molecular data change the placement of fossil taxa.Syst Biol 59: 674–688. doi:10.1093/sysbio/syq048. PubMed: 20930035.
86. Casewell NR, Wagstaff SC, Harrison RA, Wüster W (2011) Gene treeparsimony of multilocus snake venom protein families reveals speciestree conflict as a result of multiple parallel gene loss. Mol Biol Evol 28:1157–1172. doi:10.1093/molbev/msq302. PubMed: 21062752.
87. Edgar RC (2004) MUSCLE: Multiple sequence alignment with highaccuracy and high throughput. Nucleic Acids Res 32: 1792–1797. doi:10.1093/nar/gkh340. PubMed: 15034147.
88. Ronquist F, Teslenko M, van der Mark P, Ayres DL, Darling A et al.(2012) MrBayes 3.2: efficient Bayesian phylogenetic inference andmodel choice across a large model space. Syst Biol 61: 539–542. doi:10.1093/sysbio/sys029. PubMed: 22357727.
89. Guindon S, Dufayard JF, Lefort V, Anisimova M, Hordijk W, et al.(2010) New algorithms and methods to estimate maximum-likelihoodphylogenies: assessing the performance of PhyML 3.0. Syst Biol 59:307–321 doi:10.1093/sysbio/syq010.
90. Posada D, Crandall KA (2002) The effect of recombination on theaccuracy of phylogeny estimation. J Mol Evol 54: 396–402. doi:10.1007/s00239-001-0034-9. PubMed: 11847565.
91. Delport W, Poon AF, Frost SD, Kosakovsky Pond SL (2010)Datamonkey 2010: a suite of phylogenetic analysis tools forevolutionary biology. Bioinformatics 26: 2455–2457. doi:10.1093/bioinformatics/btq429. PubMed: 20671151.
92. Kosakovsky Pond SL, Posada D, Gravenor MB, Woelk CH, Frost SDWet al. (2006) Automated phylogenetic detection of recombination usinga genetic algorithm. Mol Biol Evol 23: 1891–1901. doi:10.1093/molbev/msl051. PubMed: 16818476.
93. Goldman N, Yang Z (1994) A codon-based model of nucleotidesubstitution for protein-coding DNA sequences. Mol Biol Evol 11: 725–736. PubMed: 7968486.
94. Yang Z (1998) Likelihood ratio tests for detecting positive selection andapplication to primate lysozyme evolution. Mol Biol Evol 15: 568–573.doi:10.1093/oxfordjournals.molbev.a025957. PubMed: 9580986.
95. Yang Z (2007) PAML 4: Phylogenetic analysis by maximum likelihood.Mol Biol Evol 24: 1586–1591. doi:10.1093/molbev/msm088. PubMed:17483113.
96. Yang Z, Nielsen R (2002) Codon-substitution models for detectingmolecular adaptation at individual sites along specific lineages. Mol BiolEvol 19: 908–917. doi:10.1093/oxfordjournals.molbev.a004148.PubMed: 12032247.
97. Zhang J, Nielsen R, Yang Z (2005) Evaluation of an improved branch-site likelihood method for detecting positive selection at the molecularlevel. Mol Biol Evol 22: 2472–2479. doi:10.1093/molbev/msi237.PubMed: 16107592.
98. Nielsen R, Yang Z (1998) Likelihood models for detecting positivelyselected amino acid sites and applications to the HIV-1 envelope gene.Genetics 148: 929–936. PubMed: 9539414.
99. Kosakovsky Pond SL, Frost SDW, Pond SLK (2005) Not so differentafter all: a comparison of methods for detecting amino acid sites underselection. Mol Biol Evol 22: 1208–1222. doi:10.1093/molbev/msi105.PubMed: 15703242.
100. Murrell B, Moola S, Mabona A, Weighill T, Sheward D et al. (2013)FUBAR: a fast, unconstrained bayesian approximation for inferringselection. Mol Biol Evol 30: 1196–1205. doi:10.1093/molbev/mst030.PubMed: 23420840.
101. Pond SLK, Frost SDW, Muse SV (2005) HyPhy: hypothesis testingusing phylogenies. Bioinformatics 21: 676–679. doi:10.1093/bioinformatics/bti079. PubMed: 15509596.
102. Murrell B, Wertheim JO, Moola S, Weighill T, Scheffler K et al. (2012)Detecting individual sites subject to episodic diversifying selection.PLoS Genet 8: e1002764. doi:10.1371/journal.pgen.1002764. PubMed:22807683.
103. Woolley S, Johnson J, Smith MJ, Crandall KA, McClellan DA (2003)TreeSAAP: selection on amino acid properties using phylogenetictrees. Bioinformatics 19: 671–672. doi:10.1093/bioinformatics/btg043.PubMed: 12651734.
104. Bielawski JP, Yang Z (2004) A maximum likelihood method fordetecting functional divergence at individual codon sites, withapplication to gene family evolution. J Mol Evol 59: 121–132. doi:10.1007/s00239-004-2597-8. PubMed: 15383915.
105. Pond SL, Frost SD (2005) Datamonkey: rapid detection of selectivepressure on individual sites of codon alignments. Bioinformatics 21:2531–2533. doi:10.1093/bioinformatics/bti320. PubMed: 15713735.
106. Pond SLK, Scheffler K, Gravenor MB, Poon AFY, Frost SDW (2010)Evolutionary fingerprinting of genes. Mol Biol Evol 27: 520–536. doi:10.1093/molbev/msp260. PubMed: 19864470.
107. Kelley LA, Sternberg MJE (2009) Protein structure prediction on theWeb: a case study using the Phyre server. Nat Protoc 4: 363–371. doi:10.1038/nprot.2009.2. PubMed: 19247286.
108. DeLano WL (2002) The PyMOL Molecular Graphics System. DeLano.Sci San Carlos, CA.
109. Armon A, Graur D, Ben-Tal N (2001) ConSurf: an algorithmic tool forthe identification of functional regions in proteins by surface mapping ofphylogenetic information. J Mol Biol 307: 447–463. doi:10.1006/jmbi.2000.4474. PubMed: 11243830.
110. Fraczkiewicz R, Braun W (1998) Exact and efficient analyticalcalculation of the accessible surface areas and their gradients formacromolecules. J Comput Chem 19: 319–333.
Molecular Evolution of Vertebrate Neurotrophins
PLOS ONE | www.plosone.org 19 November 2013 | Volume 8 | Issue 11 | e81827