
Changes of AMPA receptors in MPTP monkeys with levodopa-induced dyskinesias
Upload
broadinstituteCategory
view
0download
0
Molecular adaptations of striatal spiny projectionneurons during levodopa-induced dyskinesiaMyriam Heimana,b,c,d, Adrian Heilbutd,e, Veronica Francardof, Ruth Kulickea,b,c,d, Robert J. Fenstera,b,c,d,1,Eric D. Kolaczyke,g, Jill P. Mesirovd,e, Dalton J. Surmeierh, M. Angela Cencif, and Paul Greengarda,2
aLaboratory of Molecular and Cellular Neuroscience, The Rockefeller University, New York, NY 10065; bDepartment of Brain and Cognitive Sciences,Massachusetts Institute of Technology, Cambridge, MA 02139; cThe Picower Institute for Learning and Memory, Cambridge, MA 02139; dThe Broad Instituteof MIT and Harvard, Cambridge, MA 02142; eProgram in Bioinformatics, gDepartment of Mathematics and Statistics, Boston University, Boston, MA 02215;fBasal Ganglia Pathophysiology Unit, Department of Experimental Medical Science, Lund University, 221 84 Lund, Sweden; and hDepartment of Physiology,Feinberg School of Medicine, Northwestern University, Chicago, IL 60611
Contributed by Paul Greengard, February 9, 2014 (sent for review December 20, 2013)
Levodopa treatment is the major pharmacotherapy for Parkinson’sdisease. However, almost all patients receiving levodopa eventuallydevelop debilitating involuntary movements (dyskinesia). Althoughit is known that striatal spiny projection neurons (SPNs) are involvedin the genesis of this movement disorder, the molecular basis ofdyskinesia is not understood. In this study, we identify distinct cell-type–specific gene-expression changes that occur in subclasses ofSPNs upon induction of a parkinsonian lesion followed by chroniclevodopa treatment. We identify several hundred genes, the ex-pression of which is correlated with levodopa dose, many of whichare under the control of activator protein-1 and ERK signaling.Despite homeostatic adaptations involving several signaling mod-ulators, activator protein-1–dependent gene expression remainshighly dysregulated in direct pathway SPNs upon chronic levodopatreatment. We also discuss which molecular pathways are mostlikely to dampen abnormal dopaminoceptive signaling in spiny pro-jection neurons, hence providing potential targets for antidyski-netic treatments in Parkinson’s disease.
Parkinson’s disease (PD) is a debilitating neurodegenerativedisorder that results in severe motor, emotional, and cogni-
tive disturbances. The motor symptoms of PD are caused by thedeath of dopamine-producing neurons in the substantia nigrapars compacta and the ensuing loss of dopamine innervation ofthe dorsal striatum (1). In the striatum, ∼95% of neurons arespiny projection neurons (SPNs), of which there are two classes.Striatonigral, direct-pathway spiny projection neurons (dSPNs)express the dopamine type 1 (D1) receptors, exhibit increasedactivity in response to dopamine, and project directly to theoutput nuclei of the basal ganglia, where their action is thoughtto promote movement. In contrast, striatopallidal, indirect-pathwayspiny projection neurons (iSPNs) express the dopamine type 2(D2) receptor, exhibit decreased activity in response to dopamine,influence the output structures of the basal ganglia indirectly (viaprojections to intermediate regions), and their action is thoughtto inhibit movement (2). Thus, dopamine promotes movementboth by activating the D1-expressing dSPNs and by inhibiting theD2-expressing iSPNs. In the parkinsonian state, when dopamineis lost, a hypokinetic state develops because of loss of dopaminesignaling through both D1 and D2 receptors.The most common parkinsonian medication, the dopamine
precursor levodopa (L-DOPA), leads to an increase in dopaminelevels in the striatum and, hence, partially restores D1- and D2-dependent signaling. However, in a majority of patients, levodopaadministration eventually leads to the development of dyskinesia,abnormal involuntary movements that represent a clinical ther-apeutic problem (3, 4). In dSPNs the temporal pattern of D1receptor stimulation is dramatically different following levodopaadministration than it is in the intact, normal striatum. D1 re-ceptors are normally only transiently stimulated by dopaminereleased by a burst of activity in dopamine fibers. Followinglevodopa treatment, D1 receptors are most likely continuouslystimulated for hours. In contrast, in iSPNs, where D2 receptors
are normally continuously stimulated by dopamine, it is the dropin dopamine tone that represents a nonphysiological condition.Because of these differences in stimulation by dopamine, wepredict that dSPNs and iSPNs will have markedly different changesto gene expression in response to dopamine depletion and levo-dopa treatment.In rodent models, gene-expression changes and posttransla-
tional protein modifications have been demonstrated to occur indSPNs upon the development of dyskinesia (e.g., refs. 5–12).Activation of ERK1/2 downstream of the D1 receptor leads toactivator protein-1 (AP-1) dependent transcription factor changesand posttranslational modifications of histones (reviewed in ref.13). These nuclear signaling events likely converge to createa substantially altered transcriptional profile in dSPNs. However,the full complement of dyskinesia-induced gene-expression changesin dSPN is not known. Despite pharmacological and genetic evi-dence linking D2 receptors to the development of dyskinesia(14–18), only a small number of changes have been found tooccur in iSPNs in levodopa-treated dyskinetic animals, and themolecular adaptations of this class of neurons remain largelyunknown. dSPNs and iSPNs are closely intermixed in striatal
Significance
Parkinson’s disease is characterized by a set of motor featuresthat depend on a loss of dopamine-producing cells in the mid-brain. The most common pharmacotherapy for Parkinson’sdisease is dopamine replacement with levodopa administra-tion. The majority of patients receiving this treatment developdebilitating abnormal involuntary movements, termed “levo-dopa-induced dyskinesia.” It is known that striatal projectionneurons (SPNs) are involved in the genesis of levodopa-induceddyskinesia, but the genes involved in this process are not fullyunderstood. We reveal the gene-expression profiles of differ-ent classes of SPNs during chronic levodopa administration. Wecorrelate gene expression to mouse behavior, predicting whichgenes are most likely involved in the emergence of levodopa-induced dyskinesia, and which are thus potential targets fornew antidyskinetic treatments.
Author contributions: M.H., E.D.K., J.P.M., D.J.S., M.A.C., and P.G. designed research;M.H., V.F., R.K., and R.J.F. performed research; M.H. and A.H. contributed new re-agents/analytic tools; M.H., A.H., V.F., E.D.K., J.P.M., D.J.S., M.A.C., and P.G. analyzed data;and M.H., A.H., D.J.S., M.A.C., and P.G. wrote the paper.
The authors declare no conflict of interest.
Data deposition: The microarray data reported in this paper have been deposited in theGene Expression Omnibus (GEO) database, www.ncbi.nlm.nih.gov/geo (accession no.GSE55096).1Present address: Adult Psychiatry Residency Training Program, Department of Psychiatryand Human Behavior, Alpert Medical School, Brown University, Providence, RI 02906.
2To whom correspondence should be addressed. E-mail: [email protected].
This article contains supporting information online at www.pnas.org/lookup/suppl/doi:10.1073/pnas.1401819111/-/DCSupplemental.
4578–4583 | PNAS | March 25, 2014 | vol. 111 | no. 12 www.pnas.org/cgi/doi/10.1073/pnas.1401819111

tissue, and so cell-type–specific whole-genome gene-expressionstudies are not attainable from whole-tissue dissections. Knowl-edge of cell-type–specific molecular changes would reveal im-portant insights in the pathophysiology of levodopa-induceddyskinesia, as well as possibly reveal new therapeutic targets fortheir treatment. To study these changes, we have used a well-validated mouse model of levodopa-induced dyskinesia (19, 20)in combination with a cell-type–specific mRNA translationalprofiling approach called translating ribosome affinity purifica-tion (TRAP) (21).Dopamine depletion led to a small number of gene-expression
changes in both dSPNs and iSPNs, and in particular, to changesin regulators of MAPK signaling in dSPNs. Chronic levodopa ad-ministration induced a small number of changes to iSPN geneexpression. In contrast, dSPNs displayed a dramatic increase incyclic AMP-responsive element binding (CREB), AP-1, and ERK-dependent gene expression. The treatment-induced pattern ofgene changes indicates that dSPNs mount homeostatic molecularresponses targeting CREB and ERK-mediated signaling, whichare, however, inefficient to down-regulate AP-1–dependent geneexpression. By comparing chronic low-dose and high-dose levo-dopa regimens, we identified genes for which expression was cor-related with severity of drug-induced dyskinesia. These dose-dependent expression changes were found only in dSPNs, notiSPNs. In dSPNs, several hundred genes were correlated withdose and abnormal involuntary movements, including a large sub-set predicted to be under the regulation of AP-1 and ERK-activated transcription factors. We also discuss the molecularchanges in dSPNs that are most likely to counteract the effectsof excessive D1 receptor activation.
ResultsAn overview of all gene-expression changes reported below ispresented graphically in Figs. 1 and 2.
Effects of Striatal Dopamine Depletion upon SPNs. The loss of do-pamine innervation primes the striatum for the development ofdyskinesia (3). A complete understanding of the pathogenesis ofdyskinesia thus requires knowledge of the changes that occur inthe dopamine-depleted striatum. To profile the cell-type–specificresponses of striatal SPNs to striatal dopamine depletion, weconducted TRAP analysis (21) of the two major classes of theseneurons: dSPNs, which express the dopamine receptor 1a (Drd1a),and iSPNs, which express the dopamine receptor 2 (Drd2). Todisrupt dopamine innervation to both of these SPN populationsthat reside in the striatum, we injected the neurotoxin 6-hydroxy-dopamine (6-OHDA), unilaterally in the medial forebrain bundle inhemizygous Drd1-TRAP andDrd2-TRAPmice (kept on a C57BL/6Jgenetic background) (21). This lesion procedure causes nigraldopamine cell death within a few days, along with a widespreadand near-complete loss of dopaminergic innervation to the entiredorsal striatum on one side of the brain (a hemiparkinsonian
model) (20) (Fig. S1). TRAP-purified mRNAs from either Drd1a-or Drd2-expressing SPNs were reverse-transcribed, amplified,and used to interrogate Affymetrix 430_2.0 GeneChip micro-arrays. Two-hundred twenty-six genes (represented by 291 probe-sets) in dSPNs, and 156 genes (represented by 196 probe-sets)in iSPNs were differentially expressed upon striatal dopaminedepletion (the effect of dopamine depletion is defined here bythe comparison of saline-treated 6-OHDA–lesioned mice vs.saline-treated sham-lesioned mice) (Datasets S1–S3) (7–10 rep-licates per group, and differential expression defined by a fold-change of 1.5 or greater and Benjamini–Hochberg adjustedP value less than α = 0.10, Welch’s t test). We performed asimple overlap analysis of gene-associated pathway annotationsto reveal functional sets of genes altered in the two SPN typesupon dopamine depletion.In dSPNs, among the most significant pathways altered upon
striatal dopamine depletion (Benjamini–Hochberg adjustedP value ≤ 0.05) were the IL-3, EGFR, and MAPK signalingpathways (Dataset S4). Regarding the latter, Dusp dual-speci-ficity phosphatases are capable of dephosphorylating both ty-rosine and serine/threonine residues, and as such are negativeregulators of MAPK signaling (22). Thus, decreased expressionof variousDusp gene products, negative regulators of ERK/MAPKsignaling, may contribute to the well-documented supersensitivityof ERK signaling in dopamine-depleted dSPNs (23). In iSPNs,among the most significant pathways altered upon striatal dopa-mine depletion were the TGF-β signaling and G-protein signalingpathways (Dataset S5); included in the latter was an increase inGng4, Gng5, and Pde1c expression. An alteration to Pde1c ex-pression may represent a homeostatic mechanism to compensatefor a decrease of dopamine-dependent Drd2 receptor signaling:decreased Drd2 receptor signaling as a result of dopamine de-pletion would be predicted to lead to increased cAMP levels,which could be counteracted by increases in levels of Pde1c, aprotein that catalyzes hydrolysis of cAMP.When comparing the dopamine-depletion–induced gene-
expression profiles of dSPNs and iSPNs, there is an overlap of 22genes represented by 38 probe-sets (for these common genes seeDataset S2). Most of these genes changed in opposite directionsin the two cell types. Although the Drd1a and Drd2 receptors areexpected to have some opposite signaling effects through couplingto Gα/olf and Gi, respectively, this small number of overlappinggenes with opposite directional changes suggests that dopaminedepletion is not simply producing inverted effects in these twocell types through Gα/olf and Gi signaling.
Effects of Levodopa Treatment on Dopamine-Depleted SPNs. Wenext examined the effects of levodopa treatment upon the mo-lecular profiles of dopamine-depleted dSPNs and iSPNs, as striatalSPNs mediate both the therapeutic response to levodopa andthe emergence of levodopa-induced dyskinesia (e.g., ref. 24).In chronically dopamine-depleted hemiparkinsonian mice, the
Fig. 1. Genome-wide heat-map of statistically significant expression changes over experimental contrasts. Contrasts were defined by cell type (Drd1a dSPNs,Drd2 iSPNs) and dose regimen (dopamine depletion only, chronic low-dose levodopa, or chronic high-dose levodopa). A single representative probe-set isshown for each gene. Color indicates direction of and magnitude of log2 fold-change between mean expression of each probe-set in each treatment group,compared with the appropriate matched control group (red, increased; blue, decreased; white, no significant change). Genes were filtered for statisticallysignificant (Benjamini–Hochberg adjusted P value ≤ 0.10) changes and sorted by hierarchical clustering using a cosine distance metric.
Heiman et al. PNAS | March 25, 2014 | vol. 111 | no. 12 | 4579
NEU
ROSC
IENCE

therapeutic effect of levodopa can be assessed using tests ofspontaneous forelimb use, which is reduced on the side con-tralateral to the lesion and promptly restored by levodopa. Atthe same time, dyskinesia can be assessed by scoring abnormalinvoluntary movements (AIMs) that affect axial, orofacial, andlimb muscles (19, 25). To define striatal TRAP profiles associ-ated with these behavioral effects, Drd1a- and Drd2-drivenTRAP mice with medial forebrain bundle lesions were treatedchronically with levodopa using either a high- or a low-doselevodopa regimen. Both treatment regimens improved thelesion-induced motor deficit in spontaneous forelimb use (Fig.S2A). However, only the high-dose regimen readily induced AIMs,which reached maximal severity by the end of the treatment(Fig. S2B). The cumulative AIM (dyskinesia) scores recordedduring the treatment period were approximately twice aslarge in the high-dose levodopa group as in the low-dose one(Fig. S2C).The TRAP analysis of dSPNs revealed that over 3,100 genes
(represented by 4,545 probe-sets) displayed altered expressionupon dopamine depletion followed by chronic low-dose levodopatreatment; 1,352 genes were up-regulated and 1,758 genes weredown-regulated (Dataset S6). [Note that—extremely rarely—different probe-sets for one gene did not directionally agree, po-tentially because of splicing differences or else poor probe de-sign, and hence summations may appear off (in this case 3,100instead of 3,110). Any such discrepancies are actually becauseof this phenomenon.] Among the most significant pathways
uniting these changes were the EGFR1 signaling, TGF-β re-ceptor signaling, IL-2 signaling, insulin signaling, and MAPKsignaling pathways (Dataset S7), the latter including an up-regulation of the Dusp negative modulators of ERK signaling.This dramatic up-regulation of Dusp genes was a notable re-versal of the down-regulation of Dusp genes seen upon dopa-mine depletion alone. Because Dusp gene expression is knownto be up-regulated by the MAPK pathway itself (26), thesechanges to Dusp gene expression likely represent a homeostaticfeedback response to increases in MAPK signaling. Followingchronic high-dose levodopa treatment, 4,603 genes (repre-sented by 7,118 probe-sets) changed expression in dopamine-depleted dSPNs; 1,898 genes were up-regulated and 2,733 geneswere down-regulated (Dataset S8). Of these genes altered uponchronic high-dose treatment, 3,635 genes (represented by 5,573probe-sets) also had statistically significant changes (of anymagnitude) following chronic low-dose treatment with levo-dopa (Dataset S9). All of the most significantly enrichedpathways among genes changing with chronic low-dose levodopawere also represented in analysis of the high-dose data (DatasetS10), signifying that chronic high-dose levodopa treatment (as-sociated with severe dyskinesia) does not elicit a completelydifferent gene-expression response compared with low-dosetreatment (associated with milder dyskinesia). A notable ex-ception, however, was the “regulation of actin cytoskeleton”pathway induced by chronic high-dose treatment. Alterationsto expression of genes in this pathway may result in unique
77 2
Drd1a(79)
Drd2(103)
145 2
Drd1a(147)
Drd2(53)
UP
Dopamine Depleted
Drd1a (dSPNs) Drd2 (iSPNs)
1329 23
Drd1a(1352) Drd2
(48)
DOWN
Chronic Low L-DOPA
1796 102
Drd1a(1898) Drd2
(244)
Chronic High L-DOPAB
A
14225
1751 7
Drd1a(1758) Drd2
(24)
17 2661 72
Drd1a(2733) Drd2
(172)
100
101
51
( 1.5-fold change; bh adj p-val 0.10)
( 1.5-fold change; bh adj p-val 0.10)
Fig. 2. Genome-wide analysis of gene expression changes induced by dopamine depletion and levodopa treatment. (A) Venn diagrams showing the totalnumbers of genes changing across treatments in Drd1a (dSPN) cells (Left) and Drd2 (iSPN) cells (Right) for statistically significant changes (Benjamini–Hochberg adjusted P value < 0.10) of 1.5-fold or greater. (B) Venn diagrams comparing the numbers of genes up-regulated and down-regulated byeach treatment between Drd1a (dSPN) and Drd2a (iSPN) cells for statistically significant changes (Benjamini–Hochberg adjusted P value < 0.10) of 1.5-foldor greater.
4580 | www.pnas.org/cgi/doi/10.1073/pnas.1401819111 Heiman et al.

changes to the structure of dSPNs upon induction of severedyskinesia.To identify regulators of the dSPN response to chronic levo-
dopa, we collected data on the presence of conserved sequencemotifs in the promoters of the altered genes [sequence motifsand target prediction from SwissRegulon (27)] and used a hy-pergeometric test to assign significance to overrepresentation ofthese motifs among the genes whose expression was altered.Analysis of the regulatory motifs of genes whose expression wasup-regulated upon high-dose treatment revealed that CREB,AP-1 (e.g., Fos and Jun), and ERK-dependent (e.g., Elk) motifswere among the most often represented [see “up” tab in DatasetS11; note that near the top of this dataset’s rankings are motifsthat are present in the regulatory elements of almost all neuro-nal-expressed genes (e.g., Sp1), and are thus not considered toreflect enrichment in the high-dose dataset]. This finding is ofinterest given what appear to be homeostatic changes present inthe dSPN high-dose levodopa treatment data (Dataset S8). Forexample, although ERK2 (Mapk1) levels are slightly increased,many Dusp genes are up-regulated, changes that would be pre-dicted to decrease ERK-dependent signaling. Gene expression ofseveral adenylyl cyclases are decreased, phosphodisterases in-creased, regulator of G protein signaling proteins increased, Creb(Creb1) and Crebbp decreased, and Crem (Icer) increased, sug-gesting that, as for ERK signaling, a homeostatic response down-regulates cAMP-PKA-CREB signaling as well. In contrast tothis homeostatic pattern of both CREB- and ERK-related genechanges, many AP-1 factors were dramatically up-regulated (Fos,Fosb, Fosl1, Fosl2, Jun, and Junb are all up-regulated) (Fig. S3and Dataset S8), and only slight decreases to facilitators of AP-1signaling were observed (for example, Mapkbp1, Mapk8ip2).Taken together, these data suggest that CREB, AP-1, and ERKsignaling are major drivers of the transcriptional response to chronichigh-dose levodopa administration in dSPNs, and although tran-scriptional changes to dampen CREB and ERK signaling are evi-dent, homeostatic responses to decrease AP-1 signaling are min-imal. This lack of decreased AP-1 signaling may be responsible forthe persistent elevations in CREB and ERK-dependent gene ex-pression, as we find that many genes that are altered upon chronichigh-dose levodopa treatment (e.g., Homer1) contain all three(CREB, AP-1, and ERK-target) binding motifs (Dataset S11).In marked contrast to the changes above, iSPNs had few sig-
nificant alterations in mRNA expression upon dopamine de-pletion followed by chronic levodopa treatment. Only 72 genes(represented by 84 probe-sets) in total had an altered expressionprofile (48 up, 24 down) upon chronic low-dose administration(Dataset S12). No pathways with statistically significant enrich-ment were observed, possibly because of the small number ofgenes involved. Upon dopamine depletion followed by chronichigh-dose levodopa treatment, 415 genes (represented by 533probe-sets) had altered expression profiles (244 up, 172 down)(Dataset S13) in iSPNs. Of these genes, 198 (represented by 252probe-sets) also changed significantly in dSPNs; of these, only 62genes moved in opposing directions (Dataset S14). Pathwayanalysis of the genes altered in iSPNs by high doses of levodoparevealed a connection to Kit receptor signaling, IL-3 signaling,and ErbB signaling (Dataset S15).Our analysis identified a large number of gene-expression
changes induced by levodopa treatment following dopaminedepletion (summary presented in Figs. 1 and 2). To prioritizegenes most likely to be related to the emergence of levodopa-induced dyskinesia, we applied two complementary procedures.In the first procedure, we compared probe-set expression forhigh- vs. low-dose groups directly (Welch’s t test). In the secondprocedure, we fit linear models relating probe-set expression,dose, and AIM score, and compared these models to assesssignificance of expression correlations with levodopa dose anddyskinesia. In dSPNs, 298 genes (represented by 409 probe-sets)
had significant positive dose–responses and were thus associatedwith more severe AIMs, whereas 192 genes (230 probe-sets)were anticorrelated with dose, and thus AIMs (Dataset S16). Nogenes had statistically significant excess correlation with AIMs,after accounting for the effect of dose and multiple testing ad-justments (SI Materials and Methods and Fig. S4). In iSPNs, nogenes had significant correlations with either dose or AIMs aftermultiple testing adjustments.The following genes had the most significant correlations be-
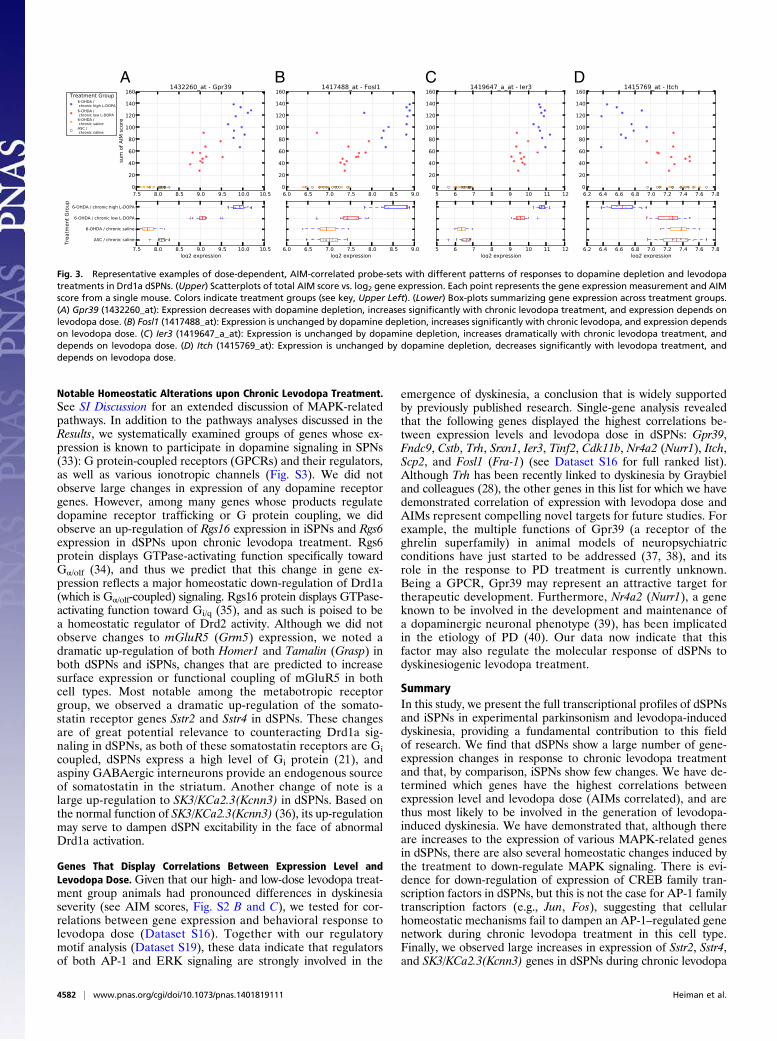
tween expression and dose in dSPNs (Dataset S16): Gpr39, Fndc9,Cstb, Trh, Srxn1, Ier3, Tinf2, Cdk11b, Nr4a2 (Nurr1), Itch, Scp2,and Fosl1 (Fra-1). Of these genes, only Trh (positively corre-lated) has previously been linked to levodopa-induced dyskinesia(28). Fosb has previously been shown to have a causal role in thedevelopment of dyskinesia (29), and we now suggest that Fosl1(positively correlated) (Fig. 3) may have a similar role. Ier3(positively correlated) (Fig. 3) encodes an inhibitor of proteinphosphatase 2A-dependent ERK dephosphorylation (30), andas such may augment ERK signaling. Itch, expression of whichwas anticorrelated to AIMs (Fig. 3), is an E3 ubiquitin ligasethat regulates c-Jun (Jun) levels (31); our data demonstrate thatlower levels of Itch expression (presumably resulting in higherlevels of c-Jun) correlate with the levodopa response. No geneslinked to CREB signaling were among those with the most sig-nificant correlations between gene expression and dose.Analysis of pathway annotations revealed that MAPK Sig-
naling (including changes to Dusp genes) was among the path-ways most significantly enriched among genes correlated withdose in dSPNs (hypergeometric test, Benjamini–Hochberg ad-justed P value < 0.05) (Dataset S17), whereas genes related tocell-cycle control, DNA replication, and B-cell receptor signalingwere among the most anticorrelated in this cell type (DatasetS18). Finally, we searched for overrepresentation of regulatorymotifs among the genes whose expression was most correlatedto dose in dSPNs: our analysis revealed that CREB, AP-1, andERK-dependent motifs were often found in the regulatory ele-ments of these genes (Dataset S19).See Dataset S20 for all statistical results discussed in this study.
DiscussionIn this study we have used a combination of a hemiparkinsonianmouse model of PD (19, 20) and a refined TRAP methodology(21) to identify cell-type–specific gene-expression changes indSPNs and iSPNs as induced by dopamine depletion and phar-macological dopamine replacement. All mice with completemedial forebrain bundle lesions of the nigrostriatal pathwaypromptly develop dyskinetic behaviors in response to levodopa(20). When studying the effects of levodopa treatment in thisanimal model, however, comparisons can be made betweenanimals with severe or mild dyskinesia by using different dosesof levodopa. This approach is clinically relevant, as levodopadosage is one of the most important risk factors for dyskinesia inPD, if not the most important one (32). Dopamine depletionfollowed by chronic low- or high-dose levodopa treatment re-vealed massive changes to mRNA translation profiles in dSPNs,compared with relatively modest changes in iSPNs (Figs. 1 and2). These results, combined with the fact that dSPNs (but notiSPNs) demonstrated gene-expression changes that had corre-lations between dose and AIMs (Dataset S16), strongly suggestthat dSPNs are involved in the genesis of levodopa-induceddyskinesia. It is likely that this movement disorder also involvessignificant adaptations of the iSPN, which, however, do notseem to require pronounced transcriptional and translationalchanges. Interestingly, although low- and high-dose levodopatreatments both led to more decreases to gene expression thanincreases to gene expression in dSPNs, the opposite was truefor iSPNs (Fig. 2).
Heiman et al. PNAS | March 25, 2014 | vol. 111 | no. 12 | 4581
NEU
ROSC
IENCE
Notable Homeostatic Alterations upon Chronic Levodopa Treatment.See SI Discussion for an extended discussion of MAPK-relatedpathways. In addition to the pathways analyses discussed in theResults, we systematically examined groups of genes whose ex-pression is known to participate in dopamine signaling in SPNs(33): G protein-coupled receptors (GPCRs) and their regulators,as well as various ionotropic channels (Fig. S3). We did notobserve large changes in expression of any dopamine receptorgenes. However, among many genes whose products regulatedopamine receptor trafficking or G protein coupling, we didobserve an up-regulation of Rgs16 expression in iSPNs and Rgs6expression in dSPNs upon chronic levodopa treatment. Rgs6protein displays GTPase-activating function specifically towardGα/olf (34), and thus we predict that this change in gene ex-pression reflects a major homeostatic down-regulation of Drd1a(which is Gα/olf-coupled) signaling. Rgs16 protein displays GTPase-activating function toward Gi/q (35), and as such is poised to bea homeostatic regulator of Drd2 activity. Although we did notobserve changes to mGluR5 (Grm5) expression, we noted adramatic up-regulation of both Homer1 and Tamalin (Grasp) inboth dSPNs and iSPNs, changes that are predicted to increasesurface expression or functional coupling of mGluR5 in bothcell types. Most notable among the metabotropic receptorgroup, we observed a dramatic up-regulation of the somato-statin receptor genes Sstr2 and Sstr4 in dSPNs. These changesare of great potential relevance to counteracting Drd1a sig-naling in dSPNs, as both of these somatostatin receptors are Gicoupled, dSPNs express a high level of Gi protein (21), andaspiny GABAergic interneurons provide an endogenous sourceof somatostatin in the striatum. Another change of note is alarge up-regulation to SK3/KCa2.3(Kcnn3) in dSPNs. Based onthe normal function of SK3/KCa2.3(Kcnn3) (36), its up-regulationmay serve to dampen dSPN excitability in the face of abnormalDrd1a activation.
Genes That Display Correlations Between Expression Level andLevodopa Dose. Given that our high- and low-dose levodopa treat-ment group animals had pronounced differences in dyskinesiaseverity (see AIM scores, Fig. S2 B and C), we tested for cor-relations between gene expression and behavioral response tolevodopa dose (Dataset S16). Together with our regulatorymotif analysis (Dataset S19), these data indicate that regulatorsof both AP-1 and ERK signaling are strongly involved in the
emergence of dyskinesia, a conclusion that is widely supportedby previously published research. Single-gene analysis revealedthat the following genes displayed the highest correlations be-tween expression levels and levodopa dose in dSPNs: Gpr39,Fndc9, Cstb, Trh, Srxn1, Ier3, Tinf2, Cdk11b, Nr4a2 (Nurr1), Itch,Scp2, and Fosl1 (Fra-1) (see Dataset S16 for full ranked list).Although Trh has been recently linked to dyskinesia by Graybieland colleagues (28), the other genes in this list for which we havedemonstrated correlation of expression with levodopa dose andAIMs represent compelling novel targets for future studies. Forexample, the multiple functions of Gpr39 (a receptor of theghrelin superfamily) in animal models of neuropsychiatricconditions have just started to be addressed (37, 38), and itsrole in the response to PD treatment is currently unknown.Being a GPCR, Gpr39 may represent an attractive target fortherapeutic development. Furthermore, Nr4a2 (Nurr1), a geneknown to be involved in the development and maintenance ofa dopaminergic neuronal phenotype (39), has been implicatedin the etiology of PD (40). Our data now indicate that thisfactor may also regulate the molecular response of dSPNs todyskinesiogenic levodopa treatment.
SummaryIn this study, we present the full transcriptional profiles of dSPNsand iSPNs in experimental parkinsonism and levodopa-induceddyskinesia, providing a fundamental contribution to this fieldof research. We find that dSPNs show a large number of gene-expression changes in response to chronic levodopa treatmentand that, by comparison, iSPNs show few changes. We have de-termined which genes have the highest correlations betweenexpression level and levodopa dose (AIMs correlated), and arethus most likely to be involved in the generation of levodopa-induced dyskinesia. We have demonstrated that, although thereare increases to the expression of various MAPK-related genesin dSPNs, there are also several homeostatic changes induced bythe treatment to down-regulate MAPK signaling. There is evi-dence for down-regulation of expression of CREB family tran-scription factors in dSPNs, but this is not the case for AP-1 familytranscription factors (e.g., Jun, Fos), suggesting that cellularhomeostatic mechanisms fail to dampen an AP-1–regulated genenetwork during chronic levodopa treatment in this cell type.Finally, we observed large increases in expression of Sstr2, Sstr4,and SK3/KCa2.3(Kcnn3) genes in dSPNs during chronic levodopa
A B C D
Fig. 3. Representative examples of dose-dependent, AIM-correlated probe-sets with different patterns of responses to dopamine depletion and levodopatreatments in Drd1a dSPNs. (Upper) Scatterplots of total AIM score vs. log2 gene expression. Each point represents the gene expression measurement and AIMscore from a single mouse. Colors indicate treatment groups (see key, Upper Left). (Lower) Box-plots summarizing gene expression across treatment groups.(A) Gpr39 (1432260_at): Expression decreases with dopamine depletion, increases significantly with chronic levodopa treatment, and expression depends onlevodopa dose. (B) Fosl1 (1417488_at): Expression is unchanged by dopamine depletion, increases significantly with chronic levodopa, and expression dependson levodopa dose. (C) Ier3 (1419647_a_at): Expression is unchanged by dopamine depletion, increases dramatically with chronic levodopa treatment, anddepends on levodopa dose. (D) Itch (1415769_at): Expression is unchanged by dopamine depletion, decreases significantly with levodopa treatment, anddepends on levodopa dose.
4582 | www.pnas.org/cgi/doi/10.1073/pnas.1401819111 Heiman et al.

treatment, all of which were AIMs-correlated. These changes tothe ion channel subunit and membrane receptors may serve tocounteract an increased D1 receptor-mediated excitabilityclose to the cell surface (as opposed to downstream transcrip-tional regulators, which are subject to signaling pathway cross-talk). In particular, Sstr2 and Sstr4 (for which specific agonistsare currently being developed) represent novel potential tar-gets for the treatment of levodopa-induced dyskinesia. Theprofound molecular adaptations of dSPN and the scarce re-sponse of iSPN during dyskinesiogenic treatment with levodopa
support the use of dopaminergic agents with preferential D2-likereceptor activity as a first-line therapy to prevent dyskinesia inPD (41).
ACKNOWLEDGMENTS. This work was funded by a JPB Foundation grant andDepartment of Defense/US Army Medical Research Acquisition Activity GrantW81XWH-09-1-0402 (to P.G.); a JPB Foundation grant (to M.H.); grants from theSwedish Foundation for International Cooperation in Research and Higher Ed-ucation (STINT) and the Swedish Research Council (to M.A.C.); and by NationalInstitutes of Health/National Institute of Neurological Disorders and Stroke Na-tional Research Service Award training Grant 5F30NS066554-03 (to R.J.F.).
1. Kish SJ, Shannak K, Hornykiewicz O (1988) Uneven pattern of dopamine loss in thestriatum of patients with idiopathic Parkinson’s disease. Pathophysiologic and clinicalimplications. N Engl J Med 318(14):876–880.
2. Gerfen CR, Surmeier DJ (2011) Modulation of striatal projection systems by dopamine.Annu Rev Neurosci 34:441–466.
3. Nutt JG (1990) Levodopa-induced dyskinesia: Review, observations, and speculations.Neurology 40(2):340–345.
4. Hely MA, Morris JG, Reid WG, Trafficante R (2005) Sydney Multicenter Study of Par-kinson’s disease: Non-L-dopa–responsive problems dominate at 15 years. Mov Disord20(2):190–199.
5. Cenci MA, Lee CS, Björklund A (1998) L-DOPA–induced dyskinesia in the rat is asso-ciated with striatal overexpression of prodynorphin- and glutamic acid decarboxylasemRNA. Eur J Neurosci 10(8):2694–2706.
6. Aubert I, et al. (2005) Increased D1 dopamine receptor signaling in levodopa-induceddyskinesia. Ann Neurol 57(1):17–26.
7. Santini E, et al. (2007) Critical involvement of cAMP/DARPP-32 and extracellular sig-nal-regulated protein kinase signaling in L-DOPA–induced dyskinesia. J Neurosci27(26):6995–7005.
8. Westin JE, Vercammen L, Strome EM, Konradi C, Cenci MA (2007) Spatiotemporalpattern of striatal ERK1/2 phosphorylation in a rat model of L-DOPA–induced dyski-nesia and the role of dopamine D1 receptors. Biol Psychiatry 62(7):800–810.
9. Nicholas AP, et al. (2008) Striatal histone modifications in models of levodopa-induceddyskinesia. J Neurochem 106(1):486–494.
10. Santini E, Heiman M, Greengard P, Valjent E, Fisone G (2009) Inhibition of mTORsignaling in Parkinson’s disease prevents L-DOPA–induced dyskinesia. Sci Signal2(80):ra36.
11. Crittenden JR, et al. (2009) Dysregulation of CalDAG-GEFI and CalDAG-GEFII predictsthe severity of motor side-effects induced by anti-parkinsonian therapy. Proc NatlAcad Sci USA 106(8):2892–2896.
12. Darmopil S, Martín AB, De Diego IR, Ares S, Moratalla R (2009) Genetic inactivation ofdopamine D1 but not D2 receptors inhibits L-DOPA–induced dyskinesia and histoneactivation. Biol Psychiatry 66(6):603–613.
13. Cenci MA, Konradi C (2010) Maladaptive striatal plasticity in L-DOPA–induced dyski-nesia. Prog Brain Res 183:209–233.
14. Luquin MR, Laguna J, Obeso JA (1992) Selective D2 receptor stimulation inducesdyskinesia in parkinsonian monkeys. Ann Neurol 31(5):551–554.
15. Grondin R, Doan VD, Grégoire L, Bédard PJ (1999) D1 receptor blockade improvesL-dopa–induced dyskinesia but worsens parkinsonism in MPTP monkeys. Neurology52(4):771–776.
16. Monville C, Torres EM, Dunnett SB (2005) Validation of the L-dopa–induced dyski-nesia in the 6-OHDA model and evaluation of the effects of selective dopamine re-ceptor agonists and antagonists. Brain Res Bull 68(1–2):16–23.
17. Gold SJ, et al. (2007) RGS9-2 negatively modulates L-3,4-dihydroxyphenylalanine-induced dyskinesia in experimental Parkinson’s disease. J Neurosci 27(52):14338–14348.
18. Lindgren HS, Ohlin KE, Cenci MA (2009) Differential involvement of D1 and D2 do-pamine receptors in L-DOPA–induced angiogenic activity in a rat model of Parkinson’sdisease. Neuropsychopharmacology 34(12):2477–2488.
19. Lundblad M, Picconi B, Lindgren H, Cenci MA (2004) A model of L-DOPA–induceddyskinesia in 6-hydroxydopamine lesioned mice: Relation to motor and cellular pa-rameters of nigrostriatal function. Neurobiol Dis 16(1):110–123.
20. Francardo V, et al. (2011) Impact of the lesion procedure on the profiles of motorimpairment and molecular responsiveness to L-DOPA in the 6-hydroxydopaminemouse model of Parkinson’s disease. Neurobiol Dis 42(3):327–340.
21. Heiman M, et al. (2008) A translational profiling approach for the molecular char-
acterization of CNS cell types. Cell 135(4):738–748.22. Huang CY, Tan TH (2012) DUSPs, to MAP kinases and beyond. Cell Biosci 2(1):24.23. Gerfen CR, Miyachi S, Paletzki R, Brown P (2002) D1 dopamine receptor supersensi-
tivity in the dopamine-depleted striatum results from a switch in the regulation of
ERK1/2/MAP kinase. J Neurosci 22(12):5042–5054.24. Cenci MA (2007) Dopamine dysregulation of movement control in L-DOPA–induced
dyskinesia. Trends Neurosci 30(5):236–243.25. Lundblad M, et al. (2005) Pharmacological validation of a mouse model of l-DOPA–
induced dyskinesia. Exp Neurol 194(1):66–75.26. Patterson KI, Brummer T, O’Brien PM, Daly RJ (2009) Dual-specificity phosphatases:
Critical regulators with diverse cellular targets. Biochem J 418(3):475–489.27. Pachkov M, Balwierz PJ, Arnold P, Ozonov E, van Nimwegen E (2013) SwissRegulon,
a database of genome-wide annotations of regulatory sites: Recent updates. Nucleic
Acids Res 41(Database issue):D214–D220.28. Cantuti-Castelvetri I, et al. (2010) Levodopa-induced dyskinesia is associated with in-
creased thyrotropin releasing hormone in the dorsal striatum of hemi-parkinsonian
rats. PLoS ONE 5(11):e13861.29. Andersson M, Hilbertson A, Cenci MA (1999) Striatal fosB expression is causally linked
with L-DOPA–induced abnormal involuntary movements and the associated upre-
gulation of striatal prodynorphin mRNA in a rat model of Parkinson’s disease. Neu-
robiol Dis 6(6):461–474.30. Letourneux C, Rocher G, Porteu F (2006) B56-containing PP2A dephosphorylate ERK
and their activity is controlled by the early gene IEX-1 and ERK. EMBO J 25(4):
727–738.31. Gao M, et al. (2004) Jun turnover is controlled through JNK-dependent phosphory-
lation of the E3 ligase Itch. Science 306(5694):271–275.32. Warren OC, et al. (2013) Factors predictive of the development of Levodopa-induced
dyskinesia and wearing-off in Parkinson’s disease. Mov Disord 28(8):1064–1071.33. Greengard P (2001) The neurobiology of slow synaptic transmission. Science 294(5544):
1024–1030.34. Posner BA, Gilman AG, Harris BA (1999) Regulators of G protein signaling 6 and 7.
Purification of complexes with gbeta5 and assessment of their effects on G protein-
mediated signaling pathways. J Biol Chem 274(43):31087–31093.35. Druey KM, et al. (1999) Amino-terminal cysteine residues of RGS16 are required
for palmitoylation and modulation of Gi- and Gq-mediated signaling. J Biol Chem
274(26):18836–18842.36. Hopf FW, Seif T, Mohamedi ML, Chen BT, Bonci A (2010) The small-conductance
calcium-activated potassium channel is a key modulator of firing and long-term de-
pression in the dorsal striatum. Eur J Neurosci 31(11):1946–1959.37. Młyniec K, Budziszewska B, Reczy�nski W, Sowa-Ku�cma M, Nowak G (2013) The role of
the GPR39 receptor in zinc deficient-animal model of depression. Behav Brain Res
238:30–35.38. Młyniec K, Nowak G (2013) GPR39 up-regulation after selective antidepressants.
Neurochem Int 62(7):936–939.39. Perlmann T, Wallén-Mackenzie A (2004) Nurr1, an orphan nuclear receptor with es-
sential functions in developing dopamine cells. Cell Tissue Res 318(1):45–52.40. Jankovic J, Chen S, Le WD (2005) The role of Nurr1 in the development of dopami-
nergic neurons and Parkinson’s disease. Prog Neurobiol 77(1–2):128–138.41. Ferreira JJ, Rascol O (2000) Prevention and therapeutic strategies for levodopa-
induced dyskinesias in Parkinson’s disease. Curr Opin Neurol 13(4):431–436.
Heiman et al. PNAS | March 25, 2014 | vol. 111 | no. 12 | 4583
NEU
ROSC
IENCE

Supporting InformationHeiman et al. 10.1073/pnas.1401819111SI Materials and MethodsMouse Use. All animal experiments were conducted with theapproval of the Massachusetts Institute of Technology or TheRockefeller University Animal Care and Use Committees. Micewere housed with food and water provided ad libitum. Experi-ments were conducted with Drd1::EGFP-L10a or Drd2::EGFP-L10a BAC transgenic, adult (9–14 wk) male mice of the C57BL/6J strain background.
6-Hydroxydopamine Lesions. A hemiparkinsonian condition wasinduced in mice by unilateral injection of 6-hydroxydopamine(6-OHDA) in the right medial forebrain bundle (MFB). Ani-mals were anesthetized with a mixture of ketamine (Putney)and xylazine (Lloyd) and mounted on a Kopf stereotaxic framein a flat-skull position. 6-OHDA hydrochloride (Sigma) wasdissolved at a concentration of 3.2 μg/μL free-base in 0.02%ice-cold ascorbate/saline and used within 2 h. One microliterof this solution was injected at the following coordinates (inmillimeters relative to bregma, sagittal suture, and dural sur-face): anterior-posterior = −1.2, lateral = −1.3, dorsoventral =−4.75. Two weeks after the lesions, mice were evaluated withtests of spontaneous ipsilateral turning behavior and limb useasymmetry (cylinder test) to select animals with successful le-sions (1). For translating ribosome affinity purification (TRAP)studies of the effect of dopamine depletion alone, we comparedanimals that received an MFB lesion to animals that receiveda mock lesion (ascorbate/saline alone injected). Both of thesegroups went on to receive chronic saline injections, so that theMFB group could also be used as a comparison group for thoseadditional MFB-lesioned mice that received chronic levodopaL-DOPA injections.
Tissue Preparation. At the end of the behavioral studies, micewere killed by decapitation 2 h after the last dose of levodopa [aninterval frequently used in transcriptomic studies of levodopa-treated Parkinson’s disease (PD) models; see e.g., ref. 2]. Afterdecapitation, the brains were rapidly extracted, striata weredissected for TRAP analysis, and the remaining part of thebrain (diencephalon and brainstem) was immersion-fixed for24 h in buffered, ice-cold 4% (wt/vol) paraformaldehyde and 10%(wt/vol) sucrose. Coronal sections of 30-μm thickness were thencut on a cryostat and stored in a nonfreezing solution [30% (wt/vol)ethylene glycol and 30% (wt/vol) glycerol in 0.1 M phosphatebuffer] at −20 °C. Immunohistochemistry for tyrosine hydroxy-lase (TH, staining dopamine cells) was then used to verify all ofthe lesions. All animals used in the TRAP analysis showeda virtually complete loss of TH-positive neurons in the sub-stantia nigra pars compacta on the side ipsilateral to the lesion(Fig. S1).
Levodopa Treatment and Behavioral Analysis. L-DOPA methyl esterand the peripheral DOPA decarboxylase inhibitor benserazide-hydrochloride (Sigma) were dissolved in physiological salineimmediately before use. The drugs were injected at the volumeof 0.1 mL/10 g body weight in a single intraperitoneal injectionper day. Benserazide was always administered at a fixed dose (12mg/kg per injection). Three weeks after lesion surgery, mice withsuccessful lesions were randomly allocated to receive treatmentwith “high-dose L-DOPA,” “low-dose L-DOPA,” or saline. Thehigh-dose L-DOPA regimen (3 mg/kg on days 1–3, followed by6 mg/kg on days 4–9) was expected to induce severe dyskinesiain all MFB-lesioned mice (1, 3). The low-dose L-DOPA regimen
(1 mg/kg on days 1–3, followed by 2 mg/kg on days 4–9) was ex-pected to reverse limb use asymmetry without causing conspicuousdyskinesia. To equalize the effects of stress and handling acrossall groups, including control groups, all mice were equally han-dled and thus received saline injections when not receivinglevodopa injections. Abnormal involuntary movements (AIMs)were rated using a validated scale, as previously described (1).Each mouse was observed individually for 1 min every 20 min for3 h, starting 20 min after L-DOPA/benserazide (or saline) ad-ministration. Only hyperkinetic and dystonic movements thatcould be clearly distinguished from naturally occurring behaviors(i.e., grooming, sniffing, rearing, and gnawing) were consideredin the ratings. The AIMs were classified into three subtypes: (i)axial AIMs (i.e., twisting of the neck and upper body toward theside contralateral to the lesion); (ii) orolingual AIMs (i.e., jawmovements and contralateral tongue protrusion); (iii) forelimbAIMs (i.e., fluttering movements of the forelimb). Each AIMsubtype was rated on a severity scale from 0 to 4: 0, absent; 1,present during less than 50% of the observation time; 2, presentduring more than 50% of the observation time; 3, present allof the time but suppressible by light visual-auditory stimuli; 4,continuous, severe and not suppressible.
TRAP Purification. Immediately following the last session of be-havioral testing, mice were killed by decapitation and the dorsalstriatum ipsilateral to the lesion of each mouse was manuallydissected for TRAP purification of mRNA. As noted above, toequalize the effects of stress and handling across all groups, in-cluding control groups, all mice were equally handled and thusreceived saline injections when not receiving levodopa injections.TRAP purifications were carried out as described in ref. 4, withthe following modifications: purifications were conducted fromsingle animal tissue; the affinity matrix consisted of anti-GFPmonoclonal antibodies 19F7 and 19C8 (Memorial Sloan-KetteringMonoclonal Antibody Facility) bound to biotinylated Protein L(Thermo Scientific)-coated Streptavidin MyOne T1 Dynabeads(Invitrogen); affinity matrix was bound to clarified tissue lysatefor 16–18 h; TRAP-purified RNA was loaded directly onto Ab-solutely RNA Nanoprep Kit purification columns (Agilent Tech-nologies) and purified with on-column DNase digestion.
Differential Expression Analysis. Affymetrix CEL files were pro-cessed and normalized using the RMA algorithm from theBioconductor “affy” package (5). For each (Dose, Cell Type)group, log2 fold-change for each probe-set was computed asthe difference in mean expression compared with the matchedsaline-treated group. Significance of differences between groupswas calculated by Welch’s t test using scipy.stats or R (6). Toreport counts for comparisons between groups, we defined sig-nificantly differentially expressed genes as those having anyprobe-set with greater than 1.5-fold change and a Benjamini–Hochberg adjusted P value from Welch’s t test < 0.10. Source codeand data files to replicate all statistical analyses are provided onthe Web site http://pd.sciencespace.org. Dataset S20 contains allstatistical results for all probe-sets.
Linear Modeling of AIM Scores from Dose and Gene Expression. Totest the hypothesis that differences in gene expression may becorrelated to variation in AIMs severity, we considered two setsof nested linear models relating expression of each probe-set,L-DOPA dose, and AIM score: AIMs ∼ Expression + C(Dose),AIMs ∼ C(Dose), and AIMs ∼ Expression, as well as Expression ∼
Heiman et al. www.pnas.org/cgi/content/short/1401819111 1 of 11

AIMs + C(Dose), Expression ∼ C(Dose), and Expression ∼AIMs. C(Dose) refers to the factor variable representing high-or low-dose levodopa treatment. Models were fit using the “ols”procedure in the python statsmodels module (7). Comparingthese models allowed assessment of whether expression was cor-related with AIM score, and whether that correlation was morethan would have been expected given the common dependenceof dyskinesia and expression on levodopa dose. This processdistinguishes three possible sets of genes: (i) dose-dependentgenes with the expected correlation with dyskinesia severity (i.e.,significant differential expression across dose, and significantassociation of AIM score and dose, but nonsignificant associa-tion of AIM score and expression, adjusting for dose); (ii) dose-dependent genes with excess correlation with dyskinesia (i.e., asin i, but with significant association of AIM score and expression,adjusting for dose); and (iii) genes with expression independentof dose yet correlated with dyskinesia (i.e., as in ii, but withoutsignificant differential expression between doses). Fig. S4 showstheoretical examples of each of these types of possible probe-sets. Dataset S16 reports statistics for all model fits and com-parisons, to enable comparisons among models and sortingprobe-sets by correlations with AIMs, statistical significance, ormagnitudes of expression changes. Probe-sets are sorted by thesignificance of the multiple correlation for the model “Expres-sion ∼ C(Dose) + AIMs,” after filtering for significant changesof 1.5-fold or greater between the high- and low-dose groups.
Multiple Hypothesis Testing Adjustment. P values from all statisticaltests were adjusted using the Benjamini–Hochberg procedurewith “multicomp.multipletests” in python statsmodels (7) to con-trol false-discovery rate (FDR) over all probe-sets. Bonferroni-adjusted and nominal P values are also reported.
Pathways Analysis. For each treatment group, the set of statisticallysignificant differentially expressed genes (Benjamini–HochbergFDR, cut-off of 0.10), independent of magnitude of change, wascompared against the Wikipathways gene sets to compute over-laps. Statistical significance of gene set overlaps was assessed bya hypergeometric test.
Motif Enrichment Analysis. Conserved motif predictions for themm9 mouse genome were obtained from the SwissRegulon da-tabase (8). Motifs were assigned to a gene if they had a Swiss-Regulon prediction score ≥0.7 and occurred between 5-kb upstreamof the transcription start site to 2-kb downstream of the tran-scription end site (based on the refFlat annotation from theUniversity of California at Santa Cruz Genome Browser). Motifswere ranked by the number of genes with which they were as-sociated in each experimental group, counting each motif nomore than once per gene. Significance of enrichment was esti-mated by a hypergeometric test.
SI DiscussionAlthough our previously published TRAP protocol necessitatedthe use of pooled tissue, we have here applied a refined procedureenabling the analysis of single animals (SI Materials and Methods).We have commented on the results of our TRAP analyses asreflecting changes to mRNA expression. In fact, TRAP analysesreflect the abundance of mRNA bound to translating ribosomes,and may therefore reflect both changes to mRNA abundanceand changes to mRNA translation. We thus believe that TRAPdata are more informative than total mRNA abundance valuesin predicting changes in protein levels within the cell.A previous study by Meurers et al. (9) examined gene-
expression changes in laser-microdissected rat spiny projectionneurons (SPNs) in response to dopamine depletion and levodopatreatment. However, it is difficult to compare our results to thoseby Meurers et al., not only because raw data from that previous
study were not published, but also because of its quite differentexperimental goals. We believe our study to be distinct from theimportant Meurers et al. study given that: (i) no statisticallysignificant gene-expression changes that survived multiple testingcorrection were reported in that study (as opposed to severalthousand in this study); (ii) of the gene-expression changes re-ported in that study, all were small magnitude changes (in con-trast to the range of altered gene expression values reported inthis study); (iii) that study contained no behavioral data andhence no rating of AIMs for correlation to gene-expressionchanges (in contrast to the extensive behavioral characterizationsreported here); (iv) only three genes were interrogated in re-sponse to levodopa treatment in that study (as opposed to thegenome-wide study reported here); and (v) custom made cDNAarrays used in that study to study the effects of dopamine de-nervation contained a total number of 6,937 clones, as opposedto the genome-wide arrays used in this study. In conclusion, ourstudy presents not only several molecules previously not linkedto dopamine denervation, but of importance to note, focusesupon the effects of levodopa treatment in the dopamine-depleted(parkinsonian) state.To assess the ability of our approach to identify gene-expres-
sion changes upon dopamine depletion and levodopa treatment,we surveyed the literature and compared the results presentedhere to those of previously published in situ hybridization studies.When combined with immunohistochemistry, in situ hybridiza-tion studies have the ability to detect large-magnitude changesin specific cell types. Our data confirmed reported up-regulationof Fosb and Pdyn in direct-pathway SPNs (dSPNs) upon chroniclevodopa treatment (10). To further validate our approach, wecompared our results to those of previous gene-expression studiesthat did not make use of a cell-type–specific approach. We rea-soned that gene-expression changes that were of high magnitudein one cell type in this study may have been previously reportedas lower magnitude changes in studies that used entire tissue(use of whole tissue would lead to a lowering or cancelling ofapparent gene expression changes). We found multiple instancesin the literature of this phenomenon. Igfbp5 was reported todecrease approximately twofold in expression in total dyskineticrat striatum upon chronic levodopa treatment by Grunblatt et al.(11), whereas we report a greater than fivefold decrease in dSPNsand no change in indirect-pathway SPNs (iSPNs). Homer1 wasreported to increase approximately twofold in total dyskinetic ratstriatum by Konradi et al. (12), whereas our profiling revealeda greater than fourfold increase in dSPNs. Changes to severalother genes reported in previous studies are evident in our data-set, including those several identified by Konradi et al. (Dusp6,Arc, Scg2, Gabra2, Gad1, Slc32a1, Dlg1, Stx4a, Ap2a2, Ap2b1,Dnm2, L1cam, Bcar1, Tnni3, Ptprr, Acp2, and Pdp1) and Ferrarioet al. (Tgfbr2, Timp2, Ywhaz, Rab14, Rgs4, Rpl13a, Atp5g1, Scn1b,Ctss, Ctsl, and Cox7a) (13) but, where fold-change values wereprovided, they often are of a smaller magnitude change thanseen in our dSPN data, consistent with the fact that these studiesused total RNA for analysis. In conclusion, these data, takenspecifically from studies performed with in situ hybridization/immunohistochemistry or rigorous statistical analysis of totalRNA gene-expression data, collectively attest to the increasedsensitivity of our approach in revealing cell-type–specific changesto gene expression.
Alterations Seen upon Dopamine Depletion Alone.Our comparisonsbetween saline-treated 6-OHDA–lesioned and sham-lesionedmice reveal that dSPNs and iSPNs respond to chronic dopaminedepletion with an approximately equal number of genes showingaltered expression (although there is only a small amount of over-lap between the two sets of genes). Additional general conclusionsfrom this dataset are that changes to MAPK signaling regulators(Dusp genes) are likely to contribute to the known increase in
Heiman et al. www.pnas.org/cgi/content/short/1401819111 2 of 11

MAPK inducibility in dSPNs, and that iSPNs up-regulate aphosphodiesterase, Pde1c, likely to counteract loss of Drd2 sig-naling following dopamine-depletion.
Alterations to MAPK Signaling Components During Chronic LevodopaTreatment. Abnormal activation of the MAPK signaling pathwayin dSPNs has been well documented during levodopa treat-ment after dopamine depletion (14–16), and has been attributedto dopamine receptor supersensitivity (17, 18). At the gene-expression level, we find evidence for a modest up-regulationof several components of the MAPK pathway, including B-raf(Braf), Kras, and several kinase genes upon chronic levodopatreatment (Fig. S3 and Dataset S8). However, we also revealseveral homeostatic adaptations that would tend to decreaseMAPK signaling upon chronic levodopa treatment (Fig. S3 andDataset S8): (i) an overall increase in various Dusp gene ex-pression (phosphatases that inactivate MAPKs); (ii) a decreasein Elk1 gene expression (major transcription factor target of
MAPKs); and (iii) an up-regulation of Spry2, Spry4, and Spred2,negative regulators of MAPK activity (19–22). Protein phos-phatase 2A (PP2A) is known to be a negative regulator of theMAPK pathway; however, recent data suggest that it can alsoactivate this pathway (e.g., ref. 23), and thus changes to PP2A inour expression data are difficult to interpret with respect toMAPK targets. The largest magnitude changes to the MAPKpathway at the gene-expression level are to Dusp4 [the productof which targets ERK and JNK (24)], Dusp14 [the product ofwhich can dephosphorylate ERK, JNK, and p38 proteins (25)],and Mapkapk3 [a MAPK-activated protein kinase that can beactivated by, and potentially amplify, signaling from p38, JNK, orERK MAPKs (26)] (Fig. S3). Although suggesting a homeostaticresponse to activation of MAPK signaling, these results dem-onstrate that the gene-expression changes are not only targetedto the ERK arm of the MAPK pathway, but that JNK and p38kinases are activated and thus targeted as well.
1. Francardo V, et al. (2011) Impact of the lesion procedure on the profiles of motorimpairment and molecular responsiveness to L-DOPA in the 6-hydroxydopaminemouse model of Parkinson’s disease. Neurobiol Dis 42(3):327–340.
2. El Atifi-Borel M, et al. (2009) De novo and long-term L-Dopa induce both common anddistinct striatal gene profiles in the hemiparkinsonian rat. Neurobiol Dis 34(2):340–350.
3. Fasano S, et al. (2010) Inhibition of Ras-guanine nucleotide-releasing factor 1 (Ras-GRF1) signaling in the striatum reverts motor symptoms associated with L-dopa–induced dyskinesia. Proc Natl Acad Sci USA 107(50):21824–21829.
4. Heiman M, et al. (2008) A translational profiling approach for the molecular char-acterization of CNS cell types. Cell 135(4):738–748.
5. Gautier L, Cope L, Bolstad BM, Irizarry RA (2004) affy—Analysis of Affymetrix GeneChipdata at the probe level. Bioinformatics 20(3):307–315.
6. R Core Team (2012) R: A Language and Environment for Statistical Computing (RFoundation for Statistical Computing, Vienna, Austria).
7. Seabold JS, Perktold J (2010) Statsmodels: Econometric and Statistical Modeling withPython. Python in Science Conference, June 28–30, 2010, Austin, TX.
8. Pachkov M, Balwierz PJ, Arnold P, Ozonov E, van Nimwegen E (2013) SwissRegulon,a database of genome-wide annotations of regulatory sites: Recent updates. NucleicAcids Res 41(Database issue):D214–D220.
9. Meurers BH, et al. (2009) Dopamine depletion induces distinct compensatory geneexpression changes in DARPP-32 signal transduction cascades of striatonigral andstriatopallidal neurons. J Neurosci 29(21):6828–6839.
10. Andersson M, Hilbertson A, Cenci MA (1999) Striatal fosB expression is causally linkedwith L-DOPA–induced abnormal involuntary movements and the associated upreg-ulation of striatal prodynorphin mRNA in a rat model of Parkinson’s disease. NeurobiolDis 6(6):461–474.
11. Grünblatt E, Schmidt WJ, Scheller DK, Riederer P, Gerlach M (2011) Transcriptionalalterations under continuous or pulsatile dopaminergic treatment in dyskinetic rats.J Neural Transm 118(12):1717–1725.
12. Konradi C, et al. (2004) Transcriptome analysis in a rat model of L-DOPA–induceddyskinesia. Neurobiol Dis 17(2):219–236.
13. Ferrario JE, et al. (2004) Differential gene expression induced by chronic levodopatreatment in the striatum of rats with lesions of the nigrostriatal system. J Neurochem90(6):1348–1358.
14. Santini E, et al. (2007) Critical involvement of cAMP/DARPP-32 and extracellularsignal-regulated protein kinase signaling in L-DOPA–induced dyskinesia. J Neurosci27(26):6995–7005.
15. Westin JE, Vercammen L, Strome EM, Konradi C, Cenci MA (2007) Spatiotemporalpattern of striatal ERK1/2 phosphorylation in a rat model of L-DOPA–induceddyskinesia and the role of dopamine D1 receptors. Biol Psychiatry 62(7):800–810.
16. Darmopil S, Martín AB, De Diego IR, Ares S, Moratalla R (2009) Genetic inactivation ofdopamine D1 but not D2 receptors inhibits L-DOPA–induced dyskinesia and histoneactivation. Biol Psychiatry 66(6):603–613.
17. Gerfen CR, Miyachi S, Paletzki R, Brown P (2002) D1 dopamine receptor supersensitiv-ity in the dopamine-depleted striatum results from a switch in the regulation ofERK1/2/MAP kinase. J Neurosci 22(12):5042–5054.
18. Cenci MA, Konradi C (2010) Maladaptive striatal plasticity in L-DOPA–induceddyskinesia. Prog Brain Res 183:209–233.
19. Casci T, Vinós J, Freeman M (1999) Sprouty, an intracellular inhibitor of Ras signaling.Cell 96(5):655–665.
20. Hanafusa H, Torii S, Yasunaga T, Nishida E (2002) Sprouty1 and Sprouty2 providea control mechanism for the Ras/MAPK signalling pathway. Nat Cell Biol 4(11):850–858.
21. Sasaki A, et al. (2003) Mammalian Sprouty4 suppresses Ras-independent ERKactivation by binding to Raf1. Nat Cell Biol 5(5):427–432.
22. Wakioka T, et al. (2001) Spred is a Sprouty-related suppressor of Ras signalling. Nature412(6847):647–651.
23. Adams DG, et al. (2005) Positive regulation of Raf1-MEK1/2-ERK1/2 signaling byprotein serine/threonine phosphatase 2A holoenzymes. J Biol Chem 280(52):42644–42654.
24. Chu Y, Solski PA, Khosravi-Far R, Der CJ, Kelly K (1996) The mitogen-activated proteinkinase phosphatases PAC1, MKP-1, and MKP-2 have unique substrate specificities andreduced activity in vivo toward the ERK2 sevenmaker mutation. J Biol Chem 271(11):6497–6501.
25. Marti F, et al. (2001) Negative-feedback regulation of CD28 costimulation by a novelmitogen-activated protein kinase phosphatase, MKP6. J Immunol 166(1):197–206.
26. Ludwig S, et al. (1996) 3pK, a novel mitogen-activated protein (MAP) kinase-activatedprotein kinase, is targeted by three MAP kinase pathways. Mol Cell Biol 16(12):6687–6697.
Heiman et al. www.pnas.org/cgi/content/short/1401819111 3 of 11

Fig. S1. Analysis of 6-OHDA lesion efficacy. (A) Photomicrographs of TH-immunostained sections through the midbrain illustrate the dramatic loss ofTH-immunoreactive neurons in the substantia nigra pars compacta (SNc) induced by unilateral 6-OHDA lesion. This pattern of cell loss occurred in all of theTRAP-profiled animals. (Scale bar, 500 μm.) (B) The absolute number of TH-positive neurons in the SNc was estimated using unbiased stereology in a subset ofMFB-lesioned and sham-lesioned mice (n = 6 per group). This analysis showed an average 98% reduction in the number of nigral TH-positive neurons on theside ipsilateral to the MFB lesion, and no change on the contralateral side. Two-way ANOVA and post hoc Bonferroni test; group, F(1, 20) = 38.17, P < 0.001; side,F(1, 20) = 54.40, P < 0.001; interaction, F(1, 20) = 44.59, P < 0.001; *P < 0.001 MFB-lesion side vs. sham-lesion side. The number of mice per group was n = 6.
Heiman et al. www.pnas.org/cgi/content/short/1401819111 4 of 11

Fig. S2. Behavioral effects of L-DOPA treatment. Mice with 6-OHDA lesions were randomly allocated to receive treatment with high-dose L-DOPA, low-doseL-DOPA, or saline. The high-dose L-DOPA regimen (3 mg/kg on days 1–3, followed by 6 mg/kg on days 4–9) was meant to induce severe dyskinesia in all of themice (1). A low-dose L-DOPA regimen (1 mg/kg on days 1–3, followed by 2 mg/kg on days 4–8) was used for a comparison. This dosage was sufficient topromptly reverse lesion-induced motor deficits, and proved to also induce mild-moderate dyskinetic behaviors in all of the animals by the end of the treatment.(A) Forelimb use asymmetry was evaluated in the cylinder test both before the start of L-DOPA treatment (baseline) and on the second and seventh day ofthe treatment (d2 and d7, respectively). Data show the percentage of supporting wall contacts performed by the paw contralateral to the lesion [two-wayrepeated-measures ANOVA and post hoc Bonferroni test; interaction, F(14, 152) = 11.28, P < 0.001; time, F(2,152) = 74.73, P < 0.001; group, F(7, 76) = 23.36, P <0.001; *P < 0.05 vs. saline-treated mice (within the same genotype); #P < 0.05 vs. sham-lesioned mice (within the same genotype]. Number of mice per group:Drd2-TRAP saline n = 6; Drd1-TRAP saline, n = 10; Drd2-TRAP LD low dose, n = 8; Drd1-TRAP LD low dose, n = 11; Drd2-TRAP LD high dose, n = 9; Drd1-TRAP LDhigh dose, n = 11; Drd2-TRAP sham lesion, n = 18; Drd1-TRAP sham lesion, n = 11. Sham lesion animals were treated with either L-DOPA or saline and thenpooled in one group for the final statistical analysis, as treatment with L-DOPA had no motor stimulant effects in these mice (in agreement with ref. 1). (B)Evolution of axial, limb and orolingual AIM scores during chronic L-DOPA treatment. Data show sum of AIM scores per session. Two-way repeated-measuresANOVA and post hoc Bonferroni test; Interaction, F(20, 204) = 8.59, P < 0.001; time(4,204) = 71.11, P < 0.001; group, F(5,51) = 48.43, P < 0.001. (C) Cumulative AIMscores during the chronic treatment. Data show sum of axial, limb and orolingual AIM score on all of the testing sessions. One-way ANOVA and post hocBonferroni test; F(5, 50) = 46, P < 0.05. In B and C, *P < 0.05 vs. saline-treated mice (within the same genotype); oP < 0.05 vs. all other groups (within the samegenotype). In B and C, the number of mice per group was the following: Drd2-TRAP saline, n = 6; Drd1-TRAP saline, n = 11; Drd2-TRAP LD low dose, n = 8; Drd1-TRAP low dose, n = 12; Drd2-TRAP LD high dose, n = 9; Drd1-TRAP LD high dose, n = 11.
Heiman et al. www.pnas.org/cgi/content/short/1401819111 5 of 11

Corticostriatal
nerve terminal
Nigrostriatal
nerve terminal Dopamine
Glutamate
Ras
Raf
MEK
ERK
Gαs/olf
Dusp
ionotropic glutamate receptor
D1
JNK1/2/3
D2
Gαi
Ca2+ channel
Ca2+
Ca2+ channel
AC5
PKA
CREM
Elk-1Nr4a2
c-Jun
Gαi
cyclic AMP
DARPP-32
PP1
β γ
β γ
D2
GRK
β-ARR
Akt
GSK-3β
PP2A
PLC
Stress
DAG IP3
IP3R
Ca2+
c-FosCREB
CRE AP-1
NR4a
transcriptionalregulation
MAPKsignaling
histone
modification
ETS
alternative
splicing
PP2A
PR72 GPCRsignaling
MSK-1
Fig. S3. (Continued)
Heiman et al. www.pnas.org/cgi/content/short/1401819111 6 of 11

Fig. S3. Schematic of and expression changes to factors that transmit dopamine signals in SPNs. Central schematic: The excitatory neurotransmitter glutamate isreleased at corticostriatal terminals, where it binds to ionotropic and metabotropic glutamate receptors. Activation of N-methyl-D-aspartate receptors and me-tabotropic glutamate receptor 5 (mGluR5) leads to activation of the Ras-Raf-MEK-ERK signaling pathway and alterations in gene transcription through phos-phorylation of transcription factors and histone proteins. The neuromodulator dopamine is released and binds to metabotropic dopamine receptors at nigrostriatalsynapses. Drd1a receptors (expressed by dSPNs) lead to an increase in cAMP production through Gα/olf coupling, and Drd2 receptors (expressed by iSPNs) lead toa decrease in cAMP production through Gαi coupling. Increases in cAMP levels lead to activation of protein kinase A (PKA), which can in turn lead to the activationof PP2A and inhibition of protein phosphatase 1 (PP1), all of which promote cyclic AMP-responsive element binding (CREB)-dependent signaling. Increases in
Legend continued on following page
Heiman et al. www.pnas.org/cgi/content/short/1401819111 7 of 11

postsynaptic cytoplasmic calcium (Ca2+) levels through calcium entry or Drd2-Gβ/γ activity can lead to Ras or PP2A activation. GRK proteins lead to dopamine re-ceptor internalization (star). A β-arrestin/AKT/PP2A/Drd2 complex can noncannonically affect the Wnt signaling pathway, although the role of this signalingcomplex during levodopa treatment is not clear. Finally, stress (e.g., endoplasmic reticulum stress) can lead to JNK pathway activation. Lines that end with ar-rowheads signify a stimulatory connection, and lines that end with a bar signify an inhibitory connection. Dashed lines signify an indirect link, and solid lines signifya direct link. Because of space constraints, not all signaling pathways, molecules, or connections are shown. Heat-maps: For the major signaling pathways describedin the central schematic, microarray probe-set heat-maps are listed next to gene names (red, increased; blue, decreased; white, no significant change, based on log2fold expression changes). D, dopamine depletion with chronic saline treatment vs. mock injection (no depletion) with chronic saline treatment; L, dopaminedepletion with chronic low-dose levodopa treatment vs. dopamine depletion with chronic saline treatment; H, dopamine depletion with chronic high-doselevodopa treatment vs. dopamine depletion with chronic saline treatment; C, dopamine depletion with chronic high-dose levodopa treatment vs. dopaminedepletion with chronic low-dose levodopa treatment, a comparison used to identify gene expression changes with correlation to dose and AIMs.
Heiman et al. www.pnas.org/cgi/content/short/1401819111 8 of 11

log2 expression
inte
grat
ed A
IMs
Group 1: Gene expression is dose-dependent;expected correlation between expression and AIMs score;
improvement in model by including expression)
log2 expression
inte
grat
ed A
IMs
Group 2: Gene expression is dose-dependent;excess correlation between
expression and AIMs score, even given knowledge of dose
log2 expression
inte
grat
ed A
IMs
Group 3: Gene expression is not related to dose;but AIMs score is correlated with expression
chronic, low-dose levodopa
chronic, high-dose levodopa
AIM ~ expression
C
B
A
AIM ~ Dose + Expression
AIM ~ Dose
AIM ~ Dose + Expression
AIM ~ Dose
chronic, low-dose levodopa
chronic, high-dose levodopa
AIM ~ expression
AIM ~ Dose + Expression
AIM ~ Dose
AIM ~ Dose + Expression
AIM ~ Dose
chronic, low-dose levodopa
chronic, high-dose levodopa
AIM ~ expression
AIM ~ Dose + Expression
AIM ~ Dose
AIM ~ Dose + Expression
AIM ~ Dose
Fig. S4. Hypothetical examples of genes with different relationships to AIM scores that are distinguished by comparisons between alternative linear models.Each panel shows a scatter plot of AIM score vs. log2 expression. Each point represents one gene in one mouse; its expression is encoded by horizontal position,and the integrated AIM score of that mouse is encoded by vertical position. Blue points represent measurements from mice treated with low-dose levodopa;red points are from mice treated with the high dose of the drug. (A) An example of a gene in group 1. The expression of this gene is dependent on dose. Fine
Legend continued on following page
Heiman et al. www.pnas.org/cgi/content/short/1401819111 9 of 11

dotted lines show the predicted AIM score for a model of AIM score as a function of dose (blue for low-dose and red for high dose). If the AIM score is modeledas a function of gene expression alone (AIM ∼ Expression), there is a significant correlation between AIM score and expression (green dotted line). Red andblue large dashed lines depict AIM score prediction from a model using both dose and expression (AIM ∼ Dose + Expression). For group 1, there is no significantdifference between the dashed and dotted lines; conditional on knowledge of dose, AIM score is not correlated with expression. (B) A hypothetical gene in group2. For this gene, there is a significant difference between the dashed and dotted lines; the model (AIM ∼ Dose + Expression) fits significantly better than (AIM ∼Dose). (C) A hypothetical gene in group 3, for which AIM score is not well modeled by gene expression alone (AIM ∼ expression), because expression measurementsoverlap between the dose groups. However, there is again a significant difference between (AIM ∼ Dose + Expression) and (AIM ∼ Dose) models.
Dataset S1. Probe-sets with significant changes (Benjamini–Hochberg adjusted P values < 0.10) of at least 1.5-fold up or down in dSPNsfollowing dopamine depletion and chronic saline treatment
Dataset S1
Dataset S2. Probesets for genes with significant differential expression upon dopamine depletion in both dSPNs and iSPNs
Dataset S2
Dataset S3. Probe-sets with significant changes (Benjamini–Hochberg adjusted P values < 0.10) of at least 1.5-fold up or down in iSPNsfollowing dopamine depletion and chronic saline treatment
Dataset S3
Dataset S4. Enriched pathways from Wikipathways in dopamine-depleted dSPNs
Dataset S4
Dataset S5. Enriched pathways from Wikipathways in dopamine-depleted iSPNs
Dataset S5
Dataset S6. Probe-sets with significant (Benjamini–Hochberg adjust P value < 0.10) changes of at least 1.5-fold up or down in dSPNswith low-dose chronic levodopa following dopamine depletion
Dataset S6
Dataset S7. Enriched Wikipathways pathways among genes differentially expressed with low-dose levodopa in dSPNs
Dataset S7
Dataset S8. Probe-sets with significant changes (Benjamini–Hochberg adjusted P value < 0.10) of at least 1.5-fold up or down in dSPNswith high-dose chronic levodopa treatment following dopamine depletion
Dataset S8
Dataset S9. Probe-sets with significant (Benjamini–Hochberg adjustd P value < 0.10) changes of at least 1.5-fold up or down in dSPNswith high-dose levodopa that also had any statistically significant changes with low-dose levodopa
Dataset S9
Dataset S10. Wikipathways pathways enriched among genes altered by high-dose levodopa in dSPNs
Dataset S10
Heiman et al. www.pnas.org/cgi/content/short/1401819111 10 of 11

Dataset S11. Motifs enriched within promoter regions (as predicted by SwissRegulon) of genes with altered expression in dSPNs uponchronic high-dose levodopa treatment
Dataset S11
Dataset S12. Differentially expressed probe-sets in iSPNs with low-dose chronic levodopa
Dataset S12
Dataset S13. Differentially expressed probe-sets (Benjamini–Hochberg adjusted P value < 0.10, at least 1.5-fold up or down) in iSPNswith chronic high-dose levodopa
Dataset S13
Dataset S14. Probe-sets significantly altered (≥ 1.5 fold-change up or down) by high-dose levodopa in both dSPNs and iSPNs
Dataset S14
Dataset S15. Wikipathways pathways enriched in genes altered by high-dose levodopa in iSPNs
Dataset S15
Dataset S16. Probe-sets differentially expressed between high- and low-dose levodopa
Dataset S16
Dataset S17. Wikipathways pathways enriched among dose-dependent positively correlated genes in dSPNs
Dataset S17
Dataset S18. Wikipathways pathways enriched among dose-dependent negatively correlated genes in dSPNs
Dataset S18
Dataset S19. Motifs enriched within promoter regions of genes with significantly altered expression in dSPNs between chronic high-dose and chronic low-dose levodopa treatment
Dataset S19
Dataset S20. Complete table of statistics for all probe-sets and comparisons performed
Dataset S20
Heiman et al. www.pnas.org/cgi/content/short/1401819111 11 of 11
Copyright © 2022 FDOKUMEN