Module 9 – (L35 – L37): “ h ” “Drought Management” - NPTEL
35
Module 9 – (L35 – L37): “ h ” “Drought Management”: Drought assessment and classification, drought l i t hi d ht iti ti l i analysis techniques, drought mitigation planning. 36 Drought Analysis 1 1 36 Drought Analysis
-
Upload
khangminh22 -
Category
Documents
-
view
0 -
download
0
Transcript of Module 9 – (L35 – L37): “ h ” “Drought Management” - NPTEL

Module 9 – (L35 – L37): “ h ”“Drought Management”:
Drought assessment and classification, drought l i t h i d ht iti ti l ianalysis techniques, drought mitigation planning.
36 Drought Analysis11111
36 Drought Analysis
L36L36– Drought AnalysisL36L36 Drought Analysis Topics CoveredTopics Covered Drought analysis, Indices, Drought analysis, Indices, Standardized
precipitation index Palmer Drought Index precipitation index, , Palmer Drought Index (PDI), , Normalized Difference Vegetation I dIndex
Keywords:Keywords: Drought analysis; IndicesDrought analysis; Indicesyy g yg y
2222Prof. T I Eldho, Department of Civil Engineering, IIT Bombay
Drought Analysis Drought Analysis -- IntroductionIntroduction Drought – Complex, least understood natural hazards Large historical datasets- required to study drought Involves complex inter-relationship between
climatological & meteorological data Not possible to avoid droughts But management of Not possible to avoid droughts - But management of
Drought impacts & preparedness is possible Success depends on how drought characteristics are
quantified Drought indices - Assimilate thousands of bits of data
on rainfall, snowpack, stream flow, & other wateron rainfall, snowpack, stream flow, & other watersupply indicators
Ex: Standard Precipitation Index (Popular method)
33Prof. T I Eldho, Department of Civil Engineering, IIT Bombay

Drought Analysis Drought Analysis -- IntroductionIntroduction Drought analysis - Interdependence between climatic,
hydrogeologic, geomorphic, ecological & societal variables Very difficult to adopt a definition that fully describes the Very difficult to adopt a definition that fully describes the
drought phenomena & respective impacts Concept of Drought - Varies among regions of different
lclimates Conceptual definitions of drought- lack to provide the
specifics about the severity, duration & extent of drought.specifics about the severity, duration & extent of drought. Operational definitions of drought - typically require
quantification of “normal" or “expected" conditions withinspecified regions & variations in societal conditionsspecified regions & variations in societal conditions
Operational definitions – Formulated in terms of Drought Indices
44Prof. T I Eldho, Department of Civil Engineering, IIT Bombay

Drought AnalysisDrought Analysis Hydrological Drought Analysis- through hydrological
models – water balance models, evapo-transpiration models water balance models, evapo transpiration studies, groundwater & surface water flow models
Onset, duration and deficit volumes – analyzed from simulated hydrographssimulated hydrographs
Physically based models – more effective To explore the impact of man-induced changes on To explore the impact of man induced changes on
droughts Existing models - still need some improvement if a
very accurate simulation of low flows and associated very accurate simulation of low flows and associated droughts is required.
55Prof. T I Eldho, Department of Civil Engineering, IIT Bombay

Drought Analysis Drought Analysis --ProcedureProcedure 1- Diagnosis of meteorological anomaly causing reduction
of the major water input to the hydrological system –j p y g yprecipitation;
2 – Analysis of the basin hydrological dynamics responsible for water retention, transport, and storage, in terms of its , p , g ,availability for human use (supply analysis);
3 – Analysis of the potential & effective use of water by society (demand analysis), & social and economic impacts of soc ety (de a d a a ys s), & soc a a d eco o c pacts osuch scarcity;
4 – Assessment of methods & models of social & political organization used to react to and mitigate such impacts, organization used to react to and mitigate such impacts, seeking the most appropriated and effective ones in the reduction of societal vulnerability.
66Prof. T I Eldho, Department of Civil Engineering, IIT Bombay

Droughts IndicesDroughts Indices Drought Index – A Single number useful for decision
making Drought Indices- measure different drought-causative
& drought-responsive parameters, & identify & classify drought accordinglydrought accordingly
Used for drought warning & lead time assessment Summarize different data on rainfall snowpack Summarize different data on rainfall, snowpack,
streamflow, and other water supply indicators PDI/PHDI, SPI, CMI, SWSI, VHI – Different Drought / , , , , g
Indices Water supply planners find it useful to consult one or
i di b f ki d i i77
more indices before making a decisionProf. T I Eldho, Department of Civil Engineering, IIT Bombay

Droughts IndicesDroughts Indices Palmer indices take precipitation, evapotranspiration & runoff
into consideration: Palmer Drought Index (PDI): A long-term meteorological Palmer Drought Index (PDI): A long-term meteorological
drought index run on a weekly or monthly basis. Strength: First comprehensive drought index in U.S. Limitations: Slow to detect rapidly changing conditions - Not
as well-suited for inhomogeneous regions- Not as effective in winter –snowpack not considered - Used to Quantify Droughtwinter snowpack not considered Used to Quantify Drought
Crop Moisture Index (CMI): A short-term weekly index designed to reflect quickly changing soil moisture conditions for agricultural applicationsfor agricultural applications.
Limitation: Used mainly during growing season
88Prof. T I Eldho, Department of Civil Engineering, IIT Bombay
Droughts IndicesDroughts Indices Palmer Hydrological Drought Index (PHDI): A monthly index
- quantifies long-term hydrological impacts. Limitation: Responds more slowly to changes than PDIResponds more slowly to changes than PDI
Standardized Precipitation Index (SPI): A monthly probability index considering only precipitation.
l l d f f l (f h ) Calculated for a variety of time-scales (from 1 to 60 months). Strengths: Recognizes drought on many time scales
Anticipates long-term drought cessationAnticipates long term drought cessation Limitation: Only considers precipitation Satellite Vegetation Health Index (VHI): A satellite-derived
index reflecting a combination of chlorophyll & moisture index reflecting a combination of chlorophyll & moisture content in vegetation and changes in thermal conditions at the surface (NDVI).Li it ti U d i l d i i
99
Prof. T I Eldho, Department of Civil Engineering, IIT Bombay
Limitation: Used mainly during growing season

Droughts IndicesDroughts Indices Objective Blended Drought Index Percentiles (OBDI): A
weekly index averaging PDI, soil moisture and 30-day precipitation ranking percentiles.precipitation ranking percentiles.
Strength: Incorporates both long and short term indices Limitation: Opposite-phased long and short-term conditions
ff f l dmay offset in final product
Other useful drought indices include: % of Normal Other useful drought indices include: % of Normal Precipitation; USGS Streamflow Percentiles; USDA/NASS Soil Moisture Measurements (SCAN); SNOTEL Measurements; Surface Water Supply Index (SWSI)** Used in the West and Surface Water Supply Index (SWSI)** Used in the West and primarily during the snow season Drought
1010Prof. T I Eldho, Department of Civil Engineering, IIT Bombay

Palmer Drought Severity Index PDSI: Computation of the PDSI (PDI) incorporates a water
balance model using historic records of monthly precipitation,potential evapotranspiration & simple 2-layer soil moisturepotential evapotranspiration & simple 2 layer soil moisturereservoir
Upper layer is assumed to contain 1 inch (25.4 mm) ofavailable moisture at field capacityavailable moisture at field capacity
Underlying layer has an available capacity that depends onthe soil characteristics of the site
Moisture cannot be removed from the lower layer until thetop layer is dryRunoff (RO) is assumed to occur when both layers reach their Runoff (RO) is assumed to occur when both layers reach theircombined moisture capacity.
1111Prof. T I Eldho, Department of Civil Engineering, IIT Bombay

Palmer Drought Severity Index. Potential values required: Potential evapotranspiration (PE),
Potential recharge (PR) - the amount of moisture required tobring the soil to field capacity, Potential loss (PL) - Thebring the soil to field capacity, Potential loss (PL) Theamount of moisture that could be lost from the soil toevapotranspiration provided precipitation during the periodwas zero Potential runoff (PRO) - the difference between thewas zero, Potential runoff (PRO) the difference between thepotential precipitation and the PR
Climate coefficients are computed as a proportion between f l l l f h f 2averages of actual versus potential values for each of 12
months Climate coefficients are used to compute the amount of Climate coefficients are used to compute the amount of
precipitation required for the Climatically Appropriate for Existing Conditions (CAFEC)
1212Prof. T I Eldho, Department of Civil Engineering, IIT Bombay

Palmer Drought Severity Index.. Difference (d) between the actual (P) and CAFEC
precipitation ( ^P) is an indicator of water deficiency for each month
ET, R, RO and L are actual evapotranspiration, recharge, ff & l ti l )runoff & loss respectively)
A Palmer Moisture Anomaly Index, Z, is defined as Z = K.d K is a weighting factor - to adjust departures from normalg g j p
precipitation such that they are comparable among differentareas & different months
Palmer suggested empirical relationships for K. By plotting Z 1313
a e sugges ed e p ca e a o s ps o y p o gversus duration for the worst drought episodes
Prof. T I Eldho, Department of Civil Engineering, IIT Bombay

Palmer Drought Severity Index… Linear relationship obtained for drought severity is
PDSI of the initial month in a dry or wet spell is equal to Z index indicates how wet or dry it was during a single month Z index indicates how wet or dry it was during a single month
without regard to past precipitation anomalies
1414Ref: Awass, 2009

Droughts Indices Droughts Indices -- SPISPI Standardized precipitation index (SPI) -based on an equi-
probability transformation of aggregated monthlyprecipitation into a standard normal variable ( See Fig)
Computation of the index requires fitting a probability distribution to aggregated monthly precipitation series (e.g. k= 3, 6, 12, 24 months, etc)
(Ref: Awass, 2009)
Fig: Equi-probability transformation from fitted gammadistribution of monthly precipitation aggregated at 12 month
1515
to standard normal distribution at Assassa StationProf. T I Eldho, Department of Civil Engineering, IIT Bombay

Droughts Indices Droughts Indices –– SPI..SPI.. Computing the nonexceedance probability related to such
aggregated values and defining the corresponding standardnormal quantile as the SPInormal quantile as the SPI
SPI has advantages of statistical consistency, & ability todescribe both short-term & long-term drought impactsthrough the different time scales of precipitation anomaliesthrough the different time scales of precipitation anomalies
Relies on one input – Limitation Temporal variability of SPI at different time scales Temporal variability of SPI at different time scales Developed for the purpose of defining & monitoring droughtU.S. National Drought Mitigation Centre Uses the SPI to monitor current states of drought SPI can track drought on multiple time-scales
SPI with 5 running time intervals i e 1 3 6 9 & 12 months1616
SPI with 5 running time intervals, i.e. 1, 3, 6, 9, & 12-monthsProf. T I Eldho, Department of Civil Engineering, IIT Bombay

Droughts Indices Droughts Indices –– SPI…SPI… Computation of the SPI - fitting a Gamma probability density
function to a given frequency distribution of precipitationtotals for a station
Estimation of parameters of gamma probability densityfunction for given frequency (1, 3, 6, 9, & 12 months)
SPI index is flexible with respect to the period chosenSPI index is flexible with respect to the period chosen The Gamma distribution is defined by its frequency or
probability density function
α, β are shape & scale parameters, P – Precipitation amount, Г(α) – Gamma function, Maximum likelihood solution for optimal estimate of α βoptimal estimate of α, β
1717 n-number of observations
Prof. T I Eldho, Department of Civil Engineering, IIT Bombay

Droughts Indices Droughts Indices –– SPI….SPI…. Cumulative probability (H(P)) of an observed precipitation
event for the given month and time scale for the station –Using resulting parametersUsing resulting parameters
g(P) is undefined for P = 0, Hence
q is the probability of a zero & G(P) the cumulative probability of the incomplete gamma functionprobability of the incomplete gamma function
q=m/n, m = no of zero precipitations Cumulative probability, H(P ), after its computation, is
transformed to the standard normal random variable z with mean equal to zero & variance of one, which is the value of the SPI
1818
e S
Prof. T I Eldho, Department of Civil Engineering, IIT Bombay

Droughts Indices Droughts Indices –– SPI….SPI…. Weather Classification by SPI values &
corresponding example : event probabilities
Ref: Awass, 2009
Loukas and Vasiliades(2004)
1919Prof. T I Eldho, Department of Civil Engineering, IIT Bombay

Normalized Difference Vegetation Index NDVI - Based on Spatial & temporal variability of
vegetation Utilizes reflectance spectra of healthy green Utilizes reflectance spectra of healthy green
vegetation -characteristically high in the near infrared 0.73-1.10µm in the case of the NOAA Advanced Very
High Resolution Radiometer (AVHRR)High Resolution Radiometer (AVHRR)Before NDVI Computation, following conversations are
necessaryF t ti th i d t l t th For computation there is a need to geo-locate thepixels from satellite data & remap to chosenprojection
Sensor calibration of individual channels- implemented& digital numbers converted to spectral reflectances toenable NDVI calculation
2020 Atmospheric corrections & employ a method to
screen for clouds
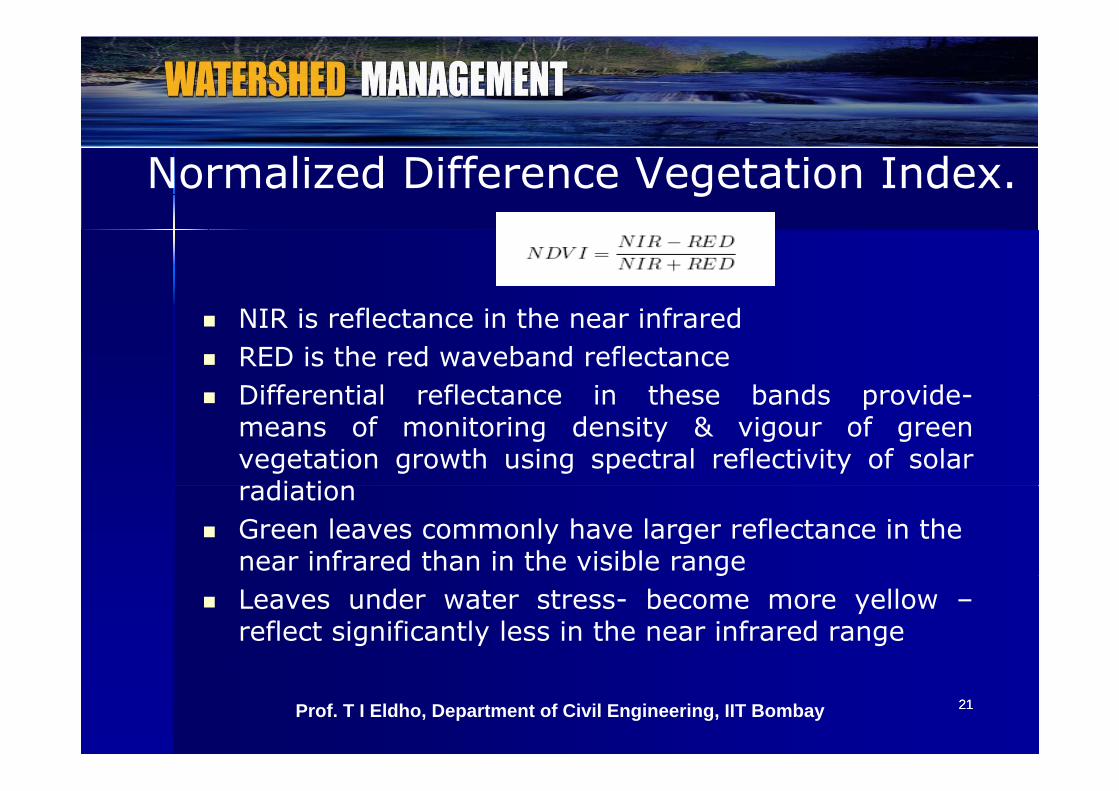
Normalized Difference Vegetation Index.
NIR is reflectance in the near infrared RED is the red waveband reflectance Differential reflectance in these bands provide- Differential reflectance in these bands provide-
means of monitoring density & vigour of greenvegetation growth using spectral reflectivity of solaradiationradiation
Green leaves commonly have larger reflectance in the near infrared than in the visible rangeg
Leaves under water stress- become more yellow –reflect significantly less in the near infrared range
2121Prof. T I Eldho, Department of Civil Engineering, IIT Bombay

Normalized Difference Vegetation Index. Vegetation NDVI typically ranges from 0.1 up to
0.6 With higher values associated with greater
density and greenness of the plant canopy Regions of high variability in NDVI depict regions Regions of high variability in NDVI depict regions
which are either highly variable in precipitationregime
Identify agricultural droughts
R f A 2009Ref: Awass, 2009
2222Prof. T I Eldho, Department of Civil Engineering, IIT Bombay

Droughts Indices Droughts Indices -- ComparisonComparison
2323Prof. T I Eldho, Department of Civil Engineering, IIT Bombay Ref: Awass, 2009

Droughts Assessment ToolsDroughts Assessment Tools U.S. Drought Monitor: A multi-agency weekly drought
assessment product which depicts drought conditions of different time scales and of varying impacts using a blend of different time scales and of varying impacts using a blend of drought indices and local expert input.
Drought Termination and Amelioration: A web tool used to quantify how much precipitation is needed and the to quantify how much precipitation is needed and the probability of receiving such precipitation to end or ameliorate a PHDI drought of specified intensity (PHDI values f 2 6) 6 h lof -2 to -6) on 1 to 6-month time scales.
Main Federal Partners: Joint Agricultural Weather Facility (USDA and DOC/NOAA)
Climate Prediction Center (DOC/NOAA/NWS) National Climatic Data Center (DOC/NOAA) Academic Partner: National Drought Mitigation Center (University of Nebraska-Lincoln)
2424
National Drought Mitigation Center (University of Nebraska-Lincoln)
Prof. T I Eldho, Department of Civil Engineering, IIT Bombay

Drought Severity Classification Drought Monitor - Categories of drought magnitude
2
Primary Indicators - for categories include: PDI, CPC Soil Moisture Model Percentiles, USGS Weekly Streamflow Percentiles Percent of Normal Precipitation SPI & VHI
2525
Percentiles, Percent of Normal Precipitation, SPI & VHI.Prof. T I Eldho, Department of Civil Engineering, IIT Bombay

Drought Situation in India Drought Prone Areas of the Country – Criteria
(MOWR)h h l f ll l h % f When the annual rainfall is less than 75% of
the normal in 20% of the years examined. Less than 30% of the cultivated area is Less than 30% of the cultivated area is
irrigated. The Irrigation Commission, 1972, National g , ,
Commission on Agriculture, 1976, Drought Area Study & Investigation Organization of C W C 1978 C.W.C., 1978
Out of total geographical area of the country (329 M. ha) about 1/6th is drought prone.
2626
( ) / g p
Prof. T I Eldho, Department of Civil Engineering, IIT Bombay

Drought Areas in India Mapping of Drought Areas Over India (2010) – NCC
Research Report, P.G. Gore, T. Prasad, H.R. Hatwar, IMD PuneIMD, Pune
Data & methodology: daily rainfall data of different stations for the period 1901 to 2000 for selected districts with long rainfall data series have been considered.
Drought criteria :- A meteorological drought over an area is defined as a situation when rainfall over that area area is defined as a situation when rainfall over that area is less than 75% of the climatological normal.
Further, when deficit of rainfall is in between 26 to 50%, moderate drought is defined When deficit of rainfall is moderate drought is defined. When deficit of rainfall is more than 50%, severe drought is defined.
2727Prof. T I Eldho, Department of Civil Engineering, IIT Bombay

Drought Areas in IndiaI t t f I di In most parts of India, probabilities of moderatedrought are in range 11 to 20%.
2828
Ref: Mapping of Drought Areas Over India(2010) – NCC Research Report, P.G. Gore, T. Prasad,H.R. Hatwar, IMD, Pune
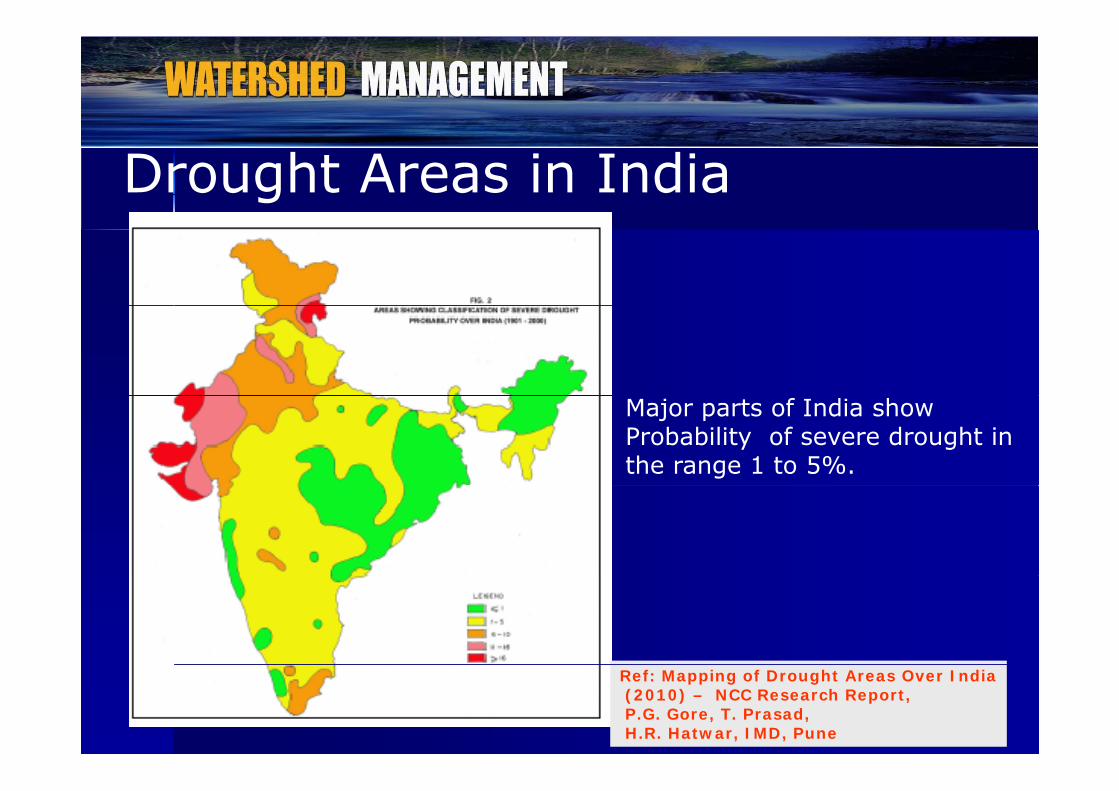
Drought Areas in India
Major parts of India show Probability of severe drought inthe range 1 to 5%.
2929
Ref: Mapping of Drought Areas Over India(2010) – NCC Research Report, P.G. Gore, T. Prasad,H.R. Hatwar, IMD, Pune

Drought Management In India Larger thrust for watershed development under Drought
Prone Area Programme. Dry land farming & water resource development Dry land farming & water resource development Dovetail Crop production activities into the watershed
project along with soil conservation activities.T k l l d l d f i d t ti Take up large scale dry land farming demonstrations.
Undertake Research on the efficacy and economics of sprinkler and drip irrigation systems.
Construction of suitable water harvesting structures-conservation & optimal use of surface water and recharge of underground aquifers
Afforestation and Pasture Development Animal Husbandry and Fodder Development. People's participation in drought proofing
3030
People s participation in drought proofingProf. T I Eldho, Department of Civil Engineering, IIT Bombay

ReferencesReferences http://drought.unl.edu/whatis/what.htm Subramanya k(2007), Engineering Hydrology, Second
diti T t M G Hilledition, Tata McGraw-Hill Aane Abebe Awass (2009), “Hydrological drought analysis-
occurrence, severity, risks: the case of Wabi Shebele River, y,Basin, Ethiopia”, University Siegen.
Loukas.A and Vasiliades.L (2004), “Probabilistic analysis ofdrought spatiotemporal characteristics in Thessaly regiondrought spatiotemporal characteristics in Thessaly region,Greece”, Natural Hazards and Earth System Sciences (2004)4: 719–731
http://wrmin.nic.in http://www.fao.org/nr/water/issues/scarcity.html Mapping of Drought Areas Over India (2010) – NCC
31313131
Mapping of Drought Areas Over India (2010) – NCC Research Report, P.G. Gore, T. Prasad, H.R. Hatwar, IMD, Pune

Tutorials - Question!.?. Critically study the various drought indices
and compare each with advantages & and compare each with advantages & limitations.
From the literature, identify the most From the literature, identify the most suitable drought index for Indian conditions..
32323232
Prof. T I Eldho, Department of Civil Engineering, IIT Bombay

Self Evaluation - Questions!.
Why drought analysis is required for d ht iti ti ?drought mitigation?
What is the role of drought index in drought mitigation?.
Discuss Standardized Precipitation Index p(SPI) with all details.
Describe the drought assessment tools with Describe the drought assessment tools with important features.
33333333Prof. T I Eldho, Department of Civil Engineering, IIT Bombay

Assignment- Questions?.g Q What is drought index?.
E l i P l d ht it i d Explain Palmer drought severity index with all features.
Illustrate Normalized Difference Vegetation Index.g
Discuss drought severity classificationclassification.
34343434Prof. T I Eldho, Department of Civil Engineering, IIT Bombay

Dr. T. I. EldhoDr. T. I. EldhoProfessor,Professor,Department of Civil Engineering, Department of Civil Engineering, p g gp g gIndian Institute of Technology Bombay,Indian Institute of Technology Bombay,Mumbai, India, 400 076.Mumbai, India, 400 076.Email:Email: [email protected]@iitb.ac.in
3535
Email: Email: [email protected]@iitb.ac.inPhone: (022) Phone: (022) –– 25767339; Fax: 2576730225767339; Fax: 25767302http://www.http://www.civil.iitb.ac.incivil.iitb.ac.in