Modulation of cell-mediated immunity by HIV-1 infection of ...
392
Modulation of cell-mediated immunity by HIV-1 infection of macrophages Lucy Caitríona Kiernan Bell Division of Infection and Immunity University College London PhD Supervisor: Dr Mahdad Noursadeghi A thesis submitted for the degree of Doctor of Philosophy University College London August 2014
-
Upload
khangminh22 -
Category
Documents
-
view
1 -
download
0
Transcript of Modulation of cell-mediated immunity by HIV-1 infection of ...

Modulation of cell-mediated immunity
by HIV-1 infection of macrophages
Lucy Caitríona Kiernan Bell
Division of Infection and Immunity
University College London
PhD Supervisor: Dr Mahdad Noursadeghi
A thesis submitted for the degree of
Doctor of Philosophy
University College London
August 2014

2
Declaration
I, Lucy Caitríona Kiernan Bell, confirm that the work presented in this thesis is my own.
Where information has been derived from other sources, I confirm that this has been
indicated in the thesis.

3
Abstract
Cell-mediated immunity (CMI) is central to the host response to intracellular pathogens
such as Mycobacterium tuberculosis (Mtb). The function of CMI can be modulated by
human immunodeficiency virus (HIV)-1 via its pleiotropic effects on the immune
response, including modulation of macrophages, which are parasitized by both HIV-1
and Mtb. HIV-1 infection is associated with increased risk of tuberculosis (TB), and so
in this thesis I sought to explore the host/pathogen interactions through which HIV-1
dysregulates CMI, and thus changes the natural history of TB.
Using an in vitro model of human monocyte-derived macrophages (MDMs), I
characterise a phenotype wherein HIV-1 specifically attenuates production of the
immunoregulatory cytokine interleukin (IL)-10 in response to Mtb and other innate
immune stimuli. I show that this phenotype requires HIV-1 integration and gene
expression, and may result from a function of the HIV-1 accessory proteins. I identify
that the phosphoinositide 3-kinase (PI3K) pathway specifically regulates IL-10
production in human MDMs, and thus may be a target for HIV-1 to mediate IL-10
attenuation. I show that HIV-1 may attenuate IL-10 to maximise its own replication, and
identify potential consequences of IL-10 attenuation for CMI.
By using the tuberculin skin test (TST) as a human challenge model, I evaluate HIV-1
modulation of CMI in vivo in active TB patients, and demonstrate IL-10 attenuation in
this context. I identify a role for type I inteferons (IFNs) in HIV-1 anergy, and observe
exaggerated T helper 2 responses associated with the immune reconstitution
inflammatory syndrome (IRIS). To fully explore CMI in vivo by transcriptional profiling, I
utilize the transcriptional heterogeneity of stimulated macrophages to develop a
modular analysis strategy for transcriptional profiles, and apply this in the TST model.
My results delineate novel modulatory effects of HIV-1 on the function of CMI, and thus
provide insights into immunopathogenesis in HIV-1/TB co-infection.

4
Acknowledgements
First and foremost I must acknowledge my supervisor, Dr Maddy Noursadeghi, whose
zeal, support and advice has seen me through the challenges of the last four years,
from scientific conundrums to experimental catastrophes. His unmitigated enthusiasm
for discussing experiments and hypotheses has been invaluable for the research
presented herein, and for stimulating my own enthusiasm for scientific endeavour. I
must thank both Maddy and my secondary supervisor, Professor Benny Chain, for
creating a supportive and stimulating environment in the lab, which has helped me
learn how to be a scientist (I hope!). I have immensely enjoyed my time working with
them, and have learned so much.
Secondly I have to thank everybody in the lab who has supported me over the course
of this work. I must particularly mention Dr Gillian Tomlinson, whose own work formed
the basis for much of mine, and whose patience guided me through my first months of
lab work. Special thanks also go to Dr Nandi Simpson, Dr Rhia Kundu and Dr Theres
Oakes, for saving me from many inept early moments. I must also thank Dr Elspeth
Potton, Dr Jennifer Roe, Dr Rachel Byng-Maddick, Dr Gabriele Pollara and Jamie
Heather, each of whom has contributed hugely to this work through our collaboration in
the lab over the years – along with everyone else in the Noursadeghi and Chain groups,
and in the Division of Infection and Immunity at UCL.
I would also like to acknowledge Professor Keertan Dheda and Dr Mellissa Pascoe at
the University of Cape Town, Professor Greg Towers and Dr Jane Rasaiyaah at UCL,
and Professor Robin May at the University of Birmingham, whose collaboration has
been essential for the work I have presented here.
A huge thank you goes to the many blood donors who gave up 120ml of their
circulating volume in the name of my experiments, and to all of the patients in London
and Cape Town who participated in the TST study – this would not have been possible
without their goodwill.
I would not have had the opportunity to do this work without the support of Professor
Gordon Stewart and the UCL MB PhD programme. Professor Stewart has been a
source of wisdom, guidance and humour, and I can’t thank him enough for his support
and belief in me. I would also like to thank Professor Ashley Moffatt at the University of

5
Cambridge, for being the first person to stimulate my interest in immunology, and for
introducing me to the notion of mixing clinical medicine and basic science.
Very appreciative thanks go to Elspeth Potton, Ina Schim van der Loeff, Katharine Best
and Gabriele Pollara for proof-reading various parts of this thesis in various unkempt
forms.
I have to thank all of my friends for their support, which has sustained me throughout
the last few years. Very special thanks have to go to Bryony Hopkinshaw and Victoria
Sampson, who have been through the ups and downs with me, and who have listened
to more scientific work crises than any friends should ever have to. Thanks also go to
Becca Burrell, Ina Schim van der Loeff and Chris McKinnon, who have been a constant
source of advice, coffee and pep talks during the busy final year of labwork and thesis-
writing.
I would like to thank and acknowledge all of my family, who have been a tremendous
source of love and support. My cousin Victoria Lennon has been a huge support in
London, and has always been on hand with a G&T, a chat and even a spare bedroom
in times of need. My grandparents Finella and David Wilson have provided invaluable
support to me throughout my education, and many childhood conversations with Papa
David, as well as with my uncle and godfather Thomas McErlean, may have helped
ignite my enthusiasm for academia at an early age.
Lastly, I would like to thank my sisters Alice and Charlotte, and parents Bronagh and
Hugh, whose love and support has been the greatest support and solace of all. Their
belief in me has got me to where I am today, and their reassurance has got me through
the most difficult times of all – I would like to dedicate this thesis to all of them.

6
Table of Contents
Abstract ......................................................................................................................... 3 Acknowledgements ...................................................................................................... 4 Table of Contents ......................................................................................................... 6 Table of figures ........................................................................................................... 11 List of tables ............................................................................................................... 16 Abbreviations .............................................................................................................. 18 Publication .................................................................................................................. 24 Chapter 1. Introduction ........................................................................................ 25
1.1 The cell-mediated immune system ............................................................... 25 1.1.1 Overview: the delayed-type hypersensitivity and cell-mediated immunity paradigm ............................................................................................................... 25 1.1.2 CMI and infectious diseases ...................................................................... 28
1.2 The role of macrophages in CMI ................................................................... 31 1.2.1 The mononuclear phagocyte system ......................................................... 31 1.2.2 Monocytes and monocyte-derived cells ..................................................... 34 1.2.3 Dendritic cells ............................................................................................ 36 1.2.4 Embryologically-derived tissue macrophages ............................................ 37 1.2.5 Functions of macrophages in CMI ............................................................. 41 1.2.6 Innate immune recognition by macrophages ............................................. 41 1.2.7 Macrophage effector functions................................................................... 45 1.2.8 Interactions of macrophages with the adaptive immune system ................ 47 1.2.9 Macrophage functional plasticity ................................................................ 51
1.3 HIV-1 infection and CMI ................................................................................. 53 1.3.1 The human immunodeficiency virus .......................................................... 53 1.3.2 Epidemiology, clinical course and treatment of HIV-1 disease ................... 53 1.3.3 HIV-1 virology ............................................................................................ 54 1.3.4 Interactions of HIV-1 with host cells: the viral lifecycle, host restriction and immune evasion .................................................................................................... 56 1.3.5 HIV-1 pathogenesis and antiviral immune responses ................................ 58 1.3.6 Immune dysfunction in HIV-1 infection ....................................................... 59 1.3.7 HIV-1-associated co-infections .................................................................. 64 1.3.8 HIV-1 infection of macrophages ................................................................. 66 1.3.9 Modulation of macrophages by HIV-1 ........................................................ 68
1.4 Tuberculosis ................................................................................................... 71 1.4.1 Epidemiology, clinical course and treatment of TB..................................... 71 1.4.2 Mtb and parasitism of macrophages .......................................................... 73 1.4.3 TB pathogenesis and the immune response .............................................. 74 1.4.4 HIV-1 and TB ............................................................................................. 77 1.4.5 Macrophages, HIV-1 and Mtb .................................................................... 79
1.5 Interleukin-10 .................................................................................................. 81 1.5.1 The IL-10 and IL-10 receptor family ........................................................... 81 1.5.2 Regulation of IL-10 production ................................................................... 82 1.5.3 Functions of IL-10 ...................................................................................... 85 1.5.4 The role of IL-10 in tuberculosis ................................................................. 89
1.6 Investigating immune responses using transcriptional profiling ............... 91 1.6.1 Using transcriptional profiling to understand immune responses in tuberculosis in vivo ................................................................................................ 91 1.6.2 Transcriptional profiling analysis ................................................................ 92
7
1.6.3 Modular analysis of transcriptomic data ..................................................... 93 1.7 Summary and research objectives ............................................................... 96
Chapter 2. Materials & Methods .......................................................................... 98 2.1 Buffers, solutions and media ........................................................................ 98
2.1.1 Buffers and solutions ................................................................................. 98 2.1.2 Cell culture media ...................................................................................... 99
2.2 Isolation and culture of primary human cells ............................................. 100 2.2.1 Isolation of PBMC .................................................................................... 100 2.2.2 Differentiation and culture of monocyte-derived macrophages ................ 100 2.2.3 Isolation and culture of monocytes .......................................................... 101 2.2.4 Differentiation and culture of monocyte-derived DCs ............................... 101
2.3 Cell line culture ............................................................................................ 101 2.3.1 HEK293T cell culture ............................................................................... 101 2.3.2 NP2 cell culture ....................................................................................... 101
2.4 HIV-1 strains and HIV-1 based vectors ....................................................... 102 2.4.1 Production of HIV-1 Ba-L ......................................................................... 102 2.4.2 Production of HIV-1 and lentiviral vectors from molecular clones ............. 102 2.4.3 Production of Vpx virus-like particles (Vpx VLPs) .................................... 103 2.4.4 Virus purification by ultracentrifugation .................................................... 104 2.4.5 Virus titrations .......................................................................................... 106
2.5 Cryptococcus neoformans strains and culture ......................................... 106 2.5.1 C. neoformans strains ............................................................................. 106 2.5.2 C. neoformans culture ............................................................................. 106
2.6 Cell culture infections and stimulations ..................................................... 107 2.6.1 Infection with HIV-1 and viral vectors ....................................................... 107 2.6.2 C. neoformans infection ........................................................................... 108 2.6.3 Innate immune stimuli and cytokines ....................................................... 108 2.6.4 Blockade of cytokine signalling ................................................................ 109 2.6.5 Chemical inhibitors and drugs.................................................................. 109
2.7 PBMC migration assays............................................................................... 110 2.8 Quantification of HIV-1 p24 .......................................................................... 111
2.8.1 Intracellular HIV-1 p24 staining ................................................................ 111 2.8.2 HIV-1 p24 ELISA ..................................................................................... 111
2.9 RNA isolation from cultured cells ............................................................... 112 2.10 Quantitative real-time PCR measurements of gene expression ............... 112 2.11 Cytokine ELISAs .......................................................................................... 113 2.12 SDS-PAGE and Western blotting ................................................................ 114 2.13 Microscopy ................................................................................................... 116
2.13.1 C. neoformans uptake assay ................................................................... 116 2.13.2 NFκB translocation assay ........................................................................ 116
2.14 Tuberculin skin tests ................................................................................... 117 2.14.1 TST injection and sample collection ........................................................ 117 2.14.2 Histological assessment of TST biopsy samples ..................................... 117 2.14.3 RNA isolation from TST biopsy samples .................................................. 118
2.15 RNA isolation from peripheral blood samples ........................................... 118 2.16 QuantiFERON-TB Gold assays .................................................................... 118 2.17 Transcriptional profiling by cDNA microarray ........................................... 118
2.17.1 Microarray methodology .......................................................................... 118 2.17.2 Microarray data analysis .......................................................................... 119
2.18 Statistical analysis of experimental data .................................................... 120 Chapter 3. Results 1. Attenuation of IL-10 responses by HIV-1 in human monocyte-derived macrophages ............................................................................. 121
3.1 Background .................................................................................................. 121

8
3.2 Results .......................................................................................................... 123 3.2.1 IL-10 attenuation by HIV-1 is not Mtb-specific .......................................... 123 3.2.2 A single-round model of HIV-1 infection can attenuate IL-10 ................... 125 3.2.3 The time-course of the zymosan-induced IL-10 response and HIV-1 attenuation .......................................................................................................... 127 3.2.4 IL-10 attenuation is not affected by protease inhibitors ............................ 130 3.2.5 HIV-1 entry is not sufficient for IL-10 attenuation ..................................... 132 3.2.6 Integration by HIV-1 is necessary but not sufficient for IL-10 attenuation . 135 3.2.7 HIV-1 Gag-Pol is not necessary for IL-10 attenuation .............................. 138 3.2.8 The HIV-1 accessory proteins Nef, Vif and Vpr are not individually necessary for IL-10 attenuation ........................................................................... 141 3.2.9 Type I IFN does not induce IL-10 in human MDMs .................................. 145 3.2.10 IL-10 attenuation by HIV-1 is context-specific .......................................... 148 3.2.11 HIV-1 does not accelerate IL-10 mRNA decay ........................................ 152 3.2.12 HIV-1 does not attenuate zymosan-induced NFκB translocation ............. 155 3.2.13 Inhibition of IL-10 induction pathways identifies the PI3K pathway as a specific regulator of anti-inflammatory cytokines ................................................. 157 3.2.14 Levels of Akt and its phosphorylation are not altered by HIV-1 ................ 161
3.3 Chapter discussion ...................................................................................... 164 Chapter 4. Results 2. The consequences of IL-10 attenuation for HIV-1 replication and the immune response ..................................................................... 174
4.1 Background .................................................................................................. 174 4.2 Results .......................................................................................................... 176
4.2.1 IL-10 inhibition may confer a replicative advantage on HIV-1 in inflammation ....................................................................................................... 176 4.2.2 Macrophage responses to Cryptococcus neoformans ............................. 179 4.2.3 The transcriptional response to IL-10 in human MDMs ............................ 186 4.2.4 IL-10 pre-treatment does not inhibit the transcriptional response to IFNγ in human MDMs ..................................................................................................... 188 4.2.5 IL-10 deficiency in inflammation dysregulates macrophage gene expression .......................................................................................................... 190 4.2.6 IL-10 deficiency in inflammation modulates cell recruitment .................... 199
4.3 Chapter discussion ...................................................................................... 202 Chapter 5. Results 3. Derivation of transcriptional modules reflecting macrophage heterogeneity ...................................................................................... 209
5.1 Background .................................................................................................. 209 5.2 Results .......................................................................................................... 212
5.2.1 MDM transcriptional responses to cytokines associated with differentially polarised T cell responses .................................................................................. 212 5.2.2 Functional investigation of MDM transcriptional responses to cytokines associated with differentially polarised T cell responses ...................................... 214 5.2.3 Exploring the stimulus specificity of MDM transcriptional responses ........ 219 5.2.4 Identifying appropriate measurements of module expression and enrichment .......................................................................................................... 221 5.2.5 Developing modules from T cell subset-derived-cytokine-stimulated MDMs224 5.2.6 Development of differential IFN pathway modules ................................... 231 5.2.7 Development of IL-10 modules ................................................................ 235 5.2.8 Development of innate immune stimulus-driven modules ........................ 242 5.2.9 Assessing modular enrichment in in vivo gene expression datasets ........ 245
5.3 Chapter discussion ...................................................................................... 249 5.3.1 Insights into macrophage plasticity from transcriptional profiling .............. 249 5.3.2 Development of gene expression modules for analysis of microarray data250

9
5.3.3 Measuring enrichment of gene expression modules in gene expression profiles from in vivo samples ............................................................................... 253
Chapter 6. Results 4. Modulation of anti-mycobacterial cell-mediated immunity by HIV-1 in vivo assessed in a human challenge model ....................... 255
6.1 Background .................................................................................................. 255 6.1.1 Cell-mediated immunity, HIV-1 and tuberculosis ..................................... 255 6.1.2 Using the tuberculin skin test as an in vivo challenge model to study CMI in HIV infection ....................................................................................................... 256
6.2 Study outline ................................................................................................ 258 6.3 Cohort description ....................................................................................... 261 6.4 Histological assessments ............................................................................ 267 6.5 Gene expression profiling of TSTs ............................................................. 270
6.5.1 Saline injection gene expression profiles ................................................. 270 6.5.2 The TST in HIV-1− patients with active TB induces innate & adaptive-associated gene expression with evidence for cell recruitment and immunoregulatory processes .............................................................................. 273 6.5.3 The molecular detail of the TST response is not systematically altered by active TB disease ................................................................................................ 277 6.5.4 Relative preservation of type I IFN responses in anergic TSTs from HIV-1+
active TB patients ............................................................................................... 281 6.5.5 HIV-1+ TST anergy is molecularly distinct from healthy individual TST negativity ............................................................................................................. 286 6.5.6 TST gene expression is broadly conserved in HIV-1+ TST+ individuals but the immunoregulatory IL-10 response is specifically attenuated .......................... 289 6.5.7 HIV-1+ unmasking IRIS patients display accentuated Th2 responses in the TST 294 6.5.8 Evidence for HIV-1 viral activity at the site of TST inflammation .............. 299 6.5.9 Molecular profiles of HIV-1 CMI dysregulation which are evident in the TST are not evident in the peripheral blood ................................................................ 301
6.6 Chapter discussion ...................................................................................... 303 Chapter 7. Discussion ........................................................................................ 310
7.1.1 Modulation of CMI by HIV-1 ..................................................................... 310 7.1.2 Dysregulation of IL-10 responses by HIV-1 ............................................. 310 7.1.3 Other axes of CMI dysregulation by HIV-1 ............................................... 313 7.1.4 The impact of HIV-1 on TB disease ......................................................... 314 7.1.5 Potential for restoring functional CMI in HIV-1 infection ........................... 318 7.1.6 Insights into the normal function of the cell-mediated immune system ..... 318 7.1.7 Summary of findings and further work ..................................................... 319
Chapter 8. Appendix I: Modules ........................................................................ 321 Chapter 9. Appendix II: TST study case list ..................................................... 340 Reference List ........................................................................................................... 345

10
Table of figures
Figure 1.1: The cell-mediated immune response........................................................................ 26
Figure 1.2: Ontogeny of mononuclear phagocytes. .................................................................... 32
Figure 1.3: Regulation of IL-10 expression in macrophages. ..................................................... 83
Figure 3.1: IL-10 attenuation by HIV-1 is not Mtb-specific. ....................................................... 123
Figure 3.2: Single round infection by HIV-1 attenuates IL-10. .................................................. 125
Figure 3.3: The time-course of zymosan-induced cytokine mRNA expression. ....................... 127
Figure 3.4: The time-course of zymosan-induced cytokine secretion....................................... 128
Figure 3.5: Inhibition of HIV-1 protease does not alter IL-10 attenuation by HIV-1. ................. 130
Figure 3.6: UV-inactivated HIV-1 does not attenuate IL-10. ..................................................... 132
Figure 3.7: The timing of IL-10 attenuation post-infection indicates that early post-entry events
are not sufficient. ....................................................................................................................... 133
Figure 3.8: An integrase mutant of HIV-1 does not attenuate IL-10. ........................................ 135
Figure 3.9: A HIV-1-based lentiviral vector does not attenuate IL-10. ...................................... 136
Figure 3.10: Infection using GagLucGFP, a HIV-1 mutant which does not express Gag-Pol. . 138
Figure 3.11: The HIV-1 mutant GagLucGFP attenuates IL-10. ................................................ 139
Figure 3.12: Infection with HIV-1 clones with mutations in the accessory genes Nef, Vif and Vpr.
.................................................................................................................................................. 141
Figure 3.13: Confirmation of HIV-1 accessory protein deletions by Western blotting. ............. 142
Figure 3.14: HIV-1 clones with mutations in the accessory genes Nef, Vif and Vpr attenuate IL-
10. ............................................................................................................................................. 143
Figure 3.15: Type I IFNs do not induce IL-10 production in human MDMs. ............................. 145
Figure 3.16: Type I IFNs do not contribute to zymosan-induced IL-10 responses. .................. 146
Figure 3.17: IL-10 transcription and HIV-1 attenuation in mononuclear phagocytes. .............. 149
Figure 3.18: IL-10 secretion, HIV-1 attenuation and IFN responses in mononuclear phagocytes.
.................................................................................................................................................. 150
Figure 3.19: HIV-1 does not accelerate cytokine mRNA decay................................................ 153
Figure 3.20: HIV-1 does not alter zymosan-induced NFκB translocation. ................................ 155

11
Figure 3.21: Inhibition of innate immune signalling pathways inhibits IL-10 and IL-6 responses.
.................................................................................................................................................. 158
Figure 3.22: Inhibition of the PI3K pathway specifically inhibits IL-10 but not pro-inflammatory
cytokine responses. .................................................................................................................. 159
Figure 3.23: Akt phosphorylation in response to zymosan is not altered by HIV-1. ................. 161
Figure 3.24: Densitometry of Akt phosphorylation in response to zymosan. ............................ 162
Figure 4.1: IL-10 suppresses zymosan-induced HIV-1 replication. .......................................... 176
Figure 4.2: IL-10 does not modulate HIV-1 replication in resting MDMs, or alter MDM
permissivity to HIV-1. ................................................................................................................ 177
Figure 4.3: Uptake of C. neoformans to human MDMs. ........................................................... 181
Figure 4.4: Expression of cytokine mRNA by MDMs in response to C. neoformans in HIV-1 co-
infection. .................................................................................................................................... 182
Figure 4.5: MDM secretion of IL-10 in response to C. neoformans in HIV-1 co-infection. ....... 183
Figure 4.6: Non-immunogenicity of C. neoformans. ................................................................. 184
Figure 4.7: The MDM transcriptional response to IL-10. .......................................................... 186
Figure 4.8: IL-10 pre-treatment does not inhibit the MDM transcriptional response to IFNγ. ... 188
Figure 4.9: Neutralisation of IL-10 alters the zymosan-induced inflammatory response in MDMs.
.................................................................................................................................................. 193
Figure 4.10: Identification of zymosan-induced gene expression changes which are
dysregulated by IL-10 neutralisation. ........................................................................................ 194
Figure 4.11: Genes which are negatively regulated by IL-10 in zymosan stimulation of MDMs.
.................................................................................................................................................. 195
Figure 4.12: Genes which are positively regulated by IL-10 in zymosan stimulation of MDMs.196
Figure 4.13: Genes which are not regulated by IL-10 in zymosan-stimulated MDMs. ............. 197
Figure 4.14: TFBS enrichment analyses of IL-10 regulated genes in zymosan-stimulated MDMs
.................................................................................................................................................. 198
Figure 4.15: IL-10 neutralisation modulates recruitment of PBMC. .......................................... 201
Figure 5.1: Transcriptional responses of MDMs to cytokines produced by differentially polarised
T cell responses. ....................................................................................................................... 214
Figure 5.2: MDM transcriptional response to IFNγ. .................................................................. 216
Figure 5.3: MDM transcriptional response to TNFα. ................................................................. 217

12
Figure 5.4: MDM transcriptional response to IL-4 and IL-13. ................................................... 218
Figure 5.5: MDM transcriptional response to TGFβ and IL-10. ................................................ 219
Figure 5.6: Exploring the stimulus-specificity of MDM transcriptional responses to cytokines
using principal component analysis. ......................................................................................... 221
Figure 5.7: Methods of quantifying module expression and module enrichment. .................... 225
Figure 5.8: Assessing specificity of T cell-subset-derived-cytokine modules – twofold change
modules. .................................................................................................................................... 229
Figure 5.9: Assessing specificity of T cell-subset-derived-cytokine modules – fourfold change
modules. .................................................................................................................................... 231
Figure 5.10: Assessing specificity of T cell-subset-derived-cytokine modules – unique fourfold
change modules. ....................................................................................................................... 233
Figure 5.11: Venn diagrams of cross-over between IFN-induced gene lists. ........................... 235
Figure 5.12: Assessing specificity of IFN pathway modules – specific fourfold change modules.
.................................................................................................................................................. 236
Figure 5.13: Venn diagram of cross-over between IL-10 module gene lists. ........................... 240
Figure 5.14: Assessing specificity of IL-10 modules – twofold change modules. ..................... 241
Figure 5.15: Bioinformatic verification of IL-10 modules by TFBS enrichment analysis. .......... 242
Figure 5.16: Further investigations of specificity and comparability of IL-10 modules. ............ 243
Figure 5.17: Assessing enrichment of IL-10 modules in innate immune-stimulated MDMs. .... 244
Figure 5.18: Venn diagrams of cross-over between innate immune stimulus-induced gene lists.
.................................................................................................................................................. 246
Figure 5.19: Assessing specificity of innate immune stimulus-driven modules – specific fourfold
change modules. ....................................................................................................................... 247
Figure 5.20: Testing module enrichment in in vivo gene expression datasets. ........................ 250
Figure 5.21: Using gene set enrichment analysis to quantitate modular expression and
enrichment in in vivo gene expression samples. ...................................................................... 251
Figure 6.1: TST human challenge model study design. ........................................................... 263
Figure 6.2: TST responses and IGRAs. .................................................................................... 268
Figure 6.3: Histological assessment of TST and saline biopsies.............................................. 271
Figure 6.4: Representative H&E stains of TST and saline biopsies. ........................................ 272
Figure 6.5: Comparing HIV-1− and HIV-1+ saline control samples. .......................................... 274

13
Figure 6.6: Principal component analysis of TST and saline biopsy gene expression profiles. 275
Figure 6.7: TST gene expression profiling in HIV-1− patients with active TB. .......................... 278
Figure 6.8: Modular analysis of the TST in HIV-1− patients with active TB. ............................. 279
Figure 6.9: Comparing active TB and healthy individual TST+ gene expression profiles. ........ 282
Figure 6.10: Modular analysis of TST+ gene expression profiles from HIV− active TB patients
and healthy individuals. ............................................................................................................. 283
Figure 6.11: Gene expression profiling of anergic TSTs from HIV-1+ active TB patients. ........ 286
Figure 6.12: Bioinformatic analyses of the HIV-1+ anergic TST response shows enrichment for
IFN signalling pathways. ........................................................................................................... 287
Figure 6.13: Modular analysis of the HIV-1+ anergic TST response demonstrates relative
preservation of the type I IFN response. ................................................................................... 288
Figure 6.14: Comparison of HIV-1+ anergic TST samples from active TB patients with HIV-1−
TST− samples from healthy individuals. .................................................................................... 290
Figure 6.15: Modular analysis of gene expression profiles from HIV-1+ active TB patient anergic
TSTs and healthy individual negative TSTs. ............................................................................. 291
Figure 6.16: Gene expression profiling of positive TSTs from HIV-1+ active TB patients. ....... 294
Figure 6.17: Modular analysis of gene expression profiles from HIV-1+ active TB patient positive
TSTs. ......................................................................................................................................... 295
Figure 6.18: Attenuation of the IL-10 response in positive TSTs from HIV-1+ active TB patients.
.................................................................................................................................................. 296
Figure 6.19: Gene expression profiling of positive TSTs from unmasking TB-IRIS patients. ... 299
Figure 6.20: Modular analysis of gene expression profiles from unmasking TB-IRIS patients
identifies increased Th2 responses. ......................................................................................... 300
Figure 6.21: Eosinophilic infiltration in TST biopsies from IRIS patients. ................................. 301
Figure 6.22: Investigating the presence of HIV-1 at the TST site. ............................................ 303
Figure 6.23: Modular analysis of peripheral blood transcriptional profiles from HIV-1− and HIV-1+
active TB patients and healthy volunteers. ............................................................................... 305
Figure 7.1: HIV-1 modulation of the CMI response to Mtb may contribute to granuloma instability.
.................................................................................................................................................. 320

14
List of tables
Table 1.1: Deficiencies in components of CMI and risk of intracellular infections in mouse
models and human disease. ....................................................................................................... 24
Table 1.2: Hetereogeneity and functions of tissue macrophages. .............................................. 34
Table 1.3: Pattern recognition of Mtb. ......................................................................................... 36
Table 1.4: Cytokines secreted by macrophages. ........................................................................ 39
Table 1.5: Induction of polarised CD4+ T cell responses by macrophage-derived cytokines. .... 43
Table 1.6: Modulation of macrophages by different CD4+ T cell subset-derived cytokines. ...... 44
Table 1.7: Immune phenotypes associated with TB-IRIS. .......................................................... 56
Table 1.8: Immune dysfunctions in HIV-1 infection .................................................................... 57
Table 1.9: HIV-1 associated co-infections. ................................................................................. 59
Table 1.10: Reported effects of HIV-1 on macrophage innate immune responses. ................... 64
Table 1.11: Effects of IL-10 on infection and inflammation in mouse models. ........................... 82
Table 2.1: Buffers and solutions. ................................................................................................ 93
Table 2.2: Cell culture media. ..................................................................................................... 94
Table 2.3: HIV-1 molecular clones and lentiviral vectors. ......................................................... 100
Table 2.4: Cryptococcus neoformans strains. ........................................................................... 101
Table 2.5: Innate immune stimuli and cytokines. ...................................................................... 103
Table 2.6: Chemical inhibitors and drugs. ................................................................................. 104
Table 2.7: Applied Biosystems Taqman qRT-PCR assays. ..................................................... 107
Table 2.8: GAPDH primer and probe sequences. .................................................................... 107
Table 2.9: ELISA antibodies, standards and dilutions. ............................................................. 108
Table 2.10: Western immunoblotting antibodies. ...................................................................... 109
Table 3.1: Innate immune stimuli used to induce IL-10 expression in MDMs. ......................... 117
Table 3.2: Cytokine mRNA half-lives calculated from one phase decay curves. ..................... 147
Table 5.1: Development of T cell-subset-derived-cytokine modules – twofold change modules.
.................................................................................................................................................. 223
Table 5.2: Development of T cell-subset-derived-cytokine driven modules – fourfold change
modules. .................................................................................................................................... 225

15
Table 5.3: Development of T cell-subset-derived-cytokine driven modules – specific fourfold
change modules. ....................................................................................................................... 227
Table 5.4: Development of IFN pathway modules – specific fourfold change modules. ......... 230
Table 5.5: Bioinformatic verification of IFN pathway modules. ................................................. 232
Table 5.6: Development of IL-10 modules – twofold change modules. ................................... 235
Table 5.7: Development of innate immune stimulus-driven modules – specific fourfold change
modules. .................................................................................................................................... 241
Table 6.1: Inclusion and exclusion criteria. ............................................................................... 257
Table 6.2: Demographic and clinical characteristics of the study cohort. ................................. 262
Table 6.3: Study group definitions for subsequent analyses. ................................................... 264
16
Abbreviations
ABS AB serum
AIDS Acquired immunodeficiency syndrome
AIR Anti-inflammatory response
AM Alveolar macrophage
APC Antigen-presenting cell
ART Anti-retroviral therapy
ARV Anti-retroviral
BCG Bacilli Calmette-Guerin
BSA Bovine serum albumin
BMDM Bone marrow-derived macrophage
CAEV Caprine arthritis encephalitis virus
cDC Classical dendritic cell
cDP Common dendritic cell precursor
cMoP Common monocyte precursor
CLR C-lectin type receptors
CMI Cell-mediated immunity
CMV Cytomegalovirus
CNS Central nervous system
cGAS Cyclic GMP-AMP synthase
Ct Cycle threshold
DC Dendritic cell
dH2O Deionised H2O
DAMP Danger-associated molecular pattern
DAPI 4',6-diamidino-2-phenylindole

17
DC Dendritic cell
DMEM Dulbecco’s modified eagle medium
DMSO Dimethyl sulfoxide
DPBS Dulbecco’s phosphate buffered saline
DTH Delayed-type hypersensitivity
ECM Extra-cellular matrix
EDTA Ethylenediaminetetraacetic acid
ELISA Enzyme-linked immunosorbant assay
ERK Extracellular signal-regulated kinase
FACS Fluorescence-activated cell sorting
FCS Foetal calf serum
FDR False detection rate
GALT Gut-associated lymphoid tissue
GAPDH Glyceraldehyde 3-phosphate dehydrogenase
GFP Green fluorescent protein
GMP Granulocyte-macrophage precursor
GM-CSF Granulocyte-macrophage colony-stimulating factor
GO Gene ontology
GSEA Gene set enrichment analysis
GXM Glucuronoxylomannan
H&E Hematoxylin and eosin
HAART Highly active anti-retroviral therapy
HIV Human immunodeficiency virus
HRP Horseradish peroxidase
HSC Haematopoietic stem cell
HSV Herpes simplex virus
IFN Interferon

18
IGRA Interferon gamma release assay
IκB Inhibitor of κB
IL Interleukin
IN Integrase
iNOS Inducible nitric oxide synthase
IRF Interferon response factor
IRIS Immune reconstitution inflammatory syndrome
KSHV Kaposi’s sarcoma herpes virus
LB Lysogeny broth
LPS Lipopolysaccharide
LTR Long terminal repeat
MAC Mycobacterium avium complex
MACS Magnetic-activated cell sorting
MAPK/MAP kinase Mitogen activated protein kinase
M-CSF Macrophage colony-stimulating factor
MDM Monocyte-derived macrophage
MDDC Monocyte-derived dendritic cell
MDP Macrophage and dendritic cell precursor
MDR Multi-drug resistant
MHC Major histocompatibility class
MMP Matrix metalloproteinase
MOI Multiplicity of infection
MP Mononuclear phagocyte
MPS Mononuclear phagocyte system
MSMD Mendelian susceptibility to mycobacterial diseases
Mtb Mycobacterium tuberculosis
Mtbfiltrate Mycobacterium tuberculosis culture filtrate

19
mTOR Mammalian target of rapamycin
NBF Neutral buffered formalin
Nef Negative regulatory factor
NES Normalised enrichment score
NFκB Nuclear factor κ-light-chain-enhancer of activated B cells
NK cell Natural killer cell
NLR NOD-like receptor
NOD Nucleotide oligomerization domain
PAMP Pathogen-associated molecular pattern
Pam2CSK4 / PCSK Tripalmitoyl-S-glyceryl-L-Cys-Ser-Lys-Lys-Lys-Lys
PBL Peripheral blood lymphocyte
PBMC Peripheral blood mononuclear cell
PBS Phosphate buffered saline
PC Principal component
PCA Principal component analysis
PCP Pneumocystis pneumonia
pDC Plasmacytoid dendritic cell
PDGF Platelet-derived growth factor
PHA Phytohaemagglutinin
PI3K Phosphoinositide 3-kinase
PIC Pre-integration complex
PPD Purified protein derivative
PRR Pattern recognition receptor
QFT QuantiFERON-TB Gold
qRT-PCR Quantitative real-time PCR
Rev Regulator of Expression of Virion proteins
RLR RIG-1-like receptors

20
Rin RNA integrity
RNS Reactive nitrogen species
ROS Reactive oxygen species
rpm Revolutions per minute
RPMI Roswell Park Memorial Institute
RT Reverse transcriptase
SDS Sodium dodecyl sulfate
SDS-PAGE Sodium dodecyl sulphate polyacrylamide gel electrophoresis
SEM Standard error of the mean
SIV Simian immunodeficiency virus
STAT Signal transducer and activator of transcription
Tat Transactivator of transcription
TB Tuberculosis
TBE Tris/borate/EDTA
TBS Tris buffered saline
TF Transcription factor
TFBS Transcription factor binding site
TGF Transforming growth factor
Th T helper
TMB 3,3',5,5'-Tetramethylbenzidine
TNF Tumour necrosis factor
TLR Toll-like receptor
Treg T regulatory
TST Tuberculin skin test
UV Ultra-violet
VLP Virus-like particle

21
Vif Viral infectivity factor
VL Viral load
VMV Visna-maedi virus
Vpr Viral protein R
Vpu Viral protein unique
Vpx Viral protein X
WT Wild-type
YPD Yeast-peptone-dextrose
2FC Two-fold change
4FC Four-fold change

22
Publication
Part of the work presented in this thesis has been presented in the following
publication:
Tomlinson, G.S.*, Bell, L.C.K.*, Walker, N.F., Tsang, J., Brown, J.S., Breen, R.,
Lipman, M., Katz, D.R., Miller, R.F., Chain, B.M., Elkington, P.T.G., Noursadeghi, M.,
2014. HIV-1 Infection of Macrophages Dysregulates Innate Immune Responses to
Mycobacterium tuberculosis by Inhibition of Interleukin-10. J. Infect. Dis. 209, 1055–
1065. doi:10.1093/infdis/jit621
* indicates shared first authorship.

Chapter 1 Introduction
23
Chapter 1. Introduction
1.1 The cell-mediated immune system
1.1.1 Overview: the delayed-type hypersensitivity and cell-mediated immunity
paradigm
The delayed-type hypersensitivity (DTH) reaction was first described in 1798 by
Edward Jenner in his seminal studies of vaccination against smallpox, when he
reported that individuals previously infected with cowpox had an accelerated reaction
to injection with variolous matter derived from smallpox lesions (Allison, 1967). These
reactions were evident as redness and induration at the injection site over 24–48
hours, and subsequently were found to occur in response to a range of pathogens or
their products (Wing and Remington, 1977; Zinsser, 1921). Histological
characterisation of the DTH reaction site showed capillary dilatation, endothelial
swelling, and a perivascular infiltrate composed chiefly of lymphocytes and histiocytes,
suggesting a cellular basis to this response (Allison, 1967).
By the 1960s, key criteria for defining a DTH reaction had been described
(Humphrey, 1967). A gradual inflammatory response to a locally introduced antigen
was typical, which did not resemble allergic hypersensitivity in terms of its gross or
histopathological appearance. It was a distinct phenomenon from antibody-mediated
immunity, as transfer of lymphoid cells, but not serum, from sensitized to unsensitised
animals could render them hypersensitive (Chase, 1946). Importantly, the reaction was
mediated locally by lymphocytes and activated macrophages, and was associated with
resistance to pathogens that induced it (Wing and Remington, 1977). These
observations led to its re-definition as cell-mediated immunity (CMI), to reflect more
appropriately the functional importance of the phenomenon (Humphrey, 1967).
However, in the pre-pattern recognition and pre-lymphocyte subset era, many
questions remained regarding what was described as a “complex, ill-defined and
sometimes rather tiresome aspect of immunology” (Humphrey, 1967). Which
“inherently hypersensitive” cells initiated the DTH reaction – the lymphocytes or the
macrophages, or both (Dumonde, 1967)? Did lymphocytes make any antibody in the
reaction (Gell, 1967), and did they secrete factors to activate the macrophages
(Humphrey, 1967)? And what precisely were its relative contributions to pathology and
protection (Humphrey, 1967)?

Chapter 1 Introduction
24
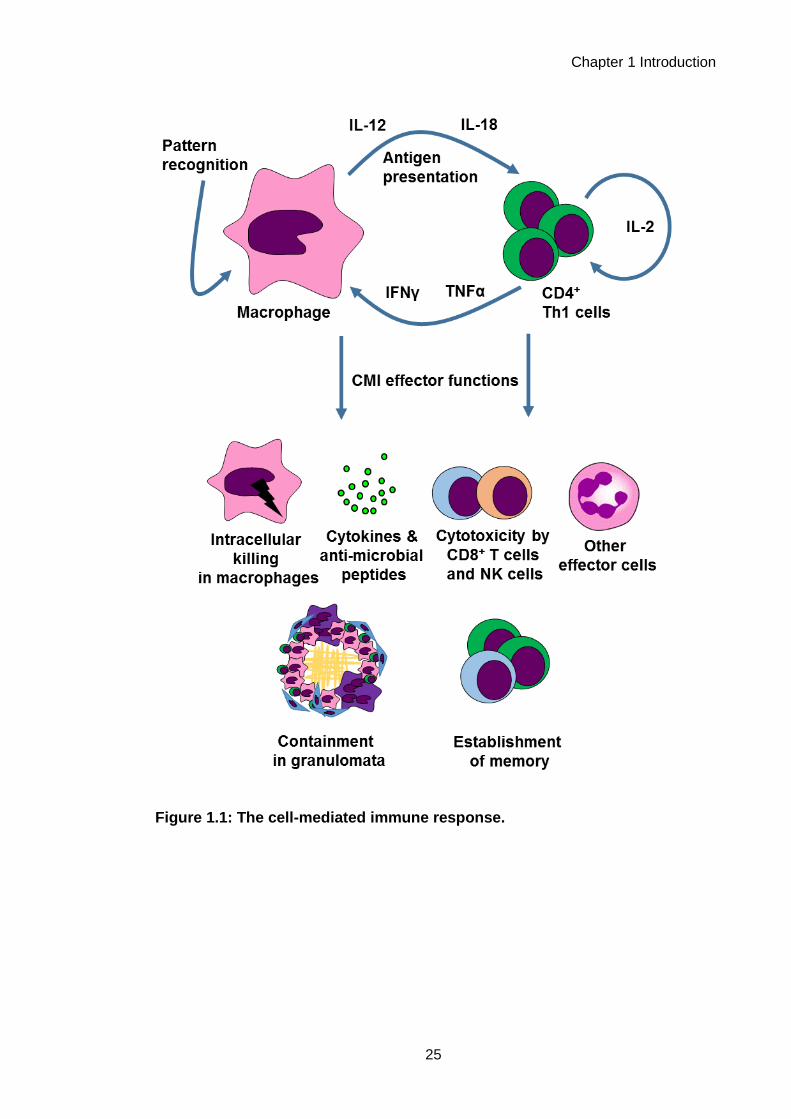
As a result of investigations in the intervening decades, CMI is now well-
characterised at the cellular and molecular levels (Figure 1.1). A canonical primary
CMI response is known to be initiated by phagocytes such as macrophages, which
detect pathogens via pattern recognition receptors (Lemaitre et al., 1996; Medzhitov
and Horng, 2009; Medzhitov et al., 1997) and become activated. These macrophages
go on to present antigen and secrete cytokines such as interleukin (IL)-12 and IL-18
(Gracie et al., 2003; Hsieh et al., 1993), in order to activate CD4+ T cells, the main
lymphocyte effectors of CMI (Cher and Mosmann, 1987). Macrophage-derived IL-12
drives a polarised T-helper 1 (Th1) phenotype in CD4+ T cells (Hsieh et al., 1993;
Mosmann et al., 1986), inducing them to secrete interferon (IFN)γ and other cytokines,
which then signal to macrophages in return, promoting their effector functions (Celada
et al., 1984; Nathan et al., 1983; Pace et al., 1983). Macrophages and CD4+ T cells
may also co-ordinate with other effector cells of CMI, such as CD8+ T cells and natural
killer (NK) cells, which perform various cytotoxic functions and secrete further IFNγ
(Kaufmann, 1995; Moretta et al., 2002). Activation of specific CD4+ T cells via
presentation of their cognate antigen leads to establishment of immunological memory
for that antigen, the basis of the accelerated CMI response observed upon re-
challenge in CMI (Bell et al., 1998). Together, these effector functions are thought to be
critical in effective responses to many pathogens, as well as playing roles in the
immune response to tumours, in transplant rejection and in chronic inflammatory
conditions.
Thus, the clinical phenomenon of the DTH redness reaction first described by
Jenner over 200 years ago is now known to result from a complex interplay of cells and
secreted factors, which act together to cause inflammation and to co-ordinate a key
arm of effective immunity.
Chapter 1 Introduction
25
Figure 1.1: The cell-mediated immune response.

Chapter 1 Introduction
26
1.1.2 CMI and infectious diseases
CMI is central to the immune response to intracellular pathogens (Kaufmann,
1995). Classic experiments showed that transfer of lymphocytes from immunised to
unimmunised animals could essentially vaccinate the latter (Lefford et al., 1973),
demonstrating that cellular immunity was sufficient for protection against infection in
some contexts. During early DTH research, it was noted that pathogens which were
facultative intracellular parasites of macrophages, such as Mycobacterium tuberculosis
(Mtb), Brucella abortus, Listeria monocytogenes and Salmonella typhimurium, were
potent inducers of DTH responses (Mackaness, 1967). These pathogens induced a
highly activated anti-bacterial phenotype in macrophages, termed “acquired cellular
resistance”, which conferred time-limited non-specific protection against other
intracellular infections (Mackaness, 1964).
Subsequent characterisation of CMI (Figure 1.1) has elucidated the effector
functions which confer this potent restrictive ability. For bacterial or fungal pathogens,
key responses may be direct macrophage-mediated killing, and anti-microbial peptide
secretion (Flannagan et al., 2009; Izadpanah and Gallo, 2005). For viruses, cytotoxic
activity and induction of anti-viral type I IFN responses are thought to be critical
(Stetson and Medzhitov, 2006). In chronic infections, pathogens may be contained in a
granuloma, which is essentially a mature focus of CMI made up of activated
macrophages, CD4+ T cells and other effector cells (Ulrichs and Kaufmann, 2006).
Deficiencies in components of the CMI response can lead to uncontrolled
infections by intracellular pathogens in mouse models and in humans, and so CMI is
suggested to be essential for protection against these pathogens (Table 1.1). In
humans, CMI is observed to be particularly important in protection against
mycobacteria, as a range of genetic deficiencies in CMI components such as IL-12 and
IFNγ signalling cause Mendelian susceptibility to mycobacterial diseases (MSMD), in
which patients present with severe infections caused by both weakly virulent
mycobacteria and virulent mycobacteria such as Mtb (Al-Muhsen and Casanova,
2008).
The importance of CMI in the immune response to Mtb is also highlighted by
the increased risk of tuberculosis (TB) in HIV-1+ patients, who for a number of reasons
may have compromised CMI responses. Both Mtb and HIV-1 are pathogens which
directly parasitize macrophages, a central cellular effector of CMI. The interaction
between macrophages, HIV-1, Mtb and the other immune mediators of CMI therefore

Chapter 1 Introduction
27
represents a complex set of host/pathogen interactions, which is likely to play a
significant role in the diseases caused by these two critical global pathogens.
In the introduction to this thesis, I will explore this set of host-pathogen
interactions, by introducing the role of macrophages in CMI, exploring HIV-1 and TB
pathogenesis, and then examining the potential role of macrophages in CMI
dysregulation in HIV-1/TB co-infection. I will also describe the function of the
immunoregulatory cytokine IL-10, which has been shown to be dysregulated in the
responses of HIV-1-infected macrophages to TB (Tomlinson et al., 2014). I will lastly
discuss the use of transcriptional profiling for exploring immune responses to
tuberculosis in vivo, and novel methods which could be utilized in this context to further
understand the function of CMI in the host response to Mtb.

Chapter 1 Introduction
28
CMI component Mouse Reference Human Reference
IFNγ IFNγ or IFNγ receptor
−/−: increased
suscepibility to Mtb, BCG
and Salmonella
typhimurium
Dalton et al. (1993);
Hess et al. (1996);
Flynn et al. (1993);
Cooper et al. (1993)
Autoantibodies to IFNγ
associated with increased risk
of mycobacterial disease
Browne et al. (2012)
IFNγ receptor genetic
deficiency in children with
disseminated mycobacterial
infections
Jouanguy et al. ( 1995);
Newport et al. ( 1995);
Dorman & Holland
(1998)
TNFα TNFR p55−/−: increased
suscepibility to Listeria
monocytogenes
Pfeffer et al. (1993) Patients treated with
monoclonal antibodies to
TNFα for auto-inflammatory
conditions have increased risk
of tuberculosis
Keane et al. (2001)
IL-12 IL-12 −/−: increased
susceptibility to BCG
Wakeham et al.
(1998)
IL-12 receptor genetic
deficiency in patients with
mycobacterial infections
Altare et al. (1998)
IL-12 p40 deficiency in a child
with disseminated BCG and
Salmonella infection
Altare et al. (1998)
STAT1 (IFNγ
signalling)
STAT1 −/−: increased
susceptibility to L.
monocytogenes and
vesicular stomatitis virus
Meraz et al. (1996) Heterozygous STAT1
mutation associated with
mycobacterial disease
Dupuis et al. (2001)
CD4+ T cells Mice depleted of CD4+ T
cells succumb more
rapidly to Mtb infection
Leveton et al. (1989) CD4+ T cell depletion in HIV-
1 infection associated with
increased risk of
mycobacterial disease,
cryptococcosis, herpesvirus
infections
Moore et al. (1996)
T-bet (Th1
signature
transcription
factor)
T-bet −/−: increased
susceptibility to Mtb and
S. typhimurium
Sullivan et al. (2005);
Ravindran et al.
(2005)
Table 1.1: Deficiencies in components of CMI and risk of intracellular infections in
mouse models and human disease.

Chapter 1 Introduction
29
1.2 The role of macrophages in CMI
1.2.1 The mononuclear phagocyte system
CMI responses are mediated via the co-ordinated function of CD4+ T cells and
macrophages (Figure 1.1). Macrophages are a member of the mononuclear phagocyte
system (MPS), which also includes monocytes and dendritic cells. To explore the
functions of macrophages in mediating CMI, it is critical to understand their
relationships with the other MPS cell types, as a group of phagocytic sentinel cells with
diverse roles in homeostasis, inflammation and immunity (Chow et al., 2011a)
The first description of phagocytic cells was made by Elie Metchnikoff in 1892,
and his work subsequently provided many insights into their functions: that
phagocytosis is an active defence mechanism; that phagocytes could provide “natural
immunity” via their responses to pathogens; that phagocytes could actively move
towards inflammatory foci; and that phagocyte activation could enhance their
microbicidal capabilities (Gordon, 2008). Subsequent work demonstrated shared
characteristics of different tissue-resident phagocyte populations, leading to their
common classification as macrophages (Guilliams et al., 2014), and also showed that
peripheral blood monocytes could differentiate into macrophages in vitro and in vivo
(Carrel and Ebeling, 1926; Ebert and Florey, 1939; van Furth and Cohn, 1968).
Monocytes and macrophages were thus classified together as the MPS (van Furth et
al., 1972), along with dendritic cells (DCs) once identified (Steinman and Witmer, 1978;
Steinman et al., 1974).
This original classification of the MPS was based on distinct functional
characteristics of monocytes, macrophages or DCs, wherein monocytes were
circulating precursor cells; macrophages were large vacuolar cells specialised for
phagocytosis and clearance; and DCs were stellate cells optimised for activating T
cells (Guilliams et al., 2014). As such, this MPS classification was also based on the
premise that macrophages and DCs were primarily derived from monocytes, and that
recruitment of blood monocytes replenished tissue populations of these cells in the
steady state (Ginhoux and Jung, 2014), but the ontogeny of mononuclear phagocytes
(MPs) is now no longer considered to be interrelated in this manner.

Chapter 1 Introduction
30
Mononuclear phagocytes (MPs) are now thought to be derived from three
sources (Ginhoux and Jung, 2014). Most tissue macrophages are thought to be self-
renewing via proliferation, and to have embryological origins (Ginhoux et al., 2010;
Guilliams et al., 2013; Hashimoto et al., 2013; Hoeffel et al., 2012; Schulz et al., 2012;
Yona et al., 2013). DCs are derived from a common DC precursor in the bone marrow
(the cDP; Naik et al., 2013; Schraml et al., 2013), and monocytes from a distinct
common monocyte precursor (the cMoP; Hettinger et al., 2013), although both cells
originate from the clonotypic source of all haematopoietic MPs, the macrophage
dendritic cell precursor (MDP; Fogg et al., 2006). Cells derived from monocytes are
found in tissues under some inflammatory conditions, but do not substantially
contribute to tissue populations in homeostasis (Ginhoux and Jung, 2014). A new
ontogeny-based classification for the MPS has been proposed in light of these findings,
based on these three origins (embryologic, the cDP, or the cMoP; Guilliams et al.,
2014). The current consensus on the ontogeny of the MPS is shown in Figure 1.3.
The majority of the evidence for MPS ontogeny is derived from mouse models
(Guilliams et al., 2014), and so its relevance in humans is unconfirmed. Some evidence
exists to support its application. Comparative gene expression analyses have
demonstrated substantial homology between murine and human monocyte and DC
subsets, indicating that there are cross-species phenotypic similarities in the MPS
(Crozat et al., 2010; Ingersoll et al., 2010; Robbins et al., 2008). Some observations
also support the concept of macrophage self-renewal in humans. After haematopoietic
stem cell (HSC) transplant, recipient macrophages persist longer in the skin than
recipient DCs which are rapidly replaced with donor cells (Haniffa et al., 2009);
conversely, in a limb transplant, the donor macrophages persisted in the skin and were
not replaced with recipient-derived cells (Kanitakis et al., 2011). Additionally, genetic
conditions affecting haematopoiesis exist wherein there are deficiencies in monocytes
and DCs but tissue macrophage populations are unaffected, suggesting that
macrophages do not require mature haematopoiesis for maintenance (Bigley et al.,
2011).

Chapter 1 Introduction
31
Figure 1.2: Ontogeny of mononuclear phagocytes.
Schematic of the development and ontogeny of the MPS based on current
understanding. Adapted from diagrams in Guilliams et al. (2014) and Ginhoux and
Jung (2014). Tissue macrophage ontogeny is purely embryological, while monocytes
and DCs are derived from distinct mature haematopoietic precursor cells. Monocytes
can differentiate into cells which infiltrate tissues and display macrophage- or DC-like
properties. Macrophages and some monocyte-derived cells are capable of self-
renewal. HSC, haematopoietic stem cell; GMP, granulocyte-macrophage precursor;
MDP, macrophage and dendritic cell precursor; cMoP; common monocyte precurscor;
cDP, common dendritic cell precursor; cDC, classical dendritic cell; pDC, plasmacytoid
dendritic cell.

Chapter 1 Introduction
32
1.2.2 Monocytes and monocyte-derived cells
Monocytes are a short-lived cell population, with an estimated half-life of hours
to days, which make up approximately 10% of the peripheral blood mononuclear cell
(PBMC) population in humans (Ginhoux and Jung, 2014). Two major circulating
subsets of monocytes have been identified in human (Ziegler-Heitbrock et al., 2010)
and in mouse (Geissmann et al., 2003). Pro-inflammatory or classical monocytes
(Ly6Chi in mouse and CD14hi in human) are rapidly recruited to tissues during
inflammation, wherein they differentiate and perform effector functions (Shi and Pamer,
2011). Patrolling or non-classical monocytes (Ly6Clow in mouse and CD14low in human)
adhere and migrate along endothelial surfaces, from where they may also be recruited
into tissues and undergo differentiation (Auffray et al., 2007); these cells have been
described as “luminal blood macrophages” (Ginhoux and Jung, 2014). A third
intermediate monocyte subset exists in humans, which may have inflammatory
functions (Belge et al., 2002). The existence of these specialized subsets
demonstrates that monocytes have specific functions beyond differentiation into
macrophage and DC-like cells, such as patrolling of blood vessels (Auffray et al.,
2007). They may also mediate specific functions in the tissues without further
differentiating, such as carriage and presentation of antigen, and promoting
angiogenesis (Avraham-Davidi et al., 2013; Jakubzick et al., 2013; Leirião et al., 2012)
Monocytes are no longer thought to contribute substantially to tissue
macrophage populations in the steady-state (Ginhoux and Jung, 2014). However, after
recruitment into tissues in inflammation, they can differentiate into cells with a spectrum
of properties characteristic of macrophages and DCs, leading to the designations of
monocyte-derived macrophages (MDMs) and monocyte-derived dendritic cells
(MDDCs) (Shi and Pamer, 2011). Many in vitro evaluations of macrophages and DCs
utilize this capacity of monocytes to differentiate, as the factors necessary to induce
MDMs and MDDCs from monocytes in vitro have been established as macrophage
colony stimulating factor (M-CSF; CSF1), or granulocyte-macrophage colony
stimulating factor (GM-CSF; CSF2) and IL-4, respectively (Geissmann et al., 2010).
Monocyte-derived cells may contribute to tissue MP populations in homeostasis in
some tissues, for example in the gut and skin (Bogunovic et al., 2009; Tamoutounour
et al., 2013; Varol et al., 2007) wherein inflammatory encounters may be more frequent
(Ginhoux and Jung, 2014; Zigmond and Jung, 2013). At inflammatory foci, monocyte-

Chapter 1 Introduction
33
derived cells are postulated to mediate a range of DC and macrophage functions
(Mildner and Jung, 2014; Wynn et al., 2013). It has been shown that MDDCs in murine
skin are transcriptionally similar to resident classical DCs, supporting the hypothesis
that they become phenotypically similar to resident cells – although this observation
was made in steady-state rather than inflammatory conditions (Tamoutounour et al.,
2013). The temporal nature of the contributions of MDMs and MDDCs have been
investigated, and in some contexts, such as in the central nervous system, their
seeding of tissues has been shown to be transient and resolve after inflammation
(Ajami et al., 2011). In other contexts, such as MDM infiltration of atherosclerotic
lesions, and MDDCs in a murine model of skin herpes simplex virus infection, they
have been shown to persist and in some cases to proliferate in situ (Eidsmo et al.,
2009; Robbins et al., 2008). It is suggested that the severity and nature of
inflammation, and how it has affected resident MPs, may determine the persistence of
monocyte-derived cells (Ginhoux and Jung, 2014).
Many effector functions of MPs have been elucidated using in vitro MDM and
MDDC models. It is cognizant to consider how accurately these cells replicate in vivo
tissue MPs. Early work noted that MDMs generated in whole blood cultures were
“indistinguishable from tissue macrophages” (Carrel and Ebeling, 1926), and the
morphological similarity of in vitro M-CSF-differentiated MDMs and ex vivo alveolar
macrophages (AMs) has been noted (Tomlinson et al., 2012). Comparative gene
expression profiling of M-CSF-differentiated MDMs and AMs showed that they were
more similar to each other than to monocytes, DCs or macrophage-like cell lines, but
were still transcriptionally distinct (Li et al., 2007; Tomlinson et al., 2012). As AMs are
dependent on GM-CSF signalling for their development in addition to M-CSF (Guilliams
et al., 2013; Shibata et al., 2001), and are phenotypically more similar to MDMs
differentiated used GM-CSF (Akagawa et al., 2006), the described functional
distinctions between MDMs and AMs may be predicated on inherent development
differences, as opposed to global incongruities between MDMs and tissue
macrophages. The substantial heterogeneity of tissue macrophage phenotypes
(Davies et al., 2013) suggests it is unlikely that in vitro MDMs can precisely model all
their highly specialised phenotypes. However, evidence for shared morphological and
functional features, as well as a common developmental requirement for M-CSF,
suggests MDMs are a reasonable reductionist model to study often inaccessible tissue
macrophages in vitro (as well as presumably modelling in vivo MDMs), with the clear

Chapter 1 Introduction
34
caveat of any in vitro study, that the absence of the tissue microenvironment may
influence functional insights.
1.2.3 Dendritic cells
DCs were identified by Steinman in 1972 as the critical accessory cell for
initiating adaptive immune responses (Steinman and Witmer, 1978; Steinman et al.,
1974). They are now known to be a distinct haematopoietic lineage derived from a
dedicated precursor, the cDP (Naik et al., 2007; Figure 1.3) under the control of the
cytokine Flt3L, with some input from M-CSF and GM-CSF for specific DC subsets
(Schmid et al., 2010).
Several DCs subsets exist with specific phenotypes and functions (Satpathy et
al., 2012). The original DC phenotype identified by Steinman is now held to be that of a
classical DC (cDC), which are highly phagocytic and specialised for processing and
presentation of antigen (Satpathy et al., 2012). A defining feature of cDCs is their ability
to migrate from the periphery to secondary lymphoid organs wherein they present
antigen and activate adaptive immune responses (Randolph et al., 2005), during which
process they differentiate from an immature phagocytic phenotype to a mature
phenotype specialised for antigen presentation (Pierre et al., 1997). A second subset,
plasmacytoid DCs (pDCs), also arise from the cDP in the bone marrow, after which
they are phenotypically and functionally divergent from cDCs (Satpathy et al., 2012).
They are spherical rather than stellate, are not phagocytic, and do not efficiently
present antigen; instead their primary function appears to be the ultra-fast production of
type I IFN (Siegal et al., 1999).
Some controversy exists regarding the purpose behind classifying some cells
as macrophages and some as DCs based on functional properties (Hume, 2008). The
recent proposal that classification should be based on ontogeny may dispel these
issues (Guilliams et al., 2014), but a key point is highlighted, which is that the
functionality of different MPs clearly overlaps, with consequences for considering their
specific roles in a CMI response. For example, although mature cDCs are specialised
for antigen presentation, macrophages are also known to present antigen and prime T
cells (Hume, 2008). Classical activation of macrophages via inflammatory stimuli may
induce cDC-like characteristics, and differentiated inflammatory monocytes may also
share similar phenotypic features (Mildner and Jung, 2014; Mosser and Edwards,
2008). Although mature cDCs, classically activated macrophages and mature
Chapter 1 Introduction
35
inflammatory monocytes do have key differences - such as their ontogeny, and their
tendency to migrate (Murray and Wynn, 2011) – this functional convergence of
different MPs upon an inflammatory T cell-priming phenotype suggests that they all
may contribute to CMI responses. As macrophages are the primary targets for many of
the intracellular pathogens which induce CMI responses, it seems likely that they are
the critical MP functioning at the site of inflammation in this arm of immunity.
1.2.4 Embryologically-derived tissue macrophages
Macrophages are resident in tissues throughout the body and perform essential
protective and homeostatic functions, including clearance of debris, immune
surveillance, and co-ordination and resolution of inflammation (Davies et al., 2013).
They are relatively long-lived cells with lifespans which may be in the region of months
(Murphy et al., 2008). It is now known that the majority of tissue macrophages have
embryological origins and are maintained by self-renewal throughout adult life
(Ginhoux and Jung, 2014). This has been demonstrated by a range of studies in
mouse models (Ginhoux et al., 2010; Guilliams et al., 2013; Hashimoto et al., 2013;
Hoeffel et al., 2012; Naito et al., 1997; Schulz et al., 2012; Yona et al., 2013). Although
there are some inconsistencies in these reports, the resultant consensus is that all
tissue macrophages derive from fetal monocytes generated during early definitive
haematopoiesis in the fetal liver, except microglia and some Langerhans cells, which
derive from yolk sac macrophages generated during primitive haematopoiesis in the
yolk sac (Ginhoux and Jung, 2014). As discussed in section 1.2.2, a minority of tissue
macrophages are monocyte-derived.
Tissue macrophage development depends on CSFR1 signalling (Wynn et al.,
2013). Many tissue macrophage populations are deficient in the M-CSF deficient
mouse model (Witmer-Pack et al., 1993), but the phenotype of this mouse is less
severe than that of the CSFR1-deficient mouse, which has additional deficiencies in
microglia and Langerhans cells (Dai et al., 2002; Wynn et al., 2013) – indicating that a
second CSFR1 ligand was involved in macrophage development. This was identified to
be IL-34 (Greter et al., 2012; Wang et al., 2012). GM-CSF also contributes to
macrophage development, specifically in terminal differentiation of AMs; the GM-CSF-
deficient mouse has grossly normal haematopoiesis, but specific defects in lung
homeostasis due to disrupted AM development (Dranoff et al., 1994; Guilliams et al.,
2013; Shibata et al., 2001; Stanley et al., 1994), and human genetic defects in GM-
CSF recapitulate this phenotype (Carey and Trapnell, 2010). Both M-CSF and GM-

Chapter 1 Introduction
36
CSF regulate macrophage biology post-developmentally; M-CSF, which is present in
tissues under homeostasis, may influence macrophage survival and self-renewal, while
GM-CSF, which is produced as part of the immune response, may induce inflammatory
macrophage phenotypes (Wynn et al., 2013).
Populations of tissue macrophages (Table 1.3) display striking phenotypic
diversity both between and within tissues, despite shared fetal origins and common
growth factor requirements; this may result from differing interactions of populations
with their tissue microenvironments (Davies et al., 2013; Hume, 2008; Wynn et al.,
2013). Some macrophage functions are developmental or homeostatic, such those of
osteoclasts, which co-ordinate bone remodelling, and liver Kupffer cells, which clear
cell debris from the blood (Davies et al., 2013). However, many of their functions are
those involved in immune responses and inflammation which are most integral to their
role in CMI, which are discussed subsequently in section 1.2.5.
The diversity of macrophages has led to consideration of what fundamentally
determines macrophage function. M-CSF-induced monocyte to MDM differentiation
involves substantial changes in gene expression (Dong et al., 2013; Lehtonen et al.,
2007; Liu et al., 2008), suggesting that transcriptional adaptations may partly determine
macrophage cell state. The transcription factor (TF) PU.1 is a key regulator of myeloid
cell fate (Mak et al., 2011), and PU.1 deficient mice have no macrophages from the
yolk sac stage (Schulz et al., 2012), indicating that it is necessary for macrophage
development. It is found to be associated with active transcriptional enhancers and
may initiate nucleosome remodelling, suggesting that it may determine cell identity by
instructing transcription (Ghisletti et al., 2010; Heinz et al., 2010). However, the PU.1-
deficient mouse has multi-lineage defects in haematopoiesis (Anderson et al., 1998;
Scott et al., 1994), and PU.1 expression also contributes to DC identity, so it cannot be
considereda classic “lineage-specific” TF for macrophages (Bakri et al., 2005). A recent
study confirmed that the substantial heterogeneity of tissue macrophages was evident
at the transcriptional level, but also defined a core macrophage transcriptomic
signature which distinguished macrophages from DCs (Gautier et al., 2012). This
included genes classically involved in macrophage function such as MR1, CD64 and
TLR4, and up-regulated in monocytes in vivo during MDM differentiation. The TF
C/EBPα was identified as a potential regulator of these genes, and has been
suggested in other studies as an instructor of macrophage identity (Liu et al., 2008).
Much remains to be clarified with regards to determinants of macrophage phenotype.

Chapter 1 Introduction
37
A recently defined tissue macrophage function is proliferation in order to self-
renew in homeostasis (Davies et al., 2013). Macrophage proliferation may also occur in
inflammation (Jenkins et al., 2011), where it may assist in replenishing tissue
macrophage populations after inflammatory depletion (Davies et al., 2011). M-CSF is
suggested to drive steady-state self-renewal, whereas proliferation in inflammation may
require IL-4 (Jenkins et al., 2013, 2011). It has also been shown that proliferative
capacity is controlled as part of an specific in vivo macrophage phenotype, which is lost
when cells are cultured ex vivo (Rosas et al., 2014); highlighting the substantial
contribution of the tissue microenvironment to macrophage function. Understanding the
mechanisms by which tissue-specific signals control macrophage phenotypes may
assist in developing tissue-specific in vitro models to study tissue macrophage function
(Okabe and Medzhitov, 2014; Rosas et al., 2014).

Chapter 1 Introduction
38
Tissue Macrophage type Functions References
Lung Alveolar macrophages Immune surveillance &
homeostatic regulation, such as
clearance of surfactant
Carey & Trapnell
(2010); Westphalen et
al. (2014)
Interstitial macrophages Regulation of DCs Bedorot et al. (2009)
Liver Kupffer cells Clearance of debris from the
blood - microorganisms, cells,
RBCs
Bilzer et al. (2006)
Motile liver macrophages Immune surveillance Klein et al. (2007)
CNS Microglia Immune surveillance & neuronal
maintenance & remodelling
London et al. (2013)
Perivascular and
meningeal macrophages
Immune surveillance Prinz et al. (2011)
Skin Dermal macrophages Immune surveillance Chorro & Geissmann
(2010)
Langerhans cells Immune surveillance & activation
of T cells
Chorro & Geissmann
(2010)
Bone Osteoclasts Bone resorption Pollard (2009)
Bone marrow macrophages Support erythropoiesis & provide
stem cell niche
Nagata (2007); Chow
et al. (2011)
Gut Intestinal macrophages Regulation of gut homeostasis
and inflammatory responses
Zigmond & Jung
(2013)
Serosal surfaces Peritoneal macrophages Immune surveillance &
homeostatic regulation
Cailhier et al. (2005)
Pleural macrophages Immune surveillance Cailhier et al. (2006)
Spleen Marginal zone
macrophages
Immune surveillance den Han & Kraal
(2012)
Metallophilic macrophages Immune surveillance den Han & Kraal
(2012)
Red pulp macrophages Erythrocyte clearance & iron
metabolism
Kohyama et al. (2009)
Lymph nodes Subcapsular sinusoidal
macrophages
Processing & presentation of
antigen to B cells
Junt et al. (2007)
Medullary macrophages Induction of immune tolerance Albacker et al. ( 2013)
Blood CD14lo monocytes
("luminal macrophages")
Surveillance & homeostasis of
endothelial surfaces
Auffray et al. (2007);
Ginhoux & Jung (2014)
Inflamed tissues Monocyte-derived
macrophages
Inflammatory & regulatory
responses
Murray and Wynn
(2013)
Table 1.2: Hetereogeneity and functions of tissue macrophages.
Adapted from Davies et al. (2013) and Murray & Wynn (2011). CNS, central nervous
system.

Chapter 1 Introduction
39
1.2.5 Functions of macrophages in CMI
Tissue macrophages and MDMs perform key functions in mediating CMI. These
range from initiation of the immune response via pattern recognition, to microbicidal
effector functions and resolution of inflammation. Importantly, they also interact with the
adaptive immune response (Davies et al., 2013; Murray and Wynn, 2011). The striking
plasticity of macrophages is critical for their ability to carry out this array of roles, and
both innate activation by microbes and adaptive modulation can contribute to their
responsive functional heterogeneity.
1.2.6 Innate immune recognition by macrophages
The pattern recognition hypothesis for pathogen detection by sentinel cells was
proposed by Janeway in 1989 and within ten years was proven by the discovery of toll-
like receptors (TLRs; Lemaitre et al., 1996; Medzhitov et al., 1997), transmembrane
proteins which bind conserved pathogen components designated as pathogen-
associated molecular patterns (PAMPs). The function of germline-encoded pattern
recognition receptors (PRRs) is now known to fundamentally underlie the initiation of
the immune response to microbial infection in invertebrates and vertebrates (Medzhitov,
2009). In macrophages, PRR activation stimulates intracellular signalling cascades,
which converge on transcriptional and non-transcriptional outputs manifest as
macrophage activation and inflammatory responses (Taylor et al., 2005).
Ten TLRs have been characterised in mammals (Takeda et al., 2003). These
are membrane-bound receptors found on the cell surface or in endosomes; the former
mainly recognise microorganism membrane components, while the latter recognise
pathogen-associated nucleic acid forms (Kawai and Akira, 2010). Many other PRR
families are now also recognised. The C-lectin type receptors (CLRs) are also
membrane-localised and recognise carbohydrate PAMPS; an archetypal CLR is dectin-
1, which is important in fungal and mycobacterial recognition (Reid et al., 2009).
Pattern recognition also occurs in the cytoplasm, where it is mediated by nucleotide
oligomerization domain (NOD)-like receptors (NLRs; Chen et al., 2009), RIG-1-like
receptors (RLRs; Loo and Gale, 2011) and a range of DNA sensors (Paludan and
Bowie, 2013). The NLRs are divided into three sub-families: the NODs, the NLRPs
(NLR, leucine-rich repeat and pyrin-domain-containing) and the IPAFs (ice protease-
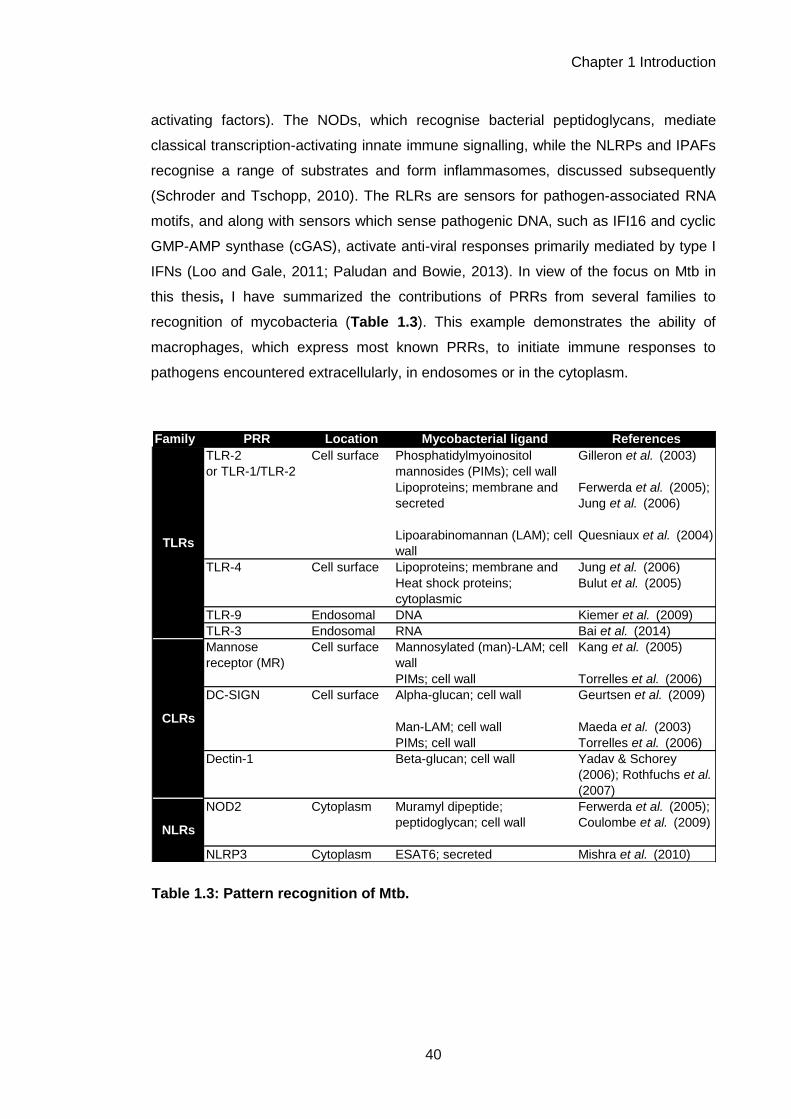
Chapter 1 Introduction
40
activating factors). The NODs, which recognise bacterial peptidoglycans, mediate
classical transcription-activating innate immune signalling, while the NLRPs and IPAFs
recognise a range of substrates and form inflammasomes, discussed subsequently
(Schroder and Tschopp, 2010). The RLRs are sensors for pathogen-associated RNA
motifs, and along with sensors which sense pathogenic DNA, such as IFI16 and cyclic
GMP-AMP synthase (cGAS), activate anti-viral responses primarily mediated by type I
IFNs (Loo and Gale, 2011; Paludan and Bowie, 2013). In view of the focus on Mtb in
this thesis, I have summarized the contributions of PRRs from several families to
recognition of mycobacteria (Table 1.3). This example demonstrates the ability of
macrophages, which express most known PRRs, to initiate immune responses to
pathogens encountered extracellularly, in endosomes or in the cytoplasm.
Family PRR Location Mycobacterial ligand References
TLR-2
or TLR-1/TLR-2
Cell surface Phosphatidylmyoinositol
mannosides (PIMs); cell wall
Gilleron et al. (2003)
Lipoproteins; membrane and
secreted
Ferwerda et al. (2005);
Jung et al. (2006)
Lipoarabinomannan (LAM); cell
wall
Quesniaux et al. (2004)
TLR-4 Cell surface Lipoproteins; membrane and
secreted
Jung et al. (2006)
Heat shock proteins;
cytoplasmic
Bulut et al. (2005)
TLR-9 Endosomal DNA Kiemer et al. (2009)
TLR-3 Endosomal RNA Bai et al. (2014)
Mannose
receptor (MR)
Cell surface Mannosylated (man)-LAM; cell
wall
Kang et al. (2005)
PIMs; cell wall Torrelles et al. (2006)
DC-SIGN Cell surface Alpha-glucan; cell wall Geurtsen et al. (2009)
Man-LAM; cell wall Maeda et al. (2003)
PIMs; cell wall Torrelles et al. (2006)
Dectin-1 Beta-glucan; cell wall Yadav & Schorey
(2006); Rothfuchs et al.
(2007)
NOD2 Cytoplasm Muramyl dipeptide;
peptidoglycan; cell wall
Ferwerda et al. (2005);
Coulombe et al. (2009)
NLRP3 Cytoplasm ESAT6; secreted Mishra et al. (2010)
TLRs
CLRs
NLRs
Table 1.3: Pattern recognition of Mtb.

Chapter 1 Introduction
41
Ligation of most membrane-bound PRRs, such as TLRs, causes intracellular
domain conformational changes leading to recruitment of adaptor proteins such as
MyD88, which activate intracellular signalling via enzymatic functions (Takeuchi and
Akira, 2010). The archetypal pathways which are activated in this manner downstream
of TLRs include the NFκB (nuclear factor kappa-light-chain-enhancer of activated B
cells) pathway, the MAPK (mitogen-activated protein kinase) cascades, and interferon
response factor 3 (IRF3) signalling (Takeuchi and Akira, 2010). TLR-induced NFκB
pathway activation causes degradation of the inhibitor of κB (IκB), which retains NFκB
TFs in the cytoplasm in the steady state, thus leading to their release and translocation
to the nucleus where they induce innate inflammatory gene expression (Takeuchi and
Akira, 2010). Concomitant activation of the MAPK cascade also leads to transcription
factor activity, such as that of AP-1 and CREB (Dong et al., 2002).
Other PRRs stimulate similar signalling pathways to TLRs; e.g. the RLR RIG-1
(retinoic acid-inducible gene 1) activates NFκB via the adaptor IPS-1 (interferon-beta
promoter stimulator 1) (Kawai and Akira, 2006), and CLRs recruit the tyrosine kinase
Syk via which MAP kinases are activated, as well as stimulating calcium-signaling
pathways to activate the TFs CREB and NFAT (Kelly et al., 2010). A major DNA
sensing pathway is activated by the inherent enzymatic activity of the sensor, cGAS,
which produces cyclic dinucleotides that act as second messengers to activate STING
(stimulator of IFN genes), leading to IRF activation (Li et al., 2013). IRF3, which is also
activated downstream of TLRs, then induces type I IFN transcription and thus
stimulates innate antiviral responses (Burdette and Vance, 2013).
It has also been established that some innate immune responses are not
powered by transcription, such as inflammasome activation (Strowig et al., 2012).
Activation of the NLRP or IPAF NLRs causes their oligomerization via their NACHT
domains, forming complexes termed inflammasomes which can activate caspase-1.
Caspase-1 then enzymatically cleaves the pro-forms of two pro-inflammatory cytokines,
pro-IL-1β and pro-IL-18, into their active forms which can be secreted. This process
can also induce a form of inflammatory cell death termed pyroptosis (Rathinam et al.,
2012). Many stimuli have been shown to activate inflammasomes, including microbial
PAMPs, and also signals that communicate tissue damage termed danger-associated
molecular patterns (DAMPs), such as urate crystals, β-amyloid and extracellular ATP
(Schroder and Tschopp, 2010). The mechanisms by which these signals activate

Chapter 1 Introduction
42
inflammasomes are unclear, but may involve effects on membrane integrity, or the
recently favoured hypothesis of mitrochondrial dysfunction and reactive oxygen
species (ROS) generation (Schroder and Tschopp, 2010).
Other non-transcriptional innate immune signalling outputs have been
described, which modulate the outcome of inflammatory gene expression programmes
via mechanisms such as altering splicing, mRNA stability and translation (Carpenter et
al., 2014). One example involves the phosphoinositide (PI)-3-kinase (PI3K)–
mammalian target of rapamycin (mTOR) pathway, the activity of which was shown to
be modulated in macrophages after bacterial infection, leading to alterations in the
efficiency of translation of cytokine mRNAs, and resultant biasing of pro- or anti-
inflammatory responses (Ivanov and Roy, 2013).

Chapter 1 Introduction
43
1.2.7 Macrophage effector functions
It has been long been established that during interactions with pathogens,
macrophages assume a pro-inflammatory phenotype involving an increased
microbicidal capacity (Unanue, 1976). It is now known that this is primarily induced by
pattern recognition, which primes the macrophage for physiological adaptation to
inflammation, and directs active anti-microbial functions. One potent macrophage
effector function is secretion of cytokines: pleiotropic secreted proteins which act in an
autocrine, paracrine and endocrine fashion. They signal via receptors on both immune
and non-immune cells to stimulate outcomes such as leukocyte activation, increased
vascular permeability and tissue adaptation to inflammation. It was first shown in the
1970s that factors secreted by macrophages could alter lymphocyte activity (Hoffmann
and Dutton, 1971) and that macrophage activation modulated this secretion (Unanue,
1976). A range of macrophage-produced cytokines have now been characterised
(Table 1.4). Macrophages are also able to secrete chemokines, molecules which are
able to control the migration and positioning of leukocytes (Griffith et al., 2014), and so
they also modulate inflammation by controlling the recruitment of other immune cells
(Mantovani et al., 2004). Via the action of cytokines and chemokines, macrophages
exert powerful effects on the quality of inflammation and the immune response.
Table 1.4: Cytokines secreted by macrophages.
Cytokine Ascribed functions References
TNFα Broad range of inflammatory bioactivites, including co-
ordination of the acute phase response, induction of
intracellular killing in macrophages and induction of
apoptosis
Wajant et al. (2003)
IL-6 Broad range of inflammatory bioactivities, including co-
ordination of the acute phase response, stimulation of
neutrophil production, and induction of monocyte
recruitment
Scheller et al. (2011)
IL-1β Broad range of inflammatory bioactivities, including
increasing vascular adhesion, co-ordination of the acute
phase response, activating and inducing survival of
innate immune cells such as neutrophils, influencing
polarisation of Th17 cells,
Dinarello (2009)
IL-12 Influences polarisation of Th1 cells Hsieh et al. (1993)
IL-18 Influences polarisation of Th1 cells Gracie et al. (2003)
IL-10 Immunomodulatory functions; contributes to resolution
of inflammation
See section 1.5
IFNβ Antiviral responses and immunosuppressive functions Stetson & Medzhitov (2006);
Gonzalez-Navajas et al.
(2012)
IL-23 Influences polarisation of Th17 cells Iwakura & Ishigame (2006)
TGFβ Promotes resolution of inflammation and fibrosis;
influences polarisation of Treg and Th17 cells
Lee et al. (2001); Murray &
Wynn (2013)

Chapter 1 Introduction
44
In addition to regulating other cells, macrophages display direct anti-microbial
activity via their potent phagocytic function and capacity for intracellular killing.
Phagocytosis is initiated by binding of pathogens by receptors which can mediate
ingestion, including scavenger receptors, complement receptors, lectins, integrins and
Fc receptors (Stuart and Ezekowitz, 2005). The initiation of phagocytosis triggers a
range of intracellular processes, including cytoskeletal rearrangements and membrane
trafficking events involved in uptake, but also pro-inflammatory signalling, microbial
killing pathways and in some cases apoptosis (Stuart and Ezekowitz, 2005).
Phagocytosis essentially co-operates with pattern recognition to trigger anti-microbial
defences (Underhill and Ozinsky, 2002); this is evidenced by observations that PRRs
such as dectin-1 can mediate phagocytic uptake (Herre et al., 2004), but also in the
recruitment of PRRs such as TLRs to phagosomes to facilitate microbial detection
(Ozinsky et al., 2000; Underhill et al., 1999). Macrophages can also phagocytose
fragments of apoptotic cells as a result of pro-phagocytic signals on the apoptotic cell
surface (Flannagan et al., 2012).
Phagocytosis internalises micro-organisms in an early phagosome, which then
undergoes a maturation process to mediate microbial killing (Stuart and Ezekowitz,
2005). This involves acidification and a series of fusion and fission events with other
endosomal compartments, most importantly lysosomes, to form the phagolysosome
(Flannagan et al., 2009). The phagolysosome is optimised for pathogen degradation,
containing degradative enzymes such as hydrolases and proteases (Stuart and
Ezekowitz, 2005). ROS are also generated to mediate killing, via the NADPH oxidase
and mitochondrial pathways (Sakata et al., 1987; West et al., 2011). In humans,
mutations in the genes encoding the subunits of the NADPH oxidase are associated
with chronic granulomatous disease (CGD), a primary immunodeficiency characterised
by recurrent bacterial and fungal infections, demonstrating the importance of this
phagocytic killing pathway in pathogen control (Heyworth et al., 2003). Generation of
reactive nitrogen species (RNS) by the action of inducible nitric oxide synthase (iNOS)
is an accepted event in murine macrophages which contributes to host protection but
evidence for this pathway in human macrophages is less clear (Aberdein et al., 2013).
The importance of phagolysosomal killing is evident in the range of pathogens which
have evolved to inhibit phagosomal maturation and function (Flannagan et al., 2009);
as a result, alternative pathways of killing may be utilized, such as autophagic killing of
Mtb (Gutierrez et al., 2004). In some contexts wherein the macrophage capacity for

Chapter 1 Introduction
45
phagolysosomal killing is exhausted, it has been shown that macrophage apoptosis
may be utilized as an alternative microbial killing mechanism, for example in the
response to Streptococcus pneumonie (Aberdein et al., 2013; Ali et al., 2003; Bewley
et al., 2011; Dockrell et al., 2003, 2001).
Macrophages also co-ordinate tissue repair and resolution of inflammation. Acute
inflammatory macrophage responses can be inherently tissue-damaging and contribute
to disease, in addition to damage which may be caused directly by pathogens (Wynn et
al., 2013). Chronic inflammation, which arises when the acute response is not
appropriately resolved, is also a major driver of pathology in which macrophage
function is implicated (Nathan and Ding, 2010). Therefore, the resolving functions of
macrophages represent an important feedback mechanism by which they regulate
immunopathogenic outcomes of their own function. Two specialised macrophage
phenotypes mediate resolution, described as either pro-fibrotic macrophages, which
are involved in wound-healing, or regulatory macrophages, which are involved in
suppression of inflammation (Wynn and Ramalingam, 2012). The latter have also been
referred to as “M2” or alternatively activated macrophages, and are proposed to
represent a polarised macrophage phenotype in contrast to pro-inflammatory “M1”
macrophages; however, the utility of these designations is a matter of debate, and is
discussed subsequently in section 1.2.9.
The factors which induce these resolution phenotypes include the Th2 cytokines IL-
4 and IL-13, IL-10, glucocorticoids, prostaglandins and apoptotic cells (Wynn et al.,
2013). Pro-fibrotic macrophages secrete factors such as platelet-derived growth factor
(PDGF) and transforming growth factor β (TGFβ), which mediate repair by inducing
fibroblasts to synthesise collagen (Wynn and Ramalingam, 2012). They also secrete
tissue inhibitors of metalloproteinases (TIMPs), which inhibit matrix metalloproteinase
(MMP)-mediated degradation of the extra-cellular matrix (ECM) (Murray and Wynn,
2011). Although depletion studies have demonstrated the necessity of pro-fibrotic
macrophages in repair (Duffield et al., 2005; Lucas et al., 2010), they have also alluded
to their potentially pathogenic functions in causing fibrosis and scar formation in
chronic inflammation (Wynn and Ramalingam, 2012). Regulatory macrophages
contribute to the resolution of inflammation by producing factors which suppress pro-
inflammatory responses, such as IL-10, which is discussed subsequently in section
1.5. Another suppressive factor produced is resistin-like molecule alpha (RELMα),
which may contribute to the regulation of Th2-polarised immune responses (Nair et al.,
2009).

Chapter 1 Introduction
46
1.2.8 Interactions of macrophages with the adaptive immune system
The crux of the CMI response is the collaboration between macrophages and CD4+
T cells in the control of intracellular pathogens (Figure 1.1). Macrophages are thought
to be less migratory than DC, and to persist in tissues after initiating inflammation
(Murray and Wynn, 2011). Thus, their interactions with adaptive immune cells are
subject to lymphocyte recruitment to the site of inflammation. The chemokine milieu
produced by macrophages in acute inflammation may drive this, including factors such
as CXCL9 and CXCL10, which are chemotactic for CD4+ Th1 cells, CD8+ cytotoxic
cells and natural killer (NK) cells, and CCL17, which is chemotactic for Th2 cells
(Griffith et al., 2014; Hardison et al., 2006; Katakura et al., 2004).
Once macrophages and adaptive immune cells are closely spatially related, several
interactions may occur. The first set of interactions stem from the macrophage, and the
most classic interaction in this regard is macrophage-driven activation of CD4+ T cells.
This is suggested to involve three signals from the macrophage or antigen presenting
cell (APC): antigen presentation is signal 1, ligation of co-stimulatory receptors is signal
2, and secretion of modulatory cytokines is signal 3 (Curtsinger et al., 1999;
Kapsenberg, 2003). The ability of macrophages to provide signal 3 is clear, as they
secrete a range of cytokines which can modulate T cells (Table 1.5). They are also
able to provide signal 1 and signal 2, as although they are not considered to be
professional APCs like DCs, they do express major histocompatibility class (MHC) II
and co-stimulatory molecules, and have the appropriate phagocytic and antigen
processing capabilities to facilitate class II-restricted presentation to CD4+ T cells
(Hume, 2008). Investigations have demonstrated that macrophage-mediated antigen
presentation to CD4+ T cells can occur in vitro (Desmedt et al., 1998) and in vivo
(Moser, 2001).
The cytokine-driven signal 3 produced by macrophages can alter the polarisation of
the subsequent CD4+ T cell response. Associations of different macrophage-derived
cytokines with different polarised CD4+ T cell responses are shown in Table 1.6.
Polarised CD4+ T cell responses are can then feedback to macrophages to modulate
their effector functions and hence produce further immune response adaptation, which
again mainly occurs via cytokine signalling. IFNγ was the first lymphocyte-produced
factor described which modulated macrophage function (Celada et al., 1984; Fowles et
al., 1973; Mackaness, 1964; Nathan et al., 1983, 1973; Pace et al., 1983), and was
found to induce a potently pro-inflammatory, microbicidal activated macrophage

Chapter 1 Introduction
47
response. Subsequently, the Th2-produced cytokines IL-4 and IL-13 were shown to
induce a divergent form of macrophage activation: promoting endocytosis via mannose
receptors, inducing expression of MHC class II molecules, and downregulating pro-
inflammatory cytokine secretion (Doyle et al., 1994; Stein et al., 1992). These two
macrophage phenotypes were respectively designated as classical and alternative
activation of macrophages, and led to the development of the M1 vs. M2 macrophage
polarisation concept, discussed subsequently in section 1.2.9. In addition to
responding to IFNγ, IL-4 and IL-13, macrophages have been reported to alter their
functions in response to other cytokines produced by CD4+ T cells, demonstrating the
diverse ways in which T cells and macrophages interact to mediate CMI. These are
summarised in Table 1.5.
Polarised CD4+ T
cell responseImmune response
Macrophage-
derived cytokinesReferences
Th1 CMI; IFNγ-producing;
intracellular pathogens
IL-12, IL-18 Hsieh et al. (1993);
Gracie et al. (2003)
Th2 Humoral immunity; IL-4/IL-13
producing; extracellular
pathogens
IL-4 Pouliot et al. (2005);
Mukhurjee et al. (2009)
Th17 IL-17 producing; extracellular
bacteria and fungi
IL-23, IL-6, IL-1β,
TGFβ
Langrish et al. (2005);
Scheller (2011); Chung
et al. (2009); Mangan et
al. (2006)
Treg Immunoregulation IL-10, TGFβ Horwitz et al. (2003);
Chen et al. (2003)
Th9 IL-9 producing; immunity to
nematodes
TGFβ, IL-4 Veldhoen et al. (2008)
Th22 IL-22 producing; skin immune
responses
IL-6, TNFα Duhen et al. (2009);
Trifari et al. (2009)
Table 1.5: Induction of polarised CD4+ T cell responses by macrophage-derived
cytokines.

Chapter 1 Introduction
48
Table 1.6: Modulation of macrophages by different CD4+ T cell subset-derived cytokines.
T-cell derived
cytokine
T cell subset
associationReported effects on macrophages References
IFNγ Th1, Th17 Classical macrophage activation;
induction of microbicidal killing and
inflammation
Fowles et al. (1973);
Nathan et al. (1983);
Pace et al. (1983);
TNFα Th1 Induction of microbicidal killing,
effects on apoptosis pathways;
regulation of cytokine secretion
Rojas et al. (1999);
Munoz-Fernandez et al.
(1992); Hodge-Dufour et
al. (1998)
IL-4 Th2 Alternative macrophage activation;
enhancement of phagocytosis &
antigen presentation pathways,
suppression of killing pathways
Stein et al. (1992);
Martinez et al. (2009)
IL-13 Th2 Similar effects to IL-4 Doyle et al. (1994)
IL-17 Th17 Reported to induce an anti-apoptotic
phenotype involved in resolution;
other reports suggest induction of pro-
inflammatory cytokines
Zizzo & Cohen (2013);
Jovanovic et al. (1998)
IL-10 Tregs; most
subsets under
some conditions
Outlined in section 1.5.3
TGFβ Tregs Activation of a specific gene
expression programme which may be
involved in Th2 responses and lipid
metabolism
Gratchev et al. (2008)
IL-22 Th22, Th17 Induction of microbial killing; however
also reported that macrophages may
not express the IL-22R
Wolk et al. (2004);
Dhiman et al. (2009)
IL-9 Th9 May induce inflammatory phenotypes Nowak et al. (2009)

Chapter 1 Introduction
49
1.2.9 Macrophage functional plasticity
Macrophages are able to appropriately adapt their function in response to
detection of a wide range of extracellular signals (Mosser and Edwards, 2008). As
such, macrophages display substantial functional plasticity, in addition to phenotypic
heterogeneity in different tissues. This plasticity of activation states has been a subject
of intensive research, mainly using in vitro MDM models, and has provided many
insights into the diverse ways in which macrophages may function during the immune
response.
Stimulation of macrophages with either IFNγ or IL-4 and IL-13 produces distinct
macrophage phenotypes which have been strongly associated with Th1 and Th2
immune responses, with demonstrations in vitro and in vivo that they are both
provoked by these immune responses and played key roles in their outcomes (Mills et
al., 2000). A macrophage subset nomenclature was proposed to formalise this parallel
with the type I vs. type II immune response paradigm, in which classically activated
macrophages, which could also be induced by innate stimulation, became known as
M1 macrophages and alternatively activated macrophages became known as M2
macrophages (Mills et al., 2000). However, many other stimuli could clearly modulate
macrophage biology, including cytokines such as IL-10 and TNFα, and other factors
such as glucocorticoids and immune complexes (Mantovani et al., 2004). Modifications
of the nomenclature were proposed to incorporate this, such as division of
macrophages into three functional subsets of host defence, wound healing and
immune regulation (Mosser and Edwards, 2008), or sub-division of the M2 category
into M2A, B and C sub-subsets, depending on which input stimuli were used to induce
alternative activation (Mantovani et al., 2004). Formulation of this classification was
accompanied by research into the molecular mechanisms by which a macrophage
becomes classically or alternatively activated, for example at the transcriptomic level
(Martinez et al., 2006) or by identification of what are postulated to be subset signature
transcription factors, such as IRF5 in M1 polarisation (Krausgruber et al., 2011) and
IRF4 (Satoh et al., 2010) and PPAR-γ (Bouhlel et al., 2007; Odegaard et al., 2007) in
M2 polarisation.
Throughout the characterisation of macrophage activation within the M1 vs. M2
framework, there was recognition that these phenotypes were an oversimplification,

Chapter 1 Introduction
50
and were actually likely to represent polarised extremes of a spectrum of phenotypes
(Mantovani et al., 2004; Biswas and Mantovani, 2010). Their existence in vivo as pure
polarized subsets was questioned (Lawrence and Natoli, 2011), with the suggestion
that it was more likely that mixed phenotypic populations were driven by multiple
signals (Martinez and Gordon, 2014). It was also reported that activated macrophage
phenotypes were in fact more labile and prone to temporal re-adaptations than a
system describing polarised subsets might indicate (Biswas and Lopez-Collazo, 2009;
Stout and Suttles, 2004; Stout et al., 2005). Subsequently, a report evaluating human
macrophages in vitro using a wide range of stimulation conditions, and transcriptional
profiling of the activation states produced, showed that the M1 vs. M2 bipolarization
model could be replaced with a complex spectral range of heterogeneous macrophage
activation states (Xue et al., 2014).
As a result, the concept of macrophage plasticity as a binary polarised system of
classically and alternatively activated macrophages has been superseded by a
paradigm in which macrophages are understood to be functionally dynamic, long-lived
cells which are capable of switching their function between a complex array of
“metastable” activation states appropriate to their microenvironment (Wynn et al., 2013;
Xue et al., 2014). This plasticity is assumed to be primarily controlled at the
transcriptional level, wherein the extracellular mediators inducing phenotypic
adaptation activate intracellular signalling cascades via receptor ligation, converging on
transcriptional outputs which reprogram the function of the cell (Lawrence and Natoli,
2011; Natoli and Monticelli, 2014).
Overall, it is clear that both autocrine and paracrine signals in CMI, generated by
macrophages and T cells, can substantially affect the phenotype of both of these cell
types as well co-ordinating other effector functions. Hence, the outcomes of CMI
responses are likely to be determined stochastically by these signals, and an
understanding of both macrophage biology and how it is modulated by these signals,
and by pathogens such as HIV-1 and Mtb which can parasitize macrophages, is central
to understanding the function of CMI.

Chapter 1 Introduction
51
1.3 HIV-1 infection and CMI
1.3.1 The human immunodeficiency virus
In the early 1980s, the first reports were made of a condition characterised by
severe opportunistic infections, tumours and reduced CD4+ T cell counts. Within four
years this condition had been formalized in name as the acquired immunodeficiency
syndrome (AIDS), and its causative agent identified: a retrovirus able to infect and
cause cytopathic effect in T cells, now called human immunodeficiency virus 1 (HIV-1)
(Barré-Sinoussi et al., 1983; Popovic et al., 1984). In the subsequent three decades,
research has extensively characterised this infection and its pathogenesis. The cellular
receptors for HIV-1 have been identified – the co-stimulatory molecule CD4 (Dalgleish
et al., 1984; Maddon et al., 1986) in combination with a chemokine co-receptor
(Alkhatib et al., 1996; Feng et al., 1996; Deng et al., 1996), which allows the virus to
infect a range of cell types in vivo, including CD4+ T cells and macrophages. The ability
of HIV-1 to infect both of these central cellular players in CMI highlights the propensity
of the virus to modulate this arm of immunity. CMI modulation represents a major
pathway of viral pathogenesis, which is mediated through the direct effects of the virus
on these cells and through its pleiotropic effects on the immune system more broadly.
The aberrant effects of HIV-1 on CMI are evident in the increased risk of infection by
intracellular pathogens in HIV-1+ individuals, of which one the most striking examples is
mycobacterial disease including TB.
1.3.2 Epidemiology, clinical course and treatment of HIV-1 disease
The global burden of the HIV-1 pandemic is substantial. In 2012, 35.3 million
people globally were HIV-1+, 2.3 million new HIV-1 infections occurred, and 1.6 million
deaths were attributed to the virus (UNAIDS, 2013). This burden of infection is
disproportionately found in sub-Saharan Africa, where more than 70% of new HIV-1
infections occurred in 2012 (UNAIDS, 2013). Two distinct epidemiological patterns of
HIV-1 infection exist; firstly, countries in which infection is primarily found in particular
at-risk groups, such as men who have sex with men (MSMs) or injecting drug users
(Cohen et al., 2008). This is the primary pattern of disease in countries outside sub-
Saharan Africa. Therein, the second epidemiological pattern is observed, in

Chapter 1 Introduction
52
generalised epidemics of HIV-1 infection which are self-sustaining throughout the
whole population (Cohen et al., 2008).
The natural history and clinical manifestations of HIV-1 disease result from the
immunopathogenic processes driven by the virus discussed subsequently in section
1.3.6). Many individuals (estimates range from 40–90%) experience an acute retroviral
syndrome or seroconversion illness within 2–6 weeks of infection, due to the initial
immune response to the virus, with archetypal symptoms of viral infection, such as
fever, myalgia, rash, lymphadenopathy and headache (Kassutto and Rosenberg,
2004). The infection soon enters a phase of clinical latency, in which most individuals
are asymptomatic and the plasma HIV-1 viral load (VL) is maintained at a lower set
point (Levy, 2009). After approximately 5–10 years of untreated infection, late-stage
HIV-1 disease is manifest in substantial loss of peripheral blood CD4+ T cells and
increased incidence of opportunistic infections, recognized clinically as AIDS (Cohen et
al., 2008). Progression to AIDS can be prevented by effective anti-retroviral therapy
(ART); however, it is now recognized that even treated HIV-1+ individuals are at
increased risk of non-AIDS-related chronic health complications, including
cardiovascular disease, neurocognitive disease, liver and kidney disease, some
cancers, and frailty (Deeks et al., 2013).
Notwithstanding non-AIDS related morbidity, the development of ART and the
global expansion of access to anti-retrovirals (ARVs) is coincident with substantial
reductions in HIV-1-associated mortality. The central principal of ART is the use of
several ARVs in combination, to avoid the rapid development of drug resistance to
single agents that occurs due to the rapid HIV-1 replication rate; this is termed highly
active anti-retroviral therapy (HAART) (Cohen et al., 2008). Due to the robust efficacy
of HAART in preventing progression to AIDS and reducing HIV-1-related mortality (The
HIV-CAUSAL Collaboration, 2010), and recent demonstrations that it can also reduce
transmission (Cohen et al., 2011a), it is now recommended that ART is initiated in all
HIV-1+ individuals with a CD4+ T cell count of less than 500/mm3 (WHO, 2013a).
1.3.3 HIV-1 virology
HIV-1 is spherical enveloped virus which is a member of the genus Lentivirus,
part of the family Retroviridae (Fields Virology, 2007). It is a single-stranded positive-
sense RNA virus, with genome of approximately 10kB (Ratner et al., 1985; Wain-
Hobson et al., 1985) containing nine genes flanked by two long terminal repeats (LTR)

Chapter 1 Introduction
53
(Morrow et al., 1994). The gag gene encodes a polyprotein containing structural
components of the virus; the pol gene encodes a polyprotein containing the viral
enzymes, reverse transcriptase, integrase and protease; and the env gene encodes
the viral glycoproteins gp120 and gp41 (Morrow et al., 1994). The six remaining genes
– tat, rev, vpr, vpu, vif and nef – encode the viral accessory proteins which have a
range of functions in replication and host cell manipulation (Morrow et al., 1994; Strebel,
2013). In the virion, two copies of the RNA genome are packaged in diploid form inside
the viral core which has a characteristic conical structure in mature virions (Morrow et
al., 1994). This is surrounded by the viral matrix, and lastly the lipid envelope, which
contains the glycoproteins which determine the cellular tropism of the virus (Shioda et
al., 1991). The virion also contains viral enzymes and various host factors which are
either packaged or derived from the host membrane during the budding process
(Morrow et al., 1994; Ott, 2008).
Phylogenetic analyses have determined that the closest ancestor of HIV-1 is
simian immunodeficiency virus (SIV) cpz, a pathogenic lentivirus of chimpanzees, and
HIV-1 is estimated to have transmitted to humans zoonotically within the last century
(Gao et al., 1999; Keele et al., 2009; Korber et al., 2000). HIV-1 is formed of four
genetic groups; M (major), O (outlier), N (non-M, non-O) and P; group M is the
pandemic HIV-1 which accounts for ≥ 90% of infections globally (Hemelaar, 2012).
Within group M, there is great genetic diversity, as a result of the inherent replicative
properties of HIV-1 that confer a rapid evolutionary rate upon the virus (Rambaut et al.,
2004). There are nine group M clades; clade B viruses predominate in Europe and the
Americas, whereas clade C viruses are most common in sub-Saharan Africa
(Hemelaar, 2012).
HIV-2, despite also being an aetiological agent of AIDS in humans, is less
closely related to HIV-1 than SIVcpz, and its genome is only partially homologous to
HIV-1 (de Silva et al., 2008). Its closest relation in the lentivirus family is the sootey
mangabey virus SIVsm, from which a separate zoonotic transmission event is thought
to have occurred (Gao et al., 1992). HIV-2 is less pathogenic than HIV-1, causing
slower progression to AIDS and exhibiting reduced rates of transmission; its global
distribution is mostly limited to west Africa (Gilbert et al., 2003; Marlink et al., 1994).

Chapter 1 Introduction
54
1.3.4 Interactions of HIV-1 with host cells: the viral lifecycle, host restriction
and immune evasion
The HIV-1 replication strategy in host cells is described as follows (Fields
Virology, 2007). HIV-1 enters cells by interaction of the viral envelope glycoproteins
with the host glycoprotein CD4 and a chemokine receptor, leading to fusion of the viral
and host membranes and release of the viral core into the cell. This core is made of
capsid proteins and contains the HIV-1 RNA genome and the viral enzymes reverse
transcriptase (RT), protease and integrase (IN), as well as tRNA primers for the
process of reverse transcription, which takes place rapidly after entry to produce a
double stranded DNA (dsDNA) copy of the viral genome. This initial RT complex then
reassembles around the dsDNA genome to form the pre-integration complex (PIC),
made up of both viral and host proteins, which is trafficked into the host cell nucleus for
the process of integration into chromosomal DNA, facilitated by IN. The transport of the
PIC through nuclear pores allows HIV-1 to effectively infect non-dividing cells, such as
tissue macrophages, a feature shared with other lentiviruses. The integrated viral
genome, termed the provirus, is used as the template for viral transcription under the
control of the viral LTR and mediated by host RNA polymerase II and the viral
transactivator protein Tat, along with cellular transcription factors. Viral transcripts are
transported to the cytoplasm using both the host nuclear export systems and the viral
protein Rev, and are translated into the polyproteins Gag and Gag-Pol, as well as
accessory proteins and envelope proteins, or alternatively become nascent viral
genomes. Viral proteins and genomic RNA dimers assemble at the plasma membrane
and bud as an immature virion, which matures throughout the budding process as the
protease enzyme cleaves the polyproteins to form a mature virion which is competent
for infection of new host cells.
This strategy is broadly similar to most retroviruses, although the six HIV-1
accessory proteins provide additional functions which aid replication, infectivity and
transmission. The transactivator protein Tat increases the efficiency of viral
transcription by promoting the formation of a highly efficient RNA polymerase II
complex, and the export protein Rev allows efficient shuttling of viral transcripts in
spliced and unspliced forms. These two proteins are essential for viral infectivity, and
deletion or mutation of their genes renders the virus non-infectious (Dayton et al.,
1986; Terwilliger et al,. 1988). The remaining four accessory proteins - Vif, Vpr, Vpu
and Nef - perform functions which maximise the efficiency of viral replication, but

Chapter 1 Introduction
55
deletion of these genes in many studied cell systems is not fully deleterious for viral
replication. Vif interacts with the host restriction factor APOBEC3G to counteract the
effects of this protein on the virus (Conticello et al., 2003). A range of functions have
been ascribed to Vpr; it is suggested to be most important for replication in
macrophage-lineage cells (Balliet et al,. 1994), and has been reported to influence viral
and host gene expression, enhance nuclear import of the PIC, and interfere with the
host cell cycle and apoptotic processes (Andersen & Planelles, 2005). It is not clear
which, if any, of these is the dominant function of Vpr. The Vpu protein is unique to
HIV-1 among lentiviruses, and has been implicated in enhancing release of virus by
countering the host restriction factor tetherin (Neil et al., 2008), and causing
degradation of CD4 in infected cells, the latter in order to prevent retention of the
envelope glycoproteins in the cell (Dubé et al., 2010). The final accessory protein, Nef,
has been shown to be important for pathogenesis in vivo, as individuals infected with
Nef-mutated viruses progressing more slowly to AIDS (Kirchhoff et al., 1995). Several
functions have been ascribed to Nef in vitro: altering cellular activation states,
downregulating a range of cell surface molecules, and interacting with autophagy
pathways, although exactly how these functions link to enhancement of infectivity in
vivo is not understood (Roeth & Collins, 2006).
A common theme emerges that many HIV-1 accessory proteins act to
antagonise or degrade host proteins which can inhibit viral replication; these proteins
are termed restriction factors, and represent a cell-autonomous part of the innate
immune system which acts to inhibit viral replication (Towers and Noursadeghi, 2014).
These factors include APOBEC3G, which introduces mutations in viral DNA (Mangeat
et al., 2003); TRIM5α, which mediates restriction by binding to the viral capsid
(Stremlau et al., 2004); tetherin, which physically prevents viral budding from the
plasma membrane (Neil et al., 2008); SAMHD1, which reduces intracellular nucleotide
pools to reduce reverse transcription efficacy (Hrecka et al., 2011; Laguette et al.,
2011), and Mx2, which restricts viral nuclear entry (Goujon et al., 2013; Kane et al.,
2013). This system of cell-autonomous HIV-1 restriction is inducible by IFN responses,
and so HIV-1 has evolved to avoid triggering IFN responses, by evading innate
immune detection in the immune sentinel cells it infects, such as macrophages
(Rasaiyaah et al., 2013; Tsang et al., 2009). The main step in the HIV-1 lifecycle at
which pattern recognition might occur is after reverse transcription of viral RNA in the
cytoplasm, as the resultant viral DNA could potentially trigger cytoplasmic DNA
sensors such as cGAS and IFI16 (D. Gao et al., 2013; Towers and Noursadeghi, 2014).

Chapter 1 Introduction
56
HIV-1 utilizes cellular co-factors to prevent DNA sensor triggering and hence prevent
restrictive IFN responses. These cofactors include TREX1, which degrades excess
viral DNA products (Yan 2010), and cyclophilin A and CPSF6, both of which are
recruited to the viral capsid and are necessary for evasion of IFN triggering (Rasaiyaah
et al., 2013).
1.3.5 HIV-1 pathogenesis and antiviral immune responses
The pathogenesis of HIV-1 infection, and subsequent progression to AIDS, has
been characterised via clinical observations and studies of SIV infection in primate
models. The first event post-transmission is establishment of infection in small
populations of founder cells – indicated from animal models to primarily be resting
CD4+ T cells, although myeloid cells may also be affected - in the mucosa, wherein
virus infection and replication expands locally for the first week of infection. This is
known as the “eclipse phase”, during which viraemia is not detectable (Cohen et al.,
2011b). Infection then disseminates systemically to secondary lymphoid organs,
manifesting within the second week post-infection as a high viraemia, as large
numbers of target cells in these cell-rich tissues are infected (Haase, 2005).
Pathological processes, including CD4+ T cell depletion, start in secondary lymphoid
organs during the initial first four weeks or “fast phase” of infection: memory CD4+ T
cells, and those in the gut-associated lymphoid tissue (GALT), are particularly affected
(Cohen et al., 2011b). By week four, viraemia starts to decline as the infection enters
its “slow phase”, as a result of the development of some immunity to the virus and
potentially depletion of target cells for infection (Haase, 2010). The slow phase,
characterised by a low steady state level of viral replication and resulting low set-point
VL, continues for a number of years, which is clinically manifest as the latent phase
until virus-driven depletion of the CD4+ T cell population becomes profound and
progression to AIDS occurs (Levy, 2009).
Throughout this process, an immune response is mounted, which may confer some
control of the virus, but which also contributes to pathogenesis. An innate anti-viral
immune response is evident early post-infection, in production of acute-phase proteins
(Kramer et al., 2010) and an inflammatory cytokine storm (Stacey et al., 2009). This
response is thought to be generated by the responses of cells such as pDCs, which
may be able to detect HIV-1, unlike macrophages (Lepelley et al., 2011; Towers and
Noursadeghi, 2014). This innate response importantly includes production of type I
IFNs, which may confer some control of the virus in the acute phase (Towers and
Chapter 1 Introduction
57
Noursadeghi, 2014). This is evident in the observation that successful founder viruses
have low propensity to trigger type I IFN responses (Salazar-Gonzalez et al., 2009).
However, prolonged IFN signalling in HIV-1 infection is thought to contribute to disease
pathogenesis as a part of chronic immune activation (discussed subsequently in
section 1.3.6), as well as potentially contributing to immunosuppression and tolerance
of the virus (González-Navajas et al., 2012; Towers and Noursadeghi, 2014). Strong
evidence for this bimodal role of type I IFNs in mediating both protection and
pathogenesis in lentiviral disease is provided in the macaque model of SIV infection
(Sandler et al., 2014). HIV-1 specific T and B cell responses can also be measured in
vivo, with a particularly strong CD8+ T cell response evident (Cohen et al., 2011b). This
adaptive response contributes to the decline in viral load after the initial fast phase
(Haase, 2005), but fails to clear the virus. The replicative properties of HIV-1 make it
unusually adapted for immune escape, and so these responses are ineffectual in the
face of the constantly mutating viral quasispecies (Rambaut et al., 2004). Additionally,
like the innate response, they may contribute to disease progression, via contributing to
CD4+ depletion via cytotoxicity, and potential involvement in chronic immune activation
phenotypes (Levy, 2009).
1.3.6 Immune dysfunction in HIV-1 infection
The most apparent immune dysfunction in HIV-1 infection is the progressive loss
of CD4+ T cells. Several mechanisms have been suggested for how depletion occurs,
and concomitantly why and when AIDS develops as a result of this (Levy, 2009). Early
studies suggested that increased apoptosis was a major mechanism, and that
reduction in thymic output might also contribute to the decrease in circulating numbers
(Douek et al., 1998; Finkel et al., 1995; Meyaard et al., 1992). Recent investigations
have demonstrated that pyroptosis of abortively infected CD4+ T cells may account for
the majority of cell death caused by the virus, and that apoptosis may only occur in a
minority of productively infected cells (Doitsh et al., 2013, 2010). Pyroptosis is an
inherently inflammatory form of cell death driven by the inflammasome, which in this
case is triggered by the DNA sensor IFI16 detecting defective RT products in the T cell
cytosol (Monroe et al., 2014). This leads to IL-1β release as well as cell death, and so
the process may be propagated as inflammation attracts new target cells for infection
and depletion (Doitsh et al., 2013). In terms of how depletion leads to progression to
AIDS, a critical event may be loss of central memory CD4+ T cells which normally act
as a self-renewing source for effector memory CD4+ T cells, as has been shown in the
Chapter 1 Introduction
58
macaque SIV model (Okoye et al., 2007). As well as depletion, HIV-1 infection is
associated with changes in T cell function. These include gross alterations in the make-
up of T cell subsets and increased basal rates of T cell activation (Douek et al., 2009).
As ART can reverse these phenotypes, ongoing viral replication is implicated in their
mechanism; however, they have not been shown to correlate with disease progression,
and their contribution to pathogenesis is unclear (Douek et al., 2009).
In addition to its effects on the T cell compartment, HIV-1 is associated with other
aberrant immune phenotypes, which may contribute to pathogenesis and impact on the
function of CMI. The most striking of these is a state of chronic immune activation
present in HIV-1+ individuals throughout the slow phase of disease, characterised by
ongoing leukocyte activation and hypercytokinaemia (Douek et al., 2009). This process
correlates with disease progression and does not occur in long-term non progessors
(individuals who remain chronically infected without progression to AIDS) and so is
thought to be critical in pathogenesis (Deeks et al., 2004; Douek et al., 2009; Forsman
and Weiss, 2008). This is supported by the observation that pathogenic lentiviruses are
more likely to cause immune activation in their hosts than non-pathogenic lentiviruses
(Evans and Silvestri, 2013; Forsman and Weiss, 2008). The inflammatory processes
surrounding CD4+ depletion, as well as anti-HIV-1 immune responses, may contribute
to chronic immune activation (Douek et al., 2009). However, a specific mechanism
involving HIV-1-mediated disruption of the gut mucosa has been suggested to play a
role. The postulated process is as follows (Douek et al., 2009): massive loss of CD4+ T
cells in the GALT soon after infection causes immunodeficiency and inflammation
within the mucosa. This causes fibrosis and structural abnormalities, along with
dysbiosis of gut commensals. These combined immunological and structural insults to
this important barrier tissue allow the translocation of microbial products from the gut
flora into the bloodstream, activating innate immune cells and causing chronic immune
activation. Evidence for this model comes from high levels of circulating LPS measured
in HIV-1+ individuals and in the SIV macaque model, which correlate with measures of
immune activation (Brenchley et al., 2006).
Two consequences of chronic immune activation are suggested. Firstly, it may
contribute to CD4+ depletion, T cell dysfunction and viral replication (i.e. the processes
which drive progression to AIDS) by providing a source of activated T cells for the virus
to infect. This essentially establishes a vicious cycle, wherein viral replication leads to
gut pathology, which drives immune activation, which then potentiates viral replication,
etc (Douek et al., 2009). The second aberrant outcome is suggested to be the non-

Chapter 1 Introduction
59
AIDS-related chronic health complications observed in HIV-1+ individuals. Chronic
inflammation itself, and a hypercoagulable state produced by effects on the liver (Shen
and Frenkel, 2004), are both drivers of tissue damage which may cause these
conditions (Deeks et al., 2013). Immune activation may therefore be a major cause of
HIV-1-related disease which is not reversible by ART, as although ART does effectively
reduce immune activation, tissue damage as a result of chronic inflammation may have
already occurred (Douek et al., 2009).
Another aberrant HIV-1-associated immune phenotype is the immune reconstitution
inflammatory syndrome (IRIS), wherein after the commencement of ART there is a
severe inflammatory exacerbation or unmasking of an underlying condition, most
commonly TB, Cryptococcus neoformans infection or cytomegalovirus (CMV) retinitis,
but also other herpesvirus infections and neoplastic syndromes (Lai et al., 2013). IRIS
has a high incidence and mortality, which were estimated as 16% and 4.5%
respectively in a meta-analysis (Müller et al., 2010). The mechanisms which underlie
this pathology are not well understood. Although the term IRIS suggests that it results
from reconstitution of the immune system and a recovered CD4+ T cell count mediating
exacerbated inflammation, it is accepted that this explanation is too simple. Most
investigations exploring IRIS immunopathology have focussed on TB IRIS, which is
either considered to be paradoxical (worsening of TB symptoms after commencing
ARVs) or unmasking (presentation of TB after commencing ARVs) (Lai et al., 2013). In
these studies, various phenotypes have been associated with IRIS, such as T cell
expansions, hypercytokinaemia, innate dysfunctions and high rates of NK cell
activation (Table 1.7). A common mechanism for IRIS in different infections was
proposed by one study, in which expansions of polyfunctional (TNFα and IFNγ
secreting) memory CD4+ T cells were observed which were specific to the underlying
co-infection (Mahnke et al., 2012). Altogether, these observations may assist in
explaining the pathogenesis of IRIS, but they may also be phenomena resulting from
the disease process rather than precipitating it, and the underlying cause-and-effect
behind the syndrome is not yet clear (Chahroudi and Silvestri, 2012).
One suggested mechanism for IRIS, as well as for immune activation processes,
involves HIV-1-triggered dysfunction of innate inflammatory cells such as macrophages
(Lai et al., 2013). As macrophages are target cells for HIV-1, modulation of their
function by the virus represents another potential aberrant immune phenotype
associated with HIV-1. This is discussed subsequently in section 1.3.9.

Chapter 1 Introduction
60
The range of dysfunctional immune phenotypes found in HIV-1 infection are
summarised in Table 1.8, including observed dysfunction of B cells, NK cells,
neutrophils and pDCs (Fauci et al., 2005; Fitzgerald-Bocarsly and Jacobs, 2010;
Kuritzkes, 2000; Moir and Fauci, 2008). HIV-1 has been associated with dysfunction of
almost all components of the immune system in some context; however, cause-and-
effect for these phenotypes are not clear, and whilst some of these are likely to be
secondary to T cell dysfunction or chronic immune activation, conclusive evidence is
lacking for their mechanisms. It is clear that the disease caused by HIV-1 is not only an
immunodeficiency, but also an immunopathology, involving aberrant inflammatory
phenotypes which may contribute substantially to pathogenesis. Dysregulated CMI
responses could potentially result from many of these phenotypes; HIV-1 dyregulation
of macrophages, as key CMI effector cells, may be a major contributor in this regard.
TB IRIS-associated phenotype Reference
T cell-based
Expansions of PPD//Mtb-specific Th1 cells Bourgarit et al. (2006);
Elliott et al. (2008)
Increased activation of circulating T cells Antonelli et al. (2010)
Impaired T-regulatory cells Seddiki et al. (2009)
Increased numbers of TCR+ γδ T cells Bourgarit et al. (2009)
Cytokine dysregulation
Increased cytokine release in heat-killed Mtb-stimulated
IRIS patient PBMC & concomitant increased cytokines
in serum
Takodera et al. (2011)
Innate responses
Dysregulated complement component expression Tran et al. (2013)
High CRP expression Haddow et al. (2011)
High TLR-2 expression Tan et al. (2011)
High rates of NK cell activation Conradie et al. (2011)
High neutrophil counts and TNF at site of inflammation Marais et al. (2013)
Humoral responses
High expression of TB-specific anti-phenolic glycolipid
antibody
Simonney et al. (2008)
Table 1.7: Immune phenotypes associated with TB-IRIS.
Table produced from the mechanisms for TB IRIS reviewed in Lai et al. (2013). In the studies
presented, the comparator groups for TB IRIS patients include a range of controls (HIV-1
negative TB, HIV-1 non-IRIS TB, etc) and include both paradoxical and unmasking IRIS
presentations.

Chapter 1 Introduction
61
Immune phenotype Description Suggested mechanisms
CD4+ T cell depletion Depletion of CD4
+ T cells, which occurs
first in primary infection but then
recovers, then progressively decreases
over the clinically latent phase until
progression to AIDS.
Pyroptosis & apoptosis of infected
cells or bystander cells; killing by
HIV-1-specific CD8+ T cells;
impaired thymic function leading to
reduced T cell production
T cell dysfunction Gross alterations in T cell subset
makeup; high basal rates of activation
Driven by viral replication; may be
due to anti-HIV immune response,
or be part of immune activation
Gut pathology Preferential depletion of CD4+ T cells
in the GALT, inflammatory damage to
the gut epithelium, dysbiosis.
Commences early post-transmission
Depletion of CD4+ T cells as above,
which leads to inflammation,
damage & compromised immunity.
Chronic immune
activation
Chronic lymphocyte activation &
hypercytokinaemia throughout the
clinically latent phase of infection.
Translocation of microbial
components across the gut wall
leading to dysregulated innate
immune cell responses, as well as
anti-HIV immune responses and
inflammation resulting from CD4+
cytotoxicity
Chronic IFN signalling Elevated levels of type I IFN evidence
systemically throughout disease which
may be broadly immunosuppressive
Chronic anti-viral immune response
Macrophage
dysfunction
B cell dysfunction Hyperactivation and alterations in
subpopulation frequencies, and
decreases in memory B cell pools
Associated with chronic immune
activation and effects on T cell
compartment
NK cell dysfunction Increased expression of inhibitory
receptors, along with decreased
capacity for cytotoxic responses and
cytokine & chemokine production
Direct interactions of the virus with
NK cells, or resulting from chronic
immune activation
Neutrophil dysfunction Reduced numbers, increased
apoptosis, and deceased microbicidal
abilities
Bone marrow dysfunction,
treatment-related, aberrant cytokine
regulation
pDC dysfunction Chronic activation combined with
reductions in numbers and altered
functionality
Direct interactions of the virus with
pDCs, or resulting from chronic
immune activation
IRIS Clinical exacerbation or unmasking of
an infection or neoplasm after
commencement of HAART
See Table 1.7
See section 1.3.8
Table 1.8: Immune dysfunctions in HIV-1 infection
Table produced from mechanisms and references cited throughout section 1.3.6.

Chapter 1 Introduction
62
1.3.7 HIV-1-associated co-infections
The most apparent clinical manifestation of HIV-1 and AIDS are the co-
infections which result from immunodeficiency. In the early era of AIDS, fungal
Pneumocystis pneumonia (PCP) and neoplastic herpesvirus infection with Kaposi’s
sarcoma herpes virus (KSHV) were the most commonly observed conditions in the
USA (Jaffe et al., 1983). Other fungal co-infections are caused by C. neoformans
(Harrison, 2009) and Candida albicans (Imam et al., 1990), while infections with
herpesviruses other than KSHV, such as CMV and herpes simplex virus (HSV) are
also common (Jacobson et al., 1997; Siegal et al., 1981). Protozal co-infections are
caused by Cryptosporidium and Toxoplasma (Antinori et al., 2004; Pozio et al., 1997),
and invasive bacterial co-infections by non-typhoidal Salmonella spp. and S.
pneumoniae, among others (Noursadeghi et al., 2006a). Finally, mycobacterial
infections caused by both Mtb and non-tuberculous mycobacteria such as
Mycobacterium avium complex (MAC) organisms contribute a significant burden of co-
infections (De Cock et al., 1992; Karakousis et al., 2004).
Co-infections can be divided into two categories; those caused by pathogens
which do not commonly cause disease in immunocompetent hosts, such as
Pneumocystis, KSHV and Cryptococcus (typically designated as opportunistic
infections), and those caused by pathogens which cause a burden of disease in
healthy individuals, such as Mtb, HSV & CMV and bacterial infections. In the latter
category, HIV-1+ individuals may experience disease more frequently, more severely or
in atypical presentations compared to healthy individuals. The risk of different co-
infections varies with the degree of immunosuppression (shown in Table 1.7); typically,
infections termed opportunistic only present at very low CD4+ counts; this may be
because these infections are directly controlled by CD4+ T cells, or simply indicate that
CD4+ count is a powerful marker of disease progression. Risk of other conditions, such
as TB (non-disseminated) and invasive bacterial infection, are higher in all HIV-1+
individuals regardless of CD4+ count (Noursadeghi et al., 2006a; Sonnenberg et al.,
2005). This suggests that some inherent consequence of HIV-1 infection which is not
necessarily involved in disease progression may contribute to risk in these settings.
This is supported by the observation that risk of opportunistic infections decreases with
HAART (Kaplan et al., 2000), whereas increased risk of TB and invasive bacterial

Chapter 1 Introduction
63
infections persists in ARV-treated individuals (Gupta et al., 2012; Noursadeghi et al.,
2006a).
TB co-infection, in particular, causes a substantial burden of morbidity and
mortality in HIV-1+ individuals. Mtb is thought to be controlled by CMI (discussed in
section 1.4.3), and like HIV-1, parasitizes macrophages. The interaction between Mtb,
HIV-1 and macrophages may therefore be a key example of where dysregulation of
CMI contributes to risk of co-infection in HIV-1+ individuals, and this is discussed in the
following sections describing HIV-1 infection of macrophages, tuberculosis, and HIV-1-
associated TB.
Table 1.9: HIV-1 associated co-infections.
HIV-1+ group at risk Infections References
All HIV-1+ individuals Pulmonary TB, invasive bacterial
infections
Gupta et al. (2012);
Noursadeghi et al. (2006);
Sonnenberg et al. (2005);
Zumla et al. (2013)
CD4<200/mm3 KSHV, cryptosporidium, PCP, atypical
pulmonary or extrapulmonary TB
Crowe et al. (1994); Phair et
al. (1990); Zumla et al. (2013)
CD4<100/mm3 Disseminated MAC, HSV,
toxoplasmosis, cryptococcosis,
oesophageal candidiasis
Crowe et al. (1994); Chaisson
et al. (1992)
CD4<50/mm3 CMV retinitis, disseminated TB Crowe et al. (1994); von Reyn
et al. (2011); Zumla et al.
(2013)

Chapter 1 Introduction
64
1.3.8 HIV-1 infection of macrophages
All lentiviruses can infect cells of the macrophage lineage (Chapter 57, Fields
Virology, 5th ed, Knipe 2007), and HIV-1 is no exception. It was determined soon after
the isolation of HIV-1 that the virus could infect macrophages in vitro and in vivo
(Gartner et al., 1986a; Ho et al., 1986), an infection which is permissible due to
macrophage expression of CD4 and the chemokine receptor CCR5, as well as the
ability of HIV-1 to evade innate immune detection in these cells (Towers and
Noursadeghi, 2014). HIV-1 infection of macrophages is productive but not cytopathic
(Cassol et al., 2006), and has been shown to occur in vivo in tissue macrophages (Cao
et al., 1992; Jambo et al., 2014; Jarry et al., 1990; Koenig et al., 1986). Infection of
monocytes in vivo is shown to be much less frequent (Spear et al., 1990) reflecting
their lower expression of the CCR5 co-receptor (Naif et al., 1998; Tuttle et al., 1998).
DCs are thought to be resistant to infection by HIV-1 in vivo, in part because of their
lower expression of CD4 and CCR5 (Luban, 2012), but also due to expression of the
restriction factor SAMHD1 (Laguette et al., 2011). Macrophage tropism may also be
modulated by SAMHD1 restriction to some extent (Sunseri et al., 2011), and it is
possible that macrophage-tropic HIV-1 strains have evolved to specifically avoid this
restriction pathway (Towers and Noursadeghi, 2014).
Infection of macrophages by HIV-1 may be important for a number of reasons.
Production of virus by macrophages may contribute considerably to viral production
and burden, even if they are only infected at low levels (Eckstein et al., 2001).
Macrophages may be infected early post-transmission, due to the fact that they are
present at the initial site of infection in the mucosa (Margolis and Shattock, 2006)
coupled with the preferential transmission of R5-tropic virus, which can infect
macrophages (Zhu et al., 1993), although the observation that MDMs are poorly
permissive in vitro to founder viruses means their role in early infection is not yet
clarified (Li et al., 2010; Salazar-Gonzalez et al., 2009). Later in disease, macrophages
form a long-lived reservoir of virus, capable of infecting CD4+ T cells (Groot et al.,
2008). This reservoir might be a privileged site in which the virus evades the immune
system, in light of findings that virions are protected from neutralizing antibodies in
macrophage intracellular compartments (Koppensteiner et al., 2012). Due to their
relatively long life-spans, any consequences of macrophage infection are likely to be
prolonged, and this covert reservoir may persist after HAART (Stevenson, 2003). It has

Chapter 1 Introduction
65
recently been reported that cell-to-cell spread of virus can continue after HAART (Sigal
et al., 2011), which highlights the potential significance of this reservoir in HIV-1
persistence. Infection of macrophages might also contribute to HIV-1 pathology by
causing bystander apoptosis of T cells (Badley et al., 2000) and neurons (Kaul et al.,
2001), which may be due to increased expression of death receptor ligands such as
Fas ligand on infected macrophages (Dockrell et al., 1998). Furthermore, it has been
reported that macrophages harboring HIV-1 infection have altered functionality in a
number of ways which may contribute to immunopathogenesis, discussed
subsequently in section 1.3.9.
In addition to evidence demonstrating that HIV-1 infection of macrophages
occurs in vivo and has functional consequences, a broader perspective on the
significance of HIV-1 macrophage tropism exists. It is clear that infection of CD4+ T
cells is a central feature of HIV-1 pathogenesis, as this is the compartment wherein the
vast majority of viral replication takes place in vivo (Towers and Noursadeghi, 2014).
However, this infection is often abortive and cytopathic (Doitsh et al., 2013, 2010),
whereas the virus appears to be more highly adapted to macrophages as a host cell, in
which it does not trigger cell death or an IFN response and establishes a productive
infection (Cassol et al., 2006; Tsang et al., 2009). As such, it has been proposed that
the virus has specifically evolved to establish this quiet but productive infection in
macrophages, suggesting that they may be a critical host cell for HIV-1 to maximise its
own replication or persistence in some context (Towers and Noursadeghi, 2014).
Evidence from other animals also indicates that macrophages can drive
lentiviral pathogenesis. Visna-maedi virus (VMV), which infects sheep, and caprine
arthritis encephalitis virus (CAEV), which infects goats, are both retroviruses of the
genus Lentivirus, like HIV-1 (Blacklaws, 2012). They present clinically as slowly
progressing inflammatory conditions: VMV is characterised by chronic pulmonary
inflammation, a wasting syndrome and neurological disease (Sigurdardottir and
Thormar, 1964; Thormar, 2013), while CAEV presents with inflammatory arthritis and
neurological disease (Narayan and Cork, 1985). Importantly, VMV and CAEV do not
infect lymphocytes, but only cells of the monocyte/macrophage lineage (Anderson et
al., 1983; Blacklaws, 2012; Narayan et al., 1982), suggesting that the inflammatory
disease processes are purely driven by infection of these cells. Although their clinical
courses are clearly distinct from HIV-1, it is speculated that shared clinical features
(wasting and neurological involvement) may also be driven by macrophage infection in
HIV-1 infection (Forsman and Weiss, 2008). These conditions also provide a proof of
Chapter 1 Introduction
66
principal, in terms of infected macrophages contributing to disease in lentiviral
pathogenesis.
1.3.9 Modulation of macrophages by HIV-1
Due to the role of macrophages as key immune sentinel and effector cells
(section 1.2.5–1.2.9), there has been considerable interest in assessing whether these
functions are disrupted by HIV-1 infection, as this has the potential to contribute to HIV-
1-associated immunopathogenesis (Noursadeghi et al., 2006a). Various investigations
have been made into the function of MDMs and ex vivo tissue macrophages from HIV-
1+ individuals, reporting a range of phenotypes, such as impaired phagocytosis
(Chaturvedi et al., 1995; Koziel et al., 1998; Torre et al., 2002; Wehle et al., 1993);
conserved phagocytosis (Elssner et al., 2004; Gordon et al., 2001); impaired cytokine
release (Gordon et al., 2005; Nicol et al., 2008; Tachado et al., 2005); increased
cytokine release (Gordon et al., 2007; Millar et al., 1991; Trentin et al., 1992); and
impaired apoptosis (Patel et al., 2009). However, as the burden of infection in
monocytes and macrophages in vivo is not uniform, it is likely that many of the cells in
these studies were not actually HIV-1-infected, and so it is difficult to assess whether
these phenotypes are directly caused by the virus or result from indirect effects of the
virus on the host immune response (Noursadeghi et al., 2006a).
Other studies have used in vitro models of HIV-1 infection in MDMs, ex vivo
AMs or macrophage cell lines, to establish more conclusively that observed
phenotypes result from HIV-1 infection. The range of described phenotypes is
summarised in Table 1.10, and include effects on phagocytosis, microbicidal killing,
autophagy, inflammatory responses and apoptosis. These phenotypes have the
potential to contribute to disease, particularly in the context of opportunistic infections.
However, due to the range of models used (different time-points, methods of MDM
differentiation, HIV-1 strains used, etc), it is challenging to draw many overarching
conclusions from this body of work. Identifying mechanisms for phenotypes in terms of
their HIV-1 determinants may lend confidence; for example, it is reported that some
inhibitory effects on phagocytosis are Nef-dependent (Mazzolini et al., 2010).
Corroboration of phenotypes in vivo is also likely to be an important step in determining
whether they contribute to disease, and recently developed methods for quantifying
HIV-1 infection in ex vivo AMs from HIV-1+ individuals has allowed specific assessment
of their phagocytic function (Jambo et al., 2014).

Chapter 1 Introduction
67
Effects of HIV-1 accessory proteins in modulating signalling pathways involved
in innate immunity have also been described, which could potentially contribute to HIV-
1 dysregulation of macrophages; these include inhibition of NFκB signalling by Vpu and
Vpr (Bour et al., 2001; Muthumani et al., 2005), and multifaceted effects on signalling
and receptor expression by Nef (Aiken et al., 1994; Tachado et al., 2005; Vigerust et al.,
2005). However, these effects have mainly been described in cell lines or in T cells,
and their relevance to macrophage function, innate immune responses and particular
HIV-1-dysregulated phenotypes remains to be assessed.
As it has been shown in two independent assessments that HIV-1 does not
modulate the baseline transcriptome of macrophages (Maddocks et al., 2009;
Noursadeghi et al., 2009), and it is known that it does not trigger innate immunity or
cause baseline cytotoxicity in these cells (Cassol et al., 2006; Rasaiyaah et al., 2013),
effects of the virus are likely to be evident in altered innate immune responses, rather
than in changes in resting activity. A hypothesis for why the virus might act to alter
innate immune signalling in macrophages is presented by the observation that these
pathways can modulate HIV-1 replication via effects on viral transcription (Chen et al.,
1997; Perkins et al., 1994, 1993; Williams et al., 2007). Therefore, it is possible that
HIV-1 may have evolved to modulate inflammatory pathways to maximise its own
replication; further evidence for this comes from studies using HIV-1/Mtb co-infected
macrophages, discussed subsequently in section 1.4.5.
Clearly, if HIV-1 modulates macrophage function in vivo in the ways it has been
described to in vitro, this may contribute to immune dysfunction in HIV-1 infection, and
in particular affect CMI pathways in which macrophage function is integral. One
scenario in which this would be likely to contribute is in TB, as CMI is critical in control
and pathogenesis of Mtb, for which macrophages also act as host cells.

Chapter 1 Introduction
68
Phenotype Experimental model Reference
Uptake and microbicidal killing
Increased intracellular growth of
Mycobacterium avium
MDM infected with full-length HIV-1 Kallenius et al. (1992)
Impaired phagocytosis of Candida
albicans
MDM infected with full-length HIV-1 Crowe et al. (1994)
Impaired phagocytosis and killing of
Toxoplasma gondii
MDM infected with full-length HIV-1 Biggs et al. (1995)
Impaired phagosome-lysosome fusion MDM infected with full-length HIV-1
or treated with gp120
Moorjani et al. (1996)
Impaired killing of Cryptococcus
neoformans
Ex vivo AMs infected with full-length
HIV-1
Ieong et al. (2000)
Increased intracellular growth of Mtb MDM infected with full-length HIV-1 Imperiali et al. (2001)
Impaired complement-mediated
phagocytosis
MDM infected with full-length HIV-1 Azzam et al. (2006)
Impaired intracellular killing of Leishmania MDM infected with full-length HIV-1 Barreto-de-Souza et al.
(2006)
Impaired FcR-mediated phagocytosis MDM infected with full-length HIV-1 Leeansyah et al. (2007)
Interaction with autophagy pathways MDM infected with full-length HIV-1 Kyei et al. (2009)
Impaired phagocytosis due to
perturbations in endosomal remodelling
MDM infected with full-length HIV-1 Mazzolini et al. (2010)
Increased intracellular growth of
mycobacteria
MDM infected with full-length HIV-1 Pathak et al. (2010)
Impaired phagocytosis Ex vivo small AMs from HIV-1+
individuals confirmed to be infected
with HIV-1 by FiSH
Jambo et al. (2014)
Inflammatory responses
Impaired LPS-induced MAP kinase
activation, NFκB binding to the IL-12p40
promoter & IL-12 production
Macrophage cell line infected with
full-length HIV-1
Chambers et al. (2004)
Reduction in co-stimulatory molecule
expression
MDM treated with HIV-1 Vpr Muthumani et al. (2005)
Reduction in mannose receptor expression MDM expressing HIV-1 Nef Vigerust et al. (2005)
Impaired LPS-induced TNFα release Macrophage cell line harbouring HIV-
1 provirus
Tachado et al. (2005);
Nicol et al. (2008)
Impairment of TNFα release and apoptosis
in response to Mtb
Macrophage cell line harbouring HIV-
1 provirus and ex vivo AMs infected
with HIV-1
Patel et al. (2007)
Attenuation of classical NFκB signalling
but broadly preserved downstream
transcriptional response
MDM infected with full-length HIV-1 Noursadeghi et al. (2009)
Increased pro-inflammatory cytokine
production in response to Mtb
MDM infected with full-length HIV-1 Pathak et al. (2010)
Activation of the inflammasome leading to
IL-1β and IL-18 production
MDM cultured with plasma from
viraemic HIV-1+ patients
Chattergoon et al. (2014)
Table 1.10: Reported effects of HIV-1 on macrophage innate immune responses.

Chapter 1 Introduction
69
1.4 Tuberculosis
1.4.1 Epidemiology, clinical course and treatment of TB
TB, the disease caused by Mtb, has been present in human populations for at
least 2000 years (Russell, 2007; Zink et al., 2003). Advances in public health and
antibiotic therapy throughout the 20th century reduced the mortality attributed to TB
(Lawn and Zumla, 2011), but the global burden of TB disease remains substantial. In
2012, 8.6 million new cases of TB occurred worldwide, and 1.3 million deaths were
attributed to the disease (WHO, 2013b). This burden is disproportionately found in low-
and middle-income countries, but high TB incidence is also observed in urban centres
in some high-income countries, including the UK (Abubakar et al., 2011; Hayward et al.,
2003). The global distribution of the TB pandemic is co-incident with the HIV-1
pandemic, leading to a huge burden of morbidity and mortality associated with TB/HIV-
1 co-infection in sub-Saharan Africa (Lawn and Churchyard, 2009).
Current estimates suggest that approximately 10% of individuals exposed to
Mtb will develop active TB in their lifetime, whereas the remaining 90% either contain
the pathogen as a latent infection, or potentially clear the infection, although the latter
scenario may be difficult to conclusively prove (O’Garra et al., 2013). Two billion
individuals worldwide are estimated to have latent TB (Zumla et al., 2013). Within the
10% of exposed individuals who develop active TB, half are estimated to do so within
18 months of exposure; designated as primary progressive disease (Zumla et al.,
2013). The remainder initially contain the infection latently, and then go on to develop
active disease due to reactivation (Zumla et al., 2013).
Mtb transmission occurs via the respiratory route, and the majority of TB
disease is pulmonary, with archetypal symptoms including cough, increased sputum
production, fever, weight loss, night sweats and haemoptysis (Zumla et al., 2013),
along with pulmonary features evident on chest X-ray such as lung lesion cavitation
and thoracic lymphadenopathy (O’Garra et al., 2013). Extra-pulmonary presentations
of TB are also relatively common, enumerating 10-42% of patients depending on the
at-risk group. The manifestations of extra-pulmonary disease can be extremely varied
and preclude simple diagnosis; in fact, diagnosis of TB is often challenging, due to
sharing of cardinal clinical features with other diseases such as sarcoidosis and cancer
(O’Garra et al., 2013). Microbiological confirmation forms the backbone of diagnosis,

Chapter 1 Introduction
70
although the challenges inherent in culturing the bacterium also present difficulties
(Lawn and Zumla, 2011; Zumla et al., 2013).
Current standard care for drug-sensitive active TB is quadruple antibiotic
therapy with isoniazid, rifampin, ethambutol, and pyrazinamide (Zumla et al., 2013).
The emergence of multi-drug resistant (MDR)-TB, enumerating approximately 5% of
cases annually (WHO, 2013b), has meant that an additional 17 anti-microbial agents
are used therapeutically (Zumla et al., 2013). Immunotherapy for TB has previously
been evaluated, but has not been cemented as a therapeutic option, with a need for
further assessment in randomised controlled trials (Uhlin et al., 2012). Treatment
targeting active TB immunopathology is commonly used in one context, wherein
corticosteroids are used as adjunctive treatment for TB meningitis (Thwaites et al.,
2004). Increasing interest in host-directed immunotherapy exists, after it was
demonstrated that the outcome of corticosteroid therapy in TB meningitis was
dependent on host genotype (Tobin et al., 2012).
The bacilli Calmette-Guerin (BCG) vaccine for TB has been available for nearly
100 years, but its efficacy varies between groups and wanes over time (Lawn & Zumla
2011). It may be effective in preventing disseminated disease in infants, but its value is
limited in preventing adult pulmonary infection (Colditz et al., 1994; Trunz et al., 2006).
The first TB vaccine efficacy trial since BCG, which tested the vaccine-modified
Vaccinia virus Ankara expressing antigen 85A (MVA85A), reported no protective effect
after promising results in pre-clinical studies (Tameris et al., 2013). When considering
the complexity of the immune response to Mtb, in that immunocompetent individuals
with latent TB develop an immune response which is protective in preventing active
disease, but the development of active TB in other individuals involves an immune
response which causes immunopathology (discussed in section 1.4.3), the challenges
are clear for developing a vaccine which can induce an immune response with this
critical balance between protection and pathogenesis (Andersen and Woodworth,
2014).

Chapter 1 Introduction
71
1.4.2 Mtb and parasitism of macrophages
In 1882, Robert Koch identified the infective aetiological agent of tuberculosis, the
tubercle bacillus, by staining fine rod-like bacilli in tuberculous material from infected
animals (Sakula, 1982). This agent, known now as Mycobacterium tuberculosis, is an
aerobic, acid-fast, non-motile, unencapsulated bacterium which replicates slowly and
has a lipid-rich cell wall characteristic of mycobacteria (Lawn and Zumla, 2011). Mtb is
a facultative intracellular pathogen, and its primary host cell is the macrophage
(Russell et al., 2010). Macrophage uptake of Mtb is the initial host-pathogen interaction
that occurs after aerosol Mtb transmission, when alveolar macrophages internalise
inhaled bacilli (Russell et al., 2010). This occurs by phagocytosis mediated via
receptors such as scavenger, complement and mannose receptors (Schäfer et al.,
2009). This host-driven process is rapidly hijacked by the pathogen: Mtb arrests
maturation of the phagosome, hence preventing early macrophage-mediated killing
and limiting the hostility of the intracellular environment (Russell, 2007).
Mtb then persists within the early endosomal system in macrophages, wherein it
can access nutrients for growth (Russell et al., 2010). Despite phagosome arrest,
macrophage activation can deliver Mtb to bactericidal environments and lead to killing
(Russell, 2007). In humans, autophagy pathways may be critical for this process, in
which arrested phagosomes are targeted via the autophagosome to acidified
lysosomes, wherein the bacterium can be degraded by acidification, antimicrobial
peptides and hydrolases (Alonso et al., 2007; Gutierrez et al., 2004; Russell et al.,
2010). Activation of macrophages by TLR ligands and IFNγ may activate or enhance
autophagy (Delgado et al., 2008; Singh et al., 2006). The importance of intracellular
killing of Mtb in human macrophages is also demonstrated by the association of CGD
(in which NADPH oxidase mutations lead to impaired respiratory burst killing in
phagocytes) and predisposition to TB (Bustamante et al., 2011; Lee et al., 2008).
Mtb parasitism of macrophages may cause cell death, and it is apparent that
macrophage cell death occurs in TB pathogenesis, as dead or dying macrophages are
observed in vivo within granulomata (Ramakrishnan, 2012). However, the contribution
of different cell death pathways to this remains ill-defined. Some evidence indicates
that Mtb is anti-apoptotic in macrophages, diverting the cell to death by necrosis (Gan
et al., 2008), and that this process is associated with virulence (Velmurugan et al.,

Chapter 1 Introduction
72
2007). Mtb may also directly induce necrosis (Divangahi et al., 2009). Conversely,
some reports show that Mtb and other mycobacteria promote macrophage apoptosis
(Davis and Ramakrishnan, 2009; Keane et al., 1997). Which of these pathways is more
advantageous for the bacterium is not clear. Necrosis may confer more benefit, as
uncontrolled intracellular replication followed by cell lysis promotes extracellular
propagation of high bacillary loads, whereas apoptosis may be a form of innate
defence and reduce Mtb viability (Behar et al., 2011; Keane et al., 2000). However,
apoptosis has been shown to facilitate transmission to new host macrophages as a
result of phagocytosis of apoptotic fragments containing viable bacilli (Davis and
Ramakrishnan, 2009). The association between active TB and necrotic phenotypes in
granulomata (Ramakrishnan, 2012) suggests that necrosis may be a particularly host-
detrimental process.
1.4.3 TB pathogenesis and the immune response
It is known that the immune system, and in particular CMI, is important in
protection against TB. Many known TB risk factors demonstrate the importance of CMI
in protecting against TB disease. Firstly, the existence of MSMD conditions, in which
patients have genetic mutations in CMI effectors such as IFNγ, the IFNγ receptor and
IL-12 (see table 1.1). Although these conditions have mainly been described to confer
susceptibility to less virulent non-tuberculous mycobacteria, they have also been
shown to be associated with severe tuberculosis in some patients with mutations in IL-
12p40, IL-12Rβ1 and IFNGR1 (Abel et al., 2014; Boisson-Dupuis et al., 2011; de
Beaucoudrey et al., 2010; Dorman et al., 2004; Picard et al., 2002; Sasaki et al., 2002).
Thus, MSDM highlights the importance of these effectors of CMI in the response to TB.
Further evidence is provided by some polymorphisms in genes related to CMI
components which are associated with increased TB risk, such as IL12B1, IFNG and
MBL (Lawn and Zumla, 2011; Maartens and Wilkinson, 2007).
Some iatrogenic TB risk factors also demonstrate the protective role of the
immune response in TB, such as the increased risk of active TB in patients on anti-
TNFα antibody therapy (Keane et al., 2001) or corticosteroids (Lawn and Zumla, 2011).
However, the most clear example of immune dysfunction increasing TB risk is
observed in HIV-1 infection, which is the strongest single risk factor for active TB
(Walker et al., 2013). As HIV-1 is characterised by immune defects, this strongly
indicates that alterations in the immune response impact on both TB risk and the
natural history of the condition, and so in some capacity the immune response must be

Chapter 1 Introduction
73
protective. However, it is also clear that we do not yet understand the correlates of
immune protection in TB, and precisely what components of immunity mediate
protection (O’Garra et al., 2013). This is complicated by the fact that the pathogenesis
of TB disease is driven by the immune response; the hallmark of disease is the
caseating granuloma, a classic focus of CMI (Dannenberg, 1994; Dannenberg et al.,
1968), and immune-mediated tissue destruction is strongly implicated in active disease
(Elkington et al., 2011).
The archetypal drivers of CMI, Th1-polarised CD4+ T cells, are suggested to be
necessary for protection against Mtb, due to studies of their deficiency in mouse
models (Leveton et al., 1989) and their depletion in HIV-1+ individuals. However,
whether they are sufficient for protection is unclear, and the effector functions they
utilise to mediate this protection are not defined (Sakai et al., 2014). For example, the
contribution of IFNγ production by CD4+ T cells is unclear, as it has not been found to
correlate with BCG-induced immune protection against Mtb (Kagina et al., 2010), and
protection mediated by CD4+ T cells was independent of IFNγ in a mouse model
(Gallegos et al., 2011). IFNγ may also be produced by cytotoxic CD8+ T cells, and this
may contribute to protection (Tascon et al., 1998). Overall, the relative contributions of
CD4+ and CD8+ T cells to anti-mycobacterial immunity via CMI remain unclear. The
fact that most individuals exposed to TB, including those with active disease, develop a
TB-specific Th1 response as evidenced by positive IFNγ release assays (IGRAs) and
tuberculin skin tests (TSTs) also demonstrates that although a Th1 response is
necessary for protection against TB due to risk factors as discussed above, it is not
sufficient for protection, as active disease occurs in its presence.
This has raised the question of what other immune components contribute to
protection. A range of cytokine signalling axes which can modulate the function of CMI
have been implicated in this. An overarching theme is observed with regard to these
cytokines modulating CMI to produce a balanced inflammatory response which can
induce protection without immunopathogenesis. This is exemplified by investigations
into the role of TNFα in the zebrafish M. marinum model, in which it is demonstrated
that either too little or too much production of TNFα can drive disease, whereas the
“just-right” amount of TNFα is protective (Roca and Ramakrishnan, 2013; Tobin et al.,
2012) – a so-called “Goldilocks effect” (Andersen and Woodworth, 2014). The
downstream effects of either low or high TNFα result in macrophage necrosis and
uncontrolled extracellular replication of bacteria (Roca and Ramakrishnan, 2013), and

Chapter 1 Introduction
74
the potential relevance of this phenotype to human TB has been confirmed via genetic
studies of homologues of implicated factors (Tobin et al., 2012).
TNFα dysregulation in this zebrafish model is caused by various eicosanoid lipid
mediators (Tobin et al., 2012). The anti-mycobacterial functions of the cytokine IL-1β
(Fremond et al., 2007) have also been shown to be mediated by eicosanoid induction.
Again, counter-regulation of pro- and anti-inflammatory pathways is found to be key in
this mechanism, as these lipid mediators act by limiting the anti-inflammatory effects of
another group of cytokines, type I IFNs (Mayer-Barber et al., 2014). Signatures of type
I IFN responses, and by implication their immunosuppressive functions (Guarda et al.,
2011; Reboldi et al., 2014), have been described to distinguish active TB from latent
controlled infection in peripheral blood gene expression profiles (Berry et al., 2010),
lending support to the hypothesis that they are host-detrimental in mycobacterial
infection (Teles et al., 2013). In this regard, they have been strongly associated with
the anti-inflammatory cytokine IL-10 and are suggested to induce its expression (Teles
et al., 2013), although this is yet to be conclusively demonstrated. The role of IL-10 in
the response to tuberculosis is a matter of some investigation and is discussed
subsequently in section 1.5.4.
Overall, these investigations have begun to describe a system in which the
protective immune response to Mtb involves a CMI response driven by CD4+ T cells
and IFNγ, in the context of a cytokine and lipid mediator mileu which appropriately
regulates the burden of inflammation caused by this response, while also ensuring it
can mediate protection against the pathogen – a balanced inflammatory response.
Dysfunction of CMI, due to deficiency or aberrant immunoregulation, is then suggested
to lead to active TB, by disrupting this balance with consequences for bacterial growth
and immunopathology.
Studies of the site of TB disease in granulomata have lent support to this
concept. The granuloma is driven by CMI, and is implicated in both containment of Mtb
and in immunopathology (Russell et al., 2009). Contexts in which well-formed
granuloma are not generated are associated with severe disseminated TB, such as in
immunosuppressed HIV-1+ individuals (Lawn and Zumla, 2011), or TNFα-deficient
mouse models (Bean et al., 1999), showing that the CMI response in TB granuloma
can contribute to protection. However, inappropriate inflammation, such as that causing
macrophage cell death by necrosis (Roca and Ramakrishnan, 2013) may lead to
instability of the granuloma and thus compromise protection; clinical observations
Chapter 1 Introduction
75
indicate that necrosis and liquefaction in granulomata are associated with active TB
(Ramakrishnan, 2012). Dysregulated inflammation at the site of disease may also
contribute to tissue destruction and cavitation, for example by production of matrix
metalloproteinases (Elkington et al., 2011).
Studies in the macaque Mtb infection model have also demonstrated that the
CMI response in granulomata can contribute to active disease, by demonstrating the
heterogeneity of granulomata in vivo. Animals with both latent and active infection were
shown to have a spectrum of lesion types, from healed fibrous sterile lesions, to
caseating lesions with high bacillary burdens (Lin et al., 2014, 2009). However, in
animals with active disease, there were more caseating granulomata with extensive
tissue pathology (Lin et al., 2014). This indicated that the granulomatous CMI response
had the potential to contain bacteria and sterilize sites of disease in all animals, but that
stochastic degenerative events in individual granulomata caused some animals to
develop active disease.
It can be assumed that the nature of the immune response contributes to these
stochastic determinants of granuloma degeneration, and resulting active disease, and
that risk factors such as HIV-1 which dysregulate CMI increase the likelihood that the
immune response at the site of TB disease will not be appropriately balanced to
mediate microbial killing without exacerbated inflammation. Considering the nature of
TB disease in HIV-1+ individuals lends support to this, as the natural history of TB is
drastically altered by HIV-1 co-infection.
1.4.4 HIV-1 and TB
TB co-infection is the leading cause of death in HIV-1+ individuals (UNAIDS,
2013). Globally, the incidence of active TB in HIV-1+ individuals is approximately twenty
times greater than in HIV-1− individuals (Lawn and Churchyard, 2009), and risk is
increased in all HIV-1+ patients, including those with preserved CD4+ counts
(Sonnenberg et al., 2005). HIV-1 co-infection severely alters the natural history of TB.
Although HIV-1+ individuals with preserved CD4+ counts may present with typical
pulmonary TB, those with CD4+ counts of less than 200/mm3 often have atypical
presentations of pulmonary TB and extra-pulmonary manifestations (Zumla et al.,
2013). Individuals with severely depleted CD4+ counts (<50/mm3) often present with
disseminated TB disease, characterised by a non-specific febrile illness with

Chapter 1 Introduction
76
widespread organ involvement and mycobacteraemia (Domoua et al., 1995; Elliott et
al., 1993; Gilks et al., 1990; von Reyn et al., 2011).
In addition to aberrant clinical phenotypes, the underlying pathology of TB may
be altered in HIV-1+ individuals. Radiological features of pulmonary TB have been
reported to be different, with less consolidation, apical involvement and
bronchopulmonary spread, but higher rates of pleural effusions and lymphadenopathy
(Lawn et al., 1999). Tissue pathology studies have also described altered phenotypes,
particularly in severely immunosuppressed patients where granulomata are often
absent or poorly formed (Lawn and Zumla, 2011). Other observations from the site of
disease in HIV-1+ individuals, when compared to HIV-1− individuals, have shown
increased granuloma necrosis and polymorphonuclear cell infiltration (de Noronha et
al., 2008); increased TNFα levels and necrosis in pleural granulomata (Bezuidenhout
et al., 2009); increased rates of apoptosis in cells from pleural fluid (Hirsch et al.,
2001); and a paucity of inflammation accompanied by many extracellular bacilli in
tuberculous lymphadenitis biopsies (Nambuya et al., 1988). Although TB tissue
pathology may not be atypical in relatively immunocompetent HIV-1+ individuals
(Walker et al., 2013), there is clearly a spectrum of pathology associated with HIV-1
that illustrates potent dysregulation of anti-mycobacterial immune responses by the
virus.
This poses the question of which of the immune responses that are affected by
HIV-1 mediate these effects on TB natural history? CD4+ depletion does correlate with
increased rates of atypical TB presentation (Zumla et al., 2013), and the extent of initial
CD4+ depletion by SIV correlates with the time to TB reactivation in the macaque
model of SIV/TB co-infection (Diedrich et al., 2010; Mattila et al., 2011). Low numbers
of CD4+ cells are observed at the site of disease in HIV-1+ patients, indicating that
systemic depletion does translate into differences in in situ CMI responses (Law et al.,
1996). Additionally, Mtb-specific T cells may be preferentially depleted by HIV-1 due to
their higher CCR5 expression, meaning that TB risk would be hypersensitive to CD4+
loss (Geldmacher et al., 2012, 2010).
However, the increased risk of TB in HIV-1+ individuals before CD4+ depletion
has strongly indicated that other changes in immune function may also contribute to
disease risk. One hypothesis is that T cell function is altered in a way that
compromises TB protection (O’Garra et al., 2013), and investigations have shown that
the frequency of polyfunctional mycobacteria-specific T cells (i.e. those producing

Chapter 1 Introduction
77
IFNγ, TNFα and IL-2) are lower in the lungs of HIV-1+ individuals compared to healthy
individuals, although this study was not performed in patients with active TB (Kalsdorf
et al., 2009). Another report in HIV-1+ individuals with ongoing active TB showed
increased numbers of polyfunctional T cells at the site of disease (Matthews et al.,
2012), and no consensus has yet emerged about the contribution of T cell functionality.
An alternative hypothesis is that dysfunction of HIV-1-infected macrophages
contributes to increased TB risk, and this is further discussed in section 1.4.5. Other
proposed mechanisms include dysregulation of MMPs in HIV-1+ individuals causing
tissue damage, although observations that MMP levels are lower in the sputum of HIV-
1+ active TB patients do not support this suggestion (Walker et al., 2012). Finally, the
increased rates of HIV-1 replication which are observed at the site of TB disease (Lawn
et al., 2001; Nakata et al., 1997) has suggested that a direct effect of viral replication in
situ may exacerbate immunopathology (Diedrich and Flynn, 2011), although the
mechanisms by which this would compromise control are unclear.
No all-encompassing theory of how HIV increases TB risk has yet emerged. It is
likely that several factors contribute to this interaction (Diedrich and Flynn, 2011), and
the diversity of clinical presentations & pathology observed in HIV-1/TB co-infection
may reflect the diverse effects of HIV-1 on the immune response (Walker et al., 2013).
The fact that HIV-1 is the strongest known risk factor for TB suggests that the parts of
the immune system which are dysregulated by HIV-1, including those involved in
mediating CMI, are essential for protection against active TB. Increased understanding
of how HIV-1 modulates CMI is therefore critical for understanding HIV-1/TB co-
infection pathogenesis. The role of macrophages, as a host cell for both HIV-1 and Mtb
infection, may be critical in this.
1.4.5 Macrophages, HIV-1 and Mtb
Both HIV-1 and Mtb parasitize macrophages in vivo as a niche for growth and
persistence which may contribute to disease. It is possible that co-infection of
macrophages by both pathogens may take place in vivo, particularly in the respiratory
tract wherein both may infect AMs. This has posed the question of whether the
increased risk of TB in HIV-1+ individuals may result from dysregulation of
macrophage/Mtb interactions by HIV-1 co-infection. As discussed in section 1.3.9,
HIV-1 infection of macrophages may result in a range of dysregulated phenotypes,
including some involving Mtb. These include increased intracellular growth of Mtb in

Chapter 1 Introduction
78
HIV-1 infected MDMs (Imperiali et al., 2001; Pathak et al., 2010), which may be due to
effects of HIV-1 on autophagic pathways which are critical in macrophage control of TB
(Gutierrez et al., 2004; Kyei et al., 2009). Exaggerated pro-inflammatory responses and
dysregulation of apoptosis have also been reported in HIV-1/Mtb co-infected
macrophages (Patel et al., 2007; Pathak et al., 2010).
HIV-1 replication is also reported to be modulated in co-infected macrophages,
although there has been some controversy about whether Mtb promotes viral
replication (Honda et al., 1998; Hoshino et al., 2004, 2002; Toossi et al., 1997) or
inhibits it (Goletti et al., 2004; Weiden et al., 2000). Reports from sites of TB disease in
vivo in co-infected individuals have shown high levels of HIV-1 (Collins et al., 2002b;
Lawn et al., 2001; Nakata et al., 1997), and a mechanism involving Mtb activation of
the transcription factor NFAT and subsequent transactivation of the HIV-1 LTR has
been described (Ranjbar et al., 2012); these observations support the concept that
HIV-1 replication increases in co-infected macrophages, although this is likely to vary
with temporal and Mtb-strain-specific conditions (Ranjbar et al., 2009).
Previous work in our group has investigated the consequences of HIV-1/Mtb
co-infection of macrophages, using a well-characterised in vitro MDM model in which
confluent HIV-1 infection can be established (Noursadeghi et al., 2009). This work has
found that expression of the anti-inflammatory cytokine IL-10 in response to Mtb is
attenuated in HIV-1 infected macrophages, potentially as a result of attenuated
signalling through MAP kinase pathways (Tomlinson et al., 2014) – a previously
unreported phenotype. This deficiency in IL-10 was associated with exaggerated and
sustained pro-inflammatory macrophage responses to Mtb. These in vitro data were
mirrored by identification of lower levels of IL-10 and higher levels of pro-inflammatory
IL1 in respiratory samples from HIV-1 infected patients with pulmonary TB in
comparison to non-tuberculous respiratory infections, suggesting that the same
immunological phenotype may occur in vivo.
Attenuation of IL-10 by HIV-1 might be caused by a novel host/virus interaction
affecting common macrophage IL-10 induction pathways, and so this observation
might also be applicable in responses to other co-infecting pathogens. IL-10 is known
to have a range of potent immunomodulatory functions (described further in section
1.5), and so this phenotype may have consequences which contribute to dysregulation
of CMI and immunopathogenesis in HIV-1/TB co-infection. Therefore, further
characterisation of this phenotype and its consequences, and identifying the

Chapter 1 Introduction
79
mechanism by which HIV-1 causes IL-10 attenuation merits further investigation, which
may also provide insight into the regulation of IL-10 responses in macrophages.
1.5 Interleukin-10
1.5.1 The IL-10 and IL-10 receptor family
Although most cytokines induce pro-inflammatory or immune-activating
processes, several have been identified that have anti-inflammatory activities which are
essential for producing a balanced immune response capable of pathogen clearance
with limited immunopathology. Among these, interleukin-10 (IL-10) is considered to be
non-redundant in the initial anti-inflammatory component of the immune response (Iyer
and Cheng, 2012). IL-10 is a homodimeric secreted protein produced by immune cells,
which mediates potent negative regulation of immune responses by gene-specific
transcriptional repression and up-regulation of factors that modulate immune signalling
pathways (Iyer and Cheng, 2012; Moore et al., 2001). It was first identified as a factor
produced by Th2 CD4+ T cells, which was capable of suppressing Th1 responses, and
was subsequently found to be produced by other cells including B cells, mast cells and
macrophages, and to be broadly suppressive with regard to many cell types (O’Garra &
Murphy, 2009).
The human IL-10 protein is relatively highly conserved, with 73% homology to
mouse IL-10, and has an α-helical bundle structure classic of many cytokines including
IFNs (Moore et al., 2001). The secreted IL-10 homodimer signals via a receptor
complex made up of IL-10R1 and IL-10R2, of which IL-10R1 is the ligand-binding
subunit with some signalling activity, and IL-10R2 purely functions in signalling (Moore
et al., 2001). As IL-10R2 is constitutively expressed in most cells, IL-10R1 expression
determines IL-10 responsiveness (Moore et al., 2001). IL-10R1 is expressed on most
haematopoietic cells at relatively low levels, but most highly on macrophages and DCs,
and its expression can be regulated by cellular activation (Murray, 2006; Tan et al.,
1993). Expression on fibroblasts and in intestinal epithelium has also been observed
(Denning et al., 2000; Weber-Nordt et al., 1994). Binding of IL-10 to its receptor
complex initiates a cascade of signalling: the receptor-associated kinases JAK1 and
TYK2 are phosphorylated and activated, leading to recruitment and phosphorylation of
STAT3 (Carey et al., 2012; Finbloom and Winestock, 1995; Riley et al., 1999; Rodig et
al., 1998; Weber-Nordt et al., 1996). Activated STAT3 homodimerises and translocates
to the nucleus (Pranada et al., 2004) wherein initiates transcription to mediate the

Chapter 1 Introduction
80
downstream functions of IL-10 (described subsequently in section 1.5.3). It should
also be noted that seven other cytokines, along with IL-10, form the IL-10 cytokine
superfamily; these cytokines generally signal via other receptors and have a range of
divergent effects on immunity and inflammation (Commins et al., 2008).
1.5.2 Regulation of IL-10 production
IL-10 can be produced by many immune cells in vivo, but T cell subsets and
MPs such as monocytes, macrophages and cDCs are the main cell types involved
(Murray, 2006). Most CD4+ T helper subsets can produce IL-10 in some contexts, and
this is thought to be partly regulated by subset-specific signals (Cretney et al., 2011;
Saraiva and O’Garra, 2010; Saraiva et al., 2009; Shoemaker et al., 2006). A central
role for ERK signalling has been suggested (Saraiva et al., 2009), but the mechanisms
controlling production in T cells are not well delineated (Iyer and Cheng, 2012).
However, IL-10 induction pathways in macrophages and other MPs downstream of
pattern recognition have been extensively described, and are thought to involve an
array of transcriptional and post-transcriptional regulatory mechanisms (summarised in
Figure 1.3).
TLR-2 and dectin-1 are central PRRs in IL-10 induction (Kelly et al., 2010; Moreira
et al., 2008; Netea et al., 2004), and have been shown to be synergistic in this regard
(Ferwerda et al., 2008). TLR-3, TLR-4, TLR-9 and NOD2 stimulation have also been
shown to induce macrophage IL-10 production (Boonstra et al., 2006; Moreira et al.,
2008). PRR stimulation activates complex arrays of signalling pathways (section 1.2.6),
and accordingly IL-10 is regulated via several axes. The MAPK cascades via p38 and
ERK are thought to be critical (Chanteux et al., 2007; Elcombe et al., 2013; Ma et al.,
2001; Yi et al., 2002), and both signalling strength through this pathway and negative
regulation of its activity contribute to fine-tuning of IL-10 production (Chi et al., 2006;
Kaiser et al., 2009; Saraiva and O’Garra, 2010). MAPKs, along with NFκB signalling
(Banerjee et al., 2006; Gringhuis et al., 2007), calcium-burst signalling downstream of
dectin-1, CaM kinase II and Pyk2 (Kelly et al., 2010), and some PI3K-stimulated
pathways (Hu et al., 2006), activate a range of transcription factors which may
influence IL-10 transcription. These include Sp1, IRFs, CREB, C/EBP, c-MAF and
NFκB; which of these are necessary and sufficient for IL-10 transcription is still not
clarified, although Sp1 is suggested to have a critical role (Brightbill et al., 2000).
Regulation at this level may be highly stimulus-specific (Saraiva and O’Garra, 2010).
Chromatin remodelling at the IL-10 locus may also influence IL-10 transcription; this
Chapter 1 Introduction
81
has been shown to occur at the IL-10 locus downstream of LPS stimulation of
macrophages (Saraiva et al., 2005), and histone modifications of the locus also
contribute to control of expression (Cheng et al., 2014; Villagra et al., 2009). Active
negative regulation of IL-10 transcription has been demonstrated: suppression by
factors including CIITA, STAT1 and BCL-6 has been demonstrated, but whether all
these pathways operate in macrophages is not clear (Saraiva and O’Garra, 2010). The
IκB protein BCL-3 has been shown to negative regulate IL-10 expression in murine
macrophages, via regulation of the initiation of IL-10 transcription (Riemann et al.,
2005).
Post-transcriptional mechanisms also contribute to regulation of macrophage IL-10
production. Like many other cytokines, IL-10 mRNA has destabilizing motifs in the 3’
untranslated region (Powell et al., 2000) and is a target for the RNA-degradation
mediator, tristetraprolin (Stoecklin et al., 2008). IL-10 regulation by miRNAs, which act
on mRNA to increase degradation or prevent translation, has also been demonstrated
downstream of TLR-2 and TLR-4 signalling (Xie et al., 2014). Finally, mechanisms
acting on translation have been described. The activity of the PI3K pathway, mediated
by Akt and ultimately through mTOR, has been reported to determine the magnitude of
IL-10 production via global effects on the efficiency of translation; this allows distinct
regulation of anti-inflammatory IL-10 production vs. pro-inflammatory cytokine
production in a phenomenon termed “cytokine biasing” (Ivanov and Roy, 2013;
Weichhart et al., 2008).
Another line of evidence suggests that there may be indirect control of IL-10
production in the innate immune response, via PRR-induced type I IFN production
which feeds back to induce IL-10 in a circuit which may also involve the production of
IL-27 (Chang et al., 2007; Iyer and Cheng, 2012). However, other reports suggest that
type I IFNs can inhibit IL-10 production (Lin et al., 2013), and so this mechanism is not
yet clarified. However, it is representative of the complex molecular mechanisms which
control IL-10 expression in macrophages. This complexity is likely to be linked to the
fine balance which is required in its expression, owing to the potency of its suppressive
functions.

Chapter 1 Introduction
82
Figure 1.3: Regulation of IL-10 expression in macrophages.

Chapter 1 Introduction
83
1.5.3 Functions of IL-10
IL-10 signalling activates the transcription factor STAT3, which has been shown to
be essential for all described functions of IL-10 (Williams et al., 2004; Williams et al.,
2007). The main targets for IL-10 signalling are the MPs: macrophages, DCs and
monocytes, which express the highest amounts of IL10R1 (Murray, 2006), although
most other immune cells may respond to IL-10 in some context (Iyer and Cheng,
2012). IL-10 signalling may occur in a paracrine or an autocrine fashion; autocrine
signalling in macrophages downstream of PRR activation has suggested to be an
important auto-regulatory axis (Lang et al., 2002c; Murray, 2006).
The downstream functions of IL-10/STAT3 signalling have been termed the “anti-
inflammatory response” (AIR), and it has been shown in macrophages that the overall
outcome of the AIR is selective inhibition of transcription of components of the
inflammatory response (Murray, 2005). However, STAT3 is a positive transcriptional
regulator, and mediates the AIR in macrophages indirectly by inducing the transcription
of “AIR factors”: various transcription factors and signalling modulators which then
exert the AIR (Hutchins et al., 2012). Some AIR factors have been identified via gene
expression studies of IL-10 stimulated cells (Antoniv et al., 2005; Hutchins et al., 2012;
Park-Min et al., 2005; Stumpo et al., 2003), and include molecules such as SOCS3,
which regulates pro-inflammatory cytokine signalling (Berlato et al., 2002; Niemand et
al., 2003; Yasukawa et al., 2003); BCL3, which limits the production of TNFα via NFκB
signalling suppression (Kuwata et al., 2003; Wessells et al., 2004); Zfp36, which
targets TNFα mRNA for degradation (Gaba et al., 2012; Schaljo et al., 2009); and Nfil3,
while regulates IL-12 expression (Kobayashi et al., 2011). Suppression of NFκB
signalling and potent inhibitory effects on TNFα production are common themes of the
AIR (Chan et al., 2012; Driessler et al., 2004; Smallie et al., 2010). However, the
suppressive effects of IL-10 are not uniform across the entire pro-inflammatory
response; a study in mouse macrophages showed that IL-10 negatively regulated
approximately 15–20% of the response to LPS (Lang et al., 2002a). The significance of
which components of the inflammatory response are regulated by IL-10, and which are
not, is not yet clarified (Murray, 2006), and limited data exists investigating the
intricacies of this pathway in human macrophages.

Chapter 1 Introduction
84
Various cellular phenotypes have been described which result from these
molecular mechanisms of IL-10 signalling. Macrophages and other APCs, as well as
being subject to inflammatory response auto-regulation, are suggested to take on an
anti-inflammatory phenotype (variously described as M2, alternatively activated or
regulatory; Mantovani et al., 2004). These effects of IL-10 on APCs lead to inhibition of
Th1-polarised responses (Fiorentino et al., 1991, 1991) and may act to promote
resolution of inflammation (Ogawa et al., 2008). In T cells, IL-10 signalling may directly
suppress Th1 effector functions such as IFNγ production, but this mechanism is less
clear than its indirect modulation of Th1 responses via APCs (Del Prete et al., 1993;
Redford et al., 2011). Despite its original description as a Th2 factor, IL-10 has also
been shown to suppress Th2-driven responses in some contexts (Grunig et al., 1997).
Induction of a Treg phenotype is another described function of IL-10 (Horwitz et al.,
2003), which may potentiate regulatory function via the production of further IL-10. The
overall effects of IL-10 on B cells and NK cells are less clear; it has been shown to
modulate activation of these cells in some reports (Go et al., 1990; Itoh and Hirohata,
1995; Shibata et al., 1998; Stacey et al., 2011). Another key cellular phenotype
controlled by IL-10 is apoptosis. Its anti-apoptotic functions have been described both
in vitro and in vivo (Eslick et al., 2004; Geng et al., 2000; Penttilä et al., 2008; Zhou et
al., 2001), and it may act either directly, or indirectly via TNFα regulation, to mediate
these (Cyktor and Turner, 2011).
The potent effects of IL-10 on a range of immune cells suggest its signalling may
have significant consequences for disease and inflammation. Many studies of
physiological IL-10 function have been performed in mouse models of IL-10 deficiency,
signalling blockade, or supplementation, and examples of phenotypes observed in
these models are presented in Table 1.11. The baseline phenotype of the IL-10
deficient mouse model is severe spontaneous enterocolitis, and the important role of
IL-10 in maintaining gut homeostasis has recently been attributed to its effects on gut-
resident macrophages (Kühn et al., 1993; Shouval et al., 2014; Zigmond et al., 2014).
Various models using inflammatory and infectious challenges have elucidated the
importance of IL-10 in limiting immunopathology, as deficient mice are
hypersusceptible to endotoxin-induced shock, contact hypersensitivity, and succumb
rapidly in some infections due to exacerbated inflammation in the absence of IL-10
regulation (Berg et al., 1995a, 1995b; Gazzinelli et al., 1996; Hunter et al., 1997; Li et
al., 1999). However, in some contexts IL-10 is shown to limit control of infections due to
its suppressive effects on microbicidal functions; this is most clear in the context of

Chapter 1 Introduction
85
persistant viral infections (Brooks et al., 2006; Ejrnaes et al., 2006), but also in bacterial
infections such as Salmonella enterica serotype Typhimurium and Yersinia pestis
(Lokken et al., 2014; Sing et al., 2002). The discovery of functional viral IL10
homologues supports the concept that IL10 expression may confer an evolutionary
advantage to pathogens in some contexts (Ouyang et al., 2013). An overall picture of
the role of IL-10 in infections has emerged wherein IL-10 exerts regulation which must
be limited to allow pathogen clearance, but sufficient to prevent immunopathology
(Couper et al., 2008). It is suggested that features of particular infections determine the
net outcome of its signalling; for pathogens which induce lots of inflammation, IL-10
signalling may be critical in preventing disease, but for persistent pathogens which
have adapted to avoid killing, IL-10 signalling may exacerbate disease by further
preventing microbicidal functions (Cyktor and Turner, 2011).
In humans, the precise role of IL-10 in regulating inflammation is not as well
elucidated as in mice. Its homeostatic role in the gut is clear, as IL-10 receptor
mutations have been found in patients with spontaneous severe inflammatory bowel
disease (Glocker et al., 2009). IL-10 polymorphisms, including promoter haplotypes
which influence levels of gene expression, have been described which contribute to the
risk or severitiy of inflammatory and infectious diseases such as graft vs. host disease,
hepatitis C virus and community-acquired pneumonia (Edwards-Smith et al., 1999;
Gallagher et al., 2003; Lin et al., 2003; Paladino et al., 2006), and treatment of patients
with HCV with recombinant IL-10 was shown to limit the tissue damage caused by
chronic inflammation (Nelson et al., 2000) – again suggesting that IL-10 limits
damaging immunopathology in humans as well as in mice.
The potential role of IL-10 in regulating CMI is clear from its described effects in
modulating macrophage and T cell function, and this is supported by the observation
that infections by intracellular pathogens such as Listeria monocytogenes, Salmonella
enterica serotype Typhimurium, Toxoplasma gondii and Toxoplasma cruzii have
altered phenotypes in mouse models in the context of IL-10 deficiency (Table 1.11).
Inhibition of macrophage IL-10 production by HIV-1 (section 1.3.9) may therefore have
substantial consequences for the regulation of CMI, and pathology caused by
intracellular pathogens such as Mtb.

Chapter 1 Introduction
86
Mouse model Phenotype Reference
IL-10 −/− Spontaneous chronic enterocolitis Kuhn et al. (1993)
Excessive inflammation & death after
Trypanosoma cruzi infection, but
improved parasite clearance
Hunter et al. (1997); Holscher et al.
(2000)
Excessive inflammation & death after
Toxoplasma gondii infection
Gazzinelli et al. (1996)
Excessive inflammation & death after
Listeria monocytogenes
meningoencephalitis
Deckert et al. (2001)
Increased morbidity and mortality in
malaria infection but improved
parasite clearance
Li et al. (1999)
Protection against Yersinia pestis
infection
Sing et al. (2002)
Hypersensitive to endotoxin-induced
shock
Berg et al. (1995a)
Exaggerated contact hypersensitivity
response
Berg et al. (1995b)
Impaired resolution of lung
inflammation
Aggarwal et al. (2014)
Neutralization of IL-10 via
antibody
Improved control of Salmonella
typhimurium co-infection during
malaria infection
Lokken et al. (2014)
Blockade of IL-10 signalling
by neutralising antibody to IL-
10R
Increased inflammation but improved
parasite control in Leishmania
infection
Gonzalez-Lombana et al. (2013)
Resolution of chronic viral infections Ejrnaes et al. (2006); Brooks et al.
(2006)
IL-10 −/−:
macrophage/neutrophil-
specific
Enhanced inflammatory response to
LPS
Siewe et al. (2006)
IL-10 −/−: T cell-specific Excessive inflammation & death after
Trypanosoma cruzi infection, but
protected from LPS and skin irritant
hypersensitivity
Roers et al. (2004)
IL-10 supplementation to
WT
Protection from endotoxin-induced
shock
Howard et al. (1993)
Protection from acute induced
pancreatitis
Kusske et al. (1996)
Table 1.11: Effects of IL-10 on infection and inflammation in mouse models.

Chapter 1 Introduction
87
1.5.4 The role of IL-10 in tuberculosis
The role of IL-10 in regulating TB disease has been extensively researched
(Redford et al., 2011). The known functions of IL-10 in regulating Th1 responses and
macrophage microbicidal functions could clearly impact on control of Mtb; however, it
also regulates the inflammation associated with TB immunopathology, suggesting that
the contribution of IL-10 to TB disease may be dichotomous. Accordingly,
investigations of TB in mouse models have described a spectrum of phenotypes, from
those in which IL-10 deficiency improves control of TB with reduced bacterial loads in
deficient mice (Beamer et al., 2008; Redford et al., 2010; Turner et al., 2002), to those
in which it is unaffected (Jung et al., 2003; North, 1998), to those in which it
exacerbates immunopathology (Higgins et al., 2009). Different inbred mouse strains
are known to have different inherent susceptibilities to Mtb, which may somewhat
account for this range of observations (Redford et al., 2011). As such it is difficult to
draw any overall conclusions from this body of work, except from the broad observation
that dysregulation of IL-10 can compromise TB control or cause immunopathology in a
context-dependent manner. Differences between human and mouse TB, such as the
inability to establish latent infection also make it difficult to extrapolate from this model
to human disease (Flynn, 2006).
IL-10 is thought to contribute to human TB, as it can be measured at the site of
disease in active TB patients (Barnes et al., 1993). Studies of IL-10 function in active
TB patient PBMC have shown that it can inhibit proliferation and IFNγ production by T
cells (Gong et al., 1996; Zhang et al., 1994). Although this demonstrates the potentially
suppressive role of IL-10 in TB, it does not provide insight into the potential function of
IL-10 at the site of disease, in which its roles in regulating resolution, tissue damage
and apoptosis could be critical. One study has reported that a polymorphism that
increases the risk of pulmonary TB also increases IL-10 levels, providing some
indication that it may compromise protection (Awomoyi et al., 2002); however, a
metaanalysis of the contribution of IL-10 polymorphisms to risk of TB showed no
overall effect (Pacheco et al., 2008).
Overall, the postulated function of IL-10 in human TB is mainly still derived from
knowledge about its functions and how these impact on the immune response to TB.
As described above, its inhibitory effects on the Th1 axis of immunity have the potential

Chapter 1 Introduction
88
to compromise protection. However, as IL-10 is a potent regulator of TNFα responses
and apoptosis (Cyktor and Turner, 2011), it seems likely that it may also feed into the
TNFα-balance and cell death determinants of TB immunopathology (as discussed in
section 1.4.3), and again may be subject to a “Goldilocks effect” in terms of too much
or too little IL-10 being damaging. However, this hypothesis has not been formally
demonstrated. It has also been shown that IL-10 may inhibit phagolysosome
maturation in Mtb-infected human macrophages (O’Leary et al., 2011), suggesting that
it may also impact on macrophage parasitism by the pathogen.
The role of IL-10 in regulating the immune response to TB is clearly complex.
This is a scenario in which there is substantial host-damaging inflammation, which IL-
10 can regulate, but also in which the pathogen persists and subverts killing, which IL-
10 may compromise. In terms of the effects of HIV-1-mediated IL-10 attenuation for
HIV-1-associated mycobacterial disease, existing knowledge about the role of IL-10
mainly indicates that this phenotype has the potential to dysregulate host immunity, but
the precise downstream consequences are not clear and merit further investigation. It
should also be noted that due to systemic immune dysfunction in HIV-1 infection, the
consequences of IL-10 inhibition may have context-specific effects, as the normal role
of IL-10 in the immune system is likely to be altered by concurrent HIV-1 infection.
Notwithstanding the complexity of these interactions, investigation of the
consequences of this potent mechanism of CMI dysregulation by HIV-1 is likely to
provide valuable insights into pathogenesis in HIV-1/TB co-infection.

Chapter 1 Introduction
89
1.6 Investigating immune responses using transcriptional
profiling
1.6.1 Using transcriptional profiling to understand immune responses in
tuberculosis in vivo
Of the various –omics technologies, transcriptomics or transcriptional profiling,
in which the expression of thousands of transcripts is measured simultaneously in one
sample, has perhaps been used most widely to gain biological insights. The main
advantage of transcriptional profiling, as with other –omics technologies, is that it can
provide systems-level insights into biology, with resolution of these systems at the
molecular level. For investigating cells, transcriptional profiling can provide a broad
impression of cell state; at the tissue level, it can be used to assess the overall activity
of tissues in homeostasis and disease. Key insights using transcriptional profiling of
tissues have been made in a range of human diseases, including cancer and
autoimmune conditions (Chaussabel et al., 2008; Rhodes et al., 2005).
As a major human disease in which the immune response remains poorly understood,
TB is a clear candidate for systems-level analysis via transcriptional profiling. To date,
this has mainly been performed using peripheral blood samples from active TB patients
and appropriate comparator groups (latent TB, healthy individuals, etc). Evaluating the
blood is suggested to be a suitable method, as it contains immune effector cells which
may traffic from the site of disease (Berry et al., 2013), and various insights have
indeed been gained from these studies. Dominant IFN signatures driven by neutrophil
and monocyte activity in the peripheral blood have been identified, which are
specifically associated with active TB as opposed to latent disease (Berry et al., 2010;
Maertzdorf et al., 2012; Ottenhoff et al., 2012). These signatures may have diagnostic
and therapeutic utility, as they can differentiate TB from some other conditions, and
may correlate with the resolution of disease throughout chemotherapy (Bloom et al.,
2013, 2012; Cliff et al., 2013).
However, there are arguably major limitations in studying TB in the peripheral blood.
The site of disease is known to be crucial in determining disease outcome in TB (Lin et
al., 2014), and although the blood transcriptome may reflect activity at the disease site
(as the signatures seen resolve with recovery from active disease; Berry et al., 2013), it

Chapter 1 Introduction
90
clearly has a very different cellular and structural milieu. Regardless of whether the
blood is an appropriate tissue to study, transcriptional profiling of the site of disease
would certainly provide further insights into mechanisms of pathogenesis, as it has in
other settings such as leprosy and transplantation (Cantu et al., 2013; Teles et al.,
2013). However, the site of disease in TB usually has limited accessibility, and so
collecting appropriate samples for this purpose may be challenging. It may be even
more challenging to obtain samples which can be robustly evaluated comparatively
(i.e. to assess the effect of HIV-1 co-infection on TB) which are appropriately controlled
in terms of time of disease, site of disease and other aspects of disease heterogeneity.
An approach recently developed by our group to assess anti-mycobacterial immune
responses in vivo in humans may assist in overcoming these various limitations, by
using the TST, a classic model of CMI/DTH, as a standardised human challenge
model, from which RNA samples can be collected and assessed by transcriptional
profiling. Using this method in healthy individuals has provided a proof-of-concept that
it can characterise CMI in vivo in an inflamed site, and provide molecular-level insights
into the anti-mycobacterial immune response (Tomlinson et al., 2011). As a tissue
model which contains macrophages and infiltrating T cells, it is arguable that it provides
a stronger surrogate for the site of TB disease than the peripheral blood, although
clearly aspects of pulmonary inflammation may not be replicated here. However, this
method provides an attractive option for performing comparative studies of immune
responses to tuberculosis in vivo in particular groups of patients, for example those
with HIV-1 co-infection.
1.6.2 Transcriptional profiling analysis
To gain reliable insights into biological systems by using transcriptional
profiling, it is clear that robust analysis methods are required. Traditional methods
include feature selection analysis, in which statistical testing and fold-change difference
cut-offs are used to identify differences in transcript levels across gene expression
profiles. This method is crucial for generating lists of differentially expressed
transcripts, but does not provide any inherent systems-level insights. These are
generally gained by further downstream assessments using bioinformatics methods
such as pathway, gene ontology or transcription factor binding site enrichment
analyses.

Chapter 1 Introduction
91
In addition to these supervised methods of exploring transcriptomic data,
unsupervised clustering methods, such as principal component analysis (PCA), can
provide powerful insights. PCA is a unsupervised exploratory statistical method which
can be used to assess variance across a large data set in such a way that retains more
information than simple hierarchical clustering (Chain et al., 2010; Ringnér, 2008). It
identifies directions (components) across which the variation in the data is maximal.
Each sequential principal component (PC) identified by the PCA algorithm describes
variation in a new direction, which is uncorrelated to the previous components
identified. PCA can thus be used to gain an impression of the overarching patterns of
variation within a set of gene expression datasets, by describing multiple distinct
relationships between samples. The PCA algorithm output assigns each sample a
numerical value within each identified component (a PC score). This simplifies
visualisation of the highly multidimensional data, as each sample can be represented
by a single PC score for each component, rather than by using the many thousands of
expression values which contribute to this (Ringnér, 2008).
The power of PCA lies in its ability to deconvolute highly multidimensional gene
expression data into a restricted set of components which can be used for simple
cross-sample comparisons. Another method of gene expression data deconvolution is
modular analysis, which is a powerful method for assessing the activation of pathways
of biological interest in gene expression profiles.
1.6.3 Modular analysis of transcriptomic data
Modular analysis, in which the expression of defined sets of genes of interest is
measured as a unified variable, has been widely used in recent years for analysis of
transcriptomic data, initially in the fields of cancer biology and diabetes, and
subsequently in immunology (Chaussabel et al., 2008; Li et al., 2014; Rhodes et al.,
2005; Segal et al., 2003). It is postulated to be an intuitive systems-based approach for
exploring gene expression datasets (Chaussabel and Baldwin, 2014), and may be
superior to traditional methods such feature selection for a number of reasons. It does
not rely as heavily on user-selected cut-offs or ranking methods (Chaussabel and
Baldwin, 2014), and by defining a priori gene sets of interest, it may be less subject to
bias than post hoc assessments of functional enrichment (Mootha et al., 2003). It may
also be less susceptible to confounding by multiple testing (Subramanian et al., 2005)
or cross-platform transcriptomic comparisons – i.e. those in which compared datasets
are generated using different platforms – as measuring sets of genes is presumably

Chapter 1 Introduction
92
less likely to be affected by statistical noise or technological differences than
assessment of a single transcript (Chaussabel and Baldwin, 2014). The overarching
advantage of modular analysis may be the increased power of assessing gene
expression changes at the level of sets of genes, rather than at the level of single
genes, which seems plausible when biological systems are considered at the pathway
level (Subramanian et al., 2005).
Two principal methods of generating modules have been employed. Firstly, data-
driven modules, which use the expression values in a collection of transcriptome
datasets of interest to build co-clustering networks of transcript correlations. Sets of
transcripts which behave in a similar way in that particular setting are extracted from
the network in an unsupervised manner to construct repertoire of modules, which can
then be functionally explored and defined as being associated with particular functional
axes – relying on the premise that co-clustering will be driven by functional
associations (Chaussabel and Baldwin, 2014). The activity of these modules can then
be assessed in similar types of datasets to those used to generate the module.
Limitations of this method lie in the ability of the investigator to associate a given
module with a plausible function, which is somewhat reliant on individual expertise
and/or the availability of appropriate bioinformatics tools, and also the assumption that
co-correlation of transcriptomic data will provide superior functional insight than purely
providing an assessment of differential cell numbers within the source dataset. Data-
driven modules have been employed extensively for analysis of peripheral blood
transcriptomic data, where they have provided valuable insights into disease
phenotypes, including in TB (Berry et al., 2010; Bloom et al., 2013).
The second method of module generation can be described as hypothesis-driven.
In this method, the modular activity that the user wishes to assess is defined a priori –
for example, the activity of a particular cytokine or the phenotype of a specific cell.
There are two options for deriving such a module; (a) to use a curated gene list from a
bioinformatics source which pertains to the module of interest, or (b) to use
experimental transcriptomic data, either from curated gene expression data
repositories or generated independently, to build a stimulus/cell-specific gene list. Both
methods have been used successfully to gain specific biological insights (Cantu et al.,
2013; Mootha et al., 2003; Rhodes et al., 2005; Teles et al., 2013). As this is a
supervised method, there is a considerable degree of user determination in setting the
parameters for what genes should make up a module. For the bioinformatics approach,
this relates to the resources selected to obtain gene lists. For the transcriptome-derived

Chapter 1 Introduction
93
approach, there is firstly the question of what experimental setup will provide the most
appropriate data for module derivation. There are then multiple options for extracting a
gene list from the dataset, pertaining to statistical or fold-change thresholds, correlation
analyses and specificity filters. For testing specific hypotheses, this module generation
approach is arguably superior to data-driven modules, as it provides an increased
degree of confidence that a module is strongly associated with the context of interest,
rather than requiring external verification of the module’s nature. Furthermore, although
data-driven modules can provide valuable insight into a particular system, the
unsupervised approach used may mean that a desired module is not generated and so
that particular pathway cannot be assessed in that system.
A reliable modular analysis method also relies on selecting an appropriate
measurement for evaluation of whether expression of a module is enriched in a dataset
of interest in comparison to control or other datasets. Similarly to generating modules,
multiple strategies have been developed to do this. The simplest of these are the most
intuitive methods, in which the mean or median expression value of the genes making
up the module is calculated in the sample of interest, which is then used as a module
score which can be used for between-group comparisons (Chaussabel and Baldwin,
2014). This strategy has been used most often for assessing data-driven module
expression within the framework of the system used to generate the modules, with the
assumption that the inherently co-correlated nature of the sets of genes within each
module mean that assessing them as essentially a single variable is justified
(Chaussabel and Baldwin, 2014).
Assessing the expression of hypothesis-driven modules has generally been
performed using more complex techniques, perhaps owing to a lower level of prior
confidence that a module which is generated entirely independently from the system in
which it is to be assayed will have specificity for phenotypes within that system. One of
the most widely used methods in this regard is gene set enrichment analysis (GSEA),
the development of which helped to pioneer the concept of assessing hypothesis-
driven modules (Mootha et al., 2003; Subramanian et al., 2005). GSEA uses an
algorithm which determines a list of ranked gene expression differences between the
transcriptomes of two phenotypes of interest, e.g. a disease state and a control, and
then assesses where the members of the module gene set lie in this ranked list; if they
tend to occur towards one or other end of the list, then the module is assessed as
significantly enriched in that phenotype in comparison to the other (Subramanian et al.,
2005).

Chapter 1 Introduction
94
This approach essentially produces a gene-set level statistic by the sum of the
gene-level statistics (Alavi-Majd et al., 2014), and variations on this univariate testing
approach have been developed using different statistical tests and assumptions about
dataset distribution (Dinu et al., 2007; Luo et al., 2009; Irizarry et al., 2009). Multivariate
approaches which incorporate the correlation structures of gene sets into the testing
algorithm have also been developed (Tsai and Chen, 2009). A gold standard for
hypothesis-driven module enrichment analysis is yet to emerge (Hung et al., 2012),
and it is suggested that the most appropriate analysis method to use depends on the
distribution of the dataset to be assessed (Alavi-Majd et al., 2014), or that use of
multiple methods to widely explore datasets and confirm enrichment may be most
appropriate (Glazko and Emmert-Streib, 2009).
As macrophages are highly responsive to many different signals and stimuli,
and their plasticity is evident transcriptionally (discussed in section 1.2.9), they may be
an appropriate cell type to use as a barometer for different functional axes in
transcriptional profiles, by deriving hypothesis-driven modules from gene expression
profiles of differentially stimulated macrophages. Data-driven modules derived from
macrophage gene expression profiles have already been successfully used to gain
insights in macrophage heterogeneity and in vivo disease processes (Xue et al., 2014),
indicating that they may indeed be an appropriate source of gene expression data for
modular assessments. Modules derived from macrophages may be particularly
appropriate for the analysis of CMI in vivo, due to the central role of macrophages in
CMI, and assessment of immune responses in TB may be one example of where such
modules might have utility.
1.7 Summary and research objectives
Macrophages are critical effector cells of CMI, the function of which is central to
determining protection and pathogenesis in active TB. HIV-1 infection is associated
with aberrant immune phenotypes which modulate the function of CMI, and also
significantly alters the natural history of TB. HIV-1 infection and modulation of
macrophages, which are also the host cell for Mtb, may be a major contributor to these
complex host/pathogen interactions. Recent observations in our group have shown that
production of the critical immunomodulatory cytokine IL-10 is attenuated in HIV-1
infected macrophages in the response to Mtb. As IL-10 has potent modulatory effects
Chapter 1 Introduction
95
on CMI, this phenotype is highly likely to have consequences for TB control and
pathogenesis, which may contribute to the increased risk of TB in HIV-1 infection. As
such, investigation of the mechanism and consequences of this phenotype are merited.
A central feature of macrophage function, which is likely to impact on CMI, is
their responsive plasticity to different stimuli. In particular, their responses to different
T cell subset cytokines may determine the quality of a CMI response. As their plasticity
is controlled transcriptionally, macrophage heterogeneity represents an opportunity for
development of modular tools for transcriptional profiling analysis, by using gene
expression profiles from differentially stimulated macrophages to derive specific
modules of interest. Such tools would clearly have potential applications for gaining
insights into the function of CMI in HIV-1/TB co-infection at the systems level, wherein
transcriptional profiling may assist in elucidating complex immune phenotypes in this
host/pathogen interaction. Using the TST as a human challenge model in HIV-1− and
HIV-1+ patients represents an opportunity to do this in a controlled and highly
comparative manner.
My broad research objectives for this thesis are as follows, with specific
objectives expanded upon in each chapter.
1. To investigate the mechanisms and consequences of attenuation of IL10
responses by HIV-1 in monocyte derived macrophages (Chapter 3 and Chapter 4).
2. To investigate MDM molecular heterogeneity in response to differentially
polarised T cell responses and cytokines, and to use this data to develop modular tools
for investigation of in vivo gene expression datasets (Chapter 5).
3. To investigate CMI responses in vivo in HIV-1 infected patients with TB by
using the TST as a human challenge model (Chapter 6).

Chapter 2 Materials and Methods
96
Chapter 2. Materials & Methods
2.1 Buffers, solutions and media
2.1.1 Buffers and solutions
Buffer or solution Composition
Phosphate buffered saline (PBS)
10×: 80g NaCl, 2g KCl, 14.4g Na2HPO4, 2.4g KH2PO4, pH adjusted to 7.4 and made up to 1l with deionised H2O (dH2O)
1×: 10× diluted 1 in 10 with dH2O
PBS-Tween 1× PBS with 0.05% vol/vol Tween-20 (Fisher Scientific)
Tris buffered saline (TBS) 10×: 24.23g Tris-base, 80.06g NaCl, pH adjusted to 7.6 and made up to 1l with dH2O
1×: 10× diluted 1 in 10 with dH2O
TBS-Tween 1× TBS with 0.05% vol/vol Tween-20
Tris/borate/EDTA (TBE) 10×: 108g of Tris-base, 55g of boric acid, 7.5 g of
EDTA disodium salt, made up to 1l with dH2O
1×: 10× diluted 1 in 10 with dH2O
SDS-PAGE MES running buffer Proprietary (Novex; Life Technologies)
Western blotting transfer buffer Proprietary (Novex; Life Technologies) with 10% methanol (Sigma-Aldrich)
Western blotting blocking buffer TBS-Tween, 5% weight/vol bovine serum albumin (BSA), 0.45μM filtered
Western blotting antibody buffer TBS-Tween, 5% weight/vol BSA, 0.45μM filtered
ELISA blocking buffer PBS-Tween, 1% weight/vol BSA, 0.45μM filtered
Cell freezing buffer FCS, 10% dimethyl sulfoxide (DMSO)
25% sucrose buffer for ultracentrifugation
25% weight/vol sucrose in sterile DBPS, 0.22μM filtered
Magnetic-activated cell sorting (MACS) buffer
1x PBS with 0.5%BSA and 2mM EDTA
Table 2.1: Buffers and solutions.

Chapter 2 Materials and Methods
97
2.1.2 Cell culture media
Cell type Medium
Primary human PBMC Roswell Park Memorial Institute (RPMI)-1640 with L-glutamine (GIBCO, Invitrogen), supplemented with 5% heat-inactivated (56°C, 30 minutes) filtered (0.45μM filter
units; Corning) pooled human type AB serum (ABS) (Sigma-Aldrich)
Primary human monocytes RPMI-1640 with L-glutamine supplemented with 10% heat-inactivated autologous serum
Primary human MDMs
Differentiation media RPMI-1640 with L-glutamine supplemented with 10% heat-inactivated autologous serum and M-CSF (20ng/ml; R&D Systems)
Maintenance media RPMI-1640 with L-glutamine supplemented with 5% heat-inactivated filtered pooled human ABS
Primary human MDDCs
Differentiation media RPMI-1640 with L-glutamine supplemented with 10% heat-inactivated autologous serum, IL-4 (50ng/ml; Peprotech) and GM-CSF (100ng/ml; Peprotech)
Maintenance media RPMI-1640 with L-glutamine supplemented with 5% heat-inactivated filtered pooled human ABS
HEK293T cells Dulbecco's Modified Eagle's Medium (DMEM) with 2 mM L-glutamine (Invitrogen) supplemented with 10% foetal calf serum (FCS) (Biosera)
NP-2 cells DMEM (Invitrogen) supplemented with 5% FCS, puromycin (1μg/ml; Sigma-Aldrich) and geneticin (G418; 100μg/ml; Sigma-Aldrich)
Table 2.2: Cell culture media.
All plastic used for tissue culture was obtained from TPP. All cultures were incubated at
37°C, 5% CO2 except where stated otherwise.

Chapter 2 Materials and Methods
98
2.2 Isolation and culture of primary human cells
This healthy volunteer study was approved by the joint University College
London/University College London Hospitals National Health Service Trust Human
Research Ethics Committee, and written informed consent was obtained from all
participants.
2.2.1 Isolation of PBMC
Blood samples of up to 120ml were obtained from healthy volunteers. Blood
was collected into heparinised syringes, mixed in a 1:1 ratio with sterile Dulbecco’s
phosphate buffered saline containing Ca and Mg - DPBS with Ca, Mg - (Gibco, Life
Technologies), layered in a 2:1 ratio over density gradient media (Lymphoprep, Axis-
Shield), and centrifuged at 800g for 20 minutes with minimum brake, in order to
separate the peripheral blood mononuclear cell fraction (PBMC) from erythrocytes and
granulocytes. The PBMC layer was removed using a Pasteur pipette and centrifuged
for 10 minutes at 800g. PBMC were subsequently washed three times in DPBS with
Ca, Mg, for 5 minutes at 400g. PBMC were counted and resuspended at 6.25 x 10⁵/ml
in PBMC medium (see Table 2.2).
Blood samples for autologous serum were collected concurrently with blood
samples for cell isolation, into unheparinised syringes. Serum was isolated from whole
blood using serum separation tubes (Starstedt) which were centrifuged for 10 minutes
at 1000g. Serum was aspirated using a Pasteur pipette and heat-inactivated at 56° for
30 minutes.
2.2.2 Differentiation and culture of monocyte-derived macrophages
For differentiation of MDMs, monocytes were selected by adhesion as follows.
PBMC were seeded at 2×10⁶/cm2 in appropriate tissue culture plates and incubated for
1 hour at 37°C, 5% CO2, to allow the monocytic fraction to adhere. Non-adherent cells,
which were peripheral blood lymphocytes (PBLs), were then removed and adherent
peripheral blood monocytes were washed 3 times with DPBS with Ca, Mg. Adherent
monocytes were cultured for 3 days in MDM differentiation medium (see Table 2.2),
after which they were washed to remove remaining non-adherent cells, followed by 3
further days of culture in MDM differentiation medium without M-CSF supplementation.
This method typically yields 1×10⁵ MDM/cm2 with less than 5% lymphocyte

Chapter 2 Materials and Methods
99
contamination (Noursadeghi et al., 2009). From 6 days post-isolation, MDMs were
used for experiments, and were maintained in culture for up to 4 weeks in macrophage
maintenance medium (see Table 2.2). Media was replaced every 3–4 days.
In this MDM model, M-CSF was selected as the macrophage differentiation
factor as opposed to GM-CSF, for several reasons. M-CSF has been shown in vivo to
be necessary for the development and homeostatic maintenance of many tissue
macrophage populations, whereas GM-CSF primarily plays a role in terminal
differentiation of AMs and under inflammatory conditions (Wynn et al., 2013). Hence,
M-CSF differentiated MDMs may be a reasonable in vitro model for a resting tissue
macrophage. Additionally, in the experience of our laboratory, M-CSF differentiated
MDMs are much more permissive for infection by full-length HIV-1 (without VSV-G
pseudotyping or Vpx-mediated relief of SAMHD1 restriction), meaning that this MDM
model is practically more suited for some of the experiments conducted using these
viruses.
For some experiments wherein MDMs were to be compared to monocytes and
monocyte-derived DCs, monocytes isolated by MACS (section 2.2.3) were used for
MDM differentiation as above. MDMs were also differentiated by this method using
GM-CSF (20ng/ml; Peprotech) instead of M-CSF.
2.2.3 Isolation and culture of monocytes
Periphal blood monocytes were isolated from PBMC by MACS using a CD14
positive selection kit (Miltenyi Biotec) according to the manufacturer’s instructions.
Monocytes were resuspended in monocyte medium (see Table 2.2) at 1×10⁶ cells/ml
and seeded in appropriate tissue culture plates. Monocytes were used for experiments
within 48 hours of isolation.
2.2.4 Differentiation and culture of monocyte-derived DCs
Peripheral blood monocytes, isolated by CD14 positive selection MACS, were
differentiated into MDDCs by resuspension at 1×10⁶ cells/ml in MDDC differentiation
media (see Table 2.2). Cells were differentiated over 4 days, after which they were
used for experiments, and were maintained in MDDC maintenance media (see Table
2.2).

Chapter 2 Materials and Methods
100
2.3 Cell line culture
2.3.1 HEK293T cell culture
Human embryonic kidney 293T (HEK-239T) cells, which were used for virus
production, were cultured at 37°C, 10% CO2 in HEK293T media (see Table 2.2), and
were passaged 1:4 three times per week using trypsin/EDTA (GIBCO, Invitrogen).
Frozen stocks were maintained in cell freezing buffer stored in liquid nitrogen.
2.3.2 NP2 cell culture
NP2 cells are an astrocytoma cell line stably transduced to express the HIV-1 co-
receptors CD4 and CXCR4 (NP2-X4) or CD4 and CCR5 (NP2-R5), which were used
for HIV-1 titrations. NP2 cells were cultured in NP2 media, which is DMEM
supplemented with 5% FCS and antibiotic selection (100μg/ml G418 and 1μg/ml
puromycin) to maintain expression of the HIV-1 co-receptors. The cells were passaged
1:10 once a week.
2.4 HIV-1 strains and HIV-1 based vectors
All full-length HIV-1 strains were used in Category 3 laboratories using
appropriate safety precautions. VSV-G-pseudotyped HIV-1 strains with env deletions,
VLPs and lentiviral vectors were used in Category 2 laboratories using appropriate
safety precautions.
2.4.1 Production of HIV-1 Ba-L
The CCR5- and thus macrophage-tropic HIV-1 strain Ba-L (Gartner et al.,
1986b) was produced by propagation of infectious stocks in PBL and MDM cultures.
Non-adherent PBLs from MDM preparations were cultured for 3 days in RPMI-1640
with 20% FCS and 0.5g/ml phytohaemagglutinin (PHA; Sigma-Aldrich) to generate
activated T cells. These cells were then inoculated with HIV-1 Ba-L, using a multiplicity
of infection (MOI) of 1, and subsequently cultured in RPMI 1640 with 20% FCS and 20
U/ml IL-2 (PeproTech). At 3- to 4-day intervals, the cell culture supernatants were
collected and additional PHA-stimulated PBMC were added to maintain the cell density
at 1x10⁶/ml. Cell culture supernatants containing PBMC-derived HIV-1 were filtered
through 0.45μm filters (Millipore) and used to inoculate 6-day-old MDM cultures
Chapter 2 Materials and Methods
101
overnight (MOI of 1), refreshing the medium on the following day. Culture supernatants
from infected MDM, containing MDM-derived HIV-1 Ba-L, were collected at weekly
intervals, centrifuged at 400g for 5 min and 0.45μm filtered to remove cellular debris.
Virus was purified and concentrated from supernatants as below (section 2.4.4).
2.4.2 Production of HIV-1 and lentiviral vectors from molecular clones
Full-length, and Env-deleted single-round HIV-1 strains with a range of
mutations, were generated by transfection of producer cells with molecular clones. The
range of molecular clones used in this thesis, and details of their derivations, are listed
in Table 2.3.
To generate the R9ΔenvΔvif and R9ΔenvΔvpr molecular clones as described in
Table 2.3, I performed molecular cloning. All enzymes and buffers used in this process
were obtained from Promega, and plasmid preparation and transformations were as
detailed below. Ligations were performed at 4°C overnight. Clones were verified by
sequencing (performed by the Wolfson Institute for Biomedical Research Scientific
Support Services) using primers obtained from Sigma-Aldrich. All plasmids were
prepared for transfections by transformation of HB101 competent Escherichia coli with
1μl of plasmid DNA at 42°C for 45 seconds, followed by plating of bacteria onto
lysogeny broth (LB) agar (Invitrogen) plates with the appropriate selection antibiotic.
Plates were incubated overnight at 37°C. Single colonies were picked and inoculated
into starter cultures of 5ml LB (Invitrogen) with appropriate selection antibiotic, which
were incubated for 8 hours at 37°C on a shaker. One millilitre of starter culture was
inoculated into 100ml of media as above and incubated on a shaker overnight at 37°C
to grow bacteria for plasmid purification, which was performed using a Qiagen Plasmid
Midikit (Qiagen). Plasmid concentration and purity was determined using a NanoDrop
spectrophotomer. All plasmids were routinely checked by restriction digests and TBE
agarose gel electrophoresis.
Transient transfection of plasmids into subconfluent HEK-239T producer cells
was performed to produce viruses, using Fugene-6 transfection reagent (Roche) and
OptiMEM media (GIBCO, Life Technologies). Fugene-6 (18μl per 10cm2 tissue culture
dish) was mixed with OptiMEM (200μl per dish) and left for 5 minutes, followed by
addition of plasmid DNA as detailed below. This mixture was incubated for 20 minutes
after which it was added dropwise to cells. Media was changed the following day, and
supernatants were collected to harvest virus on the subsequent 2 days.

Chapter 2 Materials and Methods
102
Full-length HIV-1 clones were generated by transfection of 3.5μg of plasmid
DNA per 10cm2 dish of HEK293T cells. Env-deleted viruses were vesicular stomatitis
virus G protein (VSV-G) pseudotyped, and so were co-transfected with pMDG, a VSV-
G expression vector (Naldini et al., 1996). Three micrograms of Env-deleted virus
plasmids and 1ug of pMDG were used for these transfections per 10cm2 dish of
HEK293T cells. Gag-Luc-GFP and HR’-based lentiviral vector were co-transfected with
the packaging plasmid p8.91 (Zufferey et al., 1997) and pMDG. 1.5ug of virus/vector
plasmid, 1ug of p8.91 and 1ug of pMDG were used for these transfections per 10cm2
dish of HEK293T cells.
2.4.3 Production of Vpx virus-like particles (Vpx VLPs)
To express the SIV and HIV-2 protein Vpx, which can increase the efficiency of
macrophage lentiviral transduction by overcoming SAMHD1-medated restriction
(Berger et al., 2011; Hrecka et al., 2011; Laguette et al., 2011), VSV-pseudotyped Vpx
virus-like particles (Vpx VLPs) were produced as follows. The plasmid pSIV3+, a
SIVmac Gag-Pol expression vector which includes the gene for Vpx (Nègre et al.,
2000), was co-transfected with pMDG, without any genome plasmid, into HEK293T
cells as above. pSIV3+ was used at 3μg, and pMDG at 1μg, per 10cm2 dish of
HEK293T cells.
2.4.4 Virus purification by ultracentrifugation
To purify and concentrate virus, filtered culture supernatants were layered over
25% sucrose buffer cushions and ultracentrifuged in sterilised ultracentrifuge tubes
(Beckman-Coulter) for 2 hours at 23000 rpm, 4°C, to remove soluble contaminants.
Ultracentrifugation was performed using a Sorvall Sure-Spin 630 rotor. Viral pellets
were resuspended in MDM maintenance media, aliquoted and stored in liquid nitrogen.
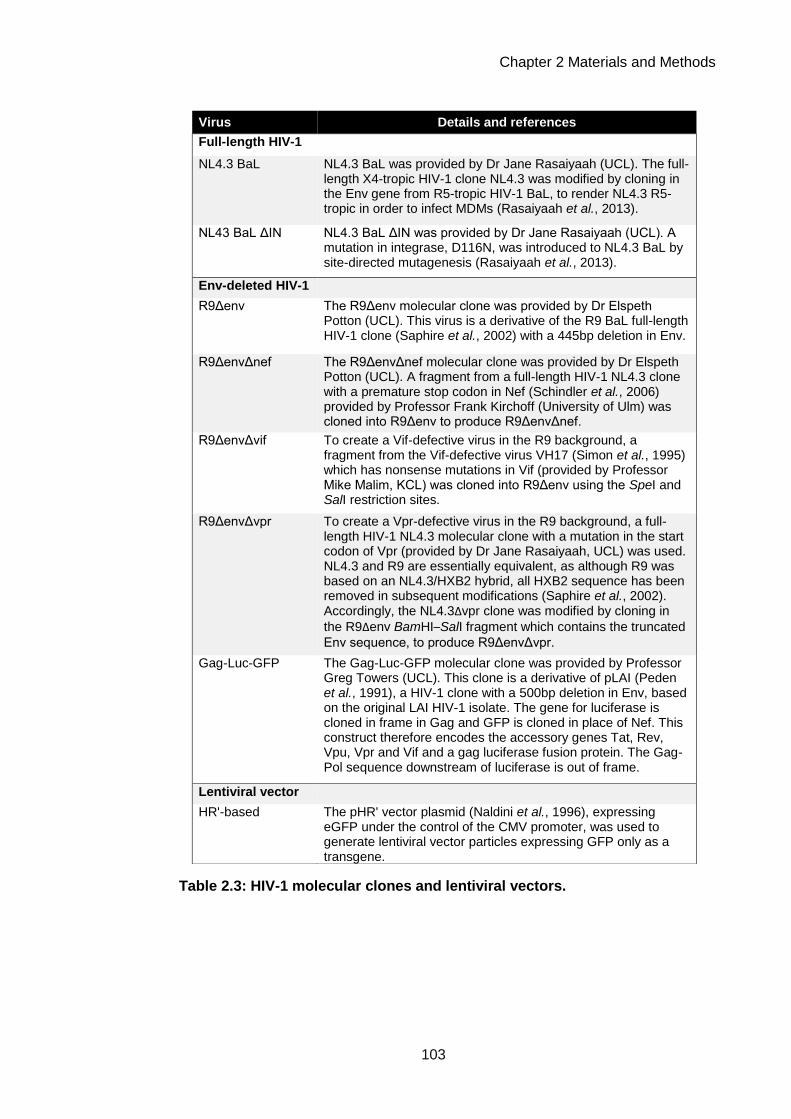
Chapter 2 Materials and Methods
103
Virus Details and references
Full-length HIV-1
NL4.3 BaL NL4.3 BaL was provided by Dr Jane Rasaiyaah (UCL). The full-length X4-tropic HIV-1 clone NL4.3 was modified by cloning in the Env gene from R5-tropic HIV-1 BaL, to render NL4.3 R5-tropic in order to infect MDMs (Rasaiyaah et al., 2013).
NL43 BaL ΔIN NL4.3 BaL ΔIN was provided by Dr Jane Rasaiyaah (UCL). A mutation in integrase, D116N, was introduced to NL4.3 BaL by site-directed mutagenesis (Rasaiyaah et al., 2013).
Env-deleted HIV-1
R9Δenv The R9Δenv molecular clone was provided by Dr Elspeth Potton (UCL). This virus is a derivative of the R9 BaL full-length HIV-1 clone (Saphire et al., 2002) with a 445bp deletion in Env.
R9ΔenvΔnef The R9ΔenvΔnef molecular clone was provided by Dr Elspeth Potton (UCL). A fragment from a full-length HIV-1 NL4.3 clone with a premature stop codon in Nef (Schindler et al., 2006) provided by Professor Frank Kirchoff (University of Ulm) was cloned into R9Δenv to produce R9ΔenvΔnef.
R9ΔenvΔvif To create a Vif-defective virus in the R9 background, a fragment from the Vif-defective virus VH17 (Simon et al., 1995) which has nonsense mutations in Vif (provided by Professor Mike Malim, KCL) was cloned into R9Δenv using the SpeI and SalI restriction sites.
R9ΔenvΔvpr To create a Vpr-defective virus in the R9 background, a full-length HIV-1 NL4.3 molecular clone with a mutation in the start codon of Vpr (provided by Dr Jane Rasaiyaah, UCL) was used. NL4.3 and R9 are essentially equivalent, as although R9 was based on an NL4.3/HXB2 hybrid, all HXB2 sequence has been removed in subsequent modifications (Saphire et al., 2002). Accordingly, the NL4.3Δvpr clone was modified by cloning in
the R9Δenv BamHI–SalI fragment which contains the truncated
Env sequence, to produce R9ΔenvΔvpr.
Gag-Luc-GFP The Gag-Luc-GFP molecular clone was provided by Professor Greg Towers (UCL). This clone is a derivative of pLAI (Peden et al., 1991), a HIV-1 clone with a 500bp deletion in Env, based on the original LAI HIV-1 isolate. The gene for luciferase is cloned in frame in Gag and GFP is cloned in place of Nef. This construct therefore encodes the accessory genes Tat, Rev, Vpu, Vpr and Vif and a gag luciferase fusion protein. The Gag-Pol sequence downstream of luciferase is out of frame.
Lentiviral vector
HR'-based The pHR' vector plasmid (Naldini et al., 1996), expressing eGFP under the control of the CMV promoter, was used to generate lentiviral vector particles expressing GFP only as a transgene.
Table 2.3: HIV-1 molecular clones and lentiviral vectors.

Chapter 2 Materials and Methods
104
2.4.5 Virus titrations
HIV-1 strains were titrated on the NP2 cell line (section 2.3.2) as previously
described (Noursadeghi et al., 2009). NP2/CD4/CCR5 cells were seeded 24 hours
prior to titrations, to allow for attachment to the tissue culture plastic as well as for
expression of the receptors required for HIV-1 infection. Cells were inoculated for 2
hours at 37°C with serial log-fold dilutions of viral stocks, using duplicate wells. The
inoculum was then removed and the media replaced. Infection was detected after 72
hours by p24 immunostaining (section 2.8.1). P24-positive cells were counted using
an AID Viruspot reader, and titres calculated from the lowest dilution with positive cells,
in which the number of positive cells was verified by manual counting using the light
microscope. Titration values were calculated as infectious units per ml.
Integrase-deficient HIV-1, Gag-LucGFP, lentiviral vectors and Vpx VLPs, which
could not be titrated by p24-gag staining, were titrated by measuring the amount of
reverse transcriptase in the viral sample a reverse transcriptase (RT) assay
colorimetric kit (Roche) according to the manufacturer’s instructions. One nanogram of
RT correlates to 1×10⁶ infectious units in this assay.
2.5 Cryptococcus neoformans strains and culture
2.5.1 C. neoformans strains
C. neoformans strains used are shown in Table 2.4. All strains were provided by
Professor Robin May, University of Birmingham.
2.5.2 C. neoformans culture
All strains were propagated on yeast-peptone-dextrose (YPD) agar (Sigma-
Aldrich) plates. Stocks of C. neoformans were stored at −80° in glycerol stocks, using a
microbank bacterial and fungal preservation system (Fisher Scientific). Beads from
microbanks were added to agar plates and incubated for up to 48 hours at 25–30°C.
Fungal lawns were re-streaked onto a fresh plate to give stock plates for experiments,
which were incubated similarly. Stock plates were stored at 4°C for up to 2 weeks
before re-streaking. For experiments, YPD broth (Sigma-Aldrich) was inoculated from
fungal lawns, and C. neoformans yeasts were cultured in suspension for 16–24 hours
at 20rpm in a microbial incubator at 25–30°C. These cultures were centrifuged at

Chapter 2 Materials and Methods
105
6000g for 2 minutes to pellet yeast cells, which were then resuspended in sterile DPBS
for counting by haemocytometer.
C. neoformans strain
Details Serotype Reference
H99 WT laboratory-propagated strain; C. neoformans type strain
A Perfect et al. (1980); Perfect et al. (1993)
Cap59 Unencapsulated derivative of H99
A Nelson et al. (2001)
B3501 WT laboratory-propagated strain
D Kwon-Chung (1976)
Cap67 Unencapsulated derivative of B3501
D Jacobson et al. (1982)
H99-GFP5 H99 expressing GFP A Voelz et al. (2010)
Table 2.4: Cryptococcus neoformans strains.
2.6 Cell culture infections and stimulations
2.6.1 Infection with HIV-1 and viral vectors
MDMs were inoculated with Ba-L at an MOI of 3–5 in a minimal cell culture
volume, followed by an overnight incubation, after which inoculums were removed and
maintenance media refreshed. Infected MDMs were kept in culture for a further seven
days, to allow spreading propagation of virus to establish uniform infection of the
culture, before use in experiments.
MDMs were inoculated with NL4.3 Ba-L WT or ΔIN at an MOI of 15 in a minimal
cell culture volume, followed by an overnight incubation, after which inoculums were
removed and maintenance media refreshed. Infected MDMs were kept in culture for a
further 14 days, to allow spreading propagation of virus to establish uniform infection of
the culture, before use in experiments.
MDMs, MDDCs and monocytes were inoculated with VSV-G pseudotyped HIV-
1 strains at an MOI of 3–5 in a minimal cell culture volume, and were co-transduced
with Vpx VLPs at 2ng RT/ml. Inoculums were removed after an overnight incubation

Chapter 2 Materials and Methods
106
and normal maintenance media was refreshed. Infected cells were kept in culture for at
least 24 hours before use in experiments.
MDMs were inoculated with the lentiviral vector HR’ and HIV-1 GagLucGFP at
7ng RT/ml in a minimal cell culture volume, and were co-transduced with Vpx VLPs at
2ng RT/ml. Inoculums were removed after an overnight incubation and normal
maintenance media was refreshed. Infected cells were kept in culture for at least 24
hours before use in experiments.
For all experiments in which Vpx VLPs were used, uninfected wells were also
transduced with Vpx VLPs at 2ng RT/ml as a control. Success of HIV-1 infection was
routinely verified in experiments using p24 immunostaining of paired wells (see
section 2.8.1).
2.6.2 C. neoformans infection
C. neoformans yeasts from liquid cultures were resuspended at the appropriate
MOI (10–100; indicated in figure legends) in MDM maintenance media, and incubated
with MDMs for 4 hours, after which MDMs were washed thoroughly using DPBS to
eliminate extracellular yeasts. Infected MDMs were maintained for up to 24 hours.
2.6.3 Innate immune stimuli and cytokines
MDMs were incubated with innate immune stimuli and recombinant human
cytokines as shown in Table 2.5.
MDMs were also stimulated with Mtb culture supernatant. To generate this,
M.tuberculosis H37Rv was cultured in Middlebrook 7H9 medium (BD Biosciences)
supplemented with 10% ADC enrichment medium, 0.2% glycerol (AnalaR, VWR) and
0.02% Tween-80 (Sigma-Aldrich). Mtb culture filtrate was generated by centrifugation
of cultures at an OD600nm of 0.6 at 15000g for five minutes followed by filtration through
a 0.2µm Anopore filter (Whatman), and this was used to stimulate MDMs.

Chapter 2 Materials and Methods
107
Reagent Concentration for
use Manufacturer
Innate immune stimuli
Ultrapure lipopolysaccharide (LPS) from Escherichia coli O111:B4
100ng/ml Invivogen
Pam3-Cys-Ser-Lys4 (Pam3CSK4) 100ng/ml Axis-Shield
Zymosan from Saccharomyces cerevisiae cell wall
0.4mg/ml Invivogen
Curdlan (β-1,3-glucan from Alcaligenes faecalis)
0.1mg/ml Wako Chemicals
Recombinant human cytokines
IL-10 10ng/ml eBioscience
TNFα 10ng/ml eBioscience
IFNγ 10ng/ml Peprotech
IFNα (clinical grade) 200IU/ml Teva
IFNβ (clinical grade) 200IU/ml Merck Serono
IL-4 10ng/ml Peprotech
IL-13 10ng/ml eBioscience
TGFβ 10ng/ml Peprotech
Table 2.5: Innate immune stimuli and cytokines.
2.6.4 Blockade of cytokine signalling
To block IL-10 signalling in innate immune responses, MDMs were
preincubated with neutralising antibodies to IL-10 (clone JES3-9D7, 5ug/ml,
eBioscience) and the IL-10 receptor (clone 3F9, 10ug/ml, BD Biosciences) for 2 hours
prior to innate immune stimulation, and throughout the stimulation conditions.
To block type I IFN signalling in innate immune responses, MDMs were
preincubated with neutralising antibody to the type I IFN receptor IFNBAR2 (clone
MMHAR-2, 1ug/ml, PBL Assay Science) for 2 hours prior to innate immune stimulation,
and throughout the stimulation conditions.
2.6.5 Chemical inhibitors and drugs
MDMs were incubated with chemical inhibitors and drugs as detailed in Table 2.6.
Cells were pre-incubated with inhibitors for 2 hours before experiments, and throughout
the experiment as appropriate. Conditions without inhibitors were controlled by the
addition of the appropriate carrier. For experiments using indinivir sulphate, MDMs
were pre-incubated for 3 days prior to assays.

Chapter 2 Materials and Methods
108
Inhibitor/drug Target Carrier Concentration
for use Manufacturer
SB203580 p38 MAP kinase DMSO 10µM Calbiochem
PD98059 MEK (and downstream ERK1/2 MAP kinase)
DMSO 10µM Calbiochem
UO126 MEK1 (and downstream ERK1/2 MAP kinase)
DMSO 10µM Calbiochem
AG17 Pyk2 DMSO 10µM Calbiochem
KN93 CaM kinase II DMSO 10µM Calbiochem
LY294002 PI3K DMSO 10µM Calbiochem
Triciribine Akt DMSO 20µM Calbiochem
Rapamycin mTOR DMSO 200nM Sigma-Aldrich
Actinomycin D RNA polymerase II DMSO 10ug/ml Sigma-Aldrich
Indinivir sulphate
HIV-1 protease H2O 10µM Centre for AIDS reagents, NIBSC
Table 2.6: Chemical inhibitors and drugs.
2.7 PBMC migration assays
PBMC were isolated from healthy donor blood samples as above, and
resuspended at 5×10⁶ cells/ml in PBMC media. Five hundred microliters of MDM-
conditioned media (described below) or control media was placed into the lower
chamber of 5μm-pore polycarbonate transwells (Costar). One hundred microliters of
the PBMC suspension was transferred into the top chamber of transwells, and
incubated for 3 hours at 37°C for migration to occur. Transwells were gently lifted out of
the lower chamber and the undersurface was rinsed twice with trypsin-EDTA and
incubated for a further 10 minutes to remove adherent cells. Transwells were removed
and the migrated cells were fixed by addition of PFA to the lower chamber suspension
to a final concentration of 1% and incubation for 15 minutes. Cells were then stained
with fluorochrome-conjugated antibodies to CD14 and CD3, to delineate monocytes
and T cells respectively (both antibodies from BD Biosciences) and acquired on a
FACS Calibur flow cytometer to quantify migrated cells. Fluorescent beads (Flow-
Check Fluorospheres; Beckman Coulter) were added to all samples to standardise
acquisition. Migration indices were calculated as follows to quantify the migration of

Chapter 2 Materials and Methods
109
different cell populations: the absolute numbers of cells recruited, for the cell population
of interest, were normalised as a ratio to the absolute number of that cell population in
an input PBMC sample.
MDM-conditioned media, which was generated by stimulation of MDMs in
conditions described in figure legends, was pooled from 4 donors, diluted 1 in 10 in
macrophage maintenance media and 0.45μM filtered before use.
2.8 Quantification of HIV-1 p24
2.8.1 Intracellular HIV-1 p24 staining
Immunostaining of cells for HIV-1 p24 was performed as follows. Cells were
fixed with ice cold acetone (Sigma-Aldrich) and methanol (Sigma-Aldrich) in a 1:1 ratio
for 30 minutes at room temperature, followed by three washes with PBS. The primary
antibody (mouse anti-p24, clone EVA365/366, NIBSC) diluted 1 in 50 in PBS with 1%
FCS was added. After incubation for 2 hours at room temperature, cells were washed 3
times with PBS and the secondary antibody, goat anti-mouse Ig β-galactosidase
conjugate (Southern Biotechnology Associates) diluted 1 in 40 in PBS with 1% FCS
was applied and incubated for 1 hour at room temperature. Cells were washed three
times in PBS, and pre-mixed β-galactosidase substrate, X-gal, at 20mg/ml (Fermentas)
was added in X-gal solution (PBS containing 3 mmol/l potassium ferricyanide, 3 mmol/l
potassium ferrocyanide and 1 mmol/l magnesium chloride), followed by incubation
overnight at 37°C. p24-positive cells, stained blue, were quantified as infected cells per
field using an AID Viruspot reader.
2.8.2 HIV-1 p24 ELISA
HIV-1 p24 enzyme-linked immunosorbant assay (ELISA) was used to quantify
HIV-1 in cell culture supernatants. Plates, antibodies and standards were from the p24
ELISA kit version 9.2, AIDS and Cancer Virus Programme, National Cancer Institute,
Frederick. Cell culture supernatants were diluted 1 in 10 in RPMI-1640 with 1% BSA
and 0.2% Tween-20. Lysing solution, which was 10% Triton-X-100 (Sigma-Aldrich) in
Milli-Q H2O (Millipore UltraPure Water Purification System), was added in a 1:10 ratio.
Samples were incubated for 1 hour at 37°C for HIV-1 lysis. Recombinant protein
standards were prepared by making two-fold dilutions in the appropriate cell culture
medium. Standards and samples were added in duplicate or triplicate to pre-blocked

Chapter 2 Materials and Methods
110
plates coated with anti-p24 capture antibody and incubated at 37°C for 2 hours,
followed by washing three times with PBS-Tween (see Table 2.1). The biotinylated
detection antibody was prepared 1 in 150, in 0.45μm filtered RPMI-1640 with 10%FCS
and 2% normal mouse serum (NMS) (Sigma-Aldrich), added to wells and incubated for
1 hour at 37°C. Wells were washed as above and the avidin-horseradish peroxidase
(HRP) conjugate, diluted 1 in 100 in 0.45μm filtered RPMI-1640 with 2% NMS, 5%
normal goat serum (NGS) (Sigma-Aldrich) and 0.01% Tween-20, was added to wells
and incubated for 1 hour at 37°C. Wells were washed as above, the HRP substrate,
3,3',5,5'-tetramethylbenzidine (TMB) in solution was applied and the reaction was
allowed to develop in the dark. When the reaction had reached an appropriate stage, it
was stopped using 1N hydrochloric acid (Sigma-Aldrich). The resulting colorimetric
product was quantified at OD450nm using a Thermo Scientific Multiskan FC, and the
standard values used to construct a standard curve, from which p24 concentrations in
the samples were calculated. Co-efficients of variation (CV) were calculated for
replicate wells and samples with %CV greater than 20% were re-assayed.
2.9 RNA isolation from cultured cells
RNA was isolated by lysis of cells using RLT buffer (Qiagen) as per the
manufacturer’s instructions. Extraction was performed using a Qiagen RNeasy Kit
(Qiagen) as per the manufacturer’s instructions. For downstream processing, RNA was
subject to DNase treatment using a TURBO DNA-free kit (Ambion, Life Technologies)
as per the manufacturer’s instructions to remove contaminating genomic DNA. When
RNA was used for microarray analysis, RNA quality and quantity was checked using
RNA Nanochips (Agilent) and an Agilent 2100 Bioanalyzer.
2.10 Quantitative real-time PCR measurements of gene
expression
DNase-treated RNA was used as the template to make first strand cDNA, using
qScript cDNA Mastermix (Quanta Biosciences), which contains appropriate buffer,
dNTPs, MgCl2, primers, RNase inhibitor protein, qScript reverse transcriptase and
stabilizers. Quantitative real-time PCR (qRT-PCR) for genes of interest was performed
using TaqMan inventoried assays (Applied Biosystems, Invitrogen), shown in Table 2.7,
and 2× TaqMan Gene Expression Mastermix (Applied Biosystems, Invitrogen), using

Chapter 2 Materials and Methods
111
an AB7500 Fast RT-PCR System. Expression levels of target genes were normalised
using a Δ cycle threshold (Ct) calculation, to that of glyceraldehyde 3-phosphate
dehydrogenase (GAPDH), which was amplified and detected using primer and probe
sequences (Table 2.8) as previously reported (Tsang et al., 2009). GAPDH primers
and probes were obtained from Sigma-Aldrich. TaqMan assays use FAM as the dye,
and GAPDH probes were also used with FAM.
Gene Applied Biosystems Assay ID
IL10 Hs00961622_m1
IL6 Hs00985639_m1
TNFA Hs00174128_m1
IL1B Hs01555410_m1
IFI16 Hs00194261_m1
HIV-1 LTR Pa03453409_s1
Table 2.7: Applied Biosystems Taqman qRT-PCR assays.
Sequence (5'–3')
GAPDH forward primer GGC TGA GAA CGG GAA GCT T
GAPDH reverse primer AGG GAT CTC GCT CCT GGA A
GAPDH probe TCA TCA ATG GAA ATC CCA TCA CCA
Table 2.8: GAPDH primer and probe sequences.
2.11 Cytokine ELISAs
To measure cytokine secretion from cells, ELISAs were performed as follows.
Cell culture supernatants were collected during experiments, centrifuged for 2 minutes
at 12000g to remove cell debris, and stored at −80°C. Antibodies, standards and
detection reagents from Ready-Set-Go ELISA kits (eBioscience) were used, and 100μl
volumes of all reagents was used per well. Antibodies, sample dilution factors and
upper concentrations of standards are summarised in Table 2.9 and buffers used are
shown in Table 2.1. Flat-bottomed polystyrene 96-well plates (Nunc) were coated with
the primary capture antibody at 1μg/ml in PBS and incubated overnight at 4°C. The
capture antibody was flicked out, and blocking buffer was applied for 2 hours at room

Chapter 2 Materials and Methods
112
temperature. A range of standards were prepared from recombinant proteins by
doubling dilutions in sample buffer, which was the appropriate cell culture medium.
Sample dilutions were also made in sample buffer. The blocking buffer was flicked out
and the plate was washed three times with PBS-Tween and blotted dry. Standards and
samples were applied to wells, in duplicate or triplicate as appropriate, leaving
duplicate blank wells. This was incubated at room temperature for 2 hours or at 4°C
overnight. Samples and standards were flicked out and the plate washed as above.
The biotinylated secondary detection antibody was applied at 1μg/ml in PBS-Tween,
incubated for 1 hour at room temperature, flicked out, and washed as above. The
avidin-HRP conjugate was applied at 1μg/ml in PBS-Tween, for 30 minutes at room
temperature, flicked out, and washed as above. TMB was added and the reaction was
developed and assessed as detailed in section 2.8.2, pg. 27.
Cytokine Capture
antibody clone Detection
antibody clone
Highest standard used
(pg/ml)
MDM culture supernatant
dilution factor
IL-10 JES3-9D7 ES3-12G8 4000 1:2
IL-6 MQ2-13A5 MQ2-39C3 4000 1:5
TNFα MAb1 MAb11 4000 1:5
Table 2.9: ELISA antibodies, standards and dilutions.
2.12 SDS-PAGE and western blotting
Cell lysates were collected in sodium dodecyl sulfate (SDS) sample buffer
(Novex, Life Technologies), containing protease and phosphatase inhibitor cocktails
(Pierce), and were homogenised by boiling at 103°C for 5 minutes and subsequent
sonication at 40 Hz using an ultrasonic processor (Jencons Scientific). Proteins were
separated by SDS polyacrylamide gel electrophoresis (SDS-PAGE) using 4−12% Bis-
Tris polyacrylamide gels (Novex, Life Technologies) in MES running buffer (Novex, Life
Technologies) using an XCell SureLock electrophoresis system (Novex, Life
Technologies). PageRuler protein marker (Fermentas) was used as a size reference.
Protein transfer onto Hybond nitrocellulose membranes (Amersham, GE Healthcare)

Chapter 2 Materials and Methods
113
was performed in transfer buffer (Novex, Life Technologies), also using the XCell
SureLock electrophoresis system with the blot module.
Buffers used for western blotting are shown in Table 2.1 and antibodies are
shown in Table 2.10. Membranes were blocked on a shaker for 1 hour at room
temperature, and washed three times in TBS-Tween for five minutes on a shaker.
Membranes were sequentially immunoblotted with primary antibodies overnight at 4°C,
and HRP-conjugated secondary antibodies for one hour at room temperature, with
washing as above between each step. Immediately before detection, membranes were
washed twice in TBS without Tween. Detection was performed using ECL Prime
(Amersham, GE Healthcare) according to the the manufacturer’s instructions, and
chemiluminescence was visualized using the FluorChem FC2 imaging system (Alpha
Innotech). Images were acquired and analysed for densitometry using AlphaView
software v3.03 (Alpha Innotech).
Table 2.10: Western immunoblotting antibodies.
Target Species Clone Dilution Manufacturer
Primary antibodies
HIV-1 gag/p24 Mouse E365/366 1:1000 NIBSC
HIV-1 Vif Mouse #319 1:500 NIH AIDS Reagent Program
HIV-1 Nef Rabbit Polyclonal 1:200 NIH AIDS Reagent Program
β-actin Mouse AC-15 1:10000 Abcam
Akt Rabbit C67E7 1:1000 Cell Signaling
Phospho Akt (Ser473) Rabbit 9271 1:1000 Cell Signaling
Secondary antibodies
Anti-rabbit HRP conjugate Swine Polyclonal 1:3000 DAKO
Anti-mouse HRP conjugate Goat Polyclonal 1:3000 DAKO

Chapter 2 Materials and Methods
114
2.13 Microscopy
2.13.1 C. neoformans uptake assay
Confocal immunofluorescence microscopy was used to analyse MDM uptake of
C. neoformans. For this purpose, MDMs were cultured in 96-well tissue culture-treated
confocal plates (Perkin-Elmer). Three replicate wells were used per condition. After
experiments, MDMs were fixed using 4% paraformaldehyde (Sigma-Aldrich) for 30
minutes at 4°C, and washed with ice-cold PBS. Cells were blocked using 10% normal
goat serum (Sigma-Aldrich) in PBS for 1 hour at room temperature. Intracellular C.
neoformans was visualised by use of a GFP-expressing strain (H99-GFP5).
Extracellular C. neoformans was counterstained using a monoclonal antibody to
glucuronoxylomannan, a component of the C. neoformans capsule (mouse; clone
18B7; used at 1.98 μg/ml; provided by Arturo Casadevall, Albert Einstein School of
Medicine, New York) and goat anti-mouse conjugated to Alexa Fluor 555 (Molecular
Probes; Life Technologies), both applied for 1 hour at room temperature with 3 washes
in PBS between incubations. MDM nuclei were stained for 5 minutes at room
temperature with 4',6-diamidino-2-phenylindole (DAPI; Cell Signaling) at 2 μg/ml in
PBS. Confocal microscopy was performed using the PerkinElmer Opera LX
microscope and images were analysed using IMAGEJ, in collaboration with Dr Janos
Kristin-Vizi, Laboratory for Molecular and Cellular Biology, University College London.
2.13.2 NFκB translocation assay
Confocal immunofluorescence microscopy was used to quantify nuclear
translocation of NFkB RelA as previously described (Tsang et al., 2009). For this
purpose, MDMs were cultured in 96-well tissue culture-treated confocal plates (Perkin-
Elmer). Three replicate wells were used per condition. Cells were fixed and blocked as
above (section 2.13.1). Cells were permeablised using 0.1% Triton-X-100 (Sigma-
Aldrich) in PBS. The primary antibody NFκB p65 (RelA) (rabbit; clone C-20; Santa Cruz
Biotechnology) was applied at 1 in 100 in blocking buffer for 1 hour at room
temperature. Wells were washed 3 times with PBS, and the secondary antibody (goat
anti-rabbit conjugated to Alexa Fluor 488; Molecular Probes, Life Technologies) was
applied at 1 in 250 in 1 in 100 in blocking buffer for 1 hour at room temperature. Wells
were washed as above, and then stained with CellMask HCS Orange reagent for 30
minutes at room temperature to delineate the cytoplasm (1 in 20000 of stock in PBS;
Chapter 2 Materials and Methods
115
Molecular Probes, Life Technologies) and DAPI to delineate the nucleus, as above.
Cells were imaged using a Hermes WiScan Cell Imaging System (IDEA Biomedical) on
the 10× objective, with 100% coverage and 100% density of each well imaged to
acquire images of approximately 5×10⁴ cells/well. Images were analysed using Wiscan
software (IDEA Biomedical), to quantify the nuclear:cytoplasmic ratio of average RelA
fluorescence intensity, per well. Ratios were compared over time-courses to analyse
nuclear translocation.
2.14 Tuberculin skin tests
The study was approved by the research ethics committees of all sites and
institutions involved, and informed written consent was obtained from all participants.
2.14.1 TST injection and sample collection
TSTs were performed by intradermal injection of 2U purified protein derivative
(PPD) (Serum Stratens Institute) into the proximal third of the volar aspect of the
forearm. A subset of patients received saline injections (clinical grade saline, from local
clinical sites) as a control cohort. TSTs were assessed at 48 hours and two 3mm
punch skin biopsies were collected from the marked injection site which were collected
into either RNAlater reagent (Sigma-Aldrich) for RNA isolation, or 4% neutral buffered
formalin (NBF; LabSource) for adjunctive histological analysis. All TSTs and biopsies
were performed by trained clinical staff. Until processing, samples in RNAlater were
stored at −80°C and samples in 4%NBF were stored at room temperature.
2.14.2 Histological assessment of TST biopsy samples
After fixation in 4%NBF, biopsies were embedded in paraffin (performed by the
Department of Pathology, Groote Schuur Hospital, Cape Town, South Africa),
sectioned and mounted on slides, and stained with haemotoxylin and eosin (performed
by the University College London Hospital histopathology department). Digital images
were acquired with an AxioScan Z1 slide scanner (Zeiss) and are presented without
any subsequent processing. All histological assessments were performed by a
histopathologist blinded to concomitant clinical information.

Chapter 2 Materials and Methods
116
2.14.3 RNA isolation from TST biopsy samples
Biopsy samples were transferred into QIAzol reagent (Qiagen) and were
disrupted using a homogeniser (Omni International). RNA was purified from
homogenised samples using the Lipid Tissue RNeasy kit (Qiagen) according to the
manufacturer’s instructions. RNA was subject to DNase treatment using a TURBO
DNA-free kit (Ambion, Life Technologies) as per the manufacturer’s instructions to
remove contaminating genomic DNA. RNA quality and quantity was checked using
RNA Nanochips (Agilent) and an Agilent 2100 Bioanalyzer.
2.15 RNA isolation from peripheral blood samples
Blood samples for RNA isolation were collected into Tempus RNA blood tubes
(Life Technologies) and were stored at −80°C until processing. RNA processing of
blood samples was performed by Dr Jennifer Roe and Dr Gabriele Pollara, UCL
Division of Infection and Immunity. RNA was purified using a Tempus Spin RNA
Isolation Kit (Ambion; Life Technologies) and globin mRNA was eliminated using a
GlobinClear kit (Life Technologies) both according to the manufacturer’s instructions.
RNA was subject to DNase treatment using a TURBO DNA-free kit (Ambion, Life
Technologies) as per the manufacturer’s instructions to remove contaminating genomic
DNA. RNA quality and quantity was checked using RNA Nanochips (Agilent) and an
Agilent 2100 Bioanalyzer.
2.16 QuantiFERON-TB Gold assays
Blood samples for QuantiFERON-TB Gold (QFT) assays were collected into QFT
assay blood tubes (Qiagen) and processed according to the manufacturer’s
instructions to isolate plasma samples. Plasma samples were stored at −80°C until
processing. IFNγ in plasma samples was measured using the QFT ELISA kit according
to the manufacturer’s instructions.
2.17 Transcriptional profiling by cDNA microarray
2.17.1 Microarray methodology
The quantity and quality of all RNA samples was checked using RNA Nanochips
(Agilent) and the Agilent 2100 Bioanalyzer prior to processing for microarray analysis.

Chapter 2 Materials and Methods
117
Only RNA samples with an RNA integrity value (Rin) of greater than 6 were used for
microarrays. The Agilent Low RNA Input Linear Amplification Kit was used to generate
amplified cDNA and subsequently labelled cRNA, according to the manufacturer’s
instructions. Successful purification, labelling and intensity and cRNA concentration
were verified using a NanoDrop ND-1000 UV-VIS Spectrophotometer (Thermo
Scientific). Equal concentrations of Cy5-labelled and Cy3-labelled cRNA samples were
mixed and hybrised to Agilent 8×60k whole genome cDNA microarrays, according to
the manufacturer’s instructions. Array images were acquired with a dual-laser
G2565BA microarray scanner (Agilent) and signal data was collected and processed
using Agilent Feature Extraction software (v10.7.1.1).
2.17.2 Microarray data analysis
Raw microarray signal data were processed, log2 transformed, and subjected to
local regression (LOESS) normalisation to a baseline derived from gene expression
data of the appropriate cell type or tissue, using the agilp R package (Chain, 2012;
Chain et al., 2010; available at
http://www.bioconductor.org/packages/release/bioc/html/agilp.html) in R v3.0.2
(http://www.r-project.org/). This process also averages duplicate probe signal data.
Normalised log2 transformed gene expression data was used for all subsequent
analyses. Within datasets, data cleaning was performed before clustering, statistical
and bioinformatics analyses, by removing data from any microarray probe for which
signal never exceeded the baseline background signal in any sample, and for which
signal never varied by more than two-fold between any two samples.
Euclidean distance hierarchical clustering and statistical analyses of microarray
data were performed using MultiExperiment Viewer (MeV) v4.9.0
(http://www.tm4.org/mev.html). For experimental MDM gene expression data,
significant differences in gene expression between groups were assessed by paired t-
tests with a Welch’s correction for unequal variance, or unpaired tests where samples
were not derived from shared paired healthy donors. For clinical sample data, I
assumed data were not normally distributed, so elected to use non-paramteric tests
and thus assessed significant differences in gene expression between groups by
Wilcoxon rank sum tests. For both tests, a P value of <0.05 was considered significant.
The generated lists of significantly differently expressed genes were then subject to a
two-fold change cut-off between groups to produce gene lists for downstream
Chapter 2 Materials and Methods
118
bioinformatics analyses. These approaches have been used extensively in published
data from our group (Chain et al., 2010; Le Bert et al., 2011; Rasaiyaah et al., 2013;
Tomlinson et al., 2014, 2012, 2011; Tsang et al., 2009).
Bioinformatic analyses were performed using publicly available online tools. All
gene lists submitted for bioinformatics analyses were restricted to genes for which
annotation with a RefSeq accession number was available, and any duplicate genes
(by Gene Symbol) were removed. InnateDB (www.innatedb.com; Breuer et al., 2013)
was used to perform gene ontology (GO) and pathway enrichment analyses, using the
recommended default settings to identify significantly enriched GO terms and pathways
(a hypergeometric algorithm with a significance level of Benjamini-Hochberg
correction-adjusted P<0.05). InnateDB integrates GO term and pathway annotation
information from several publicly available databases, and the databases used for
particular analyses are indicated in the relevant figure legends. GO and pathway
enrichment analysis results are presented as network visualisations which were
generated using Gephi v0.8.2 (https://gephi.github.io/). Transcription factor binding site
(TFBS) enrichment analysis was performed using oPOSSUM-3 human single site
analysis (Kwon et al., 2012; http://opossum.cisreg.ca), which compares the rate of
occurrence of a TFBS in the submitted set of genes to the expected rate estimated
from the pre-computed background set, by describing the normal approximation to the
binomial distribution and determining how many standard deviations away from this the
gene-list rate of occurrence lies: the Z-score is equal to this number of standard
deviations. A Z score of greater than 10 is commonly accepted as significant.
Clustering analysis of microarray gene expression data was also performed by
principal component analysis (PCA), in R v3.0.2 using a package provided by
Professor Benjamin Chain. Modular analysis strategies were also used for microarray
data analysis purposes, and are discussed and outlined in Chapter 4.
2.18 Statistical analysis of experimental data
Statistical tests used for analyses of experimental data are indicated in the
relevant figure legends, and were performed using GraphPad Prism v6.0. =

Chapter 3 Results
119
Chapter 3. Results 1. Attenuation of IL-10 responses
by HIV-1 in human monocyte-derived macrophages
3.1 Background
Previous work has shown that HIV-1-infected MDMs display attenuated IL-10
responses to Mtb, which are associated with downstream exacerbated pro-
inflammatory responses to Mtb (Tomlinson et al., 2014). IL-10 is a critical
immunomodulatory cytokine, and so this phenotype may represent a novel host-virus
interaction with physiologically significant consequences. Elucidation of the mechanism
behind IL-10 attenuation is therefore merited, to characterize HIV-1 modulation of
macrophage function, and to further understand CMI dysfunction in HIV-1 infection.
The initial observation, that full-length replication-competent HIV-1 can attenuate
the MDM IL-10 response to Mtb, poses several questions. Is this phenotype Mtb-
specific, or can HIV-1 also attenuate IL-10 expression induced by other innate immune
stimuli? Does the phenotype require ongoing viral propagation with replicative virus, or
can it result from macrophage-autonomous infection? As HIV-1 has been shown to
modulate macrophage function in a number of ways (Introduction, section 1.3.8), it is
possible that IL-10 attenuation represents further direct modulation by the virus;
therefore, what are the viral determinants of the phenotype?
The pathways regulating IL-10 production in mononuclear phagocytes are complex
and highly context-specific (Introduction, section 1.5.2). Exploring which host
pathways are modulated by HIV-1 to produce specific attenuation of IL-10 while not
affecting pro-inflammatory cytokines may assist in elucidating the mechanism behind
the phenotype, and also provide insight into specific regulation of IL-10 responses.
I aimed to characterise the specificity of IL-10 attenuation, and the viral and host
determinants of this phenotype, by evaluating the following questions:
1) Does HIV-1 attenuate IL-10 responses to innate immune stimuli other than Mtb
in MDMs?
2) Is IL-10 attenuation by HIV-1 evident over the time-course of the innate immune
IL-10 response in MDMs?

Chapter 3 Results
120
3) If IL-10 attenuation represents direct modulation of macrophage function by
HIV-1, specific components of the viral lifecycle will be necessary and/or
sufficient for the phenotype.
a. Is viral entry necessary or sufficient to cause IL-10 attenuation?
b. Is HIV-1 integration necessary or sufficient to cause IL-10 attenuation?
c. Which expressed components of HIV-1 are necessary or sufficient to
cause IL-10 attenuation?
4) Type I IFNs have been shown to be involved in regulating IL-10 responses. Is
this evident in this MDM model, and does HIV-1 modulate this pathway?
5) Monocytes and DCs can also mount innate immune IL-10 responses. Are these
affected by HIV-1?
6) IL-10 can be regulated by post-transcriptional mechanisms. Does HIV-1 alter
IL-10 mRNA stability?
7) A range of innate immune signalling pathways have been implicated in
regulating IL-10 transcription in macrophages.
a. Which of these signalling pathways are important in MDM IL-10
responses?
b. Are any of these signalling pathways modulated by HIV-1 infection?

Chapter 3 Results
121
3.2 Results
3.2.1 IL-10 attenuation by HIV-1 is not Mtb-specific
The effect of infection with full-length HIV-1 Ba-L on MDM IL-10 responses was
assessed following stimulation with Mtb culture filtrate and a range of alternative innate
immune stimuli, including those which have previously been reported to induce IL-10,
or which share innate immune receptors for Mtb (Table 3.1). The primary cellular
response to stimulation was initially assessed at four hours. In these experiments, IL10
mRNA expression and IL-10 protein secretion were reduced in HIV-1 infected MDMs
compared to uninfected MDMs in response to all stimuli (Figure 3.1). Mtbfiltrate,
zymosan and curdlan induced the IL10 mRNA responses of the greatest magnitude,
which were statistically significantly attenuated by HIV-1 (Figure 3.1a). Pam2CSK4 and
LPS induced smaller IL-10 responses, which were attenuated by HIV-1, but this did not
reach statistical significance (Figure 3.1a, b).
These data suggest that HIV-1 inhibits IL-10 induction pathways which are
conserved in the innate immune responses to different stimuli, and so this phenotype is
not specific to Mtb. For further experiments evaluating the phenotype of IL-10
attenuation by HIV-1, I employed zymosan as a model inducer of IL-10 expression,
which stimulates similar PRRs to Mtb (TLR-2 and dectin-1; Table 3.1).
Stimulus Description Receptor Reference
MtbfiltrateFiltrate from M. tuberculosis 7H9
cultures
TLR-2, dectin-1,
TLR-4, othersTomlinson et al. 2014
ZymosanDerivative of the cell wall of the
fungus Saccharomyces cerevisiaeTLR-2, dectin-1 Gantner et al. 2004
Pam2CSK4 Synthetic diacylated lipopeptide TLR-2/6 Long et al. 2009
Curdlanβ-1,3-glucan from Alcaligenes
faecalisDectin-1 Goodridge et al. 2009
LPSUltra-pure lipopolysaccharide from
E. coli O111:B4TLR-4 Poltorak et al. 1998
Table 3.1: Innate immune stimuli used to induce IL-10 expression in MDMs.

Chapter 3 Results
122
Figure 3.1: IL-10 attenuation by HIV-1 is not Mtb-specific.
MDMs were infected with HIV-1 (full-length strain Ba-L at an MOI of 3-5) for 1 week,
and then stimulated for 4 hours with Mtb culture filtrate, zymosan (0.4mg/ml),
Pam2CSK4 (100ng/ml), curdlan (0.1mg/ml) or LPS (100ng/ml). (a) IL10 mRNA was
measured 4 hours post-stimulation by qRT-PCR. HIV-1 infected MDMs expressed
lower levels of IL10 mRNA in comparison to uninfected MDMs in response to all
stimuli, and a significantly lower level in response to Mtb filtrate, zymosan and curdlan
(b) IL-10 protein secretion at 4 hours was measured by ELISA of culture supernatants.
HIV-1 infected MDMs secreted lower levels of IL-10 in comparison to uninfected MDMs
in response to all stimuli, and significantly lower levels in response to zymosan. * =
P<0.05, paired t-test. Paired data points from the same experiment are indicated. Bars
represent the mean result +/- SEM of 4 experiments. Each experiment employed
MDMs from a single healthy blood donor, and a different donor was used for each
experiment. Both IL10 mRNA and IL-10 protein production varied up to fourfold
between different healthy donors; this magnitude of variation was seen consistently
across experiments.

Chapter 3 Results
123
3.2.2 A single-round model of HIV-1 infection can attenuate IL-10
Next, I investigated whether a single-round model of HIV-1 infection in MDM
was sufficient to attenuate IL-10 responses. On one hand, this experiment would
establish whether on-going viral propagation is necessary for the phenotype. More
importantly, using this approach would also allow further experiments to investigate the
virological determinants of IL-10 attenuation, as establishing confluent infection in a
single round mitigates the deleterious effects of viral mutations or deletions in a
spreading infection.
For this purpose, I used a HIV-1 clone (R9 Δenv) with a deletion in envelope
which is produced as a VSV-G pseudotyped virus, and so can infect cells but is not
capable of assembly, budding or propagation of infection (see Methods section 2.4.2
for all details of viruses). It should be noted that VSV-G pseudotyped viruses use
different receptors and potentially routes of entry to WT virus, and so the dynamics of
this infection may differ from the full-length model.
Vpx VLPs were used to maximise infection efficiency in this model (described in
Methods section 2.4.3). As use of Vpx VLPs involves entry of viral components into
the cell, which are functional and mediate cellular modulation such as degradation of
SAMHD1, it was possible that they had autonomous effects on IL-10 production, and
so MDMs were transduced with Vpx VLPs alone and IL-10 transcription was measured.
Vpx VLPs did not have any effect on IL-10 transcription autonomously, and so their use
should not alter the phenotype of IL-10 attenuation (Figure 3.2a).
Confluent infection of MDMs was achieved using the single-round model of
infection (Figure 3.2b, c). R9Δenv attenuated zymosan-induced IL10 mRNA
expression in MDMs at 4 hours post-stimulation, while IL6 mRNA expression was
unaffected (Figure 3.2d). Secretion of IL-10 at 4 hours was similarly attenuated while
IL-6 was again unaffected (Figure 3.2e).
These results demonstrate that a single-round infection by HIV-1 can lead to IL-
10 attenuation, similarly to full-length HIV-1. This suggests that ongoing viral
propagation is not required for IL-10 attenuation, nor are the Env-derived proteins. This
model was used to further investigate the virological determinants of IL-10 attenuation.

Chapter 3 Results
124
In all subsequent experiments using this model, control uninfected MDMs were
transduced with Vpx VLPs.

Chapter 3 Results
125
Figure 3.2: Single round infection by HIV-1 attenuates IL-10.
(a) MDMs were transduced with Vpx VLPs at 2ng RT/ml and stimulated 1 week
subsequently with zymosan (0.4mg/ml) for 4 hours. Vpx-transduced MDMs and control
MDMs expressed similar amounts of IL10 mRNA. (b) HIV-1 p24 staining of Vpx-only
transduced or single-round HIV-1 (R9Δenv, MOI of 3–5) plus Vpx transduced MDMs.
(c) Representative images of p24 stains. (d, e) MDMs were infected and stimulated
with zymosan as in (b). IL10 mRNA expression and protein secretion were significantly
attenuated in comparison to Vpx-only transduced MDMs. IL6 mRNA expression and
protein secretion were unaffected. mRNA expression was measured by qRT-PCR, and
cytokine secretion was measured by ELISA of cell culture supernatants. * = P<0.05,
n.s. = non-significant, paired t-test. Bars represent the mean result −/+ SEM of at least
3 experiments.

Chapter 3 Results
126
3.2.3 The time-course of the zymosan-induced IL-10 response and HIV-1
attenuation
To further evaluate the phenotype of IL-10 attenuation by HIV-1, I characterised
the time-course of the zymosan-induced IL-10 response, and for comparison, the pro-
inflammatory IL-6 and TNFα responses, and the effects of HIV-1 infection on these
responses over a time-course of 1–72 hours. Induction of IL10 mRNA expression in
response to zymosan was evident from 3 hours and peaked at 6 hours, before
returning to baseline levels by 24 hours (Figure 3.3a). Attenuation of this response by
HIV-1 was evident across the time-course, and was statistically significant at 3–6
hours. It was also clear that although HIV-1 attenuated IL10 mRNA expression, it did
not entirely inhibit it, as some IL10 mRNA expression was induced in HIV-1 infected
MDMs over a similar time-course to uninfected MDMs (Figure 3.3a). IL6 and TNFA
mRNA expression in response to zymosan was not attenuated by HIV-1 at any time-
point (Figure 3.3b, c).
Similar observations were made when measuring zymosan-induced cytokine
secretion over this time-course. IL-10 protein secretion was detected from 3 hours, at
which time IL-10 attenuation was already evident (Figure 3.4a). Peak levels of IL-10
were measurable in the MDM culture supernatants at 12 hours, and these then
declined over the following 60 hours (Figure 3.4a). HIV-1 attenuation was evident
across the time-course and was statistically significant at 3, 12 and 72 hours (Figure
3.4a). IL-6 and TNFα protein secretion was measured at 6, 24 and 72 hours, and was
evident across the time-course for both cytokines, with no clear diminution of these
responses over 72 hours, or as a result of HIV-1 infection (Figure 3.4b, c).
These results demonstrated that HIV-1 attenuated the innate immune IL-10
response to zymosan across the time-course of IL-10 production. They also confirmed
that attenuation was specific to the IL-10 response and did not similarly affect pro-
inflammatory cytokines.

Chapter 3 Results
127
Figure 3.3: The time-course of zymosan-induced cytokine mRNA expression.
MDMs were infected with HIV-1 (R9Δenv at an MOI of 3–5, with Vpx VLPs at 2ng
RT/ml) for 1 week and then stimulated with zymosan (0.4mg/ml) for 1–72 hours.
Cytokine mRNA expression was measured by qRT-PCR. (a) IL10 mRNA expression
was significantly attenuated by HIV-1 at 3 and 6 hours post-stimulation. (b) IL6 mRNA
expression was not altered by HIV-1 at any time-point. (c) TNFA mRNA expression was
not altered by HIV-1 at any time-point. * indicates P<0.05, paired t-test. Bars represent
the mean −/+ SEM of at least 3 experiments.
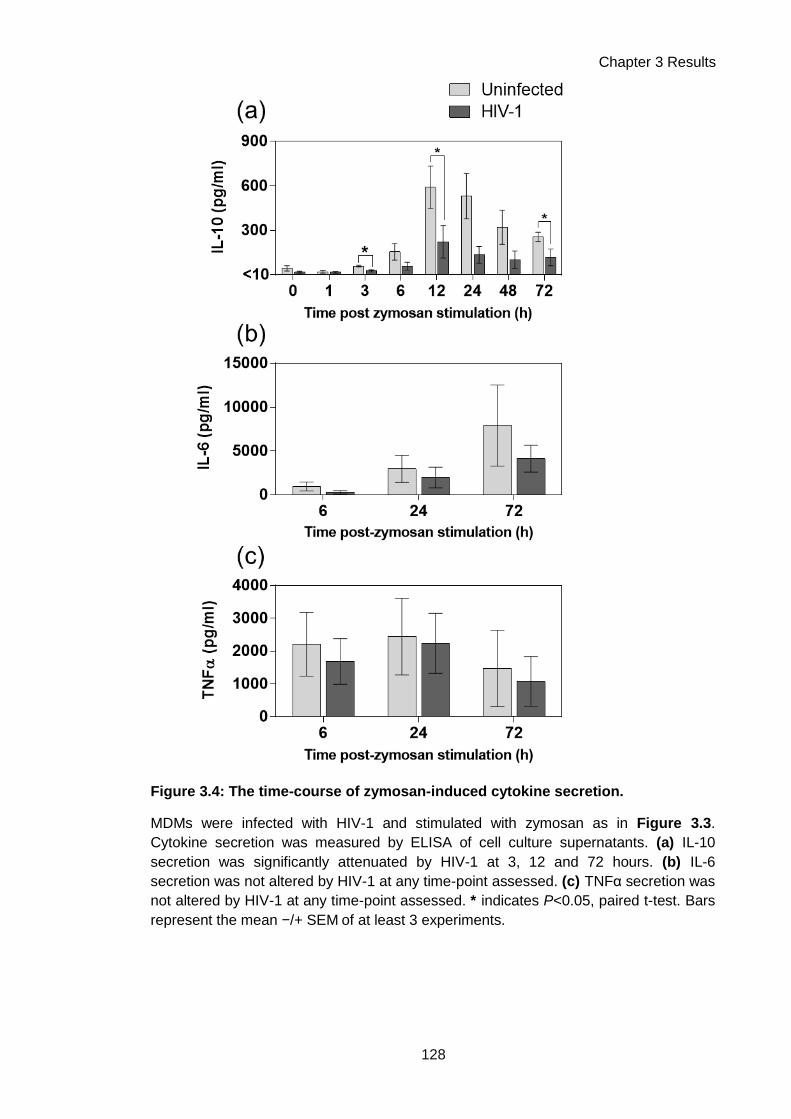
Chapter 3 Results
128
Figure 3.4: The time-course of zymosan-induced cytokine secretion.
MDMs were infected with HIV-1 and stimulated with zymosan as in Figure 3.3.
Cytokine secretion was measured by ELISA of cell culture supernatants. (a) IL-10
secretion was significantly attenuated by HIV-1 at 3, 12 and 72 hours. (b) IL-6
secretion was not altered by HIV-1 at any time-point assessed. (c) TNFα secretion was
not altered by HIV-1 at any time-point assessed. * indicates P<0.05, paired t-test. Bars
represent the mean −/+ SEM of at least 3 experiments.

Chapter 3 Results
129
3.2.4 IL-10 attenuation is not affected by protease inhibitors
Infection with a single-round model of HIV-1 infection demonstrated that viral
propagation is not necessary for IL-10 attenuation. Viral propagation can be also be
prevented by ARVs, which inhibit parts of the viral lifecycle. To test whether IL-10
attenuation could persist in the context of ART, the protease inhibitor indinavir was
supplemented into confluently HIV-1-infected MDM cultures, and IL-10 secretion in
response to zymosan was measured.
The mechanism of action of protease inhibitors is shown in Figure 3.5a. Briefly,
during budding, the HIV-1 particle undergoes a maturation process mediated by the
viral protease, which is necessary for infection of new cells (Flexner, 1998). HIV-1
clones lacking the protease gene produce only immature non-infectious viral particles
(Kohl et al., 1988), and protease inhibitors are understood to exert the same effect.
Addition of indinavir to infected MDMs led to a near-complete reduction in HIV-1
p24 measurable in the culture supernatant (Figure 3.5b), indicating that release of
mature virus was abrogated. IL-10 protein secretion in response to zymosan was
attenuated in infected MDMs supplemented with indinavir (Figure 3.5c). Indinavir
alone had no effect on cytokine secretion, and secretion of IL-6, assessed for
comparison, was unaffected in all conditions (Figure 3.5d). This supports conclusions
made based on the single-round virus experiments; that viral propagation is not
necessary for attenuation to occur. It also indicates that HIV-1 attenuation of
macrophage IL-10 responses might persist in the context of anti-retroviral therapy,
while a reservoir of non-productively infected macrophages remains.

Chapter 3 Results
130
Figure 3.5: Inhibition of HIV-1 protease does not alter IL-10 attenuation by HIV-1.
(a) Schematic of the protease inhibitor mechanism of action. (b) MDMs were infected
with HIV-1 for one week of spreading infection (full-length strain Ba-L, at an MOI of 3–
5) and then were treated with the protease inhibitor indinavir sulphate at 10µM for 3
days prior to zymosan stimulation. Inhibition of mature virion production was assessed
by p24 ELISA of cell culture supernatants. Indinavir sulphate treatment reduced p24
levels by 2 logs. (c, d) MDMs were stimulated with zymosan (0.4mg/ml) for 4 hours. IL-
10 and IL-6 secretion were assessed by ELISA of cell culture supernatants. HIV-1
significantly attenuated IL-10 secretion, and this was not altered by indinavir treatment.
Indinavir alone had no effect on IL-10 production. IL-6 secretion was not altered by
HIV-1 infection or indinavir treatment. * indicates P<0.05, paired t-test. Bars represent
the mean +/- SEM of 4 experiments.

Chapter 3 Results
131
3.2.5 HIV-1 entry is not sufficient for IL-10 attenuation
Treatment of viral particles with ultra-violet (UV) radiation dimerises viral nucleic
acids, which are then non-replicable, rendering the virus non-infectious (Mohr et al.,
2009). The consequences of UV treatment for HIV-1 are that the virus can enter the
cell, but is unable to reverse transcribe or integrate its genome, and thus is unable to
establish infection. UV-inactivated HIV-1 was used to assess whether viral entry was
sufficient to cause IL-10 attenuation, or whether the presence of viable viral nucleic
acid was necessary for the phenotype. No HIV-1 LTR transcript was detected in MDMs
infected with UV-treated virus after 1 week (Figure 3.6a), and there was no attenuation
of IL10 mRNA expression in response to zymosan (Figure 3.6b). IL-10 protein
secretion in response to zymosan was also reduced by HIV-1 but not by UV-treated
HIV-1, although these differences did not reach statistical significance (Figure 3.6d).
IL-6 responses were not affected (Figure 3.6c, e).
These data indicated that HIV-1 entry alone is not sufficient for IL-10
attenuation, but that carriage of viable viral genomes is required. I explored this
observation further, by assessing the relationship between the timing of HIV-1 infection
and the presence of the IL-10 attenuation phenotype (Figure 3.7). MDMs were infected
with HIV-1 at 1 week, 24 hours or 4 hours before zymosan stimulation, or were infected
at the same time as stimulation. MDMs which had been infected for 1 week or 24 hours
pre-stimulation displayed statistically significantly attenuated IL10 mRNA expression,
whereas those which had been infected for 4 hours or simultaneously with stimulation
did not (Figure 3.7a). The MDMs that were infected for 4 hours prior to stimulation, or
that were simultaneously infected with stimulation, were within the first 8 hours of viral
infection when they were assessed. Previous reports suggest that integration of the
HIV-1 pro-virus will not have occurred in this timeframe (Mohammadi et al., 2013), and
thus that nascent viral production will not have commenced. In-keeping with this
hypothesis, detectable HIV-1 RNA levels decreased over this time-frame (4–8 hours)
post-infection (Figure 3.7b), suggesting that de novo viral transcription from an
integrated provirus had not yet occurred. These results indicated that early post-entry
events are not sufficient for HIV-1 to attenuate IL-10 responses, but that subsequent
steps in the viral life-cycle involving the viral genome may be necessary, such as
integration of the HIV-1 provirus.

Chapter 3 Results
132
Figure 3.6: UV-inactivated HIV-1 does not attenuate IL-10.
MDMs were infected with HIV-1 (R9Δenv at an MOI of 3–5, with Vpx VLPs at 2ng
RT/ml), or an equivalent inoculum in which HIV-1 was UV-inactivated (UV-C, 254nm,
for 10 min). MDMs were stimulated with zymosan (0.4mg/ml) for 4 hours at 1 week
post-infection. mRNA expression was measured by qRT-PCR and secretion was
measured by ELISA of cell culture supernatants. (a) HIV-1 RNA was measured by qRT-
PCR for the HIV-1 LTR. No HIV-1 RNA was detectable in MDMs infected with UV-
inactivated HIV-1. (b) HIV-1, but not UV-inactivated HIV-1, significantly attenuated IL10
mRNA expression in response to zymosan. (c) IL6 mRNA expression was not altered
by HIV-1 infection. (c) HIV-1, but not UV-inactivated HIV-1, reduced IL-10 secretion in
response to zymosan. (d) IL-6 secretion was not altered by HIV-1 infection. * indicates
P<0.05, paired t-test. n.d., not detectable. Bars represent the mean −/+ SEM of 4
experiments.

Chapter 3 Results
133
Figure 3.7: The timing of IL-10 attenuation post-infection indicates that early
post-entry events are not sufficient.
MDMs were infected with HIV-1 (R9Δenv at an MOI of 3–5, with Vpx VLPs at 2ng
RT/ml) and then stimulated for 4 hours with zymosan (0.4mg/ml) at the indicated times
(0h, 4h, 24h, 1 week) post-HIV-1 infection (a) IL10 mRNA expression was measured by
qRT-PCR. Expression was significantly attenuated at 24h and 1 week post-HIV-1
infection, but not 4h post-infection or when zymosan and HIV-1 were added
simultaneously. (b) HIV-1 transcript in MDMs measured by qRT-PCR for the HIV-1
LTR. Viral RNA was detectable at 4 hours post-infection (the 0h HIV-1 condition, as all
conditions have 4 hours of zymosan stimulation after the infection), which dropped
approximately fourfold after 8 hours of infection, before rising >100-fold 28 hours post-
infection and remaining stable at this level for 1 week. * indicates P<0.05, paired t-test.
n.d., not detectable. Bars represent the mean −/+ SEM of 4 experiments.

Chapter 3 Results
134
3.2.6 Integration by HIV-1 is necessary but not sufficient for IL-10 attenuation
Once HIV-1 enters the cell, the RNA viral genome is reverse transcribed into a
DNA copy by the viral reverse transcriptase. This DNA is then integrated into the host
cell genome to form the HIV-1 provirus by the action of the viral integrase. To establish
if these events in the viral lifecycle are necessary for IL-10 attenuation, a full-length
HIV-1 clone with a mutation in the integrase active site was employed (Rasaiyaah et al.,
2013), which is capable of cell entry and reverse transcription but not integration (see
Methods section 2.4.2 for details of this virus). MDMs were infected with this virus
(HIV-1ΔIN) or its WT parent virus. Confluent infection with the WT virus was confirmed
at 2 weeks post-infection by HIV-1 p24 staining of MDM cultures (Figure 3.8a, b).
MDMs infected with HIV-1ΔIN were negative for HIV-1 p24, confirming that this virus
could not establish replicative infection (Figure 3.8a, b). IL-10 secretion in response to
zymosan was statistically significantly attenuated by WT HIV-1 but not by HIV-1ΔIN
(Figure 3.8c), suggesting that integration is necessary for IL-10 attenuation to occur.
Insertion of viral DNA into the host genome has an inherent mutagenic potential,
and can lead to dysregulation of expression of host genes (Cavazza et al., 2013).
Proviral integration itself may thus have consequences for cell function, irrespective of
the transcription and production of new viral components. IL-10 attenuation may
therefore be a consequence of integration itself. To assess whether integration was
sufficient to cause IL-10 attenuation, I employed a HIV-1 based viral vector (HR’)
carrying a genome with just the GFP gene, and no HIV-1 components other than the
viral LTRs (see Methods section 2.4.2 for details). The absence of mature HIV-1
proteins expressed after infection with this virus was confirmed by negative HIV-1 p24
staining of transduced cells (Figure 3.9a, c). Successful integration of the sequence
carried by HR’ was confirmed by measuring transcription from the HIV-1 LTR, which
was present, albeit at lower levels than with single-round HIV-1 (Figure 3.9b).
HR’-transduced cells did not exhibit attenuated IL-10 responses at the level of
mRNA expression or protein secretion, in comparison to single-round HIV-1, which
statistically significantly attenuated both (Figure 3.9c, e). IL6 mRNA expression was
not affected by either virus (Figure 3.9d). This suggests that integration alone is not
sufficient for IL-10 attenuation, but that it is necessary for the provirus to express HIV-1
genes.

Chapter 3 Results
135
Figure 3.8: An integrase mutant of HIV-1 does not attenuate IL-10.
MDMs were infected with HIV-1 (full length strain NL4.3 BaL, MOI of 15) or an integrase
deficient (ΔIN) mutant (NL4.3 BaLΔIN – D116N) for 2 weeks of spreading infection. (a) Cultures
were stained for HIV-1 p24 to enumerate infected cells. HIV-1 p24 staining of cells infected with
the ΔIN mutant did not significantly exceed background levels. (b) Representative images of
HIV-1 p24 staining (blue). (c) MDMs were stimulated with zymosan (0.4mg/ml) and IL-10
secretion was measured by ELISA of cell culture supernatants. HIV-1 significantly attenuated
IL-10 secretion in comparison to uninfected MDMs or MDMs infected with the ΔIN mutant. HIV-
1ΔIN did not attenuate IL-10 secretion. * indicates P<0.05, paired t-test. n.s., not significant.
Bars represent the mean −/+ SEM of 4 experiments.

Chapter 3 Results
136
Figure 3.9: A HIV-1-based lentiviral vector does not attenuate IL-10.
MDMs were infected with HIV-1 (R9Δenv at an MOI of 3–5, with Vpx VLPs at 2ng RT/ml), or a
HIV-1-based viral vector (HR’) carrying only the eGFP gene under the control of the CMV
promoter (7ng RT/ml with Vpx VLPs at 2ng RT/ml). MDMs were stimulated with zymosan
(0.4mg/ml) for 4 hours at 1 week post-infection. mRNA expression was measured by qRT-PCR
and secretion was measured by ELISA of cell culture supernatants. (a) Cultures were stained
for HIV-1 p24 to enumerate infected cells. Staining of cells infected with HR’ did not significantly
exceed background levels. (b) HIV-1 transcript was measured by qRT-PCR for the HIV-1 LTR,
and was detectable in cells infected with HIV-1 or HR’, but was significantly less in those
infected with HR’. (c) Representative images of HIV-1 p24 staining (blue). (d) HIV-1, but not
HR’, significantly attenuated IL10 mRNA expression in response to zymosan. (e) IL6 mRNA
expression was not affected. (f) HIV-1, but not HR’, reduced IL-10 secretion in response to
zymosan. * indicates P<0.05, paired t-test. n.d., not detectable. Bars represent the mean −/+
SEM of 3 experiments.

Chapter 3 Results
137
3.2.7 HIV-1 Gag-Pol is not necessary for IL-10 attenuation
As integration of a provirus containing HIV-1 genetic material was necessary for
IL-10 attenuation, I next investigated which HIV-1 gene products were necessary for
this phenotype. The single-round virus, deleted in env, suggested that the Env-derived
viral glycoproteins gp120 and gp41 were not necessary for attenuation. To assess
whether components of the HIV-1 gagpol coding region, wherein the viral capsid and
enzymes are encoded, were necessary for IL-10 attenuation, a mutant clone of HIV-1
(GagLucGFP) was used. In this virus, Gag-Pol expression is disrupted by cloning of
the luciferase gene into this region (see Methods section 2.4.2 for details). Infectious
particles are produced using a separate Gag-pol expressor packaging plasmid.
Deficiency of HIV-1 capsid protein expression using GagLucGFP was
confirmed by the absence of HIV-1 p24 staining in infected MDMs (Figure 3.10a, c),
which also confirms the absence of immature HIV-1 gag p55. Transcription from the
integrated provirus was confirmed by measurement of HIV-1 LTR transcript (Figure
3.10b). Expression of viral accessory proteins in the absence of HIV-1 capsid
expression in GagLucGFP infection was confirmed by western immunoblotting for HIV-
1 gag p55 and p24 and the accessory protein Vif (Figure 3.10d). The absence of viral
enzymes was confirmed by an RT-ELISA of concentrated supernatants from HEK293T
cells transfected with GagLucGFP plasmid with or without a Gag-Pol expressor
plasmid. This showed that no RT was detectable in the latter condition (Figure 3.10e).
IL10 mRNA expression in response to zymosan was reduced in MDMs infected
with both WT HIV-1 and GagLucGFP, but this did not reach statistical significance in
either condition (Figure 3.11a). However, IL-10 secretion was statistically significantly
reduced by both WT HIV-1 and GagLucGFP (Figure 3.11c). IL6 mRNA expression
was not affected by either virus (Figure 3.11b). These results suggest that Gag-Pol
expression is not necessary for IL-10 attenuation, and thus that the viral components
encoded in this region – capsid proteins, integrase, reverse transcriptase and protease
– are not necessary for this phenotype.

Chapter 3 Results
138
Figure 3.10: Infection using GagLucGFP, a HIV-1 mutant which does not express Gag-
Pol.
MDMs were infected with HIV-1 (R9Δenv at an MOI of 3–5, with Vpx VLPs at 2ng RT/ml), or a
HIV-1 mutant with the luciferase gene cloned into the GagPol coding sequence to disrupt it
(GagLucGFP; at 7ng RT/ml with Vpx VLPs at 2ng RT/ml). Assessments were made 1 week
post-infection. (a) Cultures were stained for HIV-1 p24 to enumerate infected cells. Staining of
cells infected with GagLucGFP did not significantly exceed background levels. (b) HIV-1 RNA
was measured by qRT-PCR for the HIV-1 LTR, and was detectable in cells infected with HIV-1
or GagLucGFP, but was less in those infected with GagLucGFP. (c) Representative images of
HIV-1 p24 staining (blue). (d) Western immunoblotting for HIV-1 proteins. Capsid proteins p55
gag and p24 were detectable in cells infected with HIV-1, but not GagLucGFP. The HIV-1
accessory protein Vif was detectable in both infections. β-actin was used as a loading control.
(e) Supernatants from HEK293T cells transiently transfected with the indicated plasmids were
concentrated by ultracentrifugation and HIV-1 RT was measured by an RT ELISA. RT was not
detectable in supernatants derived from GagLucGFP transfection unless a Gag-Pol expression
plasmid (p8.91) was also transfected, indicating lack of functional RT in GagLucGFP. n.d., not
detectable. Bars represent the mean −/+ SEM of 3 experiments.

Chapter 3 Results
139
Figure 3.11: The HIV-1 mutant GagLucGFP attenuates IL-10.
MDMs infected as in Figure 3.10 were stimulated with zymosan (0.4mg/ml) for 4 hours.
(a) IL10 mRNA expression was measured by qRT-PCR, and was significantly induced
by zymosan. HIV-1 and GagLucGFP both reduced IL10 mRNA expression but this was
not significant. (b) IL6 mRNA expression was not altered by either virus. (c) IL-10
secreted by MDMs was measured by ELISA of cell culture supernatants. HIV-1 and
GagLucGFP significantly attenuated IL-10 secretion in response to zymosan. There
was no significant difference between levels of IL-10 secreted by HIV-1 infected or
GagLucGFP infected MDMs. * indicates P<0.05, paired t-test. Bars represent the mean
−/+ SEM of 3 experiments.

Chapter 3 Results
140
3.2.8 The HIV-1 accessory proteins Nef, Vif and Vpr are not individually
necessary for IL-10 attenuation
HIV-1 Gag-Pol and Env expression were shown not to be necessary for IL-10
attenuation but the role of the other six HIV-1 proteins in the mechanism of this
phenotype remained to be explored. The viral regulatory proteins are Tat and Rev,
which transactivate viral transcription and co-ordinate viral RNA transport respectively.
As a result, Tat and Rev are difficult to assess in isolation via deletion, as their function
is necessary for expression of all HIV-1 genes. The other four accessory proteins are
non-essential for infection of cells by HIV-1, but provide functions which enhance
replication such as counteracting host restriction factors (Strebel, 2013). The
consequences of their loss-of-function can thus be assessed using a high-efficiency
single-round model of infection such as the one presented in Figure 3.2. Using this
model, the consequences of the loss-of-function of these proteins for propagation of
infection are mitigated by achieving confluent infection of the culture in a single
transduction.
To assess the role of accessory proteins in IL-10 attenuation, deleterious
mutations in the genes encoding for the accessory proteins Vif, Nef and Vpr were
cloned into the R9Δenv single-round infection background (see Methods section 2.4.2
for details of mutants). Establishment of confluent infection in MDM cultures using
these mutants was confirmed by HIV-1 p24 staining (Figure 3.12a, c), and they also
displayed similar levels of viral transcript as the WT virus (Figure 3.12b). Deletions of
Vif and Nef were confirmed by western blotting (Figure 3.13); suitable antibody
reagents to confirm the Vpr deletion were not identified.
All mutants tested statistically significantly attenuated IL10 mRNA expression in
response to zymosan (Figure 3.14a), while IL6 mRNA expression was unaffected
(Figure 3.14b). IL-10 protein secretion was also significantly attenuated by all mutants
(Figure 3.14c), excepting the HIV-1Δvif mutant, which non-statistically significantly
attenuated IL-10 secretion. This suggests that the HIV-1 accessory proteins Nef, Vif
and Vpr are not necessary for IL-10 attenuation.

Chapter 3 Results
141
Figure 3.12: Infection with HIV-1 clones with mutations in the accessory
genes Nef, Vif and Vpr.
MDMs were infected with HIV-1 clones with mutations in the accessory genes Nef, Vif
and Vpr. These mutants were all in the single-round infection R9Δenv background and
were used at an MOI of 3–5, with Vpx VLPs at 2ng RT/ml. Assessments were made 1
week post-infection. (a) Cultures were stained for HIV-1 p24 to enumerate infected
cells. Staining of cells infected with deletion mutants was equivalent to that with WT
virus. (b) HIV-1 RNA was measured by qRT-PCR for the HIV-1 LTR, and was
equivalent in cells infected with deletion mutants to that with WT virus. (c)
Representative images of HIV-1 p24 staining (blue). Bars represent the mean −/+ SEM
of at least 3 experiments.

Chapter 3 Results
142
Figure 3.13: Confirmation of HIV-1 accessory protein deletions by western
blotting.
MDMs were infected with HIV-1 clones with mutations in the accessory genes Nef, Vif
and Vpr as in Figure 3.12. Western immunoblotting for Nef and Vif was performed to
confirm deletions. Immunoblotting for HIV-1 p55 gag and p24 was performed to confirm
HIV-1 infection, and β-actin was used as a loading control.

Chapter 3 Results
143
Figure 3.14: HIV-1 clones with mutations in the accessory genes Nef, Vif and Vpr
attenuate IL-10.
MDMs infected as in Figure 3.12 were stimulated with zymosan (0.4mg/ml) for 4 hours.
mRNA expression was measured by qRT-PCR and secretion was measured by ELISA
of cell culture supernatants. (a) IL10 mRNA expression was significantly attenuated by
WT HIV-1 and all mutants. (b) IL6 mRNA expression was not affected by any virus
used. (c) IL-10 secreted by MDMs was significantly attenuated by WT HIV-1 and all
mutants tested, except HIV-1Δvif, in which secretion was non-significantly reduced
(P=0.054). * indicates P<0.05, paired t-test. Bars represent the mean −/+ SEM of at
least 3 experiments.

Chapter 3 Results
144
3.2.9 Type I IFN does not induce IL-10 in human MDMs
Recently, investigations of type I IFN responses in mycobacterial infection have
suggested that they may exert an immunosuppressive effect by inducing IL-10
expression in monocytes and macrophages (Mayer-Barber et al., 2011; McNab et al.,
2013; Teles et al., 2013). Corroboration of this observation in human MDMs, and
investigation of whether HIV-1 could attenuate such a pathway, may provide insight
into both the mechanism and the stimulus-specificity of IL-10 attenuation. Therefore, I
sought to test whether induction of IL-10 expression by type I IFNs in human MDMs
occurs, and if so, whether this can be attenuated by HIV-1 infection.
Stimulation of MDMs for 24 hours with either IFNα or IFNβ did not induce IL-10
mRNA expression or protein secretion (Figure 3.15a, b). This phenotype was not
affected by HIV-1 infection. Type I IFN responses in MDMs at this time-point were
confirmed by measuring mRNA of a prototypic IFN responsive gene, IFI16 (Trapani et
al., 1994), which was induced by both IFNα and IFNβ (Figure 3.15c). These data
suggest that type I IFNs do not induce IL-10 responses over this time-course in M-CSF
differentiated human MDMs, although they do induce other gene expression changes.
In mouse models, it has been reported that type I IFNs may be involved in
inducing IL-10 expression in the context of innate immune stimulation, wherein LPS-
induced IFNβ acts on macrophages in an autocrine fashion to mediate the LPS-
induced IL-10 response (Chang et al., 2007). To test whether this mechanism played a
role in zymosan-induced IL-10 responses and attenuation of these by HIV-1, MDMs
were stimulated with zymosan in the presence of neutralising antibody to the β chain of
the IFNα/β receptor (anti-IFNAR2), a method which has been shown to effectively
neutralise type I IFN responses in MDM cultures (Rasaiyaah et al., 2009). Anti-IFNAR2
supplementation had no effect on zymosan-induced IL-10 mRNA expression or protein
secretion, or HIV-1 attenuation thereof (Figure 3.16), suggesting that type I IFN does
not contribute to this phenotype.

Chapter 3 Results
145
Figure 3.15: Type I IFNs do not induce IL-10 production in human MDMs.
MDMs were infected with HIV-1 (R9Δenv at an MOI of 3–5, with Vpx VLPs at 2ng
RT/ml) for 1 week, and stimulated with zymosan (Zym., 0.4mg/ml) for 4 hours, or either
IFNα or IFNβ (200IU/ml) for 24 hours. (a) IL10 mRNA expression was measured by
qRT-PCR. Zymosan induced IL10 mRNA expression, which was attenuated in HIV-1
infected MDMs. IFNα and IFNβ did not induce IL10 mRNA expression. (b) IL10 protein
secretion was measured by ELISA of cell culture supernatants. Zymosan induced IL10
secretion, which was attenuated in HIV-1 infected MDMs. IFNα and IFNβ did not
induce IL-10 secretion. (c) IFI16 mRNA expression was measured by qRT-PCR. Both
IFNα and IFNβ induced IFI16 mRNA expression. * indicates P<0.05, paired t-test. Bars
indicate the mean +/- SEM of at least 3 experiments.

Chapter 3 Results
146
Figure 3.16: Type I IFNs do not contribute to zymosan-induced IL-10
responses.
MDMs were infected with HIV-1 (R9Δenv at an MOI of 3–5, with Vpx VLPs at 2ng RT/ml)
for 1 week, and stimulated with zymosan (Zym., 0.4mg/ml) for 4 hours, with or without
neutralising antibody to the β chain of the IFNα/β receptor (anti-IFNAR2, 1μg/ml). (a) IL-10
mRNA expression was measured by qPCR. Zymosan induced IL-10 mRNA expression,
and this was attenuated by HIV-1. This phenotype was not altered by anti-IFNAR2
supplementation. (b) IL-10 secretion was measured by ELISA of cell culture supernatants.
Zymosan induced IL-10 secretion, and this was attenuated by HIV-1. This phenotype was
not altered by anti-IFNAR2 supplementation. * indicates P<0.05, paired t-test. Bars
indicate the mean +/- SEM of at least 3 experiments.

Chapter 3 Results
147
3.2.10 IL-10 attenuation by HIV-1 is context-specific
IL-10 can be produced by cells of the mononuclear phagocyte system other
than macrophages, such as monocytes and DCs (Saraiva and O’Garra, 2010).
Therefore, in order to assess the cell specificity of IL-10 attenuation by HIV-1, I tested
the effect of HIV-1 infection on innate immune IL-10 responses in peripheral blood
monocytes, MDMs differentiated with GM-CSF rather than M-CSF, and MDDCs
differentiated with IL-4 and GM-CSF. This may provide insight into the mechanism of
IL-10 attenuation, as different signalling pathways are thought to be involved in the
induction of IL-10 responses in different myeloid cells (Saraiva and O’Garra, 2010), as
well as determining the context-specificity of this phenotype.
All cell types were infected using the single-round (R9Δenv with Vpx VLPs)
model of HIV-1 infection, thus overcoming post-entry restrictions that have previously
been reported in monocytes, GM-CSF differentiated MDM or MDDC. After 24 hours of
infection, cells were stimulated with either zymosan, as an innate immune inducer of
IL-10, or IFNβ, to assess whether type I IFNs induce IL-10 in cell types other than
macrophages. HIV-1 transcription could be measured in all cell types 24 hours post-
infection, suggesting that the virus had successfully integrated and was transcribing in
all contexts tested (Figure 3.17a). IL10 mRNA expression was induced by zymosan in
monocytes, M-CSF MDMs and MDDCs, but not in GM-CSF MDMs (Figure 3.17b).
HIV-1 statistically significantly attenuated this response in M-CSF MDMs only (Figure
3.17b). Significant induction of IL10 mRNA expression by IFNβ was not observed in
any cell type. TNFA mRNA expression was measured to assess pro-inflammatory
responses, and occurred in response to zymosan in all cell types. This was unaffected
by HIV-1 infection (Figure 3.17b).
Zymosan induced IL-10 protein secretion in monocytes and M-CSF MDMs
(Figure 3.18a). IL-10 protein secretion was also evident in MDDCs, but this experiment
was not adequately powered to reach statistical significance, and GM-CSF MDMs did
not secrete IL-10 under any condition (Figure 3.18a). HIV-1 infection significantly
attenuated IL-10 protein secretion in M-CSF MDMs (Figure 3.18a), in-keeping with
previous data (Figure 3.1). In monocytes, HIV-1 infection was associated with reduced
zymosan-induced IL-10 secretion, but this did not reach statistical significance (Figure
3.18a).

Chapter 3 Results
148
Induction of IL-10 by type I IFN was only observed in MDDCs, which secreted
IL-10 after stimulation with IFNβ; however, this failed to reach statistical significance
(Figure 3.18a). Cellular responses to IFNβ were confirmed by measuring IFI16 mRNA
expression, which was induced by IFNβ in all cell types (Figure 3.18b).
These results demonstrate striking cell-type specificity, in both the magnitude of
IL-10 responses to zymosan and in the effect of HIV-1 infection on these. Considering
the fact that equivalent levels of HIV-1 infection and pro-inflammatory cytokine
responses are observed in all cell types tested, these results strongly suggest that
innate immune IL-10 responses are differentially regulated in each cell, and
consequently that there is a context-specific effect of the virus in exerting IL-10
attenuation.
Any role for type I IFN in inducing IL-10 responses is not demonstrated by
these experiments. IFNβ does not induce IL-10 in human monocytes over 24 hours
(Figure 3.17b, Figure 3.18a) as previously reported (Teles et al., 2013). The only
context tested in which any IL-10 is produced in response to IFNβ is a secretory
response in MDDCs, but that did not reach significance (Figure 3.18a), and IL10 gene
expression is not induced by IFNβ in these cells (Figure 3.17b).
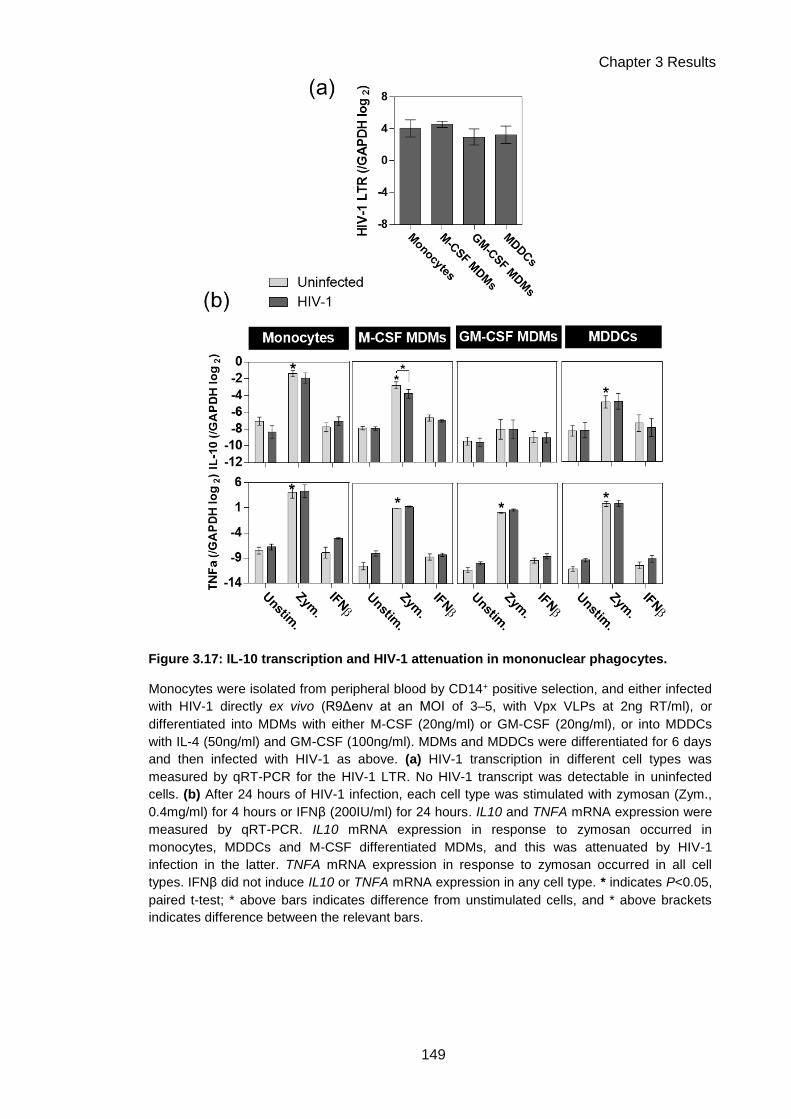
Chapter 3 Results
149
Figure 3.17: IL-10 transcription and HIV-1 attenuation in mononuclear phagocytes.
Monocytes were isolated from peripheral blood by CD14+ positive selection, and either infected
with HIV-1 directly ex vivo (R9Δenv at an MOI of 3–5, with Vpx VLPs at 2ng RT/ml), or
differentiated into MDMs with either M-CSF (20ng/ml) or GM-CSF (20ng/ml), or into MDDCs
with IL-4 (50ng/ml) and GM-CSF (100ng/ml). MDMs and MDDCs were differentiated for 6 days
and then infected with HIV-1 as above. (a) HIV-1 transcription in different cell types was
measured by qRT-PCR for the HIV-1 LTR. No HIV-1 transcript was detectable in uninfected
cells. (b) After 24 hours of HIV-1 infection, each cell type was stimulated with zymosan (Zym.,
0.4mg/ml) for 4 hours or IFNβ (200IU/ml) for 24 hours. IL10 and TNFA mRNA expression were
measured by qRT-PCR. IL10 mRNA expression in response to zymosan occurred in
monocytes, MDDCs and M-CSF differentiated MDMs, and this was attenuated by HIV-1
infection in the latter. TNFA mRNA expression in response to zymosan occurred in all cell
types. IFNβ did not induce IL10 or TNFA mRNA expression in any cell type. * indicates P<0.05,
paired t-test; * above bars indicates difference from unstimulated cells, and * above brackets
indicates difference between the relevant bars.

Chapter 3 Results
150
Figure 3.18: IL-10 secretion, HIV-1 attenuation and IFN responses in
mononuclear phagocytes.
For details of cell differentiation, HIV-1 infection and stimulation, please see Figure
3.17 legend. (a) IL-10 protein secretion was measured by ELISA of cell culture
supernatants. Secretion of IL-10 in response to zymosan occurred in monocytes and
M-CSF differentiated MDMs, and this was attenuated by HIV-1 infection in the latter.
Significant induction of IL-10 secretion did not occur in HIV-1 infected monocytes.
IL-10 secretion was observed in response to zymosan and IFNβ in MDDCs, but this
was not significant in comparison to unstimulated MDDCs. (b) IFI16 mRNA expression
was measured by qRT-PCR, and occurred in response to IFNβ in all cell types. *
indicates P<0.05, paired t-test. Bars indicate the mean +/- SEM of at least 3
experiments.

Chapter 3 Results
151
3.2.11 HIV-1 does not accelerate IL-10 mRNA decay
In addition to being controlled transcriptionally, inflammatory responses can
also be regulated by effects on mRNA stability and decay (Hao and Baltimore, 2009),
for example by the activity of RNA-degrading enzymes, or via the action of micro-
RNAs. The molecular details of some of these mechanisms have been elucidated for
pro-inflammatory cytokines such as IL-6 (Iwasaki et al., 2011) and TNFα (Carballo et
al., 1998) and also for IL-10 (Stoecklin et al., 2008; Teixeira-Coelho et al., 2013). I
therefore sought to test the hypothesis that reduction of IL10 mRNA levels observed in
the context of HIV-1 infection could be due to accelerated IL10 mRNA decay. This
hypothesis might underpin the observation that some induction of IL10 mRNA by
zymosan was still evident in HIV-1 infected MDM.
To measure cytokine mRNA decay rates, an inhibitor of transcription,
actinomycin D, was employed. Actinomycin D prevents any new transcription by
inhibiting RNA polymerase II (Sobell, 1985), and so sequential measurements of
mRNA levels after its addition can be used to plot the rate of mRNA decay. MDMs with
and without HIV-1 infection were stimulated with zymosan for 3 hours, after which
actinomycin D was added. Measurements of mRNA levels were then made over the
following 3 hours.
As expected, less IL10 mRNA was induced by zymosan in HIV-1 infected
MDMs (Figure 3.19a). Decay of IL10 mRNA clearly occurred over 3 hours in both
unstimulated and zymosan-stimulated cells, and this was shown to be statistically
significant by two-way ANOVA (Figure 3.19a). IL10 mRNA decay rates appeared
similar in HIV-1 infected MDMs (Figure 3.19a). Decay rates were quantified by fitting a
one-phase decay curve and measuring the mRNA half-life (Table 3.2). The half-lives
calculated for IL10 mRNA were longer in HIV-1 infected MDMs, suggesting that the
mRNA was in fact more stable in this context, rather than less stable. This suggests
that HIV-1 does not attenuate IL-10 by accelerating the rate of IL10 mRNA decay.
The effects of HIV-1 on pro-inflammatory cytokine mRNAs were also measured.
Statistically significant decay over this time-course was detected for TNFA mRNA in
unstimulated and zymosan-stimulated MDMs, and for IL1B mRNA in unstimulated
MDMs (Figure 3.19b, c). IL1B and IL6 mRNA in zymosan-stimulated MDMs did not
show statistically significant decay rates, potentially reflecting increased stability of
these mRNAs due to activation of inflammatory signalling (Figure 3.19c, d, Hao and

Chapter 3 Results
152
Baltimore, 2009)). HIV-1 did not accelerate any cytokine mRNA decay rates, but in fact
stabilised all cytokine mRNAs measured, as quantified by one-phase decay half-lives.
These were increased for all mRNAs measured, or in some cases could no longer be
calculated as decay curves could no longer be fitted to the data (Table 3.2).
These results demonstrate that HIV-1 does not attenuate IL-10 responses by
modulating cytokine mRNA decay pathways. However, they do strongly suggest that
cytokine mRNA is differentially regulated in HIV-1 infected MDMs, as all cytokine
mRNAs tested were found to be more stable in this context.
Table 3.2: Cytokine mRNA half-lives calculated from one phase decay curves.
Half-lives for cytokine mRNAs were calculated from fitted one-phase decay curves
using GraphPad Prism 6. Where significant decay curves could not be fitted,
suggesting that mRNA did not decay, half-lives are not presented (indicated by n/a).
Zymosan stimulation increased the half-life of TNFA mRNA and prevented decay of
IL1B mRNA. HIV-1 infection increased half-lives or prevented decay for all cytokine
mRNAs measured. Data are derived from the results of 3 experiments.

Chapter 3 Results
153
Figure 3.19: HIV-1 does not accelerate cytokine mRNA decay.
MDMs were infected with HIV-1 (R9Δenv at an MOI of 3–5, with Vpx VLPs at 2ng RT/ml) for 1
week and then stimulated with zymosan (0.4mg/ml) for 3 hours, at which time actinomycin D
(an RNA polymerase II inhibitor) was added to cultures at 10ug/ml to inhibit further transcription.
RNA samples were collected at 0, 30, 60, 120 and 180 minutes post-actinomycin D addition.
Levels of cytokine mRNA at each time-point were measured by qRT-PCR. One-phase decay
curves were fitted to data using GraphPad Prism 6. Symbols show mean mRNA level −/+ SEM
at each time-point and lines show one-phase decay curves. The X-axis shows time post-
actinomycin D addition. Statistical assessment was performed by two-way ANOVA, with P<0.05
used to determine significance. (a) IL10 mRNA measurements and decay curves. Significant
decay of IL10 mRNA was observed across this time-course in all conditions. (b) TNFA mRNA
measurements and decay curves. Significant decay of TNFA mRNA was observed across this
time-course in all conditions. (c) IL1B mRNA measurements and decay curves. Significant
decay of IL1B mRNA was observed across this time-course in unstimulated MDMs, with and
without HIV-1 infection. (d) IL6 RNA mRNA measurements and decay curves. No significant
decay of IL6 mRNA was detected across this time-course in any condition. IL6 RNA was not
detected in unstmulated MDMs. RNA half-lives, calculated from one-phase decay curves, are
presented in Table 3.2. Data are derived from the results of 3 experiments.

Chapter 3 Results
154
3.2.12 HIV-1 does not attenuate zymosan-induced NFκB translocation
HIV-1 did not modulate IL-10 mRNA post-transcriptionally by accelerating its
decay. It also did not act at the level of receptor signalling, as attenuation was
observed downstream of multiple PRRs (Figure 3.1). This indicates that that the
mechanism of attenuation involves the signalling pathways controlling IL-10
transcription downstream of PRR signalling.
Diminution of the activity of a signalling pathway, rather than complete
inhibition, would account for the observed incomplete inhibition of IL-10 transcription.
Previous investigations have shown that LPS-induced NFκB pathway activation is
attenuated in HIV-1 infected MDMs (Noursadeghi et al., 2009). The NFkB pathway has
been implicated in the control of IL-10 responses in macrophages (Saraiva and
O’Garra, 2010), but NFkB attenuation was not previously observed to be associated
with IL-10 attenuation (Noursadeghi et al., 2009). However, LPS is not a strong inducer
of IL-10 responses in M-CSF differentiated MDMs (Figure 3.1b), and so significant IL-
10 attenuation may simply not have been evident in that context. I investigated NFκB
activation in response to zymosan, which does induce substantial IL-10 responses in
MDMs.
NFκB activation was measured by assessing nuclear translocation of the RelA
subunit of NFκB, quantified as a nuclear/cytoplasmic ratio of this protein. Induction of
translocation by zymosan from 30−120 minutes was statistically significant by two-way
ANOVA, and equivalent in uninfected and HIV-1 infected MDMs (Figure 3.20). This
suggests that attenuation of NFκB signalling is not the mechanism of IL-10 attenuation
in HIV-1 infected MDMs, as no clear attenuation occurs during stimulation with a strong
inducer of IL-10.

Chapter 3 Results
155
Figure 3.20: HIV-1 does not alter zymosan-induced NFκB translocation.
MDMs were infected with HIV-1 (R9Δenv at an MOI of 3–5, with Vpx VLPs at 2ng
RT/ml) for 1 week and then stimulated with zymosan (0.4mg/ml) for 0–120 minutes. (a)
Activation of the NFκB pathway was measured by quantitative imaging analysis of
nuclear translocation of NFκB (RelA), assessed as a ratio of nuclear:cytoplasmic
intensity of RelA immunofluorescence staining. Nuclear localisation of RelA
significantly increased with time (P=0.0054, two-way ANOVA) but this was not affected
by HIV-1. Symbols represent mean values −/+ SEM from 4 experiments. Lines show
linear regression, fitted using GraphPad Prism 6. (b) Representative images of the
NFκB translocation assay. Nuclei are stained blue with DAPI and NFκB RelA is stained
green. Nuclear NFκB is evident in the right-hand panels of zymosan-stimulated MDMs
(green nuclear staining).

Chapter 3 Results
156
3.2.13 Inhibition of IL-10 induction pathways identifies the PI3K pathway as a
specific regulator of anti-inflammatory cytokines
In addition to the NFκB pathway, multiple other signalling pathways
downstream of PRRs have been shown to contribute to IL-10 expression in
mononuclear phagocytic cells. Activation of the MAP kinase cascades (Chanteux et al.,
2007; Ma et al., 2001b; Yi et al., 2002) and PI3K signalling (Bai et al., 2014; Hu et al.,
2006) are suggested to play critical roles. Calcium-burst stimulated signalling via CaM
kinase II and Pyk2 is also thought to contribute, downstream of dectin-1 (Kelly et al.
2010).
I aimed to identify which of these pathways were involved in controlling IL-10
production in M-CSF differentiated MDMs, in order to highlight candidate pathways on
which HIV-1 might exert its effects. Small molecule inhibitors of these pathways were
used to this effect. MDMs were pre-incubated with inhibitors of p38 and ERK MAP
kinases, PI3K, CaM kinase II or Pyk2, prior to stimulation with Mtb culture filtrate or
zymosan. Secretion of IL-10, and for comparison, IL-6, were measured at 4 hours.
Inhibition of p38 MAP kinase, PI3K or Pyk2 reduced IL-10 secretion in response
to Mtb culture filtrate (Figure 3.21a) or zymosan (Figure 3.21b). However, inhibiting
p38 MAP kinase or Pyk2 also led to reduced IL-6 secretion in response to these stimuli
(Figure 3.21c, d). As HIV-1 does not attenuate production of IL-6, this suggests that
the virus does not act via these pathways to exert specific attenuation of IL-10.
However, inhibition of PI3K did not reduce IL-6 secretion in response to these stimuli
(Figure 3.21c, d), highlighting it as a candidate molecule involved in specific regulation
of IL-10 but not of pro-inflammatory cytokines.
Activation of the PI3K signalling pathway begins with recruitment of PI3K to the
intracellular regions of activated receptors, including PRRs (Weichhart and Säemann,
2008), where it is activated and catalyses the phosphorylation of phosphatidylinositol-
4,5-trisphosphate (PIP2) to phosphatidylinositol-3,4,5-trisphosphate (PIP3) (Liu et al.,
2009). PIP3 then acts as a second messenger to activate downstream targets, the most
critical of which is the serine/threonine kinase Akt (Liu et al., 2009). Akt acts as the
main mediator of the functional effects of PI3K activation by phosphorylating a range of
further targets (Liu et al., 2009). One key target of Akt is mTOR, a high molecular
weight kinase which controls protein synthesis pathways (Liu et al., 2009). It has
previously been highlighted that the PI3K-Akt-mTOR pathway might play a role in

Chapter 3 Results
157
differential regulation of the anti-inflammatory IL-10 response versus pro-inflammatory
responses, in a review of the function of this pathway in innate immune cells
(Weichhart and Säemann, 2008). A recent study further explored this mechanism in
mouse bone marrow-derived macrophages (BMDMs), and showed that mTOR activity
specifically controlled anti-inflammatory and pro-inflammatory responses (termed
“cytokine biasing”) by controlling the efficiency of translation of cytokine mRNAs
(Ivanov and Roy, 2013).
I tested whether the PI3K-Akt-mTOR pathway was involved in differential
control of anti-inflammatory and pro-inflammatory responses in M-CSF differentiated
human MDMs, using specific inhibitors of PI3K, Akt and mTOR, and measuring
cytokine mRNA and protein expression in response to zymosan. Inhibition of any of
these molecules led to a statistically significant reduction in IL10 mRNA expression in
response to zymosan (Figure 3.22a), while IL6 and TNFA mRNA expression were
unaffected (Figure 3.22b, c). Similarly, at the level of protein expression, inhibition of
PI3K or mTOR led to a statistically significant reduction in IL-10 secretion, and
inhibition of Akt substantially reduced IL-10 secretion although this did not reach
statistical significance (Figure 3.22d). Again, IL-6 and TNFα were unaffected (Figure
3.22e, f).
These results confirm that the PI3K-Akt-mTOR pathway specifically controls the
anti-inflammatory IL-10 response, and not the pro-inflammatory cytokines TNFα and IL-
6, in human MDMs. The effects of inhibiting this pathway phenotypically copies the
effect of HIV-1 on cytokine responses to zymosan, and thus highlights a strong
candidate for where HIV-1 may exert its effects to mediate IL-10 attenuation.

Chapter 3 Results
158
Figure 3.21: Inhibition of innate immune signalling pathways inhibits IL-10 and
IL-6 responses.
MDMs were pre-incubated with small molecule inhibitors of ERK1/2 MAP kinase (i:
PD98059 or ii: U0126), p38 MAP kinase (SB203580), p38 and ERK1/2 combined
(PD98059 and SB 203580), PI-3 kinase (LY294002), CaM kinase II (KN93) or Pyk2
(AG17), all at 10μM, for 2 hours before stimulation with Mtb culture filtrate or zymosan
(0.4mg/ml) for 4 hours. Cytokine secretion was measured by ELISA of cell culture
supernatants. (a) IL-10 secretion in response to Mtbfiltrate was significantly reduced by
inhibition of p38, p38 and ERK combined, PI-3 kinase or Pyk2. (b) IL-10 secretion in
response to zymosan was significantly reduced by inhibition of p38, p38 and ERK
combined, PI-3 kinase or Pyk2. (c) IL-6 secretion in response to Mtbfiltrate was
significantly reduced by inhibition of ERK, p38, CaM kinase II or Pyk2. (d) IL-6
secretion in response to zymosan was significantly reduced by inhibition of ERK, p38
or Pyk2. * indicates P<0.05, paired t-test. Bars represent the mean −/+ SEM of 4
experiments.
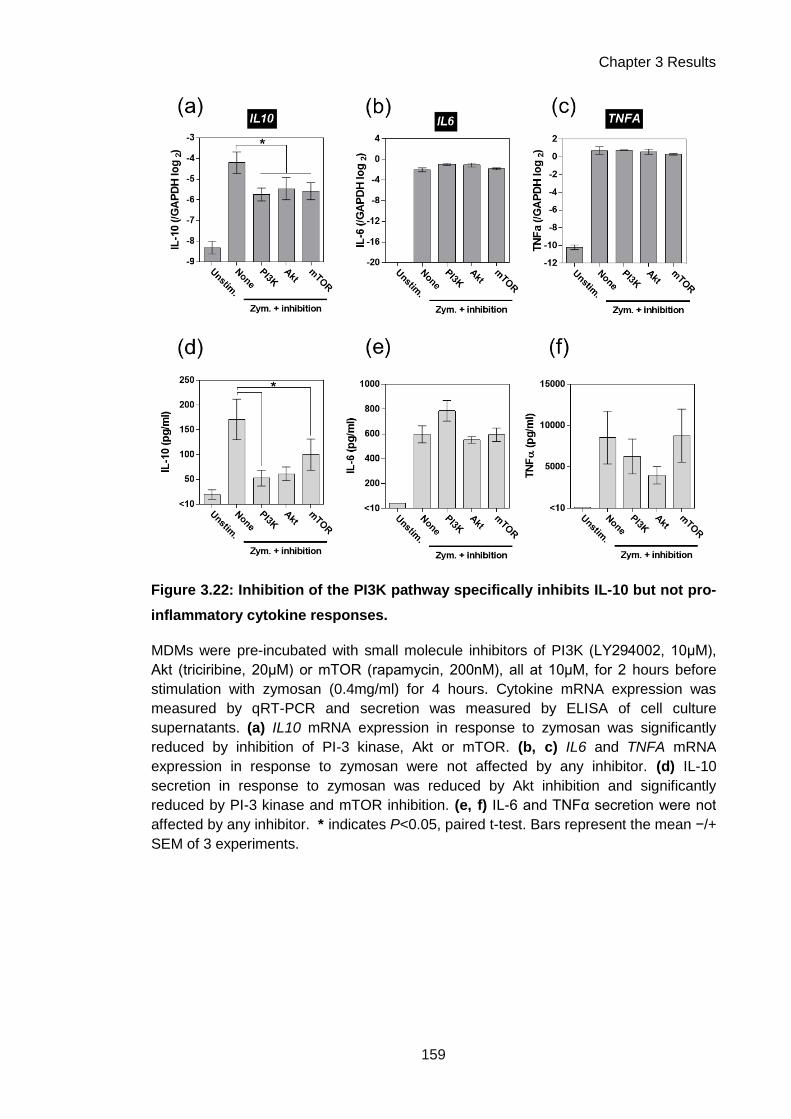
Chapter 3 Results
159
Figure 3.22: Inhibition of the PI3K pathway specifically inhibits IL-10 but not pro-
inflammatory cytokine responses.
MDMs were pre-incubated with small molecule inhibitors of PI3K (LY294002, 10μM),
Akt (triciribine, 20μM) or mTOR (rapamycin, 200nM), all at 10μM, for 2 hours before
stimulation with zymosan (0.4mg/ml) for 4 hours. Cytokine mRNA expression was
measured by qRT-PCR and secretion was measured by ELISA of cell culture
supernatants. (a) IL10 mRNA expression in response to zymosan was significantly
reduced by inhibition of PI-3 kinase, Akt or mTOR. (b, c) IL6 and TNFA mRNA
expression in response to zymosan were not affected by any inhibitor. (d) IL-10
secretion in response to zymosan was reduced by Akt inhibition and significantly
reduced by PI-3 kinase and mTOR inhibition. (e, f) IL-6 and TNFα secretion were not
affected by any inhibitor. * indicates P<0.05, paired t-test. Bars represent the mean −/+
SEM of 3 experiments.

Chapter 3 Results
160
3.2.14 Levels of Akt and its phosphorylation are not altered by HIV-1
As the PI3K-Akt-mTOR pathway was a strong candidate for where HIV-1 might
act to exert IL-10 attenuation, I further investigated this pathway in HIV-1 infected
MDMs. Akt is essentially the central hub of this signalling pathway: it is recruited to the
membrane by PI3K-produced PIP3, where it undergoes a conformational change which
facilitates its activation via phosphorylation, after which it phosphorylates a range of
downstream targets (Liu et al., 2009). Assessment of Akt activation may therefore help
identify if HIV-1 modulates the upstream membrane-proximal section of this signalling
pathway involving PI3K, PIP3 and Akt, or the downstream components such as mTOR
and other Akt targets. Control of total Akt levels by its ubiquitination and subsequent
targeting for degradation has been reported as a regulatory mechanism for this
pathway (Ivanov and Roy, 2013). It has also previously been reported that
phosphorylation of Akt may be reduced in HIV-1 infected M-CSF differentiated human
MDMs (Huang et al., 2006).
I assessed total Akt levels and Akt phosphorylation in response to 5–120
minutes of zymosan stimulation in uninfected and HIV-1 infected MDMs. Total levels of
Akt were unaffected by HIV-1 infection, suggesting that ubiquitin-targeted degradation
of Akt also does not play a role in this phenotype (Figure 3.23); however, the bands for
total Akt for donors 2 and 3 were highly dense and may have been saturated, meaning
that assessing the dynamic range of density of these bands may not have been
optimal. Akt phosphorylation was present at baseline, and was increased by zymosan
stimulation over this time-course, but this was not affected by HIV-1 infection (Figure
3.23, 3.24). These results suggest that HIV-1 does not attenuate IL-10 by degrading
Akt, or modulating its activation via phosphorylation at its Ser473 residue. This
suggests that if HIV-1 does modulate the PI3K-Akt-mTOR pathway in order to
attenuate IL-10, it may act downstream of Akt, potentially at the level of mTOR
activation. It is also possible that an aspect of Akt activation which has not been
assessed is affected, such as its localisation, or phosphorylation at its second
activation residue, Tyr308.
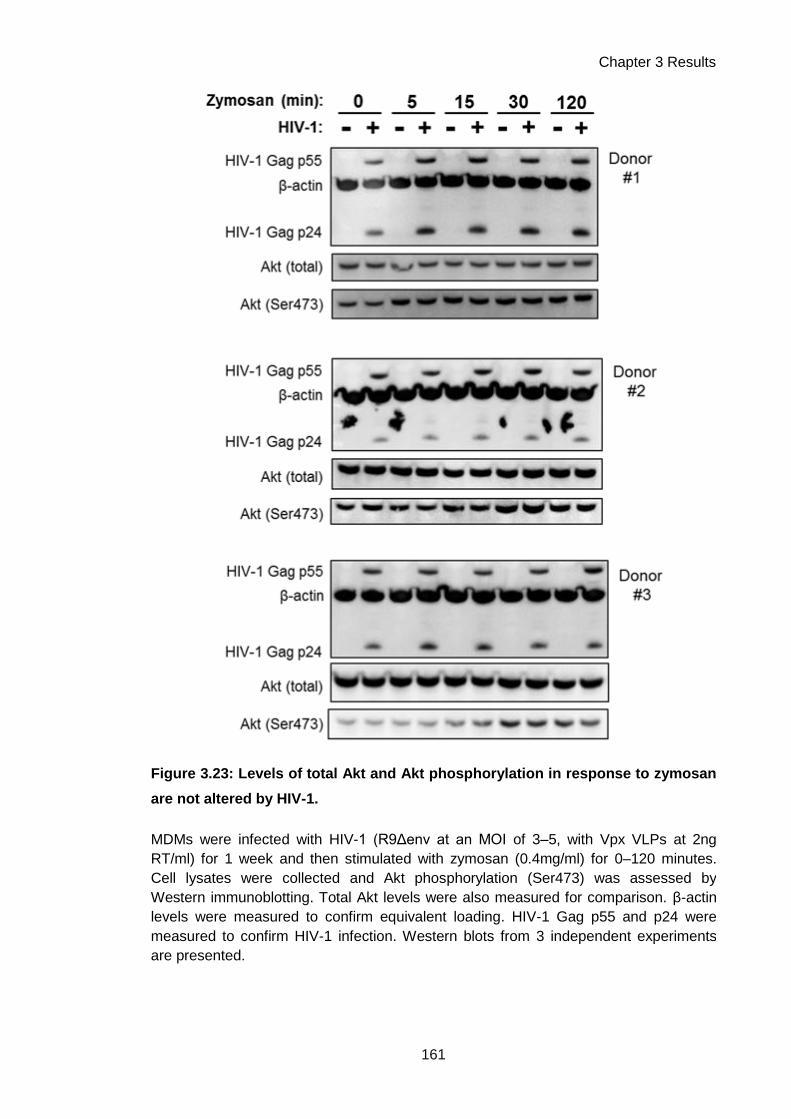
Chapter 3 Results
161
Figure 3.23: Levels of total Akt and Akt phosphorylation in response to zymosan
are not altered by HIV-1.
MDMs were infected with HIV-1 (R9Δenv at an MOI of 3–5, with Vpx VLPs at 2ng
RT/ml) for 1 week and then stimulated with zymosan (0.4mg/ml) for 0–120 minutes.
Cell lysates were collected and Akt phosphorylation (Ser473) was assessed by
Western immunoblotting. Total Akt levels were also measured for comparison. β-actin
levels were measured to confirm equivalent loading. HIV-1 Gag p55 and p24 were
measured to confirm HIV-1 infection. Western blots from 3 independent experiments
are presented.

Chapter 3 Results
162
0 2 0 4 0 6 0 8 0 1 0 0 1 2 0 1 4 0
0 .0
0 .2
0 .4
0 .6
0 .8
T im e p o s t z y m . s t im u la t io n (m in )
Av
era
ge
in
ten
sit
y r
ati
o
(Ph
os
ph
o A
kt/
To
tal
Ak
t)
U n in fe c te d
H IV -1
Figure 3.24: Densitometry of Akt phosphorylation in response to zymosan.
Densitometry calculations were performed with AlphaViewer software on the Western
blots presented in Figure 3.23. The average intensity of the phosphorylated (Ser473)
Akt bands was normalised to the average intensity of the total Akt bands, to quantify
relative levels of Akt phosphorylation. Akt phosphorylation was significantly induced
over time (P= 0.0429, two-way ANOVA), but this was not altered in HIV-1 infection.
Symbols represent mean values −/+ SEM from 3 experiments.

Chapter 3 Results
163
3.3 Chapter discussion
In this body of work, I aimed to characterise HIV-1 mediated attenuation of
macrophage IL-10 responses, in terms of viral and host determinants, and to identify a
potential mechanism for this phenotype. I found that IL-10 attenuation was not limited
to Mtb responses, but occurred downstream of other IL-10-inducing innate immune
stimuli, and was evident across the time-course of the innate immune IL-10 response.
Viral propagation was not required, as IL-10 was attenuated by a single-round HIV-1
infection or in the presence of protease inhibitor inhibition of mature virion production.
Viral entry was not sufficient for IL-10 attenuation to occur, nor was integration. My
results indicate that transcription of HIV-1 genes, and specifically accessory proteins,
were necessary for this phenotype.
The host determinants of IL-10 attenuation were also delineated. Type I IFNs did
not induce IL-10 responses in mononuclear phagocytes, and played no evident role in
HIV-1 attenuation of IL-10. Attenuation was highly cell type-specific, as HIV-1-infected
monocytes and DCs did mount innate immune IL-10 responses but these were not
attenuated by HIV-1. Suppression of IL10 mRNA by HIV-1 was demonstrated to be
due to modulation of pre-transcriptional regulatory pathways, as IL10 mRNA decay
was not potentiated by the virus. Investigation of which signalling cascades controlled
IL-10 production in MDMs highlighted the PI3K pathway as a key regulator of the anti-
inflammatory cytokine response. Exploration of the effects of HIV-1 on this pathway
suggested that any modulation of its activity by the virus occurs downstream of the
activation of the kinase Akt.
HIV-1 attenuated IL-10 responses downstream of a range of innate immune
stimuli, such as zymosan, curdlan and Pam2CSK4. This suggested that IL-10
attenuation may be relevant to infection with pathogens other than Mtb which stimulate
TLR-2 or dectin-1. To assess whether this phenotype is relevant in further contexts,
challenge with ligands or pathogens which stimulate other PRRs may be informative.
For example, IL-10 responses have been reported downstream of TLR-3 (Bai et al.,
2014). It is clear that the attenuating effect of HIV-1 is most apparent in the context of
stimuli such as Mtb and zymosan, which induce the most substantial macrophage IL-
10 responses. When considering host immune adaptation to pathogens, it might be
that when a large IL-10 response is requisite for an effective response, the attenuating

Chapter 3 Results
164
effect of HIV-1 is at its greatest and most subversive for normal host immunity. As such,
the significance of this phenotype in vivo is likely to display pathogen specificity, in
relation to their propensity to induce IL-10.
These results also provide insight into the mechanism by which HIV-1 attenuates
IL-10: it must act downstream of receptor ligation, as multiple receptors are implicated
in this phenotype. Further mechanistic insight is provided by the demonstration that a
single-round Env-deleted HIV-1 can attenuate IL-10 (Figure 3.2), as this shows that
Env-derived proteins, viral assembly and budding are not causative in this phenotype. I
further confirmed this observation via protease inhibitor supplementation of HIV-1
infected MDM cultures, in which context IL-10 attenuation was still evident (Figure 3.5).
These experiments demonstrate that non-productively infected MDMs exhibit
attenuated IL-10 responses, and that ongoing viral propagation is not necessary for
this phenotype. This is of particular significance when considering that macrophages
may form a long-lived reservoir of HIV-1 infection during anti-retroviral therapy; these
experiments suggest that IL-10 attenuation might persist in such a context, and that it
might contribute to immune dysfunction which occurs during HAART, such as IRIS. It is
interesting to note that some of the co-infections most commonly associated with IRIS
are with Mtb or fungal pathogens (Lawn et al., 2008), which are indicated to be strong
innate immune producers of IL-10 responses in macrophages, using Mtb culture filtrate,
or the fungal cell wall derivative zymosan (Figure 3.1).
Investigation of the viral determinants of IL-10 attenuation clearly showed that
viral entry was not sufficient for attenuation to occur. This suggests that the component
of HIV-1 which mediates attenuation is not present in the virion in sufficient quantities
to mediate its effects. Viral integration was necessary for attenuation, but was not
sufficient, as an empty viral vector did not cause attenuation. This experiment indicates
that the various consequences of integration itself, such as insertional mutagenesis, do
not cause IL-10 attenuation, but that HIV-1 genetic material is necessary for
attenuation. It has not formally been demonstrated in this set of experiments that viral
transcription from the integrated HIV-1 provirus is necessary for attenuation; it may be
difficult to test this question specifically, as inhibitors of HIV-1 transcription generally
also have off-target effects on host transcription (Baba, 2004). HIV-1 clones deleted for
the viral transactivator Tat, in which viral transcription is instead controlled by
doxycycline responsive Tet-on elements, may be potential tools in this regard (Das et
al., 2011).

Chapter 3 Results
165
It is difficult to envisage a viral function that results purely from the presence of
HIV-1 genetic material without its transcription, out-with mutagenic consequences of
the event of integration, which has already been eliminated as a sufficient mechanism.
Consequently, the most likely hypothesis is that viral transcription, and production of
new viral components, is necessary for IL-10 attenuation. I therefore investigated which
components of the virus may be necessary. As previously discussed, Env-derived
proteins and the viral protease have been shown not to be involved.
I tested the role of the remaining Gag-Pol proteins by using a virus in which no
mature Gag-Pol-derived proteins are expressed, as the luciferase gene is cloned in-
frame into Gag. This virus also lacks Env and expresses GFP in place of Nef.
Resultingly, only the viral accessory proteins Tat, Rev, Vif, Vpr and Vpu are expressed.
However, it was still capable of attenuating zymosan-induced IL-10 production –
suggesting that one or more of the aforementioned accessory proteins are causative in
this phenotype. It also remains possible that immature sections of Gag, which are still
expressed as part of the Gag-Luciferase fusion protein expressed here, are involved.
To clarify this, it may be necessary to construct and test a virus which expresses only
Gag-Pol and no accessory proteins.
The necessity of various HIV-1 accessory proteins was further investigated using
deletion mutants, showing that Nef, Vif and Vpr are not autonomously necessary for IL-
10 attenuation. This leaves Vpu, Tat and Rev as candidates for this mechanism.
Testing a Vpu deletion mutant in the same manner as Nef, Vif and Vpr is a simple
subsequent experiment. However, Tat and Rev cannot be similarly assessed via
deletion, as their functions are necessary for all efficient viral RNA production. As Tat in
particular may be a strong candidate for mediating the phenotype, as it is a modulator
of transcription, a priority for future experiments should be designing strategies for
testing its role. The aforementioned doxycycline-inducible Tat mutants are an option for
testing this, or expressing either Tat or Rev in isolation may demonstrate if either is
sufficient to cause this phenotype. It also remains possible that IL-10 attenuation is a
consequence of a redundant function of the accessory proteins, in which case single
expression vectors should cause the phenotype. As the HIV-1 accessory proteins have
a range of functions (see Introduction section 1.3.4), there is no single clear potential
mechanism for how one of them might act to attenuate IL-10. However, the functions of
Vpu and Vif in mediating host interactions are by degrading host proteins (Conticello et

Chapter 3 Results
166
al., 2003; Dubé et al., 2010) suggest that degradation of a host factor involved in IL-10
regulation is a potential mechanism.
A final potential mechanism to consider is that IL-10 attenuation does not involve
viral proteins, but is due to a viral mRNA species, such as a microRNA. It has been
shown that HIV-1 encodes microRNA species, and that these can regulate host gene
expression (Narayanan et al., 2011; Ouellet et al., 2013; Schopman et al., 2012).
MicroRNAs regulate gene expression post-transcriptionally by binding to mRNAs,
preventing their translation or targeting them for degradation (Fabian et al., 2010). As
the effect of HIV-1 on IL-10 is to reduce transcript levels, the former mechanism is
unlikely, and the latter mechanism is refuted by later experiments showing that HIV-1
does not accelerate IL-10 mRNA decay. This suggests the action of viral miRNAs is
not likely to be causative in mediating attenuation.
Further insights into the mechanism of IL-10 attenuation were made by
investigating the host determinants of this phenotype. Various publications have
described that induction of IL-10 by type I IFNs in macrophages and monocytes is a
critical mechanism by which these cytokines exert immunosuppressive effects which
may be relevant in protection against mycobacteria (Mayer-Barber et al., 2011; McNab
et al., 2013; Teles et al., 2013). In my experiments, no significant IFN-mediated IL-10
induction was evident in human MDMs, DCs or monocytes (Figure 3.15, Figure 3.18),
nor was type I IFN found to contribute to zymosan-induced IL-10 (Figure 3.16), as has
been reported for LPS-induced IL-10 (Chang et al., 2007). There may be several
reasons for these discrepancies with published reports: substantial evidence is derived
from mouse models of Mtb infection (Chang et al., 2007; Guarda et al., 2011; Mayer-
Barber et al., 2014, 2011; McNab et al., 2013), and so this may reflect differences
between the murine and human immune systems. Additionally, several murine studies
use surrogate methods to demonstrate induction of IL-10 by type I IFN, such as
suppressed IL-10 responses in the context of IFNAR1 knock-out (Mayer-Barber et al.,
2011; McNab et al., 2013), or IL-10 production downstream of an inducer of type I IFN
such as pICLC (Mayer-Barber et al., 2014, 2011), and do not show direct induction of
IL-10 as a result of type I IFN signalling.
Previous reports in the human system also have some key differences from the
experiments presented here. These include showing induction of IL-10 by type I IFNs
in whole PBMC (Aman et al., 1996; Rudick et al., 1996) rather than specifically in
mononuclear phagocytic cells; induction in monocytes only during synergistic

Chapter 3 Results
167
stimulation with LPS (Aman et al., 1996); or drawing conclusions from increased serum
IL-10 in multiple sclerosis patients treated with IFNβ (Rep et al., 1999; Rudick et al.,
1996). Additionally, the Interferome 3.0 database does not identify IL-10 as a type I IFN
target gene (http://interferome.its.monash.edu.au/interferome; Rusinova et al., 2013).
This review of the literature, in conjunction with the experimental data presented
here, strongly suggests that although type I IFNs have clearly been shown to exert
immunosuppressive functions (Mayer-Barber et al., 2014) and may indeed contribute
to IL-10 responses in an indirect manner, they do not directly induce IL-10 production
from resting human mononuclear phagocytes. Their well-characterised
immunosuppressive effects on IL-1β production, via which pathway they have been
postulated to regulate anti-mycobacterial responses, have recently been shown to be
controlled by a pathway which does not implicate IL-10 (Reboldi et al., 2014). A single
published report shows direct induction of IL-10 in human monocytes after stimulation
with IFNβ (Teles et al., 2013), and there are no clear differences between that
experimental setup and the one presented here. Reductionist experiments, such as
using an IL-10 promoter-reporter system in an IFNAR-expressing cell line, may assist
in further clarifying this issue. Overall, these experiments demonstrate that type I IFN
does not directly induce macrophage IL-10 responses, and so further insights into HIV-
1 attenuation of IL-10 cannot be gained via investigation of this pathway.
The cell type specificity of IL-10 responses and attenuation was also investigated.
It was observed that HIV-1-mediated attenuation of zymosan-induced IL-10 specifically
occurred in M-CSF differentiated MDMs and not in other IL-10-producing mononuclear
phagocytes, such as monocytes or MDDCs (Figure 3.17, Figure 3.18). This suggests
that IL-10 attenuation is a context-specific phenomenon. Macrophages differentiated
with GM-CSF did not express IL-10 in response to zymosan, despite expressing a pro-
inflammatory cytokine, TNFα; it is possible that the IL10 locus is closed in these cells
and as such IL10 expression is not inducible. This observation is interesting when
considering that the major roles of GM-CSF in regulating macrophage biology are
thought to be during inflammation or differentiation of alveolar macrophages. The
absence of production of an anti-inflammatory cytokine may fit with the former scenario,
but as AMs are suggested to produce IL-10 in vivo, the relevance to the latter scenario
is less clear.
The largest IL-10 responses evident in the different cell types tested were found
in the cells in which HIV-1 significantly attenuated IL-10: the M-CSF differentiated

Chapter 3 Results
168
MDMs. This again suggests that the attenuating effect of HIV-1 is at its greatest and
most potent in the context of large IL-10 responses which are generated by specific cell
types in response to specific pathogens. If these responses are a host-evolved
protective mechanism, then this suggests that modulation by HIV-1 may certainly have
pathogenic consequences. This leads to consideration of how the demonstrated
context-specificity of this phenotype might be relevant in vivo; which in vivo
mononuclear phagocyte is the in vitro M-CSF differentiated MDM an appropriate model
of? Are they an appropriate in vitro model of alveolar macrophages (AMs), which are
presumably the most relevant cells for this phenotype in HIV-1/Mtb co-infection? A
previous investigation showed that this MDM model is morphologically and
transcriptionally more similar to AMs than to DCs and monocytes, but that AMs had a
heightened pro-inflammatory bias compared to MDMs (Tomlinson et al., 2012). It is
also clear that AM development is dependent on GM-CSF signalling (Bonfield et al.,
2003; Guilliams et al., 2013), which may suggest that GM-CSF differentiated MDMs
are a more appropriate model of AM. AM, however, have been shown to produce IL-10,
although less than M-CSF differentiated MDM (Hoppstädter et al., 2010). Further
experiments assessing this phenotype using ex vivo isolated tissue mononuclear
phagocytes, such as alveolar macrophages or Langerhans cells, including from HIV-1
positive patients, may be informative.
To establish the temporal dynamics of MDM cytokine responses and HIV-1
modulation of these, I investigated zymosan-induced expression of IL-10 mRNA and
IL-10 protein, and of pro-inflammatory cytokines for comparison, over a time-course in
uninfected and HIV-1 infected MDMs (Figure 3.3, Figure 3.4). The dynamics of the IL-
10 response were clearly differentiated from that for the pro-inflammatory cytokines IL-
6 and pro IL-1β. IL10 mRNA expression took longer to develop, and this was also a
self-limited response which returned to baseline after 24 hours, whereas the pro-
inflammatory cytokines were expressed rapidly after stimulation and these responses
persisted to 72 hours. This raises two hypotheses about the specific regulation of IL-10
responses in MDMs, which may provide insight into how HIV-1 attenuates these
responses; firstly, is it a secondary response gene in the innate immune response
(Medzhitov and Horng, 2009), as would be suggested by a delay in its transcription
post-stimulation? Chromatin remodelling of the IL10 locus has been shown to play a
role in LPS-induced IL-10 expression (Saraiva et al., 2005), which would support this
suggestion. And secondly, do negative feedback loops exist to limit its expression? IL-

Chapter 3 Results
169
10 is suggested to be negatively regulated by a range of transcription factors (Saraiva
and O’Garra, 2010), and whether HIV-1 modulates these pathways merits investigation.
Homeostatic control of IL-10 is also known to be mediated post-transcriptionally
via destabilizing motifs in the 3’ untranslated region of the mRNA (Powell et al., 2000).
It is also a target for the RNA-degrading enzyme tristetraprolin (Stoecklin et al., 2008).
HIV-1 might attenuate IL-10 responses by accelerating decay of IL10 mRNA, leading to
lower measurable levels of the cytokine mRNA at any single time-point. I investigated
the rate of IL-10 mRNA decay, and found that it was not accelerated by HIV-1 infection.
In fact, HIV-1 was associated with increased stability of all cytokine mRNAs measured;
an interesting observation which may be informative when considering modulation of
the PI3K-mTOR pathway by HIV-1 as a potential mechanism of attenuation, discussed
subsequently.
It is also possible that an effect of the virus on the IL-10 locus, e.g. in terms of its
histone modifications and availability for transcription, is involved. However, as some
IL-10 transcription is detectable in HIV-1 infected MDMs, this seems less likely,
indicating that the virus acts pre-transcriptionally to attenuate IL-10. I therefore
investigated the signalling pathways involved in inducing IL-10 transcription in
macrophages. Although attenuation of the NFκB pathway has previously been
demonstrated in HIV-1 infected MDMs (Noursadeghi et al., 2009), this was not evident
downstream of zymosan stimulation, and so did not present a strong candidate for the
host determinant of this phenotype. Investigation of which innate immune pathways
were involved in specific regulation of IL-10 and not pro-inflammatory cytokine
responses in MDMs identified the PI3K pathway as a clear candidate target for HIV-1,
as inhibition of this pathway pheno-copied the effects of HIV-1 on IL-10.
A number of previous reports have highlighted the PI3K pathway as a positive
regulator of IL-10 in both human and murine macrophages, including in responses to
mycobacteria (Bai et al., 2014; Fallah et al., 2011; Foey et al., 2001; Hu et al., 2006).
One key report using mouse BMDMs demonstrated that this pathway was critical in
establishing the phenomenon of “cytokine biasing”, wherein the cytokine response to
pathogenic strains of Legionella was dominated by pro-inflammatory transcripts and
displayed a lack of IL-10, while non-pathogenic strains did induce IL-10 (Ivanov and
Roy, 2013). This was controlled by degradation of Akt during infection with the
pathogenic bacteria, which led to lower levels of mTOR activity, thus reducing the
efficiency of cellular translation. The mRNAs of pro-inflammatory cytokines, which were

Chapter 3 Results
170
in higher abundance, were then preferentially translated in comparison to low
abundance IL-10 transcripts (Ivanov and Roy, 2013).
If this mechanism also occurs in human macrophages, it is clearly a strong
candidate for how HIV-1 might cause IL-10 attenuation; perhaps the virus essentially
induces a “cytokine biasing” phenomenon, causing the macrophage to react to stimuli
as though they had increased pathogenicity. The levels of IL-10 transcript which are
induced in response to innate immune stimulation are generally of lower abundance
than pro-inflammatory transcripts (Figure 3.19, Figure 3.22), which would support this
possibility. However, these is clearly a discrepancy here, as the mechanism described
by Ivanov and Roy (2013) takes place at the level of protein production, while the
phenotype caused by HIV-1 attenuates IL-10 transcription. In addition, inhibiting mTOR
in human MDMs inhibited IL-10 transcription as well as protein secretion (Figure 3.22),
and as it is well-established that mTOR regulates proteins via translation and not
transcription, this observation requires further exploration. It is possible that inhibitory
effects on transcription due to mTOR inhibition represent negative feedback effects
from its effects on translation, wherein reduced levels of IL-10 protein (or another anti-
inflammatory factor) feedback to impact on IL-10 transcription. The observation that
HIV-1 increases all cytokine mRNA stability (Figure 3.19) is also interesting to consider
in this regard; if the virus reduces mTOR activity and translational efficiency by
affecting the PI3K pathway, perhaps mRNAs are more stable as a result due to less
traffic through the translation pathway.
Although how the PI3K-Akt-mTOR pathway specifically regulates the IL-10
response in human MDMs is not entirely clarified, I made preliminary assessments of
its activity in HIV-1 infected MDMs. Previous reports linking HIV-1 to this pathway have
suggested that Nef activates PI3K in order to downregulate MHC class I molecules and
modulate apoptosis (Hung et al., 2007; Linnemann et al., 2002; Swann et al., 2001;
Wolf et al., 2001). It has also been shown that Env-derived gp120 or Tat can activate
this pathway (Deregibus et al., 2002; François and Klotman, 2003). An up-regulatory
effect on this pathway would be unlikely to explain the IL-10 attenuation phenotype,
and in any case the relevance of these reports to MDM biology is not entirely clear, as
they are mainly made using T cells, or transformed cell lines which often have inherent
PI3K pathway dysfunction (Astoul et al., 2001). Akt is a central hub of the PI3K
pathway, and has been implicated in the phenomenon of cytokine biasing, and so it
was selected as a focus for investigation. However, HIV-1 was not shown to have any

Chapter 3 Results
171
effect on its total levels or on Ser473 phosphorylation. This suggests that the virus
does not modulate the activity of this pathway at this level, or further upstream; the
most informative subsequent experiments, therefore, should be to investigate
activation of mTOR and other downstream targets of Akt in HIV-1 infected MDMs.
Localisation of Akt, which also plays a role in its activation, should also be assessed.
In summary, I have shown that HIV-1 mediates innate immune IL-10 attenuation in
macrophages in a highly context-specific manner, and that this is likely to be due to an
as-yet unidentified function of a viral accessory protein. The most promising candidate
host pathway that might be affected by the virus is the PI3K-Akt-mTOR pathway, which
appears to play a key role in specifically regulating IL-10, and hence potentially
producing the phenomenon of cytokine biasing. HIV-1 might act downstream of Akt to
modulate this pathway and hence dysregulate IL-10 production in macrophages.
Further exploration of the activity of this pathway in MDMs, and of the virological
determinants of this phenotype, may fully chararactise this novel host-virus interaction
which has the potential to impact substantially on the function of the immune response.

Chapter 3 Results
172

Chapter 4 Results
173
Chapter 4. Results 2. The consequences of IL-10
attenuation for HIV-1 replication and the immune
response
4.1 Background
HIV-1 attenuates macrophage IL-10 responses to Mtb and other innate immune
stimuli. My investigation into the mechanism of this phenotype has shown that it is a
consequence of integration by HIV-1 and is dependent on expression of viral
accessory proteins. The host pathways affected by the virus may involve the specific
regulation of the anti-inflammatory cytokine response differentially from the pro-
inflammatory cytokine response, and the PI3K pathway is a strong candidate in this
regard.
The ability of HIV-1 to specifically inhibit macrophage production of IL-10, which
has well-established immunomodulatory and anti-inflammatory functions, raises
several questions about the consequences of this phenotype. Firstly, does it have
consequences for the virus? HIV-1 appears to have evolved to cause this phenotype,
as it is indicated to be due to the function of viral proteins expressed in the
macrophage. This raises the teleological question of whether IL-10 attenuation confers
any advantage to the virus; can IL-10 modulate HIV-1 replication, or alter cellular
permissivity to HIV-1 infection?
The previously characterised potent functions of IL-10 suggest that its
attenuation by HIV-1 is also likely to have consequences for the host immune response.
The contexts in which this phenotype might play an immunopathological role must be
considered. Mtb is clearly one example of a clinically important co-infecting pathogen
that induces a strong macrophage IL-10 response which HIV-1 can attenuate. However,
as this phenotype is not Mtb-specific, are there other pathogens which may be affected
by it? Exploring whether other co-infecting pathogens induce IL-10 responses in MDMs
may help elucidate the importance of this phenotype for immunopathology in vivo in
HIV-1 positive patients.
The potential mechanisms of immunopathology which IL-10 attenuation might
trigger also clearly merit investigation. In a previous investigation within our group, IL-
10 attenuation was associated with exaggerated downstream pro-inflammatory

Chapter 4 Results
174
responses in HIV-1/Mtb co-infected macrophages (Tomlinson et al., 2014). This
included exaggerated production of pro-inflammatory cytokines which IL-10 normally
acts to suppress, such as TNFα, IL-1β and IL-23. These results indicated that autocrine
IL-10 signalling in macrophage inflammatory responses could potently affect
macrophage function. Further understanding of how IL-10 modulates macrophage
function and macrophage-generated inflammatory processes may provide further
insight into how HIV-1 might impact on inflammatory responses to co-infecting
pathogens, and thus the prospective immunopathological consequences of this
phenotype in vivo.
I therefore aimed to explore the potential consequences of IL-10 attenuation for
the virus and the host immune response, with the following objectives:
1) To explore whether IL-10 modulates HIV-1 replication in human
macrophages, in order to determine whether the virus might attenuate IL-10
to promote its own replication.
2) To identify whether IL-10 attenuation is present in macrophage responses to
clinically important co-infecting pathogens other than Mtb, by evaluating the
macrophage response to Cryptococcus neoformans and the effect of HIV-1
on this.
3) To explore how IL-10 modulates macrophage transcriptional responses, in
the following contexts:
a. The effects of IL-10 on gene expression in unstimulated MDMs.
b. The effects of IL-10 on IFNγ-induced gene expression in MDMs.
c. The role of IL-10 in modulating the pro-inflammatory transcriptional
response to zymosan.
4) To explore how attenuation of IL-10 modulates cell recruitment to
inflammatory foci.

Chapter 4 Results
175
4.2 Results
4.2.1 IL-10 inhibition may confer a replicative advantage on HIV-1 in
inflammation
I aimed to identify why HIV-1 attenuates IL-10 by exploring the consequences
of this phenotype for the virus. The simplest hypothesis is that IL-10 is detrimental to
viral replication, and so the virus has evolved to suppress IL-10 to avoid these
detrimental effects. It has previously been shown that IL-10 can suppress HIV-1
replication in macrophages (Tanaka et al., 2005; Wang and Rice, 2006). Conversely,
innate immune signalling via the NFκB pathway (Pazin et al., 1996; Perkins et al.,
1993; Williams et al., 2004; Williams et al., 2007), and pro-inflammatory cytokines (Poli
et al., 1994, 1990) can induce HIV-1 replication. The effect of IL-10 on HIV-1 replication
in the context of an inflammatory response has not specifically been addressed. To
investigate this, I sought to supplement deficient IL-10 production in HIV-1-infected
MDMs stimulated with zymosan, by addition of recombinant IL-10 four hours after
zymosan stimulation.
72 hours post-zymosan stimulation, HIV-1 release and transcription were
measured, and were significantly increased above levels in unstimulated MDMs
(Figure 4.1). Supplementation of IL-10 significantly suppressed zymosan-induced HIV-
1 transcription (Figure 4.1b) and showed a trend to suppression of zymosan-induced
HIV-1 release at this time point (Figure 4.1a), although this effect fell short of statistical
significance. The outcome of 72 hours of IL-10 supplementation on viral replication in
unstimulated MDMs was also assessed, and no effect was seen on either viral
transcription or release (Figure 4.2a, b). To investigate the effect of IL-10 on
macrophage permissivity to HIV-1 infection, MDMs were pre-treated with IL-10 prior to
HIV-1 infection. This had no impact on the number of cells which were infected by HIV-
1 when measured at 3 days post-infection (Figure 4.2c). These results indicate that IL-
10 can inhibit zymosan-induced viral replication in MDMs, but has no effect on the
baseline level of HIV-1 replication in unstimulated MDMs, or on the permissivity of
unstimulated MDMs to HIV-1 infection.

Chapter 4 Results
176
Figure 4.1: IL-10 suppresses zymosan-induced HIV-1 replication.
MDMs were infected with HIV-1 (full-length strain Ba-L, at an MOI of 3–5) for 1 week of
spreading infection, and then stimulated with zymosan (0.4mg/ml). 4 hours later,
recombinant IL-10 (10ng/ml) was supplemented into the culture. Viral release and
transcription were measured 72 hours post-supplementation. (a) Viral release was
measured by HIV-1 p24 ELISA of cell culture supernatants. Zymosan induced
significantly higher levels of HIV-1 release compared to unstimulated MDMs, and IL-10
supplementation suppressed this. (b) Viral transcription was measured by qRT-PCR for
the HIV-1 LTR. Zymosan induced significantly higher levels of HIV-1 transcript
compared to unstimulated MDMs, and this was significantly suppressed by IL-10
supplementation. * indicates P<0.05, paired t-test. Box-and-whisker plots indicate the
median and range of at least 3 experiments.

Chapter 4 Results
177
Figure 4.2: IL-10 does not modulate HIV-1 replication in resting MDMs, or alter
MDM permissivity to HIV-1.
MDMs were infected with HIV-1 (full-length strain Ba-L, at an MOI of 3–5) for 1 week of
spreading infection, and then supplemented with recombinant IL-10 (10ng/ml). (a) Viral
release was measured at 72 hours by HIV-1 p24 ELISA of cell culture supernatants.
IL-10 supplementation had no effect on HIV-1 release. (b) Viral transcription was
measured at 72 hours by qRT-PCR for the HIV-1 LTR. IL-10 supplementation had no
effect on HIV-1 transcription. (c) MDMs were pre-incubated with recombinant IL-10
(10ng/ml) for 24 hours prior to infection with HIV-1 (full-length strain Ba-L, at an MOI of
3-5). At 72 hours, MDMs were fixed and stained for HIV-1 p24 to measure the number
of HIV-1 infected MDMs in the culture. IL-10 pre-treatment had no effect on the
numbers of MDMs infected. Box-and-whisker plots indicate the median and range of at
least 3 experiments. Bars indicate the mean +/- SEM of at least 3 experiments.

Chapter 4 Results
178
4.2.2 Macrophage responses to Cryptococcus neoformans
Having shown that IL-10 attenuation was not Mtb-specific (section 3.2.1), I
aimed to establish whether HIV-1 attenuation of IL-10 might have immunopathological
consequences in the response to a pathogen other than Mtb. Zymosan, a particulate
innate immune stimulus which is a derivative of the cell wall of the fungus
Saccharomyces cerevisiae (Gantner et al., 2003), induced substantial IL-10 responses
in human MDMs (Figure 3.1), as has been previously reported (Kelly et al., 2010).
Therefore, I aimed to test if a clinically important fungal pathogen in HIV-1+ patients
also induces IL-10 responses in human MDMs, and whether HIV-1 infection attenuates
these responses.
Cryptococcus neoformans is a fungal species which commonly causes
disseminated infections associated with meningoencephalitis in HIV-1 positive patients
with AIDS (Harrison, 2009). C. neoformans can be manipulated in culture (Sabiiti et al.,
2012), directly infects macrophages (Vecchiarelli et al., 1994), and the major
component of its capsule, glucuronoxylomannan (GXM), has been shown to be a
potent inducer of IL-10 expression (Monari et al., 2006; Vecchiarelli et al., 1996).
Therefore, it provided an appropriate candidate pathogen with which to test IL-10
attenuation by HIV-1 in the context of a fungal infection. To characterise infection by C.
neoformans in this MDM model, MDM uptake of C. neoformans at 4 hours post-
infection was measured by confocal microscopy using a GFP-expressing C.
neoformans WT strain, H99-GFP (Figure 4.3a). Using an MOI of 10, intracellular
fungal burden at 4 hours was approximately 0.1 cryptococci per MDM (Figure 4.3b),
indicating that approximately 10% of MDMs were infected, although heterogeneity in
fungal burden may exist at the single cell level. Co-infection of MDMs with HIV-1 did
not affect uptake of C. neoformans (Figure 4.3b).
Macrophage inflammatory responses to C. neoformans, in the presence and
absence of pre-existing HIV-1 infection, were assessed by measuring changes to
selected cytokine mRNA expression in MDMs at 4h and 24h post-infection. In these
experiments, zymosan was used as a positive control for induction of cytokine gene
expression. Two WT laboratory-propagated strains of C. neoformans of different
serotypes, H99 and B3501, did not induce IL-10, TNFα or IL-1β mRNA expression at 4
or 24 hours post-infection, irrespective of co-existing HIV-1 infection (Figure 4.4). The

Chapter 4 Results
179
C. neoformans capsule is suggested to be its major virulence factor and may mask
immunogenic PAMPs in the cell wall, or be directly immunosuppressive (Monari et al.,
2006; Vecchiarelli et al., 1996, 1995; Zaragoza et al., 2009). Isogenic unencapsulated
mutants of the H99 and B3501 WT strains exist, which have mutations in enzymes
involved in capsule production or trafficking (all C. neoformans strains used are
detailed in Methods section 2.5). These mutants, Cap59 (H99) and Cap67 (B3501)
were used to infect MDMs, to assess whether cytokine gene expression could be
induced by C. neoformans when the capsule was absent. At 24 hours post-infection,
these strains induced expression of mRNA for the pro-inflammatory cytokines IL-1β
and TNFα (Figure 4.4). IL10 mRNA expression was not induced at any time-point, and
consequently no modulation by HIV-1 was observed.
To further assess whether C. neoformans could induce an IL-10 response in
MDMs, secretion of IL-10 protein was measured at 4 and 24 hours post-infection with
WT strains or unencapsulated mutants. No IL-10 secretion was evident at 4 hours in
response to any C. neoformans strain (Figure 4.5a). At 24 hours post-infection with
unencapsulated strains, IL-10 secretion was observed in 3 of 6 experiments, and this
was reduced in paired HIV-1 co-infected MDMs, although these data were insufficient
to reach statistical significance (Figure 4.5b). C. neoformans WT strains did not induce
IL-10 secretion at 24 hours (Figure 4.5b).
Previous investigators have reported that macrophages and monocytes can
produce pro-inflammatory and IL-10 responses to C. neoformans in various in vitro
models (Delfino et al., 1997; Levitz et al., 1994; Oliveira et al., 2010; Vecchiarelli et al.,
1996). The non-immunogenicity of C. neoformans in this MDM model was investigated.
The MOI employed was not shown to be limiting, as an eight-fold increase in MOI did
not induce IL-10 or IL-6 secretion (Figure 4.6a). In animal models of C. neoformans
infection, the innate immune adaptor MyD88, which transduces TLR signals to activate
the NFκB pathway, has been shown to be essential for protection against C.
neoformans (Biondo et al., 2005; Yauch et al., 2004). Additionally, the C. neoformans
capsule has been shown to induce NFκB activation, as assessed by nuclear
translocation, in human PBMC (Shoham et al., 2001). I assessed NFκB nuclear
translocation in response to a WT strain of C. neoformans in this MDM model. In
comparison to LPS stimulation as a positive control, C. neoformans did not induce
NFκB translocation (Figure 4.6b, c), suggesting that MDMs do not respond to C.
neoformans via this archetypal innate immune signalling pathway.

Chapter 4 Results
180
Taken together, these data show that M-CSF-differentiated MDMs do not
mount a classical transcriptional innate immune response to C. neoformans, despite
internalising the pathogen. The absence of NFκB pathway activation suggests that they
might not detect C. neoformans by classical pattern recognition. As such, whether HIV-
1 could attenuate IL-10 responses to C. neoformans could not be evaluated, and the
effects of the phenotype of IL-10 attenuation in HIV-1/C. neoformans co-infection could
not be explored using this experimental model.

Chapter 4 Results
181
Figure 4.3: Uptake of C. neoformans to human MDMs.
MDMs were infected with HIV-1 (R9Δenv at an MOI of 3–5, with Vpx VLPs at 2ng
RT/ml) for 1 week, and then infected with GFP-expressing C. neoformans strain H99-
GFP at an MOI of 10. Four hours post-infection, MDMs were washed to remove
extracellular yeasts. Cells were fixed and uptake was assessed by confocal
microscopy. Non-internalised C. neoformans was excluded by counterstaining with an
antibody (18B7) to the GXM component of the capsule. MDMs were enumerated by
staining of nuclei with DAPI. (a) Representative images of the DAPI nuclear stain;
GFP-expressing cryptococci; counterstaining of external cryptococci with 18B7; and a
merged image demonstrating extracellular cryptococci (yellow) and intracellular
cryptococci (green). (b) MDMs and intracellular cryptococci were enumerated, and
expressed as a ratio of intracellular cryptococci per MDM over the whole culture. Bar
represents the mean +/- SEM of 3 experiments. Confocal imaging and analysis was
carried out in collaboration with Dr. Janos Kristin-Vizi, LMCB, UCL.

Chapter 4 Results
182
Figure 4.4: Expression of cytokine mRNA by MDMs in response to C. neoformans in HIV-
1 co-infection.
MDMs were infected with HIV-1 (R9Δenv at an MOI of 3–5, with Vpx VLPs at 2ng RT/ml) for 1
week, and then infected with WT C. neoformans strains H99 or B3501, their isogenic
unencapsulated mutants Cap59 or Cap67 (all at an MOI of 10), or stimulated with zymosan
(Zym.; 0.4mg/ml). Cytokine mRNA expression at 4 and 24h was measured by qRT-PCR.
Significant (P<0.05, paired t-test) differences in mRNA expression from unstimulated MDMs are
indicated by * above bars, and significant differences in mRNA expression between uninfected
and HIV-1 infected cells are indicated by * above brackets. (a) IL10 mRNA was expressed at 4h
in response to zymosan but not C. neoformans strains, and was not expressed at 24h in
response to any stimulus. HIV-1 attenuated IL-10 mRNA expression. (b) TNFA mRNA was
expressed at 4h and 24h in response to zymosan and at 24h in response to unencapsulated C.
neoformans. (c) IL1B mRNA was expressed at 4h and 24h in response to zymosan and at 24h
in response to unencapsulated C. neoformans. Bars represent mean -/+ SEM of at least 3
experiments.

Chapter 4 Results
183
Figure 4.5: MDM secretion of IL-10 in response to C. neoformans in HIV-1 co-
infection.
MDMs were infected with HIV-1 (R9Δenv at an MOI of 3–5, with Vpx VLPs at 2ng
RT/ml) for 1 week, and then infected with WT C. neoformans strains H99 or B3501,
their isogenic unencapsulated mutants Cap59 or Cap67 (all at an MOI of 10), or
stimulated with zymosan (Zym., 0.4mg/ml). IL-10 secretion at 4h and 24h was
measured by ELISA of cell culture supernatants. (a) IL-10 secretion at 4h. IL-10 was
secreted in response to zymosan, but not in response to C. neoformans strains. IL-10
secretion was reduced in HIV-1 infected MDMs, but this was non-significant. (b) IL-10
secretion at 24h. In 3 of 6 experiments, IL-10 was secreted at 24h in response to
unencapsulated mutants of C. neoformans, and this was attenuated by HIV-1 co-
infection. Significant differences between groups were not observed. Paired results
from the same experiment are indicated.

Chapter 4 Results
184
Figure 4.6: Non-immunogenicity of C. neoformans.
(a) MDMs were infected with C. neoformans WT strain H99 at an MOI of 10 or 80, or stimulated
with zymosan (Zym., 0.4mg/ml). IL-10 and IL-6 secretion at 4h and 24h was measured by ELISA
of cell culture supernatants. Both cytokines were secreted in response to zymosan at 4h and 24h,
but not in response to C. neoformans at either MOI or timepoint. (b) MDMs infected with C.
neoformans WT strain H99 at an MOI of 10 or 100, or stimulated with LPS at 10ng/ml. Activation
of the NFκB pathway was measured by quantitative imaging analysis of nuclear translocation of
NFκB (RelA), assessed as a ratio of nuclear: cytoplasmic intensity of RelA staining. LPS
stimulation induced translocation of NFκB (P=<0.0001, 0 mins vs. 30 mins or 120 mins, two-way
ANOVA). C. neoformans did not induce NFκB translocation at either MOI used at any time point
(P>0.05, two-way ANOVA). Bars represent mean -/+ SEM of at least 3 experiments. (c)
Representative images of the NFκB translocation assay. Nuclei are stained blue with DAPI and
NFκB RelA is stained green. Nuclear NFκB is evident in the middle panel of LPS-stimulated
MDMs (green nuclear staining).

Chapter 4 Results
185
4.2.3 The transcriptional response to IL-10 in human MDMs
Previous investigations showed that attenuated IL-10 responses in HIV-1/Mtb
co-infected macrophages were associated with exaggerated downstream pro-
inflammatory macrophage responses (Tomlinson et al., 2014), and it is well described
that IL-10 induces an anti-inflammatory response in macrophages, which includes
cytokine suppression (Murray, 2005). Accordingly, IL-10 supplementation of co-
infected MDM cultures reversed the HIV-1 associated exaggerated inflammatory
phenotype (Tomlinson et al., 2014). Further understanding the function of IL-10 in
macrophage-driven immune responses may delineate potential outcomes of HIV-1-
mediated IL-10 attenuation as well as the role of IL10 in the context of an inflammatory
response. As macrophages express the IL-10 receptor (Moore et al., 2001),
macrophage IL-10 production can lead to autocrine IL-10 signalling and modulation of
macrophage function (Murray, 2006). To investigate this, MDMs were stimulated with
recombinant IL-10 for 24 hours, and changes in gene expression were assessed by
genome-wide transcriptional profiling. IL-10 induced the expression of 47 genes in
resting MDMs (Figure 4.7a). TFBS enrichment analysis of these genes using
oPOSSUM-3 (Kwon et al., 2012; http://opossum.cisreg.ca) corroborated that they could
be regulated by IL-10. Binding sites for STAT3, the major downstream mediator of IL-
10 signalling (L. Williams et al., 2004), were highly enriched (Figure 4.7b). IL-10 did
not cause any substantial suppression of gene expression in resting MDMs (Figure
4.7a).
The function of the IL-10-induced genes was investigated by GO enrichment
analysis using the web-tool InnateDB (Breuer et al., 2013; http://www.innatedb.com).
This analysis was visualised as a network of enriched GO terms and associated genes
(Figure 4.7c). IL-10 induced expression of genes involved in the innate immune
response, inflammation and apoptosis. Some of these encoded for molecules with the
potential to alter macrophage function, including signalling molecules such as SOCS3
and JAK3, and receptors such as IgG FC receptors and the IL-7 receptor. Secreted
molecules were also highlighted, including the chemokine CCL18, and members of
S100 protein family, which can be secreted and play immunomodulatory roles (Donato
et al., 2013). IL-10 also induced expression of the genes encoding pro-IL-1β and the
complement factor C1S. These results show that IL-10 modulates macrophages by
inducing gene expression and thus potentially altering functionality, consistent with
previous reports (Antoniv et al., 2005; Park-Min et al., 2005; Stumpo et al., 2003).

Chapter 4 Results
186
Figure 4.7: The MDM transcriptional response to IL-10.
MDMs were stimulated for 24h with recombinant IL-10 (10ng/ml). RNA was collected and genome-
wide transcriptional profiling by microarray was performed. Significant gene expression changes
induced by IL-10 were identified by t-test (P<0.05) and a twofold change threshold in comparison to
unstimulated MDMs. (a) Frequency distribution of IL-10-induced changes in gene expression,
presented as fold-change increases/decreases. (b) Genes up-regulated by IL-10 were subjected to
transcription factor binding site (TFBS) enrichment analysis using oPOSSUM-3. The sequence
5000bp up/downstream of each gene was analysed. Significance of TFBS frequency compared to
background was assessed by the Z-score statistic, which was considered significant when ≥10. The
X axis lists the number of genes enriched for a TFBS, and the Y axis displays the Z score. (c)
Network visualisation of InnateDB gene ontology (GO) enrichment analysis of IL-10-induced genes.
Enrichment assessment was performed using a hypergeometric algorithm, and filtered to biological
process GO terms with a significance level of P<0.05 (Benjamini-Hochberg correction-adjusted).
The top 15 enriched GO terms by gene count are shown. GO terms are in blue and genes are in
red. Node size is determined by number of connections. All data presented are derived from the
mean results of 3 independent experiments.

Chapter 4 Results
187
4.2.4 IL-10 pre-treatment does not inhibit the transcriptional response to IFNγ in
human MDMs
As well as negatively regulating the innate inflammatory response (Lang et al.,
2002b), IL-10 is also suggested to suppress functions of adaptive immunity (Hutchins
et al., 2013). The ability of adaptive immune CD4+ Th1 cells to activate macrophages
via IFNγ is a key interface of CMI. I tested whether IL-10 could modulate this interface
by altering macrophage responses to IFNγ.
MDMs were pre-treated with IL-10 for 24 hours prior to IFNγ stimulation. The
response to IFNγ was assessed by genome-wide transcriptional profiling. In both the
presence and absence of IL-10 pre-treatment, IFNγ up-regulated the expression of
hundreds of genes in MDMs (Figure 4.8a, b). IL-10 modulation of this response was
assessed by comparing gene expression in the two MDM conditions, and specifically
testing for significant differences in gene expression in the IFNγ response gene list
(Figure 4.8c). The IFNγ response was highly conserved in the presence of IL-10 pre-
treatment, with only four statistically significant changes of ≥two-fold in transcription
(Figure 4.8c), which were either in genes independently inducible by IL-10 (JAK3,
SOCS3), or were in uncharacterised loci.
These results demonstrate that IL-10 priming of macrophages does not alter
their transcriptional response to IFNγ.
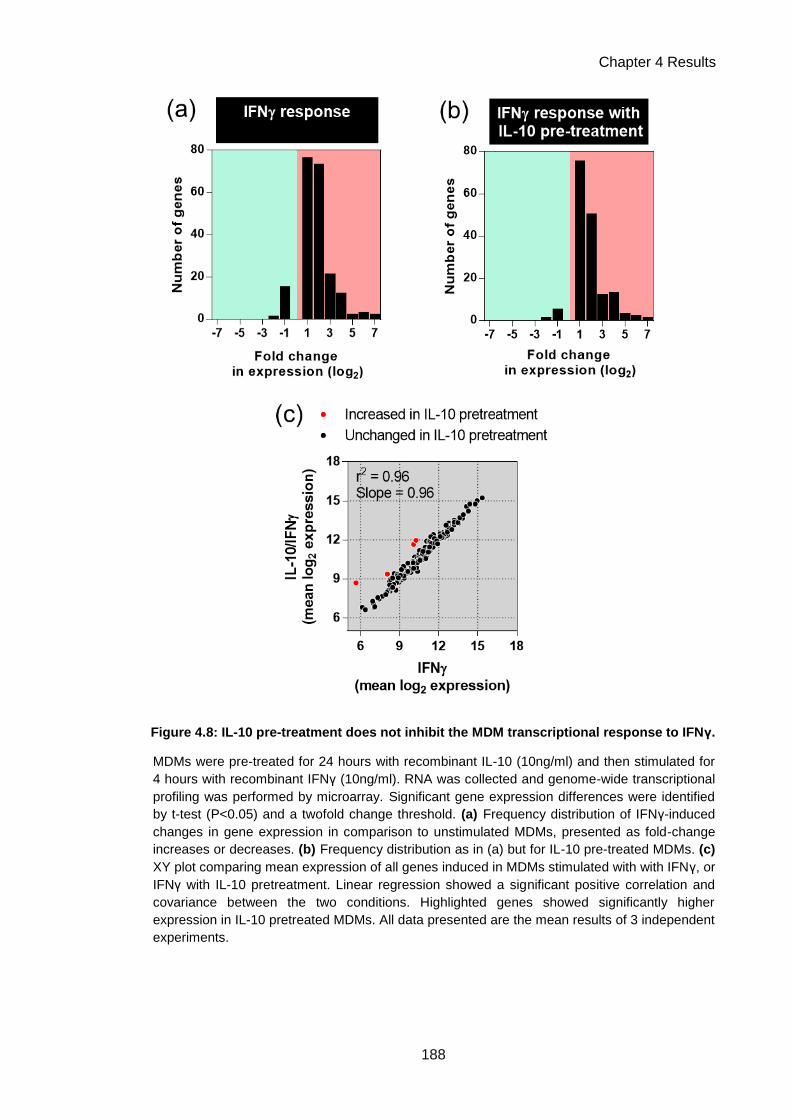
Chapter 4 Results
188
Figure 4.8: IL-10 pre-treatment does not inhibit the MDM transcriptional response to IFNγ.
MDMs were pre-treated for 24 hours with recombinant IL-10 (10ng/ml) and then stimulated for
4 hours with recombinant IFNγ (10ng/ml). RNA was collected and genome-wide transcriptional
profiling was performed by microarray. Significant gene expression differences were identified
by t-test (P<0.05) and a twofold change threshold. (a) Frequency distribution of IFNγ-induced
changes in gene expression in comparison to unstimulated MDMs, presented as fold-change
increases or decreases. (b) Frequency distribution as in (a) but for IL-10 pre-treated MDMs. (c)
XY plot comparing mean expression of all genes induced in MDMs stimulated with with IFNγ, or
IFNγ with IL-10 pretreatment. Linear regression showed a significant positive correlation and
covariance between the two conditions. Highlighted genes showed significantly higher
expression in IL-10 pretreated MDMs. All data presented are the mean results of 3 independent
experiments.

Chapter 4 Results
189
4.2.5 IL-10 deficiency in inflammation dysregulates macrophage gene
expression
As the primary function of IL-10 is thought to be regulation of immune and
inflammatory responses, I assessed the role of IL-10 in the context of an inflammatory
response. MDMs were stimulated with zymosan in the presence or absence of
neutralising antibodies to IL-10 and the IL-10 receptor, in order to block zymosan-
induced autocrine IL-10 signalling, and thus assess the consequences of IL-10
deficiency in the inflammatory response. A similar exercise has been carried out in
LPS-stimulated murine BMDMs from IL-10 deficient mice (Lang et al., 2002a), but the
role of IL-10 in regulating the inflammatory response of human macrophages to a
strong IL-10 inducer, such as zymosan, has not previously been assessed. The MDM
response to 24 hours of zymosan stimulation was measured by genome-wide
expression profiling. Zymosan caused up- and down-regulation of the expression of
hundreds of genes (Figure 4.9a), and IL-10 blockade magnified this response (Figure
4.9b).
These transcriptional response were explored using the unsupervised
exploratory statistical method of PCA. PCA is described in Introduction section 1.6.2.
Briefly, it can be used to assess variance across a large data set by identifying multiple
directions (termed components) across which the variation in the data is maximal
(Chain et al., 2010; Ringnér, 2008). Each sample in such a dataset can be represented
by its value within each component (a PC score), rather than by using the many
thousands of expression values which contribute to this (Ringnér, 2008), and thus
these scores can be used to visualise relationships within the dataset in multiple
different dimensions. PC scores for the major component describing the zymosan
response were significantly increased in the presence of IL-10 neutralisation (PC1;
Figure 4.9c). PC scores for components describing further aspects of the zymosan
response were, conversely, attenuated by IL-10 neutralisation (PC2–4; Figure 4.9c).
This suggests that blocking IL-10 function in the innate inflammatory response leads to
both induction and suppression of components of gene expression.
To identify which genes were involved in this dysregulated phenotype, the lists
of genes up-regulated by zymosan were compared in the presence or absence of IL-10
neutralisation (Figure 4.10a). As suggested by PCA, IL-10 blockade produced further
increases in gene expression, while other gene expression increases were no longer
evident (Figure 4.10a). Directly comparing the expression of all genes up-regulated in

Chapter 4 Results
190
either condition showed a significant positive correlation and covariance of the overall
response. However, statistically significant differences in expression of ≥two-fold as a
result of IL-10 neutralisation could be identified (Figure 4.10b): 117 genes were further
increased in expression, while 45 genes were attenuated in expression, representing
dysregulation of 17.4% of the response to zymosan.
The 117 zymosan-induced genes which are further increased in expression as
a result of IL-10 neutralisation (Figure 4.10b) are ostensibly negatively regulated by IL-
10 in the context of an innate immune inflammatory response, as IL-10 blockade leads
to their up-regulation. The function of these genes was investigated by GO enrichment
analysis using InnateDB, and the results of this were visualised as a network of
enriched GO terms and associated genes (Figure 4.11). IL-10 exerted negative
regulatory effects on genes encoding for innate immune signalling components, such
as the NFκB pathway mediators RelA and IRAK1, and mediators and regulators of
cytokine signalling such as JAK2, STAT5a and SOCS1. Regulation of apoptosis by IL-
10 was also highlighted, as well as negative regulation of cytokines and secreted
factors, such as IL-12 p40, CCL22, M-CSF and GM-CSF.
A similar analysis was performed for the 45 genes for which expression was
attenuated as a result of IL-10 neutralisation (Figure 4.10b), which are postulated to be
positively regulated by IL-10, as IL-10 blockade leads to their inhibition. A network for
the GO enrichment analysis for these genes is presented in Figure 4.12. This analysis
demonstrates that in the context of inflammation, IL-10 induced changes in gene
expression with potential functions in modulating the innate immune response, in
addition to suppressive effects. Many of the gene induction effects of IL-10 described in
resting MDMS (Figure 4.7) were evident here, such as induction of JAK3 and SOCS3,
S100 proteins, C1S and chemokines.
A large component of the response to zymosan was not affected by autocrine
IL-10 signalling as assessed by IL-10 blockade (Figure 4.10). To investigate the
functional characteristics of the non-IL-10-regulated response, the most highly
zymosan-upregulated genes (≥16-fold increase in expression) for which expression
was not significantly altered by IL-10 blockade were selected, and assessed by GO
enrichment analysis. The results of this analysis are presented in a network in Figure
4.13. This analysis suggests that IL-10 does not regulate the expression of many
molecules considered to be part of the type I IFN and antiviral responses, such as
CXCL9 and members of the IFITM (IFN-induced transmembrane protein) and ISG (IFN

Chapter 4 Results
191
stimulated gene) families. Some genes which IL-10 had been shown to regulate in
other contexts, such as IL23A and IL1B (Figure 4.7; Tomlinson et al., 2014), were not
regulated by IL-10 in this setting, perhaps reflecting some context-specificity of the
function of IL-10.
To gain insight into the mechanisms by which IL-10 regulated gene expression
in inflammation, TFBS enrichment analysis was performed on genes increased in
expression (Figure 4.14a), attenuated in expression (Figure 4.14b) or conserved in
expression (Figure 4.14c) in IL-10 blockade. It should be noted that identification of
TFBS enrichment in this analysis does not definitively indicate that the TF in question is
regulating the genes concerned in this particular experiment, as the majority of genes
will be regulated by many TFs in different contexts, and hence will contain binding sites
for many TFs. Additionally, the presence of a TFBS does not indicate whether the
associated TF is positively or negatively regulating gene expression, both of which are
possible. However, the analysis provides insight into the potential list of TFs which may
regulate these groups of genes in either a positive or negative fashion.
Many TFBSs were significantly enriched in the group of genes postulated to be
negatively regulated by IL-10 (Figure 4.14a). This included binding sites for STAT3,
the primary transcriptional mediator of IL-10 signalling; however, this was one of the
least significantly enriched TFBSs identified, with sites in less than half of the genes
assessed. However, many other TFs were identified in this analysis, and previous
reports have described that the IL-10-induced AIR involves STAT3 inducing expression
of a secondary wave of transcription factors, the AIR factors, which then co-ordinate
the AIR by exerting inhibitory effects on transcription (Hutchins et al., 2012; Murray,
2005). The multiplicity of TFBSs highlighted in this gene list, including many known
innate immune mediators such as NFκB and MZFs, thus supports the suggestion that
negative regulation by IL-10 may mainly be controlled indirectly by other TFs
downstream of STAT3, which alter the outcome of innate immune signalling pathways.
Assessment of the genes postulated to be positively regulated by IL-10 showed
no significant TFBS enrichment (Figure 4.14b; no TFBS has a Z score ≥10). Stat3
binding sites were identified in >50% of these genes, but this was not statistically
significant. The presence of STAT3 binding sites nonetheless suggests that some of
these genes may be directly positively regulated by IL-10 signalling. However, it may
also be possible that these genes are indirectly regulated by IL-10. Overall,
assessments of these gene lists are concordant with the hypothesis that IL-10

Chapter 4 Results
192
signalling involves a limited primary response mediated by STAT3, which then
produces functional outcomes via secondary responses and feedback loops mediated
via other TFs. TFBS enrichment analysis of the genes which were identified as not
regulated by IL-10 (Figure 4.13) shows significant enrichment for NFκB binding sites
only (Figure 4.14c). IRF1 and IRF2 binding sites are also identified in many of these
genes, although are not enriched to a level of statistical significance; however, this
lends support to the hypothesis that this gene list is highly enriched for features of type
I IFN responses, further indicating that this axis of innate immunity is not regulated by
IL-10.
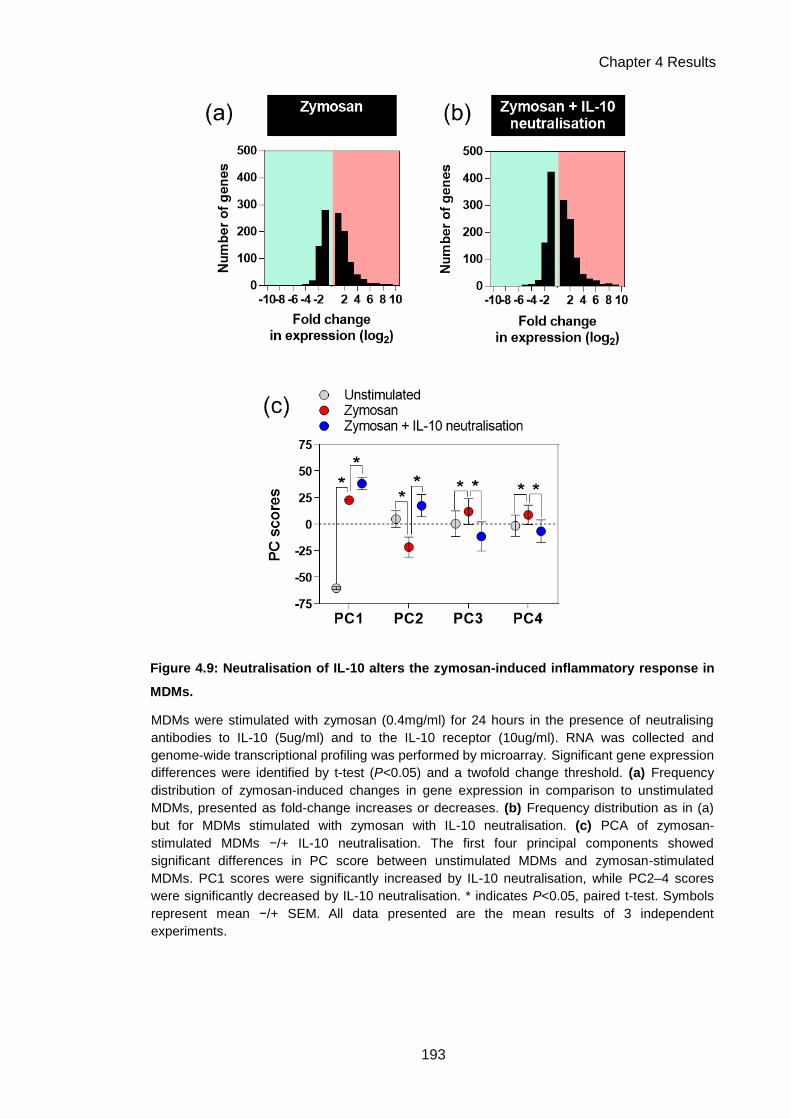
Chapter 4 Results
193
Figure 4.9: Neutralisation of IL-10 alters the zymosan-induced inflammatory response in
MDMs.
MDMs were stimulated with zymosan (0.4mg/ml) for 24 hours in the presence of neutralising
antibodies to IL-10 (5ug/ml) and to the IL-10 receptor (10ug/ml). RNA was collected and
genome-wide transcriptional profiling was performed by microarray. Significant gene expression
differences were identified by t-test (P<0.05) and a twofold change threshold. (a) Frequency
distribution of zymosan-induced changes in gene expression in comparison to unstimulated
MDMs, presented as fold-change increases or decreases. (b) Frequency distribution as in (a)
but for MDMs stimulated with zymosan with IL-10 neutralisation. (c) PCA of zymosan-
stimulated MDMs −/+ IL-10 neutralisation. The first four principal components showed
significant differences in PC score between unstimulated MDMs and zymosan-stimulated
MDMs. PC1 scores were significantly increased by IL-10 neutralisation, while PC2–4 scores
were significantly decreased by IL-10 neutralisation. * indicates P<0.05, paired t-test. Symbols
represent mean −/+ SEM. All data presented are the mean results of 3 independent
experiments.
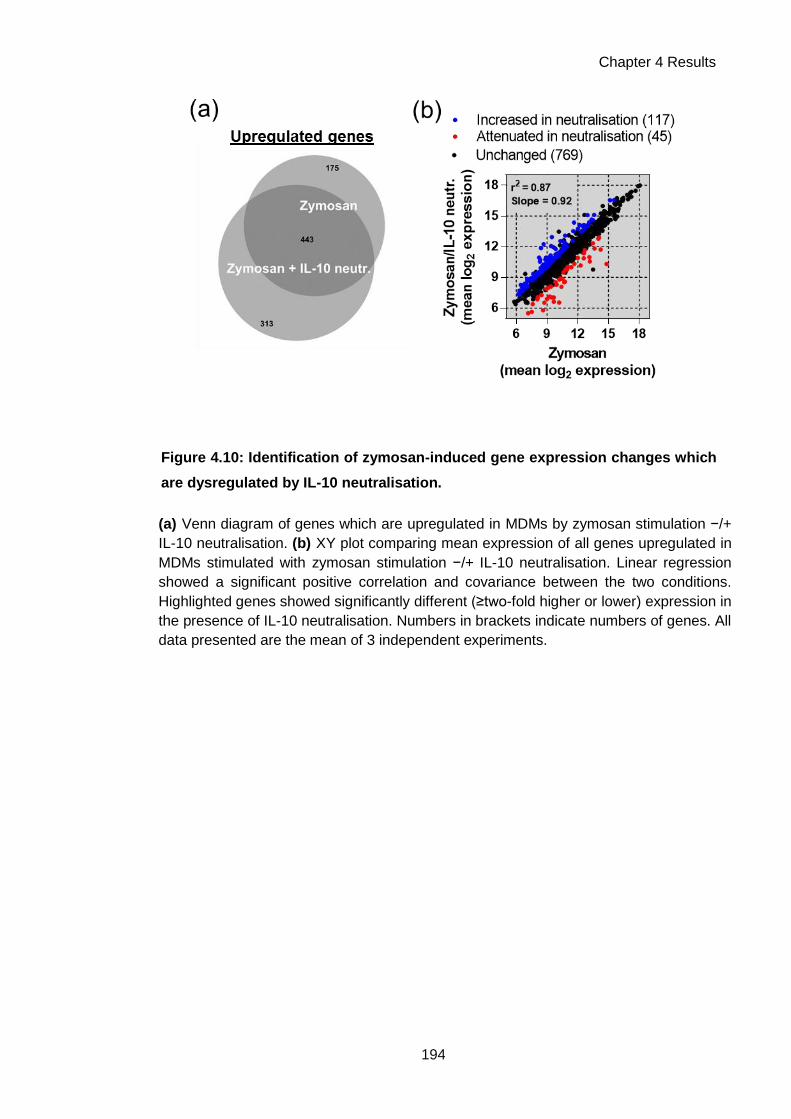
Chapter 4 Results
194
Figure 4.10: Identification of zymosan-induced gene expression changes which
are dysregulated by IL-10 neutralisation.
(a) Venn diagram of genes which are upregulated in MDMs by zymosan stimulation −/+
IL-10 neutralisation. (b) XY plot comparing mean expression of all genes upregulated in
MDMs stimulated with zymosan stimulation −/+ IL-10 neutralisation. Linear regression
showed a significant positive correlation and covariance between the two conditions.
Highlighted genes showed significantly different (≥two-fold higher or lower) expression in
the presence of IL-10 neutralisation. Numbers in brackets indicate numbers of genes. All
data presented are the mean of 3 independent experiments.

Chapter 4 Results
195
Figure 4.11: Genes which are negatively regulated by IL-10 in zymosan
stimulation of MDMs.
IL-10 neutralisation significantly increased the expression of 117 genes which are
usually upregulated in the MDM response to zymosan (Figure 4.10b), suggesting that
these genes were negatively regulated by IL-10. InnateDB (Breuer et al., 2013;
http://www.innatedb.com) GO enrichment analysis was performed for this gene list and
the results of this analysis are visualised as a network. Enrichment assessment was
performed using a hypergeometric algorithm, and filtered to biological process GO
terms with a significance level of P<0.05 (Benjamini-Hochberg correction-adjusted).
The top 20 enriched GO terms by gene count are shown. GO terms are in blue and
genes are in red. Node size is determined by number of connections. All data
presented are derived from the mean results of 3 independent experiments.

Chapter 4 Results
196
Figure 4.12: Genes which are positively regulated by IL-10 in zymosan
stimulation of MDMs.
IL-10 neutralisation significantly attenuated the expression of 45 genes which are
usually upregulated in the MDM response to zymosan (Figure 4.10b), suggesting that
these genes were positively regulated by IL-10. InnateDB (Breuer et al., 2013;
http://www.innatedb.com) GO enrichment analysis was performed for this gene list and
the results of this analysis are visualised as a network. Enrichment assessment was
performed using a hypergeometric algorithm, and filtered to biological process GO
terms with a significance level of P<0.05 (Benjamini-Hochberg correction-adjusted). All
enriched GO terms are shown. GO terms are in blue and genes are in red. Node size is
determined by number of connections. All data presented are derived from the mean
results of 3 independent experiments.

Chapter 4 Results
197
Figure 4.13: Genes which are not regulated by IL-10 in zymosan-stimulated
MDMs.
A large proportion of the gene expression response to zymosan in MDMs was not
affected by IL-10 neutralisation (769 of 915 genes; Figure 4.10b). To gain insight into
the function of these non-IL-10 regulated components of the innate immune response,
the most highly zymosan-inducible genes (≥16-fold increase in expression) were
selected and InnateDB (Breuer et al., 2013; http://www.innatedb.com) GO enrichment
analysis was performed for this gene list. Enrichment assessment was performed using
a hypergeometric algorithm, and filtered to biological process GO terms with a
significance level of P<0.05 (Benjamini-Hochberg correction-adjusted). The 10 most
highly enriched GO terms are shown. GO terms are in blue and genes are in red. Node
size is determined by number of connections. All data presented are derived from the
mean results of 3 independent experiments.

Chapter 4 Results
198
Figure 4.14: TFBS enrichment analyses of IL-10 regulated genes in zymosan-
stimulated MDMs
To gain insight into transcriptional regulation of the genes which were differentially
expressed in zymosan stimulation −/+ IL-10 neutralisation, TFBS enrichment analysis
was performed using oPOSSUM-3 (Kwon et al., 2012; http://opossum.cisreg.ca). The
sequence 5000bp up/downstream of each gene was analysed. Significance of TFBS
frequency compared to background was assessed by the Z-score statistic, which was
considered significant when ≥10. The X axis lists the number of genes enriched for a
TFBS, and the Y axis displays the Z score. (a) TFBS enrichment analysis for genes
further up-regulated as a result of IL-10 neutralisation (Figure 4.10b; Figure 4.12). (b)
TFBS enrichment analysis for genes which were attenuated in expression as a result
of IL-10 neutralisation (Figure 4.10b; Figure 4.13). (c) TFBS enrichment analysis for
genes which were conserved in IL-10 neutralisation (Figure 4.13). All data presented
are derived from the mean results of 3 independent experiments.

Chapter 4 Results
199
4.2.6 IL-10 deficiency in inflammation modulates cell recruitment
Neutralisation of IL-10 in the MDM response to zymosan dysregulated
expression of a range of secreted factors, including cytokines and chemokines (Figure
4.11, 4.12). This suggested that a deficiency in autocrine IL-10 signalling in
macrophages might impact on the function of other cells which are responsive to these
factors. One candidate pathway which may be affected is the recruitment of other
leukocytes to an inflammatory focus generated by the macrophage. A previous
investigation of dysregulated inflammatory responses in HIV-1/Mtb co-infected
macrophages demonstrated that expression of the chemokines CCL20, CCL3,
CCL3L3 and CCL5 in response to Mtb was potentiated by HIV-1 co-infection, and that
this may be a result of IL-10 attenuation (Tomlinson et al., 2014).
I aimed to investigate whether IL-10 deficiency in macrophage-generated
inflammation altered cellular recruitment. A transwell experiment was used to model
recruitment to an inflammatory focus (Figure 4.15a). Conditioned media generated by
zymosan stimulation of macrophages in the presence or absence of IL-10
neutralisation was placed in the lower chamber, and PBMC were placed in the upper
chamber. After 3 hours of migration, cells in the lower chamber were collected and
stained for CD3 and CD14 to quantify T cells and monocytes respectively, using flow
cytometry.
To quantify the migration of different cell populations, a migration index was
used. The absolute numbers of cells recruited, for each cell population of interest, were
normalised as a ratio to the absolute number of that cell population in an input PBMC
sample. The acquisition of all samples, including the input sample, was standardised
using beads spiked into equivalent volumes of fixed cell suspensions. Migration indices
for conditioned media of interest were compared to the migration index for control non-
conditioned media, to identify differential recruitment generated by macrophage
responses.
The PBMC migration index was statistically significantly increased using
conditioned media generated by MDMs with IL-10 neutralisation, regardless of
zymosan stimulation (Figure 4.15b). The CD3+ migration index suggests that increased
numbers of T cells are recruited using zymosan-stimulated conditions (Figure 4.15c),
and this was significantly increased further by IL-10 neutralisation (Figure 4.15c). The
CD14+ monocyte migration index was significantly increased by IL-10 neutralisation

Chapter 4 Results
200
alone (Figure 4.15d). Assessing modulation of CD14+ cell migration in the context of
zymosan stimulation may be confounded by the fact that fewer monocytes migrated
using zymosan-conditioned media (Figure 4.15d), which may be due to inflammatory
mediator-induced increases in monocyte adhesion (Gerszten et al., 1999; Imhof and
Aurrand-Lions, 2004; Jiang et al., 1992) meaning they adhere within the upper
chamber and to the upper surface of the transwell, preventing migration. No differential
recruitment was observed for the CD3−CD14− cell population (Figure 4.15e).
These results suggest that deficiency of IL-10 can impact on cellular recruitment
to a macrophage-generated inflammatory focus. Most strikingly, T cell recruitment is
clearly potentiated by neutralisation of IL-10 in zymosan-stimulated MDMs. Monocyte
recruitment may also be affected, as resting MDMs with IL-10 neutralisation appear to
recruit increased numbers of monocytes; however, further assessment is merited to
clarify whether this also occurs in the presence of inflammation. The CD3−CD14−
population is made up of several cell types, including B cells, NK cells and CD14−
mononuclear myeloid cells, and so although no gross differential recruitment was
shown in this experiment, further assessment may be necessary to delineate any
differential regulation as a result of IL-10 deficiency.

Chapter 4 Results
201
Figure 4.15: IL-10 neutralisation modulates recruitment of PBMC.
(a) Schematic of transwell experimental model. Conditioned media generated from stimulation of
MDMs with zymosan −/+ IL-10 neutralisation (pooled from 4 donors) was placed in the lower
chamber of the transwell. PBMC from a healthy donor were placed in the upper chamber and
allowed to migrate for 3 hours. Recruited cells were stained and analysed by flow cytometry.
Migration indices were calculated for each cell population by normalising the absolute number of
recruited cells to the absolute number in an input PBMC sample. Sample acquisition was
standardised using beads. Control (ctrl) indicates unconditioned media in the lower chamber. (b)
PBMC migration was significantly increased by conditioned media generated with IL-10
neutralisation −/+ zymosan stimulation. (c) CD3+ (T cell) migration was significantly increased by
zymosan-stimulated conditioned media, and addition of IL-10 neutralisation significantly increased
CD3+ migration above zymosan alone. (d) CD14+ (monocyte) migration was significantly increased
by conditioned media generated with IL-10 neutralisation without zymosan stimulation. (e) CD3-
CD14- cell migration index. No conditioned media altered migration. * indicates P<0.05, paired t-test.
Bars show mean −/+ SEM of 4 independent experiments.

Chapter 4 Results
202
4.3 Chapter discussion
I aimed to explore the consequences of IL-10 attenuation for viral replication, and
for the host immune response, in terms of the pathogens affected and the functional
outcomes of innate immune IL-10 deficiency.
To understand the consequences of IL-10 attenuation by HIV-1 in MDMs, I
assessed whether this phenotype provided the virus with a replicative advantage. IL-10
supplementation inhibited zymosan-induced viral replication and release in MDMs
(Figure 4.1), and did so at the level of virus transcription, corroborating previously
published work suggesting this to be the case in other systems (Tanaka et al., 2005;
Wang and Rice, 2006). This gives a strong indication of why restricting IL-10
transcription might provide an advantage to the virus, and thus why HIV-1 has evolved
this function. This enhancement of HIV-1 replication by zymosan, or other stimuli which
activate dectin-1, has not previously been observed. Mtb has been shown to enhance
HIV-1 replication in macrophages, but TLR-2 rather than dectin-1 stimulation has been
the primary pathway implicated in this mechanism (Falvo et al., 2011; Ranjbar et al.,
2012). Establishing whether specific stimulation of dectin-1 can directly enhance HIV-1
replication is of interest, as it would provide insight into the dynamics of viral replication
during fungal co-infections in which dectin-1 is a major PRR. Stimulation of MDMs with
curdlan, a specific dectin-1 ligand, may provide insight into this interaction.
IL-10 supplementation did not affect HIV-1 replication in non-stimulated
macrophages, nor was IL-10 found to modulate macrophage permissivity to HIV-1
infection (Figure 4.2). However, as IL-10 is less likely to be produced by macrophages
in the resting state, and thus to elicit a response in these cells, this situation may be
less relevant than the interplay between HIV-1, IL-10 and macrophages in the context
of macrophage activation. In this model, macrophages are reservoirs of latent HIV-1
infection, which begins to replicate during activation by a pathogen, at which time there
is accumulation of other macrophages and T cells, i.e. an appropriate time for viral
propagation between cells. IL-10 can suppress viral replication and limit the
inflammatory response, so it is advantageous to the virus to inhibit IL-10 production in
order to amplify the inflammatory environment and to maximise viral replication and
transmission to new host cells. Importantly, several studies have identified increased
HIV-1 replication in vivo at the site of TB disease, i.e. an inflammatory environment,
indicating that these interactions may be relevant to co-infection pathogenesis (Collins

Chapter 4 Results
203
et al., 2002b; Garrait et al., 1997; Lawn et al., 2001; Nakata et al., 1997). Testing the
effects of IL-10 supplementation on cell-to-cell spread of virus may provide further
insight into this hypothesis, by determining if IL-10 attenuation by HIV-1 augments
transmission between macrophages or from macrophages to T cells.
To investigate whether HIV-1 attenuated IL-10 responses to a pathogen other
than Mtb, the opportunistic pathogenic fungus C. neoformans was investigated. Uptake
of C. neoformans to MDMs was confirmed, albeit at relatively low levels, and this was
not affected by HIV-1 co-infection (Figure 4.3). However, inflammatory responses to C.
neoformans were not evident, except in response to unencapsulated C. neoformans
mutants, where some pro-inflammatory cytokine expression, and IL-10 secretion (non-
significantly in a subset of donors), was measured at 24 hours (Figure 4.4, Figure 4.5).
The non-immunogenicity of C. neoformans was further confirmed by the lack of NFκB
activation in response to this pathogen (Figure 4.6). As such, the existence or
relevance of attenuated MDM IL-10 responses to C. neoformans could not be
assessed.
C. neoformans is known to be a relatively non-immunogenic organism
(Vecchiarelli et al., 1995). However, as healthy individuals (who do not commonly
experience cryptococcal disease) generate protective immune responses to C.
neoformans, as evident by detectable antibody responses in most individuals by early
childhood (Abadi and Pirofski, 1999; Goldman et al., 2001), presumably an innate
response must occur in vivo in order for an adaptive response to be provoked. It is also
clear that this innate response is likely to be generated by alveolar macrophages, as
transmission of C. neoformans infection occurs via the respiratory tract, and so alveolar
macrophages are assumed to be the primary host cell for the fungus (McQuiston and
Williamson, 2011). It may be that this model of M-CSF differentiated MDMs does not
effectively model the in vivo sentinel cell, alveolar macrophage or otherwise, which
detects C. neoformans, and indeed other reports describing innate responses have
used different cellular models, such as PBMC (Levitz et al., 1994; Walenkamp et al.,
1999) ex vivo alveolar macrophages (Vecchiarelli et al., 1994), DCs (Lupo et al., 2008;
Vecchiarelli et al., 1995) or monocytes (Delfino et al., 1997; Vecchiarelli et al., 1995).
Further experiments using these cells may allow assessment of whether HIV-1
infection of the mononuclear phagocyte sentinel cell modulates the innate response to
C. neoformans, as well as assessing other aspects of this host-pathogen interaction
such as phagocytosis, killing and inflammasome activation. In terms of further

Chapter 4 Results
204
identification of pathogens for which HIV-1-mediated IL-10 attenuation may be relevant,
the agents of other clinically important fungal co-infections are candidates, such as
Candida albicans and Pneumocystic jirovecii.
The consequences of IL-10 attenuation for the function of the immune response
were explored in a set of experiments investigating regulation of macrophage function
by IL-10 signalling. Stimulation of resting MDMs with recombinant IL-10 for 24 hours
induced modest gene expression changes (Figure 4.7), in comparison to the
magnitude of gene expression changes induced by another cytokine which can
modulate macrophage function, IFNγ (Figure 4.8). This gene expression response was
concordant with known functions of IL-10, such as modulation of apoptotic pathways
(Balcewicz-Sablinska et al., 1999, 1998; Eslick et al., 2004; Rojas et al., 1999; Zhou et
al., 2001). Many gene expression changes identified have also been reported by other
investigators as effects of IL-10 on macrophages or monocytes, such as induction of
SOCS3, IL7R, CD163, C1S, IL1B and CCL18 (Antoniv et al., 2005; Teles et al., 2013;
Williams et al., 2002). Many of these genes encode for proteins with functions which
are not classically immunosuppressive or anti-inflammatory, and which have functions
other than mediating inhibition of transcriptional responses, which is suggested to the
main mechanism of IL-10/STAT-3 induced AIR factors (Hutchins et al., 2012; Murray,
2006, 2005). This demonstrates that IL-10 signalling in macrophages can modulate
function, as well as having directly suppressive effects on pro-inflammatory responses.
For example, the induction of signalling molecules such as SOCS3 and JAK3 could
modulate subsequent responses to innate immune stimuli and cytokines, IL1B and
C1S are potentially involved in inflammation, and CCL18 is chemotactic for Th2 cells
(Griffith et al., 2014).
As this gene expression profile represents the outcome 24 hours post-IL-10
signalling, it may include both genes induced directly by IL-10 via STAT3 signalling,
and secondary waves of response coordinated via indirect pathways, particularly as it
is suggested that STAT3 mainly acts to induce the expression of transcription factors
(Hutchins et al., 2012). That it might include both responses is supported by the
observation that it includes previously identified secondary STAT3 effectors, such
BCL3 and BATF (Hutchins et al., 2012), but also clearly includes many genes with
divergent functions. Additionally, TFBS enrichment analysis only identifies STAT3
binding sites in a subset of the genes (Figure 4.7b).

Chapter 4 Results
205
The effects of IL-10 pre-treatment on the MDM response to IFNγ was measured,
to assess whether IL-10 could modulate this key interaction in the cell-mediated
immune response. No significant impact of IL-10 pretreatment was apparent (Figure
4.8). This is consistent with some published reports, including in the mouse model of
Mtb, wherein it has been shown that macrophage-derived IL-10 modulates the immune
response to Mtb by pathways which do not involve the Th1 response (Schreiber et al.,
2009). However, there is a prevalent concept within the field that IL-10 can negatively
regulate protective IFNγ responses and that this is a pathway by which it could
compromise protection in TB infection (O’Garra et al., 2013). This may still occur
indirectly, due to IL-10 regulation of the innate response leading to less Th1
polarisation (Fiorentino et al., 1991, 1991). It is also possible that post hoc signalling by
IL-10 might modulate the IFNγ response. The former scenario is supported by
subsequent experiments assessing the effect of IL-10 blockade on leukocyte
recruitment, in which IL-10 neutralisation potentiates T cell recruitment, suggesting that
IL-10 normally acts to inhibit macrophage/T cell interactions.
However, this experiment strongly indicates that IL-10 does not directly suppress
the macrophage response to IFNγ, and this is supported by the observation that IL-10
does not induce expression of the major intracellular negative regulatory of IFNγ
signalling, SOCS1 (Carey et al., 2012). In fact, IL-10 negatively regulates SOCS1 in a
subsequent experiment assessing the effects of IL-10 via its blockade (Figure 4.11).
The main negative regulator induced by IL-10 in these experiments is SOCS3 (Figure
4.7, Figure 4.12), the main function of which is in negative regulation of innate
inflammatory IL-6 signalling (Carey et al., 2012). These divergent effects of IL-10 on
regulatory pathways controlling either adaptive or inflammatory signalling may indicate
that its main direct function in human macrophages is to regulate the innate response,
via which it may then exert indirect effects on adaptive immunity.
Assessment of the role of IL-10 in the innate immune response was further
extended by specifically investigating its role in inflammation, by blockade of autocrine
IL-10 signalling during zymosan stimulation of MDMs (Figure 4.9–Figure 4.14). Some
of the genes shown to be induced by IL-10 in resting MDMs are also highlighted here,
such as SOCS3, C1S and S100 proteins, showing that in the context of inflammation,
IL-10 still induces particular phenotypic changes in macrophages, as well as exerting
suppressive effects. Its suppressive role is strongly evident in this context: IL-10
negatively regulated approximately 20% of the MDM response to zymosan, consistent

Chapter 4 Results
206
with the reported magnitude of its role in regulating the LPS response in murine
BMDMs (Lang et al., 2002b). It is also clear from this experiment, similarly to the
previous investigation of the murine LPS response, that the regulatory effects of IL-10
on gene expression are greater in magnitude in the context of innate activation of
macrophages than in resting macrophages, supporting the concept that the major role
of IL-10 is to modulate inflammation.
Many of the genes affected by IL-10 neutralisation in this experiment may have
roles in cell-autonomous macrophage functions, highlighting potential dysregulated
macrophage phenotypes which might result from HIV-1 mediated IL-10 attenuation in
the innate immune response. These include the previously discussed dysregulation of
SOCS proteins. Expression of SOCS1, which regulates IFNγ signalling, was induced
as a result of IL-10 blockade, while the IL-6 signalling regulator SOCS3 was
suppressed (Figure 4.11, Figure 4.12; Carey et al., 2012). If corroborated in HIV-1
infected MDMs, this suggests that IL-10 attenuation might cause hyper-responsiveness
to inflammatory IL-6 signalling and hypo-responsiveness to adaptive IFNγ signalling.
Assessing responses of HIV-1 infected MDMs to these cytokines may be informative,
as well as testing the response of HIV-1 infected MDMs to type I IFNs or co-infecting
viruses, as these latter pathways were highlighted by exploration of the component of
the innate immune response which was not regulated by IL-10. Finally, the role of IL-10
in modulating apoptosis was emphasized in these experiments, and as a result
assessments of dysregulation of apoptosis in HIV-1 infected MDMs are clearly merited.
As well as indicating macrophage-autonomous functions which are modulated by
IL-10 neutralisation and hence also potentially by HIV-1 attenuation of IL-10, this
experiment also identifies many factors secreted by MDMs which are dysregulated as
a result of IL-10 blockade, including the genes encoding for IL-12 p40, M-CSF, GM-
CSF and a number of chemokines. This suggests that autocrine IL-10 signalling in
macrophages can indirectly regulate the function of other cells via these factors, thus
identifying candidate pathways by which the IL-10 attenuation phenotype might impact
on the downstream immune response. One such pathway, regulation of chemotaxis, is
discussed subsequently. Other strong candidates for investigation including assessing
the effect of HIV-1 infected macrophages on T cell polarisation, as IL-12, the major
inducer of Th1 polarisation, is dysregulated. Exploring the effects of these cells on
monocyte differentiation is also merited, due to the demonstrated dysregulation of M-
CSF and GM-CSF.

Chapter 4 Results
207
The effects of innate immune IL-10 deficiency on chemotaxis were investigated
by testing recruitment of leukocytes to an inflammatory focus, via modelling this
interaction in a transwell experiment (Figure 4.15). Conditioned media from zymosan-
stimulated MDMs was shown to induce T cell migration, and IL-10 neutralisation was
capable of significantly increasing this (Figure 4.15c). This could potentially be due to
absence of negative regulation by IL-10 of the T cell chemotactic factor CCL22 (Figure
4.11; Griffith et al., 2014). Assessment of whether HIV-1-mediated IL-10 attenuation
produces the same phenotype is warranted, as if HIV-1 uses macrophage IL-10
deficiency to potentiate T cell recruitment in inflammation, this would support the
concept that HIV-1 produces this phenotype in order to maximise its own propagation.
The previous investigation of dysregulated responses in HIV-1/Mtb co-infected
macrophages did not identify CCL22 dyregulation, but did demonstrate exaggerated
production of the T cell chemotactic factor CCL20 (Griffith et al., 2014; Tomlinson et al.,
2014), also supporting further investigation of this phenotype. Blockade of different
chemokines with neutralising antibodies within this experimental setup may also help
identify the specific mechanisms by which IL-10, and possibly HIV-1, lead to
downstream modulation of leukocyte recruitment.
These alterations in cellular recruitment due to IL-10 deficiency also have the
potential to change the quality of the inflammation generated; for example by leading to
polarised T cell phenotypes. As such, further work defining the phenotype of these
recruited T cells is merited: firstly, whether they are CD4+ or CD8+, and secondly,
whether there is differential polarisation within the CD4+ population: CCL22, discussed
above, is postulated to be associated with specific recruitment of Th2 cells (Griffith et
al., 2014).
In these experiments, monocyte recruitment was found to be abrogated in the
presence of conditioned media from zymosan-stimulated MDMs (Figure 4.15d), and
as such the effect of IL-10 neutralisation on modulating their recruitment could not be
assessed. This absence of migration may be due to increased monocyte adhesion in
the upper chamber of the transwell setup, as monocyte adhesion can be induced by
various inflammatory mediators that are likely to be generated by zymosan stimulation
of MDMs (Gerszten et al., 1999; Imhof and Aurrand-Lions, 2004; Jiang et al., 1992).
In summary, the phenotype of IL-10 attenuation may have substantial
consequences for both viral replication and for the host immune response.
Inflammation represents a valuable opportunity for the virus to maximise its own

Chapter 4 Results
208
replication, both within macrophages and by inducing recruitment of new target cells for
infection. Suppressing innate immune IL-10 production allows HIV-1 to potentiate its
own replication in the context of inflammation. As IL-10 has a multitude of modulatory
and suppressive effects, this host-virus interaction may impact on the immune
response in a number of ways. Further exploring the functions of macrophage-
produced IL-10 and dysregulated responses of HIV-1 infected macrophages may
provide insight into the immunopathology of HIV-1 associated co-infections, and the
role of macrophages in these.

Chapter 5. Results
209
Chapter 5. Results 3. Derivation of transcriptional
modules reflecting macrophage heterogeneity
5.1 Background
Macrophages are tissue-resident sentinel cells which are also involved in regulation
and repair processes, and so must continuously respond to changes in the
homeostasis of their environment (Wynn et al., 2013), via a wide variety of potential
inputs. Each of these inputs requires the macrophage to alter its function appropriately,
and therefore functional plasticity and subsequent phenotypic heterogeneity are central
tenets of macrophage biology (Lawrence and Natoli, 2011). This plasticity is assumed
to be primarily controlled at the transcriptional level, wherein the extracellular mediators
inducing macrophage phenotypic adaptation activate intracellular signalling cascades
via receptor ligation, converging on transcriptional outputs which reprogram the
function of the cell (Lawrence and Natoli, 2011; Natoli and Monticelli, 2014). Hence,
genome-wide transcriptional profiling, has been widely employed to characterise the
molecular detail of macrophage activation states (Beyer et al., 2012; Lacey et al., 2012;
Martinez et al., 2006; Nau et al., 2002; Xue et al., 2014).
As macrophages are critical co-ordinators of the immune response in the tissue
microenvironment, most evidently in the context of CMI, assessment of their phenotype
can potentially provide insight into the overarching phenotype of an immune response.
I aimed to use the functional heterogeneity of macrophage phenotypes as a window for
assessing immune responses in vivo, through investigating macrophage plasticity in
human MDMs by transcriptional profiling, and subsequently using these datasets to
analyse in vivo-derived gene expression profiles. To make this link between
macrophage transcriptomes and in vivo gene expression profiles, I chose to use MDM
gene expression data to develop a modular strategy for transcriptional analysis.
Modular analysis of gene expression data is a method by which the expression of a
set of genes that define a particular functional response, cell type or pathway is
quantified as a single variable for comparative assessments (reviewed fully in
Introduction section 1.6.3). For example, to measure IFNγ activity, the expression of
all genes induced by IFNγ is integrated to quantify as a single IFNγ score. There are
several clear advantages provided by modular transcriptomic analyses. Firstly, in
identifying a particular biological process of interest, assaying a set of genes as

Chapter 5. Results
210
opposed to a single gene is likely to provide superior specificity; a single gene is more
likely to act as a false positive than is a combined set of genes. Secondly, the power
available to assess the bioactivity of a particular stimulus is increased by measuring a
larger set of genes as a proxy, as it does not rely on the ability to measure any single
particular molecule. Finally, in assessing gene expression profiles derived from
complex in vivo samples, which are likely to contain multiple signatures of parallel
functional processes, modular analysis may be a particularly valuable method for
deconvoluting genome-wide data into its component, functionally informative parts.
Two principal methods of generating modules currently exist. Firstly, data-driven
modules, an unsupervised method in which co-clustering networks of transcript
correlations are built and used to identify a repertoire of modules each of which is
made up of co-correlated genes. Modules can then be assigned particular functional or
cellular labels by post hoc assessments (Chaussabel and Baldwin, 2014). The second
method can be described as hypothesis-driven, in which the modular activity that the
investigator wishes to assess is defined a priori – for example, the activity of a
particular cytokine or the phenotype of a specific cell – and a gene set is constructed
for this module from bioinformatics sources or experimentally generated transcriptomic
data (Subramanian et al., 2005). Multiple strategies have also been developed to
quantify enrichment of module expression in transcriptomic datasets. These include
simple methods, in which the mean or median expression value of the module gene set
is calculated in the sample of interest, which is then used as a module score which can
be used for between-group comparisons (Chaussabel and Baldwin, 2014). More
complex techniques for assessing enrichment involve statistical algorithms such as
GSEA (Mootha et al., 2003; Subramanian et al., 2005). A gold standard for module
enrichment scoring is yet to emerge (Hung et al., 2012). The most appropriate analysis
method to use is likely to depend on the distribution of the dataset to be assessed
(Alavi-Majd et al., 2014), and use of multiple methods to widely explore datasets and
confirm enrichment may be most appropriate (Glazko and Emmert-Streib, 2009).
I aimed to use macrophage heterogeneity, a powerful gauge of the function of the
immune response, to develop hypothesis-driven modules for stimuli of interest, in order
to facilitate downstream analyses of in vivo-derived gene expression profiles. In order
to do this, I aimed to explore macrophage plasticity via transcriptional profiling, to
develop and optimise gene expression profiles from these data, and to identify

Chapter 5. Results
211
appropriate methods for assessing enrichment of these modules in downstream
applications. The specific objectives of this investigation were as follows:
(a) To use transcriptional profiling to characterise MDM responses to signature
cytokines produced by different T cell subsets: IFNγ, or TNFα (Th1), IL-4
and IL-13 combined (Th2) or TGFβ and IL-10 combined (Treg), to explore
adaptive immune modulation of macrophage plasticity in different types of
polarised immune response.
(b) To use this dataset to generate hypothesis-driven modules, which are
optimised for detection of stimulus-specific effects in gene expression
datasets.
(c) To use the optimised modular generation pipeline to produce modules for
other stimuli of interest, from appropriate MDM transcriptomic datasets:
differential IFN responses, immuno-regulatory IL-10 responses, and specific
innate immune stimuli.
(d) To identify an appropriate method for quantifying enrichment of these
modules in in vivo-derived gene expression profiles.

Chapter 5. Results
212
5.2 Results
5.2.1 MDM transcriptional responses to cytokines associated with differentially
polarised T cell responses
Whole genome transcriptional profiling of unstimulated MDMs revealed gene
expression levels above that of the genome-wide median for the receptors for all
signature cytokines associated with differentially polarised T cell responses (Figure
5.1a). TGFβ receptor type 1 (TGFBR1) expression was lower than that of the other
receptors, but still above the background level of detectable expression (Figure 5.1a).
Interestingly, TGFβ receptor type 2 (TGFBR2) which was highly expressed, can
function as a homodimeric receptor (Derynck and Feng, 1997). These data suggest
that our model of MDM express the full complement of receptors necessary to respond
to the canonical T cell cytokines.
To assess macrophage responses to cytokines, human MDMs were stimulated
with IFN γ, TNFα, IL-4 & IL-13 combined or TGFβ & IL-10 combined, all at 10ng/ml for
24 hours, and genome-wide transcriptional profiling was performed by microarray.
Significant transcriptional expression changes in comparison to unstimulated MDMs
were identified, and are shown as frequency distributions of increased and decreased
fold changes in gene expression (Figure 5.1b). All four conditions were associated
with hundreds of up- and down-regulatory changes in gene expression, with IFNγ
being associated with the greatest magnitude and numbers of changes (Figure 5.1b).

Chapter 5. Results
213
(a) Gene expression matrix for cytokine receptor genes in unstimulated MDMs from five healthy
donors. Data is presented as normalised microarray expression values, where 6.5 is the lowest
detectable expression, 18 is the highest and 8 is the median. GAPDH is shown as a reference
housekeeping gene. (b) Human MDMs were stimulated with recombinant cytokines for 24 hours
at 10ng/ml. RNA was collected and transcriptional profiling performed by microarray. Significant
gene expression changes (≥two-fold, P<0.05) from unstimulated MDMs were identified by t-test
with a Welch’s approximation. All ≥two-fold increases and decreases in gene expression are
displayed as frequency distributions of numbers of changes induced in each condition. Gene
lists are filtered to remove any duplicate genes which might be present due to representation of
the same gene by multiple probes on the microarray. Results represent mean gene expression
values for at least three individual healthy donor MDMs for each condition.
Figure 5.1: Transcriptional responses of MDMs to cytokines produced by differentially
polarised T cell responses.

Chapter 5. Results
214
5.2.2 Functional investigation of MDM transcriptional responses to cytokines
associated with differentially polarised T cell responses
I explored the transcriptional changes induced by each cytokine using a
bioinformatics approach. Firstly, in order to investigate the potential regulation of each
up-regulated or down-regulated gene list, TFBS enrichment analysis was performed
using oPOSSUM-3 (Kwon et al., 2012; http://opossum.cisreg.ca). Diverse arrays of
transcription factors were enriched in these gene lists, representing potentially complex
programs of cytokine-induced or cytokine-suppressed transcriptional changes (Figure
5.2–5.5). These included transcription factors known to be activated by these
cytokines, such as NFκB in TNFα-induced genes (Figure 5.3) and STAT1 in IFNγ-
suppressed genes (Figure 5.2a). The latter observation may reflect direct
transcriptional suppression mediated by STAT1, as has been reported in the murine
system (Begitt et al., 2014).
Exploration of the functional characteristics of the gene lists was performed via
pathway enrichment analysis using the web tool InnateDB, a manually curated
knowledge database for the innate immune response, which integrates interaction &
pathway information from several public databases (Breuer et al., 2013;
http://www.innatedb.com; Figure 5.2–5.5). The results of this analysis were visualised
as networks of enriched pathways and associated genes. All gene lists were enriched
for multiple pathways. Some of these were confirmatory with regards to the assumed
effects of the cytokines. IFN signalling pathways were enriched in IFNγ-up-regulated
genes (Figure 5.2b). Inflammatory pathways, such as complement activation, were
enriched in genes down-regulated by the regulatory cytokines TGFβ and IL-10 (Figure
5.5c). Common themes of cytokine-mediated MDM activation were also evident.
Chemokine activity was enriched in genes up-regulated by TNFα, IL-4 and IL-13, or
TGFβ and IL-10 (Figure 5.3–5.5). Arachidonic acid metabolism was enriched in genes
down-regulated by TNFα, or by IL-13 and IL-13 (Figure 5.3, 5.4).

Chapter 5. Results
215
Figure 5.2: MDM transcriptional response to IFNγ.
Human MDMs were stimulated with recombinant IFNγ for 24 hours at 10ng/ml. RNA was
collected and transcriptional profiling performed by microarray. Significant gene expression
changes (P<0.05) from unstimulated MDMs were identified by t-test with a Welch’s
approximation. (a) Lists of genes up-regulated or down-regulated (≥two-fold) by IFNγ were
subjected to TFBS enrichment analysis using oPOSSUM-3. Significance of the frequency of
TFBS occurrence in gene lists compared to background was assessed by the Z-score statistic,
with a score greater than 10 used as a significance threshold. (b, c) Network visualisations of
InnateDB pathway enrichment analysis for genes up-regulated (b) or down-regulated (c) by
IFNγ. Enrichment assessment was performed using a hypergeometric algorithm and filtered to
Reactome-curated pathways with a significance level of P<0.05 (Benjamini-Hochberg
correction-adjusted. Gene nodes are in red and pathway nodes are in blue. Node size is
determined by the number of connections.

Chapter 5. Results
216
Figure 5.3: MDM transcriptional response to TNFα.
Human MDMs were stimulated with recombinant TNFα for 24 hours at 10ng/ml. RNA was
collected and transcriptional profiling performed by microarray. Significant gene expression
changes (P<0.05) from unstimulated MDMs were identified by t-test with a Welch’s
approximation. (a) Lists of genes up-regulated or down-regulated (≥twofold) by TNFα were
subjected to TFBS enrichment analysis using oPOSSUM-3. Significance of the frequency of
TFBS occurrence in gene lists compared to background was assessed by the Z-score statistic,
with a score greater than 10 used as a significance threshold. (b, c) Network visualisations of
InnateDB pathway enrichment analysis for genes up-regulated (b) or down-regulated (c) by
TNFα. Enrichment assessment was performed using a hypergeometric algorithm and filtered to
Reactome-curated pathways with a significance level of P<0.05 (Benjamini-Hochberg
correction-adjusted. Gene nodes are in red and pathway nodes are in blue. Node size is
determined by the number of connections.

Chapter 5. Results
217
Figure 5.4: MDM transcriptional response to IL-4 and IL-13.
Human MDMs were stimulated with recombinant IL-4 and IL-13 for 24 hours at 10ng/ml. RNA
was collected and transcriptional profiling performed by microarray. Significant gene expression
changes (P<0.05) from unstimulated MDMs were identified by t-test with a Welch’s
approximation. (a) Lists of genes up-regulated or down-regulated (≥twofold) by IL-4 and IL-13
were subjected to TFBS enrichment analysis using oPOSSUM-3. Significance of the frequency
of TFBS occurrence in gene lists compared to background was assessed by the Z-score
statistic, with a score greater than 10 used as a significance threshold. (b, c) Network
visualisations of InnateDB pathway enrichment analysis for genes up-regulated (b) or down-
regulated (c) by IL-4 and IL-13. Enrichment assessment was performed using a hypergeometric
algorithm and filtered to Reactome-curated pathways with a significance level of P<0.05
(Benjamini-Hochberg correction-adjusted. Gene nodes are in red and pathway nodes are in
blue. Node size is determined by the number of connections.

Chapter 5. Results
218
Figure 5.5: MDM transcriptional response to TGFβ and IL-10.
Human MDMs were stimulated with recombinant TGFβ and IL-10 for 24 hours at 10ng/ml. RNA
was collected and transcriptional profiling performed by microarray. Significant gene expression
changes (P<0.05) from unstimulated MDMs were identified by t-test with a Welch’s
approximation. (a) Lists of genes up-regulated or down-regulated (≥twofold) by TGFβ and IL-10
were subjected to TFBS enrichment analysis using oPOSSUM-3. Significance of the frequency
of TFBS occurrence in gene lists compared to background was assessed by the Z-score
statistic, with a score greater than 10 used as a significance threshold. (b, c) Network
visualisations of InnateDB pathway enrichment analysis for genes up-regulated (b) or down-
regulated (c) by TGFβ and IL-10. Enrichment assessment was performed using a
hypergeometric algorithm and filtered to Reactome-curated pathways with a significance level of
P<0.05 (Benjamini-Hochberg correction-adjusted. Gene nodes are in red and pathway nodes
are in blue. Node size is determined by the number of connections.

Chapter 5. Results
219
5.2.3 Exploring the stimulus specificity of MDM transcriptional responses
PCA is an unsupervised exploratory statistical method which can be used to
assess variance across a large data set in such a way that retains more information
than simple hierarchical clustering, described in Introduction section 1.6.2.
PCA was used to explore the transcriptional responses of MDMs to different T
cell subset-derived cytokines. The outcome of the PCA is shown in Figure 5.6(a), and
demonstrates that the dataset is highly multidimensional, with 80% of the variance
explained by seven PCs. A matrix of the PC scores for these components for each
stimulated MDM condition is shown in Figure 5.6(b). Negative and positive signs in PC
scores do not represent any inherent increase or decrease in gene expression, but are
arbitrarily assigned in order to centre each PC on zero. Visualisation of PC scores in
geometric space is shown for PC1 and PC2, or PC3 and PC4, in Figure 5.6(c).
Assessment of these PCA plots and the PC score matrix shows that most PC
directions are associated with more than one condition (displayed in network form in
Figure 5.6d). This analysis demonstrates that the transcriptional programs induced by
these cytokines in MDMs have many overlapping features, although a subset of
responses to each stimulus may in fact be unique and specific, e.g. the positive
direction of PC3 for IL-4 and IL-13; the positive direction of PC2 for TNFα; and the
negative direction of PC3 for TGFβ and IL-10.

Chapter 5. Results
220
Figure 5.6: Exploring the stimulus-specificity of MDM transcriptional responses to
cytokines using principal component analysis.
Principal component analysis (PCA) of gene expression data from MDMs stimulated with IFNγ,
TNFα, IL-4 and IL-13 or TGFβ and IL-10. (a) Plot demonstrating the variance (determined by
eigenvalues) attributable to each principal component (PC), autonomously (blue) or
cumulatively (red). The dashed box shows selection of components which describe
approximately 80% of the variance in the dataset, for which principal component scores (PC
scores) for each MDM condition are shown in the matrix in (b). Values shown are the median of
at least three independent MDM transcriptomes for each condition. (c) PC score plots for PC1
and PC2, or PC3 and PC4. Each symbol represents a separate MDM transcriptome. (d)
Network map of relationships of different PC directionss to stimulation conditions. PC directions
which are uniquely associated with one stimulus are shown in red.

Chapter 5. Results
221
5.2.4 Identifying appropriate measurements of module expression and
enrichment
I explored the transcriptional responses of MDMs to cytokines associated with
particular polarised T cell responses and showed that these cytokines induced many
gene expression changes in MDMs (Figure 5.1), which were associated with particular
functional outcomes (Figure 5.2–5.5), including responses which were either shared
between stimuli or were stimulus-specific (Figure 5.6). I then used these gene
expression data sets to develop a pipeline for generating gene expression modules
optimised for detecting stimulus-specific transcriptional responses, for subsequent use
in detecting the effects of these stimuli in in vivo gene expression datasets. I aimed to
derive modules of optimal specificity, which were powered to detect the specific activity
of a particular stimulus, while also having adequate sensitivity to detect this activity in a
potentially noisy in vivo setting. I also aimed to ensure that the modules contained
enough genes to retain the advantages of using a gene list strategy (discussed in
section 5.1).
In order to derive and optimise modules, I first identified an appropriate
measurement of module expression in a gene expression dataset, as using such a
measurement would be critical in assessing module specificity. Three measurements
of central tendency of module gene list expression were considered for this purpose:
the mean, the median and the geometric mean. These will respectively assume that
the data in question is parametric, is non-parametric (which is likely for complex gene
expression data), or that the different parameters contributing to the data may have
different distributions (which is also likely, as expression of different genes may vary
over different ranges).
For this exercise, I used a preliminary module in which high a priori confidence
was held, due to the potent functional effects of the stimulus in question: an IFNγ
module, made up of genes significantly (P<0.05) up-regulated by ≥twofold by IFNγ.
The mean, median and geometric mean expression for this module were assessed in
unstimulated MDMs and cytokine-stimulated MDMs, as a test group of gene
expression datasets. All three measurements proved to be discriminatory with regard
to differential modular expression: the IFNγ module was only highly expressed in IFNγ-
stimulated MDMs (Figure 5.7a–c). There were no clear major differences between the
three measurements in their quantitative or discriminatory capacities, as they produced
similar overall expression patterns (Figure 5.7a–c). However, it was considered that

Chapter 5. Results
222
the geometric mean was the most appropriate measurement of central tendency due to
the nature of the data, so this measurement was carried forward for further use.
Methods for assessing enrichment of modular expression, as quantified by
geometric mean, were then tested, to establish a system for assigning “module
enrichment scores” to different samples for comparative analyses. Firstly, enrichment
with regard to the genome-wide gene expression level was measured, wherein the
geometric mean of genome-wide expression was calculated and used as the
denominator in a ratio for normalisation to produce module scores (Figure 5.7d). In
this method, if the module enrichment score is >0, this indicates that the expression of
the module is above the genome-wide geometric mean, as the scale used in these
assessments is a log2 scale, wherein a ratio of 0 indicates equivalence and a ratio of 1
indicates a twofold difference. This assessment is suitable for measuring enrichment,
as it can be assumed that the expression of a randomly selected set of genes would
approximate to the genome-wide geometric mean; thus expression above this level for
a module gene set shows that the expression of that module is non-random and
enriched. It can also control for any variation in genome-wide gene expression
between samples. In this dataset, this appeared to be an appropriate method for
scoring enrichment, as IFNγ-stimulated MDMs had the highest enrichment scores of all
MDMs tested (Figure 5.7d).
Although this is a powerful method for assessing enrichment, the most
interesting and relevant differences biologically are likely to be those quantified in
comparison to control samples. In these test datasets, the unstimulated MDMs were
the appropriate control, and so a second set of module enrichment scores was
calculated, wherein the denominator was the median of the measured module
expression values (geometric means) for the control group of unstimulated MDMs
(Figure 5.7e). This again appeared to be an appropriate method for scoring
enrichment, as the highest scores produced were for IFNγ-stimulated MDMs (Figure
5.7e). It is also possible to perform statistical testing of module expression when
control data are available, by comparison of module expression values between the
group of interest and the control group. Therefore, in future assessments of module
enrichment, I aimed to use normalisation to control data where it was available, as this
is the most biologically relevant comparison. Where control data is not available,
comparison with the genome-wide geometric mean, as described above, is an
appropriate alternative.

Chapter 5. Results
223
Figure 5.7: Methods of quantifying module expression and module enrichment.
To identify an appropriate measurement of module gene set expression, a test exercise was
carried out. Expression of an IFNγ module was assessed in unstimulated and cytokine-
stimulated MDMs. Three measures of central tendency were assessed: mean (a), median (b),
and geometric mean (c). For all measurements, the IFNγ module was most highly expressed in
IFNγ-stimulated MDMs. Geometric mean was selected as the most appropriate measurement.
Using geometric mean module expression, two methods for quantifying module enrichment
were assessed. (d) Enrichment scores were calculated as module expression normalised by a
ratio to the geometric mean expression for the entire genome. (e) Enrichment scores were
calculated as module expression normalised by a ratio to the median value for module
expression in a control sample group: in this case, unstimulated MDMs. Each symbol shows a
separate MDM transcriptome. Lines and error bars indicate median and range.

Chapter 5. Results
224
5.2.5 Developing modules from T cell subset-derived-cytokine-stimulated
MDMs
After selecting appropriate methods for measuring module expression and
enrichment, I then developed a pipeline for deriving optimally specific modules using
the cytokine-stimulated MDM datasets discussed in sections 5.2.1–5.2.3. The gene
lists derived in the analysis presented in Figure 5.1, of genes significantly (P<0.05) up-
regulated by ≥two-fold by each stimulus, were used as the initial modules, shown in
Table 5.1. I aimed to ensure that these modules had adequate sensitivity for detecting
the effects of these stimuli in potentially noisy in vivo settings, by selecting a twofold
change cut-off and hence only including genes which are highly up-regulated by the
cytokines.
I then went on to assess the specificity of these modules via two approaches:
firstly identifying any cross-over in the module gene lists via Venn diagrams, and
secondly measuring the module enrichment scores in all cytokine-stimulated MDMs,
with the hypothesis that an optimally specific module should only be highly expressed
in MDMs stimulated with the module-specific stimulus. These assessments are
presented as matrices, wherein rows represent modules and columns represent MDM
transcriptomes for the conditions indicated. The two module enrichment scores
described in section 5.2.5 and Figure 5.7, by either normalisation to the genome-wide
geometric mean or the median control geometric mean, were used.
The specificity of this set of modules was not optimal (Figure 5.8). For example,
high expression of the TNFα module was evident in IFNγ-stimulated MDMs and
TGFβ/IL-10 stimulated MDMs (Figure 5.8a). A Venn diagram demonstrated that there
was considerable cross-over between module gene lists (Figure 5.8c).
I hypothesised that further restricting the modules to genes up-regulated by
≥four-fold by each stimulus might improve specificity. The derivation of these modules
is shown in Table 5.2 and the specificity assessment (performed as for the twofold
change modules) is shown in Figure 5.9. Some specificity issues were still evident with
these modules, with cross-enrichment of modules observed in differential conditions.
Additionally, some cross-over between the module gene lists was still identified by
Venn diagram (Figure 5.9c).
I performed a final filtering step to further improve specificity, in which any gene
which was up-regulated more than twofold by any other stimulus was removed from

Chapter 5. Results
225
the fourfold change gene lists (Table 5.3), to produce completely unique gene lists.
Module specificity was further improved by this filter (Figure 5.10), evident in the
minimal enrichment detected for all modules in MDMs not stimulated with the module-
specific cytokine, and approximately eight-fold higher enrichment scores in the
specifically stimulated MDMs in comparison to controls. These modules were
employed for downstream analyses, and the pipeline used for their development was
used to derive modules for other stimuli of interest (sections 5.2.6–5.2.8).
StimulusT-test, p<0.05
filter2FC filter
IFNγ 1693 315
TNFα 1460 157
IL-4/IL-13 1435 190
TGFβ/IL-10 1084 161
Table 5.1: Development of T cell-subset-derived-cytokine modules – twofold
change modules.
Numbers in each column represent the number of genes selected by that stage of
filtering. 2FC, twofold change.

Chapter 5. Results
226
Figure 5.8: Assessing specificity of T cell-subset-derived-cytokine modules – twofold
change modules.
Matrices are presented showing module enrichment scores in the MDM transcriptomes used for
module derivation, as an assessment of module specificity. Modules are in rows and MDM
transcriptomes are in columns. Ctrl indicates unstimulated MDMs. All values presented are the
medians of module enrichment scores in at least three independent MDM datasets for each
condition. (a) Matrix of module expression presented as the geometric mean of the expression
values for the genes making up the module, normalised to the genome-wide geometric mean
expression for the same sample. Max on the colour scale is the maximum value for this dataset.
(b) Matrix of module expression presented as the geometric mean of the expression values for
the genes making up the module, normalised to the same measure of modular expression in the
control samples. Max on the colour scale is the maximum value for this dataset. (c) Venn
diagram depicting the shared genes between the four module gene lists. Numbers represent the
number of twofold change-induced genes shared between/unique to module gene lists.

Chapter 5. Results
227
StimulusT-test, p<0.05
filter2FC filter 4FC filter
IFNγ 1693 315 93
TNFα 1460 157 34
IL-4/IL-13 1435 190 51
TGFβ/IL-10 1084 161 42
Table 5.2: Development of T cell-subset-derived-cytokine driven modules
– fourfold change modules.
Numbers in each column represent the number of genes selected by that stage of
filtering. 2FC, twofold change; 4FC, fourfold change.
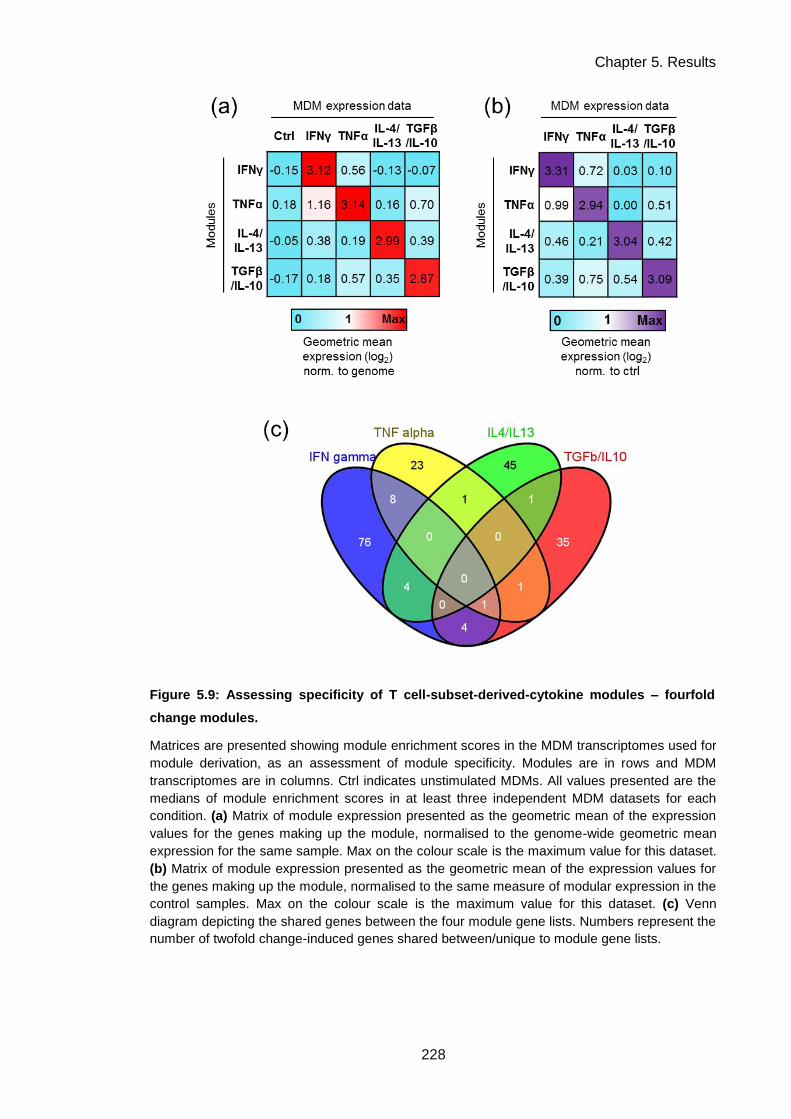
Chapter 5. Results
228
Figure 5.9: Assessing specificity of T cell-subset-derived-cytokine modules – fourfold
change modules.
Matrices are presented showing module enrichment scores in the MDM transcriptomes used for
module derivation, as an assessment of module specificity. Modules are in rows and MDM
transcriptomes are in columns. Ctrl indicates unstimulated MDMs. All values presented are the
medians of module enrichment scores in at least three independent MDM datasets for each
condition. (a) Matrix of module expression presented as the geometric mean of the expression
values for the genes making up the module, normalised to the genome-wide geometric mean
expression for the same sample. Max on the colour scale is the maximum value for this dataset.
(b) Matrix of module expression presented as the geometric mean of the expression values for
the genes making up the module, normalised to the same measure of modular expression in the
control samples. Max on the colour scale is the maximum value for this dataset. (c) Venn
diagram depicting the shared genes between the four module gene lists. Numbers represent the
number of twofold change-induced genes shared between/unique to module gene lists.

Chapter 5. Results
229
StimulusT-test, p<0.05
filter2FC filter 4FC filter Specificity filter
IFNγ 1693 315 93 65
TNFα 1460 157 34 16
IL-4/IL-13 1435 190 51 32
TGFβ/IL-10 1084 161 42 27
Table 5.3: Development of T cell-subset-derived-cytokine driven modules
– specific fourfold change modules.
Numbers in each column represent the number of genes selected by that stage of
filtering. The specificity filter represents the removal of any gene which features in
the 2FC gene list for more than one condition. 2FC, twofold change; 4FC, fourfold
change.

Chapter 5. Results
230
Figure 5.10: Assessing specificity of T cell-subset-derived-cytokine modules – unique
fourfold change modules.
Matrices are presented showing module enrichment scores in the MDM transcriptomes used for
module derivation, as an assessment of module specificity. Modules are in rows and MDM
transcriptomes are in columns. Ctrl indicates unstimulated MDMs. All values presented are the
medians of module enrichment scores in at least three independent MDM datasets for each
condition. (a) Matrix of module expression presented as the geometric mean of the expression
values for the genes making up the module, normalised to the genome-wide geometric mean
expression for the same sample. Max on the colour scale is the maximum value for this dataset.
(b) Matrix of module expression presented as the geometric mean of the expression values for
the genes making up the module, normalised to the same measure of modular expression in the
control samples. Max on the colour scale is the maximum value for this dataset.

Chapter 5. Results
231
5.2.6 Development of differential IFN pathway modules
Type I and type II IFNs induce complex programs of gene expression which
share many features, but are known to be functionally distinct (Schneider et al., 2014).
Recently there has been interest in the impacts that these differential functional effects
might have on anti-mycobacterial immunity (Teles et al., 2013). I developed modules
for measuring the specific activity of type I or type II IFNs using the pipeline developed
in section 5.2.5. The gene expression dataset available for this purpose was derived
from MDMs stimulated for 4 hours with either IFNβ (type I IFN), or IFNγ (type II IFN)
(Tsang et al., 2009). Derivation of these modules is presented in Table 5.4. Although
assessment of the crossover between the two-fold and four-fold change gene lists for
both IFNs showed considerable overlap (Figure 5.11), an arguably adequate degree of
specificity was achieved (Figure 5.12), wherein each IFN module was enriched by
≥twofold in its matched IFN-stimulated MDM dataset in comparison to the non-matched
dataset.
As an additional quality control step, post hoc bioinformatic verification of
module gene list function was carried out using InnateDB pathway analysis. This
suggested that adequate specificity had been achieved, as each module gene list was
highly enriched for its respective IFN signalling pathway (Table 5.5).

Chapter 5. Results
232
Table 5.4: Development of IFN pathway modules
– specific fourfold change modules.
Numbers in each column represent the number of genes selected by that stage of
filtering. The specificity filter represents the removal of any gene which features in the
2FC gene list for more than one condition. 2FC, twofold change; 4FC, fourfold change.
Figure 5.11: Venn diagrams of cross-over between IFN-induced gene lists.
StimulusT-test, p<0.05
filter2FC filter 4FC filter Specificity filter
Type I IFN 3524 630 181 108
Type II IFN 1373 226 71 24
Venn diagrams depicting shared genes between the IFN-induced gene lists. Numbers
represent the number of genes shared between/unique to gene lists.
(a) Two-fold change gene lists. (b) Four-fold change gene lists.

Chapter 5. Results
233
Figure 5.12: Assessing specificity of IFN pathway modules – specific fourfold change
modules.
Matrices are presented showing module enrichment scores in the MDM transcriptomes used for
module derivation, as an assessment of module specificity. Modules are in rows and MDM
transcriptomes are in columns. Ctrl indicates unstimulated MDMs. All values presented are the
medians of module enrichment scores in at least three independent MDM datasets for each
condition. (a) Matrix of module expression presented as the geometric mean of the expression
values for the genes making up the module, normalised to the genome-wide geometric mean
expression for the same sample. Max on the colour scale is the maximum value for this dataset.
(b) Matrix of module expression presented as the geometric mean of the expression values for
the genes making up the module, normalised to the same measure of modular expression in the
control samples. Max on the colour scale is the maximum value for this dataset.

Chapter 5. Results
234
Table 5.5: Bioinformatic verification of IFN pathway modules.
InnateDB pathway enrichment analysis (Breuer et al., 2013; http://www.innatedb.com)
for module gene lists. Enrichment assessment was performed using a hypergeometric
algorithm and filtered to pathways with a significance level of P<0.05 (Benjamini-
Hochberg correction-adjusted). The three most highly enriched pathways, their sources
and corrected P values for enrichment significance are shown for each module.
Module Pathway Name Source NamePathway P value
(corrected)
Type I IFN Interferon alpha/beta signaling REACTOME 1.90E-08
Scavenging of Heme from Plasma REACTOME 2.75E-06
Nicotinate Nicotinamide metabolism INOH 9.76E-04
Type II IFN Chemokine signaling pathway KEGG 2.70E-06
Interferon gamma signaling REACTOME 9.72E-06
IL23-mediated signaling events PID NCI 1.40E-04

Chapter 5. Results
235
5.2.7 Development of IL-10 modules
Gene expression profiling had demonstrated a detectable but limited
transcriptional response in MDMs to specific stimulation with IL-10 for 24 hours
(Chapter 4, section 4.2.3). I developed a module from this dataset using a less
stringent pipeline than the one described in section 5.2.5. A two-fold change filter was
used, as few genes were up-regulated by more than four-fold by IL-10, and a specificity
filtration step with comparisons to gene lists from other stimuli was not employed. This
strategy was used in order to develop a module which was highly sensitive for
detecting the subtle autonomous effects of IL-10, even if some specificity was
compromised as a result. A module of 47 genes was derived (Table 5.6).
An alternative IL-10 module was also developed from an independent dataset:
gene expression data from MDMs stimulated for 24 hours with an inflammatory
stimulus (zymosan) in the presence of neutralising antibodies to IL-10 and the IL-10
receptor (i.e. an inflammatory scenario in which IL-10 activity is known to be deficient)
(Chapter 4, section 4.2.5). In this case, the module gene list was generated by testing
for significant gene expression differences between MDMs stimulated with zymosan
and MDMs stimulated with zymosan in the presence of IL-10 neutralisation. A two-fold
change filter was then applied, to select genes for which expression was decreased in
IL-10 neutralisation, i.e. those which are usually positively regulated by IL-10. This
yielded a module of 49 genes (Table 5.6). Comparison of this gene list with the
directly-induced IL-10 module revealed some overlap (Figure 5.13), lending
confidence to the hypothesis that these genes are regulated by IL-10.
Module gene list specificity was assessed by Venn diagram comparison with
the T cell-subset-derived cytokine modules (excepting the TGFβ/IL-10 combined
module, with which overlap would be expected). Both IL-10 modules had minimal
overlap with these gene lists (Figure 5.14a, b). A formal assessment of specificity
demonstrated that the IL-10 module was highly enriched in IL-10 stimulated MDMs,
with a reasonably high degree of specificity, but that the zymosan/IL-10 neutralisation
module was not enriched as highly or specifically (Figure 5.14c, d). I performed
bioinformatic verification of these modules by oPOSSUM TFBS enrichment analysis
(Figure 5.15). Significant enrichment of binding sites for STAT3, the downstream
mediator of IL-10 signalling, was found in the IL-10 module gene list (Williams et al.,

Chapter 5. Results
236
2004; Figure 5.15a). STAT3 binding sites were also identified in the majority of genes
in the zymosan/IL-10 neutralisation module, but this enrichment was not significant
(Figure 5.15b).
Due to the low sensitivity and specificity of the zymosan/IL-10 neutralisation
module in the initial set of analyses, I performed further evaluations of these modules.
Enrichment scores for both modules were significantly higher in IL-10 stimulated MDMs
than in MDMs stimulated with other cytokines (Figure 5.16a, b). Correlation and
covariance of the two module scores were assessed across all cytokine-stimulated
MDMs. They were found to strongly correlate (r2=0.82) and have significant covariance
(P<0.0001), but the zymosan/IL-10 neutralisation module scores were much lower for
each sample (slope = 0.58; Figure 5.16c). This suggested that the zymosan/IL-10
neutralisation module could specifically detect the effect of IL-10, but that it was less
sensitive than the IL-10 module.
I hypothesised that the zymosan/IL-10 neutralisation module might be more
sensitive to detect the effects of IL-10 in the context of an inflammatory stimulus, as it
was generated from such a condition. Correlation and covariance of module scores
were assessed between the two modules in innate immune-stimulated MDMs, and
were found to strongly correlate (r2=0.93) and have significant covariance (P<0.0001),
with a slope of close to 1 (Figure 5.16d). Both modules were most highly enriched in
MDMs stimulated with Mtb, which has been shown to be most potent inducer of IL-10
of the four stimuli tested (Tomlinson et al., 2014; Figure 5.16d). A formal specificity
assessment of modular enrichment in innate immune-stimulated MDMs also
demonstrated that the zymosan/IL-10 neutralisation module was highly enriched in
these datasets, and in particular in Mtb-stimulated MDMs (Figure 5.17). These
analyses suggest that the zymosan/IL-10 neutralisation module is most sensitive for
detecting the effect of IL-10 in an inflammatory context. Therefore, it may have utility in
assessing IL-10 function in inflammatory in vivo samples.

Chapter 5. Results
237
StimulusT-test, p<0.05
filter2FC filter
IL-10 274 47
Zymosan + IL-10
neutralisation374 49
Table 5.6: Development of IL-10 modules
– twofold change modules.
Venn diagrams depicting shared genes between the IL-10 module gene lists. Numbers
represent the numbers of genes shared between/unique to gene lists. Zym/IL-10n;
zymosan + IL-10 neutralisation
Numbers in each column represent the number of genes selected by that stage of
filtering. 2FC, twofold change.
Figure 5.13: Venn diagram of cross-over between IL-10 module gene lists.

Chapter 5. Results
238
Figure 5.14: Assessing specificity of IL-10 modules – twofold change modules.
(a, b) Venn diagrams depicting shared genes between the IL-10 module gene lists and other
cytokine-induced modules; (a) IL-10; (b) zymosan + IL-10 neutralisation. Numbers represent the
numbers of genes shared between/unique to gene lists. (c) Matrix of module expression
presented as the geometric mean of the expression values for the genes making up the
module, normalised to the genome-wide geometric mean expression for the same sample. Max
on the colour scale is the maximum value for this dataset. (d) Matrix of module expression
presented as the geometric mean of the expression values for the genes making up the
module, normalised to the same measure of modular expression in the control samples. Max on
the colour scale is the maximum value for this dataset.

Chapter 5. Results
239
Figure 5.15: Bioinformatic verification of IL-10 modules by TFBS enrichment analysis.
Module gene lists were subjected to TFBS enrichment analysis using oPOSSUM-3 (Kwon et al.,
2012; http://opossum.cisreg.ca). Significance of the frequency of TFBS occurrence in gene lists
compared to background was assessed by the Z-score statistic, with a score greater than 10
used as a significance threshold. Results of this analysis are shown for the IL-10 module (a)
and the zymosan/IL-10 neutralisation module (b). All significantly enriched TFBSs in the
sequence region 5000bp upstream/downstream of each gene are shown. The X axis lists the
number of genes enriched for a TFBS, and the Y axis displays significance by Z score.

Chapter 5. Results
240
Figure 5.16: Further investigations of specificity and comparability of IL-10 modules.
(a) Comparison of the geometric mean of module expression in the dataset of interest
normalised to the geometric mean of module expression in control MDMs (module score) of the
IL-10 module in IL-10 stimulated MDMs versus all other cytokine-stimulated MDMs. * represents
P<0.05, Mann-Whitney test. (b) Comparison of the zymosan/IL-10 neutralisation module scores
in IL-10 stimulated MDMs versus all other cytokine-stimulated MDMs. * represents P<0.05,
Mann-Whitney test. (c) Comparison of IL-10 module scores versus zymosan + IL-10
neutralisation module scores in IL-10 stimulated MDMs (red symbols) and other cytokine-
stimulated MDMs (black). (d) Comparison of IL-10 module scores versus zymosan + IL-10
neutralisation module scores in the indicated innate immune stimulated MDMs. Dashed lines
represent linear regressions and descriptive statistics for correlation (r2) and covariance (slope)
are presented within the plots. All slopes presented were significantly non-zero (P<0.05). Fitting
and statistical analyses were performed using GraphPad Prism 6.0.

Chapter 5. Results
241
Figure 5.17: Assessing enrichment of IL-10 modules in innate immune-stimulated MDMs.
Matrices are presented showing module enrichment scores in the MDM transcriptomes used for
module derivation, as an assessment of module specificity. Modules are in rows and MDM
transcriptomes are in columns. Ctrl indicates unstimulated MDMs. All values presented are the
medians of module enrichment scores in at least three independent MDM datasets for each
condition. (a) Matrix of module expression presented as the geometric mean of the expression
values for the genes making up the module, normalised to the genome-wide geometric mean
expression for the same sample. Max on the colour scale is the maximum value for this dataset.
(b) Matrix of module expression presented as the geometric mean of the expression values for
the genes making up the module, normalised to the same measure of modular expression in the
control samples. Max on the colour scale is the maximum value for this dataset.

Chapter 5. Results
242
5.2.8 Development of innate immune stimulus-driven modules
Using the module development pipeline outlined in section 5.2.5, I developed
modules specific to the effects of a selection of innate immune stimuli, with the aim of
being able to assess specific stimulation of inflammatory pathways within in vivo gene
expression samples. These were derived from transcriptomic datasets generated in
previous investigations, in which MDMs were stimulated for 4 hours with different
innate immune stimuli or pathogens: LPS, a TLR4 ligand; PCSK, a TLR2 ligand; Mtb;
or S. pneumoniae (Spn) (Noursadeghi et al., 2009; Tomlinson et al., In press, 2014).
The derivation pipeline for these modules is shown in Table 5.7.
Cross-over between the two-fold-change and four-fold-change induced gene
lists for these stimuli was assessed by Venn diagram and was found to be
considerable (Figure 5.18). Specificity assessments demonstrated that these modules
were most highly expressed in their matched MDM datasets (Figure 5.19). However,
some lack of specificity was demonstrated: for example, expression of the PCSK
module was enriched in LPS-stimulated MDMs, and cross-enrichment of the PCSK
and Mtb modules was observed in their respective MDM datasets. It is probable that
these stimuli activate conserved innate signalling pathways, and so the differential
transcriptomes of innate stimuli may be fairly limited. Further improvements in
specificity may, therefore, be difficult to achieve. With regard to the cross-enrichment of
Mtb and PCSK modules, it should be noted that Mtb is known to stimulate TLR-2
(Means et al., 1999; Reiling et al., 2002), and this cross-enrichment may be expected.

Chapter 5. Results
243
Table 5.7: Development of innate immune stimulus-driven modules
– specific fourfold change modules.
Numbers in each column represent the number of genes selected by that stage of
filtering. The specificity filter represents the removal of any gene which features in
the 2FC gene list for more than one condition. 2FC, twofold change; 4FC, fourfold
change.
Figure 5.18: Venn diagrams of cross-over between innate immune stimulus-induced gene lists.
Venn diagrams depicting shared genes between the innate immune stimulus-induced
gene lists. Numbers represent the numbers of genes shared between/unique to gene
lists. (a) Two-fold change gene lists. (b) Four-fold change gene lists.
StimulusT-test, p<0.05
filter2FC filter 4FC filter Specificity filter
LPS 3341 556 121 39
PCSK 3158 628 108 12
Mtb 2645 292 103 19
Spn 3140 403 67 19

Chapter 5. Results
244
Figure 5.19: Assessing specificity of innate immune stimulus-driven modules – specific
fourfold change modules.
Matrices are presented showing module enrichment scores in the MDM transcriptomes used for
module derivation, as an assessment of module specificity. Modules are in rows and MDM
transcriptomes are in columns. Ctrl indicates unstimulated MDMs. All values presented are the
medians of module enrichment scores in at least three independent MDM datasets for each
condition. (a) Matrix of module expression presented as the geometric mean of the expression
values for the genes making up the module, normalised to the genome-wide geometric mean
expression for the same sample. Max on the colour scale is the maximum value for this dataset.
(b) Matrix of module expression presented as the geometric mean of the expression values for
the genes making up the module, normalised to the same measure of modular expression in the
control samples. Max on the colour scale is the maximum value for this dataset.

Chapter 5. Results
245
5.2.9 Assessing modular enrichment in in vivo gene expression datasets
As an initial test exercise to evaluate the ability of the modules developed in
sections 5.2.5–5.2.8 to detect immune biological activities in in vivo samples, I
analysed module enrichment scores in gene expression profiles from tuberculin skin
test (TST) biopsies obtained from healthy volunteers (Tomlinson et al., 2011). As
these gene expression profiles had already been investigated via bioinformatic and
comparative methods, this meant that the function of these modules could be tested in
a context where some a prior hypotheses existed. For example, enrichment for IFNγ or
type II IFN signalling was expected, as was differential modular enrichment between
positive and negative TST biopsies, or between biopsies collected at 6 hours and 48
hours post-TST.
I calculated module enrichment scores using the module geometric mean
expression normalised to the genome-wide geometric mean expression, as an
appropriate control dataset for normalisation was not available in this dataset. Each set
of modules developed proved to be quantitative and discriminatory in this dataset
(Figure 5.20). The IFNγ module was the most highly expressed in the 48 hour positive
TSTs in comparison to the other cytokine modules, but was not highly expressed in the
6 hour TST biopsies (Figure 5.20a), which is consistent with findings from
bioinformatic assessments of this data (Tomlinson et al., 2011). This was also
confirmed when using the specific IFN modules, wherein the type II IFN module was
more highly enriched in 48 hour TST biopsies than the type I IFN module (Figure
5.20b). The differential enrichment measured for the IFN modules also suggested that
they were able to discriminate between these two closely related immune responses.
The IL-10 modules were also enriched in the TST samples, consistent with recognized
IL-10 responses in anti-mycobacterial immune responses (Figure 5.20c; Redford et al.,
2011). Additionally, the two different IL-10 modules were enriched to a similar degree
in this dataset, supporting the hypothesis that the zymosan/IL-10 neutralisation module
is able to detect IL-10 activity in the context of inflammation, such as in the TST. Finally,
the highest enrichment for the innate immune stimulus modules was for the Mtb-
specific or PCSK (TLR-2)-specific modules, suggesting that specific anti-mycobacterial
innate responses could be measured in the TST using these modules.
Many published methods exist for quantifying modular enrichment in gene
expression datasets (Ackermann and Strimmer, 2009). These include simple methods
such as the one used here, in which a measure of central tendency of the expression

Chapter 5. Results
246
values of the module is used as a single measurement of module expression. More
complex methods are also used, such as the GSEA algorithm, which has been widely
used for previous modular analysis exercises (Mootha et al., 2003; Subramanian et al.,
2005). This method is designed to detect differences in module enrichment between
two groups of gene expression samples, as it involves ranking all genes in a dataset in
order of their difference between the compared two groups. I tested GSEA as an
alternative method of module enrichment scoring in the TST dataset, using the T cell
subset cytokine-driven modules (Figure 5.21). GSEA produces a normalised
enrichment score (NES) for each module, and a recommended statistic used to assess
the significance of the NES, which is the false detection rate (FDR) q-value.
The quantitative power of GSEA was assessed by comparison of the 48 hour
TST samples with the 6 hour TST samples (Figure 5.21a, b). This detected
enrichment of the IFNγ and TNFα modules in the positive TST samples (Figure 5.21a),
but assigned a marginally higher NES to the TNFα module than the IFNγ module,
although the geometric mean scoring method used shown the IFNγ module to be
expressed at a considerably higher (>two-fold) level (Figure 5.20a). The IL-4/IL-13 and
TGFβ/IL-10 modules were not scored as significantly enriched in this comparison
(Figure 5.21a), although the previous assessment had indicated some enrichment of
the latter in the same samples (Figure 5.20a). No modules were assessed as enriched
in the negative TST samples (Figure 5.21b), although again, some had been assessed
as enriched using the alternative method (Figure 5.20a). These observations
suggested that GSEA might be less sensitive and quantitative for assessment of
modular enrichment than using a geometric mean-derived module score.
The discriminatory power of GSEA was assessed by comparisons between the
48 hour positive TSTs and the 48 hour negative TSTs. Significant enrichment of the
TNFα module in the 48 hour positive TST in comparison to the 48 hour negative TST
was identified (Figure 5.21c), suggesting that this method might have some utility for
discriminating differential enrichment between groups of samples.

Chapter 5. Results
247
Figure 5.20: Testing module enrichment in in vivo gene expression datasets.
A test dataset of in vivo gene expression profiles, generated from TST biopsies obtained from
healthy volunteers, was used to evaluate module enrichment in in vivo samples. Module
enrichment scores were calculated as module expression normalised by a ratio to the
geometric mean expression for the entire genome. (a) Module enrichment score in the
indicated TST groups for T cell subset-derived cytokine modules. (b) Module enrichment score
in the indicated TST groups for specific IFN modules. (c) Module enrichment score in the
indicated TST groups for IL-10 modules. (d) Module enrichment score in the indicated TST
groups for innate immune stimulus modules. Symbols and error bars represent median −/+
range for at least 4 samples in each group.

Chapter 5. Results
248
Figure 5.21: Using gene set enrichment analysis to quantitate modular expression
and enrichment in in vivo gene expression samples.
Modular enrichment analysis between groups of TST biopsies performed using the gene set
enrichment analysis (GSEA) algorithm. The normalised enrichment scores (NES) are shown on
the X axes and measurement of statistical significance (FDR q-value) is shown on the Y axis.
The dashed line indicates the threshold of statistical significance recommended for use for this
algorithm. (a) Comparison of 48 hour positive biopsies with 6h positive biopsies. (b)
Comparison of 48 hour negative biopsies with 6h negative biopsies. (c, d) Comparison of 48
hour positive biopsies with 48h negative biopsies; three modules were assessed as enriched in
the positive group (c) and one module was assessed as enriched in the negative group (d).

Chapter 5. Results
249
5.3 Chapter discussion
5.3.1 Insights into macrophage plasticity from transcriptional profiling
Macrophage plasticity, which is thought to be primarily controlled at the
transcriptional level, is central to the function of these key sentinel cells of the immune
system. I aimed to use gene expression profiling of human MDMs to understand this
plasticity. I then aimed to utilise the multidimensional power of this data for evaluating
immune responses in vivo, by deriving gene expression modules from MDMs
stimulated with different factors of interest for use in assessing in vivo transcriptomic
datasets.
Human MDMs were shown to express cell-surface receptors for cytokines
associated with differentially polarised T cell responses (Figure 5.1a), for IFNγ, TNFα,
IL-4, IL-13, TGFβ and IL-10. Stimulation of MDMs with these cytokines induced
hundreds of gene expression changes (Figure 5.1b). This illustrated the potent role of
transcriptional reprogramming in cytokine-driven macrophage activation, and confirmed
that human macrophages can be functionally modulated by polarised T cell responses
beyond the Th1 and CMI paradigm, as previously suggested (Mosser and Edwards,
2008). One potential caveat of this approach is that using cytokines in combination (IL-
4 and IL-13, and TGFβ and IL-10) means that the unique effects of these cytokines
cannot be teased out; however, while not using an absolutely reductionist approach
means that some direct mechanistic insight may be lost, this method may better
simulate polarised inflammatory responses in vivo where multiple cytokines are likely to
be acting in tandem.
TFBS analysis of the cytokine-regulated gene lists revealed enrichment for sets
of transcription factors which may be downstream of signalling by these cytokines. This
included enrichment for some factors previously shown to be associated with these
stimuli, such as NFκB in TNFα up-regulated genes (Aggarwal, 2003; Figure 5.3a).
Strikingly, many of the canonical transcription factors which are activated by these
cytokines were not shown to be enriched in the up-regulated gene lists. For example,
STAT1 TFBS were not enriched in the IFNγ-induced genes (Platanias, 2005), STAT6
was not enriched in the IL-4-induced genes (Takeda et al., 1996) and SMADs were not
enriched in the TGFβ-induced genes (Derynck and Feng, 1997; Figure 5.2a, 5.4a,
5.5a). However, as these gene expression profiles represent the MDM transcriptome

Chapter 5. Results
250
after 24 hours after cytokine stimulation, it is possible that the primary transcriptional
responses mediated by these signature transcription factors were no longer evident.
Pathway enrichment analysis of cytokine-regulated gene lists provided insight
into the functional outcomes of cytokine signalling in macrophages. Some specific
effects of the cytokines were confirmed, such as IFN signalling pathway enrichment in
the IFNγ-stimulated MDMs (Figure 5.2b). Novel pathways downstream of these
cytokines were also identified. For example, TGFβ and IL-10 induced expression of
genes enriched for integrin pathways, vascular wall interactions, fibrin formation and
hypoxia-inducible factor 1α (HIF1α)-regulated gene expression. This included
expression of the potent angiogenic factor vascular endothelial growth factor A
(VEGFA; Nagy et al., 2007; Figure 5.5d). This might reflect the role of macrophages in
structural aspects of inflammatory resolution induced by these regulatory cytokines.
Further experiments are required to evaluate whether these in silico analyses are
associated with significant functional effects.
Common themes of macrophage transcriptional responses to cytokines were
identified in the bioinformatic assessment of these gene lists, such as chemokine
activity and integrin interactions (Figure 5.2–5.5). The multidimensional relationships
between the gene expression programmes were evaluated using the exploratory
statistical technique of PCA. This demonstrated that the data was highly multi-
dimensional, and that many patterns of variation in gene expression were shared
between the different stimulation conditions (Figure 5.6). This analysis alludes to the
multi-dimensional spectral nature of macrophage activation programmes, as described
in previous reports (Xue et al., 2014). Further analysis of the PCA results, focussing in
particular on the genes which are most associated with various PC deviations, may
assist in identifying novel functional hubs of macrophage activation.
5.3.2 Development of gene expression modules for analysis of microarray data
I aimed to utilize macrophage transcriptional heterogeneity for evaluation of
immune responses in vivo, by developing gene expression modules from MDM gene
expression datasets. The data-driven module generation method has provided
valuable insights in a number of previous studies (Berry et al., 2010; Li et al., 2014;
Obermoser et al., 2013; Xue et al., 2014), but as it is inherently reliant on the structure
of the input data, the range of modules generated may not include those relating to
pathways of interest if they are not variably expressed in the datasets used. This then

Chapter 5. Results
251
precludes assessment of those pathways in downstream analyses. As a major aim of
the exercise in constructing modules was the ability to assess pathways and
phenotypes of interest in a range of potential downstream contexts, I chose to use the
hypothesis-driven method of module generation, in which the function that the user
wishes to assess is defined a priori.
Module gene lists for this purpose can be derived from bioinformatic databases,
published data or publicly accessible array data repositories, but in this context I chose
to derive these modules using in-house-generated rather than independent datasets.
This was to maximise confidence that the baseline cellular phenotype in the datasets
was consistent, so that any differential effects seen were specifically due to the
stimulation conditions used rather than any extraneous contextual differences. This
does not preclude using published datasets to derive modules for comparative and
verification purposes, which may in fact add value to such an exercise and can be used
for validation. As this is a supervised method, there is a considerable degree of user
determination in setting parameters for extracting a gene list from a dataset, pertaining
to statistical or fold-change thresholds, correlation analyses and specificity filters.
Consensus for a method of deriving such a module has not yet emerged (Bild and
Febbo, 2005).
I first evaluated how module expression should be quantified in a dataset of
interest, and how enrichment of this expression should be measured for comparisons
to other datasets. Three measurements of central tendency of modular gene list
expression values were tested: mean, median and geometric mean. Each provided
broadly similar approximations of module expression (Figure 5.7a–c). Although
selection of one above the other may therefore be arbitrary, geometric mean was felt to
provide the most accurate measurement of central tendency in terms of the nature of
the data, so this was used for further assessments. Two strategies for quantifying
enrichment of expression were then tested: using either the geometric mean of the
genome-wide gene expression or the module expression in a control sample as a
denominator for producing an enrichment score (Figure 5.7d, e). Both methods
produced discriminatory measurements of enrichment. However, the latter strategy has
the advantage of allowing statistical testing of modular enrichment, i.e. in comparison
to control data. This illustrates the importance of identifying or obtaining appropriate
control datasets for such analyses, as it eliminates the inherent assumptions present in

Chapter 5. Results
252
the genome-wide normalisation method with regards to the baseline expression of a
module.
I then used the gene expression profiles of MDMs stimulated with different T
cell subset-derived cytokines to develop a pipeline for module generation. Firstly,
significant gene expression differences from unstimulated MDMs were identified by t-
tests with a Welch approximation. As an FDR algorithm was not used, it may be
suggested that high rate of false positive identification will occur. However, as the
subsequent steps in the pipeline involve applying fold-change filters to select for gene
expression changes which are within a biologically plausible range of interest, any false
positives (which are unlikely to exceed these thresholds if they are background noise)
should be eliminated.
Two-fold change and four-fold change filters were applied to these gene lists to
derive modules (Table 5.1, 5.2) which were then subjected to tests of specificity
(Figure 5.8, 5.9). Although these modules were highly sensitive in detecting the effects
of the stimulus of interest (suggesting that the t-test and fold-change approach used
was competent for identifying the effects of these stimuli), their specificity was poor, as
modular enrichment could be detected in some non-stimulus-specific contexts. The fact
that non-specificity becomes an issue is not surprising when the PCA of the source
data is considered (Figure 5.6), as the macrophage transcriptional responses to
cytokines clearly share many overlapping features.
I therefore applied an additional filter to improve specificity, in which any gene
up-regulated by more than two-fold by any of the other cytokines tested was eliminated
from the four-fold change gene lists (Table 5.3). This improved module specificity
(Figure 5.10), and so this pipeline was used to develop further modules for specific
IFN pathways and innate immune stimuli. Although this is an arguably rigorous strategy
to select the highly specific effects of a stimulus, to construct a stimulus-specific
module, it is possible that there may still be confounders present. For example, genes
which are just below the two-fold threshold of induction by one stimulus will not be
filtered out of other gene lists, and thus may contribute to some residual non-specificity.
However, as gene expression measurements are essentially continuous variables,
which vary in multiple contexts, developing completely stimulus-specific modules of
sufficient gene numbers for usage may not be possible. Overall, there is a trade-off to
be made between developing highly stimulus-specific modules, and developing
modules which are sensitive to detect activation of a pathway of interest. Aiming to be

Chapter 5. Results
253
entirely reductionist, and eliminating any gene from a module which is potentially
regulated by another stimulus, may prevent valuable insights being made into
inherently noisy biological systems in vivo. As long as modules are adequately tested
and validated, and used appropriately in conjunction with other analysis methods, then
low-level risk of non-specificity such as described above, may be acceptable.
Modules for detecting the function of IL-10 were derived using a less stringent
pipeline than the other cytokine modules, using a two-fold change threshold and no
specificity filter. The autonomous effects of IL-10 in up-regulating gene expression
appear to be subtle, perhaps reflecting its immunomodulatory rather than
immunostimulatory function. As such, IL-10 induced insufficient numbers of genes by
more than four-fold to use the initial strategy. To maximise confidence using this less
stringent approach, two IL-10 modules were developed from different gene expression
datasets in parallel, and their specificity to detect the activity of IL-10 was extensively
validated (Figure 5.14, Figure 5.16), which suggested that they would still have
reasonable utility in this regard.
5.3.3 Measuring enrichment of gene expression modules in gene expression
profiles from in vivo samples
Lastly, I validated whether the modules developed could detect enrichment of
the immune response pathways of interest in in vivo samples, using a previously
published dataset of TST biopsies (Tomlinson et al., 2011). This analysis suggested
that the modules were quantitative and discriminatory in detecting the effects of the
stimuli of interest in an in vivo setting. The enrichment results produced corroborated
published analyses of this data, and also provided evidence for activity of factors such
as IFNγ, TNFα, IL-10 and type I IFN at the site of inflammation in in vivo human anti-
mycobacterial immune responses.
These enrichment scores were based on measuring the geometric mean of
module expression. For comparative purposes, I tested the GSEA algorithm as a more
complex method of assessing modular enrichment. This produced different results to a
certain extent, which seemed to be less quantitative and sensitive for detecting module
expression than the geometric mean-based analyses (Figure 5.21). Some
discriminatory capacity was demonstrated in comparing highly expressed modules in
similar samples (Figure 5.21c). An inherent limitation of the GSEA algorithm is that it
does not produce a range of module enrichment scores for a group of tested samples,

Chapter 5. Results
254
but alternatively produces an average enrichment value for the entire group. This
means that the heterogeneity of a given dataset cannot be assessed (Chaussabel and
Baldwin, 2014). It also only allows comparative assessments of enrichment between
two samples, which may also limit its utility.
Overall, using the geometric mean of the module gene list to measure
expression and enrichment appeared to be a sufficiently sensitive, discriminatory and
quantitative strategy, and may be especially so when appropriate comparative control
data is available, wherein statistical testing can be performed (as discussed above in
section 5.3.2). GSEA may have some utility as an adjunctive strategy for comparing
expression of modules between highly similar groups of samples. Reviews of module
enrichment assessment strategies have suggested that the most appropriate analysis
method to use depends on the distribution of the dataset to be assessed (Alavi-Majd et
al., 2014), or that use of multiple methods to widely explore datasets and confirm
enrichment may be most appropriate (Glazko and Emmert-Streib, 2009). Thus, using
both geometric mean expression and GSEA may maximise confidence in the results of
modular analysis exercises.

Chapter 6. Results
255
Chapter 6. Results 4. Modulation of anti-
mycobacterial cell-mediated immunity by HIV-1 in
vivo assessed in a human challenge model
6.1 Background
6.1.1 Cell-mediated immunity, HIV-1 and tuberculosis
CMI is the process by which T cells and macrophages functionally collaborate
to kill and control intracellular pathogens (Kaufmann, 1999; Wing and Remington,
1977). HIV-1 impacts on many functions of the immune system, which is evident in the
depletion of the circulating CD4+ T cell pool, chronic immune activation and
compromise of the gut-associated lymphoid tissues (Levy, 2009), among other
phenomena (reviewed in Introduction section 1.3.6). CMI in particular may be at risk
of modulation by HIV-1, as the virus directly infects both CD4+ T cells (Spear et al.,
1990) and macrophages (Noursadeghi et al., 2006b).
Mtb, which also replicates within macrophages, is the prototypic example of a
pathogen that is thought to be controlled by CMI (Dannenberg, 1989), and the human
TB granuloma can be described as a mature focus of CMI, wherein macrophages and
T cells are spatially and functionally coordinated in order to exert this control (Ulrichs
and Kaufmann, 2006). The major functional axes of CMI, such as IFNγ, IL-12 and
STAT1 signalling, are known from human genetic studies to be essential for control of
mycobacterial infections (Altare et al., 1998a; Dorman and Holland, 1998; Dupuis et al.,
2001; Newport et al., 1996). Recent work in non-human primates has shown that
host/pathogen interactions in individual granulomata are critical in determining the
course of TB disease (Lin et al., 2014), indicating the importance of an effective
localised CMI response in Mtb containment.
The effects of HIV-1 on CMI may therefore have major consequences for
immune control of Mtb. In vivo, HIV-1 co-infection has profound effects on TB infection;
it is associated with substantial increases in the incidence and mortality of active TB
(Corbett et al., 2006), and with differences in disease presentation such as
disseminated infections (Schutz et al., 2010) and immune reconstitution inflammatory
syndromes (IRIS; Lawn et al., 2008). CD4+ T cell depletion by HIV-1 is assumed to
contribute to these changes in TB natural history (Geldmacher et al., 2012). However,

Chapter 6. Results
256
TB risk is increased in all HIV-1+ patients including those without substantial CD4+ T
cell loss (Gupta et al., 2012; Sonnenberg et al., 2005), and so other HIV-1-associated
immune dysfunction may also contribute. Investigating how HIV-1 modulates anti-
mycobacterial CMI in vivo may aid our understanding of TB pathogenesis in HIV-1/TB
co-infection.
6.1.2 Using the tuberculin skin test as an in vivo challenge model to study CMI
in HIV infection
I sought to describe the effects of HIV-1 on CMI responses to mycobacteria in
vivo. Previous studies of active TB in vivo have identified phenotypes in the peripheral
blood (Antonelli et al., 2010; Berry et al., 2010), which has provided insight into the
systemic immune response, but does not characterise the function of CMI at the site of
inflammation. Others have explored samples obtained from the site of disease
(Matthews et al., 2012; Mwandumba et al., 2008); this latter approach affords a
valuable opportunity to study CMI in situ, but might be prone to confounding by time of
sampling and disease heterogeneity. To study CMI at the site of inflammation in vivo
using a controlled approach, I employed the tuberculin skin test (TST) as a
standardised challenge model, which as a DTH reaction is a classic in vivo model of
anti-mycobacterial CMI (Scheynius et al., 1982).
The TST is performed via an intradermal injection of tuberculin, also known as
purified protein derivative (PPD), which is a sterilized precipitated filtrate of Mtb
cultures (Magnusson and Bentzon, 1958). This elicits a localised inflammatory reaction,
manifest as erythema and induration, over 24–48 hours in mycobacterial antigen-
sensitized individuals. HIV-1 infection is known to be associated with increased
incidence of TST anergy, i.e. clinical TST non-responsiveness as measured by
induration (Markowitz et al., 1993), including in individuals who are epidemiologically
highly likely to have been exposed to mycobacteria (Rangaka et al., 2007). TST anergy
has been shown to correlate with HIV-1 disease progression (Graham et al., 1992),
although some reports suggest that compromised skin DTH in HIV-1 infection may not
correlate with disease markers (Okulicz et al., 2012).
The TST has previously been used to investigate CMI in situ via histological
methods. This demonstrated a cellular infiltrate composed of CD4+ T cells, CD8+ T
cells and APCs (Poulter et al., 1982; Scheynius et al., 1982), showed the presence of
cytokines at the inflammatory site (Chu et al., 1992; Fullmer et al., 1987), and outlined

Chapter 6. Results
257
the contribution of different APC subsets to the reaction (Bond et al., 2012). The effects
of HIV-1 have also previously been investigated using TST histology, in studies
showing that DC recruitment to the TST is correlated to the magnitude of T cell
recruitment in HIV-1+ individuals (Liang et al., 2013), and that the make-up of cellular
infiltrates in TSTs in these individuals may be altered compared to HIV-1 negative
(HIV-1−) individuals (Sarrazin et al., 2009).
I aimed to use the TST as a challenge model to understand the effects of HIV-1
on anti-mycobacterial CMI in vivo with molecular resolution, by genome-wide
transcriptional profiling of RNA collected from TST biopsies. This approach was
previously validated in healthy individuals, in which TST transcriptional profiling was
used to distinguish molecular signatures of polarised T cell and innate immune
responses in the positive TST. Furthermore, this method was used to demonstrate
immune responses in TST negative (TST−) individuals, which were present but
quantitatively less than in TST positive (TST+) individuals – demonstrating that the
transcriptomic approach added value, and may be more sensitive than clinical and
histological assessments (Tomlinson et al., 2011). It also demonstrated that CMI
responses in this setting showed no major systematic confounding by ethnicity
(Tomlinson et al., 2011). I have now used TST gene expression profiling to
characterise anti-mycobacterial CMI at the site of inflammation in patients with active
TB and HIV-1 co-infection, and have identified diverse ways in which HIV-1
dysregulates this immune response in vivo.

Chapter 6. Results
258
6.2 Study outline
Patients with active TB, with or without HIV-1 co-infection, were recruited from
clinical sites in London (UK) and Cape Town (South Africa) within the first month of TB
chemotherapy. This patient cohort and time point was chosen in order to minimise
inter-subject variability in mycobacterial exposure, as patients without active TB may
have latent or undiagnosed TB, particularly in a high transmission setting in Cape
Town, and distinguishing these groups clinically may not be possible. HIV-1 status was
confirmed by routine clinical testing. Microbiological TB diagnosis was confirmed by
smear, culture or GeneXpert MTB/RIF in >90% of enrolled patients, with the remainder
of TB diagnoses being made on a clinical basis (see Appendix II for case by case
clinical details). The study design and sample collection protocol is outlined in Figure
6.1(a), and inclusion and exclusion criteria are shown in Table 6.1.
TSTs were performed by intradermal injection of 2U PPD into the proximal third
of the volar aspect of the forearm. A subset of patients received saline injections as a
control cohort. TSTs were assessed at 48 hours and two 3mm punch skin biopsies
were collected from the marked injection site (Figure 6.1b). The biopsies were
collected into either RNAlater reagent for RNA isolation, or 4% neutral buffered
formalin for adjunctive histological analysis. A positive TST was defined clinically as an
induration of ≥10mm at 48 hours, which is indicated to be an appropriate cut-off for this
cohort (Cobelens et al., 2006). All TSTs, TST assessments and biopsies were
performed by experienced TB clinical research staff. Blood samples for clinical
measurements, PBMC, RNA and DNA were also collected from all individuals before
TSTs were performed, as outlined in Figure 6.1(a). A time-point of 48 hours was
chosen for assessments, as in the previous proof-of-concept study, both innate and
adaptive components of the immune response were evident at this time-point in both
TST+ and TST– individuals, and differences between groups were also evident. Thus,
using this time-point should allow assessment of the overall CMI response in the
different groups of interest.
The study was approved by the research ethics committees of all sites and
institutions involved, and informed written consent was obtained from all participants.

Chapter 6. Results
259
Inclusion criteria Exclusion criteria
Active TB confirmed by microbiological
and/or clinical diagnosisNeoplastic disease
Within the first 4 weeks of anti-TB therapyAIDS defining disease other than tuberculosis or
KSHV infection
> 16 years of age Hepatitis B/C co-infection
Immunomodulatory therapy (e.g. interferon)
Immunization within preceding 2 weeks
Existing paradoxical reaction to anti-tuberculosis
treatment
Previous keloid formation
Table 6.1: Inclusion and exclusion criteria.
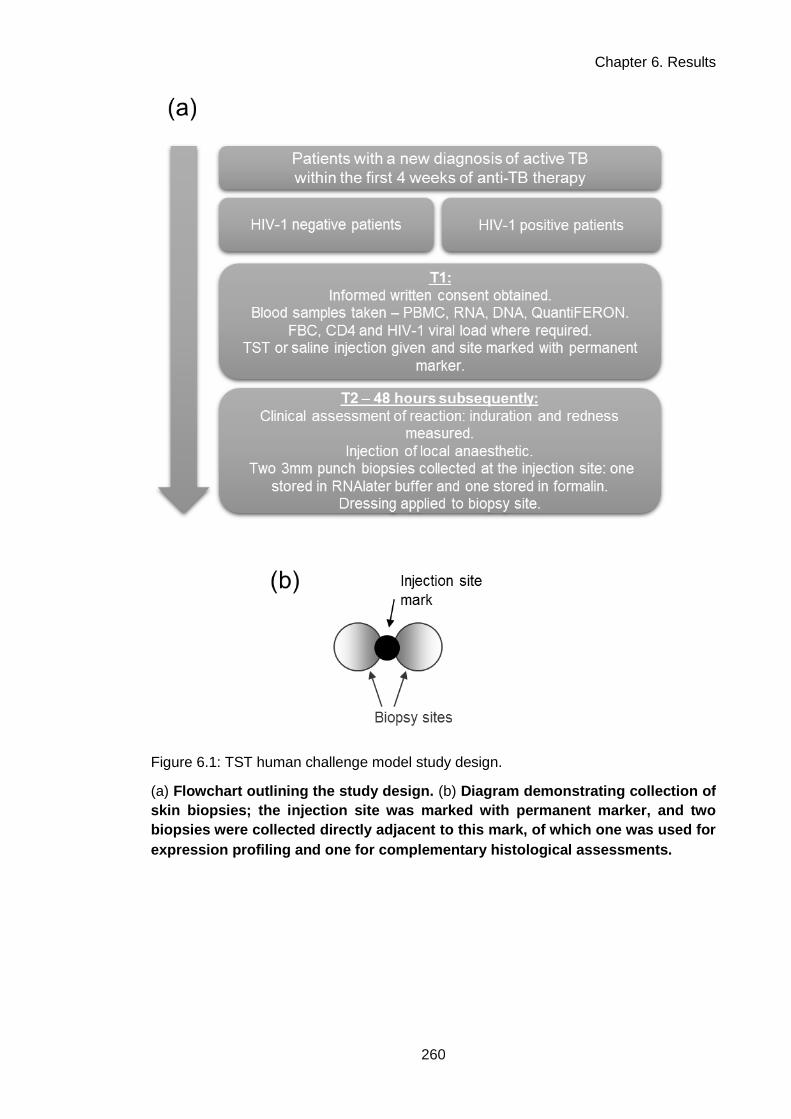
Chapter 6. Results
260
Figure 6.1: TST human challenge model study design.
(a) Flowchart outlining the study design. (b) Diagram demonstrating collection of
skin biopsies; the injection site was marked with permanent marker, and two
biopsies were collected directly adjacent to this mark, of which one was used for
expression profiling and one for complementary histological assessments.

Chapter 6. Results
261
6.3 Cohort description
Characteristics of the recruited cohort are shown in Table 6.2. Fifty patients
with active TB were recruited. Forty-two received TSTs and eight received control
saline injections (see Appendix II for case-by-case demographic and clinical
information table).
HIV-1− patients were recruited from Cape Town and London. The Cape Town
cohort were predominantly black African and had pulmonary TB, while the London
cohort were a mix of ethnicities and had extra-pulmonary disease. This may reflect the
distinct epidemiological settings of the two groups: a high transmission setting with
predominantly primary infection in Cape Town (Verver et al., 2004), and a low
transmission setting with predominantly reactivation of latent disease in London
(Kruijshaar and Abubakar, 2009). The Cape Town cohort included two patients with
MDR TB. All HIV-1− patients were TST+, and median induration did not differ between
London and Cape Town cohorts (Table 6.2). The London and Cape Town HIV-1−
cohorts were combined as a single group for all subsequent analyses.
All HIV-1+ patients were recruited in Cape Town. In comparison to the
equivalent HIV-1− Cape Town cohort, this group of patients included more females and
had a higher incidence of extra-pulmonary disease, as might be expected for a HIV-1+
South African cohort (Abdool Karim et al., 2009; Schutz et al., 2010). Consistent with
previous reports, HIV-1 infection was associated with a higher incidence of clinically
anergic TSTs (Table 6.2; Markowitz et al., 1993; Rangaka et al., 2007). HIV-1+ patients
were divided into three groups for subsequent analyses: those who were TST−
(anergic), TST+, or classified as undergoing an unmasking IRIS, which was defined in
this instance as presentation with active TB within 2–8 weeks of commencing ARVs,
consistent with published case definitions of this condition (Haddow et al., 2009;
Meintjes et al., 2008a). All patients in the IRIS group were TST+. Of note, these
patients had some of the greatest induration reactions of all HIV-1+ TST+ patients.
The TST− HIV-1+ group of patients had a lower median CD4+ count than TST+
HIV-1+ patients (28 vs. 214; Table 6.2). More TST+ patients were on ARVs than TST−
patients (55.56% vs. 35.71%; Table 6.2), and median length of ARV use was also
higher (123 weeks vs. 0.7 weeks; Table 6.2). I specifically evaluated the correlation

Chapter 6. Results
262
between HIV-1 disease markers and TST induration. Within the HIV-1+ cohort,
induration was significantly but weakly positively correlated with CD4+ count (Figure
6.2a), although the CD4+ count ranges in TST+ and TST− patients overlapped (Table
6.2), suggesting that there is not a direct linear relationship between these variables.
HIV-1 viral loads, where available, did not correlate with TST induration (Figure 6.2b).
These findings are consistent with previous reports, in demonstrating that HIV-1
seropositivity is associated with a high incidence of TST anergy, and that although this
does correlate with CD4+ count, anergy is still observed among patients with CD4+
counts ≥200 CD4+ cells mm-3, and positive TSTs are observed among patients with
CD4+ counts ≤200 CD4+ cells mm-3 (Markowitz et al., 1993; Selwyn et al., 1992).
The group of patients who received saline control injections was made up of
three HIV-1− patients and five HIV-1+ patients. The characteristics of this group were
comparable to the groups which received TSTs (Table 6.2).
To assess TB antigen reactivity directly in T cells, IFNγ release assays (IGRAs)
were used, in which peripheral blood mononuclear cells are mixed with TB-specific
antigens and IFNγ release is measured. The QuantiFERON-TB Gold In-Tube test was
used in this instance. This test uses the Mtb antigens ESAT-6, CFP-10 and TB7.7,
which are mixed with whole blood ex vivo. IFNγ release is measured after 24 hours by
ELISA, and compared to baseline IFNγ levels, and release induced by a positive
control mitogen, to determine whether the test is positive, negative or indeterminate.
QuantiFERON tests were performed on all patients recruited from sites in Cape Town.
HIV-1+ individuals had a high incidence of negative or indeterminate QuantiFERON
results, despite being Mtb antigen-exposed as a result of having active TB (Figure
6.2c). Positive tests were more frequent in groups with higher CD4+ counts when
patients were stratified as such (Figure 6.2d) as previously reported (Leidl et al.,
2010).
TST and IGRA responses were compared by correlating induration with TB antigen-
elicited IFNγ release, and weak positive correlations were observed for both HIV-1−
and HIV-1+ groups (Figure 6.2e). Some TST+ individuals had negative or indeterminate
QuantiFERON results, and vice versa, particularly in the HIV-1+ group; this discordance
is consistent with previous reports (Luetkemeyer et al., 2007; Rangaka et al., 2007).
In addition to the five groups of patients recruited in this cohort, subsequent
analyses also made comparisons with gene expression profiles from TSTs obtained

Chapter 6. Results
263
from healthy individuals in a previous study (Tomlinson et al., 2011). The definitions of
all groups which were analysed are presented in Table 6.3.
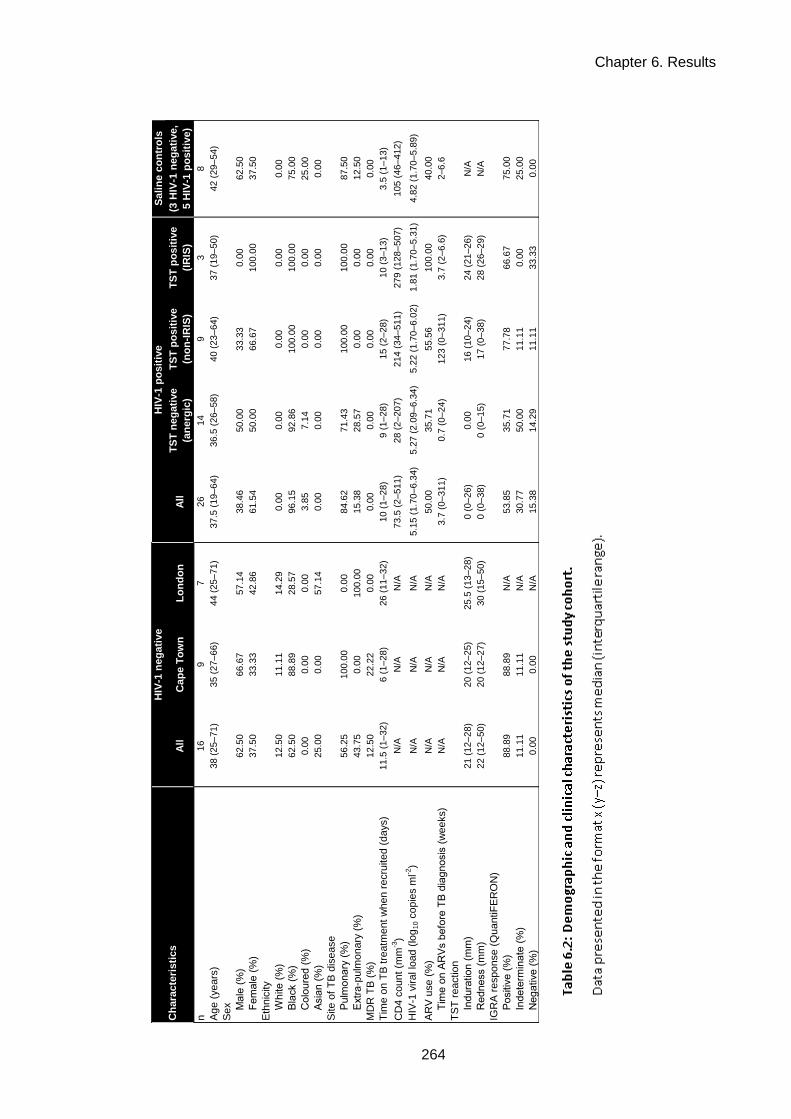
Chapter 6. Results
264
Table 6.2: Demographic and clinical characteristics of the study cohort.
Sali
ne c
on
tro
ls
All
Cap
e T
ow
nL
on
do
nA
llT
ST
neg
ati
ve
(an
erg
ic)
TS
T p
osit
ive
(no
n-I
RIS
)
TS
T p
osit
ive
(IR
IS)
(3 H
IV-1
neg
ati
ve,
5 H
IV-1
po
sit
ive)
n16
97
26
14
93
8
Ag
e (
years
)38 (
25–71
)35 (
27–66)
44 (
25–71)
37.5
(19–64)
36.5
(26–58)
40 (
23–
64)
37 (
19–50)
42 (
29–54)
Sex
M
ale
(%
)62.5
066.6
757.1
438.4
650.0
033.3
30.0
062.5
0
F
em
ale
(%
)37.5
033.3
342.8
661.5
450.0
066.6
7100.0
037.5
0
Eth
nic
ity
W
hite (
%)
12.5
011.1
114.2
90.0
00.0
00.0
00.0
00.0
0
B
lack (
%)
62.5
088.8
928.5
796.1
592.8
6100.0
0100.0
075.0
0
C
olo
ure
d (
%)
0.0
00.0
00.0
03.8
57.1
40.0
00.0
025.0
0
A
sia
n (
%)
25.0
00.0
057.1
40.0
00.0
00.0
00.0
00.0
0
Site o
f T
B d
isease
P
ulm
onary
(%
)56.2
5100.0
00.0
084.6
271.4
3100.0
0100.0
087.5
0
E
xtr
a-p
ulm
onary
(%
)43.7
50.0
0100.0
015.3
828.5
70.0
00.0
012.5
0
MD
R T
B (
%)
12.5
022.2
20.0
00.0
00.0
00.0
00.0
00.0
0
Tim
e o
n T
B t
reatm
ent
when r
ecru
ited (
days)
11.5
(1–32
)6 (
1–28)
26 (
11–32)
10 (
1–28)
9 (
1–28)
15 (
2–
28)
10 (
3–13)
3.5
(1–13)
CD
4 c
ount
(mm
-3)
N/A
N/A
N/A
73.5
(2–511)
28 (
2–207)
214 (
34–
511)
279 (
128–507)
105 (
46–412)
HIV
-1 v
iral lo
ad (
log
10 c
opie
s m
l-2)
N/A
N/A
N/A
5.1
5 (
1.7
0–6.3
4)
5.2
7 (
2.0
9–6.3
4)
5.2
2 (
1.7
0–6.0
2)
1.8
1 (
1.7
0–5.3
1)
4.8
2 (
1.7
0–5.8
9)
AR
V u
se (
%)
N/A
N/A
N/A
50.0
035.7
155.5
6100.0
040.0
0
T
ime o
n A
RV
s b
efo
re T
B d
iag
nosis
(w
eeks)
N/A
N/A
N/A
3.7
(0–311)
0.7
(0–24)
123 (
0–
311)
3.7
(2–6.6
)2–6
.6
TS
T r
eaction
In
dura
tion (
mm
)21 (
12–28
)20 (
12–25)
25.5
(13–28)
0 (
0–26)
0.0
016 (
10–
24)
24 (
21–26)
N/A
R
edness (
mm
)22 (
12–50
)20 (
12–27)
30 (
15–50)
0 (
0–38)
0 (
0–15)
17 (
0–
38)
28 (
26–29)
N/A
IGR
A r
esponse (
QuantiF
ER
ON
)
P
ositiv
e (
%)
88.8
988.8
9N
/A53.8
535.7
177.7
866.6
775.0
0
In
dete
rmin
ate
(%
)11.1
111.1
1N
/A30.7
750.0
011.1
10.0
025.0
0
N
eg
ative (
%)
0.0
00.0
0N
/A15.3
814.2
911.1
133.3
30.0
0
HIV
-1 n
eg
ati
ve
HIV
-1 p
osit
ive
Ch
ara
cte
risti
cs

Chapter 6. Results
265
(a) Correlation of TST induration with CD4+ cell counts for HIV-1+ individuals. Linear regression
showed a weak but significant positive correlation. (b) Correlation of TST induration with viral
loads (where available) for HIV-1+ individuals. Linear regression was was non-significant. (c)
QuantiFERON (IGRA) test responses. (d) QuantiFERON test positivity (% of indicated group) in
HIV-1+ patients stratified by CD4+ cell count. (e) Correlation of induration with IFNγ release
elicited by TB antigens in QuantiFERON tests, in HIV-1− and HIV-1+ patients. Weak but
significant positive correlations were observed for both groups. The dashed horizontal line
indicates the level required for a positive result; subjects below this line had negative or
indeterminate results. IU, international units. Red/blue lines indicate medians or linear
regressions for all plots.
Figure 6.2: TST responses and IGRAs.

Chapter 6. Results
266
Group n TB disease status HIV-1 statusTST
responseNotes Source
A 16 Active TB Negative Positive This study
B 14 Active TB Positive Anergic
Termed TST anergic as opposed to
TST negative, as patients have
confirmed active TB so should
have Mtb antigen memory, but do
not react.
This study
C 9 Active TB Positive Positive This study
D 3 Active TB Positive Positive
Unmasking IRIS patients;
presentation with active TB within
2–8 weeks of commencing ARV
therapy.
This study
E 5
Healthy (latent TB, or
previous exposure to
mycobacteria)
Negative PositiveTomlinson
et al. (2011)
F 5 Healthy (uninfected) Negative Negative
Termed TST negative, as no TST
response in healthy individuals with
no clear risk factor for anergy
suggests no Mtb exposure.
Tomlinson
et al. (2011)
G (Saline) 8 Active TBNegative (3) /
Positive (5)N/A This study
Table 6.3: Study group definitions for subsequent analyses.

Chapter 6. Results
267
6.4 Histological assessments
Histological assessments of inflammation were made using biopsies from this
recruited cohort (groups A, B, C, D, G, Table 6.3). Hematoxylin and eosin (H&E)
stained sections were scored by a histopathologist blinded to concomitant clinical
information and TST/saline status. Inflammation was scored from 0 (no inflammation)
to 3. Figure 6.3(a) shows the relationship between histological inflammation score and
clinical induration in each group, which demonstrates that although histological
inflammation was detected in some clinically negative TSTs or saline control samples,
there was mainly concordance between TST positivity and higher histological
inflammation scores. No difference in median histological inflammation score was
found between positive TSTs from HIV-1− patients or HIV-1+ patients.
Where present, the cellular composition of the inflammatory infiltrate in the TST
biopsies was assessed. This was largely composed of lymphocytes and histiocytes
(APCs), which were reported to make up the majority of the cellular influx in all cases,
consistent with previous studies (Poulter et al., 1982; Scheynius et al., 1982). The
median ratio of lymphocytes to histiocytes was higher in positive TSTs from HIV-1−
patients in comparison to HIV-1+ patients, although this difference was not statistically
significant (Figure 6.3b; Mann-Whitney test, P=0.1049). The distribution of the
inflammatory infiltrate was also assessed, and found to have a predominantly
perivascular distribution in all groups, which is again consistent with previous reports
assessing TST reactions at this time-point (Figure 6.3c; Gibbs et al., 1984).
Representative images of H&E stains from each group for each inflammatory score
(where applicable) are shown in Figure 6.4.

Chapter 6. Results
268
Biopsies were formalin fixed, paraffin embedded, sectioned and stained with H&E to
delineate the inflammatory infilitrate. All quantitative assessments were performed by
an assessor blinded to clinical information. (a) Inflammatory infilitrate grading on a 0
(no inflammation) to 3 scale. Each symbol represents an individual TST. (b)
Composition of cellular infilitrate, where present, as assessed by a
lymphocyte:histiocyte ratio. Each symbol represents an individual TST. Red lines
indicates medians per group. (c) Distribution of cellular infilitrate, where present, as
assessed by a perivascular:other distribution ratio. Each symbol represents an
individual TST. Red lines indicates medians per group.
Figure 6.3: Histological assessment of TST and saline biopsies.

Chapter 6. Results
269
Figure 6.4: Representative H&E stains of TST and saline biopsies.
Representative images from each group for each inflammatory score (indicated by the
left-hand column of numbers). Paraffin embedding of biopsies was performed by Groote
Schuur Hospital (Cape Town) Department of Pathology. Sectioning and H&E staining
were performed by the University College London Hospital (UCLH) histopathology
department. With thanks, histopathology assessments and scoring were performed by
Dr Alan Ramsay, UCLH Department of Pathology.

Chapter 6. Results
270
6.5 Gene expression profiling of TSTs
6.5.1 Saline injection gene expression profiles
Biopsies were collected from the site of saline control injections performed on
eight active TB patients, in order to establish a baseline from which induction of gene
expression in TSTs could be investigated (group G, Table 6.3). Three patients were
HIV-1− and five were HIV-1+. Before gene expression profiles from these biopsies were
used as a pooled group, the characteristics of the samples in the HIV-1− and HIV-1+
groups were compared, to assess whether any systematic differences existed that
could confound their use as a common baseline.
No difference between the groups was found upon histological inflammation
scoring of biopsies (Figure 6.5a). Hierarchical clustering of gene expression profiles
also did not discriminate HIV-1− and HIV-1+ samples (Figure 6.5b). Specific
assessment of significant differences between the groups in genome-wide gene
expression identified only 11 genes for which median expression differed by two-fold
between the HIV-1− and HIV-1+ saline groups, all of which were expressed more highly
in HIV-1− samples (Figure 6.5c).
PCA was used to explore the multidimensional relationships of variance within
the entire dataset. The two highest PCs showed clustering of saline biopsies, with
again no distinction observed between HIV-1− and HIV-1+ saline biopsies (Figure 6.6).
The clustering analyses and the minimal level of between-group differences in
gene expression indicated that there was no systematic difference between the groups
of saline biopsies. They were subsequently used as a common baseline for all gene
expression analyses.
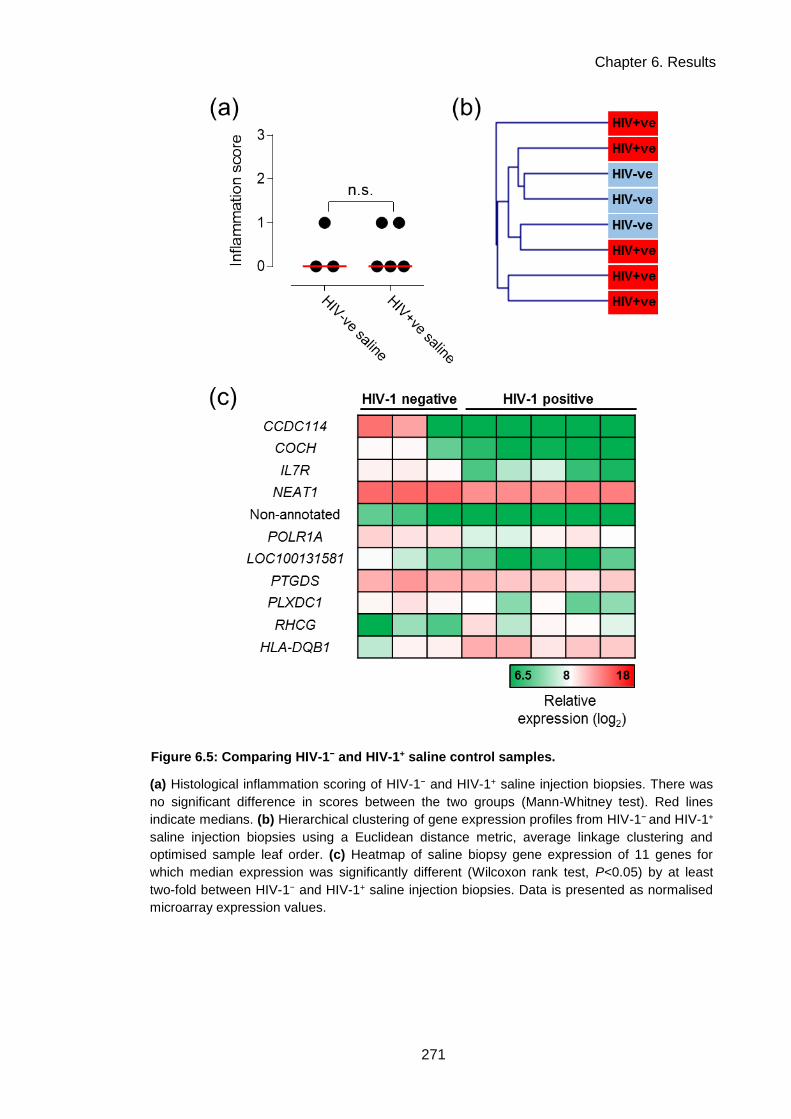
Chapter 6. Results
271
Figure 6.5: Comparing HIV-1− and HIV-1+ saline control samples.
(a) Histological inflammation scoring of HIV-1− and HIV-1+ saline injection biopsies. There was
no significant difference in scores between the two groups (Mann-Whitney test). Red lines
indicate medians. (b) Hierarchical clustering of gene expression profiles from HIV-1− and HIV-1+
saline injection biopsies using a Euclidean distance metric, average linkage clustering and
optimised sample leaf order. (c) Heatmap of saline biopsy gene expression of 11 genes for
which median expression was significantly different (Wilcoxon rank test, P<0.05) by at least
two-fold between HIV-1− and HIV-1+ saline injection biopsies. Data is presented as normalised
microarray expression values.

Chapter 6. Results
272
-1 5 0 -1 0 0 -5 0 0 5 0 1 0 0
-1 5 0
-1 0 0
-5 0
0
5 0
1 0 0
H IV -T S T + H IV - S a lin e
H IV + T S T -
H IV + T S T +
P C 1 s c o re
PC
2 s
co
re
H IV + S a lin e
Figure 6.6: Principal component analysis of TST and saline biopsy gene
expression profiles.
Principal component analysis was performed on genome-wide expression profiles from
TST or saline biopsies from the indicated groups. Principal component (PC) scores for
the two highest PCs, PC1 and PC2, are shown. Each symbol represents a distinct
biopsy gene expression profile.

Chapter 6. Results
273
6.5.2 The TST in HIV-1− patients with active TB induces innate & adaptive-
associated gene expression with evidence for cell recruitment and
immunoregulatory processes
The TST transcriptional response in active TB was characterised by comparing
gene expression profiles of TST biopsies from HIV-1− active TB patients to saline
controls (groups A and G in Table 6.3). Statistically significantly increased expression
of 1725 genes was found in the TST (Figure 6.7a). Transcription factor binding site
(TFBS) enrichment analysis of this gene list using oPOSSUM-3 (Kwon et al., 2012;
http://opossum.cisreg.ca) indicated that these genes were regulated by multiple
immune response signalling pathways (Figure 6.7b). These included innate immune
NFκB and IRF2 signalling, adaptive immune STAT1 signalling and regulatory cytokine
signalling via STAT3.
The functional characteristics of the TST gene expression profile were explored
by InnateDB pathway enrichment analysis (Breuer et al., 2013;
http://www.innatedb.com; Figure 6.7c). This showed enrichment for innate pathways
such as phagocytosis and type I IFN signalling, and adaptive pathways such as type II
IFN signalling and T cell receptor (TCR) signalling. Pathways involved in the interface
between innate and adaptive immunity were also enriched, such as antigen
presentation and immunoregulatory interactions, as were pathways involved in cellular
recruitment to inflammatory foci, such as chemokine activity and integrin activation.
These bioinformatic analyses were complemented by assessing the TST using
independently derived gene expression modules (see Chapter 5 & Appendix I for
further description) constructed to detect specific cell types (Figure 6.8a; with thanks to
Dr Gabriele Pollara; see Appendix I for description), or specific cytokine- or innate
stimulus-induced functional signatures (generated in Chapter 5; Figure 6.8b and 6.6c
respectively). Statistically significant enrichment in comparison to the saline control
baseline was observed for all cell types, but B cell, macrophage and DC-specific
modules were only very modestly enriched above salines (Figure 6.8a). The modest
increase observed in enrichment in the macrophage-specific module, despite evidence
of many histiocytes on histology, may be because these histiocytes are infilitrating
monocytes which have not yet completely differentiated into MDMs; the monocyte-
specific signature enrichment corroborates this hypothesis.

Chapter 6. Results
274
The IFNγ, TNFα, IL-4/IL-13 and TGFβ/IL-10 modules generated in Chapter 5
from stimulated MDMs can be compared quantitatively, as the gene sets for each had
similar overall module expression values in MDMS stimulated with the relevant
cytokines; suggesting that no module is biased towards more highly-expressed genes
(see pg. 228). The most highly significantly enriched cytokine module was specific for
IFNγ activity, followed by TNFα – cytokines known to be critical in CMI and anti-
mycobacterial responses. Significant but lesser enrichment was observed for activity of
the Th2 cytokines IL-4 and IL-13, and the regulatory cytokines TGFβ and IL-10 (Figure
6.8b). Innate stimulus modules specific to PCSK (a TLR-2 ligand) or Mtb were
significantly enriched in TSTs, while those specific to another pathogen, Spn or LPS (a
TLR-4 ligand), were not enriched above saline controls (Figure 6.8c) - suggesting that
the inflammation generated in the TST exhibits specificity for Mtb-induced innate
inflammatory respnses.
These analyses demonstrated that molecular assessment of the TST in active
TB, via bioinformatic and modular characterisation of gene expression profiles, can
provide qualitative and quantitative insights into multiple components of the CMI
response in site of inflammation samples from patients with active TB.

Chapter 6. Results
275
Figure 6.7: TST gene expression profiling in HIV-1− patients with active TB.
(a) Frequency distribution of genes for which median expression was significantly increased
(Wilcoxon rank test, P<0.05) by at least two-fold in HIV-1− TSTs compared to saline controls.
(b) oPOSSUM transcription factor binding site (TFBS) enrichment analysis of 5000bp
upstream/downstream of the 1725 genes presented in (a). The X axis lists the number of genes
enriched for a TFBS, and the Y axis displays significance by Z score. (c) Network visualisation
of InnateDB (Reactome) pathway enrichment analysis of the 1725 genes. The 12 enriched
pathways with the highest numbers of genes identified are shown, all of which were significantly
enriched in this gene set (corrected P<0.05). Red nodes, pathways; blue nodes, genes; node
size is correlated to number of network connections.

Chapter 6. Results
276
Modular analysis of TST gene expression profiles from HIV-1− TST+ (active TB) samples.
Module score represents the geometric mean expression of the module gene set in each TST
gene expression profile, normalised to the saline control baseline, which is the median of the
geometric mean module expression in all saline samples. Symbols represent group median
module score and error bars represent interquartile range. The statistical significance of
modular enrichment above the saline baseline was assessed using a Mann-Whitney test for
differences in module expression between all TSTs and all salines (P<0.05). (a) All modules
were significantly enriched above salines. (b) All modules were significantly enriched above
salines. (c) PCSK and Mtb modules were significantly enriched above salines.
Figure 6.8: Modular analysis of the TST in HIV-1− patients with active TB.

Chapter 6. Results
277
6.5.3 The molecular detail of the TST response is not systematically altered by
active TB disease
Active TB infection is associated with significant changes to the peripheral
blood transcriptome (Berry et al., 2010). To assess if active TB also altered or
confounded the TST response, I compared TST+ gene expression profiles from HIV-1−
patients with active TB to TST+ gene expression profiles from healthy individuals
generated in an earlier study (Tomlinson et al., 2011; groups A and E in Table 6.3).
Previous analysis of the healthy individual TST+ gene expression profiles showed
similar global functional enrichment results to the active TB profiles (Figure 6.7), such
as T cell activation, chemokine activity and innate immune pathways (Tomlinson et al.,
2011).
Comparison of genes which were increased in expression in either TST+ group
showed a substantial degree of overlap (Figure 6.9a). Directly comparing the
expression of all these genes showed a significant positive covariance and correlation
between active TB patients and healthy individuals (Figure 6.9b). I identified
statistically significant differences in gene expression of more than two-fold between
the groups (Figure 6.9b). 356 genes were increased in healthy individuals in
comparison to active TB patients, and 156 genes were increased in active TB patients
in comparison to healthy individuals (in total, <25% of the integrated gene set). The 25
most highly increased genes in active TB patients are shown in Figure 6.9c, and
include immune response factors such as the antimicrobial peptides DEFB4A and PI3,
and the matrix metalloproteinase MMP1. Pathway enrichment analysis of the gene list
increased in active TB showed enrichment for Src signalling, integrin activation,
vascular wall interactions and complement pathway activation (Figure 6.9c). Fewer
pathways were enriched in the gene list increased in healthy individuals, and reflected
mRNA processing and splicing (data not shown).
Modular enrichment analysis of the gene expression profiles showed similar
enrichment in the two groups for all modules tested (Figure 6.10a, b, c), except for the
T cell-specific module, which was statistically significantly more highly enriched in
healthy individual TST+ profiles (Figure 6.10a).
Overall, these gene expression analyses suggested that substantial
components of the TST response in active TB are shared with the TST response in

Chapter 6. Results
278
healthy individuals, and so employing the TST as a challenge model in active TB
patients is not likely to be systematically confounded by attendant active disease. In
fact, as active disease is associated with some functionally enriched alterations in gene
expression, this may add value to an exercise in investigating inflammation in active TB
specifically.

Chapter 6. Results
279
Figure 6.9: Comparing active TB and healthy individual TST+ gene expression profiles.
(a) Venn diagram of the overlap between genes significantly induced in active TB TST+ vs.
healthy individual TST+ samples (both in comparison to saline controls). (b) XY plot comparing
median expression of all genes induced in either active TB or healthy TST+ samples. Linear
regression showed a significant positive correlation and covariance between the two groups.
Highlighted genes are significantly (P<0.05, Wilcoxon rank test) expressed ≥two-fold in one
group compared to the other. Data are normalised microarray expression values. (c) Matrix
showing the top 25 genes with significantly increased expression in active TB patient TSTs
compared to healthy individuals. Data are normalised microarray expression values. (d)
Network visualisation of InnateDB (Reactome) pathway enrichment analysis of genes
upregulated in active TB TST+ profiles compared to healthy individuals. All significantly
(corrected P<0.05) enriched pathways are shown. Red nodes, pathways; blue nodes, genes;
node size is correlated to number of network connections.

Chapter 6. Results
280
Figure 6.10: Modular analysis of TST+ gene expression profiles from HIV− active TB
patients and healthy individuals.
Modular analysis of TST gene expression profiles from HIV-1− TST+ (active TB) and HIV-1−
TST+ (healthy individual) samples. Module score represents the geometric mean expression of
the module gene set in each TST gene expression profile, normalised to the saline control
baseline, which is the median of the geometric mean module expression in all saline samples.
Symbols represent group median module score and error bars represent interquartile range.
The statistical significance of modular enrichment above the saline baseline was assessed
using a Mann-Whitney test for differences in module expression between all TSTs and all
salines (P<0.05). Mann-Whitney tests were also used to test for significant differences in
module score between groups (* indicates P<0.05 between indicated groups). (a) All cell type
modules were significantly enriched above salines. The T cell module score was significantly
increased in healthy individuals. (b) All cytokine modules were significantly enriched above
salines. (c) PCSK and Mtb modules were significantly enriched above salines.

Chapter 6. Results
281
6.5.4 Relative preservation of type I IFN responses in anergic TSTs from HIV-1+
active TB patients
In HIV-1+ patients with anergic TST responses, biopsies collected from the
marked TST injection site at 48 hours were assessed for differences in gene
expression in comparison to saline controls (groups B and G in Table 6.3). Expression
of 98 genes was statistically significantly increased in these samples despite the
absence of a clinical reaction (Figure 6.11a), almost all of which were also increased in
expression in the HIV-1− TST+ samples (Figure 6.11b). Directly comparing the
expression of all genes induced in either group showed a significant positive
correlation, but with a substantially reduced covariance (Figure 6.11c), demonstrating
significantly attenuated enrichment of TST-associated gene expression in in HIV-1
anergy. This detectable but attenuated anergic TST response was further evident when
comparing induction of gene expression in each group above saline (Figure 6.11d).
Importantly, this analysis suggests that the detectable response is not purely made up
of genes which are the most highly expressed in TST+ samples, but are instead
distributed across the spectrum of gene expression levels.
Pathway enrichment analysis of the HIV-1+ anergic response gene list
demonstrated enrichment for both type I and type II IFN signalling, with the most
significant enrichment detected for the former (Figure 6.12a). Directly comparing how
many genes from the Reactome biological pathway database
(http://www.reactome.org/) IFN pathway gene lists were expressed in each group
showed a change in bias from type II IFNs towards type I IFNs in HIV-1+ anergic
samples (Figure 6.12b). TFBS enrichment analysis of the anergic response gene list
also reflected the relative dominance of innate type I IFN activity in these samples, with
highly significant enrichment detected for IRF2 and NFκB TFBS (Figure 6.12c).
To further characterise IFN activity in these samples, and in particular to
distinguish type I and type II signatures which have substantial functional overlap,
modular enrichment analysis was performed using modules specific to type I and type
II IFNs developed in Chapter 5, section 5.2.6 (Figure 6.13a). Both modules were
statistically significantly enriched above saline in all TSTs. Type II IFN activity was
significantly more highly enriched in comparison to type I IFN in all TST+ samples,
regardless of HIV-1 status. In the HIV-1+ anergic TSTs, both modules were less highly
Chapter 6. Results
282
enriched than in TST+ samples. However, a differential pattern of enrichment was
observed: type I and type II IFN activity were enriched to a similar degree, indicating
relative preservation of the type I IFN response in these samples. The resulting
alteration in balance between the two IFN pathways was evident when the type I and
type II module scores were expressed as a ratio. Significantly increased type I IFN/type
II IFN ratios were observed in HIV-1+ anergic TST biopsies, in comparison to either
HIV-1– or HIV-1+ TST+ samples (Figure 6.13b).
Assessment of the panel of cell type, cytokine and innate stimulus-specific
modules in HIV-1+ anergic TSTs showed that enrichment of all modules was either
absent or substantially attenuated in comparison to HIV-1– TST+ biopsies (Figure
6.13c, d, e). Detectable responses above the saline baseline included IFNγ cytokine
activity (Figure 6.13d), consistent with some type II IFN activity identified in the specific
IFN analysis. TLR-2 specific responses induced by PCSK were also detectable (Figure
6.13e).
These results indicated that immune responses were evident at the site of
mycobacterial challenge in clinically anergic TSTs from HIV-1+ active TB patients, and
that these were characterised by a relatively preserved type I IFN response.

Chapter 6. Results
283
Figure 6.11: Gene expression profiling of anergic TSTs from HIV-1+ active TB
patients.
(a) Frequency distribution of 98 genes for which median expression was significantly
increased by at least two-fold in HIV-1+ anergic TSTs compared to saline controls. (b)
Venn diagram demonstrating the overlap between genes significantly induced in active
TB HIV-1− TST+ vs. HIV-1+ anergic samples (both in comparison to saline controls). (c)
XY plot comparing median expression of all genes induced in either HIV-1− TST+ or
HIV-1+ anergic samples. Linear regression showed a significant positive correlation
between the two groups, but with a slope of substantially <1, suggesting reduced
expression in HIV-1+ anergic samples. Data presented are normalised microarray
expression values. (d) XY plot comparing median fold-change induction compared to
saline controls of all genes induced in either HIV-1− TST+ or HIV-1+ anergic samples.
The 98 significantly induced genes in the latter are highlighted in red.

Chapter 6. Results
284
Figure 6.12: Bioinformatic analyses of the HIV-1+ anergic TST response shows
enrichment for IFN signalling pathways.
(a) Network visualisation of InnateDB (Reactome) pathway enrichment analysis of the 98
induced genes. The 12 enriched pathways with the highest numbers of genes identified are
shown, all of which were significantly enriched in this gene set (corrected P<0.05). Red nodes,
pathways; blue nodes, genes; node size and labelling are correlated to the number of network
connections. (b) Comparison of numbers of genes from Reactome IFN pathways expressed in
HIV-1- TST+ and HIV-1+ anergic samples. (c) oPOSSUM TFBS enrichment analysis of 5000bp
upstream/downstream of the induced 98 genes. The X axis lists the number of genes enriched
for a TFBS, and the Y axis displays significance by Z score.

Chapter 6. Results
285
Figure 6.13: Modular analysis of the HIV-1+ anergic TST response demonstrates relative
preservation of the type I IFN response.
Modular analysis of TST gene expression profiles from HIV-1− TST+ and HIV-1+ TST− samples.
Module score represents the geometric mean expression of the module gene set in each TST
gene expression profile, normalised to the saline control baseline, which is the median of the
geometric mean module expression in all saline samples. Symbols represent group median
module score and error bars represent interquartile range. The statistical significance of
modular enrichment above the saline baseline was assessed using a Mann-Whitney test for
differences in module expression between all TSTs and all salines (P<0.05). Mann-Whitney
tests were also used to test for significant differences in module score between groups (*
indicates P<0.05 between indicated groups). (a) Modular analysis of gene expression profiles
using modules specific to type I and type II IFNs. All modules were significantly enriched above
salines in all groups, but significant differences between type I and type II IFN expression were
only observed for positive TSTs. (b) Ratio of type I IFN to type II IFN module scores. (c) All cell
type modules were significantly enriched above salines in TST+ samples, but none were
significantly enriched in anergic TSTs. (d) All cytokine modules were significantly enriched
above salines in TST+ samples, but only the IFNγ module was significantly enriched in anergic
TSTs. (e) PCSK and Mtb modules were significantly enriched above salines in TST+ samples,
but only the PCSK module was significantly enriched in anergic TSTs.

Chapter 6. Results
286
6.5.5 HIV-1+ TST anergy is molecularly distinct from healthy individual TST
negativity
A previous investigation showed that healthy individual TST− biopsies contained
detectable immune responses, which were qualitatively similar but quantitatively less
than those in TST+ samples (Tomlinson et al., 2011). I evaluated the differences
between HIV-1+ anergic TSTs and TST− samples from healthy volunteers. This showed
that the HIV-1+ anergic TST response was manifestly limited in comparison to healthy
individual TST− samples (Figure 6.14a, b). This analysis also highlighted that a subset
of the HIV-1+ anergic response was less highly expressed in the HIV-1− TST− biopsies.
Twenty-eight genes which were increased in the HIV-1+ anergic group were not
statistically significantly increased in expression in HIV-1− TST− samples in comparison
to saline controls (Figure 6.14a, b, c). This list included multiple IFN response genes
(Figure 6.14d).
These TSTs were also assessed via modular analysis. Statistically significant
enrichment of most cytokine and cell type modules, as well as LPS and PCSK innate
stimulus modules, was found in the HIV-1− TST− samples in comparison to salines
(Figure 6.15a, b, c). As described above (Figure 6.13), only IFNγ and PCSK modules
were significantly enriched in anergic TSTs, and the expression of these modules was
much lower than in HIV-1− TST− samples (Figure 6.15a, b, c). This indicates that
substantial cellular infiltration, cytokine activity and innate inflammation occur at the site
of a negative TST in a healthy individual, but that these processes are absent in the
context of HIV-1+ anergy.
These assessments show that HIV-1+ TST anergy in active TB patients is
molecularly distinct from TST negativity in a healthy individual. This indicates that
anergy is mechanistically different from TST negativity, and may involve a specific type
I IFN response not detected in healthy individuals, in the absence of any other evident
inflammation or cellular infiltration.
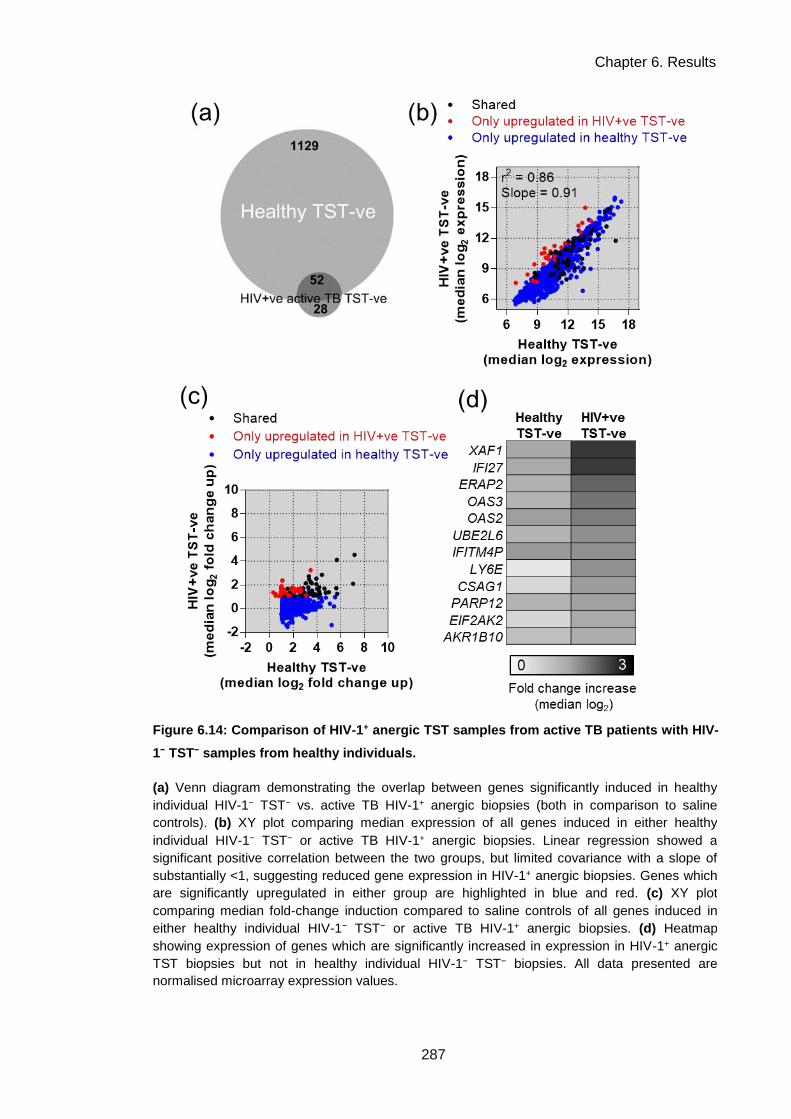
Chapter 6. Results
287
(a) Venn diagram demonstrating the overlap between genes significantly induced in healthy
individual HIV-1− TST− vs. active TB HIV-1+ anergic biopsies (both in comparison to saline
controls). (b) XY plot comparing median expression of all genes induced in either healthy
individual HIV-1− TST− or active TB HIV-1+ anergic biopsies. Linear regression showed a
significant positive correlation between the two groups, but limited covariance with a slope of
substantially <1, suggesting reduced gene expression in HIV-1+ anergic biopsies. Genes which
are significantly upregulated in either group are highlighted in blue and red. (c) XY plot
comparing median fold-change induction compared to saline controls of all genes induced in
either healthy individual HIV-1− TST− or active TB HIV-1+ anergic biopsies. (d) Heatmap
showing expression of genes which are significantly increased in expression in HIV-1+ anergic
TST biopsies but not in healthy individual HIV-1− TST− biopsies. All data presented are
normalised microarray expression values.
Figure 6.14: Comparison of HIV-1+ anergic TST samples from active TB patients with HIV-
1− TST− samples from healthy individuals.
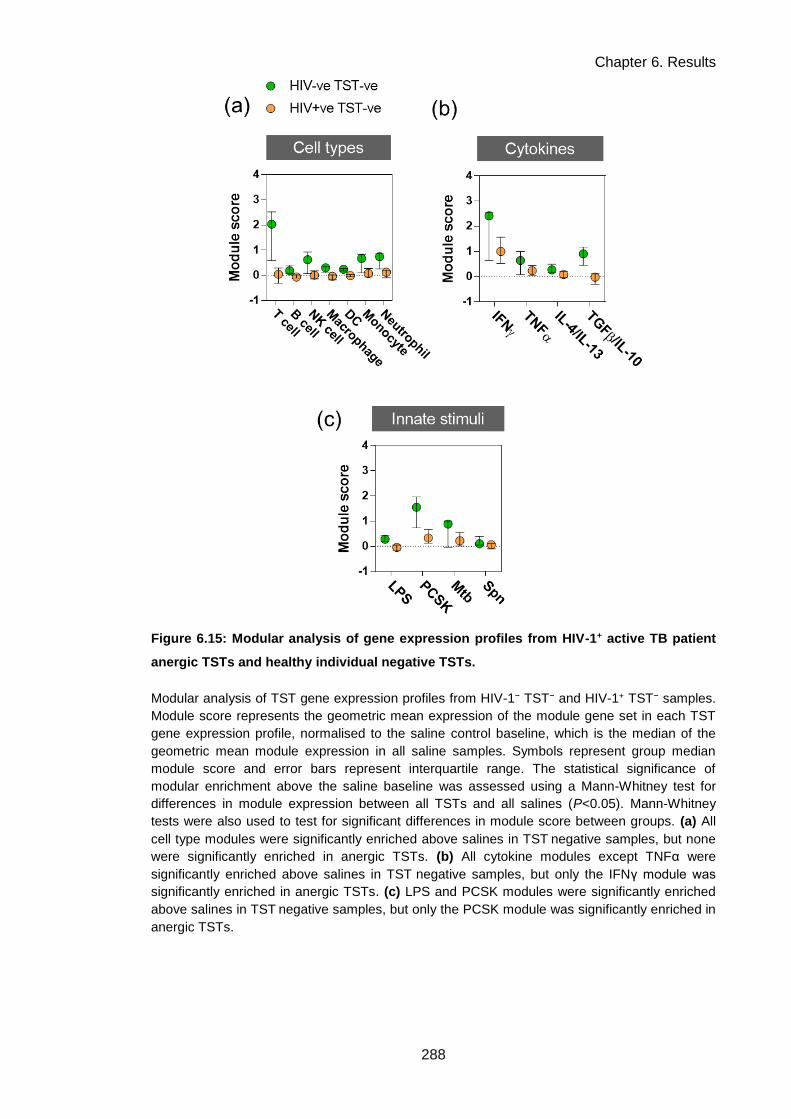
Chapter 6. Results
288
Figure 6.15: Modular analysis of gene expression profiles from HIV-1+ active TB patient
anergic TSTs and healthy individual negative TSTs.
Modular analysis of TST gene expression profiles from HIV-1− TST− and HIV-1+ TST− samples.
Module score represents the geometric mean expression of the module gene set in each TST
gene expression profile, normalised to the saline control baseline, which is the median of the
geometric mean module expression in all saline samples. Symbols represent group median
module score and error bars represent interquartile range. The statistical significance of
modular enrichment above the saline baseline was assessed using a Mann-Whitney test for
differences in module expression between all TSTs and all salines (P<0.05). Mann-Whitney
tests were also used to test for significant differences in module score between groups. (a) All
cell type modules were significantly enriched above salines in TST negative samples, but none
were significantly enriched in anergic TSTs. (b) All cytokine modules except TNFα were
significantly enriched above salines in TST negative samples, but only the IFNγ module was
significantly enriched in anergic TSTs. (c) LPS and PCSK modules were significantly enriched
above salines in TST negative samples, but only the PCSK module was significantly enriched in
anergic TSTs.
Chapter 6. Results
289
6.5.6 TST gene expression is broadly conserved in HIV-1+ TST+ individuals but
the immunoregulatory IL-10 response is specifically attenuated
I next investigated the TST+ response in HIV-1+ active TB patients (group C in
Table 6.3). Significant ≥two-fold increases in expression of 1291 genes were observed
above saline controls (Figure 6.16a), and this response was broadly concordant with
the response in HIV-1− patients (Figure 6.16b, c). Specific comparison with the HIV-1−
TST+ response identified 44 genes which were statistically significantly attenuated in
expression by ≥two-fold in HIV-1+ TSTs (Figure 6.16c). TFBS enrichment analysis was
used to assess the attenuated genes (Figure 6.16d). This showed enrichment for
several factors: innate TFs such as RelA; STAT1, which is downstream of IFNγ
signalling; and STAT3, which is downstream of signalling by the anti-inflammatory
cytokine IL-10 (L. Williams et al., 2004).
I used modular analysis, as in previous sections, to specifically investigate if the
activities of these pathways were altered in HIV-1+TST+ samples. Innate stimulus
(downstream of RelA) and IFNγ (downstream of STAT1) module enrichment were
preserved, as was enrichment of the module measuring activity of TGFβ and IL-10 in
combination (Figure 6.17b, c). No differences were found in module expression in
HIV-1+ samples using the overall panel of modules, except for significantly reduced
enrichment of the T cell-specific module (Figure 6.17a), as might be expected for a
group of patients with a diminished peripheral CD4+ T cell pool.
To measure the specific activity of IL-10, I used two IL-10-specific functional
modules described in Chapter 5 section 5.2.7. IL-10 modular enrichment was
significantly attenuated in HIV-1+ TSTs (Figure 6.18a). As the enrichment for all other
cytokine-induced modules tested was preserved, this suggested a specific deficit in IL-
10. An independently published IL-10 module was used to confirm this finding (Teles et
al., 2013). Enrichment for this module was much lower than that of my IL-10 modules
(Figure 6.18b), which may reflect that the published module was generated from IL-10-
stimulated PBMC rather than MDMs; the latter may be a more accurate model of a
tissue-resident cell IL-10 response. Nonetheless, attenuation of IL-10 modular
enrichment was also observed using this PBMC module (Figure 6.18b).
To further confirm this observation, a discrete assessment of modular
enrichment was made using the gene set enrichment analysis (GSEA) algorithm
(Subramanian et al., 2005). This algorithm is optimised for detecting differences in

Chapter 6. Results
290
module enrichment between two groups, as it involves ranking all genes in a dataset in
order of their difference between the two groups to be compared. In a GSEA
comparison of HIV-1− and HIV-1+ TST+ samples, significant relative enrichment of one
IL-10 functional module was demonstrated in the HIV-1− group (Figure 6.18c), further
confirming IL-10 functional deficiency at the site of inflammation in the HIV-1+ TST+
active TB patients.
As it has been shown that IL-10 responses to Mtb are attenuated in vitro in HIV-
1 infected macrophages (Tomlinson et al., 2014; Chapter 3), this identification of
functional deficiency of IL-10 activity in the HIV-1+ TST response may represent an in
vivo correlate of the in vitro observation. This suggests that an important
immunoregulatory component of CMI to mycobacteria is deficient at the site of
inflammation in HIV-1+ patients with active TB.

Chapter 6. Results
291
Figure 6.16: Gene expression profiling of positive TSTs from HIV-1+ active TB patients.
(a) Frequency distribution of 1291 genes for which median expression was significantly
increased by at least two-fold in HIV-1+ TST+ samples compared to saline controls. (b) Venn
diagram demonstrating the overlap between genes significantly induced in active TB HIV-1−
TST+ vs. HIV-1+ TST+ samples (both in comparison to saline controls). (c) XY plot comparing
median expression of all genes induced in either HIV-1− TST+ or HIV-1+ TST+ biopsies. Linear
regression showed a significant positive correlation between the two groups, with a slope of
approximately 1, demonstrating broad conservation of the TST+ response in HIV-1+ active TB
patients. Forty-four genes for which expression is significantly reduced by ≥ two-fold in HIV-1+
TSTs are highlighted. Data presented are normalised microarray expression values. (d)
oPOSSUM TFBS enrichment analysis of 10000bp upstream/downstream of the 44 attenuated
genes. The X axis lists the number of genes enriched for a TFBS, and the Y axis displays
significance by Z score.
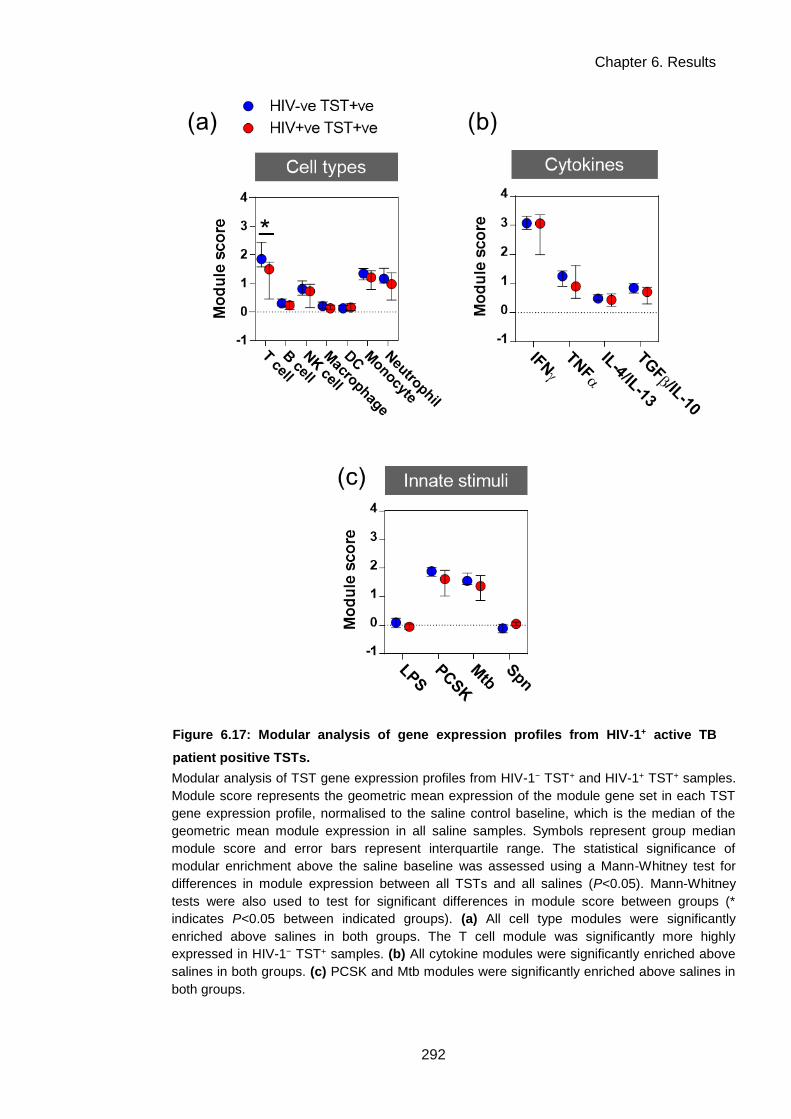
Chapter 6. Results
292
Figure 6.17: Modular analysis of gene expression profiles from HIV-1+ active TB
patient positive TSTs.
Modular analysis of TST gene expression profiles from HIV-1− TST+ and HIV-1+ TST+ samples.
Module score represents the geometric mean expression of the module gene set in each TST
gene expression profile, normalised to the saline control baseline, which is the median of the
geometric mean module expression in all saline samples. Symbols represent group median
module score and error bars represent interquartile range. The statistical significance of
modular enrichment above the saline baseline was assessed using a Mann-Whitney test for
differences in module expression between all TSTs and all salines (P<0.05). Mann-Whitney
tests were also used to test for significant differences in module score between groups (*
indicates P<0.05 between indicated groups). (a) All cell type modules were significantly
enriched above salines in both groups. The T cell module was significantly more highly
expressed in HIV-1− TST+ samples. (b) All cytokine modules were significantly enriched above
salines in both groups. (c) PCSK and Mtb modules were significantly enriched above salines in
both groups.

Chapter 6. Results
293
Figure 6.18: Attenuation of the IL-10 response in positive TSTs from HIV-1+ active TB
patients.
Modular analysis of TST gene expression profiles from HIV-1− TST+ and HIV-1+ TST+ samples.
(a, b) Module score represents the geometric mean expression of the module gene set in each
TST gene expression profile, normalised to the saline control baseline, which is the median of
the geometric mean module expression in all saline samples. Symbols represent group median
module score and error bars represent interquartile range. The statistical significance of
modular enrichment above the saline baseline was assessed using a Mann-Whitney test for
differences in module expression between all TSTs and all salines (P<0.05). Mann-Whitney
tests were also used to test for significant differences in module score between groups (*
indicates P<0.05 between indicated groups). (a) Expression of two IL-10 functional modules
was significantly attenuated in HIV-1+ TST+ samples: an IL-10 inducible module (IL-10), a
module made up of genes suppressed when IL-10 is neutralised in the context of zymosan-
induced inflammation (zymosan/IL-10n). (b) Expression of an independently published IL-10
inducible module (Teles et al., 2013) was also attenuated in HIV-1+ TST+ samples. (c) Modular
enrichment analysis of HIV-1− TST+ biopsies compared to HIV-1+ TST+ samples performed
using the GSEA algorithm. The dashed line indicates the threshold of statistical significance
recommended for use for this algorithm. Although a number of modules were scored as
enriched in HIV-1− TST+ samples compared to HIV-1+ TST+ samples, only the zymosan/IL-10 n
module was significantly enriched, and consequently assessed to be relatively attenuated in the
HIV-1+ TSTs.

Chapter 6. Results
294
6.5.7 HIV-1+ unmasking IRIS patients display accentuated Th2 responses in the
TST
Within the HIV-1+ active TB patient cohort, three patients were classified as
undergoing an unmasking IRIS (group D in Table 6.3). Unmasking IRIS was defined as
presentation with active TB within 2−8 weeks of commencing ARVs, consistent with
published definitions (Haddow et al., 2009; Meintjes et al., 2008a). The
immunopathology of unmasking IRIS remains incompletely understood (Lai et al.,
2013), and so I used the TST samples collected from these patients as an opportunity
to gain insights into anti-mycobacterial responses at the site of inflammation in IRIS.
All patients in this group had clinically positive TSTs (Table 6.2), and high
histological inflammation scores (Figure 6.3a, Figure 6.4). IRIS TSTs showed
statistically significant increases in expression of 2780 genes compared to saline
controls (Figure 6.19a), representing an expanded response in comparison to HIV-1−
TST+ samples (Figure 6.19b). A direct comparison of all genes increased in IRIS or in
HIV-1− TST+ samples demonstrated that the responses were broadly concordant with
significant correlation and covariance, but that 52 genes were statistically significantly
increased ≥two-fold in expression in the IRIS group (Figure 6.19c). This gene list
contained factors involved in driving Th2 immune responses, such as IL-13, IRF4,
CCL26, CCL17 and CCL1 (Corren, 2013; Y. Gao et al., 2013; Gonzalo et al., 2007;
Imai et al., 1999; Provost et al., 2013), and pathway enrichment analysis of this gene
list showed overrepresentation for Th2 pathways such as IL-4 signalling and asthma
(Figure 6.19d).
Upregulation of the Th2 response in IRIS patient TSTs was confirmed by
modular analysis, which showed significantly increased enrichment for activity of the
Th2 cytokines IL-4 and IL-13 in comparison to HIV-1− TST+ samples (Figure 6.20a). All
other cytokine-driven modules were similarly enriched between the groups, suggesting
that Th1 responses driven by IFNγ or T-regulatory responses driven by TGFβ and IL-
10 were not accentuated in the IRIS TSTs (Figure 6.20b). Additionally, T cell modular
activity was not significantly enriched in IRIS TSTs above HIV-1− TST+ samples
(Figure 6.20c). Together, these observations suggest that the increase in Th2 activity
in IRIS TSTs is not due to an overall broader T cell response than non-IRIS TSTs, but
that a specific bias exists within a T cell response of similar magnitude. Activity of all
Chapter 6. Results
295
other modules tested was similar, with the exception of a significant but modest
increase in DC module enrichment (Figure 6.20a, c); this could potentially also be
involved in Th2 biasing, as a specific role for DCs in initiating this arm of immunity has
recently been reported (Y. Gao et al., 2013). The Th2 bias in IRIS TSTs compared to
HIV-1− TST+ samples was further confirmed in a separate modular assessment using
the GSEA algorithm. This showed significant enrichment of the IL-4/IL-13 module in the
IRIS samples (Figure 6.20d).
Th2-type inflammation was also evident in histological assessments of these
samples. Upon H&E staining, infiltration of eosinophils, which are implicated in Th2
responses (Rothenberg and Hogan, 2006), was identified in all biopsy samples in the
IRIS group, while it was only observed in 11% and 22% of the HIV-1−TST+ and HIV-
1+TST+ groups respectively. Representative images of eosinophils present in IRIS
biopsy sample H&E stains are shown in Figure 6.21.
Both gene expression and histological assessments at the site of inflammation
in IRIS patients demonstrated a Th2 bias in the context of an otherwise typical TST+
response. This may provide insight into the nature of the immunopathology which
exacerbates TB disease in these patients.

Chapter 6. Results
296
Figure 6.19: Gene expression profiling of positive TSTs from unmasking TB-IRIS
patients.
(a) Frequency distribution of 2780 genes for which median expression was significantly
increased by at least two-fold in HIV-1+ TST+ IRIS patient biopsies compared to saline controls.
(b) Venn diagram demonstrating the overlap between genes significantly induced in active TB
HIV-1− TST+ vs. HIV-1+ TST+ IRIS biopsies (both in comparison to saline controls). (c) XY plot
comparing median expression of all genes induced in either HIV-1− TST+ or HIV-1+ TST+ IRIS
biopsies. Linear regression showed a significant positive correlation between the two groups.
Fifty-two genes for which expression is significantly increased by ≥ two-fold in IRIS biopsies are
highlighted. Data presented are normalised microarray expression values. (d) Network
visualisation of InnateDB (all curated databases) pathway enrichment analysis of the 52 genes
for which expression was increased. All significantly enriched pathways in this gene set are
shown (corrected P<0.05). Red nodes, pathways; blue nodes, genes; node size is correlated to
number of network connections.

Chapter 6. Results
297
Figure 6.20: Modular analysis of gene expression profiles from unmasking TB-IRIS
patients identifies increased Th2 responses.
Modular analysis of TST gene expression profiles from HIV-1− TST+ and HIV-1+ TST+ (IRIS)
samples. Module score represents the geometric mean expression of the module gene set in
each TST gene expression profile, normalised to the saline control baseline, which is the
median of the geometric mean module expression in all saline samples. Symbols represent
group median module score and error bars represent interquartile range. The statistical
significance of modular enrichment above the saline baseline was assessed using a Mann-
Whitney test for differences in module expression between all TSTs and all salines (P<0.05).
Mann-Whitney tests were also used to test for significant differences in module score between
groups (* indicates P<0.05 between indicated groups). (a) All cell type modules were
significantly enriched above salines in both groups. The DC module was significantly more
highly expressed in HIV-1+ TST+ (IRIS) samples. (b) All cytokine modules were significantly
enriched above salines in both groups. The IL-4/IL-13 module was significantly more highly
expressed in HIV-1+ TST+ (IRIS) samples (c) PCSK and Mtb modules were significantly
enriched above salines in both groups. (d) Modular enrichment analysis of HIV-1+ TST+ (IRIS)
samples compared to HIV-1− TST+ samples performed using the GSEA algorithm. The dashed
line indicates the threshold of statistical significance recommended for use for this algorithm.
Although a number of modules were scored as enriched in HIV-1+ TST+ (IRIS) samples
compared to HIV-1− TST+ samples, only the IL-4/IL-13 module was assessed as significantly
enriched.

Chapter 6. Results
298
Figure 6.21: Eosinophilic infiltration in TST biopsies from IRIS patients.
Representative images of eosinophils from IRIS patient TST biopsy H&E stains. Each image is
from a separate patient biopsy. Eosinophils, multinucleated cells staining highly positively for
eosin (pink/purple), are indicated by white arrows.

Chapter 6. Results
299
6.5.8 Evidence for HIV-1 viral activity at the site of TST inflammation
Gene expression profiles of HIV-1+ active TB patient TSTs showed that HIV-1
was associated with multiple pathways of dysregulation compared to HIV-1− TST
responses. I was interested to determine whether HIV-1 was detectable at the TST
site, as if so this might indicate that these phenotypes were a direct result of viral
activity in the inflammatory milieu. This might include intracellular viral reservoirs in
patients on ARVs, as the phenotypes described were not exclusive to patients with
uncontrolled viral loads (VLs).
qRT-PCR for the HIV-1 LTR, a highly conserved viral sequence, was performed
on TST RNA samples. This was detectable in a subset of TSTs (Figure 6.22a), which
may either represent virus present in the TST tissue, or virus derived from blood
contamination of the biopsy. In the latter scenario, it might be expected that HIV-1 LTR
transcript would correlate with blood VL. A significant but weak positive correlation was
found between the two measures (Figure 6.22b), although some patients with elevated
VLs had undetectable TST virus, and one patient with a suppressed VL had a low level
of TST viral transcript detectable. It is difficult to draw any conclusions from this data,
as the weak correlation between TST LTR and VL is indicative that the LTR detectable
may be derived from contaminating blood; further assessments are merited which
would be less confounded by this issue, such as histological staining for HIV-1
proteins.

Chapter 6. Results
300
Figure 6.22: Investigating the presence of HIV-1 at the TST site.
qRT-PCR for the HIV-1 LTR demonstrates detectable HIV-1 transcript, expressed as
HIV-1 LTR cycle threshold (ct) in which a lower value indicates higher levels of
transcript, in a subset of biopsies, which showed a significant but weak positive
correlation with peripheral blood HIV-1 viral load.
3 4 5 6 7
2 8
3 0
3 2
3 4
3 6
Un
dete
cta
ble
r2
= 0 .2 1
V ira l lo a d
( lo g 1 0 c o p ie s m l-1 )
HIV
-1 L
TR
C
t

Chapter 6. Results
301
6.5.9 Molecular profiles of HIV-1 CMI dysregulation which are evident in the TST
are not evident in the peripheral blood
Gene expression profiling of the immune response to TB in vivo has previously
evaluated the peripheral blood, and insights into systemic immune activity have been
gained via this method (Berry et al., 2010; Bloom et al., 2013, 2012; Cliff et al., 2013;
Maertzdorf et al., 2012; Ottenhoff et al., 2012). I sought to assess whether the HIV-1-
dysregulated phenotypes found in the TST were also evident in the peripheral blood.
Cytokine-specific module expression was measured in peripheral blood gene
expression profiles from samples which were collected contemporaneously with TST
injection in the same patient cohort. Although all modules tested were statistically
significantly enriched in TST+ biopsy samples compared to saline controls, only a
subset of modules were more highly expressed in active TB patient peripheral blood
compared to healthy volunteer blood: IFNγ and type II IFN modules, and the IL-10
module (Figure 6.23a−c). This is hypothesised to reflect systemic immune activity
resulting from active TB.
Some modules were differentially expressed in HIV-1+ active TB peripheral blood
compared to HIV-1− patients. There was evidence for increased IFN signalling in HIV-1
infection, as the IFNγ, type I IFN and type II IFN modules were all significantly
increased in expression in HIV-1+ peripheral blood in comparison to HIV-1− patients
(Figure 6.23a, b). HIV-1+ patients with anergic TSTs also had significant increased
expression of the TNFα module, and significantly decreased expression of the
TGFβ/IL-10 module (Figure 6.23a). These observations may be due to systemic
immune activation in HIV-1+ patients. Importantly, none of the phenotypes associated
with HIV-1 infection in the TST were observed in the peripheral blood. Although type I
IFN activity was increased in HIV-1+ patients, this was not specific to those with anergy
(Figure 6.23b). Attenuation of IL-10 was not evident (Figure 6.23c). No IL-4/IL-13
(Th2) module expression was observed in any samples, including the IRIS patients
((Figure 6.23a). This suggests that these phenotypes are specific to the site of
inflammation and are not evident in systemic immune activity as measured in the
peripheral blood transcriptome.

Chapter 6. Results
302
Figure 6.23: Modular analysis of peripheral blood transcriptional profiles from HIV-1− and
HIV-1+ active TB patients and healthy volunteers.
Modular analysis of peripheral blood gene expression profiles. Module score represents the
geometric mean expression of the module gene set in each TST gene expression profile,
normalised to the geometric mean expression of the entire genome. Symbols represent group
median module score and error bars represent interquartile range. Mann-Whitney tests were
also used to test for significant differences in module score between groups (* indicates P<0.05
between indicated groups). (a) The IFNγ module was significantly increased in expression in
active TB patients compared to healthy volunteers, and significantly increased in expression in
HIV-1+ patients compared to HIV-1− patients. The TNFα module was significantly increased in
HIV-1+ patients with anergic TSTs compared to HIV-1− patients and healthy volunteers. The
TGFβ/IL-10 module was significantly decreased in HIV-1+ patients with anergic TSTs compared
to HIV-1− patients and healthy volunteers. (b) The type I IFN module was significantly increased
in expression in HIV-1+ patients compared to HIV-1− patients and healthy volunteers. The type II
IFN module was significantly increased in expression in active TB patients compared to healthy
volunteers, and significantly increased in expression in HIV-1+ patients compared to HIV-1−
patients. (c) The IL-10 module was significantly increased in expression in active TB patients
compared to healthy volunteers.
HIV+ve TST-ve

Chapter 6. Results
303
6.6 Chapter discussion
I have employed genome-wide transcriptional profiling of TST biopsy samples to
gain insights into the function of CMI at the molecular level in vivo, and the pathways
by which HIV-1 modulates this response. The TST+ response was broadly consistent in
active TB and in healthy individuals, but with some specific pathways upregulated
which may represent active disease processes. Clinically negative TSTs were found to
contain detectable responses, which were phenotypically divergent: healthy individual
TST negativity displayed many features of the TST+ response, while HIV-1+ anergy
showed a manifestly limited response with relative preservation of the type I IFN
response. Positive TSTs from HIV-1+ active TB patients had broad conservation of the
TST response but with specific attenuation of activity of the anti-inflammatory cytokine
IL-10. Finally, a Th2 response bias was identified in TSTs from HIV-1+ unmasking IRIS
patients.
Clinical TST responses in this cohort were broadly as expected. The frequency
and disease correlates of anergic responses in HIV-1+ individuals were consistent with
previous reports in similar cohorts (Rangaka et al., 2007). Poor concordance was
found between IGRA results and TST responses, which was again consistent with
previous studies (Luetkemeyer et al., 2007; Rangaka et al., 2007). This observation
highlights the potential value of studying anti-mycobacterial responses in a tissue
setting, as the responses of peripheral blood cells are unlikely to be closely
comparable. This is also shown by modular assessment of peripheral blood
transcriptional profiles from these patients, in which the HIV-1-dysregulated
phenotypes described in the TST were not evident by modular analysis.
Gene expression profiling of HIV-1− TST+ samples from active TB patients
confirmed the value of this approach in dissecting the CMI response at a systems level
in vivo, consistent with the previous investigation in healthy volunteers (Tomlinson et
al., 2011). A modular analysis strategy was used to gain further insights into the CMI
response. Signatures of infiltration by a range of cell types were identified, and limited
Th2 and T-regulatory responses were detected in the context of a dominant Th1
response. Importantly, Mtb-specific innate responses were enriched in comparison to
those specific to other pathogens, confirming the utility of the TST as a model to study
specific Mtb-induced inflammation.

Chapter 6. Results
304
Comparison of TST+ samples from active TB patients with those from healthy
individuals also lent confidence to utilising the TST as a challenge model in active TB
patients, as it was not systematically confounded by active disease. However, the
molecular resolution of the transcriptional approach allowed identification of a subset of
genes with increased expression in active TB TSTs. Some of these have been
implicated in TB pathogenesis, such as the matrix metalloproteinase MMP1 (Elkington
et al., 2011) and anti-microbial peptides including a beta-defensin (Rivas-Santiago et
al., 2006). This gene list was also enriched for inflammatory pathways such as integrin
and complement activation. These observations suggest that although the TST
response is broadly conserved in active TB, it may be used to gain disease-specific
insights. Further such insights were gained from modular analysis showing decreased
enrichment for the T cell-specific module, perhaps reflecting the relative lymphopenia
which is observed in active TB patients (Beck et al., 1985).
Anergic TST responses, i.e. those in which patients fail to react to PPD despite
having active TB and so presumably having Mtb antigenic memory, were found in 54%
of the HIV-1+ patients in this cohort, and similarly to previous reports (Cobelens et al.,
2006), I found TST responsiveness to be an “all-or-nothing” phenomenon: i.e.
responses were clearly positive (≥10mm induration) or completely negative, with no
intermediate “weak” TST responses. This clinical observation presents the hypothesis
that TST anergy in these individuals is due to a specific failure to generate any
inflammation whatsoever, rather than being a diminishment in the inflammatory
response due to immunosuppression. Gene expression profiling of HIV-1+ anergic
TSTs lent considerable support to this hypothesis. Comparison with TST+ samples
from HIV-1− active TB patients showed a detectable but strikingly limited response in
the anergic TSTs. This differed from observations in healthy individual TST− samples,
which despite being clinically identical to anergic responses contained a much broader
gene expression response. Further comparisons between HIV-1+ anergic TSTs and
healthy individual negative TSTs confirmed that TST anergy was molecularly distinct
from TST negativity. Anergic TSTs had little evidence of cellular infilitration or
inflammatory activity, both of which were demonstrated in the healthy TST− individuals.
Further evaluations showed that the limited response in the HIV-1+ anergic TSTs was
dominated by a relatively preserved type I IFN response. This response was also
present in its entirety in TST+ samples. This confirms that type 1 IFN responses are
evident at the tissue level in human anti-mycobacterial responses, consistent with
previous reports derived from analysis of peripheral blood (Berry et al., 2010).

Chapter 6. Results
305
Interestingly, these can be invoked by PPD alone, which suggests that mycobacterial
components without live bacterial replication are sufficient to induce a type I IFN
response in vivo.
Observation of this type I IFN response in the absence of other inflammation in
HIV-1+ anergic TSTs raises two questions: firstly, what cells or mechanisms are
generating this response, and secondly, what consequences might this phenotype
have for TB pathogenesis in these individuals? As there appears to be an absence of
any cellular influx in these samples, I hypothesise that the response is being generated
by tissue-resident sentinel cells such as macrophages. In terms of the consequences
for TB pathogenesis, there has recently been considerable interest and supportive
assessment of the hypothesis that type I IFN is immunosuppressive and compromises
control in tuberculosis and other mycobacterial infections (Manca et al., 2001; Mayer-
Barber et al., 2011; Redford et al., 2014; Stanley et al., 2007; Teles et al., 2013). This
suggests that this presence of this response in itself might be functionally implicated in
the anergic failure to generate inflammation. At the site of disease, failure to generate
an effective CMI response in HIV-1+ individuals may lead to poor granulomatous
organisation and uncontrolled bacillary replication (Lawn et al., 2002). This phenotype
may be analogous to lepromatous lesions in leprosy, in which the failure of host
immunity leads to uncontrolled bacillary replication and disease - a process which has
been shown to be driven by type I IFN (Teles et al., 2013). My identification of type I
IFN responses at the site of CMI anergy in HIV-1+ individuals thus presents a novel
hypothesis for the mechanism of anergy and associated poor clinical outcomes in
these patients (Moreno et al., 1993), and lends further support to the notion that type I
IFNs compromise control of mycobacteria in vivo.
Assessment of the site of inflammation in HIV-1+ TST+ active TB patients showed
broadly typical TST responses in these individuals, with a specific deficiency in activity
of the immunoregulatory cytokine IL-10. As it has been shown that human MDMs
infected with HIV-1 in vitro display attenuated IL-10 responses to Mtb as a direct result
of viral infection (Tomlinson et al., 2014, Chapter 3), this observation suggests that this
phenomenon may also occur in vivo. A clear hypothesis for the mechanism of this
phenotype within the TST is suggested by my experimental data - that IL-10 responses
are inhibited in either tissue-resident macrophages or recruited monocyte-derived
macrophages which are infected with HIV-1. Both my cellular module assessments and
a previous report (Liang et al., 2013) indicate that recruitment of monocytes/APCs to

Chapter 6. Results
306
the TST is non-defective in HIV-1+ individuals, meaning the latter scenario is plausible.
However, if this is a specifically macrophage-driven phenomenon, 48 hours is likely to
be an insufficient timeframe for differentiation of infiltrating monocytes into
macrophages. Additionally, the burden of HIV-1 infection within the circulating
monocyte population is thought to be extremely low (Spear et al., 1990). However,
multiple reports have demonstrated HIV-1 infection in tissue macrophages in vivo, and
so attenuated IL-10 responses generated by these cells as a mechanism for this
phenotype is plausible (Cao et al., 1992; Jambo et al., 2014; Jarry et al., 1990; Koenig
et al., 1986).
The potential consequences of attenuated IL-10 responses for TB pathogenesis
in vivo in HIV-1+ individuals are numerous. Previous in vitro data highlighted that
deficiency in the innate immunoregulatory functions of IL-10 may lead to exacerbated
pro-inflammatory responses, which have the potential to increase immunopathology
and tissue damage (Tomlinson et al., 2014; Chapter 4). IL-10 also plays key roles in
regulating apoptosis and promoting resolution of inflammation (Eslick et al., 2004;
Ogawa et al., 2008; Zhou et al., 2001), and dysregulation of these processes could
have consequences for the effective containment of Mtb within a protective fibrotic
granuloma structure (Lin et al., 2014).
Finally, in HIV-1+ active TB patients classified as undergoing an unmasking IRIS,
I used gene expression profiling to identify a Th2 bias in the context of otherwise
conserved CMI responses in the TST. Although this observation was made in a small
patient cohort, it was statistically consistent and confirmed via both modular analysis of
gene expression profiles and histopathological assessments.. Previous investigations
of immunopathological mechanisms in IRIS have associated expanded polyfunctional
T cell populations and hypercytokinaemia with the syndrome (Mahnke et al., 2012;
Meintjes et al., 2008b; Tadokera et al., 2011), but I am aware of no previous reports
specifically suggesting a role for Th2 responses. Some reports exist describing a
systemic Th2 bias in HIV-1+ individuals including in patients on HAART (Hagiwara et al.,
1996; Meroni et al., 1996; Sindhu et al., 2006), which may contribute. Th2 responses
represent an entirely distinct mode of immunity to the Th1 response which is classically
protective in TB (Anthony et al., 2007; Jenkins et al., 2011; Voehringer et al., 2004),
and so it may be suggested that this is a non-protective bias detected at the site of
inflammation in IRIS. In support of this, corticosteroids have been shown to be effective
in treating TB IRIS (Meintjes et al., 2012), and these agents are also widely used

Chapter 6. Results
307
clinically to treat Th2-associated conditions such as asthma. However, further
confirmation of whether this phenotype exists in vivo in a wider cohort of patients is
necessary before its potential consequences can be properly delineated.
Identification of these three dysregulated phenotypes at the site of anti-
mycobacterial inflammation in HIV-1+ active TB patients posed the question of whether
virus could be detected in the TST samples, which might suggest that these
phenotypes were due to some direct effects of the virus in the inflammatory context.
Although viral transcript was detected in a subset of TST samples, it could not be
definitively concluded that this was not due to bloodborne virus from contaminating
blood. As such, there remains a lack of conclusive evidence as to whether HIV-1 is
directly causing these phenotypes at the site of inflammation, or whether they are a
result of some systemic effects of HIV-1 infection. Further assessments of whether
HIV-1 infected cells are present in the TST reaction site are merited, for example by
immunohistochemical staining of HIV-1 proteins, or by fluorescence in situ
hybridisation for HIV-1 RNA, as has recently been successfully used to quantify
infection in AMs ex vivo (Jambo et al., 2014).
To further investigate the phenotypes identified here, it may be informative to
assess TST inflammation in similar patient cohorts at earlier and later time-points post-
TST, as further temporal resolution might elucidate the mechanisms driving these
phenotypes and characterise their consequences. For example, identifying at what
stage post-TST the type I IFN response develops in HIV-1+ anergy might be illustrative
as to what cells generate this response and by what mechanism. Evaluation of TST
inflammation in HIV-1+ TST+ samples at later time-points may assist in exploring the
functional outcomes of IL-10 deficiency in terms of inflammation and resolution. Finally,
confirmation of these phenotypes in samples from the site of TB disease is warranted,
although methods for this which are sufficiently controlled to allow detailed cross-group
comparisons need to be identified.
By using the TST as an in vivo human challenge model, I have identified multiple
pathways through which HIV-1 may exert detrimental modulatory effects on anti-
mycobacterial CMI. How does elucidating these phenotypes aid our ability to effectively
combat active TB in HIV-1+ individuals? Understanding the divergent nature of TB
disease in this heterogeneous high-risk group may potentially aid diagnosis and
treatment, particularly as strategies for targeted immunotherapeutics in human TB
begin to be elucidated (Mayer-Barber et al., 2014; Tobin et al., 2012). Understanding

Chapter 6. Results
308
the fundamentals of immunopathogenesis in active TB, including in the context of HIV-
1 co-infection, is essential if such strategies are to be widely employed successfully,
and characterising anti-mycobacterial CMI in vivo is an important step forward in this
regard.

Chapter 6. Results
309

Chapter 7. Discussion
310
Chapter 7. Discussion
7.1.1 Modulation of CMI by HIV-1
HIV-1 pathogenesis is characterised by immune and inflammatory dysfunction.
The two key components of the CMI response, CD4+ T cells and macrophages, are
direct targets for infection by HIV-1. The effects that the virus has on these cells, as
well as its other pleiotropic effects on immunity, has the potential to disrupt the function
of this arm of the immune response. I have investigated how HIV-1 modulates CMI,
firstly by using an in vitro model of human MDMs, and secondly by using an in vivo
human challenge model, the TST.
7.1.2 Dysregulation of IL-10 responses by HIV-1
I have shown that HIV-1 infection of human MDMs in vitro inhibits production of
the immunomodulatory cytokine IL-10 in response to innate immune stimulation, and
that this is a consequence of integration by HIV-1 and expression of viral components.
Importantly, IL-10 attenuation was also observed in vivo, in positive TST reactions from
HIV-1+ active TB patients. This suggests that this phenomenon is a novel host-virus
interaction which may have physiologically significant consequences. Further
confirmation of its role in vivo, elucidation of the mechanism which causes it and
delineation of its consequences are priorities for further investigation. These will be
necessary in evaluating any potential for targeting this phenotype therapeutically in
HIV-1 associated co-infections.
The in vitro experiments presented here showed that IL-10 attenuation was
context-specific and, of the cells tested, occurred only in monocyte-derived
macrophages differentiated with M-CSF. This phenotype was confirmed in vivo in the
TST via bioinformatic and modular evaluations of gene expression data, but although
transcriptional profiling can provide highly multidimensional insights into immune
responses, it does not facilitate direct identification of the cellular basis of a phenotype.
Moreover, appropriate markers to evaluate IL-10 attenuation in paired histological
samples were not available. Identification of the cell types in vivo wherein HIV-1
attenuates IL-10 responses therefore remains a priority. The most useful insights may
be gained by studying mononuclear phagocytic cells from HIV-1+ patients, and most
importantly tissue-resident macrophages. It has recently been confirmed that alveolar
macrophages (AMs) are infected with HIV-1 in vivo (Jambo et al., 2014), and so a key

Chapter 7. Discussion
311
investigation may be to obtain AMs from HIV-1+ patients and evaluate their ability to
mount IL-10 responses to Mtb and other clinically important pathogens.
Investigating site-of-disease samples may also be informative: it should be
noted that substantially lower IL-10 levels in comparison to HIV-1− individuals have
been measured in cerebrospinal fluid from TB meningitis cases (Simmons et al., 2006).
Further investigations could utilise pleural fluid, BAL or other accessible site-of-disease
samples to further confirm this phenotype. Systemically attenuated IL-10 levels in HIV-
1+ patients have not been reported; conversely, raised systemic IL-10 has been
identified in HIV-1 infection (Arias et al., 2010; Brockman et al., 2009). However, this
may be part of the generally raised cytokine levels which are associated with HIV-1
infection (Kedzierska and Crowe, 2001), and thus non-intuitively be originally due to a
deficiency of early-response IL-10, causing a defective anti-inflammatory response and
thus heightened inflammation. The model suggested by my in vitro data points to
tissue-resident cells generating this phenotype early in the innate immune response, so
it is conceivable that it will not be evident at steady state in the peripheral blood. This is
also evidenced by assessment of peripheral blood transcriptional profiles from active
TB patients, wherein expression of an IL-10 module was detected, but was not affected
by HIV-1 co-infection.
As well as evaluating the presence of IL-10 attenuation by HIV-1 in vivo, further
investigation of the mechanism of this phenotype is merited. I have shown that
integration by HIV-1 is necessary for IL-10 attenuation, and have begun to delineate
which viral proteins are involved. Further virological experiments should demonstrate
which components of the virus are necessary and sufficient for this phenotype. This
may also provide insight into the host pathways which are affected, but to this end I
have identified a strong candidate in the PI3K pathway, and assessments of its
function in HIV-1 infected MDMs may also assist in elucidating the mechanism of IL-10
attenuation. The experiments presented here indicate that HIV-1 inhibits IL-10
expression by modulating conserved innate immune signalling pathways involved in IL-
10 induction, and so systems-level assessment of the activation of these pathways
using phosphoproteomics may also be informative.
Identifying the consequences of attenuated IL-10 responses may inform our
understanding of the immunopathogenesis of HIV-1 disease and associated co-
infections. I have demonstrated that IL-10 attenuation potentiates HIV-1 replication in
an inflammatory setting. Induction of HIV-1 replication by inflammatory pathways is

Chapter 7. Discussion
312
consistent with previous in vitro reports (Garrait et al., 1997; Hoshino et al., 2002; Poli
et al., 1994, 1990; Ranjbar et al., 2009) and in vivo observations in TB disease (Collins
et al., 2002; Nakata et al., 1997; Toossi et al., 2001a; Toossi et al., 2001b). As previous
investigations have shown that IL-10 attenuation is associated with exacerbated pro-
inflammatory responses (Tomlinson et al., 2014), this strongly supports the hypothesis
that HIV-1 may attenuate IL-10 to promote its own replication in an inflammatory
microenvironment, by eliminating IL-10-mediated immunosuppression. I have also
shown that IL-10 neutralisation in the innate inflammatory response leads to increased
recruitment of T cells, indicating a further pathway by which HIV-1 might promote its
own propagation by inhibiting IL-10, via inducing recruitment of potential host cells.
Investigating whether HIV-1 itself alters recruitment of T cells to inflammatory foci via
IL-10 attenuation, and investigation of the relationship between this phenotype and
cell-to-cell transfer of virus, may help confirm these hypotheses with regard to viral
propagation.
To gain insight into the consequences of IL-10 attenuation for the function of
the immune system, I carried out a series of experiments to investigate the role of IL-10
in modulating macrophage function. These experiments showed that IL-10 has a range
of modulatory effects in the innate immune response, as opposed to being a purely
immunosuppressive factor, and highlighted some key IL-10-regulated pathways which
merit further investigation in the context of HIV-1 infection of macrophages. These
included cell recruitment to inflammatory foci, as discussed above, and regulation of
pro-inflammatory cytokine production, as previously investigated (Tomlinson et al.,
2014). Exploration of two further pathways may also be informative.
Firstly, IL-10 regulates the production of secreted factors which control cell
differentiation and polarisation. These include M-CSF and GM-CSF, which may
regulate monocyte differentiation, and IL-12 p40, which regulates Th1 cell
differentiation. Confirmation of whether attenuation of IL-10 by HIV-1 leads to
dysregulation of these cell differentiation pathways may characterise effects of the
virus on these key cells of cell-mediated immunity. Monocytes/macrophages and Th1
cells are the major constituents of the site of TB disease, the granuloma. Elucidating
how HIV-1 modulates the phenotype of these cells, and hence the phenotype of the
granuloma, may assist in identifying how HIV-1 exacerbates TB pathology during co-
infection (Diedrich and Flynn, 2011; Lawn et al., 2002). To this end, evaluating the

Chapter 7. Discussion
313
outcomes of IL-10 attenuation and associated phenotypes using developed in vitro
models of granulomata may be informative (Puissegur et al., 2004).
A second pathway regulated by IL-10 was apoptosis, consistent with previous
reports describing IL-10 as an anti-apoptotic factor (Eslick et al., 2004; Zhou et al.,
2001). Modulation of this function via HIV-1 attenuation could potentially contribute to
macrophage cell death; this again could severely impact on granuloma function, and
hence exacerbate TB disease in HIV-1+ individuals. Increased cell death in situ has
been observed in the pleural fluid of HIV-1+ pleural TB patients in comparison to HIV-1−
patients, particularly among mononuclear phagocytes (Hirsch et al., 2001), as has
increased necrosis in pleural granulomata in HIV-1+ patients (Bezuidenhout et al.,
2009). These observations suggest that exploration of the effects of HIV-1 on cell
death in vitro is warranted, and any role of IL-10 in this.
As well as further exploring the consequences of IL-10 attenuation using in vitro
models, the fact that this phenotype is evident in the TST challenge model provides a
valuable in vivo opportunity to study its consequences. Characterising the TST
response at later time-points in HIV-1− and HIV-1+ TST+ samples, for example at 1
week post-TST, may elucidate whether functional deficiency of IL-10 impairs resolution
of inflammation – a described function of IL-10 (Aggarwal et al., 2014; Tabas, 2010). It
may also be possible to utilize recently developed animal models of HIV-1 infection for
further in vivo investigations, such as humanized mice (Calderon et al., 2013; Marsden
et al., 2012; Sun et al., 2007) or macaque models of HIV-1/Mtb co-infection (Diedrich et
al., 2010; Mattila et al., 2011).
7.1.3 Other axes of CMI dysregulation by HIV-1
In addition to identifying IL-10 attenuation by HIV-1 in an in vivo inflammatory
setting, I used the TST human challenge model to identify two further phenotypes of
HIV-1 dysregulation of CMI responses. Firstly, in HIV-1+ patients with anergic TST
responses, I showed that there was relative preservation of the type I IFN response in
the absence of any other effective inflammation, and that this phenotype was
molecularly distinct from negative TST responses in healthy individuals. This
observation may help elucidate the mechanism of anti-mycobacterial anergy in HIV-1+
individuals, particularly in the light of recent reports that type I IFN responses are
damaging and immunosuppressive in mycobacterial disease (Mayer-Barber et al.,
2014; Teles et al., 2013). To consider the effect this phenotype might have on TB

Chapter 7. Discussion
314
immunopathology, comparisons may be drawn with reports that the site of TB disease
in severely immunosuppressed HIV-1+ individuals is characterised by a paucity of CMI
response (analogous to anergy) and a preponderance of replicating bacilli (de Noronha
et al., 2008; Lawn et al., 2002; Nambuya et al., 1988). This suggests that anergy could
promote TB disease via uncontrolled mycobacterial replication. Confirmation of
whether type I IFN responses exist at disease sites, in a similar fashion to the TST
model, may implicate them in this mechanism, along with in vitro evaluations of
whether type I IFN can suppress CMI responses and mycobacterial killing.
Consideration of how HIV-1 might mechanistically cause this anergic phenotype is also
merited.
A second phenotype identified using the TST challenge model was that of
exaggerated Th2 responses detectable at the site of CMI in HIV-1+ patients classified
as undergoing an unmasking IRIS. Further confirmation of this phenotype using the
same model in further IRIS patients is warranted, as this finding was made in a limited
cohort of patients. Additionally, it will be valuable to explore whether it is evident at the
site of TB disease, if appropriate sampling opportunities are available. A mechanism is
not clear for how HIV-1 would cause exaggerated Th2 responses, or how these would
lead to exacerbated presentations of active TB in IRIS patients. If this phenotype is
further confirmed in vivo, this may therefore be another potential avenue for
investigation.
7.1.4 The impact of HIV-1 on TB disease
Two major models have emerged recently which have enhanced our
understanding of the development and pathogenesis of mycobacterial disease. Firstly,
the “Goldilocks effect”, in which either too little or too much inflammation can
compromise protection and lead to immunopathogenesis. This is supported by
evidence from the M. marinum zebrafish model, in which the magnitude of TNFα
production can determine disease outcome (Roca and Ramakrishnan, 2013; Tobin et
al., 2012), and from studies of human and mouse mycobacterial infections, in which a
balance between inflammatory IL-1 or adaptive IFNγ responses and
immunosuppressive type I IFN responses has been shown to be critical in
mycobacterial control (Mayer-Barber et al., 2014; Teles et al., 2013). Secondly,
although it has long been assumed that the function of the granuloma is central to Mtb
control (Davis and Ramakrishnan, 2009), recent studies have demonstrated that the

Chapter 7. Discussion
315
dynamic and heterogeneous host/pathogen interactions which take place at the level of
the single granuloma are critical in determining the clinical outcome of TB infection,
particularly with regard to the granuloma stability and the degree of bacillary killing
which occur in each lesion (Lin et al., 2014). Integrating these two models defines our
current understanding of Mtb control and pathogenesis, in which the quantity and
quality of inflammation at each site of infection has the potential to determine the
systematic outcome of disease, via effects on bacterial killing and local tissue integrity.
By considering how the modulatory effects of HIV-1 on CMI described in this
thesis might impact on this model, ways by which I have shown HIV-1 may
compromise Mtb control are summarised (Figure 7.1). Dysregulation of IL-10
responses, in granulomata containing HIV-1-infected mononuclear phagocytes, may
generate a nidus of exaggerated inflammation, which has the potential to compromise
granuloma integrity, exacerbate symptoms and lead to excessive cell death. The
exaggerated Th2 responses seen in IRIS patients may similarly contribute to
exaggerated inappropriate inflammatory phenotypes which compromise granuloma
function. Conversely, HIV-1 anergy at the site of disease, in which type I IFNs may
potentially be implicated, may lead to active disease via the failure to generate an
effective CMI response and subsequent uncontrolled bacillary replication. These
stochastic events caused by HIV-1, which alter the functionality of individual
granulomata, may convert sites of Mtb control to sites of uncontrolled replication and
inflammation, and hence lead to development of clinical TB disease. Further work is
required to confirm these proposed interactions and to delineate their mechanisms.
A body of previous data describes how the IL-10 response in TB is damaging,
and compromises control of the pathogen by suppressing effective immune responses
(Redford et al., 2011). Additionally, it is proposed that some of the immunosuppressive
effects of type I IFN are in fact mediated by induction of IL-10 (Mayer-Barber et al.,
2011; Teles et al., 2013). These findings are in conflict with the model presented here,
as I propose that IL-10 deficiency is a pathway by which HIV-1 increases risk of TB
disease. However, it should be pointed out that these observations have mainly been
made out with the context of HIV-1 infection. The pleiotropic effects of HIV-1 on
immunity may alter the outcomes of IL-10 deficiency. Additionally, another “Goldilocks
effect” may be in evidence, wherein too much or too little IL-10 can lead to aberrant
immune processes, and IL-10 attenuation by HIV-1 leads to the latter scenario.

Chapter 7. Discussion
316
TB disease clearly has an altered phenotype in HIV-1+ individuals, wherein
profound loss of control of the pathogen is evident in disseminated disease and
mycobacteraemia (Domoua et al., 1995; Elliott et al., 1993; Gilks et al., 1990; von Reyn
et al., 2011), as well as in altered inflammatory phenotypes such as IRIS (Lawn et al.,
2008). Modulation of CMI by HIV-1, which I have shown may include IL-10 attenuation,
is likely to contribute to these processes. Further molecular characterisation of aberrant
immune phenotypes in human tuberculosis in vivo, in HIV-1+ individuals and in other
contexts, is necessary to fully elucidate the contribution of risk factors, genetics and
immunology to this phenotypically heterogeneous disease.

Chapter 7. Discussion
317
Figure 7.1: HIV-1 modulation of the CMI response to Mtb may contribute to
granuloma instability.
Stable granulomata are hypothesised to be a site of an effective CMI response co-
ordinated by macrophages, giant cells and T cells, in which mycobacteria and
associated necrotic processes are contained by these cell types and recruited fibrotic
processes (Ulrichs and Kaufmann, 2006). Progression to granuloma instability, in
which there is uncontrolled mycobacterial replication and increased necrosis, is
postulated to increase the risk of clinical TB disease (Lin et al., 2014). This schematic
summarises the contribution of different inflammatory processes to granuloma
deterioration, and wherein the effects of HIV-1 on CMI described in this thesis may
contribute to this.

Chapter 7. Discussion
318
7.1.5 Potential for restoring functional CMI in HIV-1 infection
HIV-1 infected macrophages may represent a long-lived reservoir of viral
infection (Gendelman et al., 1989; Groot et al., 2008). This indicates that HIV-1
modulation of CMI which results from macrophage infection may persist in the context
of ART, hence potentially providing insight into immune and inflammatory dysfunction
post-ARVs, such as IRIS. ARVs are highly effective in reducing mortality in HIV-1+
patients (The HIV-CAUSAL Collaboration, 2010). In treating aspects of disease which
persist despite their use (Palella et al., 2006) - or in the case of IRIS, because of it –
understanding how HIV-1 modulates CMI may suggest potential therapeutics targeting
immune processes dysregulated by the virus. These may also be therapeutic options in
the context of ARV treatment failure. The mechanism of IL-10 attenuation, if elucidated,
may be one such target. Exaggerated Th2 responses in IRIS, if confirmed to be
pathogenic, are a clear opportunity for intervention due to the range of effective
therapies available for treating Th2-mediated diseases such as allergy and asthma. In
fact, as there is some evidence for using corticosteroids in the treatment of IRIS
(Meintjes et al., 2012), it is possible that this pathway is already being targeted
therapeutically.
7.1.6 Insights into the normal function of the cell-mediated immune system
Understanding pathological processes can provide insights into normal physiology,
and the effects of HIV-1 on CMI described in this thesis provide some insights into the
basic biology of this system. While investigating a mechanism by which HIV-1 might
inhibit IL-10 but not pro-inflammatory cytokine production, a specific role was identified
for the PI3K pathway in regulating IL-10 and not pro-inflammatory cytokine production.
This may be a critical mechanism by which the host mounts appropriate immune
responses to pathogenic and non-pathogenic microbes, as reported in the murine
system (Ivanov and Roy, 2013), and as such further investigation is merited of how this
pathway functions in human macrophages.
I have also specifically evaluated some functions of the cell-mediated immune
system out with the context of HIV-1 infection. I used transcriptional profiling to explore
how IL-10 regulates macrophage-mediated immune responses, showing that it might
exert its most potent effects in modulating the innate response, while not inhibiting
macrophage responses to IFNγ. This is in conflict with a prevalent concept in the field
that IL-10 can inhibit protective IFNγ responses (O’Garra et al., 2013). Although a large

Chapter 7. Discussion
319
body of work exists describing the functions of IL-10, this highlights that many aspects
of the biology of this immunomodulatory cytokine remain uncharacterised or
controversial. Further work to clarify its precise functions is merited, particularly as it
has been postulated to be a therapeutic target (O’Garra et al., 2008)
I also used transcriptional profiling to explore macrophage plasticity in the context
of differentially polarised T cell responses, and showed that cytokines associated with
Th1, Th2 and Treg responses could all produce large magnitudes of transcriptional
changes in human MDMs. This corroborates recent reports demonstrating the broad
diversity of macrophage activation states (Xue et al., 2014). One important limitation of
these investigations is that they rely on the hypothesis that the transcriptome is an
accurate barometer of cell state, when in fact there may be dissociation between the
transcriptome and the functional proteome (Germain et al., 2011). Future systems
biology approaches to understanding macrophage diversity, and furthermore, to
understand immune responses in vivo, may be enhanced by integrating transcriptomic
and proteomic approaches.
7.1.7 Summary of findings and further work
In this thesis, I have used in vitro and in vivo models to explore the effects of
HIV-1 on the CMI response, and to gain insights into the normal function of this arm of
the immune system. Using an in vitro MDM model, I have characterised a phenotype
wherein HIV-1 attenuates innate immune production of the immunomodulatory cytokine
IL-10. In work exploring the mechanism of this phenotype, I have determined that it is
highly context-specific and likely to be due to a function of the viral accessory proteins.
I have also identified that the PI3K pathway is involved in specifically regulating IL-10
production in human MDMs, suggesting that it might be a target for HIV-1 in mediating
IL-10 attenuation. I have shown that HIV-1 may attenuate IL-10 in order to maximise its
own replication in the advantageous inflammatory microenvironment, and have
identified potential consequences of this phenotype for the immune response by
studying the normal functions of IL-10 in regulating macrophage biology and innate
immune responses.
By using transcriptional profiling to explore macrophage plasticity, I have
developed methods for assessing the activity of different axes of the immune response
in in vivo gene expression profiles. I have applied these while evaluating the effect of
HIV-1 on CMI in vivo using a human challenge model, the TST, in active TB patients.

Chapter 7. Discussion
320
Using this model, I have gained insights into the function of CMI at the site of
inflammation in vivo with molecular resolution, and have identified three dysregulated
phenotypes associated with HIV-1 infection: IL-10 attenuation (corroborating my in vitro
findings), a role for type I IFNs in anergy, and exaggerated Th2 responses in IRIS
patients.
My findings suggest a range of potential future investigations. Further in vitro
work to identify the mechanism of IL-10 attenuation by HIV-1 may identify a novel host-
virus interaction. Further characterisation of the downstream consequences of this
phenotype in vitro, in terms of its effects on cell differentiation, recruitment and
apoptosis, will highlight its potentially physiologically relevant consequences. To this
end, using macrophage/T cell co-culture systems or in vitro granuloma models may
allow assessment of the effects of HIV-1 on CMI beyond the function of macrophages.
Using systems biology approaches to assess a human challenge model of CMI
in vivo provided valuable insights into how HIV-1 dysregulates responses to
mycobacteria. Further use of such approaches, both in expanding this challenge model
to further timepoints and contexts, and in assessing samples obtained from the site of
disease, will help to further confirm and explore these phenotypes. Such an approach
may identify opportunities for using immunotherapeutics to mitigate the potent
dysregulatory effects of HIV-1 on CMI, most importantly in the context of TB.

Appendix I
321
Chapter 8. Appendix I: Modules
Gene lists for modules developed in Chapter 5 and/or used in Chapter 6 are
presented in this appendix. Modules 1–12 are those developed in Chapter 5.
Modules 13–19 were developed by Dr Gabriele Pollara (University College London).
The strategy for deriving these modules is described as follows:
A semi-supervised bioinformatic approach was used to identify cell-type defining
modules. A gene expression matrix of many cell types was derived from publicly
available transcriptional profiling data repositories. For each cell type of interest, gene
probes representing 3 putative markers that conventionally identify such cells were
identified from the published literature. A correlation script in R identified the degree of
co-correlation in gene expression between each marker probe and all other gene
probes present in the expression matrix. The 1% of probes that were most co-
correlated with the expression of each marker were identified, and modules were then
derived from those highly co-correlated probes that were common to all 3 markers for
each cell type.

Appendix I
322
(1) IFNγ module
Agilent Probe ID
RefSeq
Accession
number
Gene
SymbolAgilent Probe ID
RefSeq
Accession
number
Gene
Symbol
A_23_P18452 NM_002416 CXCL9 A_24_P12690 NM_194294 IDO2
A_23_P112026 NM_002164 IDO1 A_23_P18604 NM_015907 LAP3
A_23_P81898 NM_006398 UBD A_33_P3424217 NM_001243962 HLA-DQB1
A_24_P303091 NM_001565 CXCL10 A_24_P687326 NR_024366 LINC00256A
A_23_P1962 NM_004585 RARRES3 A_23_P76529 NM_000889 ITGB7
A_23_P7827 NM_001010919 FAM26F A_33_P3402615 NM_201649 SLC6A9
A_32_P44394 NM_004833 AIM2 A_33_P3393821 NM_001733 C1R
A_33_P3259393 NM_178232 HAPLN3 A_23_P65651 NM_004184 WARS
A_23_P39840 NM_006634 VAMP5 A_23_P116942 NM_002286 LAG3
A_23_P72737 NM_003641 IFITM1 A_33_P3376971 NM_024111 CHAC1
A_19_P00812190 NA Q5D1D6 A_23_P105794 NM_033255 EPSTI1
A_24_P48204 NM_003004 SECTM1 A_23_P349966 NM_152913 TMEM130
A_23_P32404 NM_002201 ISG20 A_33_P3401826 NM_207315 CMPK2
A_23_P139123 NM_000062 SERPING1 A_24_P387875 NM_002241 KCNJ10
A_33_P3407880 NM_144590 ANKRD22 A_24_P323148 NM_182573 LYPD5
A_23_P42353 NM_016135 ETV7 A_23_P400378 NM_001077191 GPBAR1
A_24_P270460 NM_005532 IFI27 A_24_P7594 NM_030641 APOL6
A_24_P28722 NM_080657 RSAD2 A_24_P245815 NM_020437 ASPHD2
A_24_P274270 NM_139266 STAT1 A_33_P3369058 NM_198578 LRRK2
A_23_P121253 NM_003810 TNFSF10 A_33_P3299279 NM_001014279 C5orf39
A_32_P356316 NM_002119 HLA-DOA A_33_P3396139 NM_005214 CTLA4
A_23_P45871 NM_006820 IFI44L A_23_P258493 NM_005573 LMNB1
A_32_P171061 NM_005170 ASCL2 A_23_P41470 NM_017631 DDX60
A_33_P3276615 NM_030643 APOL4 A_33_P3413905 NM_024866 ADM2
A_32_P209960 NM_000246 CIITA A_32_P108254 NM_017565 FAM20A
A_23_P85693 NM_004120 GBP2 A_23_P17663 NM_002462 MX1
A_23_P64721 NM_006018 HCAR3 A_24_P274831 NM_153236 GIMAP7
A_23_P370682 NM_138456 BATF2 A_23_P9883 NM_001079821 NLRP3
A_33_P3284933 NM_145659 IL27 A_24_P340128 NM_178129 P2RY8
A_24_P557479 NM_017523 XAF1 A_33_P3271635 NM_002121 HLA-DPB1
A_23_P210690 NM_021158 TRIB3 A_23_P42588 NM_018384 GIMAP5
A_23_P156687 NM_001710 CFB A_23_P6535 NM_138433 KLHDC7B
A_32_P453321 NM_001145636 C1orf228

Appendix I
323
(2) TNFα module
Agilent Probe ID
RefSeq
Accession
number
Gene
Symbol
A_23_P119478 NM_005755 EBI3
A_33_P3398912 NM_017585 SLC2A6
A_33_P3303810 NM_005558 LAD1
A_33_P3227899 NR_015361 LOC440896
A_32_P87013 NM_000584 IL8
A_23_P76901 NM_015549 PLEKHG3
A_33_P3242623 NM_014331 SLC7A11
A_23_P106002 NM_020529 NFKBIA
A_23_P98350 NM_001165 BIRC3
A_23_P214222 NM_002356 MARCKS
A_33_P3226395 NR_024420 LOC389634
A_24_P56689 NM_003456 ZNF205
A_33_P3255131 NM_001100915 KCTD19
A_24_P941217 NA SGPP2
A_23_P256948 NM_005098 MSC
A_23_P119042 NM_005601 NKG7

Appendix I
324
(3) IL-4/IL-13 module
Agilent Probe IDRefSeq Accession
number
Gene
Symbol
A_23_P215484 NM_006072 CCL26
A_23_P55373 NM_001140 ALOX15
A_24_P125335 NM_005408 CCL13
A_23_P86470 NM_003956 CH25H
A_23_P254507 NM_139211 HOPX
A_23_P157795 NM_003798 CTNNAL1
A_23_P153390 NM_198492 CLEC4G
A_24_P73577 NM_170697 ALDH1A2
A_24_P313418 NM_002990 CCL22
A_32_P217750 NM_002183 IL3RA
A_23_P27795 NM_021102 SPINT2
A_33_P3258392 NM_001955 EDN1
A_24_P49190 NM_181655 C17orf58
A_33_P3354935 NM_172212 CSF1
A_23_P164773 NM_002002 FCER2
A_23_P139418 NM_198516 GALNTL4
A_23_P19624 NM_001718 BMP6
A_23_P339818 NM_183376 ARRDC4
A_33_P3245908 NM_001010863 C10orf128
A_33_P3422124 NM_181310 IL22RA2
A_23_P88626 NM_001150 ANPEP
A_23_P394986 NM_153836 CREG2
A_32_P86763 NM_004613 TGM2
A_33_P3287348 NM_004067 CHN2
A_24_P203056 NM_020993 BCL7A
A_23_P215956 NM_002467 MYC
A_23_P147711 NM_000906 NPR1
A_33_P3379775 NA TLE1
A_23_P55749 NM_015719 COL5A3
A_23_P121499 NM_006005 WFS1
A_33_P3423979 NM_001166109 PALLD
A_23_P400716 NM_001010846 SHE

Appendix I
325
(4) TGFβ/IL-10 module
Agilent Probe ID
RefSeq
Accession
number
Gene Symbol
A_23_P131676 NM_020311 CXCR7
A_23_P144959 NM_004385 VCAN
A_23_P78543 NM_005498 AP1M2
A_23_P166408 NM_020530 OSM
A_23_P434809 NM_002964 S100A8
A_24_P413126 NM_020182 PMEPA1
A_23_P28815 NM_000782 CYP24A1
A_32_P65616 NM_000948 PRL
A_24_P118196 NM_001080393 GXYLT2
A_23_P79978 NM_020689 SLC24A3
A_23_P57709 NM_013363 PCOLCE2
A_24_P299685 NM_198389 PDPN
A_33_P3358099 NM_181449 CD300E
A_23_P21485 NM_017933 PID1
A_23_P87049 NM_003105 SORL1
A_24_P330518 NM_001218 CA12
A_23_P154037 NM_001159 AOX1
A_23_P404494 NM_002185 IL7R
A_33_P3236177 NM_001145 ANG
A_23_P79518 NM_000576 IL1B
A_19_P00318323 NR_015410 LINC00340
A_23_P99253 NM_004664 LIN7A
A_23_P33723 NM_004244 CD163
A_19_P00320881 NR_040025 LOC100505474
A_23_P134935 NM_001394 DUSP4
A_23_P136978 NM_014467 SRPX2
A_24_P277367 NM_002994 CXCL5

Appendix I
326
(5) IL-10 module
Agilent Probe ID
RefSeq
Accession
number
Gene
SymbolAgilent Probe ID
RefSeq
Accession
number
Gene
Symbol
A_24_P59667 NM_000215 JAK3 A_23_P4662 NM_005178 BCL3
A_23_P207058 NM_003955 SOCS3 A_23_P98350 NM_001165 BIRC3
A_23_P55270 NM_002988 CCL18 A_23_P134176 NM_001024465 SOD2
A_23_P404494 NM_002185 IL7R A_33_P3329013 NM_001050 SSTR2
A_23_P38795 NM_002029 FPR1 A_23_P94552 NM_013390 TMEM2
A_23_P434809 NM_002964 S100A8 A_32_P47754 NA SLC2A14
A_32_P108254 NM_017565 FAM20A A_23_P2492 NM_001734 C1S
A_23_P63209 NM_181755 HSD11B1 A_23_P19226 NM_013352 DSE
A_23_P12082 NM_001025199 CHI3L2 A_23_P74001 NM_005621 S100A12
A_23_P62647 NM_003037 SLAMF1 A_23_P102731 NM_175839 SMOX
A_23_P33723 NM_004244 CD163 A_24_P122921 NM_138621 BCL2L11
A_23_P63390 NM_001017986 FCGR1B A_24_P261259 NM_004566 PFKFB3
A_23_P94338 NM_006209 ENPP2 A_23_P386478 NM_024873 TNIP3
A_23_P77493 NM_006086 TUBB3 A_24_P329795 NM_007021 C10orf10
A_33_P3381671 NA LOC731424 A_32_P24585 NM_001017995 SH3PXD2B
A_23_P110473 NM_004536 NAIP A_23_P55649 NM_001462 FPR2
A_23_P79518 NM_000576 IL1B A_23_P112482 NM_004925 AQP3
A_33_P3413840 NM_001205019 GK A_23_P23048 NM_002965 S100A9
A_33_P3375934 NM_005746 NAMPT A_33_P3298587 NM_014963 SBNO2
A_23_P61371 NM_198282 TMEM173 A_23_P52647 NM_006795 EHD1
A_23_P128974 NM_006399 BATF A_33_P3408918 NM_030754 SAA2
A_23_P62115 NM_003254 TIMP1 A_23_P74609 NM_015714 G0S2
A_24_P141214 NM_198194 STOM A_23_P200728 NM_000569 FCGR3A
A_23_P28485 NM_012198 GCA

Appendix I
327
(6) Zymosan/IL-10 neutralisation module
Agilent Probe ID
RefSeq
Accession
number
Gene
SymbolAgilent Probe ID
RefSeq
Accession
number
Gene
Symbol
A_23_P434809 NM_002964 S100A8 A_23_P145965 NM_003596 TPST1
A_23_P38795 NM_002029 FPR1 A_23_P127288 NM_000417 IL2RA
A_23_P74001 NM_005621 S100A12 A_33_P3338121 NM_001017402 LAMB3
A_33_P3408918 NM_030754 SAA2 A_23_P211445 NM_016733 LIMK2
A_24_P335092 NM_000331 SAA1 A_33_P3420035 NM_181489 ZNF445
A_23_P123853 NM_006274 CCL19 A_23_P72117 NM_006714 SMPDL3A
A_23_P386478 NM_024873 TNIP3 A_33_P3242543 NM_000240 MAOA
A_23_P41424 NM_022154 SLC39A8 A_23_P156687 NM_001710 CFB
A_23_P119042 NM_005601 NKG7 A_24_P141214 NM_198194 STOM
A_23_P77493 NM_006086 TUBB3 A_19_P00318323 NR_015410 LINC00340
A_23_P206920 NM_001040114 MYH11 A_33_P3352578 NM_080387 CLEC4D
A_24_P133905 NM_005064 CCL23 A_33_P3412975 NM_175875 SIX5
A_24_P59667 NM_000215 JAK3 A_33_P3413840 NM_001205019 GK
A_23_P61371 NM_198282 TMEM173 A_33_P3350074 NM_001126121 SLC25A19
A_23_P12082 NM_001025199 CHI3L2 A_24_P299685 NM_198389 PDPN
A_32_P108254 NM_017565 FAM20A A_23_P309701 NM_002828 PTPN2
A_23_P208182 NM_033130 SIGLEC10 A_23_P2492 NM_001734 C1S
A_23_P150979 NM_058173 MUCL1 A_23_P64650 NM_005726 TSFM
A_33_P3253394 NM_002287 LAIR1 A_33_P3384432 NM_001178138 TFDP2
A_23_P128974 NM_006399 BATF A_23_P256641 NM_012282 KCNE1L
A_24_P277367 NM_002994 CXCL5 A_33_P3215803 NM_001974 EMR1
A_23_P207058 NM_003955 SOCS3 A_23_P59045 NM_021052 HIST1H2AE
A_23_P127584 NM_006169 NNMT A_23_P7827 NM_001010919 FAM26F
A_33_P3421351 NA TRAF3IP3 A_24_P322474 NM_006202 PDE4A
A_33_P3358601 NM_001170820 IFITM10

Appendix I
328
(7) Type I IFN module
Agilent Probe ID
RefSeq
Accession
number
Gene
SymbolAgilent Probe ID
RefSeq
Accession
number
Gene
Symbol
A_23_P24004 NM_001547 IFIT2 A_23_P66948 NM_022751 FAM59A
A_23_P52266 NM_001548 IFIT1 A_23_P97700 NM_006472 TXNIP
A_23_P139786 NM_003733 OASL A_23_P104318 NM_019058 DDIT4
A_32_P9543 NM_145699 APOBEC3A A_24_P236251 NM_003836 DLK1
A_23_P132159 NM_017414 USP18 A_24_P23034 NM_021035 ZNFX1
A_32_P54553 XM_036729 USP41 A_23_P408285 NM_153026 PRICKLE1
A_23_P53137 NM_000559 HBG1 A_23_P116942 NM_002286 LAG3
A_23_P121106 NM_003865 HESX1 A_24_P68079 NM_014831 TRANK1
A_24_P66027 NM_004900 APOBEC3B A_24_P183664 NM_014817 TRIL
A_23_P23074 NM_006417 IFI44 A_23_P160025 NM_005531 IFI16
A_23_P150609 NM_000612 IGF2 A_23_P75220 NM_031212 SLC25A28
A_23_P127948 NM_001124 ADM A_23_P45087 NM_016220 ZNF107
A_23_P166686 NM_016201 AMOTL2 A_23_P252928 NM_005367 MAGEA12
A_23_P60146 NM_006207 PDGFRL A_23_P94338 NM_006209 ENPP2
A_23_P87879 NM_001781 CD69 A_23_P423331 NM_032536 NTNG2
A_23_P321501 NM_182908 DHRS2 A_32_P108156 NR_001458 MIR155HG
A_23_P59547 NM_001002010 NT5C3 A_23_P34628 NM_001514 GTF2B
A_23_P312851 NM_006928 PMEL A_23_P65442 NM_006084 IRF9
A_23_P6263 NM_002463 MX2 A_23_P48414 NM_003914 CCNA1
A_23_P20122 NM_024625 ZC3HAV1 A_23_P26457 NM_000517 HBA2
A_23_P66798 NM_002276 KRT19 A_24_P148717 NM_001295 CCR1
A_23_P52761 NM_002423 MMP7 A_24_P258051 NM_032844 MASTL
A_24_P277657 NM_006877 GMPR A_23_P21838 NM_033133 CNP
A_23_P29773 NM_014398 LAMP3 A_23_P256504 NM_001633 AMBP
A_23_P72737 NM_003641 IFITM1 A_23_P84596 NM_016459 MZB1
A_23_P64828 NM_002534 OAS1 A_23_P127584 NM_006169 NNMT
A_24_P42136 NM_000224 KRT18 A_23_P62227 NM_025159 CXorf21
A_23_P200001 NM_144573 NEXN A_23_P115261 NM_000029 AGT
A_23_P123672 NM_014290 TDRD7 A_23_P398566 NM_173200 NR4A3
A_23_P328740 NR_026875 NEURL3 A_23_P23266 NA BLZF1
A_23_P155514 NM_001622 AHSG A_23_P257834 NM_000477 ALB
A_32_P231617 NM_014220 TM4SF1 A_32_P120895 NM_153374 LYSMD2
A_23_P86470 NM_003956 CH25H A_32_P157945 NM_004415 DSP
A_23_P153372 NM_032855 HSH2D A_23_P61398 NM_001001852 PIM3
A_23_P154488 NM_033109 PNPT1 A_23_P118722 NM_001671 ASGR1
A_24_P7594 NM_030641 APOL6 A_23_P89755 NM_016271 RNF138
A_24_P175187 NM_017654 SAMD9 A_32_P36235 NM_004907 IER2
A_24_P261259 NM_004566 PFKFB3 A_23_P151710 NM_000956 PTGER2
A_23_P38346 NM_024119 DHX58 A_23_P252106 NM_003821 RIPK2
A_23_P304171 NM_001145642 KIAA0226 A_32_P151800 NM_207418 FAM72D
A_23_P165624 NM_007115 TNFAIP6 A_23_P111132 NM_005345 HSPA1A
A_23_P121011 NM_033027 CSRNP1 A_23_P109881 NM_002218 ITIH4
A_24_P239076 NM_020070 IGLL1 A_23_P203191 NM_000039 APOA1
A_23_P200829 NM_015326 SRGAP2 A_23_P157299 NM_001129 AEBP1
A_24_P228796 NM_021123 GAGE7 A_23_P89941 NM_001800 CDKN2D
A_23_P29922 NM_003265 TLR3 A_24_P214598 NM_152542 PPM1K
A_23_P15727 NM_021939 FKBP10 A_24_P274831 NM_153236 GIMAP7
A_24_P12435 NM_181782 NCOA7 A_24_P209455 NM_018326 GIMAP4
A_23_P59138 NM_002701 POU5F1 A_24_P896205 XR_132630 LOC645722
A_23_P215634 NM_001013398 IGFBP3 A_23_P337753 NM_138402 SP140L
A_24_P576174 NM_018403 DCP1A A_23_P254741 NM_003102 SOD3
A_23_P42718 NM_004289 NFE2L3 A_23_P374149 NM_015050 FTSJD2
A_23_P143845 NM_015508 TIPARP A_23_P37375 NM_004755 RPS6KA5
A_24_P228130 NM_001001437 CCL3L3

Appendix I
329
(8) Type II IFN module
Agilent Probe ID
RefSeq
Accession
number
Gene Symbol
A_23_P18452 NM_002416 CXCL9
A_23_P81898 NM_006398 UBD
A_32_P209960 NM_000246 CIITA
A_23_P1962 NM_004585 RARRES3
A_24_P165864 NM_014879 P2RY14
A_24_P304071 NM_001547 IFIT2
A_23_P89431 NM_002982 CCL2
A_23_P125278 NM_005409 CXCL11
A_23_P207058 NM_003955 SOCS3
A_24_P125335 NM_005408 CCL13
A_23_P63390 NM_001017986 FCGR1B
A_23_P128974 NM_006399 BATF
A_24_P416997 NM_145641 APOL3
A_24_P59667 NM_000215 JAK3
A_23_P211445 NM_016733 LIMK2
A_23_P40453 NM_001236 CBR3
A_23_P38795 NM_002029 FPR1
A_23_P55270 NM_002988 CCL18
A_24_P941167 NM_030641 APOL6
A_23_P74278 NM_001037341 PDE4B
A_23_P153320 NM_000201 ICAM1
A_32_P56249 NR_038996 LOC100131733
A_23_P141555 NM_013351 TBX21
A_24_P322353 NM_024430 PSTPIP2

Appendix I
330
(9) LPS module
Agilent Probe IDRefSeq Accession
numberGene Symbol
A_23_P253791 NM_004345 CAMP
A_23_P349966 NM_152913 TMEM130
A_23_P15727 NM_021939 FKBP10
A_23_P253602 NM_001721 BMX
A_23_P215634 NM_001013398 IGFBP3
A_23_P136683 NM_001243961 HLA-DQB1
A_24_P42136 NM_000224 KRT18
A_23_P78248 NM_015515 KRT23
A_23_P58266 NM_005980 S100P
A_24_P236251 NM_003836 DLK1
A_23_P46429 NM_001554 CYR61
A_23_P206760 NM_005143 HP
A_24_P201153 NM_201629 TJP2
A_32_P206839 NR_037631 LOC100288911
A_23_P252928 NM_005367 MAGEA12
A_24_P216361 NM_206956 PRAME
A_24_P941217 NA SGPP2
A_23_P112982 NM_018711 SVOP
A_23_P59138 NM_002701 POU5F1
A_23_P319423 NM_003740 KCNK5
A_23_P254507 NM_139211 HOPX
A_23_P166297 NM_207627 ABCG1
A_23_P85783 NM_006623 PHGDH
A_23_P212508 NM_001063 TF
A_23_P257971 NM_001353 AKR1C1
A_23_P19517 NM_002224 ITPR3
A_23_P144916 NM_005110 GFPT2
A_23_P84596 NM_016459 MZB1
A_23_P30567 NM_001882 CRHBP
A_23_P256572 NM_000324 RHAG
A_32_P526255 NM_001145717 PNPLA1
A_23_P257834 NM_000477 ALB
A_23_P112482 NM_004925 AQP3
A_23_P2920 NM_001085 SERPINA3
A_23_P138541 NM_003739 AKR1C3
A_23_P157793 NM_001216 CA9
A_32_P141682 NM_001145127 EVPLL
A_23_P146456 NM_001333 CTSL2
A_23_P69586 NM_005245 FAT1
A_23_P50919 NM_006216 SERPINE2

Appendix I
331
(10) PCSK module
Agilent Probe ID
RefSeq
Accession
number
Gene Symbol
A_23_P82868 NM_000930 PLAT
A_23_P29773 NM_014398 LAMP3
A_23_P62647 NM_003037 SLAMF1
A_23_P112026 NM_002164 IDO1
A_23_P160720 NM_018664 BATF3
A_23_P51487 NM_018284 GBP3
A_23_P135271 NM_001497 B4GALT1
A_24_P126628 NM_015257 TMEM194A
A_24_P63522 NM_002130 HMGCS1
A_23_P207367 NM_003152 STAT5A
A_23_P94754 NM_005118 TNFSF15
A_24_P911676 NM_003107 SOX4

Appendix I
332
(11) Mtb module
(12) Spn module
Agilent Probe IDRefSeq Accession
numberGene Symbol
A_24_P252945 NM_032966 CXCR5
A_24_P399230 NM_175575 WFIKKN2
A_23_P407112 NM_145263 SPATA18
A_23_P52986 NM_152718 VWCE
A_23_P206359 NM_004360 CDH1
A_23_P218807 NM_017590 ZC3H7B
A_32_P52153 NR_038453 LOC728978
A_24_P404458 NM_170678 ITGB1BP3
A_23_P126103 NM_001902 CTH
A_23_P167983 NA HIST1H2AC
A_24_P165423 NM_052960 RBP7
A_23_P309381 NM_001040874 HIST2H2AA4
A_23_P254944 NM_000853 GSTT1
A_24_P319374 NM_005814 GPA33
A_23_P16523 NM_004864 GDF15
A_23_P59045 NM_021052 HIST1H2AE
A_23_P428184 NM_021065 HIST1H2AD
A_24_P152649 NR_033748 LOC644189
A_24_P68631 NM_175065 HIST2H2AB
Agilent Probe IDRefSeq Accession
numberGene Symbol
A_23_P207456 NM_005623 CCL8
A_24_P133905 NM_005064 CCL23
A_23_P52207 NM_012342 BAMBI
A_24_P788878 NM_001007595 C2CD4B
A_23_P89431 NM_002982 CCL2
A_24_P277367 NM_002994 CXCL5
A_23_P25155 NM_020370 GPR84
A_23_P128808 NM_013345 GPR132
A_23_P78037 NM_006273 CCL7
A_24_P8371 NM_001124758 SPNS2
A_23_P25674 NM_001823 CKB
A_24_P280497 NM_001142641 FBRSL1
A_23_P329261 NM_000891 KCNJ2
A_23_P126735 NM_000572 IL10
A_23_P24004 NM_001547 IFIT2
A_23_P339818 NM_183376 ARRDC4
A_32_P9543 NM_145699 APOBEC3A
A_23_P108751 NM_001039492 FHL2

Appendix I
333
(13) T cell module
Agilent Probe ID
RefSeq
Accession
number
Gene
Symbol
A_23_P10025 NM_006159 NELL2
A_23_P103361 NM_005356 LCK
A_23_P114299 NM_001504 CXCR3
A_23_P128993 NM_033423 GZMH
A_23_P1473 NM_005041 PRF1
A_23_P161280 SPOCK2
A_23_P28334 NM_003853 IL18RAP
A_23_P302018 NM_003328 TXK
A_23_P306941 NM_153615 RGL4
A_23_P340019 NM_178844 NLRC3
A_23_P34676 NM_198053 CD247
A_23_P37685 TMEM204
A_23_P44155 NM_198196 CD96
A_23_P8297 SCML4
A_23_P8424 PVRIG
A_23_P98173 PTPRCAP
A_24_P291278 LAX1
A_24_P673968 TTC22
A_24_P854492 NR_003491 MIAT

Appendix I
334
(14) Macrophage module
Agilent Probe ID
RefSeq
Accession
number
Gene Symbol Agilent Probe ID
RefSeq
Accession
number
Gene Symbol
A_23_P140591 ABHD2 A_23_P114414 NM_001031855 LONRF3
A_23_P256205 NM_014945 ABLIM3 A_23_P112004 NM_012472 LRRC6
A_23_P21758 ADAM28 A_23_P388670 NM_000895 LTA4H
A_23_P320304 AKR7L A_23_P70688 NM_004271 LY86
A_23_P83098 NM_000689 ALDH1A1 A_23_P250379 MAN2B2
A_23_P105184 ARAP1 A_23_P212061 MME
A_24_P378202 ARL11 A_24_P184445 NM_002429 MMP19
A_23_P379864 ASRGL1 A_23_P171296 NM_002436 MPP1
A_23_P380614 NM_006045 ATP9A A_23_P148737 NM_004997 MYBPH
A_23_P104996 NM_004183 BEST1 A_23_P360240 NM_138768 MYEOV
A_23_P7325 NM_004334 BST1 A_23_P143817 NM_053025 MYLK
A_23_P76983 NM_025057 C14orf45 A_24_P339664 NM_020170 NCLN
A_23_P163467 NM_207380 C15orf52 A_23_P381431 NPL
A_23_P368484 NM_207387 C17orf76 A_23_P88381 NM_001005743 NUMB
A_23_P142055 C19orf38 A_23_P372848 NM_002558 P2RX1
A_23_P153562 NM_001736 C5AR1 A_23_P24903 NM_176072 P2RY2
A_24_P283189 CD14 A_24_P243749 NM_002612 PDK4
A_23_P33723 NM_004244 CD163 A_23_P21485 NM_017933 PID1
A_23_P209055 NM_001771 CD22 A_24_P40165 PIGT
A_23_P26771 NM_006678 CD300C A_23_P151506 NM_016445 PLEK2
A_23_P15369 NM_174892 CD300LB A_23_P6355 POM121L1P
A_24_P279307 CD300LF A_23_P103011 NM_004914 RAB36
A_23_P364437 NM_022124 CDH23 A_32_P393316 NM_001098531 RAPGEF3
A_23_P137665 NM_001276 CHI3L1 A_32_P377577 SCAF1
A_23_P105571 NM_020244 CHPT1 A_32_P74391 SIRPD
A_23_P383986 NM_015892 CHST15 A_24_P76831 SLC11A1
A_23_P128470 NM_138337 CLEC12A A_23_P325562 NM_006671 SLC1A7
A_24_P180654 CREB3L2 A_23_P388900 NM_018420 SLC22A15
A_23_P217258 CYBB A_24_P208345 NM_033102 SLC45A3
A_23_P119266 NM_001375 DNASE2 A_32_P109653 SNCA
A_23_P133506 DOK3 A_23_P7642 SPARC
A_23_P79251 NM_014600 EHD3 A_23_P121533 NM_012445 SPON2
A_23_P11764 EIF2C1 A_23_P94736 NM_175039 ST6GALNAC4
A_23_P165848 EMILIN1 A_24_P122337 NM_080737 SYTL4
A_23_P63390 NM_001017986 FCGR1B A_23_P75369 TCIRG1
A_23_P126298 FCGR3B A_23_P76402 TCTN1
A_23_P67847 NM_024572 GALNT14 A_23_P10873 NM_003263 TLR1
A_23_P8640 NM_001039966 GPER A_24_P17677 TLR6
A_23_P160226 NM_001039464 HEATR8 A_24_P728604 TMEM114
A_23_P210330 NM_014181 HSPC159 A_23_P121196 NM_024334 TMEM43
A_24_P318656 NM_000212 ITGB3 A_23_P24784 NM_003282 TNNI2
A_23_P501232 KCNAB2 A_23_P145965 NM_003596 TPST1
A_24_P346762 NM_025182 KIAA1539 A_24_P239811 NM_183008 UBXN11
A_23_P125117 KLHDC8B A_23_P201551 NM_006113 VAV3
A_23_P86283 NM_006762 LAPTM5 A_24_P337700 VNN1
A_23_P89187 NM_006148 LASP1 A_23_P217269 NM_007268 VSIG4
A_24_P348989 NM_006863 LILRA1 A_23_P105562 NM_000552 VWF
A_23_P142205 NM_006866 LILRA2 A_23_P215132 NM_014149 WDR91
A_23_P107847 LILRA5 A_23_P161156 NM_182755 ZNF438
A_32_P95147 LOC100506190 A_24_P376787 NM_032752 ZNF496

Appendix I
335
(15) DC module
Agilent Probe ID
RefSeq
Accession
number
Gene
SymbolAgilent Probe ID
RefSeq
Accession
number
Gene Symbol
A_23_P500400 NM_080284 ABCA6 A_23_P166376 GGT5
A_23_P202327 ADAM12 A_23_P167005 NM_014373 GPR160
A_23_P115011 NM_019032 ADAMTSL4 A_23_P154245 GPR35
A_23_P55373 NM_001140 ALOX15 A_24_P356601 NM_006460 HEXIM1
A_23_P86570 NM_004034 ANXA7 A_24_P354800 HLA-DOA
A_24_P31275 NM_001678 ATP1B2 A_24_P243528 HLA-DPA1
A_23_P49539 NM_001080519 BAHCC1 A_24_P288836 NR_001435 HLA-DPB2
A_24_P203056 NM_020993 BCL7A A_24_P239676 HLA-DQB1
A_23_P24097 C10orf128 A_24_P402222 HLA-DRB3
A_23_P155477 NM_016210 C3orf18 A_23_P99906 NM_199330 HOMER2
A_23_P345710 NM_152531 C3orf21 A_24_P305067 HOXB4
A_23_P58390 NM_152400 C4orf32 A_23_P126757 NM_023015 INTS3
A_24_P123516 C5orf20 A_23_P50591 NM_004823 KCNK6
A_23_P39898 CALCRL A_23_P402157 KCTD17
A_32_P4985 NM_015215 CAMTA1 A_23_P309619 NM_001145206 KIAA1671
A_23_P26965 CCL13 A_32_P226646 XR_109259 LOC100129781
A_23_P26325 NM_002987 CCL17 A_23_P145336 LOC100510687
A_24_P12065 NM_004354 CCNG2 A_23_P34452 NM_000427 LOR
A_23_P402670 NM_001763 CD1A A_23_P83857 MAOA
A_23_P351844 NM_001764 CD1B A_23_P85008 MAOB
A_23_P51767 CD1C A_23_P67042 NM_017947 MOCOS
A_23_P201160 CD1E A_23_P37205 NDRG2
A_23_P41217 NM_138806 CD200R1 A_24_P129277 NM_006092 NOD1
A_23_P70095 NM_001025158 CD74 A_23_P147711 NM_000906 NPR1
A_23_P113613 NM_022842 CDCP1 A_23_P212779 PARM1
A_23_P83976 NM_145036 CEP112 A_24_P27373 PLDN
A_23_P7212 NM_000204 CFI A_23_P150807 PPFIBP2
A_23_P86470 NM_003956 CH25H A_24_P296772 PPP1R14A
A_23_P338603 NM_001011667 CHCHD7 A_24_P162911 PRKD3
A_23_P33384 CIITA A_32_P30345 RAB30
A_23_P57784 NM_021101 CLDN1 A_23_P50946 NM_005855 RAMP1
A_23_P141508 CLEC10A A_24_P36890 NM_002885 RAP1GAP
A_24_P360993 CLEC1A A_23_P425073 NM_002898 RBMS2
A_23_P153390 NM_198492 CLEC4G A_23_P113245 RBPJ
A_23_P157795 NM_003798 CTNNAL1 A_23_P256297 RRP1B
A_32_P104000 NM_173475 DCUN1D3 A_32_P227870 SLC30A4
A_23_P20337 DPYSL2 A_23_P129433 NM_004594 SLC9A5
A_23_P54291 NM_017434 DUOX1 A_23_P156907 NM_018013 SOBP
A_24_P44453 DUOXA1 A_23_P27795 NM_021102 SPINT2
A_23_P3237 ELL3 A_23_P121061 STAC
A_23_P94338 NM_006209 ENPP2 A_24_P99046 NM_015000 STK38L
A_24_P28578 EPS15 A_23_P149529 NM_002353 TACSTD2
A_24_P205045 NM_015576 ERC2 A_23_P301372 NM_153365 TAPT1
A_24_P170983 NM_194312 ESPNL A_23_P24751 NM_173810 TTC9C
A_23_P395609 FAM110B A_23_P256445 VCPIP1
A_23_P308150 NM_152424 FAM123B A_23_P218108 WDFY2
A_23_P103765 NM_002001 FCER1A A_24_P179504 NM_144668 WDR66
A_23_P164773 NM_002002 FCER2 A_23_P211926 WNT5A
A_32_P164246 NM_033260 FOXQ1 A_23_P53588 NM_030775 WNT5B
A_23_P139418 NM_198516 GALNTL4 A_23_P210608 NM_006526 ZNF217
A_23_P146922 NM_000820 GAS6 A_23_P16652 NM_152791 ZNF555
A_23_P129144 NM_001018100 GCOM1

Appendix I
336
(16) B cell module
Agilent Probe ID
RefSeq
Accession
number
Gene
SymbolAgilent Probe ID
RefSeq
Accession
number
Gene Symbol
A_23_P251686 ADRBK2 A_23_P320739 NM_002397 MEF2C
A_23_P373464 NM_002285 AFF3 A_23_P116371 MS4A1
A_23_P110151 ARHGAP24 A_23_P140434 NM_018728 MYO5C
A_23_P10232 NM_017935 BANK1 A_23_P90130 NM_004851 NAPSA
A_23_P97394 NM_003567 BCAR3 A_23_P90125 NAPSB
A_23_P218584 BCL11A A_23_P42746 NM_000265 NCF1
A_23_P139500 NM_030762 BHLHE41 A_23_P30655 NM_004556 NFKBIE
A_23_P53763 NM_025113 C13orf18 A_23_P365614 NM_004557 NOTCH4
A_23_P152858 NM_018405 C17orf79 A_23_P53663 NM_002583 PAWR
A_23_P158470 C3orf54 A_23_P206532 NM_001031835 PHKB
A_23_P134477 NM_032350 C7orf50 A_23_P253321 NM_006228 PNOC
A_23_P422851 NM_138375 CABLES1 A_23_P408285 NM_153026 PRICKLE1
A_23_P500741 NM_005187 CBFA2T3 A_23_P130194 NM_006907 PYCR1
A_23_P113572 NM_001770 CD19 A_23_P97517 RALGPS2
A_23_P74575 CD1D A_23_P12363 NM_005012 ROR1
A_23_P351286 CD22 A_23_P169629 NM_005412 SHMT2
A_23_P107735 NM_001783 CD79A A_23_P76969 NM_015556 SIPA1L1
A_23_P70670 NM_004233 CD83 A_23_P160159 NM_003039 SLC2A5
A_23_P259189 NM_013943 CLIC4 A_23_P130735 NM_014037 SLC6A16
A_23_P214208 NM_033181 CNR1 A_23_P209962 NM_024624 SMC6
A_23_P40108 NM_001853 COL9A3 A_23_P7697 NM_003100 SNX2
A_23_P360804 NM_020939 CPNE5 A_23_P203920 NM_005086 SSPN
A_23_P14774 NM_004390 CTSH A_23_P47282 NM_021978 ST14
A_23_P3237 ELL3 A_23_P116533 SWAP70
A_23_P201211 NM_031281 FCRL5 A_23_P163697 NM_016524 SYT17
A_23_P67847 NM_024572 GALNT14 A_23_P357717 NM_021966 TCL1A
A_23_P153897 NM_052847 GNG7 A_23_P53276 NM_003920 TIMELESS
A_23_P134734 GOLSYN A_23_P33420 TLR10
A_23_P30736 NM_002120 HLA-DOB A_23_P85240 NM_016562 TLR7
A_23_P30900 HLA-DQA1 A_23_P24716 NM_017870 TMEM132A
A_23_P25194 NM_003806 HRK A_23_P91764 NM_052945 TNFRSF13C
A_23_P158817 IGHG1 A_23_P132536 NM_001042646 TRAK1
A_23_P167168 NM_144646 IGJ A_23_P168229 NM_030810 TXNDC5
A_23_P117582 NM_130469 JDP2 A_23_P132956 NM_004181 UCHL1
A_23_P366453 NM_152688 KHDRBS2 A_23_P168306 NM_003931 WASF1
A_23_P217528 NM_007250 KLF8 A_23_P134601 NM_057168 WNT16
A_23_P70688 NM_004271 LY86 A_23_P159027 NM_015461 ZNF521
A_23_P5281 LYL1 A_23_P169978 NM_020747 ZNF608

Appendix I
337
(17) NK cell module
Agilent Probe IDRefSeq Accession
numberGene Symbol
A_23_P128281 NM_007333 KLRC3
A_23_P348257 NM_014840 NUAK1
A_23_P259611 NM_016616 TXNDC3
A_23_P151046 NM_002259 KLRC1
A_23_P70359 NR_024277 NCRNA00241
A_23_P393777 NM_000953 PTGDR
A_23_P50678 NM_139355 MATK
A_23_P85453 NM_016382 CD244
A_23_P334218 NM_145647 WDR67
A_23_P1473 NM_005041 PRF1
A_23_P257895 NM_138957 MAPK1
A_23_P254507 NM_139211 HOPX
A_23_P219197 NM_134427 RGS3
A_23_P423331 NM_032536 NTNG2
A_23_P317683 NM_003274 TRAPPC10
A_23_P141394 NM_017983 WIPI1
A_23_P141429 NM_016428 ABI3
A_23_P28334 NM_003853 IL18RAP
A_23_P50799 NM_013939 OR10H2
A_23_P53081 NM_020896 OSBPL5
A_23_P152727 NM_014798 PLEKHM1
A_23_P142447 NM_012335 MYO1F
A_23_P28263 NM_021198 CTDSP1
A_23_P23443 NM_024329 EFHD2
A_23_P414913 NM_022343 GLIPR2
A_23_P121533 NM_012445 SPON2

Appendix I
338
(18) Monocyte module
Agilent Probe ID
RefSeq
Accession
number
Gene Symbol Agilent Probe ID
RefSeq
Accession
number
Gene
Symbol
A_23_P143120 NM_003183 ADAM17 A_23_P214222 NM_002356 MARCKS
A_23_P257971 NM_001353 AKR1C1 A_24_P278126 NM_002485 NBN
A_23_P259071 NM_001657 AREG A_23_P106002 NM_020529 NFKBIA
A_23_P68970 NM_014570 ARFGAP3 A_24_P214754 NR3C1
A_23_P97871 ARID5B A_24_P124624 NM_002543 OLR1
A_23_P211047 NM_206866 BACH1 A_23_P71570 OSR2
A_23_P207564 NM_002984 CCL4 A_23_P95755 PFKFB3
A_23_P138760 NM_013246 CLCF1 A_23_P61398 NM_001001852 PIM3
A_23_P7144 NM_001511 CXCL1 A_32_P89310 NM_001080475 PLEKHM3
A_24_P257416 NM_002089 CXCL2 A_23_P30254 NM_006622 PLK2
A_24_P251764 CXCL3 A_23_P90172 NM_014330 PPP1R15A
A_24_P217520 EREG A_24_P77008 PTGS2
A_24_P382661 ETS2 A_23_P121064 NM_002852 PTX3
A_32_P96000 NM_001004341 ETV3L A_23_P88849 RRAD
A_24_P4816 NM_031412 GABARAPL1 A_23_P4561 SERPINB8
A_24_P100387 GK A_23_P30687 SERPINB9
A_23_P105442 GRASP A_24_P359191 NM_003043 SLC6A6
A_23_P19619 NM_002114 HIVEP1 A_23_P131846 NM_005985 SNAI1
A_23_P86330 NM_016545 IER5 A_24_P935819 SOD2
A_23_P72096 NM_000575 IL1A A_23_P156788 NM_003764 STX11
A_23_P79518 NM_000576 IL1B A_23_P74129 TMEM50A
A_23_P71037 NM_000600 IL6 A_24_P157926 NM_006290 TNFAIP3
A_32_P87013 NM_000584 IL8 A_23_P165624 NM_007115 TNFAIP6
A_23_P80635 IRAK2 A_24_P5856 TNFSF9
A_23_P162300 NM_007199 IRAK3 A_24_P89891 NM_005658 TRAF1
A_32_P74409 NM_001145033 LOC387763 A_23_P167595 NM_003337 UBE2B
A_32_P219581 LOC440934 A_23_P215096 UBE2H
A_23_P35035 LPAR3 A_23_P371155 WTAP
A_23_P78209 NM_002359 MAFG A_23_P326160 ZC3H12A
A_23_P23947 NM_005204 MAP3K8

Appendix I
339
(19) Neutrophil module
Agilent Probe ID
RefSeq
Accession
number
Gene Symbol Agilent Probe ID
RefSeq
Accession
number
Gene
Symbol
A_23_P250294 NM_016006 ABHD5 A_23_P79398 IL1R2
A_23_P206945 ACOX1 A_23_P209995 IL1RN
A_23_P110212 NM_001995 ACSL1 A_23_P17655 KCNJ15
A_23_P127948 NM_001124 ADM A_23_P43380 KIAA1539
A_23_P106362 NM_020980 AQP9 A_23_P217447 LAMP2
A_24_P336577 NM_019099 C1orf183 A_23_P30547 NM_005565 LCP2
A_23_P259506 NM_032412 C5orf32 A_23_P163380 NM_006441 MTHFS
A_23_P130515 NM_001815 CEACAM3 A_23_P305060 NAMPT
A_23_P152234 NM_144673 CMTM2 A_23_P106463 NM_002537 OAZ2
A_23_P77401 NM_018340 CPPED1 A_24_P97342 NM_021935 PROK2
A_23_P157117 NM_182898 CREB5 A_24_P250922 NM_000963 PTGS2
A_23_P126218 CSF3R A_23_P137470 NM_020808 SIPA1L2
A_23_P7144 NM_001511 CXCL1 A_23_P29083 SLC19A1
A_23_P155057 NM_013385 CYTH4 A_23_P216004 SLC25A37
A_23_P321201 NM_015213 DENND5A A_23_P134176 NM_001024465 SOD2
A_23_P53198 NM_032564 DGAT2 A_24_P351906 STEAP4
A_23_P364580 DOCK4 A_23_P394216 TECPR2
A_23_P39925 DYSF A_23_P60306 TLR4
A_24_P154080 NM_001397 ECE1 A_23_P421423 NM_006291 TNFAIP2
A_23_P208768 NM_002000 FCAR A_23_P165624 NM_007115 TNFAIP6
A_23_P214603 NM_005803 FLOT1 A_23_P119102 NM_003370 VASP
A_23_P55649 NM_001462 FPR2 A_23_P122724 NM_004665 VNN2
A_23_P96556 GK A_23_P214935 VNN3
A_23_P61637 NM_002108 HAL

Appendix II
340
Chapter 9. Appendix II: TST study case list
Anonymised demographic and clinical data for all active TB patients recruited into
the TST study (Chapter 6) are presented in this Appendix. For the healthy volunteers,
the relevant data can be found in the original publication (Tomlinson et al., 2011).
Abbreviations used in tables: UIN, unique identification number; LDN, London;
CPT, Cape Town; M, male; F, female; LN, lymph node; LLL, left lower lobe; MDR,
multi-drug resistant; ARV, anti-retrovirals; Y, yes; N, no; CXR; chest x-ray; dx,
diagnosis; TST, tuberculin skin test; N/A, not applicable.

Appendix II
341
UIN
CP
T/
LD
NG
en
der
Ag
eE
thn
icit
yH
IV-1
sta
tus
CD
4
co
un
t
(mm
-3)
HIV
-1 v
iral
load
(lo
g1
0
co
pie
s m
l-2)
Sit
e o
f T
BT
B d
iag
no
sis
AR
Vs
TS
T/
Salin
e
Ind
ura
tio
n
(mm
)
Qu
an
tiF
ER
ON
resu
lt
A01
CP
TM
35
Bla
ck
Negative
N/A
N/A
Pulm
onary
(M
DR
)S
mear
positiv
eN
/AT
ST
12
Positiv
e
A02
CP
TM
34
White
Negative
N/A
N/A
Pulm
onary
(M
DR
)S
mear
positiv
eN
/AT
ST
15
Positiv
e
A05
CP
TM
29
Bla
ck
Negative
N/A
N/A
Pulm
onary
Gene X
pert
positiv
eN
/AT
ST
21
Positiv
e
A06
CP
TM
66
Bla
ck
Negative
N/A
N/A
Pulm
onary
Gene X
pert
positiv
eN
/AT
ST
20
Positiv
e
A07
CP
TF
40
Bla
ck
Negative
N/A
N/A
Pulm
onary
Gene X
pert
positiv
eN
/AT
ST
25
Positiv
e
A09
CP
TM
45
Bla
ck
Negative
N/A
N/A
Pulm
onary
Clin
ical dx o
n C
XR
N/A
TS
T15
Indete
rmin
ate
A10
CP
TF
27
Bla
ck
Negative
N/A
N/A
Pulm
onary
Sm
ear
positiv
eN
/AT
ST
25
Positiv
e
A11
CP
TM
30
Bla
ck
Negative
N/A
N/A
Pulm
onary
Clin
ical dx o
n C
XR
N/A
TS
T16
Positiv
e
A13
CP
TF
46
Bla
ck
Negative
N/A
N/A
Pulm
onary
Gene X
pert
positiv
eN
/AT
ST
25
Positiv
e
L01
LD
NM
71
White
Negative
N/A
N/A
Media
stinal LN
& L
LL
Data
not availa
ble
N/A
TS
T13
Not done
L02
LD
NM
25
South
Asia
nN
egative
N/A
N/A
Left
knee join
tD
ata
not availa
ble
N/A
TS
T18
Not done
L03
LD
NF
51
Som
alia
nN
egative
N/A
N/A
LN
Data
not availa
ble
N/A
TS
T25
Not done

Appendix II
342
UIN
CP
T/
LD
NG
en
der
Ag
eE
thn
icit
yH
IV-1
sta
tus
CD
4
co
un
t
(mm
-3)
HIV
-1 v
iral
load
(lo
g1
0
co
pie
s m
l-2)
Sit
e o
f T
BT
B d
iag
no
sis
AR
Vs
TS
T/
Salin
e
Ind
ura
tio
n
(mm
)
Qu
an
tiF
ER
ON
resu
lt
L04
LD
NF
66
Asia
nN
egative
N/A
N/A
LN
Data
not availa
ble
N/A
TS
T26
Not done
L05
LD
NF
44
Afr
o-C
aribbean
Negative
N/A
N/A
Abdom
inal LN
Data
not availa
ble
N/A
TS
T27
Not done
L12
LD
NM
30
Asia
nN
egative
N/A
N/A
Cerv
ical and
pulm
onary
LN
Data
not availa
ble
N/A
TS
T28
Not done
L13
LD
NM
36
South
Asia
nN
egative
N/A
N/A
Media
stinal LN
Data
not availa
ble
N/A
TS
T23
Not done
B01
CP
TM
41
Bla
ck
Positiv
e34
Not done
Pulm
onary
Culture
positiv
eN
TS
T15
Positiv
e
B02
CP
TF
31
Bla
ck
Positiv
e10
6.3
4P
ulm
onary
& u
rinary
tract
Sm
ear
positiv
eN
TS
T0
Indete
rmin
ate
B03
CP
TF
35
Bla
ck
Positiv
e48
5.1
5P
ulm
onary
Gene X
pert
positiv
eN
TS
T0
Positiv
e
B05
CP
TM
38
Bla
ck
Positiv
e36
5.8
8P
ulm
onary
Gene X
pert
positiv
eY
TS
T17
Positiv
e
B06
CP
TF
34
Bla
ck
Positiv
e31
5.5
0P
ulm
onary
Sm
ear
positiv
eN
TS
T0
Indete
rmin
ate
B07
CP
TM
44
Bla
ck
Positiv
e9
5.6
0P
ulm
onary
Culture
positiv
eN
TS
T0
Negative
B09
CP
TM
58
Bla
ck
Positiv
e15
Not done
Pulm
onary
Gene X
pert
positiv
eN
TS
T0
Indete
rmin
ate
B10
CP
TM
32
Bla
ck
Positiv
e16
5.3
9A
bdom
inal
Clin
ical dx o
n im
agin
gN
TS
T0
Positiv
e

Appendix II
343
UIN
CP
T/
LD
NG
en
de
rA
ge
Eth
nic
ity
HIV
-1
sta
tus
CD
4
co
un
t
(mm
-3)
HIV
-1 v
ira
l
loa
d (
log
10
co
pie
s m
l-2)
Sit
e o
f T
BT
B d
iag
no
sis
AR
Vs
TS
T/
Sa
lin
e
Ind
ura
tio
n
(mm
)
Qu
an
tiF
ER
ON
resu
lt
B1
1C
PT
F36
Bla
ck
Po
sitiv
e2
4.9
4D
isse
min
ate
dC
linic
al d
xN
TS
T0
Inde
term
inate
B1
3C
PT
M41
Bla
ck
Po
sitiv
e34
No
t do
ne
Pu
lmo
na
ryC
linic
al d
x o
n C
XR
NT
ST
0P
ositiv
e
C0
1C
PT
M40
Ca
pe
co
loure
dP
ositiv
e170
2.8
4P
ulm
ona
ryS
me
ar
positiv
eY
TS
T0
Po
sitiv
e
C0
3C
PT
F26
Bla
ck
Po
sitiv
e93
5.7
5P
ulm
ona
ryS
me
ar
positiv
eN
TS
T0
Ne
gative
C0
5C
PT
F36
Bla
ck
Po
sitiv
e207
No
t do
ne
Dis
se
min
ate
dS
me
ar
positiv
eN
TS
T0
Po
sitiv
e
C0
6C
PT
F64
Bla
ck
Po
sitiv
e207
6.0
2P
ulm
ona
ryG
ene
Xp
ert
po
sitiv
eN
TS
T10
Po
sitiv
e
C0
7C
PT
F45
Bla
ck
Po
sitiv
e294
1.7
0P
ulm
ona
ryG
ene
Xp
ert
po
sitiv
eY
TS
T15
Ne
gative
C0
9C
PT
M23
Bla
ck
Po
sitiv
e227
4.9
5P
ulm
ona
ryS
me
ar
positiv
eN
TS
T21
Po
sitiv
e
C1
0C
PT
F30
Bla
ck
Po
sitiv
e214
5.6
1P
ulm
ona
ryC
ultu
re p
ositiv
eY
TS
T16
Inde
term
inate
C1
1C
PT
F51
Bla
ck
Po
sitiv
e341
1.7
0P
ulm
ona
ryS
me
ar
positiv
eY
TS
T15
Po
sitiv
e
C1
3C
PT
F53
Bla
ck
Po
sitiv
e54
3.6
9P
ulm
ona
ryG
ene
Xp
ert
po
sitiv
eN
TS
T0
Inde
term
inate
C1
6C
PT
F40
Bla
ck
Po
sitiv
e138
5.5
0P
ulm
ona
ryG
ene
Xp
ert
po
sitiv
eN
TS
T24
Po
sitiv
e
D0
1C
PT
M37
Bla
ck
Po
sitiv
e25
No
t do
ne
Mili
ary
Ge
ne
Xp
ert
po
sitiv
eY
TS
T0
Inde
term
inate

Appendix II
344
UIN
CP
T/
LD
NG
en
de
rA
ge
Eth
nic
ity
HIV
-1
sta
tus
CD
4
co
un
t
(mm
-3)
HIV
-1 v
iral
loa
d (
log
10
co
pie
s m
l-2)
Sit
e o
f T
BT
B d
iag
no
sis
AR
Vs
TS
T/
Salin
e
Ind
ura
tio
n
(mm
)
Qu
an
tiF
ER
ON
resu
lt
D0
2C
PT
F35
Bla
ck
Po
sitiv
e511
4.7
3P
ulm
ona
ryG
ene X
pert
positiv
eN
TS
T17
Po
sitiv
e
D0
3C
PT
F37
Bla
ck
Po
sitiv
e279
1.8
1P
ulm
ona
ryS
mear
positiv
eY
TS
T24
Po
sitiv
e
D0
5C
PT
F50
Bla
ck
Po
sitiv
e128
5.3
1P
ulm
ona
ryS
mear
positiv
eY
TS
T21
Po
sitiv
e
D0
6C
PT
F19
Bla
ck
Po
sitiv
e507
1.7
0P
ulm
ona
ryS
mear
positiv
eY
TS
T26
Ne
gative
D0
7C
PT
M51
Bla
ck
Po
sitiv
e3
2.0
9P
ulm
ona
ryS
mear
positiv
eY
TS
T0
Inde
term
inate
D0
8C
PT
F30
Bla
ck
Po
sitiv
e46
1.6
6D
issem
inate
dG
ene X
pert
po
sitiv
eY
Sa
line
N/A
Inde
term
inate
C1
5C
PT
F34
Bla
ck
Po
sitiv
e287
2.4
6P
ulm
ona
ryC
linic
al dx o
n C
XR
NS
alin
eN
/AIn
de
term
inate
D0
4C
PT
M39
Bla
ck
Po
sitiv
e412
2.6
1P
ulm
ona
ryG
ene X
pert
positiv
eY
Salin
eN
/AP
ositiv
e
C1
2C
PT
M53
Bla
ck
Po
sitiv
e105
2.0
2P
ulm
ona
ryS
mear
positiv
eN
Salin
eN
/AP
ositiv
e
A1
2C
PT
M45
Bla
ck
Ne
gative
N/A
N/A
Pu
lmo
na
ryS
mear
positiv
eN
/AS
alin
eN
/AP
ositiv
e
A0
4C
PT
M54
Bla
ck
Ne
gative
N/A
N/A
Pu
lmo
na
ryG
ene X
pert
positiv
eN
/AS
alin
eN
/AP
ositiv
e
A0
8C
PT
F29
Ca
pe
co
loure
dN
eg
ative
N/A
N/A
Pu
lmo
na
ryS
mear
positiv
eN
/AS
alin
eN
/AP
ositiv
e
C0
4C
PT
M47
Ca
pe
co
loure
dP
ositiv
e88
1.9
4P
ulm
ona
ryC
ultu
re p
ositiv
eN
Sa
line
N/A
Po
sitiv
e

Reference List
345
Reference List
Abadi, J., Pirofski, L. a, 1999. Antibodies reactive with the cryptococcal capsular polysaccharide glucuronoxylomannan are present in sera from children with and without human immunodeficiency virus infection. J. Infect. Dis. 180, 915–919. doi:10.1086/314953
Abdool Karim, S.S., Churchyard, G.J., Karim, Q.A., Lawn, S.D., 2009. HIV infection and tuberculosis in South Africa: an urgent need to escalate the public health response. Lancet 374, 921–933. doi:10.1016/S0140-6736(09)60916-8
Abel, L., El-Baghdadi, J., Bousfiha, A.A., Casanova, J.-L., Schurr, E., 2014. Human genetics of tuberculosis: a long and winding road. Philos. Trans. R. Soc. B Biol. Sci. 369, 20130428. doi:10.1098/rstb.2013.0428
Aberdein, J.D., Cole, J., Bewley, M.A., Marriott, H.M., Dockrell, D.H., 2013. Alveolar macrophages in pulmonary host defence the unrecognized role of apoptosis as a mechanism of intracellular bacterial killing. Clin. Exp. Immunol. 174, 193–202. doi:10.1111/cei.12170
Abubakar, I., Lipman, M., Anderson, C., Davies, P., Zumla, A., 2011. Tuberculosis in the UK--time to regain control. BMJ 343, d4281–d4281. doi:10.1136/bmj.d4281
Ackermann, M., Strimmer, K., 2009. A general modular framework for gene set enrichment analysis. BMC Bioinformatics 10, 47. doi:10.1186/1471-2105-10-47
Aggarwal, B.B., 2003. Signalling pathways of the TNF superfamily: a double-edged sword. Nat. Rev. Immunol. 3, 745–756. doi:10.1038/nri1184
Aggarwal, N.R., Tsushima, K., Eto, Y., Tripathi, A., Mandke, P., Mock, J.R., Garibaldi, B.T., Singer, B.D., Sidhaye, V.K., Horton, M.R., King, L.S., D’Alessio, F.R., 2014. Immunological Priming Requires Regulatory T Cells and IL-10-Producing Macrophages To Accelerate Resolution from Severe Lung Inflammation. J. Immunol. Baltim. Md 1950. doi:10.4049/jimmunol.1400146
Aiken, C., Konner, J., Landau, N.R., Lenburg, M.E., Trono, D., 1994. Nef induces CD4 endocytosis: requirement for a critical dileucine motif in the membrane-proximal CD4 cytoplasmic domain. Cell 76, 853–864.
Ajami, B., Bennett, J.L., Krieger, C., McNagny, K.M., Rossi, F.M.V., 2011. Infiltrating monocytes trigger EAE progression, but do not contribute to the resident microglia pool. Nat. Neurosci. 14, 1142–1149. doi:10.1038/nn.2887
Akagawa, K.S., Komuro, I., Kanazawa, H., Yamazaki, T., Mochida, K., Kishi, F., 2006. Functional heterogeneity of colony-stimulating factor-induced human monocyte-derived macrophages. Respirol. Carlton Vic 11 Suppl, S32–36. doi:10.1111/j.1440-1843.2006.00805.x
Al-Muhsen, S., Casanova, J.-L., 2008. The genetic heterogeneity of mendelian susceptibility to mycobacterial diseases. J. Allergy Clin. Immunol. 122, 1043–1051; quiz 1052–1053. doi:10.1016/j.jaci.2008.10.037
Alavi-Majd, H., Khodakarim, S., Zayeri, F., Rezaei-Tavirani, M., Tabatabaei, S.M., Heydarpour-Meymeh, M., 2014. Assessment of gene set analysis methods based on microarray data. Gene 534, 383–389. doi:10.1016/j.gene.2013.08.063
Albacker, L.A., Yu, S., Bedoret, D., Lee, W.-L., Umetsu, S.E., Monahan, S., Freeman, G.J., Umetsu, D.T., DeKruyff, R.H., 2013. TIM-4, expressed by medullary macrophages, regulates respiratory tolerance by mediating phagocytosis of antigen-specific T cells. Mucosal Immunol. 6, 580–590. doi:10.1038/mi.2012.100
Ali, F., Lee, M.E., Iannelli, F., Pozzi, G., Mitchell, T.J., Read, R.C., Dockrell, D.H., 2003. Streptococcus pneumoniae-associated human macrophage apoptosis after bacterial internalization via complement and Fcgamma receptors correlates with intracellular bacterial load. J. Infect. Dis. 188, 1119–1131. doi:10.1086/378675
Alkhatib, G., Combadiere, C., Broder, C.C., Feng, Y., Kennedy, P.E., Murphy, P.M., Berger, E.A., 1996. CC CKR5: a RANTES, MIP-1alpha, MIP-1beta receptor as a fusion cofactor for macrophage-tropic HIV-1. Science 272, 1955–1958.
Allison, A.C., 1967. Cell-mediated immune responses to virus infections and virus-induced tumours. Br. Med. Bull. 23, 60–65.

Reference List
346
Alonso, S., Pethe, K., Russell, D.G., Purdy, G.E., 2007. Lysosomal killing of Mycobacterium mediated by ubiquitin-derived peptides is enhanced by autophagy. Proc. Natl. Acad. Sci. 104, 6031–6036. doi:10.1073/pnas.0700036104
Altare, F., Durandy, A., Lammas, D., Emile, J.F., Lamhamedi, S., Le Deist, F., Drysdale, P., Jouanguy, E., Döffinger, R., Bernaudin, F., Jeppsson, O., Gollob, J.A., Meinl, E., Segal, A.W., Fischer, A., Kumararatne, D., Casanova, J.L., 1998a. Impairment of mycobacterial immunity in human interleukin-12 receptor deficiency. Science 280, 1432–1435.
Altare, F., Ensser, A., Breiman, A., Reichenbach, J., Baghdadi, J.E., Fischer, A., Emile, J.F., Gaillard, J.L., Meinl, E., Casanova, J.L., 2001. Interleukin-12 receptor beta1 deficiency in a patient with abdominal tuberculosis. J. Infect. Dis. 184, 231–236. doi:10.1086/321999
Altare, F., Lammas, D., Revy, P., Jouanguy, E., Döffinger, R., Lamhamedi, S., Drysdale, P., Scheel-Toellner, D., Girdlestone, J., Darbyshire, P., Wadhwa, M., Dockrell, H., Salmon, M., Fischer, A., Durandy, A., Casanova, J.L., Kumararatne, D.S., 1998b. Inherited interleukin 12 deficiency in a child with bacille Calmette-Guérin and Salmonella enteritidis disseminated infection. J. Clin. Invest. 102, 2035–2040. doi:10.1172/JCI4950
Aman, M.J., Tretter, T., Eisenbeis, I., Bug, G., Decker, T., Aulitzky, W.E., Tilg, H., Huber, C., Peschel, C., 1996. Interferon-alpha stimulates production of interleukin-10 in activated CD4+ T cells and monocytes. Blood 87, 4731–4736.
Andersen, J.L., Planelles, V., 2005. The role of Vpr in HIV-1 pathogenesis. Curr. HIV Res. 3, 43–51.
Andersen, P., Woodworth, J.S., 2014. Tuberculosis vaccines – rethinking the current paradigm. Trends Immunol. 35, 387–395. doi:10.1016/j.it.2014.04.006
Anderson, K.L., Smith, K.A., Conners, K., McKercher, S.R., Maki, R.A., Torbett, B.E., 1998. Myeloid development is selectively disrupted in PU.1 null mice. Blood 91, 3702–3710.
Anderson, L.W., Klevjer-Anderson, P., Liggitt, H.D., 1983. Susceptibility of blood-derived monocytes and macrophages to caprine arthritis-encephalitis virus. Infect. Immun. 41, 837–840.
Anthony, R.M., Rutitzky, L.I., Urban, J.F., Stadecker, M.J., Gause, W.C., 2007. Protective immune mechanisms in helminth infection. Nat. Rev. Immunol. 7, 975–987. doi:10.1038/nri2199
Antinori, A., Larussa, D., Cingolani, A., Lorenzini, P., Bossolasco, S., Finazzi, M.G., Bongiovanni, M., Guaraldi, G., Grisetti, S., Vigo, B., Gigli, B., Mariano, A., Nogare, E.R.D., Marco, M.D., Moretti, F., Corsi, P., Abrescia, N., Rellecati, P., Castagna, A., Mussini, C., Ammassari, A., Cinque, P., Monforte, A. d’Arminio, 2004. Prevalence, Associated Factors, and Prognostic Determinants of AIDS-Related Toxoplasmic Encephalitis in the Era of Advanced Highly Active Antiretroviral Therapy. Clin. Infect. Dis. 39, 1681–1691. doi:10.1086/424877
Antonelli, L.R.V., Mahnke, Y., Hodge, J.N., Porter, B.O., Barber, D.L., DerSimonian, R., Greenwald, J.H., Roby, G., Mican, J., Sher, A., Roederer, M., Sereti, I., 2010. Elevated frequencies of highly activated CD4+ T cells in HIV+ patients developing immune reconstitution inflammatory syndrome. Blood 116, 3818–3827. doi:10.1182/blood-2010-05-285080
Antoniv, T.T., Park-Min, K.-H., Ivashkiv, L.B., 2005. Kinetics of IL-10-induced gene expression in human macrophages. Immunobiology 210, 87–95. doi:10.1016/j.imbio.2005.05.003
Arias, J.F., Nishihara, R., Bala, M., Ikuta, K., 2010. High systemic levels of interleukin-10, interleukin-22 and C-reactive protein in Indian patients are associated with low in vitro replication of HIV-1 subtype C viruses. Retrovirology 7, 15. doi:10.1186/1742-4690-7-15
Astoul, E., Edmunds, C., Cantrell, D.A., Ward, S.G., 2001. PI 3-K and T-cell activation: limitations of T-leukemic cell lines as signaling models. Trends Immunol. 22, 490–496.
Auffray, C., Fogg, D., Garfa, M., Elain, G., Join-Lambert, O., Kayal, S., Sarnacki, S., Cumano, A., Lauvau, G., Geissmann, F., 2007. Monitoring of blood vessels and tissues by a population of monocytes with patrolling behavior. Science 317, 666–670. doi:10.1126/science.1142883
Avraham-Davidi, I., Yona, S., Grunewald, M., Landsman, L., Cochain, C., Silvestre, J.S., Mizrahi, H., Faroja, M., Strauss-Ayali, D., Mack, M., Jung, S., Keshet, E., 2013. On-site education of VEGF-recruited monocytes improves their performance as angiogenic and arteriogenic accessory cells. J. Exp. Med. 210, 2611–2625. doi:10.1084/jem.20120690
Awomoyi, A.A., Marchant, A., Howson, J.M.M., McAdam, K.P.W.J., Blackwell, J.M., Newport, M.J., 2002. Interleukin-10, polymorphism in SLC11A1 (formerly NRAMP1), and susceptibility to tuberculosis. J. Infect. Dis. 186, 1808–1814. doi:10.1086/345920

Reference List
347
Azzam, R., Kedzierska, K., Leeansyah, E., Chan, H., Doischer, D., Gorry, P.R., Cunningham, A.L., Crowe, S.M., Jaworowski, A., 2006. Impaired complement-mediated phagocytosis by HIV type-1-infected human monocyte-derived macrophages involves a cAMP-dependent mechanism. AIDS Res. Hum. Retroviruses 22, 619–629. doi:10.1089/aid.2006.22.619
Baba, M., 2004. Inhibitors of HIV-1 gene expression and transcription. Curr. Top. Med. Chem. 4, 871–882.
Badley, A.D., Pilon, A.A., Landay, A., Lynch, D.H., 2000. Mechanisms of HIV-associated lymphocyte apoptosis. Blood 96, 2951–2964.
Bai, W., Liu, H., Ji, Q., Zhou, Y., Liang, L., Zheng, R., Chen, J., Liu, Z., Yang, H., Zhang, P., Kaufmann, S.H.E., Ge, B., 2014. TLR3 regulates mycobacterial RNA-induced IL-10 production through the PI3K/AKT signaling pathway. Cell. Signal. doi:10.1016/j.cellsig.2014.01.015
Bakri, Y., Sarrazin, S., Mayer, U.P., Tillmanns, S., Nerlov, C., Boned, A., Sieweke, M.H., 2005. Balance of MafB and PU.1 specifies alternative macrophage or dendritic cell fate. Blood 105, 2707–2716. doi:10.1182/blood-2004-04-1448
Balcewicz-Sablinska, M.K., Gan, H., Remold, H.G., 1999. Interleukin 10 Produced by Macrophages Inoculated with Mycobacterium avium Attenuates Mycobacteria-Induced Apoptosis by Reduction of TNF-α Activity. J. Infect. Dis. 180, 1230–1237. doi:10.1086/315011
Balcewicz-Sablinska, M.K., Keane, J., Kornfeld, H., Remold, H.G., 1998. Pathogenic Mycobacterium tuberculosis evades apoptosis of host macrophages by release of TNF-R2, resulting in inactivation of TNF-alpha. J. Immunol. Baltim. Md 1950 161, 2636–2641.
Balliet, J.W., Kolson, D.L., Eiger, G., Kim, F.M., McGann, K.A., Srinivasan, A., Collman, R., 1994. Distinct effects in primary macrophages and lymphocytes of the human immunodeficiency virus type 1 accessory genes vpr, vpu, and nef: mutational analysis of a primary HIV-1 isolate. Virology 200, 623–631. doi:10.1006/viro.1994.1225
Banerjee, A., Gugasyan, R., McMahon, M., Gerondakis, S., 2006. Diverse Toll-like receptors utilize Tpl2 to activate extracellular signal-regulated kinase (ERK) in hemopoietic cells. Proc. Natl. Acad. Sci. U. S. A. 103, 3274–3279. doi:10.1073/pnas.0511113103
Barnes, P.F., Lu, S., Abrams, J.S., Wang, E., Yamamura, M., Modlin, R.L., 1993. Cytokine production at the site of disease in human tuberculosis. Infect. Immun. 61, 3482–3489.
Barré-Sinoussi, F., Chermann, J.C., Rey, F., Nugeyre, M.T., Chamaret, S., Gruest, J., Dauguet, C., Axler-Blin, C., Vézinet-Brun, F., Rouzioux, C., Rozenbaum, W., Montagnier, L., 1983. Isolation of a T-lymphotropic retrovirus from a patient at risk for acquired immune deficiency syndrome (AIDS). Science 220, 868–871.
Barreto-de-Souza, V., Pacheco, G.J., Silva, A.R., Castro-Faria-Neto, H.C., Bozza, P.T., Saraiva, E.M., Bou-Habib, D.C., 2006. Increased Leishmania replication in HIV-1-infected macrophages is mediated by tat protein through cyclooxygenase-2 expression and prostaglandin E2 synthesis. J. Infect. Dis. 194, 846–854. doi:10.1086/506618
Beamer, G.L., Flaherty, D.K., Assogba, B.D., Stromberg, P., Gonzalez-Juarrero, M., de Waal Malefyt, R., Vesosky, B., Turner, J., 2008. Interleukin-10 promotes Mycobacterium tuberculosis disease progression in CBA/J mice. J. Immunol. Baltim. Md 1950 181, 5545–5550.
Bean, A.G., Roach, D.R., Briscoe, H., France, M.P., Korner, H., Sedgwick, J.D., Britton, W.J., 1999. Structural deficiencies in granuloma formation in TNF gene-targeted mice underlie the heightened susceptibility to aerosol Mycobacterium tuberculosis infection, which is not compensated for by lymphotoxin. J. Immunol. Baltim. Md 1950 162, 3504–3511.
Beck, J.S., Potts, R.C., Kardjito, T., Grange, J.M., 1985. T4 lymphopenia in patients with active pulmonary tuberculosis. Clin. Exp. Immunol. 60, 49–54.
Bedoret, D., Wallemacq, H., Marichal, T., Desmet, C., Quesada Calvo, F., Henry, E., Closset, R., Dewals, B., Thielen, C., Gustin, P., de Leval, L., Van Rooijen, N., Le Moine, A., Vanderplasschen, A., Cataldo, D., Drion, P.-V., Moser, M., Lekeux, P., Bureau, F., 2009. Lung interstitial macrophages alter dendritic cell functions to prevent airway allergy in mice. J. Clin. Invest. 119, 3723–3738. doi:10.1172/JCI39717
Begitt, A., Droescher, M., Meyer, T., Schmid, C.D., Baker, M., Antunes, F., Knobeloch, K.-P., Owen, M.R., Naumann, R., Decker, T., Vinkemeier, U., 2014. STAT1-cooperative DNA binding distinguishes type 1 from type 2 interferon signaling. Nat. Immunol. 15, 168–176. doi:10.1038/ni.2794

Reference List
348
Behar, S.M., Martin, C.J., Booty, M.G., Nishimura, T., Zhao, X., Gan, H.-X., Divangahi, M., Remold, H.G., 2011. Apoptosis is an innate defense function of macrophages against Mycobacterium tuberculosis. Mucosal Immunol. doi:10.1038/mi.2011.3
Belge, K.-U., Dayyani, F., Horelt, A., Siedlar, M., Frankenberger, M., Frankenberger, B., Espevik, T., Ziegler-Heitbrock, L., 2002. The proinflammatory CD14+CD16+DR++ monocytes are a major source of TNF. J. Immunol. Baltim. Md 1950 168, 3536–3542.
Bell, E.B., Sparshott, S.M., Bunce, C., 1998. CD4+ T-cell memory, CD45R subsets and the persistence of antigen—a unifying concept. Immunol. Today 19, 60–64. doi:10.1016/S0167-5699(97)01211-5
Berg, D.J., Kühn, R., Rajewsky, K., Müller, W., Menon, S., Davidson, N., Grünig, G., Rennick, D., 1995a. Interleukin-10 is a central regulator of the response to LPS in murine models of endotoxic shock and the Shwartzman reaction but not endotoxin tolerance. J. Clin. Invest. 96, 2339–2347. doi:10.1172/JCI118290
Berg, D.J., Leach, M.W., Kühn, R., Rajewsky, K., Müller, W., Davidson, N.J., Rennick, D., 1995b. Interleukin 10 but not interleukin 4 is a natural suppressant of cutaneous inflammatory responses. J. Exp. Med. 182, 99–108.
Berger, G., Durand, S., Goujon, C., Nguyen, X.-N., Cordeil, S., Darlix, J.-L., Cimarelli, A., 2011. A simple, versatile and efficient method to genetically modify human monocyte-derived dendritic cells with HIV-1-derived lentiviral vectors. Nat. Protoc. 6, 806–816. doi:10.1038/nprot.2011.327
Berlato, C., Cassatella, M.A., Kinjyo, I., Gatto, L., Yoshimura, A., Bazzoni, F., 2002. Involvement of suppressor of cytokine signaling-3 as a mediator of the inhibitory effects of IL-10 on lipopolysaccharide-induced macrophage activation. J. Immunol. Baltim. Md 1950 168, 6404–6411.
Berry, M.P.R., Blankley, S., Graham, C.M., Bloom, C.I., O’Garra, A., 2013. Systems approaches to studying the immune response in tuberculosis. Curr. Opin. Immunol. 25, 579–587. doi:10.1016/j.coi.2013.08.003
Berry, M.P.R., Graham, C.M., McNab, F.W., Xu, Z., Bloch, S.A.A., Oni, T., Wilkinson, K.A., Banchereau, R., Skinner, J., Wilkinson, R.J., Quinn, C., Blankenship, D., Dhawan, R., Cush, J.J., Mejias, A., Ramilo, O., Kon, O.M., Pascual, V., Banchereau, J., Chaussabel, D., O’Garra, A., 2010. An interferon-inducible neutrophil-driven blood transcriptional signature in human tuberculosis. Nature 466, 973–977. doi:10.1038/nature09247
Bewley, M.A., Marriott, H.M., Tulone, C., Francis, S.E., Mitchell, T.J., Read, R.C., Chain, B., Kroemer, G., Whyte, M.K.B., Dockrell, D.H., 2011. A cardinal role for cathepsin d in co-ordinating the host-mediated apoptosis of macrophages and killing of pneumococci. PLoS Pathog. 7, e1001262. doi:10.1371/journal.ppat.1001262
Beyer, M., Mallmann, M.R., Xue, J., Staratschek-Jox, A., Vorholt, D., Krebs, W., Sommer, D., Sander, J., Mertens, C., Nino-Castro, A., Schmidt, S.V., Schultze, J.L., 2012. High-resolution transcriptome of human macrophages. PloS One 7, e45466. doi:10.1371/journal.pone.0045466
Bezuidenhout, J., Roberts, T., Muller, L., van Helden, P., Walzl, G., 2009. Pleural tuberculosis in patients with early HIV infection is associated with increased TNF-alpha expression and necrosis in granulomas. PloS One 4, e4228. doi:10.1371/journal.pone.0004228
Biggs, B.A., Hewish, M., Kent, S., Hayes, K., Crowe, S.M., 1995. HIV-1 infection of human macrophages impairs phagocytosis and killing of Toxoplasma gondii. J. Immunol. 154, 6132–6139.
Bigley, V., Haniffa, M., Doulatov, S., Wang, X.-N., Dickinson, R., McGovern, N., Jardine, L., Pagan, S., Dimmick, I., Chua, I., Wallis, J., Lordan, J., Morgan, C., Kumararatne, D.S., Doffinger, R., van der Burg, M., van Dongen, J., Cant, A., Dick, J.E., Hambleton, S., Collin, M., 2011. The human syndrome of dendritic cell, monocyte, B and NK lymphoid deficiency. J. Exp. Med. 208, 227–234. doi:10.1084/jem.20101459
Bild, A., Febbo, P.G., 2005. Application of a priori established gene sets to discover biologically important differential expression in microarray data. Proc. Natl. Acad. Sci. U. S. A. 102, 15278–15279. doi:10.1073/pnas.0507477102
Bilzer, M., Roggel, F., Gerbes, A.L., 2006. Role of Kupffer cells in host defense and liver disease. Liver Int. Off. J. Int. Assoc. Study Liver 26, 1175–1186. doi:10.1111/j.1478-3231.2006.01342.x
Biondo, C., Midiri, A., Messina, L., Tomasello, F., Garufi, G., Catania, M.R., Bombaci, M., Beninati, C., Teti, G., Mancuso, G., 2005. MyD88 and TLR2, but not TLR4, are required for host defense against Cryptococcus neoformans. Eur. J. Immunol. 35, 870–878. doi:10.1002/eji.200425799

Reference List
349
Biswas, S.K., Lopez-Collazo, E., 2009. Endotoxin tolerance: new mechanisms, molecules and clinical significance. Trends Immunol. 30, 475–487. doi:10.1016/j.it.2009.07.009
Biswas, S.K., Mantovani, A., 2010. Macrophage plasticity and interaction with lymphocyte subsets: cancer as a paradigm. Nat. Immunol. 11, 889–896. doi:10.1038/ni.1937
Blacklaws, B.A., 2012. Small ruminant lentiviruses: immunopathogenesis of visna-maedi and caprine arthritis and encephalitis virus. Comp. Immunol. Microbiol. Infect. Dis. 35, 259–269. doi:10.1016/j.cimid.2011.12.003
Bloom, C.I., Graham, C.M., Berry, M.P.R., Rozakeas, F., Redford, P.S., Wang, Y., Xu, Z., Wilkinson, K.A., Wilkinson, R.J., Kendrick, Y., Devouassoux, G., Ferry, T., Miyara, M., Bouvry, D., Valeyre, D., Dominique, V., Gorochov, G., Blankenship, D., Saadatian, M., Vanhems, P., Beynon, H., Vancheeswaran, R., Wickremasinghe, M., Chaussabel, D., Banchereau, J., Pascual, V., Ho, L.-P., Lipman, M., O’Garra, A., 2013. Transcriptional blood signatures distinguish pulmonary tuberculosis, pulmonary sarcoidosis, pneumonias and lung cancers. PloS One 8, e70630. doi:10.1371/journal.pone.0070630
Bloom, C.I., Graham, C.M., Berry, M.P.R., Wilkinson, K.A., Oni, T., Rozakeas, F., Xu, Z., Rossello-Urgell, J., Chaussabel, D., Banchereau, J., Pascual, V., Lipman, M., Wilkinson, R.J., O’Garra, A., 2012. Detectable changes in the blood transcriptome are present after two weeks of antituberculosis therapy. PloS One 7, e46191. doi:10.1371/journal.pone.0046191
Bogunovic, M., Ginhoux, F., Helft, J., Shang, L., Hashimoto, D., Greter, M., Liu, K., Jakubzick, C., Ingersoll, M.A., Leboeuf, M., Stanley, E.R., Nussenzweig, M., Lira, S.A., Randolph, G.J., Merad, M., 2009. Origin of the lamina propria dendritic cell network. Immunity 31, 513–525. doi:10.1016/j.immuni.2009.08.010
Boisson-Dupuis, S., El Baghdadi, J., Parvaneh, N., Bousfiha, A., Bustamante, J., Feinberg, J., Samarina, A., Grant, A.V., Janniere, L., El Hafidi, N., Hassani, A., Nolan, D., Najib, J., Camcioglu, Y., Hatipoglu, N., Aydogmus, C., Tanir, G., Aytekin, C., Keser, M., Somer, A., Aksu, G., Kutukculer, N., Mansouri, D., Mahdaviani, A., Mamishi, S., Alcais, A., Abel, L., Casanova, J.-L., 2011. IL-12Rβ1 deficiency in two of fifty children with severe tuberculosis from Iran, Morocco, and Turkey. PloS One 6, e18524. doi:10.1371/journal.pone.0018524
Bond, E., Liang, F., Sandgren, K.J., Smed-Sörensen, A., Bergman, P., Brighenti, S., Adams, W.C., Betemariam, S.A., Rangaka, M.X., Lange, C., Wilkinson, R.J., Andersson, J., Loré, K., 2012. Plasmacytoid dendritic cells infiltrate the skin in positive tuberculin skin test indurations. J. Invest. Dermatol. 132, 114–123. doi:10.1038/jid.2011.246
Bonfield, T.L., Raychaudhuri, B., Malur, A., Abraham, S., Trapnell, B.C., Kavuru, M.S., Thomassen, M.J., 2003. PU.1 regulation of human alveolar macrophage differentiation requires granulocyte-macrophage colony-stimulating factor. Am. J. Physiol. Lung Cell. Mol. Physiol. 285, L1132–1136. doi:10.1152/ajplung.00216.2003
Boonstra, A., Rajsbaum, R., Holman, M., Marques, R., Asselin-Paturel, C., Pereira, J.P., Bates, E.E.M., Akira, S., Vieira, P., Liu, Y.-J., Trinchieri, G., O’Garra, A., 2006. Macrophages and myeloid dendritic cells, but not plasmacytoid dendritic cells, produce IL-10 in response to MyD88- and TRIF-dependent TLR signals, and TLR-independent signals. J. Immunol. Baltim. Md 1950 177, 7551–7558.
Bouhlel, M.A., Derudas, B., Rigamonti, E., Dièvart, R., Brozek, J., Haulon, S., Zawadzki, C., Jude, B., Torpier, G., Marx, N., Staels, B., Chinetti-Gbaguidi, G., 2007. PPARgamma activation primes human monocytes into alternative M2 macrophages with anti-inflammatory properties. Cell Metab. 6, 137–143. doi:10.1016/j.cmet.2007.06.010
Bour, S., Perrin, C., Akari, H., Strebel, K., 2001. The Human Immunodeficiency Virus Type 1 Vpu Protein Inhibits NF-κB Activation by Interfering with βTrCP-mediated Degradation of IκB. J. Biol. Chem. 276, 15920–15928. doi:10.1074/jbc.M010533200
Bourgarit, A., Carcelain, G., Martinez, V., Lascoux, C., Delcey, V., Gicquel, B., Vicaut, E., Lagrange, P.H., Sereni, D., Autran, B., 2006. Explosion of tuberculin-specific Th1-responses induces immune restoration syndrome in tuberculosis and HIV co-infected patients. AIDS Lond. Engl. 20, F1–7. doi:10.1097/01.aids.0000202648.18526.bf
Bourgarit, A., Carcelain, G., Samri, A., Parizot, C., Lafaurie, M., Abgrall, S., Delcey, V., Vicaut, E., Sereni, D., Autran, B., 2009. Tuberculosis-Associated Immune Restoration Syndrome in HIV-1-Infected Patients Involves Tuberculin-Specific CD4 Th1 Cells and KIR-Negative γδ T Cells. J. Immunol. 183, 3915–3923. doi:10.4049/jimmunol.0804020

Reference List
350
Brenchley, J.M., Price, D.A., Schacker, T.W., Asher, T.E., Silvestri, G., Rao, S., Kazzaz, Z., Bornstein, E., Lambotte, O., Altmann, D., Blazar, B.R., Rodriguez, B., Teixeira-Johnson, L., Landay, A., Martin, J.N., Hecht, F.M., Picker, L.J., Lederman, M.M., Deeks, S.G., Douek, D.C., 2006. Microbial translocation is a cause of systemic immune activation in chronic HIV infection. Nat Med 12, 1365–1371. doi:10.1038/nm1511
Breuer, K., Foroushani, A.K., Laird, M.R., Chen, C., Sribnaia, A., Lo, R., Winsor, G.L., Hancock, R.E.W., Brinkman, F.S.L., Lynn, D.J., 2013. InnateDB: systems biology of innate immunity and beyond--recent updates and continuing curation. Nucleic Acids Res. 41, D1228–D1233. doi:10.1093/nar/gks1147
Brightbill, H.D., Plevy, S.E., Modlin, R.L., Smale, S.T., 2000. A prominent role for Sp1 during lipopolysaccharide-mediated induction of the IL-10 promoter in macrophages. J. Immunol. Baltim. Md 1950 164, 1940–1951.
Brockman, M.A., Kwon, D.S., Tighe, D.P., Pavlik, D.F., Rosato, P.C., Sela, J., Porichis, F., Le Gall, S., Waring, M.T., Moss, K., Jessen, H., Pereyra, F., Kavanagh, D.G., Walker, B.D., Kaufmann, D.E., 2009. IL-10 is up-regulated in multiple cell types during viremic HIV infection and reversibly inhibits virus-specific T cells. Blood 114, 346–356. doi:10.1182/blood-2008-12-191296
Brooks, D.G., Trifilo, M.J., Edelmann, K.H., Teyton, L., McGavern, D.B., Oldstone, M.B.A., 2006. Interleukin-10 determines viral clearance or persistence in vivo. Nat. Med. 12, 1301–1309. doi:10.1038/nm1492
Browne, S.K., Burbelo, P.D., Chetchotisakd, P., Suputtamongkol, Y., Kiertiburanakul, S., Shaw, P.A., Kirk, J.L., Jutivorakool, K., Zaman, R., Ding, L., Hsu, A.P., Patel, S.Y., Olivier, K.N., Lulitanond, V., Mootsikapun, P., Anunnatsiri, S., Angkasekwinai, N., Sathapatayavongs, B., Hsueh, P.-R., Shieh, C.-C., Brown, M.R., Thongnoppakhun, W., Claypool, R., Sampaio, E.P., Thepthai, C., Waywa, D., Dacombe, C., Reizes, Y., Zelazny, A.M., Saleeb, P., Rosen, L.B., Mo, A., Iadarola, M., Holland, S.M., 2012. Adult-onset immunodeficiency in Thailand and Taiwan. N. Engl. J. Med. 367, 725–734. doi:10.1056/NEJMoa1111160
Bulut, Y., Michelsen, K.S., Hayrapetian, L., Naiki, Y., Spallek, R., Singh, M., Arditi, M., 2005. Mycobacterium tuberculosis heat shock proteins use diverse Toll-like receptor pathways to activate pro-inflammatory signals. J. Biol. Chem. 280, 20961–20967. doi:10.1074/jbc.M411379200
Burdette, D.L., Vance, R.E., 2013. STING and the innate immune response to nucleic acids in the cytosol. Nat. Immunol. 14, 19–26. doi:10.1038/ni.2491
Bustamante, J., Arias, A.A., Vogt, G., Picard, C., Galicia, L.B., Prando, C., Grant, A.V., Marchal, C.C., Hubeau, M., Chapgier, A., de Beaucoudrey, L., Puel, A., Feinberg, J., Valinetz, E., Jannière, L., Besse, C., Boland, A., Brisseau, J.-M., Blanche, S., Lortholary, O., Fieschi, C., Emile, J.-F., Boisson-Dupuis, S., Al-Muhsen, S., Woda, B., Newburger, P.E., Condino-Neto, A., Dinauer, M.C., Abel, L., Casanova, J.-L., 2011. Germline CYBB mutations that selectively affect macrophages in kindreds with X-linked predisposition to tuberculous mycobacterial disease. Nat. Immunol. 12, 213–221. doi:10.1038/ni.1992
Cailhier, J.F., Partolina, M., Vuthoori, S., Wu, S., Ko, K., Watson, S., Savill, J., Hughes, J., Lang, R.A., 2005. Conditional macrophage ablation demonstrates that resident macrophages initiate acute peritoneal inflammation. J. Immunol. Baltim. Md 1950 174, 2336–2342.
Cailhier, J.F., Sawatzky, D.A., Kipari, T., Houlberg, K., Walbaum, D., Watson, S., Lang, R.A., Clay, S., Kluth, D., Savill, J., Hughes, J., 2006. Resident pleural macrophages are key orchestrators of neutrophil recruitment in pleural inflammation. Am. J. Respir. Crit. Care Med. 173, 540–547. doi:10.1164/rccm.200504-538OC
Calderon, V.E., Valbuena, G., Goez, Y., Judy, B.M., Huante, M.B., Sutjita, P., Johnston, R.K., Estes, D.M., Hunter, R.L., Actor, J.K., Cirillo, J.D., Endsley, J.J., 2013. A humanized mouse model of tuberculosis. PloS One 8, e63331. doi:10.1371/journal.pone.0063331
Cantu, E., Lederer, D.J., Meyer, K., Milewski, K., Suzuki, Y., Shah, R.J., Diamond, J.M., Meyer, N.J., Tobias, J.W., Baldwin, D.A., Van Deerlin, V.M., Olthoff, K.M., Shaked, A., Christie, J.D., CTOT Investigators, 2013. Gene set enrichment analysis identifies key innate immune pathways in primary graft dysfunction after lung transplantation. Am. J. Transplant. Off. J. Am. Soc. Transplant. Am. Soc. Transpl. Surg. 13, 1898–1904. doi:10.1111/ajt.12283
Cao, Y.Z., Dieterich, D., Thomas, P.A., Huang, Y.X., Mirabile, M., Ho, D.D., 1992. Identification and quantitation of HIV-1 in the liver of patients with AIDS. AIDS Lond. Engl. 6, 65–70.
Reference List
351
Carballo, E., Lai, W.S., Blackshear, P.J., 1998. Feedback inhibition of macrophage tumor necrosis factor-alpha production by tristetraprolin. Science 281, 1001–1005.
Carey, A.J., Tan, C.K., Ulett, G.C., 2012. Infection-induced IL-10 and JAK-STAT: A review of the molecular circuitry controlling immune hyperactivity in response to pathogenic microbes. JAK-STAT 1, 159–167. doi:10.4161/jkst.19918
Carey, B., Trapnell, B.C., 2010. The molecular basis of pulmonary alveolar proteinosis. Clin. Immunol. Orlando Fla 135, 223–235. doi:10.1016/j.clim.2010.02.017
Carpenter, S., Ricci, E.P., Mercier, B.C., Moore, M.J., Fitzgerald, K.A., 2014. Post-transcriptional regulation of gene expression in innate immunity. Nat. Rev. Immunol. 14, 361–376. doi:10.1038/nri3682
Carrel, A., Ebeling, A.H., 1926. THE FUNDAMENTAL PROPERTIES OF THE FIBROBLAST AND THE MACROPHAGE : II. THE MACROPHAGE. J. Exp. Med. 44, 285–305.
Cassol, E., Alfano, M., Biswas, P., Poli, G., 2006. Monocyte-derived macrophages and myeloid cell lines as targets of HIV-1 replication and persistence. J. Leukoc. Biol. 80, 1018–1030. doi:10.1189/jlb.0306150
Celada, A., Gray, P.W., Rinderknecht, E., Schreiber, R.D., 1984. Evidence for a gamma-interferon receptor that regulates macrophage tumoricidal activity. J. Exp. Med. 160, 55–74.
Chahroudi, A., Silvestri, G., 2012. IRIS: the unfortunate rainbow of HIV. Blood 119, 2971–2972. doi:10.1182/blood-2012-01-403683
Chain, B., Bowen, H., Hammond, J., Posch, W., Rasaiyaah, J., Tsang, J., Noursadeghi, M., 2010. Error, reproducibility and sensitivity: a pipeline for data processing of Agilent oligonucleotide expression arrays. BMC Bioinformatics 11, 344. doi:10.1186/1471-2105-11-344
Chaisson, R.E., Moore, R.D., Richman, D.D., Keruly, J., Creagh, T., 1992. Incidence and natural history of Mycobacterium avium-complex infections in patients with advanced human immunodeficiency virus disease treated with zidovudine. The Zidovudine Epidemiology Study Group. Am. Rev. Respir. Dis. 146, 285–289. doi:10.1164/ajrccm/146.2.285
Chan, C.S., Ming-Lum, A., Golds, G.B., Lee, S.J., Anderson, R.J., Mui, A.L.-F., 2012. Interleukin-10 inhibits lipopolysaccharide-induced tumor necrosis factor-α translation through a SHIP1-dependent pathway. J. Biol. Chem. 287, 38020–38027. doi:10.1074/jbc.M112.348599
Chang, E.Y., Guo, B., Doyle, S.E., Cheng, G., 2007. Cutting edge: involvement of the type I IFN production and signaling pathway in lipopolysaccharide-induced IL-10 production. J. Immunol. Baltim. Md 1950 178, 6705–6709.
Chanteux, H., Guisset, A.C., Pilette, C., Sibille, Y., 2007a. LPS induces IL-10 production by human alveolar macrophages via MAPKinases- and Sp1-dependent mechanisms. Respir. Res. 8, 71. doi:10.1186/1465-9921-8-71
Chase, M.W., 1946. The cellular transfer of cutaneous hypersensitivity. J. Bacteriol. 51, 643.
Chattergoon, M.A., Latanich, R., Quinn, J., Winter, M.E., Buckheit, R.W., 3rd, Blankson, J.N., Pardoll, D., Cox, A.L., 2014. HIV and HCV Activate the Inflammasome in Monocytes and Macrophages via Endosomal Toll-Like Receptors without Induction of Type 1 Interferon. PLoS Pathog 10, e1004082. doi:10.1371/journal.ppat.1004082
Chaturvedi, S., Frame, P., Newman, S.L., 1995. Macrophages from Human Immunodeficiency Virus-Positive Persons Are Defective in Host Defense against Histoplasma Capsulatum. J. Infect. Dis. 171, 320–327. doi:10.1093/infdis/171.2.320
Chaussabel, D., Baldwin, N., 2014. Democratizing systems immunology with modular transcriptional repertoire analyses. Nat. Rev. Immunol. 14, 271–280. doi:10.1038/nri3642
Chaussabel, D., Quinn, C., Shen, J., Patel, P., Glaser, C., Baldwin, N., Stichweh, D., Blankenship, D., Li, L., Munagala, I., Bennett, L., Allantaz, F., Mejias, A., Ardura, M., Kaizer, E., Monnet, L., Allman, W., Randall, H., Johnson, D., Lanier, A., Punaro, M., Wittkowski, K.M., White, P., Fay, J., Klintmalm, G., Ramilo, O., Palucka, A.K., Banchereau, J., Pascual, V., 2008. A modular analysis framework for blood genomics studies: application to systemic lupus erythematosus. Immunity 29, 150–164. doi:10.1016/j.immuni.2008.05.012
Reference List
352
Chen, B.K., Feinberg, M.B., Baltimore, D., 1997. The kappaB sites in the human immunodeficiency virus type 1 long terminal repeat enhance virus replication yet are not absolutely required for viral growth. J. Virol. 71, 5495–5504.
Chen, G., Shaw, M.H., Kim, Y.-G., Nuñez, G., 2009. NOD-Like Receptors: Role in Innate Immunity and Inflammatory Disease. Annu. Rev. Pathol. Mech. Dis. 4, 365–398. doi:10.1146/annurev.pathol.4.110807.092239
Chen, W., Jin, W., Hardegen, N., Lei, K.-J., Li, L., Marinos, N., McGrady, G., Wahl, S.M., 2003. Conversion of peripheral CD4+CD25- naive T cells to CD4+CD25+ regulatory T cells by TGF-beta induction of transcription factor Foxp3. J. Exp. Med. 198, 1875–1886. doi:10.1084/jem.20030152
Cheng, F., Lienlaf, M., Wang, H.-W., Perez-Villarroel, P., Lee, C., Woan, K., Rock-Klotz, J., Sahakian, E., Woods, D., Pinilla-Ibarz, J., Kalin, J., Tao, J., Hancock, W., Kozikowski, A., Seto, E., Villagra, A., Sotomayor, E.M., 2014. A Novel Role for Histone Deacetylase 6 in the Regulation of the Tolerogenic STAT3/IL-10 Pathway in APCs. J. Immunol. Baltim. Md 1950. doi:10.4049/jimmunol.1302778
Cher, D.J., Mosmann, T.R., 1987. Two types of murine helper T cell clone. II. Delayed-type hypersensitivity is mediated by TH1 clones. J. Immunol. Baltim. Md 1950 138, 3688–3694.
Chi, H., Barry, S.P., Roth, R.J., Wu, J.J., Jones, E.A., Bennett, A.M., Flavell, R.A., 2006. Dynamic regulation of pro- and anti-inflammatory cytokines by MAPK phosphatase 1 (MKP-1) in innate immune responses. Proc. Natl. Acad. Sci. U. S. A. 103, 2274–2279. doi:10.1073/pnas.0510965103
Chow, A., Brown, B.D., Merad, M., 2011a. Studying the mononuclear phagocyte system in the molecular age. Nat Rev Immunol 11, 788–798. doi:10.1038/nri3087
Chow, A., Lucas, D., Hidalgo, A., Méndez-Ferrer, S., Hashimoto, D., Scheiermann, C., Battista, M., Leboeuf, M., Prophete, C., van Rooijen, N., Tanaka, M., Merad, M., Frenette, P.S., 2011b. Bone marrow CD169+ macrophages promote the retention of hematopoietic stem and progenitor cells in the mesenchymal stem cell niche. J. Exp. Med. 208, 261–271. doi:10.1084/jem.20101688
Chu, C.Q., Field, M., Andrew, E., Haskard, D., Feldmann, M., Maini, R.N., 1992. Detection of cytokines at the site of tuberculin-induced delayed-type hypersensitivity in man. Clin. Exp. Immunol. 90, 522–529.
Chung, Y., Chang, S.H., Martinez, G.J., Yang, X.O., Nurieva, R., Kang, H.S., Ma, L., Watowich, S.S., Jetten, A., Tian, Q., Dong, C., 2009. Critical regulation of early Th17 cell differentiation by IL-1 signaling. Immunity 30, 576–587. doi:10.1016/j.immuni.2009.02.007
Cliff, J.M., Lee, J.-S., Constantinou, N., Cho, J.-E., Clark, T.G., Ronacher, K., King, E.C., Lukey, P.T., Duncan, K., Van Helden, P.D., Walzl, G., Dockrell, H.M., 2013. Distinct phases of blood gene expression pattern through tuberculosis treatment reflect modulation of the humoral immune response. J. Infect. Dis. 207, 18–29. doi:10.1093/infdis/jis499
Cobelens, F.G., Egwaga, S.M., van Ginkel, T., Muwinge, H., Matee, M.I., Borgdorff, M.W., 2006. Tuberculin skin testing in patients with HIV infection: limited benefit of reduced cutoff values. Clin. Infect. Dis. Off. Publ. Infect. Dis. Soc. Am. 43, 634–639. doi:10.1086/506432
Cohen, M.S., Chen, Y.Q., McCauley, M., Gamble, T., Hosseinipour, M.C., Kumarasamy, N., Hakim, J.G., Kumwenda, J., Grinsztejn, B., Pilotto, J.H.S., Godbole, S.V., Mehendale, S., Chariyalertsak, S., Santos, B.R., Mayer, K.H., Hoffman, I.F., Eshleman, S.H., Piwowar-Manning, E., Wang, L., Makhema, J., Mills, L.A., de Bruyn, G., Sanne, I., Eron, J., Gallant, J., Havlir, D., Swindells, S., Ribaudo, H., Elharrar, V., Burns, D., Taha, T.E., Nielsen-Saines, K., Celentano, D., Essex, M., Fleming, T.R., 2011a. Prevention of HIV-1 Infection with Early Antiretroviral Therapy. N. Engl. J. Med. 365, 493–505. doi:10.1056/NEJMoa1105243
Cohen, M.S., Hellmann, N., Levy, J.A., DeCock, K., Lange, J., 2008. The spread, treatment, and prevention of HIV-1: evolution of a global pandemic. J. Clin. Invest. 118, 1244–1254. doi:10.1172/JCI34706
Cohen, M.S., Shaw, G.M., McMichael, A.J., Haynes, B.F., 2011b. Acute HIV-1 Infection. N. Engl. J. Med. 364, 1943–1954. doi:10.1056/NEJMra1011874
Colditz, G.A., Brewer, T.F., Berkey, C.S., Wilson, M.E., Burdick, E., Fineberg, H.V., Mosteller, F., 1994. Efficacy of BCG vaccine in the prevention of tuberculosis. Meta-analysis of the published literature. JAMA J. Am. Med. Assoc. 271, 698–702.

Reference List
353
Collins, K.R., Quiñones-Mateu, M.E., Toossi, Z., Arts, E.J., 2002a. Impact of tuberculosis on HIV-1 replication, diversity, and disease progression. AIDS Rev. 4, 165–176.
Collins, K.R., Quinones-Mateu, M.E., Wu, M., Luzze, H., Johnson, J.L., Hirsch, C., Toossi, Z., Arts, E.J., 2002b. Human Immunodeficiency Virus Type 1 (HIV-1) Quasispecies at the Sites of Mycobacterium tuberculosis Infection Contribute to Systemic HIV-1 Heterogeneity. J Virol 76, 1697–1706. doi:<p>10.1128/JVI.76.4.1697-1706.2002</p>
Commins, S., Steinke, J.W., Borish, L., 2008. The extended IL-10 superfamily: IL-10, IL-19, IL-20, IL-22, IL-24, IL-26, IL-28, and IL-29. J. Allergy Clin. Immunol. 121, 1108–1111. doi:10.1016/j.jaci.2008.02.026
Conradie, F., Foulkes, A.S., Ive, P., Yin, X.M., Roussos, K., Glencross, D.K., Lawrie, D., Stevens, W., Montaner, L.J.D., Sanne, I., Azzoni, L., 2011. Natural Killer Cell Activation Distinguishes Mycobacterium tuberculosis-Mediated Immune Reconstitution Syndrome From Chronic HIV and HIV/MTB Coinfection. [Miscellaneous Article]. J. Acquir. Immune Defic. Syndr. Novemb. 1 58, 309–318. doi:10.1097/QAI.0b013e31822e0d15
Conticello, S.G., Harris, R.S., Neuberger, M.S., 2003. The Vif protein of HIV triggers degradation of the human antiretroviral DNA deaminase APOBEC3G. Curr. Biol. CB 13, 2009–2013.
Cooper, A.M., Dalton, D.K., Stewart, T.A., Griffin, J.P., Russell, D.G., Orme, I.M., 1993. Disseminated tuberculosis in interferon gamma gene-disrupted mice. J. Exp. Med. 178, 2243–2247.
Corbett, E.L., Marston, B., Churchyard, G.J., De Cock, K.M., 2006. Tuberculosis in sub-Saharan Africa: opportunities, challenges, and change in the era of antiretroviral treatment. Lancet 367, 926–937. doi:10.1016/S0140-6736(06)68383-9
Corren, J., 2013. Role of interleukin-13 in asthma. Curr. Allergy Asthma Rep. 13, 415–420. doi:10.1007/s11882-013-0373-9
Couper, K.N., Blount, D.G., Riley, E.M., 2008. IL-10: the master regulator of immunity to infection. J. Immunol. Baltim. Md 1950 180, 5771–5777.
Cretney, E., Xin, A., Shi, W., Minnich, M., Masson, F., Miasari, M., Belz, G.T., Smyth, G.K., Busslinger, M., Nutt, S.L., Kallies, A., 2011. The transcription factors Blimp-1 and IRF4 jointly control the differentiation and function of effector regulatory T cells. Nat. Immunol. 12, 304–311. doi:10.1038/ni.2006
Crowe, S.M., Carlin, J.B., Stewart, K.I., Lucas, C.R., Hoy, J.F., 1991. Predictive value of CD4 lymphocyte numbers for the development of opportunistic infections and malignancies in HIV-infected persons. J. Acquir. Immune Defic. Syndr. 4, 770–776.
Crowe, S.M., Vardaxis, N.J., Kent, S.J., Maerz, A.L., Hewish, M.J., McGrath, M.S., Mills, J., 1994. HIV infection of monocyte-derived macrophages in vitro reduces phagocytosis of Candida albicans. J. Leukoc. Biol. 56, 318–327.
Crozat, K., Guiton, R., Guilliams, M., Henri, S., Baranek, T., Schwartz-Cornil, I., Malissen, B., Dalod, M., 2010. Comparative genomics as a tool to reveal functional equivalences between human and mouse dendritic cell subsets. Immunol. Rev. 234, 177–198. doi:10.1111/j.0105-2896.2009.00868.x
Curtsinger, J.M., Schmidt, C.S., Mondino, A., Lins, D.C., Kedl, R.M., Jenkins, M.K., Mescher, M.F., 1999. Inflammatory Cytokines Provide a Third Signal for Activation of Naive CD4+ and CD8+ T Cells. J. Immunol. 162, 3256–3262.
Cyktor, J.C., Turner, J., 2011. Interleukin-10 and immunity against prokaryotic and eukaryotic intracellular pathogens. Infect. Immun. 79, 2964–2973. doi:10.1128/IAI.00047-11
Dai, X.-M., Ryan, G.R., Hapel, A.J., Dominguez, M.G., Russell, R.G., Kapp, S., Sylvestre, V., Stanley, E.R., 2002. Targeted disruption of the mouse colony-stimulating factor 1 receptor gene results in osteopetrosis, mononuclear phagocyte deficiency, increased primitive progenitor cell frequencies, and reproductive defects. Blood 99, 111–120.
Dalgleish, A.G., Beverley, P.C., Clapham, P.R., Crawford, D.H., Greaves, M.F., Weiss, R.A., 1984. The CD4 (T4) antigen is an essential component of the receptor for the AIDS retrovirus. Nature 312, 763–767.
Dalton, D.K., Pitts-Meek, S., Keshav, S., Figari, I.S., Bradley, A., Stewart, T.A., 1993. Multiple defects of immune cell function in mice with disrupted interferon-gamma genes. Science 259, 1739–1742.

Reference List
354
Dannenberg, A.M., 1989. Immune mechanisms in the pathogenesis of pulmonary tuberculosis. Rev. Infect. Dis. 11 Suppl 2, S369–378.
Dannenberg, A.M., 1994. Roles of cytotoxic delayed-type hypersensitivity and macrophage-activating cell-mediated immunity in the pathogenesis of tuberculosis. Immunobiology 191, 461–473. doi:10.1016/S0171-2985(11)80452-3
Dannenberg, A.M., Meyer, O.T., Esterly, J.R., Kambara, T., 1968. The local nature of immunity in tuberculosis, illustrated histochemically in dermal BCG lesions. J. Immunol. Baltim. Md 1950 100, 931–941.
Das, A.T., Harwig, A., Berkhout, B., 2011. The HIV-1 Tat Protein Has a Versatile Role in Activating Viral Transcription. J. Virol. 85, 9506–9516. doi:10.1128/JVI.00650-11
Davies, L.C., Jenkins, S.J., Allen, J.E., Taylor, P.R., 2013. Tissue-resident macrophages. Nat. Immunol. 14, 986–995. doi:10.1038/ni.2705
Davies, L.C., Rosas, M., Smith, P.J., Fraser, D.J., Jones, S.A., Taylor, P.R., 2011. A quantifiable proliferative burst of tissue macrophages restores homeostatic macrophage populations after acute inflammation. Eur. J. Immunol. 41, 2155–2164. doi:10.1002/eji.201141817
Davis, J.M., Ramakrishnan, L., 2009. The role of the granuloma in expansion and dissemination of early tuberculous infection. Cell 136, 37–49. doi:10.1016/j.cell.2008.11.014
Dayton, A.I., Sodroski, J.G., Rosen, C.A., Goh, W.C., Haseltine, W.A., 1986. The trans-activator gene of the human T cell lymphotropic virus type III is required for replication. Cell 44, 941–947.
De Beaucoudrey, L., Samarina, A., Bustamante, J., Cobat, A., Boisson-Dupuis, S., Feinberg, J., Al-Muhsen, S., Jannière, L., Rose, Y., de Suremain, M., Kong, X.-F., Filipe-Santos, O., Chapgier, A., Picard, C., Fischer, A., Dogu, F., Ikinciogullari, A., Tanir, G., Al-Hajjar, S., Al-Jumaah, S., Frayha, H.H., AlSum, Z., Al-Ajaji, S., Alangari, A., Al-Ghonaium, A., Adimi, P., Mansouri, D., Ben-Mustapha, I., Yancoski, J., Garty, B.-Z., Rodriguez-Gallego, C., Caragol, I., Kutukculer, N., Kumararatne, D.S., Patel, S., Doffinger, R., Exley, A., Jeppsson, O., Reichenbach, J., Nadal, D., Boyko, Y., Pietrucha, B., Anderson, S., Levin, M., Schandené, L., Schepers, K., Efira, A., Mascart, F., Matsuoka, M., Sakai, T., Siegrist, C.-A., Frecerova, K., Blüetters-Sawatzki, R., Bernhöft, J., Freihorst, J., Baumann, U., Richter, D., Haerynck, F., De Baets, F., Novelli, V., Lammas, D., Vermylen, C., Tuerlinckx, D., Nieuwhof, C., Pac, M., Haas, W.H., Müller-Fleckenstein, I., Fleckenstein, B., Levy, J., Raj, R., Cohen, A.C., Lewis, D.B., Holland, S.M., Yang, K.D., Wang, X., Wang, X., Jiang, L., Yang, X., Zhu, C., Xie, Y., Lee, P.P.W., Chan, K.W., Chen, T.-X., Castro, G., Natera, I., Codoceo, A., King, A., Bezrodnik, L., Di Giovani, D., Gaillard, M.I., de Moraes-Vasconcelos, D., Grumach, A.S., da Silva Duarte, A.J., Aldana, R., Espinosa-Rosales, F.J., Bejaoui, M., Bousfiha, A.A., Baghdadi, J.E., Ozbek, N., Aksu, G., Keser, M., Somer, A., Hatipoglu, N., Aydogmus, C., Asilsoy, S., Camcioglu, Y., Gülle, S., Ozgur, T.T., Ozen, M., Oleastro, M., Bernasconi, A., Mamishi, S., Parvaneh, N., Rosenzweig, S., Barbouche, R., Pedraza, S., Lau, Y.L., Ehlayel, M.S., Fieschi, C., Abel, L., Sanal, O., Casanova, J.-L., 2010. Revisiting human IL-12Rβ1 deficiency: a survey of 141 patients from 30 countries. Medicine (Baltimore) 89, 381–402. doi:10.1097/MD.0b013e3181fdd832
De Cock, K.M., Soro, B., Coulibaly, I.M., Lucas, S.B., 1992. Tuberculosis and HIV infection in sub-Saharan Africa. JAMA J. Am. Med. Assoc. 268, 1581–1587.
De Noronha, A.L.L., Báfica, A., Nogueira, L., Barral, A., Barral-Netto, M., 2008. Lung granulomas from Mycobacterium tuberculosis/HIV-1 co-infected patients display decreased in situ TNF production. Pathol. Res. Pract. 204, 155–161. doi:10.1016/j.prp.2007.10.008
De Silva, T.I., Cotten, M., Rowland-Jones, S.L., 2008. HIV-2: the forgotten AIDS virus. Trends Microbiol. 16, 588–595. doi:10.1016/j.tim.2008.09.003
Deckert, M., Soltek, S., Geginat, G., Lütjen, S., Montesinos-Rongen, M., Hof, H., Schlüter, D., 2001. Endogenous interleukin-10 is required for prevention of a hyperinflammatory intracerebral immune response in Listeria monocytogenes meningoencephalitis. Infect. Immun. 69, 4561–4571. doi:10.1128/IAI.69.7.4561-4571.2001
Deeks, S.G., Kitchen, C.M.R., Liu, L., Guo, H., Gascon, R., Narváez, A.B., Hunt, P., Martin, J.N., Kahn, J.O., Levy, J., McGrath, M.S., Hecht, F.M., 2004. Immune activation set point during early HIV infection predicts subsequent CD4+ T-cell changes independent of viral load. Blood 104, 942–947. doi:10.1182/blood-2003-09-3333
Deeks, S.G., Tracy, R., Douek, D.C., 2013. Systemic Effects of Inflammation on Health during Chronic HIV Infection. Immunity 39, 633–645. doi:10.1016/j.immuni.2013.10.001

Reference List
355
Del Prete, G., De Carli, M., Almerigogna, F., Giudizi, M.G., Biagiotti, R., Romagnani, S., 1993. Human IL-10 is produced by both type 1 helper (Th1) and type 2 helper (Th2) T cell clones and inhibits their antigen-specific proliferation and cytokine production. J. Immunol. Baltim. Md 1950 150, 353–360.
Delfino, D., Cianci, L., Lupis, E., Celeste, A., Petrelli, M.L., Curró, F., Cusumano, V., Teti, G., 1997. Interleukin-6 production by human monocytes stimulated with Cryptococcus neoformans components. Infect. Immun. 65, 2454–2456.
Delgado, M.A., Elmaoued, R.A., Davis, A.S., Kyei, G., Deretic, V., 2008. Toll-like receptors control autophagy. EMBO J. 27, 1110–1121. doi:10.1038/emboj.2008.31
Den Haan, J.M.M., Kraal, G., 2012. Innate immune functions of macrophage subpopulations in the spleen. J. Innate Immun. 4, 437–445. doi:10.1159/000335216
Deng, H., Liu, R., Ellmeier, W., Choe, S., Unutmaz, D., Burkhart, M., Di Marzio, P., Marmon, S., Sutton, R.E., Hill, C.M., Davis, C.B., Peiper, S.C., Schall, T.J., Littman, D.R., Landau, N.R., 1996. Identification of a major co-receptor for primary isolates of HIV-1. Nature 381, 661–666. doi:10.1038/381661a0
Denning, T.L., Campbell, N.A., Song, F., Garofalo, R.P., Klimpel, G.R., Reyes, V.E., Ernst, P.B., 2000. Expression of IL-10 receptors on epithelial cells from the murine small and large intestine. Int. Immunol. 12, 133–139.
Deregibus, M.C., Cantaluppi, V., Doublier, S., Brizzi, M.F., Deambrosis, I., Albini, A., Camussi, G., 2002. HIV-1-Tat Protein Activates Phosphatidylinositol 3-Kinase/ AKT-dependent Survival Pathways in Kaposi’s Sarcoma Cells. J. Biol. Chem. 277, 25195–25202. doi:10.1074/jbc.M200921200
Derynck, R., Feng, X.-H., 1997. TGF-β receptor signaling. Biochim. Biophys. Acta BBA - Rev. Cancer 1333, F105–F150. doi:10.1016/S0304-419X(97)00017-6
Desmedt, M., Rottiers, P., Dooms, H., Fiers, W., Grooten, J., 1998. Macrophages Induce Cellular Immunity by Activating Th1 Cell Responses and Suppressing Th2 Cell Responses. J. Immunol. 160, 5300–5308.
Dhiman, R., Indramohan, M., Barnes, P.F., Nayak, R.C., Paidipally, P., Rao, L.V.M., Vankayalapati, R., 2009. IL-22 Produced by Human NK Cells Inhibits Growth of Mycobacterium tuberculosis by Enhancing Phagolysosomal Fusion. J. Immunol. 183, 6639–6645. doi:10.4049/jimmunol.0902587
Diedrich, C.R., Flynn, J.L., 2011. HIV-1/mycobacterium tuberculosis coinfection immunology: how does HIV-1 exacerbate tuberculosis? Infect. Immun. 79, 1407–1417. doi:10.1128/IAI.01126-10
Diedrich, C.R., Mattila, J.T., Klein, E., Janssen, C., Phuah, J., Sturgeon, T.J., Montelaro, R.C., Lin, P.L., Flynn, J.L., 2010. Reactivation of Latent Tuberculosis in Cynomolgus Macaques Infected with SIV Is Associated with Early Peripheral T Cell Depletion and Not Virus Load. PLoS ONE 5, e9611. doi:10.1371/journal.pone.0009611
Dinarello, C.A., 2009. Immunological and inflammatory functions of the interleukin-1 family. Annu. Rev. Immunol. 27, 519–550. doi:10.1146/annurev.immunol.021908.132612
Dinarello, C.A., 2010. IL-1: Discoveries, controversies and future directions. Eur. J. Immunol. 40, 599–606. doi:10.1002/eji.201040319
Dinu, I., Potter, J.D., Mueller, T., Liu, Q., Adewale, A.J., Jhangri, G.S., Einecke, G., Famulski, K.S., Halloran, P., Yasui, Y., 2007. Improving gene set analysis of microarray data by SAM-GS. BMC Bioinformatics 8, 242. doi:10.1186/1471-2105-8-242
Divangahi, M., Chen, M., Gan, H., Desjardins, D., Hickman, T.T., Lee, D.M., Fortune, S., Behar, S.M., Remold, H.G., 2009. Mycobacterium tuberculosis evades macrophage defenses by inhibiting plasma membrane repair. Nat. Immunol. 10, 899–906. doi:10.1038/ni.1758
Dockrell, D.H., Badley, A.D., Villacian, J.S., Heppelmann, C.J., Algeciras, A., Ziesmer, S., Yagita, H., Lynch, D.H., Roche, P.C., Leibson, P.J., Paya, C.V., 1998. The expression of Fas Ligand by macrophages and its upregulation by human immunodeficiency virus infection. J. Clin. Invest. 101, 2394–2405. doi:10.1172/JCI1171
Dockrell, D.H., Lee, M., Lynch, D.H., Read, R.C., 2001. Immune-mediated phagocytosis and killing of Streptococcus pneumoniae are associated with direct and bystander macrophage apoptosis. J. Infect. Dis. 184, 713–722. doi:10.1086/323084

Reference List
356
Dockrell, D.H., Marriott, H.M., Prince, L.R., Ridger, V.C., Ince, P.G., Hellewell, P.G., Whyte, M.K.B., 2003. Alveolar macrophage apoptosis contributes to pneumococcal clearance in a resolving model of pulmonary infection. J. Immunol. Baltim. Md 1950 171, 5380–5388.
Doitsh, G., Cavrois, M., Lassen, K.G., Zepeda, O., Yang, Z., Santiago, M.L., Hebbeler, A.M., Greene, W.C., 2010. Abortive HIV infection mediates CD4 T cell depletion and inflammation in human lymphoid tissue. Cell 143, 789–801. doi:10.1016/j.cell.2010.11.001
Doitsh, G., Galloway, N.L.K., Geng, X., Yang, Z., Monroe, K.M., Zepeda, O., Hunt, P.W., Hatano, H., Sowinski, S., Muñoz-Arias, I., Greene, W.C., 2013. Cell death by pyroptosis drives CD4 T-cell depletion in HIV-1 infection. Nature advance online publication. doi:10.1038/nature12940
Domoua, K., N’Dhatz, M., Coulibaly, G., Traore, F., Konan, J.B., Lucas, S., Beaumel, A., De Cock, K.M., Dago-Akribi, A., Yapi, A., 1995. [Autopsy findings in 70 AIDS patients who died in a department of pneumology in Ivory Coast: impact of tuberculosis]. Médecine Trop. Rev. Corps Santé Colon. 55, 252–254.
Donato, R., Cannon, B.R., Sorci, G., Riuzzi, F., Hsu, K., Weber, D.J., Geczy, C.L., 2013. Functions of S100 Proteins. Curr. Mol. Med. 13, 24–57.
Dong, C., Davis, R.J., Flavell, R.A., 2002. MAP kinases in the immune response. Annu. Rev. Immunol. 20, 55–72. doi:10.1146/annurev.immunol.20.091301.131133
Dong, C., Zhao, G., Zhong, M., Yue, Y., Wu, L., Xiong, S., 2013. RNA sequencing and transcriptomal analysis of human monocyte to macrophage differentiation. Gene 519, 279–287. doi:10.1016/j.gene.2013.02.015
Dorman, S.E., Holland, S.M., 1998. Mutation in the signal-transducing chain of the interferon-gamma receptor and susceptibility to mycobacterial infection. J. Clin. Invest. 101, 2364–2369. doi:10.1172/JCI2901
Dorman, S.E., Picard, C., Lammas, D., Heyne, K., van Dissel, J.T., Baretto, R., Rosenzweig, S.D., Newport, M., Levin, M., Roesler, J., Kumararatne, D., Casanova, J.-L., Holland, S.M., 2004. Clinical features of dominant and recessive interferon γ receptor 1 deficiencies. The Lancet 364, 2113–2121. doi:10.1016/S0140-6736(04)17552-1
Douek, D.C., McFarland, R.D., Keiser, P.H., Gage, E.A., Massey, J.M., Haynes, B.F., Polis, M.A., Haase, A.T., Feinberg, M.B., Sullivan, J.L., Jamieson, B.D., Zack, J.A., Picker, L.J., Koup, R.A., 1998. Changes in thymic function with age and during the treatment of HIV infection. Nature 396, 690–695. doi:10.1038/25374
Douek, D.C., Roederer, M., Koup, R.A., 2009. Emerging concepts in the immunopathogenesis of AIDS. Annu. Rev. Med. 60, 471–484. doi:10.1146/annurev.med.60.041807.123549
Doyle, A.G., Herbein, G., Montaner, L.J., Minty, A.J., Caput, D., Ferrara, P., Gordon, S., 1994. Interleukin-13 alters the activation state of murine macrophages in vitro: comparison with interleukin-4 and interferon-gamma. Eur. J. Immunol. 24, 1441–1445. doi:10.1002/eji.1830240630
Dranoff, G., Crawford, A.D., Sadelain, M., Ream, B., Rashid, A., Bronson, R.T., Dickersin, G.R., Bachurski, C.J., Mark, E.L., Whitsett, J.A., 1994. Involvement of granulocyte-macrophage colony-stimulating factor in pulmonary homeostasis. Science 264, 713–716.
Driessler, F., Venstrom, K., Sabat, R., Asadullah, K., Schottelius, A.J., 2004. Molecular mechanisms of interleukin-10-mediated inhibition of NF-kappaB activity: a role for p50. Clin. Exp. Immunol. 135, 64–73.
Dubé, M., Bego, M.G., Paquay, C., Cohen, É.A., 2010. Modulation of HIV-1-host interaction: role of the Vpu accessory protein. Retrovirology 7, 114. doi:10.1186/1742-4690-7-114
Duffield, J.S., Forbes, S.J., Constandinou, C.M., Clay, S., Partolina, M., Vuthoori, S., Wu, S., Lang, R., Iredale, J.P., 2005. Selective depletion of macrophages reveals distinct, opposing roles during liver injury and repair. J. Clin. Invest. 115, 56–65. doi:10.1172/JCI22675
Dumonde, D.C., 1967. The Role of the Macrophage in Delayed Hypersensitivity. Br. Med. Bull. 23, 9–14.
Dupuis, S., Dargemont, C., Fieschi, C., Thomassin, N., Rosenzweig, S., Harris, J., Holland, S.M., Schreiber, R.D., Casanova, J.L., 2001. Impairment of mycobacterial but not viral immunity by a germline human STAT1 mutation. Science 293, 300–303. doi:10.1126/science.1061154
Ebert, R.H., Florey, H.W., 1939. The Extravascular Development of the Monocyte Observed In vivo. Br. J. Exp. Pathol. 20, 342–356.

Reference List
357
Eckstein, D.A., Sherman, M.P., Penn, M.L., Chin, P.S., De Noronha, C.M., Greene, W.C., Goldsmith, M.A., 2001. HIV-1 Vpr enhances viral burden by facilitating infection of tissue macrophages but not nondividing CD4+ T cells. J. Exp. Med. 194, 1407–1419.
Edwards-Smith, C.J., Jonsson, J.R., Purdie, D.M., Bansal, A., Shorthouse, C., Powell, E.E., 1999. Interleukin-10 promoter polymorphism predicts initial response of chronic hepatitis C to interferon alfa. Hepatol. Baltim. Md 30, 526–530. doi:10.1002/hep.510300207
Eidsmo, L., Allan, R., Caminschi, I., van Rooijen, N., Heath, W.R., Carbone, F.R., 2009. Differential migration of epidermal and dermal dendritic cells during skin infection. J. Immunol. Baltim. Md 1950 182, 3165–3172. doi:10.4049/jimmunol.0802950
Ejrnaes, M., Filippi, C.M., Martinic, M.M., Ling, E.M., Togher, L.M., Crotty, S., von Herrath, M.G., 2006. Resolution of a chronic viral infection after interleukin-10 receptor blockade. J. Exp. Med. 203, 2461–2472. doi:10.1084/jem.20061462
Elcombe, S.E., Naqvi, S., Van Den Bosch, M.W.M., Mackenzie, K.F., Cianfanelli, F., Brown, G.D., Arthur, J.S.C., 2013. Dectin-1 Regulates IL-10 Production via a MSK1/2 and CREB Dependent Pathway and Promotes the Induction of Regulatory Macrophage Markers. PloS One 8, e60086. doi:10.1371/journal.pone.0060086
Elkington, P., Shiomi, T., Breen, R., Nuttall, R.K., Ugarte-Gil, C.A., Walker, N.F., Saraiva, L., Pedersen, B., Mauri, F., Lipman, M., Edwards, D.R., Robertson, B.D., D’Armiento, J., Friedland, J.S., 2011. MMP-1 drives immunopathology in human tuberculosis and transgenic mice. J. Clin. Invest. doi:10.1172/JCI45666
Elliott, A.M., Halwiindi, B., Hayes, R.J., Luo, N., Tembo, G., Machiels, L., Bem, C., Steenbergen, G., Pobee, J.O., Nunn, P.P., 1993. The impact of human immunodeficiency virus on presentation and diagnosis of tuberculosis in a cohort study in Zambia. J. Trop. Med. Hyg. 96, 1–11.
Elliott, J.H., Vohith, K., Saramony, S., Savuth, C., Dara, C., Sarim, C., Huffam, S., Oelrichs, R., Sophea, P., Saphonn, V., Kaldor, J., Cooper, D.A., Vun, M.C., French, M.A., 2009. Immunopathogenesis and Diagnosis of Tuberculosis and Tuberculosis-Associated Immune Reconstitution Inflammatory Syndrome during Early Antiretroviral Therapy. J. Infect. Dis. 200, 1736–1745. doi:10.1086/644784
Elssner, A., Carter, J.E., Yunger, T.M., Wewers, M.D., 2004. HIV-1 infection does not impair human alveolar macrophage phagocytic function unless combined with cigarette smoking. Chest 125, 1071–1076.
Eslick, J., Scatizzi, J.C., Albee, L., Bickel, E., Bradley, K., Perlman, H., 2004. IL-4 and IL-10 Inhibition of Spontaneous Monocyte Apoptosis Is Associated with Flip Upregulation. Inflammation 28, 139–145. doi:10.1023/B:IFLA.0000039560.00231.cd
Evans, D.T., Silvestri, G., 2013. Nonhuman primate models in AIDS research. [Miscellaneous Article]. Curr. Opin. HIV AIDS July 2013 8, 255–261. doi:10.1097/COH.0b013e328361cee8
Fabian, M.R., Sonenberg, N., Filipowicz, W., 2010. Regulation of mRNA Translation and Stability by microRNAs. Annu. Rev. Biochem. 79, 351–379. doi:10.1146/annurev-biochem-060308-103103
Fallah, M.P., Chelvarajan, R.L., Garvy, B., Bondada, S., 2011. Role of phosphoinositide 3-kinase-Akt signaling pathway in the age-related cytokine dysregulation in splenic macrophages stimulated via TLR-2 or TLR-4 receptors. Mech. Ageing Dev. doi:10.1016/j.mad.2011.05.003
Falvo, J.V., Ranjbar, S., Jasenosky, L.D., Goldfeld, A.E., 2011. Arc of a vicious circle: pathways activated by Mycobacterium tuberculosis that target the HIV-1 LTR. Am. J. Respir. Cell Mol. Biol. doi:10.1165/rcmb.2011-0186TR
Fauci, A.S., Mavilio, D., Kottilil, S., 2005. NK cells in HIV infection: Paradigm for protection or targets for ambush. Nat. Rev. Immunol. 5, 835–843. doi:10.1038/nri1711
Feng, Y., Broder, C.C., Kennedy, P.E., Berger, E.A., 1996. HIV-1 entry cofactor: functional cDNA cloning of a seven-transmembrane, G protein-coupled receptor. Science 272, 872–877.
Ferwerda, G., Girardin, S.E., Kullberg, B.-J., Le Bourhis, L., de Jong, D.J., Langenberg, D.M.L., van Crevel, R., Adema, G.J., Ottenhoff, T.H.M., Van der Meer, J.W.M., Netea, M.G., 2005. NOD2 and Toll-Like Receptors Are Nonredundant Recognition Systems of Mycobacterium tuberculosis. PLoS Pathog 1, e34. doi:10.1371/journal.ppat.0010034

Reference List
358
Ferwerda, G., Meyer‐Wentrup, F., Kullberg, B., Netea, M.G., Adema, G.J., 2008. Dectin‐1 synergizes with
TLR2 and TLR4 for cytokine production in human primary monocytes and macrophages. Cell. Microbiol. 10, 2058–2066. doi:10.1111/j.1462-5822.2008.01188.x
Finbloom, D.S., Winestock, K.D., 1995. IL-10 induces the tyrosine phosphorylation of tyk2 and Jak1 and the differential assembly of STAT1 alpha and STAT3 complexes in human T cells and monocytes. J. Immunol. Baltim. Md 1950 155, 1079–1090.
Finkel, T.H., Tudor-Williams, G., Banda, N.K., Cotton, M.F., Curiel, T., Monks, C., Baba, T.W., Ruprecht, R.M., Kupfer, A., 1995. Apoptosis occurs predominantly in bystander cells and not in productively infected cells of HIV- and SIV-infected lymph nodes. Nat. Med. 1, 129–134.
Fiorentino, D.F., Zlotnik, A., Mosmann, T.R., Howard, M., O’Garra, A., 1991. IL-10 inhibits cytokine production by activated macrophages. J. Immunol. Baltim. Md 1950 147, 3815–3822.
Fitzgerald-Bocarsly, P., Jacobs, E.S., 2010. Plasmacytoid dendritic cells in HIV infection: striking a delicate balance. J. Leukoc. Biol. 87, 609–620. doi:10.1189/jlb.0909635
Flannagan, R.S., Cosío, G., Grinstein, S., 2009. Antimicrobial mechanisms of phagocytes and bacterial evasion strategies. Nat. Rev. Microbiol. 7, 355–366. doi:10.1038/nrmicro2128
Flannagan, R.S., Jaumouillé, V., Grinstein, S., 2012. The cell biology of phagocytosis. Annu. Rev. Pathol. 7, 61–98. doi:10.1146/annurev-pathol-011811-132445
Flexner, C., 1998. HIV-protease inhibitors. N. Engl. J. Med. 338, 1281–1292. doi:10.1056/NEJM199804303381808
Flynn, J.L., 2006. Lessons from experimental Mycobacterium tuberculosis infections. Microbes Infect. Inst. Pasteur 8, 1179–1188. doi:10.1016/j.micinf.2005.10.033
Flynn, J.L., Chan, J., Triebold, K.J., Dalton, D.K., Stewart, T.A., Bloom, B.R., 1993. An essential role for interferon gamma in resistance to Mycobacterium tuberculosis infection. J. Exp. Med. 178, 2249–2254.
Foey, A.D., Feldmann, M., Brennan, F.M., 2001. CD40 ligation induces macrophage IL-10 and TNF-alpha production: differential use of the PI3K and p42/44 MAPK-pathways. Cytokine 16, 131–142. doi:10.1006/cyto.2001.0954
Fogg, D.K., Sibon, C., Miled, C., Jung, S., Aucouturier, P., Littman, D.R., Cumano, A., Geissmann, F., 2006. A clonogenic bone marrow progenitor specific for macrophages and dendritic cells. Science 311, 83–87. doi:10.1126/science.1117729
Forsman, A., Weiss, R.A., 2008. Why is HIV a pathogen? Trends Microbiol., 25 Years of HIV 16, 555–560. doi:10.1016/j.tim.2008.09.004
Fowles, R.E., Fajardo, I.M., Leibowitch, J.L., David, J.R., 1973. The enhancement of macrophage bacteriostasis by products of activated lymphocytes. J. Exp. Med. 138, 952–964.
François, F., Klotman, M.E., 2003. Phosphatidylinositol 3-Kinase Regulates Human Immunodeficiency Virus Type 1 Replication following Viral Entry in Primary CD4+ T Lymphocytes and Macrophages. J. Virol. 77, 2539–2549. doi:10.1128/JVI.77.4.2539-2549.2003
Fremond, C.M., Togbe, D., Doz, E., Rose, S., Vasseur, V., Maillet, I., Jacobs, M., Ryffel, B., Quesniaux, V.F.J., 2007. IL-1 receptor-mediated signal is an essential component of MyD88-dependent innate response to Mycobacterium tuberculosis infection. J. Immunol. Baltim. Md 1950 179, 1178–1189.
Fullmer, M.A., Shen, J.Y., Modlin, R.L., Rea, T.H., 1987. Immunohistological evidence of lymphokine production and lymphocyte activation antigens in tuberculin reactions. Clin. Exp. Immunol. 67, 383–390.
Gaba, A., Grivennikov, S.I., Do, M.V., Stumpo, D.J., Blackshear, P.J., Karin, M., 2012. Cutting Edge: IL-10–Mediated Tristetraprolin Induction Is Part of a Feedback Loop That Controls Macrophage STAT3 Activation and Cytokine Production. J. Immunol. 189, 2089–2093. doi:10.4049/jimmunol.1201126
Gallagher, P., Lowe, G., Fitzgerald, T., Bella, A., Greene, C., McElvaney, N., O’Neill, S., 2003. Association of IL-10 polymorphism with severity of illness in community acquired pneumonia. Thorax 58, 154–156. doi:10.1136/thorax.58.2.154

Reference List
359
Gallegos, A.M., van Heijst, J.W.J., Samstein, M., Su, X., Pamer, E.G., Glickman, M.S., 2011. A gamma interferon independent mechanism of CD4 T cell mediated control of M. tuberculosis infection in vivo. PLoS Pathog. 7, e1002052. doi:10.1371/journal.ppat.1002052
Gan, H., Lee, J., Ren, F., Chen, M., Kornfeld, H., Remold, H.G., 2008. Mycobacterium tuberculosis blocks crosslinking of annexin-1 and apoptotic envelope formation on infected macrophages to maintain virulence. Nat. Immunol. 9, 1189–1197. doi:10.1038/ni.1654
Gantner, B.N., Simmons, R.M., Canavera, S.J., Akira, S., Underhill, D.M., 2003. Collaborative induction of inflammatory responses by dectin-1 and Toll-like receptor 2. J. Exp. Med. 197, 1107–1117. doi:10.1084/jem.20021787
Gao, D., Wu, J., Wu, Y.-T., Du, F., Aroh, C., Yan, N., Sun, L., Chen, Z.J., 2013. Cyclic GMP-AMP Synthase Is an Innate Immune Sensor of HIV and Other Retroviruses. Science 341, 903–906. doi:10.1126/science.1240933
Gao, F., Bailes, E., Robertson, D.L., Chen, Y., Rodenburg, C.M., Michael, S.F., Cummins, L.B., Arthur, L.O., Peeters, M., Shaw, G.M., Sharp, P.M., Hahn, B.H., 1999. Origin of HIV-1 in the chimpanzee Pan troglodytes troglodytes. Nature 397, 436–441. doi:10.1038/17130
Gao, F., Yue, L., White, A.T., Pappas, P.G., Barchue, J., Hanson, A.P., Greene, B.M., Sharp, P.M., Shaw, G.M., Hahn, B.H., 1992. Human infection by genetically diverse SIVSM-related HIV-2 in west Africa. Nature 358, 495–499. doi:10.1038/358495a0
Gao, Y., Nish, S.A., Jiang, R., Hou, L., Licona-Limón, P., Weinstein, J.S., Zhao, H., Medzhitov, R., 2013. Control of T helper 2 responses by transcription factor IRF4-dependent dendritic cells. Immunity 39, 722–732. doi:10.1016/j.immuni.2013.08.028
Garrait, V., Cadranel, J., Esvant, H., Herry, I., Morinet, P., Mayaud, C., Israël-Biet, D., 1997. Tuberculosis generates a microenvironment enhancing the productive infection of local lymphocytes by HIV. J. Immunol. Baltim. Md 1950 159, 2824–2830.
Gartner, S., Markovits, P., Markovitz, D.M., Betts, R.F., Popovic, M., 1986a. Virus isolation from and identification of HTLV-III/LAV-producing cells in brain tissue from a patient with AIDS. JAMA J. Am. Med. Assoc. 256, 2365–2371.
Gartner, S., Markovits, P., Markovitz, D.M., Kaplan, M.H., Gallo, R.C., Popovic, M., 1986b. The role of mononuclear phagocytes in HTLV-III/LAV infection. Science 233, 215–219.
Gautier, E.L., Shay, T., Miller, J., Greter, M., Jakubzick, C., Ivanov, S., Helft, J., Chow, A., Elpek, K.G., Gordonov, S., Mazloom, A.R., Ma’ayan, A., Chua, W.-J., Hansen, T.H., Turley, S.J., Merad, M., Randolph, G.J., Immunological Genome Consortium, 2012. Gene-expression profiles and transcriptional regulatory pathways that underlie the identity and diversity of mouse tissue macrophages. Nat. Immunol. 13, 1118–1128. doi:10.1038/ni.2419
Gazzinelli, R.T., Wysocka, M., Hieny, S., Scharton-Kersten, T., Cheever, A., Kühn, R., Müller, W., Trinchieri, G., Sher, A., 1996. In the absence of endogenous IL-10, mice acutely infected with Toxoplasma gondii succumb to a lethal immune response dependent on CD4+ T cells and accompanied by overproduction of IL-12, IFN-gamma and TNF-alpha. J. Immunol. 157, 798–805.
Geissmann, F., Jung, S., Littman, D.R., 2003. Blood monocytes consist of two principal subsets with distinct migratory properties. Immunity 19, 71–82.
Geissmann, F., Manz, M.G., Jung, S., Sieweke, M.H., Merad, M., Ley, K., 2010. Development of monocytes, macrophages, and dendritic cells. Science 327, 656–661. doi:10.1126/science.1178331
Geldmacher, C., Ngwenyama, N., Schuetz, A., Petrovas, C., Reither, K., Heeregrave, E.J., Casazza, J.P., Ambrozak, D.R., Louder, M., Ampofo, W., Pollakis, G., Hill, B., Sanga, E., Saathoff, E., Maboko, L., Roederer, M., Paxton, W.A., Hoelscher, M., Koup, R.A., 2010. Preferential infection and depletion of Mycobacterium tuberculosis-specific CD4 T cells after HIV-1 infection. J. Exp. Med. 207, 2869–2881. doi:10.1084/jem.20100090
Geldmacher, C., Zumla, A., Hoelscher, M., 2012. Interaction between HIV and Mycobacterium tuberculosis: HIV-1-induced CD4 T-cell depletion and the development of active tuberculosis. Curr. Opin. HIV AIDS 7, 268–275. doi:10.1097/COH.0b013e3283524e32
Gell, P.G.H., 1967. Delayed Hypersensitivity: Specific Cell-Mediated Immunity. Br. Med. Bull. 23, 1–2.

Reference List
360
Gendelman, H.E., Orenstein, J.M., Baca, L.M., Weiser, B., Burger, H., Kalter, D.C., Meltzer, M.S., 1989. The macrophage in the persistence and pathogenesis of HIV infection. AIDS Lond. Engl. 3, 475–495.
Geng, Y., Shane, R.B., Berencsi, K., Gonczol, E., Zaki, M.H., Margolis, D.J., Trinchieri, G., Rook, A.H., 2000. Chlamydiapneumoniae Inhibits Apoptosis in Human Peripheral Blood Mononuclear Cells Through Induction of IL-10. J. Immunol. 164, 5522–5529. doi:10.4049/jimmunol.164.10.5522
Germain, R.N., Meier-Schellersheim, M., Nita-Lazar, A., Fraser, I.D.C., 2011. Systems Biology in Immunology - A Computational Modeling Perspective. Annu. Rev. Immunol. 29, 527–585. doi:10.1146/annurev-immunol-030409-101317
Gerszten, R.E., Garcia-Zepeda, E.A., Lim, Y.-C., Yoshida, M., Ding, H.A., Gimbrone, M.A., Luster, A.D., Luscinskas, F.W., Rosenzweig, A., 1999. MCP-1 and IL-8 trigger firm adhesion of monocytes to vascular endothelium under flow conditions. Nature 398, 718–723. doi:10.1038/19546
Geurtsen, J., Chedammi, S., Mesters, J., Cot, M., Driessen, N.N., Sambou, T., Kakutani, R., Ummels, R., Maaskant, J., Takata, H., Baba, O., Terashima, T., Bovin, N., Vandenbroucke-Grauls, C.M.J.E., Nigou, J., Puzo, G., Lemassu, A., Daffé, M., Appelmelk, B.J., 2009. Identification of mycobacterial alpha-glucan as a novel ligand for DC-SIGN: involvement of mycobacterial capsular polysaccharides in host immune modulation. J. Immunol. Baltim. Md 1950 183, 5221–5231. doi:10.4049/jimmunol.0900768
Ghisletti, S., Barozzi, I., Mietton, F., Polletti, S., De Santa, F., Venturini, E., Gregory, L., Lonie, L., Chew, A., Wei, C.-L., Ragoussis, J., Natoli, G., 2010. Identification and characterization of enhancers controlling the inflammatory gene expression program in macrophages. Immunity 32, 317–328. doi:10.1016/j.immuni.2010.02.008
Gibbs, J.H., Ferguson, J., Brown, R.A., Kenicer, K.J., Potts, R.C., Coghill, G., Swanson Beck, J., 1984. Histometric study of the localisation of lymphocyte subsets and accessory cells in human Mantoux reactions. J. Clin. Pathol. 37, 1227–1234.
Gilbert, P.B., McKeague, I.W., Eisen, G., Mullins, C., Guéye-NDiaye, A., Mboup, S., Kanki, P.J., 2003. Comparison of HIV-1 and HIV-2 infectivity from a prospective cohort study in Senegal. Stat. Med. 22, 573–593. doi:10.1002/sim.1342
Gilks, C.F., Brindle, R.J., Otieno, L.S., Bhatt, S.M., Newnham, R.S., Simani, P.M., Lule, G.N., Okelo, G.B., Watkins, W.M., Waiyaki, P.G., 1990. Extrapulmonary and disseminated tuberculosis in HIV-1-seropositive patients presenting to the acute medical services in Nairobi. AIDS Lond. Engl. 4, 981–985.
Gilleron, M., Quesniaux, V.F.J., Puzo, G., 2003. Acylation State of the Phosphatidylinositol Hexamannosides from Mycobacterium bovis Bacillus Calmette Guérin and Mycobacterium tuberculosis H37Rv and Its Implication in Toll-like Receptor Response. J. Biol. Chem. 278, 29880–29889. doi:10.1074/jbc.M303446200
Ginhoux, F., Greter, M., Leboeuf, M., Nandi, S., See, P., Gokhan, S., Mehler, M.F., Conway, S.J., Ng, L.G., Stanley, E.R., Samokhvalov, I.M., Merad, M., 2010. Fate mapping analysis reveals that adult microglia derive from primitive macrophages. Science 330, 841–845. doi:10.1126/science.1194637
Ginhoux, F., Jung, S., 2014. Monocytes and macrophages: developmental pathways and tissue homeostasis. Nat. Rev. Immunol. 14, 392–404. doi:10.1038/nri3671
Glazko, G.V., Emmert-Streib, F., 2009. Unite and conquer: univariate and multivariate approaches for finding differentially expressed gene sets. Bioinformatics 25, 2348–2354. doi:10.1093/bioinformatics/btp406
Glocker, E.-O., Kotlarz, D., Boztug, K., Gertz, E.M., Schäffer, A.A., Noyan, F., Perro, M., Diestelhorst, J., Allroth, A., Murugan, D., Hätscher, N., Pfeifer, D., Sykora, K.-W., Sauer, M., Kreipe, H., Lacher, M., Nustede, R., Woellner, C., Baumann, U., Salzer, U., Koletzko, S., Shah, N., Segal, A.W., Sauerbrey, A., Buderus, S., Snapper, S.B., Grimbacher, B., Klein, C., 2009. Inflammatory bowel disease and mutations affecting the interleukin-10 receptor. N. Engl. J. Med. 361, 2033–2045. doi:10.1056/NEJMoa0907206
Go, N.F., Castle, B.E., Barrett, R., Kastelein, R., Dang, W., Mosmann, T.R., Moore, K.W., Howard, M., 1990. Interleukin 10, a novel B cell stimulatory factor: unresponsiveness of X chromosome-linked immunodeficiency B cells. J. Exp. Med. 172, 1625–1631.

Reference List
361
Goldman, D.L., Khine, H., Abadi, J., Lindenberg, D.J., Pirofski La, Niang, R., Casadevall, A., 2001. Serologic evidence for Cryptococcus neoformans infection in early childhood. Pediatrics 107, E66.
Goletti, D., Carrara, S., Vincenti, D., Giacomini, E., Fattorini, L., Garbuglia, A.R., Capobianchi, M.R., Alonzi, T., Fimia, G.M., Federico, M., Poli, G., Coccia, E., 2004. Inhibition of HIV-1 replication in monocyte-derived macrophages by Mycobacterium tuberculosis. J. Infect. Dis. 189, 624–633. doi:10.1086/381554
Gong, J.H., Zhang, M., Modlin, R.L., Linsley, P.S., Iyer, D., Lin, Y., Barnes, P.F., 1996. Interleukin-10 downregulates Mycobacterium tuberculosis-induced Th1 responses and CTLA-4 expression. Infect. Immun. 64, 913–918.
Gonzalez-Lombana, C., Gimblet, C., Bacellar, O., Oliveira, W.W., Passos, S., Carvalho, L.P., Goldschmidt, M., Carvalho, E.M., Scott, P., 2013. IL-17 Mediates Immunopathology in the Absence of IL-10 Following Leishmania major Infection. PLoS Pathog 9, e1003243. doi:10.1371/journal.ppat.1003243
González-Navajas, J.M., Lee, J., David, M., Raz, E., 2012. Immunomodulatory functions of type I interferons. Nat. Rev. Immunol. doi:10.1038/nri3133
Gonzalo, J.-A., Qiu, Y., Lora, J.M., Al-Garawi, A., Villeval, J.-L., Boyce, J.A., Martinez-A, C., Marquez, G., Goya, I., Hamid, Q., Fraser, C.C., Picarella, D., Cote-Sierra, J., Hodge, M.R., Gutierrez-Ramos, J.-C., Kolbeck, R., Coyle, A.J., 2007. Coordinated involvement of mast cells and T cells in allergic mucosal inflammation: critical role of the CC chemokine ligand 1:CCR8 axis. J. Immunol. Baltim. Md 1950 179, 1740–1750.
Gordon, M.A., Gordon, S.B., Musaya, L., Zijlstra, E.E., Molyneux, M.E., Read, R.C., 2007. Primary macrophages from HIV-infected adults show dysregulated cytokine responses to Salmonella, but normal internalization and killing. AIDS Lond. Engl. 21, 2399–2408. doi:10.1097/QAD.0b013e3282f25107
Gordon, S., 2008. Elie Metchnikoff: father of natural immunity. Eur. J. Immunol. 38, 3257–3264. doi:10.1002/eji.200838855
Gordon, S.B., Jarman, E.R., Kanyanda, S., French, N., Pridmore, A.C., Zijlstra, E.E., Molyneux, M.E., Read, R.C., 2005. Reduced interleukin-8 response to Streptococcus pneumoniae by alveolar macrophages from adults with HIV/AIDS. AIDS Lond. Engl. 19, 1197–1200.
Gordon, S.B., Molyneux, M.E., Boeree, M.J., Kanyanda, S., Chaponda, M., Squire, S.B., Read, R.C., 2001. Opsonic phagocytosis of Streptococcus pneumoniae by alveolar macrophages is not impaired in human immunodeficiency virus-infected Malawian adults. J. Infect. Dis. 184, 1345–1349. doi:10.1086/324080
Goujon, C., Moncorgé, O., Bauby, H., Doyle, T., Ward, C.C., Schaller, T., Hué, S., Barclay, W.S., Schulz, R., Malim, M.H., 2013. Human MX2 is an interferon-induced post-entry inhibitor of HIV-1 infection. Nature advance online publication. doi:10.1038/nature12542
Gracie, J.A., Robertson, S.E., McInnes, I.B., 2003. Interleukin-18. J. Leukoc. Biol. 73, 213–224.
Graham, N.M., Nelson, K.E., Solomon, L., Bonds, M., Rizzo, R.T., Scavotto, J., Astemborski, J., Vlahov, D., 1992. Prevalence of tuberculin positivity and skin test anergy in HIV-1-seropositive and -seronegative intravenous drug users. JAMA J. Am. Med. Assoc. 267, 369–373.
Gratchev, A., Kzhyshkowska, J., Kannookadan, S., Ochsenreiter, M., Popova, A., Yu, X., Mamidi, S., Stonehouse-Usselmann, E., Muller-Molinet, I., Gooi, L., Goerdt, S., 2008. Activation of a TGF-β-Specific Multistep Gene Expression Program in Mature Macrophages Requires Glucocorticoid-Mediated Surface Expression of TGF-β Receptor II. J. Immunol. 180, 6553 –6565.
Greter, M., Lelios, I., Pelczar, P., Hoeffel, G., Price, J., Leboeuf, M., Kündig, T.M., Frei, K., Ginhoux, F., Merad, M., Becher, B., 2012. Stroma-derived interleukin-34 controls the development and maintenance of langerhans cells and the maintenance of microglia. Immunity 37, 1050–1060. doi:10.1016/j.immuni.2012.11.001
Griffith, J.W., Sokol, C.L., Luster, A.D., 2014. Chemokines and chemokine receptors: positioning cells for host defense and immunity. Annu. Rev. Immunol. 32, 659–702. doi:10.1146/annurev-immunol-032713-120145
Gringhuis, S.I., den Dunnen, J., Litjens, M., van Het Hof, B., van Kooyk, Y., Geijtenbeek, T.B.H., 2007. C-type lectin DC-SIGN modulates Toll-like receptor signaling via Raf-1 kinase-dependent acetylation of transcription factor NF-kappaB. Immunity 26, 605–616. doi:10.1016/j.immuni.2007.03.012
Reference List
362
Groot, F., Welsch, S., Sattentau, Q.J., 2008. Efficient HIV-1 transmission from macrophages to T cells across transient virological synapses. Blood 111, 4660–4663. doi:10.1182/blood-2007-12-130070
Grunig, G., Corry, D.B., Leach, M.W., Seymour, B.W.P., Kurup, V.P., Rennick, D.M., 1997. Interleukin-10 Is a Natural Suppressor of Cytokine Production and Inflammation in a Murine Model of Allergic Bronchopulmonary Aspergillosis. J. Exp. Med. 185, 1089–1100.
Guarda, G., Braun, M., Staehli, F., Tardivel, A., Mattmann, C., Förster, I., Farlik, M., Decker, T., Du Pasquier, R.A., Romero, P., Tschopp, J., 2011. Type I interferon inhibits interleukin-1 production and inflammasome activation. Immunity 34, 213–223. doi:10.1016/j.immuni.2011.02.006
Guilliams, M., Ginhoux, F., Jakubzick, C., Naik, S.H., Onai, N., Schraml, B.U., Segura, E., Tussiwand, R., Yona, S., 2014. Dendritic cells, monocytes and macrophages: a unified nomenclature based on ontogeny. Nat. Rev. Immunol. 14, 571–578. doi:10.1038/nri3712
Guilliams, M., Kleer, I.D., Henri, S., Post, S., Vanhoutte, L., Prijck, S.D., Deswarte, K., Malissen, B., Hammad, H., Lambrecht, B.N., 2013. Alveolar macrophages develop from fetal monocytes that differentiate into long-lived cells in the first week of life via GM-CSF. J. Exp. Med. doi:10.1084/jem.20131199
Gupta, A., Wood, R., Kaplan, R., Bekker, L.-G., Lawn, S.D., 2012. Tuberculosis incidence rates during 8 years of follow-up of an antiretroviral treatment cohort in South Africa: comparison with rates in the community. PloS One 7, e34156. doi:10.1371/journal.pone.0034156
Gutierrez, M.G., Master, S.S., Singh, S.B., Taylor, G.A., Colombo, M.I., Deretic, V., 2004. Autophagy Is a Defense Mechanism Inhibiting BCG and Mycobacterium tuberculosis Survival in Infected Macrophages. Cell 119, 753–766. doi:10.1016/j.cell.2004.11.038
Haase, A.T., 2005. Perils at mucosal front lines for HIV and SIV and their hosts. Nat. Rev. Immunol. 5, 783–792. doi:10.1038/nri1705
Haase, A.T., 2010. Targeting early infection to prevent HIV-1 mucosal transmission. Nature 464, 217–223. doi:10.1038/nature08757
Haddow, L.J., Dibben, O., Moosa, M.-Y.S., Borrow, P., Easterbrook, P.J., 2011. Circulating inflammatory biomarkers can predict and characterize tuberculosis-associated immune reconstitution inflammatory syndrome. AIDS Lond. Engl. 25, 1163–1174. doi:10.1097/QAD.0b013e3283477d67
Haddow, L.J., Easterbrook, P.J., Mosam, A., Khanyile, N.G., Parboosing, R., Moodley, P., Moosa, M.-Y.S., 2009. Defining Immune Reconstitution Inflammatory Syndrome: Evaluation of Expert Opinion versus 2 Case Definitions in a South African Cohort. Clin. Infect. Dis. 49, 1424–1432. doi:10.1086/630208
Hagiwara, E., Sacks, T., Leitman-Klinman, S.F., Klinman, D.M., 1996. Effect of HIV infection on the frequency of cytokine-secreting cells in human peripheral blood. AIDS Res. Hum. Retroviruses 12, 127–133.
Haniffa, M., Ginhoux, F., Wang, X.-N., Bigley, V., Abel, M., Dimmick, I., Bullock, S., Grisotto, M., Booth, T., Taub, P., Hilkens, C., Merad, M., Collin, M., 2009. Differential rates of replacement of human dermal dendritic cells and macrophages during hematopoietic stem cell transplantation. J. Exp. Med. 206, 371–385. doi:10.1084/jem.20081633
Hao, S., Baltimore, D., 2009. The stability of mRNA influences the temporal order of the induction of genes encoding inflammatory molecules. Nat. Immunol. 10, 281–288. doi:10.1038/ni.1699
Hardison, J.L., Wrightsman, R.A., Carpenter, P.M., Lane, T.E., Manning, J.E., 2006. The chemokines CXCL9 and CXCL10 promote a protective immune response but do not contribute to cardiac inflammation following infection with Trypanosoma cruzi. Infect. Immun. 74, 125–134. doi:10.1128/IAI.74.1.125-134.2006
Harrison, T.S., 2009. The burden of HIV-associated cryptococcal disease. AIDS Lond. Engl. 23, 531–532. doi:10.1097/QAD.0b013e328322ffc3
Hashimoto, D., Chow, A., Noizat, C., Teo, P., Beasley, M.B., Leboeuf, M., Becker, C.D., See, P., Price, J., Lucas, D., Greter, M., Mortha, A., Boyer, S.W., Forsberg, E.C., Tanaka, M., van Rooijen, N., García-Sastre, A., Stanley, E.R., Ginhoux, F., Frenette, P.S., Merad, M., 2013. Tissue-Resident Macrophages Self-Maintain Locally throughout Adult Life with Minimal Contribution from Circulating Monocytes. Immunity 38, 792–804. doi:10.1016/j.immuni.2013.04.004

Reference List
363
Hayward, A.C., Darton, T., Van-Tam, J.N., Watson, J.M., Coker, R., Schwoebel, V., 2003. Epidemiology and control of tuberculosis in Western European cities. Int. J. Tuberc. Lung Dis. Off. J. Int. Union Tuberc. Lung Dis. 7, 751–757.
Heinz, S., Benner, C., Spann, N., Bertolino, E., Lin, Y.C., Laslo, P., Cheng, J.X., Murre, C., Singh, H., Glass, C.K., 2010. Simple combinations of lineage-determining transcription factors prime cis-regulatory elements required for macrophage and B cell identities. Mol. Cell 38, 576–589. doi:10.1016/j.molcel.2010.05.004
Hemelaar, J., 2012. The origin and diversity of the HIV-1 pandemic. Trends Mol. Med. 18, 182–192. doi:10.1016/j.molmed.2011.12.001
Herre, J., Marshall, A.S.J., Caron, E., Edwards, A.D., Williams, D.L., Schweighoffer, E., Tybulewicz, V., Sousa, C.R. e, Gordon, S., Brown, G.D., 2004. Dectin-1 uses novel mechanisms for yeast phagocytosis in macrophages. Blood 104, 4038–4045. doi:10.1182/blood-2004-03-1140
Hess, J., Ladel, C., Miko, D., Kaufmann, S.H., 1996. Salmonella typhimurium aroA- infection in gene-targeted immunodeficient mice: major role of CD4+ TCR-alpha beta cells and IFN-gamma in bacterial clearance independent of intracellular location. J. Immunol. 156, 3321–3326.
Hettinger, J., Richards, D.M., Hansson, J., Barra, M.M., Joschko, A.-C., Krijgsveld, J., Feuerer, M., 2013. Origin of monocytes and macrophages in a committed progenitor. Nat. Immunol. 14, 821–830. doi:10.1038/ni.2638
Heyworth, P.G., Cross, A.R., Curnutte, J.T., 2003. Chronic granulomatous disease. Curr. Opin. Immunol. 15, 578–584.
Higgins, D.M., Sanchez-Campillo, J., Rosas-Taraco, A.G., Lee, E.J., Orme, I.M., Gonzalez-Juarrero, M., 2009. Lack of IL-10 alters inflammatory and immune responses during pulmonary Mycobacterium tuberculosis infection. Tuberc. Edinb. Scotl. 89, 149–157. doi:10.1016/j.tube.2009.01.001
Hirsch, C.S., Toossi, Z., Johnson, J.L., Luzze, H., Ntambi, L., Peters, P., McHugh, M., Okwera, A., Joloba, M., Mugyenyi, P., Mugerwa, R.D., Terebuh, P., Ellner, J.J., 2001. Augmentation of apoptosis and interferon-gamma production at sites of active Mycobacterium tuberculosis infection in human tuberculosis. J. Infect. Dis. 183, 779–788. doi:10.1086/318817
Ho, D.D., Rota, T.R., Hirsch, M.S., 1986. Infection of monocyte/macrophages by human T lymphotropic virus type III. J. Clin. Invest. 77, 1712–1715. doi:10.1172/JCI112491
Hodge-Dufour, J., Marino, M.W., Horton, M.R., Jungbluth, A., Burdick, M.D., Strieter, R.M., Noble, P.W., Hunter, C.A., Puré, E., 1998. Inhibition of interferon γ induced interleukin 12 production: A potential mechanism for the anti-inflammatory activities of tumor necrosis factor. Proc. Natl. Acad. Sci. 95, 13806–13811. doi:10.1073/pnas.95.23.13806
Hoeffel, G., Wang, Y., Greter, M., See, P., Teo, P., Malleret, B., Leboeuf, M., Low, D., Oller, G., Almeida, F., Choy, S.H.Y., Grisotto, M., Renia, L., Conway, S.J., Stanley, E.R., Chan, J.K.Y., Ng, L.G., Samokhvalov, I.M., Merad, M., Ginhoux, F., 2012. Adult Langerhans cells derive predominantly from embryonic fetal liver monocytes with a minor contribution of yolk sac-derived macrophages. J. Exp. Med. 209, 1167–1181. doi:10.1084/jem.20120340
Hoffmann, M., Dutton, R.W., 1971. Immune response restoration with macrophage culture supernatants. Science 172, 1047–1048.
Hölscher, C., Mohrs, M., Dai, W.J., Köhler, G., Ryffel, B., Schaub, G.A., Mossmann, H., Brombacher, F., 2000. Tumor Necrosis Factor Alpha-Mediated Toxic Shock inTrypanosoma cruzi-Infected Interleukin 10-Deficient Mice. Infect. Immun. 68, 4075–4083. doi:10.1128/IAI.68.7.4075-4083.2000
Honda, Y., Rogers, L., Nakata, K., Zhao, B.-Y., Pine, R., Nakai, Y., Kurosu, K., Rom, W.N., Weiden, M., 1998. Type I Interferon Induces Inhibitory 16-kD CCAAT/ Enhancer Binding Protein (C/EBP)β, Repressing the HIV-1 Long Terminal Repeat in Macrophages: Pulmonary Tuberculosis Alters C/EBP Expression, Enhancing HIV-1 Replication. J. Exp. Med. 188, 1255 –1265. doi:10.1084/jem.188.7.1255
Hoppstädter, J., Diesel, B., Zarbock, R., Breinig, T., Monz, D., Koch, M., Meyerhans, A., Gortner, L., Lehr, C.-M., Huwer, H., Kiemer, A.K., 2010. Differential cell reaction upon Toll-like receptor 4 and 9 activation in human alveolar and lung interstitial macrophages. Respir. Res. 11, 124. doi:10.1186/1465-9921-11-124

Reference List
364
Horwitz, D.A., Zheng, S.G., Gray, J.D., 2003. The role of the combination of IL-2 and TGF-β or IL-10 in the generation and function of CD4+ CD25+ and CD8+regulatory T cell subsets. J. Leukoc. Biol. 74, 471–478. doi:10.1189/jlb.0503228
Hoshino, Y., Nakata, K., Hoshino, S., Honda, Y., Tse, D.B., Shioda, T., Rom, W.N., Weiden, M., 2002. Maximal HIV-1 Replication in Alveolar Macrophages during Tuberculosis Requires both Lymphocyte Contact and Cytokines. J. Exp. Med. 195, 495 –505. doi:10.1084/jem.20011614
Hoshino, Y., Tse, D.B., Rochford, G., Prabhakar, S., Hoshino, S., Chitkara, N., Kuwabara, K., Ching, E., Raju, B., Gold, J.A., Borkowsky, W., Rom, W.N., Pine, R., Weiden, M., 2004. Mycobacterium tuberculosis-induced CXCR4 and chemokine expression leads to preferential X4 HIV-1 replication in human macrophages. J. Immunol. Baltim. Md 1950 172, 6251–6258.
Howard, M., Muchamuel, T., Andrade, S., Menon, S., 1993. Interleukin 10 protects mice from lethal endotoxemia. J. Exp. Med. 177, 1205–1208. doi:10.1084/jem.177.4.1205
Hrecka, K., Hao, C., Gierszewska, M., Swanson, S.K., Kesik-Brodacka, M., Srivastava, S., Florens, L., Washburn, M.P., Skowronski, J., 2011. Vpx relieves inhibition of HIV-1 infection of macrophages mediated by the SAMHD1 protein. Nature 474, 658–661. doi:10.1038/nature10195
Hsieh, C.-S., Macatonia, S.E., Tripp, C.S., Wolf, S.F., O’Garra, A., Murphy, K.M., 1993. Development of Th1 CD4 T Cells Through IL-12 Produced by Listeria-Induced Macrophages. Science, New Series 260, 547–549.
Hu, X., Paik, P.K., Chen, J., Yarilina, A., Kockeritz, L., Lu, T.T., Woodgett, J.R., Ivashkiv, L.B., 2006. IFN-gamma suppresses IL-10 production and synergizes with TLR2 by regulating GSK3 and CREB/AP-1 proteins. Immunity 24, 563–574. doi:10.1016/j.immuni.2006.02.014
Huang, Y., Erdmann, N., Peng, H., Herek, S., Davis, J.S., Luo, X., Ikezu, T., Zheng, J., 2006. TRAIL-Mediated Apoptosis in HIV-1-Infected Macrophages Is Dependent on the Inhibition of Akt-1 Phosphorylation. J. Immunol. 177, 2304–2313.
Hume, D.A., 2008. Macrophages as APC and the dendritic cell myth. J. Immunol. Baltim. Md 1950 181, 5829–5835.
Humphrey, J.H., 1967. Cell-mediated immunity--general perspectives. Br. Med. Bull. 23, 93–97.
Hung, C.-H., Thomas, L., Ruby, C.E., Atkins, K.M., Morris, N.P., Knight, Z.A., Scholz, I., Barklis, E., Weinberg, A.D., Shokat, K.M., Thomas, G., 2007. HIV-1 Nef Assembles a Src Family Kinase-ZAP-70/Syk-PI3K Cascade to Downregulate Cell-Surface MHC-I. Cell Host Microbe 1, 121–133. doi:10.1016/j.chom.2007.03.004
Hung, J.-H., Yang, T.-H., Hu, Z., Weng, Z., DeLisi, C., 2012. Gene set enrichment analysis: performance evaluation and usage guidelines. Brief. Bioinform. 13, 281–291. doi:10.1093/bib/bbr049
Hunter, C.A., Ellis-Neyes, L.A., Slifer, T., Kanaly, S., Grünig, G., Fort, M., Rennick, D., Araujo, F.G., 1997. IL-10 is required to prevent immune hyperactivity during infection with Trypanosoma cruzi. J. Immunol. Baltim. Md 1950 158, 3311–3316.
Hutchins, A.P., Diez, D., Miranda-Saavedra, D., 2013. The IL-10/STAT3-mediated anti-inflammatory response: recent developments and future challenges. Brief. Funct. Genomics 12, 489–498. doi:10.1093/bfgp/elt028
Hutchins, A.P., Poulain, S., Miranda-Saavedra, D., 2012. Genome-wide analysis of STAT3 binding in vivo predicts effectors of the anti-inflammatory response in macrophages. Blood 119, e110–119. doi:10.1182/blood-2011-09-381483
Ieong, M.H., Reardon, C.C., Levitz, S.M., Kornfeld, H., 2000. Human immunodeficiency virus type 1 infection of alveolar macrophages impairs their innate fungicidal activity. Am. J. Respir. Crit. Care Med. 162, 966–970.
Imai, T., Nagira, M., Takagi, S., Kakizaki, M., Nishimura, M., Wang, J., Gray, P.W., Matsushima, K., Yoshie, O., 1999. Selective recruitment of CCR4-bearing Th2 cells toward antigen-presenting cells by the CC chemokines thymus and activation-regulated chemokine and macrophage-derived chemokine. Int. Immunol. 11, 81–88.
Imam, N., Carpenter, C.C.J., Mayer, K.H., Fisher, A., Stein, M., Danforth, S.B., 1990. Hierarchical pattern of mucosal candida infections in HIV-seropositive women. Am. J. Med. 89, 142–146. doi:10.1016/0002-9343(90)90291-K

Reference List
365
Imhof, B.A., Aurrand-Lions, M., 2004. Adhesion mechanisms regulating the migration of monocytes. Nat. Rev. Immunol. 4, 432–444. doi:10.1038/nri1375
Imperiali, F.G., Zaninoni, A., La Maestra, L., Tarsia, P., Blasi, F., Barcellini, W., 2001. Increased Mycobacterium tuberculosis growth in HIV-1-infected human macrophages: role of tumour necrosis factor-alpha. Clin. Exp. Immunol. 123, 435–442.
Ingersoll, M.A., Spanbroek, R., Lottaz, C., Gautier, E.L., Frankenberger, M., Hoffmann, R., Lang, R., Haniffa, M., Collin, M., Tacke, F., Habenicht, A.J.R., Ziegler-Heitbrock, L., Randolph, G.J., 2010. Comparison of gene expression profiles between human and mouse monocyte subsets. Blood 115, e10–19. doi:10.1182/blood-2009-07-235028
Irizarry, R.A., Wang, C., Zhou, Y., Speed, T.P., 2009. Gene set enrichment analysis made simple. Stat. Methods Med. Res. 18, 565–575. doi:10.1177/0962280209351908
Itoh, K., Hirohata, S., 1995. The role of IL-10 in human B cell activation, proliferation, and differentiation. J. Immunol. Baltim. Md 1950 154, 4341–4350.
Ivanov, S.S., Roy, C.R., 2013. Pathogen signatures activate a ubiquitination pathway that modulates the function of the metabolic checkpoint kinase mTOR. Nat. Immunol. 14, 1219–1228. doi:10.1038/ni.2740
Iwakura, Y., Ishigame, H., 2006. The IL-23/IL-17 axis in inflammation. J. Clin. Invest. 116, 1218–1222. doi:10.1172/JCI28508
Iwasaki, H., Takeuchi, O., Teraguchi, S., Matsushita, K., Uehata, T., Kuniyoshi, K., Satoh, T., Saitoh, T., Matsushita, M., Standley, D.M., Akira, S., 2011. The I[kappa]B kinase complex regulates the stability of cytokine-encoding mRNA induced by TLR-IL-1R by controlling degradation of regnase-1. Nat Immunol 12, 1167–1175. doi:10.1038/ni.2137
Iyer, S.S., Cheng, G., 2012. Role of interleukin 10 transcriptional regulation in inflammation and autoimmune disease. Crit. Rev. Immunol. 32, 23–63.
Izadpanah, A., Gallo, R.L., 2005. Antimicrobial peptides. J. Am. Acad. Dermatol. 52, 381–390. doi:10.1016/j.jaad.2004.08.026
Jacobson, M.A., Zegans, M., Pavan, P.R., O’Donnell, J.J., Sattler, F., Rao, N., Owens, S., Pollard, R., 1997. Cytomegalovirus retinitis after initiation of highly active antiretroviral therapy. The Lancet 349, 1443–1445. doi:10.1016/S0140-6736(96)11431-8
Jaffe, H.W., Bregman, D.J., Selik, R.M., 1983. Acquired immune deficiency syndrome in the United States: the first 1,000 cases. J. Infect. Dis. 148, 339–345.
Jakubzick, C., Gautier, E.L., Gibbings, S.L., Sojka, D.K., Schlitzer, A., Johnson, T.E., Ivanov, S., Duan, Q., Bala, S., Condon, T., van Rooijen, N., Grainger, J.R., Belkaid, Y., Ma’ayan, A., Riches, D.W.H., Yokoyama, W.M., Ginhoux, F., Henson, P.M., Randolph, G.J., 2013. Minimal differentiation of classical monocytes as they survey steady-state tissues and transport antigen to lymph nodes. Immunity 39, 599–610. doi:10.1016/j.immuni.2013.08.007
Jambo, K.C., Banda, D.H., Kankwatira, A.M., Sukumar, N., Allain, T.J., Heyderman, R.S., Russell, D.G., Mwandumba, H.C., 2014. Small alveolar macrophages are infected preferentially by HIV and exhibit impaired phagocytic function. Mucosal Immunol. doi:10.1038/mi.2013.127
Jarry, A., Cortez, A., René, E., Muzeau, F., Brousse, N., 1990. Infected cells and immune cells in the gastrointestinal tract of AIDS patients. An immunohistochemical study of 127 cases. Histopathology 16, 133–140.
Jenkins, S.J., Ruckerl, D., Cook, P.C., Jones, L.H., Finkelman, F.D., van Rooijen, N., MacDonald, A.S., Allen, J.E., 2011. Local Macrophage Proliferation, Rather than Recruitment from the Blood, Is a Signature of TH2 Inflammation. Science 332, 1284 –1288. doi:10.1126/science.1204351
Jenkins, S.J., Ruckerl, D., Thomas, G.D., Hewitson, J.P., Duncan, S., Brombacher, F., Maizels, R.M., Hume, D.A., Allen, J.E., 2013. IL-4 directly signals tissue-resident macrophages to proliferate beyond homeostatic levels controlled by CSF-1. J. Exp. Med. 210, 2477–2491. doi:10.1084/jem.20121999
Jiang, Y., Beller, D.I., Frendl, G., Graves, D.T., 1992. Monocyte chemoattractant protein-1 regulates adhesion molecule expression and cytokine production in human monocytes. J. Immunol. 148, 2423–2428.

Reference List
366
Jouanguy, E., Altare, F., Lamhamedi, S., Revy, P., Emile, J.F., Newport, M., Levin, M., Blanche, S., Seboun, E., Fischer, A., Casanova, J.L., 1996. Interferon-gamma-receptor deficiency in an infant with fatal bacille Calmette-Guérin infection. N. Engl. J. Med. 335, 1956–1961. doi:10.1056/NEJM199612263352604
Jouanguy, E., Döffinger, R., Dupuis, S., Pallier, A., Altare, F., Casanova, J.L., 1999. IL-12 and IFN-gamma in host defense against mycobacteria and salmonella in mice and men. Curr. Opin. Immunol. 11, 346–351.
Jovanovic, D.V., Battista, J.A.D., Martel-Pelletier, J., Jolicoeur, F.C., He, Y., Zhang, M., Mineau, F., Pelletier, J.-P., 1998. IL-17 Stimulates the Production and Expression of Proinflammatory Cytokines, IL-β and TNF-α, by Human Macrophages. J. Immunol. 160, 3513–3521.
Jung, S.-B., Yang, C.-S., Lee, J.-S., Shin, A.-R., Jung, S.-S., Son, J.W., Harding, C.V., Kim, H.-J., Park, J.-K., Paik, T.-H., Song, C.-H., Jo, E.-K., 2006. The Mycobacterial 38-Kilodalton Glycolipoprotein Antigen Activates the Mitogen-Activated Protein Kinase Pathway and Release of Proinflammatory Cytokines through Toll-Like Receptors 2 and 4 in Human Monocytes. Infect. Immun. 74, 2686–2696. doi:10.1128/IAI.74.5.2686-2696.2006
Jung, Y.-J., Ryan, L., LaCourse, R., North, R.J., 2003. Increased interleukin-10 expression is not responsible for failure of T helper 1 immunity to resolve airborne Mycobacterium tuberculosis infection in mice. Immunology 109, 295–299.
Junt, T., Moseman, E.A., Iannacone, M., Massberg, S., Lang, P.A., Boes, M., Fink, K., Henrickson, S.E., Shayakhmetov, D.M., Di Paolo, N.C., van Rooijen, N., Mempel, T.R., Whelan, S.P., von Andrian, U.H., 2007. Subcapsular sinus macrophages in lymph nodes clear lymph-borne viruses and present them to antiviral B cells. Nature 450, 110–114. doi:10.1038/nature06287
Kagina, B.M.N., Abel, B., Scriba, T.J., Hughes, E.J., Keyser, A., Soares, A., Gamieldien, H., Sidibana, M., Hatherill, M., Gelderbloem, S., Mahomed, H., Hawkridge, A., Hussey, G., Kaplan, G., Hanekom, W.A., other members of the South African Tuberculosis Vaccine Initiative, 2010. Specific T cell frequency and cytokine expression profile do not correlate with protection against tuberculosis after bacillus Calmette-Guérin vaccination of newborns. Am. J. Respir. Crit. Care Med. 182, 1073–1079. doi:10.1164/rccm.201003-0334OC
Kaiser, F., Cook, D., Papoutsopoulou, S., Rajsbaum, R., Wu, X., Yang, H.-T., Grant, S., Ricciardi-Castagnoli, P., Tsichlis, P.N., Ley, S.C., O’Garra, A., 2009. TPL-2 negatively regulates interferon-β production in macrophages and myeloid dendritic cells. J. Exp. Med. 206, 1863–1871. doi:10.1084/jem.20091059
Kallenius, G., Koivula, T., Rydgard, K.J., Hoffner, S.E., Valentin, A., Asjo, B., Ljungh, C., Sharma, U., Svenson, S.B., 1992. Human immunodeficiency virus type 1 enhances intracellular growth of Mycobacterium avium in human macrophages. Infect. Immun. 60, 2453–2458.
Kalsdorf, B., Scriba, T.J., Wood, K., Day, C.L., Dheda, K., Dawson, R., Hanekom, W.A., Lange, C., Wilkinson, R.J., 2009. HIV-1 infection impairs the bronchoalveolar T-cell response to mycobacteria. Am. J. Respir. Crit. Care Med. 180, 1262–1270. doi:10.1164/rccm.200907-1011OC
Kane, M., Yadav, S.S., Bitzegeio, J., Kutluay, S.B., Zang, T., Wilson, S.J., Schoggins, J.W., Rice, C.M., Yamashita, M., Hatziioannou, T., Bieniasz, P.D., 2013. MX2 is an interferon-induced inhibitor of HIV-1 infection. Nature 502, 563–566. doi:10.1038/nature12653
Kang, P.B., Azad, A.K., Torrelles, J.B., Kaufman, T.M., Beharka, A., Tibesar, E., DesJardin, L.E., Schlesinger, L.S., 2005. The human macrophage mannose receptor directs Mycobacterium tuberculosis lipoarabinomannan-mediated phagosome biogenesis. J. Exp. Med. 202, 987–999. doi:10.1084/jem.20051239
Kanitakis, J., Morelon, E., Petruzzo, P., Badet, L., Dubernard, J.-M., 2011. Self-renewal capacity of human epidermal Langerhans cells: observations made on a composite tissue allograft. Exp. Dermatol. 20, 145–146. doi:10.1111/j.1600-0625.2010.01146.x
Kaplan, J.E., Hanson, D., Dworkin, M.S., Frederick, T., Bertolli, J., Lindegren, M.L., Holmberg, S., Jones, J.L., 2000. Epidemiology of Human Immunodeficiency Virus–Associated Opportunistic Infections in the United States in the Era of Highly Active Antiretroviral Therapy. Clin. Infect. Dis. 30, S5–S14. doi:10.1086/313843
Kapsenberg, M.L., 2003. Dendritic-cell control of pathogen-driven T-cell polarization. Nat. Rev. Immunol. 3, 984–993. doi:10.1038/nri1246

Reference List
367
Karakousis, P.C., Moore, R.D., Chaisson, R.E., 2004. Mycobacterium avium complex in patients with HIV infection in the era of highly active antiretroviral therapy. Lancet Infect. Dis. 4, 557–565. doi:10.1016/S1473-3099(04)01130-2
Kassutto, S., Rosenberg, E.S., 2004. Primary HIV Type 1 Infection. Clin. Infect. Dis. 38, 1447–1453. doi:10.1086/420745
Katakura, T., Miyazaki, M., Kobayashi, M., Herndon, D.N., Suzuki, F., 2004. CCL17 and IL-10 as Effectors That Enable Alternatively Activated Macrophages to Inhibit the Generation of Classically Activated Macrophages. J. Immunol. 172, 1407–1413. doi:10.4049/jimmunol.172.3.1407
Kaufmann, S.H., 1999. Cell-mediated immunity: dealing a direct blow to pathogens. Curr. Biol. CB 9, R97–99.
Kaufmann, S.H.E., 1995. Immunity to intracellular microbial pathogens. Immunol. Today 16, 338–342. doi:10.1016/0167-5699(95)80151-0
Kaul, M., Garden, G.A., Lipton, S.A., 2001. Pathways to neuronal injury and apoptosis in HIV-associated dementia. Nature 410, 988–994. doi:10.1038/35073667
Kawai, T., Akira, S., 2006. Innate immune recognition of viral infection. Nat. Immunol. 7, 131–137. doi:10.1038/ni1303
Kawai, T., Akira, S., 2010. The role of pattern-recognition receptors in innate immunity: update on Toll-like receptors. Nat. Immunol. 11, 373–384. doi:10.1038/ni.1863
Keane, J., Balcewicz-Sablinska, M.K., Remold, H.G., Chupp, G.L., Meek, B.B., Fenton, M.J., Kornfeld, H., 1997. Infection by Mycobacterium tuberculosis promotes human alveolar macrophage apoptosis. Infect. Immun. 65, 298–304.
Keane, J., Gershon, S., Wise, R.P., Mirabile-Levens, E., Kasznica, J., Schwieterman, W.D., Siegel, J.N., Braun, M.M., 2001. Tuberculosis associated with infliximab, a tumor necrosis factor alpha-neutralizing agent. N. Engl. J. Med. 345, 1098–1104. doi:10.1056/NEJMoa011110
Keane, J., Remold, H.G., Kornfeld, H., 2000. Virulent Mycobacterium tuberculosis strains evade apoptosis of infected alveolar macrophages. J. Immunol. Baltim. Md 1950 164, 2016–2020.
Kedzierska, K., Crowe, S.M., 2001. Cytokines and HIV-1: interactions and clinical implications. Antivir. Chem. Chemother. 12, 133–150.
Keele, B.F., Jones, J.H., Terio, K.A., Estes, J.D., Rudicell, R.S., Wilson, M.L., Li, Y., Learn, G.H., Beasley, T.M., Schumacher-Stankey, J., Wroblewski, E., Mosser, A., Raphael, J., Kamenya, S., Lonsdorf, E.V., Travis, D.A., Mlengeya, T., Kinsel, M.J., Else, J.G., Silvestri, G., Goodall, J., Sharp, P.M., Shaw, G.M., Pusey, A.E., Hahn, B.H., 2009. Increased mortality and AIDS-like immunopathology in wild chimpanzees infected with SIVcpz. Nature 460, 515–519. doi:10.1038/nature08200
Kelly, E.K., Wang, L., Ivashkiv, L.B., 2010. Calcium-activated pathways and oxidative burst mediate zymosan-induced signaling and IL-10 production in human macrophages. J. Immunol. Baltim. Md 1950 184, 5545–5552. doi:10.4049/jimmunol.0901293
Kiemer, A.K., Senaratne, R.H., Hoppstädter, J., Diesel, B., Riley, L.W., Tabeta, K., Bauer, S., Beutler, B., Zuraw, B.L., 2009. Attenuated activation of macrophage TLR9 by DNA from virulent mycobacteria. J. Innate Immun. 1, 29–45. doi:10.1159/000142731
Kirchhoff, F., Greenough, T.C., Brettler, D.B., Sullivan, J.L., Desrosiers, R.C., 1995. Brief report: absence of intact nef sequences in a long-term survivor with nonprogressive HIV-1 infection. N. Engl. J. Med. 332, 228–232. doi:10.1056/NEJM199501263320405
Klein, I., Cornejo, J.C., Polakos, N.K., John, B., Wuensch, S.A., Topham, D.J., Pierce, R.H., Crispe, I.N., 2007. Kupffer cell heterogeneity: functional properties of bone marrow derived and sessile hepatic macrophages. Blood 110, 4077–4085. doi:10.1182/blood-2007-02-073841
Knipe, D.M., 2007. Fields Virology, 5th ed. Lippincott Williams & Wilkins.
Kobayashi, T., Matsuoka, K., Sheikh, S.Z., Elloumi, H.Z., Kamada, N., Hisamatsu, T., Hansen, J.J., Doty, K.R., Pope, S.D., Smale, S.T., Hibi, T., Rothman, P.B., Kashiwada, M., Plevy, S.E., 2011. NFIL3 Is a Regulator of IL-12 p40 in Macrophages and Mucosal Immunity. J. Immunol. 186, 4649–4655. doi:10.4049/jimmunol.1003888
Koenig, S., Gendelman, H.E., Orenstein, J.M., Dal Canto, M.C., Pezeshkpour, G.H., Yungbluth, M., Janotta, F., Aksamit, A., Martin, M.A., Fauci, A.S., 1986. Detection of AIDS virus in macrophages in brain tissue from AIDS patients with encephalopathy. Science 233, 1089–1093.

Reference List
368
Kohl, N.E., Emini, E.A., Schleif, W.A., Davis, L.J., Heimbach, J.C., Dixon, R.A., Scolnick, E.M., Sigal, I.S., 1988. Active human immunodeficiency virus protease is required for viral infectivity. Proc. Natl. Acad. Sci. U. S. A. 85, 4686–4690.
Kohyama, M., Ise, W., Edelson, B.T., Wilker, P.R., Hildner, K., Mejia, C., Frazier, W.A., Murphy, T.L., Murphy, K.M., 2009. Role for Spi-C in the development of red pulp macrophages and splenic iron homeostasis. Nature 457, 318–321. doi:10.1038/nature07472
Koppensteiner, H., Banning, C., Schneider, C., Hohenberg, H., Schindler, M., 2012. Macrophage internal HIV-1 is protected from neutralizing antibodies. J. Virol. 86, 2826–2836. doi:10.1128/JVI.05915-11
Korber, B., Muldoon, M., Theiler, J., Gao, F., Gupta, R., Lapedes, A., Hahn, B.H., Wolinsky, S., Bhattacharya, T., 2000. Timing the ancestor of the HIV-1 pandemic strains. Science 288, 1789–1796.
Koziel, H., Eichbaum, Q., Kruskal, B.A., Pinkston, P., Rogers, R.A., Armstrong, M.Y., Richards, F.F., Rose, R.M., Ezekowitz, R.A., 1998. Reduced binding and phagocytosis of Pneumocystis carinii by alveolar macrophages from persons infected with HIV-1 correlates with mannose receptor downregulation. J. Clin. Invest. 102, 1332–1344. doi:10.1172/JCI560
Kramer, H.B., Lavender, K.J., Qin, L., Stacey, A.R., Liu, M.K.P., di Gleria, K., Simmons, A., Gasper-Smith, N., Haynes, B.F., McMichael, A.J., Borrow, P., Kessler, B.M., 2010. Elevation of intact and proteolytic fragments of acute phase proteins constitutes the earliest systemic antiviral response in HIV-1 infection. PLoS Pathog. 6, e1000893. doi:10.1371/journal.ppat.1000893
Krausgruber, T., Blazek, K., Smallie, T., Alzabin, S., Lockstone, H., Sahgal, N., Hussell, T., Feldmann, M., Udalova, I.A., 2011. IRF5 promotes inflammatory macrophage polarization and T(H)1-T(H)17 responses. Nat. Immunol. doi:10.1038/ni.1990
Kruijshaar, M.E., Abubakar, I., 2009. Increase in extrapulmonary tuberculosis in England and Wales 1999-2006. Thorax 64, 1090–1095. doi:10.1136/thx.2009.118133
Kühn, R., Löhler, J., Rennick, D., Rajewsky, K., Müller, W., 1993. Interleukin-10-deficient mice develop chronic enterocolitis. Cell 75, 263–274.
Kuritzkes, D.R., 2000. Neutropenia, Neutrophil Dysfunction, and Bacterial Infection in Patients with Human Immunodeficiency Virus Disease: The Role of Granulocyte Colony-Stimulating Factor. Clin. Infect. Dis. 30, 256–270. doi:10.1086/313642
Kusske, A.M., Rongione, A.J., Ashley, S.W., McFadden, D.W., Reber, H.A., 1996. Interleukin-10 prevents death in lethal necrotizing pancreatitis in mice. Surgery 120, 284–289. doi:10.1016/S0039-6060(96)80299-6
Kuwata, H., Watanabe, Y., Miyoshi, H., Yamamoto, M., Kaisho, T., Takeda, K., Akira, S., 2003. IL-10-inducible Bcl-3 negatively regulates LPS-induced TNF-alpha production in macrophages. Blood 102, 4123–4129. doi:10.1182/blood-2003-04-1228
Kwon, A.T., Arenillas, D.J., Worsley Hunt, R., Wasserman, W.W., 2012. oPOSSUM-3: advanced analysis of regulatory motif over-representation across genes or ChIP-Seq datasets. G3 Bethesda Md 2, 987–1002. doi:10.1534/g3.112.003202
Kyei, G.B., Dinkins, C., Davis, A.S., Roberts, E., Singh, S.B., Dong, C., Wu, L., Kominami, E., Ueno, T., Yamamoto, A., Federico, M., Panganiban, A., Vergne, I., Deretic, V., 2009. Autophagy pathway intersects with HIV-1 biosynthesis and regulates viral yields in macrophages. J. Cell Biol. 186, 255–268. doi:10.1083/jcb.200903070
Lacey, D.C., Achuthan, A., Fleetwood, A.J., Dinh, H., Roiniotis, J., Scholz, G.M., Chang, M.W., Beckman, S.K., Cook, A.D., Hamilton, J.A., 2012. Defining GM-CSF- and macrophage-CSF-dependent macrophage responses by in vitro models. J. Immunol. Baltim. Md 1950 188, 5752–5765. doi:10.4049/jimmunol.1103426
Laguette, N., Sobhian, B., Casartelli, N., Ringeard, M., Chable-Bessia, C., Ségéral, E., Yatim, A., Emiliani, S., Schwartz, O., Benkirane, M., 2011. SAMHD1 is the dendritic- and myeloid-cell-specific HIV-1 restriction factor counteracted by Vpx. Nature 474, 654–657. doi:10.1038/nature10117
Lai, R.P.J., Nakiwala, J.K., Meintjes, G., Wilkinson, R.J., 2013. The immunopathogenesis of the HIV tuberculosis immune reconstitution inflammatory syndrome. Eur. J. Immunol. 43, 1995–2002. doi:10.1002/eji.201343632
Reference List
369
Lang, R., Patel, D., Morris, J.J., Rutschman, R.L., Murray, P.J., 2002a. Shaping gene expression in activated and resting primary macrophages by IL-10. J. Immunol. Baltim. Md 1950 169, 2253–2263.
Lang, R., Patel, D., Morris, J.J., Rutschman, R.L., Murray, P.J., 2002b. Shaping gene expression in activated and resting primary macrophages by IL-10. J. Immunol. Baltim. Md 1950 169, 2253–2263.
Lang, R., Rutschman, R.L., Greaves, D.R., Murray, P.J., 2002c. Autocrine deactivation of macrophages in transgenic mice constitutively overexpressing IL-10 under control of the human CD68 promoter. J. Immunol. Baltim. Md 1950 168, 3402–3411.
Langrish, C.L., Chen, Y., Blumenschein, W.M., Mattson, J., Basham, B., Sedgwick, J.D., McClanahan, T., Kastelein, R.A., Cua, D.J., 2005. IL-23 drives a pathogenic T cell population that induces autoimmune inflammation. J. Exp. Med. 201, 233–240. doi:10.1084/jem.20041257
Law, K.F., Jagirdar, J., Weiden, M.D., Bodkin, M., Rom, W.N., 1996. Tuberculosis in HIV-positive patients: cellular response and immune activation in the lung. Am. J. Respir. Crit. Care Med. 153, 1377–1384. doi:10.1164/ajrccm.153.4.8616569
Lawn, S.D., Butera, S.T., Shinnick, T.M., 2002. Tuberculosis unleashed: the impact of human immunodeficiency virus infection on the host granulomatous response to Mycobacterium tuberculosis. Microbes Infect. Inst. Pasteur 4, 635–646.
Lawn, S.D., Churchyard, G., 2009. Epidemiology of HIV-associated tuberculosis. Curr. Opin. HIV AIDS 4, 325–333. doi:10.1097/COH.0b013e32832c7d61
Lawn, S.D., Evans, A.J., Sedgwick, P.M., Acheampong, J.W., 1999. Pulmonary tuberculosis: radiological features in west Africans coinfected with HIV. Br. J. Radiol. 72, 339–344. doi:10.1259/bjr.72.856.10474493
Lawn, S.D., Pisell, T.L., Hirsch, C.S., Wu, M., Butera, S.T., Toossi, Z., 2001. Anatomically compartmentalized human immunodeficiency virus replication in HLA-DR+ cells and CD14+ macrophages at the site of pleural tuberculosis coinfection. J. Infect. Dis. 184, 1127–1133. doi:10.1086/323649
Lawn, S.D., Wilkinson, R.J., Lipman, M.C.I., Wood, R., 2008. Immune reconstitution and “unmasking” of tuberculosis during antiretroviral therapy. Am. J. Respir. Crit. Care Med. 177, 680–685. doi:10.1164/rccm.200709-1311PP
Lawn, S.D., Zumla, A.I., 2011. Tuberculosis. Lancet 378, 57–72. doi:10.1016/S0140-6736(10)62173-3
Lawrence, T., Natoli, G., 2011. Transcriptional regulation of macrophage polarization: enabling diversity with identity. Nat Rev Immunol 11, 750–761. doi:10.1038/nri3088
Le Bert, N., Chain, B.M., Rook, G., Noursadeghi, M., 2011. DC Priming by M. vaccae Inhibits Th2 Responses in Contrast to Specific TLR2 Priming and Is Associated with Selective Activation of the CREB Pathway. PLoS ONE 6, e18346. doi:10.1371/journal.pone.0018346
Lee, C.G., Homer, R.J., Zhu, Z., Lanone, S., Wang, X., Koteliansky, V., Shipley, J.M., Gotwals, P., Noble, P., Chen, Q., Senior, R.M., Elias, J.A., 2001. Interleukin-13 induces tissue fibrosis by selectively stimulating and activating transforming growth factor beta(1). J. Exp. Med. 194, 809–821.
Lee, P.P.W., Chan, K.-W., Jiang, L., Chen, T., Li, C., Lee, T.-L., Mak, P.H.S., Fok, S.F.S., Yang, X., Lau, Y.-L., 2008. Susceptibility to mycobacterial infections in children with X-linked chronic granulomatous disease: a review of 17 patients living in a region endemic for tuberculosis. Pediatr. Infect. Dis. J. 27, 224–230. doi:10.1097/INF.0b013e31815b494c
Leeansyah, E., Wines, B.D., Crowe, S.M., Jaworowski, A., 2007. The mechanism underlying defective Fcgamma receptor-mediated phagocytosis by HIV-1-infected human monocyte-derived macrophages. J. Immunol. Baltim. Md 1950 178, 1096–1104.
Lefford, M.J., McGregor, D.D., Mackaness, G.B., 1973. Immune Response to Mycobacterium tuberculosis in Rats. Infect. Immun. 8, 182–189.
Lehtonen, A., Ahlfors, H., Veckman, V., Miettinen, M., Lahesmaa, R., Julkunen, I., 2007. Gene expression profiling during differentiation of human monocytes to macrophages or dendritic cells. J. Leukoc. Biol. 82, 710–720. doi:10.1189/jlb.0307194

Reference List
370
Leidl, L., Mayanja-Kizza, H., Sotgiu, G., Baseke, J., Ernst, M., Hirsch, C., Goletti, D., Toossi, Z., Lange, C., 2010. Relationship of immunodiagnostic assays for tuberculosis and numbers of circulating CD4+ T-cells in HIV infection. Eur. Respir. J. 35, 619–626. doi:10.1183/09031936.00045509
Leirião, P., del Fresno, C., Ardavín, C., 2012. Monocytes as effector cells: activated Ly-6C(high) mouse monocytes migrate to the lymph nodes through the lymph and cross-present antigens to CD8+ T cells. Eur. J. Immunol. 42, 2042–2051. doi:10.1002/eji.201142166
Lemaitre, B., Nicolas, E., Michaut, L., Reichhart, J.M., Hoffmann, J.A., 1996. The dorsoventral regulatory gene cassette spätzle/Toll/cactus controls the potent antifungal response in Drosophila adults. Cell 86, 973–983.
Lepelley, A., Louis, S., Sourisseau, M., Law, H.K.W., Pothlichet, J., Schilte, C., Chaperot, L., Plumas, J., Randall, R.E., Si-Tahar, M., Mammano, F., Albert, M.L., Schwartz, O., 2011. Innate Sensing of HIV-Infected Cells. PLoS Pathog 7, e1001284. doi:10.1371/journal.ppat.1001284
Leveton, C., Barnass, S., Champion, B., Lucas, S., De Souza, B., Nicol, M., Banerjee, D., Rook, G., 1989. T-cell-mediated protection of mice against virulent Mycobacterium tuberculosis. Infect. Immun. 57, 390–395.
Levitz, S.M., Tabuni, A., Kornfeld, H., Reardon, C.C., Golenbock, D.T., 1994. Production of tumor necrosis factor alpha in human leukocytes stimulated by Cryptococcus neoformans. Infect. Immun. 62, 1975–1981.
Levy, J.A., 2009. HIV pathogenesis: 25 years of progress and persistent challenges. AIDS Lond. Engl. 23, 147–160. doi:10.1097/QAD.0b013e3283217f9f
Li, C., Corraliza, I., Langhorne, J., 1999. A defect in interleukin-10 leads to enhanced malarial disease in Plasmodium chabaudi chabaudi infection in mice. Infect. Immun. 67, 4435–4442.
Li, H., Bar, K.J., Wang, S., Decker, J.M., Chen, Y., Sun, C., Salazar-Gonzalez, J.F., Salazar, M.G., Learn, G.H., Morgan, C.J., Schumacher, J.E., Hraber, P., Giorgi, E.E., Bhattacharya, T., Korber, B.T., Perelson, A.S., Eron, J.J., Cohen, M.S., Hicks, C.B., Haynes, B.F., Markowitz, M., Keele, B.F., Hahn, B.H., Shaw, G.M., 2010. High Multiplicity Infection by HIV-1 in Men Who Have Sex with Men. PLoS Pathog 6, e1000890. doi:10.1371/journal.ppat.1000890
Li, J., Pritchard, D.K., Wang, X., Park, D.R., Bumgarner, R.E., Schwartz, S.M., Liles, W.C., 2007. cDNA microarray analysis reveals fundamental differences in the expression profiles of primary human monocytes, monocyte-derived macrophages, and alveolar macrophages. J. Leukoc. Biol. 81, 328–335. doi:10.1189/jlb.0206124
Li, S., Rouphael, N., Duraisingham, S., Romero-Steiner, S., Presnell, S., Davis, C., Schmidt, D.S., Johnson, S.E., Milton, A., Rajam, G., Kasturi, S., Carlone, G.M., Quinn, C., Chaussabel, D., Palucka, A.K., Mulligan, M.J., Ahmed, R., Stephens, D.S., Nakaya, H.I., Pulendran, B., 2014. Molecular signatures of antibody responses derived from a systems biology study of five human vaccines. Nat. Immunol. 15, 195–204. doi:10.1038/ni.2789
Li, X.-D., Wu, J., Gao, D., Wang, H., Sun, L., Chen, Z.J., 2013. Pivotal Roles of cGAS-cGAMP Signaling in Antiviral Defense and Immune Adjuvant Effects. Science 341, 1390–1394. doi:10.1126/science.1244040
Liang, F., Bond, E., Sandgren, K.J., Smed-Sörensen, A., Rangaka, M.X., Lange, C., Koup, R.A., McComsey, G.A., Lederman, M.M., Wilkinson, R.J., Andersson, J., Loré, K., 2013. Dendritic cell recruitment in response to skin antigen tests in HIV-1-infected individuals correlates with the level of T-cell infiltration. AIDS Lond. Engl. 27, 1071–1080. doi:10.1097/QAD.0b013e32835ecaca
Lin, L., Hou, J., Ma, F., Wang, P., Liu, X., Li, N., Wang, J., Wang, Q., Cao, X., 2013. Type I IFN Inhibits Innate IL-10 Production in Macrophages through Histone Deacetylase 11 by Downregulating MicroRNA-145. J. Immunol. Baltim. Md 1950 191, 3896–3904. doi:10.4049/jimmunol.1203450
Lin, M.-T., Storer, B., Martin, P.J., Tseng, L.-H., Gooley, T., Chen, P.-J., Hansen, J.A., 2003. Relation of an interleukin-10 promoter polymorphism to graft-versus-host disease and survival after hematopoietic-cell transplantation. N. Engl. J. Med. 349, 2201–2210. doi:10.1056/NEJMoa022060
Lin, P.L., Ford, C.B., Coleman, M.T., Myers, A.J., Gawande, R., Ioerger, T., Sacchettini, J., Fortune, S.M., Flynn, J.L., 2014. Sterilization of granulomas is common in active and latent tuberculosis despite within-host variability in bacterial killing. Nat. Med. 20, 75–79. doi:10.1038/nm.3412

Reference List
371
Lin, P.L., Rodgers, M., Smith, L., Bigbee, M., Myers, A., Bigbee, C., Chiosea, I., Capuano, S.V., Fuhrman, C., Klein, E., Flynn, J.L., 2009. Quantitative Comparison of Active and Latent Tuberculosis in the Cynomolgus Macaque Model. Infect. Immun. 77, 4631–4642. doi:10.1128/IAI.00592-09
Linnemann, T., Zheng, Y.-H., Mandic, R., Peterlin, B.M., 2002. Interaction between Nef and phosphatidylinositol-3-kinase leads to activation of p21-activated kinase and increased production of HIV. Virology 294, 246–255. doi:10.1006/viro.2002.1365
Liu, H., Shi, B., Huang, C.-C., Eksarko, P., Pope, R.M., 2008. Transcriptional diversity during monocyte to macrophage differentiation. Immunol. Lett. 117, 70–80. doi:10.1016/j.imlet.2007.12.012
Liu, P., Cheng, H., Roberts, T.M., Zhao, J.J., 2009. Targeting the phosphoinositide 3-kinase pathway in cancer. Nat. Rev. Drug Discov. 8, 627–644. doi:10.1038/nrd2926
Lokken, K.L., Mooney, J.P., Butler, B.P., Xavier, M.N., Chau, J.Y., Schaltenberg, N., Begum, R.H., Müller, W., Luckhart, S., Tsolis, R.M., 2014. Malaria Parasite Infection Compromises Control of Concurrent Systemic Non-typhoidal Salmonella Infection via IL-10-Mediated Alteration of Myeloid Cell Function. PLoS Pathog 10, e1004049. doi:10.1371/journal.ppat.1004049
London, A., Cohen, M., Schwartz, M., 2013. Microglia and monocyte-derived macrophages: functionally distinct populations that act in concert in CNS plasticity and repair. Front. Cell. Neurosci. 7, 34. doi:10.3389/fncel.2013.00034
Loo, Y.-M., Gale, M., 2011. Immune signaling by RIG-I-like receptors. Immunity 34, 680–692. doi:10.1016/j.immuni.2011.05.003
Luban, J., 2012. Innate Immune Sensing of HIV-1 by Dendritic Cells. Cell Host Microbe 12, 408–418. doi:10.1016/j.chom.2012.10.002
Lucas, T., Waisman, A., Ranjan, R., Roes, J., Krieg, T., Müller, W., Roers, A., Eming, S.A., 2010. Differential roles of macrophages in diverse phases of skin repair. J. Immunol. Baltim. Md 1950 184, 3964–3977. doi:10.4049/jimmunol.0903356
Luetkemeyer, A.F., Charlebois, E.D., Flores, L.L., Bangsberg, D.R., Deeks, S.G., Martin, J.N., Havlir, D.V., 2007. Comparison of an interferon-gamma release assay with tuberculin skin testing in HIV-infected individuals. Am. J. Respir. Crit. Care Med. 175, 737–742. doi:10.1164/rccm.200608-1088OC
Luo, W., Friedman, M.S., Shedden, K., Hankenson, K.D., Woolf, P.J., 2009. GAGE: generally applicable gene set enrichment for pathway analysis. BMC Bioinformatics 10, 161. doi:10.1186/1471-2105-10-161
Lupo, P., Chang, Y.C., Kelsall, B.L., Farber, J.M., Pietrella, D., Vecchiarelli, A., Leon, F., Kwon-Chung, K.J., 2008. The presence of capsule in Cryptococcus neoformans influences the gene expression profile in dendritic cells during interaction with the fungus. Infect. Immun. 76, 1581–1589. doi:10.1128/IAI.01184-07
Ma, W., Lim, W., Gee, K., Aucoin, S., Nandan, D., Kozlowski, M., Diaz-Mitoma, F., Kumar, A., 2001. The p38 mitogen-activated kinase pathway regulates the human interleukin-10 promoter via the activation of Sp1 transcription factor in lipopolysaccharide-stimulated human macrophages. J. Biol. Chem. 276, 13664–13674. doi:10.1074/jbc.M011157200
Maartens, G., Wilkinson, R.J., 2007. Tuberculosis. Lancet 370, 2030–2043. doi:10.1016/S0140-6736(07)61262-8
Mackaness, G.B., 1964. The immunological basis of acquired cellular resistance. J. Exp. Med. 120, 105–120.
Mackaness, G.B., 1967. The Relationship of Delayed Hypersensitivity to Acquired Cellular Resistance. Br. Med. Bull. 23, 52–54.
Maddocks, S., Scandurra, G.M., Nourse, C., Bye, C., Williams, R.B., Slobedman, B., Cunningham, A.L., Britton, W.J., 2009. Gene expression in HIV-1/Mycobacterium tuberculosis co-infected macrophages is dominated by M. tuberculosis. Tuberc. Edinb. Scotl. 89, 285–293. doi:10.1016/j.tube.2009.05.003
Maddon, P.J., Dalgleish, A.G., McDougal, J.S., Clapham, P.R., Weiss, R.A., Axel, R., 1986. The T4 gene encodes the AIDS virus receptor and is expressed in the immune system and the brain. Cell 47, 333–348.

Reference List
372
Maeda, N., Nigou, J., Herrmann, J.-L., Jackson, M., Amara, A., Lagrange, P.H., Puzo, G., Gicquel, B., Neyrolles, O., 2003. The cell surface receptor DC-SIGN discriminates between Mycobacterium species through selective recognition of the mannose caps on lipoarabinomannan. J. Biol. Chem. 278, 5513–5516. doi:10.1074/jbc.C200586200
Maertzdorf, J., Weiner, J., 3rd, Mollenkopf, H.-J., TBornotTB Network, Bauer, T., Prasse, A., Müller-Quernheim, J., Kaufmann, S.H.E., 2012. Common patterns and disease-related signatures in tuberculosis and sarcoidosis. Proc. Natl. Acad. Sci. U. S. A. 109, 7853–7858. doi:10.1073/pnas.1121072109
Magnusson, M., Bentzon, M.W., 1958. Preparation of purified tuberculin RT 23. Bull. World Health Organ. 19, 829–843.
Mahnke, Y.D., Greenwald, J.H., Dersimonian, R., Roby, G., Antonelli, L.R.V., Sher, A., Roederer, M., Sereti, I., 2012. Selective expansion of polyfunctional pathogen-specific CD4+ T cells in HIV-1-infected patients with immune reconstitution inflammatory syndrome. Blood. doi:10.1182/blood-2011-09-380840
Mak, K.S., Funnell, A.P.W., Pearson, R.C.M., Crossley, M., 2011. PU.1 and Haematopoietic Cell Fate: Dosage Matters. Int. J. Cell Biol. 2011, e808524. doi:10.1155/2011/808524
Manca, C., Tsenova, L., Bergtold, A., Freeman, S., Tovey, M., Musser, J.M., Barry, C.E., Freedman, V.H., Kaplan, G., 2001. Virulence of a Mycobacterium tuberculosis clinical isolate in mice is determined by failure to induce Th1 type immunity and is associated with induction of IFN-alpha /beta. Proc. Natl. Acad. Sci. U. S. A. 98, 5752–5757. doi:10.1073/pnas.091096998
Mangan, P.R., Harrington, L.E., O’Quinn, D.B., Helms, W.S., Bullard, D.C., Elson, C.O., Hatton, R.D., Wahl, S.M., Schoeb, T.R., Weaver, C.T., 2006. Transforming growth factor-β induces development of the TH17 lineage. Nature 441, 231–234. doi:10.1038/nature04754
Mangeat, B., Turelli, P., Caron, G., Friedli, M., Perrin, L., Trono, D., 2003. Broad antiretroviral defence by human APOBEC3G through lethal editing of nascent reverse transcripts. Nature 424, 99–103. doi:10.1038/nature01709
Mantovani, A., Sica, A., Sozzani, S., Allavena, P., Vecchi, A., Locati, M., 2004. The chemokine system in diverse forms of macrophage activation and polarization. Trends Immunol. 25, 677–686. doi:10.1016/j.it.2004.09.015
Marais, S., Wilkinson, K.A., Lesosky, M., Coussens, A.K., Deffur, A., Pepper, D.J., Schutz, C., Ismail, Z., Meintjes, G., Wilkinson, R.J., 2014. Neutrophil-associated central nervous system inflammation in tuberculous meningitis immune reconstitution inflammatory syndrome. Clin. Infect. Dis. Off. Publ. Infect. Dis. Soc. Am. doi:10.1093/cid/ciu641
Margolis, L., Shattock, R., 2006. Selective transmission of CCR5-utilizing HIV-1: the “gatekeeper” problem resolved? Nat Rev Micro 4, 312–317. doi:10.1038/nrmicro1387
Markowitz, N., Hansen, N.I., Wilcosky, T.C., Hopewell, P.C., Glassroth, J., Kvale, P.A., Mangura, B.T., Osmond, D., Wallace, J.M., Rosen, M.J., Reichman, L.B., 1993. Tuberculin and anergy testing in HIV-seropositive and HIV-seronegative persons. Pulmonary Complications of HIV Infection Study Group. Ann. Intern. Med. 119, 185–193.
Marlink, R., Kanki, P., Thior, I., Travers, K., Eisen, G., Siby, T., Traore, I., Hsieh, C.C., Dia, M.C., Gueye, E.H., Et, A., 1994. Reduced rate of disease development after HIV-2 infection as compared to HIV-1. Science 265, 1587–1590. doi:10.1126/science.7915856
Marsden, M.D., Kovochich, M., Suree, N., Shimizu, S., Mehta, R., Cortado, R., Bristol, G., An, D.S., Zack, J.A., 2012. HIV latency in the humanized BLT mouse. J. Virol. 86, 339–347. doi:10.1128/JVI.06366-11
Martinez, F.O., Gordon, S., 2014. The M1 and M2 paradigm of macrophage activation: time for reassessment. F1000prime Rep. 6, 13. doi:10.12703/P6-13
Martinez, F.O., Gordon, S., Locati, M., Mantovani, A., 2006. Transcriptional profiling of the human monocyte-to-macrophage differentiation and polarization: new molecules and patterns of gene expression. J. Immunol. Baltim. Md 1950 177, 7303–7311.
Martinez, F.O., Helming, L., Milde, R., Varin, A., Melgert, B.N., Draijer, C., Thomas, B., Fabbri, M., Crawshaw, A., Ho, L.P., Hacken, N.H.T., Jiménez, V.C., Kootstra, N.A., Hamann, J., Greaves, D.R., Locati, M., Mantovani, A., Gordon, S., 2013. Genetic programs expressed in resting and IL-4 alternatively activated mouse and human macrophages: similarities and differences. Blood 121, e57–e69. doi:10.1182/blood-2012-06-436212

Reference List
373
Matthews, K., Ntsekhe, M., Syed, F., Scriba, T., Russell, J., Tibazarwa, K., Deffur, A., Hanekom, W., Mayosi, B.M., Wilkinson, R.J., Wilkinson, K.A., 2012. HIV-1 infection alters CD4+ memory T-cell phenotype at the site of disease in extrapulmonary tuberculosis. Eur. J. Immunol. 42, 147–157. doi:10.1002/eji.201141927
Mattila, J.T., Diedrich, C.R., Lin, P.L., Phuah, J., Flynn, J.L., 2011. Simian immunodeficiency virus-induced changes in T cell cytokine responses in cynomolgus macaques with latent Mycobacterium tuberculosis infection are associated with timing of reactivation. J. Immunol. Baltim. Md 1950 186, 3527–3537. doi:10.4049/jimmunol.1003773
Mayer-Barber, K.D., Andrade, B.B., Barber, D.L., Hieny, S., Feng, C.G., Caspar, P., Oland, S., Gordon, S., Sher, A., 2011. Innate and adaptive interferons suppress IL-1α and IL-1β production by distinct pulmonary myeloid subsets during Mycobacterium tuberculosis infection. Immunity 35, 1023–1034. doi:10.1016/j.immuni.2011.12.002
Mayer-Barber, K.D., Andrade, B.B., Oland, S.D., Amaral, E.P., Barber, D.L., Gonzales, J., Derrick, S.C., Shi, R., Kumar, N.P., Wei, W., Yuan, X., Zhang, G., Cai, Y., Babu, S., Catalfamo, M., Salazar, A.M., Via, L.E., Barry Iii, C.E., Sher, A., 2014. Host-directed therapy of tuberculosis based on interleukin-1 and type I interferon crosstalk. Nature advance online publication. doi:10.1038/nature13489
Mazzolini, J., Herit, F., Bouchet, J., Benmerah, A., Benichou, S., Niedergang, F., 2010. Inhibition of phagocytosis in HIV-1-infected macrophages relies on Nef-dependent alteration of focal delivery of recycling compartments. Blood 115, 4226–4236. doi:10.1182/blood-2009-12-259473
McNab, F.W., Ewbank, J., Rajsbaum, R., Stavropoulos, E., Martirosyan, A., Redford, P.S., Wu, X., Graham, C.M., Saraiva, M., Tsichlis, P., Chaussabel, D., Ley, S.C., O’Garra, A., 2013. TPL-2-ERK1/2 signaling promotes host resistance against intracellular bacterial infection by negative regulation of type I IFN production. J. Immunol. Baltim. Md 1950 191, 1732–1743. doi:10.4049/jimmunol.1300146
McQuiston, T.J., Williamson, P.R., 2011. Paradoxical roles of alveolar macrophages in the host response to Cryptococcus neoformans. J. Infect. Chemother. Off. J. Jpn. Soc. Chemother. doi:10.1007/s10156-011-0306-2
Means, T.K., Wang, S., Lien, E., Yoshimura, A., Golenbock, D.T., Fenton, M.J., 1999. Human Toll-Like Receptors Mediate Cellular Activation by Mycobacterium tuberculosis. J. Immunol. 163, 3920–3927.
Medzhitov, R., 2009. Approaching the asymptote: 20 years later. Immunity 30, 766–775. doi:10.1016/j.immuni.2009.06.004
Medzhitov, R., Horng, T., 2009. Transcriptional control of the inflammatory response. Nat. Rev. Immunol. 9, 692–703. doi:10.1038/nri2634
Medzhitov, R., Preston-Hurlburt, P., Janeway, C.A., 1997. A human homologue of the Drosophila Toll protein signals activation of adaptive immunity. Nature 388, 394–397. doi:10.1038/41131
Medzhitov, R., Preston-Hurlburt, P., Janeway, C.A., 1997. A human homologue of the Drosophila Toll protein signals activation of adaptive immunity. Nature 388, 394–397.
Meintjes, G., Lawn, S.D., Scano, F., Maartens, G., French, M.A., Worodria, W., Elliott, J.H., Murdoch, D., Wilkinson, R.J., Seyler, C., John, L., van der Loeff, M.S., Reiss, P., Lynen, L., Janoff, E.N., Gilks, C., Colebunders, R., 2008a. Tuberculosis-associated immune reconstitution inflammatory syndrome: case definitions for use in resource-limited settings. Lancet Infect. Dis. 8, 516–523. doi:10.1016/S1473-3099(08)70184-1
Meintjes, G., Scriven, J., Marais, S., 2012. Management of the immune reconstitution inflammatory syndrome. Curr. HIV/AIDS Rep. 9, 238–250. doi:10.1007/s11904-012-0129-5
Meintjes, G., Wilkinson, K.A., Rangaka, M.X., Skolimowska, K., van Veen, K., Abrahams, M., Seldon, R., Pepper, D.J., Rebe, K., Mouton, P., van Cutsem, G., Nicol, M.P., Maartens, G., Wilkinson, R.J., 2008b. Type 1 helper T cells and FoxP3-positive T cells in HIV-tuberculosis-associated immune reconstitution inflammatory syndrome. Am. J. Respir. Crit. Care Med. 178, 1083–1089. doi:10.1164/rccm.200806-858OC
Meraz, M.A., White, J.M., Sheehan, K.C., Bach, E.A., Rodig, S.J., Dighe, A.S., Kaplan, D.H., Riley, J.K., Greenlund, A.C., Campbell, D., Carver-Moore, K., DuBois, R.N., Clark, R., Aguet, M., Schreiber, R.D., 1996. Targeted disruption of the Stat1 gene in mice reveals unexpected physiologic specificity in the JAK-STAT signaling pathway. Cell 84, 431–442.

Reference List
374
Meroni, L., Trabattoni, D., Balotta, C., Riva, C., Gori, A., Moroni, M., Luisa Villa, M., Clerici, M., Galli, M., 1996. Evidence for type 2 cytokine production and lymphocyte activation in the early phases of HIV-1 infection. AIDS Lond. Engl. 10, 23–30.
Meyaard, L., Otto, S.A., Jonker, R.R., Mijnster, M.J., Keet, R.P., Miedema, F., 1992. Programmed death of T cells in HIV-1 infection. Science 257, 217–219.
Mildner, A., Jung, S., 2014. Development and function of dendritic cell subsets. Immunity 40, 642–656. doi:10.1016/j.immuni.2014.04.016
Millar, A.B., Miller, R.F., Foley, N.M., Meager, A., Semple, S.J.G., Rook, G.A.W., 1991. Production of Tumor Necrosis Factor-α by Blood and Lung Mononuclear Phagocytes from Patients with Human Immunodeficiency Virus-related Lung Disease. Am. J. Respir. Cell Mol. Biol. 5, 144–148. doi:10.1165/ajrcmb/5.2.144
Mills, C.D., Kincaid, K., Alt, J.M., Heilman, M.J., Hill, A.M., 2000. M-1/M-2 macrophages and the Th1/Th2 paradigm. J. Immunol. Baltim. Md 1950 164, 6166–6173.
Mishra, B.B., Moura-Alves, P., Sonawane, A., Hacohen, N., Griffiths, G., Moita, L.F., Anes, E., 2010. Mycobacterium tuberculosis protein ESAT-6 is a potent activator of the NLRP3/ASC inflammasome. Cell. Microbiol. 12, 1046–1063. doi:10.1111/j.1462-5822.2010.01450.x
Mohammadi, P., Desfarges, S., Bartha, I., Joos, B., Zangger, N., Muñoz, M., Günthard, H.F., Beerenwinkel, N., Telenti, A., Ciuffi, A., 2013. 24 Hours in the Life of HIV-1 in a T Cell Line. PLoS Pathog 9, e1003161. doi:10.1371/journal.ppat.1003161
Mohr, H., Gravemann, U., Müller, T.H., 2009. Inactivation of pathogens in single units of therapeutic fresh plasma by irradiation with ultraviolet light. Transfusion (Paris) 49, 2144–2151. doi:10.1111/j.1537-2995.2009.02234.x
Moir, S., Fauci, A.S., 2008. Pathogenic mechanisms of B-lymphocyte dysfunction in HIV disease. J. Allergy Clin. Immunol. 122, 12–21. doi:10.1016/j.jaci.2008.04.034
Monari, C., Kozel, T.R., Paganelli, F., Pericolini, E., Perito, S., Bistoni, F., Casadevall, A., Vecchiarelli, A., 2006. Microbial immune suppression mediated by direct engagement of inhibitory Fc receptor. J. Immunol. Baltim. Md 1950 177, 6842–6851.
Monroe, K.M., Yang, Z., Johnson, J.R., Geng, X., Doitsh, G., Krogan, N.J., Greene, W.C., 2014. IFI16 DNA sensor is required for death of lymphoid CD4 T cells abortively infected with HIV. Science 343, 428–432. doi:10.1126/science.1243640
Moore, K.W., de Waal Malefyt, R., Coffman, R.L., O’Garra, A., 2001. Interleukin-10 and the interleukin-10 receptor. Annu. Rev. Immunol. 19, 683–765. doi:10.1146/annurev.immunol.19.1.683
Moore, R.D., Chaisson, R.E., 1996. Natural History of Opportunistic Disease in an HIV-Infected Urban Clinical Cohort. Ann. Intern. Med. 124, 633–642. doi:10.7326/0003-4819-124-7-199604010-00003
Moorjani, H., Craddock, B., Morrison, S.A., Steigbigel, R., 1996. Impairment of Phagosome-Lysosome Fusion in HIV-1-Infected Macrophages. [Miscellaneous Article]. J. Acquir. Immune Defic. Syndr. 13, 18–22.
Mootha, V.K., Lindgren, C.M., Eriksson, K.-F., Subramanian, A., Sihag, S., Lehar, J., Puigserver, P., Carlsson, E., Ridderstråle, M., Laurila, E., Houstis, N., Daly, M.J., Patterson, N., Mesirov, J.P., Golub, T.R., Tamayo, P., Spiegelman, B., Lander, E.S., Hirschhorn, J.N., Altshuler, D., Groop, L.C., 2003. PGC-1alpha-responsive genes involved in oxidative phosphorylation are coordinately downregulated in human diabetes. Nat. Genet. 34, 267–273. doi:10.1038/ng1180
Moreira, L.O., El Kasmi, K.C., Smith, A.M., Finkelstein, D., Fillon, S., Kim, Y.-G., Núñez, G., Tuomanen, E., Murray, P.J., 2008. The TLR2-MyD88-NOD2-RIPK2 signalling axis regulates a balanced pro-inflammatory and IL-10-mediated anti-inflammatory cytokine response to Gram-positive cell walls. Cell. Microbiol. 10, 2067–2077. doi:10.1111/j.1462-5822.2008.01189.x
Moreno, S., Baraia-Etxaburu, J., Bouza, E., Parras, F., Pérez-Tascón, M., Miralles, P., Vicente, T., Alberdi, J.C., Cosín, J., López-Gay, D., 1993. Risk for developing tuberculosis among anergic patients infected with HIV. Ann. Intern. Med. 119, 194–198.
Moretta, L., Bottino, C., Pende, D., Mingari, M.C., Biassoni, R., Moretta, A., 2002. Human natural killer cells: their origin, receptors and function. Eur. J. Immunol. 32, 1205–1211. doi:10.1002/1521-4141(200205)32:5<1205::AID-IMMU1205>3.0.CO;2-Y

Reference List
375
Morrow, C.D., Park, J., Wakefield, J.K., 1994. Viral gene products and replication of the human immunodeficiency type 1 virus. Am. J. Physiol. 266, C1135–1156.
Moser, M., 2001. Regulation of Th1/Th2 development by antigen-presenting cells in vivo. Immunobiology 204, 551–557. doi:10.1078/0171-2985-00092
Mosmann, T.R., Cherwinski, H., Bond, M.W., Giedlin, M.A., Coffman, R.L., 1986. Two types of murine helper T cell clone. I. Definition according to profiles of lymphokine activities and secreted proteins. J. Immunol. Baltim. Md 1950 136, 2348–2357.
Mosser, D.M., Edwards, J.P., 2008. Exploring the full spectrum of macrophage activation. Nat Rev Immunol 8, 958–969. doi:10.1038/nri2448
Mukherjee, S., Chen, L.-Y., Papadimos, T.J., Huang, S., Zuraw, B.L., Pan, Z.K., 2009. Lipopolysaccharide-driven Th2 Cytokine Production in Macrophages Is Regulated by Both MyD88 and TRAM. J. Biol. Chem. 284, 29391–29398. doi:10.1074/jbc.M109.005272
Müller, M., Wandel, S., Colebunders, R., Attia, S., Furrer, H., Egger, M., 2010. Immune reconstitution inflammatory syndrome in patients starting antiretroviral therapy for HIV infection: a systematic review and meta-analysis. Lancet Infect. Dis. 10, 251–261. doi:10.1016/S1473-3099(10)70026-8
Murphy, J., Summer, R., Wilson, A.A., Kotton, D.N., Fine, A., 2008. The prolonged life-span of alveolar macrophages. Am. J. Respir. Cell Mol. Biol. 38, 380–385. doi:10.1165/rcmb.2007-0224RC
Murray, P.J., 2005a. The primary mechanism of the IL-10-regulated antiinflammatory response is to selectively inhibit transcription. Proc. Natl. Acad. Sci. U. S. A. 102, 8686–8691. doi:10.1073/pnas.0500419102
Murray, P.J., 2006. Understanding and exploiting the endogenous interleukin-10/STAT3-mediated anti-inflammatory response. Curr. Opin. Pharmacol. 6, 379–386. doi:10.1016/j.coph.2006.01.010
Murray, P.J., Wynn, T.A., 2011. Protective and pathogenic functions of macrophage subsets. Nat Rev Immunol 11, 723–737. doi:10.1038/nri3073
Muthumani, K., Hwang, D.S., Choo, A.Y., Mayilvahanan, S., Dayes, N.S., Thieu, K.P., Weiner, D.B., 2005. HIV-1 Vpr inhibits the maturation and activation of macrophages and dendritic cells in vitro. Int. Immunol. 17, 103–116. doi:10.1093/intimm/dxh190
Mwandumba, H.C., Bertel Squire, S., White, S.A., Nyirenda, M.H., Kampondeni, S.D., Rhoades, E.R., Zijlstra, E.E., Molyneux, M.E., Russell, D.G., 2008. Association between sputum smear status and local immune responses at the site of disease in HIV-infected patients with pulmonary tuberculosis. Tuberc. Edinb. Scotl. 88, 58–63. doi:10.1016/j.tube.2007.06.003
Nagata, S., 2007. Autoimmune diseases caused by defects in clearing dead cells and nuclei expelled from erythroid precursors. Immunol. Rev. 220, 237–250. doi:10.1111/j.1600-065X.2007.00571.x
Naif, H.M., Li, S., Alali, M., Sloane, A., Wu, L., Kelly, M., Lynch, G., Lloyd, A., Cunningham, A.L., 1998. CCR5 expression correlates with susceptibility of maturing monocytes to human immunodeficiency virus type 1 infection. J. Virol. 72, 830–836.
Naik, S.H., Perié, L., Swart, E., Gerlach, C., van Rooij, N., de Boer, R.J., Schumacher, T.N., 2013. Diverse and heritable lineage imprinting of early haematopoietic progenitors. Nature 496, 229–232. doi:10.1038/nature12013
Naik, S.H., Sathe, P., Park, H.-Y., Metcalf, D., Proietto, A.I., Dakic, A., Carotta, S., O’Keeffe, M., Bahlo, M., Papenfuss, A., Kwak, J.-Y., Wu, L., Shortman, K., 2007. Development of plasmacytoid and conventional dendritic cell subtypes from single precursor cells derived in vitro and in vivo. Nat Immunol 8, 1217–1226. doi:10.1038/ni1522
Nair, M.G., Du, Y., Perrigoue, J.G., Zaph, C., Taylor, J.J., Goldschmidt, M., Swain, G.P., Yancopoulos, G.D., Valenzuela, D.M., Murphy, A., Karow, M., Stevens, S., Pearce, E.J., Artis, D., 2009. Alternatively activated macrophage-derived RELM-{alpha} is a negative regulator of type 2 inflammation in the lung. J. Exp. Med. 206, 937–952. doi:10.1084/jem.20082048
Naito, M., Hasegawa, G., Takahashi, K., 1997. Development, differentiation, and maturation of Kupffer cells. Microsc. Res. Tech. 39, 350–364. doi:10.1002/(SICI)1097-0029(19971115)39:4<350::AID-JEMT5>3.0.CO;2-L
Nakata, K., Rom, W.N., Honda, Y., Condos, R., Kanegasaki, S., Cao, Y., Weiden, M., 1997. Mycobacterium tuberculosis enhances human immunodeficiency virus-1 replication in the lung. Am. J. Respir. Crit. Care Med. 155, 996–1003. doi:10.1164/ajrccm.155.3.9117038

Reference List
376
Naldini, L., Blömer, U., Gallay, P., Ory, D., Mulligan, R., Gage, F.H., Verma, I.M., Trono, D., 1996. In vivo gene delivery and stable transduction of nondividing cells by a lentiviral vector. Science 272, 263–267.
Nambuya, A., Sewankambo, N., Mugerwa, J., Goodgame, R., Lucas, S., 1988. Tuberculous lymphadenitis associated with human immunodeficiency virus (HIV) in Uganda. J. Clin. Pathol. 41, 93–96.
Narayan, O., Cork, L.C., 1985. Lentiviral Diseases of Sheep and Goats: Chronic Pneumonia Leukoencephalomyelitis and Arthritis. Rev. Infect. Dis. 7, 89–98. doi:10.1093/clinids/7.1.89
Narayan, O., Wolinsky, J.S., Clements, J.E., Strandberg, J.D., Griffin, D.E., Cork, L.C., 1982. Slow Virus Replication: the Role of Macrophages in the Persistence and Expression of Visna Viruses of Sheep and Goats. J. Gen. Virol. 59, 345–356. doi:10.1099/0022-1317-59-2-345
Narayanan, A., Kehn-Hall, K., Bailey, C., Kashanchi, F., 2011. Analysis of the roles of HIV-derived microRNAs. Expert Opin. Biol. Ther. 11, 17–29. doi:10.1517/14712598.2011.540564
Nathan, C., Ding, A., 2010. Nonresolving inflammation. Cell 140, 871–882. doi:10.1016/j.cell.2010.02.029
Nathan, C.F., Murray, H.W., Wiebe, M.E., Rubin, B.Y., 1983. Identification of interferon-gamma as the lymphokine that activates human macrophage oxidative metabolism and antimicrobial activity. J. Exp. Med. 158, 670–689.
Nathan, C.F., Remold, H.G., David, J.R., 1973. Characterization of a lymphocyte factor which alters macrophage functions. J. Exp. Med. 137, 275–290.
Natoli, G., Monticelli, S., 2014. Macrophage Activation: Glancing into Diversity. Immunity 40, 175–177. doi:10.1016/j.immuni.2014.01.004
Nau, G.J., Richmond, J.F.L., Schlesinger, A., Jennings, E.G., Lander, E.S., Young, R.A., 2002. Human macrophage activation programs induced by bacterial pathogens. Proc. Natl. Acad. Sci. U. S. A. 99, 1503–1508. doi:10.1073/pnas.022649799
Nègre, D., Mangeot, P.E., Duisit, G., Blanchard, S., Vidalain, P.O., Leissner, P., Winter, A.J., Rabourdin-Combe, C., Mehtali, M., Moullier, P., Darlix, J.L., Cosset, F.L., 2000. Characterization of novel safe lentiviral vectors derived from simian immunodeficiency virus (SIVmac251) that efficiently transduce mature human dendritic cells. Gene Ther. 7, 1613–1623. doi:10.1038/sj.gt.3301292
Neil, S.J.D., Zang, T., Bieniasz, P.D., 2008. Tetherin inhibits retrovirus release and is antagonized by HIV-1 Vpu. Nature 451, 425–430. doi:10.1038/nature06553
Nelson, D.R., Lauwers, G.Y., Lau, J.Y., Davis, G.L., 2000. Interleukin 10 treatment reduces fibrosis in patients with chronic hepatitis C: a pilot trial of interferon nonresponders. Gastroenterology 118, 655–660.
Netea, M.G., Sutmuller, R., Hermann, C., Van der Graaf, C.A.A., Van der Meer, J.W.M., van Krieken, J.H., Hartung, T., Adema, G., Kullberg, B.J., 2004. Toll-like receptor 2 suppresses immunity against Candida albicans through induction of IL-10 and regulatory T cells. J. Immunol. Baltim. Md 1950 172, 3712–3718.
Newport, M.J., Huxley, C.M., Huston, S., Hawrylowicz, C.M., Oostra, B.A., Williamson, R., Levin, M., 1996. A mutation in the interferon-gamma-receptor gene and susceptibility to mycobacterial infection. N. Engl. J. Med. 335, 1941–1949. doi:10.1056/NEJM199612263352602
Nicol, M.Q., Mathys, J.-M., Pereira, A., Ollington, K., Ieong, M.H., Skolnik, P.R., 2008. Human Immunodeficiency Virus Infection Alters Tumor Necrosis Factor Alpha Production via Toll-Like Receptor-Dependent Pathways in Alveolar Macrophages and U1 Cells. J. Virol. 82, 7790–7798. doi:10.1128/JVI.00362-08
Niemand, C., Nimmesgern, A., Haan, S., Fischer, P., Schaper, F., Rossaint, R., Heinrich, P.C., Müller-Newen, G., 2003. Activation of STAT3 by IL-6 and IL-10 in primary human macrophages is differentially modulated by suppressor of cytokine signaling 3. J. Immunol. Baltim. Md 1950 170, 3263–3272.
North, R.J., 1998. Mice incapable of making IL-4 or IL-10 display normal resistance to infection with Mycobacterium tuberculosis. Clin. Exp. Immunol. 113, 55–58. doi:10.1046/j.1365-2249.1998.00636.x
Noursadeghi, M., Katz, D.R., Miller, R.F., 2006a. HIV-1 infection of mononuclear phagocytic cells: the case for bacterial innate immune deficiency in AIDS. Lancet Infect. Dis. 6, 794–804. doi:10.1016/S1473-3099(06)70656-9
Reference List
377
Noursadeghi, M., Tsang, J., Miller, R.F., Straschewski, S., Kellam, P., Chain, B.M., Katz, D.R., 2009. Genome-wide innate immune responses in HIV-1-infected macrophages are preserved despite attenuation of the NF-kappa B activation pathway. J. Immunol. Baltim. Md 1950 182, 319–328.
Noursadeghi, M., Ustianowski, A., Elgalib, A., Miller, R., 2006b. Bacterial Disease in HIV-Infected Patients. JAIDS J. Acquir. Immune Defic. Syndr. 41, 532–535. doi:10.1097/01.qai.0000209912.17695.e5
Nowak, E.C., Weaver, C.T., Turner, H., Begum-Haque, S., Becher, B., Schreiner, B., Coyle, A.J., Kasper, L.H., Noelle, R.J., 2009. IL-9 as a mediator of Th17-driven inflammatory disease. J. Exp. Med. 206, 1653–1660. doi:10.1084/jem.20090246
O’Garra, A., Barrat, F.J., Castro, A.G., Vicari, A., Hawrylowicz, C., 2008. Strategies for use of IL-10 or its antagonists in human disease. Immunol. Rev. 223, 114–131. doi:10.1111/j.1600-065X.2008.00635.x
O’Garra, A., Murphy, K.M., 2009. From IL-10 to IL-12: how pathogens and their products stimulate APCs to induce T(H)1 development. Nat. Immunol. 10, 929–932. doi:10.1038/ni0909-929
O’Garra, A., Redford, P.S., McNab, F.W., Bloom, C.I., Wilkinson, R.J., Berry, M.P.R., 2013. The immune response in tuberculosis. Annu. Rev. Immunol. 31, 475–527. doi:10.1146/annurev-immunol-032712-095939
O’Leary, S., O’Sullivan, M.P., Keane, J., 2011. IL-10 blocks phagosome maturation in mycobacterium tuberculosis-infected human macrophages. Am. J. Respir. Cell Mol. Biol. 45, 172–180. doi:10.1165/rcmb.2010-0319OC
Obermoser, G., Presnell, S., Domico, K., Xu, H., Wang, Y., Anguiano, E., Thompson-Snipes, L., Ranganathan, R., Zeitner, B., Bjork, A., Anderson, D., Speake, C., Ruchaud, E., Skinner, J., Alsina, L., Sharma, M., Dutartre, H., Cepika, A., Israelsson, E., Nguyen, P., Nguyen, Q.-A., Harrod, A.C., Zurawski, S.M., Pascual, V., Ueno, H., Nepom, G.T., Quinn, C., Blankenship, D., Palucka, K., Banchereau, J., Chaussabel, D., 2013. Systems scale interactive exploration reveals quantitative and qualitative differences in response to influenza and pneumococcal vaccines. Immunity 38, 831–844. doi:10.1016/j.immuni.2012.12.008
Odegaard, J.I., Ricardo-Gonzalez, R.R., Goforth, M.H., Morel, C.R., Subramanian, V., Mukundan, L., Red Eagle, A., Vats, D., Brombacher, F., Ferrante, A.W., Chawla, A., 2007. Macrophage-specific PPARgamma controls alternative activation and improves insulin resistance. Nature 447, 1116–1120. doi:10.1038/nature05894
Ogawa, Y., Duru, E.A., Ameredes, B.T., 2008. Role of IL-10 in the resolution of airway inflammation. Curr. Mol. Med. 8, 437–445.
Okabe, Y., Medzhitov, R., 2014. Tissue-specific signals control reversible program of localization and functional polarization of macrophages. Cell 157, 832–844. doi:10.1016/j.cell.2014.04.016
Okoye, A., Meier-Schellersheim, M., Brenchley, J.M., Hagen, S.I., Walker, J.M., Rohankhedkar, M., Lum, R., Edgar, J.B., Planer, S.L., Legasse, A., Sylwester, A.W., Piatak, M., Lifson, J.D., Maino, V.C., Sodora, D.L., Douek, D.C., Axthelm, M.K., Grossman, Z., Picker, L.J., 2007. Progressive CD4+ central memory T cell decline results in CD4+ effector memory insufficiency and overt disease in chronic SIV infection. J. Exp. Med. 204, 2171–2185. doi:10.1084/jem.20070567
Okulicz, J.F., Grandits, G.A., Dolan, M.J., Marconi, V.C., Wortmann, G., Landrum, M.L., 2012. Spontaneous virologic suppression in HIV controllers is independent of delayed-type hypersensitivity test responsiveness. AIDS Res. Ther. 9, 10. doi:10.1186/1742-6405-9-10
Oliveira, D.L., Freire-de-Lima, C.G., Nosanchuk, J.D., Casadevall, A., Rodrigues, M.L., Nimrichter, L., 2010. Extracellular vesicles from Cryptococcus neoformans modulate macrophage functions. Infect. Immun. 78, 1601–1609. doi:10.1128/IAI.01171-09
Ott, D.E., 2008. Cellular proteins detected in HIV-1. Rev. Med. Virol. 18, 159–175. doi:10.1002/rmv.570
Ottenhoff, T.H.M., Dass, R.H., Yang, N., Zhang, M.M., Wong, H.E.E., Sahiratmadja, E., Khor, C.C., Alisjahbana, B., van Crevel, R., Marzuki, S., Seielstad, M., van de Vosse, E., Hibberd, M.L., 2012. Genome-wide expression profiling identifies type 1 interferon response pathways in active tuberculosis. PloS One 7, e45839. doi:10.1371/journal.pone.0045839
Ouellet, D.L., Vigneault-Edwards, J., Létourneau, K., Gobeil, L.-A., Plante, I., Burnett, J.C., Rossi, J.J., Provost, P., 2013. Regulation of host gene expression by HIV-1 TAR microRNAs. Retrovirology 10, 86. doi:10.1186/1742-4690-10-86

Reference List
378
Ouyang, P., Rakus, K., van Beurden, S., Westphal, A., Davison, A., Gatherer, D., Vanderplasschen, A., 2013. Interleukin-10s encoded by viruses: a remarkable example of independent acquisitions of a cellular gene by viruses and its subsequent evolution in the viral genome. J. Gen. Virol. doi:10.1099/vir.0.058966-0
Ozinsky, A., Underhill, D.M., Fontenot, J.D., Hajjar, A.M., Smith, K.D., Wilson, C.B., Schroeder, L., Aderem, A., 2000. The repertoire for pattern recognition of pathogens by the innate immune system is defined by cooperation between toll-like receptors. Proc. Natl. Acad. Sci. U. S. A. 97, 13766–13771. doi:10.1073/pnas.250476497
Pace, J.L., Russell, S.W., Schreiber, R.D., Altman, A., Katz, D.H., 1983. Macrophage activation: priming activity from a T-cell hybridoma is attributable to interferon-gamma. Proc. Natl. Acad. Sci. U. S. A. 80, 3782–3786.
Pacheco, A.G., Cardoso, C.C., Moraes, M.O., 2008. IFNG +874T/A, IL10 -1082G/A and TNF -308G/A polymorphisms in association with tuberculosis susceptibility: a meta-analysis study. Hum. Genet. 123, 477–484. doi:10.1007/s00439-008-0497-5
Paladino, N., Fainboim, H., Theiler, G., Schroder, T., Munoz, A.E., Flores, A.C., Galdame, O., Fainboim, L., 2006. Gender Susceptibility to Chronic Hepatitis C Virus Infection Associated with Interleukin 10 Promoter Polymorphism. J. Virol. 80, 9144–9150. doi:10.1128/JVI.00339-06
Palella, F.J., Baker, R.K., Moorman, A.C., Chmiel, J.S., Wood, K.C., Brooks, J.T., Holmberg, S.D., 2006. Mortality in the Highly Active Antiretroviral Therapy Era: Changing Causes of Death and Disease in the HIV Outpatient Study. JAIDS J. Acquir. Immune Defic. Syndr. 43, 27–34. doi:10.1097/01.qai.0000233310.90484.16
Paludan, S.R., Bowie, A.G., 2013. Immune Sensing of DNA. Immunity 38, 870–880. doi:10.1016/j.immuni.2013.05.004
Park-Min, K.-H., Antoniv, T.T., Ivashkiv, L.B., 2005. Regulation of macrophage phenotype by long-term exposure to IL-10. Immunobiology 210, 77–86. doi:10.1016/j.imbio.2005.05.002
Patel, N.R., Swan, K., Li, X., Tachado, S.D., Koziel, H., 2009. Impaired M. tuberculosis-mediated apoptosis in alveolar macrophages from HIV+ persons: potential role of IL-10 and BCL-3. J. Leukoc. Biol. 86, 53–60. doi:10.1189/jlb.0908574
Patel, N.R., Zhu, J., Tachado, S.D., Zhang, J., Wan, Z., Saukkonen, J., Koziel, H., 2007. HIV impairs TNF-alpha mediated macrophage apoptotic response to Mycobacterium tuberculosis. J. Immunol. Baltim. Md 1950 179, 6973–6980.
Pathak, S., Wentzel-Larsen, T., Asjö, B., 2010. Effects of in vitro HIV-1 infection on mycobacterial growth in peripheral blood monocyte-derived macrophages. Infect. Immun. 78, 4022–4032. doi:10.1128/IAI.00106-10
Pazin, M.J., Sheridan, P.L., Cannon, K., Cao, Z., Keck, J.G., Kadonaga, J.T., Jones, K.A., 1996. NF-kappa B-mediated chromatin reconfiguration and transcriptional activation of the HIV-1 enhancer in vitro. Genes Dev. 10, 37–49.
Penttilä, T., Haveri, A., Tammiruusu, A., Vuola, J.M., Lahesmaa, R., Puolakkainen, M., 2008. Chlamydia pneumoniae infection in IL-10 knock out mice: accelerated clearance but severe pulmonary inflammatory response. Microb. Pathog. 45, 25–29. doi:10.1016/j.micpath.2008.02.004
Perkins, N.D., Agranoff, A.B., Pascal, E., Nabel, G.J., 1994. An interaction between the DNA-binding domains of RelA(p65) and Sp1 mediates human immunodeficiency virus gene activation. Mol. Cell. Biol. 14, 6570–6583.
Perkins, N.D., Edwards, N.L., Duckett, C.S., Agranoff, A.B., Schmid, R.M., Nabel, G.J., 1993. A cooperative interaction between NF-kappa B and Sp1 is required for HIV-1 enhancer activation. EMBO J. 12, 3551–3558.
Pfeffer, K., Matsuyama, T., Kündig, T.M., Wakeham, A., Kishihara, K., Shahinian, A., Wiegmann, K., Ohashi, P.S., Krönke, M., Mak, T.W., 1993. Mice deficient for the 55 kd tumor necrosis factor receptor are resistant to endotoxic shock, yet succumb to L. monocytogenes infection. Cell 73, 457–467.
Phair, J., Muñoz, A., Detels, R., Kaslow, R., Rinaldo, C., Saah, A., 1990. The risk of Pneumocystis carinii pneumonia among men infected with human immunodeficiency virus type 1. Multicenter AIDS Cohort Study Group. N. Engl. J. Med. 322, 161–165. doi:10.1056/NEJM199001183220304

Reference List
379
Picard, C., Fieschi, C., Altare, F., Al-Jumaah, S., Al-Hajjar, S., Feinberg, J., Dupuis, S., Soudais, C., Al-Mohsen, I.Z., Génin, E., Lammas, D., Kumararatne, D.S., Leclerc, T., Rafii, A., Frayha, H., Murugasu, B., Wah, L.B., Sinniah, R., Loubser, M., Okamoto, E., Al-Ghonaium, A., Tufenkeji, H., Abel, L., Casanova, J.-L., 2002. Inherited interleukin-12 deficiency: IL12B genotype and clinical phenotype of 13 patients from six kindreds. Am. J. Hum. Genet. 70, 336–348. doi:10.1086/338625
Pierre, P., Turley, S.J., Gatti, E., Hull, M., Meltzer, J., Mirza, A., Inaba, K., Steinman, R.M., Mellman, I., 1997. Developmental regulation of MHC class II transport in mouse dendritic cells. Nature 388, 787–792. doi:10.1038/42039
Platanias, L.C., 2005. Mechanisms of type-I- and type-II-interferon-mediated signalling. Nat. Rev. Immunol. 5, 375–386. doi:10.1038/nri1604
Poli, G., Kinter, A., Justement, J.S., Kehrl, J.H., Bressler, P., Stanley, S., Fauci, A.S., 1990. Tumor necrosis factor alpha functions in an autocrine manner in the induction of human immunodeficiency virus expression. Proc. Natl. Acad. Sci. U. S. A. 87, 782–785.
Poli, G., Kinter, A.L., Fauci, A.S., 1994. Interleukin 1 induces expression of the human immunodeficiency virus alone and in synergy with interleukin 6 in chronically infected U1 cells: inhibition of inductive effects by the interleukin 1 receptor antagonist. Proc. Natl. Acad. Sci. U. S. A. 91, 108–112.
Pollard, J.W., 2009. Trophic macrophages in development and disease. Nat. Rev. Immunol. 9, 259–270. doi:10.1038/nri2528
Popovic, M., Sarngadharan, M.G., Read, E., Gallo, R.C., 1984. Detection, isolation, and continuous production of cytopathic retroviruses (HTLV-III) from patients with AIDS and pre-AIDS. Science 224, 497–500.
Pouliot, P., Turmel, V., Gélinas, E., Laviolette, M., Bissonnette, E.Y., 2005. Interleukin-4 production by human alveolar macrophages. Clin. Exp. Allergy J. Br. Soc. Allergy Clin. Immunol. 35, 804–810. doi:10.1111/j.1365-2222.2005.02246.x
Poulter, L.W., Seymour, G.J., Duke, O., Janossy, G., Panayi, G., 1982. Immunohistological analysis of delayed-type hypersensitivity in man. Cell. Immunol. 74, 358–369.
Powell, M.J., Thompson, S.A., Tone, Y., Waldmann, H., Tone, M., 2000. Posttranscriptional regulation of IL-10 gene expression through sequences in the 3’-untranslated region. J. Immunol. Baltim. Md 1950 165, 292–296.
Pozio, E., Rezza, G., Boschini, A., Pezzotti, P., Tamburrini, A., Rossi, P., Di Fine, M., Smacchia, C., Schiesari, A., Gattei, E., Zucconi, R., Ballarini, P., 1997. Clinical cryptosporidiosis and human immunodeficiency virus (HIV)-induced immunosuppression: findings from a longitudinal study of HIV-positive and HIV-negative former injection drug users. J. Infect. Dis. 176, 969–975.
Pranada, A.L., Metz, S., Herrmann, A., Heinrich, P.C., Müller-Newen, G., 2004. Real Time Analysis of STAT3 Nucleocytoplasmic Shuttling. J. Biol. Chem. 279, 15114–15123. doi:10.1074/jbc.M312530200
Prinz, M., Priller, J., Sisodia, S.S., Ransohoff, R.M., 2011. Heterogeneity of CNS myeloid cells and their roles in neurodegeneration. Nat. Neurosci. 14, 1227–1235. doi:10.1038/nn.2923
Provost, V., Larose, M.-C., Langlois, A., Rola-Pleszczynski, M., Flamand, N., Laviolette, M., 2013. CCL26/eotaxin-3 is more effective to induce the migration of eosinophils of asthmatics than CCL11/eotaxin-1 and CCL24/eotaxin-2. J. Leukoc. Biol. jlb.0212074. doi:10.1189/jlb.0212074
Puissegur, M.-P., Botanch, C., Duteyrat, J.-L., Delsol, G., Caratero, C., Altare, F., 2004. An in vitro dual model of mycobacterial granulomas to investigate the molecular interactions between mycobacteria and human host cells. Cell. Microbiol. 6, 423–433. doi:10.1111/j.1462-5822.2004.00371.x
Quesniaux, V.J., Nicolle, D.M., Torres, D., Kremer, L., Guérardel, Y., Nigou, J., Puzo, G., Erard, F., Ryffel, B., 2004. Toll-Like Receptor 2 (TLR2)-Dependent-Positive and TLR2-Independent-Negative Regulation of Proinflammatory Cytokines by Mycobacterial Lipomannans. J. Immunol. 172, 4425–4434. doi:10.4049/jimmunol.172.7.4425
Ramakrishnan, L., 2012. Revisiting the role of the granuloma in tuberculosis. Nat. Rev. Immunol. 12, 352–366. doi:10.1038/nri3211
Rambaut, A., Posada, D., Crandall, K.A., Holmes, E.C., 2004. The causes and consequences of HIV evolution. Nat. Rev. Genet. 5, 52–61. doi:10.1038/nrg1246

Reference List
380
Randolph, G.J., Angeli, V., Swartz, M.A., 2005. Dendritic-cell trafficking to lymph nodes through lymphatic vessels. Nat. Rev. Immunol. 5, 617–628. doi:10.1038/nri1670
Rangaka, M.X., Wilkinson, K.A., Seldon, R., Van Cutsem, G., Meintjes, G.A., Morroni, C., Mouton, P., Diwakar, L., Connell, T.G., Maartens, G., Wilkinson, R.J., 2007. Effect of HIV-1 infection on T-Cell-based and skin test detection of tuberculosis infection. Am. J. Respir. Crit. Care Med. 175, 514–520. doi:10.1164/rccm.200610-1439OC
Ranjbar, S., Boshoff, H.I., Mulder, A., Siddiqi, N., Rubin, E.J., Goldfeld, A.E., 2009. HIV-1 replication is differentially regulated by distinct clinical strains of Mycobacterium tuberculosis. PloS One 4, e6116. doi:10.1371/journal.pone.0006116
Ranjbar, S., Jasenosky, L.D., Chow, N., Goldfeld, A.E., 2012. Regulation of Mycobacterium tuberculosis-Dependent HIV-1 Transcription Reveals a New Role for NFAT5 in the Toll-Like Receptor Pathway. PLoS Pathog 8, e1002620. doi:10.1371/journal.ppat.1002620
Rasaiyaah, J., Noursadeghi, M., Kellam, P., Chain, B., 2009. Transcriptional and functional defects of dendritic cells derived from the MUTZ-3 leukaemia line. Immunology 127, 429–441. doi:10.1111/j.1365-2567.2008.03018.x
Rasaiyaah, J., Tan, C.P., Fletcher, A.J., Price, A.J., Blondeau, C., Hilditch, L., Jacques, D.A., Selwood, D.L., James, L.C., Noursadeghi, M., Towers, G.J., 2013. HIV-1 evades innate immune recognition through specific cofactor recruitment. Nature 503, 402–405. doi:10.1038/nature12769
Rathinam, V.A.K., Vanaja, S.K., Fitzgerald, K.A., 2012. Regulation of inflammasome signaling. Nat. Immunol. 13, 333–332. doi:10.1038/ni.2237
Ratner, L., Haseltine, W., Patarca, R., Livak, K.J., Starcich, B., Josephs, S.F., Doran, E.R., Rafalski, J.A., Whitehorn, E.A., Baumeister, K., Ivanoff, L., Petteway, S.R., Pearson, M.L., Lautenberger, J.A., Papas, T.S., Ghrayeb, J., Chang, N.T., Gallo, R.C., Wong-Staal, F., 1985. Complete nucleotide sequence of the AIDS virus, HTLV-III. Nature 313, 277–284. doi:10.1038/313277a0
Ravindran, R., Foley, J., Stoklasek, T., Glimcher, L.H., McSorley, S.J., 2005. Expression of T-bet by CD4 T cells is essential for resistance to Salmonella infection. J. Immunol. Baltim. Md 1950 175, 4603–4610.
Reboldi, A., Dang, E.V., McDonald, J.G., Liang, G., Russell, D.W., Cyster, J.G., 2014. 25-Hydroxycholesterol suppresses interleukin-1–driven inflammation downstream of type I interferon. Science 345, 679–684. doi:10.1126/science.1254790
Redford, P.S., Boonstra, A., Read, S., Pitt, J., Graham, C., Stavropoulos, E., Bancroft, G.J., O’Garra, A., 2010. Enhanced protection to Mycobacterium tuberculosis infection in IL-10-deficient mice is accompanied by early and enhanced Th1 responses in the lung. Eur. J. Immunol. 40, 2200–2210. doi:10.1002/eji.201040433
Redford, P.S., Mayer-Barber, K.D., McNab, F.W., Stavropoulos, E., Wack, A., Sher, A., O’Garra, A., 2014. Influenza A virus impairs control of Mycobacterium tuberculosis coinfection through a type I interferon receptor-dependent pathway. J. Infect. Dis. 209, 270–274. doi:10.1093/infdis/jit424
Redford, P.S., Murray, P.J., O’Garra, A., 2011. The role of IL-10 in immune regulation during M. tuberculosis infection. Mucosal Immunol. doi:10.1038/mi.2011.7
Reid, D.M., Gow, N.A.R., Brown, G.D., 2009. Pattern recognition: recent insights from Dectin-1. Curr. Opin. Immunol. 21, 30–37. doi:10.1016/j.coi.2009.01.003
Reiling, N., Hölscher, C., Fehrenbach, A., Kröger, S., Kirschning, C.J., Goyert, S., Ehlers, S., 2002. Cutting Edge: Toll-Like Receptor (TLR)2- and TLR4-Mediated Pathogen Recognition in Resistance to Airborne Infection with Mycobacterium tuberculosis. J. Immunol. 169, 3480–3484. doi:10.4049/jimmunol.169.7.3480
Rep, M.H., Schrijver, H.M., van Lopik, T., Hintzen, R.Q., Roos, M.T., Adèr, H.J., Polman, C.H., van Lier, R.A., 1999. Interferon (IFN)-beta treatment enhances CD95 and interleukin 10 expression but reduces interferon-gamma producing T cells in MS patients. J. Neuroimmunol. 96, 92–100.
Rhodes, D.R., Kalyana-Sundaram, S., Mahavisno, V., Barrette, T.R., Ghosh, D., Chinnaiyan, A.M., 2005. Mining for regulatory programs in the cancer transcriptome. Nat. Genet. 37, 579–583. doi:10.1038/ng1578
Riemann, M., Endres, R., Liptay, S., Pfeffer, K., Schmid, R.M., 2005. The IkappaB protein Bcl-3 negatively regulates transcription of the IL-10 gene in macrophages. J. Immunol. Baltim. Md 1950 175, 3560–3568.

Reference List
381
Riley, J.K., Takeda, K., Akira, S., Schreiber, R.D., 1999. Interleukin-10 Receptor Signaling through the JAK-STAT Pathway REQUIREMENT FOR TWO DISTINCT RECEPTOR-DERIVED SIGNALS FOR ANTI-INFLAMMATORY ACTION. J. Biol. Chem. 274, 16513–16521. doi:10.1074/jbc.274.23.16513
Ringnér, M., 2008. What is principal component analysis? Nat. Biotechnol. 26, 303–304. doi:10.1038/nbt0308-303
Rivas-Santiago, B., Sada, E., Tsutsumi, V., Aguilar-León, D., Contreras, J.L., Hernández-Pando, R., 2006. β-Defensin Gene Expression during the Course of Experimental Tuberculosis Infection. J. Infect. Dis. 194, 697–701. doi:10.1086/506454
Robbins, S.H., Walzer, T., Dembélé, D., Thibault, C., Defays, A., Bessou, G., Xu, H., Vivier, E., Sellars, M., Pierre, P., Sharp, F.R., Chan, S., Kastner, P., Dalod, M., 2008. Novel insights into the relationships between dendritic cell subsets in human and mouse revealed by genome-wide expression profiling. Genome Biol. 9, R17. doi:10.1186/gb-2008-9-1-r17
Roca, F.J., Ramakrishnan, L., 2013. TNF dually mediates resistance and susceptibility to mycobacteria via mitochondrial reactive oxygen species. Cell 153, 521–534. doi:10.1016/j.cell.2013.03.022
Rodig, S.J., Meraz, M.A., White, J.M., Lampe, P.A., Riley, J.K., Arthur, C.D., King, K.L., Sheehan, K.C., Yin, L., Pennica, D., Johnson, E.M., Schreiber, R.D., 1998. Disruption of the Jak1 gene demonstrates obligatory and nonredundant roles of the Jaks in cytokine-induced biologic responses. Cell 93, 373–383.
Roers, A., Siewe, L., Strittmatter, E., Deckert, M., Schlüter, D., Stenzel, W., Gruber, A.D., Krieg, T., Rajewsky, K., Müller, W., 2004. T cell-specific inactivation of the interleukin 10 gene in mice results in enhanced T cell responses but normal innate responses to lipopolysaccharide or skin irritation. J. Exp. Med. 200, 1289–1297. doi:10.1084/jem.20041789
Roeth, J.F., Collins, K.L., 2006. Human immunodeficiency virus type 1 Nef: adapting to intracellular trafficking pathways. Microbiol. Mol. Biol. Rev. MMBR 70, 548–563. doi:10.1128/MMBR.00042-05
Rojas, M., Olivier, M., Gros, P., Barrera, L.F., García, L.F., 1999. TNF-α and IL-10 Modulate the Induction of Apoptosis by Virulent Mycobacterium tuberculosis in Murine Macrophages. J. Immunol. 162, 6122–6131.
Rosas, M., Davies, L.C., Giles, P.J., Liao, C.-T., Kharfan, B., Stone, T.C., O’Donnell, V.B., Fraser, D.J., Jones, S.A., Taylor, P.R., 2014. The Transcription Factor Gata6 Links Tissue Macrophage Phenotype and Proliferative Renewal. Science 344, 645–648. doi:10.1126/science.1251414
Rothenberg, M.E., Hogan, S.P., 2006. The eosinophil. Annu. Rev. Immunol. 24, 147–174. doi:10.1146/annurev.immunol.24.021605.090720
Rothfuchs, A.G., Bafica, A., Feng, C.G., Egen, J.G., Williams, D.L., Brown, G.D., Sher, A., 2007. Dectin-1 interaction with Mycobacterium tuberculosis leads to enhanced IL-12p40 production by splenic dendritic cells. J. Immunol. Baltim. Md 1950 179, 3463–3471.
Rudick, R.A., Ransohoff, R.M., Peppler, R., VanderBrug Medendorp, S., Lehmann, P., Alam, J., 1996. Interferon beta induces interleukin-10 expression: relevance to multiple sclerosis. Ann. Neurol. 40, 618–627. doi:10.1002/ana.410400412
Rusinova, I., Forster, S., Yu, S., Kannan, A., Masse, M., Cumming, H., Chapman, R., Hertzog, P.J., 2013. INTERFEROME v2.0: an updated database of annotated interferon-regulated genes. Nucleic Acids Res. 41, D1040–D1046. doi:10.1093/nar/gks1215
Russell, D.G., 2007. Who puts the tubercle in tuberculosis? Nat. Rev. Microbiol. 5, 39–47. doi:10.1038/nrmicro1538
Russell, D.G., Cardona, P.-J., Kim, M.-J., Allain, S., Altare, F., 2009. Foamy macrophages and the progression of the human tuberculosis granuloma. Nat. Immunol. 10, 943–948. doi:10.1038/ni.1781
Russell, D.G., VanderVen, B.C., Lee, W., Abramovitch, R.B., Kim, M., Homolka, S., Niemann, S., Rohde, K.H., 2010. Mycobacterium tuberculosis Wears What It Eats. Cell Host Microbe 8, 68–76. doi:10.1016/j.chom.2010.06.002
Sabiiti, W., May, R.C., Pursall, E.R., 2012. Experimental models of cryptococcosis. Int. J. Microbiol. 2012, 626745. doi:10.1155/2012/626745

Reference List
382
Sakai, S., Mayer-Barber, K.D., Barber, D.L., 2014. Defining features of protective CD4 T cell responses to Mycobacterium tuberculosis. Curr. Opin. Immunol., Host pathogens * Immune senescence 29, 137–142. doi:10.1016/j.coi.2014.06.003
Sakata, A., Ida, E., Tominaga, M., Onoue, K., 1987. Arachidonic acid acts as an intracellular activator of NADPH-oxidase in Fc gamma receptor-mediated superoxide generation in macrophages. J. Immunol. Baltim. Md 1950 138, 4353–4359.
Sakula, A., 1982. Robert Koch: centenary of the discovery of the tubercle bacillus, 1882. Thorax 37, 246–251. doi:10.1136/thx.37.4.246
Salazar-Gonzalez, J.F., Salazar, M.G., Keele, B.F., Learn, G.H., Giorgi, E.E., Li, H., Decker, J.M., Wang, S., Baalwa, J., Kraus, M.H., Parrish, N.F., Shaw, K.S., Guffey, M.B., Bar, K.J., Davis, K.L., Ochsenbauer-Jambor, C., Kappes, J.C., Saag, M.S., Cohen, M.S., Mulenga, J., Derdeyn, C.A., Allen, S., Hunter, E., Markowitz, M., Hraber, P., Perelson, A.S., Bhattacharya, T., Haynes, B.F., Korber, B.T., Hahn, B.H., Shaw, G.M., 2009. Genetic identity, biological phenotype, and evolutionary pathways of transmitted/founder viruses in acute and early HIV-1 infection. J. Exp. Med. 206, 1273–1289. doi:10.1084/jem.20090378
Sandler, N.G., Bosinger, S.E., Estes, J.D., Zhu, R.T.R., Tharp, G.K., Boritz, E., Levin, D., Wijeyesinghe, S., Makamdop, K.N., del Prete, G.Q., Hill, B.J., Timmer, J.K., Reiss, E., Yarden, G., Darko, S., Contijoch, E., Todd, J.P., Silvestri, G., Nason, M., Norgren Jr, R.B., Keele, B.F., Rao, S., Langer, J.A., Lifson, J.D., Schreiber, G., Douek, D.C., 2014. Type I interferon responses in rhesus macaques prevent SIV infection and slow disease progression. Nature 511, 601–605. doi:10.1038/nature13554
Saraiva, M., Christensen, J.R., Tsytsykova, A.V., Goldfeld, A.E., Ley, S.C., Kioussis, D., O’Garra, A., 2005. Identification of a macrophage-specific chromatin signature in the IL-10 locus. J. Immunol. Baltim. Md 1950 175, 1041–1046.
Saraiva, M., Christensen, J.R., Veldhoen, M., Murphy, T.L., Murphy, K.M., O’Garra, A., 2009. Interleukin-10 production by Th1 cells requires interleukin-12-induced STAT4 transcription factor and ERK MAP kinase activation by high antigen dose. Immunity 31, 209–219. doi:10.1016/j.immuni.2009.05.012
Saraiva, M., O’Garra, A., 2010. The regulation of IL-10 production by immune cells. Nat. Rev. Immunol. 10, 170–181. doi:10.1038/nri2711
Sarrazin, H., Wilkinson, K.A., Andersson, J., Rangaka, M.X., Radler, L., van Veen, K., Lange, C., Wilkinson, R.J., 2009. Association between tuberculin skin test reactivity, the memory CD4 cell subset, and circulating FoxP3-expressing cells in HIV-infected persons. J. Infect. Dis. 199, 702–710. doi:10.1086/596735
Sasaki, Y., Nomura, A., Kusuhara, K., Takada, H., Ahmed, S., Obinata, K., Hamada, K., Okimoto, Y., Hara, T., 2002. Genetic Basis of Patients with Bacille Calmette-Guérin Osteomyelitis in Japan: Identification of Dominant Partial Interferon-γ Receptor 1 Deficiency as a Predominant Type. J. Infect. Dis. 185, 706–709. doi:10.1086/339011
Satoh, T., Takeuchi, O., Vandenbon, A., Yasuda, K., Tanaka, Y., Kumagai, Y., Miyake, T., Matsushita, K., Okazaki, T., Saitoh, T., Honma, K., Matsuyama, T., Yui, K., Tsujimura, T., Standley, D.M., Nakanishi, K., Nakai, K., Akira, S., 2010. The Jmjd3-Irf4 axis regulates M2 macrophage polarization and host responses against helminth infection. Nat. Immunol. 11, 936–944. doi:10.1038/ni.1920
Satpathy, A.T., Wu, X., Albring, J.C., Murphy, K.M., 2012. Re(de)fining the dendritic cell lineage. Nat. Immunol. 13, 1145–1154. doi:10.1038/ni.2467
Schäfer, G., Jacobs, M., Wilkinson, R.J., Brown, G.D., 2009. Non-opsonic recognition of Mycobacterium tuberculosis by phagocytes. J. Innate Immun. 1, 231–243. doi:10.1159/000173703
Schaljo, B., Kratochvill, F., Gratz, N., Sadzak, I., Sauer, I., Hammer, M., Vogl, C., Strobl, B., Müller, M., Blackshear, P.J., Poli, V., Lang, R., Murray, P.J., Kovarik, P., 2009. Tristetraprolin is required for full anti-inflammatory response of murine macrophages to IL-10. J. Immunol. Baltim. Md 1950 183, 1197–1206. doi:10.4049/jimmunol.0803883
Scheller, J., Chalaris, A., Schmidt-Arras, D., Rose-John, S., 2011. The pro- and anti-inflammatory properties of the cytokine interleukin-6. Biochim. Biophys. Acta BBA - Mol. Cell Res., Including the Special Section: 11th European Symposium on Calcium 1813, 878–888. doi:10.1016/j.bbamcr.2011.01.034

Reference List
383
Scheynius, A., Klareskog, L., Forsum, U., 1982. In situ identification of T lymphocyte subsets and HLA-DR expressing cells in the human skin tuberculin reaction. Clin. Exp. Immunol. 49, 325–330.
Schmid, M.A., Kingston, D., Boddupalli, S., Manz, M.G., 2010. Instructive cytokine signals in dendritic cell lineage commitment. Immunol. Rev. 234, 32–44. doi:10.1111/j.0105-2896.2009.00877.x
Schneider, W.M., Chevillotte, M.D., Rice, C.M., 2014. Interferon-stimulated genes: a complex web of host defenses. Annu. Rev. Immunol. 32, 513–545. doi:10.1146/annurev-immunol-032713-120231
Schopman, N.C.T., Willemsen, M., Liu, Y.P., Bradley, T., van Kampen, A., Baas, F., Berkhout, B., Haasnoot, J., 2012. Deep sequencing of virus-infected cells reveals HIV-encoded small RNAs. Nucleic Acids Res. 40, 414–427. doi:10.1093/nar/gkr719
Schraml, B.U., van Blijswijk, J., Zelenay, S., Whitney, P.G., Filby, A., Acton, S.E., Rogers, N.C., Moncaut, N., Carvajal, J.J., Reis e Sousa, C., 2013. Genetic tracing via DNGR-1 expression history defines dendritic cells as a hematopoietic lineage. Cell 154, 843–858. doi:10.1016/j.cell.2013.07.014
Schreiber, T., Ehlers, S., Heitmann, L., Rausch, A., Mages, J., Murray, P.J., Lang, R., Hölscher, C., 2009. Autocrine IL-10 induces hallmarks of alternative activation in macrophages and suppresses antituberculosis effector mechanisms without compromising T cell immunity. J. Immunol. Baltim. Md 1950 183, 1301–1312. doi:10.4049/jimmunol.0803567
Schroder, K., Tschopp, J., 2010. The inflammasomes. Cell 140, 821–832. doi:10.1016/j.cell.2010.01.040
Schulz, C., Gomez Perdiguero, E., Chorro, L., Szabo-Rogers, H., Cagnard, N., Kierdorf, K., Prinz, M., Wu, B., Jacobsen, S.E.W., Pollard, J.W., Frampton, J., Liu, K.J., Geissmann, F., 2012. A lineage of myeloid cells independent of Myb and hematopoietic stem cells. Science 336, 86–90. doi:10.1126/science.1219179
Schutz, C., Meintjes, G., Almajid, F., Wilkinson, R.J., Pozniak, A., 2010. Clinical management of tuberculosis and HIV-1 co-infection. Eur. Respir. J. 36, 1460–1481. doi:10.1183/09031936.00110210
Scott, E.W., Simon, M.C., Anastasi, J., Singh, H., 1994. Requirement of transcription factor PU.1 in the development of multiple hematopoietic lineages. Science 265, 1573–1577.
Seddiki, N., Sasson, S.C., Santner-Nanan, B., Munier, M., van Bockel, D., Ip, S., Marriott, D., Pett, S., Nanan, R., Cooper, D.A., Zaunders, J.J., Kelleher, A.D., 2009. Proliferation of weakly suppressive regulatory CD4+ T cells is associated with over-active CD4+ T-cell responses in HIV-positive patients with mycobacterial immune restoration disease. Eur. J. Immunol. 39, 391–403. doi:10.1002/eji.200838630
Segal, E., Shapira, M., Regev, A., Pe’er, D., Botstein, D., Koller, D., Friedman, N., 2003. Module networks: identifying regulatory modules and their condition-specific regulators from gene expression data. Nat. Genet. 34, 166–176. doi:10.1038/ng1165
Selwyn, P.A., Sckell, B.M., Alcabes, P., Friedland, G.H., Klein, R.S., Schoenbaum, E.E., 1992. High risk of active tuberculosis in HIV-infected drug users with cutaneous anergy. JAMA J. Am. Med. Assoc. 268, 504–509.
Shen, Y.-M.P., Frenkel, E.P., 2004. Thrombosis and a hypercoagulable state in HIV-infected patients. Clin. Appl. Thromb. Off. J. Int. Acad. Clin. Appl. Thromb. 10, 277–280.
Shi, C., Pamer, E.G., 2011. Monocyte recruitment during infection and inflammation. Nat Rev Immunol 11, 762–774. doi:10.1038/nri3070
Shibata, Y., Berclaz, P.Y., Chroneos, Z.C., Yoshida, M., Whitsett, J.A., Trapnell, B.C., 2001. GM-CSF regulates alveolar macrophage differentiation and innate immunity in the lung through PU.1. Immunity 15, 557–567.
Shibata, Y., Foster, L.A., Kurimoto, M., Okamura, H., Nakamura, R.M., Kawajiri, K., Justice, J.P., Van Scott, M.R., Myrvik, Q.N., Metzger, W.J., 1998. Immunoregulatory roles of IL-10 in innate immunity: IL-10 inhibits macrophage production of IFN-gamma-inducing factors but enhances NK cell production of IFN-gamma. J. Immunol. Baltim. Md 1950 161, 4283–4288.
Shioda, T., Levy, J.A., Cheng-Mayer, C., 1991. Macrophage and T cell-line tropisms of HIV-1 are determined by specific regions of the envelope gp120 gene. Nature 349, 167–169. doi:10.1038/349167a0
Shoemaker, J., Saraiva, M., O’Garra, A., 2006. GATA-3 directly remodels the IL-10 locus independently of IL-4 in CD4+ T cells. J. Immunol. Baltim. Md 1950 176, 3470–3479.

Reference List
384
Shoham, S., Huang, C., Chen, J.M., Golenbock, D.T., Levitz, S.M., 2001. Toll-like receptor 4 mediates intracellular signaling without TNF-alpha release in response to Cryptococcus neoformans polysaccharide capsule. J. Immunol. Baltim. Md 1950 166, 4620–4626.
Shouval, D.S., Biswas, A., Goettel, J.A., McCann, K., Conaway, E., Redhu, N.S., Mascanfroni, I.D., Al Adham, Z., Lavoie, S., Ibourk, M., Nguyen, D.D., Samsom, J.N., Escher, J.C., Somech, R., Weiss, B., Beier, R., Conklin, L.S., Ebens, C.L., Santos, F.G.M.S., Ferreira, A.R., Sherlock, M., Bhan, A.K., Müller, W., Mora, J.R., Quintana, F.J., Klein, C., Muise, A.M., Horwitz, B.H., Snapper, S.B., 2014. Interleukin-10 Receptor Signaling in Innate Immune Cells Regulates Mucosal Immune Tolerance and Anti-Inflammatory Macrophage Function. Immunity 40, 706–719. doi:10.1016/j.immuni.2014.03.011
Siegal, F.P., Kadowaki, N., Shodell, M., Fitzgerald-Bocarsly, P.A., Shah, K., Ho, S., Antonenko, S., Liu, Y.J., 1999. The nature of the principal type 1 interferon-producing cells in human blood. Science 284, 1835–1837.
Siegal, F.P., Lopez, C., Hammer, G.S., Brown, A.E., Kornfeld, S.J., Gold, J., Hassett, J., Hirschman, S.Z., Cunningham-Rundles, C., Adelsberg, B.R., 1981. Severe acquired immunodeficiency in male homosexuals, manifested by chronic perianal ulcerative herpes simplex lesions. N. Engl. J. Med. 305, 1439–1444. doi:10.1056/NEJM198112103052403
Siewe, L., Bollati-Fogolin, M., Wickenhauser, C., Krieg, T., Müller, W., Roers, A., 2006. Interleukin-10 derived from macrophages and/or neutrophils regulates the inflammatory response to LPS but not the response to CpG DNA. Eur. J. Immunol. 36, 3248–3255. doi:10.1002/eji.200636012
Sigal, A., Kim, J.T., Balazs, A.B., Dekel, E., Mayo, A., Milo, R., Baltimore, D., 2011. Cell-to-cell spread of HIV permits ongoing replication despite antiretroviral therapy. Nature advance online publication. doi:10.1038/nature10347
Sigurdardottir, B., Thormar, H., 1964. ISOLATION OF A VIRAL AGENT FROM THE LUNGS OF SHEEP AFFECTED WITH MAEDI. J. Infect. Dis. 114, 55–60.
Simmons, C.P., Thwaites, G.E., Quyen, N.T.H., Torok, E., Hoang, D.M., Chau, T.T.H., Mai, P.P., Lan, N.T.N., Dung, N.H., Quy, H.T., Bang, N.D., Hien, T.T., Farrar, J., 2006. Pretreatment Intracerebral and Peripheral Blood Immune Responses in Vietnamese Adults with Tuberculous Meningitis: Diagnostic Value and Relationship to Disease Severity and Outcome. J. Immunol. 176, 2007–2014.
Simonney, N., Dewulf, G., Herrmann, J.-L., Gutierrez, M.C., Vicaut, E., Boutron, C., Leportier, M., Lafaurie, M., Abgrall, S., Sereni, D., Autran, B., Carcelain, G., Bourgarit, A., Lagrange, P.H., 2008. Anti-PGL-Tb1 responses as an indicator of the immune restoration syndrome in HIV-TB patients. Tuberc. Edinb. Scotl. 88, 453–461. doi:10.1016/j.tube.2008.01.006
Sindhu, S., Toma, E., Cordeiro, P., Ahmad, R., Morisset, R., Menezes, J., 2006. Relationship of in vivo and ex vivo levels of TH1 and TH2 cytokines with viremia in HAART patients with and without opportunistic infections. J. Med. Virol. 78, 431–439. doi:10.1002/jmv.20558
Sing, A., Roggenkamp, A., Geiger, A.M., Heesemann, J., 2002. Yersinia enterocolitica Evasion of the Host Innate Immune Response by V Antigen-Induced IL-10 Production of Macrophages Is Abrogated in IL-10-Deficient Mice. J. Immunol. 168, 1315–1321. doi:10.4049/jimmunol.168.3.1315
Singh, S.B., Davis, A.S., Taylor, G.A., Deretic, V., 2006. Human IRGM Induces Autophagy to Eliminate Intracellular Mycobacteria. Science 313, 1438–1441. doi:10.1126/science.1129577
Smallie, T., Ricchetti, G., Horwood, N.J., Feldmann, M., Clark, A.R., Williams, L.M., 2010. IL-10 inhibits transcription elongation of the human TNF gene in primary macrophages. J. Exp. Med. 207, 2081–2088. doi:10.1084/jem.20100414
Sobell, H.M., 1985. Actinomycin and DNA transcription. Proc. Natl. Acad. Sci. U. S. A. 82, 5328–5331.
Sonnenberg, P., Glynn, J.R., Fielding, K., Murray, J., Godfrey-Faussett, P., Shearer, S., 2005. How soon after infection with HIV does the risk of tuberculosis start to increase? A retrospective cohort study in South African gold miners. J. Infect. Dis. 191, 150–158. doi:10.1086/426827
Spear, G.T., Ou, C.Y., Kessler, H.A., Moore, J.L., Schochetman, G., Landay, A.L., 1990. Analysis of lymphocytes, monocytes, and neutrophils from human immunodeficiency virus (HIV)-infected persons for HIV DNA. J. Infect. Dis. 162, 1239–1244.
Stacey, A.R., Norris, P.J., Qin, L., Haygreen, E.A., Taylor, E., Heitman, J., Lebedeva, M., DeCamp, A., Li, D., Grove, D., Self, S.G., Borrow, P., 2009. Induction of a striking systemic cytokine cascade prior to peak viremia in acute human immunodeficiency virus type 1 infection, in contrast to more

Reference List
385
modest and delayed responses in acute hepatitis B and C virus infections. J. Virol. 83, 3719–3733. doi:10.1128/JVI.01844-08
Stacey, M.A., Marsden, M., Wang, E.C.Y., Wilkinson, G.W.G., Humphreys, I.R., 2011. IL-10 restricts activation-induced death of NK cells during acute murine cytomegalovirus infection. J. Immunol. Baltim. Md 1950 187, 2944–2952. doi:10.4049/jimmunol.1101021
Stanley, E., Lieschke, G.J., Grail, D., Metcalf, D., Hodgson, G., Gall, J.A., Maher, D.W., Cebon, J., Sinickas, V., Dunn, A.R., 1994. Granulocyte/macrophage colony-stimulating factor-deficient mice show no major perturbation of hematopoiesis but develop a characteristic pulmonary pathology. Proc. Natl. Acad. Sci. U. S. A. 91, 5592–5596.
Stanley, S.A., Johndrow, J.E., Manzanillo, P., Cox, J.S., 2007. The Type I IFN response to infection with Mycobacterium tuberculosis requires ESX-1-mediated secretion and contributes to pathogenesis. J. Immunol. Baltim. Md 1950 178, 3143–3152.
Stein, M., Keshav, S., Harris, N., Gordon, S., 1992. Interleukin 4 potently enhances murine macrophage mannose receptor activity: a marker of alternative immunologic macrophage activation. J. Exp. Med. 176, 287–292.
Steinman, R.M., Lustig, D.S., Cohn, Z.A., 1974. Identification of a novel cell type in peripheral lymphoid organs of mice. 3. Functional properties in vivo. J. Exp. Med. 139, 1431–1445.
Steinman, R.M., Witmer, M.D., 1978. Lymphoid dendritic cells are potent stimulators of the primary mixed leukocyte reaction in mice. Proc. Natl. Acad. Sci. U. S. A. 75, 5132–5136.
Stetson, D.B., Medzhitov, R., 2006. Type I Interferons in Host Defense. Immunity 25, 373–381. doi:10.1016/j.immuni.2006.08.007
Stevenson, M., 2003. HIV-1 pathogenesis. Nat Med 9, 853–860. doi:10.1038/nm0703-853
Stoecklin, G., Tenenbaum, S.A., Mayo, T., Chittur, S.V., George, A.D., Baroni, T.E., Blackshear, P.J., Anderson, P., 2008. Genome-wide analysis identifies interleukin-10 mRNA as target of tristetraprolin. J. Biol. Chem. 283, 11689–11699. doi:10.1074/jbc.M709657200
Stout, R.D., Jiang, C., Matta, B., Tietzel, I., Watkins, S.K., Suttles, J., 2005. Macrophages sequentially change their functional phenotype in response to changes in microenvironmental influences. J. Immunol. Baltim. Md 1950 175, 342–349.
Stout, R.D., Suttles, J., 2004. Functional plasticity of macrophages: reversible adaptation to changing microenvironments. J. Leukoc. Biol. 76, 509–513. doi:10.1189/jlb.0504272
Strebel, K., 2013. HIV accessory proteins versus host restriction factors. Curr. Opin. Virol., Virus replication in animals and plants 3, 692–699. doi:10.1016/j.coviro.2013.08.004
Stremlau, M., Owens, C.M., Perron, M.J., Kiessling, M., Autissier, P., Sodroski, J., 2004. The cytoplasmic body component TRIM5α restricts HIV-1 infection in Old World monkeys. Nature 427, 848–853. doi:10.1038/nature02343
Strowig, T., Henao-Mejia, J., Elinav, E., Flavell, R., 2012. Inflammasomes in health and disease. Nature 481, 278–286. doi:10.1038/nature10759
Stuart, L.M., Ezekowitz, R.A.B., 2005. Phagocytosis: elegant complexity. Immunity 22, 539–550. doi:10.1016/j.immuni.2005.05.002
Stumpo, R., Kauer, M., Martin, S., Kolb, H., 2003. IL-10 induces gene expression in macrophages: partial overlap with IL-5 but not with IL-4 induced genes. Cytokine 24, 46–56. doi:10.1016/S1043-4666(03)00270-9
Subramanian, A., Tamayo, P., Mootha, V.K., Mukherjee, S., Ebert, B.L., Gillette, M.A., Paulovich, A., Pomeroy, S.L., Golub, T.R., Lander, E.S., Mesirov, J.P., 2005. Gene set enrichment analysis: a knowledge-based approach for interpreting genome-wide expression profiles. Proc. Natl. Acad. Sci. U. S. A. 102, 15545–15550. doi:10.1073/pnas.0506580102
Sullivan, B.M., Jobe, O., Lazarevic, V., Vasquez, K., Bronson, R., Glimcher, L.H., Kramnik, I., 2005. Increased susceptibility of mice lacking T-bet to infection with Mycobacterium tuberculosis correlates with increased IL-10 and decreased IFN-gamma production. J. Immunol. Baltim. Md 1950 175, 4593–4602.
Sun, Z., Denton, P.W., Estes, J.D., Othieno, F.A., Wei, B.L., Wege, A.K., Melkus, M.W., Padgett-Thomas, A., Zupancic, M., Haase, A.T., Garcia, J.V., 2007. Intrarectal transmission, systemic infection, and

Reference List
386
CD4+ T cell depletion in humanized mice infected with HIV-1. J. Exp. Med. 204, 705–714. doi:10.1084/jem.20062411
Sunseri, N., O’Brien, M., Bhardwaj, N., Landau, N.R., 2011. Human immunodeficiency virus type 1 modified to package Simian immunodeficiency virus Vpx efficiently infects macrophages and dendritic cells. J. Virol. 85, 6263–6274. doi:10.1128/JVI.00346-11
Swann, S.A., Williams, M., Story, C.M., Bobbitt, K.R., Fleis, R., Collins, K.L., 2001. HIV-1 Nef blocks transport of MHC class I molecules to the cell surface via a PI 3-kinase-dependent pathway. Virology 282, 267–277. doi:10.1006/viro.2000.0816
Tabas, I., 2010. Macrophage death and defective inflammation resolution in atherosclerosis. Nat. Rev. Immunol. 10, 36–46. doi:10.1038/nri2675
Tachado, S.D., Li, X., Bole, M., Swan, K., Anandaiah, A., Patel, N.R., Koziel, H., 2010. MyD88-dependent TLR4 signaling is selectively impaired in alveolar macrophages from asymptomatic HIV+ persons. Blood 115, 3606–3615. doi:10.1182/blood-2009-10-250787
Tachado, S.D., Zhang, J., Zhu, J., Patel, N., Koziel, H., 2005. HIV impairs TNF-alpha release in response to Toll-like receptor 4 stimulation in human macrophages in vitro. Am. J. Respir. Cell Mol. Biol. 33, 610–621. doi:10.1165/rcmb.2004-0341OC
Tadokera, R., Meintjes, G., Skolimowska, K.H., Wilkinson, K.A., Matthews, K., Seldon, R., Chegou, N.N., Maartens, G., Rangaka, M.X., Rebe, K., Walzl, G., Wilkinson, R.J., 2011. Hypercytokinaemia accompanies HIV-tuberculosis immune reconstitution inflammatory syndrome. Eur. Respir. J. Off. J. Eur. Soc. Clin. Respir. Physiol. 37, 1248–1259. doi:10.1183/09031936.00091010
Takeda, K., Kaisho, T., Akira, S., 2003. Toll-like receptors. Annu. Rev. Immunol. 21, 335–376. doi:10.1146/annurev.immunol.21.120601.141126
Takeda, K., Tanaka, T., Shi, W., Matsumoto, M., Minami, M., Kashiwamura, S., Nakanishi, K., Yoshida, N., Kishimoto, T., Akira, S., 1996. Essential role of Stat6 in IL-4 signalling. Nature 380, 627–630. doi:10.1038/380627a0
Takeuchi, O., Akira, S., 2010. Pattern recognition receptors and inflammation. Cell 140, 805–820. doi:10.1016/j.cell.2010.01.022
Tameris, M.D., Hatherill, M., Landry, B.S., Scriba, T.J., Snowden, M.A., Lockhart, S., Shea, J.E., McClain, J.B., Hussey, G.D., Hanekom, W.A., Mahomed, H., McShane, H., 2013. Safety and efficacy of MVA85A, a new tuberculosis vaccine, in infants previously vaccinated with BCG: a randomised, placebo-controlled phase 2b trial. The Lancet 381, 1021–1028. doi:10.1016/S0140-6736(13)60177-4
Tamoutounour, S., Guilliams, M., Montanana Sanchis, F., Liu, H., Terhorst, D., Malosse, C., Pollet, E., Ardouin, L., Luche, H., Sanchez, C., Dalod, M., Malissen, B., Henri, S., 2013. Origins and Functional Specialization of Macrophages and of Conventional and Monocyte-Derived Dendritic Cells in Mouse Skin. Immunity 39, 925–938. doi:10.1016/j.immuni.2013.10.004
Tan, J.C., Indelicato, S.R., Narula, S.K., Zavodny, P.J., Chou, C.C., 1993. Characterization of interleukin-10 receptors on human and mouse cells. J. Biol. Chem. 268, 21053–21059.
Tanaka, N., Hoshino, Y., Gold, J., Hoshino, S., Martiniuk, F., Kurata, T., Pine, R., Levy, D., Rom, W.N., Weiden, M., 2005. Interleukin-10 induces inhibitory C/EBPbeta through STAT-3 and represses HIV-1 transcription in macrophages. Am. J. Respir. Cell Mol. Biol. 33, 406–411. doi:10.1165/rcmb.2005-0140OC
Tascon, R.E., Stavropoulos, E., Lukacs, K.V., Colston, M.J., 1998. Protection against Mycobacterium tuberculosis infection by CD8+ T cells requires the production of gamma interferon. Infect. Immun. 66, 830–834.
Taylor, P.R., Martinez-Pomares, L., Stacey, M., Lin, H.-H., Brown, G.D., Gordon, S., 2005. Macrophage receptors and immune recognition. Annu. Rev. Immunol. 23, 901–944. doi:10.1146/annurev.immunol.23.021704.115816
Teixeira-Coelho, M., Guedes, J., Ferreirinha, P., Howes, A., Pedrosa, J., Rodrigues, F., Lai, W.S., Blackshear, P.J., O Garra, A., Castro, A.G., Saraiva, M., 2013. Differential post-transcriptional regulation of IL-10 by TLR2 and TLR4-activated macrophages. Eur. J. Immunol. doi:10.1002/eji.201343734
Teles, R.M.B., Graeber, T.G., Krutzik, S.R., Montoya, D., Schenk, M., Lee, D.J., Komisopoulou, E., Kelly-Scumpia, K., Chun, R., Iyer, S.S., Sarno, E.N., Rea, T.H., Hewison, M., Adams, J.S., Popper, S.J.,

Reference List
387
Relman, D.A., Stenger, S., Bloom, B.R., Cheng, G., Modlin, R.L., 2013. Type I interferon suppresses type II interferon-triggered human anti-mycobacterial responses. Science 339, 1448–1453. doi:10.1126/science.1233665
Terwilliger, E., Burghoff, R., Sia, R., Sodroski, J., Haseltine, W., Rosen, C., 1988. The art gene product of human immunodeficiency virus is required for replication. J. Virol. 62, 655–658.
The HIV-CAUSAL Collaboration *, 2010. The effect of combined antiretroviral therapy on the overall mortality of HIV-infected individuals. [Miscellaneous Article]. AIDS January 2 2010 24, 123–137. doi:10.1097/QAD.0b013e3283324283
Thormar, H., 2013. The origin of lentivirus research: Maedi-visna virus. Curr. HIV Res. 11, 2–9.
Thwaites, G.E., Bang, N.D., Dung, N.H., Quy, H.T., Oanh, D.T.T., Thoa, N.T.C., Hien, N.Q., Thuc, N.T., Hai, N.N., Lan, N.T.N., Lan, N.N., Duc, N.H., Tuan, V.N., Hiep, C.H., Chau, T.T.H., Mai, P.P., Dung, N.T., Stepniewska, K., White, N.J., Hien, T.T., Farrar, J.J., 2004. Dexamethasone for the Treatment of Tuberculous Meningitis in Adolescents and Adults. N. Engl. J. Med. 351, 1741–1751. doi:10.1056/NEJMoa040573
Tobin, D.M., Roca, F.J., Oh, S.F., McFarland, R., Vickery, T.W., Ray, J.P., Ko, D.C., Zou, Y., Bang, N.D., Chau, T.T.H., Vary, J.C., Hawn, T.R., Dunstan, S.J., Farrar, J.J., Thwaites, G.E., King, M.-C., Serhan, C.N., Ramakrishnan, L., 2012. Host genotype-specific therapies can optimize the inflammatory response to mycobacterial infections. Cell 148, 434–446. doi:10.1016/j.cell.2011.12.023
Tomlinson, G., Chimalapati, S., Lapp, T., Pollard, T., Cohen, J., Camberlein, E., Stafford, S., Periselneris, J., Aldridge, C., Vollmer, W., Picard, C., Casanova, J.L., Noursadeghi, M., Brown, J., In press. TLR-mediated inflammatory responses to Streptococcus pneumoniae are highly dependent on surface expression of bacterial lipoproteins. J. Immunol.
Tomlinson, G.S., Bell, L.C.K., Walker, N.F., Tsang, J., Brown, J.S., Breen, R., Lipman, M., Katz, D.R., Miller, R.F., Chain, B.M., Elkington, P.T.G., Noursadeghi, M., 2014. HIV-1 Infection of Macrophages Dysregulates Innate Immune Responses to Mycobacterium tuberculosis by Inhibition of Interleukin-10. J. Infect. Dis. 209, 1055–1065. doi:10.1093/infdis/jit621
Tomlinson, G.S., Booth, H., Petit, S.J., Potton, E., Towers, G.J., Miller, R.F., Chain, B.M., Noursadeghi, M., 2012. Adherent Human Alveolar Macrophages Exhibit a Transient Pro-Inflammatory Profile That Confounds Responses to Innate Immune Stimulation. PLoS ONE 7, e40348. doi:10.1371/journal.pone.0040348
Tomlinson, G.S., Cashmore, T.J., Elkington, P.T.G., Yates, J., Lehloenya, R.J., Tsang, J., Brown, M., Miller, R.F., Dheda, K., Katz, D.R., Chain, B.M., Noursadeghi, M., 2011. Transcriptional profiling of innate and adaptive human immune responses to mycobacteria in the tuberculin skin test. Eur. J. Immunol. 41, 3253–3260. doi:10.1002/eji.201141841
Toossi, Z., Johnson, J.L., Kanost, R.A., Wu, M., Luzze, H., Peters, P., Okwera, A., Joloba, M., Mugyenyi, P., Mugerwa, R.D., Aung, H., Ellner, J.J., Hirsch, C.S., 2001. Increased replication of HIV-1 at sites of Mycobacterium tuberculosis infection: potential mechanisms of viral activation. J. Acquir. Immune Defic. Syndr. 1999 28, 1–8.
Toossi, Z., Mayanja-Kizza, H., Hirsch, C.S., Edmonds, K.L., Spahlinger, T., Hom, D.L., Aung, H., Mugyenyi, P., Ellner, J.J., Whalen, C.W., 2001. Impact of tuberculosis (TB) on HIV-1 activity in dually infected patients. Clin. Exp. Immunol. 123, 233–238.
Toossi, Z., Nicolacakis, K., Xia, L., Ferrari, N.A., Rich, E.A., 1997. Activation of latent HIV-1 by Mycobacterium tuberculosis and its purified protein derivative in alveolar macrophages from HIV-infected individuals in vitro. J. Acquir. Immune Defic. Syndr. Hum. Retrovirology Off. Publ. Int. Retrovirology Assoc. 15, 325–331.
Torre, D., Gennero, L., Baccino, F.M., Speranza, F., Biondi, G., Pugliese, A., 2002. Impaired macrophage phagocytosis of apoptotic neutrophils in patients with human immunodeficiency virus type 1 infection. Clin. Diagn. Lab. Immunol. 9, 983–986.
Torrelles, J.B., Azad, A.K., Henning, L.N., Carlson, T.K., Schlesinger, L.S., 2008. Role of C-type lectins in mycobacterial infections. Curr. Drug Targets 9, 102–112.
Torrelles, J.B., Azad, A.K., Schlesinger, L.S., 2006. Fine discrimination in the recognition of individual species of phosphatidyl-myo-inositol mannosides from Mycobacterium tuberculosis by C-type lectin pattern recognition receptors. J. Immunol. Baltim. Md 1950 177, 1805–1816.

Reference List
388
Towers, G.J., Noursadeghi, M., 2014. Interactions between HIV-1 and the Cell-Autonomous Innate Immune System. Cell Host Microbe 16, 10–18. doi:10.1016/j.chom.2014.06.009
Tran, H.T.T., Van den Bergh, R., Loembé, M.M., Worodria, W., Mayanja-Kizza, H., Colebunders, R., Mascart, F., Stordeur, P., Kestens, L., De Baetselier, P., Raes, G., TB-IRIS study group, 2013. Modulation of the complement system in monocytes contributes to tuberculosis-associated immune reconstitution inflammatory syndrome. AIDS Lond. Engl. 27, 1725–1734. doi:10.1097/QAD.0b013e328361648b
Trapani, J.A., Dawson, M., Apostolidis, V.A., Browne, K.A., 1994. Genomic organization of IFI16, an interferon-inducible gene whose expression is associated with human myeloid cell differentiation: correlation of predicted protein domains with exon organization. Immunogenetics 40, 415–424.
Trentin, L., Garbisa, S., Zambello, R., Agostini, C., Caenazzo, C., Di Francesco, C., Cipriani, A., Francavilla, E., Semenzato, G., 1992. Spontaneous production of interleukin-6 by alveolar macrophages from human immunodeficiency virus type 1-infected patients. J. Infect. Dis. 166, 731–737.
Trifari, S., Kaplan, C.D., Tran, E.H., Crellin, N.K., Spits, H., 2009. Identification of a human helper T cell population that has abundant production of interleukin 22 and is distinct from TH-17, TH1 and TH2 cells. Nat. Immunol. 10, 864–871. doi:10.1038/ni.1770
Trunz, B.B., Fine, P., Dye, C., 2006. Effect of BCG vaccination on childhood tuberculous meningitis and miliary tuberculosis worldwide: a meta-analysis and assessment of cost-effectiveness. Lancet 367, 1173–1180. doi:10.1016/S0140-6736(06)68507-3
Tsai, C.-A., Chen, J.J., 2009. Multivariate analysis of variance test for gene set analysis. Bioinformatics 25, 897–903. doi:10.1093/bioinformatics/btp098
Tsang, J., Chain, B.M., Miller, R.F., Webb, B.L.J., Barclay, W., Towers, G.J., Katz, D.R., Noursadeghi, M., 2009. HIV-1 infection of macrophages is dependent on evasion of innate immune cellular activation. AIDS Lond. Engl. 23, 2255–2263. doi:10.1097/QAD.0b013e328331a4ce
Turner, J., Gonzalez-Juarrero, M., Ellis, D.L., Basaraba, R.J., Kipnis, A., Orme, I.M., Cooper, A.M., 2002. In vivo IL-10 production reactivates chronic pulmonary tuberculosis in C57BL/6 mice. J. Immunol. Baltim. Md 1950 169, 6343–6351.
Tuttle, D.L., Harrison, J.K., Anders, C., Sleasman, J.W., Goodenow, M.M., 1998. Expression of CCR5 increases during monocyte differentiation and directly mediates macrophage susceptibility to infection by human immunodeficiency virus type 1. J. Virol. 72, 4962–4969.
Uhlin, M., Andersson, J., Zumla, A., Maeurer, M., 2012. Adjunct Immunotherapies for Tuberculosis. J. Infect. Dis. jis197. doi:10.1093/infdis/jis197
Ulrichs, T., Kaufmann, S.H.E., 2006. New insights into the function of granulomas in human tuberculosis. J. Pathol. 208, 261–269. doi:10.1002/path.1906
UNAIDS, 2013. 2013 UNAIDS Report on the global AIDS epidemic.
Unanue, E.R., 1976. Secretory function of mononuclear phagocytes: a review. Am. J. Pathol. 83, 396–418.
Underhill, D.M., Ozinsky, A., 2002. Phagocytosis of microbes: complexity in action. Annu. Rev. Immunol. 20, 825–852. doi:10.1146/annurev.immunol.20.103001.114744
Underhill, D.M., Ozinsky, A., Hajjar, A.M., Stevens, A., Wilson, C.B., Bassetti, M., Aderem, A., 1999. The Toll-like receptor 2 is recruited to macrophage phagosomes and discriminates between pathogens. Nature 401, 811–815. doi:10.1038/44605
Van Furth, R., Cohn, Z.A., 1968. The origin and kinetics of mononuclear phagocytes. J. Exp. Med. 128, 415–435.
Van Furth, R., Cohn, Z.A., Hirsch, J.G., Humphrey, J.H., Spector, W.G., Langevoort, H.L., 1972. The mononuclear phagocyte system: a new classification of macrophages, monocytes, and their precursor cells. Bull. World Health Organ. 46, 845–852.
Varol, C., Landsman, L., Fogg, D.K., Greenshtein, L., Gildor, B., Margalit, R., Kalchenko, V., Geissmann, F., Jung, S., 2007. Monocytes give rise to mucosal, but not splenic, conventional dendritic cells. J. Exp. Med. 204, 171–180. doi:10.1084/jem.20061011
Vecchiarelli, A., Dottorini, M., Pietrella, D., Monari, C., Retini, C., Todisco, T., Bistoni, F., 1994. Role of human alveolar macrophages as antigen-presenting cells in Cryptococcus neoformans infection. Am. J. Respir. Cell Mol. Biol. 11, 130–137.

Reference List
389
Vecchiarelli, A., Retini, C., Monari, C., Tascini, C., Bistoni, F., Kozel, T.R., 1996. Purified capsular polysaccharide of Cryptococcus neoformans induces interleukin-10 secretion by human monocytes. Infect. Immun. 64, 2846–2849.
Vecchiarelli, A., Retini, C., Pietrella, D., Monari, C., Tascini, C., Beccari, T., Kozel, T.R., 1995. Downregulation by cryptococcal polysaccharide of tumor necrosis factor alpha and interleukin-1 beta secretion from human monocytes. Infect. Immun. 63, 2919–2923.
Veldhoen, M., Uyttenhove, C., van Snick, J., Helmby, H., Westendorf, A., Buer, J., Martin, B., Wilhelm, C., Stockinger, B., 2008. Transforming growth factor-[beta] “reprograms” the differentiation of T helper 2 cells and promotes an interleukin 9-producing subset. Nat Immunol 9, 1341–1346. doi:10.1038/ni.1659
Velmurugan, K., Chen, B., Miller, J.L., Azogue, S., Gurses, S., Hsu, T., Glickman, M., Jacobs, W.R., Porcelli, S.A., Briken, V., 2007. Mycobacterium tuberculosis nuoG is a virulence gene that inhibits apoptosis of infected host cells. PLoS Pathog. 3, e110. doi:10.1371/journal.ppat.0030110
Verver, S., Warren, R.M., Munch, Z., Vynnycky, E., van Helden, P.D., Richardson, M., van der Spuy, G.D., Enarson, D.A., Borgdorff, M.W., Behr, M.A., Beyers, N., 2004. Transmission of tuberculosis in a high incidence urban community in South Africa. Int. J. Epidemiol. 33, 351–357. doi:10.1093/ije/dyh021
Vigerust, D.J., Egan, B.S., Shepherd, V.L., 2005. HIV-1 Nef mediates post-translational down-regulation and redistribution of the mannose receptor. J. Leukoc. Biol. 77, 522–534. doi:10.1189/jlb.0804454
Villagra, A., Cheng, F., Wang, H.-W., Suarez, I., Glozak, M., Maurin, M., Nguyen, D., Wright, K.L., Atadja, P.W., Bhalla, K., Pinilla-Ibarz, J., Seto, E., Sotomayor, E.M., 2009. The histone deacetylase HDAC11 regulates the expression of interleukin 10 and immune tolerance. Nat. Immunol. 10, 92–100. doi:10.1038/ni.1673
Voehringer, D., Shinkai, K., Locksley, R.M., 2004. Type 2 immunity reflects orchestrated recruitment of cells committed to IL-4 production. Immunity 20, 267–277.
Von Reyn, C.F., Kimambo, S., Mtei, L., Arbeit, R.D., Maro, I., Bakari, M., Matee, M., Lahey, T., Adams, L.V., Black, W., Mackenzie, T., Lyimo, J., Tvaroha, S., Waddell, R., Kreiswirth, B., Horsburgh, C.R., Pallangyo, K., 2011. Disseminated tuberculosis in human immunodeficiency virus infection: ineffective immunity, polyclonal disease and high mortality. Int. J. Tuberc. Lung Dis. Off. J. Int. Union Tuberc. Lung Dis. 15, 1087–1092. doi:10.5588/ijtld.10.0517
Wain-Hobson, S., Sonigo, P., Danos, O., Cole, S., Alizon, M., 1985. Nucleotide sequence of the AIDS virus, LAV. Cell 40, 9–17.
Wajant, H., Pfizenmaier, K., Scheurich, P., 2003. Tumor necrosis factor signaling. Cell Death Differ. 10, 45–65. doi:10.1038/sj.cdd.4401189
Wakeham, J., Wang, J., Magram, J., Croitoru, K., Harkness, R., Dunn, P., Zganiacz, A., Xing, Z., 1998. Lack of both types 1 and 2 cytokines, tissue inflammatory responses, and immune protection during pulmonary infection by Mycobacterium bovis bacille Calmette-Guérin in IL-12-deficient mice. J. Immunol. Baltim. Md 1950 160, 6101–6111.
Walenkamp, A.M., Chaka, W.S., Verheul, A.F., Vaishnav, V.V., Cherniak, R., Coenjaerts, F.E., Hoepelman, I.M., 1999. Cryptococcus neoformans and its cell wall components induce similar cytokine profiles in human peripheral blood mononuclear cells despite differences in structure. FEMS Immunol. Med. Microbiol. 26, 309–318.
Walker, N.F., Clark, S.O., Oni, T., Andreu, N., Tezera, L., Singh, S., Saraiva, L., Pedersen, B., Kelly, D.L., Tree, J.A., D’Armiento, J.M., Meintjes, G., Mauri, F.A., Williams, A., Wilkinson, R.J., Friedland, J.S., Elkington, P.T., 2012. Doxycycline and HIV infection suppress tuberculosis-induced matrix metalloproteinases. Am. J. Respir. Crit. Care Med. 185, 989–997. doi:10.1164/rccm.201110-1769OC
Walker, N.F., Meintjes, G., Wilkinson, R.J., 2013. HIV-1 and the immune response to TB. Future Virol. 8, 57–80. doi:10.2217/fvl.12.123
Wang, Y., Rice, A.P., 2006. Interleukin-10 inhibits HIV-1 LTR-directed gene expression in human macrophages through the induction of cyclin T1 proteolysis. Virology 352, 485–492. doi:10.1016/j.virol.2006.05.013
Wang, Y., Szretter, K.J., Vermi, W., Gilfillan, S., Rossini, C., Cella, M., Barrow, A.D., Diamond, M.S., Colonna, M., 2012. IL-34 is a tissue-restricted ligand of CSF1R required for the development of Langerhans cells and microglia. Nat. Immunol. 13, 753–760. doi:10.1038/ni.2360

Reference List
390
Weber-Nordt, R.M., Meraz, M.A., Schreiber, R.D., 1994. Lipopolysaccharide-dependent induction of IL-10 receptor expression on murine fibroblasts. J. Immunol. Baltim. Md 1950 153, 3734–3744.
Weber-Nordt, R.M., Riley, J.K., Greenlund, A.C., Moore, K.W., Darnell, J.E., Schreiber, R.D., 1996. Stat3 Recruitment by Two Distinct Ligand-induced, Tyrosine-phosphorylated Docking Sites in the Interleukin-10 Receptor Intracellular Domain. J. Biol. Chem. 271, 27954–27961. doi:10.1074/jbc.271.44.27954
Wehle, K., Schirmer, M., Dünnebacke-Hinz, J., Küpper, T., Pfitzer, P., 1993. Quantitative differences in phagocytosis and degradation of Pneumocystis carinii by alveolar macrophages in AIDS and non-HIV patients in vivo. Cytopathol. Off. J. Br. Soc. Clin. Cytol. 4, 231–236.
Weichhart, T., Costantino, G., Poglitsch, M., Rosner, M., Zeyda, M., Stuhlmeier, K.M., Kolbe, T., Stulnig, T.M., Hörl, W.H., Hengstschläger, M., Müller, M., Säemann, M.D., 2008. The TSC-mTOR signaling pathway regulates the innate inflammatory response. Immunity 29, 565–577. doi:10.1016/j.immuni.2008.08.012
Weichhart, T., Säemann, M.D., 2008. The PI3K/Akt/mTOR pathway in innate immune cells: emerging therapeutic applications. Ann. Rheum. Dis. 67, iii70–iii74. doi:10.1136/ard.2008.098459
Weiden, M., Tanaka, N., Qiao, Y., Zhao, B.Y., Honda, Y., Nakata, K., Canova, A., Levy, D.E., Rom, W.N., Pine, R., 2000. Differentiation of Monocytes to Macrophages Switches the Mycobacterium tuberculosis Effect on HIV-1 Replication from Stimulation to Inhibition: Modulation of Interferon Response and CCAAT/Enhancer Binding Protein ß Expression. J. Immunol. 165, 2028 –2039.
Wessells, J., Baer, M., Young, H.A., Claudio, E., Brown, K., Siebenlist, U., Johnson, P.F., 2004. BCL-3 and NF-kappaB p50 attenuate lipopolysaccharide-induced inflammatory responses in macrophages. J. Biol. Chem. 279, 49995–50003. doi:10.1074/jbc.M404246200
West, A.P., Brodsky, I.E., Rahner, C., Woo, D.K., Erdjument-Bromage, H., Tempst, P., Walsh, M.C., Choi, Y., Shadel, G.S., Ghosh, S., 2011. TLR signalling augments macrophage bactericidal activity through mitochondrial ROS. Nature 472, 476–480. doi:10.1038/nature09973
Westphalen, K., Gusarova, G.A., Islam, M.N., Subramanian, M., Cohen, T.S., Prince, A.S., Bhattacharya, J., 2014. Sessile alveolar macrophages communicate with alveolar epithelium to modulate immunity. Nature advance online publication. doi:10.1038/nature12902
WHO, 2013a. WHO | Consolidated guidelines on the use of antiretroviral drugs for treating and preventing HIV infection.
WHO, 2013b. Global tuberculosis report 2013.
Williams, L., Bradley, L., Smith, A., Foxwell, B., 2004. Signal transducer and activator of transcription 3 is the dominant mediator of the anti-inflammatory effects of IL-10 in human macrophages. J. Immunol. Baltim. Md 1950 172, 567–576.
Williams, L., Jarai, G., Smith, A., Finan, P., 2002. IL-10 expression profiling in human monocytes. J. Leukoc. Biol. 72, 800–809.
Williams, L.M., Sarma, U., Willets, K., Smallie, T., Brennan, F., Foxwell, B.M.J., 2007. Expression of constitutively active STAT3 can replicate the cytokine-suppressive activity of interleukin-10 in human primary macrophages. J. Biol. Chem. 282, 6965–6975. doi:10.1074/jbc.M609101200
Williams, S.A., Chen, L.-F., Kwon, H., Fenard, D., Bisgrove, D., Verdin, E., Greene, W.C., 2004. Prostratin antagonizes HIV latency by activating NF-kappaB. J. Biol. Chem. 279, 42008–42017. doi:10.1074/jbc.M402124200
Williams, S.A., Kwon, H., Chen, L.-F., Greene, W.C., 2007. Sustained induction of NF-kappa B is required for efficient expression of latent human immunodeficiency virus type 1. J. Virol. 81, 6043–6056. doi:10.1128/JVI.02074-06
Wing, E.J., Remington, J.S., 1977. Cell-mediated immunity and its role in resistance to infection. West. J. Med. 126, 14–31.
Witmer-Pack, M.D., Hughes, D.A., Schuler, G., Lawson, L., McWilliam, A., Inaba, K., Steinman, R.M., Gordon, S., 1993. Identification of macrophages and dendritic cells in the osteopetrotic (op/op) mouse. J. Cell Sci. 104 ( Pt 4), 1021–1029.
Wolf, D., Witte, V., Laffert, B., Blume, K., Stromer, E., Trapp, S., Paola, Schürmann, A., Baur, A.S., 2001. HIV-1 Nef associated PAK and PI3-Kinases stimulate Akt-independent Bad-phosphorylation to induce anti-apoptotic signals. Nat. Med. 7, 1217–1224. doi:10.1038/nm1101-1217

Reference List
391
Wolk, K., Kunz, S., Witte, E., Friedrich, M., Asadullah, K., Sabat, R., 2004. IL-22 Increases the Innate Immunity of Tissues. Immunity 21, 241–254. doi:10.1016/j.immuni.2004.07.007
Wynn, T.A., Chawla, A., Pollard, J.W., 2013. Macrophage biology in development, homeostasis and disease. Nature 496, 445–455. doi:10.1038/nature12034
Wynn, T.A., Ramalingam, T.R., 2012. Mechanisms of fibrosis: therapeutic translation for fibrotic disease. Nat. Med. 18, 1028–1040. doi:10.1038/nm.2807
Xie, N., Cui, H., Banerjee, S., Tan, Z., Salomao, R., Fu, M., Abraham, E., Thannickal, V.J., Liu, G., 2014. miR-27a Regulates Inflammatory Response of Macrophages by Targeting IL-10. J. Immunol. Baltim. Md 1950. doi:10.4049/jimmunol.1400203
Xue, J., Schmidt, S.V., Sander, J., Draffehn, A., Krebs, W., Quester, I., De Nardo, D., Gohel, T.D., Emde, M., Schmidleithner, L., Ganesan, H., Nino-Castro, A., Mallmann, M.R., Labzin, L., Theis, H., Kraut, M., Beyer, M., Latz, E., Freeman, T.C., Ulas, T., Schultze, J.L., 2014. Transcriptome-Based Network Analysis Reveals a Spectrum Model of Human Macrophage Activation. Immunity 40, 274–288. doi:10.1016/j.immuni.2014.01.006
Yadav, M., Schorey, J.S., 2006. The beta-glucan receptor dectin-1 functions together with TLR2 to mediate macrophage activation by mycobacteria. Blood 108, 3168–3175. doi:10.1182/blood-2006-05-024406
Yasukawa, H., Ohishi, M., Mori, H., Murakami, M., Chinen, T., Aki, D., Hanada, T., Takeda, K., Akira, S., Hoshijima, M., Hirano, T., Chien, K.R., Yoshimura, A., 2003. IL-6 induces an anti-inflammatory response in the absence of SOCS3 in macrophages. Nat. Immunol. 4, 551–556. doi:10.1038/ni938
Yauch, L.E., Mansour, M.K., Shoham, S., Rottman, J.B., Levitz, S.M., 2004. Involvement of CD14, toll-like receptors 2 and 4, and MyD88 in the host response to the fungal pathogen Cryptococcus neoformans in vivo. Infect. Immun. 72, 5373–5382. doi:10.1128/IAI.72.9.5373-5382.2004
Yi, A.-K., Yoon, J.-G., Yeo, S.-J., Hong, S.-C., English, B.K., Krieg, A.M., 2002. Role of mitogen-activated protein kinases in CpG DNA-mediated IL-10 and IL-12 production: central role of extracellular signal-regulated kinase in the negative feedback loop of the CpG DNA-mediated Th1 response. J. Immunol. Baltim. Md 1950 168, 4711–4720.
Yona, S., Kim, K.-W., Wolf, Y., Mildner, A., Varol, D., Breker, M., Strauss-Ayali, D., Viukov, S., Guilliams, M., Misharin, A., Hume, D.A., Perlman, H., Malissen, B., Zelzer, E., Jung, S., 2013. Fate mapping reveals origins and dynamics of monocytes and tissue macrophages under homeostasis. Immunity 38, 79–91. doi:10.1016/j.immuni.2012.12.001
Zaragoza, O., Rodrigues, M.L., De Jesus, M., Frases, S., Dadachova, E., Casadevall, A., 2009. The capsule of the fungal pathogen Cryptococcus neoformans. Adv. Appl. Microbiol. 68, 133–216. doi:10.1016/S0065-2164(09)01204-0
Zhang, M., Gong, J., Iyer, D.V., Jones, B.E., Modlin, R.L., Barnes, P.F., 1994. T cell cytokine responses in persons with tuberculosis and human immunodeficiency virus infection. J. Clin. Invest. 94, 2435–2442. doi:10.1172/JCI117611
Zhou, J.H., Broussard, S.R., Strle, K., Freund, G.G., Johnson, R.W., Dantzer, R., Kelley, K.W., 2001. IL-10 inhibits apoptosis of promyeloid cells by activating insulin receptor substrate-2 and phosphatidylinositol 3’-kinase. J. Immunol. Baltim. Md 1950 167, 4436–4442.
Zhu, T., Mo, H., Wang, N., Nam, D.S., Cao, Y., Koup, R.A., Ho, D.D., 1993. Genotypic and phenotypic characterization of HIV-1 patients with primary infection. Science 261, 1179–1181.
Ziegler-Heitbrock, L., Ancuta, P., Crowe, S., Dalod, M., Grau, V., Hart, D.N., Leenen, P.J.M., Liu, Y.-J., MacPherson, G., Randolph, G.J., Scherberich, J., Schmitz, J., Shortman, K., Sozzani, S., Strobl, H., Zembala, M., Austyn, J.M., Lutz, M.B., 2010. Nomenclature of monocytes and dendritic cells in blood. Blood 116, e74–80. doi:10.1182/blood-2010-02-258558
Zigmond, E., Bernshtein, B., Friedlander, G., Walker, C.R., Yona, S., Kim, K.-W., Brenner, O., Krauthgamer, R., Varol, C., Müller, W., Jung, S., 2014. Macrophage-Restricted Interleukin-10 Receptor Deficiency, but Not IL-10 Deficiency, Causes Severe Spontaneous Colitis. Immunity 40, 720–733. doi:10.1016/j.immuni.2014.03.012
Zigmond, E., Jung, S., 2013. Intestinal macrophages: well educated exceptions from the rule. Trends Immunol. 34, 162–168. doi:10.1016/j.it.2013.02.001

Reference List
392
Zink, A.R., Sola, C., Reischl, U., Grabner, W., Rastogi, N., Wolf, H., Nerlich, A.G., 2003. Characterization of Mycobacterium tuberculosis complex DNAs from Egyptian mummies by spoligotyping. J. Clin. Microbiol. 41, 359–367.
Zinsser, H., 1921. Studies on the Tuberculin Reaction and on Specific Hypersensitiveness in Bacterial Infection. J. Exp. Med. 34, 495–524. doi:10.1084/jem.34.5.495
Zizzo, G., Cohen, P.L., 2013. IL-17 Stimulates Differentiation of Human Anti-Inflammatory Macrophages and Phagocytosis of Apoptotic Neutrophils in Response to IL-10 and Glucocorticoids. J. Immunol. Baltim. Md 1950. doi:10.4049/jimmunol.1203017
Zufferey, R., Nagy, D., Mandel, R.J., Naldini, L., Trono, D., 1997. Multiply attenuated lentiviral vector achieves efficient gene delivery in vivo. Nat. Biotechnol. 23, 871–875.
Zumla, A., Raviglione, M., Hafner, R., Fordham von Reyn, C., 2013. Tuberculosis. N. Engl. J. Med. 368, 745–755. doi:10.1056/NEJMra1200894