Stream water quality changes following timber harvest in a coastal plain swamp forest
Upload
independentCategory
view
0download
0
ORIGINAL PAPER
Modelling the risk of invasion by the red-swamp crayfish(Procambarus clarkii): incorporating local variablesto better inform management decisions
Francisco D. Moreira • Fernando Ascensao •
Cesar Capinha • Diana Rodrigues • Pedro Segurado •
Margarida Santos-Reis • Rui Rebelo
Received: 14 September 2013 / Accepted: 20 May 2014
� Springer International Publishing Switzerland 2014
Abstract The correct modelling of the potential
distribution of an invasive species is crucial to define
effective management and monitoring strategies. Here
we compared the results of models built at different
spatial scales to identify the areas at risk of invasion by
the red swamp crayfish (Procambarus clarkii) in the
northwest of Portugal. Firstly, we surveyed crayfish at
97 locations. Secondly, we used presence–absence
data and local variables to model its current distribu-
tion (local variables model) and identified slope and
river width as the best explanatory factors. Thirdly, we
integrated these two local variables into a former
model built for the Iberian Peninsula (regional model)
increasing considerably its predictive power. Finally,
we compared both models focusing on the area
predicted to be invaded. The local model showed a
considerably narrower extent of suitable areas for
crayfish in the study area than the regional model.
These results show that the refinement of regional
scale predictions through the incorporation of species-
environment relationships at local scales may be
important for supporting management decisions. By
not integrating the effects of local variability, regional
bioclimatic models may overlook the potential distri-
bution of this invader at manageable extents. Results
further suggest that a wide range of native ecosystems
of conservation value are probably unsuitable for this
invasive species.
Keywords Biological invasions � Red swamp
crayfish � Risk assessment � Spatial Scale �Species distribution models
Introduction
Invasive species are a major threat to biodiversity
worldwide (Sala et al. 2000; Vie et al. 2009) and an
important part of current research in invasion ecology
aims at predicting the areas at risk of invasion.
Available predictions have been largely based on
correlative approaches that compare environmental
conditions in which species are observed in their
native or introduced ranges and those found in the new
areas (Guisan and Thuiller 2005), usually on a regional
or continental scale (e.g. Ficetola et al. 2007; Capinha
and Anastacio 2011). However, these large-scale
predictions may be insufficient to forecast local-scale
F. D. Moreira (&) � F. Ascensao � C. Capinha �D. Rodrigues
Centro de Biologia Ambiental, Faculdade de Ciencias,
Universidade de Lisboa, 1749-016 Lisbon, Portugal
e-mail: [email protected]
P. Segurado
Centro de Estudos Florestais, Universidade Tecnica de
Lisboa, Tapada da Ajuda, 1349-017 Lisbon, Portugal
M. Santos-Reis � R. Rebelo
Centro de Biologia Ambiental, Departamento de Biologia
Animal, Faculdade de Ciencias, Universidade de Lisboa,
Ed. C2, Campo Grande, 1749-016 Lisbon, Portugal
123
Biol Invasions
DOI 10.1007/s10530-014-0725-y

distribution (Guisan and Thuiller 2005; Loo et al.
2009; Reino et al. 2013), which is often the scale at
which management options are feasible. On the other
hand, using local variables alone to predict the
invasibility can lead to erroneous assumptions of
suitability because factors acting at coarser scales (e.g.
climate) may hamper the species’ establishment. This
duality emphasizes the importance of using analyses at
both local and regional/continental scales when esti-
mating the invasibility of an area. Nevertheless, local
analyses have been frequently ignored despite their
potential to refine information about invasibility, an
essential step for defining eradication/contention
strategies of invasive species or for mitigating their
effects in the native ecosystems (Loo et al. 2009).
The red swamp crayfish (Procambarus clarkii,
Girard 1852, hereafter ‘crayfish’) is native to south-
eastern North America and is currently an invasive
species in five continents (Gherardi 2006). In the
Iberian Peninsula the species was introduced in 1973
in southwestern Spain and was first recorded in SE
Portugal in 1979 (Ramos and Pereira 1981). Since
then, and as a result of natural dispersion and
anthropogenic transport, its distribution is expanding
to the north. In fact, humans have been playing a key
role in this invasion, transporting crayfish to new sites
and/or altering the landscape in a way that facilitates
its spread and establishment (Siesa et al. 2011;
Capinha et al. 2013).
The negative impacts of this invader are largely
known, affecting many taxa from aquatic plants
(Correia 2003; Geiger et al. 2005; Carreira et al.
2013) to invertebrates (e.g. Correia 2003; Geiger et al.
2005; Correia and Anastacio 2008) and amphibians
(e.g. Cruz et al. 2006, 2008; Nunes et al. 2010; Ficetola
et al. 2011). Conversely, there may be positive impacts
on higher trophic levels as a result of the role of this
crayfish as an abundant and easy prey for many
mammalian and avian predators (Correia 2001; Geiger
et al. 2005). Either way, its establishment disrupts the
structure and function of native ecosystems by
changing the relations between species; as well as
the flow of matter and energy (Geiger et al. 2005;
Ficetola et al. 2012).
During the last 40 years P. clarkii established itself
in all of Portugal’s main river basins. Capinha and
Anastacio (2011), using climatic and physiographic
predictors, suggested that one of the distribution limits
for this species will be the Northwest of the Iberian
Peninsula; however these authors also suggested that
most of the Northwest is suitable for this species.
Moreira (2011) conducted a bibliographical analysis
of more than 2,500 articles (scientific and grey
literature including news in local journals) and found
that: (1) the first records of the species in Northwest
Portugal date back to the year 2000; (2) four years later
the species was already present in all of the main river
basins of this region (Fig. 1). However, i n spite of
being present for at least a decade in this area this
crayfish was apparently not able to colonize all the
available freshwater habitats. This absence may be due
to local limiting factors, such as steep slope and high
water velocity, factors that have already been identi-
fied by other authors as limitative of P. clarkii
expansion in other areas of the Iberian Peninsula
(Cruz and Rebelo 2007; Banha and Anastacio 2011;
Gil-Sanchez and Alba-Tercedor 2002; Maceda-Veiga
et al. 2013).
In this study we aimed to identify the most
influential factors that are conditioning P. clarkii
expansion in the fringe of its distribution. We first
assessed the species presence and modelled its current
distribution. We then evaluated how the inclusion of
local variables improved Capinha and Anastacio
(2011) model. With this information we expected to
improve the identification of the areas at most risk of
being invaded.
Methods
Study area
The study was conducted in the northwest of Portugal,
a mountainous area (maximum altitude of 1.507 m)
within the Atlantic climate region, with an annual
mean temperature ranging between 7.8 and 15.6 �C
and an annual precipitation of 981 mm to 1,705 mm.
Along a SW–NE axis this area shows a gradient of
increasing elevation, as well as a change from silt to
rocky soils. There are just a few large lentic water
bodies; the landscape is dominated by large extensions
of different sized rivers (Fig. 1).
The region is one of the most biologically diverse in
Portugal, with approximately 30 % of its area under
some type of legal protection (Fig. 1), which may
constitute an opportunity to implement management
strategies concerning the invasion by P. clarkii.
F. D. Moreira et al.
123

Field survey
To assess crayfish presence we sampled 97 river
stretches spread throughout the study area, covering
all of the main river basins (Fig. 1). Crayfish distri-
bution data was collected from July to October 2010,
matching the time of year when the species is more
active (Gherardi et al. 2000). Sampling sites corre-
spond to different sized rivers. Within this paper,
‘‘small rivers’’ refers to rivers with strahler levels of
1–2 (that is, with either one or no tributaries of their
own) and which are \10 m wide; ‘‘medium sized
rivers’’ are those with strahler 2–5, and which usually
are between 10 and 30 m wide; and ‘‘main rivers’’ are
those that flow directly to the sea and are more than
30 m wide. At each sampling site we performed a
100 m transect along the river bank and searched for
signs of crayfish presence (live specimens or pieces of
recently predated individuals). When no signs of
crayfish were found, we installed five funnel traps (5 L
containers with a 43 mm diameter opening) baited
with fish-tasted cat food. Traps were set until the
presence of crayfish was confirmed or for a maximum
of three consecutive nights. For each basin, the
sampling was carried upstream, starting from the
vicinity of the river mouth.
Environmental variables
To characterize each 100 m river stretch we used ten
local environmental variables (for the complete list
and methodological details see Table 1) plus the
occurrence probability of P. clarkii according to the
Capinha and Anastacio (2011) model (hereafter
referred to as ‘‘regional model’’) which included the
following variables compiled at 1 km resolution:
annual mean temperature; mean temperature of
warmest quarter; mean temperature of coldest quarter;
annual precipitation; precipitation of wettest quarter
and precipitation of driest quarter; altitude; slope;
distance to ocean and a compound topographical
index.
Fig. 1 Study area within
the Iberian Peninsula; Grey
areas are under
environmental protection—
Natura 2000. Black dots
represent dates when
crayfish was first recorded in
each basin before our
sampling effort in 2010.
Black open square indicates
the area where the sampling
efficiency was tested.
Adapted from Moreira
(2011)
The red-swamp crayfish (Procambarus clarkii)
123
Slope was extracted for each river segment from the
Catchment Characterisation and Modelling database
(Vogt et al. 2007) as a surrogate of water current
velocity which has been pointed by several authors as
having a negative impact on this species (Gil-Sanchez
and Alba-Tercedor 2002; Cruz and Rebelo 2007). This
slope is actually quite different from the one used by
Capinha and Anastacio (2011) as it refers to the slope
of the riverbed and not to the average slope of a one
square kilometre cell. Additionally, we measured
width and depth of the river on site since they can
also influence current velocity.
The variable Human impacts assessed the level of
anthropological disturbance as it has been shown to
positively influence the distribution of crayfish (Siesa
et al. 2011; Capinha et al. 2013). The dominant habitat
surrounding each site was characterized within a 10 m
buffer along the river margin, since the surrounding
habitat can influence river characteristics (Allan
2004).
Soil and vegetation of the river margins and bed
were characterized by identifying soil and vegetation
types in ten points spaced out by 10 cm in three 1-m
transects distributed randomly along each sampling
point; counts of each type of soil and vegetation were
then converted into percentages. Soil was character-
ized according to its granulometry as the crayfish has
been referred to prefer silt surfaces because of its
burrowing behaviour (Correia and Ferreira 1995).
Margin vegetation was also characterized on the basis
of its cover using an increasing magnitude of human
intervention: from natural riparian forest to clear river
Table 1 Explanatory variables for modelling
Variable Type Unit Description Total range and
range of values
used for modelling
Regional model Continuous – Probability according to Capinha and Anastacio (2011) 0–0.82
0.56–0.81
Altitude Continuous m GPS 4–369
4–250
Slope Continuous % Steepness of the river segment 0–26.9
0–7.7
Width Continuous m Distance between the two margins (wet region) 2–315
3–315
Depth Continuous cm Water depth at each sampling site 20–130
30–120
Human impact Ordinal – Anthropogenic disturbance
1) no disturbance; 1–3
2) small impacts (such as for leisure activities); 1–3
3) high human impact and river bed modification
(e.g. channelling)
Surrounding area Ordinal – Land cover in the first 10 m of margin
1) natural vegetation; 1–3
2) afforestation or traditional small-scale agriculture; 1–3
3) human structures (houses, paved roads, etc.).
Margin soil Categorical – Soil type at the margin according to granulometry, from
1 (softest) to 4 (hardest)
1–4
1–3
River bed soil Categorical – Soil type at the river bed according to granulometry,
from 1 (softest) to 4 (hardest)
1–4
1–3
Margin vegetation Categorical – Vegetation type at the margin classified in a landscape
with increasingly more human impact
1–4
1–4
River bed vegetation Categorical – Vegetation type at the river bed classified by the
percentage of cover
1–4
1–4
F. D. Moreira et al.
123
banks. High cover of margin vegetation can influence
microclimate and deprive riverbed vegetation of light
(Allan 2004). The same procedure was applied to river
bed vegetation, one of the most important components
of crayfish’s diet (Gutierrez-Yurrita et al. 1998).
Although water flow has been found to influence
crayfish distribution (Gil-Sanchez and Alba-Tercedor
2002; Cruz and Rebelo 2007; Banha and Anastacio
2011), it was not considered in our models because
frequent and unpredictable discharges from dams
located upstream in all the main rivers of NW Portugal
cause a high temporal variability.
Data analysis
Sampling efficiency
Before further analysis, we assessed the accuracy of
our method in detecting the real absence of crayfish in
sampled sites, by calculating the probability of not
finding crayfish where the species is known to be
present (Type II error). This test was performed in a
small protected area (‘‘Paisagem Protegida da Lagoa
de Bertiandos e S. Pedro d’Arcos’’) and nearby rivers
(Fig. 1), in five different sites where crayfish is
present, but with contrasting abundances—two sites
with abundant populations (89 % occupied traps; 2.46
individuals caught per unit effort—CPUE) and three
sites where crayfish is captured only occasionally
(16 % occupied traps; 0.17 CPUE) (Rodrigues,
unpublished data). We used 15 traps per site that were
set for five consecutive nights and checked daily for
crayfish presence.
We built occupancy models (MacKenzie et al.
2002) separately for each type of site, using PRE-
SENCE software (Hines 2006). We randomly selected
five traps (out of the 15 that were used each night) to
simulate one sampling unit, and results were then
transformed to presence/absence. This random proce-
dure of choosing five out of the 15 traps was repeated
1,000 times for each of the 5 days of sampling. We
then estimated the detectability of the species using
one to five sampling days, in both low and high
abundance sites.
Modelling procedures
To investigate the relative influence of environmental
variables in the crayfish distribution and predict the
potential area of expansion we fitted logistic regres-
sion models to our data. A logistic regression model
was used to evaluate relationships between presence/
absence in our sampling sites and the set of environ-
mental predictors depicted in Table 1. Presence/
absence data were defined as follows: for each main
river basin, the invaded area was considered to
encompass the entire basin starting from the most
upstream site with confirmed presence. From this area,
we selected all presences (n = 46) for model building.
Absences were also chosen within the invaded area,
based on whether or not the site was located nearby a
site known to have crayfish; only those sites where
crayfish was not recorded and were distanced\10 km
from a known ‘presence’ were considered ‘absences’
(n = 16) (see Fig. 3). This is an important step to
insure that the equilibrium assumption is met (Guisan
and Zimmermann 2000).
Before model building we evaluated the collinear-
ity between the variables, using the Variation Inflation
Factor, which shows how much the regression coef-
ficient is increased due to collinearity. Variables with a
Variation Inflation factor above five were removed
from the subsequent analysis (Craney and Surles
2002). This procedure removed Altitude and Depth
from further analysis.
We constrained our models to include the variable
representing the probabilities of species occurrence
projected by the regional model for each sampling site,
while the other remaining eight variables were com-
bined in all possibilities in a total of 255 models
(hereafter referred to as ‘combined models’). Model
selection procedure was based on the Akaike Infor-
mation Criteria adjusted for small sample sizes (AICc,
Burnham and Anderson 2004). In order to identify
those models with larger support, Akaike weights (wi)
were computed for each candidate model (dAICc \ 4,
Richards 2005).
A Moran’s I test was performed to check for spatial
autocorrelation in the residuals of the best fitted
model. For that purpose a distance matrix among all
sites was computed based on distances along the river
network. Dispersion between river basins was consid-
ered to be negligible.
We assessed the classification accuracy of the
different models using a leave-one-out cross-valida-
tion to compute two commonly used measures
(Allouche et al. 2006): area under the ROC (AUC)
and true skill statistics (TSS). For TSS computation
The red-swamp crayfish (Procambarus clarkii)
123
and presence/absence predictions, we used species
prevalence as the cut-off probability.
To map the probability of colonization of the river
stretches that were not directly sampled, we first
divided the best combined model into two simpler
models: (1) a ‘Regional model’ represents the proba-
bility of distribution according to Capinha and Anasta-
cio (2011), as explained previously; and (2), a ‘local
model’ that was built with the two local variables
included in the combined model. This local model does
not represent the result of the modelling selection
procedure. Using the partial responses of river width,
we could determine, to any given slope, the critical
value for the model to change its prediction from
absence to presence, based on the cut-off probability.
River width was calculated with the aerial images from
the software Google Earth (version 7.1.2.2041) to any
given site. We used this function to classify all the river
stretches of the study area as susceptible of being
invaded, or protected from invasion. This separation
between presence and absence sites was clear for most
stream sections, either with steep slopes (where the
species would require wide rivers to be present) or
moderate slopes (where the species would still be able
to establish in narrow rivers).We then overlapped the
map resulting from this approach with the regional
model in order to trace the species potential distribu-
tion boundaries in each basin.
All statistical analyses were performed in R soft-
ware version 2.12 (R Development Core Team 2012).
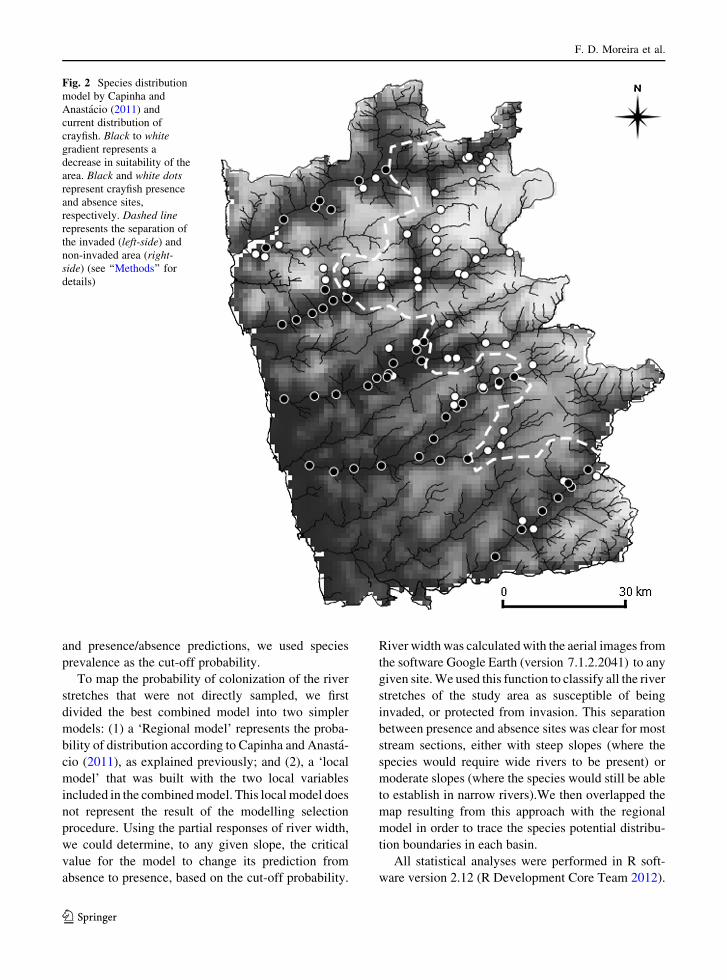
Fig. 2 Species distribution
model by Capinha and
Anastacio (2011) and
current distribution of
crayfish. Black to white
gradient represents a
decrease in suitability of the
area. Black and white dots
represent crayfish presence
and absence sites,
respectively. Dashed line
represents the separation of
the invaded (left-side) and
non-invaded area (right-
side) (see ‘‘Methods’’ for
details)
F. D. Moreira et al.
123
AICc and wi were computed using the R package
MuMIn (Barton 2009). Moran’ I values and tests were
computed with the R package spdep (Bivand 2007).
Results
Sampling efficiency
Sampling efficiency was very high in sites with high
crayfish abundance, with 100 % probability of detec-
tion within the first day with any given set of five traps.
At low abundance sites the probability of detecting
crayfish within 1 day of sampling was also high
(78.6 %) and after 3 days of sampling it increased to
97.4 %. On the basis of these results, we set 3 days as
the minimum number of days necessary to confirm
crayfish presence at any given site.
Field survey
We found crayfish in 46 out of 97 sampling sites. The
species is mostly present at lower altitudes and is
apparently more widespread in the southern part of the
study area, where it has supposedly arrived earlier
(Fig. 2).
Combined suitability models
The overlap of the current distribution of crayfish with
the regional model highlighted many river segments
located in the non-invaded area with high environmental
suitability for the species, and conversely absences in
river segments showing high suitability index values in
the invaded area (Fig. 2).
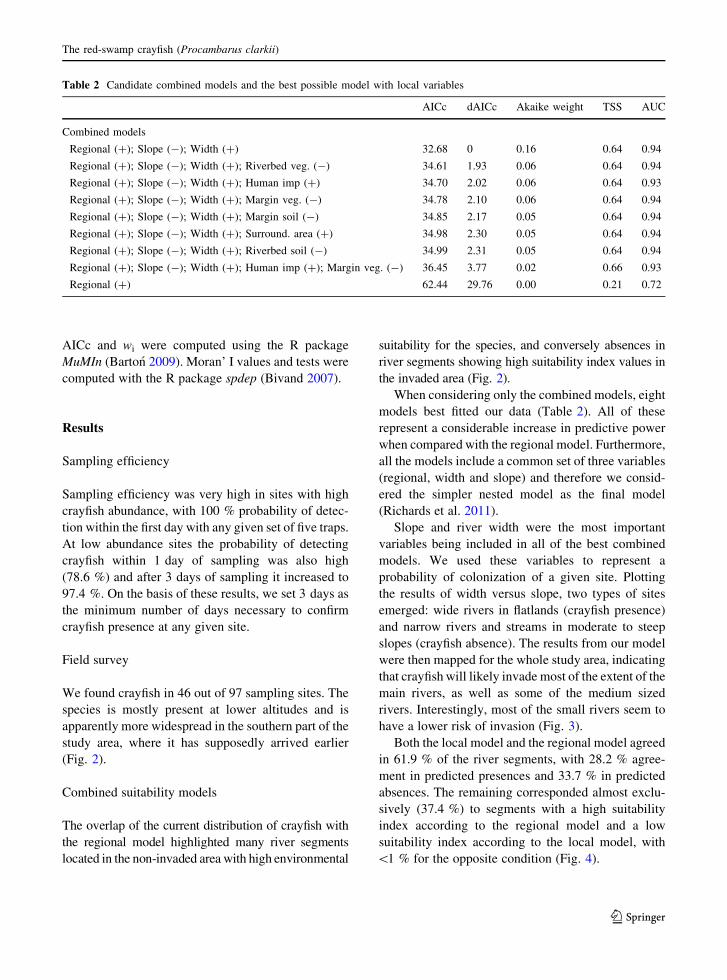
When considering only the combined models, eight
models best fitted our data (Table 2). All of these
represent a considerable increase in predictive power
when compared with the regional model. Furthermore,
all the models include a common set of three variables
(regional, width and slope) and therefore we consid-
ered the simpler nested model as the final model
(Richards et al. 2011).
Slope and river width were the most important
variables being included in all of the best combined
models. We used these variables to represent a
probability of colonization of a given site. Plotting
the results of width versus slope, two types of sites
emerged: wide rivers in flatlands (crayfish presence)
and narrow rivers and streams in moderate to steep
slopes (crayfish absence). The results from our model
were then mapped for the whole study area, indicating
that crayfish will likely invade most of the extent of the
main rivers, as well as some of the medium sized
rivers. Interestingly, most of the small rivers seem to
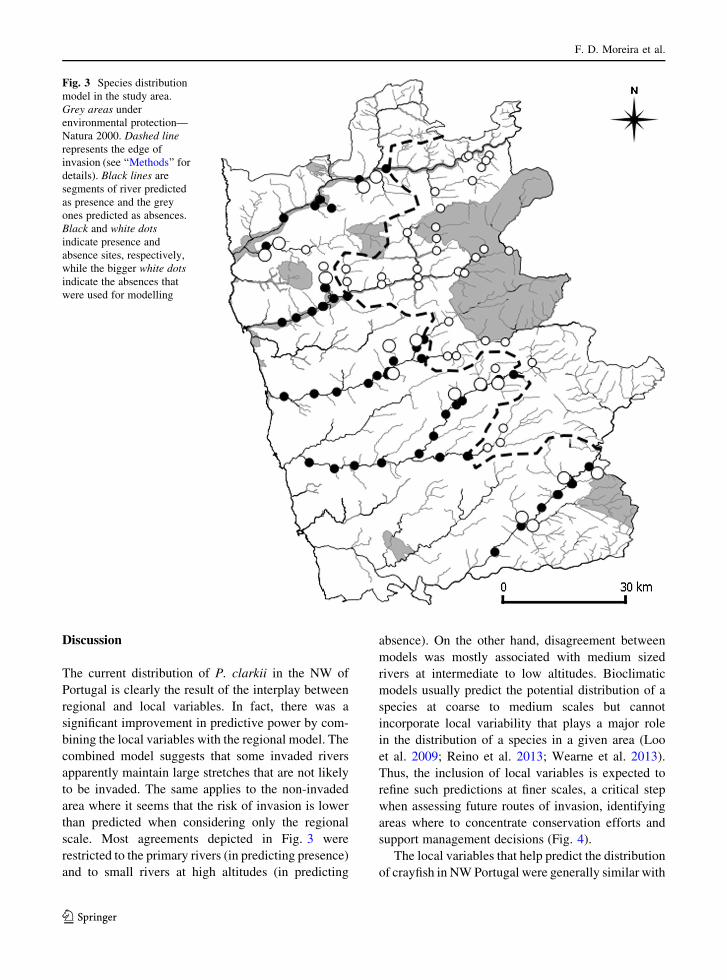
have a lower risk of invasion (Fig. 3).
Both the local model and the regional model agreed
in 61.9 % of the river segments, with 28.2 % agree-
ment in predicted presences and 33.7 % in predicted
absences. The remaining corresponded almost exclu-
sively (37.4 %) to segments with a high suitability
index according to the regional model and a low
suitability index according to the local model, with
\1 % for the opposite condition (Fig. 4).
Table 2 Candidate combined models and the best possible model with local variables
AICc dAICc Akaike weight TSS AUC
Combined models
Regional (?); Slope (-); Width (?) 32.68 0 0.16 0.64 0.94
Regional (?); Slope (-); Width (?); Riverbed veg. (-) 34.61 1.93 0.06 0.64 0.94
Regional (?); Slope (-); Width (?); Human imp (?) 34.70 2.02 0.06 0.64 0.93
Regional (?); Slope (-); Width (?); Margin veg. (-) 34.78 2.10 0.06 0.64 0.94
Regional (?); Slope (-); Width (?); Margin soil (-) 34.85 2.17 0.05 0.64 0.94
Regional (?); Slope (-); Width (?); Surround. area (?) 34.98 2.30 0.05 0.64 0.94
Regional (?); Slope (-); Width (?); Riverbed soil (-) 34.99 2.31 0.05 0.64 0.94
Regional (?); Slope (-); Width (?); Human imp (?); Margin veg. (-) 36.45 3.77 0.02 0.66 0.93
Regional (?) 62.44 29.76 0.00 0.21 0.72
The red-swamp crayfish (Procambarus clarkii)
123
Discussion
The current distribution of P. clarkii in the NW of
Portugal is clearly the result of the interplay between
regional and local variables. In fact, there was a
significant improvement in predictive power by com-
bining the local variables with the regional model. The
combined model suggests that some invaded rivers
apparently maintain large stretches that are not likely
to be invaded. The same applies to the non-invaded
area where it seems that the risk of invasion is lower
than predicted when considering only the regional
scale. Most agreements depicted in Fig. 3 were
restricted to the primary rivers (in predicting presence)
and to small rivers at high altitudes (in predicting
absence). On the other hand, disagreement between
models was mostly associated with medium sized
rivers at intermediate to low altitudes. Bioclimatic
models usually predict the potential distribution of a
species at coarse to medium scales but cannot
incorporate local variability that plays a major role
in the distribution of a species in a given area (Loo
et al. 2009; Reino et al. 2013; Wearne et al. 2013).
Thus, the inclusion of local variables is expected to
refine such predictions at finer scales, a critical step
when assessing future routes of invasion, identifying
areas where to concentrate conservation efforts and
support management decisions (Fig. 4).
The local variables that help predict the distribution
of crayfish in NW Portugal were generally similar with
Fig. 3 Species distribution
model in the study area.
Grey areas under
environmental protection—
Natura 2000. Dashed line
represents the edge of
invasion (see ‘‘Methods’’ for
details). Black lines are
segments of river predicted
as presence and the grey
ones predicted as absences.
Black and white dots
indicate presence and
absence sites, respectively,
while the bigger white dots
indicate the absences that
were used for modelling
F. D. Moreira et al.
123
variables included in other published models (Gil-
Sanchez and Alba-Tercedor 2002; Cruz and Rebelo
2007; Banha and Anastacio 2011). River width and
slope were chosen for their positive and negative
relationship, respectively, on the potential distribution
of the crayfish. This result was expected since crayfish
preference for wide and slow streams is well docu-
mented (e.g. Gil-Sanchez and Alba-Tercedor 2002;
Cruz and Rebelo 2007). It should be noted that not all
the variability range of these and other variables was
used for calibrating models, because some the sites
that were not exposed to the crayfish invasion could
not be considered as true absences. This may have
cause some problems when extrapolating the model
for the whole study area. However, we think the range
of conditions that was omitted in model calibration is
the most unsuitable for the species (e.g. very steep
sites) and therefore will have little implications on
model transferability.
In contrast with the results of Siesa et al. (2011), we
found no significant association between crayfish
presence and human dominated areas. This may result
from a lower degree of human impact in NW Portugal
than in Lombardy in Italy, as well as from the type of
aquatic habitat considered which is mainly lentic in
Italy and entirely lotic in this study.
Mapping the predictions of two models, one based
on width and slope (local variables) and another based
on macroecological factors (regional model) revealed
a similar prediction for 62 % of the river stretches
Fig. 4 Comparison
between the species
distribution models of
Capinha and Anastacio
(2011) and of the present
study. Black both the
regional and local models
show high suitability index;
Green both the regional and
local models show low
suitability; Blue the regional
model indicates a high
suitability and the local
model a low suitability; Red
the regional model indicates
a high suitability and the
local model a low
suitability. Grey areas are
under environmental
protection—Natura 2000.
Dashed line represents the
edge of invasion
The red-swamp crayfish (Procambarus clarkii)
123
considered, while the remaining ones seemed to
almost exclusively show a high suitability according
to the regional model and a low suitability according
to the local model. This is the result of a weak
prediction ability of the regional model for medium
size tributaries. Since temperature was the most
important variable for the regional model (Capinha
and Anastacio 2011), we assume that these habitats
may have an adequate temperature for crayfish, but
nevertheless are steep (and water flow will probably be
strong), which makes them unsuitable for this species.
On the contrary, stretches for which the regional
model indicated a low suitability and the local model a
high suitability were rare as high altitude plateaus with
large and less steep rivers stretches are very uncom-
mon. This too might be explained by the fact that low
temperature habitats will mostly be located at high
altitudes, where rivers will be both narrower and
steeper.
Since the variables chosen in both models are
related to altitude, one could expect crayfish to be
present at low altitudes and slowly disappear as
altitude increases. However, this may not always be
the case as the current edges of crayfish distribution in
the most northern basins of the study area are located
at an altitude of approximately 25 m a.s.l. albeit this
species is known to occur up to varying altitudes such
as 190 m a.s.l in the SW Portugal (Cruz and Rebelo
2007), 572 m a.s.l. in the NE Portugal (Bernardo et al.
2011) and 750 m a.s.l. in southern Spain (Maceda-
Veiga et al. 2013). The restriction of crayfishes to low
altitude sites in the northern edge of the study area may
be due to insufficient propagule pressure due to
limitations to natural dispersal. However, the river
located just north of the area where we tested sampling
efficiency (river Estoraos) had a nearby (3.3 km) high
density site for more than 10 years, and yet the
crayfish altitudinal limit in this river is still very low
(51 m a.s.l.). Individuals of this species are known to
disperse upstream up to 1.74 km/year in other edge
areas (Bernardo et al. 2011); the fact that they were not
able to disperse over 3.3 km during a 10 years period
suggests that low altitude regions of NW Portugal are
less suitable to this species. This may be due to a
stronger stream flow, lower overall temperature or
even to other unassessed variables such as the stream’s
chemical properties (e.g. calcium concentration) at
each site (Cairns and Yan 2009; Favaro et al. 2010).
One of the assumptions for building a presence/
absence model is that the species is at equilibrium and
violating this assumption may have severe conse-
quences on the results (Guisan and Zimmermann
2000; Gallien et al. 2012; Vaclavik and Meentemeyer
2012). This is especially important for invasive
species during the invasion process since these are
the ones that violate this assumption more severely
while being also the ones for which predictions of
potential distributions are most desirable. An impor-
tant assumption of modelling approaches based on
presence/absence data is that locations where the
species is absent are truly unsuitable. To ascertain this,
all the sites in the three northernmost rivers that had no
crayfish in the 2010 survey were sampled again in
2012 and were found to be still devoid of crayfish.
However, overlaying the current distribution of cray-
fish with the results of any of the models, it is clear that
there should be suitable habitat for the species in the
non-invaded area and lack of crayfish in some places
may be just the result of a slow expansion. Another
hypothesis is that environmental variables other than
the ones accounted for in these models are preventing
the species from expanding its distribution. A possible
effect of physical barriers is not plausible, considering
that no physical barriers were found at the current edge
of invasion in any of the rivers. We therefore assume
that the sites we considered as true absences still are or
have been unsuitable for crayfish in the last
5–10 years. However, climate change may consider-
ably change this picture, particularly if precipitation/
river flow are affected (Capinha et al. 2013).
Conservation implications
Approximately 30 % of NW Portugal is under some
sort of environmental protection. Therefore progres-
sion of crayfish in this region may increase the impacts
on several endemic species and communities. Most
feared are those on native amphibians (e.g. Cruz and
Rebelo 2005) and fishes (e.g. Correia 2003) but also
important are those on macroinvertebrates (e.g. Geiger
et al. 2005; Correia and Anastacio 2008) and,
indirectly, on macroinvertebrate-feeding species like
the threatened Pyrenean desman (Galemys pyrenai-
cus). Crayfish may also have a direct influence on
riverbed vegetation by damaging soil structure and
increasing water turbidity through its burrowing
F. D. Moreira et al.
123
behavior (Correia and Ferreira 1995; Angeler et al.
2001). Last but not least, its recognised impacts on the
higher trophic levels that will influence the whole
ecosystem. Particularly important is the role it may
play in supporting populations of native species (such
as the European otter Lutra lutra); it may also be a
facilitator of the expansion of another new invader in
NW Portugal, the American mink (Neovison vison)
(Rodrigues et al. 2014), that in turn exerts predation
over the local biodiversity, strengthening the negative
impacts of the crayfish.
Due to crayfish biological and ecological traits and
continuing human mediated dispersion, most of the
Iberian Peninsula is seen as a lost cause in terms of
preventing its expansion. However, this work suggests
that crayfish might not colonize as many habitats as
one would expect.
The current abundance levels and the extent to
which the species has spread indicate that an eradica-
tion program is no longer feasible. Instead, a manage-
ment program, coupled with regular monitoring
efforts, is urgent and critical to understand and prevent
its further progression. New insights on the needs of
this species at a local scale are essential as these are
easier to act on through management programs. The
use of physical barriers on rivers (Kerby et al. 2005;
Rosewarne et al. 2013) to control the numbers of
crayfish that progress upstream is a management
option that has already shown promising results in
another region of the Iberian Peninsula (Dana et al.
2011). These barriers would function as a high slopes
that would increase water flow. However, as a barrier
will impact multiple other species, its use might be
controversial and will impose mitigation measures,
meaning that it cannot be applied at a widespread scale
and needs a detailed and scientifically sound planning.
Today P. clarkii is the most widely introduced
crayfish in the world. While it is an abundant and
widespread species in southwestern Europe, it is
currently spreading in central and even northern
Europe, as well as in other hilly or mountainous
temperate areas of the world (Gherardi 2006). In these
regions the physiographic and climatic conditions
encountered by this invasive are relatively similar to
those of NW Portugal and the constraints on its
dispersal identified in this work may be used to help to
contain its invasion.
Also important is the recognition that the high
invasion rate of the crayfish is a human-mediated
process, already referred by Capinha et al. (2013) at
the European level, but particularly evident in our
study area (similar years of arrival in distant basins).
This evidence reinforces the urgent need of informing
local stakeholders of the consequences of the species
expansion to new areas, developing local solutions and
promoting social awareness of this environmental
problem at the national level.
Acknowledgments This study was financed by FCT—
Fundacao para a Ciencia e Tecnologia (Portugal) through
project DILEMA—Alien species and conservation dilemmas:
the effects of native competitors and alien prey species on the
spread of American mink in Portugal (PTDC/BIA-BECD/
102433/2008). The authors would like to thank the staff at
‘‘Paisagem Protegida da Lagoa de Bertiandos e S. Pedro
d’Arcos’’ for logistic support and everyone involved in the
fieldwork. The authors would also like to thank G.F. Ficetola
and an anonymous reviewer for their overall contribution and
consequent improvement of the manuscript.
References
Allan JD (2004) Landscapes and riverscapes: the influence of
land use on stream ecosystems. Annu Rev Ecol Evol Syst
35:257–284
Allouche O, Tsoar A, Kadmon R (2006) Assessing the accuracy
of species distribution models: prevalence, kappa and the
true skill statistic (TSS). J Appl Ecol 43:1223–1232
Angeler DG, Sanchez-Carillo S, Garca G, Alvarez-Cobelas M
(2001) The influence of Procambarus clarkii (Decapoda:
Cambaridae) on water quality and sediment characteristics
in Spanish floodplain wetland. Hydrobiologia 464:89–98
Banha F, Anastacio PM (2011) Interactions between invasive
crayfish and native river shrimp. Knowl Manag Aquat
Ecosyst 401(17):1–12
Barton K (2009) Bivand: multi-model inference. R package,
version 1.7.2. http://r-forge.r-project.org/projects/mumin/
Bernardo JM, Costa AM, Bruxelas S, Teixeira A (2011) Dis-
persal and coexistence of two non-native crayfish species
(Pacifastacus leniusculus and Procambaru clarkii) in NE
Portugal over a 10-year period. Knowl Manag Aquat
Ecosyst 401:28
Bivand R (2007) spdep: Spatial dependence: weighting
schemes, statistics and models. R package version 0.5-43.
http://r-forge.r-project.org/projects/spdep/
Burnham KP, Anderson DR (2004) Multimodel inference:
understanding AIC and BIC in model selection. Sociol
Methods Res 33(2):261–304
Cairns A, Yan N (2009) A review of the influence of low
ambient calcium concentrations on freshwater daphniids,
gammarids, and crayfish. Environ Rev 17:67–79
Capinha C, Anastacio P (2011) Assessing the environmental
requirements of invaders using ensembles of distribution
models. Divers Distrib 17:13–24
Capinha C, Brotons L, Anastacio P (2013) Geographical vari-
ability in propagule pressure and climatic suitability
The red-swamp crayfish (Procambarus clarkii)
123
explain the European distribution of two highly invasive
crayfish. J Biogeogr 40:548–558
Carreira BM, Dias MP, Rebelo R (2013) How consumption and
fragmentation of macrophytes by the invasive crayfish
Procambarus clarkii shape the macrophyte communities of
temporary ponds. Hydrobiologia 721:89–98
Correia AM (2001) Seasonal and interspecific evaluation of
predation by mammals and birds on the introduced red
swamp crayfish Procambarus clarkii (Crustacea, Cam-
baridae) in a freshwater marsh (Portugal). J Zool
255(4):533–541
Correia AM (2003) Food choice by the introduced crayfish
Procambarus clarkii. Ann Zool Fenn 40:517–528
Correia AM, Anastacio PM (2008) Shifts in aquatic macroin-
vertebrate biodiversity associated with the presence and
size of an alien crayfish. Ecol Res 23:729–734
Correia AM, Ferreira O (1995) Burrowing behavior of the
introduced red swamp crayfish Procambarus clarkii
(Decapoda: Cambaridae) in Portugal. J Crustacean Biol
15:248–257
Craney TA, Surles JG (2002) Model-dependent variance infla-
tion factor cutoff values. Qual Eng 14(3):391–403
Cruz MJ, Rebelo R (2007) Colonization of freshwater habitats
by an introduced crayfish, Procambarus clarkii, in South-
west Iberian Peninsula. Hydrobiologia 575:191–201
Cruz MJ, Rebelo R, Crespo EG (2006) Effects of an introduced
crayfish, Procambarus clarkii, on the distribution of south-
western Iberian amphibians in their breeding habitats.
Ecography 29:329–338
Cruz MJ, Segurado P, Sousa M, Rebelo R (2008) Collapse of the
amphibian community of the Paul do Boquilobo Natural
Reserve (central Portugal) after the arrival of the exotic
American crayfish Procambarus clarkii. Herpetol J
18:197–204
Dana ED, Garcia-de-Lomas J, Gonzalez R, Ortega F (2011)
Effectiveness of dam construction to contain the invasive
crayfish Procambarus clarkii in a Mediterranean mountain
stream. Ecol Eng 37:1607–1613
Favaro L, Tirelli T, Pessani D (2010) The role of water chem-
istry in the distribution of Austropotamobius pallipes
(Crustacea Decapoda Astacidae) in Piedmont (Italy). C R
Biol 333:68–75
Ficetola GF, Thuiller W, Miaud C (2007) Prediction and vali-
dation of the potential global distribution of a problematic
alien invasive species—the American bullfrog. Divers
Distrib 13:476–485
Ficetola GF, Siesa ME, Manenti R, Bottoni L, De Bernardi F,
Padoa-Schioppa E (2011) Early assessment of the impact
of alien species: differential consequences of an invasive
crayfish on adult and larval amphibians. Divers Distrib
17:1141–1151
Ficetola GF, Siesa ME, De Bernardi F, Padoa-Schioppa E
(2012) Complex impact of an invasive crayfish on fresh-
water food webs. Biodivers Conserv 21:2641–2651
Gallien L, Douzet R, Pratte S, Zimmermann NE, Thuiller W
(2012) Invasive species distribution models—how violat-
ing the equilibrium assumption can create new insights.
Glob Ecol Biogeogr 21:1126–1136
Geiger W, Alcorlo P, Baltanas A, Montes C (2005) Impact of an
introduced crustacean on the trophic webs of Mediterra-
nean wetlands. Biol Invasions 7:49–73
Gherardi F (2006) Crayfish invading Europe: the case study of
Procambarus clarkii. Mar Freshw Behav Physiol
39:175–191
Gherardi F, Barbaresi S, Salvi G (2000) Spatial and temporal
patterns in the movement of Procambarus clarkii, an
invasive crayfish. Aquat Sci 62:179–193
Gil-Sanchez JM, Alba-Tercedor J (2002) Ecology of the native
and introduced crayfishes Austropotamobius pallipes and
Procambarus clarkii in southern Spain and implications for
conservation of the native species. Biol Conserv 105:75–80
Guisan A, Thuiller W (2005) Predicting species distribution:
offering more than simple habitat models. Ecol Lett
8:993–1009
Guisan A, Zimmermann NE (2000) Predictive habitat distri-
bution models in ecology. Ecol Model 135:147–186
Gutierrez-Yurrita PJ, Sancho G, Bravo MA, Baltanas A, Montes
C (1998) Diet of the red swamp crayfish Procambarus
clarkii in natural ecosystems of the Donana National Park
temporary freshwater marsh (Spain). J Crustacean Biol
18(1):120–127
Hines JE (2006) PRESENCE—Software to estimate patch
occupancy and related parameters. USGS-PWRC. http://
www.mbr-pwrc.usgs.gov/software/presence.html
Kerby JL, Riley SPD, Kats LB, Wilson P (2005) Barriers and
flow as limiting factors in the spread of an invasive crayfish
(Procambarus clarkii) in southern California streams. Biol
Conserv 126:402–409
Loo SE, Nally RM, O’Dowd DJ, Thomson JR, Lake PS (2009)
Multiple scale analysis of factors influencing the distribu-
tion of an invasive aquatic grass. Biol Invasions
11:1903–1912
Maceda-Veiga A, De Sostoa A, Sanchez-Espada S (2013)
Factors affecting the establishment of the invasive crayfish
Procambarus clarkii (Crustacea, Decapoda) in the Medi-
terranean rivers of the northeastern Iberian Peninsula.
Hydrobiologia 703:33–45
MacKenzie DI, Nichols JD, Lachman GB, Droege S, Royle JA,
Langtimm A (2002) Estimating site occupancy rates when
detection probabilities are less than one. Ecology
83(8):2248–2255
Moreira F (2011) Propagacao de um invasor: passado, presente e
futuro de P. clarkii no noroeste de Portugal. MSc Disser-
tation. University of Lisbon
Nunes AL, Cruz MJ, Tejedo M, Laurila A, Rebelo R (2010)
Nonlethal injury caused by an invasive alien predator and
its consequences for an anuran tadpole. Basic Appl Ecol
11(7):645–654
R Development Core Team (2012) R: A language and envi-
ronment for statistical computing. R Foundation for Sta-
tistical Computing, Vienna, Austria. ISBN 3-900051-07-0.
http://www.R-project.org/
Ramos MA, Pereira TM (1981) Um novo Astacidae para a fauna
portuguesa: Procambarus clarkii (Girard, 1852). Bol Inst
Nac Invest Pescas 6:37–47
Reino L, Beja P, Araujo MB, Dray S, Segurado P (2013) Does
local habitat fragmentation affect large-scale distributions?
The case of a specialist grassland bird. Divers Distrib
19(4):423–432
Richards SA (2005) Testing ecological theory using the Infor-
mation-Theoretic approach: examples and cautionary
results. Ecology 86(10):2805–2814
F. D. Moreira et al.
123
Richards SA, Whittingham MJ, Stephens PA (2011) Model
selection and model averaging in behavioural ecology: the
utility of the IT-AIC framework. Behav Ecol Sociobiol
65:77–89
Rodrigues D, Simoes L, Mullins J, Lampa S, Mendes RC,
Fernandes C, Rebelo R, Santos-Reis M (2014) Tracking the
expansion of the American mink (Neovison vison) range in
NW Portugal. Biol Invasions. doi:10.1007/s10530-014-
0706-1
Rosewarne P, Wright RM, Dunn AM (2013) Do low-head riv-
erine structures hinder the spread of invasive crayfish?
Case study of signal crayfish (Pacifastacus leniusculus)
movements at a flow gauging weir. Manag Biol Inv
4(4):273–282
Sala OE, Chapin FS III, Armesto JJ, Berlow E, Bloomfield J,
Dirzo R, Huber-Sanwald E, Huenneke LF, Jackson RB,
Kinzig A, Leemans R, Lodge DM, Mooney HA, Oester-
held M, Poff NLR, Sykes MT, Walker BH, Walker M, Wall
DH (2000) Global biodiversity scenarios for the year 2100.
Science 287:1770–1774
Siesa ME, Manenti R, Padoa-Schioppa E, De Bernardi F,
Ficetola GF (2011) Spatial autocorrelation and the analysis
of invasion processes from distribution data: a study with
the crayfish Procambarus clarkii. Biol Invasions
13:2147–2160
Vaclavik R, Meentemeyer RK (2012) Equilibrium or not?
Modelling potential distribution of invasive species in
different stages of invasion. Divers Distrib 18(1):73–83
Vie J, Hilton-Taylor C, Stuart SN (2009) Wildlife in a changing
world: An analysis of the 2008 IUCN red list of threatened
species 1-184. IUCN
Vogt J, Soille P, De Jager A, Rimaviciute E, Mehl W, Foisneau
S, Bodis K, Dusart J, Paracchini ML, Haastrup P (2007) A
pan-European River and Catchment Database. JRC Ref-
erence Reports
Wearne LJ, Ko D, Hannan-Jones M, Calvert M (2013) Potential
distribution and risk assessment of an invasive plant spe-
cies: a case study of Hymenachne amplexicaulis in Aus-
tralia. Hum Ecol Risk Assess Int J 19:53–79
The red-swamp crayfish (Procambarus clarkii)
123
Copyright © 2022 FDOKUMEN