
Modelling the distribution of the moss species Hypopterygium tamarisci (Hypopterygiaceae, Bryophyta)...
22
399 Nova Hedwigia Vol. 91 issue 3–4, 399–420 Stuttgart, November 2010 Article © 2010 J. Cramer in Gebr. Borntraeger Verlagsbuchhandlung, Stuttgart, Germany www.borntraeger-cramer.de DOI: 10.1127/0029-5035/2010/0091-0399 0029-5035/2010/0091-0399 $ 5.50 Modelling the distribution of the moss species Hypopterygium tamarisci (Hypopterygiaceae, Bryophyta) in Central and South America Hans (J.D.) Kruijer, Niels Raes and Michael Stech Netherlands Centre for Biodiversity Naturalis (section NHN), Leiden University, P.O. Box 9514, 2300 RA Leiden, The Netherlands; With 11 figures and 3 tables Kruijer, J.D., N. Raes & M. Stech (2010): Modelling the distribution of the moss species Hypopterygium tamarisci (Hypopterygiaceae, Bryophyta) in Central and South America. – Nova Hedwigia 91: 399– 420. Abstract: The pleurocarpous moss Hypopterygium tamarisci is widely distributed in Africa, S and SE Asia, Australasia, Oceania, as well as South and Central America, where it extends into Mexico and the Caribbean. It is a species of mainly mountainous tropical and warm temperate areas. The present study focuses on the actual and the potential distributions of H. tamarisci in the New World south of the Tropic of Cancer. It aims to find ecological conditions for this area that determine the distribution of this species by making use of species distribution modelling techniques. We use a data set from verified herbarium specimens and a set of collection records downloaded from the GBIF (Global Biodiversity Information Facility) database. The potential distribution models of H. tamarisci were developed with Maxent (Phillips et al. 2006) based on the collection datasets and a set of uncorrelated bioclimatic and edaphic variables. The predicted distribution of the species matches the actual collecting localities very well. A maximum temperature below 29°C in the warmest month is the most important ecological variable that determines the presence of H. tamarisci. Second most important variable is the precipitation in the warmest quarter, for which H. tamarisci shows an increasing probability of presence under wetter conditions. The models predict the potential occurrence of the species in the Guiana Highlands, where the species does not occur. Several explanations for this mismatch are being discussed, but a satisfactory explanation is wanting. Keywords: Autecology, bioclimatic variables, Caribbean, Central America, distribution modelling, edaphic variables, Guiana Highlands; Hypopterygium tamarisci, South America. e-mail: [email protected] (author for correspondence), [email protected], [email protected]
Transcript of Modelling the distribution of the moss species Hypopterygium tamarisci (Hypopterygiaceae, Bryophyta)...
399
Nova Hedwigia Vol 91 issue 3ndash4 399ndash420
Stuttgart November 2010
Article
copy 2010 J Cramer in Gebr Borntraeger Verlagsbuchhandlung Stuttgart Germany wwwborntraeger-cramerdeDOI 1011270029-503520100091-0399 0029-503520100091-0399 $ 550
Modelling the distribution of the moss speciesHypopterygium tamarisci (Hypopterygiaceae Bryophyta) inCentral and South America
Hans (JD) Kruijer Niels Raes and Michael Stech
Netherlands Centre for Biodiversity Naturalis (section NHN) Leiden UniversityPO Box 9514 2300 RA Leiden The Netherlands
With 11 figures and 3 tables
Kruijer JD N Raes amp M Stech (2010) Modelling the distribution of the moss species Hypopterygiumtamarisci (Hypopterygiaceae Bryophyta) in Central and South America ndash Nova Hedwigia 91 399ndash420
Abstract The pleurocarpous moss Hypopterygium tamarisci is widely distributed in Africa S andSE Asia Australasia Oceania as well as South and Central America where it extends into Mexico andthe Caribbean It is a species of mainly mountainous tropical and warm temperate areas The presentstudy focuses on the actual and the potential distributions of H tamarisci in the New World south ofthe Tropic of Cancer It aims to find ecological conditions for this area that determine the distributionof this species by making use of species distribution modelling techniques We use a data set fromverified herbarium specimens and a set of collection records downloaded from the GBIF (GlobalBiodiversity Information Facility) database The potential distribution models of H tamarisci weredeveloped with Maxent (Phillips et al 2006) based on the collection datasets and a set of uncorrelatedbioclimatic and edaphic variables The predicted distribution of the species matches the actual collectinglocalities very well A maximum temperature below 29degC in the warmest month is the most importantecological variable that determines the presence of H tamarisci Second most important variable is theprecipitation in the warmest quarter for which H tamarisci shows an increasing probability ofpresence under wetter conditions The models predict the potential occurrence of the species in theGuiana Highlands where the species does not occur Several explanations for this mismatch are beingdiscussed but a satisfactory explanation is wanting
Keywords Autecology bioclimatic variables Caribbean Central America distribution modellingedaphic variables Guiana Highlands Hypopterygium tamarisci South America
e-mail hkruijernhnleidenunivnl (author for correspondence) raesnhnleidenunivnlstechnhnleidenunivnl
400
Introduction
The genus Hypopterygium Brid comprises 7 to 9 species (Kruijer amp Bloumlcher 2007Shaw et al 2008) and is the largest genus of the small pleurocarpous moss familyHypopterygiaceae Mitt The mainly pantropical to warm-temperate speciesHypopterygium tamarisci (Sw) Brid ex MuumlllHal is the most widespread species ofboth the genus and the family and is indigenous in the New World Africa AsiaAustralasia and Oceania (Pfeiffer et al 2000 Kruijer 2002) which reflects aGondwanan origin The species has been introduced to Europe (Kruijer 1997 2002and references therein Stech amp Pfeiffer 2006)
Hypopterygium tamarisci occurs in dry to wet forests where it grows in moist or wetplaces most frequently near streams or in partially to fully shaded habitats (Kruijer2002) The beautiful plants (gametophores) are dendroids fans or intermediateforms and grow in terrestrial epilithic epiphytic or epixylic colonies on varioussubstrates with various angles of inclination The altitudinal distribution varies from600ndash3160 m in the Neotropics and 0ndash4160 m in the Palaeotropics to 0ndash1550 m in(warm-)temperate areas (here including SE Brazil and adjacent areas Kruijer 2002)Although H tamarisci is widely distributed in the Tropics to warm-temperate areasof the world it is not evenly distributed in these areas Being predominantly a speciesof forests in humid climates it is of course absent from deserts and semi-arid areaswith the occasional exception of a few caves and other moist sheltered environmentsin arid parts of eastern Australia (Downing et al 1997 Kruijer 2002) The specieshowever is also mainly absent from tropical lowlands (eg Amazon basin Congobasin) and few tropical highlands that seem to fall within distribution area of thespecies (eg Guiana Highlands highlands of Central and NE Brazil Kruijer 2002)
The species show great morphological variability Truly dendroid (umbellate) plantsare probably confined to horizontal substrates and true fans to nearly vertical substrateswhereas intermediate forms occur on substrates with other angles of inclinationRegional and some ecological variation is especially observed in life form sizecosta length and number and morphology of the axillary hairs Much variation wasobserved to occur in sexuality (Pfeiffer et al 2000 Kruijer 2002) Monoicous plantspredominate but dioicous ones are common Herbarium specimens may containboth monoicous and dioicous gametophores (occasionally both even attached) Inmonoicous material the frequency of unisexual (male female) and bisexual gametoeciavaries considerably between specimens and gametophores
However molecular evidence based on trnL intron (Pfeiffer et al 2000) or trnLintron and ITS2 (Stech et al 2002) sequences showed that the regional forms aregrouped in a single well-supported clade albeit that in most molecular phylogeneticreconstructions H discolor Mitt is included in the H tamarisci clade Pfeiffer et al(2000) concluded that the observed molecular differences between the regional formsof H tamarisci can be considered as normal variation within a single species andproposed an artificial classification in seven informal regional variants to classifythe morphological variability of the species This classification was adopted by Kruijer(2002) and is followed here
401
Subject of this paper is H tamarisci in the New World represented by Pfeiffer etals (2000) New World variant the only representative of the species that occursthere The paper focuses on the actual and the potential distributions of H tamarisciin the New World and aims to find ecological conditions that determine its distributionin the New World south of the Tropic of Cancer (235degN)
Based on the material examined by Kruijer (2002) and additional specimens examinedfor this study H tamarisci occurs in there in southern North America (MexicoVera Cruz Chiapas) Central America (Guatemala Costa Rica Panama) the Caribbean(Cuba Jamaica Haiti Dominican Republic Martinique) and South America(Colombia Venezuela Ecuador Peru Bolivia Paraguay Brazil Minas Geraiumls Riode Janeiro Satildeo Paolo Paranaacute Santa Catarina Rio Grande do Sul UruguayArgentina Salta Tucumaacuten Buenos Aires Chile Chiloeacute) Sharp et al (1994) reportedthe species also from the Mexican States Hidalgo Oaxaca Puebla San Luis Potosiacuteand Tamaulipas and Kindberg (1901) and Britton (1913) from Puerto Rico Thespecies is not known from the Lesser Antilles (except Martinique) the Guyanas theGuiana Highlands and Llanos in Venezuela and Colombia the lowlands of the Amazonbasin the highlands of Central and NE Brazil and the Gran Chaco (Kruijer 2002)
According to Kruijer (2002) H tamarisci occurs in the New World in variousforest types varying from subtropical rainforest to open upper montane rainforestand from broad-leaved forest to coniferous forests The altitudinal distribution variesfrom 600ndash1950 m in Central America and the Caribbean to 700ndash3160 m in theAndes and 20ndash1350 m in SE Brazil and adjacent areas The observed morphologicalvariation in specimens of H tamarisci from the New World eg in size of theplants was not correlated with ecological factors obtained from label informationPlant size however show some correlation with geography Plants up to 45 cm talloccur throughout the distribution area in the Americas whereas plants of 45ndash55 cmtall occur frequently in the Caribbean the Andes and SE Brazil and adjacent areasand are less common in Central America Most striking is the variability in capsulesize Small and large capsules respectively up to 10 mm long and 08 mm wide orlonger than 10 mm long and 08 mm wide may be present in a single specimen butthe majority of the fruiting plants from throughout the distribution area have smallcapsules Plants with large capsules however are most frequently found in the Andesand SE Brazil and adjacent areas
To predict the potential distribution of H tamarisci we use species distribution models(SDMs) Species distribution modelling has attracted much research attention overthe last decade (for a comprehensive overview see Arauacutejo amp Guisan 2006 Peterson2006 Elith amp Leathwick 2009) and has in a few occasions been used to model thedistribution of mosses (Seacutergio et al 2007) SDMs predict the potential distributionof a species by interpolating identified relationships between presenceabsence orpresence-only data of a species on one hand and environmental predictors on theother hand across an area of interest (Elith et al 2006) The accuracy of an SDMtherefore highly depends on the environmental predictors that are used to model aspecies distribution or habitat suitability and should capture the ecological niche ofa species From the suite of different available applications Maxent (Seacutergio et al2007 Elith et al 2006 Phillips et al 2006) stands out because it also performs a
402
jackknife analysis of variable importance With this tool it is possible to identifywhich environmental variables contribute most to the predicted distribution of aspecies Simultaneously Maxent produces response curves that plot the probabilityof presence against the range of values of an individual environmental predictorIdentification of the most important predictors and the analysis of the relationsbetween the predictors and (predicted) habitat suitability allows the description ofthe autecology of a species (defined here as the biological relationship between aspecies and its environment) Using this methodology we analyse the autecology ofH tamarisci and attempt to explain why this species is missing from certain regions
Material and methods
SPECIES RECORDS We used two sets of collection records The first set is compiled by Kruijer based ondata from 382 herbarium specimens of the New World variant of H tamarisci of which 341 wereexamined for Kruijerrsquos (2002) revision and 41 were identified later that are preserved in the followinginstitutional herbaria (abbreviations follow Holmgren et al 1990) BM BR COI F G GRO HBGL MEL NMW NY PC RO S TDC U UPS W Z and ZT The additional material includespecimens that are preserved in Frahmrsquos personal herbarium (BONN) The co-ordinates of collectinglocalities were obtained using information written or printed on the labels of the specimens in combinationwith various sources of information including The Times Atlas of the World (mid-century editionvols 1ndash5 1955ndash1959 comprehensive editions 1967 1992) the United States Office of GeographyrsquosOfficial Standard Names gazetteer volumes for the various countries (1952ndash74 and 1999ndash2009internet versions now (Dec 2009) to be obtained by logging on to the GEOnet Names Server (GNS)of the US National Geospatial-Intelligence Agency (earth-infongamilgnshtmlindexhtml) GoogleMaps (mapsgooglecom) and Google Earth (earthgooglecom) and various other atlases maps (egin Herzog 1916) and local internet information In determining the co-ordinates of a collecting localityan uncertainty of 10 km was accepted in most cases the obtained accuracy was higher Specimens ofwhich the collecting locality are not known have consequently been omitted from the analyses (egPerrotet sn unknown coll sn BR both from Martinique) This resulted in (only) 133 unique andvalidated records of H tamarisci (Fig 1)
The second set comprised the records of the first set supplemented with collection records downloadedfrom the GBIF (Global Biodiversity Information Facility) database (wwwgbiforg downloaded 20091216) totalling 450 records This data set does include some duplicates but the distribution modeldeveloped by Maxent (see below) was set to remove these records This dataset comprises 313 uniquerecords (Fig 3)
BIOCLIMATIC DATA To model the distribution of H tamarisci we first defined the study area as the NewWorld south of the Tropic of Cancer To relate the occurrence records of H tamarisci with abioticconditions we downloaded the 19 bioclimatic variables and the altitudinal data from the WorldClimdatabase at 5 arcmin (~100 km2 at the equator) resolution (wwwworldclimorg) (Hijmans et al 2005)To this set of climate data we added the variable FAO07 - Length of available growing period(16 classes) downloaded from the FAO GeoNetwork (wwwfaoorggeonetworksrvenmainhome)Since we modelled a species that is also epiphyticepilithic we also included a data layer on the potentialevapotranspiration (PET) We used the following equation to estimate the PET ratio the mean annualbiotemperature (degC) divided by total annual precipitation (mm) this ratio is then multiplied by anempirically derived constant of 60 (Loiselle et al 2008) The total list of bioclimatic variables that wereconsidered to model the distribution is given in Table 1
To avoid problems with multicollinearity (ie highly correlated variables) we selected the mostmeaningful and uncorrelated bioclimatic variables (Pearson correlation coefficient less than 07 orlarger than -07) This requirement was fulfilled for the bioclimatic variables (including altitude andpotential evapotranspiration) Alt Bio02 Bio04 Bio05 Bio12 Bio15 Bio18 and PET (Table 1)
403
SOIL DATA Because H tamarisci also grows terrestrially we included a set of edaphic conditionsThese data were downloaded from the FAO GeoNetwork Although the FAO data are categoricaltheir classes do follow a continuous scale To prevent the use of correlated variables we used Spearmanrank correlation to identify correlated variables which were subsequently omitted from the environmentaldata set This was only the case for the FAO13 - Soil moisture storage capacity which was correlatedwith FAO05 - Easy available water The selected edaphic variables are listed in Table 2
In total we used 21 uncorrelated bioclimatic and edaphic variables to model the potential distribution ofH tamarisci We only used grid cells which had data for all data layers in total 239987 grid cells Thismeans that the data layers were cropped to the continental extent of the FAO soil data and furtherexcluding water bodies rivers glaciers rock shifting sand and missing data All data layermanipulations were performed with Manifold GIS (Manifold Net)
MAXENT DISTRIBUTION MODEL From the variety of modelling techniques we selected Maxent (Phillips etal 2006) because Maxent outperforms other applications (Elith et al 2006) and is most robust forgeoreferencing errors (Graham et al 2008) We ran two models one with the verified collections (133records Kruijerrsquos data) and one where we added the GBIF records totalling 450 records Duplicaterecords from the same grid cell (two collections each in eight cells) were omitted from these two setsof unique records by which procedure respectively 125 (Kruijerrsquos) and 313 (Kruijer amp GBIFrsquos)unique records remained in the analyses
We set Maxent to only use unique records We used the ten times cross-validation option of Maxent(version 332) to test model accuracy This means that the dataset is ten times partitioned into 90training data and 10 test data Model accuracy is measured by the Area Under the Curve (AUC) value(Fielding amp Bell 1997) We report the average AUC value from 10 test datasets AUC values higher
Table 1 Abbreviations and descriptions of the 21 bioclimatic variables (19 bioclimatic variablesaltitude and potential evapotranspiration) used for modelling the distribution of H tamarisci Themost meaningful and uncorrelated bioclimatic variables (see text) including altitude and potentialevapotranspiration are given in bold
Bioclimatic variable Description
Alt Altitude in m aslBIO1 Annual Mean TemperatureBIO2 Mean Diurnal Range (Mean of monthly (max temp - min temp)BIO3 Isothermality (P2P7) (100)BIO4 Temperature Seasonality (standard deviation 100)BIO5 Max Temperature of Warmest MonthBIO6 Min Temperature of Coldest MonthBIO7 Temperature Annual Range (P5-P6)BIO8 Mean Temperature of Wettest QuarterBIO9 Mean Temperature of Driest QuarterBIO10 Mean Temperature of Warmest QuarterBIO11 Mean Temperature of Coldest QuarterBIO12 Annual PrecipitationBIO13 Precipitation of Wettest MonthBIO14 Precipitation of Driest MonthBIO15 Precipitation Seasonality (Coefficient of Variation)BIO16 Precipitation of Wettest QuarterBIO17 Precipitation of Driest QuarterBIO18 Precipitation of Warmest QuarterBIO19 Precipitation of Coldest QuarterFAO07 Length of Available Growing PeriodPET Potential Evapotranspiration
404
than 07 indicate reliable models values higher than 08 good models (but see Raes amp ter Steege 2007)Since our main interest is to identify the environmental parameters that determine the distribution ofH tamarisci and because all test AUC values were larger than 09 (see Results) we have chosen to useall collection records for the two final models
Secondly we performed a jackknife analysis to measure the importance of each variable to the two finaldistribution models This analysis gives a heuristic estimate of relative contributions of the environmentalvariables to the Maxent model and is standard output of Maxent Since we only make use of uncorrelatedvariables this measure is reliable to use For the three environmental predictors that contribute most tothe final model we also report the response curves Response curves plot the predicted probability ofpresence for the range of values of a given predictor The probabilities are calculated for the rangevalues of one variable with all other variables set to their average value over the set of presencelocalities
STATISTICAL ANALYSIS Since the Maxent models predict that the Guiana Highlands harbour suitablehabitat for H tamarisci (see Results) being also the largest among the areas where suitable habitats arepredicted and without records of the species we decided to further explore where the cells representingthe Guiana highlands were located in multivariate space of predicted presence We defined the GuianaHighlands as the mountainous region crossing the borders of Guyana Venezuela and Brazil with analtitude higher than 250 m asl
We first selected those variables that contributed at least 25 to the Maxent model of Kruijer basedon the jackknife procedure of Maxent We chose for Kruijerrsquos model because the two models did notdiffer much and Kruijerrsquos data is most reliable To select the cells of predicted presence we firstconverted the continuous Maxent prediction to discrete presence-absence values by setting a thresholdWe used the 10 percentile presence threshold the Maxent value that excludes 10 percent of thepresence records (Liu et al 2005) Since we are familiar with the difficulties of accurate georeferencingwe consider this as a conservative but save threshold to use
Subsequently we performed a PCA (Principal Component Analysis) on the values of the seven mostcontributing variables of those gridcells for which H tamarisci is predicted to be present based onKruijerrsquos dataset Finally we plotted the predicted presence localities on PC axes 1 and 2 and withinthis multivariate space we highlighted those gridcells that represent the Guiana Highlands and thosethat represent the actual 125 unique collection localities
Table 2 Abbreviations and circumscriptions of the edaphic variables used for modelling the distributionof H tamarisci
Abbreviation of Circumscription of edaphic variableedaphic variable
FAO01 Base saturation (topsoil)FAO02 CarbonNitrogen-Class (topsoil)FAO03 CEC (Cation Exchange Capacity) clay (topsoil)FAO04 CEC soil (topsoil)FAO05 Easy available waterFAO06 Effective soil depthFAO08 Nitrogen (topsoil)FAO09 Organic Carbon (topsoil)FAO10 Organic Carbon poolFAO11 pH (topsoil)FAO12 Soil Drainage ClassFAO14 Soil Production IndexFAO15 Textural Class (topsoil)
405
Results
Both models predict the presence localities very well The mean AUC values based on10 times cross-validated Maxent models based on 125 (Kruijerrsquos) and 313 (Kruijer ampGBIFrsquos) unique records were 0921 and 0933 respectively Fig 1 shows the predictedMaxent distribution of H tamarisci based on Kruijerrsquos verified data Model valuesclose to 1 indicate high probability of presence Fig 2 shows predicted presence of thethresholded model with the predicted presence areas in grey Similarly the results forthe model based on all 313 records are presented in Figs 3 and 4 respectively
Fig 1 Maxent distribution model for H tamarisci based on 125 records from specimens identified byKruijer (see text) Probability of presence increases from dark blue (0) to red (1) Most areas in red areobscured by the black dots representing the collection localities The red demarcation line indicates theGuiana Highlands (above 250 m asl)
406
The average percentages contribution and corresponding ranks for the 21 variablesof the two series of 10 times cross-validated Maxent models are given in Table 3Bio05 the maximum temperature in the warmest month is identified as the mostimportant variable by both models The largest difference between the two series ofmodels was that the model based on the combined datasets (313 records) identifiedaltitude (Alt) as secondly most important variable (Table 3) For the model based onKruijerrsquos data the second most important variable was Bio18 precipitation of warmestquarter followed by Bio12 annual precipitation Bio18 and Bio12 have position 3and 4 in the ranking for the model based on all records (Table 3) Because we notfully trust the georeferencing of the GBIF records that were added to this dataset weshow the environmental data and response curves for environmental variables Bio05
Fig 2 Thresholded Maxent distribution model for H tamarisci based on 125 records from specimensidentified by Kruijer (see text) Grey areas indicate predicted presence
407
(Figs 5 amp 6) Bio18 (Figs 7 amp 8) and Bio12 (Figs 9 amp 10) based on Kruijerrsquos verifieddata The response curve for the Maximum Temperature in the Warmest Month(Bio05) shows that the probability of presence drops when temperatures exceed 29degCin the warmest month (Fig 6) These areas largely represent the lowland regions ofthe continent (Fig 5) The response curve for the Precipitation in the Warmest Quartershows an increasing probability of presence with wetter conditions (Fig8) H tamarisciis largely absent from the dryer regions (Fig 7) The response curve for lsquoAnnualPrecipitationrsquo (Fig10) shows an optimum range between 750ndash3000 mm precipitationannually The geographic distibution of annual precipitation is shown in Fig 9
Fig 3 Maxent distribution model for H tamarisci based on 313 records from Kruijer and GBIF (seetext) Probability of presence increases from dark blue (0) to red (1) Most areas in red are obscured bythe black dots representing the collection localities The red demarcation line indicates the GuianaHighlands (above 250 m asl)
408
PRINCIPAL COMPONENT ANALYSIS Like for the response curves we conducted themultivariate PCA analysis on the model based on Kruijerrsquos verified data The resultsof the PCA of the seven variables that contributed more than 25 to the Maxentmodel is given in Fig 11 PC axes 1 and 2 explained 292 and 249 of the totalvariance respectively It is evident that the ecological niche dimensions of the GuianaHighlands for these seven variables do not differ from the area for which H tamarisciwas predicted to be present (red outline Fig 1) The grid cells representing theGuiana Highlands are close to the middle of the cloud (Fig 11) We also plotted thecollection localities to show that these cover the full dimensions of multivariatespace (Fig 11)
Fig 4 Maxent distribution model for H tamarisci based on 313 records from Kruijer and GBIF (seetext) Grey areas indicate predicted presence
409
Discussion and conclusions
EXPLAINED PRESENCE AND ABSENCE The distribution of Hypopterygium tamarisci inthe New World is overall well explained by both models (Figs 1ndash4) and the underlyingbioclimatic and edaphic variables (Tables 1ndash2) The most important variable is themaximum temperature in the warmest month (Bio5 Figs 5ndash6) which contributes439 to the full Maxent model based on Kruijerrsquos 125 unique records followed bythe precipitation of the warmest quarter (Bio18 Figs 7ndash8) contributing 164 tothe full model and the annual precipitation (Bio12 Figs 9ndash10) contributing 106to the full model
Both models (Figs 1ndash4) predict the occurrence of H tamarisci on several of theLeeward Islands and rather locally on a few of the eastern Windward Islands in theCaribbean This prediction matches the known but omitted records for MartiniqueWith exception of the Leeward Antilles (off the coast of Venezuela) the speciesmight be more widely distributed in the Lesser Antilles than known
Both models (Figs 1ndash4) clearly show that the absence of the New World variant ofH tamarisci from the Leeward Antilles the lowlands of the Guianas the Llanos inVenezuela and Colombia the lowlands of the Amazon basin and the Gran Chacocan be ascribed to unfavourable ecological conditions among which the high
Table 3 Average rank and relative contribution of the 21 environmental variables to the 10 times cross-validated Maxent models based on 125 (Kruijerrsquos) and 313 (Kruijer amp GBIFrsquos) unique records(duplicate records from the same grid cell omitted)
Variable 125 records 313 recordsrank contribution rank contribution
Bio05 1 439 1 293Bio18 2 164 3 209Bio12 3 106 4 62FAO06 4 48 5 35FAO08 5 45 19 03Alt 6 29 2 24Bio02 7 26 8 25Bio04 8 19 12 07Bio15 9 16 9 18FAO09 10 15 10 10PET 11 14 7 26FAO14 12 13 20 02FAO05 13 12 16 05FAO10 14 10 17 05FAO11 15 10 18 04FAO04 16 09 6 27FAO02 17 08 15 06FAO01 18 08 13 07FAO03 19 06 21 01FAO15 20 02 11 08FAO12 21 01 14 07
410
temperatures in the warmest month are clearly the delimiting factor (Bio5 Figs 5ndash6)Like for the overall distribution other less important factors are the precipitation ofthe warmest quarter (Bio18 Figs 7ndash8) and the annual precipitation (Bio12 Figs 9ndash10)
The isolated single location (Figs 1ndash4) at Morro Gonzales in mainland ChiloeacuteProvince Chile matches perfectly the prediction by the models It is however notknown whether this occurrence represents a successful dispersal and colonisationevent after termination of the last glacial period (most likely) or a remnant of ahistoric distribution of the species during the last glacial period (or predatingdistributions) Only two specimens of H tamarisci are known to come from Chile
Fig 5 The collection localities of the 125 unique records of Kruijerrsquos data plotted on the bioclimaticvariable Bio05 - Maximum temperature of warmest month (in degC times 10) Lighter grey tones indicatehigher temperatures
411
They come presumably from the same collection (Lechler LPC 595 BR PC Kruijer2002) and were probably growing intermingled with H didictyon MuumlllHal Thespecimen in PC was picked out another specimen of Lechler LPC 595 an exsiccateseries of which most specimens under number LPC 595 belong to H didictyon(Kruijer 2002) The specimen in BR is an original specimen of Lechlerrsquos exsiccataseries and contains well developed fruiting material of H tamarisci Hence morepopulations may be expected to occur in the predicted areas in Chile at least in thesurroundings of Morro Gonzales perhaps with plants of H tamarisci growing insmall numbers in mixed colonies with H didictyon or other mosses
For eastern Brazil the models predict larger areas of potential occurrence than theknown distribution of H tamarisci especially extending more westwards andnorthwards (Figs 1ndash4) Since this area of Brazil is most densely populated and mostaffected by man the occurrence of the species may have been reduced due toagriculture and urbanisation However H tamarisci may have simply been overlookedand may actually be more widely distributed in eastern Brazil than known hidingitself in town parks etc
DISPERSAL AND MAINTENANCE OF THE DISTRIBUTION AREA The mixed reproductive strategyof H tamarisci consists of sexual reproduction in combination with asexualpropagation by means of filiform multicellular gemmae as well as by means ofnormal but detachable frond leaves and foliate distal parts of frond axes (Kruijer2002 Pfeiffer et al 2000) This strategy obviously plays an important role in themaintenance of the large distribution area of H tamarisci in the New World
The near-perfect match between the distribution of the species in the New Worldand its potential distribution (AUC = 0921) ie the ecological conditions thatdetermine suitable habitats for the species indicates that the species has been able tokeep up rather well with the climatic change after the termination of the last glacial
Fig 6 The response curve for the bioclimatic variable Bio05 based on 10 times cross-validated Maxentmodels This plot reflects the dependence of predicted probability of presence on Bio05 Bio05 contributes439 to the full model
412
period The mixed reproductive strategy has probably been a factor of utmostimportance for this process because it gives the species the ability to colonise newhabitats in short periods of time and over rather long distances We assume that dueto its mixed reproductive strategy in combination with its for a moss broad ecologicalamplitude (Kruijer 2002) the species is well adapted to respond to Quarternaryclimatic changes The mixed reproductive strategy and its potential for dispersal arediscussed in detail below
In H tamarisci like in other bryophytes asexual propagation may play in additionto clonal growth (Kruijer pers observations Longton amp Schuster 1983 Pfeiffer etal 2006 Schuster 1983) an important role in building up local populations after
Fig 7 The collection localities of the 125 unique records of Kruijerrsquos data plotted on the bioclimaticvariable Bio18 - Precipitation of warmest quarter (in mm) Darker grey tones indicate higher precipitation
413
colonisation maintenance of local populations in space or time and may contributeto local abundancy (compare eg Longton amp Schuster 1983 Schuster 1983Kimmerer 1991 1994 Pohjamo et al 2006) The usually colourless to brown filiformgemmae are produced in distal half of ultimate frond axes They are up to 16 cellslong and measure 15ndash95 microm long and 12ndash40 microm wide (Kruijer 2002) The occurrenceof caducous branches as such is already quite uncommon in pleurocarpous mosses(eg Correns 1989 Imura amp Iwatsuki 1990 Imura 1994 Frey amp Kuumlrschner 2011)but caducous distal parts of frond axes are to our knowledge thus far only known tooccur in seven other species of the Hypopterygiaceae (Kruijer 2002) albeit that thisphenomenon might be overlooked in other groups of pleurocarpous mosses Thedetached distal parts of frond axes have been observed to act as true propagules(Kruijer pers observation)
The gemmae and the caducous leaves and distal parts of frond axes of H tamarisciare almost certainly too big for aerial transport over intermediate and long distancesand are even unlikely to be transported over distances of ten kilometres or more(cf Longton amp Schuster 1983) Dispersal of vegetative propagules will thereforegenerally result in local dispersal only Local dispersal however may significantlycontribute to local abundancy which has been observed for H tamarisci in eg theCentral Cordillera of the northern Andes of Colombia where Wolf (1993) foundalmost pure stands of the species on tree bases in an altitudinal zone between 1725and 1980 m altitude
Local abundancy in turn may significantly contribute to the number of sporophytesthat are produced in the local patches hence increasing the chances of short- to long-distance dispersal and subsequent colonisation of new patches and suitable habitatsat various distances In H tamarisci fruiting is common in particular in Centraland South America where in total 65 of the specimens examined have sporophytes
Fig 8 The response curve for the bioclimatic variable Bio18 based on 10 times cross-validated Maxentmodels This plot reflects the dependence of predicted probability of presence on Bio18 Bio18 contributes164 to the full model
414
varying regionally from from 43 in the Caribbean to 76 SE Brazil and adjacentareas (Kruijer 2002) The spores of H tamarisci measure between 11ndash17 microm indiameter (Kruijer 2002) In bryophytes a significant number of released spores fallin close proximity of the parent colony (eg Miles amp Longton 1982 Kimmerer1991 Stoneburner et al 1992) Pohjamo et al (2006) estimated that less than halfof the spores of the liverwort Anastrophyllum hellerianum (Nees ex Lindenb)RMSchust measuring 9ndash12 microm in diameter were dispersed over 10 m distanceLocal spore deposition may have a similar function in facilitating the persistence oflocal populations (Pohjamo et al 2006) as local dispersal of vegetative propagules isthought to have A small proportion of air-borne spores is likely to be transported
Fig 9 The collection localities of the 125 unique records of Kruijerrsquos data plotted on the bioclimaticvariable Bio12 - Annual precipitation (in mm) Darker grey tones indicate higher precipitation
415
over longer distances (eg van Zanten 1978 1983 van Zanten amp Poacutecs 1981 Longtonamp Schuster 1983) Such a small proportion however may represent a high numberof spores for populations may produce spores in massive numbers (eg Longton ampSchuster 1983 Stoneburner et al 1992) For two colonies of Atrichum angustatum(Brid) Bruch amp Schimp (spore size 9ndash14 microm) Stoneburner et al (1992) estimatedthat respectively 24 and 45 million of spores were still airborne at 15 m How farwhich proportion of air-borne spores are able to travel is not known but the sporesof H tamarisci are in principle small enough for direct dispersal over distances ofup to several thousands of kilometres by air streams (cf Longton amp Schuster 1983van Zanten amp Poacutecs 1981 van Zanten amp Gradstein 1988) The possibilities forbryophytes for long-range dispersal by spores and the problems for retaining sporeviability under conditions of long-range dispersal by air streams have been thoroughlyinvestigated and discussed by van Zanten (1976 1978 1983 1992) van Zanten ampPoacutecs (1981) and van Zanten amp Gradstein (1988) Resistance to UV irradiation is thelimiting factor of long-range dispersal and resistance to desiccation is correlatedwith resistance to UV irradiation (van Zanten pers comm) Strong UV irradiationat high altitudes (eg jet streams c 10ndash12 km alt) is almost certainly lethal forspores of most tropical bryophyte species (van Zanten pers comm cf van Zantenamp Gradstein 1988) UV irradiation and other stress conditions decrease with altitudehowever and van Zanten (pers comm) and van Zanten amp Gradstein (1988) claimedthat wet or intermittently dry air streams at (or below) c 3000 m altitude offer goodpossibilities for sufficient survival of spores in time and number for long-rangedispersal of such species
Van Zanten (in Kruijer 2002) showed however that it is unlikely that spores ofH tamarisci will survive intercontinental aerial long-range transport although theoccurrence of rare transoceanic dispersal events cannot be ruled out On the other
Fig 10 The response curve for the bioclimatic variable Bio12 based on 10 times cross-validatedMaxent models This plot reflects the dependence of predicted probability of presence on Bio12 Bio12contributes 106 to the full model
416
hand the results of van Zantenrsquos experiments also showed that successful directspore dispersal is feasible at shorter ranges ie up to c 2000 km (cf Shaw et al2006) and within continents eg South and Central America especially underconditions with low UV irradiation eg at low altitude and in streams with moistair However stepwise dispersal may be the dominant factor in intracontinentalmigration processes of bryophytes (eg Schuster 1983)
UNEXPLAINED ABSENCE Both models predict potential occurrence of H tamarisci inthe Guiana Highlands where it is not known to occur (Figs 1ndash4) It is clear from themodel predictions (Fig 1ndash4) and the PCA (Fig 11) that the absence of H tamarisciin the Guiana Highlands cannot be ascribed to unfavourable ecological conditions ofthe 21 uncorrelated bioclimatic (including elevation) and edaphic variables used forthis study Albeit that for the central parts of the Guiana Highlands annual precipitation(Bio12 Figs 9ndash10) and precipitation of the warmest quarter (Bio18 Figs 7ndash8) mightact as negative factors for occurrence It may be of course that the delimitingecological factor for the Guiana Highlands was not included in the bioclimatic andedaphic variables that were used for the models but it is unknown which and whatkind of factor this might be Assuming that time has not been the delimiting factorfor H tamarisci reaching these areas after termination of the last glacial period thepossible explanations for these discrepancies between the prediction of the modelsand actual distribution of H tamarisci are discussed below
Fig 11 Result of the PCA for the seven variables that explained more than 25 of the Maxent modelbased on Kruijerrsquos data for those grid cells where H tamarisci was predicted to be present (10 percen-tile threshold) Black dots indicate the Guiana Highlands Triangles indicate collection localities
417
The distance between the Guiana Highlands and the nearest populations ofH tamarisci as such can almost be excluded as the limiting factor for dispersal ofthis species The shortest distance between the summit of the table mountains in theNW of the Guiana Highlands and the nearest locality of H tamarisci located in NWVenezuela is c 500 km that between the NE of the Guiana Highlands and thenearest locality is c 900 km Although our models predict that at present-day theGuiana Highlands cannot be reached by stepwise migration these distances are wellwithin the range of possible successful direct spore dispersal of H tamarisci
Moreover the distances between the Guiana Highlands and the nearest populationsof H tamarisci might have been much shorter during glacial periods due thedownward vertical shift of the vegetation during glaciations of which the maximumshift for the last glaciation for this region has been estimated as being 1100 m (Rull2004 2005) resulting in better possibilities for successful direct spore dispersalThe downward vertical shift might also have increased the possibilities for stepwisedispersal However further investigation towards the palaeoclimatic conditions ofthe region in the Quaternary in relation to the ecology of H tamarisci needs furtherstudy
Vegetation structure and rainfall might hamper the dispersal of spores to higher airstreams and hence intermediate- and long-distance dispersal In the case of the GuianaHighlands however it seems unlikely that vegetation structure nowadays hamperthe dispersal of spores from colonies of H tamarisci in eg Caracas and surroundings(eg Maumlgdefrau 75 76 U) to higher air streams Buck (1989) hypothesised thatprevailing winds which are from the south and east and come from over the lowlandsof the Amazon basin which act as source of spores of lowland species only are themajor cause of the depauperate moss flora (excluding Sphagnum L) of the GuianaHighlands Although Buckrsquos (1989) hypothesis is interesting and needs further studyit seems to contradict the diverse liverwort flora present in the Guiana Highlands(Buck 1989) In the case of H tamarisci which does not occur in the Amazon basinthe easterly trade winds may indeed significantly hamper spore dispersal towards theGuiana Highlands by wind streams from the nearest populations located north andwest but in June and July spore transport by air streams might be possible in localweather systems in the Intertropical Convergence Zone eg under unstableatmospheric conditions prior to storms in the morning and early afternoon withthermal turbulence and convective updrafts
Taking into account the possibility of competitive exclusion as the underlying processcausing the absence of H tamarisci from the Guiana Highlands we have no ideawhich competative moss species may be involved there If such competitors exist theydo not belong to the Hypopterygiaceae Apart from this it is not certain whethercompetitive exclusion principle is relevant here since under ecological conditionswhere evaporation is one of the delimiting factors plants of separate moss species mayactually benefit from growing intermingled in mixed colonies to reduce their evaporationrates and to retain their water content as long as possible Numerous herbariumcollections examined by Kruijer for his revision (Kruijer 2002) were mixed collectionsin which two or three sometimes even four species of Hypopterygiaceae grewintermingled often accompanied with other moss species as well
418
Probably most mysterious is the absence of H tamarisci from the Guiana Highlands(Figs 1ndash4 Kruijer 2002) where certainly from a bryological point of view humandisturbance and landuse change is insignificant The Guiana Highlands are known tohave a complex topography with table mountains with flat and extensive summitsranging from 1500ndash3000 m elevation which are separated from the surroundinglowlands by up to 1000 m high vertical escarpments and basal slopes (Rull 2005)The species might have simply been overlooked in this rather inaccessible area butbotanists have been collecting there (eg Buck 1989) and the plants can easily berecognized by non-bryologists and even non-botanists According to Buck (1989)the entire moss flora (excluding Sphagnum) of the Guiana Highlands is truly poor Itseems therefore more likely that the missing of localities of H tamarisci from thisarea reflects true absence If so the absence of H tamarisci from the Guiana Highlandsis wanting a better explanation which needs further study
References
ARAUacuteJO MB amp A GUISAN (2006) Five (or so) challenges for species distribution modelling ndashJ Biogeogr 33 1677ndash1688
BRITTON EG (1913) West Indian mosses 1 ndash Bull Torr Bot Cl 40 653ndash676
BUCK WR (1989) Why are there so few mosses on tepui summits In HERBEN T ampCB McQUEEN (eds) Proceedings of the Sixth Meeting of the Central and East European BryologicalWorking Group (CEBWG) Liblice Czechoslovakia 12th through 16th September 1988 46ndash51 ndashBotanical Institute of the Czechoslovak Acadamy of Sciences Prugravehonice
CORRENS C (1899) Untersuchungen uumlber die Vermehrung der Laubmoose durch Brutorgane undStecklinge ndash Verlag von Gustav Fischer Jena
DOWNING AJ PM SELKIRK amp RJ OLDFIELD (1997) The mosses of the YarrangobillyCaves District New South Wales Australia A review of the mosses collected by the reverend WWWatts in 1906 ndash J Hattori Bot Lab 82 105ndash121
ELITH J et al (26 authors) (2006) Novel methods improve prediction of speciesrsquo distributions fromoccurrence data ndash Ecography 29 129ndash151
ELITH J amp JR LEATHWICK (2009) Species distribution models Ecological explanation andprediction across space and time ndash Annu Rev Ecol Evol Syst 40 677ndash97
FIELDING AH amp JF BELL (1997) A review of methods for the assessment of prediction errorsin conservation presenceabsence models ndash Environm Conservation 24 38ndash49
FREY W amp H KUumlRSCHNER (2011) Asexual reproduction habitat colonization and habitat main-tenance in Bryophytes A review ndash Flora 206 (3) (in press)
GRAHAM CH J ELITH RJ HIJMANS A GUISAN AT PETERSON amp BA LOISELLE(2008) The influence of spatial errors in species occurrence data used in distribution models ndash J ApplEcol 45 239ndash247
HERZOG Th (1916) Die Bryophyten meiner zweiten Reise durch Bolivia ndash Biblioth Bot 871ndash347 pl A+1ndash8 ndash E Schweizerbart Stuttgart
HOLMGREN PK NH HOLMGREN amp LC BARNETT (1990) Index Herbariorum Part I TheHerbaria of the World (8th ed) ndash Regnum Veg 120 indashx 1ndash693
HIJMANS RJ SE CAMERON JL PARRA PG JONES amp A JARVIS (2005) Very highresolution interpolated climate surfaces for global land areas ndash Int J Climatol 25 1965ndash1978
419
IMURA S (1994) Vegetative diaspores in Japanese mosses ndash J Hattori Bot Lab 77 177ndash232
IMURA S amp Z IWATSUKI (1990) Classification of the vegetative diaspores on Japanese mossesndash Hikobia 10 435ndash443
KIMMERER RW (1991) Reproductive ecology of Tetraphis pellucida II Differential success ofsexual and asexual propagules ndash Bryologist 94 284ndash288
KIMMERER RW (1994) Ecological consequences of sexual versus asexual reproduction inDicranum flagellare and Tetraphis pellucida ndash Bryologist 97 20ndash25
KINDBERG NC (1901) Grundzuumlge einer Monographie uumlber die Laubmoos-Familie Hypoptery-giaceae ndash Hedwigia 40 275ndash303
KRUIJER JD (1997) The origin of Hypopterygium-populations in some European Botanic Gardenswith special reference to Hypopterygium atrotheca Dix ndash Glasgow Naturalist 23 11ndash17
KRUIJER JD (2002) Hypopterygiaceae of the World ndash Blumea Suppl 13 1ndash388
KRUIJER JD amp R BLOumlCHER (2007) Re-evaluation of the phylogeny of the Hypopterygiaceae(Bryophyta) based on morphological and molecular data In AE NEWTON amp RS TANGNEY(eds) Pleurocarpous mosses Systematics and evolution ndash Syst Assoc Special Vol Ser 71 65ndash109
LIU C PM BERRY TP DAWSON amp RG PEARSON (2005) Selecting thresholds of occurrencein the prediction of species distributions ndash Ecography 28 385ndash393
MILES CJ amp RE LONGTON (1992) Deposition of moss spores in relation to distance fromparent gametophytes ndash J Bryol 17 355ndash368
LONGTON RE amp RM SCHUSTER (1983) Reproductive Biology In SCHUSTER RM (ed)New manual of Bryology 1 386ndash462 ndash Hattori Bot Lab Nichinan
LOISELLE BA PM JORGENSEN T CONSIGLIO I JIMENEZ JG BLAKE LG LOH-MANN amp OM MONTIEL (2008) Predicting species distributions from herbarium collections doesclimate bias in collection sampling influence model outcomes ndash J Biogeogr 35 105ndash116
PETERSON AT (2006) Uses and requirements of ecological niche models and related distributionalmodels ndash Biodiversity Inf 3 59ndash72
PFEIFFER T S FRITZ M STECH amp W FREY (2006) Vegetative reproduction and clonaldiversity in Rhytidium rugosum (Rhytidiaceae Bryopsida) inferred by morpho-anatomical and molecularanalysis ndash J Plant Res 119 125ndash135
PFEIFFER T H (JD) KRUIJER W FREY amp M STECH (2000) Systematics of the Hypoptery-gium tamarisci complex (Hypopterygiaceae Bryopsida) implications from morphological and moleculardata Studies in austral temperate rain forest bryophytes 9 ndash J Hattori Bot Lab 89 55ndash70
PHILLIPS SJ RP ANDERSON amp RE SCHAPIRE (2006) Maximum entropy modeling ofspecies geographic distributions ndash Ecol Modelling 190 231ndash259
POHJAMO M S LAAKA-LINDBERG O OVASKAINEN amp H KORPELAINEN (2006)Dispersal potential of spores and asexual propagules in the epixylic hepatic Anastrophyllum hellerianumndash Evol Ecol 20 415ndash430
RAES N amp H TER STEEGE (2007) A null-model for significance testing of presence-only speciesdistribution models ndash Ecography 30 727ndash736
RULL V (2004) Is the Lost World really lost Palaeoecological insights in the origin of the peculiarflora of the Guyana Highlands ndash Naturwissenschaften 91 139ndash142
RULL V (2005) Biotic diversification in the Guayana Highlands a proposal ndash J Biogeogr 32921ndash927
SCHUSTER RM (1983) Phytogeography of the Bryophyta In SCHUSTER RM (ed) Newmanual of Bryology 1 463ndash626 ndash Hattori Bot Lab Nichinan
420
SEacuteRGIO C R FIGUEIRA D DRAPER R MENEZES amp AJ SOUSA (2007) Modelling bryo-phyte distribution based on ecological information for extent of occurrence assessment ndash Biol Cons135 341ndash351
SHARP AJ H CRUM amp PM ECKEL (1994) The Moss Flora of Mexico 2 Orthotrichales toPolytrichales ndash Mem New York Bot Gard 69 indashviii 581ndash1113 IndashXVII
SHAW AJ I HOLZ CJ COX amp B GOFFINET (2008) Phylogeny character evolution andbiogeography of the Gondwanic moss family Hypopterygiaceae (Bryophyta) ndash Syst Bot 33 21ndash30
SHAW MW TD HARWOOD M J WILKINSON amp L ELLIOTT (2006) Assembling spatiallyexplicit landscape models of pollen and spore dispersal by wind for risk assessment ndash Proc Roy SocBiol Sci Ser B 273 1705ndash1713
STECH M amp T PFEIFFER (2006) Molecular identity of Hypopterygium populations (Hypoptery-giaceae Bryopsida) from three European botanical gardens Studies in austral temperate rain forestbryophytes 30 ndash J Bryol 28 83ndash87
STECH M T PFEIFFER amp W FREY (2002) Molecular generic classification of the Hypopterygiaceae(Bryopsida) with the description of a new genus Arbusculohypopterygium gen nov Studies inaustral temperate rain forest bryophytes 10 ndash New Zealand J Bot 40 207ndash221
STONEBURNER A DM LANE amp LE ANDERSON (1992) Spore dispersal distances inAtrichum angustatum (Polytrichaeceae) ndash Bryologist 95 324ndash328
WOLF JHD (1993) Epiphyte communities of tropical montane rain forests in the northern Andes1 Lower montane communities ndash Phytocoenologia 22 1ndash52
ZANTEN BO van (1976 ) Preliminary report on germination experiments designed to estimate thesurvival changes of moss spores ndash J Hattori Bot Lab 41 133ndash140
ZANTEN BO van (1978) Experimental studies on trans-oceanic long-range dispersal of mossspores in the Southern Hemisphere ndash J Hattori Bot Lab 44 455ndash482
ZANTEN BO van (1983) Possibilities of long-range dispersal in bryophytes with special referenceto the Southern Hemisphere ndash Sonderbd naturwiss Hamburg 7 49ndash64
ZANTEN BO van (1992) Historisch overzicht van het onderzoek naar mogelijkheden voor lange-afstand-verspreiding bij mossen ndash Buxbaumiella 27 31ndash34
ZANTEN BO van amp SR GRADSTEIN (1988) Experimental dispersal geography of Neotropicalliverworts ndash Nova Hedwigia Beih 90 41ndash94
ZANTEN BO van amp T POacuteCS (1981) Distribution and dispersal of bryophytes ndash Adv Bryol 1479ndash562
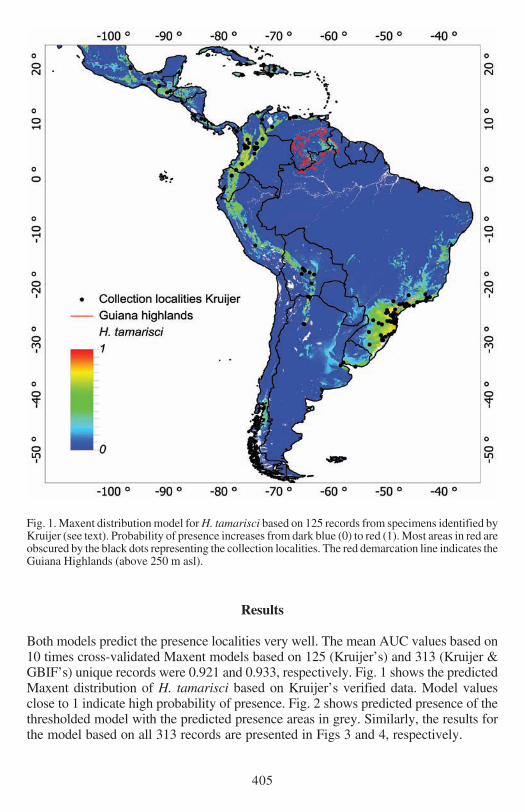
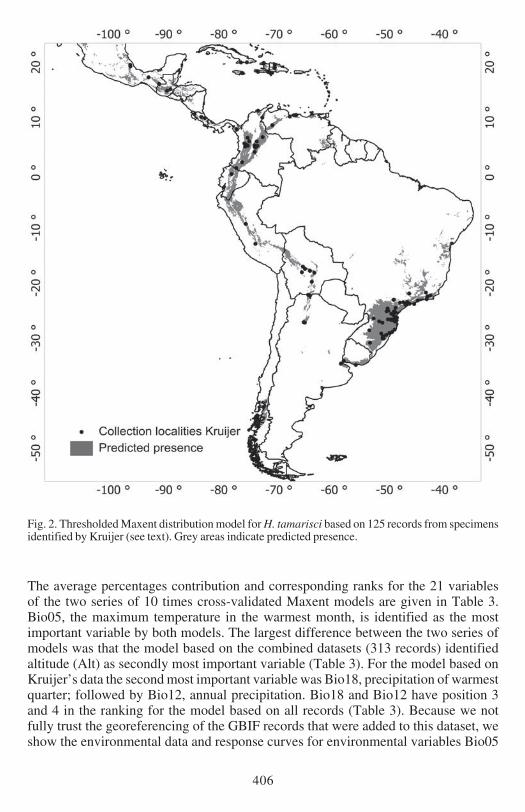
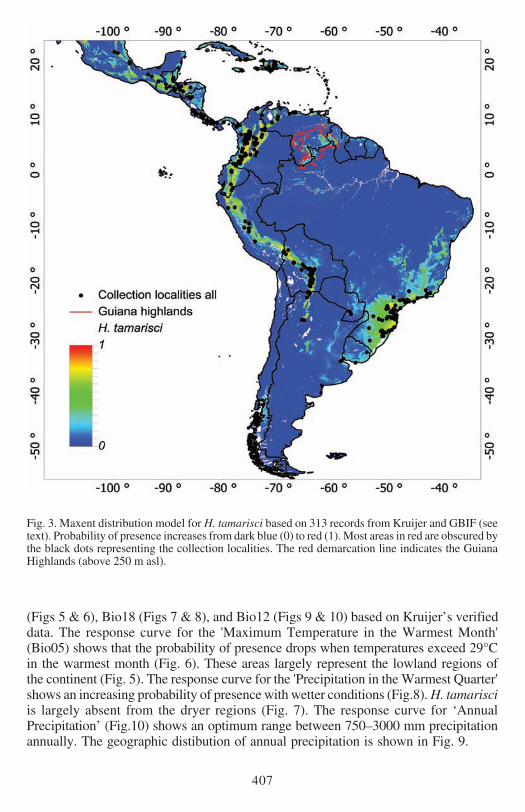
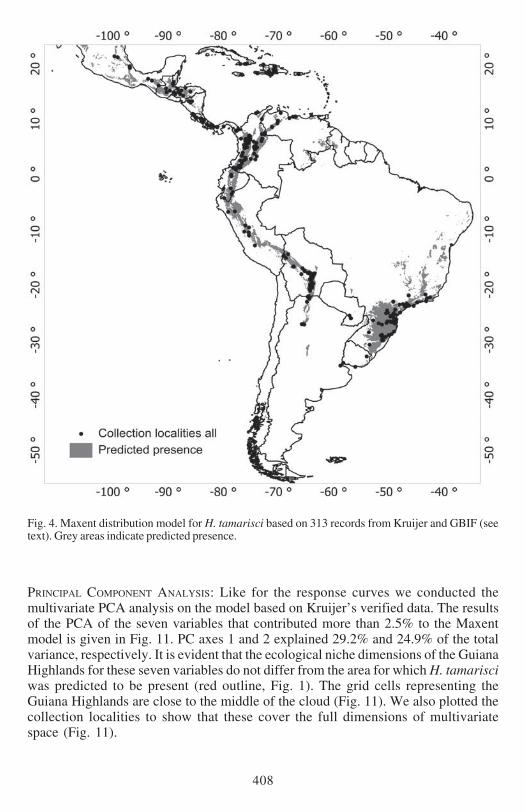
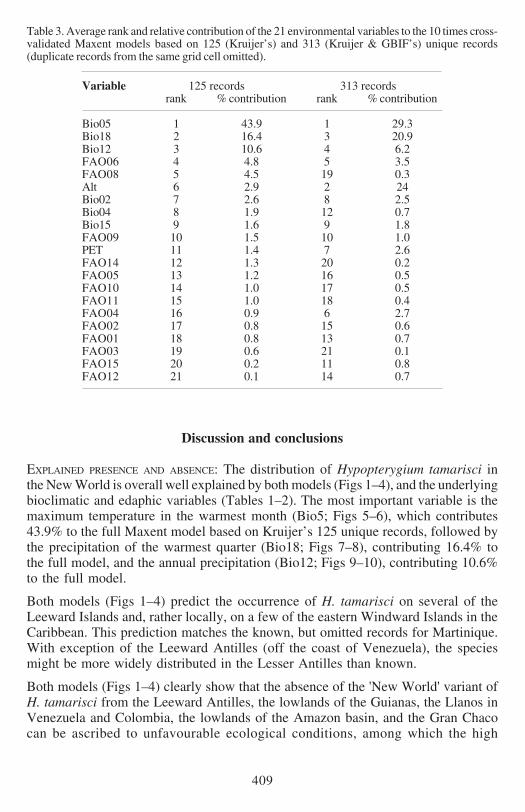
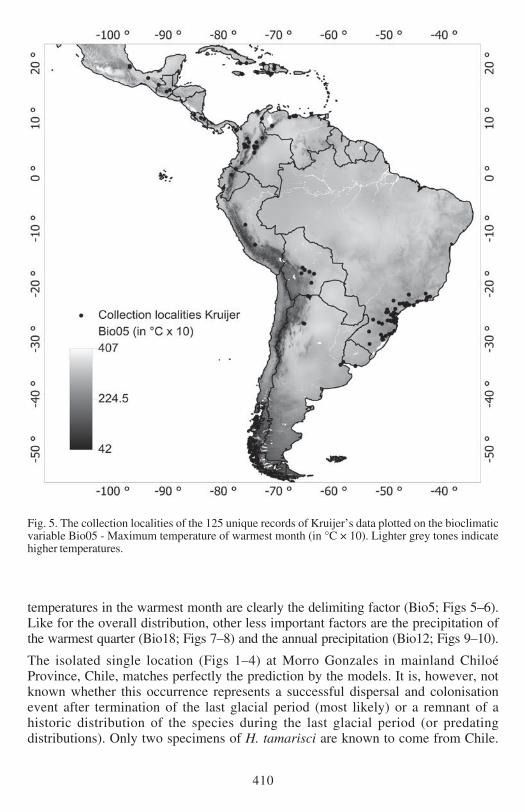
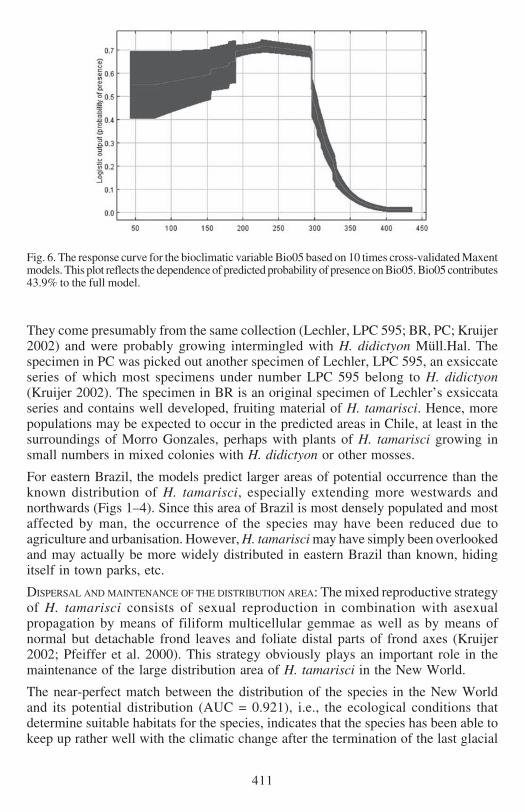
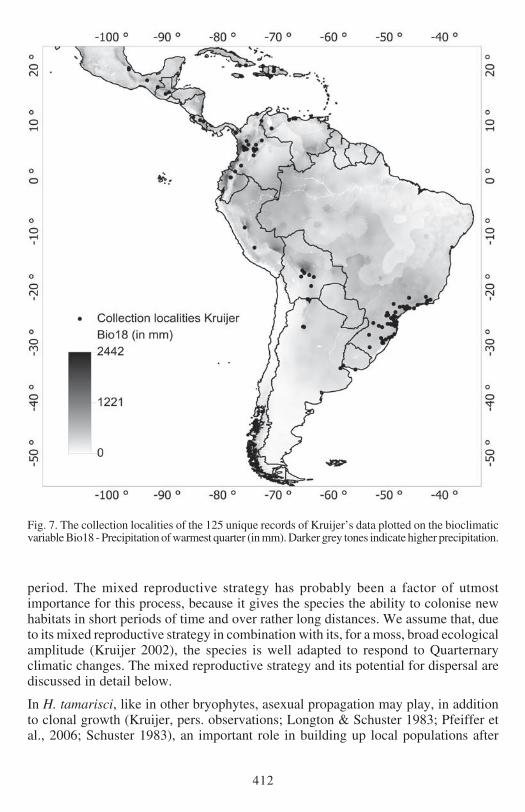
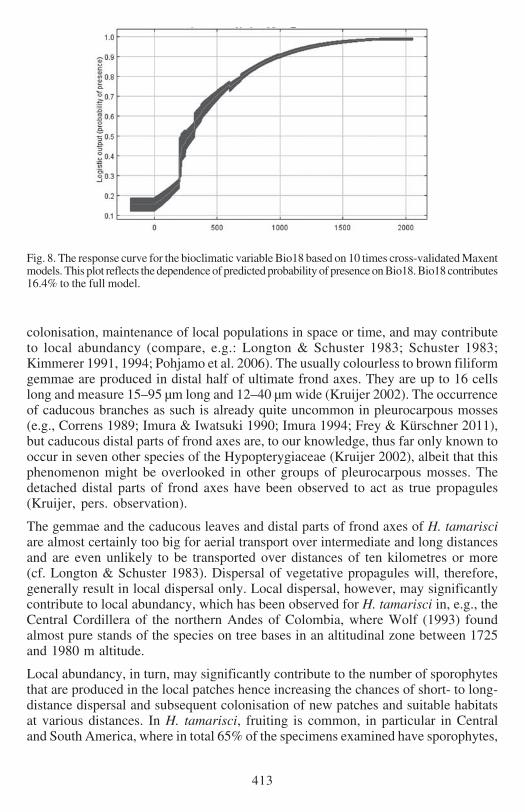
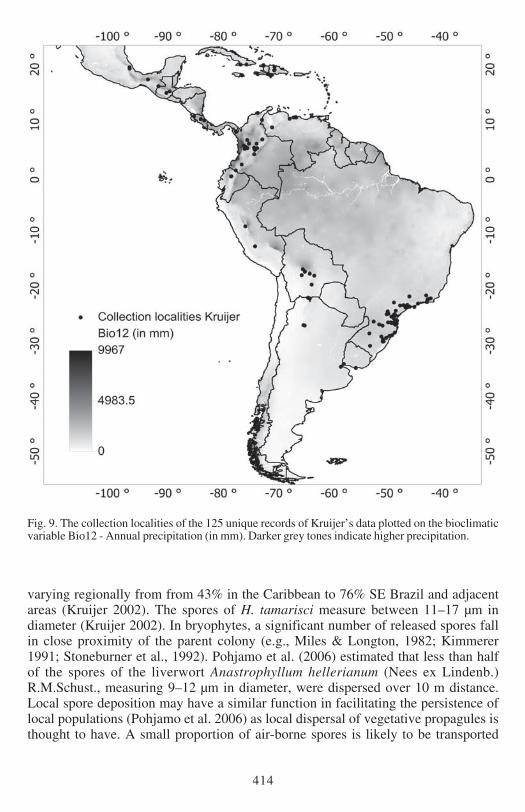
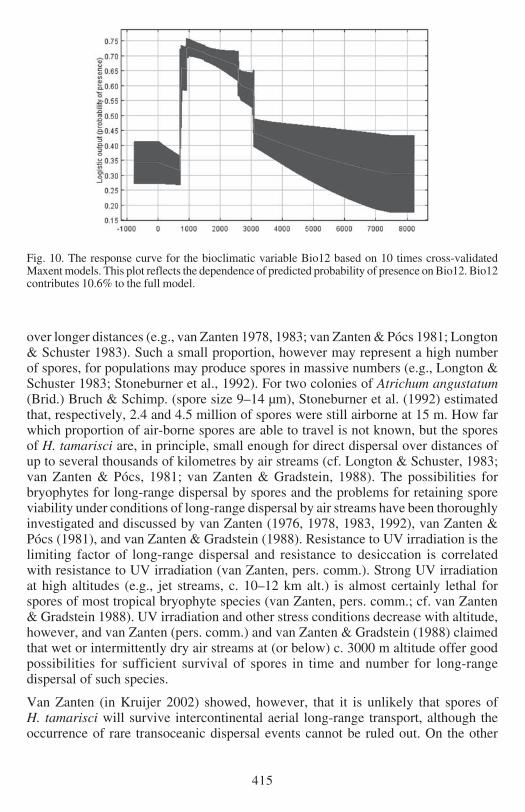
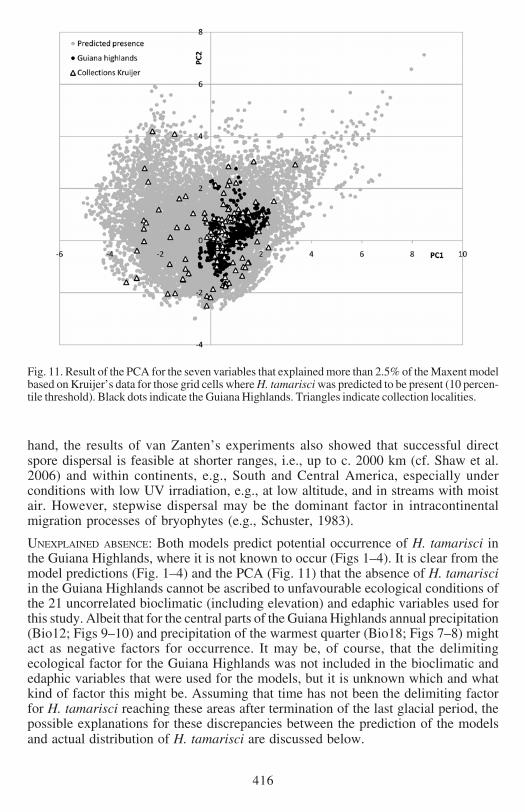


![[Prehistoric America] - ScienceViews.com](https://static.fdokumen.com/doc/165x107/6333b0f7a6138719eb0abae5/prehistoric-america-scienceviewscom.jpg)