Modelling Long Distance Pleasure Travel Mode Using Perceived Modal Attributes
19
Bond University ePublications@bond School of Business Discussion Papers Bond Business School December 1990 Modelling long distance pleasure travel mode using perceived modal aributes Hume Winzar Phil Pidcock Lester Johnson Follow this and additional works at: hp://epublications.bond.edu.au/discussion_papers is Discussion Paper is brought to you by the Bond Business School at ePublications@bond. It has been accepted for inclusion in School of Business Discussion Papers by an authorized administrator of ePublications@bond. For more information, please contact Bond University's Repository Coordinator. Recommended Citation Winzar, Hume; Pidcock, Phil; and Johnson, Lester, "Modelling long distance pleasure travel mode using perceived modal aributes" (1990). School of Business Discussion Papers. Paper 20. hp://epublications.bond.edu.au/discussion_papers/20
Transcript of Modelling Long Distance Pleasure Travel Mode Using Perceived Modal Attributes

Bond UniversityePublications@bond
School of Business Discussion Papers Bond Business School
December 1990
Modelling long distance pleasure travel mode usingperceived modal attributesHume Winzar
Phil Pidcock
Lester Johnson
Follow this and additional works at: http://epublications.bond.edu.au/discussion_papers
This Discussion Paper is brought to you by the Bond Business School at ePublications@bond. It has been accepted for inclusion in School of BusinessDiscussion Papers by an authorized administrator of ePublications@bond. For more information, please contact Bond University's RepositoryCoordinator.
Recommended CitationWinzar, Hume; Pidcock, Phil; and Johnson, Lester, "Modelling long distance pleasure travel mode using perceived modal attributes"(1990). School of Business Discussion Papers. Paper 20.http://epublications.bond.edu.au/discussion_papers/20

"Modelling Long Distance Pleasure Travel ModeUsing Perceived Modal Attributes"
December 1991
DISCUSSION PAPER NO 20
Gold Coast,QLD,4229
HumeWinzarPhil Pidcock
Lester Johnson
PAPERS
University- Drive,
DISCUSSION
BOND UNIVERSITYSchool of Business

SCHOOL OF BUSINESS
DISCUSSION PAPERSBond University was established by Act ofParliament in 1987 as an independant, prIvate University. The fIrststudent intake occurred in May 1989. The School of Business offers degrees in the undergraduate (B Com andDiploma) and the graduate (MCom, MBA and PhD) levels.
The School teaches and sponsors research in accounting, economics, econometrics, finance, marketing, management, organisational behaviour and related disciplines in hospitality and real estate fields.
The Discussion Paper series is intended to foster research and comments are invited. The views expressed inthe papers are the opinion of the authors and do not necessarily reflect the views of the School or the University.
Lists of available Discussion Papers and copies of the papers (which are free of charge) may be obtained from:
The Senior School AdministratorSchool of BusinessBond UniversityUniversity DriveGOLD COAST QLD 4229
Telephone: (075) 952244Fax: (075) 951160
Dean: Professor Ashley W. Goldsworthy AO OBE
B o N D u N I v E R s I T y

Modelling Long Distance Pleasure Travel Mode UsingPerceived Modal Attributes
HumeWinzar
Phil Pidcock
Lester Johnson
School of Business
Bond University
Gold Coast, Queensland, 4229
Australia
1

Modelling Long Distance Pleasure Travel Mode UsingPerceived Modal Attributes
Abstract
Modelling transport choice behaviour traditionally has been addressed using
objective measures of attribute data: price, time, etc. The authors argue that
actual brand attributes may not be a good causal influence on consumer
choice of long distance tourism travel. Choice is more likely to be a function
of brand perceptions or brand image, which in turn is a function of past
experience, expectations, promotional influences, family life stage and other
personal factors.
The authors re-examine data gathered in 1985 on tourist travel between Perth
and Sydney or Melbourne, Australia; about 2400 miles. The authors model
actual behaviour as a function of respondents' perceptions of travel mode
attributes using a customized Multinomial Logit programme which develops
separate explanatory models for identified market segments. Results
demonstrate the improvement in predictability over non-segmented models.
Implications for tourism operators in promotions, product design and market
targeting are discussed.
2

Modelling Long Distance Pleasure Travel Mode UsingPerceived Modal Attributes
Introduction
One aspect of long distance pleasure travel (e.g., coast to coast) within a large
contiguous geographic area, such as the U.S., Australia or Europe, that is of
potential interest to tourism authorities and marketers is the mode choice
decision of individuals engaged in such travel. Understanding this decision
process can provide tourism analysts with choice of pleasure travel mode
and, perhaps, point to ways that certain modes (e.g., train or bus) can be
effectively improved, thereby potentially increasing total demand for pleasure
travel as well as facilitating mode switching behaviour.
There exists a great deal of literature in transportation concerned with
modelling the choice of mode in various contexts (See Ortuzar and Willumsen
1990 for an extensive review). Most of this modelling has used actual modal
attributes and!or the characteristics of individuals as explanatory variables.
This is particularly the case when the mode choice decision has been
modelled using the popular multinomiallogit (MNL) tnodel or one of its
variants (see Hensher and Johnson 1981 for a comprehensive review of logit
modelling and Gensch and Recker 1979 for its use in marketing). However,
one might argue that it would be more relevant to use traveller perceptions of
the modal attributes as explanatory variables since it has been suggested that
choice can be as much a function of perceptions and image of alternatives
(Mowen 1990). Of course it is reasonable to say that attributes will drive
perceptions which will, in turn, drive choices, but it is just as true that prior
experience, imagery and the influences of word-of-mouth and reference
group behaviour will affect which alternatives and attributes are considered
in the first place (McConnell 1986). This point is particularly important in the
choice of tourism destinations and the mode of travel (Woodside and
Lysonski 1989). For a comprehensive discussion of these issues see Moutinho
(1987.)
One of the goals of this paper is to demonstrate the use of perceptions data in
modelling the choice of mode for long distance pleasure travel. This is done
using data from a study of long distance passenger rail service in Australia
known as the Indian Pacific (IP) which runs from Sydney on the East coast to
3

Perth on the West coast, a distance of about 3900 kilometres, or 2400 miles
(ARRDO 1986). One part of the ARRDO study revolved around the use of
stated preference (i.e., conjoint analysis) techniques (Louviere and
Woodworth 1983, Louviere 1988) to examine the effects on mode share of
changing attributes of the IP (Johnson and Nelson 1991). In the current paper,
we use the actual choice made by respondents for a recent east-west trip
(known as revealed preference data - see Wardman 1988) and model these as
a function of traveller perceptions of various modal attributes.
In the next section, we provide a description of the data used in the study.
This is followed by a brief outline of logit modelling and the segmentation
scheme adopted to improve the predictive capability of the final models.
Section 4 contains a discussion of our empirical results and we finish with
some marketing implications of the modelling effort.
Data
Data used in this study came from a survey conducted in Perth, Melbourne
and Sydney over the period 22 August to 8 September 1985. A total of 660
questionnaires were mailed out to qualifying responl:J.ents (see below) and 487
completed interviews were obtained (169 in Perth, 155 in Melbourne, and 163
in Sydney) of which 413 were for non-business travellers.
The procedure used to ensure that a reasonably random sample of travellers
was obtained consisted of drawing random samples of households from
telephone directories in the three cities. If a person in the household had
travelled east-west over the past two years, or had a firm intention to travel
over the next two years, then they were invited to participate in the survey. A
total of 5646 telephone contacts were required to achieve the final sample.
Since we were interested in modelling the choice of travel mode for already
completed trips, we were restricted to using only 197 observations out of the
total of 413 pleasure travellers.
For each respondent, we used the chosen mode (plane, train, bus or car) as the
dependent variable in the modelling exercise described in the next section.
Preliminary qualitative research suggested about seventeen service
characteristics affected choice of travel mode. Perceptions of these
4

characteristics for each mode were used in the modelling exercise as
explanatory variables. They were:
1 Speed (getting to destination quickly)
2 Interest (boring Vs interesting/entertaining)
3 Stopovers (ability to stop at places of interest)
4 Comfort (cramped Vs comfortable)
5 Food Quality
6 Facilities (modern facilities and appearance)
7 Social environment, (opportunity to meet people)
8 Relaxing
9 Planning (need to plan ahead)
10 Safety
11 Scenery (ability to watch scenery)
12 Price (expensive Vs cheap)
13 Punctuality (usually on time Vs late)
14 Booking convenience (easy to arrange tickets)
15 Friendly service
16 Reliability (frequency of cancellations) and
17 Convenience (of departure and arrival times)
Clearly attributes 13 through 17 are not relevant to the car mode so
perceptions for these attributes were only collected for plane, train and bus.
Attribute scores were derived from self-explicated evaluations of attribute
level for each travel alternative, moderated by the relative importance of each
attribute to each respondent. That is:
Where:
Vikj = attribute score for attribute i on alternative k by individual j,
Eikj = evaluation of level of attribute i on alternative k by individual j,
~j = importance of attribute i to individual j.
Thus where Eikj is measured on a 7-point rating scale (-3 to +3) and ~j is
measured on a 10 point importance scale (O='not important at all',
9='extremely important') the evaluation score Vikj has a potential range of -27
to +27.
5

Model
Market Share was modelled using the basic multinomiallogit model (Gensch
and Recker, 1979) in which:
Where:
Pi =Market share of alternative i, or probability of purchase of alternative i,
Vi = Value, or estimated utility of alternative i,
Aij =level of attribute j in alternative i, and
~j =attribute parameters to be estimated.
The term eXP(Vi) means that we take the value Vi to its exponent, i.e., eVi•
The consumer market for long distance pleasure travel is not homogeneous.
The ARRDO research identified different segments based on: age of traveller;
length of stay at destination; purpose of trip (visit friends & relatives, family
holiday, etc); travelling companions (alone, family, partner); and city of
origin. As a result, model estimates for the total market are unlikely to be as
accurate and interpretable as models derived separately for different
segments.
It is possible to infer total-industry market shares for each mode from the
share estimates of separate models with:
Where:
Sk =Share of alternative k for total market
ski =Share of alternative k for market segment i,
TCi =Relative size of segment i.
Our aim is to refine the accuracy of the market share estimation by first
breaking up the market share of east-west travel into segments, then
modelling the market share for each segment using a basic multinomiallogit
model, followed by aggregation of the segments to estimate total share of
east-west travel. The innovation here is the disaggregation and modelling of
the travel market into segments for estimation purposes, prior to re
aggregation for total market share.
6

Market segments were based on measures of demographics that we
considered likely to mediate the relationship between perceptions and travel
mode choice: Age, Income, Marital status, Employment status, and the
presence of Children in the travelling party.
We considered that: (a) higher income travellers were less likely to take the
cheaper, least comfortable, mode (bus); conversely, unemployed and other
low income earners will be more inclined to take this mode, (b) Older and
retired travellers would be less concerned with travel time, (c) Parents would
be concerned with travel time and cramped conditions.
Measures of each of these variables, including dummy variables for marital
status, employment and children, were standardized to mean zero and
standard deviation one and submitted to K-means cluster analysis. A three
cluster solution provided the most interpretable results, and the best recovery
in a confirmatory discriminant analysis.
Descriptive statistics for each of the three groups are presented in Table 1
below.
Table 1.
Identified Market Segments
Silver Families YoungHairs with Kids UncommItted
n 69 73 55
Mean Age 63 39 30
Relative Income Low High Medium
Employed 4% 66% 85%
Married 70% 99% 0%
Children 7% 63% 9%
We can broadly describe the three segments in the following way:
Group 1 is made up largely of retired folk, in couples or widowed, with no
dependants travelling with them. Income is low, but this measure does not
take into account access to capital. Travel marketers would call this group
"Silver-hairs".
Group 2 is made up of middle aged families. Almost all are married, and the
vast majority have children accompanying them on their holiday journey.
7

. Average incomes are the highest of the three groups, but the variation in
income also is the greatest. Family life stage for many is "Full-nest." We call
the group "Families with Kids."
Group 3 is dominated by younger, single travellers with no children. While
average incomes are midway between groups one and two, the distribution is
actually bimodal, with almost equal proportions of very high income earners,
and relatively low income earners. A larger sample size and more well
defined discriminators may have shown separate representatives of "Back
packers" and "Yuppies". Here, this group can be collectively called "Young
Uncommitted."
Parameter estimates for the multinomiallogit choice models were derived
using maximum likelihood techniques contained in the adaptable computer
algorithm: BLOGIT (Crittle and Johnson 1981).
Empirical Results
Table 2 shows the estimated coefficients for the whole sample and for the
three market segments. The MNL models for different segments show
markedly different coefficients from the group model, especially in the
attribute-specific constants (intercepts) and in the attributes Comfort, Social,
and Friendly. Generally goodness of fit, measured by the Rho-squared
statistic (see footnote), is better for the separate segments model, despite the
substantial reduction in degrees of freedom1. (It is not valid to calculate a
combined Log-Likelihood Function by simply summing individual segment
LLF's because these involve the summation of logs.)
Tables 3 and 4 show the whole sample and combined segments prediction
success tables (Hensher & Johnson 1981) respectively. We can see that, as
1 The goodness of fit statistic Rho-squared (p2) is given by the complement of the ratio ofthe log-likelihood function of the model under consideration to the log-likelihood of the nullmodel, Le., where all betas are set to zero. That is,
p2; 1- (LLF(~)/LLF(O»)
Oearly p2 can range from 0 to 1, with the larger the value the better the fit of the model or, inother words, the greater the explanatory power of the predictor variables. It should be notedthat values of p2 of between 0.2 and 0.4 are considered extremely good fits, so the analystshould not be looking for values in excess of 0.9 as we may be used to with R2 in ordinaryregression.Where models with different numbers of parameters are compared then we use Rho-barsquared (pbar2) which is an adjustment for degrees of freedom. See Henscher & Johnson(1981) p.51 and McFadden (1979) for details.
8

expected, the combined segments models provide a better prediction success
with the combined model providing nearly 60% success compared with 50%
success for the whole sample model. We would expect that segments which
are more well defined than the available demographic groups used here
would provide even better prediction accuracy. Two commonly used
measures in travel research include "length of visit'~ and "purpose of visit,"
which includes visiting friends and relatives, family holiday, and so on. If
these measures were included in our segmentation schema, for example, then
we could expect significantly better prediction results to emerge.
In Table 2, Alternative-Specific Constants CASC) are presented for Air, Train
and Bus to give intercept terms with respect to Car mode, which is implicitly
set to zero. Thus the ASC's are dummy variables which can be interpreted as
overall attractiveness scores for the specific alternatives if all the attribute
evaluations were zero. The following seventeen sets of beta estimates indicate
the contribution of each attribute perception of travel mode choice. Note
these beta estimates are based on the raw evaluation scores; they are not
standardized betas and cannot be' compared for relative contribution, except
by the strength of their significance levels.
While results for the separate segments show a clear improvement in
goodness-of-fit and a marginal improvement in prediction accuracy, the most
striking result is the difference in the beta estimates among the segments and
between each segment and the whole sample. Importantly, where the whole
model suggests no significant impact of a perceptual variable, that variable is
actually very important to the travel decision for at least one segment. We
find this in estimates for INTEREST, COMFORT, FACILITIES, and
PLANning. Conversely, we discovered that some variables are determined
significant in the undifferentialted model but which subsequently only appear
significant in certain segments, not in all three. For example, DURATION of
trip and CONVENIENCE of terminal location and scheduling appear
significant for the whole sample but are only really important to the Families
with Kids segment. Similarly, FRIENDLY service appears significant in the
whole sample model, but when segmented was found to be of major concern
only to the Silver Hairs segment.
9

Marketing Implications
This choice modelling exercise revealed that choice of travel mode in long
distance vacation-oriented trips in Australia is influenced by travellers'
perceptions about the trip, as well as exhibiting demographic segmentation
characteristics.
This paper demonstrates the viability of modelling travel choice behaviour as
afunction of perceptions of the attributes of available alternatives. The results
show that although the whole sample model (representing the general
vacation-travelling public) presents some non-significant perceptual
variables, the segment models reveal perception variables which are both
significant in the choice process, and, moreover, segment-specific. This is
important because it allows the marketer to 'get closer' to the decision process
of the target consumer. If we know which attribute perceptions figured
prominently in the choice process, we can be confident (more confident than
with a choice model based on attribute measures alone) that manipulating the
marketing mix in a way designed to maximise these desired [target]
perceptions will result in a better probability of the target travel mode (or
brand, to generalise beyond travel) being chosen by its target segment.
Results are doubly interesting because the data set was quite severely limited,
(in terms of the richness of perception and other data gathered) yet still
revealed clear superiority for segment-based choice models. As noted in the
results section, with more well-defined segments we would expect the
segment-based choice predictions to be improved even more, relative to the
results obtained for an unsegmented model.
Thus we found that for three simple demographic segments, certain
perceptions could tentatively be viewed as positioning variables. For the
"silver hairs" segment, for example, perceptions of FRIENDLY SERVICE, and
an INTERESTING and COMFORTABLE trip are significant determinants of
mode of long distance pleasure travel. With research into the attractiveness
(e.g., the size) of this segment, management may decide to 'turn up the dials'
on these key variables, to improve the probability of choice among this
segment. Emphasis on these dimensions in promotions and product design
will have greatest effect on this segment.
Similarly "families with kids", which as Table 1 indicates have the highest
income of the three identified segments, are influenced by perception of TRIP
10

DURATION, CONVENIENCE, the NEED TO PLAN, and, incongruously,
SCENERY. Scenery appears incongruous because the other perceptions seem
to indicate a preference for air travel, for which scenery could be hard to
provide.
The "young uncommitted" segment shows predictable positioning
perceptions, given their demographic characteristics: COST and the NEED
TO PLAN, FACILITIES and SCENERY. Emphasis on budget, flexibility and
the enjoyment of the travelling experience should be most featured in
promotions and packaging for this segment.
The potential usefulness of these models is that they enable us to measure the
importance of the perceptions about travel mode (or any product's attribute
set) held by individual consumers. We are thus able to create segments based onsomething much closer to the choice process - perceptions of product - and relate
these perceptions to things we can measure (and therefore use to assess the size
and other important aspects to do with a segment's attractiveness, and
lifestyle characteristics of each segment for guidance in setting marketing mix
objectives). This gives us a capability to create market segments at the most
sensitive level - consumer choice/decision process - from an empirical basis.
This may confer an advantage on this approach compared with other possible
approaches that might be used for the same purpose - such as conjoint
analysis - which rely on an experimental basis.
It is relatively easy to profile these 'perception segments' in demographic
(easy to quantify) terms. These results then enable us to assess the size of
segments which are more meaningful than mere demographic segments, and
we are able to design more sharply-focussed marketing strategies targeted on
the positioning perceptions which the choice modelling analysis reveals.
To observe that "Families with kids" are concerned with duration and
convenience, and that "Young uncommitted" are concerned with budget and
experience, and so on, seems both obvious and redundant. This research goes
much further than that however. We have shown that we can make sound
estimates of how much these factors affect responsiveness of each segment to
different transport offerings. Marketers for specific transport alternatives can
estimate the degree of change required in consumer attitudes that is required
to bring about significant change in behaviour. Clearly these are important
for establishing promotions objectives, and estimating market share.
11

Future research in this area then should address the nature of attitude and
perception measures that are most closely associated with the purchase
decision measures.
12

Table 2Estimated Coefficients for Whole Sample
and Selected Segments
Whole Silver Families Youn~Sample Hairs with kids UncommItted
ASC-AIR .722* -.367 2.424*** 1.324
ASC-TRAIN -1.063*** -.830 -1.208 -1.982**
ASC-BUS -1.310**** -1.346** -1.638* -2.206***
DURATION .110**** .025 .155**** .125*
INTEREST .034 .153** -.012 -.035
STOPOVER .011 -.059 -.024 .062
COMFORT .029 .099** .058 -.022
FOOD .025 -.019 .022 .015
FACILITIES -.016 -.082 .005 .206**
SOCIAL .067** .065 .072 .075
RELAX .020 .057 -.022 .018
PLAN .012 .012 -.084** .159***
SAFETY -.040** -.052 -.028 -.056
SCENERY .117**** .017 .354**** .163**
COST .051*** .054* .048 .134***
PUNCTUAL .044 .028 .023 .082
BOOKING -.038 -.087* -.151* .026
FRIENDLY .084** .222*** .080 .011
RELIABLE .069*** .096* .115* .114
CONVENIENT -.091**** -.076* -.183*** .001
Summary Statistics
Samrcle size 197 69 73 55LLF 0) -237.60 -93.56 -72.37 -58.51LtF(~) -185.82 -73.57 -42.17 -37.42P 0.218 0.214 0.417 0.360Pbar2 0.191 0.130 0.359 0.272
Significance level: '" :::: 0.<.20, ** :;;; 0.<.10, *** = 0.<.05, ****:;;; a.<.01
13

Table 3.Whole Sample Prediction Success Table
AIR TRAIN BUS CAR
AIR 101 65.238 9.487 8.378 17.898
TRAIN 25 8.400 7.272 4.248 5.081
BUS 25 9.963 2.782 7.500 4.755
CAR 46 17.400 5.460 4.874 18.266
101 25 25 46
ProportionSuccessfullyPredicted .... 64.5% 29.1% 30.0% 39.7%
Overall Prediction Success =49.89%
Table 4.Combined Segments Prediction Success Table
AIR TRAIN 'BUS CAR
AIR 101 73.389 6.961 6.068 14.582
TRAIN 25 6.633 9.762 4.438 4.167
BUS 25 7.474 3.422 9.541 4.463
CAR 46 13.504 4.855 4.953 22.688
101 25 25 46
ProportionSuccessfullyPredicted ..... 72.7% 39.1% 38.2% 49.2%
Overall Prediction Success =58.57%
14
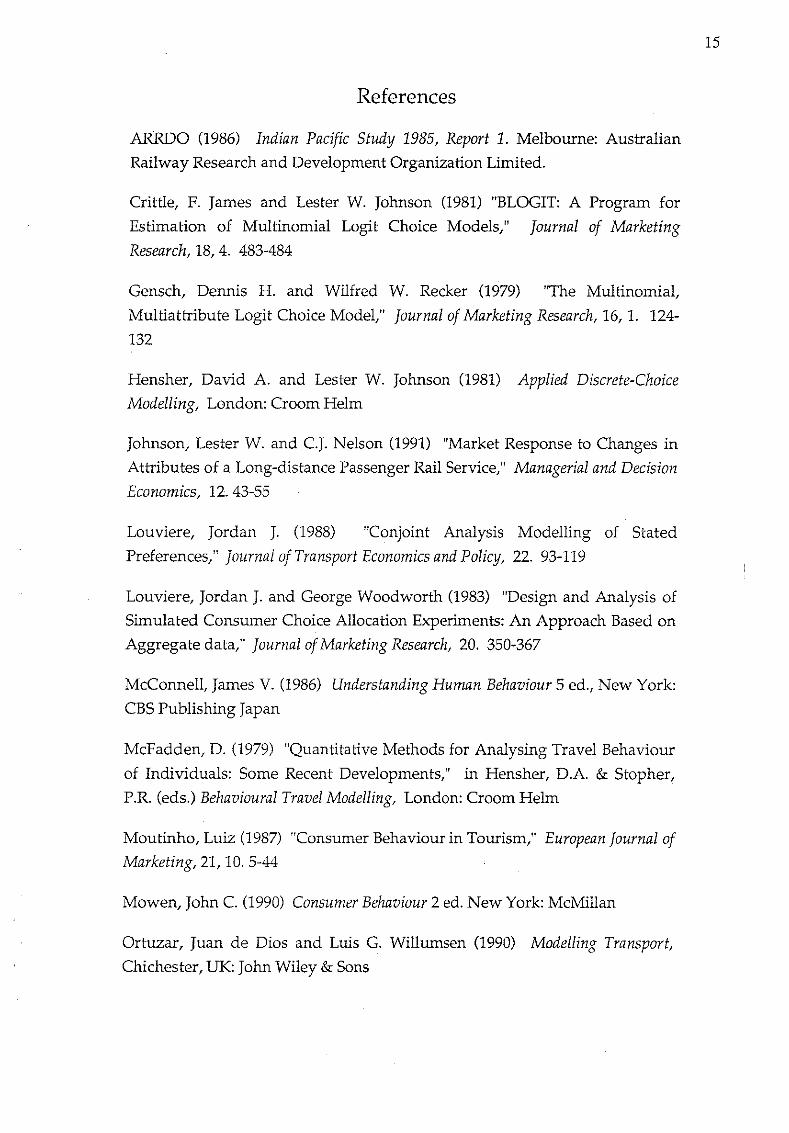
References
ARRDO (1986) Indian Pacific Study 1985, Report 1. Melbourne: Australian
Railway Research and Development Organization Limited.
Crittle, F. James and Lester W. Johnson (1981) "BLOGIT: A Program for
Estimation of Multinomial Logit Choice Models," Journal of Marketing
Research, 18,4. 483-484
Gensch, Dennis H. and Wilfred W. Recker (1979) "The Multinomial,
Multiattribute Logit Choice Model," Journal of Marketing Research, 16, 1. 124
132
Hensher, David A. and Lester W. Johnson (1981) Applied Discrete-ChoiceModelling, London: Croom Helm
Johnson, Lester W. and c.J. Nelson (1991) "Market Response to Changes in
Attributes of a Long-distance Passenger Rail Service," Managerial and DecisionEconomics, 12. 43-55
Louviere, Jordan J. (1988) "Conjoint Analysis Modelling of Stated
Preferences," Journal of Transport Economics and Policy, 22. 93-119
Louviere, Jordan J. and George Woodworth (1983) "Design and Analysis of
Simulated Consumer Choice Allocation Experiments: An Approach Based on
Aggregate data," Journal ofMarketing Research, 20. 350-367
McConnell, James V. (1986) Understanding Human Behaviour 5 ed., New York:
CBS Publishing Japan
McFadden, D. (1979) "Quantitative Methods for Analysing Travel Behaviour
of Individuals: Some Recent Developments," in Hensher, D.A. & Stopher,
P.R. (eds.) Behavioural Travel Modelling, London: Croom Helm
Moutinho, Luiz (1987) "Consumer Behaviour in Tourism," European Journal ofMarketing, 21, 10. 5-44
Mowen, John C. (1990) Consumer Behaviour 2 ed. New York: McMillan
Ortuzar, Juan de Dios and Luis G. Willumsen (1990) Modelling Transport,
Chichester, UK: John Wiley & Sons
15

Wardman, M. (1988) "A Comparison of Revealed Preference and Stated
Preference Models of Travel Behaviour," Journal of Transport Economics andPolicy, 22. 71-91
Woodside, Arch G. and Steven Lysonski, (1989) "A General Model of
Traveler Destination Choice," Journal of Travel Research, 27 (Spring) 8-14
16