Bangladesh Cage Aquaculture for Greater Economic Security ...

Chapter 8
Modelling and Analysis of Higher Phase Order (HPO)Squirrel Cage Induction Machine
A.A. Jimoh, E.K. Appiah and A.S.O. Ogunjuyigbe
Additional information is available at the end of the chapter
http://dx.doi.org/10.5772/57468
1. Introduction
The need for more power per volume, or mass and reliability has promoted the advancementof higher phase order (HPO) electric machines. The HPO machines are electric machines withthe number of phases higher than the conventional arrangement of three (3). These machinesare considered to have several advantages and useful applications. So far HPO machines havefound applications in electric ship propulsion, hybrid electric vehicles and many otherindustrial applications (Yong Le A, et al, 1997), (Lipo T.A., 1980). Also, they can operate withan asymmetrical winding structure in the case of loss of one or more machine phases thusmaking them fault tolerant (Apsley J., et al, 2006).
In this chapter, an approach of modelling and analysis of the higher phase order machine willbe explored where the stator has a symmetrical winding layout. The machine stator windingis connected to a balanced phase supply and the machine performance characteristics observedduring normal operation and under fault conditions, both in loaded and unloaded conditions.The performance under fault is considered to demonstrate the fault tolerance of the machine.Though rating may fall during the loss of 1 or more phases due to fault, unlike the conventional3-phase ones, does not stop the machine from running as long as the condition for theproduction of rotating magnetic field in the air-gap is met.
Furthermore, a six phase squirrel cage induction machine was investigated using the classicalfield analysis method, the generalised theory method and the finite element method (FEM).The six phase squirrel cage induction machine is modelled and simulated in Matlab\Simulinkenvironment. Steady-state and the dynamic results characterising the performance of the sixphase squirrel cage induction machine were generated. Laboratory tests were conducted on aconstructed 1.5 kW experimental machine to validate the performance characteristics resultsobtained from the theoretical simulations. The results of the three methods used were
© 2014 The Author(s). Licensee InTech. This chapter is distributed under the terms of the Creative CommonsAttribution License (http://creativecommons.org/licenses/by/3.0), which permits unrestricted use,distribution, and reproduction in any medium, provided the original work is properly cited.

compared among themselves, and also with the experimental to appraise the suitability of eachmethod for modelling and analysis of HPO machines. Even though six-phase machine isconsidered it is believed that the methods as applied in this work are generally applicable toHPO squirrel cage induction machine of any number of phases.
2. Mathematical modelling of the six phase squirrel cage inductionmachine
The arbitrary reference frame theory is used in the dynamic analysis of electrical machines.The highly coupled nature of the machine, especially the inductances within the windingmakes it rather challenging to perform the dynamic simulations and analysis on this machine(Ogunjuyigbe A.S.O., 2009), (Krause P.C., Wasynczuk O., et al, 2002). By using this method asapplied to the three phase case, a six-phase machine is also transformed to a four-phasemachine with their magnetic axis in quadrature. This method is also commonly referred to asthe dqxy0102 transformation. Figure 1 shows the symmetrical layout of the machine in thenatural reference frame, where the stator is represented by the six phase symmetrical windingand the rotor by the three phase winding.
60˚
θ ras
zscr
ys
xs
br
cs
ar
bs
Figure 1. The Machine Diagram in natural reference frame
MATLAB Applications for the Practical Engineer220

The matrix transformation of the dqxy0102 and abcxyz for the stator phases is given in Equation
(1) and Equation (2) as (Levi E., 2006):
(1)
( ) ( ) ( ) ( )
( ) ( ) ( )
cos sin cos 2 sin 2 1 12 2cos sin cos 2 sin 2 1 1
3 3 3 32 2 4 4cos sin cos 2 sin 2 1 13 3 3 3
cos sin cos 2 2 si
as
bs
cs
xs
ys
zs
ffffff
q q q q
p p p pq q q q
p p p pq q q q
q p q p q p
æ ö æ ö æ ö æ ö- + - + -ç ÷ ç ÷ ç ÷ ç ÷é ù è ø è ø è ø è øê ú
æ ö æ ö æ ö æ öê ú - + - +ç ÷ ç ÷ ç ÷ ç ÷ê ú è ø è ø è ø è øê ú =- + -ê ú
ê úê úê úë û
( )1
2
n 2 2 1 14 4 8 8cos sin cos 2 sin 2 1 13 3 3 3
5 5 10 10cos sin cos 2 sin 2 1 13 3 3 3
ds
qs
dxs
qys
os
os
ffffff
q p
p p p pq q q q
p p p pq q q q
é ùê úê úê ú é ùê ú ê úê ú ê úê ú êê ú êê ú ê+ -ê ú ê
æ ö æ ö æ ö æ öê ú ê- + - +ç ÷ ç ÷ ç ÷ ç ÷ê ú êè ø è ø è ø è ø ë ûê úê úæ ö æ ö æ ö æ ö
- + - + -ê úç ÷ ç ÷ ç ÷ ç ÷è ø è ø è ø è øë û
úúúúúú
(2)
Likewise, the rotor matrix transformation between ABC and dq0 is also given in Equation (3)
and Equation (4) as (Jimoh A.A., Jac-Venter P, Appiah E.K., 2012):
2 4cos cos cos3 3
2 4sin sin sin3 3
1 1 12 2 2
dr ar
qr br
cror
f ff f
ff
p pb b b
p pb b b
é ùæ ö æ ö- -ê úç ÷ ç ÷
è ø è øê úé ù é ùê úê ú æ ö æ ö ê ú= + +ê úê ú ç ÷ ç ÷ ê úè ø è øê úê ú ê úë ûê úë ûê úê úë û
(3)
Modelling and Analysis of Higher Phase Order (HPO) Squirrel Cage Induction Machinehttp://dx.doi.org/10.5772/57468
221

cos sin 12 2cos sin 13 3
4 4cos sin 13 3
ar dr
br qr
cr or
f ff ff f
b bp pb b
p pb b
é ùê úê ú é ùé ùê ú ê úæ ö æ öê ú = - -ê ú ê úç ÷ ç ÷ê ú è ø è øê ú ê úê úë û ê ú ë ûæ ö æ öê ú- +ç ÷ ç ÷ê úè ø è øë û
(4)
Where f can be expressed as the voltage, current or the flux linkage and the subscript ABC‐XYZ represents the phases of the machine winding.
In developing the equations which describe the behaviour of the six phase induction machinethe following assumptions were made:
1. The air-gap is uniform.
2. Eddy currents, friction and windage losses and saturation are neglected.
3. The windings are distributed sinusoidally around the air gap.
4. The windings are identical.
2.1. Voltage and flux linkage equations
The voltage equation of the six phases (abcxyz to dqxy0102) is derived using the similar conceptas applied to the three phase case (Jimoh A.A., Jac-Venter P, Appiah E.K., 2012). The symmet‐rical dqxy0102 voltage equation with flux linkage as state variables is expressed as (AppiahE.K., et al, 2013):
l ll wl
æ ö-= + -ç ÷
è øds md
ds s ds qsls
dV rl dt (5)
qs mqqsqs s ds
ls
dV rl dt
l ll wl
æ ö-ç ÷= + +ç ÷è ø
(6)
( )l ll w w l
æ ö-= + - -ç ÷
è ødr md
dr r dr r qrlr
dV rl dt (7)
( ) qr mqqr r qr r dr
lr
dV rl dt
l ll w w l
æ ö-ç ÷= + + -ç ÷è ø
(8)
MATLAB Applications for the Practical Engineer222

ll
æ ö= +ç ÷
è ødxs
dxs r dxsls
dV rl dt (9)
ll
æ ö= +ç ÷
è ø
qysqys s qys
ls
dV rl dt (10)
11 1
ll
æ ö= +ç ÷
è øos
os s osls
dV rl dt (11)
22 2
ll
æ ö= +ç ÷
è øos
os s osls
dV rl dt (12)
The flux linkage equations are expressed as current dependent variables (Levi E., 2006):
ds mdds
lsi
ll l-
= (13)
qs mqqs
lsi
ll l-
= (14)
dr mddr
lri
ll l-
= (15)
l l-æ ö= ç ÷è ø
qr mqqr
lri
l (16)
læ ö= ç ÷è ø
dxsdxs
lsi
l (17)
læ ö= ç ÷è ø
dysdys
lsi
l (18)
Modelling and Analysis of Higher Phase Order (HPO) Squirrel Cage Induction Machinehttp://dx.doi.org/10.5772/57468
223

11
læ ö= ç ÷è ø
osos
lsi
l (19)
22
læ ö= ç ÷è ø
osos
lsi
l (20)
The mutual inductances between the stator and the rotor are given as:
( )1l = +md m ds drL i i (21)
( )1l = +mq m qs qrL i i (22)
Where λ is the flux linkage, Lm the magnetizing inductance and Lls and Llr are the stator androtor inductances respectively.
2.2. Mechanical equations voltage and flux linkage equations
The mechanical equations for the six phase squirrel cage induction machine comprises of theelectromagnetic torque and the speed as expressed in Equations (23) and (24). These equationsare derived using the same concept of the three phase case (Ogunjuyigbe A.S.O., 2009), (KrauseP.C., Wasynczuk O., et al, 2002).
( )1 1 1 162 2
l læ ö= -ç ÷è ø
em ds qs qs dsPT i i (23)
2 wæ ö + =ç ÷è ø
rL em
dJ T TP dt
(24)
Where P is number of poles, J is moment of inertia, Tem is the electromagnetic torque, TL istorque connected to the shaft, and ωr is the angular rotational speed of the rotor.
2.3. Equivalent circuit
The equivalent circuit diagram of figure 2 summarises the voltage and flux linkage equationsof the six phase squirrel cage machine in dqxy0102 transformation. The figure 2 (a) and figure2 (b) illustrates the equations with its corresponding stator and rotor mutual coupling of themachine as expressed in equations (5)-(8) and (13)-(16). From the equivalent circuit presenta‐tion, only these equations take part in the electromechanical energy conversion process.
MATLAB Applications for the Practical Engineer224

Figure 2. The dqxy0102 equivalent circuit of the six phase squirrel cage induction machine (a) The q equivalent circuit(b) The d equivalent circuit, (c) The h non-coupling equivalent circuit
There is no mutual coupling in the equations (9)-(12) and (17)-(20) as presented in figure 2(c)where h denotes xy0102 voltage equations. These equations do not take part in the energyconversion process and therefore contribute to losses in the system. (Aroquiadassou G.,Mpanda-Mabwe A., 2009).
3. Modelling of six-phase squirrel cage induction machine under faultconditions
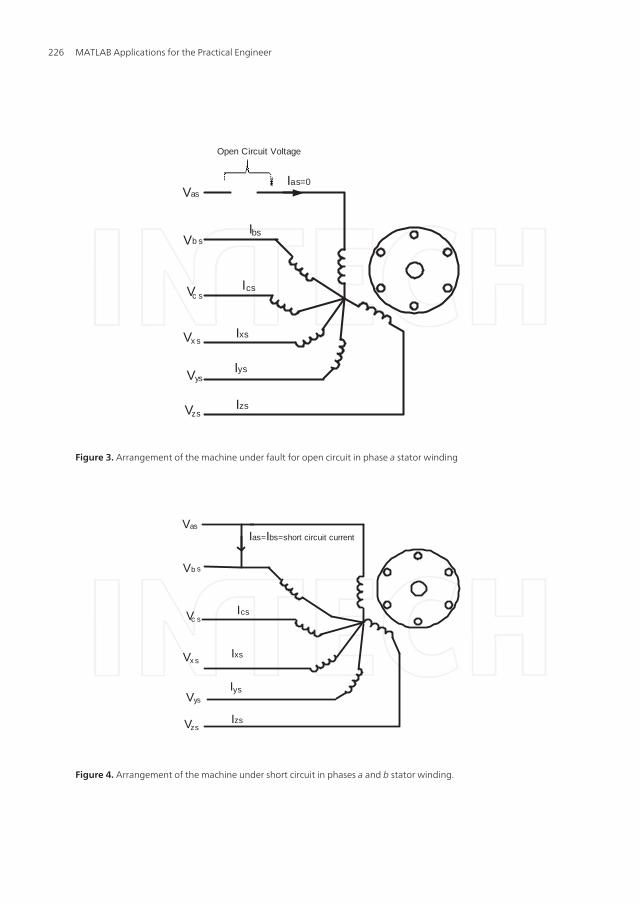
The operation of the machine under fault is considered here to demonstrate its fault toleranceability. This machine consists of a symmetrical six phase supply with a fault at the statorterminal, assuming the phase a winding. To investigate the performance of the machine underfaulty conditions, the open and short circuit faults were simulated for both no-load and loadedstates of operation. The winding arrangement for an open circuit in phase a is as shown infigure 3. The short circuit faults winding arrangement between the phases a and b is shown infigure 4.
Modelling and Analysis of Higher Phase Order (HPO) Squirrel Cage Induction Machinehttp://dx.doi.org/10.5772/57468
225
Vas
Vb s
Vc s
Vx s
Vys
Vzs
Ias=0
Ibs
Ics
Ixs
Izs
Iys
Open Circuit Voltage
Figure 3. Arrangement of the machine under fault for open circuit in phase a stator winding
Vas
Vb s
Vc s
Vx s
Vys
Vzs
Ias=Ibs=short circuit current
Ics
Ixs
Izs
Iys
Figure 4. Arrangement of the machine under short circuit in phases a and b stator winding.
MATLAB Applications for the Practical Engineer226

3.1. Open circuit fault
With phase a opened the machine is modelled for ease of referral in the stationary referenceframe where ω=0 is substituted in equation (5). The open circuit fault is simulated by simplyassuming that the current ceases to flow in phase a after a normal steady state current, and anopen circuit voltage is assumed across the open circuit terminals (Singh G.K., Pant V., 2000),(Krause P.C., Thomas C.H., 1965). The machine is assumed to be operating as a motor, hencea balanced six phase supply is applied to the stator. The six phase squirrel cage inductionmachine has no neutral connections and therefore, all the zero sequence currents are zerobefore the fault. However, at the loss of a phase the machine operates in asymmetry, and zerosequence current flow in the rest of the winding.
For a balanced six phase, the total phase currents may be expressed as:
0+ + + + + =as bs cs xs ys zsI I I I I I (25)
From equation (2), assuming θ=0, the stator current of phase a is expressed as:
1= +as ds dxsI I I (26)
From equation (26), as Ias =0,
1 = -ds dxsI I (27)
The open circuit voltage is also expressed as:
1= +as ds dxsV V V (28)
Putting Ids1=0 into equation (13) and (21) and back substituting into equation (5) gives the newd-axis voltage equation as:
'm
ds drm r
LdVdt L L
læ öç ÷= ç ÷+è ø
(29)
There is no mutual coupling between the stator and the rotor winding of the x-axis voltage.As such, putting Idxs=0 into equation (9) gives the new x-axis voltage as:
0=dxsV (30)
Modelling and Analysis of Higher Phase Order (HPO) Squirrel Cage Induction Machinehttp://dx.doi.org/10.5772/57468
227

Back substituting equations (29) and (30) into (28) gives the open circuit voltage as:
'm
as drm r
LdVdt L L
læ öç ÷= ç ÷+è ø
(31)
Where L s = L ls + L lr and L r' = L lr + L m.
The open circuit voltage in equation (31) is placed across the open circuit terminal in thesimulation.
3.2. Short circuit fault simulations
In this section we consider a short circuit between two phases during a normal operation ofthe machine. For this instance, the balanced six phase total phase voltages may be expressedas:
0+ + + + + =as bs cs xs ys zsV V V V V V (32)
With phase a and phase b short circuited, the line to line voltage between these two phasesbecome zero. The short circuit fault is simulated by putting this line voltage to zero, implyingthe connection of phase a to phase b at a certain point at a time t when the fault occurs.
3.3. Classical field analysis
In this section, the classical field analysis is used to determine the magnetic field distributionin the air-gap of the machine. With this magnetic field distribution, the performance behaviourof the machine at steady state was determined using the equivalent circuit in figure 2. Thecorresponding smooth air-gap flux density distribution of the stator and the rotor is given inmore details by (Appiah E.K. et al, 2013):
( ) ( )
( ) ( )
0
0
,,
,,
m qq
m qq
=
=
gsg
rgr
g
MMF tB t
l
MMF tB t
l
(33)
The permeance factor Λ is expressed as (Jimoh A. A., 1986):
( )( )12
1-L =
é - - ùë û
y
a y b y(34)
MATLAB Applications for the Practical Engineer228

1 2 tan 0.51
qp
é ù+ += - + + + -ê ú
- -ê úë û
os os
g g
b bg p b p pIn In ap b p l lb
(35)
Where Bg represents the flux density distribution of the stator and the rotor, MMF representsthe magnetomotive force, lg represents the air-gap length, μo represents the permeability of air,
θ represents space, and t represents time.
The six phase air-gap power can be expressed as:
'2'6= rag r
RP Is
(36)
Where:
'2,w w
w-
= =s rr
ss R R (37)
The electromechanical power and torque of the machine is expressed as:
( )1= -em agP P s (38)
w= ag
ems
PT (39)
Similarly, the input power, output power and the power factor are also expressed as:
2'6=in ag r sP P I R (40)
= -out ag lossP P P (41)
6= in
s s
PPFV I (42)
Modelling and Analysis of Higher Phase Order (HPO) Squirrel Cage Induction Machinehttp://dx.doi.org/10.5772/57468
229

Also s denotes the slip, ωs is the synchronous speed, ωr is the rotor speed, Pin is the input power,Vs is the supply voltage, Is is the stator supply current, PF is the power factor, Pag is the air-gappower, Pem is the electromagnetic power, Pout is the output power, Ploss is the losses-whichincludes stator and rotor winding losses, core loss, windage and friction and other stray losses-and the subscripts s and r denotes the stator and the rotor respectively.
As the permeance factor of equation (34) is superimposed on the flux density distributionexpressed in equation (33), the effects of slot opening on the flux density distribution isaccounted.
3.4. Finite element analysis
In this section, the finite element analysis using a two dimensional Quickfield software packageis used to evaluate the performance behaviour of the machine. The magnetic vector potentialis employed in the numerical solution to give the magnetic flux density distribution. Themagnetic vector potential is expressed as (Pyrhonen T. P., Valeria H., 2008), (Appiah E.K.,Jimoh A. A., et al, 2013):
® ®= Ñ´B A (43)
¶=
¶x
xABy (44)
¶=
¶y
yA
Bx
(45)
For a two dimensional problem of the vector potential, the Poisson equation is expressed as:
2 22
2 2
2 22
2 2
.
.
m
m
®
®
¶ ¶Ñ = + = -
¶ 
¶ ¶Ñ = + = -
¶ 
x xx x
y yy y
A AA Jx y
A AA J
x y
(46)
The performance behaviour of the machine at steady state was evaluated by loading themachine in AC magnetics in Quickfield software. The governing equation for the slip andtorque is given by (Appiah E.K. et al, 2013):
w w w= - +r s ss (47)
MATLAB Applications for the Practical Engineer230

The torque derivation of the FEA is given as:
1 (( )( . ) ( )( . ) ( )( . )2
= + -òsT rxH n B rxB n H rxn H B ds (48)
where r is a radius vector of the point of integration and n denotes the unit vector normal tothe surface.
The geometry of the whole machine was developed using the software package. Two boundaryconditions were used for this analysis within the entire structure: the Dirichlet’s boundarycondition for the outer layer of the machine structure and the homogeneous Neumannboundary condition for the change over from one geometry or medium to another such asfrom the core to the air-gap and vice versa. The automatic meshing of the machine geometrywhich is generated by the software and spread over the whole cross section is shown in figure6(a (i)). The field solution is now obtained by running the mesh geometry in the software solverby solving the Maxwell’s equation. The machine winding has been excited with balanced statorcurrents for no-load and full load conditions.
4. Simulation results
In this section, the simulation results for the three methods; the generalised theory of machine,the classical field, and the finite element analysis are presented. The dynamic performancebehaviour of the machine was determined using the derived mathematical modelling indqxy0102 (generalised theory), and implemented in Matlab/Simulink environment. Thissimulation results are generated in the Matlab/Simulink environment for the machineperformance characteristics, during normal operation and under fault conditions in loadedand unloaded conditions. The performance behaviour of the machine at steady state wasdetermined using the equivalent circuit, and the models implemented in Matlab for classicalfield analysis and Quickfield environment for FEA. The effect of slot opening on the magneticflux density distribution of the air-gap for the field and other results obtained from finiteelement analysis are shown in the remaining part of the section.
4.1. Magnetic flux density distribution of the classical field
To obtain the air-gap flux density distribution the permeance factor distribution, which reflectsthe effects of the slot openings, is superimposed on the flux density distribution. If saturationis to be accounted for, the B-H characteristics of the magnetic core would have been incorpo‐rated in the flux density distribution (Jimoh A. A., 1986). Figure 5 shows the permeance fluxdensity distribution and the air-gap flux density distribution, for the no load and the full loadconditions.
Modelling and Analysis of Higher Phase Order (HPO) Squirrel Cage Induction Machinehttp://dx.doi.org/10.5772/57468
231

conditions in loaded and unloaded conditions. The performance behaviour of the machine at steady state was determined using the equivalent circuit, and the models implemented in Matlab for classical field analysis and Quickfield environment for FEA. The effect of slot opening on the magnetic flux density distribution of the air-gap for the field and the finite element analysis are shown in the rest of the section.
4.1 Magnetic Flux Density Distribution of the Classical Field
To obtain the air-gap flux density distribution the permeance factor distribution, which reflects the effects of the slot openings, is superimposed on the flux density distribution. If saturation is to be accounted for the B-H characteristics of the magnetic core would have been incorporated in the flux density distribution (Jimoh A. A., 1986). Figure 5 shows the permeance flux density distribution and the air-gap flux density distribution, for the no load and the full load conditions.
(i) (ii)
Fig. 5. The plot of air-gap flux density (i) no-load, (ii) loaded conditions
4.2 Magnetic Flux Density Distribution of the FEA
In this section, the automatic meshing of the machine and the magnetic flux lines are shown in figure 6 (a).The colour map of the magnetic flux line shows that most of the portion of the yoke is under high flux density. The effect of slot opening on the magnetic flux density distribution of the air-gap is shown in figure 6 (b), for no-load and rated load condition. This is achieved by clicking the mid-air-gap of the whole geometry in Quickfield. The magnetic saturation of the materials is taken care of by the magnetization curve.
Figure 5. The plot of air-gap flux density (i) no-load, (ii) full load conditions
4.2. Magnetic flux density distribution of the FEA
In this section, the automatic meshing of the machine and the magnetic flux lines are shownin figure 6 (a).The colour map of the magnetic flux line shows that most of the portion of theyoke is under high flux density. The effect of slot opening on the magnetic flux densitydistribution of the air-gap is shown in figure 6 (b), for no-load and rated load condition. Thisis achieved by clicking the mid-air-gap of the whole geometry in Quickfield. The magneticsaturation of the materials is taken care of by the magnetization curve.
4.3. Steady state analysis
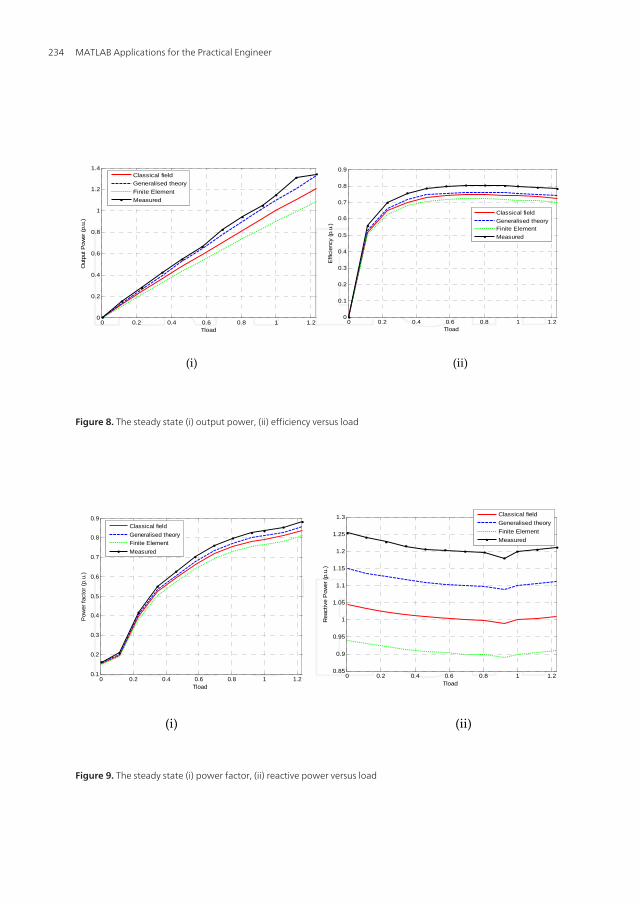
This section presents the results of the analysis of the machine in steady state for the threemethods; the generalised theory of machine, the classical field and the finite element analysis.For test performance under load condition the machine has been loaded to approximately125% of rated torque. The values obtained for torque, efficiency, input power, output power,power factor and reactive power were respectively plotted against the loading as shown infigures 7-9. Experimental measurements were also plotted on the same curve for validation ofthe theoretical work. The machine performance characteristics increase with increasing load.The range of loading of the machine from 0 to 0.2 per unit shows that the three scenarios understudy have the same effects until they begin to deviate from each other. However, the case ofthe reactive power is different in such that it deviates from each other from 0 to 125% of therated load. It is further observed during the load study that the reactive power at start is highbut decreases with loading and vice versa for the active power. The difference in deviationcould be so because of the rotor losses when the machine is being loaded. The effect of thereactive power at start gives a very poor power factor to the machine but the performanceimproves with loading. The experimental results validate the theoretical model and are plottedalongside those of the three methods.
MATLAB Applications for the Practical Engineer232

study have the same effects until they begin to deviate from each other. However, the case of the reactive power is different in such that it deviates from each other from 0 to 125% of the rated load. It is further observed during the load study that the reactive power at start is high but decreases with loading and vice versa for the active power. The difference in deviation could be so because of the rotor losses when the machine is being loaded. The effect of the reactive power at start gives a very poor power factor to the machine but the performance improves with loading. The experimental results validate the theoretical model and are plotted alongside those of the three methods.
(i) (ii)
Fig. 7. The steady state (i) electromagnetic torque, (ii) input power versus load
(i) (ii)
Fig. 8. The steady state (i) output power, (ii) efficiency versus load
0 0.2 0.4 0.6 0.8 1 1.20
0.5
1
1.5
Tload
Ele
ctro
mag
netic
Tor
que
(p.u
.)
Classical field
Generalised theoryFinite Element
Measured
0 0.2 0.4 0.6 0.8 1 1.20
0.2
0.4
0.6
0.8
1
1.2
1.4
Tload
Inpu
t P
ower
(p.
u.)
Classical field
Generalised theory
Finite Element
Measured
0 0.2 0.4 0.6 0.8 1 1.20
0.2
0.4
0.6
0.8
1
1.2
1.4
Tload
Out
put P
ower
(p.
u.)
Classical field
Generalised theory
Finite Element
Measured
0 0.2 0.4 0.6 0.8 1 1.20
0.1
0.2
0.3
0.4
0.5
0.6
0.7
0.8
0.9
Tload
Effic
ienc
y (p
.u.)
Classical field
Generalised theoryFinite Element
Measured
Figure 7. The steady state (i) electromagnetic torque, (ii) input power versus load
(i) (ii)
(a)
(i) (ii)
(b)
Fig. 6. (a) (i) mesh of the full geometry, (ii) magnetic flux lines, (b) (i) air-gap magnetic flux density distribution at no-load, (ii) air-gap magnetic flux density distribution at full load
4.3 Steady State Analysis
This section presents the results of the analysis of the machine in steady state for the three methods; the generalised theory of machine, the classical field and the finite element analysis. For test performance under load condition the machine has been loaded to approximately 125% of rated torque. The results of the plots of torque, efficiency, input power, output power, power factor and reactive power all versus loading, for the three methods and the experiment are as shown below in figures 7 - 9. The machine performance characteristics increase with increasing load. It is observed from the graph, that the generalised theory of machine have a higher performance of electromagnetic torque, input power, output power, efficiency, power factor and reactive power. This is followed by the classical magnetic field analysis and the finite element analysis in their respective order. The range of loading of the machine from 0 to 0.2 per unit shows that the three scenarios under
0 50 100 150 200 250 300 350-1.5
-1
-0.5
0
0.5
1
1.5
Position (Degrees)
Airg
ap F
lux
Den
sity
(T)
Flux Density
Average Flux Density
0 50 100 150 200 250 300 350-2
-1.5
-1
-0.5
0
0.5
1
1.5
2
Position (Degrees)
Airg
ap F
lux
Den
sity
(T)
Flux Density
Average Flux Density
Figure 6. (a) (i) mesh of the full geometry, (ii) magnetic flux lines, (b) (i) air-gap magnetic flux density distribution atno-load, (ii) air-gap magnetic flux density distribution at full load
Modelling and Analysis of Higher Phase Order (HPO) Squirrel Cage Induction Machinehttp://dx.doi.org/10.5772/57468
233
study have the same effects until they begin to deviate from each other. However, the case of the reactive power is different in such that it deviates from each other from 0 to 125% of the rated load. It is further observed during the load study that the reactive power at start is high but decreases with loading and vice versa for the active power. The difference in deviation could be so because of the rotor losses when the machine is being loaded. The effect of the reactive power at start gives a very poor power factor to the machine but the performance improves with loading. The experimental results validate the theoretical model and are plotted alongside those of the three methods.
(i) (ii)
Fig. 7. The steady state (i) electromagnetic torque, (ii) input power versus load
(i) (ii)
Fig. 8. The steady state (i) output power, (ii) efficiency versus load
0 0.2 0.4 0.6 0.8 1 1.20
0.5
1
1.5
Tload
Ele
ctro
mag
netic
Tor
que
(p.u
.)
Classical field
Generalised theoryFinite Element
Measured
0 0.2 0.4 0.6 0.8 1 1.20
0.2
0.4
0.6
0.8
1
1.2
1.4
Tload
Inpu
t P
ower
(p.
u.)
Classical field
Generalised theory
Finite Element
Measured
0 0.2 0.4 0.6 0.8 1 1.20
0.2
0.4
0.6
0.8
1
1.2
1.4
Tload
Out
put P
ower
(p.
u.)
Classical field
Generalised theory
Finite Element
Measured
0 0.2 0.4 0.6 0.8 1 1.20
0.1
0.2
0.3
0.4
0.5
0.6
0.7
0.8
0.9
Tload E
ffic
ienc
y (p
.u.)
Classical field
Generalised theoryFinite Element
Measured
Figure 8. The steady state (i) output power, (ii) efficiency versus load
(i) (ii)
Fig. 9. The steady state (i) power factor, (ii) reactive power versus load
4.4 Dynamic Analysis
Steady-state analysis is not always sufficient in determining the behaviour of an electrical machine. The behaviour of the machine under changing conditions is also necessary. The dynamic model will show the exact behaviour of the machine during transient and or dynamic periods. The derived voltage, flux linkage and mechanical equations for the squirrel cage six phase induction machine is implemented in Matlab/ Simulink as follows: (1) All partial differential variables are converted to integral variables. This concept is similarly applicable to the three phase case (Chee Mun Ong, 1998). (2) The flux linkage equations are resolved into state variables and current as dependent variables. (Ogunjuyigbe A.S.O., 2009), (Krause P.C., Wasynczuk O., et al, 2002). (1). All partial differential variables are converted to integral variables. This concept is similarly applicable to the three phase case (Chee Mun Ong, 1998). ((3) The entire equations are then modelled, implemented and simulated within the Matlab/Simulink environment.
4.4.1 Simulation of Healthy Machine
The dynamic and transient simulation of the six phase squirrel cage induction machine is done in the arbitrary reference frame. The Simulink representation of the model blocks are represented in figure 10 using the equations described in (5 to 24). The model is grouped into the power supply block and the whole machine system. The power supply block converts the machine variables from the balanced abcxyzs supply voltage to the dqxy0102 using the Park transformation matrix. This is used as an input to supply the squirrel cage induction machine which is modelled in the dqxy0102 reference frame. The simulation of these models is carried out with all the phases connected. Two scenarios: (1) at no load and (2) at rated load were investigated. The free acceleration characteristics under no-load and rated load are shown in figure 11.
The results in figure 11 show that the speed settles a little below synchronous speed at 314.1 rad/sec for the 50 Hz supply system. It is to be noted that the friction and the windage
0 0.2 0.4 0.6 0.8 1 1.20.1
0.2
0.3
0.4
0.5
0.6
0.7
0.8
0.9
Tload
Pow
er f
acto
r (p
.u.)
Classical field
Generalised theoryFinite Element
Measured
0 0.2 0.4 0.6 0.8 1 1.20.85
0.9
0.95
1
1.05
1.1
1.15
1.2
1.25
1.3
Tload
Rea
ctiv
e P
ower
(p.
u.)
Classical field
Generalised theory
Finite Element
Measured
Figure 9. The steady state (i) power factor, (ii) reactive power versus load
MATLAB Applications for the Practical Engineer234

4.4. Dynamic analysis
Steady-state analysis is not always sufficient in determining the behaviour of an electricalmachine. The behaviour of the machine under changing conditions is also necessary. Thedynamic model will show the exact behaviour of the machine during transient and or dynamicperiods. The derived voltage, flux linkage and mechanical equations for the squirrel cage sixphase induction machine is implemented in Matlab/ Simulink as follows:
1. All partial differential variables are converted to integral variables. This concept issimilarly applicable to the three phase case (Chee Mun Ong, 1998).
2. The flux linkage equations are resolved into state variables and current as dependentvariables. (Ogunjuyigbe A.S.O., 2009), (Krause P.C., Wasynczuk O., et al, 2002).
3. The entire equations are then modelled, implemented and simulated within the Matlab/Simulink environment.
4.4.1. Simulation of healthy machine
The dynamic and transient simulation of the six phase squirrel cage induction machine is donein the arbitrary reference frame. The Simulink model built using equations (5-24) is shown infigure 10. Figure 10a shows the complete model of the six-phase machine system, while thepower block is represented in Figure 10b. The power supply block converts the machinevariables from the balanced abcxyzs supply voltage to the dqxy0102 using the Park transfor‐mation matrix. This is used as an input to supply the squirrel cage induction machine whichis modelled in the dqxy0102 reference frame. The simulation of these models is carried out withall the phases connected. Two scenarios: (1) at no load and (2) at rated load were investigated.The free acceleration characteristics under no-load and rated load are shown in figure 11.
The results in figure 11 show that the speed settles a little below synchronous speed at 314.1rad/sec for the 50 Hz supply system. It is to be noted that the friction and the windage losseshave been neglected in this model and as such the speed is almost equal to the synchronousspeed. This effect is shown in the torque versus speed curve, and the speed versus time. Fromthe theoretical simulations, it is observed that the starting current is about 10.8 A as comparedto the rated current of 1.8 A. At the steady state settling of the current at no-load, the currentis not zero but is at 0.8 A. This accounts for the magnetizing current present in the machine atno-load. The speed versus time, torque versus speed curve characteristics and the waveformsof the two stator currents, phases a and x, are as shown in figure 11a. The machine settles intoa steady state at about 1.8 seconds.
Furthermore, the results of figure 11b show that the speed of the machine settles at rated loadto 293.194 rad/sec, corresponding to a slip of 0.07. The simulation was done by applying therated load of 1 pu at the time of 2.5 seconds, after the settling of the free oscillation at no-load.It is observed that the current immediately increased to show the presence of load. The speedversus time, torque versus speed curve characteristics and the waveforms of the two statorcurrents, phases a and x for sudden increase in load are as shown in figure 11b.
Modelling and Analysis of Higher Phase Order (HPO) Squirrel Cage Induction Machinehttp://dx.doi.org/10.5772/57468
235

(a)
(b)
Figure 10. The Simulink representation for the healthy six phase squirrel cage induction machine model (a) The mainblock, (b) The conversion from abcxyzs supply voltage to dqxy0102 block
MATLAB Applications for the Practical Engineer236
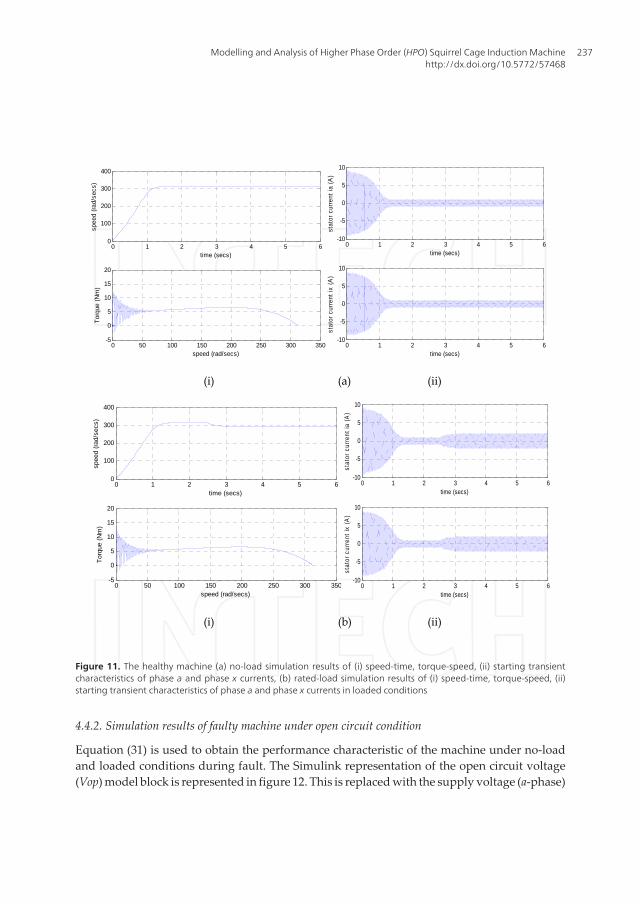
Figure 10: The Simulink representation for the healthy six phase squirrel cage induction machine model (a) The main block, (b) The conversion from abcxyzs supply voltage to
dqxy0102 block
(i) (a) (ii)
(i) (b) (ii)
Fig. 11. The healthy machine (a) no-load simulation results of (i) speed-time, torque-speed, (ii) starting transient characteristics of phase a and phase x currents, (b) rated-load
simulation results of (i) speed-time, torque-speed, (ii) starting transient characteristics of phase a and phase x currents in loaded conditions
4.4.2 Simulation Results of Faulty Machine under Open Circuit Condition
Equation (31) is used to obtain the performance characteristic of the machine under no-load and loaded conditions during fault. The Simulink representation of the open circuit voltage
0 1 2 3 4 5 60
100
200
300
400
time (secs)
spee
d (r
ad/s
ecs)
0 50 100 150 200 250 300 350-5
0
5
10
15
20
speed (rad/secs)
Tor
que
(Nm
)
0 1 2 3 4 5 6-10
-5
0
5
10
time (secs)
stat
or c
urre
nt ia
(A
)
0 1 2 3 4 5 6-10
-5
0
5
10
time (secs)
stat
or c
urre
nt ix
(A
)
0 1 2 3 4 5 60
100
200
300
400
time (secs)
spee
d (r
ad/s
ecs)
0 50 100 150 200 250 300 350-5
0
5
10
15
20
speed (rad/secs)
Tor
que
(Nm
)
0 1 2 3 4 5 6-10
-5
0
5
10
time (secs)
stat
or c
urre
nt ia
(A
)
0 1 2 3 4 5 6-10
-5
0
5
10
time (secs)
stat
or c
urre
nt ix
(A
)
Figure 11. The healthy machine (a) no-load simulation results of (i) speed-time, torque-speed, (ii) starting transientcharacteristics of phase a and phase x currents, (b) rated-load simulation results of (i) speed-time, torque-speed, (ii)starting transient characteristics of phase a and phase x currents in loaded conditions
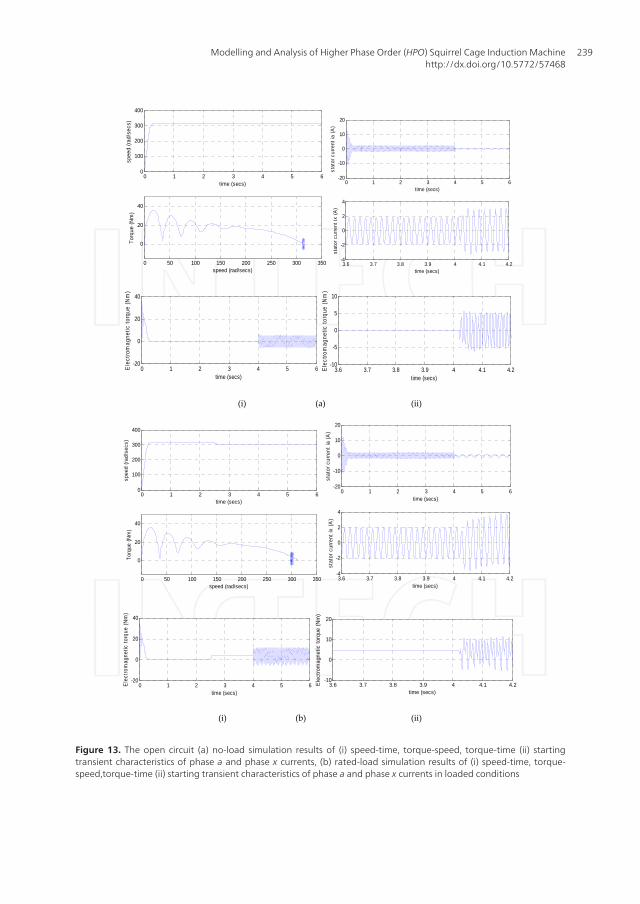
4.4.2. Simulation results of faulty machine under open circuit condition
Equation (31) is used to obtain the performance characteristic of the machine under no-loadand loaded conditions during fault. The Simulink representation of the open circuit voltage(Vop) model block is represented in figure 12. This is replaced with the supply voltage (a-phase)
Modelling and Analysis of Higher Phase Order (HPO) Squirrel Cage Induction Machinehttp://dx.doi.org/10.5772/57468
237

using a signal builder as a timer, via a multiport switch for the simulation. The fault was createdat a time 4 seconds, and the simulated results are shown in figure 13.
From the occurrence of fault at 4 seconds, the current in the faulty phase a is zero as expected.The amplitude of the oscillations in phase x rose to reach a constant value. Although there isno much significant change in speed during this period, the torque lead to oscillations as shownin the torque versus speed curve of figures 13a and 13b. This is true especially in loadedconditions when the amplitude of torque oscillations is nearly twice that observed in no loadconditions. During the full load condition the speed dropped from 314 to about 280 rad\secswhich is demonstrated in the step liked waveform in figure 13b. This created the oscillationsin the performance characteristics. Although the machine was able to run at the rated torqueunder fault, severe precautions must be taken into account in other not to damage the entirewinding of the machine. The speed versus time, torque versus speed, torque versus time curvesand the waveforms of the two stator currents, phases a and x are as shown in figures 13 a and13 b for no-load and rated load conditions respectively.
Figure 12. The Simulink representation for the unhealthy (open circuit) six phase squirrel cage induction machinemodel
MATLAB Applications for the Practical Engineer238
(i) (a) (ii)
(i) (b) (ii)
Fig. 13. The open circuit (a) no-load simulation results of (i) speed-time, torque-speed, torque-time (ii) starting transient characteristics of phase a and phase x currents, (b) rated-load simulation results of (i) speed-time, torque-speed,torque-
time (ii) starting transient characteristics of phase a and phase x currents in loaded conditions
0 1 2 3 4 5 60
100
200
300
400
time (secs)
spee
d (r
ad/s
ecs)
0 50 100 150 200 250 300 350
0
20
40
speed (rad/secs)
Tor
que
(Nm
)
0 1 2 3 4 5 6-20
-10
0
10
20
time (secs)
stat
or c
urre
nt ia
(A
)
3.6 3.7 3.8 3.9 4 4.1 4.2-4
-2
0
2
4
time (secs)
stat
or c
urre
nt ix
(A
)
0 1 2 3 4 5 6-20
0
20
40
time (secs)
Ele
ctro
mag
netic
tor
que
(Nm
)
3.6 3.7 3.8 3.9 4 4.1 4.2-10
-5
0
5
10
time (secs)
Ele
ctro
mag
netic
tor
que
(Nm
)
0 1 2 3 4 5 60
100
200
300
400
time (secs)
spee
d (r
ad/s
ecs)
0 50 100 150 200 250 300 350
0
20
40
speed (rad/secs)
Tor
que
(Nm
)
0 1 2 3 4 5 6-20
-10
0
10
20
time (secs)
stat
or c
urre
nt ia
(A
)
3.6 3.7 3.8 3.9 4 4.1 4.2-4
-2
0
2
4
time (secs)
stat
or c
urre
nt ix
(A
)
0 1 2 3 4 5 6-20
0
20
40
time (secs)
Ele
ctro
mag
netic
tor
que
(Nm
)
3.6 3.7 3.8 3.9 4 4.1 4.2-10
0
10
20
time (secs)
Ele
ctro
mag
netic
tor
que
(Nm
)
Figure 13. The open circuit (a) no-load simulation results of (i) speed-time, torque-speed, torque-time (ii) startingtransient characteristics of phase a and phase x currents, (b) rated-load simulation results of (i) speed-time, torque-speed,torque-time (ii) starting transient characteristics of phase a and phase x currents in loaded conditions
Modelling and Analysis of Higher Phase Order (HPO) Squirrel Cage Induction Machinehttp://dx.doi.org/10.5772/57468
239

4.4.3. Simulation results of faulty machine under short circuit condition
The short circuit voltage is achieved by making the supply voltages equal to zero by shortcircuiting two phases using the signal builder. The Simulink representation of the short circuitvoltage model blocks is represented in figure 14. For the theoretical analysis of short circuit, afault was created at 4 seconds for phases a and b after the machine started from standstill atno-load. The simulation of the rated load was done by applying the load at 2.5 seconds afterthe free oscillation settling of the no-load.
In this instance currents in both phase a and phase x are subject to oscillations having the sameimpact on the torque as in the open circuit fault but simply the amplitude of the oscillationsappearing is slightly greater. Conversely, the speed drops and oscillates around a certainaverage value. From the effects of the short circuit simulated below on the torque and speed,it is apparent that this is a case of the most severe fault. However, the performance of themachine is not critically affected. The results, shown in figure 15 are the speed versus time,torque versus speed, torque versus time curves and the waveforms of the two stator currents,phases a and x for no-load and rated load conditions.
Figure 14. The Simulink representation for the unhealthy (short circuit) six phase squirrel cage induction machinemodel
MATLAB Applications for the Practical Engineer240

(i) (a) (ii)
(i) (b) (ii)
Fig. 15. The shot circuit (a) no-load simulation results of (i) speed-time, torque-speed, (ii) starting transient characteristics of phase a and phase x currents, (b) rated-load simulation results of (i) speed-time, torque-speed, (ii) starting transient
characteristics of phase a and phase x currents in loaded conditions
0 1 2 3 4 5 60
100
200
300
400
time (secs)
spee
d (r
ad/s
ecs)
0 50 100 150 200 250 300 350
0
20
40
speed (rad/secs)
Tor
que
(Nm
)
0 1 2 3 4 5 6-20
-10
0
10
20
time (secs)
stat
or c
urre
nt ia
(A
)
3.6 3.7 3.8 3.9 4 4.1 4.2-10
-5
0
5
10
time (secs)
stat
or c
urre
nt ix
(A
)
0 1 2 3 4 5 6-20
0
20
40
time (secs)
Ele
ctro
mag
netic
tor
que
(Nm
)
3.6 3.7 3.8 3.9 4 4.1 4.2-20
-10
0
10
time (secs)
Ele
ctro
mag
netic
tor
que
(Nm
)
Figure 15. The shot circuit (a) no-load simulation results of (i) speed-time, torque-speed, (ii) starting transient charac‐teristics of phase a and phase x currents, (b) rated-load simulation results of (i) speed-time, torque-speed, (ii) startingtransient characteristics of phase a and phase x currents in loaded conditions
Modelling and Analysis of Higher Phase Order (HPO) Squirrel Cage Induction Machinehttp://dx.doi.org/10.5772/57468
241

5. Experimental validation
In order to validate the theoretical results with the experimental results, the experimental setup shown in figure 16 is utilised. The experimental results are used to validate the theoreticalmodel. The set up consists of an induction motor which was reconstructed to a six phasemachine, data acquisition equipment, torque transducer and computer system for waveformacquisition and a six phase supply. The machine performance at steady state has been plottedalongside the theoretic figures 7-9.
Figure 16. The six-phase experimental machine system
The dynamic simulations of the stator currents have been observed for the machine perform‐ance characteristics during normal operation and under fault conditions, both in loaded andunloaded conditions. These are shown in the figures 17 and 18. Given a fault condition, thecurrent drawn at full load under fault condition is higher than that of the no load. This meansthat operating the machine for a long period of time under full load fault without de-ratingcan damaged the machine winding. The good agreement, shown by the curves, betweentheoretical and experimental results tends to validate the model.
MATLAB Applications for the Practical Engineer242

5. Experimental Validation
In order to validate the theoretical results with the experimental results, the experimental set up shown in figure 16 is realised. The experimental results are used to validate the theoretical model. The set up consists of an induction motor which was reconstructed to a six phase machine, data acquisition equipment, torque transducer and computer system for waveform acquisition and a six phase supply. The machine performance at steady state has been plotted alongside the theoretical values as shown from figures 7-9.
Fig. 16. The six-phase experimental machine system
The dynamic simulations of the stator currents have been observed for the machine performance characteristics during normal operation and under fault conditions, both in loaded and unloaded conditions. These are shown in the figures 17 and 18 below. The current in the full load fault is higher than the one at the no-load fault. This means that operating the machine for a long period of time under full load fault without de-rating can damaged the machine winding. The good agreement, shown by the curves, between theoretical and experimental results tends to validate the model.
(i) (ii)
Fig. 17. The experimental results, (i) no-load, (ii) loaded condition
Figure 17. The experimental results, (i) no-load, (ii) loaded condition
(i) (ii)
Fig. 18. The experiment results, (i) no-load, (ii) loaded condition
6. Application Possibility in Electric Vehicles (EV) and Hybrid Electric Vehicles (HEV)
In view of the need to reduce the continued dependency on petroleum as a source of energy for powering cars and the drive to reduce CO2 emissions, EV/HEV has received huge research interest. The applications of HEV range from small cars to buses, and even trucks. Researchers are generally working towards developing more efficient drive systems for EV/HEV vehicles. With numerous different vehicle applications and requirements, it is clear that no single electric motor design fits all. As such motors designed for electric vehicle applications have to meet rigorous demands, with space limitations and the driving environment key factors. Reports of achievements has demonstrated that the specific performance characteristic of HPO machines matches the technical demands of HEV and also has the potential to further improve its quality. HPO machines finds application in areas where high power, high torque as well as high reliability is demanded. This is because it has a reduced amplitude and increased frequency of torque oscillation, reducing the rotor harmonic current per phase without increasing the voltage per phase, lowers the dc-link current harmonics, high fault tolerance (in the case of loss of one or more phases), reduction of required power rating per inverter leg and increase torque per ampere for the same volume of machine. HPO has been utilised also for integrated stator/alternator in HEV and ordinary vehicles with combustion engines Miller et al (2001) and Miller and Stefanovic (2002). The integrated idea replaced two electrical machines with a single machine and matches the goal of reducing the number of assemblies to have lighter vehicles. The major types of electric motors adopted for EV/HEV includes DC motor, Induction motor, permanent magnet motor and Switched reluctance motor. A general review of the state of the art in EV/HEV shows that cage induction motors and the permannet magnet motors are highly dominant, whereas, study on the use of DC motors are going down.
6.1 Comparative Study
6.1.1 DC Motor
DC motors have established presence in electric propulsion because their torque-speed characteristics suit traction requirement well and their speed controls are simple, Wildi (2004). However, dc motor drives have large assemblage, low efficiency, low reliability and continuous need of maintenance, mainly due to the presence of the mechanical commutator (brush). Contrary to this, the continuous development of rugged solid-state power semiconductors has made it increasingly practicable to introduce AC induction and synchronous motor drives that are mature to replace dc motor drive in EV/HEV /traction applications. The motors without commutator are attractive, as high reliability and maintenance-free operation are prime considerations for electric propulsion. Nevertheless, with regard to the cost of the inverter, ac drives are used generally just for higher power. At low power ratings, the dc motor is still more than an alternative (Zeraoulia, 2006).
Table 6.1: Evaluation of Electric Propulsion Systems (Zeraoulia, 2006)
Figure 18. The experiment results, (i) no-load, (ii) loaded condition
6. Application possibility in electric vehicles (EV) and hybrid electricvehicles (HEV)
In view of the need to reduce the continued dependency on petroleum as a source of energyfor powering cars and the drive to reduce CO2 emissions, EV/HEV has received huge researchinterest. The applications of HEV range from small cars to buses, and even trucks. Researchersare generally working towards developing more efficient drive systems for EV/HEV vehicles.With different vehicle applications and requirements, it is clear that no single electric motordesign fits all. As such motors designed for electric vehicle applications have to meet rigorous
Modelling and Analysis of Higher Phase Order (HPO) Squirrel Cage Induction Machinehttp://dx.doi.org/10.5772/57468
243
demands, with space limitations and the driving environment key factors. Reports of achieve‐ments has demonstrated that the specific performance characteristic of HPO machines matchesthe technical demands of HEV and also has the potential to further improve its quality. HPOmachines finds application in areas where high power, high torque as well as high reliabilityis demanded. This is because it has a reduced amplitude and increased frequency of torqueoscillation, reducing the rotor harmonic current per phase without increasing the voltage perphase, lowers the dc-link current harmonics, high fault tolerance (in the case of loss of one ormore phases), reduction of required power rating per inverter leg and increase torque perampere for the same volume of machine. HPO has been utilised also for integrated stator/alternator in HEV and ordinary vehicles with combustion engines Miller et al (2001) and Millerand Stefanovic (2002). The integrated idea replaced two electrical machines with a singlemachine and matches the goal of reducing the number of assemblies to have lighter vehicles.
The major types of electric motors adopted for EV/HEV includes DC motor, Induction motor,permanent magnet motor and Switched reluctance motor. A general review of the state of theart in EV/HEV shows that cage induction motors and the permannet magnet motors are highlydominant, whereas, study on the use of DC motors are going down.
6.1. Comparative study
6.1.1. Dc motor
DC motors have established presence in electric propulsion because their torque-speedcharacteristics suit traction requirement well and their speed controls are simple, Wildi(2004). However, dc motor drives have large assemblage, low efficiency, low reliability andcontinuous need of maintenance, mainly due to the presence of the mechanical commutator(brush).
Contrary to this, the continuous development of rugged solid-state power semiconductors hasmade it increasingly practicable to introduce AC induction and synchronous motor drives thatare mature to replace dc motor drive in EV/HEV /traction applications.
The motors without commutator are attractive, as high reliability and maintenance-freeoperation are prime considerations for electric propulsion. Nevertheless, with regard to thecost of the inverter, ac drives are used generally just for higher power. At low power ratings,the dc motor is still more than an alternative (Zeraoulia, 2006).
6.1.2. Induction motor
Cage induction motors has wide acceptance as a potential candidate for the electric propulsionof EV/HEVs based on their reliability, ruggedness, low maintenance, low cost, and the abilityto operate in a hostile environment. They are particularly well suited for the rigors of industrialand traction drive environments. Today, induction motor drive, Chris (2007) is the mostmature technology among various commutatorless motor drives.
The introduction of, as well as the level of development in the HPO machines has furtherstrengthened the position of Induction machine for electric propulsion in EV/HEV, particularly
MATLAB Applications for the Practical Engineer244
because of the possibility of high power, high torque and high torque per ampere for samevolume of machine.
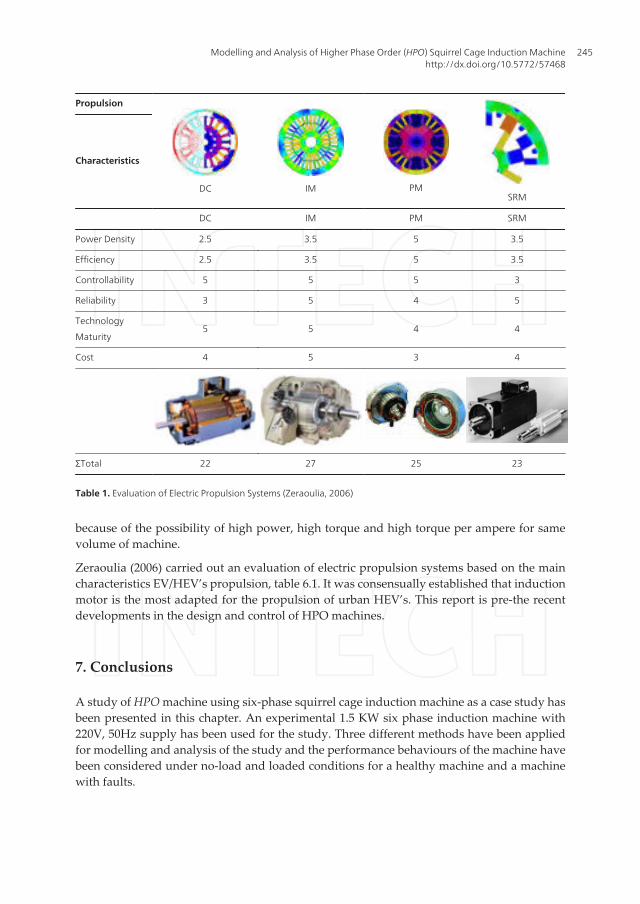
Zeraoulia (2006) carried out an evaluation of electric propulsion systems based on the maincharacteristics EV/HEV’s propulsion, table 6.1. It was consensually established that inductionmotor is the most adapted for the propulsion of urban HEV’s. This report is pre-the recentdevelopments in the design and control of HPO machines.
7. Conclusions
A study of HPO machine using six-phase squirrel cage induction machine as a case study hasbeen presented in this chapter. An experimental 1.5 KW six phase induction machine with220V, 50Hz supply has been used for the study. Three different methods have been appliedfor modelling and analysis of the study and the performance behaviours of the machine havebeen considered under no-load and loaded conditions for a healthy machine and a machinewith faults.
Propulsion
DC IM PMSRM
Characteristics
DC IM PM SRM
Power Density 2.5 3.5 5 3.5
Efficiency 2.5 3.5 5 3.5
Controllability 5 5 5 3
Reliability 3 5 4 5
Technology
Maturity5 5 4 4
Cost 4 5 3 4
ΣTotal 22 27 25 23
Table 1. Evaluation of Electric Propulsion Systems (Zeraoulia, 2006)
Modelling and Analysis of Higher Phase Order (HPO) Squirrel Cage Induction Machinehttp://dx.doi.org/10.5772/57468
245

The results obtained showed that in both healthy and unhealthy cases the machine is able toproduce the starting torque. However, it has been observed that the torque produced by thehealthy machine is greater in magnitude and produces fewer oscillations than the machinewith faults at the stator phases. The significant observation is that the machine settles downto a new steady state with the fault, thus confirming fault tolerance, albeit the performance ofthe signal variables is compromised.
The steady state performance of real power, reactive power, power factor, electromagnetictorque, the stator currents and efficiency have been shown. In the steady state results, theperformance characteristics obtained from the simulations were compared with the experi‐mental results, while the dynamic ones were similarly compared. While good agreements weregenerally observed the generalized theory gave closer result to the experiment than theclassical field and the finite element methods.
Author details
A.A. Jimoh1, E.K. Appiah1 and A.S.O. Ogunjuyigbe2
1 Tshwane University of Technology, Pretoria, South Africa
2 University of Ibadan, Ibadan, Nigeria
References
[1] Appiah E.K., Mboungui G., Jimoh A.A., Munda J.L. & Ogunjuyigbe A.S.O. 2013.Symmetrical Analysis of a Six-Phase Induction Machine under Fault Conditions. Pa‐per presented at the World Acadeny of Science Engineering and Technology, Brazil.
[2] Appiah E.K., Jimoh A.A., Mboungui G.&Munda J.L. “Effects of slot opening on theperformance of a six phase squirrel cage induction machine using Finite Element andField Analysis”, Paper Accepted and presented at the IEEE Africon Conference inMauritius, September 2013.
[3] Apsley J. & Williamson S. 2006. Analysis of Multiphase Induction Machines withWinding Faults. IEEE Transactions On Industry Applications, 42(2).
[4] Aroquiadassou G., Mpanda-Mbawe A., Betin F. & Capolino G. A. 2009. Six Phase In‐duction Machine Drive Model for Fault-Tolerant Operation. Paper presented at theIEEE Transactions. Retrieved
[5] Bianchi N. 2005. Electrical Machine Analysis using Finite Elements. CRC Press, Taylorand Francis Group.
MATLAB Applications for the Practical Engineer246

[6] Boldea I. & Tutelea L. 2010. Steady State, Transients, and Design with Matlab. CRCPress, Taylor & Francis Group.
[7] Ghuru B. S. & Hiziroglu H. R. 2005. Electromagnetic Field Theory Fundamentals. Cam‐bridge University Press.
[8] Jimoh A. A. 1986. Stray load losses in Induction Machine. Doctor of Philosophy,McMaster University, McMaster University.
[9] Jimoh A. A., Jac-Venter P. & Appiah E.K. (2012). Modelling and Analysis of SquirrelCage Induction Motor with leading Power factor Injection. Chapter in a book "InductionMotors - Modelling and Control", Edited by Prof. Rui Esteves Araújo, ISBN978-953-51-0843-6, Published by Intech: November 14, 2012 under CC BY 3.0 license,in subject Energy Engineering, Chapter 4, pp. 99-126.
[10] Krause P. C. & Thomas C.H. 1965. Simulation of Symmetrical Induction Machinery.Paper presented at the IEEE Transactions on Power Apparatus and Systems.
[11] Krause P. C., Wasynczuk O. & Sudhoff S.D. 2002. Analysis of Electrical Machineryand Drive Systems. In: University, P. (Ed.). Analysis of Electrical Machinery and DriveSystems. IEEE Power Engineering Society
[12] Levi E. 2006. Recent Developments in High Performance Variable-Speed MultiphaseInduction Motor Drives. Belgrade, SASA, Serbia: Sixth International Symposium Ni‐kola Tesla.
[13] Lipo T. A. 47907. A d-q model for Six Phase Induction Machines [Electronic Version].
[14] Ogunjuyigbe A.S.O. 2009. Improved Synchronous Reluctance Machine With DualStator Windings And Capacitance Injection. Doctor of Technology, A thesis submit‐ted to the Department of Electrical Engineering, Tshwane University of Technology.
[15] Pyrhonen T. P. & Val´Eria H. 2008. Design Of Rotating Machines. First Ed. UnitedKingdom: John Willey and Sons Limited.
[16] Singh G.K. & Pant V. 2000. Analysis of a Multiphase Induction Machine Under FaultCondition in a Phase-Redundant A.C. Drive System [Electronic Version]. 577-590.
[17] Yong-Le A., Kamper M. J. & Le Roux A. D. 2007. Novel Direct Flux and Direct Tor‐que Control of Six-Phase Induction Machine With Special Phase Current Waveforms.Paper presented at the IIEEE Transactions on Industry Applications.
[18] Chris;, M. 2007. Field-Oriented Control of Induction Motor Drives with Direct RotorCurrent Estimation for Application in Electric and Hybrid Vehicles Journal of ASIAelectric vehicles, 5(2):4.
[19] Wildi T. 2004. Electrical Machines, Drives, and Power Systems. Sixth Edition ed.: Pear‐son Prentice Hall.
Modelling and Analysis of Higher Phase Order (HPO) Squirrel Cage Induction Machinehttp://dx.doi.org/10.5772/57468
247

[20] Miller, J.M., Stefanovic, V., Ostovic, V. and Kelly, J., (2001), Design considerations foran automotive integrated starter-generator with pole-phase modulation, Proc. IEEEInd. Appl. Soc. Annual Meeting IAS, Chicago, Illinois, CD-ROM Paper 56_06.
[21] Miller, J.M. and Stefanovic, V., (2002), Prognosis for integrated starter alternator sys‐tems in automotive applications, Proc. Power Electronics and Motion Control Conf.PEMC, Cavtat, Croatia, CD-ROM Paper T5-001.
[22] M. Zeraoulia, IEEE, M.E.H. Benbouzid and D. Diallo (2006) Electric Motor Drive Se‐lection Issues for HEV Propulsion Systems: A Comparative Study, 1756 IEEE Trans‐actions On Vehicular Technology, Vol. 55, No. 6, November 2006.
MATLAB Applications for the Practical Engineer248
Copyright © 2022 FDOKUMEN