Motivational Externalism: Formulation, Methodology, Rationality and Indifference

I


Investigating Growth Prerequisites … 1
Investigating Growth Prerequisites in Organizations:
A Case Study in Finnish Polytechnic Institution of
Higher Education
Petri Nokelainen and Pekka Ruohotie
University of Tampere
Abstract
This study examines the factors of growth-oriented atmosphere
in a Finnish polytechnic institution of higher education (n =
447) with categorical exploratory factor analysis,
multidimensional scaling and Bayesian unsupervised model-
based visualization. The following four research questions
were considered: 1) Is the thirteen-factor model of the
growth-oriented atmosphere relevant to describe
organisational growth prerequisites?; 2) Does the empirical
sample support the four domain model of growth-oriented
atmosphere?; 3) To what extent employees’ position is
connected to growth motivation and commitment to the
organization?; 4) Is employee's nature of contract connected
to growth motivation and commitment to the organization?
Results showed that a thirteen-factor model of the growth-
oriented atmosphere was relevant to describe growth
prerequisites of Finnish polytechnic institution of higher
education employees. The theoretical four group
classification of the growth-oriented atmosphere factors was

Investigating Growth Prerequisites … 2
supported by the results: 1) Support and rewards from the
management; 2) Incentive value of the job; 3) Operational
capacity of the team; 4) Work related stress. Results further
showed that managers and teachers had higher growth
motivation and level of commitment to work than other
personnel including job titles such as cleaner, caretaker,
accountant and computer support. Employees across all job
titles in the organization, who have temporary or part-time
contracts, had higher self-reported growth motivation and
commitment to work and organization than their established
colleagues.
Keywords
Organizational growth, growth-oriented atmosphere,
polytechnic institution of higher education, survey,
categorical variable modeling, Finland
1. Introduction
Each one of us experiences his or her own working conditions
in a unique way that directly affects on one’s motivation and
satisfaction toward work. Attributes of work are, thus, to be
studied in real working context because substance of work and
organizational atmosphere are not independent factors. The
research paradigm associating studies explaining the growth
prerequisites of organizations emphasize individual’s own
perceptions and interpretations of ones work and working
conditions. In addition to the organizational growth

Investigating Growth Prerequisites … 3
prerequisites, professional updating is dependent on personal
growth requisites like the professional self-concept and
intensity of career motivation.
The Finnish education system consists of comprehensive
school, post-comprehensive general and vocational education,
higher education and adult education. Comprehensive school
provides a nine-year compulsory educational program for all
school-age children, beginning at the age of seven. Post-
comprehensive education is given by upper secondary schools
and vocational schools or institutes. The Finnish higher
education system consists of 20 universities and 31
polytechnic institution of higher educations. The higher
education system as a whole offers openings for 66 per cent
of the relevant age group (universities 29%, polytechnic
institution of higher educations 37%).
Polytechnic institution of higher educations have been part
of the Finnish school system now for only ten years. The
polytechnic institution of higher education evaluation
committee decided between 1992 - 1996, on the basis of the
fourteen evaluation criteria, which of two-hundred vocational
education institutions were promoted to polytechnic
institution of higher educations (Liljander, 2002a, p. 10).
This paper has two main goals. First, to present a
theoretical model of growth-oriented atmosphere and second,
to demonstrate its practical use as a measurement instrument
of growth prerequisites with different employee groups of a
Finnish polytechnic institution of higher education.

Investigating Growth Prerequisites … 4
Growth prerequisites are examined on the basis of a
fourteen dimensional theoretical model of growth-oriented
atmosphere developed by Ruohotie and Nokelainen (2000). The
organization investigated in this study received its
polytechnic institution of higher education status among the
first in 1996. We conducted the first survey investigating
growth prerequisites in the organization in 1998 (Ruohotie &
Nokelainen, 2000). This research paper reports the findings
of the second survey that was conducted in 2002.
Target population is the group of units about which
information is wanted, and a survey population is the group
of units that we are able to survey. Although the study
reported here is based on a non-probability sampling, we
believe that the polytechnic institution of higher education
investigated in this study represents all the other 30
organizations at least to some extent. We base our claim on
the fact that ten years ago all the Finnish vocational
institutions that aimed to become high schools had to meet
the same criteria (e.g., planning, function and goals of
education, curriculum, the development of evaluation and
feedback systems) evaluated by the same committee before they
were promoted.
The following four research questions are to be
considered. First, is the thirteen-factor model of the
growth-oriented atmosphere relevant to describe
organisational growth prerequisites? Second, does the
empirical sample support the four domain model of growth-

Investigating Growth Prerequisites … 5
oriented atmosphere? Third, to what extent employees’
position is connected to growth motivation and commitment to
the organization? Fourth, is employee's nature of contract
connected to growth motivation and commitment to the
organization?
The data analyses applied in this study are exploratory
factor analysis for categorical indicators (research question
1), multidimensional scaling (research question 2) and
Bayesian unsupervised model-based visualization (research
questions 3 and 4).
The paper is organized as follows: First we give condensed
up-to-date introduction to the theoretical model of growth-
oriented atmosphere. Ruohotie (1996, 2000a, 2000b) has
discussed the topic in more detailed level. Second, we
represent empirical results considering the four research
questions.
2. Growth Prerequisites in Organizations
Professional development includes all developmental
functions, which are directed at the maintenance and
enhancement of professional competency. In the modern world,
updating is, ideally, a continual, lifelong process that
addresses such goals as the acquisition of new and up-to-date
information, the development of skills and techniques and the
elevation of one’s personal esteem (Ruohotie, 1996). The
maintenance and enhancement of competency is subject to the
combined effect of many factors, ranging from personal traits

Investigating Growth Prerequisites … 6
to salient features of the work environment (Fishbein &
Stasson, 1990).
Maurer and Tarulli (1994) have identified the following
factors affecting the voluntary involvement of workers in
development activities: 1) Perceptions related to the working
environment; 2) perceptions and beliefs regarding the
benefits of development; 3) values and judgments; 4)
personality factors including: 4.1) identification with work;
4.2) the personal concept of career; 4.3) the need for self-
development; 4.4) self-efficacy.
2.1 Organizational Triggers
Changes in organizational structure, areas of responsibility
and tasks often require the development of new skills.
Individuals respond to such changes both effectively and
behaviourally according to their perception of their
circumstances, interpreting environmental events or
situational change on the basis of personal values and
perspectives.
Research conducted as part of the Growth Needs Project in
Finland show that the following factors are among the keys to
the creation and maintenance of growth and high innovative
capacity in an organization (Ruohotie, 1996).
Creation of a supportive culture: in a supportive environment
innovation becomes a natural part of everyday work. Tasks may
be intentionally defined in broad terms, encouraging change
and emphasizing the possibility of choice.

Investigating Growth Prerequisites … 7
Reward of development: in innovative organizations learning,
initiative and experiment are prized as inherently valuable.
Supportive and participative management: in innovative
organizations it is seen as the duty of management to create
a workplace where each individual can reach his or her full
potential.
Intensive communication: the more intensive the communication,
the more effectively new ideas and alternative points of view
can be shared and developed.
Security: in an era of intensifying competition, the
organizations that will survive and succeed are those where
there is a secure and confident atmosphere for employees. The
fear of failure, of blame or of criticism is an effective
damper to creative innovation.
Generating continuous enlivening innovation requires at least
two things of an organization: First, it must learn to fully
develop and utilize the capacity of its personnel, and
second, it must show imagination at all times, suspending
judgment temporarily when necessary in order to promote the
development of new ideas.
2.2 Work Role Triggers
Research results of the Growth Needs Project indicate that
motivational aspects of the work environment and the
individual’s opportunities to influence it correlate
positively with personnel motivation. Boring, repetitive and
dependent work discourages professional development and

Investigating Growth Prerequisites … 8
growth. Challenging, variable and independent work encourages
it (Ruohotie, 1996).
2.3 Personal Triggers
Events or stages connected to everything from personal
factors to life changes — for example, changes in family
relationships, health, age and so forth — can cause an
individual to reconsider his or her career priorities and
goals. In addition, according to Hall (1986, 1990) and
Ruohotie (1996), certain personal characteristics predispose
an individual to make changes in order to avoid the negative
consequences of work pressure or deal with personal
frustration at the status quo (i.e., basic personality
disposition, motivation for advancement, initiative, stress
on performance, hardiness, flexibility, tolerance of
ambiguity, independence).
2.4 Factors Contributing to Growth-oriented Atmosphere
Important factors in the development of growth orientation
are support and rewards from the management, the incentive
value of the job itself, the operational capacity of the team
and work related stress. Each of these can further be divided
into smaller individual factors.
Management and leaders face such challenges as how to
empower people, support the development of their professional
identity and how to create careers based on interaction. They
should also aim to develop, reward, set goals and evaluate

Investigating Growth Prerequisites … 9
learning in the organization. Successful leadership creates
commitment to the job and the organization.
The incentive value of the job depends on the
opportunities it offers for learning, for example, the
developing nature of the job. Therefore, essential factors
for professional growth are the developmental challenges, the
employees’ chances to influence, opportunities for the
collaborative learning and valuation of the job.
The operational capacity of a team or a group can be
defined by its members’ capability to operate and learn
together, by the work group co-operation and by the
reputation for effectiveness.
Work related stress might become an obstacle to
professional growth. Ambiguity, vagueness and role conflicts,
a too heavy mental load and demand for continual alterations
may stress people and damage the organizational atmosphere.
Negative stress quickly suppresses growth and development.
2.5 Theoretical Dimensions of Growth-oriented Atmosphere
In the earlier study dating back to 1998, Ruohotie and
Nokelainen (2000) examined the theoretical dimensions of a
growth-oriented atmosphere in the same organization as in the
current study. The organization consisted of ten
geographically separate units. The sample size was 318
employees, 66 per cent out of the survey population of 479
employees. The target population was Finnish polytechnic

Investigating Growth Prerequisites … 10
institution of higher education personnel in 1998 (N =
7,958).
Both male (n = 145) and female (n = 147) respondents’ group
sizes were almost identical (46%) with eight per cent (n = 27)
missing data. Respondents’ age was reported with four
classes: 20 to 29 year (5%, n = 17), 30 to 39 year (25%, n =
78), 40 to 49 year (37%, n = 120), and over 50 year (24%, n =
75) with nine per cent (n = 29) missing data. The job profile
contained three groups (7% of missing data): Managers (8%, n =
25), teachers (44%, n = 139) and other personnel, for example,
cleaner, caretaker, librarian, (41%, n = 131).
Although the non-response rate was quite high in this
study, the job title distribution of the sample (teachers:
44%, managers: 8%, other personnel: 41%, missing: 7%) was
parallel both to the survey population (teachers: 47%,
managers: 5%, other personnel: 48%) and target population
(teachers: 63%, managers: 5%, other personnel: 32%)
distributions derived from the public records.
The instrument utilized in the study contained 80
statements. The response options in a five-point summative
rating scale (a.k.a. ‘Likert scale’, see DeVellis, 2003, 78-
80) varied from 1 (strongly disagree) to 5 (strongly agree).
Ruohotie and Nokelainen (2000) constructed fourteen
summated scales (Hair, Anderson, Tatham & Black, 1995, p. 9)
to represent the theoretical dimensions of growth-oriented
atmosphere. The scales were formed on the basis of both
theoretical aspects and the results of exploratory factor

Investigating Growth Prerequisites … 11
analysis (Maximum likelihood with Varimax rotation). The
thirteen-factor solution was the most parsimonious
representing 67 per cent of the variance within the 80 items.
Eigenvalues were between 1.05 and 23.98. Respondents
indicated only moderate differences in preferences for
various dimensions as mean ratings ranged between 3.2 and
3.8. Internal consistency for each factor was estimated with
Cronbach’s alpha coefficient (1970, pp. 160-161). The alpha
values ranged from .77 to .93 (M = .84).
Although the authors report continuous parameters such as
mean and alpha on items measured with the non-metric ordinal
scale, we consider the results plausible as the underlying
phenomenon, a growth-oriented atmosphere is continuous by
nature (Marini, Li & Fan, 1996). Johnson & Creech (1983) have
studied with simulation studies the categorization error that
occurs when continuous variables are measured by indicators
with only a few categories. The results indicated that while
categorization error does produce distortions in multiple
indicator models, under most conditions explored the bias was
not sufficient to alter substantive interpretations. However,
authors warranted caution in the use of two-, three- or four-
category ordinal indicators, particularly when the sample
size is small. In the Ruohotie and Nokelainen (2000) study,
as well as in the present study, the ordinal scale has five
categories and the sample size to the number of the observed
variables ratio is acceptable according to empirical and

Investigating Growth Prerequisites … 12
simulation studies (Cattell, 1978; Gorusch, 1983; MacCallum,
Widaman, Zhang & Hong, 1999).
Ruohotie and Nokelainen (2000) found that growth-oriented
atmosphere generates togetherness and reflects on developing
leadership. Multidimensional scaling provided evidence to
conclude that factors representing the incentive value of the
job, commitment to work and organization, the clarity of the
job and growth motivation are the strongest indicators of
growth-oriented atmosphere. Ruohotie and Nokelainen (2000)
made the following conclusions based on their research
findings: 1) Teacher’s professional growth-motivation
reflects directly with task value on teacher-pupil
relationships and on achievement motivation; 2) Task value
has an effect on growth-oriented atmosphere; 3) Growth-
oriented atmosphere is the highest in work assignments that
offer challenging professional tasks (manager, teacher) and
lowest among other workers.

Investigating Growth Prerequisites … 13
3. Method
3.1 Sample
A non-probability sample included employees that worked in a
Finnish polytechnic institution of higher education during
the year 2002. The organization is the same as in the 1998
study (Ruohotie & Nokelainen, 2000), but as the organization
structure was re-arranged in 2000, the number of units has
dropped from ten to eight. Four hundred forty-seven
participants completed the questionnaire. The sample size is
87 per cent of the survey population of 512 workers,
indicating 13 per cent non-response rate. The target
population of Finnish polytechnic institution of higher
education personnel in 2002 was 9,661. Non-response error was
analyzed in the study by comparing job title distributions
(manager/teacher/other) between the sample and public
employee records. We conclude that the results of this study
are not fully but cautiously generalizable to the target
population of Finnish polytechnic institution of higher
educations, as the target organization's job distribution in
the survey population resembles the job distribution of
target population.
The average age of respondents’ in the sample was 39 years
(SD = 9.1, range 22 - 62). Respondents’ job profiles were as
follows (with 6%, n = 27 missing data): Teachers (48%, n =
215), managers (7%, n = 30) and other personnel (39%, n = 175).

Investigating Growth Prerequisites … 14
A majority of the respondents were established employees
(64%, n = 287), but the sample included also temporary (25%, n
= 109), and part-time (6%, n = 28) workers. Eighty per cent of
managers (n = 24) had established contracts and twenty per
cent (n =6) had a temporary contract. Over the half of the
teachers (67%, n = 143) had established contracts, twenty-one
(10%) had part-time, and forty-eight (22%) had temporary
contracts. Other personnel had the following contracts: 66
per cent (n = 115) established, three per cent (n = 6) part-
time and 29 per cent (n = 51) temporary, respectively.
3.2 Instrument
The Growth-oriented Atmosphere Questionnaire (GOAQ) used in
this study was a modified version of the one developed during
the Growth Needs project (Ruohotie, 1996). The theoretical
basis for the structure of the instrument elicited from the
works of Argyris (1972, 1992), Dubin (1977, 1990), Hall
(1986, 1990), and Kaufman (1974, 1990). The latest version of
the GOAQ is based on the research findings of the Growth
Needs Project’s previous research phase (Ruohotie &
Nokelainen, 2000). The original instrument contained 92 items
operationalizing fourteen latent dimensions. Each item was
measured in a five-point summative rating scale from 1
(strongly disagree) to 5 (strongly agree). According to the results
of exploratory factor analysis for categorical variables
(CEFA), the 67 strongest loading items were chosen to
describe the thirteen dimensions of the updated growth-
oriented atmosphere model (see Appendix). The dimension

Investigating Growth Prerequisites … 15
measuring students’ attitudes toward teacher in the 1998
study was dropped out in the current study as it is relevant
only for the teachers who represent only 48 per cent of the
sample. A demographics sheet was attached to the instrument
enquiring respondents’ position in the organization and
nature of the contract.
3.3 Procedure
The sample was obtained with non-probability sampling. Each
employee of the organization was personally invited via email
to complete an online version of the GOAQ. The online
questionnaire (Miettinen, Nokelainen, Kurhila, Silander &
Tirri, 2005) presented one to five questions at the same page
allowing respondents to attach an open comment to each
question.
Non-response error was analyzed by comparing the job
profiles of the sample with survey population (teachers: 48%,
managers: 6%, other personnel: 46%) and target population
distributions (teachers: 57%, managers: 9%, other personnel:
34%) derived from public records. Comparison of the job
profile distributions shows that the ‘other personnel’ group
is seven per cent underrepresented in the sample when
compared with the survey population. Teachers are nine per
cent underrepresented in the sample when compared with the
target population. The sample distribution of job profiles is
similar enough to survey and target population distributions
to represent Finnish polytechnic institution of higher
education personnel in this study.

Investigating Growth Prerequisites … 16
3.4 Data Analyses
Research questions in this study are addressed with
unsupervised multivariate data analysis methods that allow
ordinal indicators. Unsupervised methods (e.g., exploratory
factor analysis) discover variable structure from the
evidence of the data matrix as opposite to supervised methods
(e.g., discriminant analysis) that assume a given structure
(Venables & Ripley, 2002, p. 301). Unsupervised methods are
further divided into four sub categories: 1) Visualization
methods, 2) cluster analysis, 3) factor analysis and 4)
discrete multivariate analysis.
The first research question is investigated with
exploratory factor analysis for categorical indicators
(CEFA), that is implemented in Mplus (Muthén & Muthén, 2001),
and Spearman nonparametric rank-order correlations. The use
of CEFA has two major advantages over traditional exploratory
factor analysis. First, it allows the use of ordinal
indicators as it is based on the categorical variable model
developed by Bengt Muthén (1993). Second, it does not require
multivariate normality as it applies the general asymptotic
distribution free function instead of the usual maximum
likelihood estimator (Muthén & Muthén, 2001).
The other three research questions are investigated in this
paper with non-linear visualization methods. According to
Venables and Ripley (2002), visualization methods are often
more effective than clustering methods discovering
interesting groupings in the data, and they avoid the danger

Investigating Growth Prerequisites … 17
of over-interpretation of the results as researcher is not
allowed to input number of expected latent dimensions. In
cluster analysis the centroids that represent the clusters
are still high dimensional, and some additional illustration
methods are needed for visualization (Kaski, 1997), for
example multidimensional scaling (Kim, Kwon & Cook, 2000). We
apply in this study non-linear visualization methods as they
are capable of analyzing both linear and non-linear
dependencies between variables under investigation.
4. Results
Fred Kerlinger (1986) classified weaknesses of rating scales
into extrinsic and intrinsic. Extrinsic defect is that scales
are way too easy to construct and use. Sometimes a scale is
used to measure things that it is not designed to measure.
This point was addressed with a pilot study of 12 respondents
and an interview of the organizations development manager.
The online questionnaire that was used for the pilot study
was the near-final version allowing respondents to attach an
open comment to each question. This procedure is quite close
to what Fowler (1995, pp. 130-131) calls ‘field pre-test with
observation’ as with an online questionnaire we are able to
ask item-specific comments and even track answering times for
each item. The comments from the pilot study and interview
were analyzed and wordings improved where necessary. The item
structure from the pilot study was analyzed with Bayesian
dependency modeling that is computationally robust also with

Investigating Growth Prerequisites … 18
small sample sizes. Results of the pilot study showed, for
example, that the term ‘manager’ was not clear to all the
respondents. Further, some of them did not understand the
difference between ‘management’ and ‘manager’. We solved this
problem by adding clear definitions of the terms in the
opening page of the questionnaire.
According to Kerlinger (1986, p. 495), intrinsic defect of
rating scales is their proneness to constant error. He lists
four main sources: Halo effect, error of severity (to rate
all items too low), error of leniency (to rate all items too
high) and error of central tendency (to avoid all extreme
judgments). To examine intrinsic defect we analyzed the
overall response tendency. Results show that the respondents
used the whole scale from 1 (totally disagree) to 5 (totally agree)
for all the items but one. The scale for item v82 (“I find
self-improvement useful”) range from 2 to 5. Mode frequencies
that sum up to the number of items in the questionnaire were
as follows: 1) strongly disagree, n = 0, 2) n = 9; 3) n = 27;
4) n = 54; 5) strongly agree, n = 2. This result is as overall
distribution of the modes on a five-point summative rating
scale is unimodal and only slightly biased towards positive
values.
4.1 Research Question 1: Relevance of the thirteen-factor GOA model
Exploratory factor analysis for categorical indicators was
conducted to solve the first research question: Is the
thirteen-factor model of the growth-oriented atmosphere
relevant to describe organisational growth prerequisites? In

Investigating Growth Prerequisites … 19
technical terms, our goal is to find the most relevant
factorial structure for observed variables measuring growth-
oriented atmosphere.
The GOAQ items were subject to categorical exploratory
unweighted least squares factor analysis with Varimax
rotation. An initial estimation yielded 14 factors with
eigenvalues exceeding unity, accounting for 73 per cent of
the total variance. Thirteen-factor Varimax-rotated solution,
accounting for 71 per cent of the total variance was found to
be most interpretable in terms of meaningful clusters and
correspondence to both theoretical and empirical findings of
our previous research work. The root mean square residuals
(RMSR) help the investigator to examine how well the aspects
of the data are captured by the model (Loehlin, 2004, p. 70).
RMSR value of .03 was well below a cut-off value of .08 (Hu &
Bentler, 1999). Figure 1 presents the thirteen-factor model
of the growth-oriented atmosphere. The individual items
related to the dimensions are presented in the Appendix.
-- Insert Figure 1 about here --
Dimensions derived from the factor analysis are strongly
related to each other as the correlation coefficients
presented in Table 1 are significant at the .01 level (two-
tailed). Spearman bivariate coefficients range between .81
and -.52. The average of all coefficients is .26 and the
average of total variance explained is seven per cent. Closer

Investigating Growth Prerequisites … 20
examination of the coefficients reveals, as expected, that
Growth motivation (GRM) is not affected by Strategic
leadership (STR), Know-how rewarding (REW) or Build-up of
work requirements (BUI). It is also noteworthy to mention
that Psychic stress of the job (PSY) has the only positive
correlation with Build-up of work requirements.
-- Insert Table 1 about here --
Growth prerequisites of a polytechnic institution of
higher education can be described with the help of the
thirteen dimensions that are presented in Table 2. Students’
attitude to teacher dimension that was present in the earlier
solution of Nokelainen and Ruohotie (2000) was omitted from
this model due to theoretical and technical reasons.
Theoretical reason was that the factor is too tightly related
to teaching, making it an irrelevant dimension for those
employees who do not teach, for example, managers and other
personnel. The second, more technical point favoring
rejection of the factor was that the items operationalizing
the dimension were not selective enough and the full scale
was not in use.
Internal consistency measures estimate how consistently
individuals respond to the items within a scale. Reliability
is, thus, a characteristic of the data in hand, and not of
the test (Thompson, 1998). Table 2 shows both lower
(Cronbach’s alpha) and upper bound (Tarkkonen’s reliability,

Investigating Growth Prerequisites … 21
see Vehkalahti, 2000) of such measures. The scores in our
study range from .75 to .97 (Cronbach’s alpha) and from .79
to .97 (Tarkkonen’s reliability). The most reliable factor
was Encouraging leadership (ENC). This finding is partly due
to fact that alpha values tend to get larger as the number of
items grows (ENC was measured with 15 items as the other
dimensions had three to seven items).
-- Insert Table 2 about here --
4.2 Research Question 2: Validity of the four group classification of GOA factors
Non-metric multidimensional scaling was conducted in order to
answer the second research question: Does the empirical
sample support the four domain model of growth-oriented
atmosphere? In technical terms, we examine what is the
geometric two-dimensional structure of the components
operationalizing growth-oriented atmosphere.
Figure 2 represents the structure of two dimensional
distance measures between cases in our growth-oriented
atmosphere data set. Euclidean distance as dissimilarity
measure and distance scaling model was applied for ordinal
data. First dimension classifies components into two groups.
First group contains factors representing operational
capacity of the team: Growth motivation (GRM), Incentive
value of the job (INV) and Team spirit (TES). Factors in the
second group are connected to supporting and rewarding
management: Rewarding for know-how (REW), Strategic

Investigating Growth Prerequisites … 22
leadership (STR), and Clarity of the job (CLA). Second
dimension is related to the supportive value of the job. Third
group of factors in Figure 2 represent the lack of it
(Psychic stress of the job, PSY, and increase in the
workload, BUI). Fourth group of factors (Encouraging
leadership, ENC, Valuation of the job, VAL, Know-how
developing, DEV, Commitment to work and organization, COM and
Community spirit, COS) represent the positive end of the
scale. (Figure 2.)
-- Insert Figure 2 about here --
Examination of the coordinates for scaling Euclidean
dimensions in two-dimensional space shows that Growth
motivation (1.3945) and Incentive value of the job (1.1274)
are the strongest components on the positive end of the first
dimension and Psychical stress of the job (-2.4731) is
strongest on the negative end together with Rewarding of
know-how (-1.5332), and Strategic leadership (-1.4983).
STRESS value (.049) indicates that the model fits to the data
reasonably well. This result together with visual examination
of the Figure 2 verifies the earlier research finding
suggesting that Encouraging leadership (ENC) and Commitment
to work and organization (COM) are closely situated in the
visual space, but in different dimensions.

Investigating Growth Prerequisites … 23
4.3 Research Question 3: Position and the nature of contract as predictors of
growth motivation
Bayesian model-based visualization is applied in this study
to investigate the third research question: To what extent
employees’ position and the nature of contract are connected
to growth motivation? With Bayesian unsupervised model-based
visualization we may concentrate on singular summary factors
and study each ones distribution dynamically.
Figure 3 is a visualization of the Bayesian network model.
The window has following elements: Main window, attribute
selection window (upper left corner), low profile window
(lower left corner), initial profile window (lower right
corner), and high profile window (upper right corner). Main
window contains the model in which each dot stands for one
respondent (n = 447). Attribute selection window shows the
current component of interest and its discretization (i.e.,
the classes of data). In Figure 3, the component of interest
is growth motivation (KM_GRM). Low profile window shows the
distribution of examined variables when sub sample represents
the lowest values of the component, high profile window has
the same functionality for the high end sub sample. Initial
profile window shows the initial distribution of the examined
variables. Thin bars in profile window represent initial
values, thick bars values of the current sub sample.
Attribute selection window in the upper left part of
Figure 3 shows that growth motivation scale is quite biased
and thus the upper bound for the lowest category is 3.55.

Investigating Growth Prerequisites … 24
However, inspection of the values in high-scale profile
window and high scale sub sample frame gives evidence that
managers and teachers has distinguished representation in the
highest category of growth motivation as the thick bar is
taller than the thin bar that indicates the average value. It
is interesting to observe that those respondents with the
most insecure contracts, namely temporary and part-time, have
higher growth motivation than their established colleagues.
(Figure 3.)
-- Insert Figure 3 about here --
4.4 Research Question 4: Position and the nature of contract as predictors of
commitment to the organization
The fourth research question is to study to what extent
employees’ position and the nature of contract is connected
to his or her commitment to the organization. Attribute
selection window in the upper left part of Figure 4 shows
that scale for commitment to work and organization is
balanced: Upper bound for the lowest category is 2.92 and
lower bound for the highest category is 4.76. Values in high-
scale profile window and high scale sub sample frame suggest
that managers and teachers have the highest level of
commitment to work as the thick bar is taller than the thin
bar indicating the average value. This result is parallel
with our earlier research findings (Ruohotie & Nokelainen,

Investigating Growth Prerequisites … 25
2000). Commitment to work and organization is highest among
those respondents with the most insecure contracts. (Figure
4.)
-- Insert Figure 4 about here --
5. Conclusion
We have examined in this paper dimensions of growth-oriented
atmosphere in a Finnish polytechnic institution of higher
education with categorical exploratory factor analysis,
classical multidimensional scaling and Bayesian unsupervised
model-based visualization.
Thirteen-dimension Varimax-rotated solution in the
categorical factor analysis was found to be interpretable in
terms of meaningful clusters and correspondence to both
theoretical and empirical findings of previous research
(Ruohotie & Nokelainen, 2000).
Results of two-dimensional scaling showed that the
components on the negative end of the first dimension
represent operational capacity of the team. Components on the
positive end of the first dimension are related to supporting
and rewarding management. Second dimension visualized work-
related stress; the most components with the most negative
coordinates were psychical stress of the job and increase in
the demands of the work. Rewarding for know-how, clarity of
the job assignments, and encouraging leadership represented
the positive polarity of the second dimension. Research

Investigating Growth Prerequisites … 26
evidence suggests that the psychic stress caused by the work
affects increasingly to the build-up of work requirements.
6. Discussion
The findings of a previous study (Ruohotie & Nokelainen,
2000) conducted in the same domain suggested that growth-
oriented atmosphere generates togetherness and reflects on
developing leadership. Multidimensional scaling and Bayesian
unsupervised model-based visualization both provided evidence
to conclude that factors representing encouraging leadership
and commitment to work and organization are closely situated
in, but in different dimensions. Results further showed that
managers and teachers had the highest growth motivation and
level of commitment to work. Employees across all job titles
in the organization with temporary or part-time contracts,
had higher self-reported growth motivation and commitment to
work and organization than their established colleagues.
A recent study among 131 employees of a U.S. restaurant
chain showed that conscientiousness was the best predictor of
job performance against work experience, psychological
climate and work effort (Byrne, Stoner, Thompson &
Hochwarter, 2005). Results indicated that being conscientious
might not be enough to secure the highest levels of
performance unless the individual is concurrently willing to
work hard, and is a member of a psychologically secure work
setting. Majority of the sample worked part-time (82% versus
18% full-time). Work effort is related to following GOA

Investigating Growth Prerequisites … 27
dimensions: Valuation of the Job (VAL), Commitment to Work
and Organization (COM) and Clarity of the Job (CLA).
According to Nokelainen, Ruohotie, Tirri & Silander
(2002), encouraging leadership could be used as an indicator
for empowerment (Walsh, Bartunek & Lacey, 1998; Spreitzer,
DeJanasz & Quinn, 1999). We will focus our future studies on
the relationship between Commitment to work and Strategic
leadership, Incentive value of the job, Valuation of the job,
and Psychical stress of the job.

Investigating Growth Prerequisites … 28
References
Argyris, C. (1972). The Applicability of Organizational Society. London.
Argyris, C. (1992). On Organizational Learning. Cambridge, Mass.:
Blackwell Publishers.
Byrne, Z. S., Stoner, J., Thompson, K. R., & Hochwarter, W.
A. (2005). The interactive effects of conscientiousness,
work effort, and psychological climate on job performance.
Journal of Vocational Behavior, 66, 326-338.
Cattell, R. B. (1978). The scientific use of factor analysis in behavioral
and life sciences. New York, NY: Plenum Press.
Cronbach, L. J. (1970). Essentials of Psychological Testing. Third
edition. New York, NY: Harper & Row.
DeVellis, R. F. (2003). Scale Development. Theory and Applications.
Second edition. Thousand Oaks, CA: Sage.
Dubin, S. (1977). The Updating Process. Continuing Education in
Science and Engineering, 12, 165-186.
Dubin, S. (1990). Maintaining Competence through Updating. In
S. Willis & S. Dubin (Eds.), Maintaining Professional Competence
(pp. 9-43). San Francisco: Jossey–Bass.
Fishbein, M., & Stasson, M. (1990). The Role of Desires,
Self-predictions, and Perceived Control in the Prediction
of Training Session Attendance. Journal of Applied Social
Psychology, 20, 173-198.
Fowler, F. J., Jr. (1995). Improving survey questions. Design and
Evaluation. Thousand Oaks, CA: Sage.

Investigating Growth Prerequisites … 29
Gorusch, R. (1983). Factor Analysis. Second edition. Hillsdale,
NJ: Lawrence Erlbaum Associates.
Hair, J. F., Anderson, R. E., Tatham, R. L., & Black, W. C.
(1995). Multivariate Data Analysis. Fourth edition. Englewood
Cliffs, NJ: Prentice Hall.
Hall, D. T. (1986). Breaking Career Routines: Mid-career
Choice and Identity Development. In D. T. Hall (Ed.),
Career Development in Organizations (pp. 120-159). San Francisco:
Jossey-Bass.
Hall, D. T. (1990). Career Development Theory in
Organizations. In D. Brown, L. Brooks & Associates (Eds.),
Career Choice and Development (pp. 422-454). San Francisco:
Jossey-Bass.
Hu, L., & Bentler, P. (1999). Cut-off criteria for fit
indexes in covariance structure analysis: conventional
criteria versus new alternatives. Structural Equation Modeling,
6(1), 1-55.
Johnson, D. R., & Creech, J. C. (1983). Ordinal Measures in
Multiple Indicator Models: A Simulation Study of
Categorization Error. American Sociological Review, 48, 398-407.
Kaski, S. (1997). Data exploration using self-organizing maps. Acta
Polytechnica Scandinavica, Mathematics, Computing and
Management in Engineering Series No. 82. Espoo: Finnish
Academy of Technology.
Kaufman, H. (1974). Obsolescence and Professional Career Development.
New York: AMACOM.

Investigating Growth Prerequisites … 30
Kaufman, H. (1990). Management Techniques for Maintaining a
Competent Professional Work Force. In S. Willis & S. Dubin
(Eds.), Maintaining Professional Competence (pp. 249-261). San
Francisco: Jossey-Bass.
Kerlinger, F. (1986). Foundations of Behavioral Research. Third
Edition. New York: CBS College Publishing.
Kim, S.-S., Kwon, S., & Cook, D. (2000). Interactive
Visualization of Hierarchical Clusters Using MDS and MST.
Metrika, 51(1), 39-51.
Liljander, J.-P. (2002). AMK-uudistus. [Polytechnic
institution of higher education reform]. In J.-P.
Liljander (Ed.), Omalla Tiellä [On One’s Own Road] (pp. 10-
20). Helsinki: Edita.
Loehlin, J. C. (2004). Latent Variable Models. Fourth edition.
Mahwah, NJ: Lawrence Erlbaum Associates.
MacCallum, R. C., Widaman, K. F., Zhang, S., & Hong, S.
(1999). Sample size in factor analysis. Psychological Methods,
4, 84-99.
Marini, M., Li, X., & Fan, P. (1996). Characterizing Latent
Structure: Factor Analytic and Grade of Membership Models.
Sociological Methodology, 1, 133-164.
Maurer, T., & Tarulli, B. (1994). Investigation of Perceived
Environment, Perceived Outcome, and Person Variables in
Relationship to Voluntary Development Activity by
Employees. Journal of Applied Psychology, 79(1), 3-14.

Investigating Growth Prerequisites … 31
Miettinen, M., Nokelainen, P., Kurhila, J., Silander, T., &
Tirri, H. (2005). EDUFORM — A Tool for Creating Adaptive
Questionnaires. International Journal on E-Learning, 4(3), 365-373.
Muthén, B. O. (1993). Goodness of fit with categorical and
other non-normal variables. In K. A. Bollen & J. S. Long
(Eds.), Testing Structural Equation Models (pp. 205-243). Newbury
Park, CA: Sage.
Muthén, L. K., & Muthén, B. O. (2001). Mplus user's guide. Second
edition. Los Angeles, CA: Muthén & Muthén.
Nokelainen, P., Ruohotie, P., Tirri, H., & Silander, T.
(2002, September). Empowerment - modeling the prerequisites of change
and growth with Bayesian networks. Paper presented at the European
Conference on Educational Research (ECER), Lisbon,
Portugal.
Ruohotie, P. (1996). Professional Growth and Development. In
K. Leithwood, S. Chapman, D. Carson, P. Hollinger, & A.
Hart (Eds.), International Handbook of Educational Leadership and
Administration (pp. 419-445). Dordrecht: Kluwer Academic
Publishers.
Ruohotie, P. (2000a). Conative Constructs in Learning. In P.
Pintrich & P. Ruohotie (Eds.), Conative Constructs and Self-
regulated Learning (pp. 1-31). Vancouver: Career Development
Centre.
Ruohotie, P. (2000b). Some Instructional Issues of Lifelong
Learning. In B. Beairsto & P. Ruohotie (Eds.), Empowering
Teachers as Life-long Learners (pp. 5-29). Hämeenlinna: RCVE.

Investigating Growth Prerequisites … 32
Ruohotie, P., & Nokelainen, P. (2000). Beyond the Growth-
oriented Atmosphere. In B. Beairsto & P. Ruohotie (Eds.),
Empowering Teachers as Lifelong Learners (pp. 147-167).
Hämeenlinna: RCVE.
Spreitzer, G., DeJanasz, S., & Quinn, R. (1999). Empowered to
lead: The role of psychological empowerment in leadership.
Journal of Organizational Behavior, 20, 511-526.
Thompson, B. (1998, April). Five Methodology Errors in Educational
Research: The Pantheon of Statistical Significance and Other Faux Pas.
Invited address presented at the annual meeting of the
American Educational Research Association, session 25.66.
San Diego. Retrieved 10 April 2008 from:
http://www.coe.tamu.edu/%7Ebthompson/aeraaddr.htm.
Tracey, J., Tannenbaum, S., & Kavanagh, M. (1995). Applying
Trained Skills on the Job: The Importance of the Work
environment. Journal of Applied Psychology, 80(3), 239-252.
Vehkalahti, K. (2000). Reliability of measurement scales. Statistical
Research Reports 17. Finnish Statistical Society.
Retrieved 10 April 2008 from
http://ethesis.helsinki.fi/julkaisut/val/tilas/vk/vehkalah
ti.
Venables, W. N., & Ripley, B. D. (2002). Modern Applied Statistics
with S. Fourth edition. New York: Springer.
Walsh, K., Bartunek, J., & Lacey, C. (1998). A Relational
Approach to Empowerment. Journal of Organizational Behavior, 5,
103-126.

Appendix
The Growth-oriented Atmosphere QuestionnaireData
(n = 447)Item Median ModeFactor 1: Encouraging leadership (ENC)v5. My manager is friendly and easily approachable. 4.0 5v6. My manager pays attention to my suggestions and wishes. 4.0 5v7. My manager works with a team to find solutions. 4.0 4v8. My manager is fair. 4.0 5v9. The employees in my organization are encouraged to develop new working methods and to think creatively. 4.0 4v10. My manager trusts his or her staff and allows them to work independently. 4.0 5v11. The organization promotes self-reliance and employees are encouraged to find new and improved workingmethods. 4.0 4v13. The managers are interested in the wellbeing of staff. 3.0 4v14. The management strives to improve the working conditions of staff. 4.0 4v15. My goals were agreed in co-operation with my manager. 4.0 4v23. Failures are dealt with in a constructive manner andemployees are encouraged to learn from their mistakes. 3.0 3v25. My manager has supported me in the past. 4.0 4v26. My manager knows how to tap into the differing characteristics within the workforce. 3.0 4v27. My manager has succeeded in strengthening the sense of unity in the workplace. 3.0 3v90. This organisation values me as an individual. 4.0 4Factor 2: Strategic leadership (STR)v1. The management of my organization provides a clear direction and highlights the key points in education. 3.0 3v2. The management of my organization expresses and enforces accepted values both in spoken form and through its example. 3.0 3v3. The management of my organization embodies distinct values and a clearly defined style of leadership. 3.0 3v4. The management of my organization observes the latesteducational developments and uses this information when
3.0 3

planning the organization’s activities.Factor 3: Know-how rewarding (REW)v20. It is rewarding to achieve my goals. 2.0 1v21. The organization rewards its employees’ professionalknowledge and skills. 2.0 1v22. Employees with increased knowledge are given extra responsibility. 3.0 3v24. The organization rewards employees for tackling demanding tasks. 3.0 3Factor 4: Know-how developing (DEV)v37. The organization endeavours to always use the latestknowledge in the field. 4.0 4v38. The organization’s employees are given training to increase their professional skills. 3.0 4v39. The organization takes an active interest in its employees’ professional growth. 3.0 3v40. The staff is given the latest information and professional literature. 4.0 4v41. I am given the chance to learn new things and improve myself. 4.0 4Note. Data = Employees’ of a Finnish polytechnic institution of higher education. A five-point summative rating scale ranging from 1 (strongly disagree) to 5 (strongly agree) was used.

The Growth-oriented Atmosphere Questionnaire (continued)Data
(n = 447)Item Median ModeFactor 5: Incentive value of the job (INV)v28. I can work independently and without restrictions. 4.0 4v29. I can use my skills at work in a variety of ways. 4.0 4v30. My work consists of various differing tasks. 4.0 5v31. My work gives me a sense of success and achievement. 4.0 4v32. My work gives me personal satisfaction. 4.0 4Factor 6: Clarity of the job (CLA)v46. A clear division of tasks exists between members of teaching staff. 3.0 4v47. The organization’s decision making structure is transparent. 3.0 3v48. The organization’s goals are transparent. 3.0 4v49. The teachers know exactly what their colleagues expect of them. 3.0 3Factor 7: Valuation of the job (VAL)v42. My manager appreciates my work. 4.0 4v43. I am given encouraging feedback on my work. 3.0 4v45. I feel that my work is valued. 4.0 4Factor 8: Community spirit (COS)v54. The organization’s staff feels personally responsible for achieving their goals. 4.0 4v55. The staff maintains a demand for high performance. 4.0 4v56. The staff possesses a sense of unity and a willingness to strive towards a common goal. 4.0 4v57. My colleagues help me when necessary. 4.0 4v58. The staff discusses improvements to work and/or their working environment. 4.0 4v59. The staff presents new ideas about solving work-related problems. 4.0 4v60. The staff wants to improve the quality of teaching. 4.0 4Factor 9: Team spirit (TES)v50. I have ample opportunities to exchange work-related ideas and experiences with my colleagues. 4.0 4v51. We tend to evaluate and analyze our work together tolearn from it. 3.0 3v52. We solve work-related problems together. 4.0 4v53. We advise and guide each other on executing work-related tasks. 4.0 4

Factor 10: Psychic stress of the job (PSY)v78. I feel that I am beginning to dislike my work. 2.0 2v79. I feel that it is getting more difficult for me to take the initiative. 2.0 1v80. I find it difficult to concentrate. 2.0 1Note. Data = Employees’ of a Finnish polytechnic institution of higher education. A five-point summative rating scale ranging from 1 (strongly disagree) to 5 (strongly agree) was used.

The Growth-oriented Atmosphere Questionnaire (continued)Data
(n = 447)Item Median ModeFactor 11: Build-up of work requirements (BUI)v70. My workplace has too few employees to cope with the workload. 4.0 4v72. My workload has increased during the past years. 4.0 5v76. My working pace has increased in recent years. 4.0 4v77. I feel that I am experiencing fatigue. 3.0 4Factor 12: Commitment to work and organization (COM)v87. I am happy in my present job. 4.0 4v88. ”I want to continue in my present job; it gives me job satisfaction.” 4.0 4v89. I don’t find going to work each morning disagreeable. 4.0 5v91. I do not wish to change jobs. 4.0 4Factor 13: Growth motivation (GRM)v81. I feel encouraged by having added responsibilities. 4.0 4v82. I find self-improvement useful. 5.0 5v83. I like to participate in all manner of improvement projects within the organization (such as training, team work and projects, exchanging duties, taking on additional tasks etc). 4.0 4v84. I am interested in further training, provided it speeds up my transfer to other, more challenging tasks. 4.0 5v85. I like to experiment with new ideas. 4.0 4Note. Data = Employees’ of a Finnish polytechnic institution of higher education. A five-point summative rating scale ranging from 1 (strongly disagree) to 5 (strongly agree) was used.

Figure 1. Thirteen-factor Model of the Growth-orientedAtmosphere.
Figure 2. The Growth-oriented Atmosphere Factors in Two-dimensional Space (MDS, Euclidean Distance Model).
Note. ENC = Encouraging leadership, STR = Strategicleadership, REW = Know-how rewarding, DEV = Know-how

developing, INV = Incentive value of the job, CLA = Clarityof the job, VAL = Valuation of the job, COS = Communityspirit, TES = Team spirit, PSY = Psychic stress of the job,BUI = Build-up of work requirements; COM = Commitment to workand organization, GRM = Growth motivation.

Figure 3. Bayesian Model-based Visualization of GrowthMotivation by Employees’ Position and the Nature of Contract.

Figure 4. Bayesian Model-based Visualization of Commitment toWork and Organization by Employees’ Position and the Nature
of Contract.

Table 1 Correlation Coefficients of the Thirteen Dimensions of Growth-oriented AtmosphereGrowth-oriented Atmosphere Factors 1 2 3 4 5 6 7 8 9 10 11 12 13
1. Encouraging leadership (ENC) —2. Strategic leadership (STR) .39 —3. Know-how rewarding (REW) .65 .54 —4. Know-how developing (DEV) .68 .40 .61 —5. Incentive value of the job (INV)
.60 .27 .41 .59 —
6. Clarity of the job (CLA) .72 .47 .57 .61 .48 —7. Valuation of the job (VAL) .85 .37 .60 .66 .61 .63 —8. Community spirit (COS) .55 .32 .39 .55 .46 .48 .56 —9. Team spirit (TES) .48 .30 .36 .49 .37 .44 .49 .75 —10. Psychic stress of the job (PSY)
-.30 -.19 -.21 -.31 -.40 -.30 -.35 -.24 -.23 —
11. Build-up of work requirements(BUI)
-.19 -.19 -.25 -.16 -.12 -.20 -.23 -.06 -.06 .41 —
12. Commitment to work and organization (COM)
.55 .34 .42 .49 .61 .47 .58 .36 .32 -.50 -.28 —
13. Growth motivation (GRM) .20 .04 .04 .24 .29 .11 .21 .30 .22 -.23 .03 .19 —Note. Spearman rank order correlations (rs) were calculated due to ordinal measurement scale.

Table 2 The Thirteen Dimensions of Growth-oriented AtmosphereGrowth-oriented Atmosphere Factor Description b TRc
1. Encouraging leadership (ENC)a
Management of the organization expresses and consolidates values that direct activities, monitors the development processes of units and defines the direction and focus of operations.
.97 .97
2. Strategic leadership (STR)
Manager supports and motivates personnel to developknow-how, work methods and work community. He takesadvantage of work community member's expert knowledge and he tries to solve problems with them.He pays attention to the expectations and wishes ofpersonnel.
.89 .90
3. Know-how rewarding (REW) Organization rewards its employees' professional knowledge and skills. Members of work community gain more responsibility as their know-how increases.
.87 .87
4. Know-how developing (DEV) Organization takes an active interest in its employee's professional growth. Members of work community are interested in self-developing.
.88 .90
5. Incentive value of the job (INV)a
Work gives intrinsic fulfillment by being versatile, autonomous and challenging.
.88 .90
6. Clarity of the job (CLA) Personnel has a clear picture of goals and responsibilities. They are aware of decision-making
.87 .90

processes and personal expectations.7. Valuation of the job (VAL)a
Work contribution is respected by the worker itself, colleagues and management.
.88 .90
8. Community spirit (COS)a How community members may learn from each other, for example via dialogue, by analyzing mistakes, participating in collaborative planning and qualitydevelopment.
.92 .93
aCommon dimension as in the previous study in the same organization (Ruohotie & Nokelainen, 2000) with an 80-item version of the questionnaire. b Cronbach’s index of internal consistency. cTarkkonen’s reliability index.

Table 2 The Thirteen Dimensions of Growth-oriented Atmosphere (continued)Growth-oriented Atmosphere Factor Description b TRc
9. Team spirit (TES) Good team spirit promotes helping each other and taking responsibility over common goals. Work group members discuss about developing work and working environment.
.87 .88
10. Psychic stress of the job(PSY)
To what extent work and changes relating to it induce psychic strain like fatigue flightiness.
.83 .85
11. Build-up of work requirements (BUI)
How to cope with changes in the personal workload. .75 .79
12. Commitment to work and organization (COM)a
To be truly excited about ones work. How importantit is to stay in current job.
.87 .89
13. Growth motivation (GRM)a To trust ones abilities in difficult situations, take new challenges and develop ones know-how.
.80 .81
aCommon dimension as in the previous study in the same organization (Ruohotie & Nokelainen, 2000) with an 80-item version of the questionnaire. b Cronbach’s index of internal consistency.cTarkkonen’s reliability index.

II


Investigating the Influence of Attribution Styles
on the Development of Mathematical Talent
Petri Nokelainen
University of Tampere, Finland
Kirsi Tirri
University of Helsinki, Finland
Hanna-Leena Merenti-Välimäki
Espoo-Vantaa Institute of Technology, Finland

AbstractIn this paper, we examine the influence of attribution styles on the
development of mathematical talent. The study employs a Self-
confidence attitude attribute Scales (SaaS) questionnaire (Campbell,
1996b) measuring ability and effort attributions (Weiner, 1974).
Participants were three groups of mathematically highly, moderately
and mildly gifted Finnish adolescents and adults (n = 203). The
results of Bayesian classification modeling showed that items
attributing success to effort and failure to lack of effort were the
best predictors for the level of mild mathematical giftedness and
gender (females). The results of multivariate analysis of variance
showed that mathematically highly and moderately gifted reported that
ability was a more important reason for success than effort, but
mathematically mildly gifted tended to see effort leading to success.
Mathematically moderately and mildly gifted attributed failure to
lack of effort, mathematically highly gifted attributed failure to
lack of ability.
Putting the Research to Use
It is essential that educators and parents understand the influence
of different attribution styles on the development of mathematical
talent. This study provides understanding how mathematically highly,
moderately and mildly gifted adolescents and adults differ in their
specific reasons for success and failure. Differences in attribution
styles between the three groups of mathematically gifted, measured
with the SaaS questionnaire, indicate that it is important to know if
the attributions for success or failure are stable or unstable,
external or internal.
Knowledge of how learners or trainees use attributions to account
for success and failure can help educators and parents to gain a
deeper awareness of the mathematically gifted and, thus, predict
their expectancies and plan intervention strategies when needed. The
information is also applicable to courses concerning the needs of the
gifted. Furthermore, the information can be presented directly to
mathematically gifted in order to help them develop more insight into
their own behavior.

Investigating the Influence of Attribution Styles ... 3
Introduction
In 2000, a total of 180,000 students from 28 Organization for
Economic Co-Operation and Development (OECD) member countries and
four non-OECD countries (Brazil, Latvia, Liechtenstein and the
Russian Federation) participated in the first Programme for
International Student Assessment (PISA). The results showed that
students from Japan, Korea, New Zealand and Finland scored highest in
all tests measuring mathematics literacy (OECD, 2001, p. 78). The
Finnish students ranking was even higher, the third, when variation
within country was taken into account (OECD, 2001, 80). In 2003 the
PISA follow up study focusing on mathematics literacy and involving
276,165 15-year old students was conducted in 41 countries (OECD,
2004). The results of overall student performance in different
countries on the mathematics scale showed that Hong Kong students had
the highest, and Finnish students had the second highest, mean
student score (OECD, 2004, p. 89). The finding of small within
country variance in the Finnish sample was repeated.
One logical reason for success in international comparison studies
is the Finnish government’s “equal opportunities and high quality
education for all” principle. The first practical consequence of the
principle is that education is free for all students participating in
these assessments. The second consequence is government’s strong
financial support for public sector educational institutions. This
has led to the situation where there are no appreciable differences
in teaching quality or premises between public and special schools.
Partly for this reason, only a small minority of the schools in

Investigating the Influence of Attribution Styles ... 4Finland are special schools with entrance examinations and financial
support from private or corporate sources. There are no private
universities or polytechnics in Finland.
The purpose of this study is to explore the attribution styles—that
is, personal explanations for success and failure—Finnish adolescents
and adults (n = 203) with varying levels of mathematical giftedness
to discover what attributions contribute to or impede the development
of mathematical talent.
The first group, “Olympians,” consists of mathematically highly
gifted adults who have participated in the international Olympics for
mathematics. Tirri and Campbell (2002) reported that 80 per cent of
the Finnish Olympians apply their mathematical talent by choosing a
career in science. The majority of them are researchers in academia
or engineers in technical fields. The Olympians have been very
successful in their graduate studies, and they have published
articles and books related to their fields. Those Olympians who did
not continue in academia chose a career as an engineer or as a CEO or
a manager in leading Finnish companies like Nokia. (Tirri, 2002;
Tirri & Campbell, 2002.)
The second group, “Prefinalists,” consists of secondary school
students, who have taken part in national competitions in
mathematics. The group represents the top level of Finnish 15-year
old students that participated in the international PISA 2000 study.
The third group, “Polytechnics,” consists of adolescent students
from a technical vocational high school who study mathematics as
their major subject. In Finland most of the vocational high schools
are highly specialized regional institutions training professionals

Investigating the Influence of Attribution Styles ... 5for expert and development careers. This particular institute is the
top-rated technically oriented vocational high school in Finland.
Giftedness is not a monolithic construct. There are different
levels of giftedness and, thus, the three groups representing
mathematically gifted adolescents and adults in this study are not
homogenous. Further, we are not able to guarantee that the
individuals within each group share the same level of mathematical
ability. Intelligence quotient is, especially with children, a useful
index of the discrepancy between mental and chronological age. As the
participants of this study are adolescents and adults, we did not
measure their IQ, but instead we looked at their current or past
achievements. Olympians are the most homogenous and mathematically
gifted group in this study on the basis of their achievements as
Academic Olympians and their traceable academic publication record
(Nokelainen, Tirri & Campbell, 2004; Nokelainen, Tirri, Campbell &
Walberg, 2004). We classify Olympians for the purpose of this study
as mathematically highly gifted. Also Prefinalists have undergone a
series of increasingly demanding mathematical tests in order to be
included in the Academic Olympians training programme. Their trainers
are past Olympians; that is, members of the first group in this
study. Prefinalists are classified as mathematically moderately
gifted, as we do not yet know how many will be selected to
participate as Academic Olympians in the future. Technical vocation
high school students, who study mathematics as their major, represent
mathematically mildly gifted students in this study. Group membership
(1 = “Olympians”, 2 = “Prefinalists”, 3 = “Polytechnics”) showed a
strong positive correlation with secondary school mathematics grade

Investigating the Influence of Attribution Styles ... 6average (from 1 (highest) to 7), with a correlation coefficient of
r(203) = .82, p < .001.
Earlier studies of mathematical giftedness have mainly focused on
within group differences related to, for example, gender or
attribution styles. There are very few between group comparisons,
except cross-cultural, reported. Socio-economic differences do exist
in Finland, but their impact on children’s’ educational possibilities
is minor because education is free at all levels. As the PISA results
indicate (OECD, 2001, 2004), in Finland all individuals are provided
with uniformly high-level of basic mathematical training, thus,
controlling at least to some extent individual level educational
differences. This allows us to interpret possible differences between
the groups through differences in individuals’ characteristics such
as mathematical giftedness and attribution styles.
All the participants completed the Self-confidence attitude
attribute Scales (SaaS) questionnaire (Campbell, 1996a). The
instrument included 18 items measuring ability and effort
attributions, based on Weiner’s properties of attributional thinking
(1974, 1980, 1986, 1994, 2000), on four dimensions: 1) Success due to
ability; 2) Failure due to lack of ability; 3) Success due to effort;
4) Failure due to lack of effort.
Our research questions are as follows: 1) “Are the four dimensions
of the SaaS instrument (success due to ability, failure due to lack
of ability, success due to effort, failure due to lack of effort)
identified in this domain?”; 2) “What are the best predictors for the
level of mathematical giftedness (highly = “Olympians,” moderately =
”Prefinalists” and mildly = “Polytechnics”) and gender among the SaaS

Investigating the Influence of Attribution Styles ... 7variables?”; 3) “Do the attribution styles differ by the level of
mathematical giftedness or gender?”
Theoretical Framework
Properties of Attributional Thinking
Reasons people give for an outcome, such as success or failure in a
task, are called attributions (Heider, 1958). Factors, such as
specific reason for success and failure, involved in attributional
thinking have been shown to be related in achievement settings
(Weiner, 1974, 1980, 1986, 1994, 2000). Weiner found in his studies
that the four most frequent reasons for success and failure are
ability, effort, task difficulty and luck. Subsequent research
identified learning strategies as a fifth possible reason for success
and failure (Alderman, 2004): It is no good thing trying harder if
you do not know how to try.
Dai, Moon and Feldhusen (1998) classify attribution constructs into
three groups. First, attribution appraisals are online explanations
assessed following actual or manipulated success or failure in
performing a specific task. Second, attribution beliefs are domain-specific
or domain-general beliefs about the causes of success or failure.
Third, attribution styles are generalized, stereotypical patterns of
attributions and dispositional beliefs. Attribution styles are
assessed in a similar way to attribution beliefs, except that a
certain typology is imposed on the data using predetermined criteria.
In this study, we examined attribution styles using Weiner’s (1992)
classification of reasons for success and failure: 1) Internal and
external attributions, referring to within or outside person causes;

Investigating the Influence of Attribution Styles ... 82) Stable and unstable attributions, referring to consistent or
inconsistent causes over time; 3) Controllable and uncontrollable
attributions, referring to the extent a person believes he or she has
control over the cause of an outcome. In this study, we examined
within person factors (ability and effort) as they have typically
been found to be the most frequently cited reasons for success and
failure in achievement contexts. Those factors are classified as
‘internal’ attributions. ‘External’ attributions (luck, task
difficulty) were omitted from the study design. Thus, our focus is on
stable and unstable internal, controllable and uncontrollable,
attributions. For example, most effort attributions are unstable and
controllable as opposed to ability attributions that are usually
stable and uncontrollable. We will later show in Table 2 how the 18
SaaS items are related to these dimensions. We will also discuss in
the later stages of the analysis how the four SaaS factors describe
above-mentioned dimensions of reasons for success and failure (Table
4).
Self-regulation and Attribution Styles
Self-regulation refers to the process through which self-generated
thoughts, feelings, and actions are planned and systematically
adapted as necessary to affect one’s learning and motivation (Schunk
& Ertmer, 2000, p. 631; Zimmerman, 2000, p. 14). According to social-
cognitive theory, self-regulation is dependant on the situation.
Therefore, self-regulation is not a general characteristic or a
developmental level but is contextually dependent.
Zimmerman (2000) describes self-regulation as cyclical because the
feedback from prior performance is used to make adjustments during

Investigating the Influence of Attribution Styles ... 9current efforts. Personal, behavioral, and environmental factors are
constantly changing, and therefore an individual has to monitor these
changes continuously in order to know whether any adjustments are
required. Zimmerman (2000) describes the three feedback loops
involved in monitoring one’s internal state, one’s behaviors and
one’s environment as the triadic forms of self-regulation.
Figure 1 describes self-regulation of learning tasks as a
cyclical, three-phase process (Zimmerman, 1998). The phases in this
learning cycle are forethought, performance or volitional control,
and self-reflection. Forethought, which creates the necessary conditions
for learning, consists of task analysis and self-motivation beliefs.
Performance or volitional control, which guides the learning process and
regulates concentration and learning performance, consists of self-
control and self-observation. Self-reflection, which refers to examining
and making meaning of the learning experience, consists of self-
judgment and self-reaction. Next we examine more closely the last
phase, which contains the focus of this paper, attribution styles.
Self-reflection begins with self-judgment, which is the process
whereby individual compares information attained through self-
monitoring to extrinsic standards or goals. He or she wants to have
fast and accurate feedback on his or her performance as compared to
others. Self-judgment leads to attribution interpretations where the
learner interprets the reasons for success or failure. Attribution
interpretations can lead to positive self-reactions. The individual
might interpret the failure of a strategy as the result of too little
effort and then increase her efforts, but if she interprets the
reason for failure as being a lack of ability, the reaction is liable

Investigating the Influence of Attribution Styles ... 10to be negative. Attribution interpretations reveal the possible
reasons for learning mistakes and help the learner to find those
learning strategies which best suit the given situation. They also
develop or promote the adaptation process. Self-regulated individuals
are more adaptive and evaluate their performance appropriately.
Positive reactions (e.g., self-satisfaction) reinforce positive
interpretations of oneself as an individual and enhance intrinsic
interest in the task.
-- Insert Figure 1 about here --
Ellström (2001) defines qualification as the competence that is
actually required by a task and/or is implicitly or explicitly
determined by individual qualities. In our study setting, the most
interesting point is that competence may also be seen as an attribute
of the individual, meaning for example a human resource that the
person brings to mathematical problem solving situation. Further,
attributions may emphasize formal competence as indicated by degree
requirements and certificates, or, the focus of this study, potential
competence as indicated by the capacity of the individual to
successfully complete tasks and face new challenges on the basis of
demonstrated personal attributes and abilities (other than those
obtained through formal training). Ellström (2001) has noticed that
potential competence may vary greatly between individuals with the
same formal qualifications, because they may possess very different
levels of inherent ability and may have learned different things
outside of school or studies through their working life and

Investigating the Influence of Attribution Styles ... 11recreational activities. Thus, ability attributions affect later
performance expectations and, in negative cases, the development or
continuation of learned helplessness (Ruohotie & Nokelainen, 2000).
In this study, we concentrate on participants’ self-evaluations on
the basis of mathematics achievement and academic ability because
causal attributions (see phase “Self-Reflection” in Figure 1) play an
important part in the self-regulatory process by being central
elements of self-judgment and thus influencing, for example, goal
setting and self-efficacy. We are interested to see if the
attribution styles of mathematically highly gifted individuals differ
from those of the mathematically able individuals.
Literature Review
Mathematical Giftedness and Attribution Styles
Campbell has conducted several cross-national studies on Mathematics
Olympians (e.g., 1994, 1996b; Nokelainen, Tirri & Campbell, 2004). He
made two interesting findings: first, the international data on
mathematics self-concept verified the finding that their academic
self-concepts fluctuate from grade school to high school, and second,
the Olympians attributed effort to be more important in their success
than ability (1996b). The latter research finding has been verified
by Chan (1996) who reported that adolescent gifted students were more
likely to attribute failure to lack of effort than to attribute it to
low ability. The American and Taiwanese Olympians have also
attributed success and failure more to effort than to ability (Feng,
Campbell & Verna, 2001; Wu & Chen, 2001).

Investigating the Influence of Attribution Styles ... 12
Heller and Lengfelder (2000) investigated 100 German Olympians
finalists and 135 Prefinalists in mathematics, physics, and
chemistry. In contrast to Campbell’s findings, their results showed
that participants in both groups valued ability significantly more
highly than effort. Effort was estimated to be equally important in
the case of failure as in the case of success (Heller & Lengfelder,
2000).
Marsh (1983) found, as he studied relationships among the
dimensions of self-attribution, self-concept and academic
achievements, that those who attribute academic success to ability
and who do not attribute failure to a lack of ability have better
academic self-concepts and better academic achievement. Multon, Brown
and Lent (1991) have also shown a positive correlation between
perceived ability and achievement.
Gender and Attribution Styles
In an American study by Verna and Campbell (2000), a small
significant difference between males and females was found with
regard to perceptions of ability. The female American Chemistry
Olympians considered ability to be a more important factor for
success than did the males. However, no difference was found for the
effort factor.
Kerr (1994) and Reis (1998) have identified external barriers to
gifted women as including the attitudes of parents and school,
environmental options and possible discrimination or harassment at
school or at work. The possible internal barriers among gifted
females included self-doubt, self-criticism, and low expectations.
According to Siegle and Reis (1998), gifted girls tend to

Investigating the Influence of Attribution Styles ... 13underestimate their abilities, especially in mathematics, social
studies and science.
Instrumentation of Attribution Theory
There is abundant literature and research on attribution theory,
especially on attributional properties in achievement settings
(Weiner, 1974, 1980, 1986, 1994, 2000) because the role of motivation
in academic achievement has proven to be a popular topic. The
principle of attribution theory is that students search for
understanding, trying to discover why an event has occurred (Weiner,
1974). The interest is apparent as we examine the structure of
existing measurement instruments: Biggs’ (1985) 42-item Study Process
Questionnaire (SPQ) consists of two scales (motive and strategy) with
three approaches: 1) Surface; 2) Deep; 3) Achieving. The
questionnaire contains six subscales (surface motive, deep motive,
achieving motive, surface strategy, deep strategy, and achieving
strategy). Entwistle et. al’s (Ramsden & Entwistle, 1981) Approaches
to Studying Inventory (ASI), which is one of the most widely used
questionnaire on student learning in higher education, contains
subscales including such factors as fear of failure, extrinsic
motivation, and achieving orientation. Marsh (e.g., Marsh & O’Neill,
1984) has developed a set of scales (Self-description Questionnaire
I-III) for different age groups measuring self-concept with a
multifaceted (e.g., mathematics, verbal, academic, physical) view.
According to Strein (1995), research results over the past fifteen
years have strongly supported the multifaceted view emphasizing
domain-specific self-concepts. In this study we apply the Self-
confidence attitude attribute Scales (SaaS) questionnaire that was

Investigating the Influence of Attribution Styles ... 14developed by Campbell (1996a) originally for cross-cultural Academic
Olympiad studies.
Method
Sample
The Finnish education system includes comprehensive schools, post-
comprehensive general and vocational education, higher education and
adult education. Comprehensive schools provide a nine-year compulsory
educational program for all school-age children, beginning at the age
of seven. Post-comprehensive education is provided in upper secondary
schools and vocational institutions. The Finnish higher education
system includes 20 universities and 30 vocational high schools. The
higher education system as a whole offers openings for 66 per cent of
the relevant age group (universities 29%, vocational high schools
37%).
Respondents in the first group, “Olympians,” are the Finnish
students most gifted in mathematics. The group consists of
individuals of different ages who participated in Olympiad Studies in
Mathematics during the years 1965-1999. Separate programs exist for
the Mathematics, Physics and Chemistry Olympiads. In recent years,
programs have been created for Biology and Computer Science Olympiads
as well. Distinct studies have been undertaken in each of these
academic areas. In the Mathematics, Physics and Chemistry Olympiad
programs, a series of increasingly difficult tests are administered.
This testing concludes with the identification of the top national
finalists (6-20 Olympians). These individuals are trained to compete
in the International Olympiad programs.

Investigating the Influence of Attribution Styles ... 15
The second group, “Prefinalists,” involved in this study consists
of secondary school students who have taken part in the national
competitions in mathematics during the years 2000 and 2001. Each year
schools all over the Finland send their most talented students to
this annual competition. The tests of this competition resemble the
tests used in academic Olympians.
The third group, “Polytechnics,” are students of Espoo - Vantaa
Institute of Technology. They need progressively advanced
mathematical skills as they progress in their studies. However,
compared to higher-level mathematics studies in universities,
technological mathematics studies in vocational high schools are more
practically oriented.
In addition, respondents’ parents were asked about their educational
level. Over sixty per cent of Olympians (62%) and Prefinalists (65%)
parents had an academic degree. Only 24 per cent of Polytechnics
parents had the same educational level. Analysis of parental
occupation in the three groups showed that Olympians and Prefinalists
parents shared similar vocational interests as they were, for
example, doctors, teachers and business managers. Polytechnics’
parents were mainly middle class; for example, factory workers.
However, in Finland educational level is not a good predictor of
socio-economic status. Prefinalists’ parents belong to the highest
income class in Finland with the average annual salary of USD 83,597.
Both Olympians (USD 49,447) and Polytechnics parents (USD 46,721)
earn middle level salaries in the Finnish context.

Investigating the Influence of Attribution Styles ... 16Procedure
All the participants completed the Self-confidence attitude attribute
Scales (SaaS) questionnaire (Campbell, 1996a) based on Weiner’s self-
attribution theory (1974). The Mathematics Olympians’ data (n = 77)
included 68 male and nine female respondents. The sample is quite
representative as the total number of Finnish Mathematics Olympians
is 84 (14 females and 70 males). The second group (n = 52) is a
sample from about 200 secondary school national competitors in
mathematics. The polytechnic student data (n = 74) is a fully
representative sample of an advanced mathematics course held at Espoo
- Vantaa Institute of Technology in autumn 2001, the total number of
participants in which is approximately 3000. Olympiad data was
collected between 1997 and 2002, the Polytechnic data in 2001, and
the Prefinalists data between 2001 and 2002.
Table 1 shows, except for the Polytechnics, that the gender is
biased towards males. This finding is related to the well-documented
tendency of females not to pursue careers in Sciences, even though
they are equally capable as males (e.g., Enman & Lupart, 2000),
unless one or both of their parents are in the same field (Tirri,
2002). The student’s age is a good predictor for group membership.
-- Insert Table 1 about here --
Measurement Instrument
The SaaS instrument was mailed to respondents in a traditional paper
and pen form (see Table 2). The instrument used a six-point Likert
scale ranging from 1 (totally disagree) to 6 (totally agree). The
SaaS scale included eighteen items measuring the students’

Investigating the Influence of Attribution Styles ... 17attributions based on self-attribution theory (Weiner, 1974).
Although Weiner’s original conceptualization contained four
attributions (ability, effort, difficulty, luck), the statistical
analysis based on numerous empirical samples produced only two
distinct scales, effort and ability (Campbell, 1996a, 1996b; Feng et
al., 2001; Heller & Lengfelder, 2000; Tirri, 2001). In each of these
studies a consistent factor structure was found for the ability and
effort factors. Statements linking success and effort produced high
scores on the effort factor. Statements on the ability factor
expressed the view that ability is more important than hard work.
In addition to SaaS, we asked for the following background
information from the respondents: gender, age, number of programming
languages known, and average of mathematics, physics and chemistry
secondary school grades.
-- Insert Table 2 about here --
Statistical Analyses
The data analysis began by examining all the items to see if they
were technically applicable for linear statistic computations based
on multivariate normality assumptions, such as exploratory factor
analysis (EFA) and multivariate analysis of variance (MANOVA).
In the second stage we conducted an explorative factor analysis to
answer the first research question: 1) “Are the four dimensions of
the SaaS instrument (success due to ability, failure due to lack of
ability, success due to effort, failure due to lack of effort)
identified in this domain?”

Investigating the Influence of Attribution Styles ... 18
Bayesian classification modeling (Silander & Tirri, 1999, 2000)
was conducted in the third stage of the analysis to answer the second
research question: 2) “What are the best predictors for the level of
mathematical giftedness (highly = “Olympians,” moderately =
”Prefinalists” and mildly = “Polytechnics”) and gender among the SaaS
variables?” Bayesian classification modeling resembles linear
discriminant analysis (Huberty, 1994), but it is free of most of the
assumptions of Gaussian modeling (Nokelainen, Ruohotie & Tirri, 1999,
p. 113; Nokelainen & Tirri, 2004).
In the fourth stage we conducted MANOVA (with the Roy-Bargman
stepdown analysis and Bonferroni post hoc test) to see if the
attribution styles differ by the level of mathematical giftedness or
gender. When investigating more than one dependent variable, we
applied factorial MANOVA instead of series of ANOVA’s, as it controls
for increasing risk of Type I error (falsely rejecting null
hypothesis when it is true).
Results
Investigating Variables Statistical Properties
In the first stage, a frequency analysis was carried out for all the
variables. Results show that the respondents used the whole scale
from 1 (totally disagree) to 6 (totally agree) for all the items.
According to Kerlinger (1986, p. 495), before constructing one’s own
questionnaire “… one should first ask the question: Is there a better
way to measure my variables?” He classifies weaknesses of rating
scales into extrinsic and intrinsic. The extrinsic defect is that
scales are much too easy to construct and use. Sometimes a scale is

Investigating the Influence of Attribution Styles ... 19used to measure things for which it is not appropriate. Kerlinger
defines the intrinsic defect of rating scales as their proneness to
constant error. He lists four main sources: Halo effect, the error of
severity (to rate all items too low), error of leniency (to rate all
items too high) and error of central tendency (to avoid all extreme
judgments). To address this issue, we analyzed the overall response
tendency. We found that distribution of the modes on a six-point
Likert scale was multimodal and slightly biased towards positive
values: 1) n = 0; 2) n = 5; 3) n = 0, 4) n = 11; 5) n = 0; 6) n = 0.
Numerous publications declare that certain attributes belong to
data that is appropriate for multivariate analysis (e.g., Bradley &
Schaefer, 1998, pp. 79-83; Tabachnick & Fidell, 1996, pp. 13-17). The
most commonly used criteria for accepting variables for multivariate
analysis are: 1) Standard deviation of no more than half the mean; 2)
Skewness less than +/- .3 and 3) Correlation between +/- .3 - .7.
When we examined the eighteen items using the first two criteria, we
noticed that all the items passed the first criteria, but only four
items passed the second criteria. As it seemed impossible to take the
second criteria literally due to a high rejection rate at the .3
level, we examined the skewness of items in three additional levels
(.5, .7, .8). The .7 level proved to be suitable for this data set
suggesting rejection of three items (4, 6, and 7). A non-parametric
inter-item correlation matrix was produced in order to examine the
third criteria. Thirteen items reached the desired level as the
values ranged from –0.48 to 0.71 (M = 0.05, SD = 0.16). The rejected
items were: 4, 7, 10, 14, and 18. We examined multivariate normality
with Mahalanobis distances. The maximum values for the two SaaS

Investigating the Influence of Attribution Styles ... 20scales were below critical values obtained from the Chi-square table
(alpha = .001), thus not indicating the presence of outliers.
Finally, when we combine the results of the variable selection
phase, it seems obvious that at least items “4. I worked harder if I
liked the teacher,” and “7. You have to have the ability in order to
succeed in most things” should be omitted from further analysis.
Explorative Factor Analysis
Our next task, according to the first research question, was to see
if the combined sample and three sub samples contained the following
four dimensions: 1) Success due to ability; 2) Failure due to lack of
ability; 3) Success due to effort; 4) Failure due to lack of effort.
We performed the analysis with sixteen items, as the variable
rejection based on communalities of two-dimensional PCA structure did
not appear to provide a feasible solution. Factor analysis with the
Maximum Likelihood extraction method and Direct Oblimin rotation
(delta value was set to zero, i.e., letting factors correlate) was
conducted for the combined sample (n = 203) and for each sample
separately (Olympians, n = 77; Prefinalists, n = 52; Polytechnics, n
= 74).
A four-factor solution with eight items grouped the variables in
all three sub samples and the combined sample as expected. Next we
present the eight items operationalizing four SaaS factors. Factor 1,
success due to ability, included only one variable, “5. Being smart
is more important than working hard”. The logic behind this solution
was that all the other two related items (“4. I worked harder if I
liked the teacher” and “7. You have to have the ability in order to
succeed in most things”) were omitted from further analysis because

Investigating the Influence of Attribution Styles ... 21they did not meet the assumptions of multivariate analysis. Factor 2,
failure due to a lack of ability, included items “3. There are some
things you can not do no matter how hard you try” and “13. When I did
poorly in school it was because I did not have the needed ability”
(alpha = .62). Factor 3, success due to effort, included items “9.
Self-discipline is the key to school success,” “12. I had to work
hard to get good grades” and “17. Hard work is the key to get good
grades” (alpha = .63). Factor 4, failure due to a lack of effort,
included items “8. My achievement would have been better if I tried
harder” and “16. I could have done better in mathematics if I have
tried harder” (alpha = .82). The Cronbach’s alpha values for the four
factors within the three groups varied as follows: Olympist data
(factor 1 = not calculated, factor 2 = .56, factor 3 = .75, factor 4
= .76), Prefinalists data (factor 1 = not calculated, factor 2 = .60,
factor 3 = .67, factor 4 = .84) and Polytechnics data (factor 1 = not
calculated, factor 2 = .59, factor 3 = .42, factor 4 = .80).
Although we found only one item measuring the first SaaS
dimension, success due to ability, correlations between factors
behaved as expected (Table 3). Ability and effort factors correlated
negatively with each other and both effort factors, as well as both
ability factors, correlated positively.
-- Insert Table 3 about here --
Table 4 shows how four SaaS factors are related to ‘internal’,
‘stable-unstable’ and ‘controllable-uncontrollable’ attribution
dimensions. the ‘stable-unstable’ dimension is important, as research

Investigating the Influence of Attribution Styles ... 22has typically found that learners view ability as relatively stable
(Alderman, 2004, p. 31). For example, if a mathematically gifted
person is convinced that he or she is not able to solve certain type
of problem, it is an indication of ‘internal-stable’ attribution and
his or her failure appears to be fixed. This belief pattern is known
as learned helplessness. However, there is also a third dimension,
‘controllable-uncontrollable.’ As seen in Table 4, both ability
factors represent ‘uncontrollable’ attributions, and both effort
factors represent ‘controllable’ attributions. If the mathematically
gifted person decides to continue solving problems related to area he
or she finds difficult, he or she has changed uncontrollable
attribution (ability) to one that he or she can control (effort). The
least serious dimension for the learner’s self-esteem is ‘unstable-
controllable,’ because the first component refers to a situation that
is temporary by nature, and the second refers to an effort level that
is adjustable. For example, a learner explains his or her failure in
integral calculations by saying that certain routine procedures need
more practice. No single SaaS item (see Table 2) or factor represents
the last quarter of Table 4, ‘unstable-uncontrollable’, as it
describes, for example, a situation in which a mathematically gifted
person guesses correctly the answers to those competition exercises
that he or she is unable to solve. Although we did not include
‘external’ attributions in our design, we will demonstrate it by
converting the latest ‘internal-unstable-uncontrollable’ example to
the form of ‘external-unstable-uncontrollable.’ This is accomplished
by replacing ‘guessing’ (internal attribution) with an ‘easy test’
(external attribution).

Investigating the Influence of Attribution Styles ... 23
-- Insert Table 4 about here --
Bayesian Classification Modeling
We conducted the Bayesian classification modeling with the B-Course
program (Myllymäki, Silander, Tirri & Uronen, 2002) to find out which
variables measuring attribution styles are the best predictors for
the level of mathematical giftedness (highly = “Olympians”,
moderately = ”Prefinalists” and mildly = “Polytechnics”) and gender
(research question 2). In the classification process, the automatic
search tried to find the best set of variables to predict the class
variable for each data item. This procedure resembles the traditional
linear discriminant analysis (LDA, Huberty, 1994, pp. 118-126), but
the implementation is totally different. For example, a variable
selection problem that is addressed with forward, backward or
stepwise selection procedure in LDA is replaced with a genetic
algorithm approach (e.g., Hilario, Kalousisa, Pradosa & Binzb, 2004;
Hsu, 2004) in the Bayesian classification modeling. The genetic
algorithm approach means that variable selection is not limited to
one (or two or three) specific approach; instead many approaches and
their combinations are exploited. One possible approach is to begin
with the presumption that the models (i.e., possible predictor
variable combinations) that resemble each other a lot (i.e., have
almost same variables and discretizations) are likely to be almost
equally good. This leads to a search strategy in which models that
resemble the current best model are selected for comparison, instead
of picking models randomly. Another approach is to abandon the habit
of always rejecting the weakest model and instead collect a set of

Investigating the Influence of Attribution Styles ... 24relatively good models. The next step is to combine the best parts of
these models so that the resulting combined model is better than any
of the original models. B-Course is capable of mobilizing many more
viable approaches, for example, rejecting the better model
(algorithms like hill climbing, simulated annealing) or trying to
avoid picking similar model twice (tabu search).
First, we derived the model for classifying data items according
to the class variable level of mathematical giftedness (Olympians,
Prefinalists and Polytechnics) with 18 variables of the SaaS scale as
predictors (items are listed in Table 2). The estimated
classification accuracy for the model was 65 per cent. Second, we
derived the model for classifying data items according to the class
variable gender. The estimated classification accuracy for the model
was 80 per cent.
Table 5 lists the variables ordered by their estimated
classification performance in the model. The strongest variables—that
is, those that discriminate the independent variables best—are listed
first. The percentage value attached to each variable indicates the
predicted decrease in the classification performance if the variable
were to be dropped from the model. The table shows that the variables
in the first two models, level of giftedness and gender, have a clear
order of importance. The most important variable for both models is
”12. I had to work hard to get good grades.” If we remove that
variable from the first model, it would weaken the performance from
65 per cent to 58 per cent. Removal of the variable from the second
model would weaken the performance from 80 per cent to 73 per cent.

Investigating the Influence of Attribution Styles ... 25
Differences in the group means in Table 5 show that the first
classification between three groups of mathematically gifted is based
on effort attributions as five items out seven measure success or
failure due to effort. The first item, “10. The smart kids tried the
hardest”, is the best overall predictor variable. However, the other
items are more interesting as they show that both mathematically
mildly (Polytechnics) and moderately (Prefinalists) gifted
individuals attribute failure to lack of effort, but only
mathematically mildly gifted individuals attribute success to effort.
Mathematically highly (Olympians) and moderately (Prefinalists)
gifted individuals prefer ability as an explanation for their
success.
Females in this sample tend to attribute success to effort more
than males. Further, they are also more likely to attribute failure
to lack of ability than males. Both findings are consistent with
existing research (e.g., Alderman, 2004, p. 42; Vermeer, Boekaerts &
Seegers, 2000). However, we note that ‘female voice’ in this study
belongs to mostly those who are mathematically mildly gifted as they
are members of the Polytechnics group. This explains at least to some
extent why items measuring effort have such important role in the
first two classification models. (Table 5.)
-- Insert Table 5 about here --
Multivariate Analysis of Variance
We investigated the third research question “Do the attribution
styles differ by the level of mathematical giftedness (highly =
“Olympians,” moderately = ”Prefinalists” and mildly = “Polytechnics”)

Investigating the Influence of Attribution Styles ... 26and gender?” with a 3 2 factorial multivariate analysis of
variance. The four dependent variables were SaaS factors based on
both theoretical assumptions (Weiner, 1974) and the results of
preceding EFA: Success due to ability, failure due to lack of
ability, success due to effort, and failure due to lack of effort.
The independent variables were the level of mathematical giftedness
and gender. Preliminary assumption testing was conducted to check for
normality, linearity, univariate and multivariate outliers,
homogeneity of variance-covariance matrices, and multicollinearity.
No violations were discovered except for fourth factor, failure due
to lack of effort for which the test of homogeneity of variance was
not met (Levene’s p < .001, Cochran’s p = .014, Bartlett-Box’s p
= .002). Larger variances indicate that a .05 alpha level is
overstated and the differences should be assessed using a lower
value, for example, .03 (Hair, Anderson, Tatham & Black, 1998, p.
349). For such dependent variables, Tabachnick and Fidell (1996, 382)
suggest using Pillai’s criterion instead of Wilks’ lambda.
With the use of Pillai’s criterion, the level of mathematical
giftedness multivariate main effect on the SaaS factors was found to
be significant, F(8, 384) = 4.33, p < .001. The gender multivariate
main effect on the SaaS factors was not found to be significant, F(4,
191) = 0.23, p = .992. The level of mathematical giftedness and
gender multivariate interaction was not found to be significant, F(8,
384) = 0.45, p = .893. The results reflected a modest association
between three groups of mathematically gifted and the SaaS factors,
partial 2 = .08 (Pillai’s trace) - .16 (Roy’s Largest Root). This
finding suggests that group membership explains attribution styles

Investigating the Influence of Attribution Styles ... 27from eight to 16 per cent. The achieved statistical power for this
main effect was 1.0.
To further investigate the impact of the level of mathematical
giftedness main effect on the SaaS, a Roy-Bargman stepdown analysis
was performed. Stepdown analysis resolves the problem of correlated
univariate F tests with correlated DV’s (Tabachnick & Fidell, 1996,
p. 403). The following priority order of SaaS factors from most to
least important was developed on the basis of theoretical
assumptions, instead of assigning priority on the basis of univariate
F, to avoid problems inherent in stepwise regression: (1) success due
to ability, (2) failure due to lack of ability, (3) success due to
effort, and (4) failure due to lack of effort. In stepdown analysis
each SaaS factor was analyzed, in turn, with higher-priority factors
treated as covariates and with the highest-priority SaaS factor
(success due to ability) tested in a univariate ANOVA. In addition,
univariate F values were calculated to allow correct interpretation
of the stepdown analysis. Results of the analysis are summarized in
Table 6. An experimentwise error rate of five per cent was achieved
by the apportionment of alpha as shown in the last column of Table 6
for each of the SaaS factors.
A unique contribution to predicting differences between the three
groups of mathematically gifted was made by success due to ability
factor, stepdown F(2, 194) = 3.28, p = .040, 2 = .03. According to
Cohen (1988), the effect size is small, indicating that only three
per cent of variance in the dependent variable is attributable to
differences in mathematical giftedness. Mathematically highly (mean
success due to ability = 3.45, SE = .07) and moderately (mean success

Investigating the Influence of Attribution Styles ... 28due to ability = 3.56, SE = .09) gifted individuals evaluated the role
of ability to be higher than mathematically mildly gifted did (mean
success due to ability = 3.28, SE = .07). The mean difference between
the moderately and mildly gifted reached statistical significance
using Bonferroni adjusted alpha level of .013, p = .040. This result
is consistent with both Weiner’s (1986) findings showing high-
achieving students’ tendency to use ‘internal-stable-uncontrollable’
causal attributions for success, and Heller and Lengfelder’s (2000)
findings for German Olympians and Prefinalists. However, studies of
American and Taiwanese Olympians showed opposite results as
participants referred more to effort than ability attributions
(Campbell, 1996b; Feng, Campbell & Verna, 2001; Wu & Chen, 2001).
After the pattern of differences measured by the first SaaS factor
was entered, a difference was also found on failure due to lack of
ability, stepdown F(2, 193) = 11.20, p < .001, 2 = .10. The effect
size of this finding is moderate, indicating that ten per cent of
variance in the dependent variable is attributable to differences in
mathematical giftedness. Mathematically highly gifted (adjusted mean
failure due to lack of ability = 3.00, SE = .09) students attributed
failure to lack of ability more than moderately (adjusted mean
failure due to lack of ability = 2.60, SE = .11) and mildly (adjusted
mean failure due to lack of ability = 2.38, SE = .09) gifted. The mean
difference between mathematically highly and moderately gifted
students reached statistical significance using Bonferroni adjusted
alpha level of .013, p = .028. Also, the mean difference between the
mathematically highly and mildly gifted reached statistical
significance using Bonferroni adjusted alpha level of .013, p < .001.

Investigating the Influence of Attribution Styles ... 29This ‘internal-stable-uncontrollable’ finding, which according to
Marsh (1983) may lead to low academic self-concept and achievement,
is against Weiner’s ‘internal-unstable-controllable’ expectation for
high-achievers who have failed.
The third step in the analysis was to enter the success due to
effort factor. This stepdown reached statistical significance,
however, with a small effect size, F(2, 192) = 3.05, p < .05, 2
= .03. Mathematically mildly gifted individuals valued success due to
effort higher (adjusted mean success due to effort = 3.04, SE = .09)
than those who were highly (adjusted mean success due to effort =
2.74, SE = .09) and moderately gifted (adjusted mean success due to
effort = 2.79, SE = .10). The mean difference between mildly and
highly gifted students reached statistical significance using
Bonferroni adjusted alpha level of .013, p = .029. This result
showing mathematically mildly gifted Polytechnics preferring
‘internal-unstable-controllable’ attributions was expected.
After the pattern of differences measured by success due to
ability, failure due to lack of ability and success due to effort was
entered, a difference was also found on the attitude toward failure
due to lack of effort, stepdown F(2, 191) =11.43, p < .001, 2 = .11.
According to Cohen (1988), the effect size for this finding is
classified as large. Mathematically mildly (adjusted mean failure due
to lack of effort = 3.99, SE = .11) and moderately (adjusted mean
failure due to lack of effort = 3.77, SE = .12) gifted students
attributed failure to lack of effort more than highly gifted did
(adjusted mean failure due to lack of effort = 3.27, SE = .11). The
mean difference between mildly gifted Polytechnics and highly gifted

Investigating the Influence of Attribution Styles ... 30Olympians reached statistical significance using Bonferroni adjusted
alpha level of .013, p < .001. In addition, the mean difference
between moderately gifted Prefinalists and highly gifted Olympians
reached statistical significance using Bonferroni adjusted alpha
level of .013, p < .001. The group level results of this second SaaS
failure factor were not congruent with theoretical expectations. We
expected to see mildly gifted individuals prefer ‘internal-stable-
uncontrollable’ attributions; that is, failure due to lack of
ability, instead of ‘internal-unstable-controllable’.
-- Insert Table 6 about here --
Summary of Results
In this paper we have examined the influence of attribution styles on
the development of mathematical talent in three groups of
mathematically gifted Finnish adolescents and adults (n = 203).
All the participants completed the Self-confidence attitude
attribute Scales (SaaS) questionnaire (Campbell, 1996a). The
instrument included 18 items measuring the students’ ability and
effort attributions, based on Weiner’s attribution theory (1974), on
four dimensions: (1) success due to ability, (2) failure due to lack
of ability, (3) success due to effort, and (4) failure due to lack of
effort.
The research questions in this study were as follows: “(1) Are the
four dimensions of the SaaS instrument (success due to ability,
failure due to lack of ability, success due to effort, failure due to
lack of effort) identified in this domain?”, “(2) What are the best

Investigating the Influence of Attribution Styles ... 31predictors for the level of mathematical giftedness and gender among
the SaaS scale variables?” and “(3) Do the attribution styles differ
by the level of mathematical giftedness (Olympians, Prefinalists,
Polytechnics) or gender?”
The first research question was addressed with EFA. The results
showed that the four dimensions of the SaaS were present in all
samples. The overall alpha values ranged from .62 to .82. Three alpha
values were below .60 level in the group level (Olympians, factor 2,
= .56; Polytechnics, factor 2, = .59 and factor 3, = .42).
The second research question was analyzed using Bayesian
classification modeling. The classification variables were the level
of mathematical giftedness (highly = “Olympians”, moderately =
”Prefinalists” and mildly = “Polytechnics”) and gender. Eighteen SaaS
items were predictors in all the analyses. The results showed that
both Polytechnic students and females think that they “had to work
hard to get good grades.” When we further examined the female’s
preference for effort as a cause for success, we learned that the
result was true only for the Polytechnics and Prefinalists samples as
there was no difference between female and male Olympians’ responses.
Thus Verna and Campbell’s (2000) earlier finding that female
Chemistry Olympians considered ability to be a more important factor
for success was not repeated in this study. Failure due to lack of
ability was the only self-attribute scale that was able to predict
respondent’s age. The youngest students (15-28 years) believed more
in their abilities than the older ones (29-41 and 42-55 years). We
explain this finding with the fact that the younger individuals have
not yet reached as high a level in their mathematical studies as the

Investigating the Influence of Attribution Styles ... 32older ones, and thus realized that ‘the more you know, the more you
know you ought to know.’
The third research question was analyzed with 3 2 factorial
design MANOVA. Dependent variables were four SaaS factors (success
due to ability, failure due to lack of ability, success due to
effort, failure due to lack of effort). Independent variables were
the level of mathematical giftedness (highly = “Olympians,”
moderately =”Prefinalists” and mildly = “Polytechnics”) and gender.
Results showed that the level of mathematical giftedness multivariate
main effect on the SaaS factors was found to be significant. The
gender multivariate main effect on the SaaS factors and the level of
mathematical giftedness and gender multivariate interaction were not
found to be significant. Highly and moderately mathematically gifted
individuals felt that ability is more important to success than
effort. According to Dai et al. (1998), such attributions represent
self-awareness of high potentialities that constitute a necessary but
not sufficient condition for high levels of performance. Mildly
mathematically gifted individuals tended to see effort leading to
success. Mildly and moderately mathematically gifted students
attributed failure to lack of effort. The highly gifted attributed
failure to lack of ability. This finding is related to self-concept,
as mildly and moderately mathematically gifted individuals tend to
judge their efficacy favorably, whereas the highly gifted are likely
to base their appraisals of self-efficacy on the actual difficulty
levels of the tasks in question (see Dai et al., 1998, for
discussion).

Investigating the Influence of Attribution Styles ... 33
Discussion
The theoretical idea of Ellström (2001) essential to this study is
that attributions for success or failure affect potential competence,
which is a human resource each individual brings to the mathematical
problem-solving situation. So, what are the ‘good’ attributions that
give rise to individual’s potential competence? The previous research
body shows two trends: The first is seeing ability as a more
important explanation for success than effort, ‘ability is
everything’ (e.g., Heller & Lengfelder, 2000), and another is
claiming that ‘ability without effort goes nowhere’ (e.g., Campbell,
1996b; Chan, 1996; Feng, Campbell & Verna, 2001; Wu & Chen, 2001).
Why do several international Academic Olympian research teams end
up with contradictory results? The first natural explanation is
cultural differences (Campbell, Tirri, Ruohotie & Walberg, 2004). We
suggest here that the second natural explanation is statistical. In
all of the aforementioned studies, effort and ability attributions
were calculated as mean scores of 18 SaaS items: the effort scale was
measured with 12 items and the ability scale with six items (see
Table 2). The results of variable selection and EFA indicated with
the Finnish sample that keeping all 18 SaaS items on the model does
not lead to a psychometrically justified solution (effort = .63 and
ability = .27). We forced the two factor solution and calculated
internationally comparable mean scores for the Finnish Olympian
sample (n = 77), but found no difference between ability (M = 3.16,
SD = 0.32) and effort attributions (M = 3.18, SD = 0.45). It should
also be noted that the reported mean difference between ability (M =

Investigating the Influence of Attribution Styles ... 342.91, SD = 0.58) and effort (M = 3.21, SD = 0.62) scales in the
American study (Campbell, 1996b) is quite small.
The third trend in research (e.g., Schunk & Ertmer, 2000;
Zimmermann, 2000) says that ability and effort without self-
regulation goes nowhere. Figure 1 shows that ‘ability’ is present in
the “Self-Reflection” phase that precedes the “Forethought” phase
where individuals set goals and plan actions. At this point it is
important to make a distinction between an individuals’ real and
self-perceived ability level. The real ability level is what the
first research trend is speaking about, but according to the concept
of self-regulation, it is undistinguishable from the self-perceived
ability. This notion comes from the fact that effort is represented
in the preceding phase “Performance or Volitional Control” in the
cyclical self-regulation process described in Figure 1 via self-
control. It is, therefore, sending adjusting signals via self-
observation to individual’s self-perceived ability. Our result that
shows highly mathematically gifted preferring ability over effort as
an explanation for success or failure might indicate that their
perceived ability level is so high that they are able to meet the
most demanding challenges by adjusting their efforts. According to
“attribution asymmetry” phenomenon (Dai et al., 1998), high-ability
students tend to attribute their success to both ability and effort.
According to them, attributing success to ability represent self-
awareness of high potentialities that constitute a necessary but not
sufficient condition for success. Attributing success to effort has a
self-enhancing and motivating effect as one feels in control of one’s
own development.

Investigating the Influence of Attribution Styles ... 35
It is not our primary purpose to compare ability and effort only
with questions that ask which is a better explanation for success,
but rather to continue with further questions such as “What are the
best developmental practices for those individuals who mostly prefer
effort over ability as an explanation for success in a given task?”
As Campbell (1995, p. 186) says: “Achievers need four qualities:
ability, discipline, confidence and good working habits.” Thus, high
effort level as a cause for success may indicate that tasks are too
demanding and thus individuals feel that too much effort is needed to
accomplish the task. Further, this might indicate that an individual
needs more support to be convinced that he or she has the ability to
succeed. Research has shown that ability is often viewed as a stable
and uncontrollable attribution (e.g., SaaS item “7. You have to have
the ability in order to succeed in most things“). The worst scenario
for a mathematician according to some of the self-attribution
theorists (e.g., Dweck, 1999) is to blame personal ability for
failure, as it is believed to be something that you either do have or
not, an internal and stable attribution. Interestingly the most
highly mathematically gifted in this study scored highest in this
respect when compared to those who were moderately and mildly gifted.
This finding makes sense if we agree that Olympians represent the
highest mathematical giftedness level in this study and, thus, have
probably faced a lot more demanding mathematical tasks during their
lifetime than the other two group members.
Kay Alderman suggests that it is up to the teacher or trainer to
convince a learner or trainee that mathematical thinking ability as a
skill or knowledge is learnable, unstable quality (2004, 31). Thus,

Investigating the Influence of Attribution Styles ... 36knowledge of how learners or trainees use attributions to account for
success and failure can help teachers or trainers predict their
expectancies and plan intervention strategies when needed.
Limitations of the Study
In this study, we measured attribution styles with a questionnaire.
Such self-reporting allows us to study, as opposed to attribution
appraisals or causal beliefs, hypothetical success and failure
situations without clear reference to who is the performer. The first
possible source of error is the SaaS instrument translation from
English to Finnish. To control the error variance due to translation,
all the items were re-translated back to English and compared with
the original items. However, no pilot study with correlational
analyses was conducted. A second possible source of error is cross-
cultural differences between the U.S. and Finnish mathematicians
since the original instrument was developed for studies among the
U.S. mathematics Olympians. Fortunately, the language of the SaaS
items is free of cultural references. A third possible source of
error is the psychometric properties of the SaaS instrument itself as
no alpha values were reported in the original study (Campbell,
1996a).
References
Alderman, K. (2004). Motivation for achievement. Possibilities for Teaching and
Learning. Mahwah, NJ: Lawrence Erlbaum Associates.
Biggs, J. (1985). The Role of Metalearning in Study Processes. British
Journal of Educational Psychology, 55, 185-212.

Investigating the Influence of Attribution Styles ... 37Bradley, W. J., & Schaefer, K. C. (1998). The Uses and Misuses of Data and
Models. Thousand Oaks: Sage.
Campbell, J. R. (1994). Developing cross-cultural/cross-national
methods and procedures. International Journal of Educational Research, 21(7),
675-684.
Campbell, J. R. (1995). Raising your child to be gifted. Cambridge, MA:
Brookline Books.
Campbell, J. R. (1996a). Developing cross-national instruments: Using
cross-national methods and procedures. International Journal of Educational
Research, 25(6), 485-496.
Campbell, J. R. (1996b). Early identification of mathematics talent
has long-term positive consequences for career contributions.
International Journal of Educational Research, 25(6), 497-522.
Campbell, J. R., Tirri, K., Ruohotie, P., & Walberg, H. (Eds.)
(2004). Cross-cultural Research: Basic Issues, Dilemmas, and Strategies.
Hämeenlinna: RCVE.
Chan, L. (1996). Motivational orientations and metacognitive
abilities of intellectually gifted students. Gifted Child Quarterly, 40,
184-193.
Cohen, J. (1988). Statistical power analysis for the behavioral sciences. Second
edition. Hillsdale, NJ: Lawrence Erlbaum Associates.
Dai, D. Y, Moon, S. M., & Feldhusen, J. F. (1998). Achievement
Motivation and Gifted Students: A Social Cognitive Perspective.
Educational Psychologist, 33(2/3), 45-63.
Dweck, C. (1999). Self theories: Their role in motivation, personality and development.
Philadelphia, PA: Psychology Press.

Investigating the Influence of Attribution Styles ... 38Ellström, P.-E. (2001). The many meanings of occupational competence
and qualification. In W. J. Nijhof & J. N. Streumer (Eds.), Key
Qualifications in Work and Education (pp. 39-50). Dordrecht: Kluwer
Academic Publishers.
Enman, M., & Lupart, J. (2000). Talented Female Students’ Resistance
to Science: an exploratory study of post-secondary achievement
motivation, persistence, and epistemological characteristics. High
Ability Studies, 11(2), 161-178.
Feng, A., Campbell, J. R., & Verna, M. (2001). The Talent Development
of American Physics Olympians. Gifted and Talented International, 16(2),
108-114.
Hair, J. F., Anderson, R. E., Tatham, R. L., & Black, W. C. (1998).
Multivariate Data Analysis. Fifth edition. Englewood Cliffs, NJ:
Prentice Hall.
Heider, F. (1958). The psychology of interpersonal relationships. New York:
Wiley.
Heller, K., & Lengfelder, A. (2000, April). German Olympiad study on
mathematics, physics and chemistry. Paper presented at the annual meeting
of American Educational Research Association, New Orleans, USA.
Hilario, M., Kalousisa, A., Pradosa, J., & Binzb, P.-A. (2004). Data
mining for mass-spectra based diagnosis and biomarker discovery.
Drug Discovery Today: BIOSILICO, 2(5), 214-222.
Hsu, W. H. (2004). Genetic wrappers for feature selection in decision
tree induction and variable ordering in Bayesian network
structure learning. Information Sciences, 163(1-3), 103-122.
Huberty, C. (1994). Applied Discriminant Analysis. New York: John Wiley &
Sons.

Investigating the Influence of Attribution Styles ... 39Kerlinger, F. (1986). Foundations of Behavioral Research. Third Edition. New
York: CBS College Publishing.
Kerr, B. (1994). Smart girls: A new psychology of girls, women and giftedness.
Second edition. Scottsdale, AZ: Gifted Psychology Press.
Marsh, H. (1983). Relationships among Dimensions of Self-Attribution, Dimensions of
Self-Concept and Academic Achievements. ERIC Document Reproduction
Service No. ED 243 914.
Marsh, H., & O’Neill, R. (1984). Self Description Questionnaire III:
The construct validity of multidimensional self-concept ratings
by late adolescents. Journal of Educational Measurement, 21, 153-174.
Multon, K. D., Brown, S. D., & Lent, R. W. (1991). Relation of self-
efficacy beliefs to academic outcomes: A meta-analytic
investigation. Journal of Counseling Psychology, 38, 30-38.
Myllymäki, P., Silander, T., Tirri, H., & Uronen, P. (2002). B-
Course: A Web-Based Tool for Bayesian and Causal Data Analysis.
International Journal on Artificial Intelligence Tools, 11(3), 369-387.
Nokelainen, P., Ruohotie, P., & Tirri, H. (1999). Professional Growth
Determinants - Comparing Bayesian and Linear Approaches to
Classification. In P. Ruohotie, H. Tirri, P. Nokelainen and T.
Silander (Eds.), Modern Modeling of Professional Growth vol. 1 (pp. 85-120).
Hämeenlinna: RCVE.
Nokelainen, P., & Tirri, H. (2004). Bayesian Methods that Optimize
Cross-cultural Data Analysis. In J. R. Campbell, K. Tirri, P.
Ruohotie & H. Walberg (Eds.), Cross-cultural Research: Basic Issues, Dilemmas,
and Strategies (pp. 141-158). Hämeenlinna: RCVE.

Investigating the Influence of Attribution Styles ... 40Nokelainen, P., Tirri, K., & Campbell, J. R. (2004). Cross-cultural
Predictors of Mathematical Talent and Academic Productivity. High
Ability Studies, 15(2), 230-242.
Nokelainen, P., Tirri, K., Campbell, J. R., & Walberg, H. (2004).
Isolating Factors that Contribute or Hinder Adult Productivity:
Comparing the Terman Longitudinal Studies with the Retrospective
Olympiad Studies. In J. R. Campbell, K. Tirri, P. Ruohotie, & H.
Walberg (Eds.), Cross-cultural Research: Basic Issues, Dilemmas, and Strategies
(pp. 119-140). Hämeenlinna: RCVE.
OECD (2001). Knowledge and Skills for Life. First Results from the OECD Programme for
International Student Assessment (PISA) 2000. Paris: OECD Publications.
OECD (2004). Learning for Tomorrow’s World. First Results from PISA 2003. Paris:
OECD Publications.
Ramsden, P., & Entwistle, N. (1981). Effects of Academic Departments
on Students’ Approaches to Studying. British Journal of Educational
Psychology, 51, 368-383.
Reis, S. (1998). Work left undone. Mansfield Center, CT: Creative
Learning Press.
Ruohotie, P., & Nokelainen, P. (2000). Modern modeling of student
motivation and self-regulated learning. In P. R. Pintrich & P.
Ruohotie (Eds.), Conative Constructs and Self-Regulated Learning (pp. 141-
193). Hämeenlinna: RCVE.
Schunk, D. H., & Ertmer, P. A. (2000). Self-regulation and academic
learning. In M. Boekaerts, P. R. Pintrich, & M. Zeidner (Eds.),
Handbook of Self-Regulation (pp. 631-650). San Diego CA: Academic Press.

Investigating the Influence of Attribution Styles ... 41Siegle, D., & Reis, S. (1998). Gender differences in teacher and
student perceptions of gifted students’ ability and effort. Gifted
Child Quarterly, 42(1), 39–47.
Silander, T., & Tirri, H. (1999). Bayesian classification. In P.
Ruohotie, H. Tirri, P. Nokelainen, & T. Silander (Eds.), Modern
Modeling of Professional Growth vol. 1 (pp. 61-84). ). Hämeenlinna: RCVE.
Silander, T., & Tirri, H. (2000, April). Model Selection for Bayesian
Networks. Paper presented at the annual meeting of American
Educational Research Association, New Orleans, USA.
Strein, W. (1995). Assessment of Self-concept. ERIC Document Reproduction
Service No. ED 389 962.
Tabachnick, B., & Fidell, L. (1996). Using Multivariate Statistics. New York:
Harper Collins.
Tirri, K. (2001). Finland Olympiad Studies: What Factors Contribute
to the Development of Academic Talent in Finland? Educating Able
Children, 5(2), 56-66.
Tirri, K. (2002). Developing Females’ Talent: Case Studies of Finnish
Olympians. Journal of Research in Education, 12(1), 80-85.
Tirri, K., & Campbell, J. (2002). Actualizing mathematical giftedness
in adulthood. Educating Able Children, 6(1), 14-20.
Vermeer, H. J., Boekaerts, M., & Seegers, G. (2000). Motivational and
gender differences: Sixth-grade students’ mathematical problem-
solving behavior. Journal of Educational Psychology, 92, 308-315.
Verna, M., & Campbell, J. R. (2000, April). Career orientations for American
Chemistry Olympians. Paper presented at the annual meeting of
American Educational Research Association, New Orleans, USA.

Investigating the Influence of Attribution Styles ... 42Weiner, B. (1974). Achievement motivation and attribution theory. Morristown,
NJ: General Learning Press.
Weiner, B. (1980). The role of affect in rational (attributional)
approaches to human motivation. Educational Researcher, 9, 4-11.
Weiner, B. (1986). An attributional theory of motivation and emotion. New York:
Springer.
Weiner, B. (1992). Human motivation: Metaphors, theories and research. Newbury
Park, CA: Sage.
Weiner, B. (1994). Integrating social and personal theories of
achievement striving. Review of Educational Research, 64, 557-573.
Weiner, B. (2000). Intrapersonal and Interpersonal Theories of
Motivation from an Attributional Perspective. Educational Psychology
Review, 12(1), 1-14.
Wu, W., & Chen, J. (2001). A follow-up study of Taiwan physics and
chemistry Olympians: The role of environmental influences in
talent development. Gifted and Talented International, 16(1), 16-26.
Zimmerman, B. J. (1998). Developing self-fulfilling cycles of
academic regulation: An analysis of exemplary instructional
models. In D. H. Schunk & B. J. Zimmerman (Eds.), Self-Regulated
Learning: From Teaching to Self-Reflective Practice (pp. 1-19). New York: The
Guilford Press.
Zimmerman, B. J. (2000). Attaining self-regulation. A social
cognitive perspective. In M. Boekaerts, P. R. Pintrich, & M.
Zeidner (Eds.), Handbook of self-regulation (pp. 13-39). San Diego:
Academic Press.
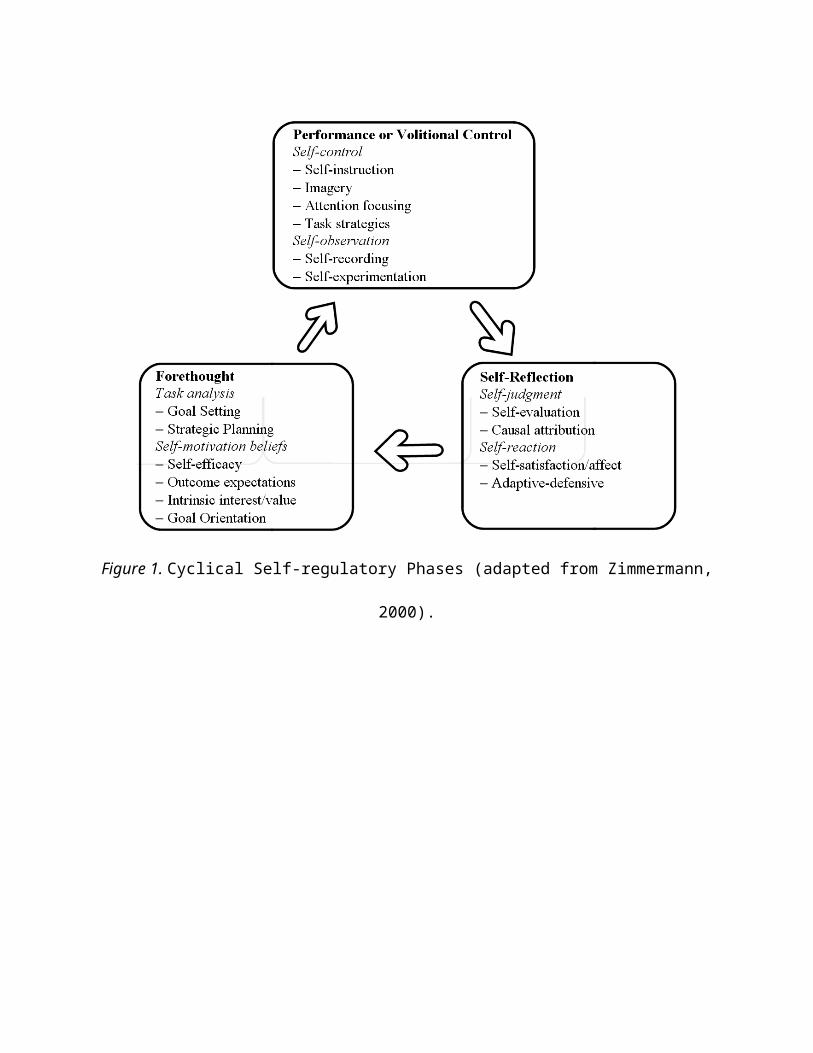
Figure 1. Cyclical Self-regulatory Phases (adapted from Zimmermann,
2000).

Table 1 Description of Mathematics Olympians, Prefinalists and PolytechnicsData
Olympians(n = 77)
Prefinalists(n = 52)
Polytechnics(n = 74)
n % n % n %Gender Male 68 88 43 83 40 54 Female 9 12 9 17 34 46Age Median 37 years 17 years 24 years Range 20 – 55
years15 – 20 years 20 – 34 years
Note. Total N of the data is 203.

Table 2 Descriptive Statistics and Attribution Dimensions of the Self-confidence Attribute Attitude Scale
Olympians (n =77)
Prefinalists (n =
52)
Polytechnics (n =
74)Stable –Unstable
a
Controllable–
Uncontrollable bItem M SD M SD M SD
Effort (12 items)1. I did poorly only when I did not work hard enough.
3.79 0.97 3.56 1.15 3.46 1.15 U C
2. You can be successful in anything if you work hard enoughat it.
3.27 1.23 3.78 1.03 3.99 0.85 U C
6. When I scored low ona test, it was because I didn’t study hard enough.
3.92 0.79 3.63 0.97 3.53 0.95 U C
8. My achievement wouldhave been better if I tried harder.
3.29 1.25 3.83 0.96 4.09 0.69 U C
9. Self-discipline is the key to school success.
3.27 0.91 3.47 0.92 3.41 1.06 S C
10. The smart kids tried the hardest.
2.43 0.93 2.81 0.95 2.22 0.93 S C
11. Poor study habits are the main cause of low grades.
3.32 0.91 3.44 0.98 3.54 1.04 U C
12. I had to work hard to get good grades.
2.11 0.95 2.08 0.95 2.74 1.03 S C
15. When I didn’t understand something, it meant I didn’t put in enough time.
3.69 0.87 3.58 1.07 3.51 0.94 U C
16. I could have done better in mathematics if I had worked harder.
3.11 1.17 3.81 1.05 4.01 0.85 U C
17. Hard work is the key to get good grades.
2.83 1.05 2.77 1.13 3.00 0.89 S C
18. I let people down when I don’t work hard enough.
2.64 1.05 2.62 1.14 2.45 1.09 U C
Ability (6 items)3. There are some things you can not do
3.68 1.19 3.29 1.17 2.97 1.19 S U

no matter how hard you try.4. I worked harder if Iliked the teacher.
3.16 1.22 3.57 1.24 3.77 0.99 U C
5. Being smart is more important than working hard.
2.99 1.03 3.23 0.92 2.64 1.03 S U
7. You have to have theability in order to succeed in most things.
3.92 0.74 3.90 0.69 3.86 0.75 S U
13. When I did poorly in school it was because I did not have the needed ability.
2.46 1.04 2.37 0.98 2.09 0.80 S U
14. Why work in an areawhere your ability is low?
2.81 1.03 2.75 1.23 2.58 1.16 S U
a Stable and unstable attributions refer to consistent or inconsistentcause over time. b Controllable and uncontrollable attributions referto extent person believes he or she has control over the cause of anoutcome.

Table 3 Correlations Between the Self-confidence Attribute Attitude ScaleFactors
1 2 3 41. Success due to ability (item5)
1.000
2. Failure due to lack of ability (items 3, 13)
.135 1.000
3. Success due to effort (items9, 12, 17)
-.194** -.052 1.000
4. Failure due to lack of effort (items 8, 16)
.151* -.286** .171* 1.000
Note. Item descriptions are in the Table 2.
* p < .05. ** p < .01. (Two-tailed.)

Table 4Self-confidence Attribute Attitude Scale Factors by Attribution Dimensions
InternalControllable Uncontrollable
Items Factors Items Factors
Stable 9, 12,17
Success due to effort
5 3, 13
Success due to ability Failure due to lack of ability
Unstable 8, 16 Failure due to lackof effort

Table 5Importance Ranking of the Self-confidence Attribute Attitude Scale Items by the Level ofGiftedness and Gender
The Level of Giftedness GenderDrop c Olympians
(n = 77)Prefinalis
ts (n = 52)
Polytechnics
(n = 74)
Male (n = 149)
Female (n = 52)
Class and Predictor variables % M SD M SD M SD M SD M SD
The Level of Giftedness a
10. The smart kids tried the hardest. 14.36 2.43 0.93 2.81 0.95 2.22 0.9316. I could have done better inmathematics if I had worked harder. 7.92 3.11 1.17 3.81 1.05 4.01 0.8512. I had to work hard to get good grades. 6.93 2.11 0.95 2.08 0.95 2.74 1.035. Being smart is more important than working hard. 4.95 2.99 1.03 3.23 0.92 2.64 1.033. There are some things you can not do no matter how hard you try. 3.96 3.68 1.19 3.29 1.17 2.97 1.194. I worked harder if I liked the teacher. 2.48 3.16 1.22 3.57 1.24 3.77 0.998. My achievement would have been better if I tried harder. 1.98 3.29 1.25 3.83 0.96 4.09 0.69
Gender b
12. I had to work hard to get good grades. 6.93 2.23 0.96 2.67 1.10

8. My achievement would have been better if I tried harder. 6.44 3.68 1.13 3.85 0.872. You can be successful in anything if you work hard enough at it. 3.96 3.65 1.14 3.71 0.981. I did poorly only when I did not work hard enough. 3.47 3.67 1.11 3.43 1.0314. Why work in an area where your ability is low? 2.97 2.78 1.13 2.61 1.025. Being smart is more important than working hard. 1.98 2.96 0.99 2.86 1.06
aClassification accuracy is 65 per cent. bClassification accuracy is 80 per cent. cDecrease in predictive classification if item is dropped from the classification model.

Table 6Tests of the Level of Giftedness, Gender, and Their Interaction
IV DV Univariate F df Stepdown F
a df 2
The Level of Giftedness SUC_ABI 3.28*
2,194 3.28*
2,194 .01 .03
FAI_ABI 11.99***2,194 11.20***
2,193 .01 .10
SUC_EFF 4.12*2,194 3.05*
2,192 .01 .03
FAI_EFF 17.80***2,194 11.43***
2,191 .01 .11
Gender SUC_ABI 0.001,194 0.00
1,194 .01 .00
FAI_ABI 0.911,194 0.92
1,193 .01 .00
SUC_EFF 0.131,194 0.11
1,192 .01 .00
FAI_EFF 0.181,194 0.09
1,191 .01 .00
Group by gender SUC_ABI 1.00
2,194 1.00
2,194 .01 .01
FAI_ABI 0.092,194 0.16
2,193 .01 .00
SUC_EFF 0.232,194 0.38
2,192 .01 .00

FAI_EFF 0.732,194 0.26
2,191 .01 .00
a Roy-Bargman stepdown F.
Note. = Adjusted alpha level. 2 = Effect size for the stepdown F. SUC_ABI =Success due to ability. FAI_ABI = Failure due to lack of ability. SUC_EFF =Success due to effort. FAI_EFF = Failure due to lack of effort.
* p < .05. ** p < .01. *** p < .001.

III


Modeling Students' Motivational Profile ... 1
CHAPTER 7
Modeling Students’ Motivational Profile forLearning in Vocational Higher Education
Petri Nokelainen and Pekka RuohotieUniversity of Tampere
Introduction
The Abilities for Professional Learning (APL) questionnaire (Ruohotie,
2000b) was designed to measure 15 factors of motivation and
learning strategies. This chapter examines the validity of
six factors of the motivational part of the APL self-report
instrument. The next chapter will focus on the development
and validation of instruments to assess strategic skills in
learning.
We agree with Boekaerts (2001, p. 18) that the problem
with extensively used self-report questionnaires is that
they do not provide insight into students’ personal
motivation traits in actual classroom learning situations as
they are in most cases developed for measuring traits of
domain-specific motivation. However, there is a shift in the
way the research methodology is applied in the context of
motivational research, as there is growing number of moments
when the students are not present simultaneously in the
classroom where it is easiest to conduct the observation of
general motivation traits. We refer here to computer-

Modeling Students' Motivational Profile ... 2
supported collaborative learning (CSCL) and other forms of
distance learning exercised in the virtual university
studies. Järvelä and Niemivirta (2001, 108) approach this
issue by challenging the researchers within the framework of
computer-supported collaboration and learning to focus on
both learners’ intrinsic and extrinsic motivational
processes. In a series of empirical case studies they
approach this challenge with multi-faceted research
methodology using questionnaires, videotaping of students’
learning activity, stimulated recall-interviews, and
repeated process-oriented interviews (Järvelä & Niemivirta,
2001, pp. 115-122).
It is clear that in order to study complex phenomenon
such as student motivation, both multi-faceted theoretical
and methodological approach is required. Unfortunately,
severe limitations for data collection exist in the context
of virtual university learning. Teacher or tutor has few
face-to-face discussions with the students. In fact, as an
expert in certain area, she has to deal each time with a new
group of attendees’. Furthermore, study processes including
collaborative actions, such as group works are conducted
through the distance learning platforms.
We believe that as the volume in virtual studies
increases, the personal face to face tutoring time for each
student decreases and leads to situation where the guidance
is conducted via synchronous (chat) or asynchronous (email)
Modeling Students' Motivational Profile ... 3
tools. In this hectic situation the teacher or tutor has to
make good use of all the available information channels in
order to understand the personal needs of each student.
Nokelainen and Tirri (2002) discuss in their article how to
utilize computerized self-rating instruments in the context
of virtual university studies.
Theoretical Framework
Learner-centered Learning and Motivation
Learning in the virtual university is intended to be
learner-centered, thus the various learning environments are
expected to meet the needs of diverse student populations,
while aiming to provide both high quality and cost-effective
learning opportunities (Nokelainen, Silander, Tirri, H.,
Nevgi & Tirri, K., 2001).
Throughout the 1990's learner-centered learning
environments and computer-mediated communication (CMC)
systems such as problem-based, project-based, cognitive
apprenticeships, constructivist learning environments, and
goal-based scenarios, have rather focused on the affordances
they provide learners for effecting their way of learning
and thinking, than transmitting information from teachers to
learners (Land & Hannafin, 2001).
Learner-centered learning is supported theoretically by
various overlapping pedagogical concepts such as self-
directed learning (Candy, 1991), student-centered

Modeling Students' Motivational Profile ... 4
instruction or learning (Felder & Brent, 1996), active
learning (Ramsden, 1992), vicarious learning (Lee &
McKendree, 1999) and cooperative learning (Felder & Brent,
2001). For example, self-directed learning involves
dimensions of process and product referring to four related
phenomena: personal autonomy, self-management, learner-
control and autodidaxy (Candy, 1991). All these dimensions
are present in the process of learner-centered learning
where the locus of control is shifted from teacher to the
learner who has now a greater responsibility for her own
learning.
Learning tasks in learner-centered learning environments
include such techniques as substituting active learning
experiences for lectures, holding students responsible for
material that has not been explicitly discussed in class,
assigning open-ended problems and problems requiring
critical or creative thinking, and using self-paced and/or
cooperative learning. The research findings of educational
literature prove convincingly that properly implemented
student-centered learning fosters motivation and elicits
deeper understanding toward the subject being taught (Felder
& Brent, 1996, 2001; Dillinger, 2001).
The learner-centered principles (APA, 1997) present a
shift from the traditional teacher-centered approach to
learner-centered approach of instruction providing learner
with valuable real-life skills (Dillinger, 2001).
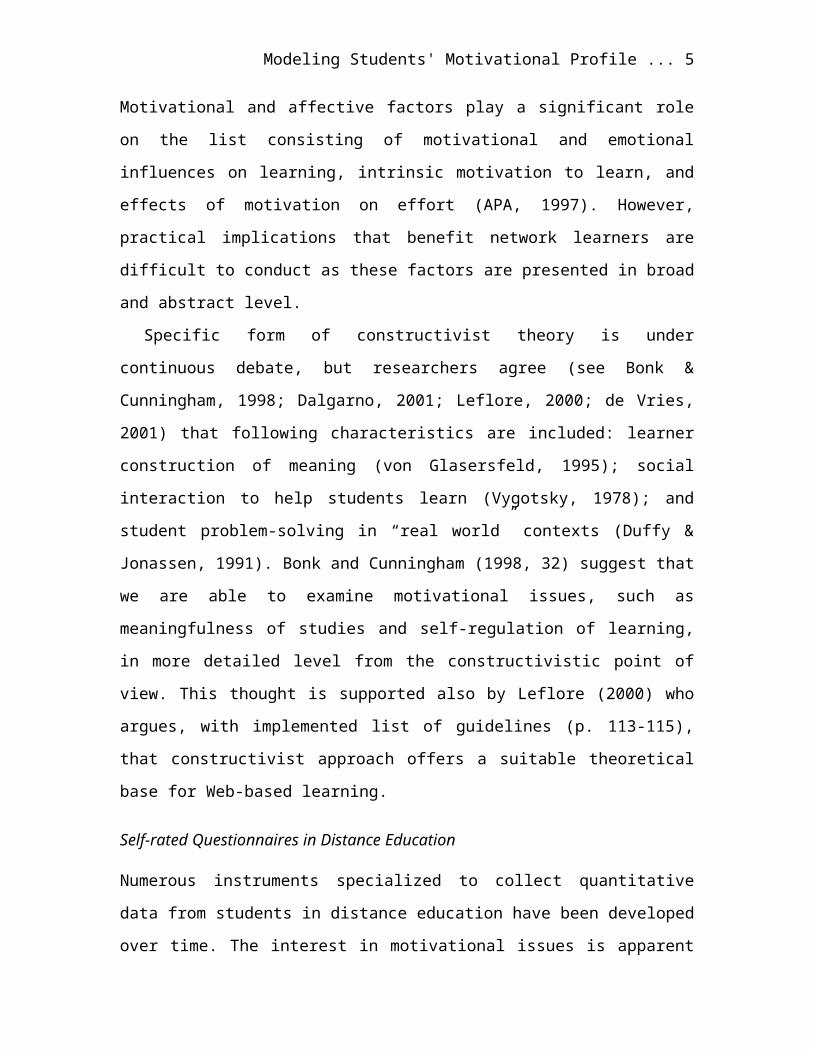
Modeling Students' Motivational Profile ... 5
Motivational and affective factors play a significant role
on the list consisting of motivational and emotional
influences on learning, intrinsic motivation to learn, and
effects of motivation on effort (APA, 1997). However,
practical implications that benefit network learners are
difficult to conduct as these factors are presented in broad
and abstract level.
Specific form of constructivist theory is under
continuous debate, but researchers agree (see Bonk &
Cunningham, 1998; Dalgarno, 2001; Leflore, 2000; de Vries,
2001) that following characteristics are included: learner
construction of meaning (von Glasersfeld, 1995); social
interaction to help students learn (Vygotsky, 1978); and
student problem-solving in “real world” contexts (Duffy &
Jonassen, 1991). Bonk and Cunningham (1998, 32) suggest that
we are able to examine motivational issues, such as
meaningfulness of studies and self-regulation of learning,
in more detailed level from the constructivistic point of
view. This thought is supported also by Leflore (2000) who
argues, with implemented list of guidelines (p. 113-115),
that constructivist approach offers a suitable theoretical
base for Web-based learning.
Self-rated Questionnaires in Distance Education
Numerous instruments specialized to collect quantitative
data from students in distance education have been developed
over time. The interest in motivational issues is apparent

Modeling Students' Motivational Profile ... 6
as we examine the structure of the instruments. For example,
Bigg’s (1985) 42-item Study Process Questionnaire (SPQ) consists
of two scales (motive and strategy) with three approaches:
(1) surface, (2) deep, and (3) achieving. The questionnaire
contains six subscales (surface motive, deep motive,
achieving motive, surface strategy, deep strategy, and
achieving strategy). Also Entwistle’s and his colleagues
(Ramsden & Entwistle, 1981) Approaches to Studying Inventory (ASI),
as one of the most widely used questionnaire on student
learning in higher education, contains subscales including,
for example, fear of failure, extrinsic motivation, and
achieving orientation.
Richardson made an extensive review of quantitative
research instruments applied to studying campus-based and
distance education (2001). He found that broadly the same
factors underlied the responses given by distance learning
and campus-based students. Richardson concluded that a
productive rapprochement can be achieved between the two
previously separate research communities, and the findings
in the mainstream research literature concerned with
approaches to studying in campus-based higher education will
be broadly valid for understanding approaches studying in
distance education (Richardson, 2001, viii).

Modeling Students' Motivational Profile ... 7
Development of Professional Learning Instruments
Paul Pintrich and his colleagues (Pintrich, Smith, Garcia &
McKeachie, 1991, 1993) developed the Motivated Strategies for
Learning Questionnaire (MSLQ) to assess students' self-rated
motivation and cognition in the classroom. Winne and Perry
(2000) categorize the MSLQ to the aptitude measurements of
self-regulated learning.
As the MSLQ was targeted for measuring college student
learning, Finnish researchers developed the first
adaptation, Motivation and Learning Strategies for Adult Education, for
the field of vocational education in the “Growth Needs”
project during 1992-1994 (Ruohotie, 1994). The first version
of the instrument, with 40 items measuring motivational
scale, was tested with both adult learners of several
companies acting in Finnish business sector and adolescent
learners of vocational education institutes. Total sample
size of this initial study was 156 respondents (Ruohotie,
1994; Kautto-Koivula, 1996).
After this period, ongoing project titled “Motivation and
Self-Regulated Learning in Vocational Education” (Ruohotie
1999), continued the development process producing the
second version, Motivated Strategies for Professional Learning
(Ruohotie, 1998). This version had the same number of items
(40) on the motivational scale, but the phrasing of items
was improved and the relationship of items to theoretical
structure was validated. This version was tested with

Modeling Students' Motivational Profile ... 8
adolescent learners of various Finnish vocational education
institutes; total sample size was 693 students.
Abilities for Professional Learning Questionnaire
The latest version, Abilities for Professional Learning (APLQ,
Ruohotie, 2000b), still retains the same basic structure as
the MSLQ measuring both motivational factors and learning
strategies based on Pintrich’s motivational expectancy model
(1988). (Table 1.)
Table 1. Elaboration of the Motivational Scale for
Professional Learning
Motivation andLearning Strategiesfor Adult Education(Ruohotie, 1994)
MotivatedStrategies forProfessional
Learning(Ruohotie, 1998)
Abilities forProfessionalLearning
(Ruohotie, 2000b)
Value Components Intrinsic Goal Orientation Extrinsic Goal Orientation Task Value of LearningExpectancy Components Intrinsic Control Beliefs Extrinsic Control Beliefs Self-Efficacy Expectancy for SuccessAffective Components Test Anxiety
Value Components Intrinsic Goal Orientation Task Value of Learning
Expectancy Components Intrinsic Control Beliefs Extrinsic Control Beliefs Self-Efficacy Expectancy for SuccessAffective Components Test Anxiety Self-Worth
Value Components Intrinsic Goal Orientation Extrinsic Goal Orientation Meaningfulness of StudyExpectancy Components Control Beliefs Self-Efficacy
Affective Components Test Anxiety

Modeling Students' Motivational Profile ... 9
Self-Worth
Method
Sample and Procedure
Our target organization in this study, a Finnish polytechnic
institution of higher education, has over 7000 students and
a staff of over 700, approximately half of which are
teachers. Most of the students are adolescents (18 – 27
years), but training programmes for adults exist, too. The
institution is situated in eight geographical units in the
Province of Southern Finland within an area of seven
municipalities. This is the most populated area in Finland
and about half of all Finns live within the Polytechnic's
sphere of influence. The polytechnic institution of higher
has five degree programmes: 1) Technology and
communications; 2) Business and administration; 3) Natural
resources; 4) Culture; 5) Health care and social services.
The sample consists of 459 students who had started their
studies in 1998 or 1999. They were thus second (n = 281,
61%) or third (n = 164, 35%) year students during March
2000. The sample represents 32% of the survey population (n
= 1436) and consists of 323 (70%) female and 134 (29%) male
participants. The respondents were divided into three groups
based on their age: (1) below 21 years (n = 195, 43%), (2)
from 21 to 27 years (n = 225, 49%), and (3) above 27 years (n
= 35, 8%). Most of the students (n = 443, 96%) are

Modeling Students' Motivational Profile ... 10
adolescents, only ten respondents (2%) study in the adult
degree program. All of the eight geographical units and five
degree programmes of the polytechnic institution are
represented in this study.
The heads of each degree program were asked for their
opinion about the propositions in the APLQ, and the
principle teachers were trained by the researchers to give
support in problematic situations to the students as they
fill out the questionnaire. The APLQ was delivered in two
forms: as a traditional paper and pen test (n = 459), and as
a computerized adaptive test (n = 205) based on Bayesian
probabilistic modeling. In this article, we report the
results and structural validation of the paper and pen
questionnaire.
Measurement Instrument
Students responded to 28 items on a 5-point scale. The total
number of items in the APLQ is 116 as the questionnaire
measures four dimensions of professional learning: 1)
Learning experiences and motivation, 28 items; 2) Study habits, 40
items; 3) Quality of teaching, 23 items; 4) Effects and outcomes of
education, 25 items. The response options varied from 1
(completely disagree) to 5 (completely agree). Students also
completed a short background information questionnaire
containing following sections: age, gender, starting year of
studies, degree program, and degree mode (adolescent or
adult). As the detailed theoretical background of the APLQ

Modeling Students' Motivational Profile ... 11
is reported elsewhere (Ruohotie, 2000b, 2002), we describe
here only the features that are relevant to the psychometric
validation process of the first, motivational part of the
questionnaire.
Motivation category of the APLQ has three sections: 1)
Value section; 2) Expectancy section; 3) Affective section.
The value section has three subscales: 1.1) Intrinsic goal
orientation; 1.2) Extrinsic goal orientation; 1.3)
Meaningfulness of study. The expectancy section consists of two
subscales: 2.1) Control beliefs and 2.2) Self-efficacy. The
affective section includes one component: 3.1) Test anxiety.
(Table 2.) Reader is encouraged to see Appendix for full
item list of APLQ.
Table 2. Theoretical Structure and Related Items of the
Motivational Scale of Abilities for Professional Learning
Questionnaire
Motivational Scale (A) Factors Items (28) in APLQ
1. Value Components 1.1 Intrinsic Goal Orientation
MF1 A1, A18, A23, A25
1.2 Extrinsic Goal Orientation
MF2 A8, A13, A27
1.3 Meaningfulness of Study
MF3 A4 (rev.), A5, A11, A15,A19, A24, A28
2. Expectancy Components 2.1 Control Beliefs MF4 A2, A10, A20, A26 2.2 Self-Efficacy MF5 A6, A7, A12, A17, A223. Affective Components 3.1 Test Anxiety MF6 A3, A9, A14, A16, A21

Modeling Students' Motivational Profile ... 12

Modeling Students' Motivational Profile ... 13
Statistical Analyses
The statistical procedures were conducted in five stages: 1)
Variable selection based on descriptive statistics; 2)
Analysis of communalities; 3) Bayesian dependency modeling;
4) Explorative factor analysis; 5) Bayesian unsupervised
model-based visualization.
First, we analyzed all the twenty-eight items to see if
they were technically applicable for linear statistic
computations, such as explorative and confirmatory factor
analysis, based on multivariate normality assumption.
Bayesian modeling techniques are in most cases free from
such presuppositions (Congdon, 2001, p. 1; Nokelainen,
Ruohotie & Tirri, 1999, p. 113). Second, we investigated the
data exploratively with factor analysis to see if the six
dimensions (motivational factors) are identified in this
domain. In the third stage of the analysis we examined
probabilistic dependences between all variables with
Bayesian search algorithm (Myllymäki, Silander, Tirri &
Uronen, 2001) in order to find a model with the highest
probability. The fourth stage was to conduct the traditional
construct validity test with Cronbach’s alpha (Cronbach,
1951). The task for the last analysis method, Bayesian
unsupervised model-based visualization (Kontkanen, Lahtinen,
Myllymäki & Tirri, 2000), was to provide information how the
derived factors are interrelated in individual level.

Modeling Students' Motivational Profile ... 14
Results
Variable Selection Based on Descriptive Statistics
The aim of the first stage was to examine learning
motivation variables and choose the acceptable ones for
explorative factor analysis. Frequency analyses were
carried out for all the variables. The results are presented
in Table 3.
Table 3 shows that respondents used the whole scale from 1
to 5, except for five propositions the scale was from 2 to
5. This leads to a notion that distribution of the mode is
strongly biased towards positive values: 1) n = 2; 2) n = 3;
3) n = 8, 4) n = 15; 5) n = 0. (Table 3.)

Modeling Students' Motivational Profile ... 15
Table 3. Descriptive Statistics of the Motivational Scale of Abilitiesfor Professional Learning Questionnaire
Min. Max. Mo M SDSkewness StatisticStd. Err.
KurtosisStatisticStd. Err.
A1 1 5 4 3.57 0.90 -0.20 0.11 -0.54 0.23A2 2 5 4 4.08 0.80 -0.69 0.11 0.18 0.23A3 1 5 1 1.77 0.91 1.07 0.11 0.38 0.23A4 1 5 2 2.59 1.13 0.30 0.11 -0.83 0.23A5 1 5 4 4.18 0.78 -0.79 0.11 0.46 0.23A6 1 5 3 3.34 0.83 -0.13 0.11 0.06 0.23A7 1 5 3 3.07 1.06 0.00 0.11 -0.75 0.23A8 1 5 4 3.68 1.00 -0.56 0.11 -0.08 0.23A9 1 5 4 2.85 1.16 0.00 0.11 -1.04 0.23A10 1 5 3 3.10 1.05 0.06 0.11 -0.81 0.23A11 2 5 4 4.08 0.76 -0.46 0.11 -0.26 0.23A12 1 5 4 3.57 0.85 -0.32 0.11 -0.21 0.23A13 1 5 3 2.88 0.98 0.16 0.11 -0.46 0.23A14 1 5 2 2.22 1.17 0.75 0.11 -0.41 0.23A15 1 5 3 3.23 1.02 -0.04 0.11 -0.59 0.23A16 1 5 2 2.52 1.09 0.37 0.11 -0.66 0.23A17 1 5 4 3.72 0.81 -0.34 0.11 -0.05 0.23A18 1 5 4 3.65 0.92 -0.26 0.11 -0.42 0.23A19 1 5 4 4.05 0.90 -0.82 0.11 0.25 0.23A20 2 5 4 4.29 0.71 -0.77 0.11 0.34 0.23A21 1 5 1 1.83 1.01 1.22 0.11 0.94 0.23A22 1 5 4 3.80 0.82 -0.42 0.11 -0.01 0.23A23 1 5 3 3.37 0.93 -0.10 0.11 -0.34 0.23A24 2 5 4 4.28 0.73 -0.72 0.11 0.04 0.23A25 1 5 4 3.47 0.88 -0.45 0.11 0.04 0.23A26 1 5 3 3.18 0.99 -0.04 0.11 -0.57 0.23A27 1 5 3 3.14 1.08 -0.10 0.11 -0.63 0.23A28 2 5 4 3.95 0.80 -0.31 0.11 -0.54 0.23
Numerous publications declare that certain attributes
belong to data that is appropriate for multivariate analysis
(e.g., Tabachnick & Fidell, 1996, pp. 13-17; Thompson, 1999;

Modeling Students' Motivational Profile ... 16
Bradley & Schaefer, 1998, pp. 79-83). The most common
criteria’s for accepting variables for further multivariate
analysis are: 1) Standard deviation maximum half the mean;
2) Skewness less than +/- .3; 3) Correlation between
+/- .3-.7. Data examination results for the items in the
learning motivation part of the instrument are presented in
Table 4. The table indicates lowest rejection rate (7%) for
the third criteria and highest (93%) for the second
criteria.
Table 4. Criteria for Motivational Scale Item Rejection
Criteria Items (n = 28)Accepted n (%)
Rejected n (%)
Rejected Items
1. SD 25 (89) 3 (11) A3, A14, A212. Skewness +/- .3
2 (7) 26 (93)
+/- .5 9 (32) 19 (68)+/- .7 17 (61) 11 (39) A3, A4, A5, A7,
A9, A10, A14, A19, A20, A21, A24
+/- .8 22 (79) 6 (21) A3, A4, A9, A10, A19, A21
+/- .9 25 (89) 3 (11) A3, A19, A213. Correlation 26 (93) 2 (7) A13, A15
The first and second criteria for item rejection were
inspected with the help of descriptive statistics presented
in Table 3. Examination suggested rejection of three
variables (A3, A14, A21) based on the first criteria, and
rejection of 26 variables based on the second criteria. As

Modeling Students' Motivational Profile ... 17
it seemed impossible to take the second criteria literally
due to high rejection rate at .3 level, we examined the
skewness of variables at four additional levels of which .8
proved to be suitable for this data set (Table 4). In order
to strengthen our opinion about the right acceptance level
based on skewness of the variables, we compared the results
to our previous study aimed to develop the first version of
the APLQ instrument (Ruohotie & Nokelainen, 2000a). The data
consisted of 156 adults working in a Finnish telemedia
company. We also used for selected evaluation tasks the
comparison data consisting of 512 adolescents studying at
Finnish polytechnic institution. The results were almost
identical with this comparison data set suggesting rejection
level between .8 and .9.
Spearman nonparametric correlation was calculated due to
use of discrete scale in the questionnaire. The variables
correlated satisfactory and their scale ranged from -.34
to .74 (M = .10, SD = .20). We suggest rejection of two
variables (A13, A15) from the analysis on the basis of the
third criteria. Examination of the correlation matrix proved
that 255 out of 392 correlations (65%) were significant at
the .01 level and 30 correlations (8%) were significant at
the .05 level. The correlation matrix contained 107
uncorrelated pairs of variables (27%). The significant
correlations on both levels (.01 and .05) and non-
significant correlations were uniformly distributed. (Table

Modeling Students' Motivational Profile ... 18
4.) Inter-item correlations (.41 - .78) did not indicate
multicollinearity or singularity.
After comparing the results of the rejection criteria’s we
decided to reject four variables, namely A3, A13, A15, and
A21. Reader should notice that we intend to use the
variables in following phases three and four that are based
on Bayesian modeling.
Table 5 shows the results of reliability analysis
supporting our rejection decisions. In the original solution
Cronbach’s Alpha level is good for only two factors (Self-
Efficacy, Test Anxiety) and satisfactory for three other
(Intrinsic Goal Orientation, Meaningfulness of Study, and
Control Beliefs), but poor for Extrinsic Goal Orientation.
The optimized 24-item solution shows essential improvement
on Extrinsic Goal Orientation and Meaningfulness of Study.
The overall reliability for the motivational scale of the
APLQ questionnaire is good for both original (Alpha = .73)
and optimized (Alpha = .79) solutions. We found similar
reliability estimates (original = .79, optimized = .83) as
testing these two solutions with our comparison data (n =
512). (Table 5.)

Modeling Students' Motivational Profile ... 19
Table 5. Reliability Comparison of the Original 28 Item andOptimized 24 Item Solutions
Original solution2 Optimized solution3
Motivational Scale
Items (28) Alpha Items (24) Alpha
1. Value Components MF1 Intrinsic Goal Orientation
A1, A18,A23, A25
.64(.66)1
A1, A18, A23,A25
.64(.66)
MF2 Extrinsic Goal Orientation
A8, A13, A27 .22(.33)
A8, A27 .62(.52)
MF3 Meaningfulness of Study
A4 (rev.),A5, A11,A15, A19,A24, A28
.54(.39)
A4 (rev.),A5, A11, A19,
A24, A28
.70(.58)
2. Expectancy Components MF4 Control Beliefs
A2, A10,A20, A26
.60(.58)
A2, A10, A20,A26
.60(.58)
MF5 Self-Efficacy
A6, A7, A12,A17, A22
.81(.82)
A6, A7, A12,A17, A22
.81(.82)
3. Affective Components MF6 Test Anxiety
A3, A9, A14,A16, A21
.76(.78)
A9, A14, A16 .63(.65)
1) Values presented inside parenthesis are derived from comparison data (n = 519)2) Cronbach’s Alpha for 28 item solution is .73 (.79)3) Cronbach’s Alpha for 24 item solution is .79 (.83)
Communalities
In the second phase of the analysis we examined
communalities in the original polytechnic institution of
higher education data (n = 459) and in three sub samples (n =
200, n = 150, n = 100) derived from it. We also inspected

Modeling Students' Motivational Profile ... 20
communalities of the comparison data (n = 512) collected from
a Finnish polytechnic institution. It was interesting to see
that the lower bound of initial estimates and total variance
explained had notable better values as the sample size
decreased, but the upper bound of initial estimates remained
at the same level. The results presented in Table 6 suggest
the use of 21-item solution as the basis for further
analysis.

Modeling Students' Motivational Profile ... 21
Table 6. Item Rejection Based on Communalities (h2) in FiveSamples
Items
Rejected Items Data1 SampleSize
n
InitialEstimate
sh2
Factors
n
TotalVariance
%
24 A3,A13,A15,A21 1 459 .16 - .58 6 571 200 .21 - .61 6 571 150 .23 - .63 7 621 100 .31 - .62 8 682 512 .18 - .53 7 62
21 A1,A3,A4,A9,A13,A15, A21
1 459 .24 - .58 6 611 200 .31 - .60 6 61
18 A1,A3,A4,A9,A13,A15, A10,A18,A21, A25
1 459 .18 - .57 5 60
17 A1,A3,A4,A9,A13,A15, A10,A18,A21,A25,A26
1 459 .28 - .56 4 56
1 Polytechnic Institution of Higher Education; 2 Polytechnic Institution
Bayesian Dependence Modeling
The third stage of the analysis was to build a Bayesian
network out of 28-item solution measuring self-evaluated
motivation. The rationale for this procedure was to examine
dependencies between variables by both their visual
representation and probability ratio of each dependency.
A Bayesian network is a representation of a probability
distribution over a set of random variables, consisting of
an directed a cyclic graph (DAG), where the nodes correspond
to domain variables, and the arcs define a set of
independence assumptions which allow the joint probability
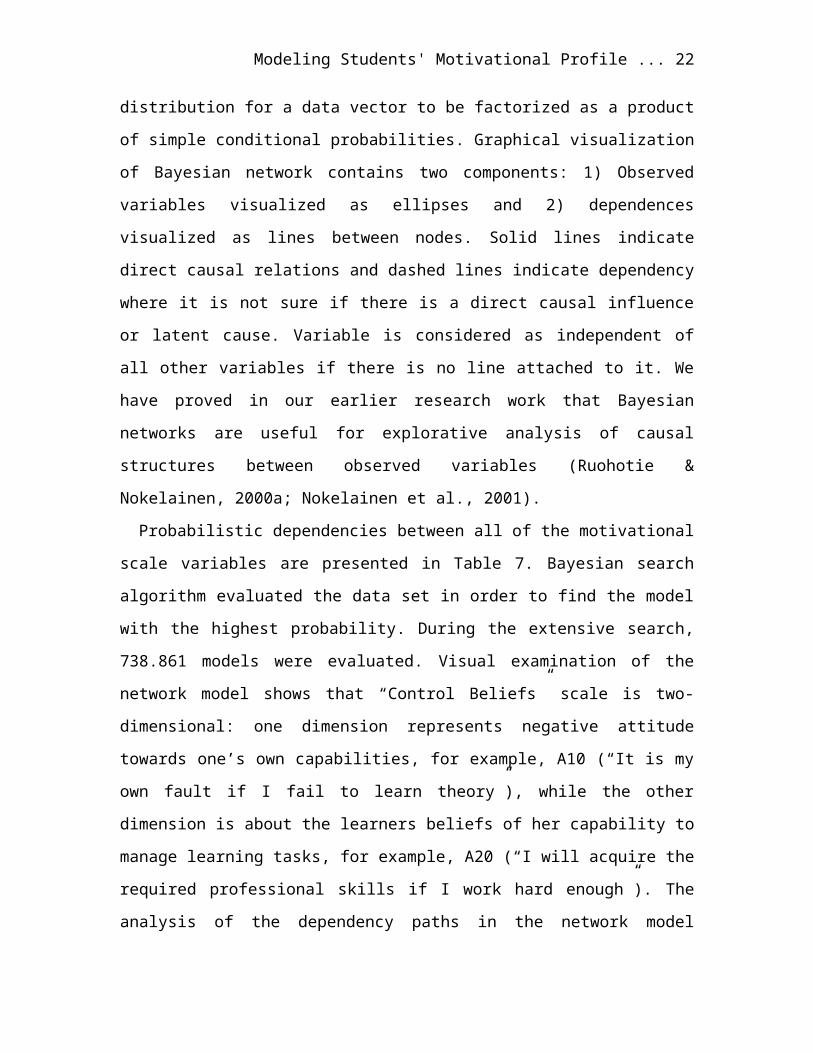
Modeling Students' Motivational Profile ... 22
distribution for a data vector to be factorized as a product
of simple conditional probabilities. Graphical visualization
of Bayesian network contains two components: 1) Observed
variables visualized as ellipses and 2) dependences
visualized as lines between nodes. Solid lines indicate
direct causal relations and dashed lines indicate dependency
where it is not sure if there is a direct causal influence
or latent cause. Variable is considered as independent of
all other variables if there is no line attached to it. We
have proved in our earlier research work that Bayesian
networks are useful for explorative analysis of causal
structures between observed variables (Ruohotie &
Nokelainen, 2000a; Nokelainen et al., 2001).
Probabilistic dependencies between all of the motivational
scale variables are presented in Table 7. Bayesian search
algorithm evaluated the data set in order to find the model
with the highest probability. During the extensive search,
738.861 models were evaluated. Visual examination of the
network model shows that “Control Beliefs” scale is two-
dimensional: one dimension represents negative attitude
towards one’s own capabilities, for example, A10 (“It is my
own fault if I fail to learn theory”), while the other
dimension is about the learners beliefs of her capability to
manage learning tasks, for example, A20 (“I will acquire the
required professional skills if I work hard enough”). The
analysis of the dependency paths in the network model
Modeling Students' Motivational Profile ... 23
suggests that variables A4 (“In my opinion craftsmanship can
be acquired through practice without theory lessons”), A13
(“I am only interested in mastering learning tasks that are
required in real working life”), and A15 (“Studying feels
often burdensome and/or frustrating”) should be removed from
the final model. The network model indicates that MF1, MF3,
and MF5 dimensions form an isolated homogenous cluster
together with the “optimistic” part of the MF4 dimension.
Closer examination of the probability ratios of dependences
reveal that also variables A1 (“I prefer to study
theoretical subjects and work tasks which are demanding and
from which I can learn something new”), A3 (“During an exam
I wonder how I am performing in comparison to other
students”), A9 (“When answering essay questions I am also
concerned about the other questions on the test that I
cannot answer”), and A25 (“When given an opportunity I
choose exercises and literature from which I can learn
something new even if it means receiving lower grades than I
could get by choosing those that I already know something
about”) should be omitted from the model. (Table 7.)
The variable rejection based on visual examination of the
network model is in general parallel with the results
obtained from the first and second phases of the analysis.
When interpreting the results we must bear in mind that the
relationships between variables in the network model are

Modeling Students' Motivational Profile ... 24
presented with dashed lines, and thus it is not sure if
there is a direct causal influence or latent cause.

Modeling Students' Motivational Profile ... 25
Table 7. Bayesian Network Model and the Importance Rankingof the 28 Item Solution Measuring Self-evaluated Motivation
Network Model Dependency Probability ratio
A14->A21
A17->A7
A22->A6
A17->A22
A17->A2
A22->A12
A11->A28
A22->A23
A5->A11
A24->A5
A20->A19
A8->A27
A17->A20
A19->A24
1 : Inf.
A26->A10
A21->A16
A23->A18
1 : 1.000.000
A21->A3 1 : 16343
A3->A9 1 : 648
A1->A17 1 : 180
A23->A25 1 : 65A4_REV,
A13,A15
No importance
The advantage of applying Bayesian dependency modeling as
a tool to identify independent variables was clearly proved
by the early stage identification of both A1 and A4

Modeling Students' Motivational Profile ... 26
variables. The comparison of the results of the first
(Tables 4), second (Table 6) and third phase (Table 7)
variable selection are presented in Table 8. Reader should
bear in mind that argument for rejection in the first and
second phase is the technical quality of the data, while in
the third phase it is the strength of dependencies between
variables.

Modeling Students' Motivational Profile ... 27
Table 8. Comparison of the First, Second, and Third PhaseItem Selection
Selection Method Rejected ItemsPhase 1 SD, Skewness Correlation Matrix
A3, A13, A15, A21
Phase 2 Communalities A1, A3, A4, A9, A13,
A15, A21Phase 3 Bayesian Dependency Network
A1, A3, A4, A9, A13, A15
Explorative Factor Analysis
The fourth phase of the analysis is based on exploratory
factor analysis. We chose Maximum Likelihood algorithm due
to adequate sample size and the first phase variable
selection. The rotation method applied in this study was
Direct Oblimin as we let the motivational factors correlate
with each other.
Table 9 shows the correlations between the variables and
the factors. Each variable’s relationship to the theoretical
model of motivation is indicated with gray background.
Reader should notice that values below +/- .20 are omitted
from the output.

Modeling Students' Motivational Profile ... 28
Table 9. Factor Structure Matrix of the 21 Item Solution
Motivational Scale FactorsItems MF5 MF6 MF4 MF2 MF1 MF3A17 0.74 -0.45 0.30 -0.39 -0.39A7 0.65 -0.41 0.24 -0.37 -0.25A23 0.60 -0.26 -0.23 -0.40A2 0.57 -0.35 0.34 -0.22 -0.35A25 0.49 -0.35 A28 0.47 -0.32 -0.38 -0.46A18 0.47 -0.32A12 0.44 -0.27 0.30 -0.44 -0.35 -0.38A14 0.66 A16 -0.22 0.64 A26 0.74 A10 0.61 A20 0.37 -0.26 0.42 -0.24 -0.22 -0.39A8 -0.67 -0.30A22 0.52 -0.43 -0.64 -0.30 -0.39A27 -0.61 A6 0.38 -0.31 -0.59 -0.31 -0.28A19 0.40 0.21 -0.24 -0.58 -0.40A5 0.32 -0.23 -0.70A11 0.43 -0.36 -0.60A24 0.30 -0.23 -0.22 -0.49 -0.60Extraction Method: Maximum Likelihood. Rotation Method: Direct Oblimin with Kaiser Normalization.
The correlations between motivational factors are
presented in Table 10. Low correlation indicates that
factors are nearly orthogonal. This is the case when we
compare “Intrinsic Goal Orientation” to “Control Beliefs”,
“Test Anxiety”, and “Extrinsic Goal Orientation”. “Self-
Efficacy” correlates relatively strongly with “Test Anxiety”

Modeling Students' Motivational Profile ... 29
and “Meaningfulness of Study”. Examination of the Table 10
justifies our earlier decision to allow the factors to
correlate, as there are only three uncorrelated pairs out of
15.

Modeling Students' Motivational Profile ... 30
Table 10. Factor Correlation Matrix
Factor MF5 MF6 MF4 MF2 MF1 MF3MF5 Self-Efficacy 1.00MF6 Test Anxiety 0.31 1.00MF4 Control Beliefs 0.18 0.15 1.00MF2 Extrinsic Goal Orientation 0.28 0.07 0.17 1.00MF1 Intrinsic Goal Orientation 0.26 0.06 0.00 0.10 1.00MF3 Meaningfulness of Study 0.44 0.15 0.16 0.33 0.23 1.00
The factor structure matrix presented earlier in Table 9
encourages us to test the reliability of two optional
solutions: the first 21 item solution is based solely on
technical appropriateness of variables for linear
multivariate analysis, and the second utilizes the results
of the Bayesian network model of motivation in the decision
making process. The reliability estimates of the two
solutions were verified with a comparison data (n = 512). The
comparison of the optimized solutions is presented in Table
11.
Table 11. Reliability Comparison of the Two OptimizedSolutions
Optimized solutiona2
Optimized solutionb3
Motivational Scale
Items (21) Alpha Items (21) Alpha
1. Value Components MF1 Intrinsic A19, A23, A25 .57 A18, A23, .60 (.60)

Modeling Students' Motivational Profile ... 31
Goal Orientation
(.62)1 A25
MF2 Extrinsic Goal Orientation
A6, A8, A27 .62(.53)
A6, A8, A27 .62 (.53)
MF3 Meaningfulness of Study
A5, A11, A24,A28
.71(.75)
A5, A11,A24, A28
.71 (.75)
2. Expectancy Components MF4 Control Beliefs
A2, A10, A20,A26
.60(.58)
A2, A10,A20, A26
.60 (.58)
MF5 Self-Efficacy
A7, A12, A17,A18, A22
.76(.78)
A7, A12,A17, A22
.79 (.81)
3. Affective Components MF6 Test Anxiety A14, A16 .62
(.61)A14, A16,
A21.78 (.78)
1) Values presented inside parenthesis are derived from comparison data (n = 519)2) Cronbach’s Alpha for the solution is .79 (.84)3) Cronbach’s Alpha for the solution is .76 (.82)
We conducted confirmatory factor analysis in order to
compare the original 28-item solution to two optimized (24
and 21 item) solutions. The results of model testing using
2, information criteria, root mean square error of
approximation measures, and residual measures are presented
in Table 12. The relative chi-squares for both models
indicated an acceptable fit between the hypothetical model
and the sample data. The root mean square error of
approximation values indicates a reasonable error of
approximation for all three models. When compared to
baseline model, the optimized 21-item solution proves to be

Modeling Students' Motivational Profile ... 32
the best by both comparative fit index and Tucker-Lewis
coefficient. When the models are compared by standardized
root mean square residual indices, the optimized 24-item
solution is slightly better than 21-item model. (Table 12.)
Table 12. Tests of Model Fit Between the Original 28 Item
and Optimized 24/21 Item solutions
Original28 ItemSolution
Optimized24 ItemSolution
Optimized21 Item
Solution bChi-Square Test of Model Fit Value Degrees of Freedom 2 / df P-Value
1093.4353353.260.000
761.3702373.210.000
651.8781743.750.000
RMSEA Estimate 90% C.I. Probability RMSEA <= .05
0.0710.066 0.0750.000
0.0700.064 0.0750.000
0.0780.071 0.0840.000
CFI 0.792 0.821 0.834TLI 0.765 0.792 0.800SRMR 0.073 0.064 0.068
Bayesian Unsupervised Model-based Visualization
The fifth and last stage of the analysis was to examine the
dispersion of single data vectors (n = 469) in three-
dimensional space. The data was mapped into six dimensions
(MF1, MF2, MF3, MF4, MF5, MF6) according to the 21 item
optimized solution (see Optimized Solution b in Table 11)
from which Bayesian algorithm produced one optimal model.

Modeling Students' Motivational Profile ... 33
The three-dimensional model was plotted into series of two-
dimensional figures each presenting one motivational
dimension.
Bayesian unsupervised model-based visualization differs
from Multidimensional Scaling (MDS) in the following ways:
1) Bayesian approach is parameter-free and the user input is
not required, instead, prior distributions of the model
offer a theoretically justifiable method for affecting the
model construction; 2) Bayesian methods work with
probabilities and can hence be expected to produce smooth
and robust visualizations with discrete data containing
nominal and ordinal attributes; 3) Bayesian approach has no
limit for minimum sample size; 4) Bayesian modeling assumes
no multivariate normal model (Kontkanen, Lahtinen, Myllymäki
& Tirri, 2000). Researchers (Ruohotie & Nokelainen, 2000b;
Ruohotie, Nokelainen & Tirri, 2002) have applied this
multidimensional data visualization method earlier to
research questions concerning growth-oriented atmosphere.
Figure 1 presents two-dimensional visualization of
Intrinsic Goal Orientation (MF1) and Test Anxiety (MF6).
Distribution of MF1 is asymptotic, but MF6 is skewed towards
small values. The figure shows clearly that the polarity
changes in the model: respondents with strong goal
orientation have little test anxiety. On the other hand,
those who have weak goal orientation are more likely to
suffer from test anxiety. Examination of Figure 2 shows that

Modeling Students' Motivational Profile ... 34
distribution of extrinsic goal orientation (MF3) is skewed
to left ranging from 2.0 to 5.0. It is interesting to see
that the “top” group of seventeen respondents located in the
lower right corner in each three figure has consistent
values on dimensions MF1, MF3, MF5, and MF6, but not on
dimensions MF2 and MF4.
Figure 3 presents profiles of two polar sub samples
selected from the visualization of the three-dimensional
model. Upper sample consists of twenty students, and lower
sample seventeen students. Visual inspection of the figure
reveals that the best discriminating dimensions between two
selections are MF1, MF3, MF4, and MF5. Members of the upper
sample have low intrinsic goal orientation and studying
feels burdensome. If they fail on learning task, it is
natural to accuse lack of effort (MF4) or ability (MF5).
Members of the lower sample are eager to learn new things,
as their studies feel meaningful. They believe in success in
studies due to high level of ability and effort. The two
groups have most in common with dimension MF2 indicating
that both groups’ extrinsic goal orientations are above
average.

Modeling Students' Motivational Profile ... 35
Figure 1. Bayesian Model-based Visualization of IntrinsicGoal Orientation (MF1) and Test Anxiety (MF6)
Figure 2. Bayesian Model-based Visualization of ExtrinsicGoal Orientation (MF2) and Meaningfulness of Study (MF3)

Modeling Students' Motivational Profile ... 36
Figure 3. Ba
yesi
an Mod
el-b
ased V
isua
lizati
on o
f Prof
iles o
f Tw
o Gr
oups P
rese
nting
the
Extrem
es
of Pol
arity
on t
he Mot
ivat
ional
Scal
e

Modeling Students' Motivational Profile ... 37
Discussion
In this article we have examined construct validity of
motivational scale of the Abilities for Professional Growth
measurement instrument. The instrument is based on
Pintrich’s motivational expectancy theory. We have discussed
the new role of self-assessment instruments on the research
field of motivational study. Technical development process
of the APLQ measurement instrument is described thoroughly,
but description of the theoretical framework is limited to
essential parts as it is presented in full length in the
second chapter of this book.
The analysis was based on a sample of 459 adolescent
students of Finnish polytechnic institution of higher
education. The total number of participants in this study
was 1127 as we validated some of the models with two
additional data sets. The statistical procedures were
conducted in five stages. Exploratory factor analysis,
Bayesian dependence modeling and Bayesian unsupervised
model-based visualization were the statistical techniques
applied in this study.
The other goal of this study was to find the core items
out of 28 in the original model for the use of limited time
tasks and time series analysis. The results of factor
analysis and Bayesian dependence modeling showed that the
six factor 21-item model has similar descriptive power than
the original 28-item version. The optimized 21-item solution

Modeling Students' Motivational Profile ... 38
(b) proved to be satisfactory when compared to baseline
model. The optimized 24-item solution was slightly better
than 21-item solution when compared by residual-based fit
indices.
We intend to carry on the development process of the 21-
item solution as it was found to be interpretable in terms
of meaningful clusters and correspondence to theoretical
structure. Empirical findings of our previous research work
also supports acceptance of this model.
Polarity change in the test anxiety scale was inspected
with Bayesian model-based visualization. With this new
method it was easy to profile each respondent, or group, by
it’s motivational level on each of the six dimensions. In
addition, we examined profiles of two polar sub samples,
first one representing students with high, and second with
low motivational level. We concluded by the visual
inspection of the profiles that the students with low
motivation are likely to accuse lack of effort or ability if
they fail in learning tasks, as opposite to highly motivated
students who believe that they succeed in their studies due
to high level of ability and effort. The both groups had
extrinsic goal orientations above average.
Our next task is to collect data from virtual university
students and test if the 21-item solution is applicable also
to that domain. In the future, it is interesting to see if
the instrument is as non-discriminating in the virtual

Modeling Students' Motivational Profile ... 39
university population as it seems to be for the students of
polytechnic institutions of higher education.
References
APA (1997). Learner–Centered Psychological Principles: A Framework for
School Redesign and Reform. American Psychology Association.
Retrieved 10 April 2008 from
http://www.cdl.org/resource–library/articles/learner_cen
tered.php.
Biggs, J. (1985). The Role of Metalearning in Study
Processes. British Journal of Educational Psychology, 55, 185–212.
Boekaerts, M. (2001). Context Sensitivity: Activated
Motivational Beliefs, Current Concerns and Emotional
Arousal. In S. Volet & S. Järvelä (Eds.), Motivation in
Learning Contexts. Theoretical Advances and Methodological Implications
(pp. 17–31). Oxford: Pergamon.
Bonk, C., & Cunningham, D. (1998). Searching for
constructivist, learner–centered and sociocultural
components for collaborative educational learning tools.
In C. Bonk & K. King (Eds.), Electronic Collaborators: Learner–
Centered Technologies for Literacy, Apprenticeship, and Discourse (pp.
25–50). New York: Erlbaum.
Bradley, W. J., & Schaefer, K. C. (1998). The Uses and Misuses of
Data and Models. Thousand Oaks : Sage.

Modeling Students' Motivational Profile ... 40
Candy, P. (1991). Self–direction for Lifelong Learning. San Francisco,
CA: Jossey–Bass.
Congdon, P. (2001). Bayesian Statistical Modeling. London: John
Wiley & Sons.
Cronbach, L. (1951). Coefficient alpha and the internal
structure of tests. Psychometrica, 16, 297–334.
Dalgarno, B. (2001). Interpretations of constructivism and
consequences for Computer Assisted Learning. British Journal
of Educational Technology, 32(2), 183–194.
de Vries, E. (2001). Hypermedia for Physics Learning: The
Case of the Energy Concept. In J. Rouet, J. Levonen, &
A. Biardeau (Eds.), Multimedia Learning – Cognitive and
Instructional Issues (pp. 141–153). Oxford: Pergamon.
Dillinger, M. (2001). Learning Environments: The Virtual
University and Beyond. In F. Tschang & T. Della Senta
(Eds.), Access to Knowledge – New Information Technologies and the
Emergence of the Virtual University. Oxford: Pergamon.
Entwistle, N. J., Hanley, M., & Hounsell, D. J. (1979).
Identifying distinctive approaches to studying. Higher
Education, 8, 365–380.
Entwistle, N. J. (1981). Styles of learning and teaching. An integrated
outline of educational psychology for students, teacher and lecturers. New
York: Wiley.
Felder, R., & Brent, R. (1996). Navigating The Bumpy Road to
Student–Centered Instruction. College Teaching, 44, 43–47.

Modeling Students' Motivational Profile ... 41
Felder, R., & Brent, R. (2001). Effective Strategies for
Cooperative Learning. Journal of Cooperation & Collaboration in
College Teaching, 10(2), 69–75.
Järvelä, S., & Niemivirta, M. (2001). Motivation in Context:
Challenges and Possibilities in Studying the Role of
Motivation in New Pedagogical Cultures. In S. Volet & S.
Järvelä (Eds.), Motivation in Learning Contexts. Theoretical Advances
and Methodological Implications (pp. 105–127). Oxford:
Pergamon.
Kautto–Koivula, K. (1996). Degree–Oriented Adult Education
in the Work Environment. In P. Ruohotie & P. P. Grimmett
(Eds.), Professional Growth and Development (pp. 149–188).
Tampere: Career Education Books.
Kontkanen, P., Lahtinen, J., Myllymäki, P., & Tirri, H.
(2000). Unsupervised Bayesian Visualization of High–
Dimensional Data. In R. Ramakrishnan, S. Stolfo, R.
Bayardo, & I. Parsa (Eds.), Proceedings of the Sixth International
Conference on Knowledge Discovery and Data Mining (KDD–2000) (pp.
325–329). New York, NY: The Association for Computing
Machinery.
Land, S., & Hannafin, M. (2000). Student–centered Learning
Environments. In D. Jonassen & S. Land (Eds.), Theoretical
Foundations of Learning Environments (pp. 1–23). Mahwah, NJ:
Lawrence Erlbaum Associates.
Laurillard, D. (1979). The process of student learning.
Higher Education, 8, 395–409.

Modeling Students' Motivational Profile ... 42
Lee, J., & McKendree, J. (1999). Learning vicariously in a
distributed environment. Journal of Active Learning, 10, 4–10.
Leflore, D. (2000). Theory Supported design Guidelines for
Web–Based Instruction. In B. Abbey (Ed.), Instructional and
Cognitive Impacts of Web–Based Education (pp. 102–117). Hershey:
Idea Group Publishing.
Myllymäki, P., Silander, T., Tirri, H., & Uronen, P. (2001).
Bayesian Data Mining on the Web with B–Course. In N.
Cercone, T. Lin, & X. Wu (Eds.), Proceedings of The 2001 IEEE
International Conference on Data Mining (pp. 626–629). IEEE
Computer Society Press.
Nisbet, J., & Shucksmith, J. (1984). The seventh sense.
Edinburgh: Scottish Council for Research in Education.
Nokelainen, P., & Ruohotie, P. (1999). Structural Equation
Modeling in Professional Growth Research. In P.
Ruohotie, H. Tirri, P. Nokelainen, & T. Silander (Eds.),
Modern Modeling of Professional Growth vol. I (pp. 121–154).
Hämeenlinna: RCVE.
Nokelainen, P., Ruohotie, P., & Tirri, H. (1999).
Professional Growth Determinants – Comparing Bayesian
and Linear Approaches to Classification. In P. Ruohotie,
H. Tirri, P. Nokelainen, & T. Silander (Eds.), Modern
Modeling of Professional Growth vol. I (pp. 85–120). Hämeenlinna:
RCVE.
Nokelainen, P., Silander, T., Tirri, H., Nevgi, A., & Tirri,
K. (2001). Modeling students’ views on the advantages of

Modeling Students' Motivational Profile ... 43
web–based learning with Bayesian networks. In H.
Ruokamo, O. Nykänen, S. Pohjolainen, & P. Hietala
(Eds.), Proceedings of the Tenth International PEG Conference:
Intelligent Computer and Communications Technology – Learning in On–
Line Communities (pp. 101–108). Tampere: Tampere
University of Technology.
Nokelainen, P., & Tirri, H. (2002). Issues in Designing an
Interactive Personalized Self–Assessment Tool. In H.
Niemi & P. Ruohotie (Eds.), Theoretical Understandings for
Learning in the Virtual University (pp. 73-89). Hämeenlinna:
RCVE.
Pintrich, P. R. (1988). A process–oriented view of student
motivation and cognition. In J. S. Stark & L. S. Mets
(Eds.), Improving teaching and learning through research. New
Directions for Teaching and Learning, no. 57. San
Francisco: Jossey–Bass.
Pintrich, P. R. (1995). Understanding Self–regulated
Learning. In P. R. Pintrich (Ed.), Understanding Self–
regulated Learning (pp.3–12). San Fransisco: Jossey–Bass.
Pintrich, P. R. (2000a). The Role of Motivation in Self–
regulated Learning. In M. Boekaerts, P. R. Pintrich, &
M. Zeidner (Eds.), Handbook of Self–regulation (pp. 451–502).
San Diego: Academic Press.
Pintrich, P. R. (2000b). The Role of Goal–orientation in
Self–regulated Learning. In P. R. Pintrich & P. Ruohotie

Modeling Students' Motivational Profile ... 44
(Eds.), Conative Constructs and Self–regulated Learning (pp. 89–
140). Hämeenlinna: RCVE.
Pintrich, P. R., Smith, D., Garcia, T., & McKeachie, W. J.
(1991). A Manual for the Use of the Motivated Strategies for Learning
Questionnaire. Technical Report 91–B–004. The Regents of
The University of Michigan.
Pintrich, P. R., Smith, D., Garcia, T., & McKeachie, W. J.
(1993). Reliability and Predictive Validity of The
Motivated Strategies for Learning Questionnaire (MSLQ).
Educational and Psychological Measurement, 53, 801–813.
Ramsden, P. (1992). Learning to Teach in Higher Education. London:
Routledge.
Ramsden, P., & Entwistle, N. (1981). Effects of Academic
Departments on Students’ Approaches to Studying. British
Journal of Educational Psychology, 51, 368–383.
Richardson, J. (2001). Researching Student Learning. United
Kingdom: The Society for Research into Higher Education
& Open University Press.
Ruohotie, P. (1994). Motivation and Self–regulated Learning.
In P. Ruohotie and P. Grimmett (Eds.), New Themes for
Education in a Changing World (pp. 15–60). Career Education
Books: Saarijärvi.
Ruohotie, P. (1998). Motivated Strategies for Professional Learning.
Hämeenlinna: RCVE.

Modeling Students' Motivational Profile ... 45
Ruohotie, P. (1999). Growth Prerequisities in Organizations.
In P. Ruohotie, H. Tirri, P. Nokelainen, & T. Silander
(Eds.), Modern Modeling of Professional Growth vol. I (pp. 5–36).
Hämeenlinna: RCVE.
Ruohotie, P. (2000a). Conative Constructs in Learning. In P.
R. Pintrich & P. Ruohotie (Eds.), Conative Constructs and Self–
regulated Learning (pp. 1–30). Hämeenlinna: RCVE.
Ruohotie, P. (2000b). Abilities for Professional Learning.
Hämeenlinna: RCVE.
Ruohotie, P. (2002). Motivation and Self–regulation in
Learning. In H. Niemi & P. Ruohotie (Eds.), Theoretical
Understandings for Learning in the Virtual University (pp. 37-72).
Hämeenlinna: RCVE.
Ruohotie, P., & Nokelainen, P. (2000a). Modern Modeling of
Student Motivation and Self–regulated Learning. In P. R.
Pintrich & P. Ruohotie (Eds.), Conative Constructs and Self–
regulated Learning (pp. 141–193). Hämeenlinna: RCVE.
Ruohotie, P., & Nokelainen, P. (2000b). Beyond the Growth–
oriented Atmosphere. In B. Beairsto & P. Ruohotie
(Eds.), Empowering Teachers as Lifelong Learners (pp. 147–167).
Hämeenlinna: RCVE.
Ruohotie, P., Nokelainen, P., & Tirri, H. (2002, April).
Visualization of Growth–oriented Atmosphere. Paper presented at
the Annual Meeting of the American Educational Research
Association, New Orleans, USA.

Modeling Students' Motivational Profile ... 46
Tabachnick, B., & Fidell, L. (1996). Using Multivariate Statistics.
New York: HarperCollins.
Thompson, B. (1999, April). Common Methodology Mistakes in
Educational Research. Paper presented at the Annual
Conference of the American Educational Research
Association, Montreal, Canada.
Tirri, H. (1997). Plausible Prediction by Bayesian Interface.
Department of Computer Science. Series of Publications
A. Report A–1997–1. University of Helsinki.
von Glasersfeld, E. (1995). Radical constructivism: A way of knowing
and learning. London: Falmer.
Vygotsky, L. S. (1978). Mind in society. Cambridge, MA: Harvard
University Press.
Winne, P. H., & Perry, N. E. (2001). Measuring self–
regulated learning. In M. Boekaerts, P. Pintrich, & M.
Zeidner (Eds.), Handbook of self–regulation (pp. 531–565). San
Diego: Academic Press.
Zimmerman, B. J. (1998). Developing Self–fulfilling Cycles
of Academic Regulation: An Analysis of Exemplary
Instructional Models. In D. Schunk & B. Zimmerman
(Eds.), Self–regulated Learning: From Teaching to Self–reflective
Practice (pp. 1–19). New York: The Guilford Press.

APPENDIX
Abilities for Professional Learning Questionnaire (APLQ)Part A Learning Experiences and Motivation
A1 I prefer to study theoretical subjects and work tasks which are demanding and from which I can learn something new.
A2 I am able to learn even the most difficult subjects if I use good study methods.
A3 During an exam I wonder how I am performing in comparison to other students.
A4 In my opinion craftsmanship can be acquired through practice without theory lessons.
A5 I believe that theory lessons will prove useful in practical training and later in working life.
A6 I expect to get excellent grades in my vocational/occupational studies.
A7 I am confident that I understand even the most difficult aspects of my studies.
A8 I want to receive as high grades as possible.A9 When answering essay questions I am also concerned about the
other questions on the test that I cannot answer. A10 It is my own fault if I fail to learn theory.A11 It is important for me to learn theory related to my
profession.A12 I am confident that I will learn the skills related to my
field. A13 I am only interested in mastering learning tasks that are
required in real working life.A14 Nervousness during exams affects my performance.A15 Studying feels often burdensome and/or frustrating.A16 When taking part in a practical examination I am concerned
about failing and what will happen as a result.A17 I am confident that I will learn even the most difficult
theoretical subjects and work tasks.A18 I prefer to study theoretical subjects that interest me even
if I find them difficult. A19 I am very interested in my field of study as well as in the
new information related to it.

A20 I will acquire the required professional skills if I work hard enough.
A21 I am really nervous in all test situations. A22 I am confident that I will do well in my studies. A23 I find it most rewarding when I can research a subject as
thoroughly as possible. A24 I believe that my vocational/occupational studies will be of
practical benefit to me.A25 When given an opportunity I choose exercises and literature
from which I can learn something new even if it means receiving lower grades than I could get by choosing those that I already know something about.
A26 If I do not understand theory, it is because I am not tryinghard enough.
A27 It is important for me to do well in my studies and show others (my family, friends, colleagues) what I am capable of.
A28 It is essential for me to understand the topics contained inmy vocational/occupational studies.

IV


Investigating the Number of Non-linear … 1
Investigating the Number of Non-linear and Multi-modal Relationships Between Observed Variables Measuring A Growth-oriented Atmosphere
P. NOKELAINEN1*, T. SILANDER2, P. RUOHOTIE1 and H. TIRRI3
1University of Tampere; 2Complex Systems Computation Group; 3Nokia Research Center
Abstract. This study investigates the number of non-linear and
multi-modal relationships between observed variables measuring a
Growth-oriented Atmosphere. The sample (n = 726) represents
employees of three vocational high schools in Finland. The first
stage of analysis showed that only 22 per cent of all dependencies
between variables were purely linear. In the second stage two sub
samples of the data were identified as linear and non-linear. Both
bivariate correlations and confirmatory factor analysis (CFA)
parameter estimates were found to be higher in the linear sub
sample. Results showed that some of the highest bivariate
correlations in both sub samples were explained via a third
variable in the non-linear Bayesian dependence modeling (BDM).
Finally, the results of CFA and BDM led to different substantive
interpretations in two out of four research questions concerning
organizational growth.
Key words: categorical data, survey data, non-linear modeling,
structural equation modeling, organizational atmosphere
1 * Author for correspondence: Ed.Lic Petri Nokelainen, Research Centre forVocational Education, University of Tampere, P.O. Box 229, FIN-13101Hämeenlinna, Finland. Email: [email protected].

Investigating the Number of Non-linear … 2
1. Introduction
When an organizational researcher wants to study dependencies
between observed and latent variables, for example, the factors of
a growth-oriented atmosphere (Ruohotie, 1996), the assumptions for
the data may become quite challenging in traditional frequentistic
statistical analysis. A few examples of such assumptions are the
assumption of continuous measurement level, multivariate normality
and linearity of both the data and phenomena under investigation.
For example, the result of violating multivariate normality
assumption is that chi-square becomes too large (too many models
are rejected) and standard errors become too small (significance
tests have too much power). In addition, normal distribution
analysis sets minimum requirements for the number of observations.
As a first response to the continuous measurement level and
multivariate normality assumptions, Muthén and Kaplan (1985)
suggest that treating the ordinal variables as continuous does
produce viable results as long as the frequency distributions are
unimodal with an internal mode. Johnson & Creech (1983) have
simulation studies to examine the categorization error that occurs
when continuous variables are measured by indicators with only a
few categories. The results indicated that while categorization
error does produce distortions in multiple indicator models, under
most conditions explored the bias was not sufficient to alter
substantive interpretations with a large simulation sample (n =
5000). However, the authors urged caution in the use of two-,
three- or four-category ordinal indicators, particularly when the
sample size is small (in that study ten sub samples of 500 cases
were examined). They were also worried about situations in which
it is not certain that a normal distribution accurately reflects
the true distribution of many underlying variables.

Investigating the Number of Non-linear … 3
The second solution that is presented theoretically by Muthén
(1983, 1984, 1989) and applied in practice in LISREL by Jöreskog
(2003) is to estimate tetrachoric (for binary variables) or
polychoric (for categorical variables) correlations among the
ordinal variables and use these correlations to estimate the model
using asymptotic distribution free function (ADF) by Browne
(1984). Amos (Arbuckle, 1999) software package uses Browne’s
original name, but EQS by Bentler (1995) describes it as arbitrary
generalized least squares (AGLS) and LISREL (Jöreskog & Sörbom,
1998) together with Mplus (Muthén & Muthén, 2001) call it weighted
least squares (WLS). The main advantage is that the estimator is
not dependent on multivariate normality. However, a limited number
of variables (recommendation is below 20) and the very large
samples that are needed to produce good estimates are the
limitations of this approach. For example, a simulation study by
Yung & Bentler (1994) suggests more than 2000 observations. In
addition, Olsson, Foss, Troye and Howell (2000) show that ADF
estimation performs poorly when the model is incorrectly
specified.
The third approach to address modeling problems with ordinal
non-normal data is the categorical variable model (CVM) developed
by Muthén (1993). The model, which is implemented in the Mplus
program, uses the general ADF function but without the
aforementioned limitations. We consider this a viable
frequentistic approach to the analysis of ordinal variables in
organizational research.
However, none of the techniques described earlier address the
problem of non-linear dependencies between observed variables. In
this paper, we argue that the Bayesian modeling approach (see
e.g., Bernardo & Smith, 2000; Myllymäki, Silander, Tirri & Uronen,

Investigating the Number of Non-linear … 4
2002), named after English reverend Thomas Bayes (1702-1761) for
his contributions (Bayes, 1763), is a viable alternative to
frequentistic statistical techniques addressing all the
abovementioned modeling problems. Although the subject domain of
this paper is organizational atmosphere (or climate) research, we
believe that this discussion applies equally to all other research
areas in the social sciences when the measurement level of the
indicators is categorical.
The essential benefits of Bayesian modeling are summarized in
(Congdon, 2001). Next we discuss more thoroughly the three most
important features for this study.
1. The researcher is capable of inputting a priori information to the model. The
source of subjective information could be, for example, an
interview with an expert on a certain topic, or previously
collected data. For example, an adaptive online questionnaire is
able to profile respondents with Bayesian probabilistic modeling
and thus personalize the total number of questions asked from each
person. In this application field a priori profile information,
which is applied in the profiling stage when considering the
closest match profile for the current person, is gained from
earlier responses from a similar population. In this paper, a
priori information is needed only when Bayesian networks are
developed from data; that is, in the part of the paper where we
perform Bayesian dependence modeling (BDM, results are presented
in Tables 2 and 3). Prior beliefs are quantified by calculating
the equivalent sample size (ESS) (e.g., Heckerman, Geiger & Chickering,
1995) parameter value with equation 1
(1)

Investigating the Number of Non-linear … 5
where |Vi| denotes the number of values of each variable Vi in
the model and N denotes the number of variables Vi in the model
(Myllymäki, Silander, Tirri & Uronen, 2002). ESS is a parameter
that regulates our behavior when new data is entered; that is, how
we update our beliefs when new evidence is presented. If the ESS
value is small, new evidence has greater impact on our beliefs
than if the parameter value is large. Equation 1 is applied in
this paper for two reasons: First, equal priors are set to all
variables in the model, as we have no reason to favor any single
variable. Second, the ESS parameter calculation is related to so-
called Jeffrey’s prior that is commonly used as a non-informative
prior in Bayesian analysis.
2. Bayesian modeling is designed to analyze discrete categorical variables.
Organizational researchers collect some of their data with paper
and pencil or web-based online surveys. The most typical question
types in survey research are dichotomous and multiple-choice
questions. In both cases, the categories are discrete (e.g., have
no overlap and are mutually exclusive) and exhaust the possible
range of responses. One of the major differences between
traditional Gaussian and Bayesian models lies in the fact that the
latter does not require a multivariate normal distribution of the
indicators (e.g., observed variables) or underlying phenomena.
This feature is especially useful for a researcher who collects
her data with, for example, Likert -scale (DeVellis, 2003, pp. 78-
80) questions as the response options from 1 to 7 produce data
that is more qualitative than quantitative in nature. The
measurement level of such an item is ordinal and it is not
advisable to model it with traditional statistical analysis that
rely on the concept of normal distribution, and require the
calculation of mean and standard deviation.

Investigating the Number of Non-linear … 6
3. Bayesian modeling is able to analyze both linear and non-linear dependencies
between variables. Phenomena under investigation are seldom purely
linear or continuous in nature. Unfortunately most commonly
applied traditional linear Gaussian models (e.g., regression and
factor analysis) are statistically inadequate for understanding
non-linear dependencies between variables. Bayesian dependence
models for discrete data allow the description of non-linearities
as Bayesian theory gives a simple criterion, the probability of
the model, to select among such models.
A major drawback with the Bayesian approach at this moment is
that only a few applications are capable of analyzing latent
variable models. Examples of such software are BUGSi, which studies
Bayesian inference using Gibbs sampling (see Congdon, 2001, 2003),
and DSIGoMii, which is based on the grade of membership analysis.
As the major goal of this paper is to investigate the number of
non-linear and multi-modal relationships in real-life
organizational research data sets, we limit the investigation to
dependencies between observed variables and use bivariate
correlations (both rp and rs) and Bayesian dependence modeling (B-
Courseiii) to reach that goal.
The research questions in this study are: (1) What kind of and
how many non-linearities are captured by discrete Bayesian
networks? (2) Is there a difference between the results of linear
bivariate correlations and Bayesian dependence modeling? (3) Does
an empirical sample containing pure linear dependencies have
better overall fit indices in CFA than a sample containing less
linear dependencies? (4) Does an empirical sample containing pure
linear dependencies have higher CFA parameter estimates than a
sample containing less linear dependencies? (5) Is there a

Investigating the Number of Non-linear … 7
difference between the substantive interpretations of the results
of CFA and BDM with linear and non-linear samples?
2. Theoretical Background
2.1 Growth-oriented Atmosphere
Ongoing learning and self-development by employees are critical to
the mission of any modern organization. In order to be successful,
educational organizations must provide effective professional
development programs for employees over the entire course of their
careers (Lawler, 1994). Professional development includes all
developmental functions that are directed at the maintenance and
enhancement of professional competency. In the modern world,
updating is ideally a continual, lifelong process that addresses
such goals as the acquisition of new and up-to-date information,
the development of skills and techniques and the elevation of
one’s personal esteem. The maintenance and enhancement of
competency is subject to the combined effect of many factors,
ranging from personal traits to the salient features of the work
environment (Fishbein & Stasson, 1990).
Research has shown that important factors in the development of
a growth orientation are support and rewards from the management,
the incentive value of the job itself, the operational capacity of
the team and work related stress (Argyris, 1990; Dubin, 1990;
Hall, 1990; Kaufman, 1990; Nokelainen & Ruohotie, 2003; Ruohotie,
1996).
Management and leaders face challenges such as how to develop and
reward learning, empower people, support the development of
professional identity, create careers based on interaction, set
goals for learning and plan development, evaluate learning and its
development and create commitment to the job and the organization.

Investigating the Number of Non-linear … 8
The incentive value of the job depends on the opportunities it offers
for learning; that is, developmental challenges, the employees’
chance to exert influence, opportunities to learn collaboratively
and the dignity of the job.
The operational capacity of a team or a group can be defined by its
members’ capability to operate and learn together, by the work
group co-operation and by the reputation for effectiveness.
Work related stress might become an obstacle to professional growth
if a heavy mental load and demand for continual alterations causes
stress for people and thus suppresses organizational growth and
development.
Ruohotie and Nokelainen (2000) examined the theoretical dimensions
of a growth-oriented atmosphere (GOA) in a Finnish vocational
education high school. The organization consisted of ten
geographically separate units. The sample size was 318 employees,
66 per cent out of the survey population of 479 employees. The
target population was Finnish vocational high school personnel in
1998 (N = 7,958).
The instrument utilized in the study contained 80 statements.
The response options on a 5-point Likert scale varied from 1
(strongly disagree) to 5 (strongly agree).
Ruohotie and Nokelainen (2000) constructed fourteen summated
scales (Hair, Anderson, Tatham & Black, 1995, p. 9) to represent
the theoretical dimensions of a growth-oriented atmosphere. The
scales were formed on the basis of both theoretical aspects of
growth-orientation (Ruohotie, 1996) and the results of exploratory
factor analysis (Maximum likelihood with Varimax rotation). The
fourteen-factor solution was the most parsimonious, representing
67 per cent of the variance within 80 items. Eigenvalues were
between 1.05 and 23.98. Respondents indicated only moderate

Investigating the Number of Non-linear … 9
differences in preferences for various dimensions as mean ratings
ranged between 3.2 and 3.8. Internal consistency for each factor
was estimated with Cronbach's alpha coefficient (1970, pp. 160-
161). The alpha values ranged from .77 to .93.
Although the authors report continuous parameters such as mean
and alpha on items measured with the nonmetric ordinal scale, we
consider the results plausible as the underlying phenomenon, a
growth-oriented atmosphere, is continuous by nature. The ration of
the sample size to the number of observed variables in the
Ruohotie and Nokelainen study (2000) was acceptable according to
empirical and simulation studies (e.g., Cattell, 1978; Gorusch,
1983; MacCallum, Widaman, Zhang & Hong, 1999).
Ruohotie and Nokelainen (2000) found that a growth-oriented
atmosphere generates togetherness and influences developing
leadership. Multidimensional scaling provided evidence that
factors representing the incentive value of the job, commitment to
work and organization, clarity of the job and growth motivation
are the strongest indicators of growth-oriented atmosphere. They
reached the following conclusions on the basis of their research
findings: 1) Teacher’s professional growth-motivation reflects
directly with task value on teacher-pupil relationships and on
achievement motivation; (2) Task value has an effect on a growth-
oriented atmosphere; 3) Growth-oriented atmosphere is strongest in
work assignments that offer challenging professional tasks
(manager, teacher) and lowest among other workers.
2.2 Bayesian Modeling Approach
In this paper, we study two different kinds of non-linearities
among the items measuring the fourteen factors of the GOA: 1) Non-
linear relationships between continuous variables and 2) multi-
modal relationships between continuous variables.

Investigating the Number of Non-linear … 10
The term ‘non-linear’ is not very informative since it seems to
include many different dependence patterns between random
variables. As a mathematical concept, linearity (of a mapping) is
well defined. In statistics, when describing the relationship
between two variables as linear, we usually assume that the mean
of the variables is a linear function of the means of some other
variables (possibly in some special context, e.g., when certain
variables are fixed). However, there are many situations in which
describing only these linear relationships of variables misses the
important aspects of dependencies. The most self-evident
shortcoming is that the dependencies between variables may be very
non-linear. Moreover, if some variables are measured on a nominal
scale, the concept of linearity is not meaningful at all. When
using ordinal scales, linearity (based on means) is also often
considered dubious. It may also be a conceptually misleading
notion even if the dependencies are mathematically linear. For
example, in the case of multi-modality the relationship between
means may be linear, but the mean of the dependent distribution
may lie in a low probability region (i.e., values close to the
mean are rare).
Discrete Bayesian networks operate on a nominal finite scale.
Thus it is trivial that these networks are capable of modeling
this type of non-linearity. Any dependence between variables, one
of which is measured on a nominal scale, is non-linear.
Consequently, non-linearity due to the scale is not studied in
this paper. However, it is worth noting that when data contains
nominal scale variables that are not totally independent of all
the other variables of the data, Bayesian networks are capable of
modeling non-linearities.

Investigating the Number of Non-linear … 11
Mathematically, linearity is well defined between two sets of
continuous variables. However, in this paper, we only study simple
non-linear relationships. In our study, the dependence between
variables X and Y is considered non-linear if the mean of the
conditional distribution of Y is not a monotonic (i.e.,
continuously increasing or decreasing) function of X. Similarly,
the dependence between variables X and Y is considered multi-modal
if the mode of the conditional distribution of Y is not a
monotonic function of X.
This study resembles to some extent the work by Hofmann and
Tresp (1996, 1998) in which they use the method of Parzen windows
to allow non-linear dependencies between continuous variables. The
purpose of their work was to demonstrate the possibility of
building Bayesian networks that can capture non-linear
relationships. By using discrete variables this is rendered
trivial, but our objective is to find out to what extent this is
possible in other situations; that is, how many and what kind of
non-linearities are captured by discrete Bayesian networks.
Given the identically and independently distributed
multivariate data set D over variables V and the prior probability
distribution over Bayesian networks (Pearl, 1998), Bayesian
probability theory allows us to calculate the probability
P(G | D, ) of any Bayesian network G (Heckerman, Geiger and
Chickering, 1995). Different networks can then be compared by
their probability. Finding the most probable Bayesian network for
any given data is known to be NP-hard (Non-deterministic
Polynomial-time hard) which means that the automatic discovery of
the most probable network is a mission impossible (Chickering,
1996). An example of an NP-hard problem is the ‘subset sum
problem’ (e.g., Cormen, Leiserson & Rivest, 1996, p. 951): Given a

Investigating the Number of Non-linear … 12
set of integers, does any subset sum exactly to zero? For example,
given the set {-5, -3, 1, 2, 9}, the answer is YES because the
subset {-3, 1, 2} sums to zero. Fortunately stochastic search
methods have proven to be successful in finding high probability
networks (Chickering, Geiger & Heckerman, 1995). Once the network
G has been constructed using data D, we can use it to calculate
predictive joint distributions P(V | G, D). Bayesian network
structure can be used to effectively calculate the conditional
marginals of the predictive joint distribution for single
variables, P(Vi | A, G, D), where A is any subset of the variables
of V. In this paper we study only the marginals, where A is a
singleton {Vj} and there is either an arrow from Vi to Vj or an
arrow from Vj to Vi (we say that Vi and Vj are adjacent in G).
The Bayesian dependence network (Heckerman, Geiger &
Chickering, 1995; Myllymäki, Silander, Tirri & Uronen, 2002;
Silander & Tirri, 2000) is a representation of a probability
distribution over a set of random variables, consisting of an
directed acyclic graph (DAG), where the nodes correspond to domain
variables, and the arcs define a set of independence assumptions
which allow the joint probability distribution for a data vector
to be factorized as a product of simple conditional probabilities.
A graphical visualization of the Bayesian network contains two
components: (1) observed variables visualized as ellipses and (2)
dependences visualized as lines between nodes. A variable is
considered to be independent of all other variables if there is no
line attached to it. Such networks (see Tables 2 and 3) are
calculated in this paper using the aforementioned B-Course
software (Myllymäki, Silander, Tirri & Uronen, 2002). We have
shown in our earlier research that Bayesian networks are useful

Investigating the Number of Non-linear … 13
for the exploratory analysis of statistical relationships between
observed variables (see e.g., Ruohotie & Nokelainen, 2000).
3. Method
3.1 Sample and Procedure
The sample (n = 726) was collected during the year 2001 with a 69-
item web-based self-report questionnaireiv that is a revised
version of the previous one (Nokelainen, Ruohotie & Tirri, 2002).
The instrument had a five-point Likert scale ranging from 1
(strongly disagree) to 5 (strongly agree). The data consists of
adult employees from three Finnish vocational high schools (D21, n
= 447; D22, n = 71; D23, n = 208). Respondents had three different
kinds of job profiles (with 4% missing data, n = 31): Managers
(6%, n = 46), teachers (61%, n = 462), and administrative personnel
(29%, n = 223). The nature of a respondent’s contract was
categorized into three classes (with 3%, n = 26 missing data):
Established (70%, n = 533), temporary (22%, n = 169), and part-time
(5%, n = 34) employees.
3.2 Measuring Non-linearities
To measure non-linear dependencies captured by Bayesian networks,
every variable was tested in each network by conditioning it one
by one with its immediate neighbors in the network. It was
observed whether the modes and means of the conditional
distributions were linear and whether the conditional
distributions were unimodal. Linearity of modes and means was
tested by recording whether the means and modes were increasing or
decreasing functions of the conditioning variable. Even clear
departures from line-like behavior were accepted as linear as long
as the direction of correlation (positive, negative) did not
change. Therefore, in these experiments, a ‘linear’ relationship

Investigating the Number of Non-linear … 14
is one that can be more or less adequately modeled by line
describing how the central tendency of the dependent variable
varies as a function of the independent variable. In measuring the
unimodality of conditional distributions, we judged the dependence
to be unimodal if (and only if) none of the conditional
distributions P(Y|X) were clearly multimodal. We acknowledge the
possible presence of Simpson’s Paradox (e.g., Moore & McCabe,
1993, p. 190) when detecting non-linear relationships with sign
changes, but prefer to label it as a statistical fact. The
reversal of the direction of a comparison or an association when
data from several groups are combined to form a single group
becomes a paradox only when associated with dubious causal
interpretation.
4. Results
4.1 Research question 1: What kind of (and how many) non-linearities are captured by discrete Bayesian networks?
Research evidence based on Bayesian network modeling of six
independent empirical data describing the dimensions of the GOA
showed that only 22 per cent of all dependencies were purely
linear; that is, linear mode, linear mean, unimodal. This is the
best data for traditional linear analysis as no information is
lost due to non-linearity. The total number of non-linear
dependencies in the data was 57 per cent. Sixteen per cent of
dependencies were purely non-linear (non-linear mode, non-linear
mean, multimodal). Multimodality was the most common violation of
linearity in all samples. The results show that Bayesian networks
capture non-linear dependencies in the data, as 46 per cent of the
pairwise (unconditional) dependencies of the models are vaguely,
and 23 per cent severely, non-linear.

Investigating the Number of Non-linear … 15
4.2 Research question 2: Is there difference between the results of linear bivariate correlations and Bayesian dependence modeling?
To answer the second research question, we compared the results of
linear correlational analysis and non-linear Bayesian network
modeling. Our hypothesis was that the results of both linear and
non-linear analysis should be the same if the level of non-
linearity in the sample has no practical effect. We used in this
stage of the analysis only D21 (n = 447) and D23 (n = 208) samples.
Those two samples were chosen as the sample sizes of the D21 and
D23 data are more appropriate for the analysis than D22 (n = 71).
The D21 data represents in this analysis a linear sample, as 24
per cent of its dependencies are unimodal and have a linear mode
and mean. The D23 data is more non-linear in nature as it has five
per cent less similar pure linear dependencies.
We begin by analyzing the fourteen GOA factors sum correlations
of the linear D21 data with the Spearman rank order method (rs) and
mean correlations with Pearson’s product moment method (rp).
Because the results of both correlational analyzes proved to be
alike, we study only the Pearson product moment correlations here.
A comparison of the Bayesian dependence modeling (BDM) and
correlation solutions is presented in Table 1. The left hand side
shows the visualization of the network where nodes represent
variables and arches represent dependencies between them. The
strength of each dependence on the model is indicated with a
color; a darker color indicates a stronger statistical
relationship between the two variables. Importance ranking
corresponding to the color of the arcs in the final model is
presented in the middle part of the table. The column on the right
hand side contains the results of the correlation matrix. BDM
shows nine strong and five weaker relationships between the GOA
factors.

Investigating the Number of Non-linear … 16
-- Insert TABLE 1 about here –
Team spirit (TES) is the most important variable in the model as
it has a direct statistical relationship to Growth motivation
(GRM), Community spirit (COS), Valuation of the job (VAL) and
Developing of know-how (DEV) factors. The role of the Valuation of
the job (VAL) factor is also important as it is a connecting node
to the Rewarding of know-how (REW) factor, which in turn is
connected to the Encouraging leadership (ENC) factor. If leaders
encourage their subordinates, they feel more commitment to work
and organization, the incentive value of the job increases and
they feel less psychic stress.
The Bayesian dependence network model is generally congruent
with the correlation matrix as both methods found the same two
factors, namely the Build-up of work requirements (BUI) and the
Students attitudes towards the teacher (STA), independent of all
the other factors. Third factor not belonging to the model is the
Growth motivation (GRM) as it has only a weak relationship to the
Team spirit (TES) factor. Non-linear modeling found nine strong
dependencies between the factors as the correlational analysis
found five. However, the results were almost identical, as all but
two of the high correlation dependencies on the matrix were also
present in the Bayesian model. The missing dependencies were
between the Valuation of the job (VAL) and Developing of know-how
(DEV) factors, r(447) = .718, p < .01, and the Rewarding of know-
how (REW) and Developing of know-how (DEV) factors, r(447) = .650,
p < .01. However, BDM suggests that the dependence between the two
factors and the Developing of know-how (DEV) factor is mediated by
the Encouraging leadership (ENC) factor. This finding, as it is

Investigating the Number of Non-linear … 17
repeated later in this paper with the non-linear sample, could be
interpreted as superior enabling her subordinates’ motivation and
commitment to work. The non-linear model provides new information
by revealing the relationship between the Team spirit (TES),
Valuation of the job (VAL) and Rewarding of know-how (REW)
factors. The Bayesian model indicates that encouraging leadership
has stronger effect on the clarity of the job factor than on the
strategic leadership factor. The correlation matrix supports this
finding as it shows higher positive correlation between the
Encouraging leadership and Clarity of the job factors, r(447)
= .709, p < .01.
Next we compare the correlations and BDM of the non-linear data
D23. The commitment to work and organization (COM) is the central
factor in the model presented in Table 2. The factor has direct
connections to the Psychic stress of the job (PSY), the Incentive
value of the job (INV), the Clarity of the work role (CLA), Team
spirit (TES) and Encouraging leadership (ENC) factors. Closer
examination of the frequency distributions (not presented in Table
2) shows, that employees at the vocational high school have high
commitment to work and organization, team spirit and valuation of
the job. Employee’s responses show that they are disappointed in
the rewarding of know-how and their work roles are not explicit.
As with the linear data D21, the correlation matrix shows high
correlation, r(208) = .699, p < .01, between the Valuation of the
job (VAL) and Developing of know-how (DEV) and Rewarding of know-
how (REW) factors. Again, the BDM shows that the dependency
between the two variables is mediated by the Encouraging
leadership (ENC) factor.
-- Insert TABLE 2 about here –

Investigating the Number of Non-linear … 18
4.3 Research question 3: Does an empirical sample containing pure linear dependencies have better overall fit indices in CFA than sample containing less linear dependencies?
We tested the GOA model fit to both samples, linear D21 and non-
linear D23, with confirmatory (restricted) factor analysis. Our
hypothesis was, that linear data should fit the model better than
the data that contains more non-linear dependencies.
Earlier in this study both correlation and Bayesian network
analysis indicated, that three dimensions of the GOA, namely “10.
Students’ attitudes towards teacher,” “12. Build-up of work
requirements” and “14. Growth motivation”, are not present in the
empirical data. Thus we conducted confirmatory factor analysis
with the remaining eleven factors: “1. Encouraging leadership,”
“2. Strategic leadership,” “3. Know-how rewarding,” “4. Know-how
developing,” “5. Incentive value of the job,” “6. Clarity of the
job,” ”7. Valuation of the job,” “8. Community spirit,” “9. Team
spirit,” “11. Psychic stress of the job” and “13. Commitment to
work and organization.”
Table 3 shows the model fit indices of the confirmatory factor
analysis. The first section of the table presents measures of
absolute fit that determine the degree to which the model predicts
the observed correlation matrix (Hair et al., 1995, p. 683). The
root mean square error of approximation (RMSEA) is designed to
evaluate the approximate fit of the model in the population
(Kaplan, 2000, p. 112). The estimate was in both samples below the
fair fit level of .08 (Hair et al., 1995, p. 685), indicating good
fit (Browne & Kudeck, 1993). The upper limit of the 90 per cent
confidence interval was also above the cutoff value in both
samples. The standardized root mean square residuals (SRMR) help
the investigator to examine how well the aspects of the data are
captured by the model (Loehlin, 2004, p. 70). SRMRs were in both
samples below a cut-off value of .08 (Hu & Bentler, 1999).

Investigating the Number of Non-linear … 19
The second section of Table 3 presents incremental fit measures
that compare the proposed model to a baseline model that all other
models should be expected to exceed (Hair et al., 1995, 685). The
Tucker-Lewis index (TLI), a.k.a. the Non-normed Fit Index (NNFI),
and a similar measure, the comparative fit index (CFI), were both
slightly below the recommended level of .90 (Tucker & Lewis, 1973)
in both samples.
The results indicate that the GOA model was performing slightly
better with the linear D21 sample than non-linear D23 sample. We
also tested the model with CFA implemented in Mplus that uses ADF
function (weighted least squares) instead of ML and allows
categorical indicators (Muthén & Muthén, 2001). The fit indices
for the linear sample were also slightly better than for the non-
linear sample with this method.
-- Insert TABLE 3 about here --
4.4 Research question 4: Does an empirical sample containing pure linear dependencies have higher CFA parameter estimates than sample containing less linear dependencies?
The factor covariances of the GOA model presented in Table 4 show
that the linear sample (D21) has higher overall parameter
estimates and smaller error variances than the non-linear sample.
Next we will discuss the differences in strength of dependencies
between the two samples in more detailed manner as we interpreted
the results via four different theoretical aspects.
-- Insert TABLE 4 about here --
4.5 Research question 5: Is there difference between substantive interpretations of the results of CFA and BDM with linear and non-linear samples?
Bollen (1989, 281) states “nonsense results for individual
parameters can occur in conjunction with good overall fit measures

Investigating the Number of Non-linear … 20
…”. We examined both Bayesian dependence models (see Tables 2 and
3) and component fit measures (see Table 4) to see if the
estimates between factors make sense according to the GOA model.
We will focus on the following four aspects of the model: 1)
Support and rewards from management have a positive influence on
how an employee experiences her know-how as being rewarded and
developed and her work as being valued; 2) The incentive value of
the job has a positive influence on the development of know-how
and valuation of the job; 3) The operational capacity of the team
and team spirit correlate positively; 4) Work-related stress
hinders the development of all the other factors of the GOA.
The first aspect is that support and rewards from management are
essential in the development of growth orientation (Ruohotie,
1996). The correlational analysis shows that both the Valuation of
the job (VAL) and Development of know-how (DEV) factors are
connected to the Know-how rewarding (REW) factor. The relationship
is also present in corresponding Bayesian models (see Tables 2 and
3), but in both samples the models include the Encouraging
leadership (ENC) as a mediating component between the two factors.
The CFA covariance matrix presented in Table 4 shows strong
positive covariances between the Encouraging leadership (ENC),
Know-how rewarding (REW), Know-how developing (DEV), Valuation of
the job (VAL) and Clarity of the job (CLA) factors. The parameter
estimates range between 0.752 and 1.116 (linear sample D21), and
0.634 and 0.798 (non-linear sample D23). Also Bayesian models for
both data contain the aforementioned relationships.
The second aspect is that the incentive value of the job depends on
the opportunities it offers for learning; that is, challenging
work and high valuation of the work (Ruohotie, 1996). Factor
covariances presented in Table 3 support the GOA theory in both

Investigating the Number of Non-linear … 21
samples (D21 INV_DEV = 0.537; D21 INV_VAL = 0.585; D23 INV_DEV = 0.518;
D23 INV_VAL = 0.537). The Bayesian model for the linear sample (D21)
shows only partial support for the second theoretical assumption
as there is a connection between the Incentive value of the job
(INV) and the Know-how developing (DEV) factors, but no direct
connection exists between the Valuation of the job (VAL) factor
and the two other factors (Table 1). The non-linear sample (D23)
does not show any evidence that supports the GOA theory (Table 2).
In both Bayesian models the Encouraging leadership (ENC) factor
acts as a mediator between the variables under investigation.
The third aspect is the relationship between the Community (COS)
and Team spirit (TES) factors. According to Argyris (1992) and
Ruohotie (1996), community members should discuss developmental
aspects of their work and learn from each other. Factor
covariances support the GOA theory in both samples: COS_TES = 0.691
(D21), and COS_TES = 0.534 (D23) (Table 5). The dependence between
the two factors is also present in both Bayesian dependence models
(Tables 2 and 3).
The fourth aspect is that work related psychic stress (PSY) hinders
people from giving their best performance in the work, and may
thus become an obstacle to professional growth (see e.g., Edwards
& Rothbard, 1999; Ruohotie, 1996). Table 4 shows that factor
covariances between the Psychic stress of the job (PSY) and the
other factors are stronger in the linear sample, as the parameter
estimates range between –0.219 and –0.547 (linear sample D21), and
–0.138 and –0.319 (non-linear sample D23). The highest (negative)
covariances in both samples are between PSY and Commitment to work
and organization (COM). The dependence between PSY and COM is also
present in both Bayesian dependence models, but no other support
for the fourth theoretical aspect is present (Tables 2 and 3).

Investigating the Number of Non-linear … 22
The results are summarized in Table 5. The first observation is
that both Bayesian dependency models do not support the second
theoretical assumption about the relationship between Incentive
value of the job (INV) and Know-how developing (DEV) and Valuation
of the job (VAL). However, INV and VAL have a statistical
dependence also in BDM derived from the linear sample (Table 1).
The second observation is that the fourth theoretical assumption
about the negative influence of Psychic stress (PSY) on all the
other factors is only partially supported in both Bayesian models.
Finally, the linear sample (D21) has in most cases higher CFA
parameter estimates than the non-linear sample (Table 4). This is
a natural finding because only linear factor covariances between
variables are estimated.
-- Insert TABLE 5 about here --
5. Discussion
This study investigated the number of linear and non-linear
dependencies between the items measuring fourteen dimensions of
Growth-oriented Atmosphere. An empirical sample represented
employees of three Finnish vocational high schools (n = 726).
Bayesian theory was discussed and Bayesian dependence models for
discrete data were introduced as a model family capable of
describing non-linearities. Next, empirical data was analyzed to
find out if non-linear dependencies weaken the robustness of
bivariate linear statistical methods (represented by correlation
analysis) when compared with non-linear modeling (represented by
Bayesian dependency modeling).
Investigation of empirical data (n =726) showed that only 22 per
cent of all dependencies between variables were purely linear
Investigating the Number of Non-linear … 23
(linear mode, linear mean, unimodal). Sixteen per cent of
dependencies were purely non-linear (non-linear mode, non-linear
mean, multimodal). Multimodality was the most common reason for
the violation of linearity in both data sets.
Investigations were continued with two sub samples of the
vocational high school data, namely D21 (n = 447) and D23 (n = 208).
The D21 sample represents in this study linear empirical data with
24 per cent of pure linear and 15 per cent of pure non-linear
dependencies and the D23 sample represents non-linear data with
only 16 per cent of pure linear dependencies and 18 per cent of
pure non-linear dependencies.
The subject domain interpretations of linear correlational
analysis and non-linear Bayesian dependence modeling (BDM) were
compared to learn if the results would lead to different
subjective interpretations. The results showed that in general
Bayesian network models were congruent with the correlation
matrixes as both methods found the same variables independent of
all the other variables. However, non-linear modeling found with
both linear and non-linear samples a greater number of strong
dependencies between the GOA factors. Comparison of the
correlations and dependencies in Bayesian networks showed, that in
both samples linear correlations indicated a direct connection
between know-how rewarding, know-how developing and valuation of
the job, as Bayesian models indicated indirect connections between
the variables with encouraging leadership acting as a mediator
between them.
Further, we focused on the following four aspects of the GOA
theory because our motivation was to investigate if there were
differences between the results of linear (CFA) and non-linear
(BDM) analysis with the linear and non-linear samples: 1) Support

Investigating the Number of Non-linear … 24
and rewards from the management have a positive influence on how
an employee experiences her know-how as being rewarded and
developed and her job as being valued; 2) The incentive value of
the job has a positive influence on the development of know-how
developing and valuation of the job; 3) The operational capacity
of the team and team spirit correlate positively; and 4) Work-
related psychic stress hinders the development of the GOA.
Results showed that the analysis techniques produced similar
results for two out of four theoretical aspects, namely the first
and third. Different results leading to different substantive
interpretations were considered for the second and fourth
theoretical aspect as follows. The BDM was able to find only
partial support from the linear sample, and no support at all from
the non-linear, sample for the assumption that the incentive value
of the job would have a positive influence on the development of
know-how developing and valuation of the job. Both Bayesian
dependency models suggested that the components under
investigation are not directly related, but instead indirectly
connected to each other via encouraging leadership. The fourth
theoretical aspect was supported in both linear analyses, as the
Psychic stress of the job factor was negatively related all the
other factors. However, in both Bayesian dependency models the PSY
factor was related only to commitment to work and organization.
Finally, linear methods (e.g., bivariate r and CFA) found stronger
statistical relationships between factors measuring the Growth-
oriented Atmosphere from a linear than non-linear sample. We fully
agree with Grilli and Rampichini (2004) when they state that use
of a proper model is always a desirable feature of the analysis
because we may expect the resulting inferences to be generally
more reliable.

Investigating the Number of Non-linear … 25
Notesi BUGS is available at http://www.mrc-bsu.cam.ac.uk/bugs/ii DSIGoM is available at
http://www.dsisoft.com/grade_of_membership.htmliii B-Course is available at http://b-course.cs.helsinki.fi/obc/iv Growth-oriented Atmosphere Questionnaire (GOAQ) is available at http://www.uta.fi/aktkk/goaq/
References
Arbuckle, J. L. (1999). Amos for Windows. Analysis of moment structures.
Chicago, IL: SmallWaters.
Argyris, C. (1992). On Organizational Learning. Cambridge, MA: Blackwell
Publishers.
Bayes, T. (1763). An essay towards solving a problem in the
doctrine of chances. Philosophical Transactions of the Royal Society, 53, 370–
418.
Bentler, P. M. (1995). EQS Structural Equations Program Manual. Encino,
CA: Multivariate Software, Inc.
Bernardo, J., & Smith, A. (2000). Bayesian Theory. New York: John
Wiley & Sons.
Bollen, K. A. (1989). Structural Equations with Latent Variables. New York:
John Wiley & Sons.
Browne, M. W. (1984). Asymptotically distribution–free methods for
the analysis of covariance structures. British Journal of Mathematical
and Statistical Psychology, 37, 1–21.
Browne, M. W., & Cudeck, R. (1993). Alternative Ways of Assessing
Model Fit. In K. A. Bollen & S. Long (Eds.), Testing Structural
Equation Models (pp. 136–162). Newbury Park, CA: Sage.
Cattell, R. B. (1978). The scientific use of factor analysis in behavioral and life
sciences. New York, NY: Plenum Press.

Investigating the Number of Non-linear … 26
Chickering, D. M. (1996). Learning Bayesian networks is NP–
complete. In D. Fisher & H. J. Lenz (Eds.), Learning from Data:
Artificial Intelligence and Statistics vol. 5 (pp. 121–130). Berlin: Springer.
Chickering, D. M., Geiger, D., & Heckerman, D. (1995). Learning
Bayesian networks: Search methods and experimental results. In
Proceedings of Fifth Conference on Artificial Intelligence and Statistics (pp. 112–
128). Fort Lauderdale, FL: Society for Artificial Intelligence
in Statistics.
Congdon, P. (2001). Bayesian Statistical Modelling. London: Wiley.
Congdon, P. (2003). Applied Bayesian Modelling. London: Wiley.
Cormen, T. H., Leiserson, C. E., & Rivest, R. L. (1996). Introduction
to Algorithms. Sixteenth edition. Cambridge, MA: MIT Press.
Cronbach, L. J. (1970). Essentials of Psychological Testing. Third edition.
New York, NY: Harper & Row.
DeVellis, R. F. (2003). Scale Development. Theory and Applications. Second
edition. Thousand Oaks, CA: Sage.
Dubin, S. (1990). Maintaining Competence through Updating. In S.
Willis & S. Dubin (Eds.), Maintaining Professional Competence (pp. 9–
43). San Francisco: Jossey–Bass.
Edwards, J. R., & Rothbard, N. P. (1999). Work and Family Stress
and Well–Being: An Examination of Person–Environment Fit in the
Work and Family Domains. Organizational Behavior and Human Decision
Processes, 77(2), 85–129.
Fishbein, M., & Stasson, M. (1990). The role of desires, self–
predictions, and perceived control in the prediction of training
session attendance. Journal of Applied Social Psychology, 20, 173–198.
Gorusch, R. (1983). Factor Analysis. Second edition. Hillsdale, NJ:
Lawrence Erlbaum Associates.
Grilli, L., & Rampichini, C. (2004). Multilevel factor models for ordinal
variables. Submitted for publication.

Investigating the Number of Non-linear … 27
Hair, J. F., Anderson, R. E., Tatham, R. L., & Black, W. C.
(1995). Multivariate Data Analysis. Fourth edition. Englewood Cliffs,
NJ: Prentice Hall.
Hall, D. (1990). Career Development Theory in Organizations. In D.
Brown & L. Brooks (Eds.), Career Choice and Development (pp. 422–
454). San Francisco: Jossey–Bass.
Heckerman, D., Geiger, D., & Chickering, D. M. (1995). Learning
Bayesian networks: The combination of knowledge and statistical
data. Machine Learning, 20, 197–243.
Hofmann, R., & Tresp, V. (1996). Discovering Structure in
Continuous Variables Using Bayesian Networks. In D. S.
Touretzky, M. C. Mozer, & M. E. Hasselmo (Eds.), Advances in Neural
Information Processing Systems vol. 8 (pp. 500–506). Cambridge, MA: MIT
Press.
Hofmann, R., & Tresp, V. (1998). Non–linear Markov Networks for
Continuous Variables. In M. I. Jordan, M. S. Kearns, & S. A.
Solla (Eds.), Advances in Neural Information Processing Systems vol. 10 (pp.
521–527). Cambridge, MA: MIT Press.
Hu, L., & Bentler, P. (1999). Cut–off criteria for fit indexes in
covariance structure analysis: conventional criteria versus new
alternatives. Structural Equation Modeling, 6(1), 1–55.
Johnson, D. R., & Creech, J. C. (1983). Ordinal Measures in
Multiple Indicator Models: A Simulation Study of Categorization
Error. American Sociological Review, 48, 398–407.
Jöreskog, K. G. (2003). Structural Equation Modeling with Ordinal Variables
using LISREL. Retrieved 13 February 2005 from:
http://www.ssicentral.com/lisrel/ordinal.htm.
Jöreskog, K. G., & Sörbom, D. (1998). LISREL 8 Program Reference Guide.
Chicago, IL: Scientific Software International.

Investigating the Number of Non-linear … 28
Kaplan, D. (2000). Structural Equation Modeling. Foundations and
Extensions. Thousand Oaks: Sage.
Kaufman, H. (1990). Management Techniques for Maintaining a
Competent Professional Work Force. In S. Willis & S. Dubin
(Eds.), Maintaining Professional Competence (pp. 249–261). San
Francisco: Jossey–Bass.
Lawler, E. E. (1994). From job–based to competence–based
organizations. Journal of Organizational Behaviour, 15, 3–15.
Loehlin, J. C. (2004). Latent Variable Models. Fourth edition. Mahwah,
NJ: Lawrence Erlbaum Associates.
MacCallum, R. C., Widaman, K. F., Zhang, S., & Hong, S. (1999).
Sample size in factor analysis. Psychological Methods, 4, 84–99.
Moore, D. S., & McCabe, G. P. (1993). Introduction to the Practice of
Statistics. Second edition. New York: Freeman.
Muthén, B. O. (1983). Latent variable structural equation modeling
with categorical data. Journal of Econometrics, 22, 48–65.
Muthén, B. O. (1984). A general structural equation model with
dichotomous, ordered categorical, and continuous latent variable
indicators. Psychometrika, 49, 115–132.
Muthén, B. O. (1989). Latent variable modeling in heterogeneous
populations. Psychometrika, 54, 557–585.
Muthén, B. O. (1993). Goodness of fit with categorical and other
non–normal variables. In K. A. Bollen & J. S. Long (Eds.), Testing
Structural Equation Models (pp. 205–243). Newbury Park, CA: Sage.
Muthén, B. O., & Kaplan, D. (1985). A comparison of some
methodologies for the factor analysis of non–normal Likert
variables. British Journal of Mathematical and Statistical Psychology, 38, 171–
189.
Muthén, L. K., & Muthén, B. O. (2001). Mplus user's guide. Second
edition. Los Angeles, CA: Muthén & Muthén.

Investigating the Number of Non-linear … 29
Myllymäki, P., Silander, T., Tirri, H., & Uronen, P. (2002). B–
Course: A Web–Based Tool for Bayesian and Causal Data Analysis.
International Journal on Artificial Intelligence Tools, 11(3), 369–387.
Nokelainen, P., & Ruohotie, P. (2003). Modeling the Prerequisites
of Empowerment. In B. Beairsto, M. Klein, & P. Ruohotie (Eds.),
Professional Learning and Leadership (pp. 147–176). Hämeenlinna: RCVE.
Nokelainen, P., Ruohotie, P., & Tirri, H. (2002, April). Visualization
of Growth–oriented Atmosphere. Paper presented at the Annual Meeting
of the American Educational Research Association, New Orleans,
USA.
Olsson, U. H., Foss, T., Troye, S. V., & Howell, R. D. (2000). The
performance of ML, GLS, and WLS estimation in structural
equation modeling under conditions of misspecification and
nonnormality. Structural Equation Modeling, 7(4), 557–595.
Pearl, J. (1988). Probabilistic Reasoning in Intelligent Systems. San Mateo,
CA: Morgan Kaufmann.
Ruohotie, P. (1996). Professional Growth and Development. In K.
Leithwood, S. Chapman, D. Carson, P. Hollinger, & A. Hart
(Eds.), International Handbook of Educational Leadership and Administration
(pp. 419–445). Dordrecht: Kluwer Academic Publishers.
Ruohotie, P., & Nokelainen, P. (2000). Beyond the Growth–oriented
Atmosphere. In B. Beairsto & P. Ruohotie (Eds.), Empowering
Teachers as Lifelong Learners (pp. 147–167). Hämeenlinna: RCVE.
Silander, T., & Tirri, H. (2000, April). Model Selection for Bayesian
Networks. Paper presented at the Annual Meeting of American
Educational Research Association, New Orleans, USA.
Tucker, T. L., & Lewis, C. (1973). A reliability coefficient for
maximum likelihood factor analysis. Psychometrica, 38, 1–10.

Investigating the Number of Non-linear … 30
Yung, Y. F., & Bentler, P. M. (1994). Bootstrap corrected ADF test
statistics in covariance structure analysis. British Journal of
Mathematical and Statistical Psychology, 47, 63–84.

Table 1Bayesian Network Model of the Dimensions of Growth-oriented Atmosphere (Linear Sample, n = 447)Network Model Dependenc
eProbability
ratiorp
TES->COS ENC->CLA ENC->COM TES->VAL VAL->REW VAL->ENC ENC->DEV CLA->STR COM->PSY
1:1.000.000 .712**.709**.645**.608**.598**.754**.764**.488**-.480**
REW-> ENCDEV-> INV
1:588631:13112
.639**
.674**COM->INV 1:23 .645**TES->DEV 1:4.67 .541**TES->GRM 1:4.59 .232**
** Correlation is significant at the 0.01 level (2-tailed). * Correlation is significant at the 0.05 level (2-tailed).
Note. ENC = Encouraging leadership, STR = Strategic leadership, REW = Know-how rewarding, DEV = Know-how developing, INV = Incentive value of the job, CLA = Clarity of the job, VAL = Valuation of the job, COS = Community spirit, TES = Team spirit, PSY = Psychic stress of the job, COM= Commitment to work and organization, GRM = Growth motivation.

Table 2Bayesian Network of the Dimensions of Growth-oriented Atmosphere (Non-linear Sample, n = 208)Network Model Dependenc
eProbability
ratiorp
ENC->DEV ENC->VAL COM->CLA ENC->REW COM->ENC
1:Inf. .742**.723**.611**.665**.636**
CLA->STRCOM->INV
1:1.000.000 .582**.693**
CLA->COS 1:58948 .500**COS->TES 1:7695 .565**COM->TES 1:34 .586**COM->PSY 1:1.7 -.373**
** Correlation is significant at the 0.01 level (2-tailed). * Correlationis significant at the 0.05 level (2-tailed).
Note. ENC = Encouraging leadership, STR = Strategic leadership, REW = Know-how rewarding, DEV = Know-how developing, INV = Incentive value of the job, CLA = Clarity of the job, VAL = Valuation of the job, COS = Community spirit, TES = Team spirit, PSY = Psychic stress of the job, COM= Commitment to work and organization.

Table 3Model Fit Indices of the Growth-oriented Atmosphere Model
Absolute fit measures Incremental fit measures
Sample 2 df 2/df p RMSEA C.I. (90) SRMR TLI CFI
D21a 4448.113
1375 3.235
.000 .071 .068 .073
.071 .835 .853
D23b 2897.437
1375 2.107
.000 .073 .069 .077
.077 .810 .831
a Linear sample D21 n = 447. b Non-linear sample D23 n = 208.
Note. RMSEA= Root Mean Square Error of Approximation with 90 per cent confidence interval. TLI = Tucker-Lewis coefficient. CFI = Comparative Fit Index.

Table 4Factor Covariances of the Growth-oriented Atmosphere Model
Data D21 (n = 447)f01_enc f02_str f03_rew f04_dev f05_inv f06_cla f07_val f08_cos f09_tes f11_psy f13_com
f01_enc Encouraging leadership 1.000f02_str Strategic leadership 0.417 1.000f03_rew Know-how rewarding 0.752 0.500 1.000f04_dev Know-how developing 0.871 0.365 0.651 1.000f05_inv Incentive value of the job 0.543 0.212 0.377 0.537 1.000f06_cla Clarity of the job 0.886 0.490 0.647 0.707 0.423 1.000f07_val Valuation of the job 1.116 0.391 0.720 0.827 0.585 0.799 1.000f08_cos Community spirit 0.510 0.288 0.384 0.506 0.323 0.501 0.552 1.000f09_tes Team spirit 0.541 0.274 0.392 0.484 0.333 0.498 0.586 0.691 1.000f11_psy Psychic stress of the job -0.361 -0.226 -0.277 -0.316 -0.387 -0.363 -0.434 -0.219 -0.240 1.000f13_com Commitment to work and
organization0.686 0.360 0.495 0.570 0.575 0.560 0.725 0.366 0.370 -0.547 1.000
Data D23 (n = 208)f01_enc f02_str f03_rew f04_dev f05_inv f06_cla f07_val f08_cos f09_tes f11_psy f13_com
f01_enc Encouraging leadership 1.000f02_str Strategic leadership 0.503 1.000f03_rew Know-how rewarding 0.632 0.491 1.000f04_dev Know-how developing 0.736 0.509 0.677 1.000f05_inv Incentive value of the job 0.462 0.243 0.373 0.518 1.000f06_cla Clarity of the job 0.684 0.600 0.587 0.633 0.366 1.000f07_val Valuation of the job 0.798 0.388 0.661 0.736 0.537 0.563 1.000f08_cos Community spirit 0.367 0.369 0.388 0.460 0.207 0.585 0.419 1.000f09_tes Team spirit 0.351 0.269 0.306 0.384 0.268 0.383 0.402 0.534 1.000f11_psy Psychic stress of the job -0.218 -0.184 -0.186 -0.179 -0.138 -0.341 -0.221 -0.304 -0.250 1.000f13_com Commitment to work and
organization0.569 0.383 0.487 0.613 0.602 0.586 0.604 0.390 0.440 -0.319 1.000
Note. Data D21 error variances range between 0.040 and 0.091. All p-values were p < .001. Data D23 error variances range between 0.055 and 0.106. All p-values range between p < .001 - .022.


Table 5Summary of the Results based on Theoretical Assumptions
D21a D23b
Theoretical assumptions BDMc CFAd BDMc CFAd
1. Support and rewards from the management
ENC (+) → REW, VAL, DEV
●e ◙g ◙g ◙g
2. The incentive value of thejob
INV (+) → DEV, VAL ○f ●e ― h ●e
3. Operational capacity of the team
COS (+) ↔ (+) TES ◙g ◙g ●e ●e
4. Work-related stress
PSY (-) → All the other factors
○f ◙g ○f ●e
a Linear sample D21 n = 447. b Non-linear sample D23 n = 208. c Bayesian Dependence Model. d Confirmatory Factor Analysis. e Research evidence supports the theoretical assumption. f Research evidence supports the theoretical assumption partially.g Research evidence supports the theoretical assumption strongly. h
Research evidence does not support the theoretical assumption.
Note. ENC = Encouraging leadership, REW = Know-how rewarding, DEV =Know-how developing, INV = Incentive value of the job, VAL = Valuation of the job, COS = Community spirit, TES = Team spirit, PSY = Psychic stress of the job.
Copyright © 2022 FDOKUMEN