Modeling and control of VLSI circuit yield
10
91 Modeling and Control of VLSI Circuit Yield Renzo Traversini, Aurelio De Lisio, Giuseppe Barbuscia SGS-Thomson Microelectronics, R. & D. Central Dept. 20041 Agrate Brianza (Milano) - Italy (*) Abstract. Due to the increasingly critical role played by yield performance in VLSI device market competition, the development of yield models for product design and production control and improvement is nowadays a very active field of research and development. The overall manufac- turing yield can be decomposed in several yield contributions related to different phases of the production process or to different degradation mechanisms. Defect yield losses are related to local device deformations usually due to spot defects and particles. Parametric yield losses are linked 10 global device deformations related to limited control on process conditions. In the paper several state-of-the-art modeling approaches to these yield terms will be presented. Moreover, the issue of yield control and monitoring for each of these loss contributions will be reviewed. 1. INTRODUCTION Improving product yield is one of the major activities performed by engineering personnel in semiconductor companies. During process development and product development, yield improvement efforts are mainly aimed to achieve working prototypes and start pre- production. A fast learning cycle is required to ramp- up production at profitable levels as soon as possible. In the production phase yield improvements are needed to survive the market competition on unit cost. While this does not apply strictly to some particular devices, it is dramatically true for a wide category of VLSI products, covering most of the world semicon- ductor market. Improving product yield requires an appropriate knowledge of yield loss mechanisms and the way they are related to yield statistics. This problem is address- ed in this paper in section 2 and 3. However, there are several yield losses that must be considered inherently linked to the production process. They act as a background loss level that must be clear- ly estimated and controlled to enable the identification of systematic drift of process quality and trigger cor- rective actions. The subject of yield control and management will be discussed in section 4. 2. YIELD IN VLSI MANUFACTURING There are several yield contributions related to VLSI integrated circuit production. The ratio of chips sur- viving the final testing phase after wafer fab process- ing, parametric and probe testing, dicing and assembly is known as manufacturing yield. This figure is clearly (*)This work has been supported by CNR, Piano Finaliz- zato ((Materiali e Dispositivi per I’Elettronica a Stato Solido)). VOL. I . N. 3 MAY-JUNE 1990 dependent on the sample of chips used to estimate it (for instance, all the product units made available for the market in a specified time interval); it gives an overall estimation of the efficiency of chip production without separating technological issues from manageri- al and human issues. Manufacturing yield is usually decomposed in a number of yield terms related to the subsequent stages of chip production. The wafer yield is the fraction of wafers that reaches the probe testing stage after wafer fab processing. It describes the effects of loss mechanisms acting in the production line during wafer processing. These mechanisms are mainly related to human errors or to single step out-of-control situations. That means that wafer yield losses are not related to the global quality of the product, but mainly to single process step quality or line management. Probe testing yield is the fraction of chips surviving the probe test after completion of wafer fab process- ing. This yield contribution is directly related to the global quality of the product as determined by desing and wafer fab manufacturing (this is strictly true only if we include in this figure the yield contribution com- ing from reliability testing). In the extreme and simplified case of a complete coverage of local product quality out-of-control by means of wafer yield losses, the probe testing yield delivers information on the overall quality of product design and process integra- tion. The testing gate dfter wafer fab processing is no1 limited to probe testing. Before shipping wafers to pro- be test, a number of electrical test measurements is per- formed on appropriate test structures, placed in specific sites on production wafers, to identify and discard wafers affected by huge mismatches between required electrical parameters and actual performances. The resulting yield figure, which bridges wafer yield to pro- be testing yield, is called processing yield (or sometimes 3 27
-
Upload
independent -
Category
Documents
-
view
0 -
download
0
Transcript of Modeling and control of VLSI circuit yield

91
Modeling and Control of VLSI Circuit Yield
Renzo Traversini, Aurelio De Lisio, Giuseppe Barbuscia SGS-Thomson Microelectronics, R. & D. Central Dept. 20041 Agrate Brianza (Milano) - Italy (*)
Abstract. Due to the increasingly critical role played by yield performance in VLSI device market competition, the development of yield models for product design and production control and improvement is nowadays a very active field of research and development. The overall manufac- tu r ing yield can be decomposed in several yield contributions related to different phases of the production process or to different degradation mechanisms. Defect yield losses are related to local device deformations usually due to spot defects and particles. Parametric yield losses are linked 10 global device deformations related to limited control on process conditions. In the paper several state-of-the-art modeling approaches to these yield terms will be presented. Moreover, the issue of yield control and monitoring for each of these loss contributions will be reviewed.
1. INTRODUCTION
Improving product yield is one of the major activities performed by engineering personnel in semiconductor companies. During process development and product development, yield improvement efforts are mainly aimed to achieve working prototypes and start pre- production. A fast learning cycle is required to ramp- up production at profitable levels as soon as possible.
In the production phase yield improvements are needed to survive the market competition on unit cost. While this does not apply strictly to some particular devices, it is dramatically true for a wide category of VLSI products, covering most of the world semicon- ductor market.
Improving product yield requires an appropriate knowledge of yield loss mechanisms and the way they are related to yield statistics. This problem is address- ed in this paper in section 2 and 3.
However, there are several yield losses that must be considered inherently linked to the production process. They act as a background loss level that must be clear- ly estimated and controlled to enable the identification of systematic drift of process quality and trigger cor- rective actions. The subject of yield control and management will be discussed in section 4.
2. YIELD IN VLSI MANUFACTURING
There are several yield contributions related to VLSI integrated circuit production. The ratio of chips sur- viving the final testing phase after wafer fab process- ing, parametric and probe testing, dicing and assembly is known as manufacturing yield. This figure is clearly
(*)This work has been supported by CNR, Piano Finaliz- zato ((Materiali e Dispositivi per I’Elettronica a Stato Solido)).
VOL. I . N. 3 MAY-JUNE 1990
dependent on the sample of chips used to estimate i t (for instance, all the product units made available for the market in a specified time interval); it gives an overall estimation of the efficiency of chip production without separating technological issues from manageri- al and human issues.
Manufacturing yield is usually decomposed in a number of yield terms related to the subsequent stages of chip production. The wafer yield is the fraction of wafers that reaches the probe testing stage after wafer fab processing. It describes the effects of loss mechanisms acting in the production line during wafer processing. These mechanisms are mainly related to human errors or to single step out-of-control situations. That means that wafer yield losses are not related to the global quality of the product, but mainly to single process step quality or line management.
Probe testing yield is the fraction of chips surviving the probe test after completion of wafer fab process- ing. This yield contribution is directly related to the global quality of the product as determined by desing and wafer fab manufacturing (this is strictly true only i f we include in this figure the yield contribution com- ing from reliability testing). In the extreme and simplified case of a complete coverage of local product quality out-of-control by means of wafer yield losses, the probe testing yield delivers information on the overall quality of product design and process integra- tion.
The testing gate dfter wafer fab processing is no1 limited to probe testing. Before shipping wafers to pro- be test, a number of electrical test measurements is per- formed on appropriate test structures, placed in specific sites on production wafers, to identify and discard wafers affected by huge mismatches between required electrical parameters and actual performances. The resulting yield figure, which bridges wafer yield to pro- be testing yield, is called processing yield (or sometimes
3 27
9R H. Traversini - A . Ile Lisio - <;. Barhuscia - Modeling and Control of V1.SI Circuit Yield
parametric yield, a term we will employ later for a somewhat different quantity).
Other yield terms refer to the assembly stage and to the final testing (final testing yield) stage of chip pro- duction.
A comprehensive account of these definitions is given by W. Maly, A.J. Strojwas and S. Director [ I ] . We will refer in the following to the framework defined in that paper as a ground for the discussion. In up-to-date VLSI production the relevant yield con- tributions to manufacturing yield are usually wafer yield, processing yield and probe testing yield. The pro- blem of managing and improving these performances is linked to technological issues, design issues but also line management questions.
Yield figures are clearly related to the overall unit cost of the product; the unit cost is a decreasing func- tion of all the various yield terms. While higher yield values usually result in a lower unit cost, this does not imply that in real market and operating conditions max- imum profit is always linked to minimum yield losses [2, 31.
This is linked to the relationships existing among ran- dom yield losses, product cycle time, production scheduling and planning. Higher wafer yield figures usually relates to higher production flow uniformity; the perturbing influence of random loss events is pro- porrional to wafer yield losses. Keeping wafer yield to an appropriate level helps reducing wafer fab cycle time uncertainty. This in turn helps in improving customer service and, as a consequence, company profit. Wafer yield tuning can be achieved maintaining relaxed pro- cess control limits during the production phase and demanding a more careful quality screening to the pro- be testing phase. Using tight control limits in process control will inherently cause random losses in the pro- duction flow perturbing production flow uniformity and then causing some uncertainty in delivery dates, which in turn can be converted in economical penalties.
However, yield improvement is often the fundamen- tal leverage in market competition. Appropriate yield models are required as a framework for the decomposi- tion, diagnosis and solution of yield problems and the achievement of yield improvements.
Moreover, there are cases in which the attainment of a minimum yield level is essential to start a profitable production of a new product. In these cases the availability of yield models as a planning tool for new product design is of fundamental importance.
solutions. But i f we focus on the case of production processes already running, the problem of decompos- ing and modeling yield in terms of controlled parameters can be addressed also by statistical model- ing techniques (see for instance [39]).
In the following we will go through the modeling ap- proach proposed by [ I ] ; this will enable us to introduce several concepts which are fundamental in any yield modeling perspective.
The inherently limited reproducibility of the manufacturing process is described assuming that a number of random perturbations, called disturbances, are independently acting on the ideal structure of the product (as defined on the basis of design and process specifications; note that this ideal form is somewhat unknown a-priori due to limits in the modeling of nominal process and device features) giving origin to a population of actual ICs differing in their physical structure. The sample is stratified, according to the discrete and batch-oriented nature of VLSI production, by chip, by wafer and by lot. In the general case the disturbances are random variables whose distribution on the chip population depend on these stratification levels and on time.
The concept of disturbance is used here to account for very different physical events: the occurrence of a localized spot defect in a pattern of conducting strips or the overall geometrical mismacth due to misalign- ment during wafer exposure are two different examples of process disturbances.
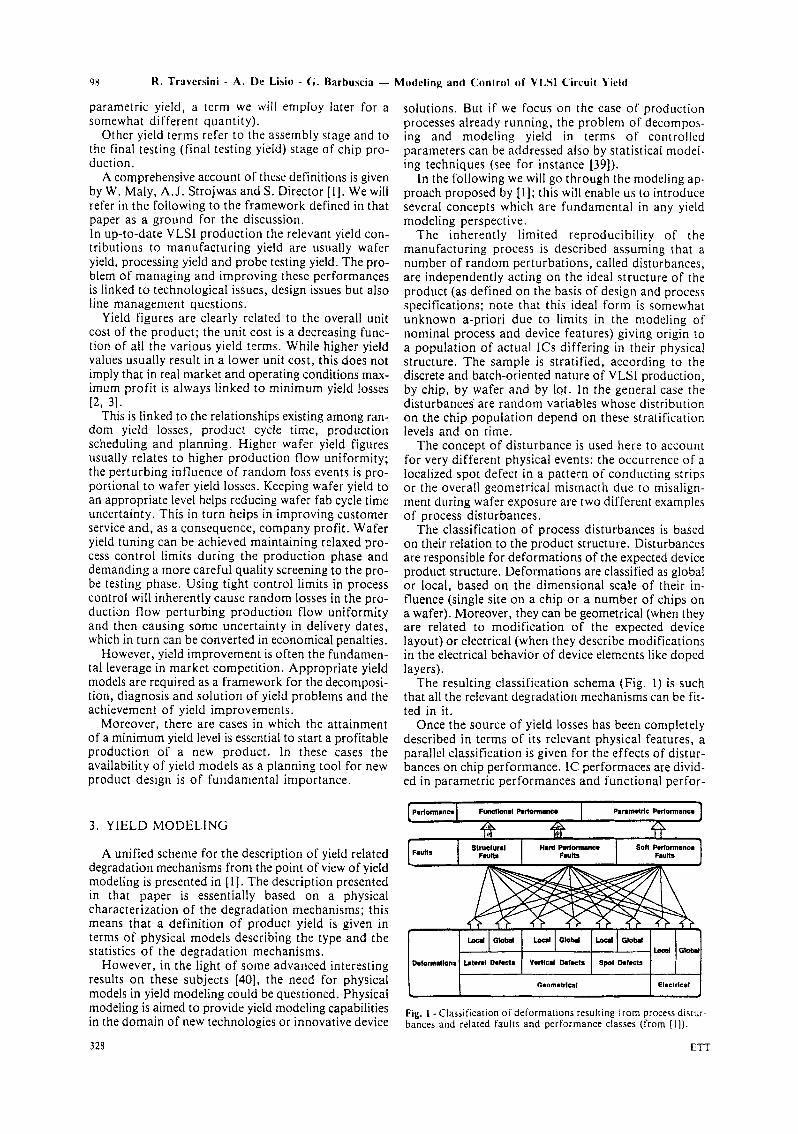
The classification of process disturbances is based on their relation to the product structure. Disturbances are responsible for deformations of the expected device product structure. Deformations are classified as global or local, based on the dimensional scale of their in- fluence (single site on a chip or a number of chips on a wafer). Moreover, they can be geometrical (when they are related to modification of the expected device layout) or electrical (when they describe modifications in the electrical behavior of device elements like doped layers).
The resulting classification schema (Fig. 1) is such that all the relevant degradation mechanisms can be fit- ted in it.
Once the source of yield losses has been completely described in terms of its relevant physical features, a parallel classification is given for the effects of distur- bances on chip performance. IC performaces are divid- ed in parametric performances and functional perfor-
3. YIELD MODELING
A unified scheme for the description of yield related degradation mechanisms from the point of view of yield modeling is presented in [I]. The description presented in that paper is essentially based on a physical characterization of the degradation mechanisms; this means that a definition of product yield is given in terms of physical models describing the type and the statistics of the degradation mechanisms.
However, in the light of some advanced interesting results on these subjects [40], the need for physical models in yield modeling could be questioned. Physical modeling is aimed to provide yield modeling capabilities in the domain of new technologies or innovative device
328
Fig. 1 - Classification of deformations resulting from process distur- bances and related faults and performance classes (from [ I ] ) .
ETT

R. Traversini - A. De Lisio - G . Barbuscia -
mances. Parametric performances are referred to single electrical parameters of the chip or of some selection of elementary electrical parameters of its component devices. Functional performances are related to the functional behavior of the chip as a complete system.
For both performance categories there is a predefined set of acceptable values; the deformation of the chip resulting from the disturbances will shift the parametric and functional performance of actual chips from their expected values. When these deviations place the system out of the set of acceptable performance values, they are called ((faults)).
On the basis of their characteristics, a functional classification of faults is possible. Performance faults consist of faults in some circuit performance not af- fecting the proper circuit functionalities; structural faults consist in structural modification of the circuit schema originating a functional behavior substantial- ly different from the expected one. Fault classification is aimed to describe and decompose the results of pro- be test and parametric test.
Given the general framework we have discussed since now, we turn now to the basic question addressed in yield modeling: the dependence of fault occurrences on the disturbances acting on the production wafers. A complete yield model should allow the prediction of wafer probe yield and processing yield on the basis of input information describing the nature and statistics of disturbances.
To achieve this general goal, several intermediate conditions should be met.
a comprehensive statistical model for the distur- bances must be available. This means that a pro- cedure has to be defined which will enable the deter- mination of all the quantitative parameters of the statistical distribution of the disturbances from data gathered from the production line; a functional model must be available that enables the computation of performance deviations and faults from the disturbances. This model must ac- count for the sensitivity of the ideal chip structure to process disturbances. This means that this part of the yield model will contain the variables describ- ing the specific circuit layout and structural aspects of the circuit. a computational procedure is required allowing the calculation of expected test results from the statistics of disturbances. This part of the model will depend on the test specifications and procedures.
Provided that all these items are available, wafer yield, probe yield and processing yield can be predicted on the basis of known disturbance statistics. Moreover, it is also possible to investigate the opposite procedure, i.e. the diagnosis of process disturbances by means of the analysis of performance faults (test results).
Nowadays there are few relevant examples of yield models meeting the requirements specified above, but they usually address only part of the relevant distur- bances. In particular, modelers have been active in the field of local disturbances (point defects) and global disturbances (process fluctuations). Two different classes of models, defect limited yield models and parametric yield models, have been investigated. This decomposition can be understood as due to the decoupling of the two types of disturbances achieved
vO1.. 1 - N. 3 MAY-JUNE 1990
Modeling and Control of VLSI Circuit Yield 99
in several process and product conditions [ I ] or for par- ticular modeling requirements [ 5 , 61.
Recently some research efforts have been perform- ed in the perspective of producing an unified approach to yield modeling including simultaneously local and global dusturbances [7, 81.
3. I . Defect yield modeling
One of the oldest sources of troubles in integra- ted circuit manufacturing is the occurrence of loca- lized structural defects in the product chip. This phenomenon is related to several different physical degradation occurrences (oxide pinholes, lithography spot defects, spikes in active areas, etc.). These distur- bances are often responsible for structural faults, even if in principle faults generated by defects can be of any type.
A widely used approach to the defect limited yield modeling consists in assuming that the distrubances are generated by a stochastic process independent from the layout and vertical arrangement of the chip structure. This process, that we will call defect generation pro- cess is assumed of some elementary type and its underlying statistics, in force of the previous hypothesis, can be determined by measurements that are independent from the specific product, that is by means of the electrical characterization of defect test chips or by visual inspection I9 i 221.
The defect generation process is expressed by the statistics of the defect of a given type generated per unit area. This quantity is called defect density and is denoted by D.
The functional model required to link disturbances to faults is in this case reduced to the assumption that any defect placed in an appropriate zone of the chip structure will compromise the functional behavior of the chip. The size of the defect sensitive region is known as critical area and is denoted by Ac.
The procedure to estimate test results from the model is in this specific case extremely simple. We are lead to define the probe yield Y of the chip as the probability that the chip does not contain defects of any type. Due to the independence of the generation processes for dif- ferent defect types, Y is simply the product of the pro- babilities Yk of having no defect of each type in the chip, k being the index labeling the N defect types:
N
Y = n u & ( 1 ) k = l
The simplest defect generation process is based on the assumption that the defect density acting on the wafer of the sample is a random variable whose distribution is uniform on the whole sample of chips, This means that the probability Prob(nk) of having nl defects of type k on a single chip does not depend on the individual chip, or on the wafer the chip belongs to.
The defect generation process at the chip level is then a Binominal process; this is usually approximated by the Poisson limit of rare events. In this case:
(2)
329

i i n ) R . Traversini - A. De Lisio - G . Barhuscia - Modeling and Control of VI.SI Circuii Yield
where A: is the critical area for defects of type k and Dk is the defect density.
By means of the relations ( I ) , (2), we have that: 1) a value for the defect density can be estimated from
the yield of specifically designed defect monitor chips (defectivity test patterns or chips);
2) an expected probe yield value can be computed; provided that critical areas of tested devices for all the defect types have been determined.
The basic structure of this model, called Poisson yield model, has been modified by several authors to account for the nonuniformity of the defect generation process. Several yield formulas have been given based on dif- ferent models of the defect density distribution on the sample. The more general approach to the problem is that of Stapper [14]. based on the usage of a two- parameters distribution for D over the sample. Stap- per assumes that the defect density acting on the sam- ple is distributed according to a Gamma density distribution function (Fig. 2):
a-I e-:/P
f&) = zp"r(Q)
where a and /3 have to be estimated from the distribu- tion of yield values over the sample (for instance, from the distribution of wafer yields over the sample) [50] (Fig. 3).
The resulting yield estimate is:
1
( 1 +AD)" Y =
where the average defect density D is equal to ap. The parameter Q is shown to be related to the defect cluster- ing phenomena and therefore is sometimes called clustering parameter [21].
The major drawbacks of these approaches are: 1 ) the assumed independence of the disturbances from
one another and from the chip structure; 2) the determination of critical areas; 3) the actual fault types related to defect occurrences.
The first point has been addressed trying to measure defect occurrences in test structures reproducing as far as possible the production chip structure and geometry [ l a .
The determination of critical areas can be approach- ed by using standard geometrical computation capabilities of layout design systems [23 + 27) .
0 1 2 3 4 5 6 fig. 2 - Gamma probabilicy density I'unctions
330
= I ) (t'rorn Ida]).
L M 690 - D e f e c t D e n s i t y
0.8
0.6
0.4
0.2
0.0
D
Fig. 3 - Distribution of observed values of defect density D at a specific process equipment and best-fit G a m m a density function (from [dSl).
A more general approach, that can cover also the last issue, is based on a detailed statistical simulation of the defect generation process on the device structure and a subsequent electrical characterization of the resulting perturbed circuit by means of a specific simulator. This is the fundamental idea underlying the simulation tool VLASIC 128,291 developed at Carnegie-Mellon Univer- sity by H. Walker and S. Director (Fig. 4). This tool
SPATIAL RNG
1 SIZE RNG
I PLACED DEFECTS
1 RAW FAULTS FAULT ANALYSIS
FAULT COMBINATION 8 FILTERING
1 SAMPLE OUT
Fig. 4 - VLASIC System s[ructure (from [ZS]).
is able to accept as input the defect statistics and a struc- tural description of the product chip (layout, vertical layer structure); it generates as output the expected statistical results of probe testing of a simulated sam- ple of chips, giving a detailed account of expected fre- quency of fault types.
3.2. Parametric yield modeling
The modeling of global disturbances through physical process models combined with the Monte Carlo method has been initiated in a pioneering work published in 1964 on the IBM R&D Journal (30, 31, 32). The whole matter has been properly defined in the framework of VLSI processes for integrated circuits and implemented in a simulator by W . Maly and A.J. Strojwas [33, 34).
ETT

R . Traversini - A. De Lisio - G . Barbuscia - Modeling and Control of VLSl Circuit Yield 101
- - -
-
The process disturbances are in this case a number of noise' factors affecting the physical characteristics of the material (diffusivities, mobilities, etc.) and the control parameters of the process (uncontrollable con- tribution to temperature, pressure and gas fluxes in ox- idation tubes; fluctuations in exposure time, exposure intensity and alignment in lithography, and so on) (Figs. 5 , 6).
1 Wafer Level - r n
RNG m
RNG - (I Chip Level
RNG - RNG -
7 s RNG
frequency
8.3E 1
- rn
a) nxide thickness
RNG rn (I
frequency(%)
7
-
threshold voltage b)
Fig. 5 - Threshold voltage disrriburion h) resulting from process parameter fluctuations as for oxide thickness a) (NMOS enh tran- sistor, SGS-Thomson).
56.
46-
38- n
i e
a
thrahold voltage
Fig. 6 - Filled histogram: measured disrribuiion of threshold voltage (as in Fig. 5 ) . Empty histogram: simulated distribution of thresold voltage based on the Monte Carlo method using the analytical Deal- Grove model for gate oxidarion and the numerical device simulator SEDAN I1 (Simulated statistics account only for random effects in the gate oxidation step).
A detailed modeling of the influence of these distur- bances on the chip structure can be derived from the already available process and device models used for nominal process and device design. An assumption is made about the independence of the disturbances. The
VOL. I - N. 3 MAY-JUNE 1990
statistical distribution of the disturbances is obtained assuming a hierarchical model based on the gaussian distribution, whose mean and standard deviation are gaussian random variables depending on the wafer and lot levels (Fig. 7).
L o t Level
Device Level
D
Fig. 7 -Three stage hierarchical random number generator for distur- bances.
A procedure is available to determine the parameters of the disturbance distributions by means of ap- propriate test structure measurements [35].
The performance faults originated by the distur- bances are determined using a three stage Monte Carlo simulation: in the first stage a sample of perturbed chip structures is determined using the disturbance models. In the second stage electrical device simulation is used to determine the sample of circuit simulation input modeling parameters (for instance, the SPICE models) of the perturbed devices. In the third stage the sample of circuit performances is computed using circuit simulation programs. Where possible, the simulation is shortened by the use of analytical relations. The cir- cuit simulation resuits have to be post-processed to determine the fraction of simulated circuits satisfying functional and parametric specifications. The final out- put consists of the statistical distribution of chip per- formances and related yield figures.
This approach has been implemented in the statistical process-device simulator FABRICS I1 [33, 341 (Fig. 8). In the first implementation FABRICS I1 used analytical models for both process and device modeling. To im- prove the modeling coverage and the accuracy of the simulator, a number of numerical computations has been successively introduced. Statistical samples are generated using Monte Carlo techniques (Fig. 9). However, it must be pointed out that the methodology is independent from the internal modeling structure of the various modules, so that the modeling strategy can in principle be applied using a full numerical approach.
Other approximation approaches have been also presented, based on empirical models for the circuit simulation input parameters and on polynomial ap- proximations for the boundaries of the region of parameter space containing the acceptable circuit con- figurations [36, 371.
Open critical issues are: 1) the computational resources required to achieve a
significant output sample. Hopefully, in the near future computing costs will drop to a level such that this not be a problem;
331

R . T'raversini - A . I)e I.isio - t i . Harhusria - M(idr l ing and Conlrol o f VI.SI ('irritil k i d d I02
PROCESS VARIATIONS &
DISTURBANCES P R 0 C E S S
PARAMETERS -
30 T
PRMCIPAL DMPONENT
PECOMPOSITION
I I I
PARAMETERS
FACTOR IN-LINE IDENTIFICATION
f
SPICE
I
c
1 MF; , IN-LINtS
Fig. 8 - FABRICS 11 System Flow Chart.
, 'UT 1 PERFORMANCES
-1 -0.95 -0.9 -0.85 -0.8
Fig. Y - FABRICS output. threshold voltage distribution of p-ch MOS transisrw (from 161).
2) the accuracy of process and device models used in the simulation. This is a much harder problem due to the limited knowledge available about a con- siderable set of process and device phenomena of utmost importance in state-of-the-art VLSI process- ing.
An efficient approach to the first question above is based on the application of experimental design and
response surface techniques [39] to the statistical cir- cuit simulation problem. These techniques are essen- tially aimed to minimize the number of experimental runs required to characterize predefined models con- necting a set of response variables to a set of predic- tors. An interesting contribution to statistical circuit simulation based on this approach has been proposed by K.K. Low and S. Director [40].
4. YIELD CONTROL AND MANAGEMENT
VLSI manufacturing activities are oriented to achieve, maintain and improve product quality and in particular product yield. At the same time, production must be profitable and perform according to expected time and volume targets. For this reason the control and management of yield in semiconductor manufac- turing is linked to the more general problem of the statistical control of the VLSI fabrication process [ 2 , 31 oriented to maximum profit.
Yield losses during the fabrication process are often linked to decision that must be taken when the quality of the product after some operation is questionable. The decision could be rejecting the material or continue processing. In any case this will influence the work in
332 ETT

R . Traversini - A. De Lisio - G. Barbuscia - Modeling and Control of VLSI Circuit Yield I03
progress balance modifying the expected values of product cycle time and output volume in the immediate future.
Any control decision of this type will be managed by setting appropriate threshold levels on measured decision variables. From the above considerations i t is clear that the decision levels will be determined from the condition of minimization of an objective function describing the profit as related to the actual work in progress, the production costs and the expected action of statistical factors in the process. A complete discus- sion of this issue and a proposal for the objective func- tion can be found in [ 2 ] .
As far as we are concerned here, we will ignore the economical tradeoffs involved in yield management and we will focus on the technological problem subtended by target yield requirements and their management.
4.1. Parametric statistical process control
Achieving quality targets requires a n appropriate learning procedure enabling process/product engineer- ing to analyze process disturbances and modify them acting on properly selected control variables. In general the final goal consist of moving the statistical distribu- tion of process disturbances from the current form to a new form that usually is required to be globally displaced from the previous one and sharpened.
The statistical distribution of a disturbance is related to several different issues: 1) time, lot, wafer and chip variations; 2 ) equipment structure and operation; 3) environmental characteristics and their time and
space evolution; 4) operator behavior.
The current distribution can be analyzed to the pur- pose of partitioning the disturbance spread by the fac- tors listed above and identify possible variance con- tributions that can be reduced or eliminated.
Moreover, modeling the functional dependence of process output from equipment control variables, time and space, new operating points can be identified with possibly a minimum sensitivity to process disturbances. The basic methodology to achieve this goal is ex- perimental design 1391.
When a viable process configuration has been iden- tified, the problem of maintaining the achieved quali- ty levels arise.
Local statistical process control is aimed to face this problem by single process step monitoring. Statistical process control (SPC) techniques have been developed in various industrial production environments to sup- port quality control. These techniques are aimed to asset and control the conformity of single process step output to a known or expected statistical distribution. Some statistical decision rules have been devised to recognize out-of-control situations and start corrective actions.
The basic idea consist in routinely sampling the pro- cess and testing the hypothesis that the last observa- tion belongs to the expected or cumulated distribution of previous values. This can be accomplished in several ways, the most common being the usage of control charts. In the specific case of semiconductor manufac- turing, the discreteness of the production flow requires a slightly more complex approach based on monitor-
VOL. I - N. 3 MAY-JUNE 1990
ing simultaneously the three distributions linked to lot- to-lot, wafer-to-wafer and chip-to-chip variations (421.
Local process control is usually not suited for main- taining and improving the overall process performances that are usually synthetized by probe yield.
Achieving and maintaining target probe yield levels requires a global statistical control procedure relating yield performance to a specific set of process control variables describing the whole set of process steps con- stituting the production process.
Global statistical process control can be modeled considering the whole production process as a single macro-operation whose output is measured by the pro- be yield results. In this framework experimental design techniques and SPC techinques can be applied to ap- proach the problem of yield control and management.
The critical issues here are: 1) the resource investment required to collect data. The
measurements involved here are performed on a variety of equipment; often the availability of sophisticated measurement devices is required. Moreover the sample Size usually is not small due to the accuracy required to properly monitor the disturbances;
2) the information gathering and data processing capability required to production line information systems.
3) Moreover, a link to the design environment is re- quired to feed-back the process learning cycle up to the product and process design phase.
The improvement of yield results is linked to the ability of diagnose yield results and partition yield losses among the known disturbances. This is a new and open research issue. The large amount of test data coming from routine test activity on product chips is a capital of information that will be exploited in the future to this purpose. An inference capability is required that will be provided by artificial intelligence systems (42, 43, 441.
4.2. Defect control and reduction
The control and reduction of random defects has to be considered a specific task in process control due to some inherent aspect of this particular disturbance type.
The data collection problem in the case of defects is characterized by several features unique to this specific application. Collecting data on defects in highly controlled environmental conditions and state-of-the- art clean rooms requires the examination of very large samples of devices and silicon area. Due to the in t r in- sic unreliability and slowness of human operators, there is a strong requirement for automated defect recogni- tion and classification equipment. Moreover, the size of defects relevant to small geometry devices (VLSI and ULSI) is dropping below the threshold of the microscope resolution.
Automated inzpection equipment is becoming a must for defect control in VLSI advanced process monitor- ing [45, 461. The most relevant techniques used in this field are based on optical data processing; they are: 1 ) the fourier analysis of polarized diffused light; 2 ) the comparison of pre-processed digital images of
3) holographic techniques based on spatial filtering of congruent fields;
the wafer image.
33.7

I04 R. Trave r s in i - A. De Lisio - G - Barbusc ia - Modeling and Conirol 0 1 V I . S I <‘irc.riit k’icltl
In all cases the inspection time for an entire 6” wafer is of the order of one hour due to the overhead linked to image processing computation.
The relevant parameters to be considered in evaluating these solutions are (Fig. 10):
10 1 0. 1 0.01
P a r t i c l e D i ame ter ( m i c r o n s )
Fig. 10 - lnspection rate arid particle sensitivity for srveral automated inspection equipment (from [46]).
1) particle resolution; the state-of-the-art is today on the border of submicron particles.
2) inspection rate; this is general inversely proportional to particle resolution and, for the state-of-the-art techniques, ranges up to one hour.
3) classification capability; that is, the ability to store recorded defects in a database with possibly a classification of defect types. This issue is also linked to the ability to drive external tools to allow inspec- tors in reviewing defects.
Anyway, the capability of current inspection equip- ment has dramatically improved in a few years the potential impact of defect reduction procedures on pro- duct yield, provided that a comprehensive strategy for defect reduction has been planned [45].
Once a proper procedure for defect detection and classification has been settled, the dependence of pro- be yield results on defects must be investigated. An ef-
Fig. 12 - Test chip for contact defectivity monitoring. Snake struc- tures are composed by n + and p + contact chains. The chip con- tains also two capacitors for dielectric integrity monitoring (SGS- Thomson).
ficient way of relating performance failures with observed defects is based on the usage of defect test chips.
Defect test chips [14] consist of special device struc- tures designed for detecting the occurrence of elemen- tary failures (interlayer and intralayer shorts, opens, leakage, etc.) in particular layout arrangements that are in use in the product chips. Examples of test structures are: contact chains, capacitors, spider devices (snake- comb structures) (Figs. 11 and 12). Data in failures are collected at probe testing and can be used:
OBS E RVATI 0 N S
Fig. 13 -Control Chart for defect densiiy monitoring. Squares: individual observa- tion of D; diamonds; exponentially weighted average values (from 1481).
334 ETT

R. Traversini - A. De Lisio - G . Barbuscia -
1 ) to estimate defect densities by using yield models; 2) to back-inspect the test chip structures and classify
defects. The usage of automated inspection equipment opens
the way to a fast and efficient back-inspection of defect test chips and moreover it allows the comparison of defect data collected during processing and defect data coming from probe testing. This information will allow a non arbitrary identification of killer defect classes 1471 '
Standard SPC techniques and statistical methods can be used also in the case of defect control 148, 491 (Fig. 13) to monitor current defect density level and trigger corrective actions.
Manuscript received on August 28, 1989.
REFERENCES
W. Maly, A . J . Strojwas, S.W. Director: VLSIyieldprediction and estimation: a unifiedframework. (tlEEE Trans. Computer- Aided Desingx. vol. CAD-5, n. 5, January 1986, p. 114-130. P.K. Mozurnder C.R. Shyamsundar, A.J. Strojwas: Stafistical control of VLSI fabrication processes: a framework. KIEEE Trans. Seminconductor Manufacturing)), vol. 1, n. 2. May 1988.
C.R. Shyamsundar. P.K. Mozurnder, A.J. Strojwas: Sfofistical conrrol of VLSI fabrication processes: a software system. NIEEE Trans. Semiconductor Manufacturing)), vol. I . n. 2, May 1988, p. 72-82. W. Maly. S.E. Naik: Process moniforing oriented I C testing. ((Internal Report, Dept. ot Electrical and Computer Engineer- ing)), Carnegie-Mellon University, 1989. W . Maly: Modeling of lithography relatedyield losses for C A D of VLSI circuifs. (tlEEE Trans. Computer-Aided Design)), vol. CAD-4, n. 3, July 1985, p. 166-177. S.R. Nassif A.J. Strojwas, S.W. Director: A methodologyfor worst-case analysis of integrated circuits. tclEEE Trans. Computer-Aided Design)). vol. CAD-5, n . I , January 1986, p. 104-1 13. K. Razdan A.J . Strojwas: A sfatisfical design rule developer. (clEEE Trans. Computer-Aided Design)), vol. CAD-5, n. 4, Oc- tober 1986. p. 508-520. lhano Chen, A.J. Strojwas: Realisfic yield simulation fw IC rtrucrural failures. ((Proceedings ICCADu, 1986, p. 220-223. C.H. Stapper, F.M. Armstrong, K. Saji: Inregrated circuit yield sfatistics. ((Proceeding of the IEEE)). vol. 71, n . 4 , April 1983.
r. Yanagawa: Yield degradation of iniegrared circuits due lo spot defecis. (tlEEE Trans. Electron Devices,). vol. ED-19, n. 2, February 1972, p. 190-197. C.H. Stapper: Defect density disfributionfor LSI yield calcula- tions. c(lEEE Trans. Electron Devices)), Ju ly 1973, p. 655-657. A. Gupta, W.A. Porter, J .W. Lathrop: Defect analysis and yield degradation of integrated circuirs.((IEEE J . Solid-state Circuits)). vol. SC-9, n. 3, June 1974. p. 96-103. E.I . Muehldorf: Faulr clustering: modeling and observation on t'xperrmental LSI chips. ctlEEE J . Solid-State Circuits)), vol. SC-10, n . 4, August 1975, p. 237-244. C.H. Stapper: LSI yield modeling and process monitoring. (clBM J . Res. Develop)), May 1976, p. 228-234. S.H. Hu: Some considerations in the formulution of ICyield sfatistics. ((Solid-State Electronics)), vol. 22, 1979, p. 205-21 I . C.H. Stapper: Comments on some considerations in the for- mulation of ICyield statistics. ((Solid-State Electronics)), vol. 24, 1981. p. 127-132. C.H. Stapper, R.J. Rosner: A simple method for modeling VLSIyield. (6olid-State Electronics)), vol. 25. n. 6 , 1982. p. 487-489. C.H. Stapper: Modeling of integrated circuit defect sensirivities. NIBM J. Res. Develop)), vol. 27, n . 6, November 1983, p. 549-557. C.H. Stapper: Yield model for fault clirsrer within inlegruled circuits. NIBM J . Res. Develop.)), vol. 28. n. 5 , September 1984,
C.H. Srapper: Theeffect of wafer to waferdefect demity varia- tions on integruted circuir defecr and fault distribufion. ctlBM
p. 62-71
p. 453-470.
p. 636-639.
VOL. 1 - N. 3 MAY-JUNE 1990
Modeling and Control of VLSI Circuit Yield I05
J. Res. Develop.)). vol. 29, n. I . January 1985. p. 87-97. C.H. Supper: On yield. fault distribution, and clustering OJ particles. ctlBM J . Res. Develop.)), vol. 30. n . 3, May 1986,
C.H. Stapper: Correlafion analysis of pariicle clusters on in- tegrafed circuil wafers. ((IBM J. Res. Develop.)), vol. 31, n . 6, November 1987, p. 641-649. A.V. Ferris-Prabhu: Modeling thecritical area in yield forecasts. tclEEE J. Solid-state Circuits)), vol. SC-20, n. 4, August 1985,
A.V. Ferris-Prabhu: Defecf size variations and their effect on the critical area of VLSI devices. ((IEEE J . Solid-state Circuits)), vol. SC-20, n. 4. August 1985, p. 878-880. A.V. Ferris-Prabhu: Role of defect size distribufion in yield modeling. ((IEEE Trans. Electron Devices),, vol. ED-32, n. 9, September 1985. p. 1727-1736. A.V. Ferris-Prabhu: Yield implicafions and scaling lawsjorsub- micrometers devices. ((IEEE Trans. Semiconductor Manufac- turing)), vol. 1, n. 2, May 1988, p. 49-61. S. Gandemer, B.C. Tremintin, J .J . Charlot: Critical area and critical levels calculation in IC yield modeling. MIEEE Trans, Electron Devices)), vol. 35, n. 2, February 1988. p. 158-166. H. Walker, S. W. Director: VLASIC: a cafasfrophic fault yield simulator for integrated circuits. ct IEEE Trans. Computer- Aided Design)), vol. CAD-5, n. 4, October 1986, p. 541-556. H . Walker: Yield simulation for integraied circuits. ((Kluwer Academic Publishers)), Boston, MA, 1987. D.P. Kennedy Monfe Carlo analysis of fransistor diffusion fechniques. ((IBM J . Res. Develop.)), October 1961, p. 331-334. D.P. Kennedy, P.C. Murley, R.R. O'Brien: A sfatistical ap- proach to ihe design of dvfused junction transistors. tclBM J. Res. Develop.)), November 1964, p. 482-495. C.H. Stapper, P.B. Hwang: Simulation of FET device parameters for LSI manufacturing. ((Semiconductor Silicon 1977n, vol. 77-2, Princeton, NJ. Electrochem. SOC., May 1977, p. 955-967. W. Maly, A.J . Strojwas: Statistical simulation of (he IC manufacturing process. (tlEEE Trans. Computer-Aided Design)), vol. CAD-I, n. 3, July 1982, p. 120-131. S.R. Nassif, A.J. Strojwas, S.W. Director: FABRICS /I: A stafistically based IC fabricofion process simulator. t r l EEE Trans. Computer-Aided Design)), vol. CAD-3, n. I , January
C.J.B. Spanos, S.W. Director: Parameter extraction for sfatistical ICprocess characferizafion. NIEEE Trans. Computer- Aided Design),, vol. CAD-5. n. I , January 1986. p. 66-78. J .P. Spoto, W.T. Coston, C.P. Hernandez: Statistical in- tegrated circuit design and characterization. ((IEEE Trans. Computer-Aided Design)), vol. CAD-5, n. 1, January 1986, p.
P . Yang, D.E. Hocevar, P.F. Cox, C. Machala, P.K. Chat- terjee: An integrated and efficient approach for MOS VLSI statistical circuil design. tcIEEE Trans. Computer-Aided Design)), vol. CAD-5, n. I , January 1986, p. 5-14. G.M. Koppelman, M.A. Wesley: OYSTER: A study of in- tegraied circuits as three-dimensional structures. (( 1BM J. Res. Develop)), vol. 27, n. 2, March 1983, p. 149-163. G.E.P. Box. N.R. Draper: Empirical model-building and response surfaces. John Wiley and Sons Inc., 1982. K .K. Low, S.W. Director: A n efficient macromodeling ap- proach for statistical IC Process design. ((Proceedings ICCAD-88)). November 1988, p. 16-19. R . Penning de Vries: Confrolcharts in IC manufacturing: selec- [ion of subgroups. SEMICON Europa 88 Technical Pro- ceedings. A.J. Strojwas, S.W. Director: A pattern recognition based method for IC failure analysis. ccIEEE Trans. Computer-Aided Design)). vol. CAD-4, n. I , January 1985, p. 76-92. J .P. Shen, W. Maly, F.J. Ferguson: Inductivefault analysis ofMOS inregrated circuits. tclEEE Design &Test.)), December
P. Odryna, A.1. Srrojwas: PROD: A VLSI fault diagnosis system. cclEEE Design & Test)), December 1985, p. 27-35. G. Dickerson, R. Estrada: Defect inspection srrutegies utiliz- ed in semiconductor manu factitring. 9th ICCCS Proceedings 1988, Institute Of Environmental Sciences, 1988. p. 684-691, J.S. Batchelder: Surface contaminorion inspection fechniques. 9th ICCCS Proceedings 1988, Institute Of Environmental Sciences, 1988, p. 679-683. W.C. Teutsch, D.C. Drain: A sfrafegy for combining electrical defect monitors wifh auiomatic visual inspection sysrems to op- rimbe defecr defection and classification. SPIE 1989 Sym- posium.
p. 326-338.
p. 874-878.
1984, p. 40-46.
90- 103.
1985, p. 13-26.
335

106
I481 A. De Lisio. R . Traversini, G. Barbuscia. EWMA controlcharrs for defect monitoring. Proceedings SEMI STEP Europe Con- ference on Defect Control and Related Yield Management (Bruxellea, October 27-28, 1988), p. 156-162.
[49] S.M. Ashkenaz: Defecf munagernenf through SPC ond sporiol analysis. Proceedings SEMI STEP Europe Conference on
R. Traversini - A . De Lisio - G. Barbuscia - Modeling and Control of VLSI Circuit Yield
Defect Control and Related Yield Management (Bruxelles, Oc- rober 27-28, 1988), p. 146-153.
[SO] R. Traversini, A . De Lisio. M. Tosi, G. Barbuscia: Statisricol defectivity control for V L S I devices. Proceedings ESSDERC 87 - 17th European Solid State Device Research Conference, (Bologna, September 14-17, 1987) p. 927-930.
336 ETT