Modèle simplifié de changement de phase en présence de ...
307
Modèle simplifié de changement de phase en présence de convection et rayonnement : Application à un mur translucide associant superisolation et stockage d'énergie thermiques Development of a simplified model for phase change in presence of natural convection and radiation: Application to a novel heat storage translucent superinsulated wall Farah SOUAYFANE Laboratoire Jean Alexandre Dieudonné LJAD Présentée en vue de l’obtention du grade de docteur en Science pour l’ingénieur de l’Université côte d’Azur et de l’Université Libanaise Dirigée par : Pascal Henry Biwole / Farouk Fardoun Soutenue le : 26 Novembre 2018 Devant le jury, composé de : Farouk Fardoun, Professeur, Université Libanaise Hassane Naji, Professeur, Université d'Artois Luisa Cabeza, Professeur, Université de Lleida Pascal Henry Biwole, Professeur, Université Clermont Auvergne Patrick Achard, Directeur de recherche, Mines- ParisTech Richard Pasquetti, Directeur de recherche, CNRS
-
Upload
khangminh22 -
Category
Documents
-
view
0 -
download
0
Transcript of Modèle simplifié de changement de phase en présence de ...

Modèle simplifié de changement de phase en présence de convection
et rayonnement : Application à un mur translucide associant
superisolation et stockage d'énergie thermiques
Development of a simplified model for phase change in presence of
natural convection and radiation: Application to a novel heat storage
translucent superinsulated wall
Farah SOUAYFANE Laboratoire Jean Alexandre Dieudonné LJAD
Présentée en vue de l’obtention
du grade de docteur en Science pour
l’ingénieur
de l’Université côte d’Azur
et de l’Université Libanaise
Dirigée par : Pascal Henry Biwole / Farouk
Fardoun
Soutenue le : 26 Novembre 2018
Devant le jury, composé de :
Farouk Fardoun, Professeur, Université
Libanaise
Hassane Naji, Professeur, Université d'Artois
Luisa Cabeza, Professeur, Université de Lleida
Pascal Henry Biwole, Professeur, Université
Clermont Auvergne
Patrick Achard, Directeur de recherche, Mines-
ParisTech
Richard Pasquetti, Directeur de recherche, CNRS


Modèle simplifié de changement de phase en présence de
convection et rayonnement : Application à un mur translucide
associant superisolation et stockage d'énergie thermiques
Development of a simplified model for phase change in presence
of natural convection and radiation: Application to a novel heat
storage translucent superinsulated wall
Jury :
Rapporteurs
Hassane Naji, Professeur, Université d'Artois
Luisa Cabeza, Professeur, Université de Lleida
Examinateurs
Patrick Achard, Directeur de recherche, Mines-ParisTech
Richard Pasquetti, Directeur de recherche, CNRS
Directeurs de thèse
Farouk Fardoun, Professeur, Université Libanaise
Pascal Henry Biwole, Professeur, Université Clermont Auvergne


5
Modèle simplifié de changement de phase en présence de convection et
rayonnement : Application à un mur translucide associant superisolation
et stockage d'énergie thermiques
Résumé
Au Liban comme en France, la consommation énergétique des bâtiments représente plus de 40% de
l’énergie finale totale. Une proportion significative de la consommation d'énergie dans les bâtiments
est utilisée pour le refroidissement et le chauffage. Une alternative pour atteindre l'objectif de
réduction de la consommation d'énergie dans le bâtiment est d'améliorer la performance énergétique
de son enveloppe en intégrant des matériaux à changement de phase (MCP). De plus, une partie
importante de la conception du bâtiment consiste à utiliser au mieux les ressources externes et en
particulier l'exploitation du rayonnement solaire. La fusion des MCP s’accompagne de différents
phénomènes, à savoir, la convection naturelle et l’absorption ou transmission du rayonnement. Dans
les bâtiments, où une évaluation thermique annuelle est nécessaire, la plupart des études sur les
façades translucides intégrant du MCP ont négligé l'effet de la convection naturelle pendant la fusion
et ont supposé des transferts unidimensionnels par conduction et rayonnement. Parce que cette
hypothèse n’est pas toujours adéquate, le développement d’un modèle numérique simplifié prenant
en compte la convection naturelle et le rayonnement lors du changement de phase, adapté à une
évaluation thermique annuelle, est nécessaire. Ainsi, dans cette thèse, un modèle numérique simplifié
bidimensionnel a été développé, en premier temps, dans le but de modéliser la convection naturelle
pendant le processus de fusion d’un matériau à changement de phase. Une validation du modèle est
faite à l’aide d’un modèle CFD précédemment développé, et des résultats numériques et
expérimentaux trouvés dans la littérature pour le cas : fusion d’Octadécane dans une cavité carrée.
Ensuite, un modèle numérique simplifié en 2D pour la fusion du MCP en présence de la convection
naturelle et du rayonnement courte longueur d’onde (CLO) a été développé. Le modèle a été validé à
l’aide d’une méthode de Boltzmann sur réseau couplé avec la méthode des ordonnées discrètes
(LBM-DOM) trouvée dans la littérature pour le cas : fusion d’acide gras dans une cavité rectangulaire.
En outre, dans le contexte d’efficacité énergétique et d’exploitation optimale des ressources
environnementales, le projet INERTRANS a proposé le développement d'une façade solaire
translucide innovante. Cette façade fournit un éclairage naturel et est composé d’une couche d’aérogel
de silice assurant une isolation thermique et acoustique importante, et d’un matériau à changement
de phase (MCP). Ce dernier est contenu dans des briques de verre et assure l’absorption, le stockage
et la restitution de la chaleur. Ce mur a été caractérisé expérimentalement en ambiance contrôlée et
in-situ sur un bâtiment à dimensions réelles et localisé au sein du centre PERSEE à Sophia Antipolis.

6
Son impact sur le bâtiment en termes de contribution aux apports énergétiques et lumineux a été mis
en évidence. Il a été remarqué que la performance thermique du mur est très élevée en hiver, tandis
qu’un problème de surchauffe a été rencontré en été lorsque le MCP reste à l’état liquide et n’arrive
plus à dissiper la chaleur stockée. Pour optimiser la performance du mur MCP-aérogels en été, un
modèle numérique simplifié décrivant les mécanismes de transfert de chaleur à travers le mur a été
développé sous MATLAB basé sur les deux modèles validés précédents. Ce modèle est trouvé simple
à mettre en œuvre et assez rapide pour être couplé à TRNSYS afin d’évaluer la performance
thermique de l'ensemble du bâtiment. Le modèle couplé MATLAB-TRNSYS a été validé
expérimentalement en été et en hiver à l’aide de la cellule expérimentale du centre PERSEE. Le
comportement thermique du mur est testé sous différentes conditions climatiques, et des solutions
passives sont proposées pour assurer le confort thermique en été. Les résultats ont montré que même
si le MCP ne cycle pas en été, le confort thermique peut être assuré à l'aide des dispositifs d'ombrage.
Enfin, le modèle validé a permis d'étudier le comportement thermique annuel d’un bâtiment intégrant
un mur MCP- aérogel dans son enveloppe, et ceci dans six climats différents. De plus, une étude
économique a été réalisée. Ces études ont confirmé l'intérêt du mur vis-à-vis de l'amélioration des
performances énergétiques du bâtiment. La faisabilité économique de l'application du mur MCP-
aérogel dépend principalement des conditions climatiques, des coûts de l’énergie, ainsi que de la
situation économique du pays et du coût d'investissement.
Mots clés : mur MCP-aérogel, matériau à changement de phase, modélisation, validation
expérimentale, convection naturelle, rayonnement, étude économique.
7
Development of a simplified model for phase change in presence of
natural convection and radiation: Application to a novel heat storage
translucent superinsulated wall
Abstract
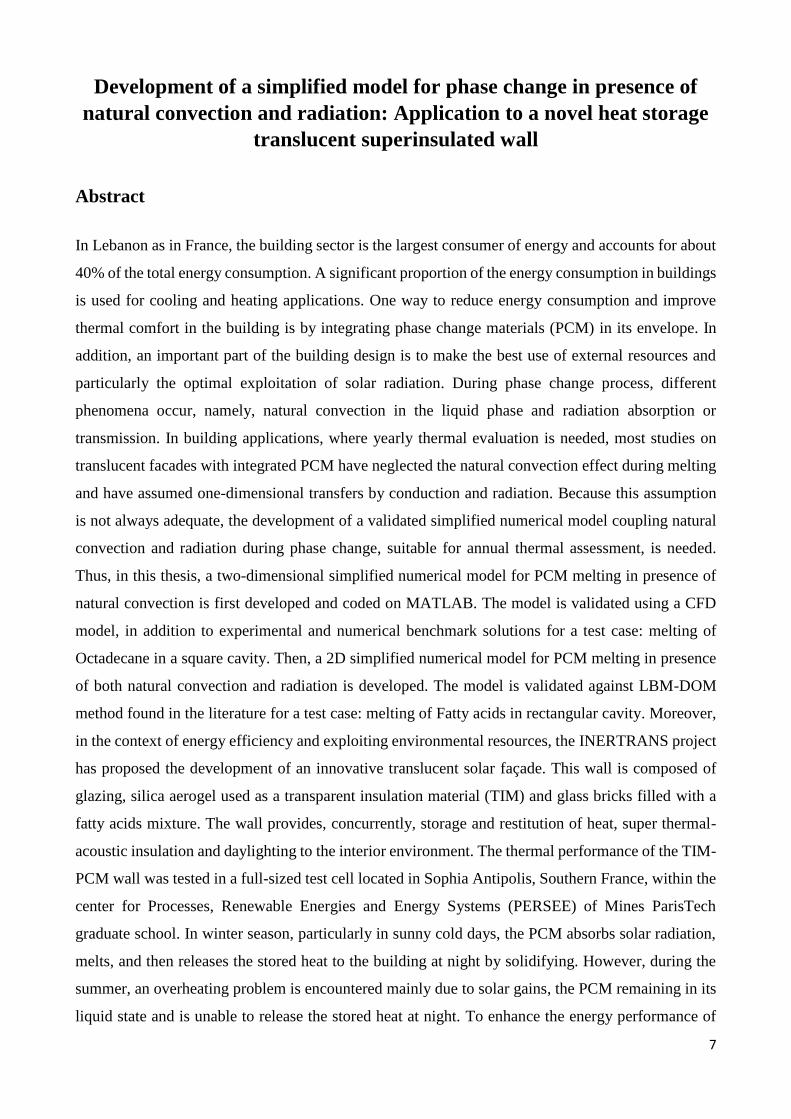
In Lebanon as in France, the building sector is the largest consumer of energy and accounts for about
40% of the total energy consumption. A significant proportion of the energy consumption in buildings
is used for cooling and heating applications. One way to reduce energy consumption and improve
thermal comfort in the building is by integrating phase change materials (PCM) in its envelope. In
addition, an important part of the building design is to make the best use of external resources and
particularly the optimal exploitation of solar radiation. During phase change process, different
phenomena occur, namely, natural convection in the liquid phase and radiation absorption or
transmission. In building applications, where yearly thermal evaluation is needed, most studies on
translucent facades with integrated PCM have neglected the natural convection effect during melting
and have assumed one-dimensional transfers by conduction and radiation. Because this assumption
is not always adequate, the development of a validated simplified numerical model coupling natural
convection and radiation during phase change, suitable for annual thermal assessment, is needed.
Thus, in this thesis, a two-dimensional simplified numerical model for PCM melting in presence of
natural convection is first developed and coded on MATLAB. The model is validated using a CFD
model, in addition to experimental and numerical benchmark solutions for a test case: melting of
Octadecane in a square cavity. Then, a 2D simplified numerical model for PCM melting in presence
of both natural convection and radiation is developed. The model is validated against LBM-DOM
method found in the literature for a test case: melting of Fatty acids in rectangular cavity. Moreover,
in the context of energy efficiency and exploiting environmental resources, the INERTRANS project
has proposed the development of an innovative translucent solar façade. This wall is composed of
glazing, silica aerogel used as a transparent insulation material (TIM) and glass bricks filled with a
fatty acids mixture. The wall provides, concurrently, storage and restitution of heat, super thermal-
acoustic insulation and daylighting to the interior environment. The thermal performance of the TIM-
PCM wall was tested in a full-sized test cell located in Sophia Antipolis, Southern France, within the
center for Processes, Renewable Energies and Energy Systems (PERSEE) of Mines ParisTech
graduate school. In winter season, particularly in sunny cold days, the PCM absorbs solar radiation,
melts, and then releases the stored heat to the building at night by solidifying. However, during the
summer, an overheating problem is encountered mainly due to solar gains, the PCM remaining in its
liquid state and is unable to release the stored heat at night. To enhance the energy performance of
8
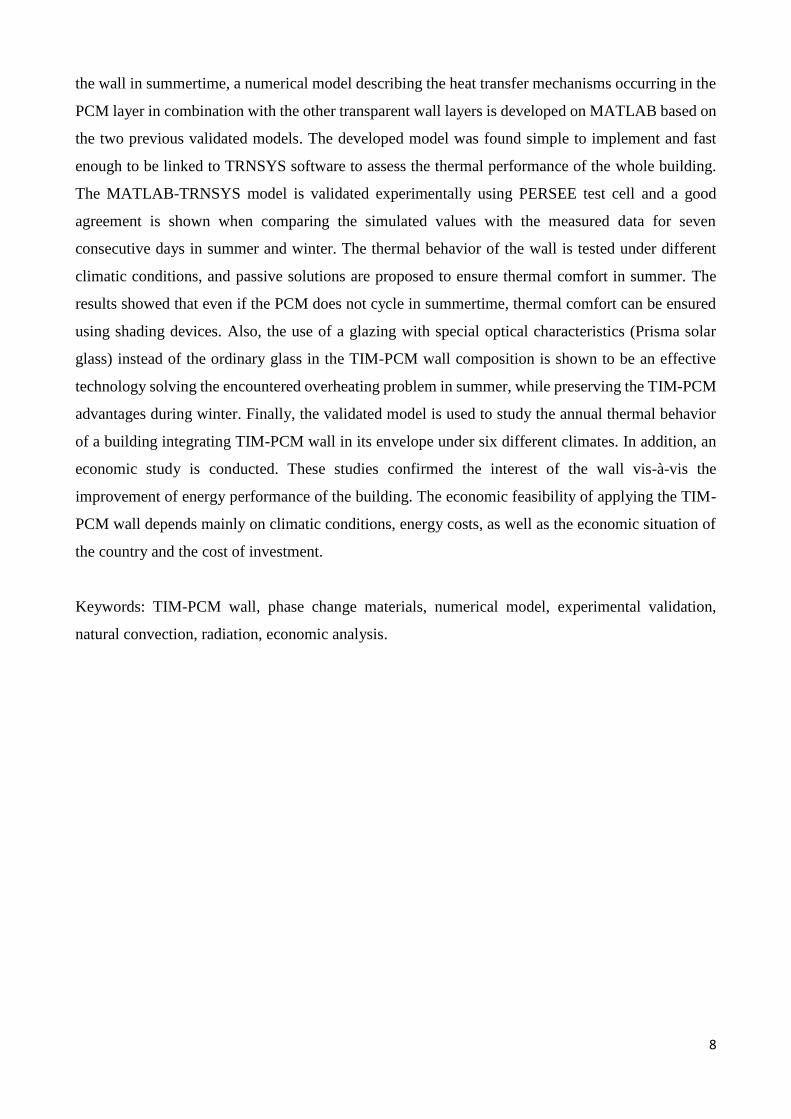
the wall in summertime, a numerical model describing the heat transfer mechanisms occurring in the
PCM layer in combination with the other transparent wall layers is developed on MATLAB based on
the two previous validated models. The developed model was found simple to implement and fast
enough to be linked to TRNSYS software to assess the thermal performance of the whole building.
The MATLAB-TRNSYS model is validated experimentally using PERSEE test cell and a good
agreement is shown when comparing the simulated values with the measured data for seven
consecutive days in summer and winter. The thermal behavior of the wall is tested under different
climatic conditions, and passive solutions are proposed to ensure thermal comfort in summer. The
results showed that even if the PCM does not cycle in summertime, thermal comfort can be ensured
using shading devices. Also, the use of a glazing with special optical characteristics (Prisma solar
glass) instead of the ordinary glass in the TIM-PCM wall composition is shown to be an effective
technology solving the encountered overheating problem in summer, while preserving the TIM-PCM
advantages during winter. Finally, the validated model is used to study the annual thermal behavior
of a building integrating TIM-PCM wall in its envelope under six different climates. In addition, an
economic study is conducted. These studies confirmed the interest of the wall vis-à-vis the
improvement of energy performance of the building. The economic feasibility of applying the TIM-
PCM wall depends mainly on climatic conditions, energy costs, as well as the economic situation of
the country and the cost of investment.
Keywords: TIM-PCM wall, phase change materials, numerical model, experimental validation,
natural convection, radiation, economic analysis.

9
Acknowledgment
First and foremost, I want to express my sincere gratitude to my supervisors Pr. Farouk FARDOUN
and Pr. Pascal Henry BIWOLE for their help and support during the past three years. It has been an
honor to be their Ph.D. student. Without their assistance and encouragement, this work would not
have been achieved.
I would also like to show my gratitude for the honorable jury members who accepted to examine my
project: Mrs. Luisa Cabeza, Mr. Hassane Naji, Mr. Patrick Achard and Mr. Richard Pasquetti.
I also want to acknowledge the support and help of all the staff members of Jean Alexandre
Dieudonné laboratory, EDST at Lebanese university, and the PERSEE research center at Mines
ParisTech in Sohpia Antipolis.
My deepest thanks go to the Lebanese university, the Côte d’Azur University and Embassy of France
in Lebanon. Their financial support is greatly appreciated.
My biggest love and gratitude goes to my family who gave me everything possible to enable me reach
higher education levels. I only hope that they know how their love, support and patience encouraged
me to fulfill my and their dream...


11
Nomenclature
ACH Air change per hour
averfl Average fraction of liquid in the PCM layer
B(T) Numerical step function, Eq.2-22
C Numerical constant kg/ (m3.s)
c1, c2, c3 dimensionless coefficient (Eq. 3-37)
CFD Computational fluid dynamics
COP Coefficient of performance
Cp Specific heat capacity (J/kg∙K)
CSTB Scientific and technical center for building research
d optical thickness
D(T) Numerical Gaussian function, Eq.2-28
DOM Discrete Ordinate Method
EC Energy cost ($)
ei Experimental value
EN European norm
ESC Energy savings cost ($)
fl Liquid fraction
Fo Fourier number 𝜶𝒕
𝑯𝟐
G Gravitational acceleration (m/s2)
Gr Grashof number
H Height of enclosure (m)
H Height of the vertical surface (Eq. 3-21) (m)
hin Indoor convective coefficient (W/ m2K)
hout Outdoor convective coefficient (W/ m2K)
HVAC Heating, ventilation and air conditioning
IC Initial cost ($)
k Thermal conductivity (W/m∙K)
L Length of enclosure (m)
LBM Lattice Boltzmann Method
LCC Life cycle cost ($)

12
LH Latent heat of fusion (J/kg)
N Total number of nodes
N Total number of nodes in each layer (chapter 2)
N Lifetime (chapter 4) (years)
N-S Navier Stokes equations
NuH Nusselt number function of H, Table 2-1
NuL Nusselt number function of L, Table 2-1
Nuz Nusselt number function of z, Table 2-5
Nx Nodes number in horizontal direction
Ny Nodes number in vertical direction
OP Overhang projection (m)
P Pressure (Pa)
PCM Phase change materials
PERSEE center for processes, renewable energies and energy
systems
PP Payback period (years)
Pr Prandtl number
PRMSE Percentage root mean square error
PWF Present worth factor
q Numerical constant (chapter 2)
Qsol Total incident solar radiation (W/m2)
Qsol-ref Reflected solar radiation (W/m2)
Qsol-total Total incident solar radiation (W/m2)
Qsol-trans Transmitted solar radiation (W/m2)
R Thermal resistance (m2K/W)
r Discount rate
R2 R-squared
RaH Rayleigh number function of H, Eq.2-15
RaL Rayleigh number function of L, Table 2-1
Raz Rayleigh number function of z, Eq.2-17
RIM Radiosity irradiosity method

13
RMSE Root mean square error
RTE Radiative transfer equation
s Position of the melting front, Eq.2-14 (m)
S Physical thickness, Eq.2-33 (m)
si Simulated value
Ste Stefan number
STIME Simulation time
t Time (s)
T Temperature (K)
T0 Initial temperature (K)
Tair Outdoor air temperature (⁰C)
Tc Cold temperature (K)
Th Hot temperature (K)
TIM Transparent insulation material
Tm Melting temperature (K), (⁰C)
u Velocity vector (m/s)
v Wind velocity (m/s)
x,y Coordinates (m)
z Height of convective zone (m)
Greek letters
∅LW,in Radiative heat exchange with the indoor environment (W/m2)
∅LW,out Radiative heat exchange with the outdoor environment (W/m2)
∅𝑐𝑜𝑛𝑑 Conductive heat flux (W/m2)
∅𝑠𝑜𝑙 Radiative source term (W/m2)
µ Dynamic viscosity (Pa.s)
α Thermal diffusivity (Table 3-1) (m2/s)
α Solar absorptivity coefficient
αPCM Solar absorption coefficient, Eq.2-34
β Thermal expansion coefficient (1/K)
δ Average position of melting front in
Table 2-2

14
δ Overall fractional change in transmittance, Eq.2-30
Δt Time increment (s)
ΔT Temperature difference between walls Th- Tc (K)
ε Surface emissivity
η Adjustment constant of order 1 (chapter 2)
η Kinematic viscosity (m2/s)
η Boiler efficiency (%)
θ Dimensionless time
ρ Solar reflectivity coefficient
ρ Density (Table 3-1) (kg/m3)
ρ Solar reflectivity coefficient
σ Extinction coefficient (m-1)
τ Solar transmissivity coefficient
τPCM Solar transmittance coefficient, Eq.2-32
Subscripts and superscripts
0 Previous time step
av Average
c Cooling
conv Conventional
e Electricity
enh Enhanced
enh,p Enhanced at node p
h Heating
in Indoor
l Liquid
ng Natural gas
Pc Phase change
s Solid
sol Solar
surf Surface

15
W, E, P, S, N West, east, center, south and north node
w, e, s, n West, east, south and north interface

16

17
Contents
Résumé .............................................................................................................................................................. 5
Abstract ............................................................................................................................................................ 7
Acknowledgment ............................................................................................................................................... 9
Nomenclature .................................................................................................................................................. 11
Greek letters..................................................................................................................................................... 13
Subscripts and superscripts .............................................................................................................................. 14
List of Figures.................................................................................................................................................. 21
List of Tables ................................................................................................................................................... 25
General Introduction ........................................................................................................................................ 29
Introduction Générale ..................................................................................................................................... 35
References ................................................................................................................................................... 40
Chapter 1. State of the art and thesis problematic ..................................................................................... 45
Résumé du chapitre en français : ................................................................................................................ 45
1. Introduction ......................................................................................................................................... 48
2. Heat transfer mechanisms during the phase change ............................................................................ 50
2.1. Conduction and convection heat transfer .................................................................................... 50
2.2. Stefan problem and Neuman problem ......................................................................................... 52
3. Melting with natural convection .......................................................................................................... 54
3.1. Physical phenomenon .................................................................................................................. 54
3.2. Mathematical solutions ................................................................................................................ 55
3.3. Literature review on melting with natural convection in enclosures ........................................... 59
4. Literature review of phase change with radiation ................................................................................ 62
5. Trombe wall with integrated PCM ...................................................................................................... 67
Transparent insulation ............................................................................................................................ 68
6. INERTRANS wall ............................................................................................................................... 70
6.1. System description ....................................................................................................................... 70
6.2. Physical phenomena .................................................................................................................... 71
6.3. Previous works related to the INERTRANS project ................................................................... 72
7. Discussion: Main limitations and thesis problematic and objectives .................................................. 78
Chapter 2. Melting of a Phase Change Material in Presence of Natural Convection and Radiation: A
Simplified Model ............................................................................................................................................. 89
Résumé du chapitre en français : ................................................................................................................ 89
Abstract ....................................................................................................................................................... 91
18
1. Introduction ......................................................................................................................................... 92
2. Numerical methodology ...................................................................................................................... 94
3. Melting with natural convection .......................................................................................................... 96
3.1. Simplified model .............................................................................................................................. 96
3.2. CFD model ....................................................................................................................................... 99
3.3. Test case of melting with natural convection ................................................................................. 101
3.4. Comparison between simplified model and CFD model simulations ............................................ 102
3.5. Validation of the simplified model for convection during melting ................................................ 103
4. Shortwave radiation through PCM .................................................................................................... 107
5. Application to the melting of fatty acid with natural convection and radiation ................................ 108
6. Conclusion ......................................................................................................................................... 111
References ................................................................................................................................................. 113
Complementary sections to chapter 2 ............................................................................................................ 117
A) Nusselt number correlation ............................................................................................................ 117
B) General concept of scaling theory proposed by Bejan .................................................................. 118
C) Enthalpy method for phase change problem in details .................................................................. 121
D) CFD model numerical and experimental validation ...................................................................... 125
E) Thermal expansion ......................................................................................................................... 127
Chapter 3. Thermal Behavior of a Translucent Superinsulated Latent Heat Energy Storage Wall in
Summertime ............................................................................................................................................... 131
Résumé du chapitre en français................................................................................................................. 131
Abstract ..................................................................................................................................................... 133
1. Introduction ....................................................................................................................................... 134
2. System description ............................................................................................................................. 137
3. Experimental data .............................................................................................................................. 139
4. Numerical model ............................................................................................................................... 143
4.1. Shortwave radiation ........................................................................................................................ 145
4.2. Longwave radiation exchange ........................................................................................................ 147
4.3. Convective heat exchange .............................................................................................................. 148
4.4. Governing equations and boundary conditions .............................................................................. 148
4.5. Heat balance on a surface in contact with the external environment .............................................. 149
4.6. Heat balance on a surface in contact with the internal environment .............................................. 150
5. MATLAB-TRNSYS link .................................................................................................................. 151
6. Model validation ................................................................................................................................ 152
7. Proposed solutions for the PCM cycling and the overheating ........................................................... 155

19
7.1. Shading devices .............................................................................................................................. 156
7.2. Prisma solar glass ........................................................................................................................... 159
7.3. Natural night ventilation ................................................................................................................. 160
7.4. PCM RT28HC ................................................................................................................................ 162
8. Thermal comfort evaluation .............................................................................................................. 163
9. Application of the TIM-PCM wall under different climate conditions ............................................. 166
10. Conclusion ..................................................................................................................................... 168
References ................................................................................................................................................. 169
Complementary sections to chapter 3 ............................................................................................................ 173
A) Graphs for model validation in winter season ............................................................................... 173
B) Wind velocity and outdoor relative humidity in winter and summer seasons ............................... 176
Chapter 4. Energy Performance and Economic Analysis of a TIM-PCM wall Under Different Climates ...
............................................................................................................................................... 181
Résumé du chapitre en français................................................................................................................. 181
Abstract ..................................................................................................................................................... 183
1. Introduction ....................................................................................................................................... 184
2. Methodology ...................................................................................................................................... 187
2.1. Description of simulated building ............................................................................................. 187
2.2. Investigated climates ................................................................................................................. 191
2.3. Numerical model ....................................................................................................................... 192
3. Energy Performance Analysis ........................................................................................................... 196
4. Economic Analysis ............................................................................................................................ 205
5. Conclusion ......................................................................................................................................... 212
References ................................................................................................................................................. 213
Complementary sections to chapter 4 ............................................................................................................ 217
A) Transient liquid fraction in each climate ....................................................................................... 217
B) Note ............................................................................................................................................... 221
General Conclusion ....................................................................................................................................... 225
1. Overview of the achievements .......................................................................................................... 225
2. Limitations and perspectives ............................................................................................................. 227
Conclusion Générale ..................................................................................................................................... 229
1. Aperçu des réalisations ..................................................................................................................... 229
2. Limitations et perspectives ................................................................................................................ 232
Annex A: Phase Change Materials (PCM) for Cooling Applications in Buildings: A Review .................... 235
Abstract: .................................................................................................................................................... 235

20
1. Introduction ....................................................................................................................................... 237
2. Phase change materials (PCM) .......................................................................................................... 239
2.1. General ........................................................................................................................................... 239
2.2. PCM classification .......................................................................................................................... 240
3. PCM for cooling applications ............................................................................................................ 242
3.1. Free cooling .................................................................................................................................... 244
3.2. Solar cooling systems with PCM .................................................................................................... 252
3.3. PCM-air conditioning systems ....................................................................................................... 255
3.4. Evaporative and radiative cooling systems..................................................................................... 258
3.5. PCM in building envelope .............................................................................................................. 260
4. Discussion .......................................................................................................................................... 282
4.1. Factors affecting PCM selection ..................................................................................................... 283
4.2. Climatic conditions ......................................................................................................................... 284
4.3. Melting temperature of PCM .......................................................................................................... 286
4.4. Location of application: Effect of PCM surface area and thickness ............................................... 289
4.5. HVAC controls ............................................................................................................................... 290
5. Conclusion ......................................................................................................................................... 291
6. Résumé en français ............................................................................................................................ 293
References ................................................................................................................................................. 295
Annex B: Graphical user interface GUI ........................................................................................................ 303
Annex C: List of Publications ....................................................................................................................... 305

21
List of Figures
Figure 1-1: Influence of natural convection on the temperature function of PCM thickness [33] .................. 51
Figure 1-2 : Schematic illustration of the two-phase Stefan problem ............................................................. 53
Figure 1-3: Regimes for melting in the presence of significant natural convection when the phase-change
material is being heated from the side [40] ..................................................................................................... 55
Figure 1-4: layout of double glazed roof filled with PCM .............................................................................. 65
Figure 1-5: Heat transfer process of the PCM-filled glass window (PCMW) ................................................. 66
Figure 1-6: schematic of TROMBE wall [115] ............................................................................................... 68
Figure 1-7: Classification of transparent insulation materials [118] ............................................................... 69
Figure 1-8: Schematic of the TIM-PCM wall ................................................................................................. 70
Figure 1-9: (a) TIM-PCM wall from the outside, (b) PCM in solid phase (left) and liquid phase (right), from
the inside (PERSEE center in Sophia Antipolis) ............................................................................................. 71
Figure 1-10: Interior and exterior photo of the TIM-PCM wall of CETHIL .................................................. 71
Figure 1-11: Schematic presentation of the full-scale test cell ........................................................................ 72
Figure 1-12: Solar radiation and air temperatures for three days in December2009 and August 2011........... 73
Figure 1-13: Comparison simulation / experimentation of the internal surface temperature of the wall for the
model with and without natural convection .................................................................................................... 74
Figure 1-14: Thermal boundary conditions on the cavity for each case [63] .................................................. 76
Figure 1-15: Melted fraction of the case of melting with convection and (a) long wave radiation, and (b)
shortwave radiation ......................................................................................................................................... 76
Figure 1-16: (a) Transparent brick filled with PCM, (b) experimental enclosure [122] ................................. 77
Figure 1-17: Comparison of Nusselt number of the 2D developed numerical model with the experimental
results and Benchmark solution (Jany and Bejan) ........................................................................................... 77
Figure 2-1: strategy retained to enhance the liquid thermal conductivity in the enclosure ............................. 99
Figure 2-2: Schematic of the test case cavity filled with PCM. .................................................................... 101
Figure 2-3: The average liquid fraction in function of dimensionless time from the model and the numerical
benchmark [74] .............................................................................................................................................. 104
Figure 2-4: Comparison of melting front positions from the model and the numerical benchmark [74] at a)
SteFo = 0.0005. b) SteFo = 0.002. c) SteFo = 0.006. d) SteFo = 0.01 .......................................................... 105
Figure 2-5: Comparison of the average position of the melting front ........................................................... 107
Figure 2-6: (a) Layout of the INERTRANS wall, (b) PCM filled in glass bricks [1] ..................................... 109
Figure 2-7: Schematic of fatty acid filled in glass bricks. ............................................................................. 110
Figure 2-8: Comparison of the average liquid fraction ................................................................................. 111
Figure 3-1: Schematic of the TIM–PCM wall. .............................................................................................. 137
Figure 3-2: (a) TIM-PCM wall from the outside, (b) PCM in solid phase (left) and liquid phase (right), from
the inside ........................................................................................................................................................ 138
Figure 3-3 : Schematic presentation of the full-scale test cell. ...................................................................... 140
Figure 3-4: Temperatures and solar radiation for seven consecutive days in summer (30 July-5 August 2017)
....................................................................................................................................................................... 142
Figure 3-5: Measured PCM temperatures for seven consecutive days in summer (30 July-5 August 2017) and
winter (27 January-2 February 2017). ........................................................................................................... 143
Figure 3-6: Integration mechanism of the TIM-PCM wall in TRNSYS and different heat transfer phenomena
through the TIM-PCM wall and the computational grid ............................................................................... 152
Figure 3-7: Simulated and measured a) internal surface temperature of the TIM-PCM wall and b) indoor test
room air temperature for seven consecutive days in summer (30 July - 5 August 2017).............................. 154
Figure 3-8: Simulated and measured PCM temperature for seven consecutive days in summer (30 July-5
August 2017). ................................................................................................................................................ 155

22
Figure 3-9: transmitted solar radiation through the TIM-PCM wall for the different cases in summer season
(3, 4, 5 August) .............................................................................................................................................. 157
Figure 3-10: a) Indoor test room air temperature and b) PCM temperature for the different cases in summer
season (3, 4, 5 August) .................................................................................................................................. 158
Figure 3-11: a) Indoor test room air temperature, and b) PCM temperature for both glazing type in summer
season (3, 4, 5 August) .................................................................................................................................. 160
Figure 3-12: Indoor air temperature for different cases after applying natural night ventilation in summer
season (3, 4, 5 August) .................................................................................................................................. 161
Figure 3-13: Average fraction of liquid and temperature in the PCM layer for both PCM in summer season
(3, 4, 5 August) .............................................................................................................................................. 162
Figure 3-14: Indoor operative temperature in summer season for different cases ........................................ 165
Figure 3-15: The percentage of occupied time where overheating occurs according to ASHRAE 55 adaptive
comfort model for different levels of satisfaction ......................................................................................... 166
Figure 3-16: Percentage of occupied time where overheating occurs according to ASHRAE 55 adaptive
comfort model for different levels of satisfaction for different climate conditions in summer season ......... 167
Figure 4-1: Typical plan of a simple office room. ......................................................................................... 188
Figure 4-2: TIM-PCM wall from the outside and Schematic of the TIM–PCM wall composition .............. 188
Figure 4-3: Annual heating load for (a) Dsb, Dfc, ET climates and (b) Csa, Cfb, Dfa climates function of the
TIM-PCM wall or the double glazing (U value=0.86 W/ m2K) area. ........................................................... 198
Figure 4-4: Percentage of annual heating savings with respect to conventional office with insulated double-
glazed window (U value=0.86 W/ m2K) at south orientation........................................................................ 200
Figure 4-5: Annual cooling load for each city (climate) function of the TIM-PCM wall or the conventional
glazing (U value=0.86 W/ m2K) surface ....................................................................................................... 201
Figure 4-6: Annual total load for three different climates function of the TIM-PCM wall or the conventional
glazing (U value=0.86 W/ m2K) surface ....................................................................................................... 203
Figure 4-7: Annual total savings for each city (climate) as function of TIM-PCM wall surface with respect to
a) conventional office with insulated double-glazed window and b) office with opaque wall at the south
orientation ...................................................................................................................................................... 204
Figure 4-8: a) Life cycle cost and b) payback period for both cases for Barentsburg (ET) .......................... 209
Figure 4-9: a) Life cycle cost and b) payback period for both cases for Kiruna (Dfc) .................................. 209
Figure 4-10: a) Life cycle cost and b) payback period for both cases for Dras (Dsb) ................................... 210
Figure 4-11: a) Life cycle cost and b) payback period for both cases for Paris (Cfb) ................................... 210
Figure 4-12: Life cycle cost for a) Toronto (Dfa) and b) Sacramento (Csa) ................................................. 211
Figure 0-1: Predicted evolution of cooling demand in EU for residential and service sectors [6] ................ 237
Figure 0-2: Predicted evolution of cooling demand (Exa-joule "EJ") in four different regions [10] ............ 238
Figure 0-3: Relationship between PCM melting enthalpy and temperature for the different groups of PCM
[15] ................................................................................................................................................................ 240
Figure 0-4: PCM classification [19] .............................................................................................................. 241
Figure 0-5: Principal function of PCM ‘‘free cooling system’’[25] .............................................................. 244
Figure 0-6: Schematic diagram of the TES unit [37] .................................................................................... 245
Figure 0-7: Installation of thermal storage for free cooling [38] ................................................................... 246
Figure 0-8:Schematic diagram of LHS System for air cooling through cylindrical tube [39] ...................... 246
Figure 0-9: An energy storage unit and its airline connection [40] ............................................................... 247
Figure 0-10: Schematic diagram of heat exchanger with plate-type PCM [42] ............................................ 247
Figure 0-11: Conceptual design of a storage unit [41] .................................................................................. 247
Figure 0-12: Schematic diagram and cross-section of the PCM heat storage unit [44] ................................ 248
Figure 0-13: The experimental PCM storage unit [47] ................................................................................. 248
Figure 0-14: cylindrical LHES filled with PCM spheres [48] ....................................................................... 248
Figure 0-15: Concept of the PCM system packed bed storage integrated under the floor [51] .................... 249
Figure 0-16: Heat exchanger considered in TRNSYS [52] ........................................................................... 249

23
Figure 0-17: solar heating and cooling system with absorption chiller and latent heat storage in cooling mode
[54] ................................................................................................................................................................ 253
Figure 0-18: Location of PCM storage tank in the solar cooling application [58] ........................................ 253
Figure 0-19: Storage tank implemented in a real solar cooling installation at the University of Sevilla (Spain)
[58] ................................................................................................................................................................ 253
Figure 0-20: solar cooling system with dry coolers and a TES PCM [59] .................................................... 254
Figure 0-21: Schematic diagram of the AC experimental system with PCM [61] ........................................ 255
Figure 0-22: prototype of the air-conditioner integrated with the PCM bed [62] ......................................... 256
Figure 0-23: schematic diagram of domestic cooling system with PCM storage unit [63] ........................... 256
Figure 0-24: (a) Schematic diagram of AC integrated with PCM thermal storage, (b) cross-section of the
PCM thermal storage unit, (c) photo of PCM thermal storage unit during heat charging process [64] ........ 256
Figure 0-25: (a) Construction of the nocturnal sky radiator, (b) Schematic diagram of the hybrid system [68]
....................................................................................................................................................................... 258
Figure 0-26: (a) metal container with pipes and supporting metal net, (b) specimen filled with the granular
PCM (c) optimized specimen with the steel matrix [69] ............................................................................... 259
Figure 0-27: Schematic diagram of the hybrid system [70] .......................................................................... 260
Figure 0-28: Internal blinds with integrated PCM [7] ................................................................................... 261
Figure 0-29: Internal blinds absorb solar radiation in order to cool the space by reducing the solar heat input
[7] .................................................................................................................................................................. 262
Figure 0-30: Delta Cool 24, upper face of PCM panel [7] ............................................................................ 263
Figure 0-31: PCM enhanced gypsum board [12] .......................................................................................... 264
Figure 0-32:Illustration of a PCM filled window [71] .................................................................................. 265
Figure 0-33: concrete cubicles with awnings (outer view and top view) [87] .............................................. 271
Figure 0-34: schematic of building envelope for PCM-OW(left) and PCM-IW (right) [89] ........................ 271
Figure 0-35: Schematic of the roof with holes filled with PCM [90] ............................................................ 271
Figure 0-36: PCM installation in the wall with ventilation gap [95] ............................................................. 272
Figure 0-37: sheet of PCM thermal shield PCMTS (left) and wall section showing the PCMTS location
(right) [96] ..................................................................................................................................................... 272
Figure 0-38: PCM layer: (a) Externally bond with concrete wall, (b) Laminated within concrete wall and (c)
Internally bonded with concrete wall [100] ................................................................................................... 272
Figure 0-39: CSM panel containing PCM [102] ........................................................................................... 273
Figure 0-40: schematic of the floor with PCM integrated in tiles [103]........................................................ 273
Figure 0-41: The general concept for cooling with PCM integrated into the ceiling [108] .......................... 274
Figure 0-42: Cool Deck C24 developed by "Climator" [7] ........................................................................... 274
Figure 0-43: General concept for cooling with PCM integrated into the floor [7] ........................................ 275
Figure 0-44: Installation of ILKATHERM PCM board [108] ...................................................................... 276
Figure 0-45: PCM board from ILKATHERM; 1) sheet metal coating, 2) PU rigid foam, 3) capillary tube
mats, 4) Micronal PCM smartboard gypsum construction panel [108] ......................................................... 276
Figure 0-46: modes of operation of VF. (a) solidification process, (b) melting process, (c) overheating
prevention, and (d) free cooling [116] ........................................................................................................... 277
Figure 0-47: ventilated façade with the distribution of fans and automatized gates [117] ............................ 280
Figure 0-48: location and operation of the ventilated cavity [121] ............................................................... 280
Figure 0-49: (a) Ventilated façade with fins filled with PCM, (b) PCM cylinders in hollow cores, (c) position
of VF and hollow cores [120] ........................................................................................................................ 281
Figure 0-50: ceiling panel made of gypsum-PCM composite [123] ............................................................. 281
Figure 0-51: schematic of PCM heat exchanger placed in an insulated box on the outside wall [125] ........ 281
Figure 0-52: A synthetic diagram of PCM cooling applications ................................................................... 283
Figure 0-53: climate classification according to the Köppen–Geiger [133] .................................................. 284
Figure 0-54: A typology diagram of PCM in building applications .............................................................. 292

24

25
List of Tables
Table 1-1 Common radiation models to solve the radiative heat transfer equation (RTE) ............................. 66
Table 2-1: General Nusselt number correlations for natural convection problem in an enclosure ................. 97
Table 2-2: Nusselt number correlations for different phase change materials with natural convection during
melting process ................................................................................................................................................ 97
Table 2-3: Thermo-physical properties of Octadecane [74] .......................................................................... 102
Table 2-4: Comparison of the computation time between CFD and simplified models for different mesh sizes
....................................................................................................................................................................... 103
Table 2-5: Cases to be conducted in the simplified model ............................................................................ 103
Table 2-6: Thermo-physical properties of the fatty acid eutectic [1] ............................................................ 109
Table 2-7: Optical properties of the fatty acid eutectic [1] ............................................................................ 109
Table 3-1 Thermo-physical properties of the fatty acid eutectic [34] ........................................................... 138
Table 3-2: Optical properties of the fatty acid eutectic CSTB [34] ............................................................... 138
Table 3-3: Thermo-physical and optical properties of glass and Silica aerogel ............................................ 139
Table 3-4: Physical properties of the transparent insulation material silica aerogel (manufacturer’ data) ... 139
Table 3-5: Test cell walls construction .......................................................................................................... 140
Table 3-6: Thermo-physical properties of the test room materials ................................................................ 141
Table 3-7: Summary of some experimental data measured for seven consecutive days in summer and winter
season ............................................................................................................................................................ 142
Table 3-8: RMSE and PRMSE for the hourly profile of the surface and indoor temperature in summer and
winter season ................................................................................................................................................. 155
Table 3-9: Values of maximum, minimum and average indoor test room air temperature for different
overhang projections ..................................................................................................................................... 156
Table 3-10: Different cases to be tested to choose the best solution ............................................................. 157
Table 3-11: Values of minimum and maximum indoor test room air temperature for the different cases.... 158
Table 3-12: Values of maximum and minimum PCM temperature for the different cases ........................... 158
Table 4-1: office room walls construction ..................................................................................................... 189
Table 4-2: Thermo-physical properties of the test room materials ................................................................ 189
Table 4-3: Thermo-physical properties of the fatty acids eutectic [32] ......................................................... 189
Table 4-4: Optical properties of the fatty acids eutectic [32] ........................................................................ 190
Table 4-5: Thermo-physical and optical properties of glass and Silica aerogel ............................................ 190
Table 4-6: Different dimensions of the TIM-PCM wall to be studied .......................................................... 190
Table 4-7: Internal heat gains in the office room (ASHRAE Fundamentals Handbook (SI) [35]) ............... 191
Table 4-8: Selected locations and climate characteristics according to Köppen-Geiger classification [37] . 191
Table 4-9: Some main weather characteristics for each climate ................................................................... 191
Table 4-10: RMSE and PRMSE for the hourly profile of the surface and indoor temperature in summer and
winter season ................................................................................................................................................. 196
Table 4-11: Annual heating loads (kWh/m2/year) for each city (climate) for an office equipped with double
glazing and PCM enhanced office for different double glazing or TIM-PCM wall surfaces ........................ 197
Table 4-12: Annual heating savings in (kWh/m2/year) by using TIM-PCM wall instead of double-glazed
window (U value=0.86 W/ m2K) at south orientation ................................................................................... 200
Table 4-13: Annual cooling loads (kWh/m2/year) for each city (climate) for conventional office and PCM
enhanced office for different surfaces ........................................................................................................... 201
Table 4-14: Annual cooling savings in (KWh/m2/year) by using TIM-PCM wall instead of double-glazed
window (U value=0.86 W/ m2K) at south orientation .................................................................................. 202
Table 4-15: Cost of electricity, natural gas price and discount rate for each country ................................... 206
Table 4-16: Prices of materials ...................................................................................................................... 206
Table 4-17: Cost of some phase change materials (data source [25], [26], [68] ) ......................................... 207

26
Table 4-18: Minimum life cycle cost and optimum area of the TIM-PCM wall and the double-glazed window
in each climate ............................................................................................................................................... 211
Table 4-19: Minimum payback period and optimum area of the TIM-PCM wall and the double-glazed
window in each climate ................................................................................................................................. 211
Table 0-1 thermo-physical, kinetic, chemical, economic and environmental requirements of PCM [7] ...... 239
Table 0-2: PCM used for cooling applications .............................................................................................. 243
Table 0-3: PCM in active free cooling system applications .......................................................................... 249
Table 0-4: PCM combined with Solar cooling system applications .............................................................. 254
Table 0-5: PCM-air conditioning system applications .................................................................................. 257
Table 0-6: PCM Passive system applications in the building envelope for cooling purposes ...................... 266
Table 0-7: PCM active system applications in building envelope including active VF ................................ 278
Table 0-8: Usual cooling & heating strategies as a function of the climate conditions [134] ....................... 285

GENERAL INTRODUCTION


General Introduction
29
General Introduction
There is global concern related to energy consumption in the built environment as one of the major
contributors to greenhouse gas emissions responsible for causing climate change and its associated
impacts. A significant proportion of the energy consumption in buildings is used for cooling and
heating application. In Lebanon, as in France, the energy consumption of buildings represents more
than 40% of total final energy and almost 25% of greenhouse gas emissions [1].
An alternative to achieve the goal of reducing energy consumption in the building is to improve the
energy performance of its envelope. This envelope acts as a filter, it reduces heat exchange between
the outside and the indoor environment, and protects the occupants from wind, rain, and other
conditions, contributing to thermal and visual comfort. To achieve these purposes, combining
insulation with latent heat storage materials is shown as an effective way. In addition, an important
part of the building design is to make the best use of external resources and particularly the
exploitation of solar radiation that is considered as an important resource in some areas.
Numerous studies have shown that the integration of phase change materials (PCM) in the building
envelope can significantly improve the energy performance of the building and save up to 80% of
heating energy in winter, as the material captures the heat of the sun, melts, then restitutes the heat to
the building by re-solidifying. However, one of the encountered problems is the high risk of summer
overheating when the material can no longer destock the stored heat and remains in its the liquid state.
However, the possibility, feasibility, thermal performance and economic analysis of using PCM call
a series of theoretical and experiential investigations. The experimental approaches offer a better
indication of the actual PCM behavior and performance in comparison to theoretical analysis.
However, the experiments are unachievable in some cases, such as the large scale or unsteady around
environment, are time and cost consuming. In addition, there are still some unavoidable testing errors.
However, the theoretical methods can avoid these weaknesses and predicate the PCM performance
suitably. The major advantage of the theoretical/numerical approaches is that various conditions can
be carried out by changing the variables in a numerical model, the main drawback being the accuracy
of the model used. Therefore, more and more investigators prefer to study the phase change problems
by mathematical solutions and numerical simulations.
Usually, when modeling phase change, numerical studies have some assumptions in their
mathematical modeling [2] e.g. neglecting convective heat transfer within PCM [3] or neglecting
radiative heat transfer [4], whereas the impact of those assumptions on simulation results are poorly
discussed in the literature. However, recent researches have demonstrated that natural convection

General Introduction
30
plays an important role in latent heat thermal energy systems, especially during the melting process
and conduction-only models may incur an unacceptable loss of accuracy.
Basically, the modeling of natural convection in liquid PCM could be classified in two major
categories. The first category includes the simplified methods including the enhanced conductivity
approach using dimensionless numbers. These approaches normally oversimplify the process. On the
other hand, detailed computational fluid dynamics (CFD) methods, which require long computational
time, are greatly complicated and complex, and might be limited to the investigated case. In addition,
CFD simulations are rarely appropriate for the initial design stages especially for long period thermal
assessment. However, between these two extremes, a model offering a good compromise between
simplicity and accuracy is needed, which will be the first purpose of the current thesis.
On the other hand, most studies on translucent facades with integrated PCM have assumed one-
dimensional transfers by conduction and radiation neglecting convection [5]–[7] and numerical
models were specifically developed to take the interaction of PCM with solar radiation into account
[8]–[11]. However, very few studies were found in the literature for the melting of PCM in presence
of both natural convection and radiation. This will be our second research question.
The ANR INERTRANS project [12] proposed the development of an innovative wall that addresses
the issue of energy efficiency and optimal use of environmental resources. This wall provides,
concurrently, storage and restitution of heat, super thermal-acoustic insulation and daylighting to the
interior environment. It allows exploiting the solar radiation during cold periods to heat the interior
of the building. To do this, it combines new generation materials, such as silica aerogel for thermal
insulation and phase change materials (PCM) for absorption and storage of heat. The quasi-constant
restitution of the heat by convection and long wave radiation contributes to the increase of the
sensation of thermal comfort of the inhabitant. An acronym for this wall is proposed: TIM-PCM wall
which stands for “Translucent Insulating Material – Phase Change Material wall”.
The establishment of such facade in the building is conditioned by the knowledge of its behavior, its
performance and its energy impact. However, this knowledge on many case studies is accessible only
through numerical modeling. It is, therefore, necessary to ensure the availability and reliability of a
numerical model representing the physics of such wall. Particularly, during the melting and
solidification of the PCM, the latter can be subjected to different modes of heat transfer depending
on the presence or not of sunshine and thus significantly change the kinetics of the phase change. The
development of this numerical model will be our third aim.
The wall has been characterized experimentally in a full-scale test cell located in Sophia Antipolis,
Southern France, within the center for Processes, Renewable Energies and Energy Systems
(PERSEE) of Mines ParisTech graduate school [13]. In their experimental study, Berthou et al [13]

General Introduction
31
found that, in the winter season, particularly in sunny cold days, the thermal performance of the wall
is very effective. While during the summer, an overheating problem is encountered mainly due to
solar gains, the PCM remains in its liquid state and it is unable to release the stored heat at night.
Thus, the optimization of the wall thermal performance in summer is needed and solutions for
overheating and PCM cycling must be proposed.
Consequently, two research issues were identified in this thesis. The first one is scientific: simplified
models using a modified heat diffusion equation to consider energy storage (enthalpy method [14],
[15], equivalent heat capacity method [16] , [17], source term method [18]) do not consider the natural
convection during the melting which can nevertheless become predominant when the PCM container
is of sufficiently large dimensions. On the other hand, sophisticated models using numerical solution
of Navier-Stokes equations (enthalpy-porosity method [19]–[26], temperature transformation model
[27]–[30], modified heat capacity method [31], lattice Boltzmann method (LBM) [32]–[35]are
computationally time-consuming and are not at all adapted to perform yearly energy performance
evaluation of the building. The second one is technological: in the summer season, the PCM
integrated in the TIM-PCM wall can no longer solidify at night and remains in its liquid state, causing
summer overheating.
Broadly speaking, the present thesis proposes at first to perform the modeling of the phenomena
involved in the translucent TIM-PCM wall to understand the influence and the interaction of the
different modes of heat transfer. This includes the development of a simplified model for phase
change, in presence of both natural convection and radiation, that offers a good compromise between
simplicity and accuracy. And then to develop a mathematical model representing the physics of the
wall to be coupled with energy simulation tool for yearly performance evaluation. The aim is to
produce an easy and simplified calculation tool that may help in bridging the gap between the research
products and concepts (as the TIM-PCM wall) and their development and implementation into the
built environment.
The manuscript is composed of four chapters:
- The first chapter presents a state of the art of the heat transfer mechanisms that occurs during the
phase change process, and the different numerical models of phase change considering natural
convection in liquid PCM. In addition, a literature review of PCM applications within translucent
facades and Trombe walls is presented. The TIM-PCM wall system is described and a history related
to studies conducted in the framework of the INERTRANS project is presented. Based on the
limitations of the previous works, the problematic and the objectives of the present thesis are
determined.

General Introduction
32
- The second chapter presents the development of a simplified numerical model for melting of PCM
in presence of natural convection and radiation. The mathematical model is coded on MATLAB using
two-dimensional implicit finite volume method. The results are then validated using a complete CFD
model created on COMSOL Multiphysics, as well as experimental and numerical benchmark
solutions for a test case found in the literature.
- In the third chapter, a numerical model describing the heat transfer mechanisms through the wall is
developed on MATLAB and then coupled with TRNSYS to evaluate the thermal performance of the
whole building. The numerical model is experimentally validated in summer and winter seasons using
the experimental cell located in the PERSEE center. The developed numerical model aims to provide
an easy tool to use and fast enough to be adopted as a design tool, to investigate the potentials and
disadvantages of the novel TIM-PCM wall under different operative conditions and different climates
and to propose solutions to optimize its performance in summer, without the need of performing
extensive and expensive experimental analysis.
- The fourth chapter presents an annual assessment of the energy performance of the solar wall
integrated into a typical office building envelope under different climatic conditions. The optimal
surface of the TIM-PCM wall is economically evaluated for each climate through a life-cycle cost
analysis (LCC) as well as the evaluation of the payback period (PP).
- Finally, since the cooling demand is significantly increasing worldwide, we have extended our
bibliographical study to PCM applications for cooling purposes, as detailed in Annex A. This aims
to get a comprehensive vision of PCM applications for cooling in buildings and problems encountered
in these applications. Difficulties in selecting these materials and the factors affecting the success and
the effective use of the PCM are also discussed.
Noting that this thesis is presented as a series of journal papers. Consequently, chapters 2,3, 4 and
Annex A can be read independently; and some overlap may be found between We have the copyright
permission from the editor to reproduce the published articles.
The articles are first-authored by the PhD candidate and co-authored by the thesis supervisors Pascal
henry Biwole and Farouk Fardoun, and are published or submitted as separate articles in international
peer-reviewed scientific journals as:
- Chapter 2: Farah Souayfane, Pascal Henry Biwole, Farouk Fardoun. “Melting of a phase change
material in presence of natural convection and radiation: A simplified model”. Published in Applied
Thermal Engineering, Elsevier, 2018, 130, pp.660 – 671.
- Chapter 3: Farah Souayfane, Pascal Henry Biwole, Farouk Fardoun. “Thermal behavior of a
translucent superinsulated latent heat energy storage wall in summertime”. Published in Applied
Energy, 2018, 217, pp. 390-408.

General Introduction
33
- Chapter 4: Farah Souayfane, Farouk Fardoun, Pascal Henry Biwole. “Energy Performance and
Economic Analysis of a TIM-PCM Wall Under Different Climates”. Submitted to Energy, revision
requested, 2018.
- Annex A: Farah Souayfane, Farouk Fardoun, Pascal Henry Biwole. “Phase Change Materials
(PCM) for cooling applications in buildings: A review”. Published in Energy and Buildings, Elsevier,
2016, 129, pp.396-431.
These articles comprise my own original work except where otherwise stated and all the work is done
by the PhD candidate under the supervision of thesis directors.
All published journal papers and international conference papers during this thesis are listed in Annex
C.


General Introduction
35
Introduction Générale
Il y a une préoccupation mondiale relative à la consommation d'énergie dans l'environnement bâti.
Celui-ci est en effet l'un des principaux contributeurs aux émissions de gaz à effet de serre
responsables du changement climatique et de ses impacts associés. Une proportion significative de la
consommation d'énergie dans les bâtiments est utilisée pour le refroidissement et le chauffage. Au
Liban comme en France, la consommation énergétique des bâtiments représente plus de 40% de
l’énergie finale totale et près de 25% des émissions de gaz à effet de serre [1].
Une alternative pour atteindre l'objectif de réduction de la consommation d'énergie dans le bâtiment
est d'améliorer la performance énergétique de son enveloppe. Cette enveloppe agit comme un filtre
qui réduit les échanges thermiques entre l'extérieur et l'intérieur et protège les occupants contre le
vent, la pluie et d'autres conditions, contribuant ainsi au confort thermique, acoustique et visuel. Pour
mieux satisfaire ces fonctions, la combinaison de l'isolation avec des matériaux de stockage de chaleur
latente est montrée comme un moyen efficace. En outre, une partie importante de la conception du
bâtiment consiste à utiliser au mieux les ressources externes et en particulier l'exploitation du
rayonnement solaire.
De nombreuses études ont montré que l’utilisation des matériaux à changement de phase (MCP) en
paroi de bâtiment permet d’améliorer remarquablement la performance énergétique du bâtiment et
d’économiser jusqu’à 80% d’énergie de chauffage l’hiver, dans la mesure où le matériau capte la
chaleur du soleil, fond, puis redonne cette chaleur au bâtiment en se re-solidifiant. Mais l’un des
problèmes rencontrés lors de l’utilisation de MCP dans les parois de bâtiment est le fort risque de la
surchauffe estival lorsque le matériau n’arrive plus à déstocker la chaleur emmagasinée et reste à
l’état liquide. Un cyclage du matériau y compris l’été lui permettrait de jouer pleinement son rôle de
barrière thermique ou de puits de chaleur en diminuant le besoin de froid.
Cependant, la possibilité, la faisabilité, la performance thermique et l’analyse économique de
l’utilisation des MCP appellent une série d’études théoriques et expérimentales. Les approches
expérimentales offrent une meilleure indication du comportement et de la performance réels des MCP
par rapport à l'analyse théorique. Cependant, les expériences sont irréalisables dans certains cas, tels
que la grande échelle ou l'instabilité autour de l'environnement, sont coûteuses en temps et en argent,
en plus, il existe des erreurs de test inévitables. Cependant, les méthodes théoriques peuvent éviter
ces faiblesses et prédire d’une manière appropriée la performance des MCP.
Le principal avantage des approches théoriques / numériques est que différentes conditions peuvent
être réalisées en modifiant les variables dans le modèle numérique. Par conséquent, de plus en plus

General Introduction
36
de chercheurs préfèrent étudier les problèmes de changement de phase par des solutions
mathématiques et des simulations numériques.
Habituellement, lors de la modélisation du changement de phase, les études numériques ont des
hypothèses dans leur modélisation mathématique [2]. Par exemple, en négligeant le transfert de
chaleur par convection dans le MCP liquide [3] ou en négligeant le transfert de chaleur radiatif [4],
alors que l'impact de ces hypothèses sur les résultats de la simulation est peu discuté dans la littérature.
Cependant, des recherches récentes ont démontré que la convection naturelle joue un rôle important
pendant le processus de fusion et que les modèles à conduction seule peuvent entraîner une perte de
précision inacceptable.
Fondamentalement, la modélisation de la convection naturelle dans les MCP liquides peuvent être
classée en deux grandes catégories. La première catégorie comprend les méthodes simplifiées, y
compris l'approche de conductivité thermique efficace utilisant les nombres adimensionnels. Ces
approches normalement simplifier le processus. En revanche, les méthodes détaillées de la dynamique
des fluides (CFD), qui exigent un temps de calcul long, sont grandement compliqué et complexe et
peuvent être limités au cas étudié. En outre, les simulations CFD sont rarement appropriées pour les
étapes de la conception initiale en particulier pour une évaluation thermique longue durée. Toutefois,
entre ces deux extrêmes, un modèle qui offre un bon compromis entre simplicité et précision est
nécessaire, qui sera le premier objectif de la thèse actuelle.
D'autre part, la plupart des études sur les façades translucides intégrant des MCP ont supposé des
transferts unidimensionnels par conduction et par radiation sans convection [5]–[7], et les modèles
numériques ont été spécifiquement développés pour prendre en compte l'interaction des MCP avec le
rayonnement solaire [8]–[11]. Cependant, très peu d'études ont été trouvées dans la littérature sur la
fusion des MCP en présence de la convection naturelle et de rayonnement. Ce sera notre deuxième
question de recherche.
Le projet INTERTRANS [12] a proposé le développement d’un mur solaire passif translucide
innovant intégré dans l’enveloppe du bâtiment s’inscrivant directement dans la problématique
d’efficacité énergétique et d’exploitation optimale des ressources environnementale. Ce mur solaire
assure, simultanément, stockage et restitution de la chaleur, super isolation thermo-acoustique et
éclairage naturel contribuant au confort visuel. Il permet d’exploiter le rayonnement solaire lors des
périodes froides pour chauffer l’intérieur du bâtiment. Pour ce faire, le mur associe des matériaux de
nouvelle génération, tel que l’aérogel de silice pour l’isolation thermique et les matériaux à
changement de phase (MCP) pour l’absorption et le stockage de la chaleur issue du rayonnement
solaire. La restitution quasi constante de la chaleur par convection et rayonnement grande longueur
contribue à l’augmentation de la sensation de confort thermique de l’habitant.

General Introduction
37
La mise en place d’une telle façade dans le bâtiment est conditionnée par la connaissance de son
comportement, de sa performance et de son impact énergétique. Or, cette connaissance sur un nombre
important de cas d’études n’est accessible que par la modélisation numérique. Il est donc nécessaire
de s’assurer de la disponibilité et de la fiabilité d’un modèle numérique susceptible de représenter la
physique d’une telle paroi. En particulier lors de la fusion et de la solidification du MCP, ce dernier
peut être soumis à différents modes de transferts de chaleur en fonction de la présence ou non
d’ensoleillement et ainsi modifier considérablement la cinétique du changement d’état. Le
développement de ce modèle numérique sera notre troisième objectif.
Ce mur a été caractérisé expérimentalement en ambiance contrôlée et in situ sur un bâtiment grandeur
nature situé au sein du laboratoire PERSEE de l’Ecole des Mines de Paris à Sophia Antipolis, dans le
sud de la France [13]. Dans leur étude expérimentale, Berthou et al [13] ont constaté que la
performance thermique du mur est très élevée en hiver, tandis qu'en été les gains de chaleur à travers
le mur provoquent un problème de surchauffe et le MCP n’arrive pas à se solidifier. Ainsi,
l'optimisation de la performance thermique de cette paroi en été est nécessaire et des solutions pour
la surchauffe et le cyclage du MCP doivent être proposées.
Deux verrous ont été alors identifiés dans cette étude. Le premier est scientifique : les modèles
simplifiés utilisant une modification de l’équation de diffusion de la chaleur pour tenir compte du
stockage de chaleur (méthode enthalpique [14], [15], méthode de la capacité thermique équivalente
[16] , [17], méthode du terme source [18]) ne prennent pas en compte la convection naturelle lors de
la fusion qui peut pourtant devenir prédominante lorsque le contenant du MCP est de dimensions
suffisamment grandes. D’autre part, les modèles sophistiqués utilisant une résolution numérique des
équations de Navier Stokes (méthode d’enthalpie-porosité [19]–[26], modèle de transformation de la
température [27]–[30], méthode de la capacité calorifique modifiée [31], méthode de Boltzmann sur
réseau (LBM) [32]–[35]) sont eux gourmands en temps de calcul et ne sont pas du tout adaptés aux
échelles de temps et d’espace caractéristiques de la simulation thermique annuelle du bâtiment. Le
deuxième verrou est technologique : en été le MCP n’arrive plus à se resolidifier la nuit, provoquant
ainsi une surchauffe estivale.
En gros, cette thèse propose dans un premier temps de réaliser la modélisation des phénomènes mis
en jeu au sein du mur translucide MCP-aérogels afin de comprendre l'influence et l'interaction des
différents modes de transfert de chaleur. Cela inclut le développement d'un modèle simplifié pour le
changement de phase, en présence de convection naturelle et de rayonnement, qui offre un bon
compromis entre simplicité et précision. Et ensuite, développer un modèle mathématique représentant
la physique du mur afin de le coupler avec un outil de simulation énergétique pour effectuer une
évaluation thermique annuelle. L'objectif est de produire un outil de calcul simple et simplifié pouvant

General Introduction
38
aider à combler le fossé entre les produits et les concepts de recherche (comme le mur MCP-aérogels)
et leur développement et leur mise en œuvre dans l'environnement bâti.
Le présent manuscrit est articulé en quatre chapitres :
-Le premier chapitre présente l’état de l’art des mécanismes de transfert de chaleur qui se produisent
pendant le processus de changement de phase, ainsi que les différents modèles numériques de
changement de phase prenant en compte la convection naturelle dans le MCP liquide. En plus, une
revue sur les applications des façades translucides et du mur Trombe intégrant des matériaux à
changement de phase est présenté. Le système du mur MCP-aérogel est décrit et un historique lié aux
études menées dans le cadre du projet INERTRANS est présenté. Sur la base des limitations des
travaux précédents, la problématique et les objectifs de la présente thèse sont déterminés.
- Le deuxième chapitre présente le développement d’un modèle numérique simplifié pour modéliser
la convection naturelle et le rayonnement courte longueur d’onde pendant le processus de fusion d’un
matériau à changement de phase. Le modèle mathématique est codé sous MATLAB en utilisant la
méthode des volumes finis en deux dimensions. Les résultats sont ensuite comparés à ceux d’un
modèle CFD complet créé dans COMSOL Multiphysics, et aux résultats numériques et
expérimentaux des benchmarks trouvés dans la littérature.
- Dans le troisième chapitre, le modèle numérique décrivant les mécanismes de transfert de chaleur à
travers le mur est développé sur MATLAB et ensuite couplé à TRNSYS pour évaluer la performance
thermique de l'ensemble du bâtiment. Le modèle numérique est validé expérimentalement en été et
en hiver par l’utilisation de la cellule expérimentale présente au sein du laboratoire PERSEE. Ce
modèle validé vise à fournir un outil facile à utiliser et assez rapide pour étudier le potentiel ainsi que
les inconvénients du mur solaire dans différentes conditions opératoires et dans différents climats, et
pour proposer des solutions pour optimiser sa performance en été.
- Le quatrième chapitre, présente une évaluation annuelle de la performance énergétique du mur
solaire intégré dans l’enveloppe d’un immeuble de bureaux typique sous différentes conditions
climatiques. La surface optimale du mur MCP-aérogel est enfin évaluée économiquement pour
chaque climat grâce à une analyse en coût global basé sur le coût durant le cycle de vie des matériaux
(CCV) et par l’évaluation du temps de retour sur investissement (TRI).
- Finalement, comme la demande de refroidissement augmente de manière significative dans le
monde entier, nous avons étendu notre recherche bibliographique aux applications de MCP pour le
refroidissement (voir Annexe A). Ceci a pour objectif d’avoir une vision globale de l’emploi des
MCP dans les bâtiments dans un contexte de refroidissement, ainsi que problèmes pouvant être
General Introduction
39
rencontrés dans ces applications. Les difficultés liées à la sélection de ces matériaux et les facteurs
affectant l'utilisation réussie et efficace des MCP sont également discutés.
Notant que cette thèse est présentée comme une série d'articles de revues. Par conséquent, les
chapitres 2, 3 et 4 et l'annexe A peuvent être lus indépendamment, et un certain chevauchement peut
être trouvé entre eux. L’autorisation préalable des éditeurs a été obtenue pour la diffusion des articles
publiés dans le cadre de ce manuscrit.
La doctorante est la première auteure de ces articles, les co-auteurs sont les directeurs de thèse Pascal
Henry Biwole et Farouk Fardoun. Pendant la thèse, quatre articles sont publiés et un article est soumis
dans des journaux internationaux de rang A à comité de lecture :
- Chapitre 2: Farah Souayfane, Pascal Henry Biwole, Farouk Fardoun. “Melting of a phase change
material in presence of natural convection and radiation: A simplified model”. Published in Applied
Thermal Engineering, Elsevier, 2018, 130, pp.660 – 671.
- Chapitre 3: Farah Souayfane, Pascal Henry Biwole, Farouk Fardoun. “Thermal behavior of a
translucent superinsulated latent heat energy storage wall in summertime”. Published in Applied
Energy, 2018, 217, pp. 390-408.
- Chapitre 4: Farah Souayfane, Farouk Fardoun, Pascal Henry Biwole. “Energy Performance and
Economic Analysis of a TIM-PCM Wall Under Different Climates”. Submitted to Energy, revision
requested, 2018.
- Annexe A: Farah Souayfane, Farouk Fardoun, Pascal Henry Biwole. “Phase Change Materials
(PCM) for cooling applications in buildings: A review”. Published in Energy and Buildings, Elsevier,
2016, 129, pp.396-431.
Ces articles comprennent mon propre travail, sauf indication contraire, et tout le travail est effectué
par la doctorante sous la supervision des directeurs de thèse.
Tous les articles de revues publiés et les publications dans des conférences internationales au cours
de cette thèse sont énumérés dans l'annexe C.
General introduction
40
References
[1] “Agence de l’Environnement et de la Maîtrise de l’Énergie Changement climatique - transition
écologique, énergétique.” [Online]. Available: http://www.ademe.fr/?sort=-
1&cid=96&m=3&catid=12846. [Accessed: 20-Feb-2018].
[2] “Atkin P, Farid MM. Improving the efficiency of photovoltaic cells using PCM infused graphite and
aluminium fins. Sol Energy 2015;114:217–28.”
[3] Z. Luo et al., “Numerical and experimental study on temperature control of solar panels with form-stable
paraffin/expanded graphite composite PCM,” Energy Convers. Manag., vol. 149, pp. 416–423, Oct.
2017.
[4] “Hendricks J, Sark W. Annual performance enhancement of building integrated photovoltaic modules by
applying phase change materials. Prog Photovolt Res Appl 2013;21:620–30.”
[5] F. Goia, “Thermo-physical behaviour and energy performance assessment of PCM glazing system
configurations: A numerical analysis,” Front. Archit. Res., vol. 1, no. 4, pp. 341–347, Dec. 2012.
[6] K. Zhong, S. Li, G. Sun, S. Li, and X. Zhang, “Simulation study on dynamic heat transfer performance
of PCM-filled glass window with different thermophysical parameters of phase change material,”
Energy Build., vol. 106, pp. 87–95, 2015.
[7] K. A. R. Ismail, C. T. Salinas, and J. R. Henriquez, “Comparison between PCM filled glass windows
and absorbing gas filled windows,” Energy Build., vol. 40, no. 5, pp. 710–719, Jan. 2008.
[8] F. Goia, M. Perino, and M. Haase, “A numerical model to evaluate the thermal behaviour of PCM
glazing system configurations,” Energy Build., vol. 54, pp. 141–153, 2012.
[9] K. A. R. Ismail and J. R. Henrıquez, “Parametric study on composite and PCM glass systems,” Energy
Convers. Manag., vol. 43, no. 7, pp. 973–993, 2002.
[10] C. Liu, Y. Zhou, D. Li, F. Meng, Y. Zheng, and X. Liu, “Numerical analysis on thermal performance of
a PCM-filled double glazing roof,” Energy Build., vol. 125, pp. 267–275, 2016.
[11] C. Liu, Y. Zheng, D. Li, H. Qi, and X. Liu, “A Model to Determine Thermal Performance of a Non-
ventilated Double Glazing Unit with PCM and Experimental Validation,” Procedia Eng., vol. 157, pp.
293–300, 2016.
[12] K. Johannes, F. Kuznik, F. Jay, P. Roquette, P. Achard, and Y. Berthou, “CRISTOPIA ENERGY
SYSTEMS, SAVERBAT SAS,Elément d’enveloppe d’un bâtiment et ensemble comprenant un tel
élément,” Brevet Francais FR 1158194, 15-Mar-2013.
[13] Y. Berthou, P. H. Biwole, P. Achard, H. Sallée, M. Tantot-Neirac, and F. Jay, “Full scale
experimentation on a new translucent passive solar wall combining silica aerogels and phase change
materials,” Sol. Energy, vol. 115, pp. 733–742, May 2015.
[14] A. . Brent and V. R. Voller, “Enthalpy-porosity technique for modeling convection-diffusion phase
change: application to the melting of a pure metal,” Numerical Heat Transfer, vol. Vol. 13, pp. 297–318,
1988.
[15] B. Binet and M. Lacroix, “Melting from heat sources flush mounted on a conducting vertical wall,” Int.
J. Num. Meth. Heat & Fluid Flow, vol. Vol. 10, pp. 286-306., 2000.
[16] K. Morgan, “A numerical analysis of freezing and melting with convection,” Comp. Meth. App. Eng.,
vol. Vol. 28, pp. 275–84, 1981.
[17] J. Hsiao, “An efficient algorithm for finite difference analysis of heat transfer with melting and
solidification,” ASME Paper No. WA/HT-42, 1984.
[18] Y. Cao and A. Faghri, “A numerical analysis of phase change problem including natural convection,” J
HEAT TRANSFER, vol. 112, pp. 812–15, 1990.
[19] V. Voller and M. Cross, “An enthalpy method for convection/ diffusion phase change,” Int J Numer
Methods Eng, vol. 24:271–84., 1987.
[20] V. Shatikian, G. Ziskind, and R. Letan, “Numerical investigation of a PCM-based heat sink with internal
fins,” Int. J. Heat Mass Transf., vol. 48, no. 17, pp. 3689–3706, Aug. 2005.
[21] M. Faraji and H. El Qarnia, “Numerical study of melting in an enclosure with discrete protruding heat
sources,” Appl. Math. Model., vol. 34, no. 5, pp. 1258–1275, May 2010.
[22] A. R. Archibold, M. M. Rahman, D. Y. Goswami, and E. K. Stefanakos, “Analysis of heat transfer and
fluid flow during melting inside a spherical container for thermal energy storage,” Appl. Therm. Eng.,
vol. 64, no. 1–2, pp. 396–407, Mar. 2014.

General Introduction
41
[23] P. Wang, H. Yao, Z. Lan, Z. Peng, Y. Huang, and Y. Ding, “Numerical investigation of PCM melting
process in sleeve tube with internal fins,” Energy Convers. Manag., vol. 110, pp. 428–435, Feb. 2016.
[24] Z. Liu, Y. Yao, and H. Wu, “Numerical modeling for solid–liquid phase change phenomena in porous
media: Shell-and-tube type latent heat thermal energy storage,” Appl. Energy, vol. 112, pp. 1222–1232,
Dec. 2013.
[25] W.-B. Ye, D.-S. Zhu, and N. Wang, “Fluid flow and heat transfer in a latent thermal energy unit with
different phase change material (PCM) cavity volume fractions,” Appl. Therm. Eng., vol. 42, pp. 49–57,
Sep. 2012.
[26] P. Goyal, A. Dutta, V. Verma, and I. T. R. Singh, “Enthalpy Porosity Method for CFD Simulation of
Natural Convection Phenomenon for Phase Change Problems in the Molten Pool and its Importance
during Melting of Solids.”
[27] S. Wang, A. Faghri, and T. L. Bergman, “A comprehensive numerical model for melting with natural
convection,” Int. J. Heat Mass Transf., vol. 53, no. 9–10, pp. 1986–2000, Apr. 2010.
[28] A. Faghri and Y. Cao, “Performance characteristics of a thermal energy storage module: a transient
PCM/forced convection conjugate analysis,” Int. J. HeatMass Transfer, pp. 93–101, 1991.
[29] P. Damronglerd and Zhang, “Modified temperature-transforming model for convection-controlled
melting,” AIAA J. Thermophy. Heat Transfer 21, pp. 203–208., 2007.
[30] x zeng and A. Faghri, “A temperature transforming model for binary solid–liquid phase change
problems: Part I – mathematical modeling and numerical methodology,” pp. 467–480, 1994.
[31] D. Groulx and P. H. Biwole, “Solar PV Passive Temperature Control Using Phase Change Materials,”
2014.
[32] J. M. Fuentes, F. Kuznik, K. Johannes, and J. Virgone, “Development and validation of a new LBM-
MRT hybrid model with enthalpy formulation for melting with natural convection,” Phys. Lett. A, vol.
378, no. 4, pp. 374–381, 2014.
[33] D. Chatterjee and S. Chakraborty, “An enthalpy-based lattice Boltzmann model for diffusion dominated
solid–liquid phase transformation,” Phys. Lett. A, vol. 341, no. 1–4, pp. 320–330, Jun. 2005.
[34] E. A. Semma, M. El Ganaoui, and R. Bennacer, “Lattice Boltzmann method for melting/solidification
problems,” Comptes Rendus Mécanique, vol. 335, no. 5–6, pp. 295–303, May 2007.
[35] C. Huber, A. Parmigiani, B. Chopard, M. Manga, and O. Bachmann, “Lattice Boltzmann model for
melting with natural convection,” Int. J. Heat Fluid Flow, vol. 29, no. 5, pp. 1469–1480, Oct. 2008.


CHAPTER 1
STATE OF THE ART AND THESIS PROBLEMATIC

Chapter 1
45
Chapter 1. State of the art and thesis problematic
Résumé du chapitre en français :
Etat de l’art et problématique
D’abord, ce chapitre présente les mécanismes de transfert de chaleur qui se produisent pendant le
processus de changement de phase. Les différents modèles numériques de changement de phase
prenant en compte la convection naturelle dans le MCP liquide sont présentés et le phénomène
physique mise en jeu est expliqué. Ces modèles numériques comprennent les modèles CFD et les
approches simplifiées. Ensuite, l’état de l'art des différentes études considérant la convection naturelle
pendant la fusion des MCP dans des enceintes est présenté. Sur la base de ce qui précède, Il a été
constaté que : - la convection naturelle doit être prise en compte dans la phase liquide du MCP pendant
la fusion ; - les modèles ‘CFD’ sophistiqués utilisés pour modéliser la convection naturelle pendant
la fusion, nécessitent la résolution numérique des équations de Navier Stokes (méthode d’enthalpie-
porosité, modèle de transformation de la température, méthode de la capacité calorifique modifiée,
méthode de Boltzmann sur réseau (LBM)) sont eux gourmands en temps de calcul et ne sont pas du
tout adaptés aux échelles de temps et d’espace caractéristiques de la simulation thermique annuelle
du bâtiment. L'approche de conductivité thermique efficace, largement utilisée, est rapide et simple,
mais elle présente plusieurs lacunes, en particulier elle est incapable de montrer les caractéristiques
du changement de phase et ne peut pas fournir d’informations sur la position du front de fusion ; - le
processus de fusion comprend principalement trois régimes : régime dominé par la conduction,
régime mixte de conduction et de convection et régime dominé par la convection. Ces régimes sont
reflétés par la courbe du nombre de Nusselt en fonction du temps. Cependant, aucun consensus n'a
été trouvé dans la littérature sur lequel est le mécanisme de transfert de chaleur dominant, lequel peut
être ignoré et comment combiner ces deux mécanismes pendant la modélisation du changement de
phase ; - le nombre de Nusselt est un paramètre clé dans les problèmes dominés par la convection. ;
- à ce jour, de nombreuses corrélations de nombre de Nusselt développées dans la littérature ne
conviennent que pour une géométrie et / ou un PCM spécifiques.
De plus, dans le cadre de l’amélioration de l’enveloppe des bâtiments et de l’exploitation optimale
des ressources environnementales pour diminuer la consommation de l’énergie, une étude
bibliographique concernant l’application des façades translucides et du mur Trombe intégrant des
matériaux à changement de phase est présentée. En se basant sur cette étude bibliographique, il a été
constaté que : - l’intégration des MCP dans les façades translucides augmente le confort thermique

Chapter 1
46
intérieur du bâtiment et par conséquent la satisfaction des occupants ; - la plupart des travaux
antérieurs sur les façades transparentes intégrant des MCP ont été principalement développés pour la
saison de chauffage et leurs avantages en termes d'efficacité énergétique sont peu quantifiés en été. -
la plupart des études sur les façades translucides ont supposé des transferts unidimensionnels par
conduction et par rayonnement sans prise en compte de la convection ; l’interaction de la convection
et du rayonnement a rarement été étudiée dans la littérature.
Dans le même contexte, le mur solaire innovant issu du projet ANR INERTRANS (2008-2011) est
présenté. Le mur est composé d'un lit d’aérogel de silice pour l’isolation thermique-acoustique
permettant la transmission du rayonnement solaire, et de briques de verre remplies d'un matériau à
changement de phase eutectique à base d’acides gras pour le stockage et la restitution de la chaleur.
Le mur entier est translucide et a été mise en place à Sophia Antipolis, au sein du centre PERSEE
(Procédés, Énergies Renouvelables et Systèmes Énergétiques) de Mines ParisTech dans le but
d'étudier son comportement thermique sous climat réel, et dans la cellule climatique MINIBAT du
Centre d’Energétique et de Thermique de Lyon dans le but de déterminer le comportement du mur
MCP-aérogel pour des scénarios climatiques imposés et répétables.
Plusieurs études ont été menées dans le cadre du projet INTERTRANS et sont citées ci-après.
Le mur a été caractérisé expérimentalement par Berthou et al. [121], en ambiance contrôlée et in-situ
sur un bâtiment grandeur nature situé au sein du laboratoire PERSEE. Les résultats expérimentaux
ont montré que la performance thermique du mur est très élevée en hiver, alors que durant l’été, les
gains de chaleur à travers le mur provoquent un problème de surchauffe et le MCP n’arrive pas à se
solidifier. Ainsi, la performance du mur doit être optimisée, et des solutions pour surmonter la
surchauffe estivale et le cyclage du MCP doivent être proposées. Le modèle numérique du mur issu
de ce travail présente de fortes différences avec les mesures expérimentales. Ceci est
vraisemblablement dû au fait que la convection naturelle n'a pas été correctement prise en compte
dans le modèle. Ainsi, la question d'un modèle numérique validé expérimentalement et qui permette
l'optimisation d'une telle paroi sous différentes conditions est toujours ouverte.
Fuentes et al. [85] ont développé un modèle de Lattice Boltzmann sur gaz réseau couplé à la méthode
des ordonnées discrètes (LBM-DOM) dans le but d’étudier la fusion d’un acide gras contenu dans les
briques de verre du mur innovant en présence de convection naturelle et de rayonnement. Ils ont
souligné l'importance de considérer la convection naturelle dans le MCP liquide. Cependant, le
modèle développé nécessite un temps de calcul très élevé. Ainsi, il ne peut pas être utilisé pour
effectuer une évaluation annuelle de la performance énergétique de bâtiments intégrant un tel mur.
Un modèle plus simplifié de rayonnement et de convection naturelle pendant la fusion est toujours
une question ouverte.

Chapter 1
47
Gong et al. [122] ont concentré leurs travaux expérimentaux et numériques, sur la question importante
du processus de fusion d’un MCP à l'intérieur d’une brique de verre. Le rayonnement dans la brique
n'a pas été pris en compte, et le modèle développé n’était pas adapté pour être couplé avec TRNSYS
ou Energy Plus, afin d’évaluer la performance thermique annuelle de l'ensemble du bâtiment.
Il résulte des points évoqués ci-dessus que des travaux supplémentaires restent à faire dans le cadre
du projet INERTRANS, et principalement la mise en place d'un modèle numérique simplifié pouvant
convenablement représenter la physique du mur MCP-aérogel, tout en tenant compte de la convection
naturelle et du rayonnement lors de la fusion du MCP. Le modèle doit être suffisamment rapide pour
être couplé avec un outil de simulation énergétique globale (tel que TRNSYS), afin d’évaluer la
performance thermique annuelle de l'ensemble du bâtiment intégrant un tel mur. Une fois le modèle
validé expérimentalement, il doit servir à l'optimisation de la performance de la paroi MCP-aérogel
sous différentes conditions climatiques et configurations.
Dans ce chapitre, le mur MCP-aérogel est décrit ainsi que la problématique de la thèse. Dans le
chapitre suivant, un modèle simplifié prenant en compte la convection naturelle et le rayonnement
lors du changement de phase sera développé. Les équations régissant ces phénomènes ainsi que leurs
hypothèses simplificatrices et les méthodes numériques adaptées à leur résolution seront présentées.

Chapter 1
48
1. Introduction
By 2035 it is expected that the energy consumption in the building sector increases 29%, which
represents an average annual rate of 1% [1]. The European Union EU has introduced some policies
and goals to improve the energy efficiency of the building sector, such as [2]–[4]:
1. The Energy Service Directive and Renewables Directive propose respectively a 9% of energy
savings by 2016 and 20% of all energies should be prevenient from renewable energy sources by
2020;
2. All new buildings by 2020 must be nearly-zero energy buildings (NZEBs) and after 2018 new
public buildings should be NZEBs;
3. The Energy strategy of the European Union added targets to 2020, known as “20-20-20” that have
the objective of 20% reduction of the greenhouse gas emissions, comparatively to the 1990 levels,
increase of 20% of energy production from renewable energy sources;
4. Besides of the Energy Strategy, the EU added individual rules and directives for each state
members for the use of renewable sources and to improve the energy efficiency until 2020.
5. In France, the Climate Plan adopted in 2005 aims at dividing by 4 the amount of greenhouse gases
emissions by 2050, compared to the 1990 baseline. About 24% of the country’s greenhouse gases
emissions are due to building heating [refer to the document I have sent]. Reducing energy demand
and increasing the share of renewable energy in the built environment are key steps to reach this
objective.
The incorporation of phase change materials (PCM) into building elements is a growing trend for
improving the thermal energy storage capacity in the latent form. PCM represent a good option to
enhance the building’s ability to smooth the peak loads and to reduce the thermal energy needs. The
working principle of the PCM is to exploit the considerable capacity of these materials of
accumulating heat when they subdue a phase transition. Therefore, compared with the most common
strategy, less material is necessary to store the same amount of thermal energy. Currently, the external
envelope, mainly in offices and commercial spaces, is systematically composed by large glazed areas
that lead to the increase of energy consumption of the building [5]–[7]. These areas are crucial
because these are the areas where high energy transfer occurs between the indoor and outdoor spaces,
that can lead to thermal and visual discomfort conditions [7]–[11]. Therefore, solutions resourcing to
the use of phase change materials to improve the energy efficiency of the glazing areas and
transparent/translucent areas have been carried out in the last 20– 25 years with promising results
[12]. Some examples of research activities in this field can be found in the literature [13]–[16]. The
first concepts of PCM glazing systems were developed mainly for cold climates, but more recent

Chapter 1
49
analysis [17] showed that the adoption of PCM glazing systems may have a positive effect in warmer
climates too. The general aim of this technology is to reduce the energy fluctuations along the time,
by acting as thermal energy storage device that is charged, mainly, by solar energy. Today, transparent
insulation materials with excellent optical and thermal properties are commercially available. Thus,
the combination of these improved materials with PCM in transparent building facades may result a
better thermal performance.
However, to fully investigate PCM potentials and drawbacks, the availability of robust and reliable
numerical tools is fundamental. Thanks to these tools it would be possible to test different
configurations of PCM integrated in glazing or transparent systems (e.g. with various PCM, layered-
structures) under different operative conditions without the need of performing extensive and
expensive experimental analysis. It would also be possible to assess the effectiveness of this
technology in different climates and for different building types.
The major challenge of the mathematical modeling of phase change process is to properly represent
the moving boundary of the solid–liquid interface and the associated thermophysical property change.
The solid–liquid phase change is characterized by a moving melting/freezing front, accompanied with
latent heat absorption/release and sharp variations of thermophysical properties, including thermal
conductivity, specific heat, viscosity and density. In addition, most of the real applications of solid–
liquid phase change occurs in multidimensional configurations, and natural convection in the liquid
phase often plays an important role in controlling heat transfer, which substantially complicates the
problem and makes analytical solutions impossible.
In fact, during the phase transformation especially melting process, the temperature and concentration
gradients in the liquid phase of PCM keep varying, which results in the movement of the liquid PCM,
named convection occurring under the action of buoyancy forces due to the density gradients. In the
previous numerical investigations, the convection heat flow in the liquid phase received less attention
than conduction owing to the limited computational capabilities of computer and the mathematical
complexities to formulate the convection heat transfer during the phase transformation. However,
recent researches have demonstrated that natural convection plays an important role in latent heat
thermal energy systems, especially during the melting process and should not be ignored. In addition,
the radiative heat transfer in the case of PCM integrated in translucent facades should be considered
in combination with both conduction and convection heat transfers during phase change.
Therefore, this chapter discusses, in section 2, the heat transfer mechanisms that occur during the
charging and discharging periods of the phase change materials (PCM) and defines the Stephan and
Neumann problems. Section 3 deals with the phase change process considering natural convection in
liquid PCM. The physical phenomenon is explained in section 3.1 and the numerical methods

Chapter 1
50
including CFD models and simplified approaches to model natural convection during melting process
are presented in section 3.2. In section 3.3 we present the state of the art of different studies on phase
change with natural convection in enclosures. A literature review of PCM applications within
translucent facades considering radiation heat transfer during phase change is presented in Section 4.
Section 5 presents a literature review of PCM applications within Trombe walls and definition of
transparent insulation materials. In section 6 we present an innovative wall, proposed by the
INERTRANS project, composed of transparent insulation material layer, silica aerogels, and a PCM
layer. This wall provides heat storage and insulation while allowing daylighting at the same time. The
description of the system and the physical phenomena involved are presented in 6.1 and 6.2. A history
related to studies conducted in the framework of the INERTRANS project are presented in section
6.3. In section 7, the previous works and their limitations are discussed, and consequently the
problematic and the objectives of the thesis are identified.
2. Heat transfer mechanisms during the phase change
2.1.Conduction and convection heat transfer
The possible heat transfer mechanisms during melting and solidification of phase change materials
are conduction, convection or a combination of both. Therefore, the simulation methods in the
literature are based on the considered heat transfer mechanism: the pure conduction model and the
combined conduction and natural convection model. The pure conduction model is a hypothetical
model, which assumes that conduction is the sole heat transfer mechanism during melting.
In 1831, Lamé and Clapeyron [18] conducted the first study on phase change problem by considering
only the conduction heat transfer and the effect of natural convection has received less attention.
However, in the last two decades, convection dominated phase change problems have become the
subject of numerous studies, and some researchers persist that natural convection is a more significant
mechanism in the liquid PCM region whenever convection motion has enough room to develop. In
fact, due to the variations of density gradients, the convection in the liquid PCM occurs under the
action of buoyancy forces during the melting process.
Modeling phase change taking into account the natural convection in the liquid PCM was firstly
considered by Sparrow et al. [19] in 1977, they concluded that the effect of natural convection should
not be ignored. In 1978 they conducted another study [20] showing that the natural convection must
be accounted for and that it is first order important in phase change problems. In 1980, Yao and Chen
[21] investigated the influence of natural convection using an approximate solution; they found that
it highly depends on Rayleigh number. Some researchers [22] [23] [24], between 1978 and 1985,
have stated that the convection influences the melting rate and the resulting distribution of the liquid

Chapter 1
51
phase of the PCM in a multi-component system. Later, in 1988 Buddhi et al. [25] explained the
phenomena that causes the convection in the liquid PCM by the density differences that induce the
buoyancy forces. In 1990, Farid et al [26] accounted for the natural convection during melting process
using an effective thermal conductivity method (𝑘𝑒𝑓𝑓/𝑘𝑙 = 𝑐𝑅𝑎𝑛). In 1994, Hasan [27] concluded
that the melting process cannot be described correctly if the heat transfer by conduction only is
considered. Later, in 1998, Lacroix et al [28] also found that during the melting process, natural
convection is the key heat transfer mechanism. In 1999, Zhang and Yi [29] believed that the
convection is the dominant heat transfer mechanism due to the continuous increase of the PCM
volume during melting. In the same year, Velraj and Seeniraj [30] concluded that during melting,
convection occurs in the liquid PCM leading to an increase in the heat transfer rate, compared with
the solidification process. In 2001, Sari et al. [31] found that the natural convection had a large effect
on the heat transferred from a heat exchanger to a stearic acid PCM. After that, in 2004, Lamberg et
al. [32] studied the impact of the natural convection on the melting and solidification procedures.
They showed that, compared with the experimental results, unsatisfactory numerical results were
obtained when the effect of natural convection is absent during the melting process, whilst good
estimation during the solidification process were showed. Figure 1-1 shows the difference between
the predicted temperature, with and without convection, during the melting of a fatty acid eutectic of
melting temperature 21⁰C. It turns out that the differences are negligible for thicknesses less than 1
cm, while beyond that, the difference between the predicted temperature with and without convection
can reach up to 18 °C [33].
Figure 1-1: Influence of natural convection on the temperature function of PCM thickness [33]
For the melting process, the PCM changes its phase from solid to a mushy state, and then liquid,
which is reversible during the solidification process. Therefore, it is possible during the phase

Chapter 1
52
transformation process that more than one kind of heat transfer mechanisms acting at work, but how
to weight the percentages of conduction and convection heat transfer in each stage has been the main
challenge for the researchers currently. Section 3 will review the most common methods used to
model the convection heat transfer during phase change.
2.2.Stefan problem and Neuman problem
The simplest of the Stefan problems, or moving boundary problems, is the one-phase Stefan problem
since only one-phase involved. The term of ‘one-phase’ designates only the liquid phases active in
the transformation and the solid phase stay at its melting temperature. Stefan's solution with constant
thermophysical properties shows that the rate of melting or solidification in a semi-infinite region is
governed by a dimensionless number, known as the Stefan number (Ste),
𝑆𝑡𝑒 =𝐶𝑙(𝑇𝑙 − 𝑇𝑚)
𝐿 Eq. 1-1
where, 𝐶𝑙 is the heat capacity of the liquid PCM, L is the latent heat of fusion, and 𝑇𝑙 and 𝑇𝑚 are the
surrounding and melting temperatures, respectively.
With the heat transfer continuing, the interface boundary is constantly moving as the liquid and solid
phases shrinking and growing, which disable the prediction of the boundary location [34]. Because
of that the solid– liquid interface is not fixed, but moving with time, the heat transfer mechanisms
during a PCM phase transformation process are complex. Therefore, the phase change transition is
difficult to analyze owing to the three reasons: the solid–liquid interface is moving; the interface
location is nonlinear; it consists of thermal conduction and natural convection heat transfer
mechanisms. Due to these three factors, the non-linearity of the governing equations is introduced to
the moving boundary, and the precise analytical solutions are only possible for a limited number of
scenarios
The Stefan problem was extended to the two-phase problem, the so-called Neumann problem which
is more realistic [35]. In Neumann problem, the initial state of the PCM is assumed to be solid, during
the melting process, its initial temperature does not equal to the phase change temperature, and the
melting temperature does not maintain at a constant value. Consider that the melting happens in a
semi-infinite slab (0 < 𝑥 < ∞), the solid PCM is initially at a uniform temperature 𝑇𝑠 < 𝑇𝑚 and a
constant temperature 𝑇0 is imposed on the slab surface x=0, with the assumptions of constant thermo-
physical properties of the PCM, the heat conduction in solid and liquid region and the heat fluxes
transferring from the liquid phase to the solid–liquid interface are given as shown in Figure 1-2.
Where ρ is the density, C is the specific heat, k is the thermal conductivity, t and x are the time and
space coordinates respectively and L is latent heat of fusion.
Neumann analytical solution can be written as:

Chapter 1
53
Position of the solid–liquid interface (melting front)
𝛿(𝑡) = 2𝜆√𝜇𝑙𝑡 Eq. 1-2
Temperature of the liquid phase:
𝑇(𝑥, 𝑡) = 𝑇𝑙 − (𝑇𝑙 − 𝑇𝑚)erf (𝑥/2√𝜇𝑙𝑡)
erf (𝜆) Eq. 1-3
Temperature of the solid phase:
𝑇(𝑥, 𝑡) = 𝑇𝑠 + (𝑇𝑚 − 𝑇𝑠)erfc (𝑥/2√𝜇𝑠𝑡)
erfc(𝜆√𝜇𝑙/𝜇𝑠) Eq. 1-4
where, 𝑇𝑠 ,𝑇𝑙 and 𝑇𝑚 the initial temperature of solid and liquid PCM (K) and melting temperature
respectively. λ is the solution to the transcendental equation [18] and 𝜇 is the thermal diffusivity of PCM
(m2/s).
However, the Neumann's solution is applicable only for moving boundary problems in the rectangular
coordinate system and needs an existing initial liquid layer.
Figure 1-2 : Schematic illustration of the two-phase Stefan problem
Furthermore, there are several other issues with the use of a theoretical approach in the study of PCM.
There were many mechanisms involved during a PCM phase transition, such like a change in volume,
density, thermal conductivity, specific heat capacity, super-cooling, etc [36]. Another major issue
with PCM is that they act as self-insulating materials. When PCM solidification occurs from the top
of the heat surface, solid insulating layer will be developed which moves inward during the whole
solidification process. With the increase in the size and thickness of the solid layer, the heat transfer
rate from the liquid PCM to the heat exchanger surface decreases until it becomes so small that will
not be possible to maintain at an acceptable heat transfer rate.

Chapter 1
54
Logical heat transfer mechanisms during the charging and discharging periods of the PCM are the
essential elements to develop any accurate mathematical model. However, there are quite a few issues
to properly describe the heat transfer mechanisms: conduction and natural convention during the
phase change process. In the next section, physical phenomenon and mathematical solutions of phase
change with natural convection will be presented.
3. Melting with natural convection
Melting in the presence of significant natural convection is an important phenomenon in the field of
thermal energy storage in phase-change materials. Considerable empirical and theoretical work has
been devoted already to this phenomenon, and one conclusion was that this phenomenon is quite
complicated [37]. The complications stem from the strong coupling that exists between the flow of
the liquid phase and the melting rate of the solid. It is this coupling that determines the instantaneous
shape of the two-phase interface, which constitutes one of the unknowns in each problem. It should
be noted that according to many authors [38] [39], convection heat transfer is less important than
conduction during solidification process.
3.1.Physical phenomenon
The evolution of the process is as follows. At first, when a small layer of liquid forms, heat transfer
is dominated by conduction and the melting front moves parallel to the left heated wall (see Figure
1-3 (a)). Then, because of the variation in density, the hot fluid rises and brings the heat to the solid
via the interface between the two. This causes a non-uniform distribution of heat, and therefore a
slight deformation of the melting front. At this time, the heat transfer is mixed combining transfer by
convection in the superior part of the enclosure and conduction in the lower part (see Figure 1-3 (b)).
As the temperatures rise, the fluid motion is more important, the liquid gives more heat to the interface
and it cools coming down, therefore, the heat transfer is larger at the top than the bottom of the
interface, leading to an irregular shape of the latter. The deformation of the melt front is more
important and dominated by the convective heat transfer (see Figure 1-3 (c)). The process continues
until the arrival of the melt front to the cold wall.

Chapter 1
55
Figure 1-3: Regimes for melting in the presence of significant natural convection when the phase-change
material is being heated from the side [40]
3.2.Mathematical solutions
The main challenge of the mathematical modeling of phase change process is to properly represent
the moving melting front. The numerical modeling of solid–liquid phase change problems can be
divided into two main groups: fixed grid methods and deforming grid methods.
In fixed grid schemes, the melting front is not tracked explicitly, but instead is determined by the
temperature/enthalpy distribution, and the mathematical calculations become much simpler with
reasonable accuracy. The most widely used fixed grid methods to formulate the energy conservation
of the phase change process are the equivalent heat capacity method proposed by Morgan, 1981 [41]
and Hsiao, 1984 [42] and the enthalpy method first introduced by Eyres et al., 1946, then reformulated
for fixed grids by Voller et al., 1987 [43] and Binet and Lacroix, 2000 [44]. Cao and Faghri (1990)
[45] proposed an enhanced temperature-based equivalent heat capacity method named the
temperature transforming model (TTM), an enhanced temperature-based equivalent heat capacity
method, in which the enthalpy-based energy equation is converted into a nonlinear equation with a
single dependent variable. But this method suffered from inconsistency [46][47]. On the other hand,
the enthalpy method treats both isothermal and mushy phase-change problems, but it suffered from
temperature oscillation.
On the other hand, in deforming grid methods or front-tracking methods the mesh moves to track the
phase interface which complicate the mathematical operations and transformed coordinate systems
must be used. At each time step, the location of the moving boundary is calculated on a grid, which
can lead to high computational costs.
When natural convection in the liquid phase is taken into account, the problem becomes more
complicated and analytical solutions cannot be used [46]. In addition to the moving boundary issue,
these problems are strongly non-linear, and the Navier-Stokes equations i.e, the coupled energy
equations in the solid and liquid phases, together with the continuity and momentum equations in the
liquid, must be solved.

Chapter 1
56
Numerically, various methods are currently explored and used to model phase change accounting for
natural convection, mainly the enthalpy-porosity approach [48][49][50][51][52][53][54][55], the
temperature transforming model (TTM) [46][56][57][58], the equivalent thermal capacity method
[41], the modified heat capacity method [59], in addition to the integral method, the boundary fixing
method, the unstructured finite-element method, and the coordinate transformation method [18]. If
no simplification is made, one must consider at least: the conservation of mass, equations of
momentum and energy equation. In addition, Lattice Boltzmann Method (LBM) [60][61][62] can be
used to model the fluid flow during phase change.
The solution of these equations can be done using finite volume methods (FVM) like the commercial
software FLUENT or finite element method (FEM) using COMSOL Multiphysics software.
3.2.1. Temperature transforming model (TTM)
The temperature transforming model TTM was suggested by Cao and Faghri (1990) [45] to model
phase-change problems with the effect of natural convection. In this method, continuity and
momentum equations are used same as fluid flow problems, while the energy equation is different
from the enthalpy-based energy equations.
Continuity equation
𝜕(𝜌𝑢)
𝜕𝑥+𝜕(𝜌𝑣)
𝜕𝑦= 0
Eq. 1-5
Momentum equations:
𝜕(𝜌𝑢)
𝜕𝑡+𝜕(𝜌𝑢𝑢)
𝜕𝑥+𝜕(𝜌𝑣𝑢)
𝜕𝑦= −
𝜕𝑝
𝜕𝑥+𝜕
𝜕𝑥(𝜇𝜕𝑢
𝜕𝑥) +
𝜕
𝜕𝑦(𝜇𝜕𝑢
𝜕𝑦)
Eq. 1-6
𝜕(𝜌𝑣)
𝜕𝑡+𝜕(𝜌𝑢𝑣)
𝜕𝑥+𝜕(𝜌𝑣𝑣)
𝜕𝑦= −
𝜕𝑝
𝜕𝑦+𝜕
𝜕𝑥(𝜇𝜕𝑣
𝜕𝑥) +
𝜕
𝜕𝑦(𝜇𝜕𝑣
𝜕𝑦) + 𝜌𝑔[𝛽(𝑇 − 𝑇𝑚) − 1]
Eq. 1-7
Energy equation:
𝜕(𝜌ℎ)
𝜕𝑡+𝜕(𝜌𝑢ℎ)
𝜕𝑥+𝜕(𝜌𝑣ℎ)
𝜕𝑦=𝜕
𝜕𝑥(𝑘𝜕𝑇
𝜕𝑥) +
𝜕
𝜕𝑦(𝑘𝜕𝑇
𝜕𝑦)
Eq. 1-8
h is the total enthalpy including sensible and latent terms, u and v are the velocities in x and y
directions (m/s), p is the pressure (Pa), k is the thermal conductivity (W/m. K).
Scaled temperature T* = T-Tm is defined, and the enthalpy is expressed by the temperature
transforming model:
h = c (T∗ + s) Eq. 1-9
{
𝑐 = 𝑐𝑠 𝑖𝑓 T∗ < −𝛿𝑇
𝑐 =(𝑐𝑠 + 𝑠𝑙)
2+ℎ𝑠𝑙
2𝛿𝑇 𝑖𝑓 − 𝛿𝑇 ≤ T∗ ≤
𝑐 = 𝑐𝑙 𝑖𝑓 T∗ > 𝛿𝑇
𝛿𝑇
Eq. 1-10

Chapter 1
57
{
𝑠 = 𝛿𝑇 𝑖𝑓 T∗ < −𝛿𝑇𝑠 = 𝛿𝑇 𝑖𝑓 − 𝛿𝑇 ≤ T∗ ≤ 𝛿𝑇
𝑠 = (𝑐𝑠
𝑐𝑙) 𝛿𝑇 +
ℎ𝑠𝑙
𝑐𝑙 𝑖𝑓 T∗ > 𝛿𝑇
Eq. 1-11
{
𝑘 = 𝑘𝑠 𝑖𝑓 T∗ < −𝛿𝑇
𝑘 = 𝑘𝑠 +(𝑘𝑙 − 𝑘𝑠)(T∗ + 𝛿𝑇)
2𝛿𝑇 𝑖𝑓 − 𝛿𝑇 ≤ T∗ ≤ 𝛿𝑇
𝑘 = 𝑘𝑙 𝑖𝑓 T∗ > 𝛿𝑇
Eq. 1-12
where hsl is the latent heat (J/kg), δT is half width of mushy zone temperature range, cp is the specific
heat (kJ/kg˚C). T*<-δT corresponds to the solid phase, -δT ≤T*≤δT to the mushy region, and T*>δT
to the liquid phase.
The energy equation becomes:
𝜕𝜌𝑐T∗
𝜕𝑡+ 𝜕
𝜌𝑢𝑐T∗
𝜕𝑥+ 𝜕
𝜌𝑣𝑐T∗
𝜕𝑦
=𝜕
𝜕𝑥(𝑘𝜕T∗
𝜕𝑥) +
𝜕
𝜕𝑦(𝑘𝜕T∗
𝜕𝑦) − 𝜕
𝜌𝑐𝑠
𝜕𝑡− 𝜕
𝜌𝑢𝑐𝑠
𝜕𝑥− 𝜕
𝜌𝑣𝑐𝑠
𝜕𝑦
Eq. 1-13
The TTM method was used by several authors[56][57][58] , Wang et al. [46] developed a 2D
numerical model for melting including natural convection applied in a square cavity. They have used
the TTM employing a new method for solid velocity correction, and the velocity–pressure coupling
is solved by the CUT algorithm. Z. Ma and Y. Zhang [47] proposed numerous solid correction
schemes to ensure zero velocity in the solid phase namely switch-off, ramped switch-off , Darcy
source term, ramped source term and variable viscosity.
3.2.2. Enthalpy-Porosity method
The enthalpy-porosity approach is the most widely used method to model phase change including the
natural convection [14]. Using enthalpy-porosity method, the liquid fraction is calculated at each
iteration. The region where the liquid fraction is between 0 and 1 is called the mushy zone. This zone
is considered as a quasi-porous medium, as the material melts the porosity increases from 0 to 1 and
decreases to zero for the solid region and therefore the velocities also vanish [55].
The energy equation can be expressed in the form:
𝜕𝜌ℎ
𝜕𝑡+ 𝜕
𝜌𝑢ℎ
𝜕𝑥+ 𝜕
𝜌𝑣ℎ
𝜕𝑦=𝜕
𝜕𝑥(𝛼𝜕ℎ
𝜕𝑥) +
𝜕
𝜕𝑦(𝛼𝜕ℎ
𝜕𝑦) − 𝑆ℎ
Eq. 1-14
where h is the sensible enthalpy, α=k/cp and Sh is the source term.
Total enthalpy:
𝐻 = ℎ + 𝛥𝐻 Eq. 1-15

Chapter 1
58
The latent heat in the enthalpy-porosity approach is accounted for by a source term in the energy
equation expressed by:
𝑆ℎ = 𝜕 (𝜌𝛥𝐻)/𝜕𝑡 + 𝜕 (𝜌𝛥𝐻)/𝜕𝑥 + 𝜕 (𝜌𝛥𝐻)/𝜕𝑦 Eq. 1-16
𝛥𝐻 = 𝑓𝑙. 𝐿 Eq. 1-17
where fl is the liquid fraction (equal to 1 for liquid state and 0 for solid state) and L is the latent heat
(J/kg).
𝜌 = 𝜌𝑙 𝑓𝑙 + (1 − 𝑓𝑙) 𝜌𝑠
𝜆 = 𝜆𝑙 𝑓𝑙 + (1 − 𝑓𝑙) 𝜆𝑠
𝑐𝑝 = 𝑐𝑝𝑙 𝑓𝑙 + (1 − 𝑓𝑙) 𝑐𝑝𝑠
Eq. 1-18
where ρ is the density (kg/m3), λ is the thermal conductivity (W/m˚C) and Cp is the specific heat
(kJ/kg˚C).
Momentum equations:
𝜕𝜌𝑢
𝜕𝑡+ 𝜕
𝜌𝑢𝑢
𝜕𝑥+ 𝜕
𝜌𝑣𝑢
𝜕𝑦= −
𝜕𝑝
𝜕𝑥+𝜕
𝜕𝑥(µ𝜕𝑢
𝜕𝑥) +
𝜕
𝜕𝑦(µ𝜕𝑢
𝜕𝑦) + 𝐴𝑢
Eq. 1-19
𝜕𝜌𝑣
𝜕𝑡+ 𝜕
𝜌𝑢𝑣
𝜕𝑥+ 𝜕
𝜌𝑣𝑣
𝜕𝑦= −
𝜕𝑝
𝜕𝑦+𝜕
𝜕𝑥(µ𝜕𝑣
𝜕𝑥) +
𝜕
𝜕𝑦(µ𝜕𝑣
𝜕𝑦) + 𝐴𝑣 + 𝑆𝑏
Eq. 1-20
𝑆𝑏 = 𝜌𝑟𝑒𝑓𝑔𝛽 (ℎ − ℎ𝑟𝑒𝑓)/𝐶𝑝 Eq. 1-21
where href and ρref are reference values of enthalpy and density respectively, β is a thermal expansion
coefficient (1/K) and Au and Av are the Darcy terms ensuring zero velocity in the solid control
volumes.
The porosity function (A) defined in momentum equations reduces velocities gradually in the solid
phase until it vanishes. A is given as:
𝐴 = −𝜂 (1 − 𝑓𝑙) 2 / (𝑓𝑙3 + 𝑏) Eq. 1-22
where b is a small number (0.001) to avoid division by zero and η is a very large number (109).
3.2.3. Enthalpy based -Lattice Boltzmann Method
Natural convection during melting of PCM can also be studied through Lattice Boltzmann Method
(LBM)[60][61][62]. The LBM offers an important alternative method for simulation of phase change
including fluid flow. the main advantages of LBM are the numerical stability, ability to set up, in
complex geometries, no-slip boundary conditions, accuracy, and the high parallel implementation of
the algorithm [63]. The enthalpy approach is used to model phase change, while lattice Boltzmann
method is used to solve fluid flow equations.
3.2.4. Enhanced conductivity approach - simplified method

Chapter 1
59
Usually in thermal engineering applications, the phase change problem is simplified, and building
models with integrated PCM ignore the convection effect in the liquid region, due to the complexity
of CFD models and the high computational time. Therefore, the convective term in the transport
equations is neglected and hence only the unsteady heat conduction term in the energy equation is
considered [64]. However, because the assumption of conduction alone is not always adequate, and
the inclusion of the convective phenomena is costly in terms of computation time when modeled
numerically using CFD methods, the buoyancy effect during the melting process was accounted using
the common effective thermal conductivity (kenh = Nu . kl ; kenh = c𝑅𝑎𝑛) [26][65][66][67][68][69].
Nevertheless, this approach has many disadvantages, mainly it cannot provide information about the
melting front location since it is essentially a conduction model, the determination of an appropriate
value of the modified conductivity function of dimensionless number is not a trivial task, a constant
value cannot be designated to the effective thermal conductivity of a fluid with varying temperature
[70] and the four regimes during melting process cannot be expressed. The average Nusselt number
is considered as a main parameter in this approach, since it defines the convection heat transfer
coefficient, and strongly affects the dynamics of the process [71]. Thus, several authors, have
presented correlations of the average Nusselt number during the melting process based on the aspect
ratio, Ra and Pr number restrictions. These correlations are based on experimental or numerical
observations. Therefore, their validity will always be restricted to the specific range, geometry
configurations, thermal boundary conditions and variables the studies were performed for [71]. It is
worthy also to mention that the choice of the characteristic length in the Ra and Nu formulas is very
critical. Either the height of the enclosure (H) or the average thickness of the liquid zone (sav) could
be used as the characteristic length scale [40]. Moreover, Webb and Viskanta [72] concluded that
caution is advised when using correlations in the literature for design purposes or as quantitative
comparisons with independent investigators, and that the proper characteristic length in
melting/solidification problems needs more research attention.
3.3.Literature review on melting with natural convection in enclosures
Conduction and convection-dominated melting along a heated isothermal wall in a rectangular or
square enclosure has received great attention due to its wide-ranging technological and engineering
applications in such fields as casting, metallurgy and thermal energy storage. This phenomenon was
investigated using both experimental and numerical/theoretical approaches. Even though the
experimental studies show more accurately the real behavior of PCM, researchers prefer to study the
phase change problems by mathematical solutions and numerical simulations due to the fact that that
numerous conditions can be carried out by changing the variables in a numerical model [18].

Chapter 1
60
Beckermann and Viskanta [73] investigated experimentally and numerically the melting of a pure
metal (gallium) inside a vertical rectangular enclosure, with natural convection heat transfer in the
liquid region and conduction in the solid one. The numerical results were validated through
comparisons with a number of experiments. It was found that the melting process consisted of four
regimes: a conduction-dominated regime, a mixed conduction-convection regime characterized by
convection in the upper part of the enclosure and conduction in the lower part, a convection-
dominated regime, and a regime where melting process is extremely influenced by heat extraction by
cold wall (the melting process approached to the steady-state condition). It was also concluded that
additional research is needed to arrive at general correlations for the dependence of the average
Nusselt numbers on the governing dimensionless parameters (Ra and Pr). Brent et al. [74] also
conducted a numerical investigation of the melting of pure gallium in a rectangular cavity, the
temperature at the left wall was maintained at 38⁰C while the right wall boundary was at an initial
temperature of 28.3⁰C, and the other walls at the top and the bottom were adiabatic. They modeled
combined convection-diffusion phase change using the enthalpy-porosity approach. The results
showed an excellent agreement between the numerical predictions and experimental findings
available in literature. They also indicated different features of the enthalpy-porosity method such as,
convergence speed, applicability and the ability to predict accurately the position of the melting front
at different times.
Wang et al. [75] investigated experimentally the thermal characteristics of the melting process in a
rectangular enclosure heated from a vertical wall using a flat plate heat pipe to provide a uniform
temperature. Based on the experimental results, they developed correlations for the melted volume
fraction and the time-averaged Nusselt number as a function of different parametric dimensionless
variables (Ra, Ste, Pr and Fo). The results showed that during the melting procedure the temporal
variation of the Nusselt number reflects the existence of three different regimes: conduction regime,
transition regime (mixed conduction-convection), and convection-dominated regime. Gong et al. [76]
studied numerically the melting of a phase change material in a rectangular cavity with an
isothermally-heated vertical wall. The enthalpy-porosity approach was used to model the evolution
of the flow at the solid/liquid interface. They found that inverting the container at an appropriate stage
during the melting process is an effective way to enhance the effect of natural convection.
Younsi et al. [77] investigated numerically the thermal characteristics of the melting process of
hydrated salt in a rectangular enclosure heated from a vertical wall, using an enthalpy-based
mathematical model. The finite volume method (FVM) was used to solve the governing equations.
The convection dominated melting in a rectangular cavity was also investigated numerically using
the commercial code FLUENT 6. It was shown an excellent agreement between the numerical

Chapter 1
61
methods (2D FVM and FLUENT code) and the experimental results. Wang et al. [46] developed a
comprehensive model based on the finite volume method and temperature transforming model for
solving the problem of 2D melting with natural convection in a square cavity for four different cases.
The consistent update technique (CUT) algorithm was used to solve the velocity–pressure coupling.
The results showed that the used algorithm is much more efficient, in terms of CPU time, than the
SIMPLE algorithm for solving melting problems. Besides, a new solid velocity correction scheme
that does not introduce large numbers to vanish velocity in the solid was used. This scheme eliminated
effectively the inconsistencies found in earlier studies and was able to accelerate the convergence
significantly. The results showed a reasonable agreement between the numerical model compared to
previous theoretical and experimental results.
Murray and Groulx [78] modeled natural convection during melting of Octadecane in a square
enclosure using the COMSOL Multiphysics package (versions 4.0a and 4.1). The left vertical wall
was heated to a temperature of 313 K, while the right wall was maintained at initial temperature Tm
of 303 K. The influence of the temperature range ΔT was established in the simulation. In addition,
the authors discussed the impact of the numerical definition of viscosity on the onset and strength of
natural convection, and the resulting melting front position. The results showed that the variation in
PCM properties such as thermal conductivity and viscosity affects the shape of the melting interface
and the amount of melted PCM. Finally, it was pointed to the importance of accounting for natural
convection during melting in a PCM.
Yanxia et al. [79] investigated experimentally the melting process of ethanolamine–water binary
mixture used as PCM in a rectangular enclosure heated from its vertical side. They studied the effect
of natural convection in terms of liquid fraction and the position of the melting front. Moreover,
empirical correlations of time-averaged Nusselt number and liquid fraction were developed in
convection-dominated melting regime. The results showed that pure conduction regime only occurs
at the early stage of the melting process and that natural convection improves the rate of melting
compared with the pure conduction model. Finally, a conduction– convection model is essential for
predicting melting process accurately.
Ho and Viskanta [80] investigated experimentally the melting of n-octadecane from an isothermal
vertical wall of a rectangular cavity. Initially, the PCM was solid with a uniform temperature that was
either preselected amount below or very close to the melting temperature. Heat transfer coefficients
at the heat source surface and the solid-liquid interface were recorded photographically. The
experimental results showed that the rates of heat transfer and melting were significantly influenced
by the buoyancy driven convection in the liquid region, except in the earlier stage of the melting
process.

Chapter 1
62
Yao and Cherney [81] studied the effect of the natural convection on the melting of a solid PCM
around a hot horizontal cylinder by using the integral method. The results demonstrated that the
integral solution had surprising accuracy when it was compared with the quasi-steady solution when
Stefan number was small. Rieger et al.[82] investigated numerically the melting process of a PCM
inside a heated horizontal circular cylinder. Both heat conduction and convection have been taken
into account to treat this moving boundary problem, and the complex structure of the timewise
changing physical domain (melt region) have been successfully overcome by applying body fitted
coordinate technique. Ismail and Silva [83] developed a 2D mathematical model to study the melting
of a PCM around a horizontal circular cylinder considering the presence of the natural convection in
the melt region. A coordinate transformation technique was used to fix the
moving front. The numerical predictions were compared with available results to establish the validity
of the model, and a satisfactory agreement was found. They concluded that the numerical model was
adequate to represent the physical situation of the proposed system. Furzerland [84] investigated the
enthalpy method and the coordinate transformation method through the comparison of the solutions
of specific problems of one dimensional heat transfer by considering pure convection. One of his
conclusions was that the enthalpy method is very attractive owing to these: it is easy to program and
there are no computational overheads associated with tracking the moving interface within a specific
range of fusion temperatures.
Concerning the computational time, it can be quite large, depending on the used method, the
simulated problem and the spatial and temporal discretization [85]. The melting of Tin, filled in a
square enclosure of height 0.1m, in presence of natural convection has been studied by different
authors [85] [86] [87]. The computational time for the melting of Tin was found 450 hours for a total
simulation time of 700 seconds with a mesh size of 400 × 400 in [86]; the simulations were conducted
using a Compaq Alpha ES40 machine. While the computational time using the LBM in [85], for a
simulation time of 1000 seconds is found 76 hours with a mesh size of 400 × 400, the simulations
were conducted using an Intel Xeon X5472. Moreover, Hannoun et al. [87] reported 2400 hours of
CPU to simulate 2500 seconds of the melting of Tin with a mesh size of 200 × 200, using Compaq
Alpha ev67 machine. In addition, the simulation of 5000 seconds of the melting of Octadecane, filled
in square enclosure of height 0.1m, with natural convection took 34 hours with a mesh size of 225 ×
225 [85].
4. Literature review of phase change with radiation
Transparent envelope components are key elements in buildings, especially in offices and commercial
buildings, that affect the energy performance and daylighting [88]–[90].

Chapter 1
63
To accomplish its energy storage function, and at the same time to allow the transmission of light into
the indoor environment, some researchers [13] [91] [16] have been interested in transparent PCM.
The integration of PCM in a transparent element of the building envelope enhances the ability for
energy storage, since the PCM will be directly exposed to the solar radiation. This technology aims
to smooth the indoor temperature and decrease the energy fluctuations, providing daylighting at the
same time.
Numerous experimental and numerical work of heat storage solutions for transparent envelope
containing PCM have been developed, especially for double glazed unit, which has been attracted
much more attention as a valid method for reducing building energy consumption. Phase change
materials were integrated within double [92] [93] or triple glazing units [94], within more complex
glazing components [95] and within translucent solar walls [13]. The performance of glazing with
integrated PCM was investigated both experimentally [92]–[94], [96], [97] and numerically [98]–
[100]. A literature review of the use of PCM in transparent and translucent building envelope
components can be found in [101].
Buddhi and Sharma [91], measured the transmittance of stearic acid, transparent PCM, as a function
of temperature and thickness. At 60 ⁰C (melting temperature Tm = 64.6⁰C) they found an average
transmittance of 99% for a thickness of 1 cm, and 81% for a thickness of 5 cm.
Manz et al. [13] studied a translucent wall for solar heating and daylighting composed of glass pan,
air gap, a translucent PCM and a transparent insulation material (TIM). They investigated
experimentally the optical PCM properties and a prototype of the TIM-PCM wall was constructed in
1994 in Swiss. Also, a one-dimensional numerical model (side effects were neglected) was developed
considering only heat transfer by conduction and the optical properties were simulated using a Monte
Carlo technique. The results show that the thermal and optical performance of the wall is very
promising and that the chosen PCM in solid state reduces the heat and light gains. Thus, they proposed
considering another PCM with a melting temperature of 21⁰C instead of 26.5⁰C. Weinläder et al. [16]
investigated experimentally the thermal behavior of three glazing systems incorporated with a plastic
container filled with different PCM. However, in both studies, the behavior of the system was not
investigated in detail in the hot season and inferences on thermal comfort were not evaluated
according to standards.
To improve the poor thermal inertia of conventional glazing systems, Goa et al. [12] studied the
implementation of a PCM layer in combination with glass panes. They developed a one-dimensional
numerical model for heat and shortwave wave transmission. The numerical model is divided in two
sub-models: to solve the heat transfer process and to calculate the solar irradiance transmitted and

Chapter 1
64
absorbed. The energy balance of the radiative heat fluxes for each layer (node) is solved iteratively
using the following equation:
𝑞𝑠𝑜𝑙,𝑛 = (𝐼𝑛−1→𝑛 + 𝐼𝑛+1→𝑛) − (𝐼𝑛→𝑛+1 + 𝐼𝑛→𝑛−1) Eq. 1-23
where 𝑞𝑠𝑜𝑙,𝑛 is the absorbed solar radiation in the nth layer [W/m2] and the 𝐼𝑥→𝑦 variables are the
short-wave radiative fluxes [W/m2] that enter/leave the nth layer. the first step of the calculation
procedure is aimed at assessing the component that is reflected by the layer. The second step
calculates the amount of shortwave radiation that is absorbed by the layer. The amount of shortwave
energy that is eventually transmitted by the layer is then obtained by difference between the total
impinging radiation and the reflected and absorbed parts. The enthalpy method in one dimension was
used to model phase change. The model was validated experimentally using a PCM glazing prototype
(1.4 m x 1.15 m) composed by two layers of glass (6 mm and 8 mm) and one PCM layer (paraffin,
15 mm thick with melting temperature of 35 °C). They found that the numerical tool represents a
good base for simulations on different configurations of PCM glazing systems.
Liu et al [97] investigated numerically the thermal performance of a PCM-filled double glazing roof
with different thickness of PCM in the cold area of Northeast China. They also studied the effect of
the semi-transparent property of the glazing roof and zenith angle on the thermal performance. The
heat transfer through the glazing unit is simplified to one dimensional unsteady heat transfer process
and the convection within the PCM layer (when in liquid state) is neglected. The phase change is
modeled using enthalpy formulation and the radiation is accounted for by adding a radiative source
term to the energy equation. The one-dimensional unsteady energy equation for PCM regions is given
as:
𝜌𝜕ℎ
𝜕𝜏= 𝑘
𝜕2𝑇
𝜕𝑥2+ ∅ Eq. 1-24
where, h is the specific enthalpy of PCM (J/kg). ρ and k are the density (kg/m3) and the thermal
conductivity (W/mK) of PCM, respectively. The radiative source term ∅ is calculated for each layer,
for example when the calculation node is in the phase 2 of PCM layer as shown in Figure 1-4:
∅ =𝑇𝑔1𝑇𝑝1𝐴𝑝2𝐼𝑠𝑜𝑙𝑐𝑜𝑠𝜃
𝐿𝑝2 Eq. 1-25
where, 𝐼𝑠𝑜𝑙 is the solar radiation (W/m2), 𝑇𝑔1, 𝑇𝑝1 are the solar transmittance of glass 1 layer and phase
1 layer respectively. 𝐴𝑝2 is the solar absorptance of phase 2 layer. 𝐿𝑝2 is the thickness (m) of phase
2 layer and glass 2 layer. The results showed that when the PCM thickness increases, the temperature
time lag increases. When the extinction coefficients of PCM increase, PCM thickness effect on
thermal performance parameters turns bigger except for the temperature time lag.

Chapter 1
65
Figure 1-4: layout of double glazed roof filled with PCM
Ismail et al. [15] investigated the thermal and optical properties of double-glazed units filled with
PCM, through numerical and experimental analysis. For the numerical model, a one-dimensional
formulation was developed, and a moving grid procedure was used within the PCM layer. They found
that the PCM filled glass window system was practical and thermally effective.
Ismail et al. [14] developed a numerical model of two concepts of glass windows, that is, double glass
window filled with infrared absorbing gases and the other one is filled with phase change materials.
For the PCM glass system, the concept is as follow: the external glass receives the solar radiation,
where part of it is absorbed, another part is reflected, and the rest is transmitted to the PCM, which
absorbs part of the energy received. At the interface between the external glass sheet and PCM, the
radiation absorbed by the PCM and the heat conducted by the glass surface raise the PCM temperature
until reaching its fusion temperature and converts a layer of the PCM to a liquid. To model the double
glass window filled with a PCM a relative simple and effective radiation conduction one dimensional
formulation is used and convection in the liquid phase of the PCM is neglected. The double glass
window filled with an absorbing gas mixture and using reflective glass is more efficient and has a
coefficient of heat gain F factor, in the range of 0.55–0.65. The double glass window filled with PCM
has F factor in the range of 0.65–0.80.
Diaz and Viskanta [102] studied the melting process using one-dimensional radiation and conduction
model. They solved the energy equation with the temperature formulation, and Stefan's condition at
the interface. For this case of conduction and radiation, this formulation has the advantage of allowing
the explicit introduction of the radiative flux at the interface.
Zhong et al. [99] established a numerical model and an experimental setup in order to determine the
effects of PCM thermophysical parameters on the dynamic heat transfer progress of PCM-filled glass

Chapter 1
66
window (PCMW). The heat transfer process of the PCMW is shown in Figure 1-5. The heat transfer
through the window is simplified to one-dimensional unsteady heat transfer process in double-glazed
window and the convective process is neglected in the PCM. Results showed that when PCM
(paraffin MG29) is used, the thermal insulation of PCMW and peak cooling load shifting effects were
remarkable in the hot summer and cold winter area of China, and the heat entered the building through
the PCMW is reduced by 18.3% in the typical sunny summer day.
Figure 1-5: Heat transfer process of the PCM-filled glass window (PCMW)
Although the inclusion of PCM in glazing systems can have a positive effect on thermal comfort and
contributes to improvements in the energy performance of buildings [96], the introduction of PCM,
instead of gas or vacuum, in a double-glazing unit, results in a reduced thermal resistance, negatively
affecting the thermal performance of the system. In addition, due to the complete melting of the PCM
within the double-glazing unit during summer, the internal surface temperature of the glazing may
increase to a level that may negatively affect thermal comfort [96].
Additionally, we present in Table 1-1 five common radiation models to solve the RTE found in the
literature. In fact, within the medium, radiative heat transfer is described by the general radiative heat
transfer equation (RTE) [103] that accounts for the variation of the intensity radiation field, and it is
usually divided into three additive terms: absorption, emission and scattering.
Table 1-1 Common radiation models to solve the radiative heat transfer equation (RTE)
Radiation model Advantages Limitations
Discrete ordinates model
(DOM)
– Solution method similar to that for the
other conservation equations.
– Conservative method leads to heat balance
for coarse discretization.
Solving a problem with a large
number of ordinates is CPU-
intensive

Chapter 1
67
– Accuracy can be increased by using a finer
discretization.
– Accounts for scattering, semi-transparent
media, specular surfaces.
– Banded-gray option for wavelength-
dependent transmission.
Discrete transfer
radiation model (DTRM)
– Relatively simple model.
– Can increase accuracy by increasing
number of rays.
– Applies to wide range of optical
thicknesses.
– Assumes all surfaces are
diffuse (isotropic reflection).
– Effect of scattering not
included.
– Solving a problem with a
large number of rays is CPU-
intensive.
P-1 model
– Radiative transfer equation easy to solve
with little CPU demand.
– Works reasonably well for combustion
applications where optical thickness is large.
– Easily applied to complicated geometries
with curvilinear coordinates.
– Effects of particles, droplets, and soot can
be included.
– Assumes all surfaces are
diffuse.
– May result in loss of
accuracy, depending on
complexity of geometry, if
optical thickness is small.
– Tends to overpredict radiative
fluxes from localized heat
sources or sinks.
Rosseland model Does not require any boundary conditions
since surfaces are treated as black
(Emissivity = 1.0)
–Only valid for optically thick
and linearly anisotropic
material (thickness/depth
greater than 10)
–Not valid near walls
The Monte Carlo Model
– Very general-purpose method - allows you
to do gray/non-gray, scattering, emission and
absorption
– It is the recommended choice for a
transparent media radiation calculation
– Computationally intensive:
Samples and ray traces the
domain every solution step.
– always contains statistical
error 1/N
5. Trombe wall with integrated PCM
Trombe wall integrating phase change materials (PCM) is a particular passive solar technique that
has shown great potentialities and can reduce effectively the building energy consumption. Basically,
traditional Trombe walls [104]–[108] consist of an external glazing, an air channel, and a high heat
capacitance wall in contact with the indoor environment (Figure 1-6) . The solar radiation heats the
air channel between the glazing and the wall and the heat is absorbed by the outer surface of the wall.
Then, the heat is transmitted inwards, by conduction within the wall, by convection and by radiation
towards the room. This type of walls can reduce the energy bill by 20 to 30% virtually in all climates
especially when the air gap is vented [107].
Among disadvantages often cited for Trombe wall, are the cost, the delicate design and operation for
the air gap and vents, the absence of light transmission through the wall, the problem of overheating
in summer and the large thermal losses in winter when there is little sunshine. To improve the Trombe
wall heat storage performance, phase change materials were implemented in the wall composition
and this technique has been investigated by numerous researchers [109]–[114]. During the day, this
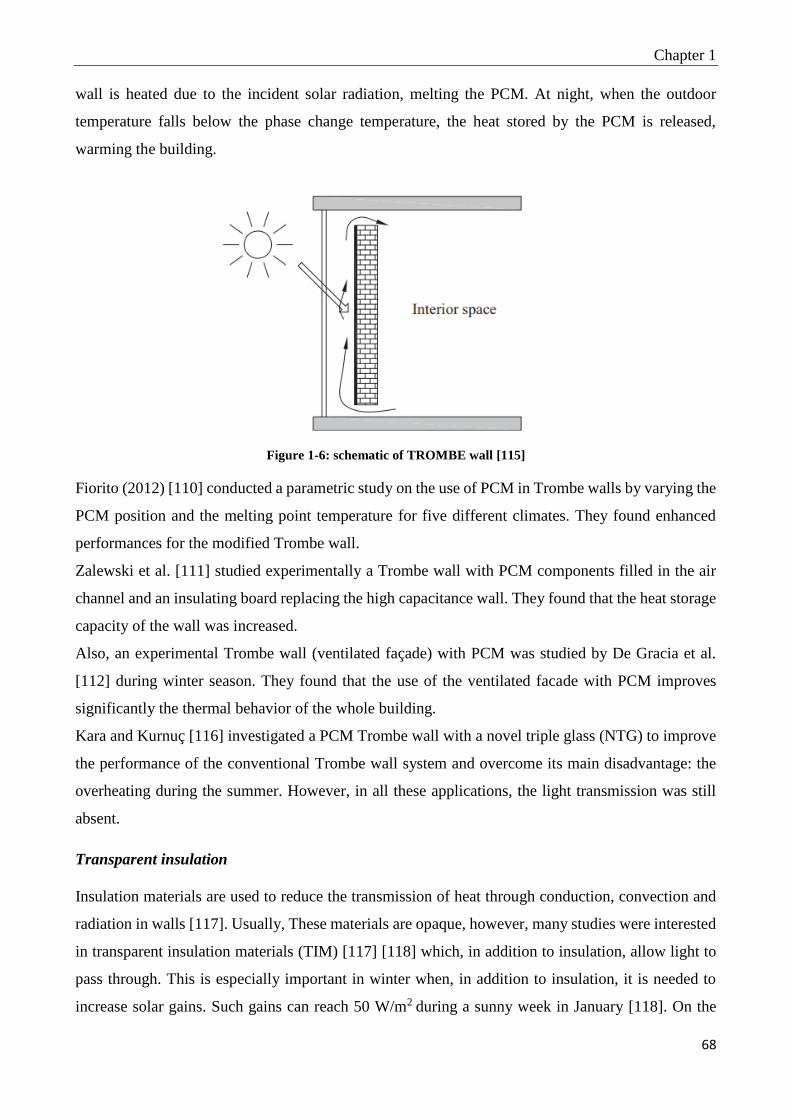
Chapter 1
68
wall is heated due to the incident solar radiation, melting the PCM. At night, when the outdoor
temperature falls below the phase change temperature, the heat stored by the PCM is released,
warming the building.
Figure 1-6: schematic of TROMBE wall [115]
Fiorito (2012) [110] conducted a parametric study on the use of PCM in Trombe walls by varying the
PCM position and the melting point temperature for five different climates. They found enhanced
performances for the modified Trombe wall.
Zalewski et al. [111] studied experimentally a Trombe wall with PCM components filled in the air
channel and an insulating board replacing the high capacitance wall. They found that the heat storage
capacity of the wall was increased.
Also, an experimental Trombe wall (ventilated façade) with PCM was studied by De Gracia et al.
[112] during winter season. They found that the use of the ventilated facade with PCM improves
significantly the thermal behavior of the whole building.
Kara and Kurnuç [116] investigated a PCM Trombe wall with a novel triple glass (NTG) to improve
the performance of the conventional Trombe wall system and overcome its main disadvantage: the
overheating during the summer. However, in all these applications, the light transmission was still
absent.
Transparent insulation
Insulation materials are used to reduce the transmission of heat through conduction, convection and
radiation in walls [117]. Usually, These materials are opaque, however, many studies were interested
in transparent insulation materials (TIM) [117] [118] which, in addition to insulation, allow light to
pass through. This is especially important in winter when, in addition to insulation, it is needed to
increase solar gains. Such gains can reach 50 W/m2 during a sunny week in January [118]. On the

Chapter 1
69
other hand, these gains may become a problem during the summer, causing overheating. TIM are
classified into four different types in accordance with the geometrical layout of the materials. Each
type has a unique pattern of solar transmission and physical behavior as illustrated in Figure 1-7,
where the bold line represents the absorbing surface (a wall with PCM for example): Absorber-
parallel structures (Figure 1-7,a) are constructed from several layers parallel to the absorber surface.
The degree of insulation can be increased, by adding more layers, resulting in an increase in optical
reflection and solar gain reduction. Such systems do not meet the criteria of high transmission and
low heat loss. Absorber-perpendicular structures (Figure 1-7,b) have low optical reflection losses and
reflect and transmit the incoming beam radiation effectively towards the absorber. The cavity
structures (Figure 1-7,c) are combination of both absorber-parallel and absorber-perpendicular
structures. Finally, quasi-homogeneous structures (Figure 1-7,d) that include TIM made of glass fiber
or aerogel, are similar to porous materials. Here, the incident rays pass through the TIM, always
undergoing multiple reflections at the surfaces of the pores and the effect is then the diffusion of the
radiation.
Figure 1-7: Classification of transparent insulation materials [118]
For decades, a number of investigations have been carried out to improve the properties of transparent
insulations. A great deal of research work has been done to improve the honeycomb structures used
as transparent insulation material (TIM). The application of these improved TIM on external walls as
a passive solar heating element similar to the Trombe wall was proposed and experimentally
investigated by Goetzberger et al.[119]. In addition, over the past 30 years, different types of
materials, such as plastics, glass, and aerogels, have been used to produce TIM [118].
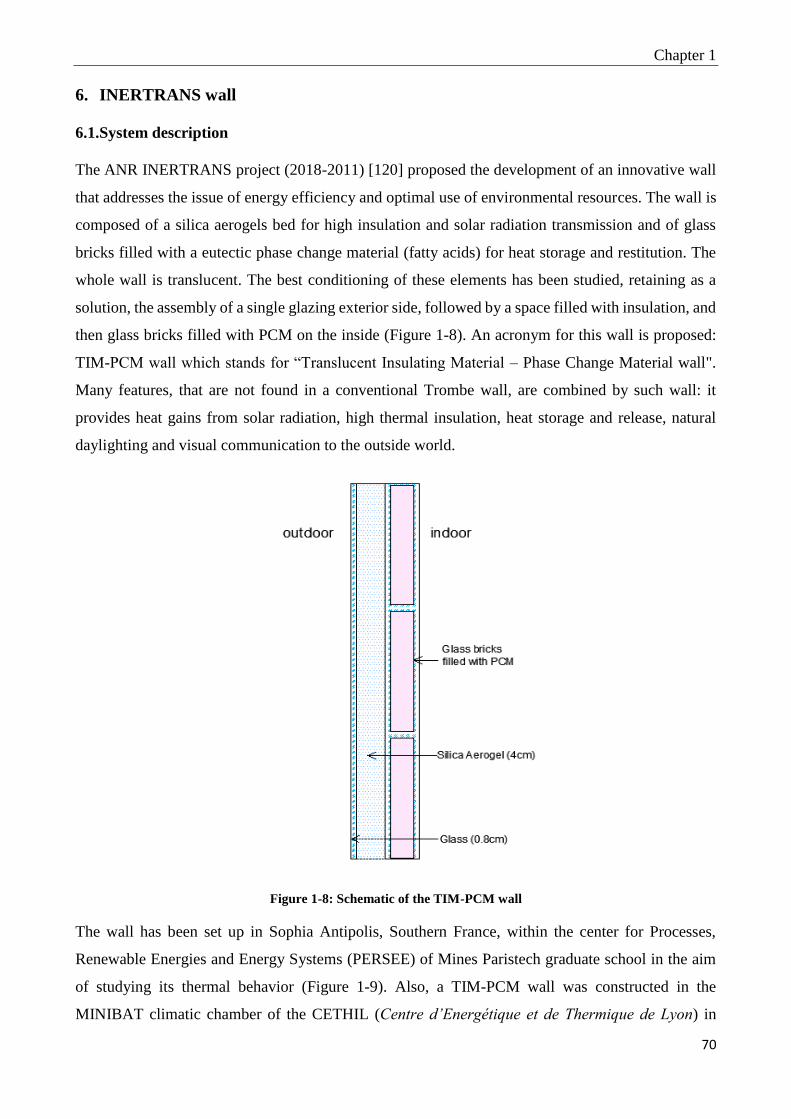
Chapter 1
70
6. INERTRANS wall
6.1.System description
The ANR INERTRANS project (2018-2011) [120] proposed the development of an innovative wall
that addresses the issue of energy efficiency and optimal use of environmental resources. The wall is
composed of a silica aerogels bed for high insulation and solar radiation transmission and of glass
bricks filled with a eutectic phase change material (fatty acids) for heat storage and restitution. The
whole wall is translucent. The best conditioning of these elements has been studied, retaining as a
solution, the assembly of a single glazing exterior side, followed by a space filled with insulation, and
then glass bricks filled with PCM on the inside (Figure 1-8). An acronym for this wall is proposed:
TIM-PCM wall which stands for “Translucent Insulating Material – Phase Change Material wall".
Many features, that are not found in a conventional Trombe wall, are combined by such wall: it
provides heat gains from solar radiation, high thermal insulation, heat storage and release, natural
daylighting and visual communication to the outside world.
Figure 1-8: Schematic of the TIM-PCM wall
The wall has been set up in Sophia Antipolis, Southern France, within the center for Processes,
Renewable Energies and Energy Systems (PERSEE) of Mines Paristech graduate school in the aim
of studying its thermal behavior (Figure 1-9). Also, a TIM-PCM wall was constructed in the
MINIBAT climatic chamber of the CETHIL (Centre d’Energétique et de Thermique de Lyon) in

Chapter 1
71
Lyon, with the aim of determining the behavior of the wall for imposed and repeatable climate
scenarios (Figure 1-10).
Figure 1-9: (a) TIM-PCM wall from the outside, (b) PCM in solid phase (left) and liquid phase (right), from the
inside (PERSEE center in Sophia Antipolis)
Figure 1-10: Interior and exterior photo of the TIM-PCM wall of CETHIL
6.2.Physical phenomena
The thermal study of the wall requires the knowledge of the different heat transfer mechanisms that
take place, especially the melting of fatty acids filled in glass bricks with combined natural convection
and radiation. The natural convection is developed in the liquid PCM and could dramatically impact
the heat transfer. The evolution of the melting process in presence of natural convection is explained
in section 3.1.
In addition, during the day, the solid PCM absorbs the solar radiation, thus increasing its temperature
until the melting, and at that moment, a small layer of liquid begins to form and the liquid PCM
transmits solar radiation. Thus, the radiation through the PCM must be coupled to the natural
convection phenomena during melting process. Noting that the TIM-PCM wall is supposed to be
opaque for the longwave radiation due to the presence of the silica aerogel layer.

Chapter 1
72
6.3.Previous works related to the INERTRANS project
Some studies have already been conducted within the framework of the INERTRANS project.
The TIM-PCM wall was studied experimentally by Berthou et al [121] in-situ, under real life
conditions, in the full-sized test cell located in Sophia Antipolis in PERSEE center (Figure 1-11).
Besides, experimentations were carried out at the French Scientific and Technical Center for Building
research (CSTB) to characterize thermal and optical properties of the materials used. The outer (TIM)
layer is composed of a 0.8 cm large glass pane while the inner layer is composed of glass bricks of
dimension 19 cm x19 cm x 5 cm filled with PCM. There is a 4-cm gap between the outer and inner
layer, which is filled with silica aerogel granulates. The test room is equipped with 4.41 m2 of TIM–
PCM wall facing south.
Figure 1-11: Schematic presentation of the full-scale test cell
Experimental results obtained by Berthou et al. [69] have shown that the heat losses through the wall
are very low while the heat and light gains are high. In addition, it was shown that the tested wall is
very effective in winter and shoulder season, particularly for cold sunny climates (the recorded indoor
air temperature varied from 17 to 20 ⁰C), but when the solar radiation is very low, the wall does not
bring any additional heat. In summer, the PCM does not cycle and stays in liquid state, causing
overheating, the indoor air temperature in the test cell reaching up to 40⁰C (Figure 1-12).

Chapter 1
73
Figure 1-12: Solar radiation and air temperatures for three days in December2009 and August 2011
Numerically, Berthou developed a 1D numerical model considering natural convection and short-
wave radiation during melting of PCM. He assumed that the wall is opaque for longwave radiation.
The radiation was modeled using the equation of Beer-Lambert, this relation defines in a simple way
the evolution of the radiative short-wave flow in the semitransparent medium and it is given as:
∅(𝑥) = 𝑘∅0𝑒−𝑘𝑥 Eq. 1-26
where ∅(𝑥) is shortwave wave radiation entering the vertical PCM layer of abscissa x and k is the
linear attenuation coefficient of the medium.
The natural convection was accounted for using dimensionless numbers and thermal transfers in the
liquid PCM were calculated by Newton's law:
∅𝑐𝑜𝑛𝑣 = ℎ(𝑇)𝑆(𝑇𝑓 − 𝑇𝑠) Eq. 1-27
where 𝑇𝑓 is the melting temperature, 𝑇𝑠 is the surface temperature and the convective coefficient h(T)
is given by:
ℎ(𝑇) =𝜆𝑁𝑢
𝐿𝑐
Eq. 1-28
where Lc is the characteristic length of the phase change, λ is the PCM conductivity and Nu is the
Nusselt number given by the following correlation:
𝑁𝑢 = 0.35𝑅𝑎0.25 Eq. 1-29
where Ra is the Rayleigh number.
In this work, the model has not been reasonably experimentally validated. In Figure 1-13, the yellow
and the red curves represent respectively the internal surface temperature of the wall for the model
with and without natural convection respectively. The results of the model without natural convection
are found closer to the experimental results as in the square 1. Moreover, during the melting, there is
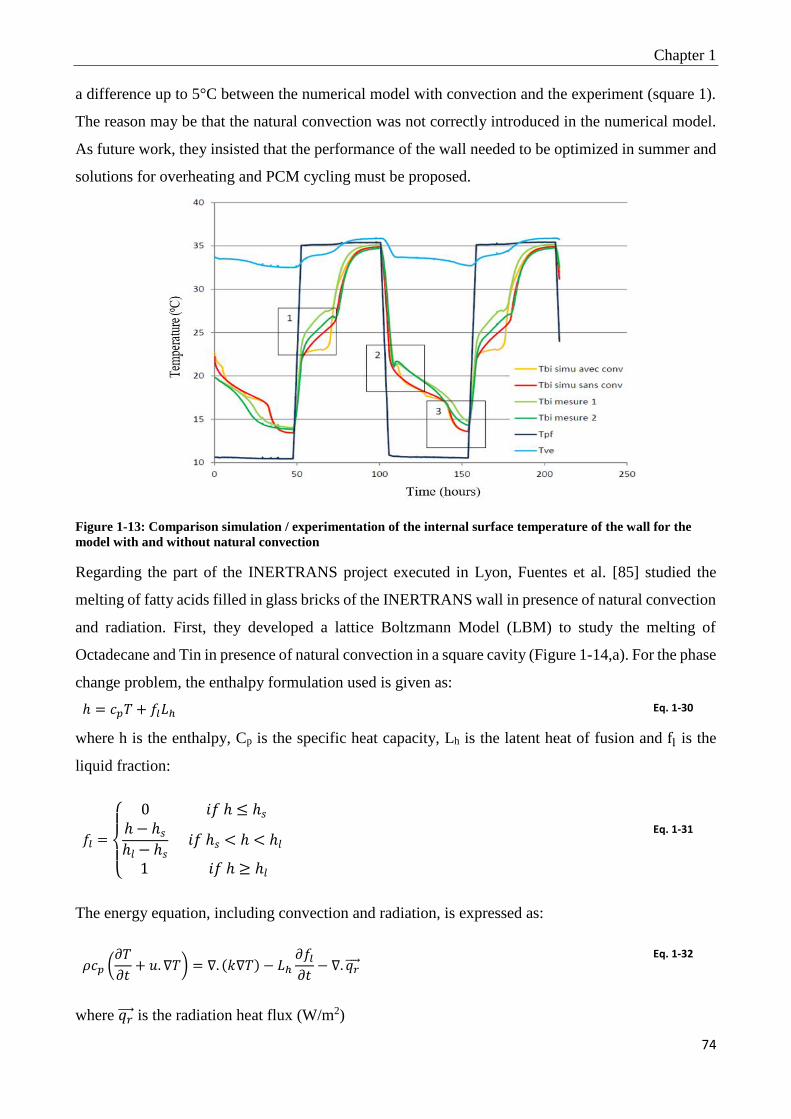
Chapter 1
74
a difference up to 5°C between the numerical model with convection and the experiment (square 1).
The reason may be that the natural convection was not correctly introduced in the numerical model.
As future work, they insisted that the performance of the wall needed to be optimized in summer and
solutions for overheating and PCM cycling must be proposed.
Figure 1-13: Comparison simulation / experimentation of the internal surface temperature of the wall for the
model with and without natural convection
Regarding the part of the INERTRANS project executed in Lyon, Fuentes et al. [85] studied the
melting of fatty acids filled in glass bricks of the INERTRANS wall in presence of natural convection
and radiation. First, they developed a lattice Boltzmann Model (LBM) to study the melting of
Octadecane and Tin in presence of natural convection in a square cavity (Figure 1-14,a). For the phase
change problem, the enthalpy formulation used is given as:
ℎ = 𝑐𝑝𝑇 + 𝑓𝑙𝐿ℎ Eq. 1-30
where h is the enthalpy, Cp is the specific heat capacity, Lh is the latent heat of fusion and fl is the
liquid fraction:
𝑓𝑙 =
{
0 𝑖𝑓 ℎ ≤ ℎ𝑠ℎ − ℎ𝑠ℎ𝑙 − ℎ𝑠
𝑖𝑓 ℎ𝑠 < ℎ < ℎ𝑙
1 𝑖𝑓 ℎ ≥ ℎ𝑙
Eq. 1-31
The energy equation, including convection and radiation, is expressed as:
𝜌𝑐𝑝 (𝜕𝑇
𝜕𝑡+ 𝑢. ∇𝑇) = ∇. (𝑘∇𝑇) − 𝐿ℎ
𝜕𝑓𝑙𝜕𝑡− ∇. 𝑞𝑟
Eq. 1-32
where 𝑞𝑟 is the radiation heat flux (W/m2)

Chapter 1
75
The energy equation is solved by finite differences, whereas fluid flow equations are solved by the
lattice Boltzmann method. The LBM equation is expressed by:
𝑓𝑖(𝑥 + 𝑐𝑖, , 𝑡 + 1) − 𝑓𝑖(𝑥 , 𝑡) = 𝛺𝑖 Eq. 1-33
where 𝑓𝑖 is the particle distribution function, which is the probability of finding a particle in position
x, time t and velocity ci (i =0, ….. , q - 1), and 𝛺𝑖 is the collision operator, giving the relaxation
towards an equilibrium state.
The developed LBM was validated using numerical Benchmark solutions found in the literature.
Later, they modeled the radiation using the Discrete Ordinates Method (DOM), and radiation flux is
added into the energy equation. The Discrete Ordinate Method (DOM) is then used to solve
numerically the angular integrals leading to a weighted sum:
𝑞𝑟 = ∫ 𝐼(𝑟 ,4𝜋
��)��𝑑𝜴 ≈ ∑ 𝑰𝒎𝑷��𝑤𝑚
𝑴
𝒎=𝟏
Eq. 1-34
𝑇(𝑟 , ��) standing for the radiation intensity in the direction ��.
The combined LBM-DOM model was used to study the melting of fatty acids filled in glass bricks
of the INERTRANS wall in presence of both natural convection and radiation for a total simulation
time of 24 minutes (Figure 1-14, b). Figure 1-14 shows the geometry and boundary conditions for the
studied cases: (a) melting of octadecane (high Prandtl) and Tin (low Prandtl) in presence of natural
convection in square cavity and (b) melting of fatty acids in presence of natural convection and
radiation in a rectangular brick.
The results showed that natural convection plays an important role in the transitional behavior of the
global heat transfer process and should not be neglected. The long wave radiation has limited impact
on the melting process while the shortwave radiation increases heat transfer, however, this increase
is not as important as that produced by convection for this kind of materials. Figure 1-15 shows that
natural convection doubles the liquid fraction present in the enclosure whereas long wave radiation
has marginal effects (<3%). In addition the consideration of shortwave radiation enhances the liquid
fraction by 10% compared to the convection model.
Concerning the computational time, it was found 6 hours 21 minutes for LBM model, and 130 hours
20 minutes for the LBM-DOM model (20 times larger considering radiation). Finally, they stated that
computional times are very high and simpler model for radiation should be used.

Chapter 1
76
Figure 1-14: Thermal boundary conditions on the cavity for each case [63]
Figure 1-15: Melted fraction of the case of melting with convection and (a) long wave radiation, and (b)
shortwave radiation
In the same context, another work was performed by Gong et al. [122]. They studied the melting of
PCM (n-Octadecane) inside the rectangular transparent brick by both experimental and numerical
approaches. This transparent brick, shown in Figure 1-16,a, was the same used to construct the TIM-
PCM Trombe wall at the CETHIL’s MINIBAT test cell. A non-intrusive experimental method was
proposed (Figure 1-16, b). The two vertical surfaces of the enclosure were maintained with different
but constant temperatures, the upper and front sides were kept available to record the inner process
by a camera, and the bottom and back sides were insulated and kept adiabatic.
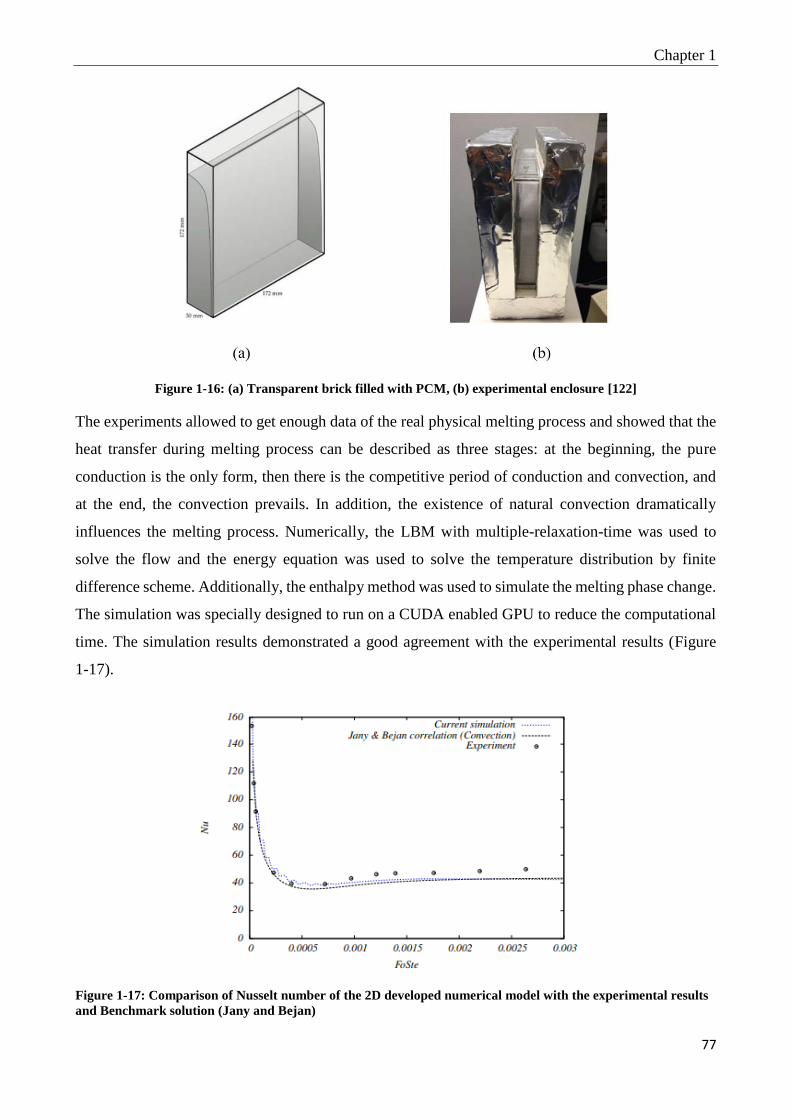
Chapter 1
77
Figure 1-16: (a) Transparent brick filled with PCM, (b) experimental enclosure [122]
The experiments allowed to get enough data of the real physical melting process and showed that the
heat transfer during melting process can be described as three stages: at the beginning, the pure
conduction is the only form, then there is the competitive period of conduction and convection, and
at the end, the convection prevails. In addition, the existence of natural convection dramatically
influences the melting process. Numerically, the LBM with multiple-relaxation-time was used to
solve the flow and the energy equation was used to solve the temperature distribution by finite
difference scheme. Additionally, the enthalpy method was used to simulate the melting phase change.
The simulation was specially designed to run on a CUDA enabled GPU to reduce the computational
time. The simulation results demonstrated a good agreement with the experimental results (Figure
1-17).
Figure 1-17: Comparison of Nusselt number of the 2D developed numerical model with the experimental results
and Benchmark solution (Jany and Bejan)

Chapter 1
78
However, for the computation efficiency, if was found that the performance decreases in three-
dimensional simulation, and the CUDA programming pattern can’t achieve ideal performance if there
are many code divergences. Consequently, in the future, a more sophisticated approach should be
devised in order to do this logic judgements in the code and to modify the solver to adapt to different
or even more complex enclosures.
7. Discussion: Main limitations and thesis problematic and objectives
According to sections 2 and 3, we can state the following:
• Despite its importance, the effect of natural convection during melting process has been
neglected in many studies. However, it is not sufficient to assume only conduction, and
convection in the liquid phase should be taken into account.
• Convection heat transfer is less important than conduction during solidification process.
• The methods based on CFD, introducing Navier Stokes equations, and LBM models simulate
the natural convection effect with more complexity and more realistic behavior. But these
methods are time consuming and might require intensive computational power, even for a
simple convection dominated phase change problem.
• The widely used enhanced conductivity approach, is fast and simple, however it has several
shortages especially that it is unable to show the characteristics of phase change and cannot
provide information about the melting front location. In addition, it is not recommended for
high accuracy results.
• All numerical models for melting with natural convection collected have their own limitations,
as the practical phase transformations in different applications are complicated, and the
thermal conditions are not ideal. Various assumptions were set up for each numerical solution
according to different numerical simulation purposes [18].
• The melting process consists mainly of three regimes: conduction-dominated regime, mixed
conduction-convection regime and convection-dominated regime. These regimes are reflected
by the average Nusselt number curve function of time. However, no consensuses were found
on which one is the dominant heat transfer mechanism, which one can be ignored and how to
combine these two transfer mechanisms in each modeling.
• The average Nusselt number is a key parameter in the convection dominated problem. To
date, many correlations that have been developed in the literature are only suitable for a
specific geometry and/or PCM.
According to section 4, we can state the follow:

Chapter 1
79
• The integration of PCM in translucent facades increases the indoor thermal comfort of the
building and consequently of occupant’s satisfaction. It reduces the maximum indoor air
temperature and increases the minimum indoor air temperature. It also increases the time lag
between the imposed conditions and the internal conditions.
• Most previous works studying PCM-enhanced transparent components have been mainly
developed for the heating season, and there is little quantification of their real advantages in
terms of energy efficiency and indoor environmental comfort in summer season.
• Most studies on translucent facades have assumed one-dimensional transfers by conduction
and radiation neglecting convection [98]–[100] and numerical models were specifically
developed to take the interaction of PCM with solar radiation into account [12], [15], [123],
[124].
• The interaction of convection and radiation has rarely been studied in the literature.
• In such walls as the INERTRANS wall, solidification is more likely to happen at night, in
absence of solar radiation. Thus, the convection and radiation heat transfers are more
important during melting process.
According to section 6, we can state the follow:
• The experimentations performed by Berthou et al. [121] showed that the performance of the
TIM-PCM wall should be optimized, and solutions to overcome summer overheating and
PCM cycling should be proposed. In their work, they were not able to properly present an
experimentally validated numerical model to study the annual energy performance of the
whole building, the reason is probably that the natural convection was not properly considered
in the model. And thus, the question of an experimentally validated numerical model allowing
the optimization of such a wall under different conditions is still open.
• Fuentes et al. [85] developed a LBM-DOM model to study the melting of fatty acids filled in
glass bricks in presence of natural convection and radiation. The coupling of these phenomena
was still not sufficiently studied in scientific literature. They emphasized on the importance
of considering natural convection in the liquid PCM filled in glass bricks. However, the
developed model requires a high computational time for a relatively small simulation time.
Thus, it can’t be used for yearly energy evaluation. Simpler model for radiation and natural
convection during melting is still an open question.
• Gong et al. [122] focused in their work on the important issue of the melting process inside
the brick. The radiation in the brick was not taken into account and the developed sophisticate
model was not shown to be linkeable to energy simulation tool such as TRNSYS or Energy
Plus for annual basis assessment.

Chapter 1
80
Consequently, a lot of work needs to be done in the context of INERTRANS project, and principally
the establishment of a numerical model that can represent the physics of the TIM-PCM wall,
considering natural convection and radiation during PCM melting process. The model needs to be
fast enough to be coupled with global energy simulation tool (such as TRNSYS) to perform annual
energy assessment of a whole building integrating such a wall. Once the needed model is created and
experimentally validated, the optimization of the TIM-PCM wall performance might be done under
different conditions and configurations.
The objectives of this thesis can thus be written as follows:
1. To develop a 2D simplified numerical model for phase change in presence of natural convection
(without recurring to the full solution of the Navier Stokes equations). In this work, the phase change
is modelled using a fixed grid enthalpy method, the natural convection in the liquid PCM is accounted
for using Bejan’s scaling theory approach coupled with the enhanced conductivity method.
The simplified enhanced conductivity approach, used by many authors [26], [65], [67]–[69], [66],
considers that the convection effect is prevalent in the whole liquid PCM, which is not true. The
scaling theory proposed by Bejan [40] [37] allows to get a clear understanding of the role of natural
convection in the liquid PCM through the sequence of mainly three regimes (pure conduction, mixed
(transition) and convection regimes) and to adequately presenting the convection effect during
melting process, especially the shape and the position of the melting front. That is why in this work
these two approaches will be coupled. The equations are discretized using 2D implicit finite volume
method and the code is written in MATLAB.
The model will be then validated using numerical and experimental benchmark solutions found in
literature, in addition to a CFD model previously created in COMSOL for a test case: melting of
Octadecane in square cavity; the computational simulations time are compared. Details and results
are presented in chapter 2.
2. To develop a 2D simplified numerical model for phase change of fatty acids filled in glass bricks
in presence of natural convection and shortwave radiation in the dynamic regime. The nodal
absorptivity and transmissivity in the PCM are evaluated function of the liquid fraction, and the
absorbed shortwave radiation is added to the energy equation as source term.
The model will be validated using the results of Fuentes et.al [85] of the LBM-DOM method (the
only reference found in scientific literature for phase change in presence of natural convection and
radiation). Details and results are presented in chapter 2.

Chapter 1
81
3. To properly model the heat transfer through the TIM-PCM wall and then to couple the model with
a global building energy simulation tool, TRNSYS, in order to study the energy performance of the
whole building. The transmission of solar radiation through the wall layer is evaluated using Seigel
equations. All details about the developed heat transfer model and the link MATLAB-TRNSYS are
presented in chapter 3. To validate the coupled model, we have used the experimental cell present in
PERSEE center of Mines ParisTech graduate school located in Sophia Antipolis. The experimental
cell already exists and in the current thesis, we have just collected the data for summer and winter
2017 (see chapter 3).
4. Using the experimentally validated model, to propose passive solutions to optimize the wall
behavior in summer conditions (see end of chapter 3).
5. To study the thermal behavior of an office building with integrated TIM-PCM wall under different
climatic conditions and its impact on the indoor thermal comfort in summer conditions (more details
in chapter 3), to compare its performance to that of the same building using a conventional double
glazing, and to perform an economic analysis of the application of the wall. Details and results are
presented in chapter 4.
In the above chapter, heat transfer mechanisms during the phase change were discussed. A literature
review of the numerical models of phase change considering natural convection, as well as a state of
the art of PCM integrated in transparent systems were presented. The TIM-PCM wall was described,
in addition the problematic and the objectives of the thesis were identified. In the next chapter, a
simplified model taking into account natural convection and radiation during phase change will be
developed. The equations governing these phenomena as well as their simplifying assumptions, and
the numerical methods adapted to their solution are presented.

Chapter 1
82
References
[1] “OECD, World Energy Outlook 2012, Organisation for Economic Cooperation and Development, Paris,
France, 2012.” .
[2] “Directive 2010/31/EU of the European Parliament and of the Council of 19 May 2010 on the energy
performance of buildings. Off J Eur Union, 2010; 53:13–35.” .
[3] “Bosch J, Johnson FX, Clément E, Mertens R, Roubanis N. Panorama of energy – energy statistics to
support EU policies and solutions. Luxembourg: Office for Official Publications of the European
Communities; 2009.” .
[4] “European Union. European Commission Energy Topics. 1995–2015.” .
[5] “Cappelletti F, Prada A, Romagnoni P, Gasparella A. Passive performance of glazed components in
heating and cooling of an open-space office under controlled indoor thermal comfort. Build Environ
2014;72:131–44.”
[6] “Gomes MG, Santos AJ, Rodrigues AM. Solar and visible optical properties of glazing systems with
venetian blinds: Numerical, experimental and blind control study. Build Environ 2014;71:47–59.”
[7] “Peng J, Lu L, Yang H. An experimental study of the thermal performance of a novel photovoltaic double-
skin facade in Hong Kong. Sol Energy 2013;97:293–304.”
[8] “Ghoshal S, Neogi S. Advance glazing system – energy efficiency approach for buildings a review. Energy
Procedia 2014;54:352–8.”
[9] “Wang T-P, Wang L-B, Li B-Q. A model of the long-wave radiation heat transfer through a glazing.
Energy Build 2013;59:50–61.”
[10] “] Grynning S, Gustavsen A, Time B, Jelle BP. Windows in the buildings of tomorrow: energy losers or
energy gainers? Energy Build 2013;61:185–92.”
[11] “Grynning S, Goia F, Rognvik E, Time B. Possibilities for characterization of a PCM window system
using large scale measurements. Int J Sustain Built Environ 2013;2:56–64.”
[12] F. Goia, M. Perino, and M. Haase, “A numerical model to evaluate the thermal behaviour of PCM glazing
system configurations,” Energy Build., vol. 54, pp. 141–153, 2012.
[13] H. Manz, P. . Egolf, P. Suter, and A. Goetzberger, “TIM–PCM external wall system for solar space heating
and daylighting,” Sol. Energy, vol. 61, no. 6, pp. 369–379, Dec. 1997.
[14] K. A. R. Ismail, C. T. Salinas, and J. R. Henriquez, “Comparison between PCM filled glass windows and
absorbing gas filled windows,” Energy Build., vol. 40, no. 5, pp. 710–719, Jan. 2008.
[15] K. A. R. Ismail and J. R. Henrıquez, “Parametric study on composite and PCM glass systems,” Energy
Convers. Manag., vol. 43, no. 7, pp. 973–993, 2002.
[16] H. Weinläder, A. Beck, and J. Fricke, “PCM-facade-panel for daylighting and room heating,” Sol. Energy,
vol. 78, no. 2, pp. 177–186, Feb. 2005.
[17] “F. Goia, M. Perino, V. Serra, F. Zanghirella, Experimental assessment of the thermal behaviour of a PCM
grazing, in: Proceedings of IAQVEC 2010, Syracuse, New York, USA, 15–18 August, 2010, pp. 1–8
(Paper Ref. 21–34).”
[18] S. Liu, Y. Li, and Y. Zhang, “Mathematical solutions and numerical models employed for the
investigations of PCMs׳ phase transformations,” Renew. Sustain. Energy Rev., vol. 33, pp. 659–674, May
2014.
[19] E. Sparrow and S. Patankar, “Analysis of melting in the presence of natural convection in the melt region,”
ASME J Heat Transf, vol. 99:520–6, 1977.
[20] E. Sparrow and J. Ramsey, “Melting and natural convection due to a vertical embedded heater.,” J Heat
Transf, pp. 100:368–70, 1978.
[21] L. Yao and F. Chen, “Effects of natural convection in the melted region around a heated horizontal
cylinder,” ASME J Heat Transf, vol. 102:667–72, 1980.
[22] R. VISKANTA and N. Hale, “Photographic observation of the solid–liquid interface motion during
melting of a solid heat from an isothermal vertical wall.,” Lett Heat Mass Transf, vol. 5:329–37., 1978.
[23] A. Bathelt and R. VISKANTA, “An experimental investigation of natural convection in the melted region
around a heated horizontal cylinder.,” J Fluid Mech, pp. 1979;90:227–39.
[24] C. Harrison and F. Weinberg, “The influence of convection on heat transferin liquid tin.,” Metall Trans B,
pp. 1985;16:355–7.
[25] D. Buddhi and N. BANSAL, “Solar thermal storage systems using phase change materials,” Int J Heat
energy res, vol. 12:547–55., 1988.

Chapter 1
83
[26] M. FARID and R. HUSIAN, “An electrical storage heater using the phase change method of heat storage.,”
Energy Convers Manag, vol. 30(3):219–30, 1990.
[27] A. Hasan, “Phase change material energy storage system employing palmitic acid,” Sol Energy, vol.
52:143–54, 1994.
[28] M. Lacroix and T. Duong, “Experimental improvements of heat transfer in a latent heat thermal energy
storage unit with embedded heat sources,” Energy Convers. Manag., vol. 39, no. 8, pp. 703–716, 1998.
[29] Y. Zhang and J. Yi, “A simple method, the T-history method of determining the heat of fusion specific
heat and thermal conductivity of phase change materials,” Meas Sci Technol, 1999.
[30] R. Velraj and R. seeniraj, “Heat transfer enhancement in a latent heat storage system,” Sol Energy, 1999.
[31] A. SARI and K. KAYGUSUZ, “Thermal energy storage system using stearic acid as a phase change
material,” Sol Energy, 2001.
[32] P. Lamberg, R. Lehtiniemi, and A.-M. Henell, “Numerical and experimental investigation of melting and
freezing processes in phase change material storage,” Int. J. Therm. Sci., vol. 43, no. 3, pp. 277–287, Mar.
2004.
[33] X. Faure, “Enveloppe hybride pour bâtiment à haute performance énergétique,” Université Joseph-
Fourier-Grenoble I, 2007.
[34] “Sasaguchi K, Viskanta R. Phase change heat transfer during melting and re-solidification of the melt area
around cylindrical heat source (s)/sink(s). J Energy Resour Technol 1989;111:43–9.”
[35] Özisik MN. Heat conduction. New York: Wiley; 1980. .
[36] “Alexiades V. Mathematical modeling of melting and freezing processes. Washington: Hemisphere
Publishing Corporation; 1993.”
[37] A. Bejan, Convection heat transfer, Fourth edition. Hoboken, New Jersey: Wiley, 2013.
[38] M. Lacroix and M. Benmadda, “Numerical simulation of natural convectiondominated melting and
solidification from a finned vertical wall,” Numer. Heat Transfer, no. Part A Appl. 31, pp. 71–86, 1997.
[39] R. Velraj, R. seeniraj, B. Hafner, C. Faber, and K. Schwarzer, “HEAT TRANSFER ENHANCEMENT
IN A LATENT HEAT STORAGE SYSTEM,” Solar Energy, vol. 65, no. No. 3, pp. 171–180, 1999.
[40] P. Jany and A. Bejan, “Scaling theory of melting with natural convection in an enclosure,” Int. J. Heat
Mass Transf., vol. 31, no. 6, pp. 1221–1235, Jun. 1988.
[41] K. Morgan, “A numerical analysis of freezing and melting with convection,” Comp. Meth. App. Eng., vol.
Vol. 28, pp. 275–84, 1981.
[42] J. Hsiao, “An efficient algorithm for finite difference analysis of heat transfer with melting and
solidification,” ASME Paper No. WA/HT-42, 1984.
[43] A. . Brent and V. R. Voller, “Enthalpy-porosity technique for modeling convection-diffusion phase
change: application to the melting of a pure metal,” Numerical Heat Transfer, vol. Vol. 13, pp. 297–318,
1988.
[44] B. Binet and M. Lacroix, “Melting from heat sources flush mounted on a conducting vertical wall,” Int. J.
Num. Meth. Heat & Fluid Flow, vol. Vol. 10, pp. 286-306., 2000.
[45] Y. Cao and A. Faghri, “A numerical analysis of phase change problem including natural convection,” J
HEAT TRANSFER, vol. 112, pp. 812–15, 1990.
[46] S. Wang, A. Faghri, and T. L. Bergman, “A comprehensive numerical model for melting with natural
convection,” Int. J. Heat Mass Transf., vol. 53, no. 9–10, pp. 1986–2000, Apr. 2010.
[47] Z. Ma and Y. Zhang, “Solid velocity correction schemes for a temperature transforming model for
convection phase change,” Int. J. Numer. Methods Heat Fluid Flow, vol. 16, no. 2, pp. 204–225, Feb.
2006.
[48] V. Voller and M. Cross, “An enthalpy method for convection/ diffusion phase change,” Int J Numer
Methods Eng, vol. 24:271–84., 1987.
[49] V. Shatikian, G. Ziskind, and R. Letan, “Numerical investigation of a PCM-based heat sink with internal
fins,” Int. J. Heat Mass Transf., vol. 48, no. 17, pp. 3689–3706, Aug. 2005.
[50] M. Faraji and H. El Qarnia, “Numerical study of melting in an enclosure with discrete protruding heat
sources,” Appl. Math. Model., vol. 34, no. 5, pp. 1258–1275, May 2010.
[51] A. R. Archibold, M. M. Rahman, D. Y. Goswami, and E. K. Stefanakos, “Analysis of heat transfer and
fluid flow during melting inside a spherical container for thermal energy storage,” Appl. Therm. Eng., vol.
64, no. 1–2, pp. 396–407, Mar. 2014.
[52] P. Wang, H. Yao, Z. Lan, Z. Peng, Y. Huang, and Y. Ding, “Numerical investigation of PCM melting
process in sleeve tube with internal fins,” Energy Convers. Manag., vol. 110, pp. 428–435, Feb. 2016.

Chapter 1
84
[53] Z. Liu, Y. Yao, and H. Wu, “Numerical modeling for solid–liquid phase change phenomena in porous
media: Shell-and-tube type latent heat thermal energy storage,” Appl. Energy, vol. 112, pp. 1222–1232,
Dec. 2013.
[54] W.-B. Ye, D.-S. Zhu, and N. Wang, “Fluid flow and heat transfer in a latent thermal energy unit with
different phase change material (PCM) cavity volume fractions,” Appl. Therm. Eng., vol. 42, pp. 49–57,
Sep. 2012.
[55] P. Goyal, A. Dutta, V. Verma, and I. T. R. Singh, “Enthalpy Porosity Method for CFD Simulation of
Natural Convection Phenomenon for Phase Change Problems in the Molten Pool and its Importance during
Melting of Solids.”
[56] A. Faghri and Y. Cao, “Performance characteristics of a thermal energy storage module: a transient
PCM/forced convection conjugate analysis,” Int. J. HeatMass Transfer, pp. 93–101, 1991.
[57] P. Damronglerd and Zhang, “Modified temperature-transforming model for convection-controlled
melting,” AIAA J. Thermophy. Heat Transfer 21, pp. 203–208., 2007.
[58] x zeng and A. Faghri, “A temperature transforming model for binary solid–liquid phase change problems:
Part I – mathematical modeling and numerical methodology,” pp. 467–480, 1994.
[59] D. Groulx and P. H. Biwole, “Solar PV Passive Temperature Control Using Phase Change Materials,”
2014.
[60] D. Chatterjee and S. Chakraborty, “An enthalpy-based lattice Boltzmann model for diffusion dominated
solid–liquid phase transformation,” Phys. Lett. A, vol. 341, no. 1–4, pp. 320–330, Jun. 2005.
[61] E. A. Semma, M. El Ganaoui, and R. Bennacer, “Lattice Boltzmann method for melting/solidification
problems,” Comptes Rendus Mécanique, vol. 335, no. 5–6, pp. 295–303, May 2007.
[62] C. Huber, A. Parmigiani, B. Chopard, M. Manga, and O. Bachmann, “Lattice Boltzmann model for
melting with natural convection,” Int. J. Heat Fluid Flow, vol. 29, no. 5, pp. 1469–1480, Oct. 2008.
[63] J. Miranda Fuentes, K. Johannes, F. Kuznik, M. Cosnier, and J. Virgone, “Melting with convection and
radiation in a participating phase change material,” Appl. Energy, vol. 109, pp. 454–461, Sep. 2013.
[64] M. M. Prieto and B. González, “Fluid flow and heat transfer in PCM panels arranged vertically and
horizontally for application in heating systems,” Renew. Energy, vol. 97, pp. 331–343, Nov. 2016.
[65] R. Kahraman, “A simplified model for melting of ice with natural convection,” Int. Commun. Heat Mass
Transfer, vol. 25, pp. 359–368, 1998.
[66] G. Vidalain, L. Gosselin, and M. Lacroix, “An enhanced thermal conduction model for the prediction of
convection dominated solid–liquid phase change,” Int. J. Heat Mass Transf., vol. 52, no. 7–8, pp. 1753–
1760, Mar. 2009.
[67] P. Johansson, “Advanced Thermal Energy Storage Heat Transfer Study with Use of Comsol and Matlab,”
2011.
[68] M. Costa and D. Buddhi, “Numerical simulation of a latent heat thermal energy storage system with
enhanced heat conduction.,” Energy Convers Manag, vol. 39:319–30., 1998.
[69] P. Dolado, A. Lazaro, J. M. Marin, and B. Zalba, “Characterization of melting and solidification in a real
scale PCM-air heat exchanger: Numerical model and experimental validation,” Energy Convers. Manag.,
vol. 52, no. 4, pp. 1890–1907, Apr. 2011.
[70] N. A. M. Amin, F. Bruno, and M. Belusko, “Effective thermal conductivity for melting in PCM
encapsulated in a sphere,” Appl. Energy, vol. 122, pp. 280–287, Jun. 2014.
[71] A. Castell and C. Solé, “An overview on design methodologies for liquid–solid PCM storage systems,”
Renew. Sustain. Energy Rev., vol. 52, pp. 289–307, Dec. 2015.
[72] B. W. Webb and R. VISKANTA, “On the characteristic length scale for correlating melting heat transfer
data,” Int. Commun. Heat Mass Transfer, vol. 12, pp. 637–646, 1985.
[73] C. Beckermann and R. Viskanta, “Effect of solid subcooling on natural convection melting of a pure
metal,” J. Heat Transf., vol. 111, no. 2, pp. 416–424, 1989.
[74] A. Brent, V. Voller, and K. Reid, “Enthalpy-porosity technique for modeling convection-diffusion phase
change: application tothe melting of a pure metal.,” Numer Heat Transfer, vol. 13:297–318., 1988.
[75] Y. Wang, A. Amiri, and K. Vafai, “An experimental investigation of the melting process in a rectangular
enclosure,” Int. J. Heat Mass Transf., vol. 42, no. 19, pp. 3659–3672, 1999.
[76] Z. Gong, S. Devahastin, and A. Mujumdar, “Enhanced heat transfer in free convection-dominated melting
in a rectangular cavity with an isothermal vertical wall.,” Appl Therm Eng, vol. 19:1237–51., 1999.
[77] Z. Younsi, A. Joulin, L. Zalewski, S. Lassue, and D. R. Rousse, “Phase change materials: a numerical
method for the behavior predictions,” in Proceedings of the Fourth International Conference on Thermal
Engineering: Theory and Applications January, 2009, pp. 12–14.
Chapter 1
85
[78] R. E. Murray and D. Groulx, “Modeling convection during melting of a phase change material,” in
Proceedings of the COMSOL Conference, 2011.
[79] D. Yanxia, Y. Yanping, J. Daiyong, C. Baoyi, and M. Jinfeng, “Experimental investigation on melting
characteristics of ethanolamine–water binary mixture used as PCM,” Int. Commun. Heat Mass Transf.,
vol. 34, no. 9–10, pp. 1056–1063, Nov. 2007.
[80] C.-J. Ho and R. Viskanta, “Heat Transfer During Melting From an Isothermal Vertical Wall,” J. Heat
Transf., vol. 106, no. 1, p. 12, 1984.
[81] “Yao LS, Cherney W. Transient phase-change around a horizontal cylinder. Int J Heat Mass Transf
1981;24:1971–81.”
[82] “Rieger H, Projahn U, Beer H. Analysis of the heat transport mechanisms during melting around a
horizontal circular cylinder. Int J Heat Mass Transf 1982;25:137–47.”
[83] “Ismail KAR, da Silva MGE. Melting of PCM around a horizontal cylinder with constant surface
temperature. Int J Therm Sci 2003;42:1145–52.”
[84] “Furzerland RM. A comparative study of numerical methods for moving boundary problems. J Inst Math
Appl 1980;26:411–29.”
[85] J. M. Fuentes, “Développement d’un modèle de Boltzmann sur gaz réseau pour l’étude du changement de
phase en présence de convection naturelle et de rayonnement,” INSA de Lyon, 2013.
[86] N. Hannoun, V. Alexiades, and T. Z. Mai, “A reference solution for phase change with convection,” Int J
Numer Methods Fluids, vol. 48, pp. 1283–1308, 2005.
[87] N. Hannoun, V. Alexiades, and T. Z. Mai, “Resolving the controversy over tin and gallium melting in a
rectangular cavity heated from the side,” Numer Heat Transfer, vol. 44, pp. 253–276, 2003.
[88] A. Ghosh, B. Norton, and A. Duffy, “Measured thermal & daylight performance of an evacuated glazing
using an outdoor test cell,” Appl. Energy, vol. 177, pp. 196–203, Sep. 2016.
[89] F. Favoino, F. Fiorito, A. Cannavale, G. Ranzi, and M. Overend, “Optimal control and performance of
photovoltachromic switchable glazing for building integration in temperate climates,” Appl. Energy, vol.
178, pp. 943–961, Sep. 2016.
[90] N. DeForest, A. Shehabi, S. Selkowitz, and D. J. Milliron, “A comparative energy analysis of three
electrochromic glazing technologies in commercial and residential buildings,” Appl. Energy, vol. 192, pp.
95–109, Apr. 2017.
[91] D. Buddhi and S. D. Sharma, “Measurements of transmittance of solar radiation through stearic acid: a
latent heat storage material,” Energy Convers. Manag., vol. 40, no. 18, pp. 1979–1984, 1999.
[92] F. Goia, M. Perino, and V. Serra, “Experimental analysis of the energy performance of a full-scale PCM
glazing prototype,” Sol. Energy, vol. 100, pp. 217–233, 2014.
[93] B. L. Gowreesunker, S. B. Stankovic, S. A. Tassou, and P. A. Kyriacou, “Experimental and numerical
investigations of the optical and thermal aspects of a PCM-glazed unit,” Energy Build., vol. 61, pp. 239–
249, Jun. 2013.
[94] S. Li, G. Sun, K. Zou, and X. Zhang, “Experimental research on the dynamic thermal performance of a
novel triple-pane building window filled with PCM,” Sustain. Cities Soc., vol. 27, pp. 15–22, Nov. 2016.
[95] S. Grynning, F. Goia, and B. Time, “Dynamic Thermal Performance of a PCM Window System:
Characterization Using Large Scale Measurements,” Energy Procedia, vol. 78, pp. 85–90, Nov. 2015.
[96] F. Goia, M. Perino, and V. Serra, “Improving thermal comfort conditions by means of PCM glazing
systems,” Energy Build., vol. 60, pp. 442–452, May 2013.
[97] C. Liu, Y. Wu, J. Bian, D. Li, and X. Liu, “Influence of PCM design parameters on thermal and optical
performance of multi-layer glazed roof,” Appl. Energy, vol. 212, pp. 151–161, Feb. 2018.
[98] F. Goia, “Thermo-physical behaviour and energy performance assessment of PCM glazing system
configurations: A numerical analysis,” Front. Archit. Res., vol. 1, no. 4, pp. 341–347, Dec. 2012.
[99] K. Zhong, S. Li, G. Sun, S. Li, and X. Zhang, “Simulation study on dynamic heat transfer performance of
PCM-filled glass window with different thermophysical parameters of phase change material,” Energy
Build., vol. 106, pp. 87–95, 2015.
[100] K. A. R. Ismail, C. T. Salinas, and J. R. Henriquez, “Comparison between PCM filled glass windows
and absorbing gas filled windows,” Energy Build., vol. 40, no. 5, pp. 710–719, Jan. 2008.
[101] T. Silva, R. Vicente, and F. Rodrigues, “Literature review on the use of phase change materials in
glazing and shading solutions,” Renew. Sustain. Energy Rev., vol. 53, pp. 515–535, Jan. 2016.
[102] “L. A. Diaz and R. Viskanta, ‘Experiments and analysis on the melting of a semitransparent material
by radiation,’ Heat Mass Transfer, vol. 20, pp. 311–321, 1986. 10.1007/BF01002422.”

Chapter 1
86
[103] G. Colomer Rey, Numerical methods for radiative heat transfer. Universitat Politècnica de Catalunya,
2006.
[104] F. Trombe, “Heating by solar radiation.” CNRS Internal Report B-1- 73-100., 1973.
[105] P. Ohanessian and W. W. . Charters, “Thermal simulation of a passive solar house using a Trombe-
Michel wall structure.,” Sol. Energy 20, pp. 275–281, 1978.
[106] A. V. Sebald, J. R. Clinton, and F. Langenbacher, “Performance effects of Trombe wall control
strategies.,” Sol. Energy 23 (6), pp. 479–487, 1979.
[107] E. Kruger, E. Suzuki, and A. Matoski, “Evaluation of a Trombe wall system in a subtropical location.,”
Energy Build., vol. 66, pp. 364–372, 2013.
[108] M. Bojic, K. Johannes, and F. Alamdari, “Optimizing energy and environmental performance of
passive Trombe wall,” Energy Build, vol. 70, pp. 279–286, 2014.
[109] M. Telkes, “Trombe wall with phase change storage material,” in Proceedings of the 2nd National
Passive Solar Conference, Philadelphia, PA, USA., 1978.
[110] F. Fiorito, “Trombe walls for lightweight buildings in temperate and hot climates. exploring the use
of phase-change materials for performances improvement.,” Energy Procedia, vol. 30, pp. 1110–1119,
2012.
[111] L. Zalewski, A. Joulin, S. Lassue, and Y. Dutil, “Experimental study of small-scale solar wall
integrating phase change material,” Sol. Energy, no. 86, pp. 208–219, 2012.
[112] A. de Gracia, L. Navarro, A. Castell, A. Ruiz-Pardo, S. Alvarez, and L. F. Cabeza, “Experimental
study of a ventilated facade with PCM during winter period,” Energy Build., pp. 58, 324–332, 2013.
[113] L. Yongcai and L. Shuli, “Experimental study on thermal performance of a solar chimney combined
with PCM,” Appl. Energy 114, pp. 172–178, 2014.
[114] G. Diarce et al., “Ventilated active façades with PCM,” Appl. Energy, vol. 109, pp. 530–537, Sep.
2013.
[115] Z. Hu, W. He, J. Ji, and S. Zhang, “A review on the application of Trombe wall system in buildings,”
Renew. Sustain. Energy Rev., vol. 70, pp. 976–987, Apr. 2017.
[116] Y. A. Kara and A. Kurnuç, “Performance of coupled novel triple glass unit and pcm wall,” Appl.
Therm. Eng., vol. 35, pp. 243–246, Mar. 2012.
[117] N. D. Kaushika and K. Sumathy, “Solar transparent insulation materials: a review,” Renew. Sustain.
Energy Rev., vol. 7, no. 4, pp. 317–351, Aug. 2003.
[118] I. L. Wong, P. C. Eames, and R. S. Perera, “A review of transparent insulation systems and the
evaluation of payback period for building applications,” Sol. Energy, vol. 81, no. 9, pp. 1058–1071, Sep.
2007.
[119] “Goetzberger A., Schmid J. andWittwer V. (1984) Transparent insulation system for passive solar
energy utilization in buildings. In Proc. First E.C. Conference on Solar Heating. D. Reidel Publishing
Company, Dordrecht, pp. 314–318.”
[120] K. Johannes, F. Kuznik, F. Jay, P. Roquette, P. Achard, and Y. Berthou, “CRISTOPIA ENERGY
SYSTEMS, SAVERBAT SAS,Elément d’enveloppe d’un bâtiment et ensemble comprenant un tel
élément,” Brevet Francais FR 1158194, 15-Mar-2013.
[121] Y. Berthou, P. H. Biwole, P. Achard, H. Sallée, M. Tantot-Neirac, and F. Jay, “Full scale
experimentation on a new translucent passive solar wall combining silica aerogels and phase change
materials,” Sol. Energy, vol. 115, pp. 733–742, May 2015.
[122] W. Gong, “Heat storage of PCM inside a transparent building brick: Experimental study and LBM
simulation on GPU,” p. 186.
[123] C. Liu, Y. Zhou, D. Li, F. Meng, Y. Zheng, and X. Liu, “Numerical analysis on thermal performance
of a PCM-filled double glazing roof,” Energy Build., vol. 125, pp. 267–275, 2016.
[124] C. Liu, Y. Zheng, D. Li, H. Qi, and X. Liu, “A Model to Determine Thermal Performance of a Non-
ventilated Double Glazing Unit with PCM and Experimental Validation,” Procedia Eng., vol. 157, pp.
293–300, 2016.

CHAPTER 2
MELTING OF A PHASE CHANGE MATERIAL IN
PRESENCE OF NATURAL CONVECTION AND
RADIATION: A SIMPLIFIED MODEL

Chapter 2
89
Chapter 2. Melting of a Phase Change Material in Presence of Natural
Convection and Radiation: A Simplified Model
Résumé du chapitre en français :
Fusion d'un matériau à changement de phase en présence de convection naturelle et de
rayonnement : un modèle simplifié
Un modèle simplifié pour modéliser la convection naturelle et le rayonnement courte longueur d’onde
(CLO) pendant le processus de fusion d’un matériau à changement de phase est présenté dans ce
chapitre. Pour modéliser le changement de phase, une méthode « enthalpique » modifiée a été utilisée.
La convection naturelle qui apparaît dans le MCP liquide est prise en compte en utilisant l'approche
de conductivité thermique efficace couplée avec la théorie d’échelle sans la résolution complète des
équations de Navier-Stokes (N-S), tandis que le flux de rayonnement CLO absorbé est ajouté à
l'équation d'énergie en tant que terme source en utilisant un algorithme simplifié. Le modèle
mathématique est codé sous MATLAB en utilisant une méthode de volumes finis implicite en deux
dimensions.
Ensuite, un modèle CFD complet est créé et mis en œuvre dans COMSOL Multiphysics en adoptant
la méthode de capacité thermique modifiée. En particulier, une corrélation du nombre de Nusselt
correspondant à notre cas d’étude est trouvée, sur la base du modèle CFD, et est ensuite implémentée
dans le modèle simplifié pour calculer la conductivité efficace. Les résultats du modèle simplifié sont
comparés à ceux du modèle CFD créé dans COMSOL, et aux résultats numériques et expérimentaux
des benchmarks trouvés dans la littérature. Les résultats montrent que, pour un temps de calcul 45
fois plus court que celui de la CFD, les valeurs de fraction liquide moyenne, de la position du front
de fusion à quatre instants différents, et de la position moyenne du front de fusion en fonction de
temps sont acceptables avec des différences inférieures à 6%, 14% et 13% respectivement. D’autre
part, les résultats du modèle simplifié montrent un très bon accord avec ceux des solutions des
benchmarks. De plus, la modélisation de la convection naturelle pendant la fusion, modifie la fraction
liquide moyenne d'environ 40% et la position du front de fusion d'environ 55% à l’instant
adimensionnel SteFo = 0.01 par rapport à un modèle à conduction seule.
Puis, le modèle développé couplant la convection naturelle et le rayonnement courte longueur d’onde
lors de la fusion est appliqué pour modéliser la fusion de l'acide gras intégré dans les briques de verre
de la paroi INERTRANS. Les résultats obtenus sont en très bon accord avec les résultats d’un modèle
de Boltzmann sur réseau et la méthode des ordonnées discrètes (LBM-DOM) trouvés dans la
littérature, en termes de la fraction liquide moyenne. Il a été constaté que la convection naturelle fait

Chapter 2
90
augmenter la fraction liquide d'environ 35% par rapport au modèle à conduction seule, tandis que le
rayonnement CLO fait augmenter la fraction liquide d'environ 20% par rapport au modèle incluant la
convection. En ce qui concerne le temps du calcul, les simulations du modèle simplifié sont beaucoup
plus rapides par rapport au modèle LBM-DOM.
Le modèle proposé considérant à la fois la convection naturelle et le rayonnement pendant le
processus de fusion est simple à mettre en œuvre et peut gérer efficacement les problèmes de
changement de phase dominés par convection sans la résolution complète de l’écoulement dans un
temps de calcul relativement court. Cependant, ce modèle simplifié est une représentation
conceptuelle de la réalité, et il a été développé pour les applications pratiques de l'ingénierie
thermique, où on cherche une évaluation annuelle de la performance énergétique. Dans le chapitre
suivant, le modèle simplifié est utilisé pour simuler le comportement thermique de l'ensemble du mur
INERTRANS sur une base annuelle, le processus de solidification étant également pris en compte.
Le modèle simplifié pourrait également être intégré dans un outil de simulation d'énergie (par
exemple TRNSYS ou EnergyPlus) pour évaluer le comportement thermique annuel d'un bâtiment.
Dans le chapitre suivant, le modèle simplifié sera utilisé pour simuler le comportement thermique du
mur INERTRANS. Ensuite, il sera couplé à un outil de simulation énergétique globale (TRNSYS)
pour évaluer le comportement thermique annuel de l'ensemble du bâtiment.

Chapter 2
91
Abstract
In this chapter, a simplified model for melting of a phase change material (PCM) in presence of
natural convection and radiation is presented. A modified enthalpy method is adopted to solve the
phase change problem, the natural convection occurring in the liquid PCM is accounted for using
the enhanced thermal conductivity approach coupled with the scaling theory, and the absorbed
shortwave radiation flux is added into the energy equation as a source term using a simplified
solution algorithm. Two-dimensional implicit finite volume method is used to solve the energy
equation. First, the simplified model for melting with natural convection is validated using a CFD
model, in addition to experimental and numerical benchmark solutions for a test case. Then, the
simplified model for melting with combined natural convection and radiation is applied to the melting
of a fatty acid eutectic filled in glass bricks, which will be used later to model the annual thermal
behavior of a special translucent façade. This complete model is validated against the lattice
Boltzmann-discrete ordinate method LBM-DOM. It was shown that (1) the proposed simplified model
is simple to implement, and its simulations run significantly faster than those of CFD models and
LBM-DOM model. Consequently, it can be easily integrated into an energy simulation tool for yearly
performance evaluation, (2) during PCM melting process, natural convection has a noteworthy role
as it enhances the average fraction of liquid and the position of the melting front, (3) shortwave
radiation enhances the average liquid fraction.
Keywords: Phase Change Materials, natural convection, shortwave radiation, computational time,
enhanced thermal conductivity, scaling theory, CFD.
Highlights:
• Simplified model for melting with natural convection and radiation.
• Enhanced thermal conductivity approach coupled with the scaling theory.
• During PCM melting, natural convection has a notable role.
• The simplified model runs much faster than CFD and LBM models.
• The model can be integrated into energy simulation tool for annual evaluation.

Chapter 2
92
1. Introduction
A new kind of translucent storage wall has been proposed, in the French INERTRANS(1) project,
composed of glass layer, a translucent insulation (silica aerogel) and fatty acid eutectic mixture filled
in glass bricks [1], [2]. The solid PCM absorbs the solar radiation, thus increasing its temperature
until the complete melting, while in liquid phase, the PCM transmits solar radiation. Then, the heat
transfer is conducted by conduction, natural convection and radiation during the phase change. To
optimize the energy performance of this type of storage walls, numerical modeling of the heat transfer
mechanisms in the wall materials is required and especially the melting with combined natural
convection and radiation.
In the last twenty years, convection dominated phase change problems have become the subject of
numerous studies [3]–[11] and the natural convection was shown as a significant mechanism during
melting process, whenever convection motion has enough space to develop [12]. This phenomenon
was investigated using both experimental [13]–[16] and numerical approaches [17]–[20]. Even
though the experimental studies show more accurately the real behavior of PCM, researchers prefer
to study the phase change problems by mathematical solutions and numerical simulations due to the
fact that numerous conditions can be carried out by changing the variables in a numerical model [21].
Numerically, various methods are currently explored and used to model phase change of a PCM
accounting for natural convection, mainly the enthalpy-porosity approach [22]–[29], the temperature
transforming model (TTM) [30]–[33], the equivalent thermal capacity method [34], the modified heat
capacity method [35], in addition to the integral method, the boundary fixing method, the unstructured
finite-element method, and the coordinate transformation method [21]. In these methods, the Navier-
Stokes equations i.e. the energy equations in the solid and liquid phases coupled with the continuity
and momentum equations in the liquid must be solved, hence the problem becomes strongly non-
linear. In addition, Lattice Boltzmann Method (LBM) [2], [36]–[38] is used as well to model the fluid
flow during phase change.
The computational time can be quite large, depending on the used method, the simulated problem and
the spatial and temporal discretization [39]. The melting of Tin, filled in a square enclosure of height
0.1m, in presence of natural convection has been studied by different authors [39] [40] [41]. The
computational time for the melting of Tin was found 450 hours for a total simulation time of 700
seconds with a mesh size of 400 × 400 in [40]; the simulations were conducted using a Compaq Alpha
ES40 machine. While the computational time using the LBM in [39], for a simulation time of 1000
seconds is found 76 hours with a mesh size of 400 × 400, the simulations were conducted using an
Intel Xeon X5472. Moreover, Hannoun et al. [41] reported 2400 hours of CPU to simulate 2500
seconds of the melting of Tin with a mesh size of 200 × 200, using Compaq Alpha ev67 machine. In

Chapter 2
93
addition, the simulation of 5000 seconds of the melting of Octadecane, filled in square enclosure of
height 0.1m, with natural convection took 34 hours with a mesh size of 225 × 225 [39].
Usually in thermal engineering applications, where yearly energy performance evaluation is sought,
the building models with integrated PCM ignore the convection effect in the liquid region, due to the
complexity of CFD models and the required high computational time. Therefore, the transient heat
conduction term is only considered in the energy equation [42]. Because the assumption of conduction
alone is not always adequate, a simplified model considering the effect of natural convection without
the complete solution of the Navier–Stokes equations is needed. The natural convection effect could
be accounted model using the enhanced thermal conductivity approach [5], [43]–[47]. Here, the
average Nusselt number is considered as a main parameter, because it describes the convective heat
transfer coefficient, and influences the procedure dynamics [48]. In this approach, the convection
effect is considered in the whole liquid PCM. The scaling theory proposed by Bejan [49] [50] allows
to get a clear understanding of the role of natural convection in the liquid PCM through the sequence
of mainly three regimes (pure conduction, mixed (transition) and convection regimes) and to
adequately presenting the convection effect during melting process, especially the shape and the
position of the melting front.
In this chapter, we develop a simplified model for convection and radiation during PCM melting
(section 2). Natural convection in the liquid PCM is modeled based on the enhanced thermal
conductivity approach and the scaling theory (section 3.1). This model is validated using the results
of a CFD model developed in COMSOL Multiphysics solver (section 3.2), in addition to numerical
and experimental benchmark solutions from the literature for a test case: melting of Octadecane in a
square enclosure heated from its left vertical wall (sections 3.3-3.5). Based on the numerical CFD
results, a correlation for the Nusselt number is proposed (section 3.4). Then, the short-wave radiation
is modeled in the PCM using a simplified solution algorithm (section 4). Later on, a simplified method
coupling the natural convection and the shortwave radiation during melting is applied to the fatty acid
filled in glass bricks used in the INERTRANS wall. The results are compared and validated against a
lattice Boltzmann method coupled with Discrete Ordinate Method (DOM) to model natural
convection and radiation respectively, during the melting of a fatty acid eutectic mixture (section 5).
In this paper, only melting is modeled for three reasons: (i) the experimental and numerical
benchmarking data on melting to compare our simplified model with, is abundant in the literature,
(ii) according to many authors [51] [52], convection heat transfer is less important than conduction
during solidification process (iii) in such walls as the INERTRANS wall solidification is more likely
to happen at night, in absence of solar radiation.

Chapter 2
94
(1) INERTRANS is acronym of Translucent Inertia, project funded by the French National Research
Agency, PREBAT 2007).
2. Numerical methodology
The main challenge of the mathematical modeling of melting process is to properly represent the
moving melting front. There are two approaches to solve this problem: fixed grid methods where the
melting front is determined implicitly by the temperature/enthalpy distribution, and the deforming
grid methods where the energy equation is formulated for each state, and then coupled by energy
balance at the solid-liquid boundary (Stefan’s condition), the mesh moves to track the phase interface
position.
In this study, a fixed-grid modified “enthalpy” method is used, inspired by the work of Zivkovic et
al. [53] which allows a separate calculation of the temperature and the liquid fraction. This method
was previously used in several studies for different applications [54] [55] [56]. The main advantages
of this method are that the moving melting front does not necessitate to be treated explicitly, the
energy equation is analogous to the single-phase equation and a mushy region is allowed between the
two phases. The energy equation, with natural convection and radiation, is given as:
𝜌𝜕𝐻
𝜕𝑡= 𝑑𝑖𝑣(𝑘𝑔𝑟𝑎𝑑 𝑇) + ∅𝑠𝑜𝑙 Eq. 2-1
Where H is the total enthalpy:
𝐻 = ℎ + 𝐿𝐻𝑓𝑙 Eq. 2-2
and h is the sensible heat
ℎ = ∫ 𝐶𝑝 𝑑𝑇 𝑇
𝑇𝑚
Eq. 2-3
The fraction of the liquid is defined as:
𝑓𝑙 = 0 , 𝑖𝑓 𝑇 < 𝑇𝑚 (𝑠𝑜𝑙𝑖𝑑)
𝑓𝑙 = ]0,1[ , 𝑖𝑓 𝑇 = 𝑇𝑚 (𝑚𝑢𝑠ℎ𝑦 𝑟𝑒𝑔𝑖𝑜𝑛)
𝑓𝑙 = 1 , 𝑖𝑓 𝑇 > 𝑇𝑚 (𝑙𝑖𝑞𝑢𝑖𝑑) Eq. 2-4
The thermal conductivity is defined as:
𝑘 = 𝑘𝑠 , 𝑖𝑓 𝑇 < 𝑇𝑚
𝑘 = 𝑘𝑒𝑛ℎ𝑓𝑙 + 𝑘𝑠(1 − 𝑓𝑙) , 𝑖𝑓 𝑇 = 𝑇𝑚
𝑘 = 𝑘𝑒𝑛ℎ , 𝑖𝑓 𝑇 > 𝑇𝑚 Eq. 2-5

Chapter 2
95
The thermal conductivity is enhanced in the liquid phase using the enhanced conductivity method
coupled with the scaling theory approach explained in section 3.1.
In the convective zone,
𝑘𝑒𝑛ℎ~𝑘𝑙(1 + 𝑁𝑢𝑧) Eq. 2-6
Otherwise
𝑘𝑒𝑛ℎ = 𝑘𝑙 Eq. 2-7
𝑁𝑢𝑧 is the Nusselt number defined function of z, the height of the convective zone.
And ∅𝑠𝑜𝑙 is the radiative source term; the shortwave radiation through the PCM is modeled by means
of a solution procedure proposed by Gowreesunker [57] detailed in section 4.
The two-dimensional Eq. 2-8, obtained from Eq. 2-1 is then used:
𝜌𝐶𝑝𝜕ℎ
𝜕𝑡=𝜕
𝜕𝑥(𝑘
𝜕𝑇
𝜕𝑥) +
𝜕
𝜕𝑦(𝑘𝜕𝑇
𝜕𝑦) − 𝜌𝐿𝐻
𝜕𝑓𝑙𝜕𝑡+ ∅𝑠𝑜𝑙
Eq. 2-8
To solve the two-dimensional 2D phase change problem, the implicit finite volume method by
Patankar 1980 [58] is used. The computational domain is divided into rectangular control volumes
(CV) and the code is written in Matlab®.
The finite volume equations are derived by integrating Eq. 2-8 over a typical control volume. It is
also necessary, in time-dependent problems, to integrate with respect to time t over a small interval
Δt from t to t + Δt. After integration, we obtain the discretization equation as follows:
𝑎𝑃𝑇𝑃𝑡+∆𝑡 = 𝑎𝑊𝑇𝑊
𝑡+∆𝑡 + 𝑎𝐸𝑇𝐸𝑡+∆𝑡 + 𝑎𝑆𝑇𝑆
𝑡+∆𝑡 + 𝑎𝑁𝑇𝑁𝑡+∆𝑡 + 𝑏 Eq. 2-9
Where,
𝑎𝑊 = 𝑘𝑤𝛥𝑦
(∆𝑥)𝑤, 𝑎𝐸 = 𝑘𝑒
𝛥𝑦
(∆𝑥)𝑒, 𝑎𝑆 = 𝑘𝑠
𝛥𝑥
(∆𝑦)𝑠, 𝑎𝑁 = 𝑘𝑛
𝛥𝑥
(∆𝑦)𝑛
𝑎𝑃 = 𝑎𝑊 + 𝑎𝐸 + 𝑎𝑆 + 𝑎𝑁 + 𝑎𝑃0
𝑎𝑃0 =
𝜌𝐶𝑝∆𝑥𝛥𝑦
∆𝑡
𝑏 = 𝑎𝑃0𝑇𝑃
0 + ∅𝑠𝑜𝑙 Eq. 2-10
Where, the product 𝛥𝑥𝛥𝑦 defines the volume of each control volume, and the index “0” designates
the previous time step. Note that for the boundary nodes, the boundary conditions will be included in
the vector 𝑏. Deriving the discretization equation for each CV, we form a system of linear equations
that is written in a matrix form as:
𝐴 ∗ 𝑇 = 𝐵 Eq. 2-11

Chapter 2
96
When phase change occurs in the control volume P, the liquid fraction is calculated using Eq. 2-13
and it is strictly in the range ]0,1[ while the temperature is fixed to the melting temperature.
𝑇𝑃 ≡ 𝑇𝑚 Eq. 2-12
𝑓𝑙𝑃 = 𝑓𝑙𝑃0 +
𝑘𝑒∆𝑡
𝜌𝐿𝐻∆𝑥2(𝑇𝐸 − 𝑇𝑚) −
𝑘𝑤∆𝑡
𝜌𝐿𝐻∆𝑥2(𝑇𝑚 − 𝑇𝑊) +
𝑘𝑛∆𝑡
𝜌𝐿𝐻∆𝑦2(𝑇𝑁 − 𝑇𝑚) −
𝑘𝑠∆𝑡
𝜌𝐿𝐻∆𝑦2(𝑇𝑚 − 𝑇𝑆) +
∅𝑠𝑜𝑙
𝜌𝐿𝐻 Eq. 2-13
3. Melting with natural convection
3.1. Simplified model
The natural convection during melting process, is accounted for using the approach of scaling theory
[49] [50] together with the enhanced conductivity method [59]. At first, the PCM melting is ruled by
conduction, the convection effect starts in the melt when the criterion of distinct thermal boundary
layers [47] [49] [50] [60] is respected:
(s
𝐻)4
𝑅𝑎𝐻 ≥ 1 Eq. 2-14
Where s is the position of the melting front, H is the height of the enclosure and 𝑅𝑎𝐻 is given by:
𝑅𝑎𝐻 =𝑔𝛽𝐻3(𝑇ℎ − 𝑇𝑚)
𝛼𝜈 Eq. 2-15
Hence, the PCM liquid thermal conductivity is enhanced (Eq. 2-6) and the enhancement is performed
in a square shaped convective zone of surface (z x z) situated in the left superior corner of the
enclosure. The height z of the convective zone is assumed to be equal to sh, the thickness of the liquid
zone assessed at the top of the enclosure [47].
𝑧 = 𝑠ℎ Eq. 2-16
At each time-step, the value of the enhanced conductivity kenh that depends on z, must be updated.
Here, Rayleigh number is calculated in function of z:
𝑅𝑎𝑧 =𝑔𝛽𝑧3(𝑇ℎ − 𝑇𝑚)
𝛼𝜈 Eq. 2-17
and the Nusselt number 𝑁𝑢𝑧 is calculated function of the Rayleigh number. Many general Nusselt
number correlations for the natural convection inside an enclosure are found in the literature based
on the aspect ratio, Ra and Pr number restrictions. Some of them are listed in Table 2-1. Several
authors have presented Nusselt number correlations during melting process as summarized in
Table 2-2. Noting that, these correlations are based on numerical or experimental observations.
Therefore, they are valid under some restrictions such as the geometry configurations, PCM used,
thermal boundary conditions and variables under which the studies were performed [48]. It is also

Chapter 2
97
worthy to mention that the selection of the characteristic length in the formulas of Ra and Nu is very
critical; the average position of the melting front (sav) or either the height of the enclosure (H) could
be used [49][61].
Table 2-1: General Nusselt number correlations for natural convection problem in an enclosure
Ref. Characteristic
length Correlations Restrictions
Berkovsky and
Polevikov [62]
Width L
NuL = 0.22 (Pr
0.2 + PrRaL)
0.28
(H
L)−0.25
2 ≤ H/L ≤ 10
Pr ≤ 105
103 < RaL < 1010
NuL = 0.18 (Pr
0.2 + PrRaL)
0.29
1 ≤ H/L < 2
10−3 ≤ Pr ≤ 105
Pr
0.2 + prRaL > 10
3
Berkovsky and
Polevikov [50]
Height H
NuH
= 0.18 (Pr
0.2 + PrRaH)
0.29
(L
H)−0.13
1 ≤ H/L < 2
10−3 < Pr < 105
Pr
0.2 + prRaH (
L
H)3
> 103
NuH = 0.22 (Pr
0.2 + PrRaH)
0.28
(L
H)0.09
2 ≤ H/L < 10
Pr < 105
RaH < 1013
Seki et al. [63] Height H NuH = 0.36 RaH0.25Pr0.051 (
H
L)−0.11
5 < H/L < 47.5
3 < Pr < 40000
107 < RaH < 4 × 10⁹
Macgregor and
Emery [64] Width L
NuL = 0.42 RaL0.25Pr0.012 (
H
L)−0.3
104 < RaL < 107
10 ≤ H/L ≤ 40
1 ≤ Pr ≤ 2 × 10⁴
NuL = 0.046 RaL1/3
106 < RaL < 109
1 < H/L < 40
1 < Pr < 20
Markatos and
Pericleous [65] Width L
NuL = 0.143 RaL0.299
H/L = 1
103 < RaL < 106
NuL = 0.082 RaL0.329
H/L = 1
106 < RaL < 1012
Table 2-2: Nusselt number correlations for different phase change materials with natural convection during
melting process
Ref. PCM / geometry Correlations Restrictions
Wang et al.[14]
-Polyethylene glycol
900
-Rectangular cavity
heated from the side
𝑁𝑢
= 0.0219 𝑅𝑎0.387𝑃𝑟0.019 (𝐻
𝛿)0.0625
2.02x10⁶ ≤ Ra ≤ 2.61 ×
107 𝑆𝑡𝑒. 𝐹𝑜 = 0.001 −
0.125
𝑃𝑟 = 804 − 1055

Chapter 2
98
Yanxia et al.
[39]
- Ethanolamine–water
binary mixture
- Rectangular
enclosure heated from
its vertical wall
𝑁𝑢 = 0.198 𝑆𝑡𝑒−0.122 𝑅𝑎0.258𝑃𝑟0.018
The valid range of the
correlation is 0.04Nu
value.
Ho and Viskanta
[66]
- n-Octadecane
- Rectangular cavity
with conducting
vertical walls.
𝑁𝑢 = 0.189 𝑅𝑎0.319 103 ≤ Ra ≤ 4.1 × 10⁵
Gau and Viskanta
[67]
- Gallium
- Rectangular test cell Nu = 0.0631 (
Ra
Ste)0.274
Valid for conduction,
mixed and convection
regimes.
Pal and Joshi
[68]
-n-triacontane
- A side heated tall
enclosure under
constant heat flux
boundary conditions
Nu = 0.01559 (Ra
15⁄
Ste. Fo)
0.4
𝑅𝑎
15⁄
𝑆𝑡𝑒. 𝐹𝑜< 0.0003
Bejan
[49] -
𝑁𝑢 = (2θ)−1
2 + [0.35𝑅𝑎1
4 −
(2θ)−1
2] [1 + (0.0175𝑅𝑎3
4𝜃3
2)−2
]−1
2
0 ≤ Ra ≤ 108
0 ≤ Ste. Fo ≤ 0.2
Pr=50
HL⁄ = 1
𝜃 = 𝑆𝑡𝑒. 𝐹𝑜
Nu∞ = 0.35Ra1/4
At later times Nusselt
number has an asymptotic
shape Pr>1
Lim and Bejan
[69] - 𝑁𝑢 =
0.35 𝑅𝑎1/4
[1 + (0.143/𝑃𝑟)9/16]4/9
covering small and large Pr
numbers RaH
Therefore, at each time step, the start of natural convection effect is tested, the height of the convective
zone z is evaluated, Raz and Nuz numbers are calculated and the thermal conductivity of liquid PCM
is enhanced in the convective zone. So as a condition, when the ordinate of the PCM node y is greater
than H-z (the PCM node is in the upper region), the enhanced conductivity method is applied. This
enhancement scheme of the thermal conductivity is presented in Figure 2-1.
Noting that the calculations in the present work are done in the mixed regime, i.e., the bottom part of
the enclosure is always ruled by conduction.

Chapter 2
99
3.2. CFD model
In this study, a CFD model is created and implemented in COMSOL Multiphysics 4.4 solver. The
modified heat capacity method is employed. This method is well adapted for commercial finite
If < 1
Calculation of
(𝑠
𝐻)4
𝑅𝑎𝐻 If ≥1
Advance time step
Evaluation of s
Liquid PCM
kenh = 𝑘𝑙
If 𝑇 > 𝑇𝑚
Convection starts in
liquid PCM
𝑧 = 𝑠ℎ
If y > H-z
kenh~kl(1+Nuz)
No
Yes
Figure 2-1: strategy retained to enhance the liquid thermal conductivity in the enclosure
T> STIME
Start time
Yes
No
End

Chapter 2
100
element solvers [70], and has been validated both numerically [71] and experimentally [72]. The heat
diffusion equation is given as:
𝜌𝐶𝑝𝜕𝑇
𝜕𝑡+ ∇(−𝑘∇𝑇) + 𝜌𝐶𝑝�� ∇𝑇 = 0
Eq. 2-18
The natural convection in the liquid PCM is taken into account for by means of the momentum
equation as follows:
𝜌𝜕��
𝜕𝑡+ 𝜌(�� ∇)�� = −∇𝑃 + 𝜇𝑙∇
2�� + 𝐹 𝑏 + 𝐹 𝑎 Eq. 2-19
Where 𝐹 𝑏 is the buoyancy force given by the Boussinesq approximation:
𝐹 𝑏 = −𝜌𝑙(1 − 𝛽(𝑇 − 𝑇𝑚))𝑔 Eq. 2-20
And 𝐹 𝑎 is the Darcy damping term [73]
𝐹 𝑎 = −𝐴(𝑇). �� Eq. 2-21
The parameter A(T), defined in the momentum equation to ensure zero velocities in solid region
(Carman–Koseny relation), is given as:
𝐴(𝑇) =𝐶(1 − 𝐵1(𝑇))
2
𝐵1(𝑇)3 + 𝑞
Eq. 2-22
Where C is a very large number and q is a very small number to evade the division by zero. Our
model used the values C = 1.6e+06 kg/ (m3. s) and q = 1e-03.
The function B1(T) is the continuous and twice-derivable liquid fraction function defined from
function B0(T):
𝐵0(𝑇) = {
0 𝑇 < (𝑇𝑚 − ∆𝑇/2) 𝑇−𝑇𝑚+∆𝑇/2
∆𝑇 (𝑇𝑚 −
∆𝑇
2) < 𝑇 < (𝑇𝑚 +
∆𝑇
2)
1 𝑇 > (𝑇𝑚 + ∆𝑇/2)
Eq. 2-23
The changing in the PCM thermo-physical properties are given function of temperature using the
following equations:
𝜇(𝑇) = 𝜇𝑙 (1 +C(1 − B1(T))
2
𝐶0(B1(T)3 + q))
Eq. 2-24
𝜌(𝑇) = 𝜌𝑠 + (𝜌𝑙 − 𝜌𝑠)B1(T) Eq. 2-25
𝑘(𝑇) = 𝑘𝑠 + (𝑘𝑙 − 𝑘𝑠)B1(T) Eq. 2-26

Chapter 2
101
Where 𝜇 is the dynamic viscosity, ρ is the density and k the thermal conductivity of the PCM, for
both the liquid and solid phase of the PCM and 𝐶0=1 kg/ (m3. s).
The modified heat capacity is given as:
𝐶𝑝(𝑇) = 𝐶𝑝𝑠 + (𝐶𝑝𝑠 − 𝐶𝑝𝑙)B1(T) + 𝐿𝐻𝐷(𝑇) Eq. 2-27
Where
𝐷(𝑇) =𝑒
−(𝑇−𝑇𝑚)2
(∆𝑇 4⁄ )2
√𝜋. (∆𝑇 4⁄ )2
Eq. 2-28
The use of a Gaussian function for D(T) ensures that the latent heat is conserved through the process
since the integral of such function over the entire range melting temperature interval ΔT is always
equal to 1 and 𝐶0. For this study, a ΔT = 1 K is used.
3.3. Test case of melting with natural convection
Natural convection during the melting of Octadecane filled in a 2D square cavity of height H =0.1m
is investigated. The initial temperature is equal to the melting temperature T0=Tm=303.15K, and the
PCM is initially at solid state. The left heated vertical wall temperature is Th=313.15K, while the
horizontal walls are adiabatic. The cold right wall temperature is Tc=T0. When natural convection
begins developing in the liquid PCM, a non-uniform displacement of the melting front is obtained as
well as a non-uniform distribution of the heat flux at the solid-liquid interface. Table 2-3 summarizes
the thermo-physical properties of Octadecane. Approximate values of the thermo-physical properties
of Octadecane were used to estimate the governing parameters [74].
Figure 2-2: Schematic of the test case cavity filled with PCM.

Chapter 2
102
Table 2-3: Thermo-physical properties of Octadecane [74]
Property value
k (W/mK)
Cps= Cpl (J/kgK)
ρs= ρl (kg/m3)
0.2
1250
800
α (m2/s)
ν (m2/s)
2.10-7
10-5
𝐿𝐻(J/kg)
Tm (K)
ΔT (K)
1.25.105
303.15
10
β (1/K)
g (m/s2)
2.10-3
10
The problem is characterized by the following dimensionless numbers:
Stefan number of 𝑆𝑡𝑒 =𝐶𝑝(𝑇ℎ−𝑇𝑚)
𝐿𝐻= 0.1
Rayleigh number of 𝑅𝑎𝐻 = 108
Prandtl number of pr =ν
α= 50
To simplify the numerical model, we assume the follow: 1) the PCM is isotropic and homogenous,
2) the thermo-physical properties of the PCM are constant, 3) the Boussinesq approximation is
applicable, 4) the density change, and hence the volume change, of the PCM during melting is
neglected; 5) the flow in the liquid PCM is incompressible, laminar and Newtonian, 6) radiation and
viscous dissipation are neglected.
3.4. Comparison between simplified model and CFD model simulations
The simulations for a time range of 5000s (θ = SteFo = 0.01) for both CFD model and simplified
model are performed on a Dell Precision Tower 5810 using an Intel Xeon CPU E5-1650 v3 of speed
3.5 GHz, six cores (12 CPUs) and 16 GB of RAM.
A grid sensitivity analysis was performed to investigate the exactitude of the calculations. For the
simplified model, the simulations in Matlab are lastly executed with a grid size containing 225 control
volumes. The dimensionless time step is taken ∆θ =2x10⁻⁵ for a total simulation dimensionless time
of θ = SteFo = 0.01. While for the CFD model, the simulations in COMSOL are finally performed
with 15268 triangular elements of maximum size 1.3e-3m and minimum size 1.5e-5m. The computer
simulations of the simplified model run much faster than those of the CFD model (at least 45 times
faster). The computation time for different mesh sizes is presented in Table 2-4.

Chapter 2
103
Table 2-4: Comparison of the computation time between CFD and simplified models for different mesh sizes
COMSOL Matlab
Mesh type Number of Triangular
elements
Computation
time (s)
Number of control
volumes
Computation
time (s)
Normal 1284 184 25 2
Fine 2244 510 100 10
Finer 6626 1438 225 70
User defined 15268 3200 400 405
Extra fine 15866 3600 625 1906
According to the average Nusselt number curve at the left heated wall derived from the CFD model,
a correlation for the average Nusselt number is proposed in Eq. 2-29. The correlation is found for a
specific case (Ra=108, Ste=0.1 and Pr=50), the aim is to demonstrate the compatibility between both
models. Least square fitting is used to correlate NuH (R2=0.99):
NuH = 23.073 RaH0.0175 (
savH)0.0525
Eq. 2-29
Cases for different Nusselt number correlation and enhanced conductivity configurations are
presented in Table 2-5.
Table 2-5: Cases to be conducted in the simplified model
cases Nusselt number correlation Enhanced conductivity
1 𝑁𝑢𝑧 = 1 (conduction only) 𝑘𝑒𝑛ℎ = 𝑘𝑙
2 𝑁𝑢𝑧 = 0.18 (𝑃𝑟
0.2+𝑃𝑟𝑅𝑎𝑧)
0.29
[50] 𝑘𝑒𝑛ℎ~𝑘𝑙(1 + 𝑁𝑢𝑧 )
3 Correlation from CFD 𝑘𝑒𝑛ℎ~𝑘𝑙(1 + 𝑁𝑢𝑧 )
3.5. Validation of the simplified model for convection during melting
To test the numerical solutions conducted on Matlab using the simplified method, the transient
average value of the liquid fraction, the average position and the form of the melting front at four
distinct times were compared to the CFD model results in addition to numerical and experimental
results obtained by other researchers.
The first validation has been done by comparing the results of the average fraction of liquid function
of the dimensionless time (Figure 2-3) from the simplified model, to those of the CFD model and the
numerical benchmark on convective melting by Bertrand et al. [74]. The comparison with numerical
benchmark results was addressed by two participants: Lacroix and Le Quere. Different methods were
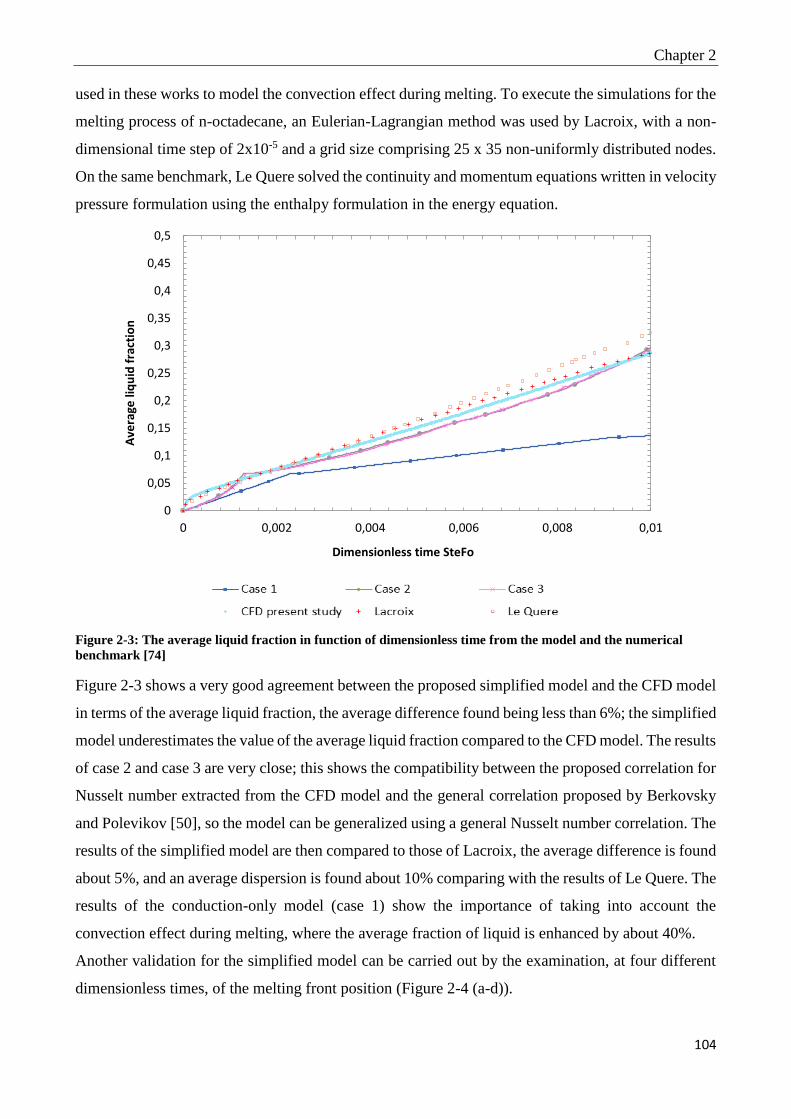
Chapter 2
104
used in these works to model the convection effect during melting. To execute the simulations for the
melting process of n-octadecane, an Eulerian-Lagrangian method was used by Lacroix, with a non-
dimensional time step of 2x10⁻⁵ and a grid size comprising 25 x 35 non-uniformly distributed nodes.
On the same benchmark, Le Quere solved the continuity and momentum equations written in velocity
pressure formulation using the enthalpy formulation in the energy equation.
Figure 2-3: The average liquid fraction in function of dimensionless time from the model and the numerical
benchmark [74]
Figure 2-3 shows a very good agreement between the proposed simplified model and the CFD model
in terms of the average liquid fraction, the average difference found being less than 6%; the simplified
model underestimates the value of the average liquid fraction compared to the CFD model. The results
of case 2 and case 3 are very close; this shows the compatibility between the proposed correlation for
Nusselt number extracted from the CFD model and the general correlation proposed by Berkovsky
and Polevikov [50], so the model can be generalized using a general Nusselt number correlation. The
results of the simplified model are then compared to those of Lacroix, the average difference is found
about 5%, and an average dispersion is found about 10% comparing with the results of Le Quere. The
results of the conduction-only model (case 1) show the importance of taking into account the
convection effect during melting, where the average fraction of liquid is enhanced by about 40%.
Another validation for the simplified model can be carried out by the examination, at four different
dimensionless times, of the melting front position (Figure 2-4 (a-d)).
0
0,05
0,1
0,15
0,2
0,25
0,3
0,35
0,4
0,45
0,5
0 0,002 0,004 0,006 0,008 0,01
Ave
rage
liq
uid
fra
ctio
n
Dimensionless time SteFo

Chapter 2
105
Figure 2-4: Comparison of melting front positions from the model and the numerical benchmark [74] at a) SteFo
= 0.0005. b) SteFo = 0.002. c) SteFo = 0.006. d) SteFo = 0.01
Examination of the melting front positions (Figure 2-4 (a-d)) shows that the results of the enhanced
conductivity model are close to those of the CFD model and are in good agreement for the overall
shape of the melting front. At SteFo = 0.0005, the position of the melting front for all cases is almost
0
0,1
0,2
0,3
0,4
0,5
0,6
0,7
0,8
0,9
1
0 0,1 0,2 0,3 0,4 0,5 0,6 0,7 0,8 0,9 1
Dim
en
sio
nle
ss Y
po
siti
on
Dimensionless X position
a)
0
0,1
0,2
0,3
0,4
0,5
0,6
0,7
0,8
0,9
1
0 0,1 0,2 0,3 0,4 0,5 0,6 0,7 0,8 0,9 1
Dim
en
sio
nle
ss Y
po
siti
on
Dimensionless X position
b)
0
0,1
0,2
0,3
0,4
0,5
0,6
0,7
0,8
0,9
1
0 0,1 0,2 0,3 0,4 0,5 0,6 0,7 0,8 0,9 1
Dim
en
sio
nle
ss Y
po
siti
on
Dimensionless X position
0
0,1
0,2
0,3
0,4
0,5
0,6
0,7
0,8
0,9
1
0 0,1 0,2 0,3 0,4 0,5 0,6 0,7 0,8 0,9 1
Dim
en
sio
nle
ss Y
po
siti
on
Dimensionless X position
d) c)

Chapter 2
106
the same and is parallel to the left heated wall; here, heat transfer is dominated by conduction. At
SteFo = 0.002, the average difference between the simplified model and the CFD model is within 1-
5% range. In addition, the average differences are within 5-9% and 2-3.5% range compared with the
results of Lacroix and Le Quere respectively. At SteFo = 0.006, the dispersions at the bottom half of
the cavity are within 5-9% while at the top they are around 15% comparing the present model with
the CFD model. The average difference is found about 8% and 14% compared with the results of
Lacroix and Le Quere respectively. At SteFo = 0.01 the dispersions at the bottom half of the cavity
are within 3-4%, while at the top half of the enclosure are within 8-11% range compared to CFD
model. One can notice that the melting front extends faster to the right at the top of the cavity in the
CFD model compared to the simplified one, the PCM melts quicker. Also, the differences, at the
bottom half of the enclosure, are within 3-4% and 1-2% range while at the top half of the enclosure
are within 6-8% and 7-11% range compared with the results of Lacroix and Le Quere respectively.
Noting that the enhanced conductivity approach does not apply at the bottom of the enclosure, a
difference in the shape of melting front can be observed at all times. The melting front corresponding
to the conduction-only model moves parallel to the heated left wall because of the constant liquid
thermal conductivity at the whole height of the enclosure; considering convection during melting
enhances the average melting front position by about at 40% at SteFo = 0.006 and about 55% at SteFo
= 0.01.
Figure 2-5 shows the results of the average position of the solid-liquid interface in the relatively short-
time interval 0 < SteFo < 0.006. Here, the comparison is made between the proposed model and the
CFD model on the one hand, and experimental benchmark solutions found in the reference [49] on
the other hand. The figure displays a good agreement between the results of the simplified model and
those of CFD; the average difference is found around 13%, also the value of the average position of
the melting front is underestimated compared to CFD model. In addition, the experimental results
obtained by Bareiss and Beer [75] and Ho and Viskanta [16] are fairly close to those of the present
model, the average difference is found about 9%. The average position of the melting front is
enhanced by about 40% taking the convection effect into consideration.

Chapter 2
107
4. Shortwave radiation through PCM
Phase change materials have variable optical characteristics that depends on their physical state, thus
investigating the short-wave radiation within the PCM is not quite simple. Gowreesunker [57]
evaluated the nodal optical properties such as the transmissivity and absorptivity in function of the
transient liquid fraction 𝑓𝑙.
When PCM changes from the fully solid to fully liquid, the fractional change in PCM transmittance
is given as:
𝛿 =𝜏𝑙 − 𝜏𝑠1 − 𝜏𝑠
Eq. 2-30
The relation between the extinction coefficient 𝜎 and the liquid fraction is written as:
𝜎 = 𝑓𝑙𝜎𝑙 + (1 − 𝑓𝑙)𝜎𝑠 Eq. 2-31
The advantage of this relation is that, during phase change, the extinction coefficient can be easily
found from the liquid fraction and the liquid and solid extinction coefficients.
The transmittance of the PCM is:
𝜏𝑃𝐶𝑀 = 10−𝑑 Eq. 2-32
Where d is the optical thickness:
0
0,05
0,1
0,15
0,2
0,25
0,3
0 0,01 0,02 0,03 0,04 0,05 0,06
Ave
rage
po
siti
on
of
the
me
ltin
g fr
on
t (x
10
)
Dimensionless time SteFo (x10)
Figure 2-5: Comparison of the average position of the melting front

Chapter 2
108
𝑑 = 𝜎. 𝑆 Eq. 2-33
Where S stands for the physical thickness
The absorptivity of the PCM evaluated at each node is given as:
𝛼𝑃𝐶𝑀 = [𝛿𝑓𝑙 + (1 − 𝑑)](1 − 𝜏𝑃𝐶𝑀) Eq. 2-34
To model combined phase change and radiation problems, the previous equations can be used. In
addition, according to Elarga et al. [76], the absorption solar radiation is divided equally between the
nodes representing each layer. Considering N=NxxNy nodes in the PCM cavity, the absorbed solar
radiation to be added as a source term to the energy equation at the node P is then given as:
∅𝑠𝑜𝑙 =𝑄𝑠𝑜𝑙 𝛼𝑃𝐶𝑀
𝑁
Eq. 2-35
Where 𝛼𝑃𝐶𝑀 is calculated using Eq. 2-34.
One can notice that modeling of the longwave radiation is neglected, because it has a marginal effect
on the melting process [77].
5. Application to the melting of fatty acid with natural convection and radiation
In this section, the simplified models for natural convection during melting process and for short
wave radiation presented in the above sections are applied to the fatty acid eutectic filling the glass
brick of the INERTRANS wall of total thickness 9.6 cm (Figure 2-6). The brick containing the PCM
is 32 mm wide and 191 mm height (aspect ratio H/L≈6). The temperature of the left heated vertical
wall is Th=40⁰C, whereas the horizontal walls are adiabatic. The cold right wall temperature is equal
to the initial temperature Tc=T0=10⁰C (Figure 2-7). The problem is characterized by the following
dimensionless numbers: Ste=0.257, RaH=3.72.109 and Pr=111.67. The PCM thermo-physical and
optical properties are summarized in Table 2-6 and
Table 2-7 respectively. The total incident solar radiation flux is assumed Qsol=500 W/m2 and the
material is considered to be absorbent and non-diffusing. The extinction coefficient for solid and
liquid PCM are σs = 200 (1/m) and σl = 2 (1/m) respectively [78]. Here, only the fatty acid layer
is considered and the heat transfer in the glass and other wall layers is not modeled.

Chapter 2
109
Figure 2-6: (a) Layout of the INERTRANS wall, (b) PCM filled in glass bricks [1]
Table 2-6: Thermo-physical properties of the fatty acid eutectic [1]
Property value
ks (W/mK) 0.182 (at 5.4 °C)
kl (W/mK) 0.182 (at 39 °C)
LH (J/kg) 152000
Cps (J/kgK) 1670
Cpl (J/kgK) 2090
ρs (kg/m3) 960 (at 35 °C)
ρl (kg/m3) 884 (at 13 °C)
Tm (°C) 21.3
α (m2/s) 9,85.10-8
ν (m2/s) 11.10-6
β (1/K) 3.1.10-3
Table 2-7: Optical properties of the fatty acid eutectic [1]
𝝉% 𝝆%
Liquid state Energetic 90 5
Optical 78 6
Solid state Energetic ≈ 0 53
Optical ≈ 0 56

Chapter 2
110
Figure 2-7: Schematic of fatty acid filled in glass bricks.
The accuracy of the calculations of the simplified model for combined natural convection and
radiation during melting is investigated by performing grid sensitivity analysis. Simulations are done
using 300 control volumes. To validate the model, the results are compared to those found by Fuentes
et al. [77][78] for a total simulation time of 24 minutes. For melting problem, they have used the
enthalpy method, to solve the radiative heat transfer they have used the discrete ordinate method
(DOM) and the lattice Boltzmann method (LBM) was used to solve fluid flow equations.
The results of the simplified model in terms of the average liquid fraction in Figure 2-8 are in very
good agreement compared to those of LBM-DOM model. Moreover, the natural convection enhances
the liquid fraction by around 35% compared to the conduction only model and the shortwave radiation
raises the liquid fraction by around 20% compared to the convection model.
Concerning the computational time, the simplified model simulations, performed on a Toshiba x64
based Processor using an Intel (R) core (TM) CPU M330 of speed 2.13 GHz, three cores and 4 GB
of RAM, run significantly faster (about five minutes) than those conducted using LBM-convection
model (6 hours 21 minutes) for natural convection during melting, and LBM-DOM model (130 hours
20 minutes) [78] for both natural convection and shortwave radiation during melting.

Chapter 2
111
Figure 2-8: Comparison of the average liquid fraction
6. Conclusion
A simplified model for melting of a phase change material with combined natural convection and
radiation is presented in this chapter. First, a simplified model for melting with natural convection is
developed without the full solution of N-S equations. This model is based on the scaling theory and
the enhanced thermal conductivity approach. Then, a full CFD model is created using COMSOL
Multiphysics adopting the modified heat capacity method, and a correlation for the Nusselt number
at the left heated wall is proposed based on CFD results, to calculate the enhanced conductivity.
The simplified model for natural convection during melting is validated against the CFD model, as
well as numerical and experimental benchmarks. Comparing the results to those of CFD model, the
difference is found less than 6%, in terms of the average liquid fraction, less than 14% in terms of the
position of the melting front at four different times, and around 13% in terms of the average position
of the melting front. On the other hand, the results of the simplified model show very good agreement
with those of the benchmark solutions. Accordingly, the results are enhanced by about 40% to 55%
when taking the natural convection effect into consideration compared to a conduction only model.
Then, a simplified method coupling the natural convection and the shortwave radiation during melting
is applied to model the melting of the fatty acid filled in glass bricks of the INERTRANS wall. The
0
0,1
0,2
0,3
0,4
0,5
0,6
0,7
0,8
0,9
1
0 200 400 600 800 1000 1200 1400
Liq
uid
fra
ctio
n
Time (sec)

Chapter 2
112
obtained results are in very good agreement to LBM-DOM results, in terms of the average liquid
fraction. It is found that natural convection increases the liquid fraction by about 35% compared to
the conduction only model, while the radiation increases the liquid fraction by about 20% compared
to the convection model. Concerning the computational time, the simplified model simulations run
significantly faster than those using the LBM-DOM model.
The simplified model considering both natural convection and radiation during melting process is
simple to implement and can manage efficiently convection-controlled phase change problems
without the full solution of the flow in a very small computational time. This simplified model is a
conceptual representation of reality, and it is developed for practical thermal engineering applications,
where yearly energy performance evaluation is sought, that cannot rely on highly computational time
needed in CFD simulations. Accordingly, it is suitable to control a real-time phase change process
that takes place in residential, commercial, and industrial latent heat thermal energy systems. As
future work, the simplified model will be used to simulate the thermal behavior of the whole
INERTRANS wall in a yearly basis where solidification process will have to be considered too. The
simplified model could also be integrated in an energy simulation tool (e.g. TRNSYS or EnergyPlus)
to evaluate the annual thermal behavior of a building
In the next chapter, the simplified model will be used to simulate the thermal behavior of the whole
INERTRANS wall. Then, it will be coupled with a global energy simulation tool (TRNSYS) to
evaluate the annual thermal behavior of a building.

Chapter 2
113
References
[1] Y. Berthou, P. H. Biwole, P. Achard, H. Sallée, M. Tantot-Neirac, and F. Jay, “Full scale
experimentation on a new translucent passive solar wall combining silica aerogels and phase change
materials,” Sol. Energy, vol. 115, pp. 733–742, May 2015.
[2] J. M. Fuentes, F. Kuznik, K. Johannes, and J. Virgone, “Development and validation of a new LBM-
MRT hybrid model with enthalpy formulation for melting with natural convection,” Phys. Lett. A, vol.
378, no. 4, pp. 374–381, 2014.
[3] E. Sparrow and J. Ramsey, “Melting and natural convection due to a vertical embedded heater.,” J
Heat Transf, pp. 100:368–70, 1978.
[4] E. Sparrow and S. Patankar, “Analysis of melting in the presence of natural convection in the melt
region,” ASME J Heat Transf, vol. 99:520–6, 1977.
[5] M. FARID and R. HUSIAN, “An electrical storage heater using the phase change method of heat
storage.,” Energy Convers Manag, vol. 30(3):219–30, 1990.
[6] A. Hasan, “Phase change material energy storage system employing palmitic acid,” Sol Energy, vol.
52:143–54, 1994.
[7] M. Lacroix and T. Duong, “Experimental improvements of heat transfer in a latent heat thermal energy
storage unit with embedded heat sources,” Energy Convers. Manag., vol. 39, no. 8, pp. 703–716, 1998.
[8] Y. Zhang and J. Yi, “A simple method, the T-history method of determining the heat of fusion specific
heat and thermal conductivity of phase change materials,” Meas Sci Technol, 1999.
[9] R. Velraj and R. seeniraj, “Heat transfer enhancement in a latent heat storage system,” Sol Energy,
1999.
[10] A. SARI and K. KAYGUSUZ, “Thermal energy storage system using stearic acid as a phase change
material,” Sol Energy, 2001.
[11] P. Lamberg, R. Lehtiniemi, and A.-M. Henell, “Numerical and experimental investigation of melting
and freezing processes in phase change material storage,” Int. J. Therm. Sci., vol. 43, no. 3, pp. 277–
287, Mar. 2004.
[12] F. Souayfane, F. Fardoun, and P. H. Biwole, “Different mathematical models of convection during
phase change,” presented at the REDEC conference, NDU university Lebanon, 2016, pp. 1–8.
[13] C. Beckermann and R. Viskanta, “Effect of solid subcooling on natural convection melting of a pure
metal,” J. Heat Transf., vol. 111, no. 2, pp. 416–424, 1989.
[14] Y. Wang, A. Amiri, and K. Vafai, “An experimental investigation of the melting process in a
rectangular enclosure,” Int. J. Heat Mass Transf., vol. 42, no. 19, pp. 3659–3672, 1999.
[15] D. Yanxia, Y. Yanping, J. Daiyong, C. Baoyi, and M. Jinfeng, “Experimental investigation on melting
characteristics of ethanolamine–water binary mixture used as PCM,” Int. Commun. Heat Mass Transf.,
vol. 34, no. 9–10, pp. 1056–1063, Nov. 2007.
[16] C.-J. Ho and R. Viskanta, “Heat Transfer During Melting From an Isothermal Vertical Wall,” J. Heat
Transf., vol. 106, no. 1, p. 12, 1984.
[17] Z. Gong, S. Devahastin, and A. Mujumdar, “Enhanced heat transfer in free convection-dominated
melting in a rectangular cavity with an isothermal vertical wall.,” Appl Therm Eng, vol. 19:1237–51.,
1999.
[18] Z. Younsi, A. Joulin, L. Zalewski, S. Lassue, and D. R. Rousse, “Phase change materials: a numerical
method for the behavior predictions,” in Proceedings of the Fourth International Conference on
Thermal Engineering: Theory and Applications January, 2009, pp. 12–14.
[19] R. E. Murray and D. Groulx, “Modeling convection during melting of a phase change material,” in
Proceedings of the COMSOL Conference, 2011.
[20] A. Brent, V. Voller, and K. Reid, “Enthalpy-porosity technique for modeling convection-diffusion
phase change: application tothe melting of a pure metal.,” Numer Heat Transfer, vol. 13:297–318.,
1988.
[21] S. Liu, Y. Li, and Y. Zhang, “Mathematical solutions and numerical models employed for the
investigations of PCMs׳ phase transformations,” Renew. Sustain. Energy Rev., vol. 33, pp. 659–674,
May 2014.
[22] V. Voller and M. Cross, “An enthalpy method for convection/ diffusion phase change,” Int J Numer
Methods Eng, vol. 24:271–84., 1987.

Chapter 2
114
[23] V. Shatikian, G. Ziskind, and R. Letan, “Numerical investigation of a PCM-based heat sink with
internal fins,” Int. J. Heat Mass Transf., vol. 48, no. 17, pp. 3689–3706, Aug. 2005.
[24] M. Faraji and H. El Qarnia, “Numerical study of melting in an enclosure with discrete protruding heat
sources,” Appl. Math. Model., vol. 34, no. 5, pp. 1258–1275, May 2010.
[25] A. R. Archibold, M. M. Rahman, D. Y. Goswami, and E. K. Stefanakos, “Analysis of heat transfer and
fluid flow during melting inside a spherical container for thermal energy storage,” Appl. Therm. Eng.,
vol. 64, no. 1–2, pp. 396–407, Mar. 2014.
[26] P. Wang, H. Yao, Z. Lan, Z. Peng, Y. Huang, and Y. Ding, “Numerical investigation of PCM melting
process in sleeve tube with internal fins,” Energy Convers. Manag., vol. 110, pp. 428–435, Feb. 2016.
[27] Z. Liu, Y. Yao, and H. Wu, “Numerical modeling for solid–liquid phase change phenomena in porous
media: Shell-and-tube type latent heat thermal energy storage,” Appl. Energy, vol. 112, pp. 1222–1232,
Dec. 2013.
[28] W.-B. Ye, D.-S. Zhu, and N. Wang, “Fluid flow and heat transfer in a latent thermal energy unit with
different phase change material (PCM) cavity volume fractions,” Appl. Therm. Eng., vol. 42, pp. 49–
57, Sep. 2012.
[29] P. Goyal, A. Dutta, V. Verma, and I. T. R. Singh, “Enthalpy Porosity Method for CFD Simulation of
Natural Convection Phenomenon for Phase Change Problems in the Molten Pool and its Importance
during Melting of Solids.”
[30] S. Wang, A. Faghri, and T. L. Bergman, “A comprehensive numerical model for melting with natural
convection,” Int. J. Heat Mass Transf., vol. 53, no. 9–10, pp. 1986–2000, Apr. 2010.
[31] A. Faghri and Y. Cao, “Performance characteristics of a thermal energy storage module: a transient
PCM/forced convection conjugate analysis,” Int. J. HeatMass Transfer, pp. 93–101, 1991.
[32] P. Damronglerd and Zhang, “Modified temperature-transforming model for convection-controlled
melting,” AIAA J. Thermophy. Heat Transfer 21, pp. 203–208., 2007.
[33] x zeng and A. Faghri, “A temperature transforming model for binary solid–liquid phase change
problems: Part I – mathematical modeling and numerical methodology,” pp. 467–480, 1994.
[34] K. Morgan, “A numerical analysis of freezing and melting with convection,” Comp. Meth. App. Eng.,
vol. Vol. 28, pp. 275–84, 1981.
[35] D. Groulx and P. H. Biwole, “Solar PV Passive Temperature Control Using Phase Change Materials,”
2014.
[36] D. Chatterjee and S. Chakraborty, “An enthalpy-based lattice Boltzmann model for diffusion
dominated solid–liquid phase transformation,” Phys. Lett. A, vol. 341, no. 1–4, pp. 320–330, Jun. 2005.
[37] E. A. Semma, M. El Ganaoui, and R. Bennacer, “Lattice Boltzmann method for melting/solidification
problems,” Comptes Rendus Mécanique, vol. 335, no. 5–6, pp. 295–303, May 2007.
[38] C. Huber, A. Parmigiani, B. Chopard, M. Manga, and O. Bachmann, “Lattice Boltzmann model for
melting with natural convection,” Int. J. Heat Fluid Flow, vol. 29, no. 5, pp. 1469–1480, Oct. 2008.
[39] J. M. Fuentes, “Développement d’un modèle de Boltzmann sur gaz réseau pour l’étude du changement
de phase en présence de convection naturelle et de rayonnement,” INSA de Lyon, 2013.
[40] N. Hannoun, V. Alexiades, and T. Z. Mai, “A reference solution for phase change with convection,” Int
J Numer Methods Fluids, vol. 48, pp. 1283–1308, 2005.
[41] N. Hannoun, V. Alexiades, and T. Z. Mai, “Resolving the controversy over tin and gallium melting in a
rectangular cavity heated from the side,” Numer Heat Transfer, vol. 44, pp. 253–276, 2003.
[42] M. M. Prieto and B. González, “Fluid flow and heat transfer in PCM panels arranged vertically and
horizontally for application in heating systems,” Renew. Energy, vol. 97, pp. 331–343, Nov. 2016.
[43] R. Kahraman, “A simplified model for melting of ice with natural convection,” Int. Commun. Heat
Mass Transfer, vol. 25, pp. 359–368, 1998.
[44] P. Johansson, “Advanced Thermal Energy Storage Heat Transfer Study with Use of Comsol and
Matlab,” 2011.
[45] M. Costa and D. Buddhi, “Numerical simulation of a latent heat thermal energy storage system with
enhanced heat conduction.,” Energy Convers Manag, vol. 39:319–30., 1998.
[46] P. Dolado, A. Lazaro, J. M. Marin, and B. Zalba, “Characterization of melting and solidification in a
real scale PCM-air heat exchanger: Numerical model and experimental validation,” Energy Convers.
Manag., vol. 52, no. 4, pp. 1890–1907, Apr. 2011.
[47] G. Vidalain, L. Gosselin, and M. Lacroix, “An enhanced thermal conduction model for the prediction
of convection dominated solid–liquid phase change,” Int. J. Heat Mass Transf., vol. 52, no. 7–8, pp.
1753–1760, Mar. 2009.

Chapter 2
115
[48] A. Castell and C. Solé, “An overview on design methodologies for liquid–solid PCM storage systems,”
Renew. Sustain. Energy Rev., vol. 52, pp. 289–307, Dec. 2015.
[49] P. Jany and A. Bejan, “Scaling theory of melting with natural convection in an enclosure,” Int. J. Heat
Mass Transf., vol. 31, no. 6, pp. 1221–1235, Jun. 1988.
[50] A. Bejan, Convection heat transfer, Fourth edition. Hoboken, New Jersey: Wiley, 2013.
[51] M. Lacroix and M. Benmadda, “Numerical simulation of natural convectiondominated melting and
solidification from a finned vertical wall,” Numer. Heat Transfer, no. Part A Appl. 31, pp. 71–86,
1997.
[52] R. Velraj, R. seeniraj, B. Hafner, C. Faber, and K. Schwarzer, “HEAT TRANSFER ENHANCEMENT
IN A LATENT HEAT STORAGE SYSTEM,” Solar Energy, vol. 65, no. No. 3, pp. 171–180, 1999.
[53] B. Zivkovic and I. Fujii, “An analysis of isothermal phase change of phase change material within
rectangular and cylindrical containers,” Sol. Energy, vol. 70, no. 1, pp. 51–61, 2001.
[54] Z. Han, M. Zheng, F. Kong, F. Wang, and Z. Li, “Numerical simulation of solar assisted ground-
source heat pump heating system with latent heat energy storage in severely cold area.,” Applied
Thermal Engineering, vol. 28(11–12), 1427–1436, 2008.
[55] A. Najjar and A. Hasan, “Modeling of greenhouse with PCM energy storage,” Energy Convers.
Manag., vol. 49, no. 11, pp. 3338–3342, Nov. 2008.
[56] Q. Qi, S. Deng, and Y. Jiang, “A simulation study on a solar heat pump heating system with seasonal
latent heat storage,” Sol. Energy, vol. 82, no. 8, pp. 669–675, Aug. 2008.
[57] B. L. Gowreesunker, S. B. Stankovic, S. A. Tassou, and P. A. Kyriacou, “Experimental and numerical
investigations of the optical and thermal aspects of a PCM-glazed unit,” Energy Build., vol. 61, pp.
239–249, Jun. 2013.
[58] S. V. Patankar, Numerical heat transfer and fluid flow. New York: McGraw-Hill., 1980.
[59] F. Souayfane, P. H. Biwole, and F. Fardoun, “MODELE SIMPLIFIE POUR LA PRISE EN COMPTE
DE LA CONVECTION NATURELLE DANS LA MODELISATION DU CHANGEMENT DE
PHASE SOLIDE-LIQUIDE.”
[60] M. Favre-Marinet and S. Tardu, Convective heat transfer: solved problems. London : Hoboken, NJ:
ISTE ; Wiley, 2009.
[61] B. W. Webb and R. VISKANTA, “On the characteristic length scale for correlating melting heat
transfer data,” Int. Commun. Heat Mass Transfer, vol. 12, pp. 637–646, 1985.
[62] I. Catton, Natural convection in enclosures, vol. 6. Toronto: in Proceedings of the 6th International
Heat Transfer Conference, 1978.
[63] N. Seki, S. Fukusako, and H. Inaba, “Heat-Transfer of Natural-Convection in a Rectangular Cavity
with Vertical Walls of Different Temperatures.,” Bulletin of the Jsme-Japan Society of Mechanical
Engineers, vol. 21(152), pp. 246–253, 1978.
[64] R. K. Macgregor and A. P. Emery, “Free convection through vertical plane layers: moderate and high
Prandtl number fluids,” J. Heat Transfer, vol. 91, 1969.
[65] N. C. Markatos and K. A. Pericleous, “Laminar and turbulent natural convection in an enclosed
cavity,” Int. J. Heat Mass Transf., vol. 27, no. 5, pp. 755–772, May 1984.
[66] C.-J. Ho and R. Viskanta, “Inward solid-liquid phase-change heat transfer in a rectangular cavity with
conducting vertical walls,” Int. J. Heat Mass Transf., vol. 27, no. 7, pp. 1055–1065, Jul. 1984.
[67] C. Gau and R. Viskanta, “Melting and Solidification of a Pure Metal on a Vertical Wall,” J. Heat
Transf., vol. 108, no. 1, p. 174, 1986.
[68] D. Pal and Y. K. Joshi, “Melting in a side heated tall enclosure by a uniformly dissipating heat source,”
Int. J. Heat Mass Transf., vol. 44, no. 2, pp. 375–387, 2001.
[69] J. S. Lim and A. Bejan, “The Prandtl Number Effect on Melting Dominated by Natural Convection,” J.
Heat Transf., vol. 114, no. 3, p. 784, 1992.
[70] S. K. Saha and P. Dutta, “Heat transfer correlations for PCM-based heat sinks with plate fins,” Appl.
Therm. Eng., vol. 30, no. 16, pp. 2485–2491, Nov. 2010.
[71] W. Ogoh and D. Groulx, “Stefan’s Problem: Validation of a One-Dimensional Solid-Liquid Phase
Change Heat Transfer Process,” in Comsol Conference 2010, 2010.
[72] P. H. Biwole, P. Eclache, and F. Kuznik, “Phase-change materials to improve solar panel’s
performance,” Energy Build., vol. 62, pp. 59–67, Jul. 2013.
[73] V. R. Voller and C. Prakash, “A fixed grid numerical modelling methodology for convection-diffusion
mushy region phase-change problems,” Int. J. Heat Mass Transfer, vol. 30 (8), pp. 1709-1719., 1987.

Chapter 2
116
[74] O. Bertrand et al., “Melting driven by natural convection A comparison exercise: first results,”
International Journal of Thermal Sciences, vol. 38 (1), pp. 5–26, 1999.
[75] M. Bareiss and H. Beer, “Experimental investigation of melting heat transfer with regard to different
geometric arrangements,” Int. Commun. Heat Mass Transf., vol. 11, no. 4, pp. 323–333, 1984.
[76] H. Elarga, M. De Carli, and A. Zarrella, “A simplified mathematical model for transient simulation of
thermal performance and energy assessment for active facades,” Energy Build., vol. 104, pp. 97–107,
Oct. 2015.
[77] J. Miranda Fuentes, K. Johannes, F. Kuznik, M. Cosnier, and J. Virgone, “Melting with convection and
radiation in a participating phase change material,” Appl. Energy, vol. 109, pp. 454–461, Sep. 2013.
[78] J. M. Fuentes, “Développement d’un modèle de Boltzmann sur gaz réseau pour l’étude du changement
de phase en présence de convection naturelle et de rayonnement,” INSA de Lyon, 2013.

Chapter 2
117
Complementary sections to chapter 2
A) Nusselt number correlation
Based on the average Nusselt number curve at the left heated wall derived from the CFD model,
shown in Figure 1, a correlation was proposed in section 2.4.
The average Nusselt number is defined as:
𝑁𝑢 = ∫𝜕𝑇
𝜕𝑥
1
0
𝑑𝑦 (1)
where, T is the temperature (K), x and y are the coordinates.
Or
𝑁𝑢 =ℎ.𝐻
𝑘𝑙 (2)
where H is the height of the cavity, 𝑘𝑙 is the thermal conductivity for the liquid PCM and h is the
convective heat transfer calculated as:
ℎ =𝑄
∆𝑇 (3)
Q is the heat flux at the left heated wall (W/m2) found in COMSOL, ∆𝑇 = 𝑇ℎ − 𝑇𝑚 with Th (K) is
the hot temperature at the left vertical wall and Tm (K) is the melting temperature
The correlation is found for a specific case, the aim is to demonstrate the compatibility between both
models: the simplified developed model and the CFD model. This correlation was used to calculate
the enhanced conductivity implemented in the simplified model.
Figure 1: Average value for Nusselt number at the left hot vertical wall from Comsol software
0
20
40
60
80
100
120
140
0 500 1000 1500 2000 2500 3000 3500 4000 4500 5000
Nu
ssel
t n
um
ber
Time (sec)

Chapter 2
118
The results of the simplified model for two different Nusselt number correlations (case 2 and case 3
in table 2-5), are found very close. This shows the compatibility between the proposed correlation for
Nusselt number extracted from the CFD model and the general correlation proposed by Berkovsky
and Polevikov [1]. So, the model can be generalized using a general Nusselt number correlation and
the general correlation is used in the rest of our work.
Noting that in chapter 2, we have modeled natural convection and radiation only during melting
process. According to many authors [2] [3], convection heat transfer is less important than conduction
during solidification process and in such walls as the INERTRANS wall solidification is more likely
to happen at night, in absence of solar radiation.
B) General concept of scaling theory proposed by Bejan
This section discusses the scaling laws adequate for two-dimensional natural convection in a
rectangular enclosure filled with PCM, with two differentially heated sides and insulated top and
bottom surfaces as illustrated in Figure 2.
Figure 2: Two-dimensional natural convection in rectangular enclosure
The natural convection melting process can be analyzed as a sequence of four regimes labeled (a)–
(d) in Figure 3. At first, when a small layer of liquid forms, the heat transfer is dominated by
conduction and the melting front moves parallel to the left heated wall first regime (Figure 3-a). This
regime is called the conduction limit regime, when the heat flux across the emerging vertical liquid
film is balanced entirely by the enthalpy absorbed at the two-phase interface,
𝑘𝑇ℎ − 𝑇𝑚
𝑠~𝜌𝐿𝐻
𝑑𝑠
𝑑𝑡
(1)
In dimensionless terms, this yield
𝑠
𝐻~𝜃1/2 (2)
where, 𝐿𝐻 is the latent heat of fusion; 𝜃 is the dimensionless time group

Chapter 2
119
𝜃 =𝑘(𝑇ℎ − 𝑇𝑚)
𝜌𝐿𝐻𝐻2
𝑡 = 𝑆𝑡𝑒 𝐹𝑜 (3)
and Ste and Fo are the Stefan and Fourier numbers respectively,
𝑆𝑡𝑒 =𝐶𝑝(𝑇ℎ − 𝑇𝑚)
𝐿𝐻
(4)
𝐹𝑜 =𝛼𝑡
𝐻2
(5)
The Nusselt number that corresponds to this conduction limit is
𝑁𝑢 =𝑄
𝑘(𝑇ℎ − 𝑇𝑚)~𝐻
𝑠~𝜃−1/2
(6)
where, Q is the total heat transfer rate through the left wall of the enclosure, per unit length in the
direction perpendicular to the plane.
Figure 3: Regimes for melting in the presence of significant natural convection when the phase-change material
is being heated from the side [4]
Secondly, because of the variation in density, the hot fluid rises and brings the heat to the solid via
the interface between the two. This causes a non-uniform distribution of heat, and therefore a slight
deformation of the melting front. The conduction process is gradually replaced by convection (Figure
3-b). This regime has been named the mixed regime (conduction + convection) and is characterized
by an upper liquid region that has become wide enough to be ruled by convection (i.e., its lateral
surfaces are lined by distinct boundary layers). Let the unknown dimension z be the height of this
upper region. Heat transfer across the rest of the liquid space (height H-z) continues to be ruled by
conduction. The convection in the upper region starts when the thermal boundary layer thickness δz
becomes of the same order of magnitude as the thickness of the liquid layer s i.e., δz~s at the
convection–conduction transition level: Considering that the liquid has a Prandtl number greater than
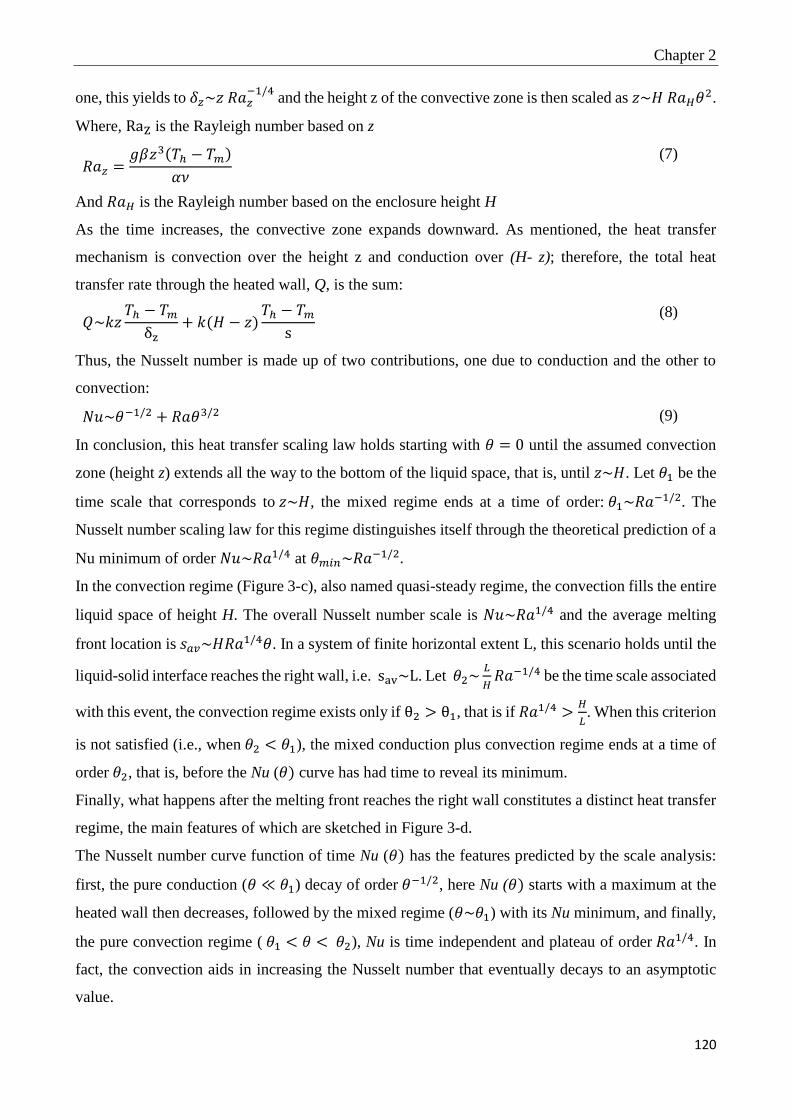
Chapter 2
120
one, this yields to 𝛿𝑧~𝑧 𝑅𝑎𝑧−1/4
and the height z of the convective zone is then scaled as 𝑧~𝐻 𝑅𝑎𝐻𝜃2.
Where, RaZ is the Rayleigh number based on z
𝑅𝑎𝑧 =𝑔𝛽𝑧3(𝑇ℎ − 𝑇𝑚)
𝛼𝜈
(7)
And 𝑅𝑎𝐻 is the Rayleigh number based on the enclosure height H
As the time increases, the convective zone expands downward. As mentioned, the heat transfer
mechanism is convection over the height z and conduction over (H- z); therefore, the total heat
transfer rate through the heated wall, Q, is the sum:
𝑄~𝑘𝑧𝑇ℎ − 𝑇𝑚δz
+ 𝑘(𝐻 − 𝑧)𝑇ℎ − 𝑇𝑚
s
(8)
Thus, the Nusselt number is made up of two contributions, one due to conduction and the other to
convection:
𝑁𝑢~𝜃−1/2 + 𝑅𝑎𝜃3/2 (9)
In conclusion, this heat transfer scaling law holds starting with 𝜃 = 0 until the assumed convection
zone (height z) extends all the way to the bottom of the liquid space, that is, until 𝑧~𝐻. Let 𝜃1 be the
time scale that corresponds to 𝑧~𝐻, the mixed regime ends at a time of order: 𝜃1~𝑅𝑎−1/2. The
Nusselt number scaling law for this regime distinguishes itself through the theoretical prediction of a
Nu minimum of order 𝑁𝑢~𝑅𝑎1/4 at 𝜃𝑚𝑖𝑛~𝑅𝑎−1/2.
In the convection regime (Figure 3-c), also named quasi-steady regime, the convection fills the entire
liquid space of height H. The overall Nusselt number scale is 𝑁𝑢~𝑅𝑎1/4 and the average melting
front location is 𝑠𝑎𝑣~𝐻𝑅𝑎1/4𝜃. In a system of finite horizontal extent L, this scenario holds until the
liquid-solid interface reaches the right wall, i.e. sav~L. Let 𝜃2~𝐿
𝐻𝑅𝑎−1/4 be the time scale associated
with this event, the convection regime exists only if θ2 > θ1, that is if 𝑅𝑎1/4 >𝐻
𝐿. When this criterion
is not satisfied (i.e., when 𝜃2 < 𝜃1), the mixed conduction plus convection regime ends at a time of
order 𝜃2, that is, before the Nu (𝜃) curve has had time to reveal its minimum.
Finally, what happens after the melting front reaches the right wall constitutes a distinct heat transfer
regime, the main features of which are sketched in Figure 3-d.
The Nusselt number curve function of time Nu (𝜃) has the features predicted by the scale analysis:
first, the pure conduction (𝜃 ≪ 𝜃1) decay of order 𝜃−1/2, here Nu (𝜃) starts with a maximum at the
heated wall then decreases, followed by the mixed regime (𝜃~𝜃1) with its Nu minimum, and finally,
the pure convection regime ( 𝜃1 < 𝜃 < 𝜃2), Nu is time independent and plateau of order 𝑅𝑎1/4. In
fact, the convection aids in increasing the Nusselt number that eventually decays to an asymptotic
value.
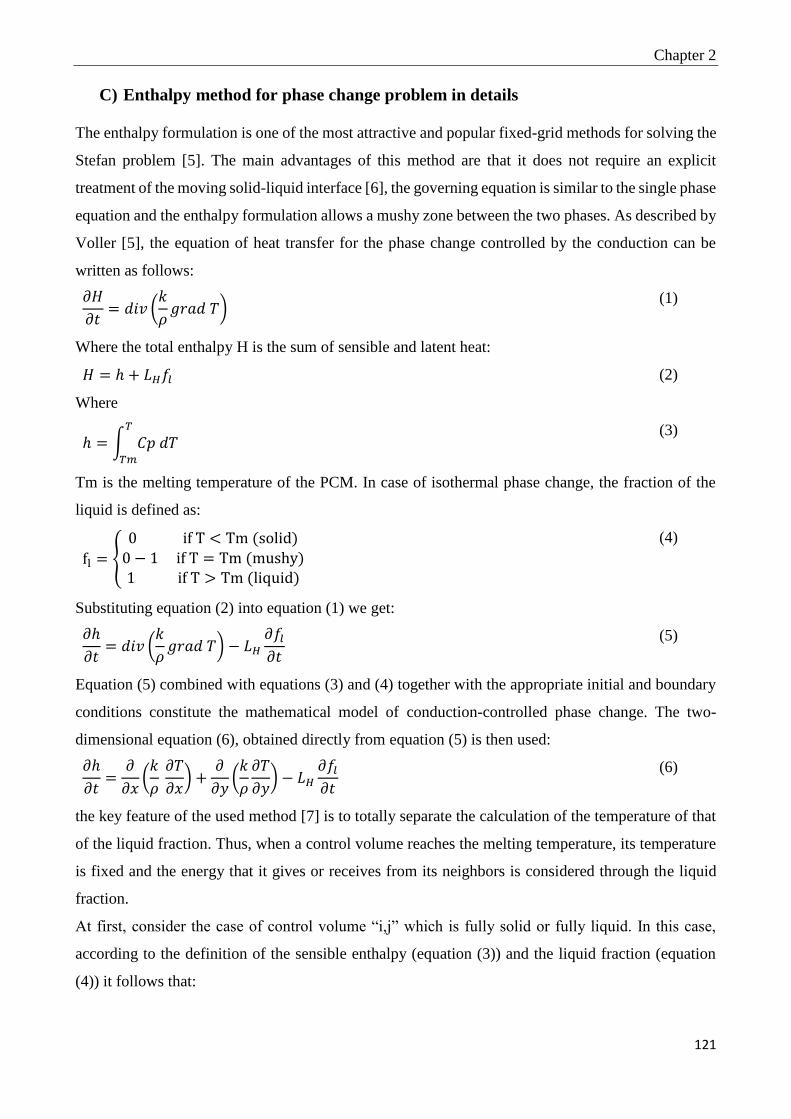
Chapter 2
121
C) Enthalpy method for phase change problem in details
The enthalpy formulation is one of the most attractive and popular fixed-grid methods for solving the
Stefan problem [5]. The main advantages of this method are that it does not require an explicit
treatment of the moving solid-liquid interface [6], the governing equation is similar to the single phase
equation and the enthalpy formulation allows a mushy zone between the two phases. As described by
Voller [5], the equation of heat transfer for the phase change controlled by the conduction can be
written as follows:
𝜕𝐻
𝜕𝑡= 𝑑𝑖𝑣 (
𝑘
𝜌𝑔𝑟𝑎𝑑 𝑇)
(1)
Where the total enthalpy H is the sum of sensible and latent heat:
𝐻 = ℎ + 𝐿𝐻𝑓𝑙 (2)
Where
ℎ = ∫ 𝐶𝑝 𝑑𝑇 𝑇
𝑇𝑚
(3)
Tm is the melting temperature of the PCM. In case of isothermal phase change, the fraction of the
liquid is defined as:
fl = {
0 if T < Tm (solid)0 − 1 if T = Tm (mushy)1 if T > Tm (liquid)
(4)
Substituting equation (2) into equation (1) we get:
𝜕ℎ
𝜕𝑡= 𝑑𝑖𝑣 (
𝑘
𝜌𝑔𝑟𝑎𝑑 𝑇) − 𝐿𝐻
𝜕𝑓𝑙𝜕𝑡
(5)
Equation (5) combined with equations (3) and (4) together with the appropriate initial and boundary
conditions constitute the mathematical model of conduction-controlled phase change. The two-
dimensional equation (6), obtained directly from equation (5) is then used:
𝜕ℎ
𝜕𝑡=𝜕
𝜕𝑥(𝑘
𝜌 𝜕𝑇
𝜕𝑥) +
𝜕
𝜕𝑦(𝑘
𝜌
𝜕𝑇
𝜕𝑦) − 𝐿𝐻
𝜕𝑓𝑙𝜕𝑡
(6)
the key feature of the used method [7] is to totally separate the calculation of the temperature of that
of the liquid fraction. Thus, when a control volume reaches the melting temperature, its temperature
is fixed and the energy that it gives or receives from its neighbors is considered through the liquid
fraction.
At first, consider the case of control volume “i,j” which is fully solid or fully liquid. In this case,
according to the definition of the sensible enthalpy (equation (3)) and the liquid fraction (equation
(4)) it follows that:

Chapter 2
122
𝜕ℎ𝑖,𝑗
𝜕𝑡= 𝐶𝑝
𝜕𝑇𝑖,𝑗
𝜕𝑡
(7)
And
𝜕𝑓𝑙𝜕𝑡
≡ 0 (8)
𝐶𝑝 represents the specific heat of the solid or liquid phase, depending on the phase of the considered
control volume. Therefore equation (6) becomes:
𝜌𝐶𝑝 𝜕𝑇
𝜕𝑡=𝜕
𝜕𝑥(𝑘
𝜕𝑇
𝜕𝑥) +
𝜕
𝜕𝑦(𝑘
𝜕𝑇
𝜕𝑦)
(9)
To solve the two-dimensional 2D phase change problem, the implicit finite volume method (Patankar
1980 [8]) is used, and the code is written in MATLAB®. The domain is divided into rectangular
control volumes CV (see Figure 4).
Figure 4: Typical control volume for the 2D situation
The finite volume equations are derived by integrating equation (9) over a typical control volume. It
is also necessary, in time-dependent problems, to integrate with respect to time t over a small interval
Δt from, say, t until t + Δt as following:
𝜌𝐶𝑝∫ ∫ ∫𝜕𝑇
𝜕𝑡
𝑛
𝑠
𝑒
𝑤
𝑡+∆𝑡
𝑡𝑑𝑥𝑑𝑦𝑑𝑡 = ∫ ∫ ∫
𝜕
𝜕𝑥(𝑘
𝜕𝑇
𝜕𝑥)
𝑛
𝑠
𝑒
𝑤
𝑡+∆𝑡
𝑡𝑑𝑥𝑑𝑦𝑑𝑡 + ∫ ∫ ∫
𝜕
𝜕𝑦(𝑘
𝜕𝑇
𝜕𝑦)
𝑛
𝑠
𝑒
𝑤
𝑡+∆𝑡
𝑡𝑑𝑥𝑑𝑦𝑑𝑡 (10)
After integration, we obtain the discretization equation as following:
𝑎𝑃𝑇𝑃𝑡+∆𝑡 = 𝑎𝑊𝑇𝑊
𝑡+∆𝑡 + 𝑎𝐸𝑇𝐸𝑡+∆𝑡 + 𝑎𝑆𝑇𝑆
𝑡+∆𝑡 + 𝑎𝑁𝑇𝑁𝑡+∆𝑡 + 𝑏 (11)
Or
𝑎𝑖,𝑗𝑇𝑖,𝑗𝑡+∆𝑡 = 𝑎𝑖−1,𝑗𝑇𝑖−1,𝑗
𝑡+∆𝑡 + 𝑎𝑖+1,𝑗𝑇𝑖+1,𝑗𝑡+∆𝑡 + 𝑎𝑖,𝑗−1𝑇𝑖,𝑗−1
𝑡+∆𝑡 + 𝑎𝑖,𝑗+1𝑇𝑖,𝑗+1𝑡+∆𝑡 + 𝑏 (12)
where,
𝑎𝑊 = 𝑎𝑖−1,𝑗 = 𝑘𝑤𝛥𝑦
(∆𝑥)𝑤
(13)

Chapter 2
123
𝑎𝐸 = 𝑎𝑖+1,𝑗 = 𝑘𝑒𝛥𝑦
(∆𝑥)𝑒
𝑎𝑆 = 𝑎𝑖,𝑗−1 = 𝑘𝑠𝛥𝑥
(∆𝑦)𝑠
𝑎𝑁 = 𝑎𝑖,𝑗+1 = 𝑘𝑛𝛥𝑥
(∆𝑦)𝑛
𝑎𝑃 = 𝑎𝑊 + 𝑎𝐸 + 𝑎𝑆 + 𝑎𝑁 + 𝑎𝑃0
𝑎𝑃0 =
𝜌𝐶𝑝∆𝑥𝛥𝑦
∆𝑡
𝑏 = 𝑎𝑃0𝑇𝑃
0
where, the product 𝛥𝑥𝛥𝑦 is the volume of control volume, and the index “0” designates the previous
time step. Note that for the boundary nodes, the boundary conditions will be included in the vector 𝑏
. Deriving the discretization equation for each control volume, we form a system of linear algebraic
equations that is written in a matrix form as:
𝐴 ∗ 𝑇 = 𝑏 (14)
In the control volume adjacent to the volume control where phase change occurs, a discontinuity in
the thermal properties occurs; a thermal conductivity at the interface must be used. The latter reflects
this discontinuity and it is calculated as the harmonic average of thermal conductivities of neighboring
control volumes.
The thermal conductivity of the control volume where the phase change occurs is approximated from
the liquid fraction:
𝑘𝑝𝑐 = 𝑘𝑙𝑓𝑙 + 𝑘𝑠(1 − 𝑓𝑙) (15)
where, the index “pc” represents the control volume control where phase change occurs, indices l and
s denote respectively the liquid and solid phases. Thus, for example, to calculate the thermal
conductivity at the interface "north" of a control volume P directly to the "south" of the control
volume N which changes phase, we use the following equation:
𝑘𝑒 =2𝑘𝑃𝑘𝑁𝑘𝑃 + 𝑘𝑁
(16)
Where, in this case:
𝑘𝑁 = 𝑘𝑝𝑐 (17)
Since the control volume N (i.e., located above the considered control volume P) undergoes a phase
change. A similar calculation is performed if the control volume undergoing phase change is below,
before or after the considered control volume.
Secondly, the case of a node “i” where phase change occurs is considered. Therefore, the liquid
fraction for this node is strictly in the range [0, 1] and the temperature for this node is equal to the
melting temperature:
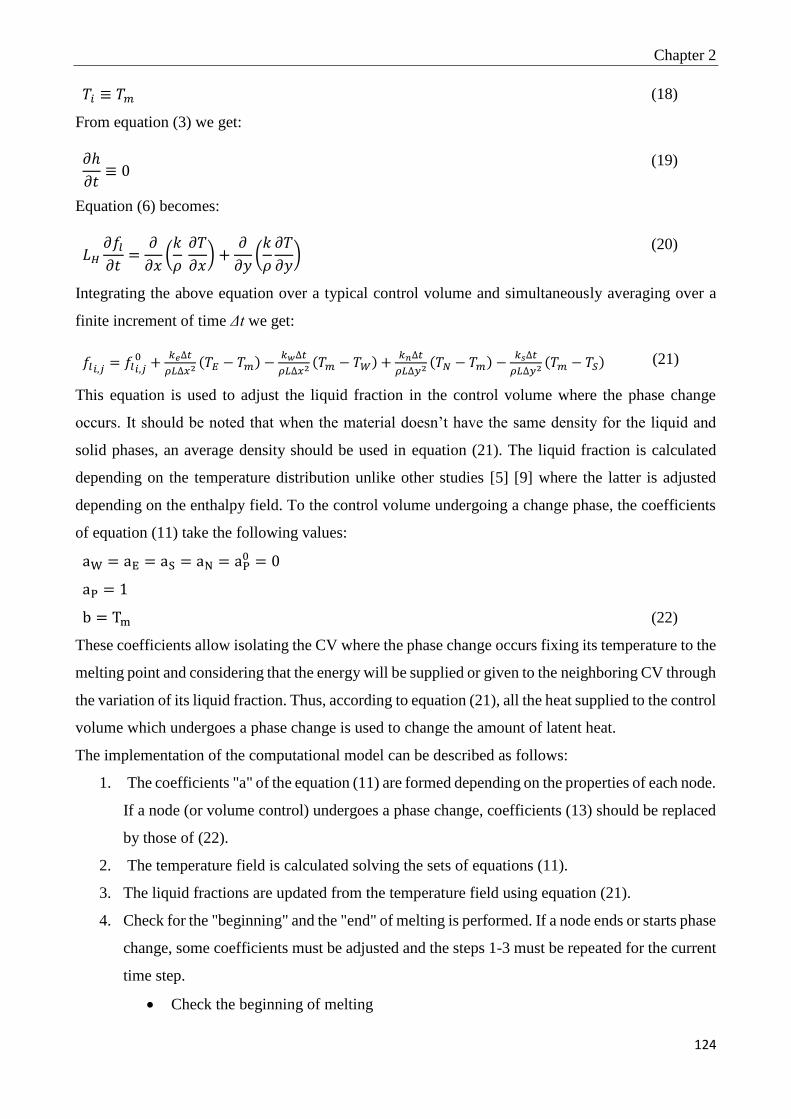
Chapter 2
124
𝑇𝑖 ≡ 𝑇𝑚 (18)
From equation (3) we get:
𝜕ℎ
𝜕𝑡≡ 0
(19)
Equation (6) becomes:
𝐿𝐻𝜕𝑓𝑙𝜕𝑡
=𝜕
𝜕𝑥(𝑘
𝜌 𝜕𝑇
𝜕𝑥) +
𝜕
𝜕𝑦(𝑘
𝜌
𝜕𝑇
𝜕𝑦)
(20)
Integrating the above equation over a typical control volume and simultaneously averaging over a
finite increment of time Δt we get:
𝑓𝑙𝑖,𝑗 = 𝑓𝑙𝑖,𝑗0 +
𝑘𝑒∆𝑡
𝜌𝐿∆𝑥2(𝑇𝐸 − 𝑇𝑚) −
𝑘𝑤∆𝑡
𝜌𝐿∆𝑥2(𝑇𝑚 − 𝑇𝑊) +
𝑘𝑛∆𝑡
𝜌𝐿∆𝑦2(𝑇𝑁 − 𝑇𝑚) −
𝑘𝑠∆𝑡
𝜌𝐿∆𝑦2(𝑇𝑚 − 𝑇𝑆) (21)
This equation is used to adjust the liquid fraction in the control volume where the phase change
occurs. It should be noted that when the material doesn’t have the same density for the liquid and
solid phases, an average density should be used in equation (21). The liquid fraction is calculated
depending on the temperature distribution unlike other studies [5] [9] where the latter is adjusted
depending on the enthalpy field. To the control volume undergoing a change phase, the coefficients
of equation (11) take the following values:
aW = aE = aS = aN = aP0 = 0
aP = 1
b = Tm (22)
These coefficients allow isolating the CV where the phase change occurs fixing its temperature to the
melting point and considering that the energy will be supplied or given to the neighboring CV through
the variation of its liquid fraction. Thus, according to equation (21), all the heat supplied to the control
volume which undergoes a phase change is used to change the amount of latent heat.
The implementation of the computational model can be described as follows:
1. The coefficients "a" of the equation (11) are formed depending on the properties of each node.
If a node (or volume control) undergoes a phase change, coefficients (13) should be replaced
by those of (22).
2. The temperature field is calculated solving the sets of equations (11).
3. The liquid fractions are updated from the temperature field using equation (21).
4. Check for the "beginning" and the "end" of melting is performed. If a node ends or starts phase
change, some coefficients must be adjusted and the steps 1-3 must be repeated for the current
time step.
• Check the beginning of melting

Chapter 2
125
For a given time step, if 𝑇𝑖,𝑗 ≥ 𝑇𝑚 and 𝑇𝑖,𝑗0 < 𝑇𝑚 it indicates that the melting just started in the control
volume. In this case, the node temperature 𝑇𝑖,𝑗 is fixed to the melting temperature Tm, and the
coefficients (13) must be replaced by coefficients (22). However, if the value 𝑇𝑖,𝑗 is simply modified
and set equal to Tm, a quantity of energy necessary for this CV to reach Tm is not considered.
Therefore, equation (21) takes the following form:
𝑓𝑙𝑖,𝑗 = 𝑓𝑙𝑖,𝑗0 +
𝑘𝑒∆𝑡
𝜌𝐿𝐻∆𝑥2(𝑇𝐸 − 𝑇𝑚) −
𝑘𝑤∆𝑡
𝜌𝐿𝐻∆𝑥2(𝑇𝑚 − 𝑇𝑊) +
𝑘𝑛∆𝑡
𝜌𝐿𝐻∆𝑦2(𝑇𝑁 − 𝑇𝑚) −
𝑘𝑠∆𝑡
𝜌𝐿𝐻∆𝑦2(𝑇𝑚 − 𝑇𝑆) −
𝐶𝑝𝑠
𝐿𝐻(𝑇𝑚 − 𝑇𝑖,𝑗
0 )
(23)
The last term on the right-hand side of equation (23) represents the amount of sensible heat that is
needed to raise the temperature of the control volume from the temperature in the previous time 𝑇𝑖,𝑗0 to
the melting temperature 𝑇𝑚. Consequently, that amount of heat cannot be used for melting the PCM.
• Check the end of melting
For a given time step, if 𝑓𝑙𝑖,𝑗≥ 1 and 𝑓𝑙𝑖,𝑗
0 < 1 it indicates that within this time step, the control
volume in question has melted completely. In this case, 𝑓𝑙𝑖,𝑗 is set to 1, and the coefficients (22) in
equation (11) are replaced by the coefficients (13) and the calculation is repeated for this time step.
In the time step in which the phase change boundary moves from the control volume in question to
the next one, the temperature of the volume control at the previous time is modified as follows:
𝑇𝑖,𝑗 𝑚𝑜𝑑𝑖𝑓𝑖𝑒𝑑0 = 𝑇𝑖,𝑗
0 −𝐿𝐻𝐶𝑝𝑙
(1 − 𝑓𝑙𝑖,𝑗0 )
(24)
This modified temperature for the previous time is used to recalculate the temperature distribution in
the PCM.
Where the last term on the right-hand side can be described as the amount of heat needed to
completely melt the control volume in question within the time step and which consequently cannot
be used to raise the temperature of the PCM.
D) CFD model numerical and experimental validation
In this study, the CFD model (chapter 2, section 3.2.) used to validate the proposed simplified model
is based on the modified heat capacity method. This method is well adapted for commercial finite
element solvers [10], and has been already validated both numerically in the references [11] [12] and
experimentally in [8] [13].
P.H. Biwole et al. [13] proposed a detailed mathematical and numerical modeling of heat and mass
transfers in coupled solar panel/phase change material architectures. A volume force was added to
the buoyancy term in the Navier–Stokes’ momentum conservation equation in order to force the

Chapter 2
126
velocity field to be zero when the PCM is solid. In order to simulate both conduction and convection,
the transient heat transfer diffusion equation was numerically solved simultaneously with the Navier–
Stokes equations using a finite elements method. To validate the model, the experimental and
simulated moving solid–liquid boundary was compared as well as the velocity field inside the PCM
container through a PIV apparatus.
Figure 5: Transient comparison of the simulated and actual liquid–solid moving boundary location.
The transient comparison of the simulated and actual liquid–solid moving boundary location was
carried out. On this first experiment, a fixed temperature of 40 ⁰C was imposed on the left side of the
PCM tank and 20 ⁰C was imposed on the right side. A photograph of the boundary was taken every
20 min. This comparison showed a good agreement between simulation and measurement except on
the top of the PCM domain as visible in Figure 5. The difference here is probably due to the air layer
which was not simulated.

Chapter 2
127
E) Thermal expansion
Experimentally, to prevent breaking from thermal expansion of the PCM, the bricks were initially
filled with the PCM at a temperature of 50 ⁰C and an air gap of 2 cm was left on top of the liquid
surface inside each brick.
Numerically, the geometry deformation due to volume expansion of the PCM was not modeled. This
may cause a numerical loss of mass. However, the lower density of the liquid phase of the Fatty Acids
(about 7.9 % lower than the solid density) means that a lower percentage of the mass in the system
may numerically disappear between the initial fully solid phase and the final fully liquid one. This in
turn may affect energy in the system, specifically the sensible energy.
In the numerical model, the ratio of sensible heat to latent heat is given by the Stefan number:
𝑆𝑡𝑒 =𝐶𝑝(𝑇ℎ−𝑇𝑚)
𝐿𝐻= 0.257
Thus, sensible energy represents about 20.44 % of the total energy stored, latent energy being the
rest, which is not affected by the density change since it enters the system at melting. Therefore, the
numerical loss of mass, and resulting energy difference in sensible heat represents approximately 7.9
% of the sensible amount, i.e. about 1.6 % of the total energy, which is an acceptable trade-off
between precision and easy implementation for engineering applications.
For octadecane there is no problem since ρs=ρl.

Chapter 2
128
References
[1] A. Bejan, Convection heat transfer, Fourth edition. Hoboken, New Jersey: Wiley, 2013.
[2] M. Lacroix and M. Benmadda, “Numerical simulation of natural convectiondominated melting and
solidification from a finned vertical wall,” Numer. Heat Transfer, no. Part A Appl. 31, pp. 71–86, 1997.
[3] R. Velraj, R. seeniraj, B. Hafner, C. Faber, and K. Schwarzer, “HEAT TRANSFER ENHANCEMENT
IN A LATENT HEAT STORAGE SYSTEM,” Solar Energy, vol. 65, no. No. 3, pp. 171–180, 1999.
[4] P. Jany and A. Bejan, “Scaling theory of melting with natural convection in an enclosure,” Int. J. Heat
Mass Transf., vol. 31, no. 6, pp. 1221–1235, Jun. 1988.
[5] V. Voller, “Fast implicit finite-difference method for the analysis of phase change problems,” Numer Heat
Transfer Part B, pp. 17:155–69, 1990.
[6] H. S. Carslaw and J. C. Jaeger, Conduction of heat in solids. Oxford, UK: Oxford University Press, 1947.
[7] B. Zivkovic and I. Fujii, “An analysis of isothermal phase change of phase change material within
rectangular and cylindrical containers,” Sol. Energy, vol. 70, no. 1, pp. 51–61, 2001.
[8] S. V. Patankar, Numerical heat transfer and fluid flow. New York: McGraw-Hill., 1980.
[9] M. Lacroix, “Numerical simulation of a shell-and-tube latent heat thermal energy storage unit,” Sol.
Energy, vol. 50, no. 4, pp. 357–367, 1993.
[10] S. K. Saha and P. Dutta, “Heat transfer correlations for PCM-based heat sinks with plate fins,” Appl.
Therm. Eng., vol. 30, no. 16, pp. 2485–2491, Nov. 2010.
[11] P. H. Biwole, D. Groulx, F. Souayfane, and T. Chiu, “Influence of fin size and distribution on solid-liquid
phase change in a rectangular enclosure,” Int. J. Therm. Sci., vol. 124, pp. 433–446, Feb. 2018.
[12] W. Ogoh and D. Groulx, “Stefan’s Problem: Validation of a One-Dimensional Solid-Liquid Phase Change
Heat Transfer Process,” in Comsol Conference 2010, 2010.
[13] P. H. Biwole, P. Eclache, and F. Kuznik, “Phase-change materials to improve solar panel’s performance,”
Energy Build., vol. 62, pp. 59–67, Jul. 2013.

CHAPTER 3
THERMAL BEHAVIOR OF A TRANSLUCENT
SUPERINSULATED LATENT HEAT ENERGY STORAGE
WALL IN SUMMERTIME

Chapter 3
131
Chapter 3. Thermal Behavior of a Translucent Superinsulated Latent
Heat Energy Storage Wall in Summertime
Résumé du chapitre en français
Comportement thermique estival d'un mur de stockage d'énergie translucide et super-isolé
Ce chapitre étudie le comportement thermique d'un mur solaire passif super isolant et translucide
composé d’un vitrage, d'aérogel de silice (matériau d'isolation transparent), et du MCP (acide gras)
contenu dans des briques de verre. L'objectif du mur MCP-Aérogel est de fournir stockage et
restitution d'énergie, éclairage naturel et super isolation thermique / acoustique. Ce mur a été
caractérisé expérimentalement en ambiance contrôlée et in situ sur un bâtiment grandeur nature situé
au sein du laboratoire PERSEE de l’Ecole des Mines de Paris à Sophia Antipolis, dans le sud de la
France. Les résultats expérimentaux ont montré que la performance thermique du mur est très élevée
en hiver, tandis qu'en été les gains de chaleur à travers le mur provoquent un problème de surchauffe
et le MCP n’arrive pas à se solidifier. Pour optimiser la performance du mur en été, un modèle
numérique simplifié décrivant les mécanismes de transfert de chaleur à travers le mur en tenant
compte de la convection naturelle dans le MCP liquide et de l'absorption et transmission du
rayonnement courte longueur d’onde a été développé sous MATLAB. Le modèle numérique structuré
est simple à mettre en œuvre et assez rapide pour être couplé avec TRNSYS afin d’évaluer la
performance thermique annuelle de l'ensemble du bâtiment.
Le modèle MATLAB-TRSNYS est ensuite validé en utilisant des résultats expérimentaux pendant
sept jours consécutifs en été et en hiver ; un bon accord est obtenu entre la température de surface
interne du mur simulée et mesurée expérimentalement, ainsi qu’en comparant la température de l'air
intérieur. L’erreur quadratique moyenne (EQM) et le pourcentage de l’erreur quadratique moyenne
(PEQM) correspondants sont calculés et se situent entre 0,57 ⁰C - 1,43 ⁰C et 1,87% - 6,99%
respectivement. La température dans la couche MCP calculée est également validée
expérimentalement en été et les EQM et PEQM trouvés sont respectivement de 1,92 ° C et de 5,33%.
Des solutions pour le problème de la surchauffe estivale parmi lesquelles des dispositifs d'ombrage,
la ventilation naturelle nocturne et l’utilisation d’un type de verre spécial qui présente des propriétés
de rayonnement solaire sélectif en fonction de la saison (Prisma Solar glass) ont été proposées.
Ensuite, le mur a été appliqué dans des différentes conditions climatiques et le confort thermique ainsi
que le cyclage du MCP ont été étudiés.
Chapter 3
132
Les conclusions suivantes peuvent être tirées de ce chapitre : (1) le modèle numérique développé
représente un bon point de départ pour des simulations sur différentes configurations du mur et permet
d'étudier pleinement ses capacités et ses inconvénients sous différentes conditions opératoires,
orientations, géométries et différents climats sans avoir besoin d'effectuer des analyses
expérimentales coûteuses ; (2) pour être plus réaliste, la convection naturelle dans le MCP liquide ne
doit pas être négligée lors de la modélisation du changement de phase ; (3) l'utilisation du vitrage
Prisma Solar glass à la place du verre ordinaire dans la composition de la paroi étudiée s'avère être
une technologie efficace pour résoudre le problème de surchauffe rencontré en été, tout en préservant
les avantages du mur pendant l'hiver ; (4) le confort thermique ainsi que le cyclage de MCP en été
dépendent des conditions climatiques. Dans le climat méditerranéen (classification Koppen Geiger
Csa), les stores vénitiens à lattes tournées à 45 degrés combinés avec un surplomb de 1 m de
projection peuvent assurer le confort thermique. Dans les climats océaniques (Cfb) et continentaux
humides (Dfb), le confort thermique peut être assuré par l'utilisation exclusive d'un surplomb de
projection 1 m et des stores vénitiens respectivement. Dans le climat subarctique (Dfc), le MCP
réalise un cycle diurne complet et le confort thermique peut être atteint en fournissant une ventilation
naturelle nocturne.
Dans le chapitre suivant, le coût global durant le cycle de vie (CCV) et du temps de retour sur
investissement (TRI) et l'optimisation du mur MCP-aérogel dans différentes conditions climatiques
seront étudiées en utilisant le modèle numérique validé.

Chapter 3
133
Abstract
This paper investigates the thermal performance of a translucent solar wall providing, concurrently,
storage and restitution of heat, super thermal-acoustic insulation and daylighting to the interior
environment. The wall is composed of glazing, silica aerogel used as a transparent insulation
material (TIM) and glass bricks filled with fatty acid, a eutectic phase change material (PCM). To
assess the TIM–PCM wall thermal behavior, experimentations were conducted in-situ in a full-sized
test cell located in Sophia Antipolis, southern France. Experimental data shows that the tested wall
is more effective in winter and might cause overheating during the summer mainly due to solar gains
and un-cycling behavior of PCM which remains in liquid state. To enhance the energy performance
of the wall in summertime, a numerical model describing the heat transfer mechanisms occurring in
the PCM layer in combination with the other transparent wall layers is developed. Then, the model
of the wall is linked to TRNSYS software to assess the thermal performance of the whole building.
The numerical model is validated experimentally, and a good agreement is shown comparing the
simulated values with the measured data for seven consecutive days in summer and winter. The
importance of considering the natural convection effect in the liquid PCM is also demonstrated.
Moreover, it was shown that shading devices can effectively reduce overheating while natural night
ventilation decreases the indoor temperature without affecting the PCM performance since the
outdoor temperature is always higher than the phase change temperature. The use of a glass with
selective solar reflection properties depending on the season instead of the ordinary glazing is shown
also to be very effective way to overcome the overheating problem. Finally, the TIM-PCM wall is
tested under different climate conditions and passive solutions are given to ensure thermal comfort
in summer season.
Keywords: TIM-PCM wall, natural convection, radiation, experimental validation, overheating,
thermal comfort.
Highlights:
• TIM-PCM wall provides heat storage/release, heat/sound insulation, and daylighting.
• Experimentations in-situ carried out in Sophia Antipolis, France.
• Numerical model of the heat transfer through the wall is developed.
• The model of the wall linked to TRNSYS is validated experimentally.
• Shading devices and nocturnal ventilation reduces overheating and discomfort.

Chapter 3
134
1. Introduction
Buildings account for almost 41% of the world’s energy consumption, which contributes to 30% of
the annual greenhouse gas emissions [1]. Trombe wall integrating phase change materials (PCM) is
a particular passive solar technique that has shown great potentialities and can reduce effectively the
building energy consumption. Basically, traditional Trombe walls [2]–[6] consist of an external
glazing, an air channel, and a high heat capacitance wall in contact with the indoor environment. To
improve the Trombe wall heat storage performance, phase change materials were implemented in the
wall composition and this technique has been investigated by numerous researchers [7]–[12]. During
the day, this wall is heated due to the incident solar radiation, melting the PCM. While at night, when
the outdoor temperature falls below the phase change temperature, the heat stored by the PCM is
released warming the building. Fiorito (2012) [8] conducted a parametric study on the use of PCM in
Trombe walls by varying the PCM position and the melting point temperature for five different
climates. they found enhanced performances for the modified Trombe wall. Zalewski et al. [9] studied
experimentally a Trombe wall with PCM components filled in the air channel and an insulating board
replacing the high capacitance wall. They found that the heat storage capacity of the wall is increased.
Also, an experimental Trombe wall (ventilated façade) with PCM was studied by De Gracia et al.
[10] during winter season. They found that the use of the ventilated facade with PCM improves
significantly the thermal behavior of the whole building. Kara and Kurnuç [13] investigated a PCM
Trombe wall with a novel triple glass (NTG) to improve the performance of conventional Trombe
wall system and overcome its main disadvantage: the overheating during the summer. However, in
all these applications, the light transmission was still absent.
On the other hand, transparent envelope components are key elements in buildings, especially in
offices and commercial buildings, that affect the energy performance and daylighting [14]–[16].
The integration of PCM in a transparent element of the building envelope enhances the ability of
energy storage, since the PCM will be directly exposed to the solar radiation. This technology aims
to smooth the indoor temperature, and decrease the energy fluctuations, providing daylighting at the
same time.
Phase change materials were integrated within double [17] [18] or triple glazing units [19], within
more complex glazing components [20] and within translucent solar walls [21]. The performance of
glazing with integrated PCM was investigated both experimentally [17]–[19], [22], [23] and
numerically [24]–[26]. Numerical models were specifically developed to take the interaction of PCM
with solar radiation into account [27]–[30]. All numerical models developed in these studies
neglected effect of natural convection in the liquid PCM. A literature review of the use of PCM in
transparent and translucent building envelope components can be found in [31].

Chapter 3
135
Manz et al. [21] studied a translucent wall for solar heating and daylighting composed of glass pan,
air gap, a translucent PCM and a transparent insulation material (TIM). They investigated
experimentally the optical PCM properties and a prototype of the TIM-PCM wall was constructed in
1994 in Swiss. Also, a one-dimensional numerical model (side effects were neglected) was developed
considering only heat transfer by conduction and the optical properties were simulated using a Monte
Carlo technique. The results show that the thermal and optical performance of the wall is very
promising and that the chosen PCM in solid state reduces the heat and light gains, thus they proposed
considering another PCM with a melting temperature of 21⁰C instead of 26.5⁰C. Weinläder et al. [32]
investigated experimentally the thermal behaviour of three glazing systems incorporated with a
plastic container filled with different PCM. However, in both studies the behavior of the system was
not investigated in detail in the hot season and inferences on thermal comfort were not evaluated
according to standards. To improve the poor thermal inertia of conventional glazing systems, Goa et
al. [27] studied the implementation of a PCM layer in combination with glass panes. They developed
a one-dimensional numerical model for heat and shortwave wave transmission, and the model was
validated experimentally. They found that the numerical tool represents a good base for simulations
on different configurations of PCM glazing systems.
Ismail et al. [28] investigated the thermal and optical properties of double-glazed units filled with
PCM, through numerical and experimental analysis. For the numerical model, a one-dimensional
formulation is developed, and a moving grid procedure is used within the PCM layer. They found
that the PCM filled glass window system is practical and thermally effective.
Although the inclusion of PCM in glazing systems can have a positive effect on thermal comfort and
contributes to improvements in the energy performance of buildings [22], the introduction of PCM
in a double-glazing unit results in a reduced thermal resistance negatively affecting the thermal
performance of the system. In addition, due to the complete melting of the PCM within the double-
glazing unit during summer, the internal surface temperature of the glazing may increase to a level
that may negatively affect thermal comfort [22].
In this chapter, a new kind of translucent storage wall proposed by the ANR INERTRANS (1) project
is studied. It is composed of glazing, granular Silica Aerogel and PCM filled in glass bricks [33].
Many features, that are not found in a conventional Trombe wall, are combined by such wall: it
provides heat gains from solar radiation, high thermal insulation, heat storage and release, natural
daylighting and visual communication to the outside world.
The thermal performance of the TIM-PCM wall is tested in a full-sized test cell located in Sophia
Antipolis, Southern France, within the center for Processes, Renewable Energies and Energy Systems
(PERSEE) of Mines Paristech graduate school. In winter season, particularly in sunny cold days, the

Chapter 3
136
PCM absorbs solar radiation, melts, and then releases the stored heat to the building at night by
solidifying. While during the summer, an overheating problem is encountered mainly due to solar
gains, the PCM remains in its liquid state and it is unable to release the stored heat at night [34]. Thus,
to enhance the energy performance of the wall, numerical modeling of the heat transfer mechanisms
in the wall materials is required and especially the melting with combined natural convection and
radiation. Usually, the building models with integrated PCM ignore the convection effect in the liquid
region, due to the complexity of CFD models and the required high computational time. It was proven
that this assumption is not always adequate and convection effect must be considered in liquid PCM
[35]–[43] [44].
Most previous works studying PCM-enhanced transparent components have been mainly developed
for the heating season, and there is little quantification of their real advantages in terms of energy
efficiency and indoor environmental comfort in summer season. Thus, the present paper focuses on
the analysis of the summer performance of the innovative translucent TIM-PCM wall and on its effect
on thermal comfort. The numerical model developed in this study aims to provide an easy tool to use
and fast enough to be adopted as a design tool, to investigate the potentials and disadvantages of the
novel TIM-PCM wall under different operative conditions and different climates and to propose
solutions to optimize its performance in summer, without the need of performing extensive and
expensive experimental analysis.
In this chapter, the TIM-PCM wall system is described in section 2, experimental data analysis is
presented in section 3. A numerical model of the heat transfer mechanisms through the wall including
natural convection and radiation during phase change is detailed in section 4, the code is written on
MATLAB. The TIM-PCM wall model is linked to TRNSYS software to simulate the thermal
behavior of the whole experimental cell in section 5. The MATLAB - TRNSYS model is validated
in summer and winter season against the experimental results and the importance of considering
natural convection in liquid PCM is demonstrated in section 6. Solutions for the overheating problem
including shading devices and nocturnal natural ventilation are proposed in section 7. A special type
of glass, Prisma solar glass, is used instead of the ordinary glazing in the TIM-PCM wall composition
in section 7.2. The thermal behavior of the wall is tested using another PCM with higher melting
temperature of 28⁰C in section 7.4. Finally, the model is exploited, and the thermal comfort range is
examined for three months in summer season under different climates conditions using ASHRAE
Standard 55-2010 in section 8 and section 9.

Chapter 3
137
2. System description
The TIM–PCM wall, proposed in the French INERTRANS (1) project, is shown in Figure 3-1 and
Figure 3-2. It is composed, from outside to inside, of a glass pane having a thickness of 0.8 cm, a 4cm
thick bed of granular silica aerogel (transparent insulation material), and eutectic of fatty acids as
PCM filled in glass bricks of dimension 19cm × 19cm × 5cm. The Silica aerogel granulate bed
provides super heat insulation, meaning that it has a thermal conductivity lower than that of still air
(0.018 w/ (m K) for aerogel, 0.026 w/ (m K) for still air). The wall also provides sound insulation and
solar and light transmission. This particular silica aerogel is chosen to meet the TIM–PCM wall
transparency and insulation principles. The chosen PCM has a comfortable phase change temperature
with long term stability. It provides solar absorption, energy storage and restitution, in addition to
light transmission. It absorbs the solar radiation when being in solid state, thus increasing its
temperature until the complete melting is achieved and transmits solar radiation when being in liquid
phase.
Figure 3-1: Schematic of the TIM–PCM wall.

Chapter 3
138
Figure 3-2: (a) TIM-PCM wall from the outside, (b) PCM in solid phase (left) and liquid phase (right), from the
inside
The thermo-physical and optical properties of the used PCM, the silica aerogel and the glass are
summarized in Table 3-1 to Table 3-4. Initially, at a temperature of 50⁰C, the glass bricks are filled
with the fatty acid and an air gap of 2 cm was left at the top of the liquid surface in each brick in order
to avert breaking due to thermal expansion of the PCM [34] and the system is maintained by means
of a wooden frame.
Table 3-1 Thermo-physical properties of the fatty acid eutectic [34]
Property value
ks (W/m.K) 0.182
kl (W/m.K) 0.182
LH (J/kg) 152000
Cps (J/kg.K) 1670
Cpl (J/kg.K) 2090
ρs (kg/m3) 960
ρl (kg/m3) 884
Tm (°C) 21.3
α (m2/s) 9,85.10-8
ν (m2/s) 11.10-6
β (1/K) 3.1.10-3
Table 3-2: Optical properties of the fatty acid eutectic CSTB [34]
𝝉% 𝝆%
Liquid state Energetic 90 5
Optical 78 6
Solid state Energetic ≈ 0 53
Optical ≈ 0 56
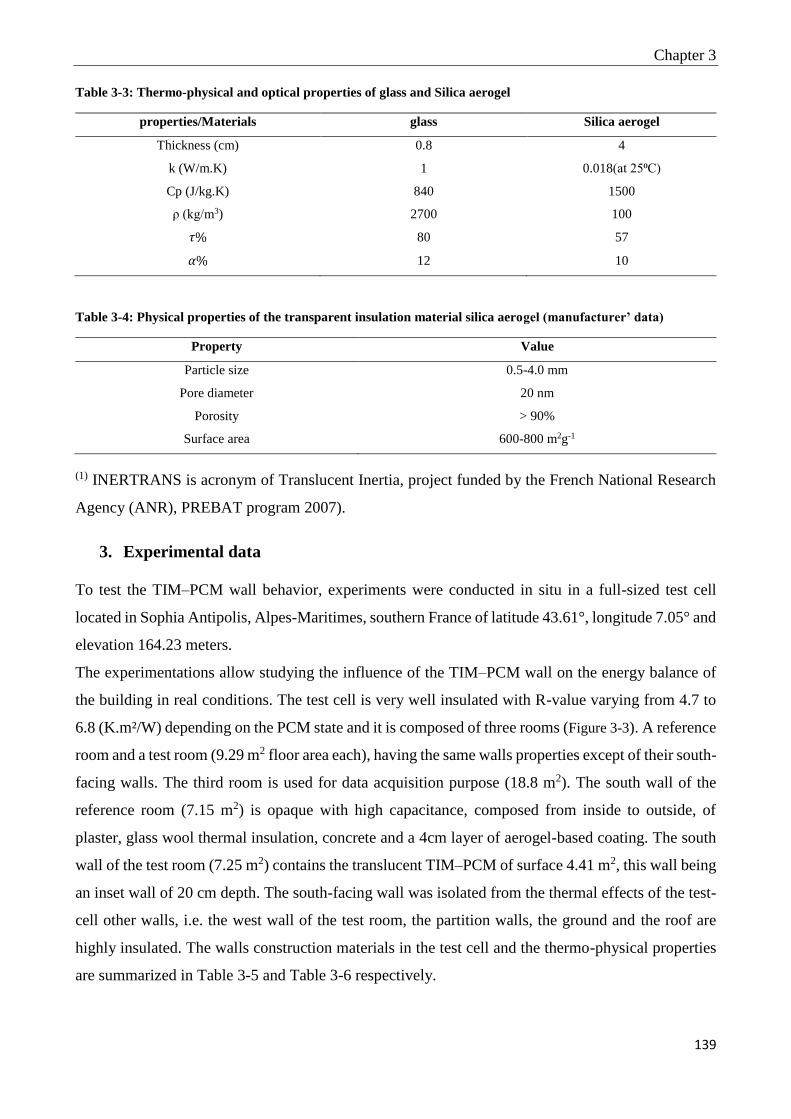
Chapter 3
139
Table 3-3: Thermo-physical and optical properties of glass and Silica aerogel
properties/Materials glass Silica aerogel
Thickness (cm) 0.8 4
k (W/m.K) 1 0.018(at 25⁰C)
Cp (J/kg.K) 840 1500
ρ (kg/m3) 2700 100
𝜏% 80 57
𝛼% 12 10
Table 3-4: Physical properties of the transparent insulation material silica aerogel (manufacturer’ data)
Property Value
Particle size 0.5-4.0 mm
Pore diameter 20 nm
Porosity > 90%
Surface area 600-800 m2g-1
(1) INERTRANS is acronym of Translucent Inertia, project funded by the French National Research
Agency (ANR), PREBAT program 2007).
3. Experimental data
To test the TIM–PCM wall behavior, experiments were conducted in situ in a full-sized test cell
located in Sophia Antipolis, Alpes-Maritimes, southern France of latitude 43.61°, longitude 7.05° and
elevation 164.23 meters.
The experimentations allow studying the influence of the TIM–PCM wall on the energy balance of
the building in real conditions. The test cell is very well insulated with R-value varying from 4.7 to
6.8 (K.m²/W) depending on the PCM state and it is composed of three rooms (Figure 3-3). A reference
room and a test room (9.29 m2 floor area each), having the same walls properties except of their south-
facing walls. The third room is used for data acquisition purpose (18.8 m2). The south wall of the
reference room (7.15 m2) is opaque with high capacitance, composed from inside to outside, of
plaster, glass wool thermal insulation, concrete and a 4cm layer of aerogel-based coating. The south
wall of the test room (7.25 m2) contains the translucent TIM–PCM of surface 4.41 m2, this wall being
an inset wall of 20 cm depth. The south-facing wall was isolated from the thermal effects of the test-
cell other walls, i.e. the west wall of the test room, the partition walls, the ground and the roof are
highly insulated. The walls construction materials in the test cell and the thermo-physical properties
are summarized in Table 3-5 and Table 3-6 respectively.

Chapter 3
140
.
Figure 3-3 : Schematic presentation of the full-scale test cell.
Table 3-5: Test cell walls construction
Element Area (m2) Construction Thickness (m)
Test south wall 2.84
plasterboard 0.013
Glass wool 0.16
concrete 0.25
Reference south wall 7.15
plasterboard 0.013
Glass wool 0.16
concrete 0.25
aerogel-based coating 0.04
Reference/test North
wall
7.05/7.18
plasterboard 0.013
Glass wool 0.16
concrete 0.25
Mousse phenol-formol 0.077
Reference west/ test east
wall (partition) 11.7
plasterboard 0.013
Glass wool 0.16
plaster 0.013
Reference east/ test west
wall 11.7
plasterboard 0.013
Glass wool 0.16
Wooden plate 0.019
Expanded polystyrene 0.08
Reference/test floor 9.17/9.29
tiles 0.015
concrete 0.15
Expanded polystyrene 0.08
Reference/test south roof
(slope 60⁰) 1.62/1.64
plasterboard 0.013
Glass wool 0.16
Wooden plate 0.018
Reference/test north roof
(slope 12⁰) 8.27/8.38
plasterboard 0.013
Glass wool 0.16
Wooden plate 0.012
Mousse phenol-formol 0.06
Wooden plate 0.012
Acquisition room walls Wooden plate 0.012
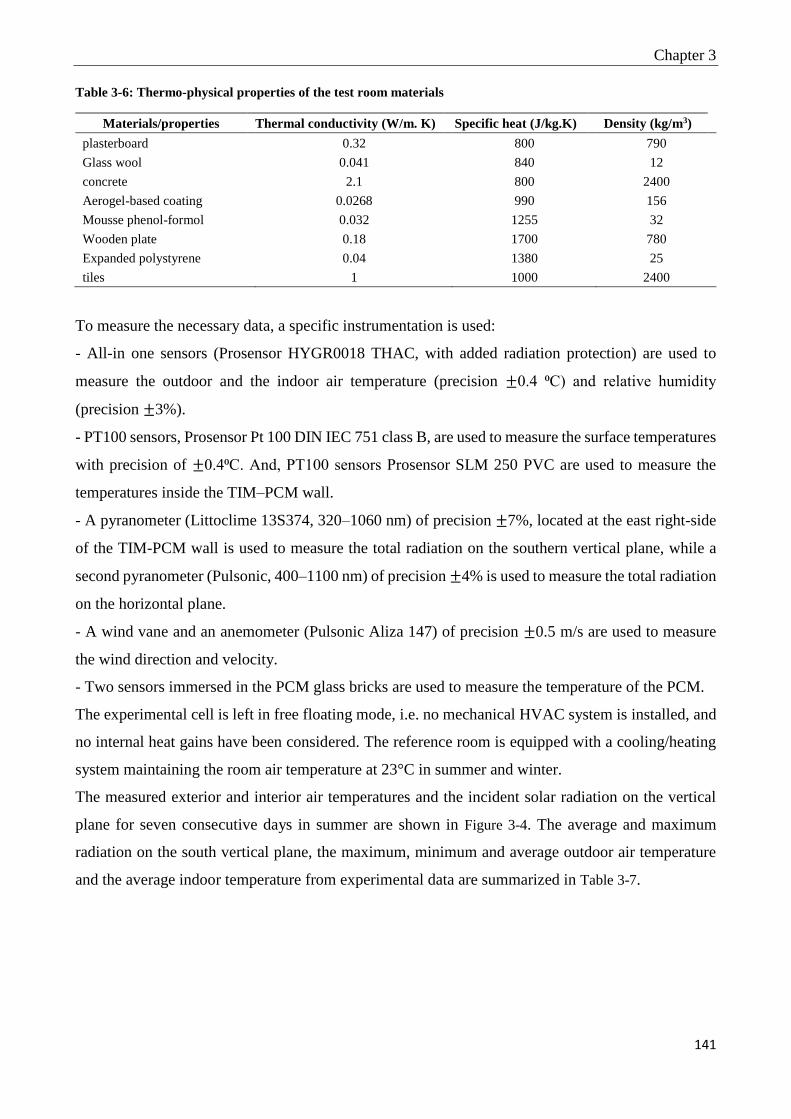
Chapter 3
141
Table 3-6: Thermo-physical properties of the test room materials
Materials/properties Thermal conductivity (W/m. K) Specific heat (J/kg.K) Density (kg/m3)
plasterboard 0.32 800 790
Glass wool 0.041 840 12
concrete 2.1 800 2400
Aerogel-based coating 0.0268 990 156
Mousse phenol-formol 0.032 1255 32
Wooden plate 0.18 1700 780
Expanded polystyrene 0.04 1380 25
tiles 1 1000 2400
To measure the necessary data, a specific instrumentation is used:
- All-in one sensors (Prosensor HYGR0018 THAC, with added radiation protection) are used to
measure the outdoor and the indoor air temperature (precision ±0.4 ⁰C) and relative humidity
(precision ±3%).
- PT100 sensors, Prosensor Pt 100 DIN IEC 751 class B, are used to measure the surface temperatures
with precision of ±0.4⁰C. And, PT100 sensors Prosensor SLM 250 PVC are used to measure the
temperatures inside the TIM–PCM wall.
- A pyranometer (Littoclime 13S374, 320–1060 nm) of precision ±7%, located at the east right-side
of the TIM-PCM wall is used to measure the total radiation on the southern vertical plane, while a
second pyranometer (Pulsonic, 400–1100 nm) of precision ±4% is used to measure the total radiation
on the horizontal plane.
- A wind vane and an anemometer (Pulsonic Aliza 147) of precision ±0.5 m/s are used to measure
the wind direction and velocity.
- Two sensors immersed in the PCM glass bricks are used to measure the temperature of the PCM.
The experimental cell is left in free floating mode, i.e. no mechanical HVAC system is installed, and
no internal heat gains have been considered. The reference room is equipped with a cooling/heating
system maintaining the room air temperature at 23°C in summer and winter.
The measured exterior and interior air temperatures and the incident solar radiation on the vertical
plane for seven consecutive days in summer are shown in Figure 3-4. The average and maximum
radiation on the south vertical plane, the maximum, minimum and average outdoor air temperature
and the average indoor temperature from experimental data are summarized in Table 3-7.

Chapter 3
142
Table 3-7: Summary of some experimental data measured for seven consecutive days in summer and winter
season
Average daily
radiation on
south vertical
plane (W.m-2)
Max
radiation on
vertical plane
(W.m-2)
Max outdoor
temperature
(⁰C)
Min outdoor
Temperature
(⁰C)
Average
outdoor
temperature
(⁰C)
Average
indoor
temperature
(⁰C)
30 July -5
August 2017 100.14 452.78 35.30 21.32 27.81 30.82
27 Januray-2
February 2017 41.63 719.26 16.63 5.22 10.65 18.38
Figure 3-4: Temperatures and solar radiation for seven consecutive days in summer (30 July-5 August 2017)
The seven consecutive days in summer season (30 July-5 August 2017) are characterized by an
outdoor air temperature varying from 21.32 ⁰C to 35.30 ⁰C, and a high solar radiation up to 452.78
W.m-2 on the southern vertical plane. The high ambient temperature together with the solar radiation
transmitted through the TIM-PCM wall, strongly increase the PCM temperature during the day
(higher than 50⁰C) and thus forbid even a partial solidification of the PCM at night (the PCM
minimum temperature recorded at night is about 28⁰C). This causes an overheating of the test room
with an indoor air temperature going from 28.05 ⁰C to 34.73 ⁰C as shown in Figure 3-4. To avert this
problem, and therefore attaining the thermal comfort range, shading devices (overhangs, blinds,
shutters) or ventilation systems (natural night ventilation, mechanical ventilation) should be used.
0
5
10
15
20
25
30
35
40
0
100
200
300
400
500
600
0 12 24 36 48 60 72 84 96 108 120 132 144 156 168
Tem
pe
ratu
re (
⁰C)
Sola
r ra
dia
tio
n (
W.m
-2)
Time (hours)
Solar radiation on vertical plan Outdoor air temperature Test room air temperature
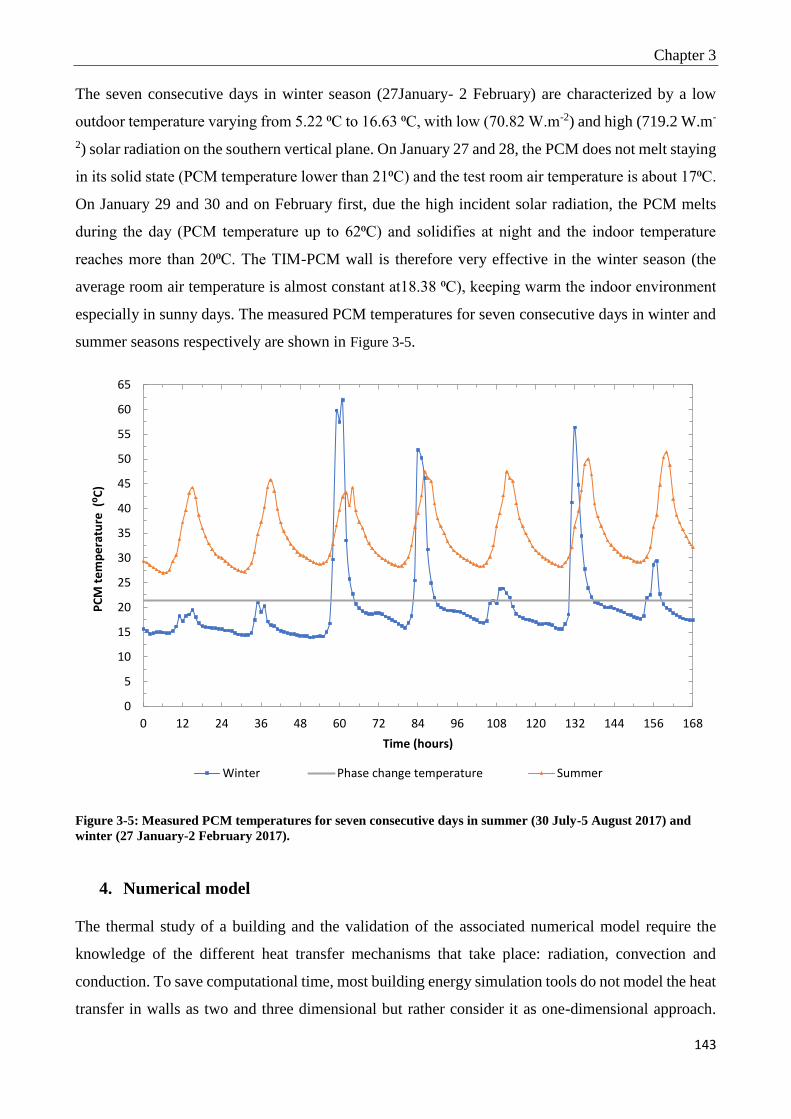
Chapter 3
143
The seven consecutive days in winter season (27January- 2 February) are characterized by a low
outdoor temperature varying from 5.22 ⁰C to 16.63 ⁰C, with low (70.82 W.m-2) and high (719.2 W.m-
2) solar radiation on the southern vertical plane. On January 27 and 28, the PCM does not melt staying
in its solid state (PCM temperature lower than 21⁰C) and the test room air temperature is about 17⁰C.
On January 29 and 30 and on February first, due the high incident solar radiation, the PCM melts
during the day (PCM temperature up to 62⁰C) and solidifies at night and the indoor temperature
reaches more than 20⁰C. The TIM-PCM wall is therefore very effective in the winter season (the
average room air temperature is almost constant at18.38 ⁰C), keeping warm the indoor environment
especially in sunny days. The measured PCM temperatures for seven consecutive days in winter and
summer seasons respectively are shown in Figure 3-5.
Figure 3-5: Measured PCM temperatures for seven consecutive days in summer (30 July-5 August 2017) and
winter (27 January-2 February 2017).
4. Numerical model
The thermal study of a building and the validation of the associated numerical model require the
knowledge of the different heat transfer mechanisms that take place: radiation, convection and
conduction. To save computational time, most building energy simulation tools do not model the heat
transfer in walls as two and three dimensional but rather consider it as one-dimensional approach.
0
5
10
15
20
25
30
35
40
45
50
55
60
65
0 12 24 36 48 60 72 84 96 108 120 132 144 156 168
PC
M t
em
pe
ratu
re (
⁰C)
Time (hours)
Winter Phase change temperature Summer
Chapter 3
144
Many researchers have conducted and experimentally validated one-dimensional transient numerical
model for heat transfer in building envelopes integrating phase change materials [21], [27], [29],
[45]–[48]. However, it was shown that the thermal bridge effects should not be neglected [49], and
that the calculation of a thermal resistance of a wall, adopting the one-dimensional approach and
neglecting the thermal bridge effects, could lead to an overestimation greater than 44% [50]. In
addition, according to the French Scientific and Technical Center for Building Research (CSTB),
thermal bridges can increase the thermal load of a house by 20% (CSTB, Réglementation thermique
2000).
The effective part of the TIM-PCM wall (without the frame) has only one element that causes a
thermal bridge: the joints of the bricks. Modeling a portion of wall using software HEAT2, the
conductive heat flux passing through the joints was estimated, and thus the thermal transmittance of
the joints was found Cj=1/Rj =16.54 W/(m2K). The flow through the joints and the edges of the bricks
is calculated as the difference between the flow through the glass bricks wall with the joints and the
flow through a monoblock of glass brick.
In this study, a one-dimensional numerical model is developed considering the effect of thermal
bridges caused by the joints of the bricks. Figure 3-6 shows the different modes of the heat transfer
through the TIM-PCM wall and the representation of the node grid.
Mesh sensitivity analysis was carried out for the numerical model to make sure that the results are
independent of the numerical domain. The number of nodes in each layer was increased and the
solution was assumed grid independent when the difference between the calculated average indoor
air temperatures for each grid size was less than 2%. The number of nodes in the PCM layer was
augmented and a difference of about 1.2 % was found between the calculated average indoor
temperatures for 5 nodes and 10 nodes.
Finally, a total of 16 nodes have been used, 2 for the glazing layer, 5 for the silica aerogel, 5 for PCM
layer and 2 nodes for each glass brick. The chosen discretized scheme shows good accuracy within a
satisfactory computational time, and it is well-matched with other works evaluating the annual
thermal performance of PCM applications in facades [51]–[53].
The unsteady energy equation is written for each node and solved numerically (sections 4.1 to 4.6).
The developed TIM-PCM wall model computes the temperature field and the solar radiation
transmitted to the test cell through the wall at each time step, these outputs are then linked to TRNSYS
to simulate the energy performance of the whole building.
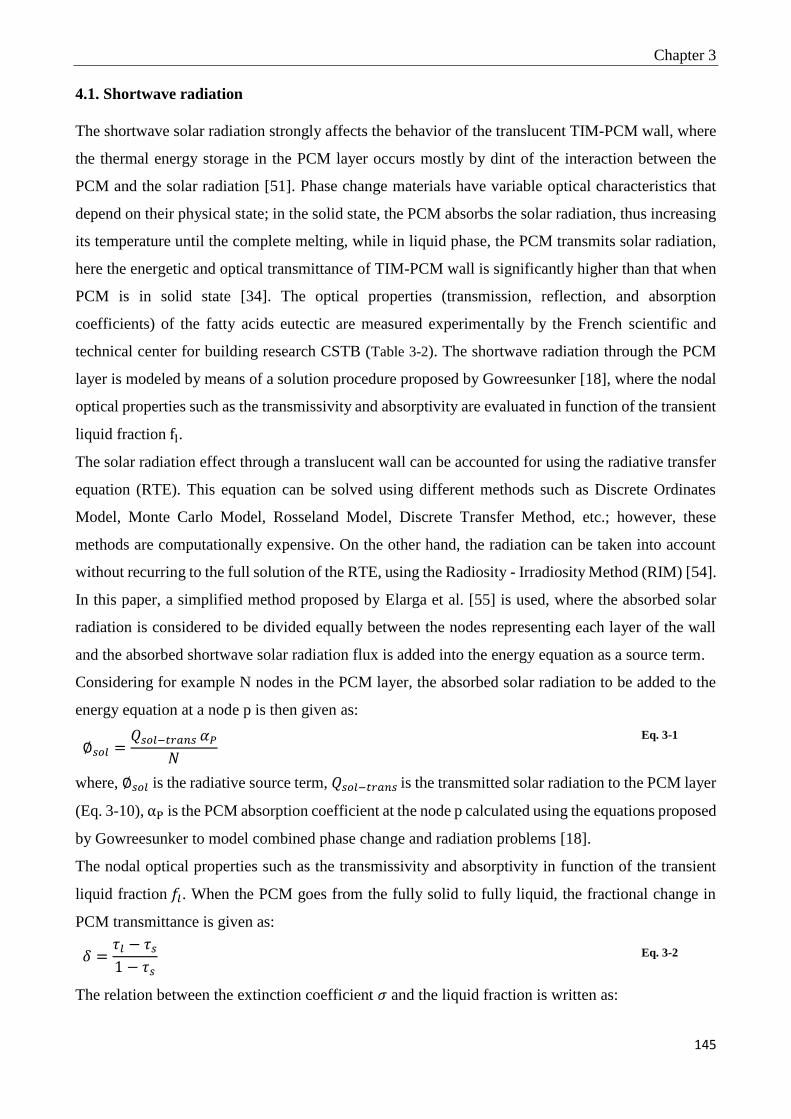
Chapter 3
145
4.1. Shortwave radiation
The shortwave solar radiation strongly affects the behavior of the translucent TIM-PCM wall, where
the thermal energy storage in the PCM layer occurs mostly by dint of the interaction between the
PCM and the solar radiation [51]. Phase change materials have variable optical characteristics that
depend on their physical state; in the solid state, the PCM absorbs the solar radiation, thus increasing
its temperature until the complete melting, while in liquid phase, the PCM transmits solar radiation,
here the energetic and optical transmittance of TIM-PCM wall is significantly higher than that when
PCM is in solid state [34]. The optical properties (transmission, reflection, and absorption
coefficients) of the fatty acids eutectic are measured experimentally by the French scientific and
technical center for building research CSTB (Table 3-2). The shortwave radiation through the PCM
layer is modeled by means of a solution procedure proposed by Gowreesunker [18], where the nodal
optical properties such as the transmissivity and absorptivity are evaluated in function of the transient
liquid fraction fl.
The solar radiation effect through a translucent wall can be accounted for using the radiative transfer
equation (RTE). This equation can be solved using different methods such as Discrete Ordinates
Model, Monte Carlo Model, Rosseland Model, Discrete Transfer Method, etc.; however, these
methods are computationally expensive. On the other hand, the radiation can be taken into account
without recurring to the full solution of the RTE, using the Radiosity - Irradiosity Method (RIM) [54].
In this paper, a simplified method proposed by Elarga et al. [55] is used, where the absorbed solar
radiation is considered to be divided equally between the nodes representing each layer of the wall
and the absorbed shortwave solar radiation flux is added into the energy equation as a source term.
Considering for example N nodes in the PCM layer, the absorbed solar radiation to be added to the
energy equation at a node p is then given as:
∅𝑠𝑜𝑙 =𝑄𝑠𝑜𝑙−𝑡𝑟𝑎𝑛𝑠 𝛼𝑃
𝑁
Eq. 3-1
where, ∅𝑠𝑜𝑙 is the radiative source term, 𝑄𝑠𝑜𝑙−𝑡𝑟𝑎𝑛𝑠 is the transmitted solar radiation to the PCM layer
(Eq. 3-10), αP is the PCM absorption coefficient at the node p calculated using the equations proposed
by Gowreesunker to model combined phase change and radiation problems [18].
The nodal optical properties such as the transmissivity and absorptivity in function of the transient
liquid fraction 𝑓𝑙. When the PCM goes from the fully solid to fully liquid, the fractional change in
PCM transmittance is given as:
𝛿 =𝜏𝑙 − 𝜏𝑠1 − 𝜏𝑠
Eq. 3-2
The relation between the extinction coefficient 𝜎 and the liquid fraction is written as:

Chapter 3
146
𝜎 = 𝑓𝑙𝜎𝑙 + (1 − 𝑓𝑙)𝜎𝑠 Eq. 3-3
The transmittance of the PCM is:
𝜏𝑃 = 10−𝑑 Eq. 3-4
where d is the optical thickness:
𝑑 = 𝜎. 𝑆 Eq. 3-5
where S stands for the physical thickness
The absorptivity of the PCM evaluated at each node is given as:
𝛼𝑃 = [𝛿𝑓𝑙 + (1 − 𝑑)](1 − 𝜏𝑃𝐶𝑀) Eq. 3-6
Moreover, the overall transmitted solar radiation through N=n+k layers is calculated using the
following equations given by Siegel [56]:
𝜏𝑠(𝑛+𝑘)
=𝜏𝑠(𝑛)𝜏𝑠(𝑘)
1 − 𝜌𝑠2(𝑛)𝜌𝑠1(𝑘)
Eq. 3-7
𝜌𝑠1(𝑛+𝑘)
= 𝜌𝑠1(𝑛)+ 𝜏𝑠
(𝑛)2 𝜌𝑠1(𝑘)
1 − 𝜌𝑠2(𝑛)𝜌𝑠1(𝑘)
Eq. 3-8
𝜌𝑠2(𝑛+𝑘)
= 𝜌𝑠2(𝑘)+ 𝜏𝑠
(𝑘)2 𝜌𝑠2(𝑛)
1 − 𝜌𝑠1(𝑘)𝜌𝑠2(𝑛)
Eq. 3-9
where, 𝜏𝑠(𝑛+𝑘)
is the transmittance for the entire system, 𝜏𝑠(𝑛)
and 𝜏𝑠(𝑘)
are the transmittances for n and
k layers system respectively. 𝜌𝑠1(𝑘)
is the overall reflectance for a system of k layers for energy incident
on the first (upper) surface of that entire system and 𝜌𝑠2(𝑛)
is the reflectance for a system of n layers
for energy incident on the second (lower) surface of that entire n layer system.
The general characteristics of one layer are used to develop the overall behavior of a two-layer system,
this procedure can be sustained and the behavior for one layer and two layers can be combined to
build up the behavior for three layers, and so on.
For example, the transmitted solar radiation to the PCM layer is found using Eq. 3-7 to Eq. 3-9 as
follow:
𝑄𝑠𝑜𝑙−𝑡𝑟𝑎𝑛𝑠 =𝜏1𝜏2𝜏3
(1−𝜌2𝜌1)(1−𝜌2𝜌3)−𝜏22𝜌3𝜌1
. 𝑄𝑠𝑜𝑙−𝑡𝑜𝑡𝑎𝑙 Eq. 3-10
where, 𝜏1, 𝜏2, 𝜏3 are the solar transmission coefficients and 𝜌1, 𝜌2 , 𝜌3 are the solar reflection coefficients of
the glazing, silica aerogel and glass brick respectively.
The overall transmission of the solar radiation through the whole TIM-PCM wall calculated from Eq.
3-7 to Eq. 3-9 is found 27.36% in summer conditions when the PCM remains in liquid its state.

Chapter 3
147
4.2. Longwave radiation exchange
Longwave radiative exchange takes place between the external surface of the wall and the outside
environment, and among the internal surface of the wall and the indoor environment. The TIM-PCM
wall is supposed to be opaque for the longwave radiation due to the presence of the silica aerogel
layer.
The outdoor radiative heat exchange (W/m2) is given as:
∅LW,out = εσFgrd(Tgrd4 − Tsurf
4 ) + εσFskyβ(Tsky4 − Tsurf
4 ) + εσFsky(1 − β)(Tair4 − Tsurf
4 ) Eq. 3-11
where, ε is the long-wave emittance of the surface and σ is the Stefan Boltzmann constant. The
temperature of the ground surface is approximated to the ambient air temperature.
Fgrd is the view factor of wall surface to ground surface temperature
Fgrd = (1 − cosδ)/2 Eq. 3-12
Fsky is the view factor of wall surface to the sky
Fsky = (1 + cosδ)/2 Eq. 3-13
The view factor to the sky is divided between sky and air radiation by:
β = √((1 + cosδ)/2) Eq. 3-14
where δ is the tilt angle of the surface, for vertical surface δ = 90°.
The sum of the view factors to the ground, air, and sky is equal to 1. The view factor to the air will
be often smaller than 0.15, since most surfaces lie somewhere between vertical and horizontal. So,
air-surface interactions are not significant, so it will be neglected, the radiative heat exchange is
linearized as follow:
∅LW,out = hr,grdFgrd(Tgrd − Tsurf) + hr,skyFsky(Tsky − Tsurf) Eq. 3-15
The sky temperature Tsky is given by Swinbank [57] function of the air temperature as follow,
assuming a clear sky:
Tsky = 0.0552Tair1.5 Eq. 3-16
For a vertical wall, Fgrd and Fsky are equal to 0.5. For usual sky and surface temperatures, the
coefficients hr,sky and hr,grd vary around the values of 4.7 W/m2. K and 5.7 W/m2. K for buildings
located in temperate regions.
The radiative flux received by the interior surface of the wall and emitted by other N surfaces of the
test room, resulting from the linearization of the radiative transfers if all interior surfaces are black
bodies (ρ = τ = 0, ε = 1), is expressed by:
∅𝐿𝑊,𝑖𝑛 =∑𝐹𝑖𝑠ℎ𝑖𝑠(𝑇𝑖 − 𝑇𝑠urf)
𝑁
𝑖=1
Eq. 3-17

Chapter 3
148
where, F is the view factor, ℎ𝑖𝑠 is the radiative coefficient, 𝑇𝑠urf is the internal surface temperature
of the TIM-PCM wall and 𝑇𝑖 is the temperature of each other surface of the room. The calculation of
the indoor radiative exchange is complicated, since the computation of the view factors between the
interior surface of the TIM-PCM wall and the other surfaces needs a specific detailed method [54].
For simplification, the temperatures of the other surfaces of the room are supposed to be equal to the
indoor test room air temperature. Thus, the resulting radiative exchange (W/m2) becomes:
∅𝐿𝑊,𝑖𝑛 = his(Tin − Tsurf) Eq. 3-18
where his is the internal longwave radiative exchange coefficient, for standard building temperatures
it varies very little around the value of 5 W/m2. K
4.3. Convective heat exchange
The convective heat exchange occurs between the external surface of the TIM-PCM wall and the
outside air, and between the internal surface of the wall and the inside air.
The general formulation of the convective heat flux (W/m2) is given by:
∅𝑐𝑜𝑛𝑣 = ℎ𝑐𝑜𝑛𝑣 ∆𝑇 Eq. 3-19
Where, ∆T is the temperature difference between the surface and the surrounding air.
The Convective exchange with the external environment is generally calculated using a linear
correlation function of the wind speed. The correlation in (W/ m2K) used here is established by
Sturrock [58]:
ℎ𝑜𝑢𝑡 = 5.7𝑣 + 11.4 (Windward)
ℎ𝑜𝑢𝑡 = 5.7𝑣 (Leeward)
Eq. 3-20
Where, v is the wind velocity (m/s)
The internal convection coefficient used to evaluate the convection heat transfer for the TIM-PCM
wall with the interior is the one developed by Alamdari for vertical surfaces [51]:
ℎ𝑖𝑛 = {[1.5(|∆𝑇|
𝐻)
1/4
]
6
+ [1.23(|∆𝑇|)1/3]6}
1/6
Eq. 3-21
where ∆T is the temperature difference between the internal wall surface and the indoor air, and H
is the height of the vertical surface.
4.4. Governing equations and boundary conditions
For the TIM-PCM wall, the heat transfer includes different regions, which are the outer glazing,
insulation silica aerogel and the PCM filled in glass brick. A one-dimensional unsteady energy
equation for glazing and insulation layer is given as

Chapter 3
149
𝜌𝐶𝑝𝜕𝑇
𝜕𝑡= 𝑘
𝜕2𝑇
𝜕𝑥2+ ∅𝑠𝑜𝑙 Eq. 3-22
where 𝜌 is the density (kg/m3), 𝐶𝑝 is the specific heat capacity (J/kg. K) and k is the thermal
conductivity (W/m. K).
In the PCM layer, the heat transfer during phase change procedure is done by conduction, natural
convection in the liquid phase and shortwave radiation. The unsteady energy equation for PCM
regions is given as:
𝜌𝐶𝑝𝜕𝑇
𝜕𝑡=𝜕
𝜕𝑥(𝑘
𝜕𝑇
𝜕𝑥)− 𝜌𝐿𝐻
𝜕𝑓𝑙
𝜕𝑡+ ∅𝑠𝑜𝑙
Eq. 3-23
where ∅sol (W/m2) is the absorbed solar radiation in the layer (section 4.1), 𝐿𝐻 is the latent heat of
fusion (J/kg) and 𝑓𝑙 is the liquid fraction.
To solve the phase change problem a fixed-grid modified “enthalpy” method is used, inspired by the
work of Zivkovic et al. [59]. The convection in the liquid PCM is accounted for using the enhanced
thermal conductivity approach together with the scaling theory [60] [61] [62]. The convection effect
is only considered in the upper part of the PCM layer of height z1 and width z2, while the zone
(z2. H) − (z1. z2) is controlled by conduction. Therefore, an average enhanced conductivity for liquid
nodes is used in the one-dimensional model expressed by:
𝑘𝑒𝑛ℎ,𝑝 =𝑘𝑙[(z2. 𝐻) − (𝑧1. 𝑧2)] + 𝑘𝑙 . 𝑁𝑢𝑧1(𝑧1. 𝑧2).
z2. 𝐻 Eq. 3-24
where 𝑘𝑒𝑛ℎ,𝑝 is the liquid enhanced conductivity for the liquid PCM node p, H is the height of the
glass brick filled with PCM and Nuz is the Nusselt number correlation given by Berkovsky and
Polevikov [63]. More details can be found in the reference [64].
4.5. Heat balance on a surface in contact with the external environment
The heat balance on the outside surface is given by:
𝜌𝑐𝑝∆𝑥
2
𝜕𝑇
𝜕𝑡= ∅𝑐𝑜𝑛𝑑(𝑡) + ∅LW,out(𝑡) + ∅𝑐𝑜𝑛𝑣,𝑜𝑢𝑡(𝑡) + ∅𝑠𝑜𝑙(𝑡)
Eq. 3-25
Where, ∅𝑐𝑜𝑛𝑑(𝑡) is the conductive heat flux in (𝑊/𝑚2) is given as:
∅𝑐𝑜𝑛𝑑(𝑡) =𝑘
∆𝑥(𝑇𝑠+∆𝑥 − 𝑇𝑠𝑢𝑟𝑓)
Eq. 3-26
and ∅𝑠𝑜𝑙 (𝑊/𝑚2) is the solar absorption flux at the surface expressed by:
∅𝑠𝑜𝑙(𝑡) = 𝛼𝑄𝑠𝑜𝑙−𝑡𝑜𝑡𝑎𝑙 Eq. 3-27
∅LW,out(𝑡) and ∅𝑐𝑜𝑛𝑣,𝑜𝑢𝑡(𝑡) are the radiative heat exchange (W/m2) with the outdoor environment and
the convective heat flux with the outside given in Eq. 3-15, Eq. 3-19 and Eq. 3-20 respectively.

Chapter 3
150
4.6. Heat balance on a surface in contact with the internal environment
The heat balance on the internal surface is given by:
𝜌𝑐𝑝∆𝑥
2
𝜕𝑇
𝜕𝑡= ∅𝑐𝑜𝑛𝑑(𝑡) + ∅LW,in(𝑡) + ∅𝑐𝑜𝑛𝑣,𝑖𝑛(𝑡) + ∅𝑠𝑜𝑙(𝑡)
Eq. 3-28
Conduction flux through the wall (𝑊/𝑚2) is given as:
∅𝑐𝑜𝑛𝑑(𝑡) =𝑘
∆𝑥(𝑇𝑠−∆𝑥 − 𝑇𝑠𝑢𝑟𝑓)
Eq. 3-29
The transmitted solar radiation flux absorbed at the internal wall surface reads:
∅𝑠𝑜𝑙(𝑡) = 𝛼𝑄𝑠𝑜𝑙−𝑡𝑟𝑎𝑛𝑠 Eq. 3-30
where ∅LW,in(𝑡) and ∅𝑐𝑜𝑛𝑣,𝑖𝑛(𝑡) are the net longwave radiant exchange flux between zone surfaces
(W/m2) and the convective heat flux with the indoor air given in Eq. 3-18, Eq. 3-19 and Eq. 3-21,
respectively.
A one dimensional implicit finite volume method established by Patankar 1980 [65] is used to
estimate the heat transfer mechanism through the TIM-PCM wall. The computational domain is
divided into control volumes, the discretized equation over a typical control volume is written as
follow:
𝑎𝑃𝑇𝑃𝑡+∆𝑡 = 𝑎𝑊𝑇𝑊
𝑡+∆𝑡 + 𝑎𝐸𝑇𝐸𝑡+∆𝑡 + 𝑏 Eq. 3-31
where,
𝑎𝑊 = 𝑘𝑤𝛥𝑦
(∆𝑥)𝑤, 𝑎𝐸 = 𝑘𝑒
𝛥𝑦
(∆𝑥)𝑒
𝑎𝑃 = 𝑎𝑊 + 𝑎𝐸 + 𝑎𝑃𝑡
𝑎𝑃𝑡 =
𝜌𝐶𝑝∆𝑥
∆𝑡
𝑏 = 𝑎𝑃𝑡 𝑇𝑃
𝑡 + ∅𝑠𝑜𝑙 Eq. 3-32
The superscript t indicates the values at the previous time step, 𝑡 + ∆𝑡 indicates the values at the
current time step. 𝑘𝑤 and 𝑘𝑒 are the thermal conductivities calculated at the interface.
A system of linear equations is formed from the discretized equations and can be written in a matrix
form as:
𝐴 ∗ 𝑇 = 𝐵 Eq. 3-33 (11)
where A is the matrix of coefficients (tri-diagonal sparse matrix), T is the vector of unknown
temperatures and B is the vector of known terms including the values at the previous time step. The
current temperature values 𝑇𝑃𝑡+∆𝑡 are obtained from the previously solved time step temperatures
values 𝑇𝑃𝑡. The system is solved using a direct non-iterative method, the Gaussian elimination
algorithm, which produces the solution without explicitly forming the inverse. The Gaussian

Chapter 3
151
elimination algorithm is a sequential process of removing unknowns from equations using forward
elimination followed by back substitution [66]. This function is built in MATLAB.
5. MATLAB-TRNSYS link
The model of the heat transfer through the TIM-PCM wall is linked to TRNSYS via Type 155, whose
function is to enable the use of MATLAB program in TRNSYS (Figure 3-6). This link enables to
simulate the thermal performance of the test cell.
The inputs for Type 155 are: the outdoor air temperature, the sky temperature (Eq. 3-16 and Eq. 3-11),
the incident solar radiation on vertical plan and the wind velocity from experimental data, in addition
to the indoor air temperature, calculated at each time step, from Type 56 (TRNbuild), also the thermo-
physical and optical properties of PCM, glass and silica aerogel (Table 3-1 to Table 3-4).
In TRNbuild Type 56 we define the building geometry, the wall constructions, the materials
properties and the zones regimes (cooling, heating, infiltration, ventilation…). The solar radiation is
processed to the building using Type 16 that needs the incident radiation on horizontal plan as input,
while the outdoor air temperature and the outdoor relative humidity are linked to the building using
Type 9 from experimental measured data. A part of the radiation is reflected from the ground, the
reflectance of the ground above which the surface is located, concrete in our case, is taken 0.22.
Type 155 provides as output data the internal surface temperature. This boundary temperature is taken
as an input to the Type 56, and the shortwave solar radiation transmitted into the test room through
the translucent wall is defined as internal radiative heat gain. Type 75 is used to calculate the
infiltration rate (ACH). The inputs for this type are: wind speed, outdoor and indoor air temperatures,
outdoor and indoor relative humidity, outdoor and indoor air pressures and the leakage area (the
leakage area was estimated 100 cm2). And, the ground temperature is approximated to the ambient
temperature. In addition, the internal convection coefficient used for horizontal surfaces are those
developed by Glück [67].
For Type 155, A non-iterative component is called at the end of each time step, the outputs are
calculated for one-time step based on the converged values of previous time step.

Chapter 3
152
Figure 3-6: Integration mechanism of the TIM-PCM wall in TRNSYS and different heat transfer phenomena
through the TIM-PCM wall and the computational grid
6. Model validation
To validate the numerical model, the hourly profile of the measured data and simulated results of the
internal surface temperature and the indoor test room air temperature are compared for seven
consecutive days in summer and winter seasons. The agreement between experimental data and
simulated results is estimated using the root mean square error (RMSE) and the percentage root mean
square error (PRMSE) shown in Eq. 3-34 and Eq. 3-35 respectively.
𝑅𝑀𝑆𝐸 = √1
𝑛∑(𝑠𝑖 − 𝑒𝑖)2𝑛
𝑖=1
Eq. 3-34
𝑃𝑅𝑀𝑆𝐸 = √1
𝑛∑(
𝑠𝑖 − 𝑒𝑖𝑒𝑖
)2
𝑛
𝑖=1
Eq. 3-35
The comparison between the measured and the simulated internal surface temperature of the TIM-
PCM wall and the indoor test room air temperature in summer season is shown in Figure 3-7. The
effect of natural convection in liquid PCM is also studied in summer and winter and the comparison
is done between the experimental data and the simulated values from the model with and without
natural convection in the liquid PCM. The PCM temperature filled in glass bricks is also compared
in summer season, as shown in Figure 3-8.

Chapter 3
153
Concerning the internal surface temperature of the TIM-PCM wall, it was measured experimentally
using seven sensors (section 3). The simulated results are compared with a temperature measured at
the middle of the left side of the wall. This measured temperature is very close to the average
temperature of all the measured temperatures (maximum dispersion 1.1˚C, average difference 0.9
˚C).
Despite the assumptions that have been made, the numerical model is found to be able to simulate the
heat transfer phenomena through the TIM-PCM wall. A good agreement is observed comparing the
experimental measured data and the simulated results. The model predicts properly the minimum and
maximum peak values of the internal surface temperature, the indoor air temperature and the PCM
temperature especially in the summer season, with a slight over-estimation of the uppermost values
in summer and an underestimation of the lowermost values in winter.
The model, considering natural convection effect, estimates the internal surface temperature of the
TIM-PCM wall in summer better than winter, where a maximum difference of 2.9 ⁰C is observed
when the temperature in the PCM layer is inferior to the phase change temperature in February first
after 6 p.m., while a very good agreement is observed when the PCM is in its solid state in January
27 and 28. The peak values in all days are in good agreement. The little over-estimation of the surface
temperature of the TIM-PCM during summer is observed when the temperature of the PCM layer is
relatively high, and the slight underestimation of the indoor temperatures occurs at night. In addition,
the PRMSE and RSME demonstrate the good agreement between the experimental and the simulated
results. The PRMSE of the indoor air temperature is 1.87% in summer and 4.05% in winter, and that
of the internal surface temperature is 3.28 % in summer and increases to 6.99% when the winter
season is examined as summarized in Table 3-8. While the RMSE is 0.76 ⁰C and 1.43 ⁰C for the indoor
air temperature and the internal surface temperature respectively in winter season.
It was also shown that without natural convection, the model underestimates the temperature values
compared to experimental results especially the highest peak values. If the natural convection effect
is not considered in the summer season, the RSME of the PCM temperature increases from 1.92 ⁰C
to 4.07 ⁰C and the PRMSE reaches 9.94 %, the difference between the maximum peaks reaches up to
11 ⁰C (Figure 3-8). For the surface temperature, the RMSE is 1.47 ⁰C and the PRMSE attains 4.12 %
while a maximum difference of about 4.5 ⁰C is observed at the peaks. For the indoor air temperature,
the RMSE is 0.84 ⁰C compared to 0.57 ⁰C considering the natural convection effect. Same for winter
season, the values of RMSE and PRMSE increase when natural convection in liquid PCM is not
considered (Table 3-8). Therefore, to get a good agreement between simulation results and
experimental data, it is not always adequate to assume only conduction heat transfer inside the PCM
and the natural convection effect must be considered in the liquid PCM.

Chapter 3
154
Figure 3-7: Simulated and measured a) internal surface temperature of the TIM-PCM wall and b) indoor test
room air temperature for seven consecutive days in summer (30 July - 5 August 2017).
20
22
24
26
28
30
32
34
36
38
40
42
44
46
48
50
0 12 24 36 48 60 72 84 96 108 120 132 144 156 168
Surf
ace
te
mp
era
ture
(⁰C
)
Time (hours)
a)
Measured Simulated without convection Simulated with convection
20
22
24
26
28
30
32
34
36
38
40
0 12 24 36 48 60 72 84 96 108 120 132 144 156 168
Ind
oo
r te
mp
era
ture
(⁰C
)
Time (hours)
b)
Measured Simulated without convection Simulated with convection
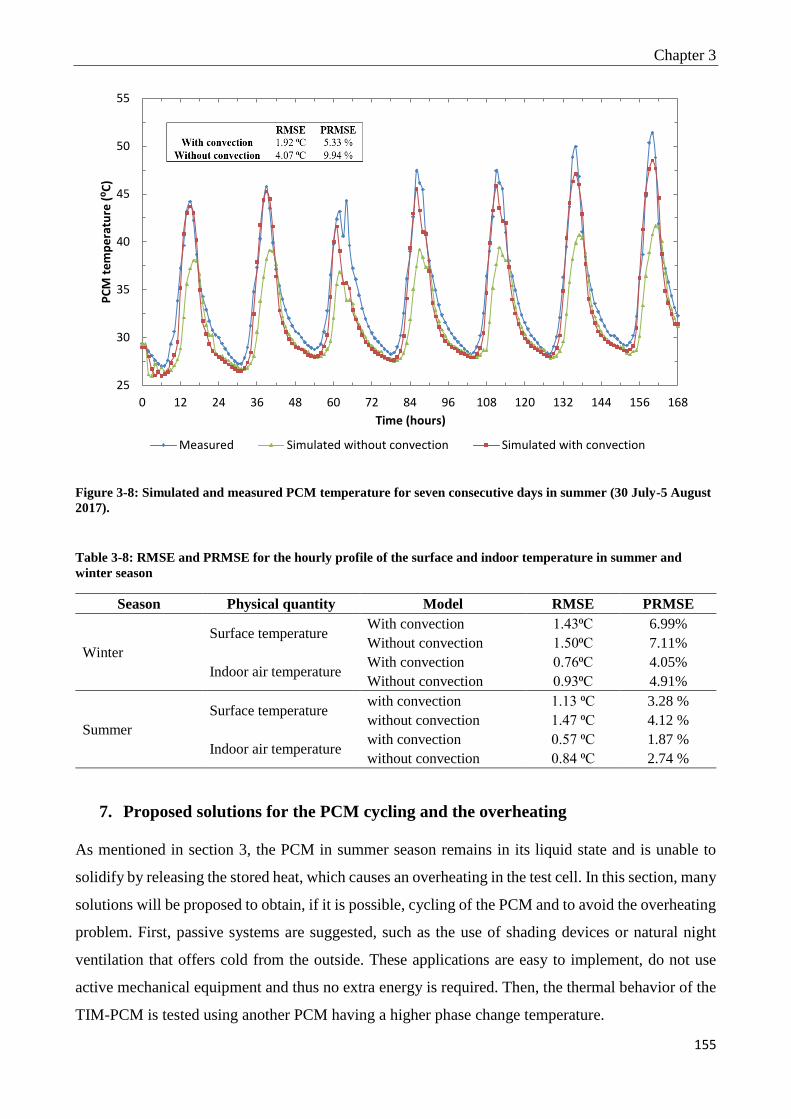
Chapter 3
155
Figure 3-8: Simulated and measured PCM temperature for seven consecutive days in summer (30 July-5 August
2017).
Table 3-8: RMSE and PRMSE for the hourly profile of the surface and indoor temperature in summer and
winter season
Season Physical quantity Model RMSE PRMSE
Winter
Surface temperature With convection 1.43⁰C 6.99%
Without convection 1.50⁰C 7.11%
Indoor air temperature With convection 0.76⁰C 4.05%
Without convection 0.93⁰C 4.91%
Summer
Surface temperature with convection 1.13 ⁰C 3.28 %
without convection 1.47 ⁰C 4.12 %
Indoor air temperature with convection 0.57 ⁰C 1.87 %
without convection 0.84 ⁰C 2.74 %
7. Proposed solutions for the PCM cycling and the overheating
As mentioned in section 3, the PCM in summer season remains in its liquid state and is unable to
solidify by releasing the stored heat, which causes an overheating in the test cell. In this section, many
solutions will be proposed to obtain, if it is possible, cycling of the PCM and to avoid the overheating
problem. First, passive systems are suggested, such as the use of shading devices or natural night
ventilation that offers cold from the outside. These applications are easy to implement, do not use
active mechanical equipment and thus no extra energy is required. Then, the thermal behavior of the
TIM-PCM is tested using another PCM having a higher phase change temperature.
25
30
35
40
45
50
55
0 12 24 36 48 60 72 84 96 108 120 132 144 156 168
PC
M t
em
pe
ratu
re (
⁰C)
Time (hours)
Measured Simulated without convection Simulated with convection

Chapter 3
156
7.1. Shading devices
Overheating due to solar radiation transmitted to the test cell through the translucent TIM-PCM wall
can be reduced using shading devices. The most important motive of the use of shading devices is to
prevent the direct solar radiation to enter into the building in summer season, and to allow the solar
gains to enter the building when it is needed in the cold season [68], [69]. Shading devices can be
either interior or exterior; the exterior devices are more effective than the interior ones, since more
significant amount of solar radiation can be rejected to the outdoor environment. They include
overhangs, awnings, louvers, venetian blinds and roller shades. Numerous studies have been done on
shading devices showing their importance in reducing the cooling loads especially in hot climates
[70].
7.1.1. Overhangs
The overhangs at the southern façade are a widely used method that provides external shading.
Overhangs need to be designed properly to block the solar radiation during summer and permit its
penetration during winter. In TRNSYS, overhangs can be defined using Type 34 and Type 67 is used
to consider shading from far away objects. The defined dimensions of the overhang are mainly the
overhang gap fixed at 20cm, the overhang extensions limited to 30 cm at each side and the overhang
projection which value is increased from 0.5m to 2.5m.
The use of overhang decreases the maximum room air temperature by about 6⁰C from 35.30⁰C to
29.29 ⁰C for a projection of 1 m, and the minimum air temperature is decreased from 28.80 ⁰C to
25.84⁰C at night. Increasing the overhang projection above 1 m has a minor effect on the maximum
and minimum indoor air temperature as shown in Table 3-9.
Table 3-9: Values of maximum, minimum and average indoor test room air temperature for different overhang
projections
Projection of the overhang (OP) Base case 0.5m 1m 1.5m 2m 2.5m
Maximum indoor air temperature 35.30 30.56 29.29 29.11 29.06 28.91
Minimum indoor air temperature 28.80 26.61 25.84 25.68 25.80 25.56
Average indoor air temperature 31.34 28.09 27.27 27.15 27.11 27.06
7.1.2. Venetian blinds
Exterior venetian blinds are installed on the outside of the TIM-PCM wall; these blinds offer a high
level of protection against solar radiation due to the reduction of light and heat. They consist of
separate, equally-spaced horizontal slats. The venetian blinds have various thermal and optical
properties which depend on the slat characteristics (rotation angle, shape, size, and colors) and the
angle of incidence of solar radiation. The used blinds in this section are products from ISOTRA

Chapter 3
157
[71][72], the solar and light transmittances are determined according to the standard CSN EN 13363-
1+A1 [73] for the selected products of ISOTRA. The blinds slat angles were determined by two
angles 45⁰ (slats half closed) with solar reduction factor of 0.25 and 0⁰ (totally closed, i.e. opaque)
with solar reduction factor of 0.069. Different cases listed in Table 3-10 are studied to find an optimal
solution for the overheating problem. Figure 3-9 shows the transmitted solar radiation through the
TIM-PCM wall for each case, it is obvious that the use of venetian blinds reduces significantly the
transmitted solar radiation into the test room cell, especially the opaque ones. Noting that, the blinds
are down and set to their utilization angle when the total incident radiation is significant, i.e. from 9
a.m. till 5 p.m.
Table 3-10: Different cases to be tested to choose the best solution
Cases Shading scenario
Case 1 No overhang and no external blinds (base case)
Case 2 Overhang of projection 1 m (type 34 TRNSYS, section 7.1.1)
Case 3 Venetian External Blinds with rotatable slat and a slat angle of 45 degrees /reduction
factor 0.25 ( according to DIN 4108, EN 4108 [74])
Case 4 Exterior Venetian Blinds with rotatable slat at 0-degree, silver color, reduction factor
0.069 (according to EN 13363-1+A1)
Case 5 Overhang 1 m + blind 45⁰ (case 2 + case3)
Case 6 Overhang 1 m + blind 0⁰ (case 2 + case 4)
Figure 3-9: transmitted solar radiation through the TIM-PCM wall for the different cases in summer season (3,
4, 5 August)
0
20
40
60
80
100
120
0 6 12 18 24 30 36 42 48 54 60 66 72
Tran
smit
ted
so
lar
rad
iati
on
(W
/m2 )
Time (hours)
Case 1 Case 2 Case 3 Case 4 Case 5 Case 6

Chapter 3
158
Table 3-11: Values of minimum and maximum indoor test room air temperature for the different cases
Case 1 Case 2 Case 3 Case 4 Case 5 Case 6
Maximum temperature 35.30 29.29 28.11 26.57 26.94 26.27
Minimum temperature 28.80 25.84 25.20 24.68 24.79 24.62
Table 3-12: Values of maximum and minimum PCM temperature for the different cases
Case 1 Case 2 Case 3 Case 4 Case 5 Case 6
Maximum PCM temperature 51.41 35.34 32.22 28.34 29.11 27.54
Minimum PCM temperature 28.25 25.21 24.51 24.21 24.29 24.06
Figure 3-10: a) Indoor test room air temperature and b) PCM temperature for the different cases in summer
season (3, 4, 5 August)
Figure 3-10 shows the indoor test room air temperature for the different cases. The venetian blinds
with rotatable slat angle of 45° (case 3) reduce the maximum temperature from 35.30 ⁰C to 28.11⁰C,
while the opaque ones (case 4) reduce the peak temperature to 26.57 ⁰C with a minimum temperature
of 24.68 ⁰C, solving the overheating problem. When combining the overhang with the venetian blinds
of 45 degrees slat rotatable angle (case 5), the maximum indoor temperature reduces to 26.94 ⁰C and
the minimum indoor temperature decreases to 24.79 ⁰C, in this case the light is fairly transmitted
through the wall. When combining the overhang with the opaque blinds (case 6), the results are not
significantly modified compared to case 4 as summarized in Table 3-11. The blinds can reduce the
22
24
26
28
30
32
34
36
0 6 12 18 24 30 36 42 48 54 60 66 72
Ind
oo
r ai
r te
mp
era
ture
(0C
)
Time (hours)
a)
Case 1 Case 2 Case 3
Case 4 Case 5 Case 6
20
25
30
35
40
45
50
55
0 6 12 18 24 30 36 42 48 54 60 66 72
PC
M t
em
pe
ratu
re (
⁰C)
Time (hours)
b)
Case 1 Case 2 Case 3
Case 4 Case 5 Case 6

Chapter 3
159
peak temperature during the day more than 8 ⁰C and the minimum temperature at night up to 4 ⁰C.
To benefit from the translucency of the TIM-PCM wall, case 5 can be considered as an optimal
solution.
Figure 3-10 shows the temperature of the PCM layer for the different cases. Despite the significant
reduction of the maximum PCM temperature, up to 23⁰C, during the day for all cases, the PCM
temperature at night does not drop below the phase change temperature (minimum temperature
reached is 24.06 ⁰C, Table 3-12). Thus, the PCM will not be able to solidify and lower temperatures
must be attained to solidify the PCM periodically in each diurnal cycle.
7.2. Prisma solar glass
Prisma solar glass is a special glazing developed by Lamberts Company which features selective solar
radiation properties depending on the season. Due to its precisely-determined prismatic structure, it
is possible for a large amount of the solar radiation in winter, having a lower angle of incidence, to
pass through the glazing into the indoor environment. whereas, in summer season a large amount of
the solar radiation, having a higher angle of incidence, is reflected to the outside. This type of glass
is already applied in the construction of an office center in Fürstenfeldbruck, Germany.
Kara et al [13] have studied the performance of a coupled novel triple glass unit (TGU) and PCM
wall, the mid layer of glass in the TGU being the Prisma solar glass. They have found that the solar
transmittance of the TGU is reduced by 100% in summer (0.2 to 0.25) compared to winter (0.45 to
0.55) and no overheating for the PCM wall has been encountered in summer season.
The Prisma solar glass can be used instead of the ordinary glass in the external glazing of the TIM-
PCM wall composition. As a result, most of the incident radiation on the wall is transmitted in winter
and reflected in summer. Therefore, the heat storage in the PCM is maximal in winter and
insignificant in summer, and therefore the overheating problem can be avoided. The Prisma solar
glass was modeled by assuming a transmission and a reflection coefficient of value 10% and 78%
respectively, for the external TIM-PCM glazing in summer season.
Figure 3-11 shows the indoor test room air temperature, and the PCM temperature for both glazing
types for three consecutive days (3, 4, 5 August) in summer season. The results show that the lower
solar transmittance during summer due to the use of Prisma solar glass can prevent the overheating
problem. The peak indoor temperature is decreased by about 6.5 °C reaching a maximum value of
28.7 °C compared to 35.3°C using ordinary glazing. In addition, the maximum PCM temperatures
are reduced up to 19 °C, while during the night the PCM temperature is still higher than the phase
change temperature and the PCM remains in its liquid state. As a conclusion, the Prisma solar glass
is shown to be an effective solution for the encountered overheating problem in summer.

Chapter 3
160
Figure 3-11: a) Indoor test room air temperature, and b) PCM temperature for both glazing type in summer
season (3, 4, 5 August)
7.3. Natural night ventilation
Nocturnal ventilation is a passive cooling technique that uses the outdoor air at night to cool the
building; the airflow is driven due to the temperature difference and the wind. The natural ventilation
is considered in the aim of evacuating the extra heat at night, and to show its effect on the PCM
performance and on the indoor air temperature during night and day.
A window of 1 m2 located at the west wall is considered and scheduled to be open from 8 p.m. till 8
a.m. and closed during the day with opaque blinds to prevent the solar radiation from entering the
room. The natural ventilation rate is calculated using the equations of Ghiaus and Roulet [75]. The
flow rate (m3/s) through the opening is calculated as:
�� = 0.5𝐴𝑤𝑣𝑒𝑓𝑓 Eq. 3-36
where Aw is the effective area of the open window and veff is found using an empirical model:
veff = (c1vr2 + c2H. ∆T + c3)
1/2 Eq. 3-37
where c1 is a dimensionless coefficient depending upon window opening (c1 ~ 0.001), c2, c3 are
buoyancy and wind constant (c2 ~ 0.0035, c3 = 0.01), vr (m/s) is the mean wind speed for the site, H
is the height of the opening, and ΔT is the mean temperature difference between outdoor and indoor
environment.
The flow in air changes per hour is given as follow:
ACH =3600
VV
Eq. 3-38
24
26
28
30
32
34
36
0 6 12 18 24 30 36 42 48 54 60 66 72
Ind
oo
r ai
r te
mp
era
ture
(⁰C
)
Time (hours)
a)
Ordinary glazing Prisma solar glass
20
25
30
35
40
45
50
0 6 12 18 24 30 36 42 48 54 60 66 72
PC
M t
em
pe
ratu
re (
⁰C)
Time (hours)
b)
Ordinary glazing Prisma solar glass

Chapter 3
161
where V is the volume of the room.
A flow rate between 6 ACH and 7 ACH is found for an opening area of 1 m2, when the difference
between outdoor and indoor air temperature is minimal and the mean wind velocity is about 0.1 m/s.
A parametric study on the effect of different ventilation rates (otherwise different window opening
proportion) is carried out. The recommended minimum ventilation rate by ASHRAE is 0.36 ACH
[76]. For a ventilation rate of 2 ACH, the peak indoor temperature is reduced by 1⁰C, above this ACH
value the results are tardily changing where a ventilation rate of 6 ACH decreases the peak
temperature by 1.5⁰ C. The minimum temperature is reduced by about 2 ⁰C and 3.6⁰C for a ventilation
rate of 2 ACH and 6 ACH respectively, showing a higher effect of the natural ventilation at night.
The natural night ventilation has almost (49.29°C 48.16°C ~ 1 °C) no effect on the maximum PCM
temperature, while at night this temperature is reduced by about 2.5 °C for 6 ACH. The nocturnal
ventilation cannot improve the performance of PCM since the outdoor air temperature at night is
relatively high in summer conditions.
Figure 3-12 shows that the natural night ventilation has insignificant effect on the indoor air
temperature when blinds at 45° rotatable slat angle are used, and a ventilation rate of 2 ACH is
sufficient in this case. As a conclusion, natural night ventilation alone cannot solve the overheating
problem, and must be combined to shading devices.
Figure 3-12: Indoor air temperature for different cases after applying natural night ventilation in summer
season (3, 4, 5 August)
22
24
26
28
30
32
34
0 6 12 18 24 30 36 42 48 54 60 66 72
Ind
oo
r te
mp
era
ture
(⁰C
)
Time (hours)
2 ACH 6 ACH Overhang+2 ACH
Overhang+6 ACH Blinds + 2 ACH Blinds + 6 ACH

Chapter 3
162
7.4. PCM RT28HC
It was noted that despite a better indoor temperature, due to shading devices and night ventilation, the
PCM never solidifies in summer, due to its low melting temperature.
In this section another PCM, with a higher phase change temperature (chosen nearby the thermal
comfort range [77]) is considered to be filled in the glass bricks instead of the fatty acid eutectic 21.3.
The PCM is RT28HC, RUBITHERM® RT, a pure material, having similar optical properties of the
fatty acid eutectic i.e. transparent in the liquid state and opaque in the solid state with phase change
temperature of 28˚C. the thermo-physical properties can be found in [78].
Figure 3-13: Average fraction of liquid and temperature in the PCM layer for both PCM in summer season (3, 4,
5 August)
Figure 3-13 shows the average liquid fraction of each PCM, the PCM having a phase change
temperature of 21.3 ⁰C remains always in its liquid state during the whole day and night, while the
other PCM with a phase change temperature of 28 ⁰C undergoes a partial freezing at night starting
from 1 am solidifying by about 20% (fraction of liquid attains about 0.8) and then returns to its fully
liquid state at 8 am with fraction of liquid equal to 1. During this partial solidification, a marginal
portion of the stored heat during the day is released decreasing very slightly the maximum PCM
temperature. Regarding the indoor air temperature, the difference is trivial using both PCM. Complete
0
0,2
0,4
0,6
0,8
1
1,2
25
30
35
40
45
50
55
60
0 6 12 18 24 30 36 42 48 54 60 66 72liq
uid
fra
ctio
n
PC
M t
em
pe
ratu
re (
⁰C)
Time (hours)
TPCM 28 TPCM 21.3 averfl (PCM 28) averfl (PCM21.3)
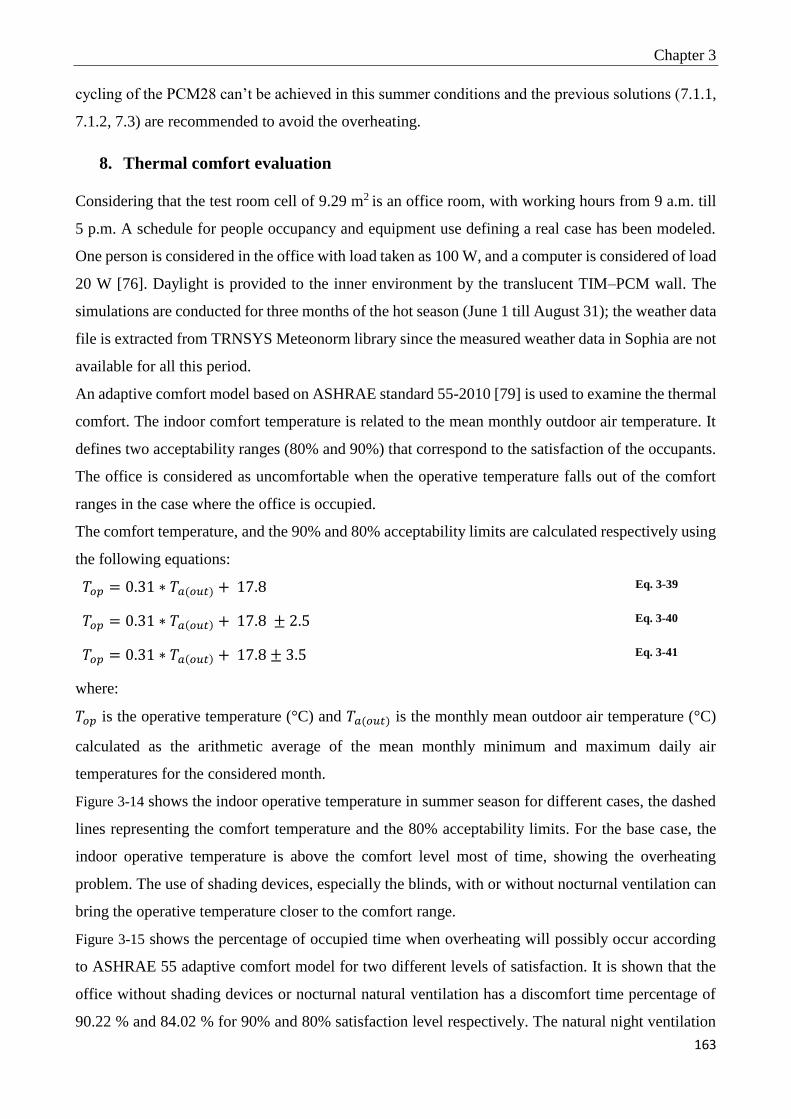
Chapter 3
163
cycling of the PCM28 can’t be achieved in this summer conditions and the previous solutions (7.1.1,
7.1.2, 7.3) are recommended to avoid the overheating.
8. Thermal comfort evaluation
Considering that the test room cell of 9.29 m2 is an office room, with working hours from 9 a.m. till
5 p.m. A schedule for people occupancy and equipment use defining a real case has been modeled.
One person is considered in the office with load taken as 100 W, and a computer is considered of load
20 W [76]. Daylight is provided to the inner environment by the translucent TIM–PCM wall. The
simulations are conducted for three months of the hot season (June 1 till August 31); the weather data
file is extracted from TRNSYS Meteonorm library since the measured weather data in Sophia are not
available for all this period.
An adaptive comfort model based on ASHRAE standard 55-2010 [79] is used to examine the thermal
comfort. The indoor comfort temperature is related to the mean monthly outdoor air temperature. It
defines two acceptability ranges (80% and 90%) that correspond to the satisfaction of the occupants.
The office is considered as uncomfortable when the operative temperature falls out of the comfort
ranges in the case where the office is occupied.
The comfort temperature, and the 90% and 80% acceptability limits are calculated respectively using
the following equations:
𝑇𝑜𝑝 = 0.31 ∗ 𝑇𝑎(𝑜𝑢𝑡) + 17.8 Eq. 3-39
𝑇𝑜𝑝 = 0.31 ∗ 𝑇𝑎(𝑜𝑢𝑡) + 17.8 ± 2.5 Eq. 3-40
𝑇𝑜𝑝 = 0.31 ∗ 𝑇𝑎(𝑜𝑢𝑡) + 17.8 ± 3.5 Eq. 3-41
where:
𝑇𝑜𝑝 is the operative temperature (°C) and 𝑇𝑎(𝑜𝑢𝑡) is the monthly mean outdoor air temperature (°C)
calculated as the arithmetic average of the mean monthly minimum and maximum daily air
temperatures for the considered month.
Figure 3-14 shows the indoor operative temperature in summer season for different cases, the dashed
lines representing the comfort temperature and the 80% acceptability limits. For the base case, the
indoor operative temperature is above the comfort level most of time, showing the overheating
problem. The use of shading devices, especially the blinds, with or without nocturnal ventilation can
bring the operative temperature closer to the comfort range.
Figure 3-15 shows the percentage of occupied time when overheating will possibly occur according
to ASHRAE 55 adaptive comfort model for two different levels of satisfaction. It is shown that the
office without shading devices or nocturnal natural ventilation has a discomfort time percentage of
90.22 % and 84.02 % for 90% and 80% satisfaction level respectively. The natural night ventilation

Chapter 3
164
of 6 ACH reduces the discomfort time percentage to 69.75 % and 57.25 % for 90% and 80%
acceptability range respectively. Adding an overhang of 1 m projection decreases the discomfort time
to approximately 53.62 % for 80% satisfaction level. Applying the natural night ventilation in
presence of the overhang decreases the overheating time percentage to 40.58% and 19.56% for 2
ACH and 6 ACH respectively for 80% satisfaction level. For 90% satisfaction level, the discomfort
is decreased to 58.33% and 34.24% for 2 ACH and 6 ACH respectively. Moreover, with Venetian
blinds of slats rotated at 45 degrees, there is not so much risk of overheating where the discomfort
percentage does not exceed 6 % for 80% satisfaction level. Combining natural night ventilation with
blinds decreases the percentage of overheating time to 2.89% and 1.99% for 2 ACH and 6 ACH
respectively for 80% acceptability range. No overheating is observed when Venetian blind are
combined with overhangs for 80% acceptability range while 3.44% of overheating time is found for
90% acceptability level.

Chapter 3
165
Figure 3-14: Indoor operative temperature in summer season for different cases
10
15
20
25
30
35
40
3624 3844 4064 4284 4504 4724 4944 5164 5384 5604 5824
Ind
oo
r o
pe
rati
ve t
em
pe
ratu
re (
⁰C)
Time (hours)
1
Base case Overhang Overhang + 2 ACH Overhang + 6 ACH
10
15
20
25
30
35
40
3624 3844 4064 4284 4504 4724 4944 5164 5384 5604 5824
Ind
oo
r o
pe
rati
ve t
em
pe
ratu
re (⁰
C)
Time (hours)
2
Blinds Blinds + 2 ACH Blinds+ 6 ACH Overhang + Blinds

Chapter 3
166
Figure 3-15: The percentage of occupied time where overheating occurs according to ASHRAE 55 adaptive
comfort model for different levels of satisfaction
9. Application of the TIM-PCM wall under different climate conditions
In this section, the thermal comfort is studied for the same office room with same internal gains
conditions, same orientation (south) but under different climates. Five different cities with different
climates were chosen according to the Köppen–Geiger classification [80]. Madrid, Spain Csa (Hot-
summer Mediterranean climate), Paris, France Cfb (temperate oceanic climate), Chicago, USA Dfa
(hot-summer humid continental climate), Ottawa, Canada Dfb (warm-summer humid continental
climate) and Kiruna, Sweden Dfc (subarctic climate). Figure 3-16 shows the percentage of occupied
time when overheating will possibly occur according to ASHRAE 55 adaptive comfort model (section
8) for two different levels of satisfaction for the different climates in three months of hot season.
In the hot-summer Mediterranean climate (Csa) and the hot-summer humid continental climate (Dfa),
the percentage of discomfort time for the base case is around 90% for both acceptability ranges. The
use of overhang of 1 m projection decreases the time of overheating percentage time to 75% for 90%
acceptability range. The reduction of discomfort percentage time is more significant in Dfa climate
using blinds. Natural night ventilation alone has not a significant effect on the discomfort percentage
time. To overcome the overheating problem in such climates (Csa and Dfa), Venetian blinds of slats
rotated at 45 degrees combined with overhang should be used.
For the Oceanic climate (Cfb) the discomfort time for the base case is about 35% and 45% for 80%
and 90% of occupants satisfied, respectively. Adding an overhang of 1 m projection decreases the
percentage of discomfort time to less than 5% and 10% for 80% and 90% occupants are satisfied,
respectively. No overheating is observed using Venetian blinds. In the warm-summer humid
0
10
20
30
40
50
60
70
80
90
100
Base case 6 ACH Overhang Overhang+ 2 ACH
Overhang+ 6 ACH
Blinds Blinds +2ACH
Blinds+6ACH
Overhang+ Blinds
% o
f o
ccu
pie
d t
ime
wit
h o
verh
eat
ing 80% acceptability range
90% acceptability range

Chapter 3
167
continental climate (Dfb) the use of venetian blinds is sufficient to eliminate the discomfort time
percentage. Providing natural ventilation decreases the discomfort time percentage. For the subarctic
climate (Dfc), the percentage of occupied time where thermal comfort is not met does not exceed
16% for 80% of occupants satisfied and no overheating is observed during the occupied hours using
overhang of 1m projection or providing natural night ventilation of 6 ACH for both 80% and 90% of
occupants satisfied.
Figure 3-16: Percentage of occupied time where overheating occurs according to ASHRAE 55 adaptive comfort
model for different levels of satisfaction for different climate conditions in summer season
Concerning the PCM cycling, in Csa and Dfa climates, the PCM remains in liquid state almost all the
summertime for the base case. Using shading devices, the PCM solidifies or partially solidifies 20%
of the summertime. In Paris, Cfb climate, the PCM remains in liquid state 75% of the time while in
Ottawa, Dfb climate, the PCM remains liquid for 92% of the time. This can be explained by the lower
outdoor ambient temperature at night in Paris allowing partial or complete solidification of the PCM.
Using overhang, the PCM becomes liquid for 50% of the summertime, and the rest of the time
changing phase or in solid state in Paris, Cfb climate. In subarctic climate (Dfc) the PCM achieves
complete diurnal cycling and it is liquid for 40% of the summertime.
0
10
20
30
40
50
60
70
80
90
100
Bas
e ca
se
Ove
rhan
g
Blin
ds
Ove
rhan
g+b
lind
s
Bas
e ca
se
Ove
rhan
g
Blin
ds
Ove
rhan
g+b
lind
s80% Acceptability 90% Acceptability
% o
f o
ccu
pie
d t
ime
wit
h o
verh
eat
ing Madrid (Csa)
Paris (Cfb)
Chicago (Dfa)
Ottawa (Dfb)
Kiruna (Dfc)

Chapter 3
168
10. Conclusion
This paper investigates the thermal behavior of a novel special translucent superinsulated storage wall
composed of glazing, silica aerogel and PCM filled in glass bricks. The aim of such wall is to provide
energy storage and restitution, daylighting, and thermal/acoustic insulation. The TIM-PCM wall was
tested in-situ in a full-sized test cell located at Sophia Antipolis, southern France. The experimental
results showed that the wall is very efficient in winter season, while in summer the heat gains through
the TIM-PCM wall cause an overheating problem and the PCM does not solidify. To optimize the
wall’s performance, a simplified numerical model for heat transfer through this composite wall
considering natural convection in liquid PCM and short-wave radiation absorption and transmission
has been developed. The structured numerical model is simple to implement and fast enough to be
coupled with TRNSYS. The MATLAB-TRSNYS model is then validated using experimental results;
a good agreement is obtained between the simulated and the experimentally measured internal surface
temperature of the TIM-PCM wall and the indoor air temperature for seven consecutive days in
summer and winter. Finally, the TIM-PCM wall has been applied in different cities under different
climates in summertime and the thermal comfort and PCM cycling have been studied. The following
general conclusions can be drawn:
• The developed numerical model represents a starting point for simulations on different
configurations of the novel TIM-PCM wall and allows to fully investigate its abilities and
drawbacks under different operative conditions, orientations, geometries and different
climates without the need of performing expensive experimental analysis.
• To be more realistic, natural convection in the liquid PCM should not be neglected when
modeling phase change in the wall.
• The use of Prisma solar glass instead of the ordinary glass in the TIM-PCM wall composition
is shown to be an effective technology solving the encountered overheating problem in
summer, while preserving the TIM-PCM advantages during winter.
• Thermal comfort and cycling of PCM in summertime depends on the climate conditions. In
the hot-summer Mediterranean climate, Venetian blinds of slats rotated at 45 degrees
combined with an overhang of 1 m projection can ensure thermal comfort with the TIM-PCM
wall. In oceanic and warm-summer humid continental climates, thermal comfort can be
ensured by the sole use of an overhang of 1 m projection and Venetian blinds respectively. In
subarctic climate the PCM achieves complete diurnal cycling and thermal comfort can be
attained providing natural night ventilation.
As future work, life cycle cost analysis, payback periods and optimization of TIM-PCM wall
configuration under different climates conditions will be studied using the validated numerical model.

Chapter 3
169
References
[1] C. Initiative, “Buildings and Climate Change http://admin.indiaenvironmentportal.org.in/files/SBCI-
BCCSummary.pdf,” 2009.
[2] F. Trombe, “Heating by solar radiation.” CNRS Internal Report B-1- 73-100., 1973.
[3] P. Ohanessian and W. W. . Charters, “Thermal simulation of a passive solar house using a Trombe-Michel
wall structure.,” Sol. Energy 20, pp. 275–281, 1978.
[4] A. V. Sebald, J. R. Clinton, and F. Langenbacher, “Performance effects of Trombe wall control
strategies.,” Sol. Energy 23 (6), pp. 479–487, 1979.
[5] E. Kruger, E. Suzuki, and A. Matoski, “Evaluation of a Trombe wall system in a subtropical location.,”
Energy Build., vol. 66, pp. 364–372, 2013.
[6] M. Bojic, K. Johannes, and F. Alamdari, “Optimizing energy and environmental performance of passive
Trombe wall,” Energy Build, vol. 70, pp. 279–286, 2014.
[7] M. Telkes, “Trombe wall with phase change storage material,” in Proceedings of the 2nd National Passive
Solar Conference, Philadelphia, PA, USA., 1978.
[8] F. Fiorito, “Trombe walls for lightweight buildings in temperate and hot climates. exploring the use of
phase-change materials for performances improvement.,” Energy Procedia, vol. 30, pp. 1110–1119, 2012.
[9] L. Zalewski, A. Joulin, S. Lassue, and Y. Dutil, “Experimental study of small-scale solar wall integrating
phase change material,” Sol. Energy, no. 86, pp. 208–219, 2012.
[10] A. de Gracia, L. Navarro, A. Castell, A. Ruiz-Pardo, S. Alvarez, and L. F. Cabeza, “Experimental study
of a ventilated facade with PCM during winter period,” Energy Build., pp. 58, 324–332, 2013.
[11] L. Yongcai and L. Shuli, “Experimental study on thermal performance of a solar chimney combined with
PCM,” Appl. Energy 114, pp. 172–178, 2014.
[12] G. Diarce et al., “Ventilated active façades with PCM,” Appl. Energy, vol. 109, pp. 530–537, Sep. 2013.
[13] Y. A. Kara and A. Kurnuç, “Performance of coupled novel triple glass unit and pcm wall,” Appl. Therm.
Eng., vol. 35, pp. 243–246, Mar. 2012.
[14] A. Ghosh, B. Norton, and A. Duffy, “Measured thermal & daylight performance of an evacuated glazing
using an outdoor test cell,” Appl. Energy, vol. 177, pp. 196–203, Sep. 2016.
[15] F. Favoino, F. Fiorito, A. Cannavale, G. Ranzi, and M. Overend, “Optimal control and performance of
photovoltachromic switchable glazing for building integration in temperate climates,” Appl. Energy, vol.
178, pp. 943–961, Sep. 2016.
[16] N. DeForest, A. Shehabi, S. Selkowitz, and D. J. Milliron, “A comparative energy analysis of three
electrochromic glazing technologies in commercial and residential buildings,” Appl. Energy, vol. 192, pp.
95–109, Apr. 2017.
[17] F. Goia, M. Perino, and V. Serra, “Experimental analysis of the energy performance of a full-scale PCM
glazing prototype,” Sol. Energy, vol. 100, pp. 217–233, 2014.
[18] B. L. Gowreesunker, S. B. Stankovic, S. A. Tassou, and P. A. Kyriacou, “Experimental and numerical
investigations of the optical and thermal aspects of a PCM-glazed unit,” Energy Build., vol. 61, pp. 239–
249, Jun. 2013.
[19] S. Li, G. Sun, K. Zou, and X. Zhang, “Experimental research on the dynamic thermal performance of a
novel triple-pane building window filled with PCM,” Sustain. Cities Soc., vol. 27, pp. 15–22, Nov. 2016.
[20] S. Grynning, F. Goia, and B. Time, “Dynamic Thermal Performance of a PCM Window System:
Characterization Using Large Scale Measurements,” Energy Procedia, vol. 78, pp. 85–90, Nov. 2015.
[21] H. Manz, P. . Egolf, P. Suter, and A. Goetzberger, “TIM–PCM external wall system for solar space heating
and daylighting,” Sol. Energy, vol. 61, no. 6, pp. 369–379, Dec. 1997.
[22] F. Goia, M. Perino, and V. Serra, “Improving thermal comfort conditions by means of PCM glazing
systems,” Energy Build., vol. 60, pp. 442–452, May 2013.
[23] C. Liu, Y. Wu, J. Bian, D. Li, and X. Liu, “Influence of PCM design parameters on thermal and optical
performance of multi-layer glazed roof,” Appl. Energy, vol. 212, pp. 151–161, Feb. 2018.
[24] F. Goia, “Thermo-physical behaviour and energy performance assessment of PCM glazing system
configurations: A numerical analysis,” Front. Archit. Res., vol. 1, no. 4, pp. 341–347, Dec. 2012.
[25] K. Zhong, S. Li, G. Sun, S. Li, and X. Zhang, “Simulation study on dynamic heat transfer performance of
PCM-filled glass window with different thermophysical parameters of phase change material,” Energy
Build., vol. 106, pp. 87–95, 2015.

Chapter 3
170
[26] K. A. R. Ismail, C. T. Salinas, and J. R. Henriquez, “Comparison between PCM filled glass windows and
absorbing gas filled windows,” Energy Build., vol. 40, no. 5, pp. 710–719, Jan. 2008.
[27] F. Goia, M. Perino, and M. Haase, “A numerical model to evaluate the thermal behaviour of PCM glazing
system configurations,” Energy Build., vol. 54, pp. 141–153, 2012.
[28] K. A. R. Ismail and J. R. Henrıquez, “Parametric study on composite and PCM glass systems,” Energy
Convers. Manag., vol. 43, no. 7, pp. 973–993, 2002.
[29] C. Liu, Y. Zhou, D. Li, F. Meng, Y. Zheng, and X. Liu, “Numerical analysis on thermal performance of a
PCM-filled double glazing roof,” Energy Build., vol. 125, pp. 267–275, 2016.
[30] C. Liu, Y. Zheng, D. Li, H. Qi, and X. Liu, “A Model to Determine Thermal Performance of a Non-
ventilated Double Glazing Unit with PCM and Experimental Validation,” Procedia Eng., vol. 157, pp.
293–300, 2016.
[31] T. Silva, R. Vicente, and F. Rodrigues, “Literature review on the use of phase change materials in glazing
and shading solutions,” Renew. Sustain. Energy Rev., vol. 53, pp. 515–535, Jan. 2016.
[32] H. Weinläder, A. Beck, and J. Fricke, “PCM-facade-panel for daylighting and room heating,” Sol. Energy,
vol. 78, no. 2, pp. 177–186, Feb. 2005.
[33] K. Johannes, F. Kuznik, F. Jay, P. Roquette, P. Achard, and Y. Berthou, “CRISTOPIA ENERGY
SYSTEMS, SAVERBAT SAS,Elément d’enveloppe d’un bâtiment et ensemble comprenant un tel
élément,” Brevet Francais FR 1158194, 15-Mar-2013.
[34] Y. Berthou, P. H. Biwole, P. Achard, H. Sallée, M. Tantot-Neirac, and F. Jay, “Full scale experimentation
on a new translucent passive solar wall combining silica aerogels and phase change materials,” Sol.
Energy, vol. 115, pp. 733–742, May 2015.
[35] E. Sparrow and J. Ramsey, “Melting and natural convection due to a vertical embedded heater.,” J Heat
Transf, p. 100:368–70, 1978.
[36] E. Sparrow and S. Patankar, “Analysis of melting in the presence of natural convection in the melt region,”
ASME J Heat Transf, vol. 99:520–6, 1977.
[37] M. FARID and R. HUSIAN, “An electrical storage heater using the phase change method of heat storage.,”
Energy Convers Manag, vol. 30(3):219–30, 1990.
[38] A. Hasan, “Phase change material energy storage system employing palmitic acid,” Sol Energy, vol.
52:143–54, 1994.
[39] M. Lacroix and T. Duong, “Experimental improvements of heat transfer in a latent heat thermal energy
storage unit with embedded heat sources,” Energy Convers. Manag., vol. 39, no. 8, pp. 703–716, 1998.
[40] Y. Zhang and J. Yi, “A simple method, the T-history method of determining the heat of fusion specific
heat and thermal conductivity of phase change materials,” Meas Sci Technol, 1999.
[41] R. Velraj and R. seeniraj, “Heat transfer enhancement in a latent heat storage system,” Sol Energy, 1999.
[42] A. SARI and K. KAYGUSUZ, “Thermal energy storage system using stearic acid as a phase change
material,” Sol Energy, 2001.
[43] P. Lamberg, R. Lehtiniemi, and A.-M. Henell, “Numerical and experimental investigation of melting and
freezing processes in phase change material storage,” Int. J. Therm. Sci., vol. 43, no. 3, pp. 277–287, Mar.
2004.
[44] F. Souayfane, F. Fardoun, and P. H. Biwole, “Different mathematical models of convection during phase
change,” presented at the REDEC conference, NDU university Lebanon, 2016, pp. 1–8.
[45] H. Elarga, F. Goia, A. Zarrella, A. Dal Monte, and E. Benini, “Thermal and electrical performance of an
integrated PV-PCM system in double skin façades: A numerical study,” Sol. Energy, vol. 136, pp. 112–
124, Oct. 2016.
[46] F. Zanghirella, M. Perino, and V. Serra, “A numerical model to evaluate the thermal behaviour of active
transparent facades,” Energy Build., vol. 43, no. 5, pp. 1123–1138, 2011.
[47] D. Faggembauu, M. Costa, M. Soria, and A. Oliva, “Numerical analysis of the thermal behaviour of
ventilated glazed facades in Mediterranean climates. Part I: development and validation of a numerical
model,” Sol. Energy, vol. 75, no. 3, pp. 217–228, 2003.
[48] O. G. Pop, L. Fechete Tutunaru, F. Bode, A. C. Abrudan, and M. C. Balan, “Energy efficiency of PCM
integrated in fresh air cooling systems in different climatic conditions,” Appl. Energy, vol. 212, pp. 976–
996, Feb. 2018.
[49] M. Alam, H. Singh, and M. C. Limbachiya, “Vacuum Insulation Panels (VIPs) for building construction
industry–A review of the contemporary developments and future directions,” Appl. Energy, vol. 88, no.
11, pp. 3592–3602, 2011.

Chapter 3
171
[50] J. Kosny and E. Kossecka, “Multi-dimensional heat transfer through complex buildings envelope
assemblies in hourly energy simulation programs,” Energy and Buildings, p. 34:445-54, 2002.
[51] F. Goia, M. Perino, and M. Haase, “A numerical model to evaluate the thermal behaviour of PCM glazing
system configurations,” Energy Build., vol. 54, pp. 141–153, Nov. 2012.
[52] H. Elarga, F. Goia, A. Zarrella, A. Dal Monte, and E. Benini, “Thermal and electrical performance of an
integrated PV-PCM system in double skin façades: A numerical study,” Sol. Energy, vol. 136, pp. 112–
124, 2016.
[53] G. Fraisse, “Development of a simplified and accurate building model based on electrical analogy,”
Energy & Buildings, vol. 34, pp. 1017–1031, 2002.
[54] G. Colomer Rey, Numerical methods for radiative heat transfer. Universitat Politècnica de Catalunya,
2006.
[55] H. Elarga, M. De Carli, and A. Zarrella, “A simplified mathematical model for transient simulation of
thermal performance and energy assessment for active facades,” Energy Build., vol. 104, pp. 97–107, Oct.
2015.
[56] R. Siegel, “Net radiation method for enclosure systems involving partially transparent walls,” 1973.
[57] W. Swinbank, “Long-wave radiation from clear skies,” Q. J. R. Meteoro. Soc, p. 89:339, 1963.
[58] F. Miranville, “Contribution à l’étude des parois complexes en physique du bâtiment: modélisation,
expérimentation et validation expérimentale de complexes de toitures incluant des produits minces
réfléchissants en climat tropical humide,” Université de la Réunion, 2002.
[59] B. Zivkovic and I. Fujii, “An analysis of isothermal phase change of phase change material within
rectangular and cylindrical containers,” Sol. Energy, vol. 70, no. 1, pp. 51–61, 2001.
[60] F. Souayfane, P. H. Biwole, and F. Fardoun, “Modèle simplifié pour la prise en compte de la convection
naturelle dans la modélisation du changement de phase solide-liquide,” presented at the Colloque Inter-
universitaire Franco-Québecois, Saint-lo, France, 2017.
[61] G. Vidalain, L. Gosselin, and M. Lacroix, “An enhanced thermal conduction model for the prediction of
convection dominated solid–liquid phase change,” Int. J. Heat Mass Transf., vol. 52, no. 7–8, pp. 1753–
1760, Mar. 2009.
[62] P. Jany and A. Bejan, “Scaling theory of melting with natural convection in an enclosure,” Int. J. Heat
Mass Transf., vol. 31, no. 6, pp. 1221–1235, Jun. 1988.
[63] A. Bejan, Convection heat transfer, Fourth edition. Hoboken, New Jersey: Wiley, 2013.
[64] F. Souayfane, P. H. Biwole, and F. Fardoun, “Melting of a phase change material in presence of natural
convection and radiation: A simplified model,” Appl. Therm. Eng., vol. 130, pp. 660–671, Feb. 2018.
[65] S. V. Patankar, Numerical heat transfer and fluid flow. New York: McGraw-Hill., 1980.
[66] S. S. Dhenakaran and E. R. Naganathan, “A new approach to multiple symmetric keys,” IJCSNS, vol. 7,
no. 6, pp. 254–259, 2007.
[67] B. Gluck, “Wärmetechnisches Raummodell: gekoppelte Berechungen und wärmephysiologische
Untersuchung,” C.F. Müller Verlag, pp. 66–67, 1997.
[68] T. E. Kuhn, C. Bühler, and W. J. Platzer, “Evaluation of overheating protection with sun-shading systems,”
Sol. Energy, vol. 69, pp. 59–74, 2001.
[69] A. I. Palmero-Marrero and A. C. Oliveira, “Effect of louver shading devices on building energy
requirements,” Appl. Energy, vol. 87, no. 6, pp. 2040–2049, Jun. 2010.
[70] A. Kirimtat, B. K. Koyunbaba, I. Chatzikonstantinou, and S. Sariyildiz, “Review of simulation modeling
for shading devices in buildings,” Renew. Sustain. Energy Rev., vol. 53, pp. 23–49, Jan. 2016.
[71] “ISOTRA.” [Online]. Available: http://www.isotra.com/calculation-of-solar-and-light-transmittance
http://www.isotra.com/calculation-of-solar-and-light-transmittance.
[72] [Online]. Available: http://www.isotra.com/.
[73] “EN 13363-1 (2003) + A1 (2007): solar protection devices combined with glazing - Part 1: simplifies
method Berlin, Beuth Verlaj GmbH.” .
[74] “DIN 4108-2 Thermal protection and energy economy in buildings- Part2: Minimum requirements to
thermal insulation, Berlin, Beuth Verlag GmbH.” .
[75] C. Ghiaus and C.-A. Roulet, “Strategies for natural ventilation,” Nat. Vent. Urban Environ. Assess. Des.,
pp. 136–157, 2005.
[76] R. and A.-C. E. American Society of Heating, ASHRAE handbook. Atlanta: American Society of Heating,
Refrigerating and Air-Conditioning Engineers, 2001.
[77] F. Souayfane, F. Fardoun, and P.-H. Biwole, “Phase change materials (PCM) for cooling applications in
buildings: A review,” Energy Build., vol. 129, pp. 396–431, Oct. 2016.

Chapter 3
172
[78] R. Hampus, Performance improvement from single to multi phase change materials in a thermal energy
storage system. 2015.
[79] S. Ferrari and V. Zanotto, “Adaptive comfort: Analysis and application of the main indices,” Build.
Environ., vol. 49, pp. 25–32, Mar. 2012.
[80] M. Kottek, J. Grieser, C. Beck, B. Rudolf, and F. Rubel, “World Map of the Köppen-Geiger climate
classification updated,” Meteorol. Z., vol. 15, no. 3, pp. 259–263, Jun. 2006.

Chapter 3
173
Complementary sections to chapter 3
A) Graphs for model validation in winter season
In summer season, the PCM remains in its liquid state and the model was validated for seven
consecutive days (30 July-5 August 2017) comparing the simulated and the measured values for the
internal surface temperature of the TIM-PCM wall, the indoor test room air temperature and the PCM
temperature in section 6. The comparisons showed a very good agreement and that the natural
convection in liquid PCM must be considered. In this section we will show the validation curves, for
internal surface temperature and indoor temperature, for seven consecutive days in winter season (27
January-2 February 2017). In this period, phase change occurs, and the PCM melts during the day
and solidifies at night.
Figure 1: Temperatures and solar radiation for seven consecutive days in winter (27 January-2 February 2017).
The seven consecutive days in winter season (27January- 2 February) are characterized by a low
outdoor temperature varying from 5.22 ⁰C to 16.63 ⁰C, with low (70.82 W.m-2) and high (719.2 W.m-
2) solar radiation on the southern vertical plane (Figure 1). On January 27 and 28, the PCM does not
melt staying in its solid state (PCM temperature lower than 21⁰C) and the test room air temperature
is about 17⁰C. On January 29 and 30 and on February first, due the high incident solar radiation, the
PCM melts during the day (PCM temperature up to 62⁰C) and solidifies at night and the indoor
temperature reaches more than 20⁰C. The TIM-PCM wall is therefore very effective in the winter
season (the average room air temperature is almost constant at18.38 ⁰C), keeping warm the indoor
0
5
10
15
20
25
0
100
200
300
400
500
600
700
800
0 12 24 36 48 60 72 84 96 108 120 132 144 156 168
Tem
pe
ratu
re (
⁰C)
Sola
r ra
dia
tio
n (
W.m
-2)
Time (hours)
Winter
Solar radiation on vertical plan Outdoor air temperature Test room air temperature

Chapter 3
174
environment especially in sunny days. The measured PCM temperatures for seven consecutive days
in winter season are shown in Figure 2.
Figure 2: Measured PCM temperatures for seven consecutive days in winter (27 January-2 February 2017).
Noting that during solidification process, the convection heat transfer is less important than
conduction [1,2]. In addition, in such walls as the INERTRANS wall solidification is more likely to
happen at night, in absence of solar radiation. Thus, the equation of heat transfer for the phase change
controlled by the conduction only is used to model solidification process (see Enthalpy method).
0
5
10
15
20
25
30
35
40
45
50
55
60
65
0 12 24 36 48 60 72 84 96 108 120 132 144 156 168
PC
M t
em
pe
ratu
re (
⁰C)
Time (hours)
Winter Phase change temperature

Chapter 3
175
Figure 3: Simulated and measured a) internal surface temperature of the TIM-PCM wall and b) indoor test
room air temperature for seven consecutive days in days in winter (27 January- 2 February 2017).
Figure 3 shows the simulated and measured internal surface temperature of the TIM-PCM wall and
indoor test room air temperature for seven consecutive days in days in winter (27 January- 2 February
2017). The numerical model is found to be able to simulate the heat transfer phenomena through the
TIM-PCM wall in winter. The model predicts properly the maximum and minimum peak values of
0
5
10
15
20
25
30
0 12 24 36 48 60 72 84 96 108 120 132 144 156 168
Surf
ace
te
mp
era
ture
(⁰C
)
Time (hours)
a)
Measured Simulated
10
12
14
16
18
20
22
24
26
0 12 24 36 48 60 72 84 96 108 120 132 144 156 168
Ind
oo
r ai
r te
mp
era
ture
(⁰C
)
Time (hours)
b)
Measured Simulated

Chapter 3
176
the hourly profile of the internal surface temperature and the indoor air temperature with a slight
underestimation of the lowest values. The peak values in all days are in good agreement. For the
indoor temperature a maximum difference between the simulated and experimental values is 1.3⁰C.
The PCM undergoes complete cycles in January 29, 30 and February first while the PCM is remains
in its solid state in 27 and 28 January where a good agreement is found between experimental and
simulated values.
In addition, the PRMSE and RSME demonstrate the good agreement between the experimental and
the simulated results. The PRMSE of the indoor air temperature is 4.05%, and that of the internal
surface temperature is 6.9 %. While the RMSE is 0.76⁰C and 1.43⁰C for the indoor air temperature
and the internal surface temperature respectively. Here, the model considers convection during
melting process.
These results are relatively acceptable, the model is validated in summer (when PCM is always in its
liquid state) and in winter (when phase change occurs). Thus, the model can be used for annual
thermal assessment.
B) Wind velocity and outdoor relative humidity in winter and summer seasons
The wind velocity is used to find the external convection heat transfer (correlation of Sturrock):
ℎ𝑜𝑢𝑡 = 5.7𝑣 + 11.4 (Windward)
ℎ𝑜𝑢𝑡 = 5.7𝑣 (Leeward))
And, the outdoor relative humidity is linked to the building model (in TRNSYS).
0
0,2
0,4
0,6
0,8
1
0
20
40
60
80
100
0 12 24 36 48 60 72 84 96 108 120 132 144 156 168
Win
d v
elo
city
(m
/s)
Re
lati
ve h
um
idit
y %
Time (hours)
Summer
Relative outdoor humidity Wind velocity

Chapter 3
177
Figure 4: Measured wind velocity and outdoor relative humidity for seven consecutive days in summer (30 July-
5 August 2017) and winter (27 January-2 February 2017).
References
[1] M. Lacroix and M. Benmadda, “Numerical simulation of natural convectiondominated melting and
solidification from a finned vertical wall,” Numer. Heat Transfer, no. Part A Appl. 31, pp. 71–86, 1997.
[2] R. Velraj, R. seeniraj, B. Hafner, C. Faber, and K. Schwarzer, “HEAT TRANSFER ENHANCEMENT
IN A LATENT HEAT STORAGE SYSTEM,” Solar Energy, vol. 65, no. No. 3, pp. 171–180, 1999.
0
0,2
0,4
0,6
0,8
1
0
20
40
60
80
100
0 12 24 36 48 60 72 84 96 108 120 132 144 156 168
Win
d v
elo
city
(m
/s)
Re
lati
ve h
um
idit
y %
Time (hours)
Winter
Relative outdoor humidity Wind velocity


CHAPTER 4
ENERGY PERFORMANCE AND ECONOMIC ANALYSIS
OF A TIM-PCM WALL UNDER DIFFERENT CLIMATES


Chapter 4
181
Chapter 4. Energy Performance and Economic Analysis of a TIM-PCM
wall Under Different Climates
Résumé du chapitre en français
Performance énergétique et analyse économique liées à l'application du mur MCP-Aérogel sous
différents climats
Dans un premier temps, ce chapitre étudie la performance énergétique d’un bureau typique suite à
l'incorporation du mur MCP-aérogel dans son enveloppe, dans six climats différents considérés selon
la classification de Köppen-Geiger. Le processus de simulation est réalisé pour une année entière à
l'aide du modèle numérique TRNSY-MATLAB validé expérimentalement. Les charges énergétiques
annuelles de chauffage et de refroidissement sont déterminées pour un bureau conventionnel équipé
d'une fenêtre double vitrage, puis comparées à celles du bureau équipé d'un mur MCP-aérogel orienté
sud. Les économies d'énergie dues à l'utilisation du mur MCP-aérogel sont aussi évaluées. La surface
du double vitrage isolé et du mur MCP-aérogel varie de 0 m2 à 7.532 m2.
Dans tous les climats étudiés, la performance énergétique du bureau, en termes d'économies de
chauffage et de refroidissement, est significativement améliorée avec l'incorporation de la paroi
MCP-aérogel au lieu d'une fenêtre à double vitrage. De plus, les charges totales diminuent avec
l'augmentation de la surface du mur sauf en climat méditerranéen (Csa). Ainsi, dans les villes ayant
une saison estivale chaude, la surface du mur MCP-aérogel doit être limitée à une certaine valeur de
manière à fournir des économies de chauffage significatives en hiver et des charges de
refroidissement acceptables en été. Dans ce cas, la surface optimale du mur fournissant des charges
énergétiques totales minimales est de 2,61 m2 à Sacramento, USA (Csa). Cependant, les dispositifs
d'ombrage peuvent être utilisés en été pour empêcher le problème de surchauffe et réduire les charges
de refroidissement. Dans les autres climats étudiés, la surface de la paroi MCP-aérogel montrant la
meilleure performance énergétique est de l’ordre de 7.5 m2.
Dans un deuxième temps, la surface optimale du mur MCP-aérogel a été évaluée économiquement
pour chaque climat grâce à une analyse portant sur le coût global durant le cycle de vie (CCV) et le
temps de retour sur investissement (TRI). Deux critères ont été évalués : la surface optimale est celle
qui assure le CCV minimal ou le TRI minimal. Il a été trouvé que lorsque le climat devient plus froid,
la surface optimale du mur MCP-aérogel augmente. Dans les climats polaire (ET) et subarctique
(Dfc), l'application de la paroi MCP-aérogel est trouvé économiquement faisable. Les économies de
chauffage pour l'immeuble de bureaux situé à Dras, en Inde (Dsb, climat continental) ne sont pas
suffisantes pour récupérer l'investissement en raison des faibles prix de l'énergie et du taux
d'actualisation (discount rate) élevé. A Paris, France (Cfb, climats océanique), l'utilisation du mur

Chapter 4
182
MCP-aérogel s'avère plus rentable que l'utilisation de la fenêtre double vitrage en termes de coût
minimal du cycle de vie et de temps de retour sur investissement. A Sacramento, Usa (Csa, climat
méditerranéen) et Toronto, Canada (Dfa, climat humide continental), l’application du mur n'est pas
rentable aux prix actuels de l'énergie et de l'investissement. Les meilleurs candidats pour l'application
du mur MCP-aérogel se trouvent là où le prix du gaz naturel est relativement élevé, rendant le coût
d'investissement initial relativement insignifiant comparé aux économies de chauffage. La viabilité
économique de l'application du mur MCP-aérogel dépend donc de différents facteurs : conditions
climatiques, économies d'énergie, coûts énergétiques (prix du gaz naturel, prix de l'électricité ...),
situation économique du pays (taux d'actualisation et facteur de valeur actuelle) et couts
d’investissement.

Chapter 4
183
Abstract
The application of an innovative translucent superinsulated latent heat storage wall, combining
transparent insulation material and phase change materials (TIM-PCM wall), on the envelope of a
typical office under different climates is evaluated. Energy and economic analysis related to this
application are presented. The simulation process is carried out using an experimentally validated
numerical model. The results show that the incorporation of the TIM-PCM wall, on the south
orientation, is more efficient than the use of a double-glazed in all considered climates. Besides,
increasing the TIM-PCM wall area increases the total energy savings in all climates except in the
Mediterranean climate. The optimum TIM-PCM wall area is then evaluated economically through
life-cycle cost and payback period analysis. The purpose is to ensure an effective performance of the
wall in each climate and at the same time to ensure an economic viability. The results show that, in
polar and subarctic climates, the application of the TIM-PCM wall has a high economic value and
the investment appears to be attractive, the payback period being 10.5 years and 7.8 years
respectively. In Paris (Oceanic climate), the use of the TIM-PCM wall is found more cost-effective
than the use of double-glazed window showing lower total life-cycle cost and payback period.
However, In Dras (continental climate), the use of the wall is found infeasible economically due to
low energy prices and high discount rates. At current prices, the TIM-PCM wall investment in
Sacramento (Mediterranean climate) and Toronto (Humid continental) does not offer economic
benefits.
Keywords: TIM-PCM wall, energy performance, climatic zones, economic analysis, office building
envelope.
Highlights:
• Application of the TIM-PCM wall under different climates.
• Energy and economic analysis related to the application of the TIM-PCM wall.
• Evaluation of the optimum TIM-PCM wall area in each climatic condition.
• Economic viability depends on climatic conditions, energy price and investment cost.

Chapter 4
184
1. Introduction
Nowadays, reducing the total energy demand of the world is a crucial challenge, due to global
warming, climate change effects, energy crisis, and environmental issues. Building sector contributes
to a great part of the world’s energy consumption [1], mainly due to the heating and cooling demands.
Thus, one of the most important ways of reducing the total global energy consumption is to decrease
the energy used in HVAC systems in buildings. One promising solution is the integration of latent
thermal energy storage systems based on phase change materials in the building envelope. Phase
change materials can store (during melting) and release (during solidification) large amounts of
energy at an almost constant temperature. Consequently, they can enhance building energy
performance, decrease building energy use, reduce peak heating and cooling loads and improve
thermal comfort [2]–[6]. However, the workability of passive PCM application in buildings depends
on the diurnal temperature variations that ensure the PCM cycling. Thus, an effective use of PCM in
buildings requires an appropriate selection of thermo-physical properties, quantity, and position of
the PCM. Many studies were conducted to find optimum PCM thickness, melting temperature, and
location under different climate conditions [7]–[9]. However, in addition to energy-saving and
thermally efficient materials, the ever-growing construction industries worldwide require
environmentally friendly and inexpensive materials [10].
Trombe walls with integrated phase change materials are a passive solar technique that has shown
great potentialities [11]–[15]. During the day, this wall is heated due to the incident solar radiation,
melting the PCM. At night, when the outdoor temperature falls below the phase change temperature,
the heat stored by the PCM is released, warming the building. However, this technique induces a loss
of visual daylight comfort because it is opaque. Many studies focus on the integration of PCM into a
transparent component [16] [17] [18] [19] [20] [21] so that the PCM is directly exposed to the solar
radiation which improves the PCM charge process, providing daylighting at the same time. Although
the integration of PCM in transparent or opaque building envelope has shown a positive impact on
annual cooling and heating loads and indoor thermal comfort in various climate zones, there are still
technical, environmental, and economic barriers to be addressed.
Kyriaki et al. [22] analyzed the state of the art of the existing research on the environmental and
economic performance of the application of PCM in buildings by using life cycle analysis (LCA) and
life cycle cost analysis (LCCA) methodologies. It was concluded that to minimize the overall
environmental impact, the use of PCM and the useful life of the building should be maximized. In
addition, they concluded that very few studies are found about the economic assessment of PCM,
based on life-cycle cost analysis. And that the application of PCM does not seem to be economically
viable because of their high initial investment cost. Baniassadi et al. [23] conducted an economic
Chapter 4
185
optimization of the thickness of the insulation and the PCM layer of a residential building for different
climatic regions of Iran using life-cycle cost analysis (LCCA). The results showed that with the
current economic situation of the country and current energy prices, insulation layers are more cost-
effective than phase change materials. This is due to the relatively high price of the BioPCM material
which makes its use not economically viable. Akeiber et al. [10] evaluated the thermal performance
and economy of a newly developed PCM extracted from Iraqi crude petroleum waste product.
Experiments showed that the room without PCM encapsulation consumes higher energy to maintain
the indoor temperature at 24⁰C. The energy economy of the PCM incorporated room is simply
evaluated by comparing the estimated electricity cost with the building that contains the traditional
air conditioning system. They found that PCM encapsulation leads to a great amount of electrical
energy saving and maintains better thermal comfort in hot and dry climate condition. Panayiotou et
al. [24] evaluated the application of macroencapsulated PCM on the envelope of a typical dwelling
in the Mediterranean region. The optimum case, achieving maximum energy savings, was combining
the PCM with a common thermal insulation. The results showed that the maximum yearly energy
savings obtained by the combined case are 66.2%. The results were also economically evaluated using
life-cycle cost (LCC) analysis. It was shown that the use of PCM alone is not a very attractive solution
in financial terms. This is due to the combination of high initial cost and low annual saving cost which
results in a long payback time of 14 ½ years. When the PCM is combined with thermal insulation,
the payback period is reduced to 7 ½ years. Kosny et al. [25] investigated a cost analysis of simple
PCM-enhanced building envelopes in southern U.S. climates. They found that dispersed PCM in wall
and attic applications can be cost-effective and payback periods for their building applications can be
less than 10 years. Also, the best candidates for these applications are found where electricity cost is
higher than $0.20/kWh and in U.S. locations with cooling degree days CDDs higher than 30000.
Bland et al. [26] showed in their study the breakdown of the financial viability of installing a PCM
system into a UK home. They found that an ideal PCM system installed into a residential building
will need a service life of at least 25 years to make it viable. The PCM systems must provide
significant energy savings before they become attractive to commercial purchasers. Chan [27]
evaluated the thermal and the energy performance of a typical residential building with PCM
integrated external walls in Hong Kong. They found that the building integrated with PCM is
economically infeasible in Hong Kong, mainly due to the expensive capital cost of PCM wallboard
with a payback period of 91 years. For economic analysis, Mi et al. [28] used the static and the
dynamic payback period approach to evaluate the application of PCM in a typical office building in
five different climates in China. They found that the energy savings resulting from PCM application
were the best for the office building located in a severely cold climate, followed by cold region. From

Chapter 4
186
the economic analysis, the application of PCM in cities having severe or cold winter showed high
economic value and the investment appeared to be attractive. However, at current prices, the PCM
investment in cities having a mild and warm climate, cannot be recovered and do not offer economic
benefits. Wahid et al [29] highlighted the feasibility of PCM utilization in the households. They found
that PCM could be extensively used in building structures to reduce the electricity demand. Sun et al.
[30] presented an energy and economic analysis related to the application of phase change materials
boards (PCMBs) in building enclosures during the cooling season. Following a simple payback period
evaluation, they found that the use of PCMBs can be possibly cost-effective in occupied buildings
for moderate temperature climates. Chaiyat [31] concluded that integration of PCM balls within the
evaporator of the air-conditioner was more beneficial than the normal air-conditioner based on energy
efficiency and economic results.
From all the above mentioned, it can be stated that: (1) the studies on economic analysis of building
integrated with PCM are not comprehensive and more studies should be conducted to evaluate the
economic performance of the use of PCM in buildings, (2) economic analyses related to the
application of PCM in buildings are conducted based on a life-cycle cost evaluation or based on a
payback period evaluation (3) the PCM systems must provide significant energy savings before they
become attractive to commercial purchase, (4) the economic feasibility of PCM depends on climatic
conditions, energy costs, country economic situation, (5) most previous studies found that the
application of PCM is not economically viable mainly due to the expensive investment costs
compared to the expected energy savings.
The present paper investigates an innovative passive solar wall, referred to as TIM-PCM wall,
providing at the same time very high insulation, latent heat storage, and daylighting. The wall is
composed of a glazing facing the outside, a gap filled with high insulation silica aerogels materials
(transparent insulation material-TIM), and glass bricks filled with a eutectic PCM on the inside. The
whole wall is translucent. The energy and economic performance of the incorporation of the TIM-
PCM wall in an office room envelope are investigated under different climates via an experimentally
validated numerical model for a whole year. The annual heating and cooling energy loads are
determined for a conventional office room equipped with an insulated double-glazed window and
then compared with those of the correspondent office room equipped with a TIM-PCM wall at the
south orientation. Energy savings due to the use of TIM-PCM are evaluated. Then, the optimum TIM-
PCM wall area is assessed economically for each climate through life-cycle cost and payback period
analysis. The aim is to ensure a good functioning of the TIM-PCM wall in each climate and at the
same time ensure economic feasibility. Noting that, The TIM-PCM wall is an innovative solar wall,
its impact on the building thermal behavior has never been studied numerically under different

Chapter 4
187
climates for an annual basis. Also, the feasibility of the wall application from an economic point of
view has never been studied. The wall area was also optimized depending on the climate for the first
time. In addition, in the literature, there is a lack of studies that evaluate the economic performance
of the use of PCM in buildings. The effective PCM system, in terms of reducing heating or cooling
loads, does not necessarily mean that this system can be applicable to real life constructions, it must
provide significant energy savings before it becomes attractive to commercial purchase. The current
study represents a starting point and should be continued in future, the purpose is not only to ensure
an effective performance of the PCM application but also to ensure an economic viability.
2. Methodology
2.1. Description of simulated building
The energy performance of a single-story office building equipped with TIM-PCM wall is studied
(Figure 4-1). The office has a height of 2.8 m and a total floor area of 32 m2 with a slab-on-grade
foundation. The ground floor is highly insulated assuming a small heat exchange occurring between
the office room and the ground. The walls construction composition and the thermo-physical
properties of used materials are summarized in Table 4-1 and Table 4-2. The conventional office
room is equipped with an insulated double-glazed window on the south wall of a total area of 11.2
m2. The double glazing with krypton insulation of thickness 4/16/4 has a U value of 0.86 W/ m2K
and a g value of 0.598. The annual heating and cooling loads are determined for the conventional
office room for different climate conditions and then compared through simulation with those of the
correspondent PCM-enhanced office room, equipped with a TIM-PCM wall at the south orientation.
The TIM-PCM wall shown in Figure 4-2 is composed, from outside to inside, of a glass pane having
a thickness of 0.8 cm, a 4cm thick bed of granular silica aerogel, and a eutectic of fatty acids as PCM,
filled in glass bricks of dimension 19cm × 19cm × 5cm. More details about the TIM-PCM wall can
be found in [32], [33]. The thermo-physical and optical properties of the used PCM, the silica aerogel,
and the glass are summarized in Table 4-1 to Table 4-5. In the simulation, the area of the insulated
double-glazed window and the TIM-PCM wall is varied from 0 m2 to 7.532 m2. Otherwise, the ratio
of the double-glazing area over the total south wall area varies between 0 % and 67 %, same for the
TIM-PCM wall (Table 4-6).

Chapter 4
188
Figure 4-1: Typical plan of a simple office room.
Figure 4-2: TIM-PCM wall from the outside and Schematic of the TIM–PCM wall composition

Chapter 4
189
Table 4-1: office room walls construction
Element Construction (inside to outside) Thickness (m) U value (W/m2K)
External walls
plasterboard 0.015
Glass wool 0.085 0.419
concrete 0.20
Partitions
plaster 0.013
Glass wool 0.16 0.241
plaster 0.013
Roof
plasterboard 0.013
0.163
Glass wool 0.16
Wooden plate 0.012
Mousse phenol-formol 0.06
Wooden plate 0.012
Floor
tiles 0.015
0.189 concrete 0.15
Expanded polystyrene 0.08
Table 4-2: Thermo-physical properties of the test room materials
Materials/properties Thermal conductivity
(W/m.K)
Specific heat
(J/kg.K) Density (kg/m3)
plasterboard 0.32 800 790
Glass wool 0.041 840 12
concrete 2.1 800 2400
Mousse phenol-formol 0.032 1255 32
Wooden plate 0.18 1700 780
Expanded polystyrene 0.04 1380 25
tiles 1 1000 2400
Table 4-3: Thermo-physical properties of the fatty acids eutectic [32]
Property value
ks (W/m.K) 0.182
kl (W/m.K) 0.182
LH (J/kg) 152000
Cps (J/kg.K) 1670
Cpl (J/kg.K) 2090
ρs (kg/m3) 960
ρl (kg/m3) 884
Tm (°C) 21.3
α (m2/s) 9.85x10⁻⁸
ν (m2/s) 11x10-6
β (1/K) 3.1x10⁻³
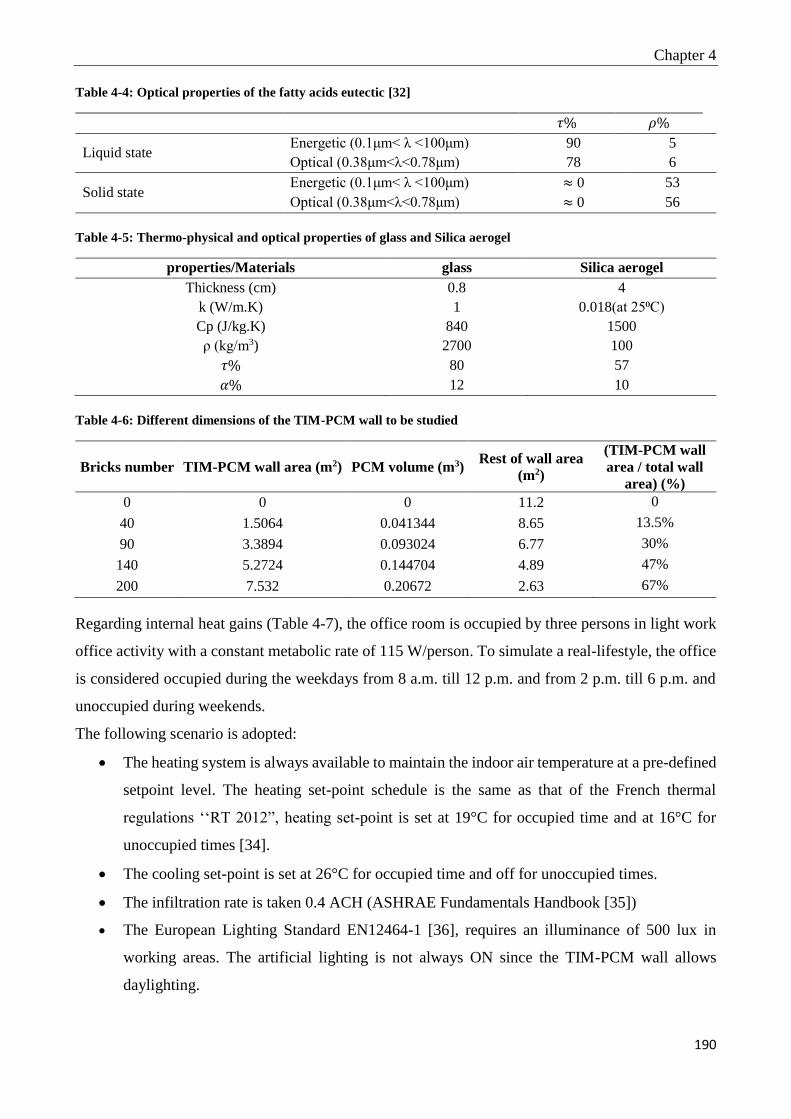
Chapter 4
190
Table 4-4: Optical properties of the fatty acids eutectic [32]
𝜏% 𝜌%
Liquid state Energetic (0.1μm< λ <100μm) 90 5
Optical (0.38μm<λ<0.78μm) 78 6
Solid state Energetic (0.1μm< λ <100μm) ≈ 0 53
Optical (0.38μm<λ<0.78μm) ≈ 0 56
Table 4-5: Thermo-physical and optical properties of glass and Silica aerogel
properties/Materials glass Silica aerogel
Thickness (cm) 0.8 4
k (W/m.K) 1 0.018(at 25⁰C)
Cp (J/kg.K) 840 1500
ρ (kg/m3) 2700 100
𝜏% 80 57
𝛼% 12 10
Table 4-6: Different dimensions of the TIM-PCM wall to be studied
Bricks number TIM-PCM wall area (m2) PCM volume (m3) Rest of wall area
(m2)
(TIM-PCM wall
area / total wall
area) (%)
0 0 0 11.2 0
40 1.5064 0.041344 8.65 13.5%
90 3.3894 0.093024 6.77 30%
140 5.2724 0.144704 4.89 47%
200 7.532 0.20672 2.63 67%
Regarding internal heat gains (Table 4-7), the office room is occupied by three persons in light work
office activity with a constant metabolic rate of 115 W/person. To simulate a real-lifestyle, the office
is considered occupied during the weekdays from 8 a.m. till 12 p.m. and from 2 p.m. till 6 p.m. and
unoccupied during weekends.
The following scenario is adopted:
• The heating system is always available to maintain the indoor air temperature at a pre-defined
setpoint level. The heating set-point schedule is the same as that of the French thermal
regulations ‘‘RT 2012”, heating set-point is set at 19°C for occupied time and at 16°C for
unoccupied times [34].
• The cooling set-point is set at 26°C for occupied time and off for unoccupied times.
• The infiltration rate is taken 0.4 ACH (ASHRAE Fundamentals Handbook [35])
• The European Lighting Standard EN12464-1 [36], requires an illuminance of 500 lux in
working areas. The artificial lighting is not always ON since the TIM-PCM wall allows
daylighting.

Chapter 4
191
Table 4-7: Internal heat gains in the office room (ASHRAE Fundamentals Handbook (SI) [35])
Gains Value
3 persons 115 W of which 45 W radiative 70 W convective
3 Computers 20 W of which 15% radiant and 85% convective
One printer 35 W of which 20% radiant and 80% convective
3 Phones / faxes 15 W of which 30% radiant and 65% convective
Microwave oven 28 L 400 W of convective gain
Small refrigerator 310 W of convective gain
2.2. Investigated climates
The main objective of this work is to evaluate the energy performance of the TIM-PCM wall and to
find the optimum wall configuration in different places around the world. Therefore, six climates for
different cities were considered according to the Köppen–Geiger classification [37]. Table 4-8 shows
the description of the different selected climates for this study as well as the latitude, the longitude
and the elevation for each city. Since the main purpose of the solar TIM-PCM wall is to provide
heating to the indoor environment, most of the climates are chosen with mild, cold or severe winter
season and the climate classifications A (tropical) and B (arid) are excluded from the study. The
weather data files are extracted from TRNSYS Meteonorm library. Table 4-9 presents some major
weather characteristics for each climate.
Table 4-8: Selected locations and climate characteristics according to Köppen-Geiger classification [37]
City Climate Latitude Longitude Elevation (m)
Sacramento, California,
(USA) Mediterranean climate (Csa) 38.5816° N 121.4944° W 9.1
Paris (France) Oceanic climate (Cfb) 48.8566° N 2.3522° E 36
Toronto (Canada) Humid Continental (Dfa) 43.6532° N 79.3832° W 76
Dras (India) Continental (Dsb) 34.4330° N 75.7670° E 3066
Kiruna (Sweden) Continental subarctic (Dfc) 67.8558° N, 20.2253° E 530
Barentsburg (Norway) Polar climate (ET) 78.0648° N 14.2335° E 15
Table 4-9: Some main weather characteristics for each climate
City Sacramento Paris Toronto Dras Kiruna Barentsburg
Climate Csa Cfb Dfa Dsb Dfc ET
Max outdoor temperature (°C) 39.7 31.25 31.05 29.3 23.6 12.2
Min outdoor temperature (°C) -0.8 -7.75 -21.75 -23.4 -32.75 -29.3
Max incident solar radiation on southern
vertical plane (W/m2 ) 833.08 844.97 881.84 963.86 837.01 890.74
Total yearly solar radiation on southern
vertical plane (Kwh/m2/ year ) 1148.54 751.48 946.92 1044.83 686.27 601.23
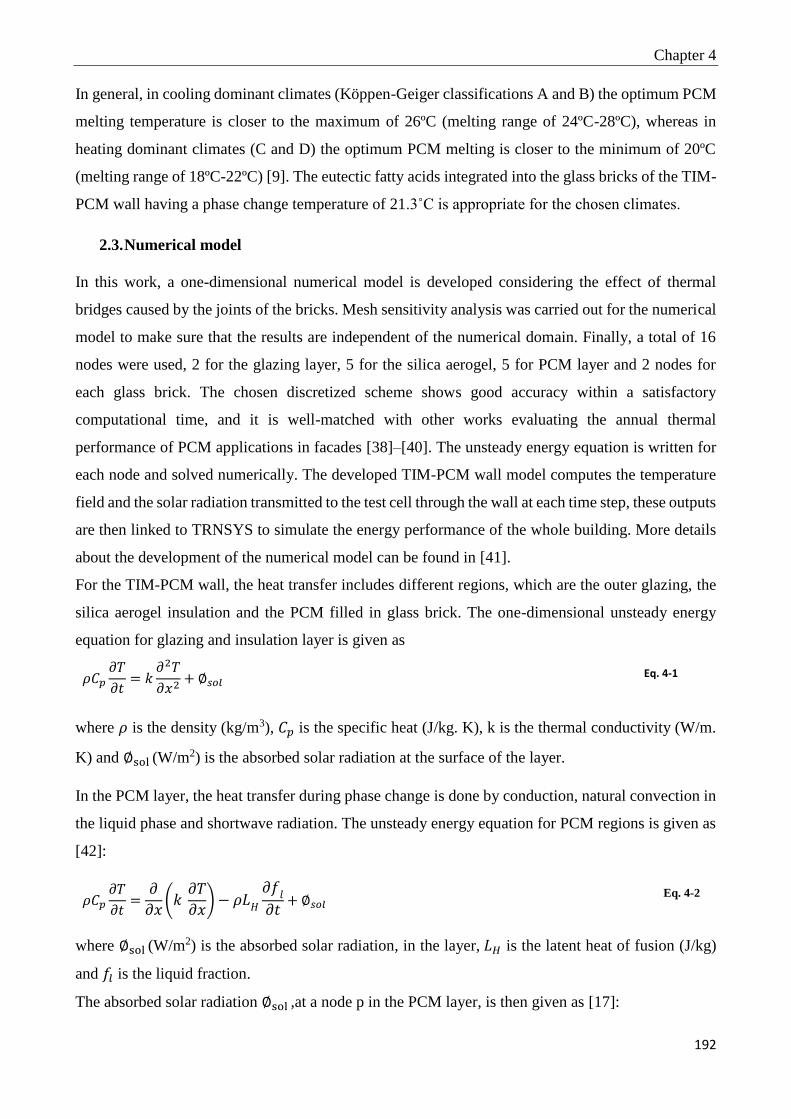
Chapter 4
192
In general, in cooling dominant climates (Köppen-Geiger classifications A and B) the optimum PCM
melting temperature is closer to the maximum of 26ºC (melting range of 24ºC-28ºC), whereas in
heating dominant climates (C and D) the optimum PCM melting is closer to the minimum of 20ºC
(melting range of 18ºC-22ºC) [9]. The eutectic fatty acids integrated into the glass bricks of the TIM-
PCM wall having a phase change temperature of 21.3˚C is appropriate for the chosen climates.
2.3. Numerical model
In this work, a one-dimensional numerical model is developed considering the effect of thermal
bridges caused by the joints of the bricks. Mesh sensitivity analysis was carried out for the numerical
model to make sure that the results are independent of the numerical domain. Finally, a total of 16
nodes were used, 2 for the glazing layer, 5 for the silica aerogel, 5 for PCM layer and 2 nodes for
each glass brick. The chosen discretized scheme shows good accuracy within a satisfactory
computational time, and it is well-matched with other works evaluating the annual thermal
performance of PCM applications in facades [38]–[40]. The unsteady energy equation is written for
each node and solved numerically. The developed TIM-PCM wall model computes the temperature
field and the solar radiation transmitted to the test cell through the wall at each time step, these outputs
are then linked to TRNSYS to simulate the energy performance of the whole building. More details
about the development of the numerical model can be found in [41].
For the TIM-PCM wall, the heat transfer includes different regions, which are the outer glazing, the
silica aerogel insulation and the PCM filled in glass brick. The one-dimensional unsteady energy
equation for glazing and insulation layer is given as
𝜌𝐶𝑝𝜕𝑇
𝜕𝑡= 𝑘
𝜕2𝑇
𝜕𝑥2+ ∅𝑠𝑜𝑙
Eq. 4-1
where 𝜌 is the density (kg/m3), 𝐶𝑝 is the specific heat (J/kg. K), k is the thermal conductivity (W/m.
K) and ∅sol (W/m2) is the absorbed solar radiation at the surface of the layer.
In the PCM layer, the heat transfer during phase change is done by conduction, natural convection in
the liquid phase and shortwave radiation. The unsteady energy equation for PCM regions is given as
[42]:
𝜌𝐶𝑝𝜕𝑇
𝜕𝑡=𝜕
𝜕𝑥(𝑘
𝜕𝑇
𝜕𝑥)− 𝜌𝐿𝐻
𝜕𝑓𝑙
𝜕𝑡+ ∅𝑠𝑜𝑙
Eq. 4-2
where ∅sol (W/m2) is the absorbed solar radiation, in the layer, 𝐿𝐻 is the latent heat of fusion (J/kg)
and 𝑓𝑙 is the liquid fraction.
The absorbed solar radiation ∅sol ,at a node p in the PCM layer, is then given as [17]:

Chapter 4
193
∅𝑠𝑜𝑙 =𝑄𝑠𝑜𝑙−𝑡𝑟𝑎𝑛𝑠 𝛼𝑃
𝑁 Eq. 4-3
𝑄𝑠𝑜𝑙−𝑡𝑟𝑎𝑛𝑠 is the transmitted solar radiation to the PCM layer calculated using equations given by
Siegel [43], αP is the PCM absorption coefficient at the node p calculated using the equations
proposed by Gowreesunker et al. to model combined phase change and radiation problems [17].
To solve the phase change problem, a fixed-grid modified “enthalpy” method is used, inspired by the
work of Zivkovic et al. [44]. The convection in the liquid PCM is accounted for using the enhanced
thermal conductivity approach together with the scaling theory [45] [46] [47]. The convection effect
is only considered in the upper part of the PCM layer of height z1 and width z2, while the zone
(z2. Hb) − (z1. z2) is controlled by conduction. Therefore, an average enhanced conductivity for
liquid nodes is used in the one-dimensional model expressed by:
𝑘𝑒𝑛ℎ,𝑝 =𝑘𝑙[(z2. Hb) − (𝑧1. 𝑧2)] + 𝑘𝑙 . 𝑁𝑢𝑧1(𝑧1. 𝑧2).
z2. Hb Eq. 4-4
where 𝑘𝑒𝑛ℎ,𝑝 is the liquid enhanced conductivity for the liquid PCM node p, Hb is the height of the
glass brick filled with PCM and Nuz is the Nusselt number correlation given by Berkovsky and
Polevikov [48]. More details can be found in the reference [33].
The heat balance on the outside surface is given by [49]:
𝜌𝑐𝑝∆𝑥
2
𝜕𝑇
𝜕𝑡= ∅𝑐𝑜𝑛𝑑(𝑡) + ∅LW,out(𝑡) + ∅𝑐𝑜𝑛𝑣,𝑜𝑢𝑡(𝑡) + ∅𝑠𝑜𝑙(𝑡)
Eq. 4-5
where, ∅𝑐𝑜𝑛𝑑(𝑡) is the conductive heat flux in (𝑊/𝑚2) is given as:
∅𝑐𝑜𝑛𝑑(𝑡) =𝑘
∆𝑥(𝑇𝑠+∆𝑥 − 𝑇𝑠𝑢𝑟𝑓)
Eq. 4-6
and ∅𝑠𝑜𝑙 (𝑊/𝑚2) is the solar absorption flux at the surface expressed by:
∅𝑠𝑜𝑙(𝑡) = 𝛼𝑄𝑠𝑜𝑙−𝑡𝑜𝑡𝑎𝑙 Eq. 4-7
∅LW,out(𝑡) and ∅𝑐𝑜𝑛𝑣,𝑜𝑢𝑡(𝑡) are respectively the radiative heat exchange (W/m2) with the outdoor
environment and the convective heat flux with the outside.
the radiative heat exchange with the outdoor environment is given as follow:
∅LW,out = hr,grdFgrd(Tgrd − Tsurf) + hr,skyFsky(Tsky − Tsurf) Eq. 4-8
The sky temperature Tsky is given by Swinbank [50], function of the air temperature as follow,
assuming a clear sky:
Tsky = 0.0552Tair1.5 Eq. 4-9

Chapter 4
194
For a vertical wall, Fgrd and Fsky are equal to 0.5. For the usual sky and surface temperatures, the
coefficients hr,sky and hr,grd range from 4.7 W/m2. K to 5.7 W/m2. K for buildings located in
temperate regions.
The convective exchange with the external environment is generally calculated using a linear
correlation function of the wind speed. The correlation in (W/ m2K) used here is the one established
by Sturrock [51]:
ℎ𝑜𝑢𝑡 = 5.7𝑣 + 11.4 (Windward)
ℎ𝑜𝑢𝑡 = 5.7𝑣 (Leeward)
Eq. 4-10
Where v is the wind velocity (m/s)
The heat balance on the internal surface is given by:
𝜌𝑐𝑝∆𝑥
2
𝜕𝑇
𝜕𝑡= ∅𝑐𝑜𝑛𝑑(𝑡) + ∅LW,in(𝑡) + ∅𝑐𝑜𝑛𝑣,𝑖𝑛(𝑡) + ∅𝑠𝑜𝑙(𝑡)
Eq. 4-11
Conduction flux through the wall (𝑊/𝑚2) is given as:
∅𝑐𝑜𝑛𝑑(𝑡) =𝑘
∆𝑥(𝑇𝑠−∆𝑥 − 𝑇𝑠𝑢𝑟𝑓)
Eq. 4-12
The transmitted solar radiation flux absorbed at the internal wall surface reads:
∅𝑠𝑜𝑙(𝑡) = 𝛼𝑄𝑠𝑜𝑙−𝑡𝑟𝑎𝑛𝑠 Eq. 4-13
where ∅LW,in(𝑡) and ∅𝑐𝑜𝑛𝑣,𝑖𝑛(𝑡) are the net longwave radiant exchange flux between zone surfaces
(W/m2) and the convective heat flux with the indoor air.
The net longwave radiant exchange flux between zone surfaces is given by
∅𝐿𝑊,𝑖𝑛 = his(Tin − Tsurf) Eq. 4-14
where his is the internal longwave radiative exchange coefficient, for standard building temperatures
it varies very little around the value 5 W/m2. K
The internal convection coefficient used to evaluate the convection heat transfer for the TIM-PCM
wall with the interior is the one developed by Alamdari for vertical surfaces [38]:
ℎ𝑖𝑛 = {[1.5(|∆𝑇|
𝐻)
1/4
]
6
+ [1.23(|∆𝑇|)1/3]6}
1/6
Eq. 4-15
where ∆T is the temperature difference between the internal wall surface and the indoor air, and H is
the height of the vertical surface.
A one-dimensional implicit finite volume method established by Patankar 1980 [52] is used to
estimate the heat transfer mechanism through the TIM-PCM wall. The computational domain is
divided into control volumes, the discretized equation over a typical control volume being written as
follow:

Chapter 4
195
𝑎𝑃𝑇𝑃𝑡+∆𝑡 = 𝑎𝑊𝑇𝑊
𝑡+∆𝑡 + 𝑎𝐸𝑇𝐸𝑡+∆𝑡 + 𝑏 Eq. 4-16
where,
𝑎𝑊 = 𝑘𝑤𝛥𝑦
(∆𝑥)𝑤, 𝑎𝐸 = 𝑘𝑒
𝛥𝑦
(∆𝑥)𝑒
𝑎𝑃 = 𝑎𝑊 + 𝑎𝐸 + 𝑎𝑃𝑡
𝑎𝑃𝑡 =
𝜌𝐶𝑝∆𝑥
∆𝑡
𝑏 = 𝑎𝑃𝑡 𝑇𝑃
𝑡 + ∅𝑠𝑜𝑙 Eq. 4-17
The superscript t indicates the values at the previous time step, 𝑡 + ∆𝑡 indicates the values at the
current time step. 𝑘𝑤 and 𝑘𝑒 are the thermal conductivities calculated at the interface.
A system of linear equations is formed from the discretized equations and can be written in a matrix
form as:
𝐴 ∗ 𝑇 = 𝐵 Eq. 4-18
where A is the matrix of coefficients (tri-diagonal sparse matrix), T is the vector of unknown
temperatures and B is the vector of known terms including the values at the previous time step. The
current temperature values 𝑇𝑃𝑡+∆𝑡 are obtained from the previously solved time step temperatures
values 𝑇𝑃𝑡. The system is solved using a direct non-iterative method, the Gaussian elimination
algorithm, which produces the solution without explicitly forming the inverse. This function is built
in MATLAB.
The model of the heat transfer through the TIM-PCM wall is then linked to TRNSYS via Type 155,
whose function is to enable the use of MATLAB program in TRNSYS. This link enables to simulate
the thermal performance of the test cell. The MATLAB-TRSNYS model is then validated using
experimental results of a full-sized test cell located at Sophia Antipolis within the center for
Processes, Renewable Energies and Energy Systems (PERSEE) of Mines Paris Tech graduate school
[32]. A good agreement is obtained between the simulated and the experimentally measured internal
surface temperature of the TIM-PCM wall and the indoor air temperature for seven consecutive days
in summer and winter. Table 4-10 shows the root mean square error 𝑅𝑀𝑆𝐸 = √1
𝑛∑ (𝑠𝑖 − 𝑒𝑖)2𝑛𝑖=1 and
the percentage of root mean square error 𝑃𝑅𝑀𝑆𝐸 = √1
𝑛∑ (
𝑠𝑖−𝑒𝑖
𝑒𝑖)2
𝑛𝑖=1 (where ei and si are the
experimental and the simulated values respectively) for the hourly profile of the surface and indoor
temperature in summer and winter season. The validated numerical model allows to completely
investigate the abilities and the drawbacks of the novel TIM-PCM wall under different conditions.
More details on the model validation can be found in [41].
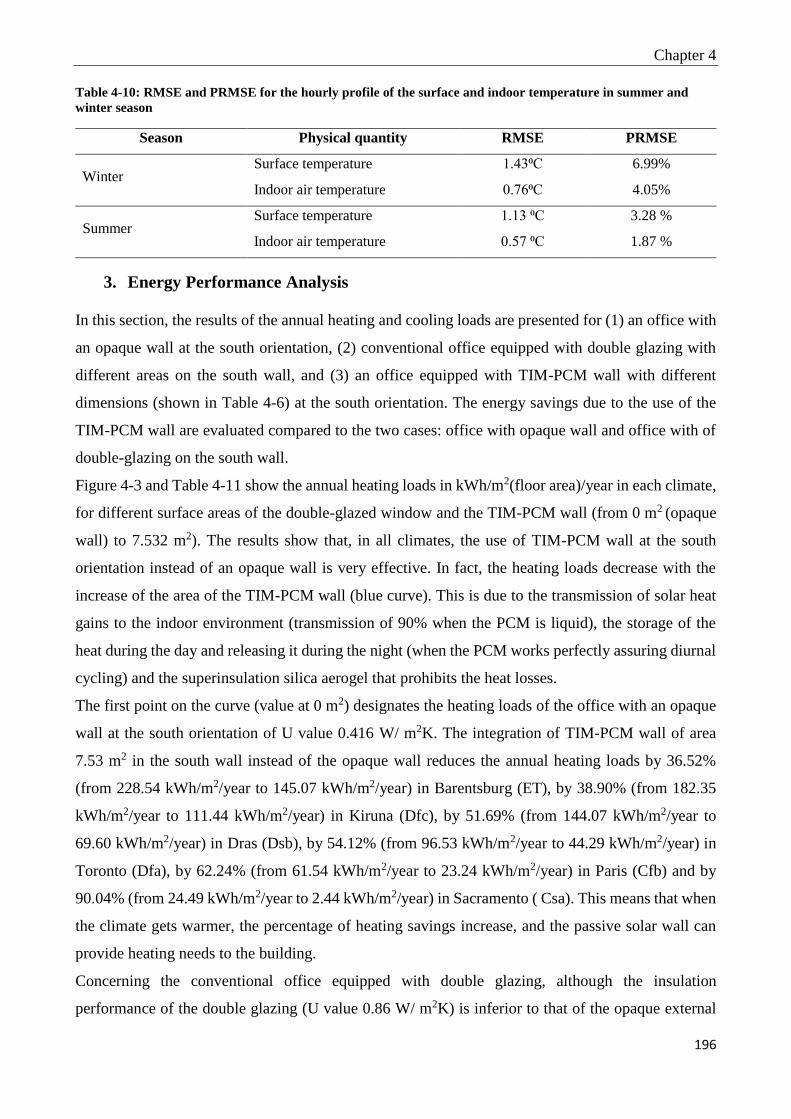
Chapter 4
196
Table 4-10: RMSE and PRMSE for the hourly profile of the surface and indoor temperature in summer and
winter season
Season Physical quantity RMSE PRMSE
Winter Surface temperature 1.43⁰C 6.99%
Indoor air temperature 0.76⁰C 4.05%
Summer Surface temperature 1.13 ⁰C 3.28 %
Indoor air temperature 0.57 ⁰C 1.87 %
3. Energy Performance Analysis
In this section, the results of the annual heating and cooling loads are presented for (1) an office with
an opaque wall at the south orientation, (2) conventional office equipped with double glazing with
different areas on the south wall, and (3) an office equipped with TIM-PCM wall with different
dimensions (shown in Table 4-6) at the south orientation. The energy savings due to the use of the
TIM-PCM wall are evaluated compared to the two cases: office with opaque wall and office with of
double-glazing on the south wall.
Figure 4-3 and Table 4-11 show the annual heating loads in kWh/m2(floor area)/year in each climate,
for different surface areas of the double-glazed window and the TIM-PCM wall (from 0 m2 (opaque
wall) to 7.532 m2). The results show that, in all climates, the use of TIM-PCM wall at the south
orientation instead of an opaque wall is very effective. In fact, the heating loads decrease with the
increase of the area of the TIM-PCM wall (blue curve). This is due to the transmission of solar heat
gains to the indoor environment (transmission of 90% when the PCM is liquid), the storage of the
heat during the day and releasing it during the night (when the PCM works perfectly assuring diurnal
cycling) and the superinsulation silica aerogel that prohibits the heat losses.
The first point on the curve (value at 0 m2) designates the heating loads of the office with an opaque
wall at the south orientation of U value 0.416 W/ m2K. The integration of TIM-PCM wall of area
7.53 m2 in the south wall instead of the opaque wall reduces the annual heating loads by 36.52%
(from 228.54 kWh/m2/year to 145.07 kWh/m2/year) in Barentsburg (ET), by 38.90% (from 182.35
kWh/m2/year to 111.44 kWh/m2/year) in Kiruna (Dfc), by 51.69% (from 144.07 kWh/m2/year to
69.60 kWh/m2/year) in Dras (Dsb), by 54.12% (from 96.53 kWh/m2/year to 44.29 kWh/m2/year) in
Toronto (Dfa), by 62.24% (from 61.54 kWh/m2/year to 23.24 kWh/m2/year) in Paris (Cfb) and by
90.04% (from 24.49 kWh/m2/year to 2.44 kWh/m2/year) in Sacramento ( Csa). This means that when
the climate gets warmer, the percentage of heating savings increase, and the passive solar wall can
provide heating needs to the building.
Concerning the conventional office equipped with double glazing, although the insulation
performance of the double glazing (U value 0.86 W/ m2K) is inferior to that of the opaque external

Chapter 4
197
wall (0.416 W/ m2K), the heating loads decrease with the increase of the area of the double-glazing
(orange curve). This reduction is due mainly to the solar heat gains provided by the transparent double
glazing. However, the continuous reduction in heating loads is not always true especially in colder
climates (Barentsburg (ET) and Kiruna (Dfc)), where the increase of the double-glazing area is not
beneficial exceeding a certain area. The heating loads started to increase again using a double glazing
of an area larger than 5.27 m2. In this case, the impact of the U value reduction of the wall is more
influential than the effect of solar heat gains.
The percentage of heating loads reduction due to the increase of glazing area depends mainly on the
climate and the amount of the incident solar radiation, and this reduction is found less significant than
that when the TIM-PCM wall is used. The integration of double glazing of area 7.53 m2 in the south
wall reduces the annual heating loads by 26.59% (from 144.07 kWh/m2/year to 105.76 kWh/m2/year)
in Dras (Dsb), by 28.29% (from 96.53 kWh/m2/year to 69.22 kWh/m2/year) in Toronto (Dfa), by
32.43% (from 61.54 kWh/m2/year to 41.58 kWh/m2/year) in Paris (Cfb) and by 79.95% (from 24.49
kWh/m2/year to 4.91 kWh/m2/year) in Sacramento ( Csa). Also, when the climate gets warmer, the
percentage of heating reduction increase.
Table 4-11: Annual heating loads (kWh/m2/year) for each city (climate) for an office equipped with double
glazing and PCM enhanced office for different double glazing or TIM-PCM wall surfaces
Annual heating loads (kWh/m2/year)
Office with
opaque
south wall
Office with double glazing (U
value=0.86 W/ m2K) on the south
wall
Office with TIM-PCM wall at the
south orientation
Area of double
glazing or TIM-
PCM wall (m2)
0 1.51 3.39 5.27 7.53 1.51 3.39 5.27 7.53
Barentsburg (ET) 228.54 225.71 222.94 221.52 221.87 213.41 188.84 167.31 145.07
Kiruna (Dfc) 182.35 177.39 173.77 172.28 172.38 167.16 146.47 129.23 111.44
Dras (Dsb) 144.07 133.92 122.86 113.88 105.76 127.34 105.22 87.18 69.60
Toronto (Dfa) 96.53 88.67 80.72 74.58 69.22 84.18 68.63 56.21 44.29
Paris(Cfb) 61.54 55.04 49.27 45.15 41.58 51.61 40.16 31.29 23.24
Sacramento (Csa) 24.49 16.81 10.83 7.23 4.91 16.03 8.48 4.73 2.44

Chapter 4
198
Figure 4-3: Annual heating load for (a) Dsb, Dfc, ET climates and (b) Csa, Cfb, Dfa climates function of the TIM-
PCM wall or the double glazing (U value=0.86 W/ m2K) area.
60
80
100
120
140
160
180
200
220
240
0 1 2 3 4 5 6 7
Hea
tin
g Lo
ad (
Kw
h/y
m2 )
TIM-PCM wall surface or double glazing surface (m2) at the south orientation
a)
Dras(Dsb)_PCM Kiruna(Dfc)_PCM Barentsburg(ET)_PCM
Dras(Dsb)_conv Kirina(Dfc)_Conv Barentsburg(ET)_conv
0
10
20
30
40
50
60
70
80
90
100
0 1 2 3 4 5 6 7
Hea
tin
g Lo
ad (
Kw
h/y
m2)
TIM-PCM wall surface or double glazing surface (m2) at the south orientation
b
Sacramento(Csa)_PCM Paris(Cfb)_PCM Toronto(Dfa)_PCM
Sancremento(Csa)_conv Paris(Cfb)_conv Toronto(Dfa)_conv

Chapter 4
199
Now, comparing the heating loads of the office with double glazing with those of the office with
integrated TIM-PCM wall (comparing the orange curve with the blue curve at each area).
The energy performance of the office, in term of heating loads, can be significantly improved in all
climates following the incorporation of the TIM-PCM wall instead of a conventional double glazing,
especially for larger areas. This can be clearly shown in Figure 4-3 and Table 4-11, where the heating
loads of PCM-enhanced office are always lower than those of the conventional office with double-
glazing. For example, the integration of the TIM-PCM wall of 7.53m2 instead of the double glazing
of the same area decreases the heating loads from 221.87 kWh/m2/year to 145.07 kWh/m2/year in
Barenstburg (ET) and from 105.76 kWh/m2/year to 69.60 kWh/m2/year in Dras (Dsb). This is mainly
due to the energy storage provided by the PCM and the superinsulation of the silica aerogel that
prohibits the heat losses, especially at night.
The annual heating savings in kWh/m2/year and their associated percentages due to the integration of
TIM-PCM wall instead of double glazing of different areas are shown in Table 4-12 and Figure 4-4.
These heating savings always increase with the increase of the TIM-PCM wall area. For example, in
Toronto, heating savings increase from 5.06% using a TIM-PCM wall of area 1.51 m2 to 36.01%
using a TIM-PCM wall of area 7.53 m2. In all climates, the maximum heating savings following the
integration of the TIM-PCM wall instead of the double glazing are reached when the surface area of
the TIM-PCM wall is 7.53 m2, and are found 34.62% (76.80 kWh/m2/year) in Barentsburg, 35.35%
(60.94 kWh/m2/year) in Kiruna (Dfc), 34.18% (36.15 kWh/m2/year) in Dras (Dsb), 36.01% (24.93
kWh/m2/year) in Toronto (Dfa), 44.11% (18.33 kWh/m2/year) in Paris (Cfb) and 50.32% (2.47
kWh/m2/year) in Sacramento (Csa). We note that, although the PCM works better in Dras, the heating
savings in Barentsburg are found higher (Table 4-12). This can be explained by the fact the
performance of the office with double glazing is better in Dras due to higher solar heat gains, while
in Braentsburg the heating loads of the office with double glazing barely decrease with the increase
of its area. In addition, the percentage of heating savings is found more significant for warmer
climates Csa and Cfb. The heating demand can be almost entirely met by the solar energy alone in
Sacramento (Csa) using the TIM-PCM wall.
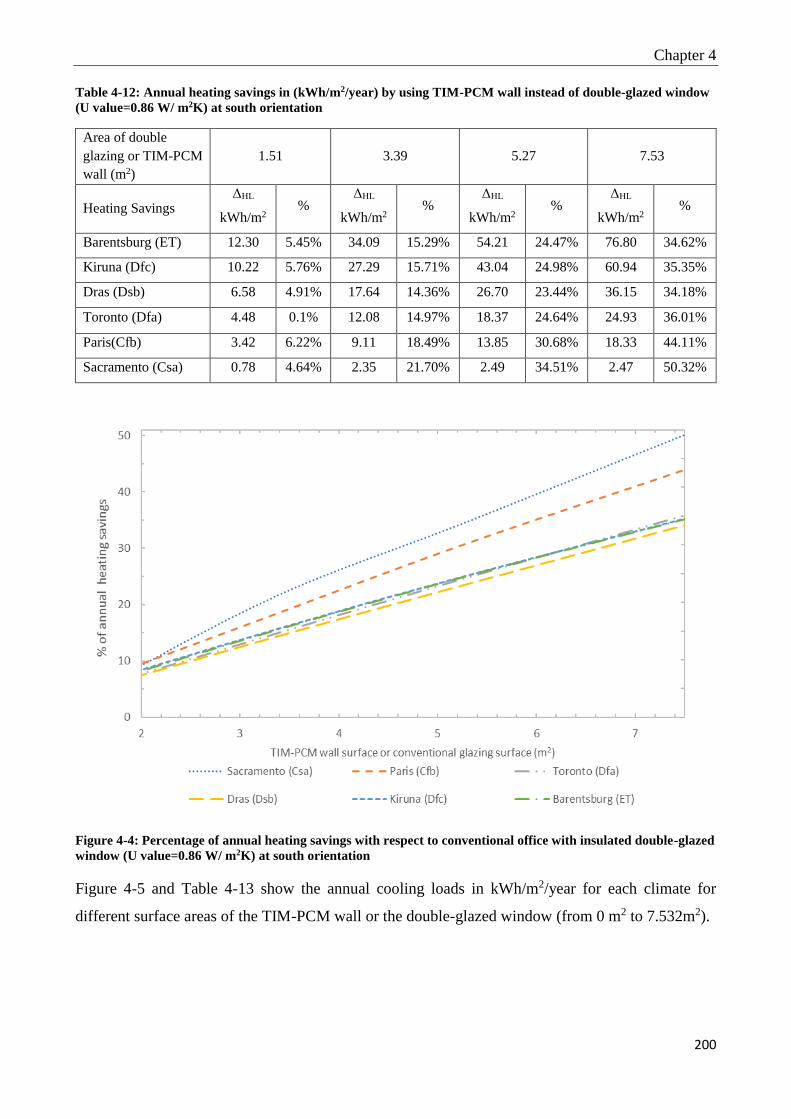
Chapter 4
200
Table 4-12: Annual heating savings in (kWh/m2/year) by using TIM-PCM wall instead of double-glazed window
(U value=0.86 W/ m2K) at south orientation
Area of double
glazing or TIM-PCM
wall (m2)
1.51 3.39 5.27 7.53
Heating Savings ΔHL
kWh/m2 %
ΔHL
kWh/m2 %
ΔHL
kWh/m2 %
ΔHL
kWh/m2 %
Barentsburg (ET) 12.30 5.45% 34.09 15.29% 54.21 24.47% 76.80 34.62%
Kiruna (Dfc) 10.22 5.76% 27.29 15.71% 43.04 24.98% 60.94 35.35%
Dras (Dsb) 6.58 4.91% 17.64 14.36% 26.70 23.44% 36.15 34.18%
Toronto (Dfa) 4.48 0.1% 12.08 14.97% 18.37 24.64% 24.93 36.01%
Paris(Cfb) 3.42 6.22% 9.11 18.49% 13.85 30.68% 18.33 44.11%
Sacramento (Csa) 0.78 4.64% 2.35 21.70% 2.49 34.51% 2.47 50.32%
Figure 4-4: Percentage of annual heating savings with respect to conventional office with insulated double-glazed
window (U value=0.86 W/ m2K) at south orientation
Figure 4-5 and Table 4-13 show the annual cooling loads in kWh/m2/year for each climate for
different surface areas of the TIM-PCM wall or the double-glazed window (from 0 m2 to 7.532m2).
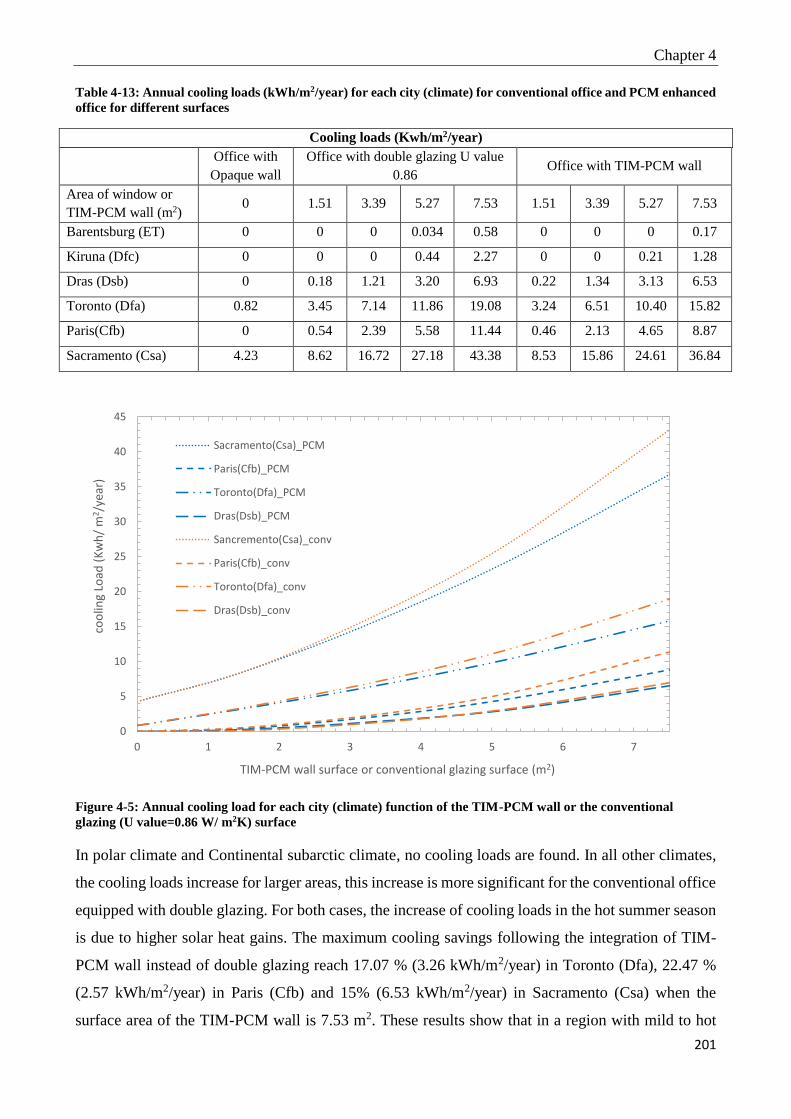
Chapter 4
201
Table 4-13: Annual cooling loads (kWh/m2/year) for each city (climate) for conventional office and PCM enhanced
office for different surfaces
Cooling loads (Kwh/m2/year)
Office with
Opaque wall
Office with double glazing U value
0.86 Office with TIM-PCM wall
Area of window or
TIM-PCM wall (m2) 0 1.51 3.39 5.27 7.53 1.51 3.39 5.27 7.53
Barentsburg (ET) 0 0 0 0.034 0.58 0 0 0 0.17
Kiruna (Dfc) 0 0 0 0.44 2.27 0 0 0.21 1.28
Dras (Dsb) 0 0.18 1.21 3.20 6.93 0.22 1.34 3.13 6.53
Toronto (Dfa) 0.82 3.45 7.14 11.86 19.08 3.24 6.51 10.40 15.82
Paris(Cfb) 0 0.54 2.39 5.58 11.44 0.46 2.13 4.65 8.87
Sacramento (Csa) 4.23 8.62 16.72 27.18 43.38 8.53 15.86 24.61 36.84
Figure 4-5: Annual cooling load for each city (climate) function of the TIM-PCM wall or the conventional
glazing (U value=0.86 W/ m2K) surface
In polar climate and Continental subarctic climate, no cooling loads are found. In all other climates,
the cooling loads increase for larger areas, this increase is more significant for the conventional office
equipped with double glazing. For both cases, the increase of cooling loads in the hot summer season
is due to higher solar heat gains. The maximum cooling savings following the integration of TIM-
PCM wall instead of double glazing reach 17.07 % (3.26 kWh/m2/year) in Toronto (Dfa), 22.47 %
(2.57 kWh/m2/year) in Paris (Cfb) and 15% (6.53 kWh/m2/year) in Sacramento (Csa) when the
surface area of the TIM-PCM wall is 7.53 m2. These results show that in a region with mild to hot
0
5
10
15
20
25
30
35
40
45
0 1 2 3 4 5 6 7
coo
ling
Load
(K
wh
/ m
2 /ye
ar)
TIM-PCM wall surface or conventional glazing surface (m2)
Sacramento(Csa)_PCM
Paris(Cfb)_PCM
Toronto(Dfa)_PCM
Dras(Dsb)_PCM
Sancremento(Csa)_conv
Paris(Cfb)_conv
Toronto(Dfa)_conv
Dras(Dsb)_conv

Chapter 4
202
summer, the TIM-PCM wall is a better choice than a conventional double-glazed window to maintain
a cool indoor temperature. In Dras (Dsb) the cooling savings are not significant as shown in Table
4-14 and no cooling savings are found when the area of the TIM-PCM wall is 1.51 m2 and 3.39 m2.
However, the use of shading devices in summer can decrease the cooling loads. The use of Venetian
blinds with rotatable slats of 45 degrees, allowing daylighting, reduce the cooling loads by 32% in
Sacramento (Csa). The use Overhang of 1 m projection combined with the Venetian blinds can reduce
this cooling loads by 38%. In Toronto (Dfa) the use of same blinds decreases the cooling loads by
about 64%. This can be explained by the fact that the cooling loads in Sacramento (Csa) are not due
only to the transmitted solar radiation but also to the high outdoor ambient temperature, reaching 40
˚C, while in Toronto (Dfa) cooling loads are mainly due to the high solar radiation transmitted to the
interior with a maximum outdoor temperature of 31˚C. The use of Venetian blinds in Paris (Cfb) and
Dras (Dsb) reduces the cooling loads by about 71% and 78% respectively.
Table 4-14: Annual cooling savings in (KWh/m2/year) by using TIM-PCM wall instead of double-glazed window
(U value=0.86 W/ m2K) at south orientation
Area of window or
TIM-PCM wall (m2) 1.51 3.39 5.27 7.53
Heating Savings ΔCL
Kwh/m2 %
ΔCL
Kwh/m2 %
ΔCL
Kwh/m2 %
ΔCL
Kwh/m2 %
Barentsburg (ET) 0 0% 0 0% 0.034 - 0.41 -
Kiruna (Dfc) 0 0% 0 0% 0.22 - 0.99 -%
Dras (Dsb) -0.05 -28.3% -0.14 -11.5% 0.07 2.14% 0.40 5.77%
Toronto (Dfa) 0.20 5.91% 0.63 8.79% 1.46 12.31% 3.26 17.07%
Paris(Cfb) 0.07 13.91% 0.26 10.83% 0.94 16.77% 2.57 22.47%
Sacramento (Csa) 0.08 0.94% 0.85 5.09% 2.57 9.45% 6.53 15%
Figure 4-6 shows the annual total energy loads for three different climates (Csa, Cfb, Dfa).
Concerning other climates, the total energy loads are very close to the heating loads due to the
respectively insignificant cooling loads.
In all considered climates, the total energy loads of the conventional office with double glazing and
the PCM-enhanced office decrease with the increase of the area except in Sacramento (Csa) (because
of high cooling loads). But still, the TIM-PCM wall performs better than the double glazing. The use
TIM-PCM wall is more efficient than the use of a conventional insulated double-glazed window in
terms of total energy loads in all considered climates, especially for larger areas where maximum
total energy savings are reached. The total energy savings in kWh/m2/year due to the integration of
TIM-PCM wall instead of double glazing on the south orientation are shown in Figure 4-7-a.

Chapter 4
203
On the other hand, comparing the results of total energy savings of the office with opaque wall at the
south orientation with those of the office with integrated TIM-PCM wall shows that increasing the
TIM-PCM wall area increases the total energy savings in all studied climates except in Mediterranean
climate (Csa) where the maximum energy savings are reached at an area of 2.61 m2 (Figure 4-7-b).
The total energy savings following the integration of TIM-PCM wall instead of an opaque wall in
kWh/m2/year are shown in Figure 4-7-b.
Figure 4-6: Annual total load for three different climates function of the TIM-PCM wall or the conventional
glazing (U value=0.86 W/ m2K) surface
20
30
40
50
60
70
80
90
100
0 1 2 3 4 5 6 7
Tota
l Lo
ad (
Kw
h/
m2/y
ear)
TIM-PCM wall surface or conventional glazing surface (m2)
Sacramento(Csa)_PCM Paris(Cfb)_PCM Toronto(Dfa)_PCM
Sacremento(Csa)_conv Paris(Cfb)_conv Toronto(Dfa)_conv
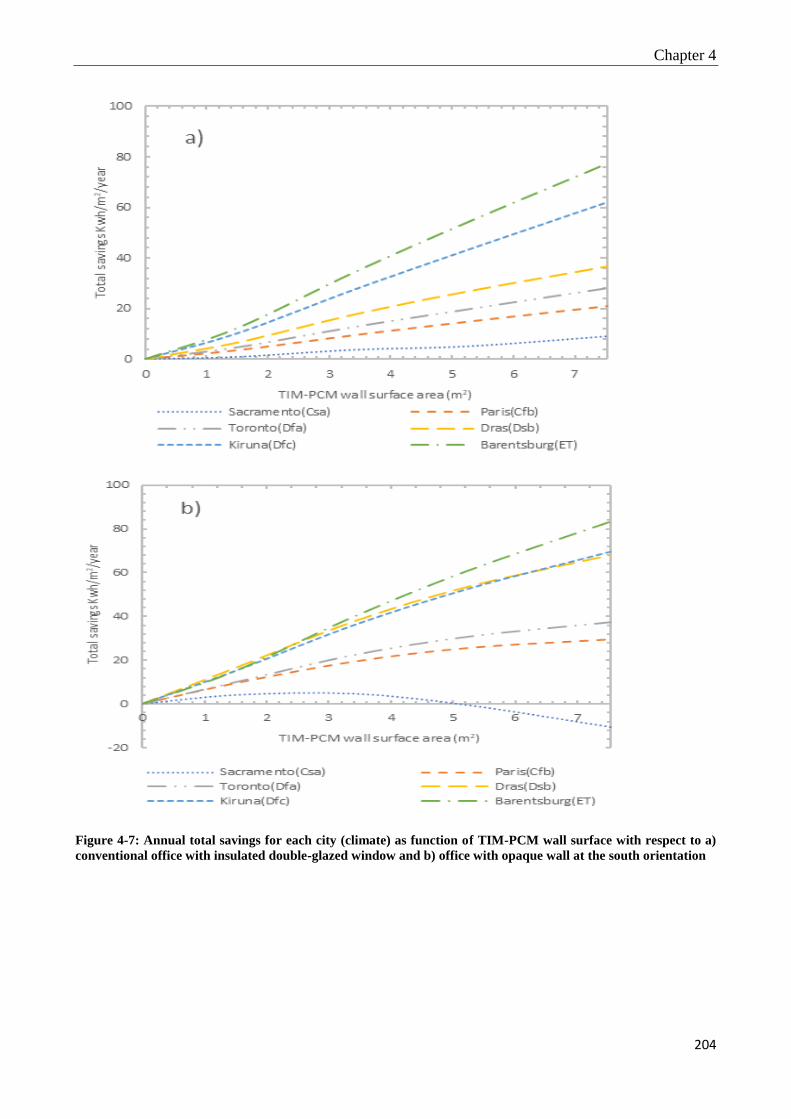
Chapter 4
204
Figure 4-7: Annual total savings for each city (climate) as function of TIM-PCM wall surface with respect to a)
conventional office with insulated double-glazed window and b) office with opaque wall at the south orientation

Chapter 4
205
4. Economic Analysis
In addition to the investigation of the thermal and energy performance of the innovative TIM-PCM
wall, an economic assessment is carried out for the applicability of this wall in buildings. In previous
studies, economic analyses related to the application of PCM in buildings were conducted based on
a life-cycle cost analysis [23] [24] or based on a payback period evaluation [28] [30]. The economic
study in this work is based on the same concept of previous studies [23][24][53], and both life cycle
cost analysis and payback period evaluation are conducted. Noting that the environmental impact of
PCM incorporated in building envelopes can be assessed by employing a Life Cycle Assessment
(LCA) approach. Many studies [54] have found that the PCM is more environmental friendly
compared to other conventional thermal insulating material.
The life-cycle cost analysis involves the analysis of the costs of a system or a component over its
entire lifetime. The optimum TIM-PCM wall area (otherwise PCM volume) corresponds to the value
that provides a minimum total life-cycle cost. It depends mainly on the yearly heating and cooling
loads, the costs of natural gas and electricity, the building lifetime, and the discount rate. The life
cycle cost or LCC is defined by:
𝐿𝐶𝐶 = 𝐼𝐶 + PWF. 𝐸𝐶 Eq. 4-19
where IC is the initial cost for implementing the considered wall (materials prices + installation +
labor cost), EC is the annual energy cost required to maintain indoor comfort within the office
building for the selected design and operating features and PWF is the present worth factor. The
heating and cooling costs over the lifetime of the building are evaluated as:
𝐸𝐶ℎ =𝑄ℎ𝜂∗ 𝑐𝑛𝑔
Eq. 4-20
𝐸𝐶𝑐 =𝑄𝑐𝐶𝑂𝑃
∗ 𝑐𝑒 Eq. 4-21
Where, 𝐸𝐶ℎ and 𝐸𝐶𝑐 are the heating and cooling costs over the lifetime of the building. 𝑄ℎ, 𝑄𝑐, 𝑐𝑛𝑔,
𝑐𝑒 , 𝜂 , COP respectively stand for the annual heating load, annual cooling load, natural gas cost, cost
of electricity, heating system efficiency and the coefficient of performance of the cooling system.
The present worth factor PWF converts future recurrent expenses to present costs regarding the
economic outlook of the country and depends on the discount rate ‘r’ and on the lifetime N. The
discount rate is the general interest rate of the country. Therefore, when evaluating the present value
of a certain investment via PWF, the discount rate should be considered in the formulation. The PWF
is given by [55]:

Chapter 4
206
𝑃𝑊𝐹 =1 − (1 + 𝑟)−𝑁
𝑟
Eq. 4-22
In addition, the simple payback period PP for the TIM-PCM wall integrated into the building
envelope is calculated by dividing the total initial cost by the energy savings cost [53]:
𝑃𝑃 = 𝐼𝐶/𝐸𝑆𝐶 Eq. 4-23
where 𝑃𝑃, 𝐼𝐶, and 𝐸𝑆𝐶 are respectively the payback period, the initial cost and the cost of energy
savings including annual lighting savings cost in cities where its value is influential.
The initial investment cost was calculated considering only the material and installation costs
(including labor cost) related to the building envelope (TIM-PCM wall). The installation cost of the
HVAC systems and other design costs were not considered since their value was assumed to be the
same for all the cases in the same location. For the same reason, only the energy costs were considered
as annual costs. To evaluate the final value, the lifetime of the building is assumed to be 30 years.
In each country different electricity costs, natural gas prices, and different labor costs are considered.
In most projects, labor costs represent approximately 25 to 35% of the total project costs [56]. The
labor cost is estimated in each country between these two values (lower income countries have lower
labor cost). Although the prices change according to the location, the material costs were assumed to
be unvaried but later multiplied by the labor cost. The heating system is a natural gas boiler with an
efficiency of 90% and the cooling system is an electrical vapor-compression heat pump of COP 2.9.
The cost of electricity and the natural gas, the discount rate and the PWF are found for each country
as summarized in Table 4-15.
Table 4-15: Cost of electricity, natural gas price and discount rate for each country
City Electricity price
$ per kWh [57], [58]
Natural Gas price
$ per kWh [59]–[61]
Discount rate %
[62], [63] PWF
Barents burg (Norway) 0.1786 0.078 0.5 27.79
Kiruna (Sweden) 0.22 0.121 -0.5 32.45
Dras (India) 0.08 0.02 6 13.76
Toronto (Canada) 0.16 0.0113 1 25.81
Paris (France) 0.2 0.064 0.05 29.76
Sacramento (USA) 0.21 0.011 1.25 24.88
Table 4-16: Prices of materials
Materials Prices
Concrete 100 $ / m3 [64]
Plasterboard 15$ to 20$ / m2 [65]
Glass wool 60-100 $ / m3.[66]
Fatty acid PCM product 3.23 $ /kg [67]
Silica aerogel 550$/m3 [53]
Single clear glazing 29.97$/m2 [55]
Insulated double glazing 102$/m2[55]

Chapter 4
207
The prices of the used materials are summarized in Table 4-16. The price of PCM varies widely,
according to their type, melting temperature and purity [25]. Unfortunately, it is impossible to take
these factors into account to accurately estimate the price of PCM. Cascone et al. [68] estimated the
price of PCM at about 40 €/m2 for each cm of thickness. An additional 20% was considered for
macroencapsulation [25]. The total estimated price of PCM was hence 48 €/ m2 /cm, plus 4.36 €/m2
for installation [69]. Baniassadi et al.[23] considered that finding an exact price for the PCM is a
challenging task. They considered an average price of 22.53 (US $/m2) for the purchase, transport,
and installation of BioPCM with an equivalent thickness of 2.01 cm. Saffari et al. [69] considered
that the PCM cost is 0.62 €/kg based on previous purchase and the cost of the installation of PCM is
approximated as 4.36 €/m2. The cost of purchasing and installing PCM was estimated at USD 2/m2
for a 10-mm thick layer of PCM in [27] and [28]. Table 4-17 summarizes the price of some PCM
reported in the literature.
Table 4-17: Cost of some phase change materials (data source [25], [26], [68] )
Material Cost (US$/kg)
Paraffin Wax (organic) 1.88-2.00
Eicosane-technical grade (organic) 7.04
Eicosane-pure laboratory grade (organic) 53.9
Rubitherm (RT20) 16.31
Rubitherm (RT 23,25,27) 0.68
Stearic acid (fatty acid) 1.43-1.56
Palmitic acid (fatty acid) 1.61-1.72
Oleic acid (fatty acid) 1.67-1.76
Crude Glycerin (fatty acid) 0.22-0.29
M-27 (commercially available fatty acid) 14.26
M-51 (commercially available fatty acid) 11.13
Calcium chloride (inorganic-salt haydrates) 0.20
LatestTM29T (commercially availabl²e salt hydrates) 4.95
BioPCM 1.30
In this study, following a discussion with ‘PCM products Ltd’ company [67], the price of the fatty
acid product is approximated as 3.23 $/kg. An additional 60% was considered for the integration of
PCM in the glass bricks and for the installation, and 25-35% of the total cost is added for labor cost.
The average total PCM cost is thus about 54 $/m2/cm in the investigated cities.
The lighting price is accounted for within the total life-cycle cost, when the artificial lighting is
needed, and when its value is significant compared to heating and cooling loads prices. The European
Lighting Standard EN12464-1 [36], requires an illuminance of 500 lux in working areas. In addition,
according to IESNA Lighting Handbook [70] the recommended lighting level in offices is between
300 and 500 lux. Using a LED lamp, the illuminance of 300 - 500 lux corresponds to the power of
3.333 W/m2 – 5.555 W/m2 respectively, i.e. 90 - 150 W for the considered office. Accordingly, the

Chapter 4
208
calculated total annual lighting load is 6.9 kWh/m2/year to 11 kWh/m2/year. The TIM-PCM wall
provides at a certain time useful daylighting without the need for the artificial lighting, thus the annual
lighting load decreases with the increase of the TIM-PCM wall area. The illuminance provided by
the wall is approximated by the transmitted solar radiation and verified based on experimental
measurements. For each climate, the number of occupied hours, where the daylighting is not sufficient
(illuminance <500 Lux), is evaluated for each TIM-PCM wall surface area, and the cost of the needed
artificial lighting is then calculated.
The life cycle cost and the payback period are evaluated for both cases, TIM-PCM wall and
conventional insulated double-glazed window, and the recommendation for each climate from an
economic point of view will be discussed. In section 3, the optimum TIM-PCM wall area showing
the best energy performance in each climate was determined as 7.53 m2 except in Sacramento (Csa).
It’s also necessary to find the optimum TIM-PCM wall area corresponding to minimum life cycle
cost or minimum payback period in each climate. Figure 4-8 to Figure 4-12 show the initial cost, the
heating and cooling consumption cost, the total cost, the energy savings cost, and the payback period
for both cases for the different climates. From these figures, it can be noticed that the heating costs
decrease, and cooling costs increase as the area of the TIM-PCM wall or the double-glazed window
area increases. The initial cost varies almost linearly with the area. The total cost and payback period
decrease to a certain minimum then start to increase in some cases. The optimum area is the one that
ensures this minimum of the total cost or minimum payback period. For each climate, the optimum
areas are presented in Table 4-18 and Table 4-19.
In colder climates (Figure 4-8 and Figure 4-9), Barentsburg (ET) and Kiruna (Dfc), the use of TIM-
PCM wall is more cost-effective than the use of the double-glazed window, the optimum TIM-PCM
wall area providing minimum LCC and minimum PP being 7.532 m2. Due to the high heating loads
in these climates and the relatively high natural gas prices and PWF, the total cost depends mainly on
the heating costs and there is larger potential to reduce energy consumption costs through enlarging
the TIM-PCM wall area. The minimum payback periods found are 10.5 years and 7.8 years in
Barentsburg (ET) and Kiruna (Dfc) respectively, showing that the application of TIM-PCM wall is
economically viable in these climates. In these cities, the cost of lighting is neglected since it is
marginal compared to heating costs.

Chapter 4
209
Figure 4-8: a) Life cycle cost and b) payback period for both cases for Barentsburg (ET)
Figure 4-9: a) Life cycle cost and b) payback period for both cases for Kiruna (Dfc)
In Dras (Dsb), in spite of the high heating loads and energy savings due to the use of the TIM-PCM
wall, the double-glazed window proves to be more cost-effective than the TIM-PCM wall (Figure
4-10-a). The initial cost controls the total life-cycle cost due to the very low energy prices (2
cents/kWh for natural gas) and relatively low PWF (high discount rate). The optimum TIM-PCM
wall area is found 1.51 m2 with a minimum LCC of 2002$ while the optimum double-glazed window
area is 2.45 m2 with a minimum LCC of 1892$ (Table 4-18). Concerning the minimum payback
period, it is found about 35 years for an optimum TIM-PCM wall area of 4.57 m2 (Table 4-19). The
PP is relatively high because the cost of energy savings is insignificant compared to the initial cost,
which makes the use of TIM-PCM wall infeasible economically. Higher natural gas prices and lower
PCM investment costs are required in Dras (India).
0
3
6
9
12
15
18
0 1 2 3 4 5 6 7
Co
st (
$x1
00
0)
TIM-PCM wall/ double glazed window surface area (m2)
a)
Initial cost _conv Initial cost_PCM
Heating cost _conv Heating cost_PCM
Total cost _conv Total cost _PCM
0
20
40
60
80
100
0
50
100
150
200
250
1,5 2,5 3,5 4,5 5,5 6,5 7,5
Pay
bac
k p
erio
d (
year
s)
An
nu
al h
eati
ng
savi
ngs
co
st $
TIM-PCM wall/ double glazed window surface area (m2)
b)
Annual heating savings cost_PCM Annual heating savings cost_conv
PP_PCM PP_conv
0
5
10
15
20
25
0 1 2 3 4 5 6 7
Co
st (
$x10
00)
TIM-PCM wall/ double glazed window surface area (m2)
a)
Initial cost _conv Initial cost_PCM
Heating cost _conv Heating cost_PCM
Total cost _conv Total cost _PCM
0
5
10
15
20
25
30
35
40
45
0
50
100
150
200
250
300
1,5 2,5 3,5 4,5 5,5 6,5 7,5
Pay
bac
k p
erio
d (
year
s)
An
nu
al h
eati
ng
savi
ngs
co
st $
TIM-PCM wall/ double glazed window surface area (m2)
b)
Annual heating savings cost_PCM Annual heating savings cost_conv
PP_PCM PP_conv
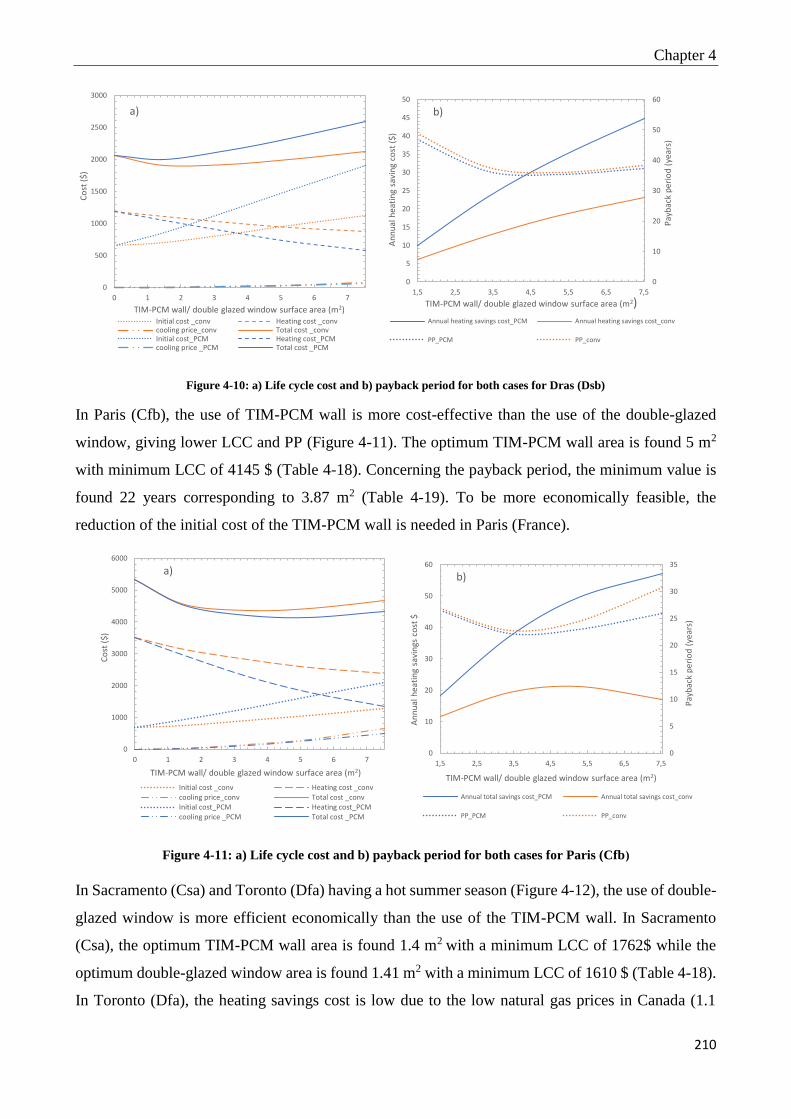
Chapter 4
210
Figure 4-10: a) Life cycle cost and b) payback period for both cases for Dras (Dsb)
In Paris (Cfb), the use of TIM-PCM wall is more cost-effective than the use of the double-glazed
window, giving lower LCC and PP (Figure 4-11). The optimum TIM-PCM wall area is found 5 m2
with minimum LCC of 4145 $ (Table 4-18). Concerning the payback period, the minimum value is
found 22 years corresponding to 3.87 m2 (Table 4-19). To be more economically feasible, the
reduction of the initial cost of the TIM-PCM wall is needed in Paris (France).
Figure 4-11: a) Life cycle cost and b) payback period for both cases for Paris (Cfb)
In Sacramento (Csa) and Toronto (Dfa) having a hot summer season (Figure 4-12), the use of double-
glazed window is more efficient economically than the use of the TIM-PCM wall. In Sacramento
(Csa), the optimum TIM-PCM wall area is found 1.4 m2 with a minimum LCC of 1762$ while the
optimum double-glazed window area is found 1.41 m2 with a minimum LCC of 1610 $ (Table 4-18).
In Toronto (Dfa), the heating savings cost is low due to the low natural gas prices in Canada (1.1
0
500
1000
1500
2000
2500
3000
0 1 2 3 4 5 6 7
Co
st (
$)
TIM-PCM wall/ double glazed window surface area (m2)
a)
Initial cost _conv Heating cost _convcooling price_conv Total cost _convInitial cost_PCM Heating cost_PCMcooling price _PCM Total cost _PCM
0
10
20
30
40
50
60
0
5
10
15
20
25
30
35
40
45
50
1,5 2,5 3,5 4,5 5,5 6,5 7,5
Pay
bac
k p
erio
d (
year
s)
An
nu
al h
eati
ng
savi
ng
cost
($
)
TIM-PCM wall/ double glazed window surface area (m2)
b)
Annual heating savings cost_PCM Annual heating savings cost_conv
PP_PCM PP_conv
0
1000
2000
3000
4000
5000
6000
0 1 2 3 4 5 6 7
Co
st (
$)
TIM-PCM wall/ double glazed window surface area (m2)
a)
Initial cost _conv Heating cost _convcooling price_conv Total cost _convInitial cost_PCM Heating cost_PCMcooling price _PCM Total cost _PCM
0
5
10
15
20
25
30
35
0
10
20
30
40
50
60
1,5 2,5 3,5 4,5 5,5 6,5 7,5
Pay
bac
k p
erio
d (
year
s)
An
nu
al h
eati
ng
savi
ngs
co
st $
TIM-PCM wall/ double glazed window surface area (m2)
b)
Annual total savings cost_PCM Annual total savings cost_conv
PP_PCM PP_conv

Chapter 4
211
cents/ kWh), which makes the total cost depending mainly on the initial cost. The optimum TIM-
PCM wall area is found 1.65 m2 with a minimum LCC of 2143$ while the optimum double-glazed
window area is 2.19 m2 with a minimum LCC of 1999 $ (Table 4-18). Concerning the minimum
payback period, the investment cost of the TIM-PCM wall can be recovered in Sacramento after 43
years and in Toronto after 51 years (Table 4-19) which makes the application of such a wall
economically unviable.
Figure 4-12: Life cycle cost for a) Toronto (Dfa) and b) Sacramento (Csa)
Table 4-18: Minimum life cycle cost and optimum area of the TIM-PCM wall and the double-glazed window in
each climate
Double-glazed window TIM-PCM wall
Minimum LCC ($) Optimum area (m2) Minimum LCC ($) Optimum area (m2)
Barentsburg (ET) 15384 3.28 11494 7.532
Kiruna (Dfc) 21317 4.22 15240 7.532
Dras (Dsb) 1892 2.45 2002 1.51
Toronto (Dfa) 1999 2.19 2143 1.65
Paris(Cfb) 4357 3.48 4145 5
Sacramento (Csa) 1610 1.41 1762 1.4
Table 4-19: Minimum payback period and optimum area of the TIM-PCM wall and the double-glazed window
in each climate
Double-glazed window TIM-PCM wall
Minimum PP
(years)
Optimum area
(m2) Minimum PP (years) Optimum area (m2)
Barentsburg (ET) 61.72 4.63 10.51 7.532
Kiruna (Dfc) 27.11 4.34 7.87 7.532
Dras (Dsb) 35.95 4.75 35 4.57
Toronto (Dfa) 48.66 1.51 51.1 1.51
Paris(Cfb) 22.69 3.88 22 3.87
Sacramento (Csa) 31.3 1.51 43.26 1.51
0
500
1000
1500
2000
2500
3000
3500
0 1 2 3 4 5 6 7
Co
st (
$)
TIM-PCM wall/ double glazed window surface area (m2)
a)
Initial cost _conv Heating cost _convcooling price_conv Total cost _convInitial cost_PCM Heating cost_PCMcooling price _PCM Total cost _PCM
0
500
1000
1500
2000
2500
3000
3500
4000
0 1 2 3 4 5 6 7
Co
st (
$)
TIM-PCM wall/ double glazed window surface area (m2)
b)
Initial cost _conv Heating cost _convcooling price_conv Total cost _convInitial cost_PCM Heating cost_PCMcooling price _PCM Total cost _PCM

Chapter 4
212
Moreover, in Toronto (Dfa) and Sacramento (Csa), the use of external Venetian blinds with an
estimated price of 40$/m2 [71], [72] added to the initial cost, has no effect on the life cycle cost and
slightly decreases the minimum payback period. In Sacramento (Csa), the use of double-glazed
window still more cost-effective than the use of the TIM-PCM wall and do not offer economic
benefits in such a climate.
5. Conclusion
In this work, energy and economic analysis of the application of a TIM-PCM wall on a typical office
building envelope was investigated under different climates for a whole year. The results showed
that, in all studied climates, the energy performance of the office, in terms of heating and cooling
savings, can be significantly improved with the incorporation of the TIM-PCM wall instead of a
conventional insulated double-glazed window. In addition, the total loads decrease with the increase
of the area of the TIM-PCM wall except in Mediterranean climate. From an economic point of view,
the following conclusions can be drawn:
• In ET and Dfc climates, the application of TIM-PCM wall is economically feasible.
• In general, when the climate gets colder, the optimum TIM-PCM wall area increases.
• The heating savings for the office building located in Dras (Dsb) are not sufficient to recover
the investment, due to the low energy prices and high discount rates.
• In Paris (Cfb), the use of the TIM-PCM wall is found more cost effective than the use of
double-glazed window in terms of minimum life-cycle cost and payback period.
• In Csa and Dfa climates, the TIM-PCM wall is not cost-effective at current energy and
investment prices.
• The best candidates for the TIM-PCM wall application are found where energy prices for
heating (natural gas in our study) are relatively high, making the initial capital cost relatively
insignificant compared to the heating savings cost.
• The economic viability of the application of the TIM-PCM wall depends on different factors,
mainly climatic conditions, energy savings, energy costs (natural gas prices, electricity prices,
etc.), the economic situation of the country (discount rate) and investment costs.
Finally, further research should focus on the development of industrially scalable low-cost PCM, to
decrease investment costs for buildings integrating such walls and as result make them economically
viable.

Chapter 4
213
References
[1] B. Hojjati and S. H. Wade, “US household energy consumption and intensity trends: a decomposition
approach,” Energy Policy, vol. 48, pp. 304–314, 2012.
[2] F. Kuznik, D. David, K. Johannes, and J.-J. Roux, “A review on phase change materials integrated in
building walls,” Renew. Sustain. Energy Rev., vol. 15, no. 1, pp. 379–391, Jan. 2011.
[3] F. Ascione, N. Bianco, R. F. De Masi, F. de’ Rossi, and G. P. Vanoli, “Energy refurbishment of existing
buildings through the use of phase change materials: Energy savings and indoor comfort in the cooling
season,” Appl. Energy, vol. 113, pp. 990–1007, Jan. 2014.
[4] M. Alam, H. Jamil, J. Sanjayan, and J. Wilson, “Energy saving potential of phase change materials in
major Australian cities,” Energy Build., vol. 78, pp. 192–201, Aug. 2014.
[5] F. Souayfane, F. Fardoun, and P.-H. Biwole, “Phase change materials (PCM) for cooling applications in
buildings: A review,” Energy Build., vol. 129, pp. 396–431, Oct. 2016.
[6] R. Baetens, B. P. Jelle, and A. Gustavsen, “Phase change materials for building applications: A state-of-
the-art review,” Energy Build., vol. 42, no. 9, pp. 1361–1368, Sep. 2010.
[7] F. Kuznik, J. Virgone, and J. Noel, “Optimization of a phase change material wallboard for building use,”
Appl. Therm. Eng., vol. 28, no. 11–12, pp. 1291–1298, Aug. 2008.
[8] N. Soares, A. R. Gaspar, P. Santos, and J. J. Costa, “Multi-dimensional optimization of the incorporation
of PCM-drywalls in lightweight steel-framed residential buildings in different climates,” Energy Build.,
vol. 70, pp. 411–421, Feb. 2014.
[9] M. Saffari, A. de Gracia, C. Fernández, and L. F. Cabeza, “Simulation-based optimization of PCM melting
temperature to improve the energy performance in buildings,” Appl. Energy, vol. 202, pp. 420–434, Sep.
2017.
[10] H. J. Akeiber, S. E. Hosseini, H. M. Hussen, M. A. Wahid, and A. T. Mohammad, “Thermal performance
and economic evaluation of a newly developed phase change material for effective building
encapsulation,” Energy Convers. Manag., vol. 150, pp. 48–61, Oct. 2017.
[11] M. Telkes, “Trombe wall with phase change storage material,” in Proceedings of the 2nd National Passive
Solar Conference, Philadelphia, PA, USA., 1978.
[12] F. Fiorito, “Trombe walls for lightweight buildings in temperate and hot climates. exploring the use of
phase-change materials for performances improvement.,” Energy Procedia, vol. 30, pp. 1110–1119, 2012.
[13] L. Zalewski, A. Joulin, S. Lassue, and Y. Dutil, “Experimental study of small-scale solar wall integrating
phase change material,” Sol. Energy, no. 86, pp. 208–219, 2012.
[14] A. de Gracia, L. Navarro, A. Castell, A. Ruiz-Pardo, S. Alvarez, and L. F. Cabeza, “Experimental study
of a ventilated facade with PCM during winter period,” Energy Build., pp. 58, 324–332, 2013.
[15] L. Yongcai and L. Shuli, “Experimental study on thermal performance of a solar chimney combined with
PCM,” Appl. Energy 114, pp. 172–178, 2014.
[16] F. Goia, M. Perino, and V. Serra, “Experimental analysis of the energy performance of a full-scale PCM
glazing prototype,” Sol. Energy, vol. 100, pp. 217–233, 2014.
[17] B. L. Gowreesunker, S. B. Stankovic, S. A. Tassou, and P. A. Kyriacou, “Experimental and numerical
investigations of the optical and thermal aspects of a PCM-glazed unit,” Energy Build., vol. 61, pp. 239–
249, Jun. 2013.
[18] S. Li, G. Sun, K. Zou, and X. Zhang, “Experimental research on the dynamic thermal performance of a
novel triple-pane building window filled with PCM,” Sustain. Cities Soc., vol. 27, pp. 15–22, Nov. 2016.
[19] S. Grynning, F. Goia, and B. Time, “Dynamic Thermal Performance of a PCM Window System:
Characterization Using Large Scale Measurements,” Energy Procedia, vol. 78, pp. 85–90, Nov. 2015.
[20] H. Manz, P. . Egolf, P. Suter, and A. Goetzberger, “TIM–PCM external wall system for solar space heating
and daylighting,” Sol. Energy, vol. 61, no. 6, pp. 369–379, Dec. 1997.
[21] T. Silva, R. Vicente, and F. Rodrigues, “Literature review on the use of phase change materials in glazing
and shading solutions,” Renew. Sustain. Energy Rev., vol. 53, pp. 515–535, Jan. 2016.
[22] E. Kyriaki, C. Konstantinidou, E. Giama, and A. M. Papadopoulos, “Life cycle analysis (LCA) and life
cycle cost analysis (LCCA) of phase change materials (PCM) for thermal applications: A review,” Int. J.
Energy Res., Nov. 2017.
[23] A. Baniassadi, B. Sajadi, M. Amidpour, and N. Noori, “Economic optimization of PCM and insulation
layer thickness in residential buildings,” Sustain. Energy Technol. Assess., vol. 14, pp. 92–99, Apr. 2016.

Chapter 4
214
[24] G. P. Panayiotou, S. A. Kalogirou, and S. A. Tassou, “Evaluation of the application of Phase Change
Materials (PCM) on the envelope of a typical dwelling in the Mediterranean region,” Renew. Energy, vol.
97, pp. 24–32, Nov. 2016.
[25] J. Kosny, N. Shukla, and A. Fallahi, “Cost analysis of simple phase change material-enhanced building
envelopes in southern U.S. climates,” Fraunhofer CSE: U. S. Department of Energy, Tech. rep., 2013.
[26] Ashley Bland, Martin Khzouz, Thomas Statheros, and Evangelos Gkanas, “PCMs for Residential Building
Applications: A Short Review Focused on Disadvantages and Proposals for Future Development,”
Buildings, vol. 7, no. 3, p. 78, Aug. 2017.
[27] A. L. S. Chan, “Energy and environmental performance of building façades integrated with phase change
material in subtropical Hong Kong,” Energy Build., vol. 43, no. 10, pp. 2947–2955, Oct. 2011.
[28] X. Mi, R. Liu, H. Cui, S. A. Memon, F. Xing, and Y. Lo, “Energy and economic analysis of building
integrated with PCM in different cities of China,” Appl. Energy, vol. 175, pp. 324–336, Aug. 2016.
[29] M. A. Wahid, S. E. Hosseini, H. M. Hussen, H. J. Akeiber, S. N. Saud, and A. T. Mohammad, “An
overview of phase change materials for construction architecture thermal management in hot and dry
climate region,” Appl. Therm. Eng., vol. 112, pp. 1240–1259, Feb. 2017.
[30] X. Sun, Q. Zhang, M. A. Medina, and K. O. Lee, “Energy and economic analysis of a building enclosure
outfitted with a phase change material board (PCMB),” Energy Convers. Manag., vol. 83, pp. 73–78, Jul.
2014.
[31] N. Chaiyat, “Energy and economic analysis of a building air-conditioner with a phase change material
(PCM),” Energy Convers. Manag., vol. 94, pp. 150–158, Apr. 2015.
[32] Y. Berthou, P. H. Biwole, P. Achard, H. Sallée, M. Tantot-Neirac, and F. Jay, “Full scale experimentation
on a new translucent passive solar wall combining silica aerogels and phase change materials,” Sol.
Energy, vol. 115, pp. 733–742, May 2015.
[33] F. Souayfane, P. H. Biwole, and F. Fardoun, “Melting of a phase change material in presence of natural
convection and radiation: A simplified model,” Appl. Therm. Eng., vol. 130, pp. 660–671, Feb. 2018.
[34] Patry, Pierre-Manuel, and Dimitri Molle. RT 2012 et RT existant: Réglementation thermique et efficacité
énergétique. Editions Eyrolles, 2015. .
[35] Handbook, ASHRAE Fundamentals. “American society of heating, refrigerating and air-conditioning
engineers.” Inc.: Atlanta, GA, USA (2009). .
[36] “European Lighting Standard EN12464-1.” [Online]. Available: https://www.fagerhult.com/knowledge-
hub/EN-12464-1/. [Accessed: 13-Feb-2018].
[37] M. Kottek, J. Grieser, C. Beck, B. Rudolf, and F. Rubel, “World Map of the Köppen-Geiger climate
classification updated,” Meteorol. Z., vol. 15, no. 3, pp. 259–263, Jun. 2006.
[38] F. Goia, M. Perino, and M. Haase, “A numerical model to evaluate the thermal behaviour of PCM glazing
system configurations,” Energy Build., vol. 54, pp. 141–153, Nov. 2012.
[39] H. Elarga, F. Goia, A. Zarrella, A. Dal Monte, and E. Benini, “Thermal and electrical performance of an
integrated PV-PCM system in double skin façades: A numerical study,” Sol. Energy, vol. 136, pp. 112–
124, 2016.
[40] G. Fraisse, “Development of a simplified and accurate building model based on electrical analogy,”
Energy & Buildings, vol. 34, pp. 1017–1031, 2002.
[41] F. Souayfane, P. H. Biwole, and F. Fardoun, “Thermal behavior of a translucent superinsulated latent heat
energy storage wall in summertime,” Appl. Energy, vol. 217, pp. 390–408, May 2018.
[42] V. Voller, “Fast implicit finite-difference method for the analysis of phase change problems,” Numer Heat
Transfer Part B, pp. 17:155–69, 1990.
[43] R. Siegel, “Net radiation method for enclosure systems involving partially transparent walls,” 1973.
[44] B. Zivkovic and I. Fujii, “An analysis of isothermal phase change of phase change material within
rectangular and cylindrical containers,” Sol. Energy, vol. 70, no. 1, pp. 51–61, 2001.
[45] F. Souayfane, P. H. Biwole, and F. Fardoun, “Modèle simplifié pour la prise en compte de la convection
naturelle dans la modélisation du changement de phase solide-liquide,” presented at the Colloque Inter-
universitaire Franco-Québecois, Saint-lo, France, 2017.
[46] G. Vidalain, L. Gosselin, and M. Lacroix, “An enhanced thermal conduction model for the prediction of
convection dominated solid–liquid phase change,” Int. J. Heat Mass Transf., vol. 52, no. 7–8, pp. 1753–
1760, Mar. 2009.
[47] P. Jany and A. Bejan, “Scaling theory of melting with natural convection in an enclosure,” Int. J. Heat
Mass Transf., vol. 31, no. 6, pp. 1221–1235, Jun. 1988.
[48] A. Bejan, Convection heat transfer, Fourth edition. Hoboken, New Jersey: Wiley, 2013.

Chapter 4
215
[49] X. Faure, “Enveloppe hybride pour bâtiment à haute performance énergétique,” Université Joseph-
Fourier-Grenoble I, 2007.
[50] W. Swinbank, “Long-wave radiation from clear skies,” Q. J. R. Meteoro. Soc, p. 89:339, 1963.
[51] F. Miranville, “Contribution à l’étude des parois complexes en physique du bâtiment: modélisation,
expérimentation et validation expérimentale de complexes de toitures incluant des produits minces
réfléchissants en climat tropical humide,” Université de la Réunion, 2002.
[52] S. V. Patankar, Numerical heat transfer and fluid flow. New York: McGraw-Hill., 1980.
[53] M. Ibrahim, P. H. Biwole, P. Achard, E. Wurtz, and G. Ansart, “Building envelope with a new aerogel-
based insulating rendering: Experimental and numerical study, cost analysis, and thickness optimization,”
Appl. Energy, vol. 159, pp. 490–501, Dec. 2015.
[54] A. Kylili and P. A. Fokaides, “Life Cycle Assessment (LCA) of Phase Change Materials (PCMs) for
building applications: A review,” J. Build. Eng., vol. 6, pp. 133–143, Jun. 2016.
[55] M. Krarti and P. Ihm, “Evaluation of net-zero energy residential buildings in the MENA region,” Sustain.
Cities Soc., vol. 22, pp. 116–125, Apr. 2016.
[56] “Percentage of cost breakdown between labour, materials and contractor profit in construction.” [Online].
Available: http://www.a4architect.com/2013/04/percentage-of-cost-breakdown-between-labour-
materials-and-contractor-profit-in-construction/. [Accessed: 15-Jan-2018].
[57] “Global electricity prices by select countries in 2017 (in U.S. dollars per kilowatt hour).” [Online].
Available: https://www.statista.com/statistics/263492/electricity-prices-in-selected-countries/. [Accessed:
15-Jan-2018].
[58] “Electricity prices for households in Norway from 2010 to 2016, semi-annually (in euro cents per kilowatt-
hour).” [Online]. Available: https://www.statista.com/statistics/643369/electricity-prices-for-households-
in-norway/. [Accessed: 15-Jan-2018].
[59] Eurostat, “Electricity and natural gas price statistics.” [Online]. Available:
http://ec.europa.eu/eurostat/documents/38154/41386/SEarticle2012S1.pdf/364a98b3-648f-4716-b95a-
71484f430a9f. [Accessed: 15-Jan-2018].
[60] “Estimated landed prices of LNG worldwide as of May 2017, by select country (in U.S. dollars per million
British thermal units).” [Online]. Available: https://www.statista.com/statistics/252984/landed-prices-of-
liquefied-natural-gas-in-selected-regions-worldwide/. [Accessed: 15-Jan-2018].
[61] Eurostat, “Natural gas price statistics.” [Online]. Available: http://ec.europa.eu/eurostat/statistics-
explained/index.php/Natural_gas_price_statistics. [Accessed: 15-Jan-2018].
[62] “Worldwide Central Bank Rates.” [Online]. Available: http://www.cbrates.com/. [Accessed: 15-Jan-
2018].
[63] “Country comparison: Central Bank Discount Rate.” [Online]. Available:
https://www.cia.gov/library/publications/the-world-factbook/rankorder/2207rank.html. [Accessed: 15-
Jan-2018].
[64] “Concrete price considerations- cost of concrete.” [Online]. Available:
https://www.concretenetwork.com/concrete-prices.html. [Accessed: 15-Jan-2018].
[65] “plasterboard installation.” [Online]. Available: https://www.ato.gov.au/Business/Small-business-
benchmarks/In-detail/Benchmarks-A-Z/L-Q/Plastering-and-ceiling-services/?page=4. [Accessed: 15-Jan-
2018].
[66] “glass wool price list.” [Online]. Available: https://www.alibaba.com/showroom/glass-wool-price-
list.html. [Accessed: 15-Jan-2018].
[67] “PCM Products.” [Online]. Available:
http://www.pcmproducts.net/Phase_Change_Material_Products.htm. [Accessed: 15-Jan-2018].
[68] Y. Cascone, A. Capozzoli, and M. Perino, “Optimisation analysis of PCM-enhanced opaque building
envelope components for the energy retrofitting of office buildings in Mediterranean climates,” Appl.
Energy, vol. 211, pp. 929–953, Feb. 2018.
[69] M. Saffari, A. de Gracia, S. Ushak, and L. F. Cabeza, “Economic impact of integrating PCM as passive
system in buildings using Fanger comfort model,” Energy Build., vol. 112, pp. 159–172, Jan. 2016.
[70] “Recommended Lighting Levels in Buildings- IESNA Lighting Handbook.” [Online]. Available:
https://www.archtoolbox.com/materials-systems/electrical/recommended-lighting-levels-in-
buildings.html. [Accessed: 13-Feb-2018].
[71] “Wholesale Pricing on Blinds and Shades.” [Online]. Available: http://www.blindsmax.com/blog/how-
much-do-new-blinds-cost/. [Accessed: 13-Feb-2018].

Chapter 4
216
[72] “wide venetian blinds prices.” [Online]. Available: http://wideblinds.co.uk/price_guide.html. [Accessed:
13-Feb-2018].

Chapter 4
217
Complementary sections to chapter 4
A) Transient liquid fraction in each climate
The transient liquid fraction of the PCM during the simulated year can be found at each time step by
the numerical model. The liquid fraction provides information about the state of the PCM: if fl = 0
the PCM is solid, if fl =1 the PCM is liquid, and if 0 < fl < 1 the PCM is changing phase. Also, the
hourly profile of the liquid fraction can show if the PCM assure diurnal cycling in winter and summer
seasons. The average liquid fraction in the PCM filled in glass bricks for a TIM-PCM wall of 7.532
m2 function of the time is shown in the following figures. Noting that the year is 8760 hours, January
starts from 0 to 744 hours, February from 744 to 1416 hours …. December from 8016 to 8760. June,
July and August are from 3624 to 5832 hours.
Figure 1: PCM liquid fraction function of time in a) Sacramento (Csa) and b) Toronto (Dfa)
Figure 1 shows that the PCM remains liquid almost all the summer in Sacramento (fl=1). This is due
to the hot summer conditions and high solar gains during the day in addition to high external
temperature during the night which prohibits PCM solidification. In winter, the PCM assure some

Chapter 4
218
complete or partial diurnal cycles. In Toronto, the PCM seems to work better, where the PCM melts
and solidifies for longer periods except in the period between 4000 hours and 6000 hours, here the
PCM remains liquid with some partial solidifications.
Figure 2: PCM liquid fraction function of time in a) Dras (Dsb) and b) Paris (Cfb)
The PCM assure partial and complete melting and solidification processes in Dras and Paris all the
year (Figure 2). In winter season, the PCM can totally melt in Dras (liquid fraction reaches 1) more
than Paris due to the higher solar radiation. In summer, the PCM is unable to completely solidify in
hot periods.
Figure 3 shows that the PCM remains in solid state in Barentsburg for almost five months without
melting (January, February, part of March, part of October, November, December). This is due to
very low external temperatures and low incident solar radiation. In warm season, the PCM achieves
complete diurnal cycling. In Kiruna the PCM can also achieves diurnal cycling except in the very
cold months where it remains in its solid state (between 0 and 750 hours and 7710 and 8760 hours).

Chapter 4
219
Figure 3: PCM liquid fraction function of time in a) Kiruna (Dfc) and b) Barentsburg (ET)
Figure 4 shows the percentage of time where the PCM is in solid state, liquid state or changing phase
in each climate for different TIM-PCM wall areas. These graphs were found based on the hourly
transient liquid fraction values calculated in the numerical model. When fl = 0, the PCM is solid, the
number of hours where fl is equal to zero are counted and the percentage of time in the year is found,
same for fl =1 (liquid PCM) and 0 < fl < 1 (PCM changing phase). For example, in Baretsburng,
using a TIM-PCM wall of an area 7.532 m2 (200 bricks filled with Fatty acids) the PCM remains
solid 85% of the time. While in Dras the PCM is solid 52% of the time, liquid 37% of the time and
changing phase the rest of the time. This means that in Dras the PCM works better and can assure
cycling. In Sacramento, the PCM remains liquid about 65% of the time, due to the hot summer season
where the PCM is unable to solidify.
It can be concluded that in the regions having a hot summer (Toronto and Sacramento) the PCM
remains liquid in summer for long periods and can barely solidify, while in winter it can achieve
diurnal complete or partial cycling. In climates having a warm summer season (Dras and Paris), the
PCM works better in summer. In regions having a cold (continental or polar) winter, the PCM remains
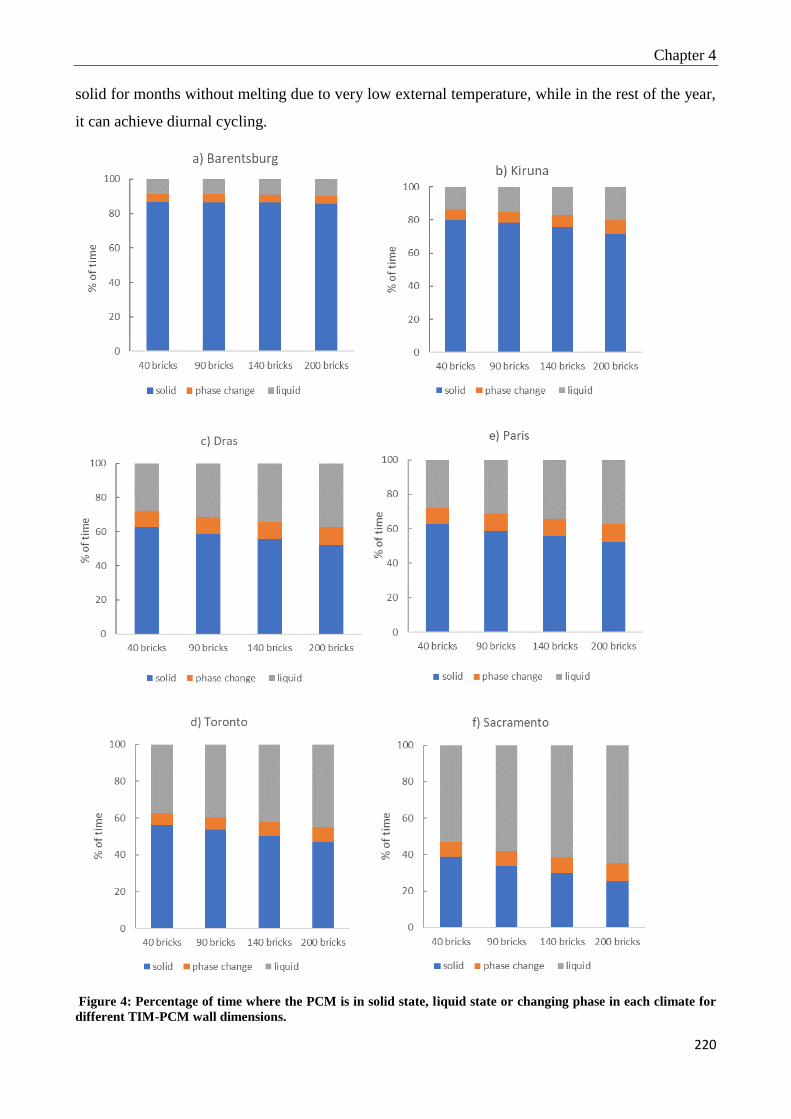
Chapter 4
220
solid for months without melting due to very low external temperature, while in the rest of the year,
it can achieve diurnal cycling.
Figure 4: Percentage of time where the PCM is in solid state, liquid state or changing phase in each climate for
different TIM-PCM wall dimensions.

Chapter 4
221
B) Note
In this chapter, same construction of the building was assumed regardless of the climate. This was
done in order to have a criterion of similarity between all the locations simulated, and to focus on the
impact of the TIM-PCM wall on the building compared to a based case.


GENERAL CONCLUSION

General conclusion
225
General Conclusion
1. Overview of the achievements
During this thesis, we have developed a simplified model for melting with natural convection at first,
and with both convection and short-wave radiation afterward. The simplified model for PCM melting
with natural convection is based on the enhanced thermal conductivity approach coupled with the
scaling theory. A modified enthalpy method is adopted to solve the phase change problem. Two-
dimensional implicit finite volume method is used to solve the energy equation and the code is written
on MATLAB. The results of the simplified model are validated using a complete CFD model, in
addition to experimental and numerical benchmark solutions for a test case: melting of Octadecane
in a square cavity. A correlation for the Nusselt number at the left heated wall is proposed based on
CFD results, to calculate the enhanced conductivity. The shortwave radiation through the PCM is
modeled by means of a simplified solution procedure and the radiative heat flux is added as a source
term to the energy equation. A nodal evaluation of the PCM optical properties function of the liquid
fraction was made. The absorbed solar radiation was equally divided between the nodes forming the
PCM layer. The model was also developed on MATLAB using two-dimensional implicit finite
volume method. It was validated against a LBM-DOM model found in the literature for the case of
melting of Fatty acid filled in rectangular enclosure. Then, based on the two previous models, we
have developed a numerical model describing the heat transfer mechanisms through the TIM-PCM
wall. The latter is an innovative translucent passive solar wall proposed by INERTRANS project
composed of glazing, silica aerogel for thermal insulation and PCM for absorption and storage of
heat. The wall was experimentally tested in a full-scale test cell located in Sophia Antipolis, Southern
France, within the PERSEE center of Mines ParisTech graduate school. The wall model was coupled
with TRNSYS to evaluate the thermal performance of the entire building. The coupled MATLAB-
TRNSYS model has been experimentally validated using the experimental cell located within the
PERSEE center for seven consecutive days in summer and winter. Then, we have used the validated
numerical model to optimize the thermal performance of the wall in summer season under different
climatic conditions, in terms of thermal comfort. Finally, we have studied the annual energy
performance of a typical office following the incorporation of the TIM-PCM wall into its south-facing
envelope, under six different climates. The optimum TIM-PCM wall area is then evaluated
economically for each climate through life-cycle cost (LCC) and payback period (PP) analysis.
The main conclusions issued from this work are:

General conclusion
226
• The developed simplified model for convection during phase change requires a computational
time much shorter than that of the CFD model. The values of the average liquid fraction, the
position of the melting front for four different instants, and the average position of the melting
front function of time from the simplified model are found in good agreement with those of
CFD model and Benchmark solutions.
• The modeling of natural convection during melting of Octadecane in square cavity enhances
the position of the melting front by about 55% at dimensionless time SteFo = 0.01 and the
average liquid fraction by about 40% compared to a conduction only model.
• Natural convection increases the liquid fraction by about 35% compared to the conduction
only model, while the radiation increases the liquid fraction by about 20% compared to the
convection model for the case of melting of Fatty acid filled in a rectangular enclosure.
• Concerning the computational time, the simplified model for both natural convection and
radiation during melting run significantly faster than the LBM-DOM model.
• The developed simplified model considering both natural convection and radiation during
melting process is simple to implement and can manage efficiently convection-controlled
phase change problems without the full solution of the flow in a very small computational
time. It is developed for practical thermal engineering applications, where yearly energy
performance evaluation is sought, that cannot rely on highly computational time needed in
CFD simulations.
• The coupled MATLAB-TRNSYS model, experimentally validated, represents a starting point
for simulations on different configurations of the novel TIM-PCM wall and allows to fully
investigate its abilities and drawbacks under different operative conditions, orientations,
geometries and different climates without the need of performing expensive experimental
analysis.
• To be more realistic, natural convection in the liquid PCM should not be neglected when
modeling phase change in the wall.
• The use of Prisma solar glass instead of the ordinary glass in the TIM-PCM wall composition
is shown to be an effective technology solving the encountered overheating problem in
summer, while preserving the TIM-PCM advantages during winter.
• Cycling is not reached in summer conditions in most climates except in the subarctic climate
(Dfc) where the PCM achieves complete diurnal cycles.
• Even if the PCM does not cycle in summertime, indoor thermal comfort can be ensured using
shading devices.

General conclusion
227
• In all considered climates in chapter 4, the energy performance of the office, in terms of
heating and cooling savings, can be significantly improved with the incorporation of the TIM-
PCM wall instead of a double-glazed window.
• In regions having a hot summer (Toronto and Sacramento), the PCM remains liquid in
summer for long periods and can barely partially solidify, while in winter it can achieve
complete or partial diurnal cycling. In climates having a warm summer (Dras and Paris), the
PCM works better in summer with more partial PCM solidifications. In regions having a cold
(continental or polar) winter, the PCM remains solid for months without melting, while in the
rest of the year, it can achieve diurnal cycling.
• From an economic point of view, we have found that when the climate gets colder, the optimal
surface of the wall increases.
• In polar (ET) and subarctic (Dfc) climates, the application of the TIM-PCM wall is found
economically feasible. In Mediterranean (Csa) and continental humid (Dfa) climates, the wall
application is unprofitable at current energy and investment prices.
• The best candidates for TIM-PCM wall application are cities where the price of natural gas is
relatively high, making the initial investment cost relatively insignificant compared to heating
savings.
• The economic viability of applying the TIM-PCM wall depends mainly on climatic
conditions, energy savings, energy costs, the country's economic situation and the investment
cost.
• A Graphical User Interface GUI is created on MATLAB to model the phase change problem
in rectangular cavity in presence of both natural convection and radiation.
2. Limitations and perspectives
Although this research has reached its aims, there were some limitations that may consist a starting
point for future work. In the 2D numerical model for natural convection during melting process, the
convective zone dimension was approximated to be equal to the position of the melting front at the
top of the cavity. This assumption is not always accurate, and more research should be done
concerning a better approximation of this zone. Moreover, the effect of thermal expansion in the
cavity was neglected to simply the numerical model. In future works, this should be considered. The
developed Nusselt number correlation was for a very specific case (specific PCM, geometry…).
Although this developed correlation has not been used in the rest of the work (a general correlation
of Berkovsky and Polikov has been used in the rest of numerical modeling, see chapter 2) more efforts

General conclusion
228
should be done to provide correlations that are appropriate for a wide range of realistic geometries
and parameters.
In addition, in our work, we have not modified the construction of the TIM-PCM wall depending on
each climate. As a future work the constructive solution can be changed, and a multidimensional
optimization study can be performed by combining TRNSYS with an optimization tool such as
GenOpt or Mobo. It would be a question to study the impact of various PCM (modification of the
melting temperature, latent heat, thickness), and to vary the width of the silica aerogel bed as well as
its optical characteristics in order to find an optimal solution suitable for each climate. It is also
necessary to change the construction of the building depending on the climate zone. A ventilated air
gap can be also added to the wall composition to ensure crystallization of the PCM at night. This
could be the subject of a full-fledged study based on the modification of the TIM-PCM wall model.
In addition, the available components for modeling PCM (Type 1270, Type 260...) in TRNSYS only
consider conduction heat transfer, so we suggest, as perspective, creating a new component for PCM
considering all heat transfer modes occurring during phase change and in 2D if possible.
Moreover, concerning the economic study, there were some difficulties in estimating the prices of
materials in each country, especially the PCM cost used in the TIM-PCM wall construction. To
improve this study, exact prices of PCM product, installation, transport, encapsulation must be
provided by the manufacturer.
Finally, although the incorporation of phase change materials into buildings seems to be very
beneficial, it seems necessary that new studies are devoted to understanding the behavior of PCM and
especially the study of supercooling, crystallization kinetics, phase segregation, containment as well
as health and safety aspects, cost and lifespan of these materials. Such realistic features of PCM were
not taken into account in our numerical model.

General conclusion
229
Conclusion Générale
1. Aperçu des réalisations
Au cours de cette thèse, nous avons développé un modèle simplifié pour la simulation de la fusion,
avec convection naturelle dans un premier temps, et avec convection et rayonnement courte longueur
d’onde (CLO) dans un deuxième temps. Le modèle simplifié pour la prise en compte de la convection
naturelle lors de fusion du MCP utilise l’approche de la conductivité efficace et la théorie d’échelle.
La méthode enthalpique a été utilisée pour modéliser le changement de phase. Le modèle
mathématique est codé sous MATLAB en utilisant la méthode de volumes finis implicite en deux
dimensions. Les résultats du modèle simplifié sont ensuite validés en utilisant un modèle CFD
complet précédemment développé dans COMSOL Multiphysics, et des résultats numériques et
expérimentaux des benchmarks trouvés dans la littérature pour le cas de fusion de l’Octadecane dans
une enceinte carrée. En particulier, une corrélation du nombre de Nusselt correspondant à notre cas
d’étude a été trouvée, sur la base du modèle CFD, et est ensuite implémentée dans le modèle simplifié.
Le modèle simplifié de la fusion avec convection et rayonnement courte longueur d’onde utilise un
algorithme simplifié pour trouver le flux de rayonnement CLO absorbé par le MCP. Ce flux est
ensuite ajouté à l'équation d'énergie en tant que terme source. Une évaluation nodale des propriétés
optiques du MCP en fonction de la fraction de liquide a été faite. De même, le rayonnement solaire
absorbé a été divisé entre les nœuds formant le couche MCP. Le modèle mathématique est codé à
nouveau sous MATLAB en utilisant la méthode des volumes finis en deux dimensions. Les résultats
obtenus sont en très bon accord avec les résultats d’un modèle de Boltzmann sur réseau et la méthode
des ordonnées discrètes (LBM-DOM) trouvés dans la littérature, en termes de la fraction liquide
moyenne pour le cas de fusion de l’acide gras contenu dans une enceinte rectangulaire. Ensuite, se
basant sur les deux modèles précédents, nous avons développé un modèle numérique décrivant les
mécanismes de transfert de chaleur à travers le mur MCP-aérogel. Ce dernier est un mur solaire passif
translucide innovant proposé par le projet INTERTRANS et composé d’un vitrage, de l’aérogel de
silice pour l’isolation thermique et des matériaux à changement de phase (MCP) pour l’absorption et
le stockage de la chaleur issue du rayonnement solaire. Ce mur a été caractérisé expérimentalement
en ambiance contrôlée et in situ sur un bâtiment grandeur nature présent au sein du centre du centre
Procédés, Energies Renouvelables et Systèmes Energétique (PERSEE) situé à l’Ecole des Mines à
Sophia Antipolis. Le modèle du mur a été couplé au logiciel de simulation dynamique des systèmes
thermiques TRNSYS, pour évaluer la performance thermique de l'ensemble du bâtiment. Ce modèle
a été validé expérimentalement à l’aide de la cellule expérimentale du centre PERSEE pendant sept
jours consécutifs en été et en hiver. Ensuite, nous avons utilisé le modèle validé pour optimiser la
performance thermique du mur en été sous différentes conditions climatiques, en termes du confort
General conclusion
230
thermique. Enfin, nous avons conduit une évaluation énergétique annuelle ainsi qu’une étude
économique pour l’application du mur MCP-aérogel dans l’enveloppe d’un bâtiment dans différents
climats.
Les principales conclusions de ce travail sont :
• Le modèle simplifié développé pour la convection pendant le changement de phase nécessite
un temps de calcul beaucoup plus court que celui du modèle CFD. Les valeurs de fraction
liquide moyenne, de la position du front de fusion pour quatre instants différents, et de la
position moyenne du front de fusion au cours du temps sont en bon accord avec celles du
modèle CFD et des solutions Benchmark.
• La modélisation de la convection naturelle pendant la fusion de l’Octadécane dans une cavité
carrée modifie la position du front de fusion d'environ 55% à l'instant SteFo = 0.01 et la
fraction liquide moyenne d'environ 40% en comparaison avec un modèle à conduction seule.
• La convection naturelle fait augmenter la fraction liquide d'environ 35% par rapport au modèle
à conduction seule, tandis que le rayonnement CLO fait augmenter la fraction liquide
d'environ 20% par rapport au modèle tenant compte de la convection pour le cas de la fusion
de l'acide gras contenu dans une enceinte rectangulaire.
• En ce qui concerne le temps du calcul, les simulations du modèle simplifié, tenant en compte
la convection naturelle et le rayonnement CLO, sont beaucoup plus rapides que celles utilisant
le modèle LBM-DOM.
• Le modèle proposé considérant à la fois la convection naturelle et le rayonnement pendant le
processus de fusion est simple à mettre en œuvre et peut gérer efficacement les problèmes de
changement de phase dominés par convection sans la résolution complète de l’écoulement
dans un temps de calcul relativement court. Il a été développé pour les applications pratiques
de l'ingénierie thermique, où on cherche une évaluation annuelle de la performance
énergétique.
• Le modèle MATLAB-TRSNYS validé expérimentalement représente un bon point de départ
pour des simulations sur différentes configurations du mur et permet d'étudier pleinement ses
capacités et ses inconvénients sous différentes conditions opératoires, et dans différents
climats.
• Pour être plus réaliste, la convection naturelle dans le MCP liquide ne doit pas être négligée
lors de la modélisation du changement de phase.

General conclusion
231
• L'utilisation d’un type de verre spécial (Prisma Solar glass) au lieu du verre ordinaire dans la
composition de la paroi MCP-aérogels se révèle être une technologie efficace pour résoudre
le problème de surchauffe rencontré en été, tout en préservant les avantages du mur en hiver.
• Le confort thermique ainsi que le cyclage du MCP en été dépendent des conditions
climatiques.
• Le cyclage n’est pas atteint l’été dans la plupart des climats sauf dans le climat subarctique
(Dfc).
• Dans tous les climats étudiés, dans le chapitre 4, la performance énergétique du bureau, en
termes d'économies de chauffage et de refroidissement, peut être significativement améliorée
avec l'incorporation de la paroi MCP-aérogel à la place d'une fenêtre à double vitrage.
• Dans les régions ayant un été chaud (Toronto et Sacramento), le MCP reste liquide en été
pendant de longues périodes et peut difficilement se solidifier même partiellement, tandis
qu'en hiver, il peut effectuer un cycle diurne complet ou partiel. Dans les climats ayant un été
tiède (Dras et Paris), le MCP fonctionne mieux en été réalisant des solidifications partielles.
Dans les régions ayant un hiver froid (continental ou polaire), le MCP reste solide pendant
des mois sans se fondre, tandis que pendant le reste de l’année, il est possible de faire des
cycles diurnes.
• D’un point de vue économique, nous avons trouvé que lorsque le climat devient plus froid,
la surface optimale du mur augmente.
• Dans les climats polaire (ET) et subarctique (Dfc), l'application de la paroi MCP-aérogel est
économiquement faisable. Dans les climats méditerranéens (Csa) et humides continentaux
(Dfa), l’application du mur n'est pas rentable aux prix actuels de l'énergie et de
l'investissement.
• Les meilleurs candidats pour l'application du mur MCP-aérogel se trouvent là où le prix du
gaz naturel est relativement élevé, rendant le coût d'investissement initial relativement
insignifiant comparé aux économies de chauffage.
• La viabilité économique de l'application du mur MCP- aérogel dépend principalement des
conditions climatiques, des économies d'énergie, des coûts de l’énergie, de la situation
économique du pays et du coût d'investissement.
• Une interface graphique GUI est créée sur MATLAB pour modéliser le problème de
changement de phase dans une cavité rectangulaire en présence de convection naturelle et de
rayonnement.
General conclusion
232
2. Limitations et perspectives
Bien que cette recherche ait atteint ses objectifs, certaines limitations peuvent constituer un point de
départ pour des travaux futurs. Dans le modèle numérique bidimensionnel pour la convection
naturelle pendant la fusion, la dimension de la zone convective était approximativement considérée
égale à la position du front de fusion au sommet de la cavité. Cette hypothèse n'est pas toujours exacte,
et des recherches supplémentaires devraient être effectuées concernant une meilleure approximation
de cette zone. De plus, l'effet de la dilatation thermique dans la cavité a été négligé pour simplifier le
modèle numérique. Dans les travaux futurs, ceci doit être considéré. Au cours de cette thèse, la
corrélation de nombre de Nusselt a été développée pour un cas très spécifique. Malgré que cette
corrélation développée n'ait pas été utilisée dans le reste du travail (une corrélation générale de
Berkovsky et Polikov a été utilisée dans le reste de la modélisation numérique, voir chapitre 2), des
efforts supplémentaires devraient être déployés pour fournir des corrélations appropriées à une large
gamme des géométries et des paramètres.
De plus, dans notre travail, nous n'avons pas modifié la construction du mur MCP-aérogel en fonction
de chaque climat. Comme travail futur, la solution constructive peut être modifiée, et une étude
d'optimisation multidimensionnelle peut être réalisée en combinant TRNSYS avec un outil
d’optimisation tels que GenOpt ou Mobo. Il s'agirait d'étudier l'impact de divers MCP (modification
de la température de fusion, de l'enthalpie, de l’épaisseur), de faire varier l’épaisseur du lit d'aérogel
de silice et ses caractéristiques optiques afin de trouver une solution optimale convenable à chaque
climat. Il est également nécessaire de modifier la construction du bâtiment en fonction de la zone
climatique. En plus, une lame d’air ventilée peut être ajoutée à la composition du mur afin d’assurer
la cristallisation du MCP la nuit. Cela pourrait faire l'objet d'une étude à part entière basée sur la
modification du modèle de mur MCP-aérogel.
Les composants disponibles pour modéliser les MCP (Type 1270, Type 260 ...) dans TRNSYS ne
prennent en compte que le transfert de chaleur par conduction. Nous proposons donc de créer un
nouveau composant pour les MCP prenant en compte tous les modes de transfert de chaleur pendant
le changement de phase et en 2D si possible.
En outre, bien que l’incorporation des matériaux à changement de phase dans les bâtiments semble
être très bénéfique, il semble nécessaire que de nouvelles études se consacrent à la compréhension du
comportement du MCP et notamment à l’étude de la surfusion, la cinétique de cristallisation, la
ségrégation des phases, le confinement ainsi que les aspects sanitaires, sécuritaires, le coût et la durée
de vie de ces matériaux. Ces caractéristiques réalistes des MCP n’ont pas été prises en compte dans
notre modèle numérique.

ANNEXES


Annexes
235
Annex A: Phase Change Materials (PCM) for Cooling Applications in Buildings:
A Review
Abstract:
Cooling demand in the building sector is growing rapidly; thermal energy storage systems using
phase change materials (PCM) can be a very useful way to improve the building thermal
performance. The right use of PCM in the envelope can minimize peak cooling loads, allow the use
of smaller HVAC technical equipment for cooling, and has the capability to keep the indoor
temperature within the comfort range due to smaller indoor temperature fluctuations. This article
presents an overview of different PCM applications in buildings for reducing cooling loads under
different climate conditions, and the factors affecting the successful and the effective use of the PCM.
Many drawbacks have been found in PCM applications, mainly the intense impact of summer weather
conditions over the PCM performance, which prohibits its complete solidification during night, and
thus, limiting its effectiveness during the day. Proposed solutions are reviewed in this article. Finally,
a topology diagram is presented to summarize the steps leading to an effective use of PCM in building
applications.
Keywords: Phase Change Materials, cooling applications, active systems, passive systems, PCM
effectiveness, melting temperature.
Highlights:
• PCM for cooling applications (active and passive systems).
• Factors affecting PCM effectiveness.
• Topology diagram summarizing PCM application.
Nomenclature
Cp specific heat (J/kg∙K)
Edaily Average daily cooling load (KW)
Hf Latent heat of fusion (J/kg)
kl thermal conductivity at liquid state (W/m∙K)
ks thermal conductivity at solid state (W/m∙K)
Qcool Cooling load (kW)
Annexes
236
Tm Melting temperature (C)
Ts Solidification temperature (C)
ρ PCM Density of PCM (kg/m3)
Acronyms
AC Air conditioning
ACH Air change per hour
AHU Air handling unit
ASEAN Association of Southeast Asian Nations
CC Cooled-ceiling
COP Coefficient of performance
DRSS Distributed Responsive System of Skins
E Energy storage effectiveness
E* Modified energy storage effectiveness
EIA Ecodesign Impact Accounting (study)
EJ Exajoules
HTF heat transfer fluid
HVAC heating, ventilating, and air conditioning
LHS Latent heat storage
LHTES Latent heat thermal energy storage
Mtoe Million Tonnes of Oil Equivalent
MVS Mechanical ventilation system
PCM Phase change materials
RT Rubitherm GmbH
SEER Seasonal Energy Efficiency Ratio
SIP Structural Insulation Panels
SPP Simple payback period
SSPCM Shape stabilized PCM
TES Thermal energy storage
VDSF Ventilated double skin facade
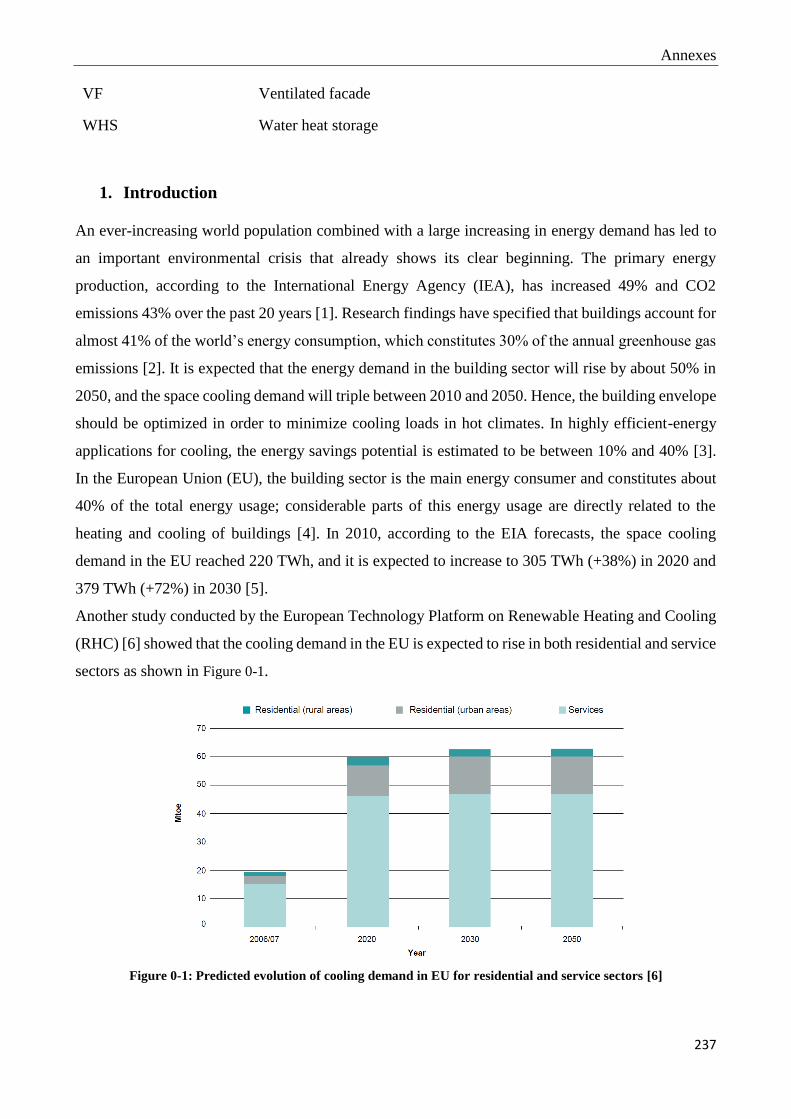
Annexes
237
VF Ventilated facade
WHS Water heat storage
1. Introduction
An ever-increasing world population combined with a large increasing in energy demand has led to
an important environmental crisis that already shows its clear beginning. The primary energy
production, according to the International Energy Agency (IEA), has increased 49% and CO2
emissions 43% over the past 20 years [1]. Research findings have specified that buildings account for
almost 41% of the world’s energy consumption, which constitutes 30% of the annual greenhouse gas
emissions [2]. It is expected that the energy demand in the building sector will rise by about 50% in
2050, and the space cooling demand will triple between 2010 and 2050. Hence, the building envelope
should be optimized in order to minimize cooling loads in hot climates. In highly efficient-energy
applications for cooling, the energy savings potential is estimated to be between 10% and 40% [3].
In the European Union (EU), the building sector is the main energy consumer and constitutes about
40% of the total energy usage; considerable parts of this energy usage are directly related to the
heating and cooling of buildings [4]. In 2010, according to the EIA forecasts, the space cooling
demand in the EU reached 220 TWh, and it is expected to increase to 305 TWh (+38%) in 2020 and
379 TWh (+72%) in 2030 [5].
Another study conducted by the European Technology Platform on Renewable Heating and Cooling
(RHC) [6] showed that the cooling demand in the EU is expected to rise in both residential and service
sectors as shown in Figure 0-1.
Figure 0-1: Predicted evolution of cooling demand in EU for residential and service sectors [6]

Annexes
238
Additionally, in 2006 the building sector in the USA accounts for 38.9% of the total primary energy
consumption; 18% for commercial buildings while 20.9% for residential buildings [7]. In 2009–2010,
the energy consumption of residential building in Australia was around 25% of total energy
consumptions [8]. Present predictions show that the energy use by nations with rising economies
(Middle East ,Southeast Asia, South America and Africa) will increase to an average annual rate of
3.2% and will exceed by 2020 that for the developed countries (Western Europe, Japan, North
America, New Zealand and Australia) at an average growing rate of 1.1% [9]. According to IEA
[10], the cooling demand is expected to increase swiftly in areas where urbanization is promptly
growing as shown in Figure 0-2.
Figure 0-2: Predicted evolution of cooling demand (Exa-joule "EJ") in four different regions [10]
Since the energy consumption of heating and air conditioning systems is still rising with the
increasing demand for thermal comfort, therefore there is large potential to ameliorate the building
energy efficiency in the areas of heating and cooling technologies.
One of the interesting ways to reduce the energy demands is the use of thermal energy storage (TES).
Depending on environmental circumstances, TES materials can absorb heat, store it and release it;
improving the gap between energy supply and energy consumption [11]. The energy can be stored
by TES materials in three ways namely sensible heat, latent heat or chemical reactions. The latent
heat thermal energy storage (LHTES) is an attractive way and has taken much attention over the last
decades for heating and cooling purposes in buildings. In residential buildings, a large variety of
studies proved that the application of thermal mass in well-insulated structures provides cooling and
heating energy savings between 5 and 30% [12].
Recently, Phase change materials (PCM), that utilize the principle of LHTES, have received a great
interest and forms a promising technology. PCM have large thermal energy storage capacity in a
temperature range near to their switch point and present a nearly isothermal behavior during the

Annexes
239
charging and discharging process [13]. The right use of PCM can minimize the peak heating and
cooling loads, and has the capability to keep the indoor temperature within the comfort range due to
smaller temperature fluctuations. Consequently, reduce the dimensions and energy consumption of
the corresponding technical equipment. The main advantage of the use of PCM is that it enhances the
thermal storage potential with a minimum change of the existing building design [12]
Many studies have investigated the use of PCM in buildings and showed that PCM can remarkably
improve the building energy performance. But a lot of difficulties were encountered especially
concerning the efficient use of PCM and its practical application.
Al-Saadi and Zhai [14], Baetens et al. [15], Cabeza et al.[16], Khudhair and Farid [17], Kuznik et al
[18] and others, have conducted several reviews on the use of PCM in buildings for thermal energy
storage and indoor climate comfort purposes, clearly showing that the interest for PCM is increasing
worldwide. It has been also proved by several authors that PCM provide energy benefits in the heating
period while limited benefits were found during the cooling season.
This study presents an overview of different PCM applications in buildings for reducing mainly the
cooling loads under different climate conditions. The difficulties related to the material selection and
the factors affecting the successful and the effective use of the PCM are also discussed.
2. Phase change materials (PCM)
2.1. General
PCM can be used to store energy or to control the temperature swings within a specific range.
Therefore, applications for heating and cooling in buildings are expected to have great potential for
PCM use. When the temperature rises, PCM absorb heat in an endothermic process and changes phase
from solid to liquid. As the temperature drops, PCM release heat in an exothermic process, and return
to its solid phase.
Certain types of PCM do not satisfy the desired criteria for an appropriate storage medium. The PCM
to be used for thermal energy storage purposes should meet desirable thermo-physical, kinetic and
chemical requirements shown in Table 0-1[7] .
Table 0-1 thermo-physical, kinetic, chemical, economic and environmental requirements of PCM [7]
Thermo-physical
Requirements Kinetic Requirements
Chemical
Requirements
Economic and
environmental
requirements
- Appropriate melting
temperature in the required
operating temperature
range.
- High latent heat of fusion.
-High nucleation rate to avoid
super cooling of the liquid
phase.
- High rate of crystallization
to satisfy demands of heat
- Long term chemical
stability of the PCM.
- No degradation after
freeze/melt cycles.
- Low price and cost
effective.
- availability
-Nonpolluting.

Annexes
240
- High specific heat.
- High thermal conductivity
of solid and liquid phases.
-High density.
- Congruent melting of the
PCM.
-cycling stability.
- Small vapor pressure.
- Small volume changes.
- Little or no sub-cooling
during freezing.
-no segregation.
recovery from the storage
system.
- Complete reversible
freeze/melt cycle.
- No corrosiveness.
-non-flammable, Non-
toxic and non-explosive
materials for safety.
- Low
environmental
impact.
- Good
recyclability.
- Low embodied
energy.
- Facility of
separation from
other materials.
2.2. PCM classification
A considerable number of PCM is available in any desired temperature range. According to their
chemical composition, PCM can be categorized as organic compounds, inorganic compounds and
eutectic mixtures. Each group has its typical range of melting temperature and its range of melting
enthalpy. The paraffin waxes, salt hydrates, fatty acids and eutectic organic /non-organic compounds
are the most used since last 30 years. The relationship between the melting enthalpy (kJ/l) and the
temperature of PCM is shown in Figure 0-3. These characteristics are considered very important
especially for their application in building envelopes (i.e. PCM incorporated into finish materials,
thermal insulation or structural components) [12].
Figure 0-3: Relationship between PCM melting enthalpy and temperature for the different groups of PCM [15]
For a specific application, PCM for thermal energy storage in buildings do not meet all the above
stated requirements and performance properties. Each material has its own specific poor
characteristics, which can be enhanced by proposing different solutions. For example, using metallic
fins can increase the thermal conductivity of PCM, introducing a nucleating agent may suppress

Annexes
241
super-cooling and the use of suitable PCM thickness can prevent incongruent melting [7]. A
classification of PCM is given Figure 0-4.
Figure 0-4: PCM classification [19]
2.2.1. Organic materials
Organic phase change materials are paraffin and non-paraffin, the latter including fatty acids, ester,
alcohols, glycols, etc... They have some characteristics making them beneficial to latent heat storage
in buildings. Generally, organic PCM are available in large temperature range, they are chemically
stable, non-corrosive and non-toxic, they freeze with little or without super cooling, they present no
segregation, and they have a high latent heat of fusion and good nucleation rate. However, Most of
the organic PCM are not stable in higher temperatures due to covalent bonds [7] . Also, their density
is low (usually less than 103 kg/m3), which is below the density of inorganic materials such as water
and salt hydrates.
Paraffin are available in a large range of melting points from about 20C up to 70 C, however they
have a low thermal conductivity (about 0.2W/ (m.K)) limiting their applications[17]. During the
freezing cycle, when high heat transfer rates are desired, Paraffin present a problem. Moreover, they
have a large volume change during the phase change [20]. In addition, they are available from many
manufacturers, but they are expensive comparing to salt hydrates. Paraffin wax is the most used
commercial organic PCM.
Fatty acids that are generally presented by the chemical formula CH3 (CH2)2nCOOH, have similar
characteristics to paraffin and they are stable at cycling. The combination of different fatty acids to
get melting temperatures range of 20–30°C with a precision of ± 0.5 °C can be promising [7].

Annexes
242
2.2.2. Inorganic materials
Inorganic materials are salt hydrates and metallic. They have respectively good thermal conductivity
and high latent heat of fusion; they are not expensive and non-flammable. Their main drawback is
compatibility with metals, since in some combinations of PCM with metals corrosion can be
developed [7]. They require containment; hence, they are inadequate for impregnation into porous
building materials.
The most attractive and important TES materials are salt Hydrates, due to their relative high storage
density of about 240 kJ/kg, their small volume change during phase transition, and their relative high
thermal conductivity of about 0.5W/ (m.K). Salt hydrates have some disadvantages such as super-
cooling, segregation, and corrosion [7]. Concerning Metallic PCMs, they are not within the desired
temperature range for building applications.
2.2.3. Eutectics
Eutectics are a mixture of proportions of many solids, in order to get more desired properties mainly
a higher latent heat and a more specific melting point. They almost melt and solidify without
segregation, preventing the separation of components. Eutectics are divided into 3 groups according
to their consisting materials: organic–organic, inorganic–organic and inorganic–inorganic eutectics.
3. PCM for cooling applications
Recently, it has been noticed that the cooling demand of the building sector is increasing rapidly,
especially in developing countries, due to: 1) the high need of comfort of building occupants, 2) the
rise of the internal heat gains of buildings, 3) the impact of urban heat island felt in overcrowded
cities and 4) the reduced cost of cooling equipment [21][22][23]. Thus, Passive or efficient-energy
solutions for space cooling have received much attention.
In space cooling, the objective is to keep a space cold, more precisely to avoid the temperature
increasing above a certain level, which can be carried out in three ways: the reduction of heat input,
the reduction of temperature fluctuations, and the improvement of heat rejection [7].
To meet the cooling requirements, PCM can be installed into the building in passive or active systems.
Passive systems do not use active mechanical equipment and no additional energy is required i.e. the
heat is charged or discharged only due to temperature fluctuations when the air temperature rises or
falls beyond the PCM melting point and only natural ventilation provides cold from outside. Passive
applications are easily implemented and can be integrated into the building envelope (walls, roofs,
and floors).

Annexes
243
On the contrary, Active systems need the help of mechanical equipment to achieve the PCM thermal
energy charging or discharging. In this case PCM can be installed in storage units, in HVAC systems
or it can be used as heat-cold storage tank in solar cooling technique.
Different PCM cooling system classifications have been suggested in different studies [24] [25]. In
the current study the PCM cooling systems are divided into five categories: free cooling, solar
cooling, air conditioning systems, evaporative and radiative cooling and PCM in building envelope.
Active and passive cooling systems could be found together or each alone in these categories. Many
PCM used for cooling applications is listed in Table 0-2.
Table 0-2: PCM used for cooling applications
Name of PCM Melting point (C) Latent heat(KJ/Kg) Reference
Emerest 2325 (butyl stearate + butyl
palmitate 49/48) 17-21 138-140
[24]
Hexadecane 18 236 [26]
Heptadecane 18 214 [26]
KF, 4H2O 18.5 231 [24]
Butyl stearate 19 140 [29]
Paraffin C16–C18 20-22 152 [32]
Paraffin RT20 20-22 172 [34]
Paraffin FMC 20-23 130 [33]
Dimethyl sebacate 21 120-135 [32]
Eutectic E21 21 150 [34]
Capric-lauric 45/55 21 143 [27]
Salt hydrates Na2SO4,10H2O 21 198 [33]
ClimSel C 21 21 122 [34]
Octadecane 22 244 [26]
Capric-palmitate 75.2/24.8 22.1 153 [30]
Paraffin RT25 24 164 [33]
CaCl2·6H2O 24-29 192 [31]
45% Ca(NO3)2_6H2O + 55%
Zn(NO3)2_6H2O 25 130
[32]
66.6% CaCl2_6H2O + 33.3%
Mgcl2_6H2O 25 127
[32]
Mn(NO3)2,6H2O 25.8 125.9 [28]
Paraffin R27 26–28 179 [32]

Annexes
244
SP27 27 180 [33]
Eutectic E23 29 155 [34]
3.1. Free cooling
In free cooling technique, a separate storage unit is utilized in order to provide the cold into the room
whenever it is required by circulating room air through the storage unit. The difference between the
natural night ventilation and free cooling is that fans or other mechanical equipment (extra power)
are used to charge or discharge the heat from the storage unit which improves the cooling potential,
unlike the night ventilation where building envelope such as walls are used for thermal storage. The
effectiveness of PCM-based free cooling application depends on the diurnal temperature range that
should be between 12C and 15C [35]. If the air temperature swing between day and night is
relatively small, then other parameters should be accurately considered in the design of free cooling
system coupled with PCM i.e. selection of an appropriate PCM with suitable encapsulation [36].
The principle of a free cooling system with PCM, shown in Figure 0-5, consists of two operation
modes:
- Solidification of PCM: occurs at night when the ambient temperature is lower than the indoor
temperature. The outdoor cool air flows across the storage unit, by means of a fan, absorbing heat
from PCM, which leads to the beginning of solidification process, which lasts until the outdoor
temperature became nearly equal to the PCM solidification temperature.
- Melting of PCM: occurs during the day when the indoor temperature increases above the comfort
range. Hot air of the room passes through the storage unit and the heat is absorbed by the solid PCM
which leads to the beginning of melting process. Consequently, the room air temperature is reduced,
and the cooled air is delivered to the interior of the building.
Figure 0-5: Principal function of PCM ‘‘free cooling system’’[25]
Many Parameters affect the thermal performance of a free cooling system during charging and
discharging such as the air flow rate, the outlet air temperature and the inlet air temperature of the
storage unit, in addition to the thermo-physical properties and encapsulation thickness of PCM, which
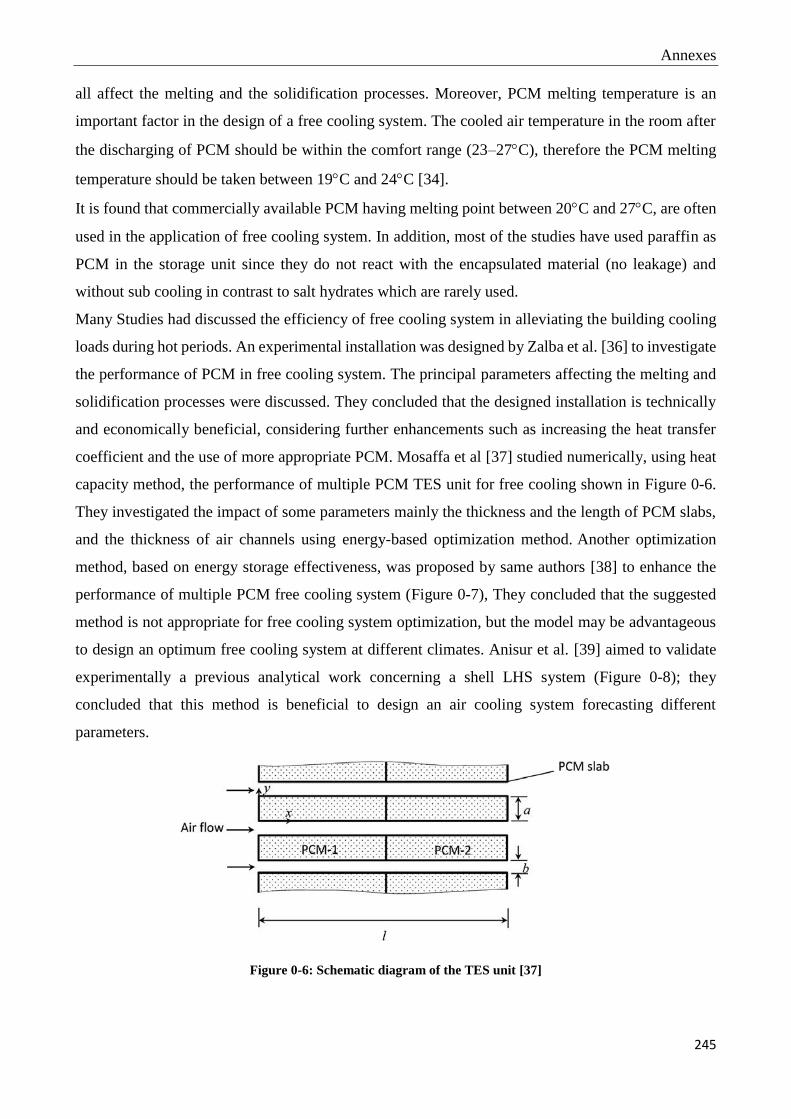
Annexes
245
all affect the melting and the solidification processes. Moreover, PCM melting temperature is an
important factor in the design of a free cooling system. The cooled air temperature in the room after
the discharging of PCM should be within the comfort range (23–27C), therefore the PCM melting
temperature should be taken between 19C and 24C [34].
It is found that commercially available PCM having melting point between 20C and 27C, are often
used in the application of free cooling system. In addition, most of the studies have used paraffin as
PCM in the storage unit since they do not react with the encapsulated material (no leakage) and
without sub cooling in contrast to salt hydrates which are rarely used.
Many Studies had discussed the efficiency of free cooling system in alleviating the building cooling
loads during hot periods. An experimental installation was designed by Zalba et al. [36] to investigate
the performance of PCM in free cooling system. The principal parameters affecting the melting and
solidification processes were discussed. They concluded that the designed installation is technically
and economically beneficial, considering further enhancements such as increasing the heat transfer
coefficient and the use of more appropriate PCM. Mosaffa et al [37] studied numerically, using heat
capacity method, the performance of multiple PCM TES unit for free cooling shown in Figure 0-6.
They investigated the impact of some parameters mainly the thickness and the length of PCM slabs,
and the thickness of air channels using energy-based optimization method. Another optimization
method, based on energy storage effectiveness, was proposed by same authors [38] to enhance the
performance of multiple PCM free cooling system (Figure 0-7), They concluded that the suggested
method is not appropriate for free cooling system optimization, but the model may be advantageous
to design an optimum free cooling system at different climates. Anisur et al. [39] aimed to validate
experimentally a previous analytical work concerning a shell LHS system (Figure 0-8); they
concluded that this method is beneficial to design an air cooling system forecasting different
parameters.
Figure 0-6: Schematic diagram of the TES unit [37]
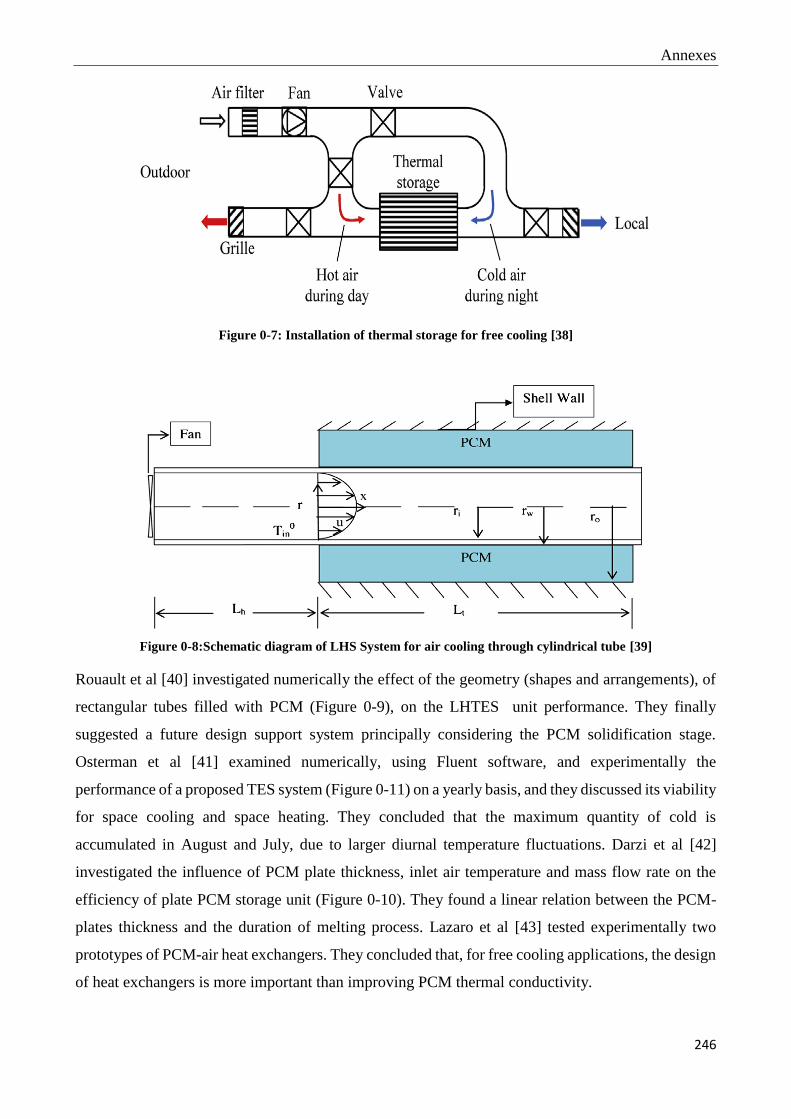
Annexes
246
Figure 0-7: Installation of thermal storage for free cooling [38]
Figure 0-8:Schematic diagram of LHS System for air cooling through cylindrical tube [39]
Rouault et al [40] investigated numerically the effect of the geometry (shapes and arrangements), of
rectangular tubes filled with PCM (Figure 0-9), on the LHTES unit performance. They finally
suggested a future design support system principally considering the PCM solidification stage.
Osterman et al [41] examined numerically, using Fluent software, and experimentally the
performance of a proposed TES system (Figure 0-11) on a yearly basis, and they discussed its viability
for space cooling and space heating. They concluded that the maximum quantity of cold is
accumulated in August and July, due to larger diurnal temperature fluctuations. Darzi et al [42]
investigated the influence of PCM plate thickness, inlet air temperature and mass flow rate on the
efficiency of plate PCM storage unit (Figure 0-10). They found a linear relation between the PCM-
plates thickness and the duration of melting process. Lazaro et al [43] tested experimentally two
prototypes of PCM-air heat exchangers. They concluded that, for free cooling applications, the design
of heat exchangers is more important than improving PCM thermal conductivity.

Annexes
247
Figure 0-11: Conceptual design of a storage unit [41]
Tan and Zhao [44] investigated the performance of PCM storage unit ( Figure 0-12) integrated in
thermoelectric system using a mathematical model, and then validated it experimentally. They also
recommended a guideline on the design of the combined system. They concluded that the selection
of TEM depends significantly on three factors namely the COP, cost and cooling power. Yanbing et
al. [45] investigated the performance of night Ventilation with PCM (NVP) storage system .They
found that the NVP system is efficient and can decrease the room energy consumption. Takeda et al
[46] investigated the potential of a PCM packed bed storage unit (positioned in the building
ventilation system) in decreasing the ventilation load for different Japanese climates. They found that
during discharging procedure, the outlet air temperature is always constant and in the range of phase
change temperature. The use of PCM storage unit can decrease the building ventilation load up to
62% in the different considered Japanese cities. Waqas and Kumar [47] investigated experimentally
the performance of free cooling system in hot and dry climate; the storage unit is shown in Figure
0-13. They found that a complete solidification of PCM can be achieved in short period when the air
Figure 0-9: An energy storage unit and its airline
connection [40]
Figure 0-10: Schematic diagram of heat exchanger with
plate-type PCM [42]

Annexes
248
flow rate is higher and the outdoor temperatures are lower at night. Moreover, the potential of free
cooling principle was also investigated using other different systems: two cylindrical LHTES filled
with PCM spheres [48] as shown in Figure 0-14, cold storage composed of a metal box [49] built in
a ceiling board, with aluminum fins in order to increase its thermal power, heat pipes embedded in
PCM [50], PCM packed bed storage [51] integrated under the floor as shown in Figure 0-15 and a
bulk PCM tank with a finned-pipe heat exchanger [52] (TRNSYS component type 842) as shown in
Figure 0-16. The free cooling system applications are summarized in Table 0-3.
Figure 0-12: Schematic diagram and cross-section of the PCM heat storage unit [44]
Figure 0-13: The experimental PCM storage unit [47]
Figure 0-14: cylindrical LHES filled with PCM spheres [48]

Annexes
249
Figure 0-15: Concept of the PCM system packed bed storage integrated under the floor [51]
Figure 0-16: Heat exchanger considered in TRNSYS [52]
Table 0-3: PCM in active free cooling system applications
Ref/Type* Location/
climate
Used PCM
properties
Heat
exchanger Results
[36]
E
Laboratory
experiment-
Spain
-encapsulated PCM
RT25
-Tm=25C
- m total PCM = 3 kg
flat plate heat
exchanger
Main parameters affecting solidification and
melting processes:
- Thickness of PCM encapsulation,
-air flow,
- inlet air temperature
--interaction between temperature and
thickness
[37]
E,S Tabriz, Iran
-CaCl2_6H2O,
Tm=29C
-Paraffin C18,
Tm=27.5C
-RT25, Tm=26.6C
Parallel
rectangular air
channels
separated by
PCM slabs
COP=7 realized by:
-combination of RT25& CaCl2_6H2O
- air channel thickness= 3.2 mm
- PCM slab length= 1.3 m and thickness= 10
mm
[38]
E,S
Eindhoven,
south of
Netherlands
-Climsel C24,
Tm=24C
-KF4H2O,
Tm=18.5C
Layers of flat
PCM slabs
with HTF
channels in
between
- COP= 7.63 & Qcool=4.38 kW
- Air channel thickness=3.2 mm, length=1.3
mm, slab thickness= 9 mm.& maximum flow
rate 1200 m3/h Toutlet < 20 C for 8 h &
power consumption =4.6 kWh
-Air flow rate<700 m3/h optimum E*=
0.66 COP<5.76 & Qcool=2.96KW
-Air channel thickness ↘↘ E*= 0.54
COP=6.22 & power consumption=5.8 kWh.
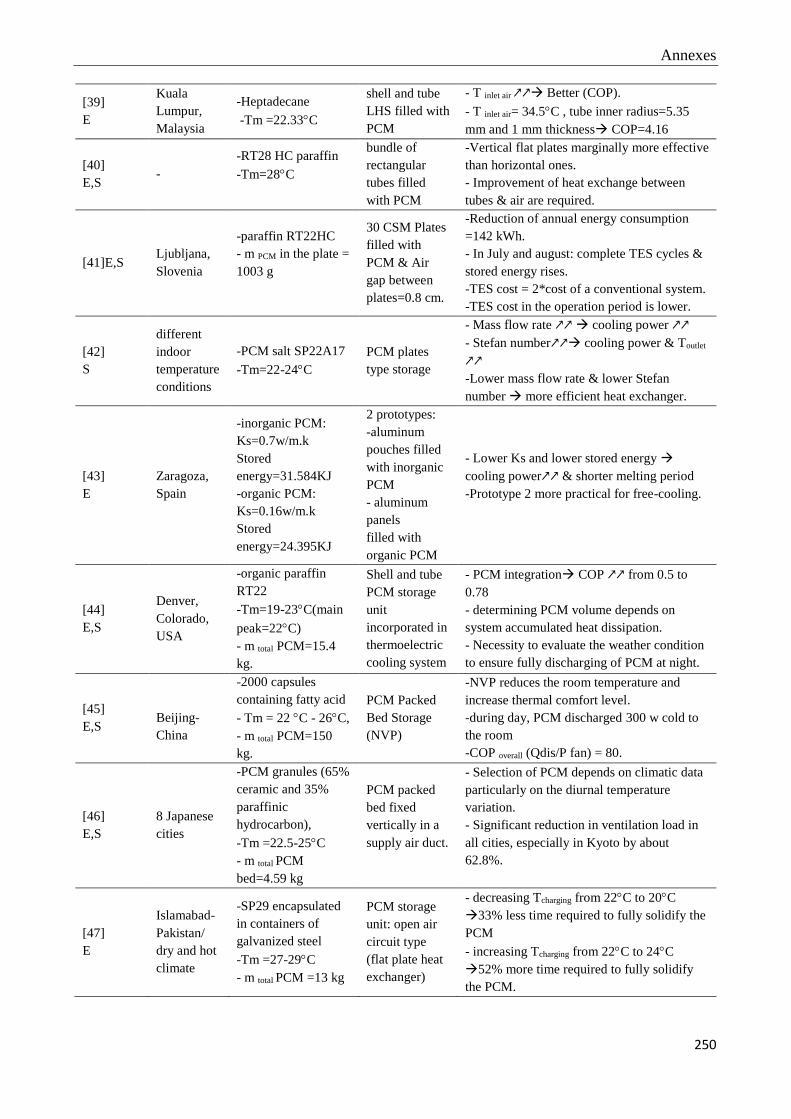
Annexes
250
[39]
E
Kuala
Lumpur,
Malaysia
-Heptadecane
-Tm =22.33C
shell and tube
LHS filled with
PCM
- T inlet air ↗↗ Better (COP).
- T inlet air= 34.5C , tube inner radius=5.35
mm and 1 mm thickness COP=4.16
[40]
E,S -
-RT28 HC paraffin
-Tm=28C
bundle of
rectangular
tubes filled
with PCM
-Vertical flat plates marginally more effective
than horizontal ones.
- Improvement of heat exchange between
tubes & air are required.
[41]E,S Ljubljana,
Slovenia
-paraffin RT22HC
- m PCM in the plate =
1003 g
30 CSM Plates
filled with
PCM & Air
gap between
plates=0.8 cm.
-Reduction of annual energy consumption
=142 kWh.
- In July and august: complete TES cycles &
stored energy rises.
-TES cost = 2*cost of a conventional system.
-TES cost in the operation period is lower.
[42]
S
different
indoor
temperature
conditions
-PCM salt SP22A17
-Tm=22-24C
PCM plates
type storage
- Mass flow rate ↗↗ cooling power ↗↗
- Stefan number↗↗ cooling power & Toutlet
↗↗
-Lower mass flow rate & lower Stefan
number more efficient heat exchanger.
[43]
E
Zaragoza,
Spain
-inorganic PCM:
Ks=0.7w/m.k
Stored
energy=31.584KJ
-organic PCM:
Ks=0.16w/m.k
Stored
energy=24.395KJ
2 prototypes:
-aluminum
pouches filled
with inorganic
PCM
- aluminum
panels
filled with
organic PCM
- Lower Ks and lower stored energy
cooling power↗↗ & shorter melting period
-Prototype 2 more practical for free-cooling.
[44]
E,S
Denver,
Colorado,
USA
-organic paraffin
RT22
-Tm=19-23C(main
peak=22C)
- m total PCM=15.4
kg.
Shell and tube
PCM storage
unit
incorporated in
thermoelectric
cooling system
- PCM integration COP ↗↗ from 0.5 to
0.78
- determining PCM volume depends on
system accumulated heat dissipation.
- Necessity to evaluate the weather condition
to ensure fully discharging of PCM at night.
[45]
E,S
Beijing-
China
-2000 capsules
containing fatty acid
- Tm = 22 C - 26C,
- m total PCM=150
kg.
PCM Packed
Bed Storage
(NVP)
-NVP reduces the room temperature and
increase thermal comfort level.
-during day, PCM discharged 300 w cold to
the room
-COP overall (Qdis/P fan) = 80.
[46]
E,S
8 Japanese
cities
-PCM granules (65%
ceramic and 35%
paraffinic
hydrocarbon),
-Tm =22.5-25C
- m total PCM
bed=4.59 kg
PCM packed
bed fixed
vertically in a
supply air duct.
- Selection of PCM depends on climatic data
particularly on the diurnal temperature
variation.
- Significant reduction in ventilation load in
all cities, especially in Kyoto by about
62.8%.
[47]
E
Islamabad-
Pakistan/
dry and hot
climate
-SP29 encapsulated
in containers of
galvanized steel
-Tm =27-29C
- m total PCM =13 kg
PCM storage
unit: open air
circuit type
(flat plate heat
exchanger)
- decreasing Tcharging from 22C to 20C
33% less time required to fully solidify the
PCM
- increasing Tcharging from 22C to 24C
52% more time required to fully solidify
the PCM.

Annexes
251
- Increasing air flow rate from 4 m3/hr to 5
m3/hr 16% reduction of solidification time
period.
-Tm of PCM affects the storage unit
performance more than the air flow rates.
[48]
E,S
Ljubljana-
Slovenia/
latitude
=46C
- RT20 paraffin
-Tm=20 C
2 cylindrical
LHTES units
filled with
PCM spheres,
integrated into
MVS
- Optimum PCM mass in both LHTES units:
6.75 kg/m2 (heavyweight bldg.) and 13.5
kg/m2 (lightweight bldg.)
- mechanical ventilation size is reduced
-more favorable temperatures are provided.
[49]
E
Lab scale
experiment
Ljubljana-
Slovenia
- RT 20 paraffin
-Tm = 22 C
- m total PCM =3.6 kg
metal box with
external and
internal fins
filled with
PCM
- Toutlet air (when airflow =1.5 m s-1) < Toutlet air
(when airflow = 2.4 m s-1).
-proper selection of PCM type depends on
local climate conditions.
- Inlet air temperature=26C and airflow=1.5
m s-1 greater air cooling time by the buffer
compared to other regimes
[50]
E,S
Typical UK
summer
conditions
-Salt hydrate
(Na2SO4 ,10H2O)
-Tm =21 C.
heat pipes
embedded in
PCM storage
unit
- T = Tm – Tcharging ↗↗ Better
solidification:
- higher air flow rates ( full solidification
-free cooling prevents overheating in
summer, and reduces CO2 emissions.
- T between air and PCM 15C PCM
melting and solidification in practical time
(7±10h).
- Heat transfer <40 W when temperature
difference is 5C (more reasonable) and flow
rates 0.18 m3/s.
[51]
E,S Japan
PCM granules with
diameter of some
micrometers
containing paraffin.
PCM packed
bed storage
Each night, 89% of daily Qcool is stored
using 30 mm thick packed bed of granular
PCM.
[52]
S
Stockholm/
Swedish
climate
excessive
overheating
in summer
-Commercially
available salt based
PCM
-Tm 17 C (close to
the average summer
temperature in
Stockholm)
bulk PCM
tank with a
finned-pipe in
an aluminum
based heat
exchanger
-Active free cooling keep the room
temperature within indoor comfort range.
- 75% of the cooling demands are met at half
of electricity consumption.
-free cooling is an economically and
environmentally proper solution for a passive
building.
*(E: experimental, S: simulation)
It could be noticed that the main component in the free cooling system is the PCM storage unit;
moreover, suitable PCM with appropriate melting temperature should be carefully selected. PCM free
cooling system technology is not yet commercialized and its initial cost is higher by about 10% than
a traditional air-conditioner; keeping this cost competitive with other traditional cooling technologies
requires more PCM commercialization [33]. However, it was shown that PCM solidification during
the limited period at night is slow due to the low thermal conductivity of PCM; heat transfer
improvements are needed. It is also found that free cooling systems are investigated numerically in

Annexes
252
many studies, and barely any free cooling system was applied in experimental real case for building
[25]. Also, the majority of studies investigated the PCM free cooling performance in summer
conditions in European climates, however there is a need to evaluate the potential of PCM free cooling
system for the desert climate with high diurnal temperature ranges [25].
3.2. Solar cooling systems with PCM
Solar cooling systems including adsorption and absorption cooling have been examined in the last
few years, and it can be considered as alternatives to traditional air conditioning systems. Moreover,
solar powered absorption cooling system can realize summer comfort conditions in buildings at low
primary energy consumption. Solar cooling systems can reduce the cooling needs in buildings under
hot climate [53]; they can also decrease the peak demand for electricity and consequently reduce the
environmental pollution.
The use of PCM with solar absorption cooling, help significantly to meet cooling demand when the
solar energy is not available.
Helm et al. [54] examined a solar-driven absorption cooling system coupled with PCM and a dry air
cooler instead of a traditional wet cooling tower as shown in Figure 0-17. They concluded that by
integrating PCM in heat rejection circuit of the chiller, a quantity of required power could be shifted
to the off-peak hours with minor rise in total electric consumption of the absorption cooling system.
A novel concept for a solar cooling system including dry cooler with PCM had been investigated [55]
in order to improve the system efficiency. The operating costs and maintenance for the new developed
system are lower, compared to the wet cooling tower. On hot days, PCM support the dry cooler to
assure a low cooling water return temperature to the absorption chiller. At the University of Lleida,
Gil et al.[56][57][58] developed a TES system for solar cooling application shown in Figure 0-18
(pilot plant at the laboratory), in order to be used later in real installation for cooling purposes on the
roof of a building in Seville [58]. The storage tank implemented in real solar cooling installation is
shown in Figure 0-19. In the experiment, a dry cooler was used to remove heat instead of the
absorption chiller and an electrical boiler was used to provide heat instead of the solar collector. They
also tested two PCM storage tanks (shell-and-tubes heat exchanger) one with fins and the other
without fins [57]. They concluded that in the design of a real PCM storage tank, the dead PCM
volumes must be avoided.
Belmonte et al [59] investigated the performance and the feasibility of an alternative solar cooling
system where the open wet tower is replaced by a dry cooler combined with PCM TES system (Figure
0-20). Then, conventional and alternative configurations were simulated and compared for different
climate conditions. They concluded that the conventional system is more efficient, at all locations, in
terms of chiller’s COP and produced cooling energy, but in terms of overall system COP, the system

Annexes
253
efficiency is improved by 50% in the alternative configuration. Furthermore, Agyenim et al. [60]
designed a tube heat exchanger with PCM in order to improve the COP of LiBr/H2O absorption
cooling system. It has been found that the chosen PCM was appropriate to improve the COP of the
solar cooling system. The solar cooling systems combined with PCM applications are summarized in
Table 0-4.
Figure 0-17: solar heating and cooling system with absorption chiller and latent heat storage in cooling mode
[54]
Figure 0-18: Location of PCM storage tank in the solar cooling application [58]
Figure 0-19: Storage tank implemented in a real solar cooling installation at the University of Sevilla (Spain) [58]

Annexes
254
Figure 0-20: solar cooling system with dry coolers and a TES PCM [59]
Table 0-4: PCM combined with Solar cooling system applications
Ref/
Type*
Location/
climate
Used PCM
properties PCM-solar system Results
[54]
E
Munich,
Germany
-calcium chloride
hexahydrate
(CaCl2,6H2O)
-Tm= 27–29C
-PCM & dry air
cooler in solar-
driven absorption
system
-PCM support heat
rejection of
absorption chiller
-PCM instead of conventional
WHSVolumetric storage density 10 times
higher.
-Reduction of over-sizing of the solar
collector
[55]E,
S
8 European
climatic
conditions
-Calcium chloride
hexahydrate
-Tm=29C
-PCM with dry re-
cooled sorption
chiller -LHS
module with inner
heat exchanger
containing 1 m³ of
PCM
-In situ measurementpositive effect on
SEER for cooling by 11.4.
- Simulation efficiency ↗↗ up to 64%
compared to system with only dry re-
cooling (without PCM)
[58]
E
Lleida &
Seville,
Spain
- PCM :
Hydroquinone
-Tm= 166 C-173C
PCM storage tank
with absorption
chiller and Fresnel
collectors
-Tank with finsshorter
melting/solidification time, PCM
conductivity↗↗, heat transfer rates↗↗,
energy stored faster
- fins money &time investment↗↗, PCM
quantity& stored energy ↘↘ rejection of
using fins in real applications.
[59]
S
52 provinces
of
Spain
- hydrated salts.
-Tm=30C
PCM in the heat
rejection loops of
absorption chillers
Alternative system with PCM TES:
-In temperate & humid summers COPsys
improved by one unit.
- Reduction of total cooling energy in
evaporator (21–38%)
-worsening of mean performance coefficient
of chiller (between 7&13%).
[60]
E
Cardiff,
Wales.
-Erythritol
-Tm=117.7°C
PCM at the hot side
of absorption
chiller with solar
collector
Erythritol suitable for the application,
provide 4.4 hours of cooling at peak load
*(E: experimental, S: simulation)

Annexes
255
3.3. PCM-air conditioning systems
Air conditioning systems control several changes such as weather conditions, residential, commercial
and industrial activities. Thus, during the day, the electrical consumption varies considerably and
reaches peak values. Integrating PCM in AC system could significantly reduce the cooling load,
where AC with smaller power size could be used. Fang et al. [61] tested the performance of an AC
system incorporated with PCM spherical capsules packed bed. They investigated different parameters
mainly the cool storage rate and capacity, the condensation and the evaporation pressures of the
refrigeration system, the COP of the system, the inlet and outlet coolant temperatures during charging
and discharging periods and others. They concluded that the AC system incorporated with PCM
showed better performances. Figure 0-21 shows their investigated experimental system. Chaiyat [62]
installed a PCM bed in the return duct of an AC system (Figure 0-22) in order to reduce the air
temperature that enters the evaporating coil and thus improving the cooling efficiency of the AC.
A tube-in-tank off-peak PCM storage system shown in
Figure 0-23 , incorporated in a domestic chiller, was modelled and simulated by Bruno et al [63] using
ε-NTU technique (effectiveness-number of transfer units) to determine the instantaneous heat
transfer. Zhao and Tan [64] aimed to increase the cooling COP of a conventional AC by integrating
a shell-and-tube PCM thermal storage unit that uses water (for charging loop) and air (for discharging
loop) as a HTF. Figure 0-24 shows the AC integrated with PCM and a cross-section of PCM thermal
storage unit. They investigated the impact of HTF mass flow rate, inlet temperature and fin height on
PCM system performance. Results showed that optimization should be carried out, depending on the
cooling load profile, in order to design HTF mass flow rate and fin height. The air-conditioning
systems combined with PCM applications are summarized in Table 0-5.
Figure 0-21: Schematic diagram of the AC experimental system with PCM [61]
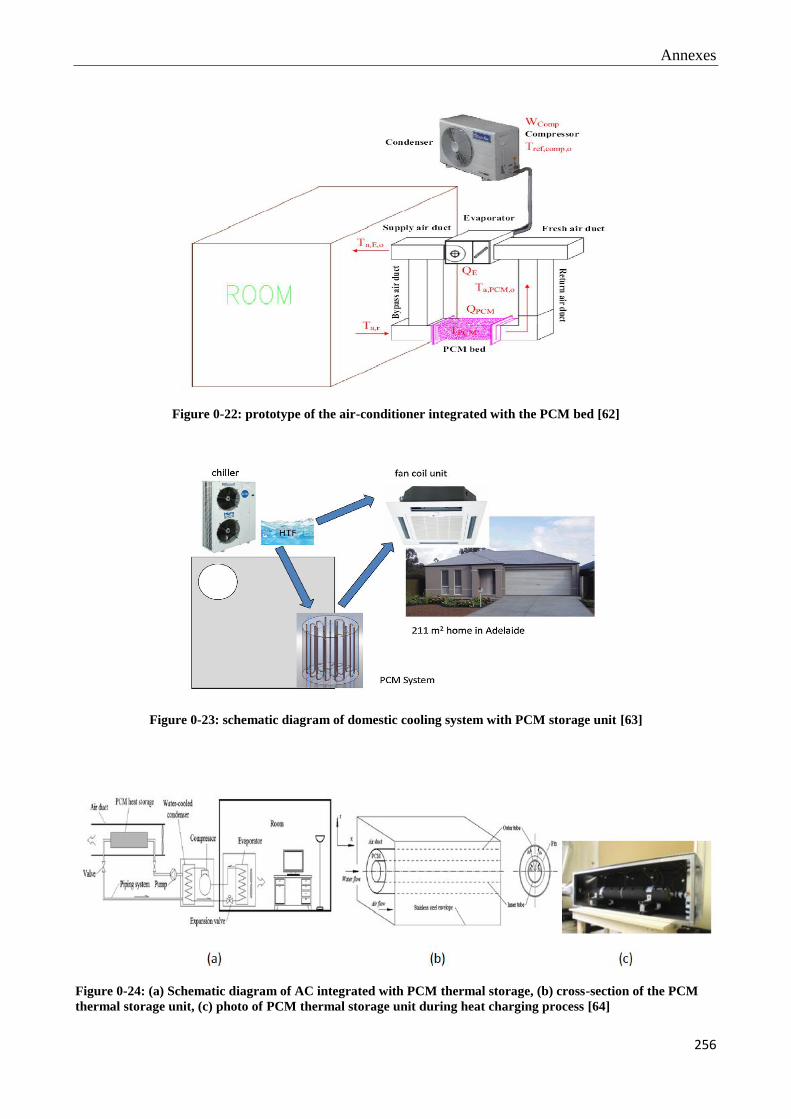
Annexes
256
Figure 0-22: prototype of the air-conditioner integrated with the PCM bed [62]
Figure 0-23: schematic diagram of domestic cooling system with PCM storage unit [63]
Figure 0-24: (a) Schematic diagram of AC integrated with PCM thermal storage, (b) cross-section of the PCM
thermal storage unit, (c) photo of PCM thermal storage unit during heat charging process [64]
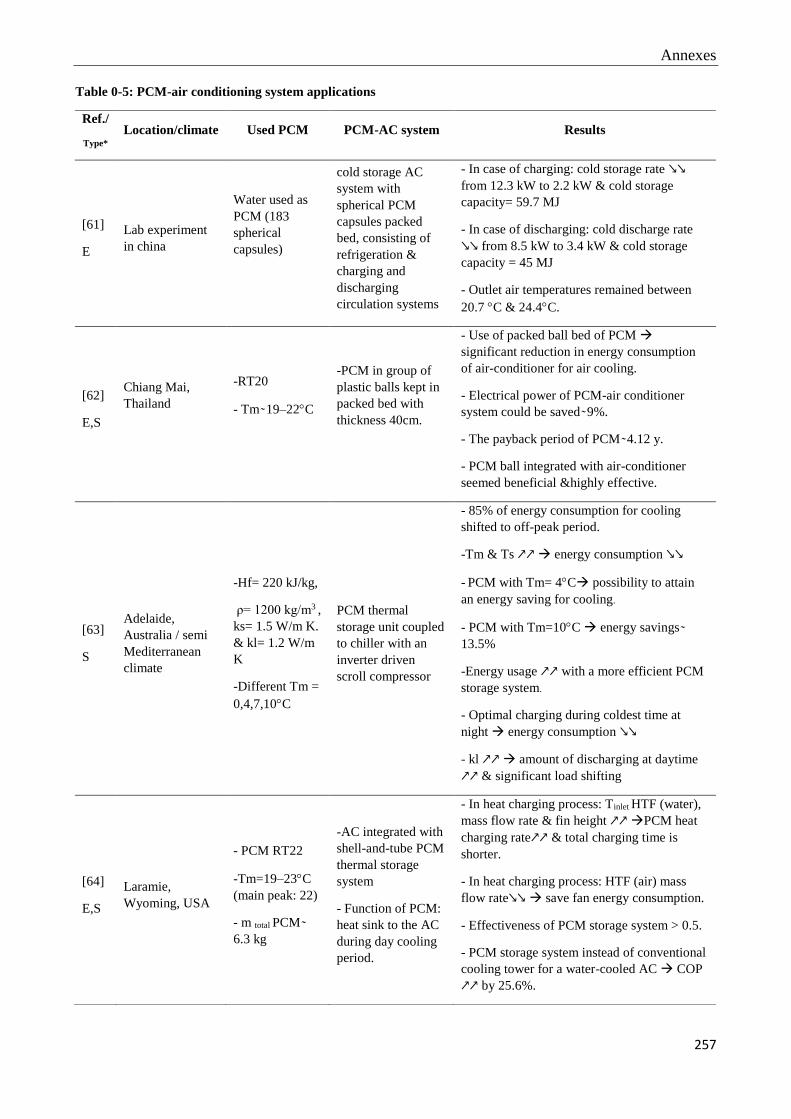
Annexes
257
Table 0-5: PCM-air conditioning system applications
Ref./
Type* Location/climate Used PCM PCM-AC system Results
[61]
E
Lab experiment
in china
Water used as
PCM (183
spherical
capsules)
cold storage AC
system with
spherical PCM
capsules packed
bed, consisting of
refrigeration &
charging and
discharging
circulation systems
- In case of charging: cold storage rate ↘↘
from 12.3 kW to 2.2 kW & cold storage
capacity= 59.7 MJ
- In case of discharging: cold discharge rate
↘↘ from 8.5 kW to 3.4 kW & cold storage
capacity = 45 MJ
- Outlet air temperatures remained between
20.7 C & 24.4C.
[62]
E,S
Chiang Mai,
Thailand
-RT20
- Tm 19–22C
-PCM in group of
plastic balls kept in
packed bed with
thickness 40cm.
- Use of packed ball bed of PCM
significant reduction in energy consumption
of air-conditioner for air cooling.
- Electrical power of PCM-air conditioner
system could be saved 9%.
- The payback period of PCM 4.12 y.
- PCM ball integrated with air-conditioner
seemed beneficial &highly effective.
[63]
S
Adelaide,
Australia / semi
Mediterranean
climate
-Hf= 220 kJ/kg,
ρ= 1200 kg/m3 ,
ks= 1.5 W/m K.
& kl= 1.2 W/m
K
-Different Tm =
0,4,7,10C
PCM thermal
storage unit coupled
to chiller with an
inverter driven
scroll compressor
- 85% of energy consumption for cooling
shifted to off-peak period.
-Tm & Ts ↗↗ energy consumption ↘↘
- PCM with Tm= 4C possibility to attain
an energy saving for cooling.
- PCM with Tm=10C energy savings
13.5%
-Energy usage ↗↗ with a more efficient PCM
storage system.
- Optimal charging during coldest time at
night energy consumption ↘↘
- kl ↗↗ amount of discharging at daytime
↗↗ & significant load shifting
[64]
E,S
Laramie,
Wyoming, USA
- PCM RT22
-Tm=19–23C
(main peak: 22)
- m total PCM
6.3 kg
-AC integrated with
shell-and-tube PCM
thermal storage
system
- Function of PCM:
heat sink to the AC
during day cooling
period.
- In heat charging process: Tinlet HTF (water),
mass flow rate & fin height ↗↗ PCM heat
charging rate↗↗ & total charging time is
shorter.
- In heat charging process: HTF (air) mass
flow rate↘↘ save fan energy consumption.
- Effectiveness of PCM storage system > 0.5.
- PCM storage system instead of conventional
cooling tower for a water-cooled AC COP
↗↗ by 25.6%.
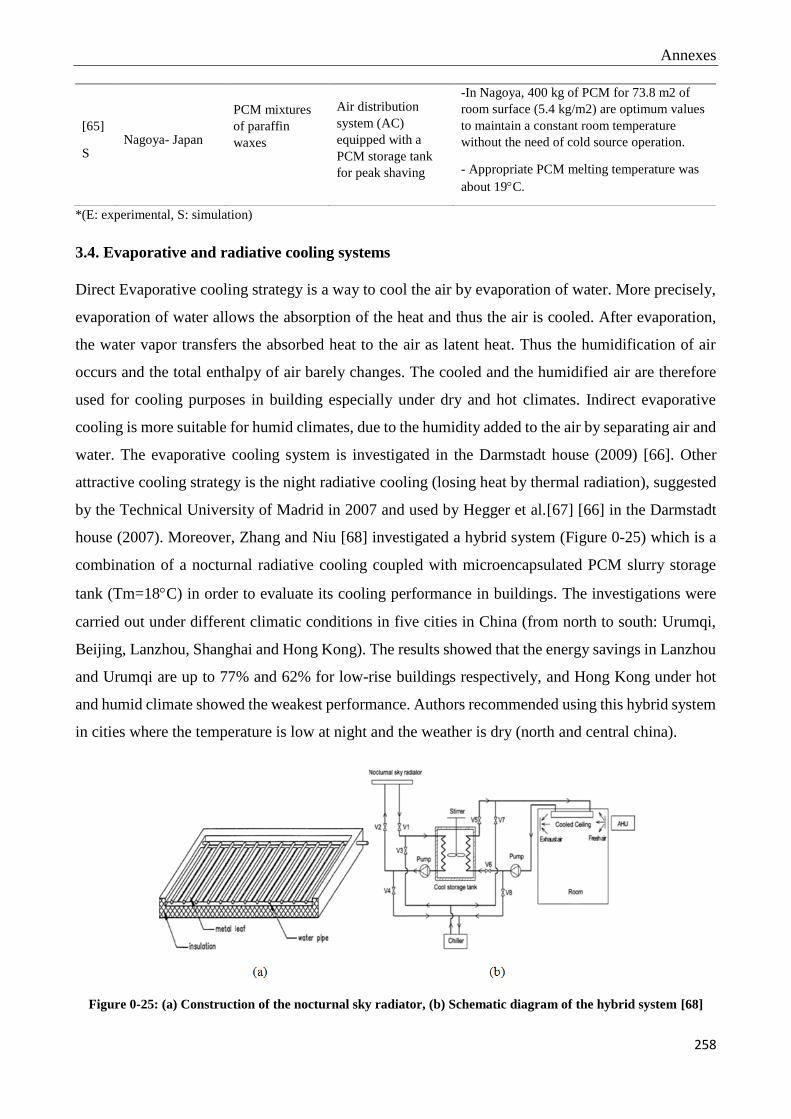
Annexes
258
*(E: experimental, S: simulation)
3.4. Evaporative and radiative cooling systems
Direct Evaporative cooling strategy is a way to cool the air by evaporation of water. More precisely,
evaporation of water allows the absorption of the heat and thus the air is cooled. After evaporation,
the water vapor transfers the absorbed heat to the air as latent heat. Thus the humidification of air
occurs and the total enthalpy of air barely changes. The cooled and the humidified air are therefore
used for cooling purposes in building especially under dry and hot climates. Indirect evaporative
cooling is more suitable for humid climates, due to the humidity added to the air by separating air and
water. The evaporative cooling system is investigated in the Darmstadt house (2009) [66]. Other
attractive cooling strategy is the night radiative cooling (losing heat by thermal radiation), suggested
by the Technical University of Madrid in 2007 and used by Hegger et al.[67] [66] in the Darmstadt
house (2007). Moreover, Zhang and Niu [68] investigated a hybrid system (Figure 0-25) which is a
combination of a nocturnal radiative cooling coupled with microencapsulated PCM slurry storage
tank (Tm=18C) in order to evaluate its cooling performance in buildings. The investigations were
carried out under different climatic conditions in five cities in China (from north to south: Urumqi,
Beijing, Lanzhou, Shanghai and Hong Kong). The results showed that the energy savings in Lanzhou
and Urumqi are up to 77% and 62% for low-rise buildings respectively, and Hong Kong under hot
and humid climate showed the weakest performance. Authors recommended using this hybrid system
in cities where the temperature is low at night and the weather is dry (north and central china).
Figure 0-25: (a) Construction of the nocturnal sky radiator, (b) Schematic diagram of the hybrid system [68]
[65]
S Nagoya- Japan
PCM mixtures
of paraffin
waxes
Air distribution
system (AC)
equipped with a
PCM storage tank
for peak shaving
-In Nagoya, 400 kg of PCM for 73.8 m2 of
room surface (5.4 kg/m2) are optimum values
to maintain a constant room temperature
without the need of cold source operation.
- Appropriate PCM melting temperature was
about 19C.
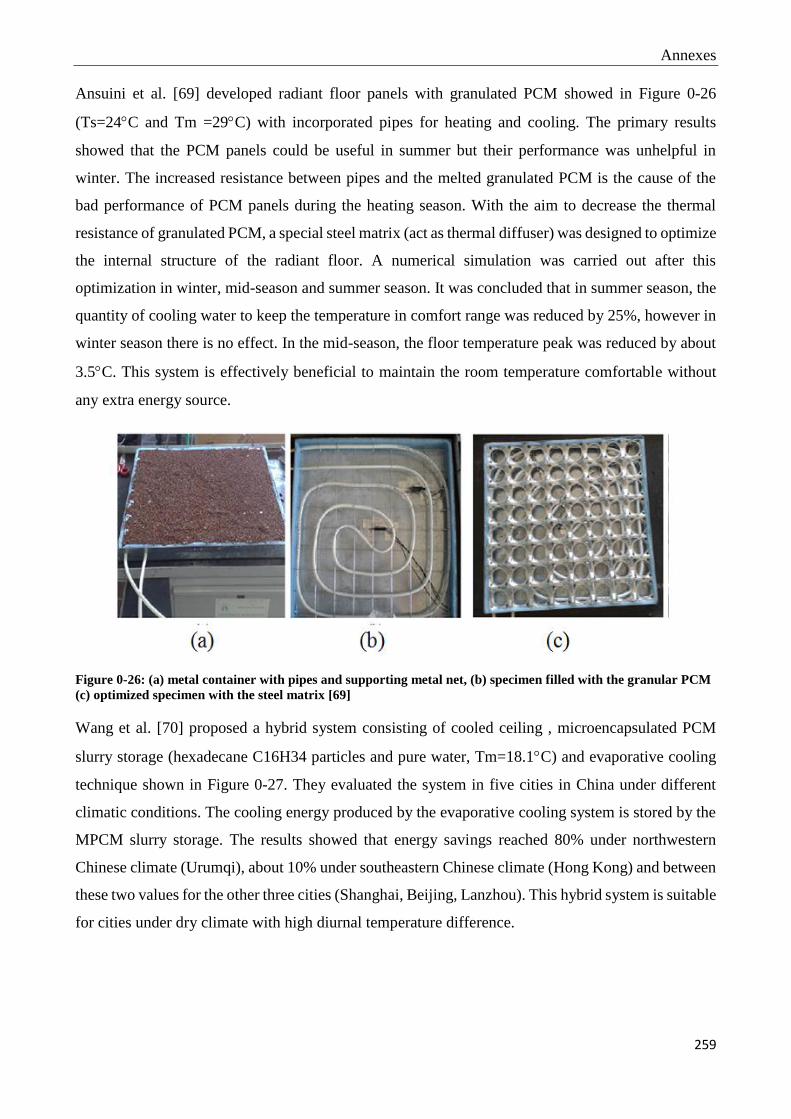
Annexes
259
Ansuini et al. [69] developed radiant floor panels with granulated PCM showed in Figure 0-26
(Ts=24C and Tm =29C) with incorporated pipes for heating and cooling. The primary results
showed that the PCM panels could be useful in summer but their performance was unhelpful in
winter. The increased resistance between pipes and the melted granulated PCM is the cause of the
bad performance of PCM panels during the heating season. With the aim to decrease the thermal
resistance of granulated PCM, a special steel matrix (act as thermal diffuser) was designed to optimize
the internal structure of the radiant floor. A numerical simulation was carried out after this
optimization in winter, mid-season and summer season. It was concluded that in summer season, the
quantity of cooling water to keep the temperature in comfort range was reduced by 25%, however in
winter season there is no effect. In the mid-season, the floor temperature peak was reduced by about
3.5C. This system is effectively beneficial to maintain the room temperature comfortable without
any extra energy source.
Figure 0-26: (a) metal container with pipes and supporting metal net, (b) specimen filled with the granular PCM
(c) optimized specimen with the steel matrix [69]
Wang et al. [70] proposed a hybrid system consisting of cooled ceiling , microencapsulated PCM
slurry storage (hexadecane C16H34 particles and pure water, Tm=18.1C) and evaporative cooling
technique shown in Figure 0-27. They evaluated the system in five cities in China under different
climatic conditions. The cooling energy produced by the evaporative cooling system is stored by the
MPCM slurry storage. The results showed that energy savings reached 80% under northwestern
Chinese climate (Urumqi), about 10% under southeastern Chinese climate (Hong Kong) and between
these two values for the other three cities (Shanghai, Beijing, Lanzhou). This hybrid system is suitable
for cities under dry climate with high diurnal temperature difference.

Annexes
260
Figure 0-27: Schematic diagram of the hybrid system [70]
3.5. PCM in building envelope
The previous sections presented PCM used as separate storage unit installed with other mechanical
equipment which were considered mostly as active systems. The installation of such systems needs a
specific place in the building, which is considered an important disadvantage for the designers and
users. As a solution for this drawback, PCM can be integrated into building envelopes i.e. walls,
roofs, and floors as part of building structure or as building component and can be installed whether
in passive or active system. The PCM integration into the building envelopes has attracted a great
interest in the last 10 years.
3.5.1. PCM passive system applications in the building envelope
Some authors [7][66] classified passive system applications in the building envelope into two main
categories:
- PCM “integrated” into building materials: when they are incorporated to a building construction
material such as plaster with microencapsulated paraffin, gypsum plasterboards with
microencapsulated paraffin, concrete with microencapsulated paraffin, panels with shape-stabilized
paraffin [7], and blending PCM with thermal insulations. The main benefit of PCM-enhanced
insulation is their capability to reduce and shift significantly the peak hour thermal loads of the
building envelopes [12]. The team of Germany (2009), in a group work [67], have used
microencapsulated PCM integrated into drywall panels as the interior finishing of a German house
for cooling periods. These panels contain Micronal microscopic polymer spheres filled with paraffin
wax developed by BASF Company. The selected PCM (Tm=26C) starts to absorb heat when the

Annexes
261
room temperature rises above PCM melting temperature, reducing overheating, where excess heat is
stored in the walls. At night the heat is discharged, since the air temperature drops below the PCM
switch temperature thanks to night ventilation. As a result, a more regular space temperature is
provided, since temperature peaks are cut off, and thus the need of a mechanical conditioning system
is minimized [66].
- PCM as “component”: The main difference between building components equipped with PCM and
PCM integrated into building materials is that a component can be manufactured before the building
being constructed and have a particular design. Blinds with integrated PCM are considered as an
example for PCM component. In fact, solar gains through windows are considered one of the major
sources of heat input into a building. Thus, to avoid direct solar radiation, blinds equipped with PCM
(Figure 0-28) can be used, it can be fixed inside the building or outside in front of the window.
Integration of PCM into the internal blinds can reduce and delay the temperature rise of the blinds,
and then the heat release into the room is delayed. The notion of internal blinds with integrated PCM
is shown in Figure 0-29. The company ZAE Bayern and Warema (project “Innovative PCM-
technology”) [7], have tested a room under realistic conditions to investigate the reduction and the
delay of the temperature rise of the blinds by integrating PCM. Compared to the conventional blinds,
the room air temperature was around 2 K less; the temperature-rise of the blinds decreased
approximately 10 K, and was delayed by about 3 hours. The numerical simulation showed that the
operative temperature of the room decreased approximately 3 K and the thermal comfort in the room
improved largely.
Figure 0-28: Internal blinds with integrated PCM [7]

Annexes
262
Figure 0-29: Internal blinds absorb solar radiation in order to cool the space by reducing the solar heat input [7]
Suspended ceilings with PCM are considered as an example for PCM component; salt hydrates are
used and are encapsulated in plastic containers, in bags or in metal containers. The company Dörken
sells a full range of PCM under the brand name DELTA®COOL system and it can be installed in
ceilings or floors [7]. A system was designed by Ontario team [66] using the commercial PCM
product DELTA-COOL 24 shown in Figure 0-30 which consists of salt hydrates encapsulated in 15
mm polypropylene panels with a melting temperature of 24 C, and a solidification temperature of
22C. A gross area of 62.1 m2 of PCM panels was installed; each panel had a heat storage capacity of
62.6 kWh, with a melt enthalpy of 158 kJ/ kg. The team used “DRSS” concept to develop a house
envelope, where exterior shades are one of the basic components that respond to the change of
external conditions. The shades change their angles between perpendicular and parallel to the sun’s
rays as required, keeping the indoor temperature comfort. During the day, when cool is needed, the
shades eliminate undesirable solar gains by preventing the solar radiation to reach the glazing, PCM
remove the excess heat and then reduce the cooling peak. During the night, the PCM release the stored
heat into the cool night air due to the activation of an air force night ventilation system.

Annexes
263
Figure 0-30: Delta Cool 24, upper face of PCM panel [7]
Moreover, Kalnæs et al. [71] presented many examples of integration of phase change materials for
passive systems, exploring possible areas and materials where PCM can be usefully incorporated.
And they divided these examples to five different categories according to the location of integration
of PCM: in walls, floors, roofs, windows/shutters, concrete, thermal insulation materials and
furniture. Moreover, Pomianowski et al. [72] presented various construction materials of the building
(gypsum and wallboards, concrete, bricks) which were blended or combined with PCM in passive
systems. Zhue et al. [73] presented an extensive list of PCM passive systems investigated
experimentally with important results. Different possibilities of the use of PCM and their application
in the American Solar Decathlon, including the descriptions of the systems and the factors that affect
their performance, as well as results of simulations and experimentation were presented by Ubinas et
al.[66]. Soares et al [74] also explored PCM application in passive systems, and investigated the effect
of these systems on the energy performance of buildings. Some examples of passive system
applications are presented in the following, according to the location of PCM integration:
- PCM in wall/wallboard: Installation of PCM wallboards in the inner side of the building envelope
is the most general and suitable solution for implementing PCM into buildings. Figure 0-31 shows
PCM gypsum board. During the last years, many studies (numerical/simulation, experimental or both)
investigated a large variety of this type of materials. Scalat et al. [75] believed that the human comfort
can be maintained for longer periods using PCM wallboard, after the heating or cooling system was
stopped. Kuznik et al. [76] investigated a renovation project in the south of Lyon-France using PCM
wallboards. By testing a room in the same building that was renovated without PCM and then
comparing it to the room with PCM, they concluded that the PCM increased the indoor thermal
comfort, but it appeared unable to use its latent heat storage capacity for a number of durations due
to the incomplete discharge overnight. Athienitis et al. [77] investigated the thermal performance of
PCM gypsum board in a direct-gain outdoor test room. The results showed a reduction of the room
temperature by a maximum 4C during the daytime. Neeper [78] investigated the thermal dynamics

Annexes
264
of room with fatty acid and paraffin waxes gypsum wallboard. The results showed that the maximum
diurnal energy storage is occurred when the melting temperature of PCM was chosen close to the
average room temperature.
Figure 0-31: PCM enhanced gypsum board [12]
-PCM in floors, roofs and ceilings: Incorporation of PCM in floors that are in direct contact with
solar radiation could be an effective solution for thermal energy storage. Xu et al. [79] investigated
the thermal performance of PCM floor system in passive solar buildings. This performance is affected
by several factors such as the choice of covering material, thickness of PCM layer, PCM melting
temperature, its thermal conductivity and heat of fusion, and the air gap between the PCM and
covering material. The results showed that the thickness of PCM should not be greater than 20 mm
and the heat of fusion and thermal conductivity of PCM should respectively exceed 120 kJ/ kg and
0.5 W/m K.
Incorporation of PCM into roof systems has not gotten too much attention, Pasupathy [80]
investigated the performance of a double layer of PCM incorporated into roof in Chennai, India.
Inorganic eutectic of hydrated salts used as PCM was incorporated into roof panels of a room and
then it was compared experimentally to a room without the PCM panel. The results showed that the
indoor air temperature swings can be narrowed due to the PCM roof panel, and that this system can
be suitable all seasons when the upper PCM layer had a melting temperature 6–7C greater than the
ambient temperature during summer and the lower PCM layer had a melting temperature close to the
indoor temperature. A naturally ventilated roof with a photovoltaic (PV) module with PCM in Oak
Ridge, Tennessee was developed by Kosny et al. [81]. Reducing heating loads and cooling loads
during winter and summer respectively was the main objective of this system, in winter PCM absorb
heat during the day and release it at night while in summer PCM absorb excess heat. The results
showed that heating loads and cooling loads were reduced by 30% and 55% during winter and

Annexes
265
summer respectively; additionally, it was observed that peak daytime roof heat fluxes were reduced
by about 90%.
-Windows and shutters: In cold climates great parts of energy are lost due to glazed facades, which
increase the need for heating while in warm climates excessive solar heat gain increase the need for
cooling, Figure 0-32 shows PCM filled window. Ismail et al. [82] investigated a glass window in a
hot climate (Brazil) with incorporated PCM. After comparing PCM window with another glass
window filled with absorbing gas, it was shown that the amount of heat penetrating into the room was
reduced while PCM melts, even though the U-value of windows was increased due to addition of
PCM. Goia et al. [83] studied the effect of PCM incorporated into glazing on the thermal comfort in
three different seasons. After comparing the PCM prototype to a traditional double glazing, it was
shown a significant improvement in thermal comfort conditions during all periods of the year except
on cloudy days. Additionally, the authors emphasized the importance of the correct selection of PCM
melting temperature. Weinläder et al. [84] investigated a solar shading system with integrated salt
hydrate PCM having a melting range between 26C and 30 C in office rooms. After comparing
rooms with PCM blinds to rooms with traditional blinds, it was shown that the air temperature is
lower by about 1-2K in the PCM blinds room in summer while in winter PCM blinds do not affect
the heating power. It was found that the main problem of PCM blinds is their renovation at night. The
use of mechanical or natural ventilation was useful to fully regenerate the PCM at night.
Figure 0-32:Illustration of a PCM filled window [71]
-PCM in Concrete: The general objective of incorporating PCM in concrete materials is to increase
heat storage of heavy construction materials in buildings. A number of studies have been carried out
on PCM incorporated into concrete and have shown positive results such as reducing indoor
temperatures in warm climates. Entrop et al. [85] investigated experimentally the performance of
PCM incorporated into concrete floors. Two rooms with PCM concrete floor as well as two rooms
with regular concrete floor were constructed. The results showed that this application leads to

Annexes
266
decrease the temperature fluctuations in the room. Cabeza et al. [86] presented a similar research,
where two identical cubicles made of concrete were tested experimentally. The first one was built of
traditional concrete and the other one of new concrete with microencapsulated PCM. The results
showed a reduction in temperature fluctuation in the room with PCM. Arce et al. [87] continued the
work presented in [86]. One of the most important obstacles found in [86] was the strong effect of
solar radiation and high outdoor temperature peaks on PCM effectiveness during the summer, which
leads to incomplete solidification during the night. The principal aim of this application was to rise
the PCM’s operation time in order to resolve the PCM cycling problem. Results showed a slight
reduction in temperatures. The PCM stayed active for at least 4% more time and the problem of high
temperatures was not completely solved. Royon et al. [88] tested the potential of filling hollow
concrete floor with paraffin PCM having a melting temperature of 27.5C. In summer, the results
showed that the temperature was lower in the hollow concrete building which allows using such
system as a passive thermal conditioner. Other passive system applications for cooling purposes [89-
107] are presented in Table 0-6.
Table 0-6: PCM Passive system applications in the building envelope for cooling purposes
Ref./
Type*
Location/
climate
Used PCM
properties Installation/Strategies Results/Conclusions
[7]
S
Austin, USA /
humid
subtropical
(hot summers
and mild
winters)
-PCM/graphite
composite:
Tm=21°C, Ts=19°C
-paraffin wax:
Tm=21.7°C,
Ts=18.7°C
-encapsulated
organic material:
Tm= 23°C, Ts=22°C
-Encapsulated
octadecane: Tm=
25.3C, Ts=26.3C
- Layer of PCM
plasterboard located in 3
different placements with
different thicknesses.
- Set-point temperature
schedule is created (the
charging cycle of PCM is
controlled).
- Use of Encapsulated octadecane
lowest required cooling loads.
- Surface area ↗↗& thickness of
PCM↘↘ more effective.
- Cooling demand depends on
charging cycle and peak load varies
depending on set point temperature
schedule.
- Adding natural ventilation does
not have an important effect in
reducing energy consumption.
[87]
E Lleida – Spain
Microencapsulated
PCM (Micronal®
from BASF), Tm =
26C & Hf = 110
kJ/kg
-PCM integrated into
concrete walls Figure
0-33 (concrete contain
about 5% in weight of
PCM).
- Awnings added to
provide solar protection,
reduce high wall
temperatures and allow
PCM solidification
overnight
- Two operation modes:
free-cooling (windows
opened only at night) and
- Using awnings reduction of
temperature peak = 6% (3–4 C),
increasing of active hours 4–10%,
& increasing in comfort time 10–
21%.
- Delay of peak hours increased
36% in case of free-cooling while in
case of open windows it decreased
14%
- PCM phase change cycles still
incomplete.

Annexes
267
open windows (all the
time).
[89]
E, S
Tianjin-china /
warm temperate
semi-humid
continental with
cold winters
and hot dry
summers
-Capric acid (CA),
Tm=303.35K.
-Capric acid and
dodecanol (CADE),
Tm=299.65K.
-Cp and K varies
with temperature.
-2 operation mode:
free cooling &opening
window at night (natural
ventilation)
- CA panels on the
outside surface of walls
and roofs (PCMOW)
-CADE panels on the
inside surface of walls
and roofs (PCMIW)
Figure 0-34
- Inside surface temperatures of
walls and roofs in PCMOW &
PCMIW rooms < than that in room
without PCM.
- Performance of PCMIW is better
than PCMOW especially with the
condition of natural ventilation.
- When PCM room temperature >
comfort temperature (26C)
active cooling should be operated.
- Heat that should be removed
(ROH) is lower in case of natural
ventilation than the free cooling
condition.
- Reduction of ROH for PCMIW up
to 80%.
[90]
S
Kuwait / hot
climate
- n-Octadecane,
Tm=27C
-n-Eicosane ,
Tm=37C
-P116, Tm=47C.
- Different
geometries of PCM
container.
- Roof-PCM system:
concrete slab with cone
frustum holes filled with
PCM Figure 0-35.
-Reducing heat flow
from outdoor to indoor
space by absorbing heat
gain in the PCM before it
reaches the indoor space.
- Significant reduction in heat gains.
-heat flux reduction at the indoor
space 39%.
- N-Eicosane performed better than
other tested PCMs.
-Regarding thermal effectiveness
conical geometry is the best as a
PCM container.
[91]
S
-Shenyang/
severe cold
-
Zhengzhou/cold
-Changsha/ Hot
summer and
cold winter
-Kunming/mild
-Hong Kong/
Hot summer
and warm
winter
octadecane paraffin
with different Tm=
23,24,25C
- PCM board (PCMB)
integrated into interior
surface of an external
wall.
- Natural cold source
- reducing the utilization
of AC system leading to
electricity savings.
- PCM phase transition
temperatures↗↗ energy savings
↗↗
- Use of PCMB did not provide
economic benefit from reduced AC
utilization.
- Mean electricity savings ratio
=13.1%.
- Optimal Tm > mean outdoor air
temperature + 3C acceptable
SPP
- Colder regions lower Tm are
required
- Hotter regionshigher Tm are
required
[92]
S
Kuwait/ hot
climate
-n-Octadecane, Tm =
27C,
-n-Eicosane, Tm =
37C,
-P116, Tm = 47 ◦C,
-thickness of PCM
shutter varied
between 0.01&
0.03 m.
-window shutter filled
with PCM
-Reducing solar heat gain
in building through
windows by absorbing it
before it reaches indoor
space.
-PCM with highest Tm = 47C
(close to upper temperature limit of
windows) best thermal
performance.
- P116 shutter heat gain
reduction= 23.29% with thickness
=0.03 m to absorb large quantity of
heat during the daytime.

Annexes
268
[93]
S Beijing, China
-Different Tm, Hf, K
& thickness of
SSPCM
-Different ACH at
night and day.
-SSPCM plates as inner
linings of 4 walls &
ceiling.
-SSPCM plates
combined with night
ventilation without active
AC
-Natural ventilation in
the day and mechanical
ventilation at night.
- Reduction of daily maximum
temperature by 2C
-Indoor comfort improved
especially in early summer days.
- Optimum values for Tm, Hf, K &
thickness of SSPCM are: 26C,
160kJ/kg, 0.5w/m. C & 20 mm
respectively.
- ACH at night should be at the
highest possible level but ACH at
daytime should be controlled.
- SSPCM plates useful for free
cooling application in summer.
[94]
S
Hong Kong
Subtropical
(Hot humid
summer-short
mild winter)
Energain®
-PCM wallboard
composed of 60%
microencapsulated
paraffin, Tm=21.7C
5mm PCM layer
wallboard incorporated
into external walls in
different orientations.
- PCM integrated in eastern &
western walls better
performance.
- Temperature of interior surface of
PCM wall stays above 28C > Tm.
- Higher Tm of 28C-30C should
be investigated in subtropical Hong
Kong climate.
[95]
S
London, UK/
summer
months.
- PCM with different
Tm = 23, 25,27◦C, &
with thicknesses of
12, 24, 36, 48 and 60
mm
- wide air gaps =15,
20, 25, 30 and 35
mm
- PCM installed in the
inner side of wall
construction system
Figure 0-36.
- Integrating PCM with
naturally ventilated air
gaps in building
envelope
- Air gap is similar to
ventilated façade &
provides extra insulation
and airflow.
-In terms of annual energy
consumption (KWh/m2) : the
optimum values for Tm, PCM
thickness and air gap width are
25C, 48mm and 25 mm
respectively.
- Application of PCM in building
reduces overheating problems &
improves indoor temperature in hot
periods.
- Effectiveness of PCM becomes
higher as temperature rise to year
2080 levels.
[96]
E
Lawrence, KS,
USA/ cooling
seasons under
full climatic
conditions.
- Hydrated salt-based
PCM,
Tm range=18–38C,
peak Tm= 31.36 C,
starting Tm=
24.79C
- m total PCM =1.5
kg/m2
- PCM contained in thin
polymer pouches,
arranged in sheets
laminated with aluminum
foil Figure 0-37.
-PCM thermal shield
(PCMTS) integrated as
thin layers at five
locations at different
depths between
insulation boards &
wallboard in the west &
south walls
- Optimum location of PCMTS is at
1.27& 2.54cm from the wallboard
in west & south wall respectively.
- Peak heat flux reduction is 51.3%
for south wall and 29.7% for west
wall.
- Peak heat flux time delayed by 6.3
h in south wall when PCMTS is
next to wallboard & 2.3 h in west
wall when PCMTS at 1.27cm from
wallboard.
- Daily heat transfer reduction=
27.1% in south wall (PCMTS at
2.54 cm from wallboard) & 3.6% in
west wall (PCMTS at 5.08 cm from
wallboard).
[97]
E,S
Weimar,
Germany
Microencapsulated
paraffin with
Paraffin-modified
gypsum plaster (with salt
- Peak temperature reduction 4 K.
- PCM loses its storage capacity if it
cannot be discharged at night after

Annexes
269
diameter =5 µm, Tm
range= 25- 28C.
mixture) applied on
surrounding walls.
sequential hot days hence night
ventilation should be used.
[98]
S
Three US
climate:
Minneapolis,
MN, Louisville,
KY, and
Miami, FL
-PCM wallboard
containing paraffin
with active
temperature range
of 25 C to 27.5 C
- Volume fraction of
PCM to gypsum is
25%.
PCM composite
wallboard integrated in
walls and roof in three
different locations
(exterior, center, and
interior) of the multi-
layered envelope
surfaces
- Optimal PCM location exists
depending on resistance values
between external boundary
conditions & PCM layer.
-PCM wallboard in the middle of
multilayered wall best
performance.
- Use of PCM wallboard shift peak
electricity load & decrease energy
consumption in summer.
[99]
E
Experimental
room in china
Capric acid (CA) &
lauric acid (LA)
mixture, Tm= 20.4C
& Ts= 19.1C.
PCM wallboards
integrated in an ordinary
wall (26% PCM by
weight into gypsum
wallboards)
PCM wallboard has high latent heat
storage capacity & energy
consumption in peak load shifted to
off-peak load period.
[100]
E Hong Kong
Paraffin macro-
encapsulated in
stainless steel box
k= 21.712 W/m K,
Tm= 20.78C,
Hf =147.4 J/g,
Ts=25.09C, and
Hs=146.9 J/g.
PCM incorporated in
concrete walls in
different positions:
internally bonded,
laminated within and
externally bonded Figure
0-38.
- PCM in concrete walls regulates
indoor temperature.
- Effectiveness of PCM highly
depends on its placement in
concrete walls.
- PCM laminated within concrete
walls best temperature control:
maximum temperature reduction
4C.
- PCM internally bonded best
humidity control
- Reduction of relative humidity
providing indoor comfort.
- Payback period of PCM
application 11 years in public house
in Hong Kong.
[101]
E
Full-scale test
room/ summer
conditions
(CETHIL-
INSA de Lyon,
France)
product from DuPont
constituted of 60%
of microencapsulated
PCM with
Tm=22C.
PCM integrated in
internal partition wall.
- overheating effect ↘↘
- Temperatures of wall surfaces ↘↘
improving thermal comfort
conditions by radiative effects.
[102]
E
Puigverd de
Lleida –Spain
macro encapsulated
PCM RT-27
paraffin, Tm =28C
& SP-25A8 hydrate
salt, Tm= 26C
-CSM PCM panels
located between
perforated bricks and
polyurethane in western
& southern walls and in
roof Figure 0-39.
-domestic heat pump as a
cooling system.
- Peak temperatures reduction= 1C,
& daily temperature fluctuations
were smoothed out.
- In case of PCM cubicle (RT27 +
PU) consumption of electricity
reduction = 15% & CO2 emissions
reduction 1–1.5 kg/year/m2.
-In case of PCM cubicle (SP25 +
Alveolar) energy savings = 17%
(2.7 kW h/m2/year).
[103]
E
Solar house
“Magic
ACUAL 20 PCM :
multi-component
mixture of
-PCM integrated in floor
tiles Figure 0-40.
-the tile basically consist
of 4 pieces of pure clay
-PCM tiles placed in the floor are
useful in summer season at night.
- Tm↗↗ the system work more
efficiently as a heat sink.
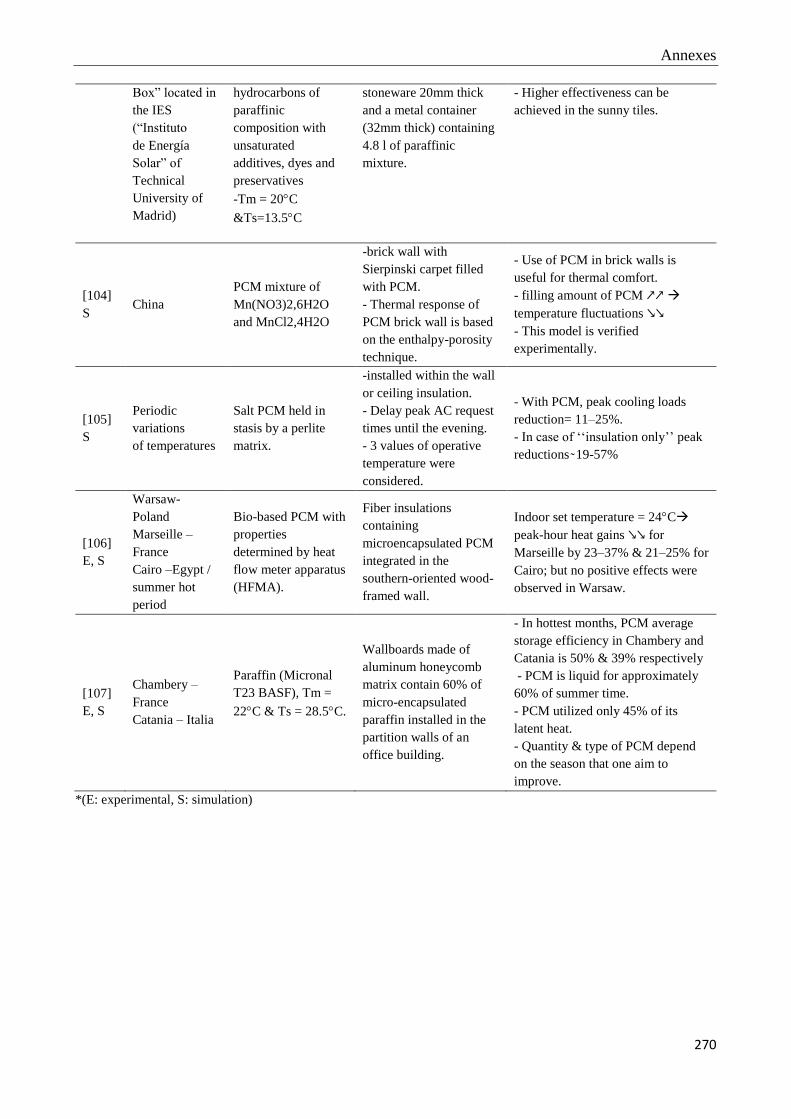
Annexes
270
Box” located in
the IES
(“Instituto
de Energía
Solar” of
Technical
University of
Madrid)
hydrocarbons of
paraffinic
composition with
unsaturated
additives, dyes and
preservatives
-Tm = 20C
&Ts=13.5C
stoneware 20mm thick
and a metal container
(32mm thick) containing
4.8 l of paraffinic
mixture.
- Higher effectiveness can be
achieved in the sunny tiles.
[104]
S China
PCM mixture of
Mn(NO3)2,6H2O
and MnCl2,4H2O
-brick wall with
Sierpinski carpet filled
with PCM.
- Thermal response of
PCM brick wall is based
on the enthalpy-porosity
technique.
- Use of PCM in brick walls is
useful for thermal comfort.
- filling amount of PCM ↗↗
temperature fluctuations ↘↘
- This model is verified
experimentally.
[105]
S
Periodic
variations
of temperatures
Salt PCM held in
stasis by a perlite
matrix.
-installed within the wall
or ceiling insulation.
- Delay peak AC request
times until the evening.
- 3 values of operative
temperature were
considered.
- With PCM, peak cooling loads
reduction= 11–25%.
- In case of ‘‘insulation only’’ peak
reductions 19-57%
[106]
E, S
Warsaw-
Poland
Marseille –
France
Cairo –Egypt /
summer hot
period
Bio-based PCM with
properties
determined by heat
flow meter apparatus
(HFMA).
Fiber insulations
containing
microencapsulated PCM
integrated in the
southern-oriented wood-
framed wall.
Indoor set temperature = 24C
peak-hour heat gains ↘↘ for
Marseille by 23–37% & 21–25% for
Cairo; but no positive effects were
observed in Warsaw.
[107]
E, S
Chambery –
France
Catania – Italia
Paraffin (Micronal
T23 BASF), Tm =
22C & Ts = 28.5C.
Wallboards made of
aluminum honeycomb
matrix contain 60% of
micro-encapsulated
paraffin installed in the
partition walls of an
office building.
- In hottest months, PCM average
storage efficiency in Chambery and
Catania is 50% & 39% respectively
- PCM is liquid for approximately
60% of summer time.
- PCM utilized only 45% of its
latent heat.
- Quantity & type of PCM depend
on the season that one aim to
improve.
*(E: experimental, S: simulation)

Annexes
271
Figure 0-33: concrete cubicles with awnings (outer view and top view) [87]
Figure 0-34: schematic of building envelope for PCM-OW(left) and PCM-IW (right) [89]
Figure 0-35: Schematic of the roof with holes filled with PCM [90]

Annexes
272
Figure 0-36: PCM installation in the wall with ventilation gap [95]
Figure 0-37: sheet of PCM thermal shield PCMTS (left) and wall section showing the PCMTS location (right)
[96]
Figure 0-38: PCM layer: (a) Externally bond with concrete wall, (b) Laminated within concrete wall and (c)
Internally bonded with concrete wall [100]
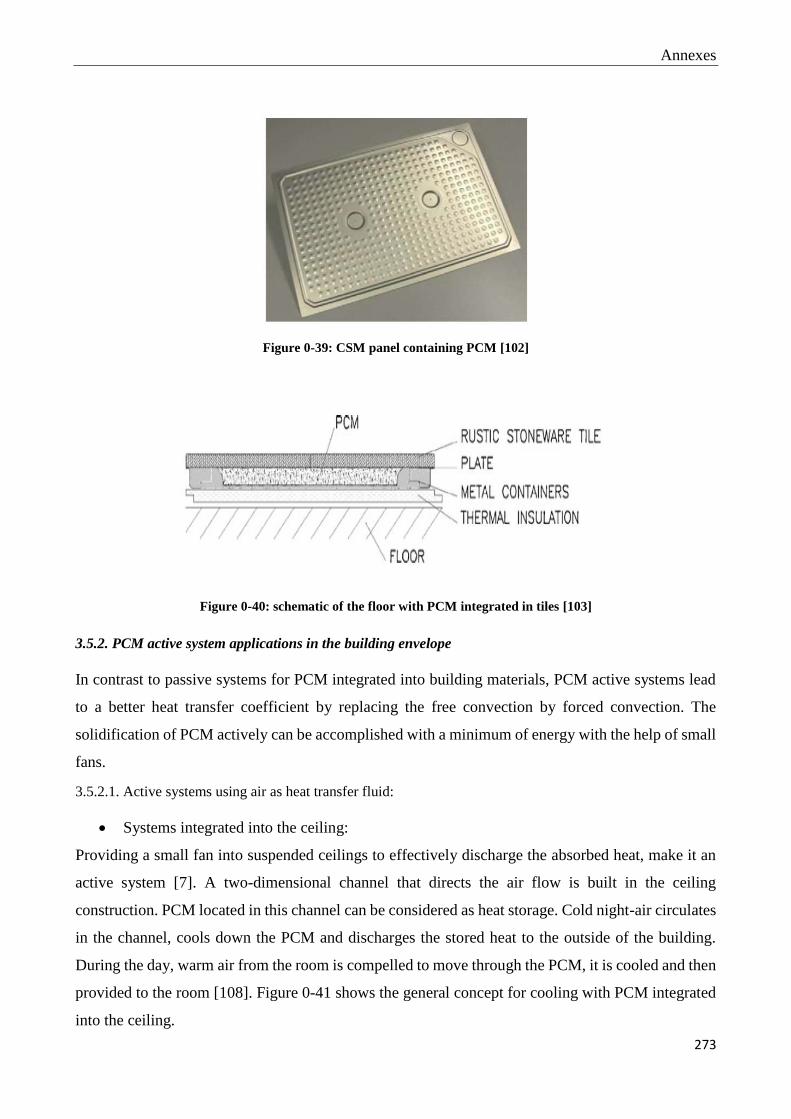
Annexes
273
Figure 0-39: CSM panel containing PCM [102]
Figure 0-40: schematic of the floor with PCM integrated in tiles [103]
3.5.2. PCM active system applications in the building envelope
In contrast to passive systems for PCM integrated into building materials, PCM active systems lead
to a better heat transfer coefficient by replacing the free convection by forced convection. The
solidification of PCM actively can be accomplished with a minimum of energy with the help of small
fans.
3.5.2.1. Active systems using air as heat transfer fluid:
• Systems integrated into the ceiling:
Providing a small fan into suspended ceilings to effectively discharge the absorbed heat, make it an
active system [7]. A two-dimensional channel that directs the air flow is built in the ceiling
construction. PCM located in this channel can be considered as heat storage. Cold night-air circulates
in the channel, cools down the PCM and discharges the stored heat to the outside of the building.
During the day, warm air from the room is compelled to move through the PCM, it is cooled and then
provided to the room [108]. Figure 0-41 shows the general concept for cooling with PCM integrated
into the ceiling.

Annexes
274
The Swedish company Climator developed a system called “CoolDeck” shown in Figure 0-42. This
system has been installed as part of a project in the town hall of Stevenage in England. The Cool
Deck consists of the PCM C24, a salt hydrate encapsulated in bags with a melting temperature of
about 24C, a metallic channel to direct the air and a fan [109].
Figure 0-41: The general concept for cooling with PCM integrated into the ceiling [108]
Figure 0-42: Cool Deck C24 developed by "Climator" [7]
An active thermal storage unit in the ceiling was developed by the Team Germany (2009) [66].The
application is composed of four insulated channels, with polycarbonate profiles filled with salt-
hydrate PCM with a melting temperature of 26C, the PCM system used is Delta Cool 28 by Dorken
[67]. The team equips the channels with ventilation fans, grills, operable flaps, and temperature
sensors. Depending on weather conditions, the COP of the system varies from 9 to 15. During the
day, in cooling mode, the air in the room circulates through the ceiling and decreases its temperature.
The cool air from outside, at night, blows across the ceiling and discharges the PCM.
• Systems integrated into the wall:
Since wall systems have been used for a longer time than other applications, the same concept is
followed as for the ceiling in a wall construction. The system consists of bags filled with PCM, at the
bottom a fan is used in order to transfer the air, openings at the top and the bottom allowing the intake
and the exit of air from the room. However, it should be assured that the volume flow rate of air at

Annexes
275
the exit does not lead to uncomfortable air velocities. An extra intake at the outside of the wall can
be used optionally for direct absorption of cold night air [108].
• Systems integrated into the floor:
It is possible to integrate the same system as for the ceiling and for wall into the floor. The PCM can
be directly located under the floorboards. Figure 0-43 shows the general concept for cooling with
PCM integrated into the floor. During the day, the warm air from the room is taken away; it is cooled
during the melting of PCM and then the cooled air is supplied back to the room providing cooling.
At night, cold air circulates under the floor, cooling the PCM and discarding the stored heat [7].
Figure 0-43: General concept for cooling with PCM integrated into the floor [7]
3.5.2.2. Active systems using a liquid as heat transfer fluid
Active systems with air thermal exchange used to reject the stored heat means that the cold night air
is used as cold source. Regarding the energy consumption, it seems a very effective method, but it is
not completely trusted that the night-air temperature drops to a temperature low enough to reject all
the heat stored during the day [108]. It is possible to integrate systems with liquid-air thermal
exchange to solve this problem, and to attach it to a cold source with a liquid heat transfer fluid.
• PCM-plaster with capillary sheets:
The capillary sheets can be fixed at the surface of the concrete wall and then cover it by a plaster layer
with PCM. Integration of capillary sheets as heat exchanger into the wall is a general approach for
the thermal activation of concrete walls [108].
• Cooling ceiling with PCM plasterboard:
Panels suspended from the ceiling are an example of this application; a plate for dry construction used
as a wall or ceiling element, was developed by the Company ILKATHERM, which is made up of a
pure-foam as an insulating layer located between two coatings made of plaster board, metal, plastics,
or others [7] [108]. In this application, the coating can be PCM plasterboard. The construction and
the installation of the PCM plasterboard are shown in Figure 0-44 and Figure 0-45.

Annexes
276
Figure 0-44: Installation of ILKATHERM PCM board [108]
Figure 0-45: PCM board from ILKATHERM; 1) sheet metal coating, 2) PU rigid foam, 3) capillary tube mats, 4)
Micronal PCM smartboard gypsum construction panel [108]
Incorporation of PCM in ceiling boards to act as air conditioning systems seems effective to shift
peak loads. Kondo [110] developed a PCM ceiling board with micro capsulated PCM for an office
building. At night, the cold air from the AHU flows into the ceiling and cool down the PCM ceiling
board. During cooling time, the cool air from the AHU flows immediately into the room. During the
peak load time, the warm air from the room circulates through the PCM ceiling board, where it is
precooled before returning to the AHU. The results showed a reduction of the peak loads; however,
an improvement of ceiling board is needed. Various numerical studies were also achieved on the
thermal performance of this system [111][112]. Jin et al. [113] investigated an activated floor with
two layers of PCM for cooling and heating. Their main objective was to find the optimal melting
temperature for each PCM layer. The results showed a reduction of the floor surface temperatures
fluctuations. The reduction of the fluctuations is caused not only by the latent heat capacity of PCM,
but also by the implementation of additional high resistance of two layers of PCM with low thermal
conductivity. Moreover, it was found that the optimal PCM melting temperature for heating and
cooling were respectively 38C and 18C and the energy release during the peak period was increased
by 41% and 38% for heating and cooling respectively. Other active system applications are presented
in Table 0-7.
3.5.3. Ventilated facades principle and applications
To reduce the energy demand of a building, the careful design of its façade is considered as the most
important method. Ventilated facades (VF) have been recently used in buildings and have attracted

Annexes
277
great attention of architects and engineers, in order to fit the energy restrictions recommended by the
European Directive (2010/31/EU) [114]. PCM can be introduced into the external layer of VF [115]
or in its air cavity [116] [117]. During cooling season, VF with PCM can act as a free cooling system
in order to avoid overheating and therefore minimize the HVAC energy consumption. VF or VDSF
are considered as a special kind of envelopes, where in front of an ordinary building façade, a second
skin is placed, and consequently an air cavity (channel) is created. In order to ameliorate the energy
or thermal performance of the building, the air in the cavity can be naturally or mechanically
ventilated [118]. Ventilated façades (VF) have the potential to ameliorate the energy efficiency of
buildings, and it can be used in both new and refurbished buildings.
During the cooling period, the working principle of VF-PCM is to use the low temperatures at night
to fully solidify the PCM, while during the day time, supply cold when it is needed by removing heat
through melting of PCM. Figure 0-46 shows how a ventilated façade works:
(a) PCM solidification: occurs at night when the outdoor temperature is lower than the PCM phase
change temperature, the air from outside enters to the channel leading to PCM solidification. To
ensure the full PCM solidification, fans operating under various power rates can be used (mechanical
ventilation instead of natural ventilation) increasing the convective heat exchange.
(b) PCM melting: during the day, PCM absorbs heat from the indoor air to provide cooling effect.
(c) Overheating prevention: after the PCM melting, due to the buoyancy forces, the air flows from
outdoors to outdoors preventing the overheating in the air channel by natural convection.
(d) Free cooling: occurs at night when the outdoor temperature is lower than the indoor set point
temperature.
Figure 0-46: modes of operation of VF. (a) solidification process, (b) melting process, (c) overheating prevention,
and (d) free cooling [116]
Ventilated facades with PCM were studied by many authors during heating period (winter season)
[115][119]. However, Gracia et al. [116] investigated experimentally the efficiency of PCM-VDSF

Annexes
278
in different cities under Mediterranean-continental climates in order to reduce cooling energy
consumption; the used PCM is SP-22 with melting temperature of 21.5C and solidification
temperature of 18C, 112 PCM panels were incorporated in the south wall and the air channel
thickness was 15 cm. furthermore, natural or mechanical ventilation conditions were tested and three
fans were used in the system in case of mechanical ventilation. They concluded that three possible
benefits can be offered by the VDSF: free cooling, cold storage, and solar radiation protection. Free
cooling can be provided for cities under “warm temperate” and “snow” main climates where the
temperature swings are considered as high. The cold storage effectiveness depends highly on heat
gains and the solar irradiance. The cooling supply during the day provided by the cold storage [116]
strategy was about 12MJ/day; while it reaches 150 MJ/day in case of free cooling. Further, in order
to optimize the charging process, a control strategy based on artificial intelligence algorithms can be
used. Other VF system applications [117] [120] are presented in Table 0-7.
Table 0-7: PCM active system applications in building envelope including active VF
Ref
Type*
Location/
climate Used PCM Installation/Strategies Results/conclusions
[26]
E, S
Lab scale
experiment /
Periodic
variations of the
temperature
Microencapsulated
paraffin in gypsum
(Heptadecane), Tm =
22C & m total
PCM=13.3 kg/m2
-ceiling panel with
PCM incorporated in
retrofitted buildings.
-thermal storage
controlled by an
integrated water
capillary tube system.
-5 cm layer of microencapsulated
PCM are sufficient to keep the
office temperature within the
comfort range.
-this system can be used in
lightweight structures due to its
benefits.
- Fire resistance could be ensured
by micro-encapsulated PCM in
gypsum covered in a sheet steel
tray.
[117]
E
Puigverd de
Lleida (Spain)/
Continental
Mediterranean
with severe or
mild summer
- macro-encapsulated
panels of salt hydrate
SP-22, Tm=22C &
Ts=18C
- 112 PCM panels (1.4
kg of SP-22 each)
distributed throughout
the facade making 14
air flow channels.
-VF in south wall
consisting of 3 fans &
Six automatized gates
in order to control the
operational mode
Figure 0-47.
-the system used as a
cold storage unit (an
overheating protection)
& as a night free
cooling application.
- Night free cooling operation
mode reduces cooling loads.
- Cold storage sequence presents
low energy storage efficiency due
to significant heat gains through
the outer skin.
-. The system prevents effectively
the overheating effect.
- Effective use of VF for cooling
purposes weather conditions &
cooling demand of final users
should be taken into account.
[120]
E, S
Madrid
Seville
- RT22 in containers,
located inside an air
chamber.
-Tm=23C
-Ventilated facade with
fins filled with PCM.
-PCM cylinders in
hollow core slabs
Figure 0-49.
-increasing contact area
between PCM & air.
- PCM located inside
mechanically ventilated air layers
convective heat transfer
coefficients↗↗ & control
strategies used to match cooling
needs of building.
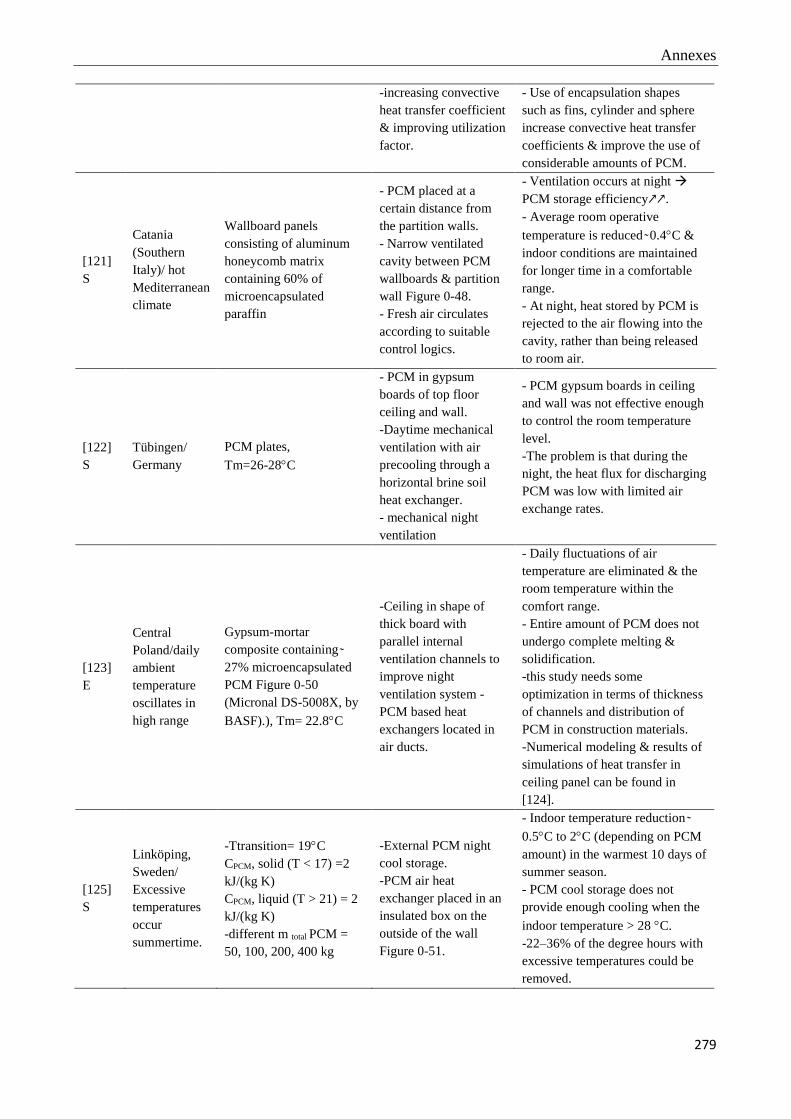
Annexes
279
-increasing convective
heat transfer coefficient
& improving utilization
factor.
- Use of encapsulation shapes
such as fins, cylinder and sphere
increase convective heat transfer
coefficients & improve the use of
considerable amounts of PCM.
[121]
S
Catania
(Southern
Italy)/ hot
Mediterranean
climate
Wallboard panels
consisting of aluminum
honeycomb matrix
containing 60% of
microencapsulated
paraffin
- PCM placed at a
certain distance from
the partition walls.
- Narrow ventilated
cavity between PCM
wallboards & partition
wall Figure 0-48.
- Fresh air circulates
according to suitable
control logics.
- Ventilation occurs at night
PCM storage efficiency↗↗.
- Average room operative
temperature is reduced 0.4C &
indoor conditions are maintained
for longer time in a comfortable
range.
- At night, heat stored by PCM is
rejected to the air flowing into the
cavity, rather than being released
to room air.
[122]
S
Tübingen/
Germany
PCM plates,
Tm=26-28C
- PCM in gypsum
boards of top floor
ceiling and wall.
-Daytime mechanical
ventilation with air
precooling through a
horizontal brine soil
heat exchanger.
- mechanical night
ventilation
- PCM gypsum boards in ceiling
and wall was not effective enough
to control the room temperature
level.
-The problem is that during the
night, the heat flux for discharging
PCM was low with limited air
exchange rates.
[123]
E
Central
Poland/daily
ambient
temperature
oscillates in
high range
Gypsum-mortar
composite containing
27% microencapsulated
PCM Figure 0-50
(Micronal DS-5008X, by
BASF).), Tm= 22.8C
-Ceiling in shape of
thick board with
parallel internal
ventilation channels to
improve night
ventilation system -
PCM based heat
exchangers located in
air ducts.
- Daily fluctuations of air
temperature are eliminated & the
room temperature within the
comfort range.
- Entire amount of PCM does not
undergo complete melting &
solidification.
-this study needs some
optimization in terms of thickness
of channels and distribution of
PCM in construction materials.
-Numerical modeling & results of
simulations of heat transfer in
ceiling panel can be found in
[124].
[125]
S
Linköping,
Sweden/
Excessive
temperatures
occur
summertime.
-Ttransition= 19C
CPCM, solid (T < 17) =2
kJ/(kg K)
CPCM, liquid (T > 21) = 2
kJ/(kg K)
-different m total PCM =
50, 100, 200, 400 kg
-External PCM night
cool storage.
-PCM air heat
exchanger placed in an
insulated box on the
outside of the wall
Figure 0-51.
- Indoor temperature reduction
0.5C to 2C (depending on PCM
amount) in the warmest 10 days of
summer season.
- PCM cool storage does not
provide enough cooling when the
indoor temperature > 28 C.
-22–36% of the degree hours with
excessive temperatures could be
removed.

Annexes
280
[126]
S Hong Kong
-PCM Hexadecane
(C16H34)
- Tm =18C &
Hf = 224 kJ/Kg
AC system:
combination of cooled
ceiling (CC) & MPCM
slurry storage tank
- Tank with volume = 0.52 m3 was
sufficient to keep the indoor
temperature within comfort level.
- Electricity demand reduction
33%.
- Annual energy consumption
reduction= 1157Kwh.
*(E: experimental, S: simulation)
Figure 0-47: ventilated façade with the distribution of fans and automatized gates [117]
Figure 0-48: location and operation of the ventilated cavity [121]
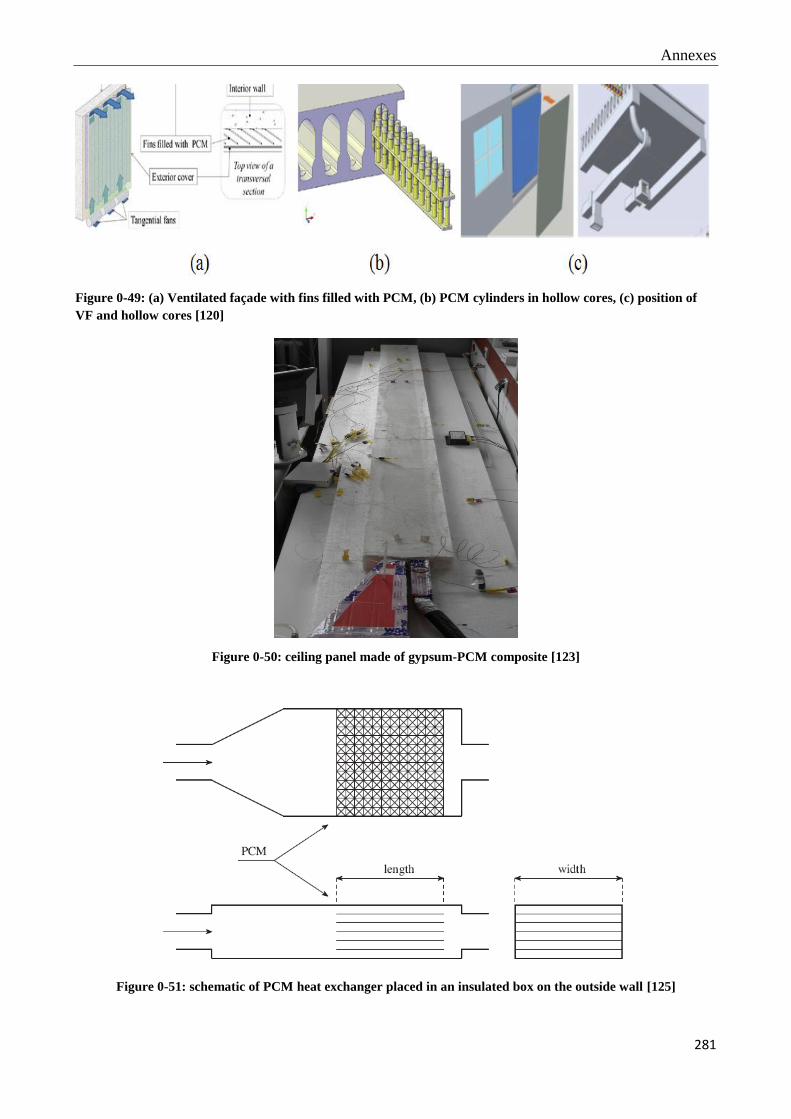
Annexes
281
Figure 0-49: (a) Ventilated façade with fins filled with PCM, (b) PCM cylinders in hollow cores, (c) position of
VF and hollow cores [120]
Figure 0-50: ceiling panel made of gypsum-PCM composite [123]
Figure 0-51: schematic of PCM heat exchanger placed in an insulated box on the outside wall [125]

Annexes
282
4. Discussion
In building applications, PCM can be incorporated in passive or active systems. Passive systems do
not require additional energy, are easy to install with integrated low consumption devices. They
depend completely on the outdoor temperature and the variable weather conditions. Thereby if night
temperatures do not drop considerably below the PCM phase change temperature, the PCM will not
fully solidify which hinders the pursuit of its operation. In addition, among day-night cycles the heat
transfer between the air and the wall limits the maximum capacity of storage which restricts the
application of passive systems [46]. Furthermore, the required rate of heat exchange between the air
and the PCM is not always attained. During summer season, Schossig et al. [127] proposed to increase
air-change rate at night; even though natural ventilation could provide cold from outside but it may
be insufficient; thus mechanical ventilation must be applied, which is considered as an active system,
leading to a better heat transfer coefficient. Improving the heat transfer rates using electrical fans
requires adding their energy consumption in the economic study. Active systems seem to be more
efficient than the passive ones, the charge/discharge process is fully controlled, and its execution
depends on several parameters besides the outdoor temperature, moreover the thermal energy storage
can be obtained when it is required. On the other hand, active applications are regarded as complicated
and complex systems requiring mechanical elements such as pumps and fans, in addition to a control
system. In terms of the use of PCM for building applications, PCM integrated materials and PCM
components are more and more easily implemented. Recently, PCM mats and boards have become
available in the market which facilitates the integration of latent heat storage in lightweight
construction. Originally, PCM boards were used only in passive systems, but later on it was used also
for active applications [67] [66]. For space heating, the solar direct gain is the most significant strategy
and the appropriate selection of the finishing material characteristics is very important in this case.
Thun et al. [66] used this strategy for the PCM floor application; however this application is affected
essentially by the type and the color of chosen floor finishing material since the PCM is not
immediately subjected to solar radiation [66]. The heat transfer rate is reduced and delayed when the
PCM is not directly in contact with solar radiation, neither with the room air. For space cooling, night
ventilation and solar protection are the most important strategies. Night ventilation is advantageous
in regions with large temperature swings between day and night; it can improve thermal comfort
conditions and it can be achieved through window or door openings, ceiling fans and others [128].
Cooling strategies and PCM applications with active and passive systems are summarized in the
synthetic diagram shown in Figure 0-52.

Annexes
283
Figure 0-52: A synthetic diagram of PCM cooling applications
4.1. Factors affecting PCM selection
The integration of PCM in buildings leads to an increase in their thermal energy storage which
subsequently minimizes the indoor temperature fluctuation, providing indoor thermal comfort and
therefore reducing the energy consumption. Osterman et al. [24] confirmed that the use of PCM
highly improves the energy performance of buildings in summer season. The efficiency of PCM
strongly depends on several factors: 1) outdoor climatic conditions, 2) type of PCM, its melting
temperature range and its thermo-physical properties, 3) PCM encapsulation method, 4) quantity of

Annexes
284
PCM (effective volume and PCM layer thickness), 5) location and installation of PCM in the building
, 6) purpose of PCM application; 7) way of PCM is charged/discharged (active or passive systems),
8) characteristics and orientation of the building, 9) real life conditions including heating and cooling
set points, air infiltration rates, internal gains from occupancy (i.e. people (person/m2), metabolic rate
(Writing, seating, standing Cooking, cleaning… (W/person)), Lighting (W/m2) and Electric
equipment (W/m2)) schedules), 10) solar gains, 11) orientation and reflectivity of the surfaces (solar
absorbance coefficient ()), 12) and finally investment cost and tariff structure should be taken into
account.
The aim of this section is to investigate the possibility to find an optimum solution (appropriate PCM
configuration) for each climate and application, in order to reduce cooling demands in hot/warm
climates. It was found that the combination of building energy simulation tools and optimization tools
can lead to optimize the design of buildings and HVAC systems [129][130][131][132]. Moreover,
both mass of PCM and typology of PCM must be carefully designed.
4.2. Climatic conditions
As it was formerly stated, climatic conditions are one of the main factors affecting the efficiency of
PCM in building applications, since the system performance is principally influenced by the outdoor
weather conditions. The climate of a specified location is influenced by its latitude; terrain, ice or
snow lids, and altitude, in addition to close water bodies. It can be defined as the average weather
over a long period and it is categorized according to the average and the typical ranges of temperature
and precipitation. Cooling and heating needs for buildings in each climatic zone can be determined
according to the climatic zone conditions, and other conditions such as the kind use of building
(residential, or non-residential) and internal gains from occupancy.
Figure 0-53: climate classification according to the Köppen–Geiger [133]

Annexes
285
One of the most popular climate classification systems is Köppen- Geiger, Figure 0-53, it divides the
main climate in five zones namely, A: equatorial, B: arid, C: warm temperate, D: snow and E: polar.
Furthermore, it determines the level of precipitation W: desert, S: steppe, f: fully humid, s: summer
dry, w: winter dry, m: monsoonal. Lastly, it gives details about temperature as h: hot arid, k: cold
arid, a: hot summer, b: warm summer, c: cool summer, d: extremely continental, F: polar frost. For
example, in Seville-Spain, the climate is considered as Csa: a Mediterranean climate with dry hot
summer and mild winter while in Paris-France the climate is Cfb: Marine west coastal with warm
summer, mild winter and rain all the year. In general, each climate zone has clearly different
construction and design requirements. Table 0-8 shows cooling and heating requirements for each
climate condition.
Table 0-8: Usual cooling & heating strategies as a function of the climate conditions [134]
climates Cooling & heating requirements
Hot humid summer / warm
winter
- Design strategies that reduce cooling energy consumption.
- Orientate the building to take advantage of cooling breezes.
- Shading all windows & walls.
- Use low solar heat gain coefficient glazing.
- Encourage natural air flow.
- Use ceiling fans & other mechanical cooling equipment.
Warm and humid summer /
mild winter
-. Auxiliary heating is not necessary.
- Ceiling fans & high energy rated cooling appliances are required.
Hot dry summer / Warm winter Evaporative cooling & passive solar heating are required
Hot dry summer / Cool winter -. Evaporative cooling, ceiling fans. & night cooling
- Passive & active solar heating.
Warm temperate climates -. No auxiliary heating or cooling is required
- Just may include ceiling fans.
Cool temperate climates
-. Cooling is unnecessary.
- Significant level of passive / active solar heating strongly desirable if available.
- Other heating systems are also needed.
Many studies were conducted in order to investigate the performance of PCM under different climates
[116][135][136][137] [138]. It can be observed that the integrated PCM does not give the same
advantages for all Mediterranean climates during all months of cooling season, the PCM wallboards
appearing more suitable for semi-arid climate than for hot/subtropical Mediterranean climates [137].
However, Soares et al. [135] concluded that the total energy savings due to the integration of PCM-
drywalls are more significant for the warmer climates, it reach 62% and 42% for Coimbra (Csb-
Mediterranean climate with dry warm summer and mild winter) and Seville (Csa-Mediterranean
climate with dry hot summer and mild winter) respectively. Moreover, it is observed that PCM-
drywalls reduce the heating energy demand not only the cooling energy demand in warmer climates.
For colder climates in Warsaw (Dfb-Moist continental with warm summer and cold winter) and
Kiruna (Dfc- Subarctic with cool summer and severe winter), PCM-drywalls can reduce the heating
energy demand significantly but are not attractive in terms of total energy savings due to the increase

Annexes
286
in summer cooling loads. Finally, it was shown that the optimization of PCM-drywalls incorporation
is very important and can be achieved in an annual evaluation basis instead of in a seasonal basis.
Furthermore, Alam et al. [136] investigated the effect of PCM in Australian cities under different
climates; they concluded that PCM can reduce the energy consumption of buildings in cities under
cold, mild and warm temperate climates. However, the integration of PCM in buildings under hot and
humid climate has very limited impact on the energy consumption. Usón et al. [138] considered five
different climatic zones in Spain to evaluate three different commercial PCM installed on tiles. They
concluded that PCM can minimize the total energy consumption and the environmental impacts.
Moreover, the effective performance of PCM is heavily influenced by the climate conditions and the
type of PCM introduced. Borderon et al. [139] investigated a PCM/air ventilation system storing
latent heat in order to improve summer comfort conditions in four French cities (Lyon, Nice,
Carpentras and Trappes) under different climates, where Carpentras is the warmest climate and
Trappes is the coldest one. It was shown that the performance of the system is mainly affected by the
daily amplitude of the exterior air temperature. In addition, the diurnal temperature range, which is
the amplitude of the outdoor air temperature swing, is a critical factor of the applicability of PCM to
reduce cooling loads [140]. Thus, when the diurnal temperature range is between 12C and 15C the
free cooling system with incorporated PCM can be applied showing an effective performance [35].
From the above literatures, it is obvious that the effective performance of PCM is extremely related
to climate conditions; therefore, it is important to choose a suitable PCM melting temperature that it
is strongly conditioned by the surrounding climate.
4.3. Melting temperature of PCM
The most significant criterion for PCM selection is the required melting temperature, it is considered
as the greatest influent parameter. It is very important to select the right type of PCM because, for a
specific climate conditions, if the melting temperature is too low, it is difficult to maintain the indoor
air temperature at a comfortable level during the night; furthermore, if the melting temperature is too
high, the quantity of solar radiation heat stored by the PCM will be reduced in the daytime [141].
Additionally, the selection of a low melting temperature leads to insufficient use of PCM in the hottest
months. On the other hand, a melting temperature too high could lead to a marginal feasibility during
the intermediate seasons. Most of the PCM that can be applied in buildings have melting points
between 18C and 28C, close to the human comfort temperature range. A phase change temperature
outside of the operating temperature range of the storage could make the application totally useless.
Partial solidification and melting of PCM can lead to insufficient thermal storage [11].
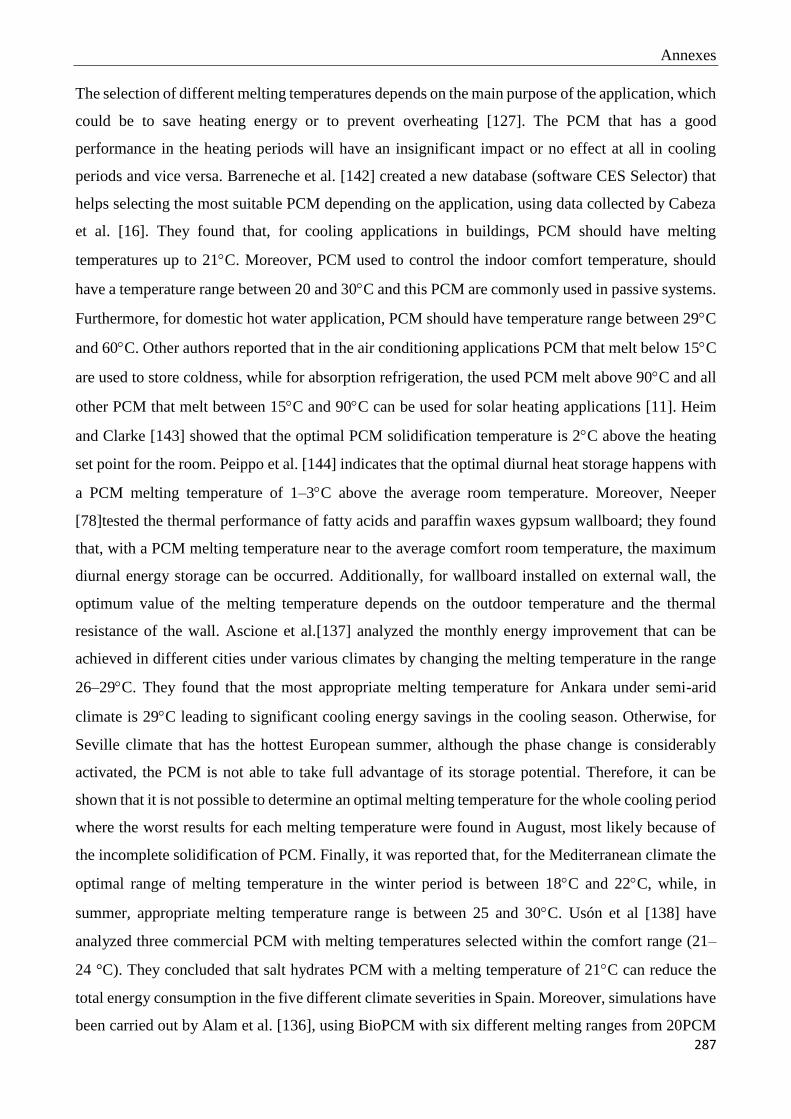
Annexes
287
The selection of different melting temperatures depends on the main purpose of the application, which
could be to save heating energy or to prevent overheating [127]. The PCM that has a good
performance in the heating periods will have an insignificant impact or no effect at all in cooling
periods and vice versa. Barreneche et al. [142] created a new database (software CES Selector) that
helps selecting the most suitable PCM depending on the application, using data collected by Cabeza
et al. [16]. They found that, for cooling applications in buildings, PCM should have melting
temperatures up to 21C. Moreover, PCM used to control the indoor comfort temperature, should
have a temperature range between 20 and 30C and this PCM are commonly used in passive systems.
Furthermore, for domestic hot water application, PCM should have temperature range between 29C
and 60C. Other authors reported that in the air conditioning applications PCM that melt below 15C
are used to store coldness, while for absorption refrigeration, the used PCM melt above 90C and all
other PCM that melt between 15C and 90C can be used for solar heating applications [11]. Heim
and Clarke [143] showed that the optimal PCM solidification temperature is 2C above the heating
set point for the room. Peippo et al. [144] indicates that the optimal diurnal heat storage happens with
a PCM melting temperature of 1–3C above the average room temperature. Moreover, Neeper
[78]tested the thermal performance of fatty acids and paraffin waxes gypsum wallboard; they found
that, with a PCM melting temperature near to the average comfort room temperature, the maximum
diurnal energy storage can be occurred. Additionally, for wallboard installed on external wall, the
optimum value of the melting temperature depends on the outdoor temperature and the thermal
resistance of the wall. Ascione et al.[137] analyzed the monthly energy improvement that can be
achieved in different cities under various climates by changing the melting temperature in the range
26–29C. They found that the most appropriate melting temperature for Ankara under semi-arid
climate is 29C leading to significant cooling energy savings in the cooling season. Otherwise, for
Seville climate that has the hottest European summer, although the phase change is considerably
activated, the PCM is not able to take full advantage of its storage potential. Therefore, it can be
shown that it is not possible to determine an optimal melting temperature for the whole cooling period
where the worst results for each melting temperature were found in August, most likely because of
the incomplete solidification of PCM. Finally, it was reported that, for the Mediterranean climate the
optimal range of melting temperature in the winter period is between 18C and 22C, while, in
summer, appropriate melting temperature range is between 25 and 30C. Usón et al [138] have
analyzed three commercial PCM with melting temperatures selected within the comfort range (21–
24 °C). They concluded that salt hydrates PCM with a melting temperature of 21C can reduce the
total energy consumption in the five different climate severities in Spain. Moreover, simulations have
been carried out by Alam et al. [136], using BioPCM with six different melting ranges from 20PCM

Annexes
288
(18–22C) to 25PCM (23–27C) in order to find the optimum PCM melting range for each climatic
zone. They concluded that an optimum PCM melting range that leads to the lowest energy
consumption in every month of the year can’t be unique, and PCM with melting point outside the
comfort or thermostat range cannot be effective and lead to decrease energy savings. Furthermore, it
was found that PCM with higher melting point were more efficient during summer as well as in warm
temperate climate areas, while PCM with lower melting point were most efficient during winter and
perform better in cold temperate climate area. Other simulations [145] showed that a phase change
temperature of 22°C, which is the mid-point of the chosen comfort range (20-24C), was the best for
the studied case. In commercial buildings, peak temperatures can be reduced by about 3-4C, and day
hours where the temperature is above 24C can be reduced by 80%. Moreover, Fiorito [146] found
that for a considered climatic zone, the PCM melting point should be selected in order to be
compatible with the average maximum outdoor temperatures. Accordingly, for a free cooling system
design, the PCM melting temperature is considered as a decisive factor [48], and it should be taken
between 19C and 24C [34] [45] which intersect the range of the human comfort 23–27C in summer
conditions. Waqas and Kumar [147] have found that the performance of free cooling system in hot
dry climates is better with a PCM melting temperature selected within the comfort range of the hottest
month. In order to find the optimal PCM melting temperature, a new method was presented by Jiang
et al. [148] for a passive solar house. They found that the optimal PCM melting point depends on the
minimal limit of the indoor thermal comfort band, and its value, in china under different climates,
should be taken from 1.1C to 3.3C greater than the minimum thermal comfort range. Soares et al.
[135] investigated the impact of six different melting temperatures; they found that the optimum PCM
melting temperature is higher for the warmer climates (between 22 and 26C), and lower for colder
climates (between 18 and 24C). For better PCM performance, Farid [149] suggested to utilize in the
same storage unit, more than one PCM with various melting temperatures. In order to get an effective
performance all the time under different weather conditions, two layers of PCM with different melting
temperature incorporated into the rooftop of the building were used [80]. Moreover, systems with
different PCM having different melting temperatures are considered as an important future research,
and should be developed in order to improve the building performance in both cooling and heating
seasons.
From the above literatures, it can be concluded that there are different criteria to select an appropriate
melting temperature whether for heating or cooling applications or both. Knowing that, the same
phase change material does not provide the same advantages referring to both heating and cooling
energy demands, and none of the PCM is equally effective over the year. The selection of melting
temperature should be based reasonably on local thermostat set points along with the climatic

Annexes
289
conditions. Some authors agree that high PCM melting temperatures seemed more effective for
warmer climates, while low PCM melting temperature could be more efficient in colder climates, and
others emphasized on the importance of selecting PCM melting temperature within the comfort range.
To choose the most suitable PCM melting temperature for an application under considered climatic
zone, the optimization method by testing different melting temperatures seemed the most appropriate.
4.4. Location of application: Effect of PCM surface area and thickness
In the previous section, the effectiveness of PCM was investigated in terms of selecting a suitable
PCM melting temperature for a considered application. In this part, the effect of position, surface area
and thickness of PCM integrated in building on energy savings will be investigated. As mentioned
previously, PCM can be incorporated into wallboards, roof, underfloor, concrete, plaster, furniture,
and insulation of buildings, glazing and others [66] [17][150][18][15][151]. The location of PCM,
essentially in passive systems, depends on its objective and functioning [11], unlike the PCM storage
units that have more options and liberty in terms of their location. Passive PCM application at the
floor seems to be the best location for the heating periods; this is due to the fact that in the floor it is
possible to benefit from each of the indoor air temperature and direct solar gains via the glazing.
However, PCM drywalls (plasterboards, wallboards or gypsum boards) seemed more appropriate as
passive systems for cooling purposes. Knowing that, night ventilation together with PCM is a very
effective strategy that leads to decrease the cooling demand of buildings. Ingenious solutions [106]
for reducing the cooling demand of buildings such as ventilated facade with fins filled with PCM and
PCM cylinders in hollow core slabs, were created in order to increase the convective heat transfer
coefficient. Therefore, they allow the use of large quantities of PCM, and improve the utilization
factor of cold stored. Ceilings present considerable areas for passive heat transfer and have less risk
of spillage of the macro-encapsulated PCM by drilling; however, they have lower convective heat
transfer coefficients compared to walls and floor. Moreover, it was found that a PCM layer
incorporated in the roof structure seemed inappropriate to improve the building energy performances
[80], actually rooftop temperature increases when the PCM becomes liquid. For the purpose of
reducing cooling demand and improving thermal comfort, Ascione et al. [137] installed gypsum
wallboard PCM on the inner faces of the external building envelope. The results showed that the
application of the PCM plaster on the whole vertical envelope leads to the highest energy savings in
different climatic zones. In addition, it has been found that the cooling demand is reduced with the
increment of the thickness of PCM plaster; however, authors investigated until a maximum thickness
of 3 cm of PCM plaster because additional increment of PCM thickness cannot provide considerable
improvements of the indoor temperature. Soares et al. [135] replaced the inner plasterboard layers of
the exterior walls, partition wall and roof by a PCM-drywall layer. In all studied cases, they found

Annexes
290
that the optimum thickness of the PCM-drywalls was equal to 4cm. Moreover, in terms of surfaces
solar absorbance, lower values ( = 0.3) are better for warmer climates while higher values (= 0.9)
are better for colder climates. Alam et al.[136] investigated energy savings for different locations of
PCM (east wall, North wall, West wall, South wall, North wall and roof, West wall and roof, South
wall and roof, east wall and roof, all walls, all walls and roof) where the thickness of PCM layer was
calculated by dividing the PCM volume by the surface area of the applied location. For a specified
amount of PCM, it was shown that energy savings and therefore effectiveness of PCM increase with
the decrease of the thickness of PCM layer and the increase of surface area until an optimum level.
During a phase change daily cycle, the PCM volume must be chosen so that PCM mass could be
melted and solidified entirely. During the cooling season, if the PCM volume is very high, the
solidification process time may be longer than the time of low temperatures at night. Similarly, in
winter, if the PCM volume is very high, the PCM cannot be completely melted because the sunshine
time could be shorter than the time required for the heat penetration in the PCM. Furthermore,
increasing the surface area of the applied location of PCM, leads to an increase of the heat transfer
rate between this area and the PCM. At a constant PCM volume, the thickness of PCM layer is thinner
when the surface area increases. Therefore, melting and solidification processes become more
effective.
The total energy exchanged due to the enthalpy content in the PCM (i.e. the overall latent heat storage
capability) can be calculated using Eq. 0-1 [138]:
𝐸𝑙𝑎𝑡𝑒𝑛𝑡 = 𝑛.𝑚.𝐻𝑓 Eq. 0-1
Where, m is the mass of the PCM, n is the number of phase changes that occur during a specified
period of time and Hf is the PCM latent heat.
For a better evaluation of the impact of PCM position and thickness, Konstantinidis [7] calculated the
total amount of PCM necessary to absorb the surplus heat for cooling periods. The average daily
cooling load Edaily was determined. Therefore, the diurnal energy stored in the PCM is given by Eq.
0-2:
𝐸𝑑𝑎𝑖𝑙𝑦 = 𝑚𝑐𝑝. 𝐻𝑓 Eq. 0-2
Where, mcp is the specific mass of PCM and Hf is the latent enthalpy of the material.
Therefore, the required mass of PCM is calculated and subsequently the required PCM volume is
given by Eq. 0-3:
𝑃𝐶𝑀 𝑉𝑜𝑙𝑢𝑚𝑒 = 𝑚(𝑃𝐶𝑀)/𝜌(𝑃𝐶𝑀) Eq. 0-3
4.5. HVAC controls
According to the indoor microclimate, two types of study can be carried out:

Annexes
291
- Without including the HVAC system (naturally ventilated building): to find out the effect of PCM
on the temperature fluctuations in the considered indoor space, where the temperature is free-running,
and the potential of PCM in reducing peaks. In this case the hourly temperature data must be given.
- Including the HVAC system (air-conditioned building): to calculate the energy consumptions, and
thus the energy savings. In this case, the indoor temperature is controlled and a schedule of set points
must be made.
5. Conclusion
A review of PCM applications for cooling purposes, and factors affecting the effectiveness of PCM
were discussed in this article. Many experimental and modeling-simulation studies have been
presented, showing the effect of PCM on the buildings thermal performance. The use of PCM in
buildings seems to be very beneficial; PCM can decrease energy consumption, shift the peak loads
of cooling energy demand, decrease temperature fluctuations providing a thermally comfortable
environment, and reduce the electricity consumption. Free cooling applications are effective when
the diurnal temperature variations are large (up to15C). When HVAC system is used, PCM act as a
cold storage unit, shifting the peak loads to low electricity rate periods. Integrating PCM in the
building envelope prevents the raise of the indoor temperature improving the thermal comfort.
However, many drawbacks have been found in PCM applications, mainly the non-use of considerable
portions of employed PCM due to the low convective heat transfer coefficients, incomplete
solidification of PCM at night and the limited contact area between the air and PCM.
Several solutions have been proposed, such as the use of proper control strategy, forced ventilation
to increase the convective heat transfer, and adequate design of the heat exchangers. Moreover, using
fins, cylinders, and spheres to encapsulate the PCM could improve the use of considerable amounts
of PCM and increase the convective heat transfer coefficients. Paraffin was mostly used in cooling
applications; however, salt hydrates and fatty acids were used in some cases. Selecting the most
suitable PCM for a specific climate and a specific application was discussed. The melting temperature
is the most influential parameter, some authors approve that high PCM melting temperatures seemed
more effective for warmer climates, while low PCM melting temperature could be more efficient in
colder climates, and others emphasized on the importance of selecting PCM melting temperature
within the comfort range then an optimization method by testing different melting temperatures is
required. Moreover, systems with different PCM having different melting temperatures are
considered as an important future research and should be developed in order to improve the building
performance in both cooling and heating seasons. Moreover, for a specified amount of PCM, it was
shown that energy savings and therefore effectiveness of PCM increase with the decrease of the

Annexes
292
thickness of PCM layer and the increase of surface area until a certain optimum level. The selection
of an appropriate amount of PCM needed for thermal storage still requires also further research. A
general topology diagram summarizing the PCM application in buildings is presented in Figure 0-54.
Figure 0-54: A typology diagram of PCM in building applications
Paraffin (mostly used)
Fatty acids Eutectics
Energy savings or energy
consumption calculation
Maximum energy savings
Minimum energy consumption
PCM
application
Passive systems
Active systems
PCM volume
(amount)
Real life
conditions
Internal gains
Solar gains
Lighting
Electric equipment
Climate
investigation Building
investigation
Cooling/heating
loads
Temperature
profile data
Facades orientation
Construction materials
Type of building Residential Non-Residential
HVAC controls Purpose of
application
Air infiltration rate
Comfort/thermostat
range
PCM melting
temperature
PCM location
(surface area)
PCM thickness
PCM type Salt hydrates
Effect of PCM on
Temperature fluctuations
YES
Optimization
NO
Minimum temperature
fluctuations
Occupancy
Chosen so that PCM mass melt & solidify entirely
Decrease the PCM layer thickness & increase
the surface area
Higher for warmer climate
Lower for colder climate
Within comfort range

Annexes
293
6. Résumé en français
Matériaux à changement de phase (MCP) pour les applications de refroidissement
dans les bâtiments : une revue
Une revue des applications de matériaux à changement de phase (MCP) pour le refroidissement des
bâtiments, et les facteurs affectant l'efficacité de MCP ont été discutés dans ce chapitre. De
nombreuses études expérimentales et numériques ont été présentées, montrant l'effet de MCP sur la
performance thermique des bâtiments. L'utilisation de MCP dans les bâtiments dans des systèmes
passifs ou actifs semble être très bénéfique ; les matériaux à changement de phase peuvent réduire la
consommation d'énergie, déplacer les pointes de charge de la demande énergétique de
refroidissement, diminuer les fluctuations de la température, fournir un environnement
thermiquement confortable et réduire la consommation d'électricité. Les applications de
refroidissement naturel (free-cooling) sont efficaces lorsque les variations de température diurnes
sont importantes (jusqu'à 15°C). Lorsque le système de chauffage, de ventilation et de climatisation
(HVAC) est utilisé, les MCP agissent comme une unité de stockage de froid, déplaçant les pointes de
charge à des périodes où l’électricité est bon marché. L'intégration de MCP dans l'enveloppe du
bâtiment empêche l'augmentation de la température intérieure en été et améliore à son tour le confort
thermique.
Cependant, de nombreux inconvénients ont été trouvés dans les applications de MCP, principalement
la non-utilisation de portions considérables du MCP en raison des faibles coefficients de transfert de
chaleur par convection, la solidification incomplète du MCP la nuit et la zone de contact limitée entre
l'air et le MCP. Plusieurs solutions ont été proposées, telles que l'utilisation d'une stratégie de contrôle
appropriée, la ventilation forcée pour augmenter le transfert de chaleur par convection et la conception
adéquate des échangeurs de chaleur. De plus, l'utilisation d'ailettes, de cylindres et de sphères pour
encapsuler les MCP pourrait augmenter la quantité de MCP utilisée ainsi que les coefficients de
transfert de chaleur par convection. La paraffine est principalement utilisée dans les applications de
refroidissement ; cependant, les hydrates de sel et les acides gras ont été utilisés dans certains cas.
La sélection des MCP les plus appropriés pour un climat spécifique et pour une application spécifique
a été aussi discutée. La température de fusion est le paramètre le plus influent, certains auteurs
admettent que des températures de fusion élevées semblent plus efficaces pour les climats plus
chauds, tandis que les températures de fusion basses peuvent être plus efficace dans les climats froids.
D’autres ont insisté sur l'importance de choisir la température de fusion de MCP dans la plage de
confort, puis d’effectuer une optimisation en testant différentes températures de fusion au sein de la
plage de confort. En plus, les systèmes avec plusieurs MCP ayant des températures de fusion

Annexes
294
différentes sont considérés comme une recherche future importante, et devraient être développés afin
d'améliorer la performance du bâtiment dans les deux saisons de refroidissement et de chauffage. Par
ailleurs, pour une quantité précisée du MCP, il a été montré que les économies d'énergie et donc
l'efficacité du MCP augmentent avec la diminution de l'épaisseur de la couche du MCP et
l'augmentation de la surface d’échange jusqu'à un certain niveau optimal. La sélection d'une quantité
appropriée de MCP pour le stockage thermique nécessite également d'autres recherches
complémentaires. Finalement, un diagramme topologique résumant les méthodes de choix des MCP
dans les bâtiments est présenté.
Annexes
295
References
[1] “IEA_Solar_HC_Roadmap_FoldOut_Print.pdf.” .
[2] C. Initiative, “Buildings and Climate Change http://admin.indiaenvironmentportal.org.in/files/SBCI-
BCCSummary.pdf,” 2009.
[3] “http://www.iea.org/Textbase/npsum/building2013SUM.pdf.” .
[4] “European Union, Directive 2012/27/EU of the European parliament and of the council efficiency.”
Official Journal of the European Union, 25-Oct-2012.
[5].“https://ec.europa.eu/energy/sites/ener/files/documents/2014_final_report_eu_building_heat_demand.pdf.
”
[6] European Commission, Joint Research Centre, and European Technology Platform on Renewable
Heating and Cooling (RHC-Platform), 2020-2030-2050, common vision for the renewable heating and
cooling sector in Europe: European technology platform on renewable heating and cooling.
Luxembourg: EUR-OP, 2011.
[7] C. V. Konstantinidou and A. Novoselac, “Integration of thermal energy storage in buildings,” Univ. Tex.
Austin, 2010.
[8] X. Wang, D. Chen, and Z. Ren, “Global warming and its implication to emission reduction strategies for
residential buildings,” Build. Environ., vol. 46, no. 4, pp. 871–883, Apr. 2011.
[9] L. Pérez-Lombard, J. Ortiz, and C. Pout, “A review on buildings energy consumption information,”
Energy Build., vol. 40, no. 3, pp. 394–398, Jan. 2008.
[10] Agence internationale de l’énergie and Organisation de coopération et de développement économiques,
Energy technology perspectives: scenarios & strategies to 2050 : in support of the G8 Plan of action.
Paris: OECD, IEA, 2006.
[11] M. M. Farid, A. M. Khudhair, S. A. K. Razack, and S. Al-Hallaj, “A review on phase change energy
storage: materials and applications,” Energy Convers. Manag., vol. 45, no. 9–10, pp. 1597–1615, Jun.
2004.
[12] J. Kośny, PCM-Enhanced Building Components. Cham: Springer International Publishing, 2015.
[13] H. Mehling and L. F. Cabeza, Heat and Cold Storage with PCM: An up to Date Introduction in to
Basics and Applications. Springer, 2008.
[14] S. N. AL-Saadi and Z. (John) Zhai, “Modeling phase change materials embedded in building enclosure:
A review,” Renew. Sustain. Energy Rev., vol. 21, pp. 659–673, May 2013.
[15] R. Baetens, B. P. Jelle, and A. Gustavsen, “Phase change materials for building applications: A state-of-
the-art review,” Energy Build., vol. 42, no. 9, pp. 1361–1368, Sep. 2010.
[16] L. F. Cabeza, A. Castell, C. Barreneche, A. de Gracia, and A. I. Fernández, “Materials used as PCM in
thermal energy storage in buildings: A review,” Renew. Sustain. Energy Rev., vol. 15, no. 3, pp. 1675–
1695, Apr. 2011.
[17] A. M. Khudhair and M. M. Farid, “A review on energy conservation in building applications with
thermal storage by latent heat using phase change materials,” Energy Convers. Manag., vol. 45, no. 2,
pp. 263–275, Jan. 2004.
[18] F. Kuznik, D. David, K. Johannes, and J.-J. Roux, “A review on phase change materials integrated in
building walls,” Renew. Sustain. Energy Rev., vol. 15, no. 1, pp. 379–391, Jan. 2011.
[19] S. A. Memon, “Phase change materials integrated in building walls: A state of the art review,” Renew.
Sustain. Energy Rev., vol. 31, pp. 870–906, Mar. 2014.
[20] S. M. Hasnain, “Review on sustainable thermal energy storage technologies, part I: heat storage
materials and techniques,” Energy Convers. Manag., vol. 39, no. 11, pp. 1127–1138, 1998.
[21] N. Artmann, R. L. Jensen, H. Manz, and P. Heiselberg, “Experimental investigation of heat transfer
during night-time ventilation,” Energy Build., vol. 42, no. 3, pp. 366–374, Mar. 2010.
[22] M. Santamouris, K. Pavlou, A. Synnefa, K. Niachou, and D. Kolokotsa, “Recent progress on passive
cooling techniques,” Energy Build., vol. 39, no. 7, pp. 859–866, Jul. 2007.
[23] U. Desideri, S. Proietti, and P. Sdringola, “Solar-powered cooling systems: Technical and economic
analysis on industrial refrigeration and air-conditioning applications,” Appl. Energy, vol. 86, no. 9, pp.
1376–1386, Sep. 2009.
[24] E. Osterman, V. V. Tyagi, V. Butala, N. A. Rahim, and U. Stritih, “Review of PCM based cooling
technologies for buildings,” Energy Build., vol. 49, pp. 37–49, Jun. 2012.

Annexes
296
[25] A. Waqas and Z. Ud Din, “Phase change material (PCM) storage for free cooling of buildings—A
review,” Renew. Sustain. Energy Rev., vol. 18, pp. 607–625, Feb. 2013.
[26] M. Koschenz and B. Lehmann, “Development of a thermally activated ceiling panel with PCM for
application in lightweight and retrofitted buildings,” Energy Build., vol. 36, no. 6, pp. 567–578, Jun.
2004.
[27] D. W. Hawes, D. Feldman, and D. Banu, “Latent heat storage in building materials,” Energy and
Buildings, pp. 77–86, 1993.
[28] A. . Futane, S. R. Karale, and U. S. Wamkhede, “A review on free cooling through heat pipe by using
phase change materials,” nternational Journal of Engineering Science and Technology, pp. 4556–4563.,
2011.
[29] C. Liang and X. Lingling, “Microencapsulation of butyl stearate as a phase change material by
interfacial polycondensation in a polyurea system,” Energy Conversion and Management, p. 50 (3) 723–
729., 2009.
[30] P. Kauranen, and K. Peippo, “An organic PCM storage system with adjustable melting temperature,”
Solar Energy 46 (5) (1991) 275–278.
[31] V. V. Tyagi and D. Buddhi, “Thermal cycle testing of calcium chloride hexahydrate as a possible PCM
for latent heat storage,” Solar Energy Materials and Solar Cells, 92 (8) ( ) 891–899 2008.
[32] M. Thambidurai, K. Panchabikesan, K. M. N, and V. Ramalingam, “Review on phase change material
based free cooling of buildings—The way toward sustainability,” J. Energy Storage, vol. 4, pp. 74–88,
Dec. 2015.
[33] S. Kamali, “Review of free cooling system using phase change material for building,” Energy Build.,
vol. 80, pp. 131–136, Sep. 2014.
[34] V. Butala and U. Stritih, “Experimental investigation of PCM cold storage,” Energy Build., vol. 41, no.
3, pp. 354–359, Mar. 2009.
[35] V. A. A. Raj and R. Velraj, “Review on free cooling of buildings using phase change materials,” Renew.
Sustain. Energy Rev., vol. 14, no. 9, pp. 2819–2829, Dec. 2010.
[36] B. Zalba, J. M. Marın, L. F. Cabeza, and H. Mehling, “Free-cooling of buildings with phase change
materials,” Int. J. Refrig., vol. 27, no. 8, pp. 839–849, Dec. 2004.
[37] A. H. Mosaffa, C. A. Infante Ferreira, F. Talati, and M. A. Rosen, “Thermal performance of a multiple
PCM thermal storage unit for free cooling,” Energy Convers. Manag., vol. 67, pp. 1–7, Mar. 2013.
[38] A. H. Mosaffa, C. A. Infante Ferreira, M. A. Rosen, and F. Talati, “Thermal performance optimization
of free cooling systems using enhanced latent heat thermal storage unit,” Appl. Therm. Eng., vol. 59, no.
1–2, pp. 473–479, Sep. 2013.
[39] M. R. Anisur, M. A. Kibria, M. H. Mahfuz, R. Saidur, and I. H. S. C. Metselaar, “Cooling of air using
heptadecane phase change material in shell and tube arrangement: Analytical and experimental study,”
Energy Build., vol. 85, pp. 98–106, Dec. 2014.
[40] F. Rouault, D. Bruneau, P. Sebastian, and J. Lopez, “Numerical modelling of tube bundle thermal
energy storage for free-cooling of buildings,” Appl. Energy, vol. 111, pp. 1099–1106, Nov. 2013.
[41] E. Osterman, V. Butala, and U. Stritih, “PCM thermal storage system for ‘free’ heating and cooling of
buildings,” Energy Build., Jul. 2015.
[42] A. A. R. Darzi, S. M. Moosania, F. L. Tan, and M. Farhadi, “Numerical investigation of free-cooling
system using plate type PCM storage,” Int. Commun. Heat Mass Transf., vol. 48, pp. 155–163, Nov.
2013.
[43] A. Lazaro, P. Dolado, J. M. Marín, and B. Zalba, “PCM–air heat exchangers for free-cooling
applications in buildings: Experimental results of two real-scale prototypes,” Energy Convers. Manag.,
vol. 50, no. 3, pp. 439–443, Mar. 2009.
[44] G. Tan and D. Zhao, “Study of a thermoelectric space cooling system integrated with phase change
material,” Appl. Therm. Eng., vol. 86, pp. 187–198, Jul. 2015.
[45] K. Yanbing, J. Yi, and Z. Yinping, “Modeling and experimental study on an innovative passive cooling
system—NVP system,” Energy Build., vol. 35, no. 4, pp. 417–425, 2003.
[46] S. Takeda, K. Nagano, T. Mochida, and K. Shimakura, “Development of a ventilation system utilizing
thermal energy storage for granules containing phase change material,” Sol. Energy, vol. 77, no. 3, pp.
329–338, Sep. 2004.
[47] A. Waqas and S. Kumar, “Thermal performance of latent heat storage for free cooling of buildings in a
dry and hot climate: An experimental study,” Energy Build., vol. 43, no. 10, pp. 2621–2630, Oct. 2011.

Annexes
297
[48] C. Arkar, B. Vidrih, and S. Medved, “Efficiency of free cooling using latent heat storage integrated into
the ventilation system of a low energy building,” Int. J. Refrig., vol. 30, no. 1, pp. 134–143, Jan. 2007.
[49] U. Stritih and V. Butala, “Experimental investigation of energy saving in buildings with PCM cold
storage,” Int. J. Refrig., vol. 33, no. 8, pp. 1676–1683, Dec. 2010.
[50] J. R. Turnpenny, D. W. Etheridge, and D. A. Reay, “Novel ventilation system for reducing air
conditioning in buildings. Part II: testing of prototype,” Appl. Therm. Eng., vol. 21, no. 12, pp. 1203–
1217, 2001.
[51] K. Nagano, S. Takeda, T. Mochida, K. Shimakura, and T. Nakamura, “Study of a floor supply air
conditioning system using granular phase change material to augment building mass thermal storage—
Heat response in small scale experiments,” Energy Build., vol. 38, no. 5, pp. 436–446, May 2006.
[52] J. N. W. Chiu, P. Gravoille, and V. Martin, “Active free cooling optimization with thermal energy
storage in Stockholm,” Appl. Energy, vol. 109, pp. 523–529, Sep. 2013.
[53] H.-M. Henning, “Solar assisted air conditioning of buildings – an overview,” Appl. Therm. Eng., vol. 27,
no. 10, pp. 1734–1749, Jul. 2007.
[54] M. Helm, C. Keil, S. Hiebler, H. Mehling, and C. Schweigler, “Solar heating and cooling system with
absorption chiller and low temperature latent heat storage: Energetic performance and operational
experience,” Int. J. Refrig., vol. 32, no. 4, pp. 596–606, Jun. 2009.
[55] M. Helm, K. Hagel, W. Pfeffer, S. Hiebler, and C. Schweigler, “Solar Heating and Cooling System with
Absorption Chiller and Latent Heat Storage – A Research Project Summary,” Energy Procedia, vol. 48,
pp. 837–849, 2014.
[56] A. Gil, C. Barreneche, P. Moreno, C. Solé, A. Inés Fernández, and L. F. Cabeza, “Thermal behaviour of
d-mannitol when used as PCM: Comparison of results obtained by DSC and in a thermal energy storage
unit at pilot plant scale,” Appl. Energy, vol. 111, pp. 1107–1113, Nov. 2013.
[57] A. Gil, E. Oró, A. Castell, and L. F. Cabeza, “Experimental analysis of the effectiveness of a high
temperature thermal storage tank for solar cooling applications,” Appl. Therm. Eng., vol. 54, no. 2, pp.
521–527, May 2013.
[58] A. Gil, E. Oró, L. Miró, G. Peiró, Á. Ruiz, J. M. Salmerón, and L. F. Cabeza, “Experimental analysis of
hydroquinone used as phase change material (PCM) to be applied in solar cooling refrigeration,” Int. J.
Refrig., vol. 39, pp. 95–103, Mar. 2014.
[59] J. F. Belmonte, M. A. Izquierdo-Barrientos, P. Eguía, A. E. Molina, and J. A. Almendros-Ibáñez, “PCM
in the heat rejection loops of absorption chillers. A feasibility study for the residential sector in Spain,”
Energy Build., vol. 80, pp. 331–351, Sep. 2014.
[60] F. Agyenim, M. Rhodes, and I. Knight, “The use of phase change material (PCM) to improve the
coefficient of perform-ance of a chiller for meeting domestic cooling in Wales,” in 2nd PALENC
Conference and 28th AIVC Conference on Building Low Energy Cooling and Advanced Ventilation
Technologies in the 21sr Century, Crete island, Greece, 2007.
[61] G. Fang, S. Wu, and X. Liu, “Experimental study on cool storage air-conditioning system with spherical
capsules packed bed,” Energy Build., vol. 42, no. 7, pp. 1056–1062, Jul. 2010.
[62] N. Chaiyat, “Energy and economic analysis of a building air-conditioner with a phase change material
(PCM),” Energy Convers. Manag., vol. 94, pp. 150–158, Apr. 2015.
[63] F. Bruno, N. H. S. Tay, and M. Belusko, “Minimising energy usage for domestic cooling with off-peak
PCM storage,” Energy Build., vol. 76, pp. 347–353, Jun. 2014.
[64] D. Zhao and G. Tan, “Numerical analysis of a shell-and-tube latent heat storage unit with fins for air-
conditioning application,” Appl. Energy, vol. 138, pp. 381–392, Jan. 2015.
[65] M. Yamaha and S. Misaki, “The Evaluation of Peak Shaving by a Thermal Storage System Using Phase-
Change Materials in Air Distribution Systems,” HVACR Res., vol. 12, 2006.
[66] E. Rodriguez-Ubinas, L. Ruiz-Valero, S. Vega, and J. Neila, “Applications of Phase Change Material in
highly energy-efficient houses,” Energy Build., vol. 50, pp. 49–62, Jul. 2012.
[67] “solardecathlon.” .
[68] S. Zhang and J. Niu, “Cooling performance of nocturnal radiative cooling combined with
microencapsulated phase change material (MPCM) slurry storage,” Energy Build., vol. 54, pp. 122–130,
Nov. 2012.
[69] R. Ansuini, R. Larghetti, A. Giretti, and M. Lemma, “Radiant floors integrated with PCM for indoor
temperature control,” Energy Build., vol. 43, no. 11, pp. 3019–3026, Nov. 2011.
[70] X. Wang, J. Niu, and A. H. C. van Paassen, “Raising evaporative cooling potentials using combined
cooled ceiling and MPCM slurry storage,” Energy Build., vol. 40, no. 9, pp. 1691–1698, Jan. 2008.

Annexes
298
[71] S. E. Kalnæs and B. P. Jelle, “Phase change materials and products for building applications: A state-of-
the-art review and future research opportunities,” Energy Build., vol. 94, pp. 150–176, May 2015.
[72] M. Pomianowski, P. Heiselberg, and Y. Zhang, “Review of thermal energy storage technologies based
on PCM application in buildings,” Energy Build., vol. 67, pp. 56–69, Dec. 2013.
[73] N. Zhu, Z. Ma, and S. Wang, “Dynamic characteristics and energy performance of buildings using phase
change materials: A review,” Energy Convers. Manag., vol. 50, no. 12, pp. 3169–3181, Dec. 2009.
[74] N. Soares, J. J. Costa, A. R. Gaspar, and P. Santos, “Review of passive PCM latent heat thermal energy
storage systems towards buildings’ energy efficiency,” Energy Build., vol. 59, pp. 82–103, Apr. 2013.
[75] S. Scalat, D. Banu, D. Hawes, J. Parish, F. Haghighata, and D. Feldman, “Full scale thermal testing of
latent heat storage in wallboard,” Sol. Energy Mater. Sol. Cells, vol. 44, no. 1, pp. 49–61, 1996.
[76] F. Kuznik, J. Virgone, and K. Johannes, “In-situ study of thermal comfort enhancement in a renovated
building equipped with phase change material wallboard,” Renew. Energy, vol. 36, no. 5, pp. 1458–
1462, May 2011.
[77] A. Athienitis, C. Liu, D. Hawes, D. Banu, and D. Feldman, “Investigation of the thermal performance of
a passive solar test-room with wall latent heat storage,” Build Env., 1997.
[78] D. A. Neeper, “Thermal dynamics of wallboard with latent heat storage,” Sol. Energy, vol. 68, no. 5, pp.
393–403, 2000.
[79] X. Xu, Y. Zhang, K. Lin, H. Di, and R. Yang, “Modeling and simulation on the thermal performance of
shape-stabilized phase change material floor used in passive solar buildings,” Energy Build., vol. 37, no.
10, pp. 1084–1091, Oct. 2005.
[80] A. Pasupathy and R. Velraj, “Effect of double layer phase change material in building roof for year
round thermal management,” Energy Build., vol. 40, no. 3, pp. 193–203, Jan. 2008.
[81] J. Kośny, K. Biswas, W. Miller, and S. Kriner, “Field thermal performance of naturally ventilated solar
roof with PCM heat sink,” Sol. Energy, vol. 86, no. 9, pp. 2504–2514, Sep. 2012.
[82] K. A. R. Ismail, C. T. Salinas, and J. R. Henriquez, “Comparison between PCM filled glass windows
and absorbing gas filled windows,” Energy Build., vol. 40, no. 5, pp. 710–719, Jan. 2008.
[83] F. Goia, M. Perino, and V. Serra, “Improving thermal comfort conditions by means of PCM glazing
systems,” Energy Build., vol. 60, pp. 442–452, May 2013.
[84] H. Weinlaeder, W. Koerner, and M. Heidenfelder, “Monitoring results of an interior sun protection
system with integrated latent heat storage,” Energy Build., vol. 43, no. 9, pp. 2468–2475, Sep. 2011.
[85] A. G. Entrop, H. J. H. Brouwers, and A. H. M. E. Reinders, “Experimental research on the use of micro-
encapsulated Phase Change Materials to store solar energy in concrete floors and to save energy in
Dutch houses,” Sol. Energy, vol. 85, no. 5, pp. 1007–1020, May 2011.
[86] L. F. Cabeza, C. Castellón, M. Nogués, M. Medrano, R. Leppers, and O. Zubillaga, “Use of
microencapsulated PCM in concrete walls for energy savings,” Energy Build., vol. 39, no. 2, pp. 113–
119, Feb. 2007.
[87] P. Arce, C. Castellón, A. Castell, and L. F. Cabeza, “Use of microencapsulated PCM in buildings and
the effect of adding awnings,” Energy Build., vol. 44, pp. 88–93, Jan. 2012.
[88] L. Royon, L. Karim, and A. Bontemps, “Thermal energy storage and release of a new component with
PCM for integration in floors for thermal management of buildings,” Energy Build., vol. 63, pp. 29–35,
Aug. 2013.
[89] X. Kong, S. Lu, Y. Li, J. Huang, and S. Liu, “Numerical study on the thermal performance of building
wall and roof incorporating phase change material panel for passive cooling application,” Energy Build.,
vol. 81, pp. 404–415, Oct. 2014.
[90] E. M. Alawadhi and H. J. Alqallaf, “Building roof with conical holes containing PCM to reduce the
cooling load: Numerical study,” Energy Convers. Manag., vol. 52, no. 8–9, pp. 2958–2964, Aug. 2011.
[91] X. Sun, Q. Zhang, M. A. Medina, and K. O. Lee, “Energy and economic analysis of a building enclosure
outfitted with a phase change material board (PCMB),” Energy Convers. Manag., vol. 83, pp. 73–78,
Jul. 2014.
[92] E. M. Alawadhi, “Using phase change materials in window shutter to reduce the solar heat gain,” Energy
Build., vol. 47, pp. 421–429, Apr. 2012.
[93] G. Zhou, Y. Yang, X. Wang, and S. Zhou, “Numerical analysis of effect of shape-stabilized phase
change material plates in a building combined with night ventilation,” Appl. Energy, vol. 86, no. 1, pp.
52–59, Jan. 2009.
[94] A. L. S. Chan, “Energy and environmental performance of building façades integrated with phase
change material in subtropical Hong Kong,” Energy Build., vol. 43, no. 10, pp. 2947–2955, Oct. 2011.

Annexes
299
[95] S. M. Sajjadian, J. Lewis, and S. Sharples, “The potential of phase change materials to reduce domestic
cooling energy loads for current and future UK climates,” Energy Build., vol. 93, pp. 83–89, Apr. 2015.
[96] K. O. Lee, M. A. Medina, E. Raith, and X. Sun, “Assessing the integration of a thin phase change
material (PCM) layer in a residential building wall for heat transfer reduction and management,” Appl.
Energy, vol. 137, pp. 699–706, Jan. 2015.
[97] C. Voelker, O. Kornadt, and M. Ostry, “Temperature reduction due to the application of phase change
materials,” Energy Build., vol. 40, no. 5, pp. 937–944, Jan. 2008.
[98] S. D. Zwanzig, Y. Lian, and E. G. Brehob, “Numerical simulation of phase change material composite
wallboard in a multi-layered building envelope,” Energy Convers. Manag., vol. 69, pp. 27–40, May
2013.
[99] L. Shilei, F. Guohui, Z. Neng, and D. Li, “Experimental study and evaluation of latent heat storage in
phase change materials wallboards,” Energy Build., vol. 39, no. 10, pp. 1088–1091, Oct. 2007.
[100] X. Shi, S. A. Memon, W. Tang, H. Cui, and F. Xing, “Experimental assessment of position of macro
encapsulated phase change material in concrete walls on indoor temperatures and humidity levels,”
Energy Build., vol. 71, pp. 80–87, Mar. 2014.
[101] F. Kuznik, J. Virgone, and J.-J. Roux, “Energetic efficiency of room wall containing PCM
wallboard: A full-scale experimental investigation,” Energy Build., vol. 40, no. 2, pp. 148–156, Jan.
2008.
[102] A. Castell, I. Martorell, M. Medrano, G. Pérez, and L. F. Cabeza, “Experimental study of using PCM
in brick constructive solutions for passive cooling,” Energy Build., vol. 42, no. 4, pp. 534–540, Apr.
2010.
[103] I. Cerón, J. Neila, and M. Khayet, “Experimental tile with phase change materials (PCM) for
building use,” Energy Build., vol. 43, no. 8, pp. 1869–1874, Aug. 2011.
[104] C. Zhang, Y. Chen, L. Wu, and M. Shi, “Thermal response of brick wall filled with phase change
materials (PCM) under fluctuating outdoor temperatures,” Energy Build., vol. 43, no. 12, pp. 3514–
3520, Dec. 2011.
[105] C. K. Halford and R. F. Boehm, “Modeling of phase change material peak load shifting,” Energy
Build., vol. 39, no. 3, pp. 298–305, Mar. 2007.
[106] J. Kosny, E. Kossecka, A. Brzezinski, A. Tleoubaev, and D. Yarbrough, “Dynamic thermal
performance analysis of fiber insulations containing bio-based phase change materials (PCMs),” Energy
Build., vol. 52, pp. 122–131, Sep. 2012.
[107] G. Evola, L. Marletta, and F. Sicurella, “A methodology for investigating the effectiveness of PCM
wallboards for summer thermal comfort in buildings,” Build. Environ., vol. 59, pp. 517–527, Jan. 2013.
[108] H. Mehling and L. F. Cabeza, “Heat and cold storage with PCM,” Hand Book Publ. Springer Ger.,
2008.
[109] F. Kaltenbach, “PCM Latent Thermal Storage Media Heating and Cooling without Energy
Consumption,” pp. 544–549, 2005.
[110] T. Kondo and T. Ibamoto, “Research on Thermal Storage Using Rock Wool Phase-Change Material
Ceiling Board,” ASHRAE Trans., vol. 112, no. 1, Jan. 2006.
[111] S. M. Vakilaltojjar and W. Saman, “Analysis and modelling of a phase change storage system for air
conditioning applications,” Appl. Therm. Eng., vol. 21, no. 3, pp. 249–263, 2001.
[112] W. Saman, F. Bruno, and E. Halawa, “Thermal performance of PCM thermal storage unit for a roof
integrated solar heating system,” Sol. Energy, vol. 78, no. 2, pp. 341–349, Feb. 2005.
[113] X. Jin and X. Zhang, “Thermal analysis of a double layer phase change material floor,” Appl. Therm.
Eng., vol. 31, no. 10, pp. 1576–1581, Jul. 2011.
[114] “Directive 2010/31/EU of the European Parliament and of the Council on the Energy Performance
of Buildings.” 19-May-2010.
[115] G. Diarce, A. Urresti, A. García-Romero, A. Delgado, A. Erkoreka, C. Escudero, and Á. Campos-
Celador, “Ventilated active façades with PCM,” Appl. Energy, vol. 109, pp. 530–537, Sep. 2013.
[116] A. de Gracia, L. Navarro, A. Castell, and L. F. Cabeza, “Energy performance of a ventilated double
skin facade with PCM under different climates,” Energy Build., vol. 91, pp. 37–42, Mar. 2015.
[117] A. de Gracia, L. Navarro, A. Castell, Á. Ruiz-Pardo, S. Álvarez, and L. F. Cabeza, “Thermal
analysis of a ventilated facade with PCM for cooling applications,” Energy Build., vol. 65, pp. 508–515,
Oct. 2013.

Annexes
300
[118] N. Safer, M. Woloszyn, and J. J. Roux, “Three-dimensional simulation with a CFD tool of the
airflow phenomena in single floor double-skin facade equipped with a venetian blind,” Sol. Energy, vol.
79, no. 2, pp. 193–203, Aug. 2005.
[119] A. de Gracia, L. Navarro, A. Castell, Á. Ruiz-Pardo, S. Alvárez, and L. F. Cabeza, “Experimental
study of a ventilated facade with PCM during winter period,” Energy Build., vol. 58, pp. 324–332, Mar.
2013.
[120] S. Álvarez, L. F. Cabeza, A. Ruiz-Pardo, A. Castell, and J. A. Tenorio, “Building integration of
PCM for natural cooling of buildings,” Appl. Energy, vol. 109, pp. 514–522, Sep. 2013.
[121] G. Evola, L. Marletta, and F. Sicurella, “Simulation of a ventilated cavity to enhance the
effectiveness of PCM wallboards for summer thermal comfort in buildings,” Energy Build., vol. 70, pp.
480–489, Feb. 2014.
[122] U. Eicker, “Cooling strategies, summer comfort and energy performance of a rehabilitated passive
standard office building,” Appl. Energy, vol. 87, no. 6, pp. 2031–2039, Jun. 2010.
[123] M. Jaworski, “Thermal performance of building element containing phase change material (PCM)
integrated with ventilation system – An experimental study,” Appl. Therm. Eng., vol. 70, no. 1, pp. 665–
674, Sep. 2014.
[124] M. Jaworski, P. Łapka, and P. Furmański, “Numerical modelling and experimental studies of
thermal behaviour of building integrated thermal energy storage unit in a form of a ceiling panel,” Appl.
Energy, vol. 113, pp. 548–557, Jan. 2014.
[125] J. Persson and M. Westermark, “Phase change material cool storage for a Swedish Passive House,”
Energy Build., vol. 54, pp. 490–495, Nov. 2012.
[126] X. Wang and J. Niu, “Performance of cooled-ceiling operating with MPCM slurry,” Energy
Convers. Manag., vol. 50, no. 3, pp. 583–591, Mar. 2009.
[127] P. Schossig, H. Henning, S. Gschwander, and T. Haussmann, “Micro-encapsulated phase-change
materials integrated into construction materials,” Sol. Energy Mater. Sol. Cells, vol. 89, no. 2–3, pp.
297–306, Nov. 2005.
[128] Y. Zhang, G. Zhou, K. Lin, Q. Zhang, and H. Di, “Application of latent heat thermal energy storage
in buildings: State-of-the-art and outlook,” Build. Environ., vol. 42, no. 6, pp. 2197–2209, Jun. 2007.
[129] M. Wetter and J. Wright, “A comparison of deterministic and probabilistic optimization algorithms
for nonsmooth simulation-based optimization,” Build. Environ., vol. 39, no. 8, pp. 989–999, Aug. 2004.
[130] E. Asadi, M. G. da Silva, C. H. Antunes, and L. Dias, “A multi-objective optimization model for
building retrofit strategies using TRNSYS simulations, GenOpt and MATLAB,” Build. Environ., vol.
56, pp. 370–378, Oct. 2012.
[131] A. Hasan, M. Vuolle, and K. Sirén, “Minimisation of life cycle cost of a detached house using
combined simulation and optimisation,” Build. Environ., vol. 43, no. 12, pp. 2022–2034, Dec. 2008.
[132] M. Fesanghary, S. Asadi, and Z. W. Geem, “Design of low-emission and energy-efficient residential
buildings using a multi-objective optimization algorithm,” Build. Environ., vol. 49, pp. 245–250, Mar.
2012.
[133] M. Kottek, J. Grieser, C. Beck, B. Rudolf, and F. Rubel, “World Map of the Köppen-Geiger climate
classification updated,” Meteorol. Z., vol. 15, no. 3, pp. 259–263, Jun. 2006.
[134] C. Reardon, “Design for climate, passive design.” 2013.
[135] N. Soares, A. R. Gaspar, P. Santos, and J. J. Costa, “Multi-dimensional optimization of the
incorporation of PCM-drywalls in lightweight steel-framed residential buildings in different climates,”
Energy Build., vol. 70, pp. 411–421, Feb. 2014.
[136] M. Alam, H. Jamil, J. Sanjayan, and J. Wilson, “Energy saving potential of phase change materials
in major Australian cities,” Energy Build., vol. 78, pp. 192–201, Aug. 2014.
[137] F. Ascione, N. Bianco, R. F. De Masi, F. de’ Rossi, and G. P. Vanoli, “Energy refurbishment of
existing buildings through the use of phase change materials: Energy savings and indoor comfort in the
cooling season,” Appl. Energy, vol. 113, pp. 990–1007, Jan. 2014.
[138] A. Aranda-Usón, G. Ferreira, A. M. López-Sabirón, M. D. Mainar-Toledo, and I. Zabalza Bribián,
“Phase change material applications in buildings: An environmental assessment for some Spanish
climate severities,” Sci. Total Environ., vol. 444, pp. 16–25, Feb. 2013.
[139] J. Borderon, J. Virgone, and R. Cantin, “Modeling and simulation of a phase change material system
for improving summer comfort in domestic residence,” Appl. Energy, vol. 140, pp. 288–296, Feb. 2015.
[140] S. Medved and C. Arkar, “Correlation between the local climate and the free-cooling potential of
latent heat storage,” Energy Build., vol. 40, no. 4, pp. 429–437, Jan. 2008.

Annexes
301
[141] W. Xiao, X. Wang, and Y. Zhang, “Analytical optimization of interior PCM for energy storage in a
lightweight passive solar room,” Appl. Energy, vol. 86, no. 10, pp. 2013–2018, Oct. 2009.
[142] C. Barreneche, H. Navarro, S. Serrano, L. F. Cabeza, and A. I. Fernández, “New Database on Phase
Change Materials for Thermal Energy Storage in Buildings to Help PCM Selection,” Energy Procedia,
vol. 57, pp. 2408–2415, 2014.
[143] D. Heim and J. A. Clarke, “Numerical modelling and thermal simulation of PCM–gypsum
composites with ESP-r,” Energy Build., vol. 36, no. 8, pp. 795–805, Aug. 2004.
[144] K. Peippo, P. Kauranen, and P. Lund, “Multicomponent PCM wall optimized for passive solar
heating,” Energy Build., 1991.
[145] C. Kendrick and N. Walliman, “Removing unwanted heat in lightweight buildings using phase
change materials in building components: simulation modelling for PCM plasterboard,” Archit. Sci.
Rev., vol. 50, no. 3, pp. 265–273, 2007.
[146] F. Fiorito, “Phase-change Materials for Indoor Comfort Improvement in Lightweight Buildings. A
Parametric Analysis for Australian Climates,” Energy Procedia, vol. 57, pp. 2014–2022, 2014.
[147] A. Waqas and S. Kumar, “Utilization of Latent Heat Storage Unit for Comfort Ventilation of
Buildings in Hot and Dry Climates,” Int. J. Green Energy, 2011.
[148] F. Jiang, X. Wang, and Y. Zhang, “A new method to estimate optimal phase change material
characteristics in a passive solar room,” Energy Convers. Manag., vol. 52, no. 6, pp. 2437–2441, Jun.
2011.
[149] M. M. Farid, “Solar energy storage with phase change,” J. Sol. Energy Res., 1986.
[150] V. V. Tyagi and D. Buddhi, “PCM thermal storage in buildings: A state of art,” Renew. Sustain.
Energy Rev., vol. 11, no. 6, pp. 1146–1166, Aug. 2007.
[151] D. Zhou, C. Y. Zhao, and Y. Tian, “Review on thermal energy storage with phase change materials
(PCMs) in building applications,” Appl. Energy, vol. 92, pp. 593–605, Apr. 2012.

Annexes
302

Annexes
303
Annex B: Graphical user interface GUI
GUIs, also known as graphical user interfaces or UIs, provide point-and-click control of software
applications, eliminating the need to learn a language or type commands to run the application. The
image processing toolbox needs to be installed.
A GUI is created to model the phase change problem in rectangular cavity in presence of natural
convection and radiation. The inputs need to be inserted: thermo-physical and optical PCM properties,
geometry of the PCM container, mesh size, boundary and initial conditions, in addition to time step
and number of time steps. Two commands are used to define these inputs: ‘edit text’ and ‘static text’
and the values are tagged in the main program (.m file).
As outputs the GUI provides the average liquid fraction, the average position of the melting front
and the position of melting front at different instants for both cases (phase change with natural
convection and phase change e with natural convection radiation). Three commands are used to
show the results: ‘push bottom’, ‘axes’ and ‘pop up menu’.

Annexes
304

Annexes
305
Annex C: List of Publications
The results of the current work are published in peer-reviewed journals. Four journal papers are
published, and one is submitted:
- Farah Souayfane, Farouk Fardoun, Pascal Henry Biwole. “Phase Change Materials (PCM) for
cooling applications in buildings: A review”. Energy and Buildings, Elsevier, 2016, 129, pp.396-431.
- Farah Souayfane, Pascal Henry Biwole, Farouk Fardoun. “Melting of a phase change material in
presence of natural convection and radiation: A simplified model”. Applied Thermal Engineering,
Elsevier, 2018, 130, pp.660 – 671
- Farah Souayfane, Pascal Henry Biwole, Farouk Fardoun. “Thermal behavior of a translucent
superinsulated latent heat energy storage wall in summertime”. Applied Energy, 2018, 217, pp. 390-
408.
- Farah Souayfane, Farouk Fardoun, Pascal Henry Biwole. “Energy Performance and Economic
Analysis of a TIM-PCM Wall Under Different Climates”. Submitted to Energy, revision requested,
2018.
- Pascal Henry Biwole, Dominic Groulx, Farah Souayfane, Tim Chiu. “Influence of fin size and
distribution on solid-liquid phase change in a rectangular enclosure”. International Journal of Thermal
Sciences, Elsevier, 2018, 124, pp.433 - 446.
International Conference Papers:
- Farah Souayfane, Pascal Henry Biwole, Farouk Fardoun. “Melting of a phase change material in
presence of natural convection and radiation: A simplified model for engineering applications”.
Thermal and fluid engineering conference (TFEC), Fort Lauderdale, USA, March 2018.
- Farah Souayfane, Pascal Henry Biwole, Farouk Fardoun. "Modèle simplifié pour la prise en compte
de la convection naturelle dans la modélisation du changement de phase solide-liquide”. XIIIème
Colloque Interuniversitaire Franco-Québécois sur la Thermique des Systèmes, Saint Lo, France, May
2017.
- Farah Souayfane, Farouk Fardoun, Pascal Henry Biwole. “Different mathematical models of
convection during phase change”. Renewable Energies for Developing Countries (REDEC), Third
international conference, Beirut, Lebanon, July 2016
Press release in the Science Trends website:
Farah Souayfane, Pascal Henry Biwole, Farouk Fardoun & Patrick Achard “Novel translucent
superinsulated latent heat storage wall’’ https://sciencetrends.com/novel-translucent-
superinsulated-latent-heat-storage-wall/