Model Paper - Hodder Education
27
National 5 Geography Model Paper WITH ANSWERS
-
Upload
khangminh22 -
Category
Documents
-
view
0 -
download
0
Transcript of Model Paper - Hodder Education

National 5 Geography
Model Paper WITH ANSWERS

This model paper is free to download and use for revision purposes. The paper, which may include a limited number of previously published SQA questions, has been specially commissioned by Hodder Gibson, and has been written by experienced senior teachers and examiners. This is not SQA material but has been devised to provide further practice for SQA National Qualification examinations in 2016 and beyond. Model Question Papers and Answers © Hodder Gibson. All rights reserved. Hodder Gibson would like to thank SQA for use of any past exam questions that may have been used in model papers, whether amended or in original form. Hodder Gibson is grateful for the use of the following: Image © gary yim/Shutterstock.com (Model Paper 1 page 6); The diagram ‘Land Use in the Rainforest’ © Rhett A. Butler/Mongabay.com (Model Paper 1 page 10); The diagram ‘Global Tourist Arrivals 1990−2011’ adapted from: http://en.ria.ru/infographics/20120928/176277103.html?id= © RIA Novosti/UNWTO (United Nations World Tourism Organization) (Model Paper 1 page 13); Image © Oliver Hoffmann/Shutterstock.com (Model Paper 1 page 14); Image © Africa Studio/Shutterstock.com (Model Paper 1 page 14);
N5 NationalQualificationsMODEL PAPER 1
SECTION 1 — PHYSICAL ENVIRONMENTS — 20 marks
Attempt EITHER question 1 or question 2 AND questions 3, 4 and 5
SECTION 2 — HUMAN ENVIRONMENTS — 20 marks
Attempt questions 6, 7 and 8
SECTION 3 — GLOBAL ISSUES — 20 marks
Attempt any TWO of the following
Question 9 — Climate Change
Question 10 — Impact of Human Activity on the Natural Environment
Question 11 — Environmental Hazards
Question 12 — Trade and Globalisation
Question 13 — Tourism
Question 14 — Health
You should read the questions carefully.
Credit will always be given for appropriately labelled sketch maps and diagrams.
Use blue or black ink.
Duration — 1 hour and 30 minutes
Total marks — 60
Geography
60584_Goeg_N5_PP1_007-028.indd 9 04/09/15 9:01 PM
© 2016 Hodder & Stoughton

10NATIONAL 5 GEOGRAPHY HODDER GIBSON MODEL PAPER 1
OS MAP ITEM A
60584_Goeg_N5_PP1_007-028.indd 10 04/09/15 9:01 PM
© 2016 Hodder & Stoughton
11HODDER GIBSON MODEL PAPER 1 NATIONAL 5 GEOGRAPHY
60584_Goeg_N5_PP1_007-028.indd 11 04/09/15 9:01 PM
© 2016 Hodder & Stoughton

12NATIONAL 5 GEOGRAPHY HODDER GIBSON MODEL PAPER 1
OS MAP ITEM B
60584_Goeg_N5_PP1_007-028.indd 12 04/09/15 9:01 PM
© 2016 Hodder & Stoughton

13HODDER GIBSON MODEL PAPER 1 NATIONAL 5 GEOGRAPHY
60584_Goeg_N5_PP1_007-028.indd 13 04/09/15 9:01 PM
© 2016 Hodder & Stoughton

MARKS DO NOT WRITE IN
THIS MARGIN
14NATIONAL 5 GEOGRAPHY HODDER GIBSON MODEL PAPER 1
Page two
SECTION 1 — PHYSICAL ENVIRONMENTS — 20 marks
Attempt EITHER Question 1 or Question 2 AND Questions 3, 4 and 5
Question 1 — Glaciated Uplands
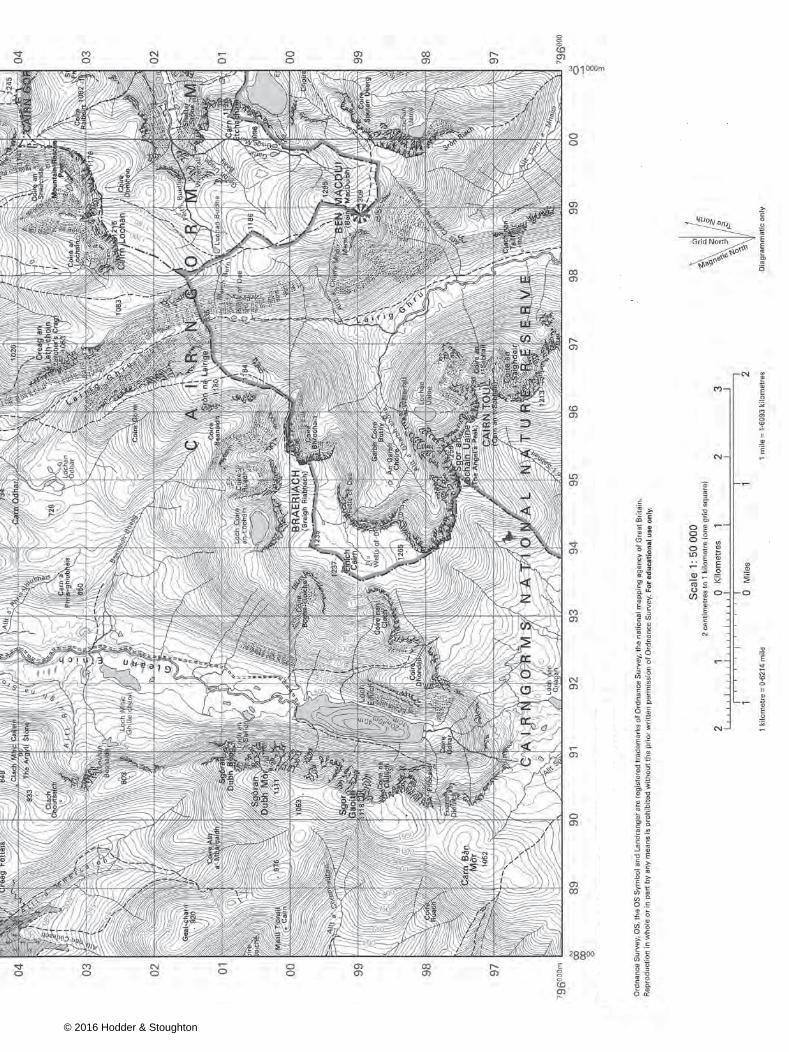
(a) Study OS map Item A of the Aviemore area.
Match the features of glaciated uplands shown below with the correct grid reference.
Features of glaciated uplands
U-shaped valley corrie pyramidal peak
Choose from grid references
954976 979976 957997 915980
(b) Explain the formation of a U-shaped valley.
You may use a diagram or diagrams in your answer.
Total marks
3
4
7
NOW ATTEMPT QUESTIONS 3, 4 AND 5
60584_Goeg_N5_PP1_007-028.indd 14 04/09/15 9:01 PM
© 2016 Hodder & Stoughton

MARKS DO NOT WRITE IN
THIS MARGIN
15HODDER GIBSON MODEL PAPER 1 NATIONAL 5 GEOGRAPHY
Page three
DO NOT ATTEMPT THIS QUESTION IF YOU HAVE ALREADY ANSWERED QUESTION 1
Question 2 — Upland Limestone Areas
(a) Study OS map Item B of the Aber-craf area.
Match the following surface limestone features with the correct grid reference.
Features of upland limestone areas
pot hole limestone pavement intermittent drainage
Choose from grid references
833164 817155 819163 814175
(b) Explain the formation of limestone pavement.
You may use a diagram or diagrams in your answer.
Total marks
3
4
7
NOW ATTEMPT QUESTIONS 3, 4 AND 5
60584_Goeg_N5_PP1_007-028.indd 15 04/09/15 9:01 PM
© 2016 Hodder & Stoughton

MARKS DO NOT WRITE IN
THIS MARGIN
16NATIONAL 5 GEOGRAPHY HODDER GIBSON MODEL PAPER 1
Page four
NOW ATTEMPT QUESTIONS 3, 4 AND 5
Question 3
Study OS map Item A of the Aviemore area.
Referring to map evidence, explain the ways in which the physical landscape has affected land use in the map extract area.
Question 4
Diagram Q4 — Synoptic Chart for 30 May 2013
Norwich
Study Diagram Q4 above.
Explain the changes that will take place in the weather at Norwich over the next twenty-four hours.
5
4
60584_Goeg_N5_PP1_007-028.indd 16 04/09/15 9:01 PM
© 2016 Hodder & Stoughton

MARKS DO NOT WRITE IN
THIS MARGIN
17HODDER GIBSON MODEL PAPER 1 NATIONAL 5 GEOGRAPHY
Page five
Question 5
Diagram Q5A — Landscape Types Diagram Q5B — Land Uses
Look at Diagrams Q5A and Q5B.
Choose one landscape type you have studied from Diagram Q5A.
Select at least two land uses from Diagram Q5B and explain why these land uses are suitable for your chosen landscape type.
Glaciated Uplands Farming
Forestry
Industry
Recreation and Tourism
Water Storage and Supply
Renewable Energy
Upland Limestone
River and ValleysCoastal Landscapes
4
60584_Goeg_N5_PP1_007-028.indd 17 04/09/15 9:01 PM
© 2016 Hodder & Stoughton

18NATIONAL 5 GEOGRAPHY HODDER GIBSON MODEL PAPER 1
Ext
ract
pro
duce
d by
Ord
nanc
e S
urve
y 20
10. L
icen
ce: 1
0004
9324
© C
row
n co
pyrig
ht 2
008.
All
right
s re
serv
ed.
Ord
nanc
e S
urve
y, O
S, t
he O
S S
ymbo
l and
Lan
dran
ger
are
regi
ster
ed tr
adem
arks
of O
rdna
nce
Sur
vey,
the
natio
nal m
appi
ng a
genc
y of
Gre
at B
ritai
n.R
epro
duct
ion
in w
hole
or
in p
art b
y an
y m
eans
is p
rohi
bite
d w
ithou
t the
prio
r w
ritte
n pe
rmis
sion
of O
rdna
nce
Sur
vey.
Fo
r ed
uca
tio
nal
use
on
ly.
OS MAP ITEM C
60584_Goeg_N5_PP1_007-028.indd 18 04/09/15 9:01 PM
© 2016 Hodder & Stoughton

19HODDER GIBSON MODEL PAPER 1 NATIONAL 5 GEOGRAPHY
Ext
ract
pro
duce
d by
Ord
nanc
e S
urve
y 20
10. L
icen
ce: 1
0004
9324
© C
row
n co
pyrig
ht 2
008.
All
right
s re
serv
ed.
Ord
nanc
e S
urve
y, O
S, t
he O
S S
ymbo
l and
Lan
dran
ger
are
regi
ster
ed tr
adem
arks
of O
rdna
nce
Sur
vey,
the
natio
nal m
appi
ng a
genc
y of
Gre
at B
ritai
n.R
epro
duct
ion
in w
hole
or
in p
art b
y an
y m
eans
is p
rohi
bite
d w
ithou
t the
prio
r w
ritte
n pe
rmis
sion
of O
rdna
nce
Sur
vey.
Fo
r ed
uca
tio
nal
use
on
ly.
60584_Goeg_N5_PP1_007-028.indd 19 04/09/15 9:01 PM
© 2016 Hodder & Stoughton

MARKS DO NOT WRITE IN
THIS MARGIN
20NATIONAL 5 GEOGRAPHY HODDER GIBSON MODEL PAPER 1
Page six
SECTION 2 — HUMAN ENVIRONMENTS — 20 marks
Attempt Questions 6, 7 and 8
Question 6
Study OS map Item C of the Durham area.
(a) Using Item C, give map evidence to show that part of Durham’s CBD is located in grid square 2742.
(b) Describe, in detail, differences between the urban environments in grid squares 2642 and 2745.
Question 7
Diagram Q7 — Complexo do Alemão Shanty Town, Rio de Janeiro
Look at Diagram Q7.
For Rio de Janeiro, or a named developing world city you have studied, describe methods used by city authorities to improve living conditions in shanty towns.
3
5
Population 100 000
One of the biggest slums in Rio
Housing made from cardboard, mud and tin sheets
Open sewers and toilets
No electricity
Few roads
6
60584_Goeg_N5_PP1_007-028.indd 20 04/09/15 9:01 PM
© 2016 Hodder & Stoughton

MARKS DO NOT WRITE IN
THIS MARGIN
21HODDER GIBSON MODEL PAPER 1 NATIONAL 5 GEOGRAPHY
Page seven
Question 8
Diagram Q8 — Modern Developments in Farming
Current Government Policy Diversification
GM Crops
New TechnologyOrganic Farming FARMINGTODAY
Look at Diagram Q8.
Choose two modern developments from Diagram Q8.
Explain how your chosen developments affect farmers in the developed world. 6
NOW GO TO SECTION 3
60584_Goeg_N5_PP1_007-028.indd 21 04/09/15 9:01 PM
© 2016 Hodder & Stoughton

MARKS DO NOT WRITE IN
THIS MARGIN
22NATIONAL 5 GEOGRAPHY HODDER GIBSON MODEL PAPER 1
SECTION 3 — GLOBAL ISSUES — 20 marks
Attempt any TWO questions
Question 9 — Climate Change
Question 10 — Impact of Human Activity on the Natural Environment
Question 11 — Environmental Hazards
Question 12 — Trade and Globalisation
Question 13 — Tourism
Question 14 — Health
Page eight
60584_Goeg_N5_PP1_007-028.indd 22 04/09/15 9:01 PM
© 2016 Hodder & Stoughton

MARKS DO NOT WRITE IN
THIS MARGIN
23HODDER GIBSON MODEL PAPER 1 NATIONAL 5 GEOGRAPHY
Page nine
Question 9 — Climate Change
Diagram Q9 — Ice Melt 1979−2012 (months of June and July only)
1980—2·5
—2
—1·5
—1—0·5
0
0·51
1·5
22·5
1985Year
Mel
t
1990 1995 2000 2005 2010
Study Diagram Q9.
(a) Describe, in detail, changes in ice melt between 1979 and 2012.
(b) Explain the effects of climate change on people and the environment.
Total marks
4
6
10
60584_Goeg_N5_PP1_007-028.indd 23 04/09/15 9:01 PM
© 2016 Hodder & Stoughton

MARKS DO NOT WRITE IN
THIS MARGIN
24NATIONAL 5 GEOGRAPHY HODDER GIBSON MODEL PAPER 1
Page ten
Question 10 — Impact of Human Activity on the Natural Environment
Diagram Q10A — Barrow, Alaska Diagram Q10B — Eismitte, Greenland
—20
—10
100
0
200
Temp°C mm
71° N 158° W
—30J F M A M J J A S O N D
0
10
20
30
—20
—10
100
50 50
0
200
Temp°C mm
70° N 40° W
—30J F M A M J J A S O N D
0
10
20
30
Study Diagrams Q10A and Q10B.
(a) Describe, in detail, differences between the climates of Barrow and Eismitte.
Diagram Q10C — Land Use in the Rainforest
Cattle ranches 60%
Small-scale, subsistence agriculture 33%
Fires, mining, urbanisation, roadconstruction, dams 3%
Logging, legal and illegal 3%
Large-scale commercial agricultureincluding soybeans 1%
(b) Look at Diagram Q10C.
Explain how two of the land uses shown in Diagram Q10C can lead to degradation of the rainforest.
Total marks
4
6
10
60584_Goeg_N5_PP1_007-028.indd 24 07/09/15 5:23 PM
© 2016 Hodder & Stoughton

MARKS DO NOT WRITE IN
THIS MARGIN
25HODDER GIBSON MODEL PAPER 1 NATIONAL 5 GEOGRAPHY
Page eleven
Question 11 — Environmental Hazards
Diagram Q11A — The World’s Most Active Volcanoes
Eurasian Plate
African Plate
CaribbeanPlate
IndianPlate
AustralianPlate
ArabianPlate
North AmericanPlate
North AmericanPlate
Juan deFucaPlate
CacosPlate
Paci�cPlate
Paci�cPlate
PhillippinePlate
NazcaPlate
South AmericanPlate
Scotia Plate Antarctic PlateVolcanoPlate boundary
Study Diagram Q11A.
(a) Describe, in detail, the distribution of the world’s most active volcanoes.
Diagram Q11B — Environmental Hazards
Look at Diagram Q11B.
(b) For a named earthquake, volcano or tropical storm you have studied, explain the impact it had on the people and the environment.
Total marks
4
6
10
60584_Goeg_N5_PP1_007-028.indd 25 04/09/15 9:01 PM
© 2016 Hodder & Stoughton

MARKS DO NOT WRITE IN
THIS MARGIN
26NATIONAL 5 GEOGRAPHY HODDER GIBSON MODEL PAPER 1
Question 12 — Trade and Globalisation
Diagram Q12A — Percentage Share of World Goods Production
1990 Developed countries 70%
China 4%
India 4%
2000 Developed countries 68%
China 7%
India 4%
2010 Developed countries 50%
China 14%
India 6%
2016 (projected) Developed countries 45%
China 18%
India 7%
Study Diagram Q12A.
(a) Describe, in detail, the trends in percentage share of world goods production.
Diagram Q12B — Newspaper Headline
“The inequality in trade between rich and poor nations is now wider than it has ever been before”
Look at Diagram Q12B.
(b) Explain the causes of inequalities in trade between developed and developing countries.
Total marks
4
6
10
Page twelve
60584_Goeg_N5_PP1_007-028.indd 26 04/09/15 9:01 PM
© 2016 Hodder & Stoughton

MARKS DO NOT WRITE IN
THIS MARGIN
27HODDER GIBSON MODEL PAPER 1 NATIONAL 5 GEOGRAPHY
Question 13 — Tourism
Diagram Q13 — Global Tourist Arrivals 1990−2011
455 000 000
Tourist arrivals across the world 2011
North andSouth America
NORTH AND SOUTH AMERICA
Europe
Africa
Middle East
Asia,Australia,and Oceania
>1 000 000 000
15.9%
528 000 000
674 000 000
800 000 000885 000 000
945 000 000 990 000 000
2011
2012
201020092004200019951990
EUROPE
51.5%MIDDLE EAST
5.6%AFRICA
5.0 %ASIA, AUSTRALIA, AND OCEANIA
22.0 %
France 79.5United States 62.5China 57.6Spain 56.7Italy 46.1Turkey 29.3Great Britain 29.2Germany 28.4Malaysia 24.7Mexico 23.4
MOST VISITED COUNTRIES MILLION PEOPLE
Study Diagram Q13.
(a) Describe the trends in global tourist arrivals between 1990 and 2011.
(b) Explain the advantages and disadvantages of mass tourism.
Total marks
4
6
10
Page thirteen
60584_Goeg_N5_PP1_007-028.indd 27 04/09/15 9:01 PM
© 2016 Hodder & Stoughton
MARKS DO NOT WRITE IN
THIS MARGIN
28NATIONAL 5 GEOGRAPHY HODDER GIBSON MODEL PAPER 1
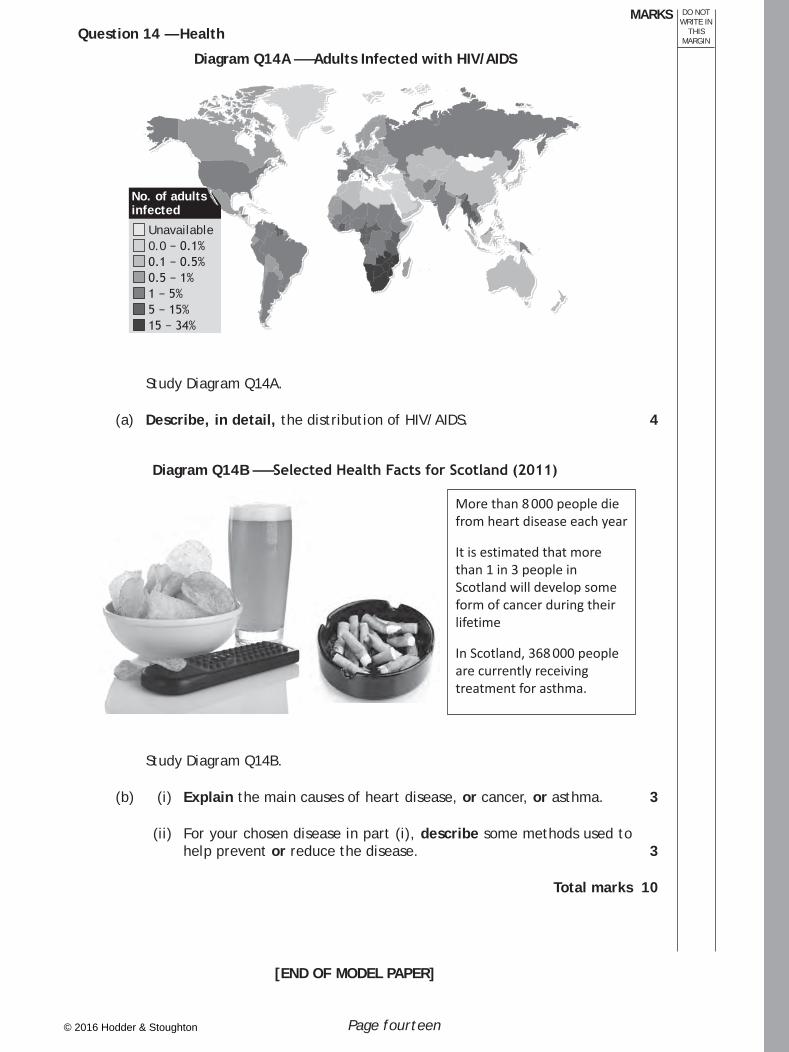
Question 14 — Health
Diagram Q14A — Adults Infected with HIV/AIDS
Unavailable0.0 − 0.1%0.1 − 0.5%0.5 − 1%1 − 5%5 − 15%15 − 34%
No. of adults infected
Study Diagram Q14A.
(a) Describe, in detail, the distribution of HIV/AIDS.
Diagram Q14B — Selected Health Facts for Scotland (2011)
Study Diagram Q14B.
(b) (i) Explain the main causes of heart disease, or cancer, or asthma.
(ii) For your chosen disease in part (i), describe some methods used to help prevent or reduce the disease.
Total marks
4
More than 8 000 people die from heart disease each year
It is estimated that more than 1 in 3 people in Scotland will develop some form of cancer during their lifetime
In Scotland, 368 000 people are currently receiving treatment for asthma.
3
3
10
Page fourteen
[END OF MODEL PAPER]
60584_Goeg_N5_PP1_007-028.indd 28 04/09/15 9:01 PM
© 2016 Hodder & Stoughton
ANSWER SECTION FOR
SQA AND HODDER GIBSON NATIONAL 5GEOGRAPHY 2015
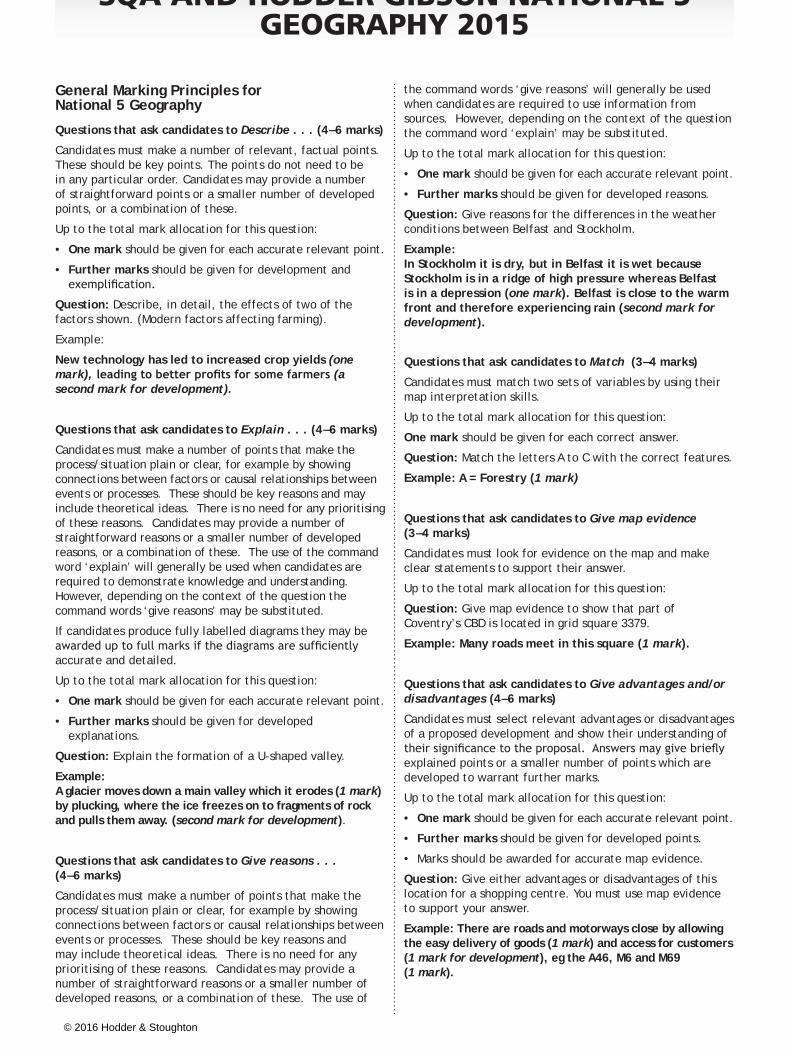
General Marking Principles for National 5 Geography
Questions that ask candidates to Describe . . . (4–6 marks)
Candidates must make a number of relevant, factual points. These should be key points. The points do not need to be in any particular order. Candidates may provide a number of straightforward points or a smaller number of developed points, or a combination of these.
Up to the total mark allocation for this question:
• One mark should be given for each accurate relevant point.
• Further marks should be given for development and exemplification.
Question: Describe, in detail, the effects of two of the factors shown. (Modern factors affecting farming).
Example:
New technology has led to increased crop yields (one mark), leading to better profits for some farmers (a second mark for development).
Questions that ask candidates to Explain . . . (4–6 marks)
Candidates must make a number of points that make the process/situation plain or clear, for example by showing connections between factors or causal relationships between events or processes. These should be key reasons and may include theoretical ideas. There is no need for any prioritising of these reasons. Candidates may provide a number of straightforward reasons or a smaller number of developed reasons, or a combination of these. The use of the command word ‘explain’ will generally be used when candidates are required to demonstrate knowledge and understanding. However, depending on the context of the question the command words ‘give reasons’ may be substituted.
If candidates produce fully labelled diagrams they may be awarded up to full marks if the diagrams are sufficiently accurate and detailed.
Up to the total mark allocation for this question:
• One mark should be given for each accurate relevant point.
• Further marks should be given for developed explanations.
Question: Explain the formation of a U-shaped valley.
Example: A glacier moves down a main valley which it erodes (1 mark) by plucking, where the ice freezes on to fragments of rock and pulls them away. (second mark for development).
Questions that ask candidates to Give reasons . . . (4–6 marks)
Candidates must make a number of points that make the process/situation plain or clear, for example by showing connections between factors or causal relationships between events or processes. These should be key reasons and may include theoretical ideas. There is no need for any prioritising of these reasons. Candidates may provide a number of straightforward reasons or a smaller number of developed reasons, or a combination of these. The use of
the command words ‘give reasons’ will generally be used when candidates are required to use information from sources. However, depending on the context of the question the command word ‘explain’ may be substituted.
Up to the total mark allocation for this question:
• One mark should be given for each accurate relevant point.
• Further marks should be given for developed reasons.
Question: Give reasons for the differences in the weather conditions between Belfast and Stockholm.
Example: In Stockholm it is dry, but in Belfast it is wet because Stockholm is in a ridge of high pressure whereas Belfast is in a depression (one mark). Belfast is close to the warm front and therefore experiencing rain (second mark for development).
Questions that ask candidates to Match (3–4 marks)
Candidates must match two sets of variables by using their map interpretation skills.
Up to the total mark allocation for this question:
One mark should be given for each correct answer.
Question: Match the letters A to C with the correct features.
Example: A = Forestry (1 mark)
Questions that ask candidates to Give map evidence (3–4 marks)
Candidates must look for evidence on the map and make clear statements to support their answer.
Up to the total mark allocation for this question:
Question: Give map evidence to show that part of Coventry’s CBD is located in grid square 3379.
Example: Many roads meet in this square (1 mark).
Questions that ask candidates to Give advantages and/or disadvantages (4–6 marks)
Candidates must select relevant advantages or disadvantages of a proposed development and show their understanding of their significance to the proposal. Answers may give briefly explained points or a smaller number of points which are developed to warrant further marks.
Up to the total mark allocation for this question:
• One mark should be given for each accurate relevant point.
• Further marks should be given for developed points.
• Marks should be awarded for accurate map evidence.
Question: Give either advantages or disadvantages of this location for a shopping centre. You must use map evidence to support your answer.
Example: There are roads and motorways close by allowing the easy delivery of goods (1 mark) and access for customers (1 mark for development), eg the A46, M6 and M69 (1 mark).
60584_Geog_N5_ANS_119_144.indd 121 04/09/15 9:07 PM
© 2016 Hodder & Stoughton
Peter.Dennis
Rectangle

ANSWERS TO NATIONAL 5 GEOGRAPHY122
NATIONAL 5 GEOGRAPHY MODEL PAPER 1
Section 1: Physical Environments 1 (a) U-shaped valley − 979976
Corrie − 957997 Pyramidal peak − 954976 3
(b) 1 mark for a valid point. 2 marks for a developed point.
Full marks can be gained for appropriately annotated diagrams. If a U-shaped valley is chosen: a glacier occupies a
V-shaped valley (1), the ice moves, eroding the sides and bottom of the valley (1), through plucking (1) and abrasion (1); this makes the valley sides steeper (1) and the valley deeper (1), and when the glacier retreats a steep, deep, flat-floored U-shaped valley is left (2), the original stream seems too small for the wider valley and is known as a misfit stream (1). 4
2 (a) Pot hole − 833164 Intermittent drainage − 817155 Limestone pavement − 814175 3
(b) 1 mark for a valid point, 2 marks for a developed point. Limestone pavement: Limestone made from decayed remains of skeletons
of sea creatures (1); laid in horizontal layers on sea bed (1); sedimentary rocks uplifted (1); overlaying rock removed by glaciation (1); cracks appear as rock dries out (1); cracks widen into grykes by chemical weathering (1); limestone dissolved by acid rainwater (1); creates clints, or upstanding blocks (1).
Credit should be given for appropriately annotated diagrams. 4
3 1 mark for a simple point. 2 marks for a developed point. Max 1 for grid references. Answers could include:
Most settlement is found along the course of the river where the land is low and suitable for building (1), e.g. at 885125 (1). Transport routes such as the B970 and the railway line follow the course of the valley as it provides a natural route way (2). The roads have had to avoid the higher, steeper ground and in some places the undulating nature of the land means cuttings and embankments are needed (1) such as at 892132 (1). Where there is gently sloping lower ground (901117) farming may be arable or mixed (1), whereas on the steeper slopes and higher ground livestock grazing will occur due to the difficulty of using machinery (2). Woodland is grown on land that is too high and cold for crops, such as 905066 (1). Steep slopes are no use for settlement but can be for recreation and tourism, such as the ski centre at 899059 (1).
Accept any other relevant point. 5
4 Max 2 marks for description of weather changes without explanation. Mark out of 3 if candidate has misidentified fronts but explained weather correctly. Answers could include: As the warm front approaches Norwich, air pressure
will fall (1), cloud cover will increase (1) and steady rain will occur (1). Winds will be quite strong as the
isobars are close together (1). The warm front will move away, and Norwich will be in the warm sector of a low-pressure system (1). Temperatures will rise, and it will be mild with occasional showers and some cloud cover (1). Winds will die down. The cold front will arrive and cloud cover will increase, with cumulonimbus clouds bringing heavy rain to the city (2). Temperatures will drop as the cold front passes over and begins to move away (1). The sky will become clear (1), the rain will stop (1) and pressure will begin to rise (1), and winds will increase (1).
Accept any other valid point. 4
5 (a) 1 mark for a valid point. 2 marks for a developed point.
If glaciated uplands chosen:• Farming − Highlands are suitable for sheep farming
as opposed to arable farming (1). Sheep can survive on steep slopes (1). Steep land is unsuited to machinery used on arable farms (1).
• Forestry − Trees can be planted on the upper slopes where the land is unsuitable for other crops due to weather and steepness of slopes (1).
• Recreation and tourism − Tourists are attracted to mountain scenery (1). The steep slopes can be used for skiing (1). The mountains attract hill walkers (1).
• Water storage and supply − Valleys can be dammed to create reservoirs (1). Mountain areas usually have high rainfall (1). The underlying rock may be impermeable and therefore suitable for water catchment and storage (1).
• Renewable energy − Highlands provide suitable sites for HEP schemes (1). Water flowing down pipelines can be used to drive turbines to create electricity (1).
• Mountain areas are also suitable sites for wind farms because of the frequency and strength of the local winds (1). 4
60584_Geog_N5_ANS_119_144.indd 122 04/09/15 9:07 PM
© 2016 Hodder & Stoughton
Peter.Dennis
Rectangle

ANSWERS TO NATIONAL 5 GEOGRAPHY 123
Section 3: Global Issues9 (a) Answers may include:
Over a 17-year period between 1979 and 1996, ice melt decreased (1), apart from 1983–4 when it increased (1). The general trend for 1997 onwards was that ice melt increased (1), reaching a high in 2012 (1) at 2% higher than the average (1).
Or any other valid point. 4
(b) 1 mark for a valid point. 2 marks for a developed point. Answers may include: Warmer global temperatures could change the
habitats of different wildlife and marine dwellers (1). Warmer water causes some fish to die or to move to colder waters, which affects fishermen and their livelihood (1). Increased temperatures may mean more drought, leading to famine (1). In some areas, new crops can be grown because of the higher temperatures (1), which increases farmers’ income (1). Rising temperatures can cause the icecaps to melt, which can result in flooding in low-lying areas like the Netherlands (1). Warmer temperatures could result in the spread of diseases like malaria into new areas (1).
Or any other valid point. 6
10 (a) Answers may include: The lowest temperature reached in Barrow is
−29 degrees whereas in Eismitte it is −27 degrees Centigrade (1). The highest temperature reached in Barrow is 5 degrees, compared with 12 degrees Centigrade in Eismitte (1). The range in temperature in Barrow is therefore 34 degrees as opposed to 39 degrees in Eismitte (1). Barrow has precipitation throughout the year, totalling 130mm, whereas there is no rainfall in Eismitte (2).
Or any other valid point. 4
(b) Answers may include: Large areas of rainforest are needed for cattle
ranching, so huge areas are burned, destroying the native wildlife and the plants (1). The land the cattle graze soon becomes infertile, so more rainforest is destroyed to allow the cattle to graze (1). This land never recovers (1). Large tracts of forest are cleared by using fires, which can get out of control and destroy far more forest than necessary (1). Large amounts of CO2 are released, affecting the local climate as well as the global climate (1). With no trees to bind the soil together, soil erosion takes place (1). Rivers become polluted with soil and cannot be used by the local people (1). The local people are forced off the land, and their traditional way of life is under threat (1). Logging destroys the habitats of animals, causing a threat of extinction (1). Fewer animals means less food for the native people (1). Illegal loggers do not replant to replace the trees, so the rainforest does not regenerate (1).
Or any other valid point. 6
Section 2: Human Environments6 (a) 1 mark per valid point.
Answers could include: Main roads like the A691 and the A690 converge on
this square (1); there is a tourist information centre (1) and a cathedral (1), many churches (1) and a bus station (1).
Accept any other valid point. 3
(b) 1 mark per valid point. 2 marks for a developed point. Mark only differences. Answers may include: 2745 is an area of newer housing, 2642 is an older,
inner urban area (1); 2745 is mainly a residential suburban area whereas 2642 has a greater variety of land uses like industry and services, as well as housing (2). 2745 has a varied street pattern including cul-de-sacs and crescents whereas 2642 has a mainly rectangular/grid-iron pattern (1); 2745 has mainly small buildings (houses) whereas 2642 has large buildings like factories (1); 2745 has a limited amount of traffic and less noise pollution, while 2642 has many main roads, railway, bus station − more noise and pollution (2).
Accept any other valid point. 5
7 1 mark for a valid point. 2 marks for a developed point. If no named example, mark out of 5. If the Rio de Janeiro example was chosen, answers may include: New roads are to be constructed to improve the
transport of people and goods in the area (1); storm drains are to be built to control flooding (1); construction of piped water supply (1); construction of latrines (1). Slums will be cleared over a five-year period (1), and people are being rehoused nearby in newly built apartments (1). These are affordable accommodation (1). The estates also include schools, markets and other facilities (1).
Or any other valid point. 6
8 For full marks, two factors should be mentioned. Award up to 4 marks for any single factor. 1 mark per valid point. 2 marks for a developed point. If New Technology is chosen, answers may include: Machinery increases the efficiency on a farm, enabling
the farmer to plough, sow, spray etc. more quickly, covering larger areas (2). It also speeds up harvesting and results in the product being delivered to markets fresher (1) and at a higher premium (1). It also allows for a smaller work force (1) and therefore lower wage bills (1). It allows for the use of satellite technology/computers to control the application of fertilisers to particular areas of fields (1), improving yields (1) yet decreasing the cost and waste.
If Diversification is chosen, answers may include: Farmers can obtain additional income from a variety
of sources if they diversify their activities on the farm (1). They may turn old farm workers’ cottages into holiday chalets (1). They may use part of the land for a golf course (1). They may earn income from sports such as quad-bike riding (1).
Or any other valid point. 6
60584_Geog_N5_ANS_119_144.indd 123 04/09/15 9:07 PM
© 2016 Hodder & Stoughton
Peter.Dennis
Rectangle

ANSWERS TO NATIONAL 5 GEOGRAPHY124
11 (a) Answers may include: Volcanoes are found along the edges of plate
boundaries (1). Many volcanoes are found along the west coast of North and South America (1) especially Alaska (1). Volcanoes are found along the coastal areas of China and Japan (1) and along the Pacific Ring of Fire (1).
Or any other valid point. 4
(b) 1 mark for a valid point. 2 marks for a developed point. If no specific example named, mark out of 4. Answers may include: Tropical storms are very powerful and can cause
immense damage (1). Storms can uproot trees (1) and disrupt telephone lines and electricity power lines (1). If plantation crops are destroyed, this can cause severe economic problems (1). Tidal surges flood low-lying coastal areas (1). There can be major loss of life caused by flooding, resulting in thousands of deaths (1). Landslides may occur where rainfall washes away buildings built on steep, unstable slopes (1). Flooding can block coastal escape routes and relief roads, making damaged areas unreachable for rescue services (2).
Or any other valid point. 6
12 (a) Answers may include: The percentage share of world goods production for
developed countries will steadily decrease between 2000 and 2016 (1). The percentage will have decreased from 68% to 45% in developed countries − a drop of 23% (1). China’s share will steadily increase during this period from 4% to an estimated 18% (1). India’s percentage has also increased, but the increase is significantly lower than that of China (1). India’s share remained at 4% between 2000 and 2010 but is due to increase slightly to 7% by 2016 (1).
Or any other valid point. 4
(b) 1 mark for a valid point. 2 marks for a developed point. Answers may include: Developed countries have a larger share of world
trade because their exports include significantly more manufactured goods than countries in the developing world (1). Developing countries tend to produce raw materials rather than manufactured goods (1). Developed countries have more industries producing a wide variety of products, such as food products, industrial machinery and electronics, which are traded with other developed countries (2). Many developed countries belong to trading alliances, such as the European Union, which help to increase the volume of trade (1). The economies of developed countries benefit from being able to purchase low-cost raw materials produced by developing countries and to sell manufactured goods back for higher profits (2). Developing countries have much less money to invest in manufacturing industries and are less able to compete with developed countries (1).
Or any other valid point. 6
13 (a) 1 mark for a valid point. 2 marks for a developed point. Answers may include: The overall number of tourist arrivals across the
world has steadily increased throughout the period from 1990 to 2011 (1). The number has more than doubled from 1990 to 2011 (1). The highest number of arrivals in 2011 occurred in Europe, with France being the most visited country (2). The second largest number of arrivals occurred in Asia, Australia and Oceania, with China accounting for 57·6 million visitors (2). North and South America were third largest in tourist arrivals, with the USA having 62·3 million tourist visitors (2). Africa had the smallest share of tourist arrivals with only 5%, as opposed to 51·5% in Europe (2).
Or any other valid point. 4
(b) 1 mark for a valid point. 2 marks for a developed point. For full marks, both advantages and disadvantages must be mentioned. If not, mark out of 5. Advantages: Mass tourism boosts the economies of developed
and developing countries (1). Tourism creates jobs in a wide variety of activities, including farming (supplying food for shops/hotels etc.) and entertainment (theatres, leisure centres) (2). It provides money for the country to improve infrastructure (transport, water supplies, sewage disposal) (1) and provides income to improve services such as education and health services (1).
Disadvantages: Tourism can create pollution, e.g. litter on beaches
(1). Sea and river pollution arises from the increased use of fertilisers and pesticides on local farms (1). Can increase traffic congestion in both cities and rural areas (1). Can cause conflict in rural areas with farmers to produce more food to feed tourists (1). Employment may only be seasonal (1). Tourism can have a detrimental effect on local culture and the physical environment, for example removing forest to build more tourist facilities (1).
Or any other valid point. 6
14 (a) 1 mark for a valid point. 2 marks for a developed point. Answers may include: AIDS is most prevalent in countries in the developing
world (1). The highest percentages of infected adults are found in areas such as Central and South Africa (1), which have 15 to 34% of the population infected (1). Infection rates are much lower in areas such as Europe and North America at 0·1 to 0·5% (1). Infection rates are also low in Australia (1). Rates are also high in parts of Asia, particularly in India and Pakistan (2).
Or any other valid point. 4
(b) (i) 1 mark for a valid point. 2 marks for a developed point. Max 1 mark for a list. If heart disease is chosen, answers may include: Heart disease can be inherited from parents (1).
Over-eating can lead to obesity, putting extra pressure on the heart (2). Smoking narrows the arteries and affects the lungs (1). This can lead to emphysema, putting a strain on the heart by making it work faster (1). The build-up of fatty deposits on the walls of the arteries
60584_Geog_N5_ANS_119_144.indd 124 04/09/15 9:07 PM
© 2016 Hodder & Stoughton
Peter.Dennis
Rectangle

ANSWERS TO NATIONAL 5 GEOGRAPHY 125
restricts the flow of blood to the heart (1); lack of exercise raises blood pressure, affecting the efficiency of the heart (1); poor diet increases cholesterol (1); stress leads to high blood pressure (1).
Or any other valid point. 3
(b) (ii) Max 1 mark for a list. Answers may include: More people now have regular check-ups for
cholesterol and blood pressure (1), allowing early intervention for at-risk patients (1). More advanced medical equipment is being invented and used (1), e.g. artificial heart valves (1). More advanced surgery is now available (1), e.g. bypass surgery (1). The government runs many campaigns to educate the public (1), e.g. stop-smoking campaigns and healthy eating (1). Advertising brands of cigarettes has been banned (1). Smoking ban in public places (1). Nicotine patches to help people give up smoking (1). People are encouraged to eat more healthily and take more exercise (1). Healthy eating is encouraged in school dining halls (1). Free and reduced membership of gyms (1).
Or any other valid point. 3
NATIONAL 5 GEOGRAPHY MODEL PAPER 2
Section 1: Physical Environments1 (a) Stack − 636871
Headland − 570863 Bay − 555869 3
(b) 1 mark for a valid point. 2 marks for a developed point.• Caves − Caves occur where a coastline of hard
rock is attacked by prolonged waves (1). The waves attack along a line of weakness such as a joint or fault in the rock (2).
• Arches − Over time, erosion of the cave may cut through the headland (1). When it reaches the other side, an arch may be formed (1).
• Stack − Continual erosion at the foot of the arch may cause the roof to collapse (1). This creates a piece of rock isolated from the headland called a stack (1).
Or any other valid point. 4
2 (a) Confluence − 584973 Meander − 614965 River flowing south − 670967 3
(b) 1 mark for a valid point. 2 marks for a developed point. A fully annotated diagram can obtain full marks. Waterfall − Waterfalls occur in a river valley at a
point where soft rock is overlain with harder rock (1). Water flowing over the hard rock begins to erode the softer rock underneath (1). At the point of erosion, a pool called a plunge pool is formed (1). As the softer rock wears away, it can no longer support the harder rock above, which collapses into the plunge pool (1).
Or any other valid point. 4
3 1 mark per valid point. 2 marks for an extended point. 1 mark for a grid reference. Answers may include: There is woodland for forest walks (1) at 533903 (1).
The coastline attracts tourists for the beautiful views (1). The limestone cliffs are attractive for rock-climbing (1). Oxwich Bay is attractive for its beautiful beach and sand dunes (2). Caves like Bacon Hole (560867) along the coast attract cavers (2). The sea can be used for water activities like boating, surfing and swimming (1).
Accept any other valid point. 5
4 For full marks, both similarities and differences must be mentioned. Otherwise mark out of 3. Similarities: There are few clouds in the sky (1). The weather is
dry (1). Wind speeds are light and calm towards the centre of the anticyclone (1). There may be mist in the morning at both times of the year (1).
Differences: Temperatures are high in summer and low in winter (1).
During the night in summer, temperatures remain above zero (1), but in winter they will fall below zero. Warm moist air rising from the ground can form thunderstorms in summer (1). Heatwaves can occur in summer if the anticyclone remains for a period of time (1).
Or any other valid point. 4
60584_Geog_N5_ANS_119_144.indd 125 04/09/15 9:07 PM
© 2016 Hodder & Stoughton
Peter.Dennis
Rectangle
Peter.Dennis
Rectangle