
Mobile Mixed method research Full paper 9-9 - EconStor
13
econstor Make Your Publications Visible. A Service of zbw Leibniz-Informationszentrum Wirtschaft Leibniz Information Centre for Economics Bouwman, Harry; de Reuver, Mark; Nikou, Shahrokh Conference Paper Mixed method research: Combining mobile log data and questionnaires 24th European Regional Conference of the International Telecommunications Society (ITS): "Technology, Investment and Uncertainty", Florence, Italy, 20th-23rd October, 2013 Provided in Cooperation with: International Telecommunications Society (ITS) Suggested Citation: Bouwman, Harry; de Reuver, Mark; Nikou, Shahrokh (2013) : Mixed method research: Combining mobile log data and questionnaires, 24th European Regional Conference of the International Telecommunications Society (ITS): "Technology, Investment and Uncertainty", Florence, Italy, 20th-23rd October, 2013, International Telecommunications Society (ITS), Calgary This Version is available at: http://hdl.handle.net/10419/88510 Standard-Nutzungsbedingungen: Die Dokumente auf EconStor dürfen zu eigenen wissenschaftlichen Zwecken und zum Privatgebrauch gespeichert und kopiert werden. Sie dürfen die Dokumente nicht für öffentliche oder kommerzielle Zwecke vervielfältigen, öffentlich ausstellen, öffentlich zugänglich machen, vertreiben oder anderweitig nutzen. Sofern die Verfasser die Dokumente unter Open-Content-Lizenzen (insbesondere CC-Lizenzen) zur Verfügung gestellt haben sollten, gelten abweichend von diesen Nutzungsbedingungen die in der dort genannten Lizenz gewährten Nutzungsrechte. Terms of use: Documents in EconStor may be saved and copied for your personal and scholarly purposes. You are not to copy documents for public or commercial purposes, to exhibit the documents publicly, to make them publicly available on the internet, or to distribute or otherwise use the documents in public. If the documents have been made available under an Open Content Licence (especially Creative Commons Licences), you may exercise further usage rights as specified in the indicated licence. www.econstor.eu
-
Upload
khangminh22 -
Category
Documents
-
view
4 -
download
0
Transcript of Mobile Mixed method research Full paper 9-9 - EconStor
econstorMake Your Publications Visible.
A Service of
zbwLeibniz-InformationszentrumWirtschaftLeibniz Information Centrefor Economics
Bouwman, Harry; de Reuver, Mark; Nikou, Shahrokh
Conference Paper
Mixed method research: Combining mobile log dataand questionnaires
24th European Regional Conference of the International Telecommunications Society (ITS):"Technology, Investment and Uncertainty", Florence, Italy, 20th-23rd October, 2013
Provided in Cooperation with:International Telecommunications Society (ITS)
Suggested Citation: Bouwman, Harry; de Reuver, Mark; Nikou, Shahrokh (2013) : Mixedmethod research: Combining mobile log data and questionnaires, 24th European RegionalConference of the International Telecommunications Society (ITS): "Technology, Investment andUncertainty", Florence, Italy, 20th-23rd October, 2013, International Telecommunications Society(ITS), Calgary
This Version is available at:http://hdl.handle.net/10419/88510
Standard-Nutzungsbedingungen:
Die Dokumente auf EconStor dürfen zu eigenen wissenschaftlichenZwecken und zum Privatgebrauch gespeichert und kopiert werden.
Sie dürfen die Dokumente nicht für öffentliche oder kommerzielleZwecke vervielfältigen, öffentlich ausstellen, öffentlich zugänglichmachen, vertreiben oder anderweitig nutzen.
Sofern die Verfasser die Dokumente unter Open-Content-Lizenzen(insbesondere CC-Lizenzen) zur Verfügung gestellt haben sollten,gelten abweichend von diesen Nutzungsbedingungen die in der dortgenannten Lizenz gewährten Nutzungsrechte.
Terms of use:
Documents in EconStor may be saved and copied for yourpersonal and scholarly purposes.
You are not to copy documents for public or commercialpurposes, to exhibit the documents publicly, to make thempublicly available on the internet, or to distribute or otherwiseuse the documents in public.
If the documents have been made available under an OpenContent Licence (especially Creative Commons Licences), youmay exercise further usage rights as specified in the indicatedlicence.
www.econstor.eu
1
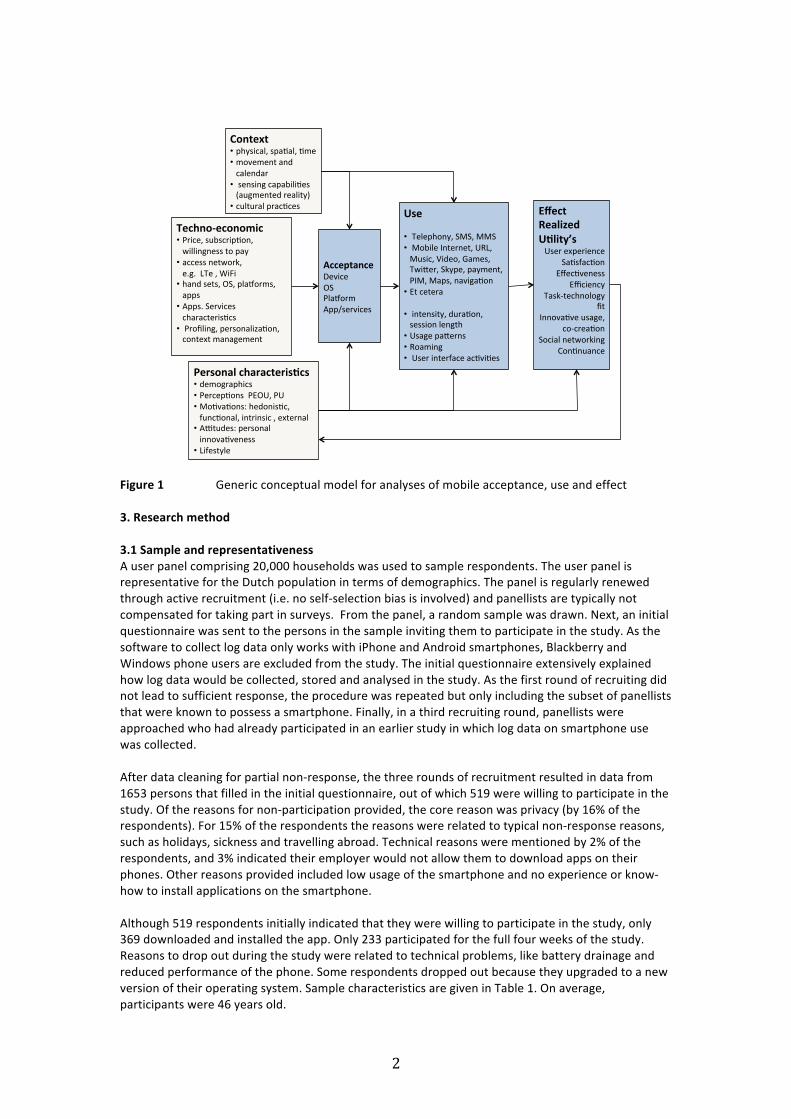
Mixed method research: combining mobile log data and questionnaires. Harry Bouwman, Delft University of Technology and Åbo Akademi, Turku Finland Mark de Reuver, Delft University of Technology Shahrokh Nikou, Åbo Akademi, Turku Finland 1. Introduction In this paper we will discuss the potential of mixed method research for understanding consumer behaviour in making use of mobile apps and the possible impact on their daily life. Research on mobile usage is predominantly based on questionnaire data, however with new technologies it is possible to measure actual behaviour (Verkasalo & Hammainen, 2007; Smura et al, 2009; Eagle & Pentland, 2006; Falaki et al, 2010; Boase & Ling, 2013; Kobayashi & Boase, 2012; Karikoski, 2013). In this paper we present the results of a two-‐year research project in which we experimented with combing two ways of data collection1. We discuss issues like privacy, response and representativeness. After discussing methodological issues we will present results from this research project. First we will discuss the discrepancies between self-‐assessment and actual registered log-‐data, and next we will show how a combination of log data and questionnaire data makes it possible to estimate how actual behaviour impacts the experienced substitution of other access technologies by smartphones, and the experienced impact on users daily life. The paper contributes to research methodology, by comparing two data-‐collection methods and their limitations, by addressing implication for privacy of respondents, issues with regard to external validity, as well as reliability and validity of current research which is affected by issues like recall, accuracy, and common method bias. This paper also contributes to new models for understanding user behaviour as commonly used in telecommunication and IS research. The paper goes beyond acceptance and adoption research by focussing on use and effect of smartphone usage. 2. Literature review Although mobile phones were introduced already in 1981 (NMT) and the first phones that enabled to connect to the Internet were introduced by Nokia in 1996 (Nokia Communicator) and actually services started large scale in the 1999’s when NTT DoCoMo introduced iMode, research on mobile telephony and mobile Internet services has been dominated for a long time by a focus on adoption and acceptance. Largely due to the rapid innovations taking place in the field of mobile technologies, service introductions and changing platforms adoption and acceptance studies dominated. Research on mobile is extensive and performed within different disciplines, e.g. communication science, information systems, and telecommunications. Meta-‐analysis of literature show that there are hundreds of papers being published. For instance Zhang et al (2012) found 53 articles discussing only mobile commerce adoption and the moderating effect of culture. The dominant paradigm in every discipline is different, where in IS research the perspective is mainly on theory of reasoned action, and planned behaviour, as well as on modifications of the technology acceptance model, in communication research the focus is on domestication, media affordance and media repertoires, and in telecommunication research the focus is on diffusion of innovation, substitution effects, continuance of usage and utility. To summarize all theoretical insights is a sheer impossible task. Based on Nikou (2012) we developed a generic model in which we integrated the different discipline specific approaches to a more generic model (see figure 1). The model is starting point for analysis focussed on usage and effects of usage of mobile telephony and applications. In our analysis we will use parts of this model focusing on the role of demographics, usage of mobile telephony, SMS and mobile Internet and the effects on substitution and effects on day-‐to-‐day routines and daily life. Substitution effects have been studied by Verkasalo (2007), Gerpott (2010) and Onegena, et al. (2012). Attention to effects on daily life are mainly studied within the domestication tradition making use of qualitative research (Haddon, 2003; Oksman, & Turtiainen, 2004) and quantitative research by Ishii (2006).
1 This research project was made possible by funding of Statistics Netherlands and the Ministry of Economic Affairs.
2
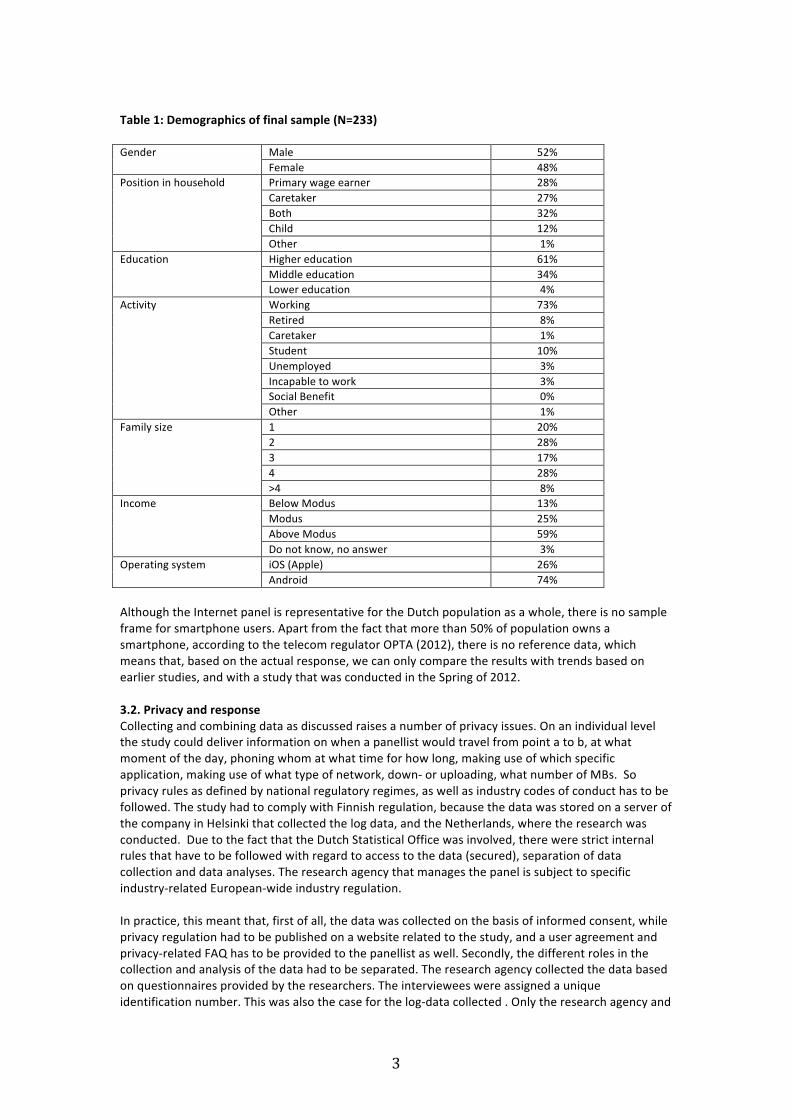
Figure 1 Generic conceptual model for analyses of mobile acceptance, use and effect 3. Research method 3.1 Sample and representativeness A user panel comprising 20,000 households was used to sample respondents. The user panel is representative for the Dutch population in terms of demographics. The panel is regularly renewed through active recruitment (i.e. no self-‐selection bias is involved) and panellists are typically not compensated for taking part in surveys. From the panel, a random sample was drawn. Next, an initial questionnaire was sent to the persons in the sample inviting them to participate in the study. As the software to collect log data only works with iPhone and Android smartphones, Blackberry and Windows phone users are excluded from the study. The initial questionnaire extensively explained how log data would be collected, stored and analysed in the study. As the first round of recruiting did not lead to sufficient response, the procedure was repeated but only including the subset of panellists that were known to possess a smartphone. Finally, in a third recruiting round, panellists were approached who had already participated in an earlier study in which log data on smartphone use was collected. After data cleaning for partial non-‐response, the three rounds of recruitment resulted in data from 1653 persons that filled in the initial questionnaire, out of which 519 were willing to participate in the study. Of the reasons for non-‐participation provided, the core reason was privacy (by 16% of the respondents). For 15% of the respondents the reasons were related to typical non-‐response reasons, such as holidays, sickness and travelling abroad. Technical reasons were mentioned by 2% of the respondents, and 3% indicated their employer would not allow them to download apps on their phones. Other reasons provided included low usage of the smartphone and no experience or know-‐how to install applications on the smartphone. Although 519 respondents initially indicated that they were willing to participate in the study, only 369 downloaded and installed the app. Only 233 participated for the full four weeks of the study. Reasons to drop out during the study were related to technical problems, like battery drainage and reduced performance of the phone. Some respondents dropped out because they upgraded to a new version of their operating system. Sample characteristics are given in Table 1. On average, participants were 46 years old.
Techno'economic*• Price,'subscrip,on,'willingness'to'pay'• access'network,'e.g.''LTe','WiFi'• hand'sets,'OS,'pla?orms,'apps'• Apps.'Services'characteris,cs'• 'Profiling,'personaliza,on,'context'management'
Context*• physical,'spa,al,',me'• movement'and'calendar'• 'sensing'capabili,es''(augmented'reality)'• cultural'prac,ces''
Personal*characteris3cs*• demographics'• Percep,ons''PEOU,'PU'• Mo,va,ons:'hedonis,c,'func,onal,'intrinsic','external''• AMtudes:'personal'innova,veness'• Lifestyle'
Use'''• 'Telephony,'SMS,'MMS'• 'Mobile'Internet,'URL,'Music,'Video,'Games,'TwiRer,'Skype,'payment,'PIM,'Maps,'naviga,on'• Et'cetera''''• 'intensity,'dura,on,'session'length'• Usage'paRerns'• Roaming'• 'User'interface'ac,vi,es''
Effect*Realized*U3lity’s*User'experience'
Sa,sfac,on'Effec,veness'
Efficiency'TaskUtechnology'
fit'Innova,ve'usage,'
coUcrea,on'Social'networking'
Con,nuance'
Acceptance*Device'OS'Pla?orm'App/services'
3
Table 1: Demographics of final sample (N=233) Gender Male 52%
Female 48% Position in household Primary wage earner 28%
Caretaker 27% Both 32% Child 12% Other 1%
Education Higher education 61% Middle education 34% Lower education 4%
Activity Working 73% Retired 8% Caretaker 1% Student 10% Unemployed 3% Incapable to work 3% Social Benefit 0% Other 1%
Family size 1 20% 2 28% 3 17% 4 28% >4 8%
Income Below Modus 13% Modus 25% Above Modus 59% Do not know, no answer 3%
Operating system iOS (Apple) 26% Android 74%
Although the Internet panel is representative for the Dutch population as a whole, there is no sample frame for smartphone users. Apart from the fact that more than 50% of population owns a smartphone, according to the telecom regulator OPTA (2012), there is no reference data, which means that, based on the actual response, we can only compare the results with trends based on earlier studies, and with a study that was conducted in the Spring of 2012. 3.2. Privacy and response Collecting and combining data as discussed raises a number of privacy issues. On an individual level the study could deliver information on when a panellist would travel from point a to b, at what moment of the day, phoning whom at what time for how long, making use of which specific application, making use of what type of network, down-‐ or uploading, what number of MBs. So privacy rules as defined by national regulatory regimes, as well as industry codes of conduct has to be followed. The study had to comply with Finnish regulation, because the data was stored on a server of the company in Helsinki that collected the log data, and the Netherlands, where the research was conducted. Due to the fact that the Dutch Statistical Office was involved, there were strict internal rules that have to be followed with regard to access to the data (secured), separation of data collection and data analyses. The research agency that manages the panel is subject to specific industry-‐related European-‐wide industry regulation. In practice, this meant that, first of all, the data was collected on the basis of informed consent, while privacy regulation had to be published on a website related to the study, and a user agreement and privacy-‐related FAQ has to be provided to the panellist as well. Secondly, the different roles in the collection and analysis of the data had to be separated. The research agency collected the data based on questionnaires provided by the researchers. The interviewees were assigned a unique identification number. This was also the case for the log-‐data collected . Only the research agency and
4
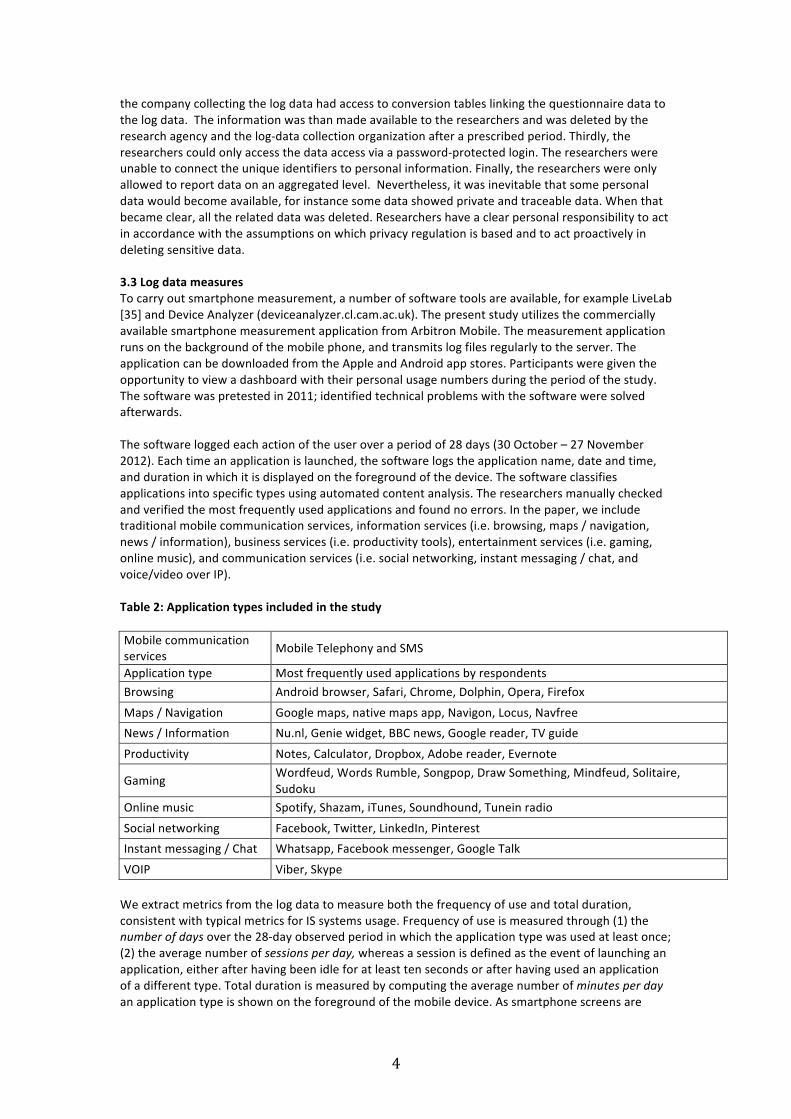
the company collecting the log data had access to conversion tables linking the questionnaire data to the log data. The information was than made available to the researchers and was deleted by the research agency and the log-‐data collection organization after a prescribed period. Thirdly, the researchers could only access the data access via a password-‐protected login. The researchers were unable to connect the unique identifiers to personal information. Finally, the researchers were only allowed to report data on an aggregated level. Nevertheless, it was inevitable that some personal data would become available, for instance some data showed private and traceable data. When that became clear, all the related data was deleted. Researchers have a clear personal responsibility to act in accordance with the assumptions on which privacy regulation is based and to act proactively in deleting sensitive data. 3.3 Log data measures To carry out smartphone measurement, a number of software tools are available, for example LiveLab [35] and Device Analyzer (deviceanalyzer.cl.cam.ac.uk). The present study utilizes the commercially available smartphone measurement application from Arbitron Mobile. The measurement application runs on the background of the mobile phone, and transmits log files regularly to the server. The application can be downloaded from the Apple and Android app stores. Participants were given the opportunity to view a dashboard with their personal usage numbers during the period of the study. The software was pretested in 2011; identified technical problems with the software were solved afterwards. The software logged each action of the user over a period of 28 days (30 October – 27 November 2012). Each time an application is launched, the software logs the application name, date and time, and duration in which it is displayed on the foreground of the device. The software classifies applications into specific types using automated content analysis. The researchers manually checked and verified the most frequently used applications and found no errors. In the paper, we include traditional mobile communication services, information services (i.e. browsing, maps / navigation, news / information), business services (i.e. productivity tools), entertainment services (i.e. gaming, online music), and communication services (i.e. social networking, instant messaging / chat, and voice/video over IP). Table 2: Application types included in the study Mobile communication services Mobile Telephony and SMS
Application type Most frequently used applications by respondents Browsing Android browser, Safari, Chrome, Dolphin, Opera, Firefox
Maps / Navigation Google maps, native maps app, Navigon, Locus, Navfree News / Information Nu.nl, Genie widget, BBC news, Google reader, TV guide
Productivity Notes, Calculator, Dropbox, Adobe reader, Evernote
Gaming Wordfeud, Words Rumble, Songpop, Draw Something, Mindfeud, Solitaire, Sudoku
Online music Spotify, Shazam, iTunes, Soundhound, Tunein radio
Social networking Facebook, Twitter, LinkedIn, Pinterest Instant messaging / Chat Whatsapp, Facebook messenger, Google Talk
VOIP Viber, Skype We extract metrics from the log data to measure both the frequency of use and total duration, consistent with typical metrics for IS systems usage. Frequency of use is measured through (1) the number of days over the 28-‐day observed period in which the application type was used at least once; (2) the average number of sessions per day, whereas a session is defined as the event of launching an application, either after having been idle for at least ten seconds or after having used an application of a different type. Total duration is measured by computing the average number of minutes per day an application type is shown on the foreground of the mobile device. As smartphone screens are
5
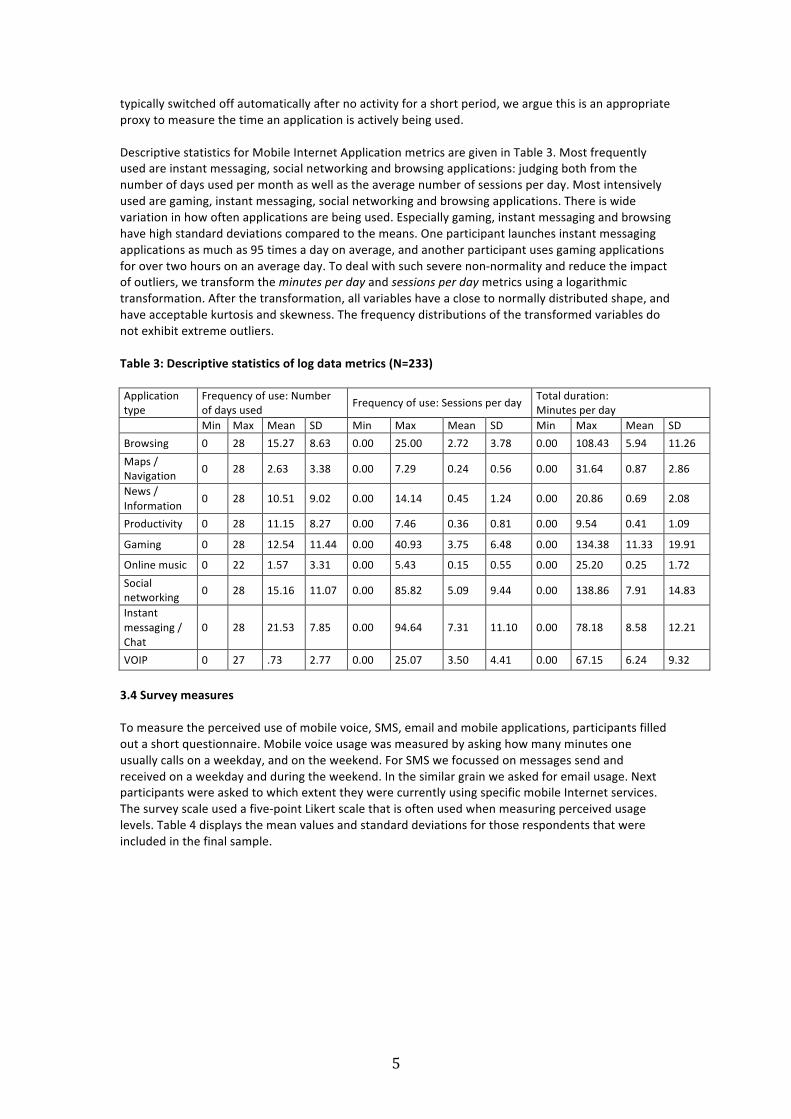
typically switched off automatically after no activity for a short period, we argue this is an appropriate proxy to measure the time an application is actively being used. Descriptive statistics for Mobile Internet Application metrics are given in Table 3. Most frequently used are instant messaging, social networking and browsing applications: judging both from the number of days used per month as well as the average number of sessions per day. Most intensively used are gaming, instant messaging, social networking and browsing applications. There is wide variation in how often applications are being used. Especially gaming, instant messaging and browsing have high standard deviations compared to the means. One participant launches instant messaging applications as much as 95 times a day on average, and another participant uses gaming applications for over two hours on an average day. To deal with such severe non-‐normality and reduce the impact of outliers, we transform the minutes per day and sessions per day metrics using a logarithmic transformation. After the transformation, all variables have a close to normally distributed shape, and have acceptable kurtosis and skewness. The frequency distributions of the transformed variables do not exhibit extreme outliers. Table 3: Descriptive statistics of log data metrics (N=233) Application type
Frequency of use: Number of days used Frequency of use: Sessions per day Total duration:
Minutes per day Min Max Mean SD Min Max Mean SD Min Max Mean SD Browsing 0 28 15.27 8.63 0.00 25.00 2.72 3.78 0.00 108.43 5.94 11.26 Maps / Navigation 0 28 2.63 3.38 0.00 7.29 0.24 0.56 0.00 31.64 0.87 2.86
News / Information 0 28 10.51 9.02 0.00 14.14 0.45 1.24 0.00 20.86 0.69 2.08
Productivity 0 28 11.15 8.27 0.00 7.46 0.36 0.81 0.00 9.54 0.41 1.09
Gaming 0 28 12.54 11.44 0.00 40.93 3.75 6.48 0.00 134.38 11.33 19.91
Online music 0 22 1.57 3.31 0.00 5.43 0.15 0.55 0.00 25.20 0.25 1.72 Social networking 0 28 15.16 11.07 0.00 85.82 5.09 9.44 0.00 138.86 7.91 14.83
Instant messaging / Chat
0 28 21.53 7.85 0.00 94.64 7.31 11.10 0.00 78.18 8.58 12.21
VOIP 0 27 .73 2.77 0.00 25.07 3.50 4.41 0.00 67.15 6.24 9.32
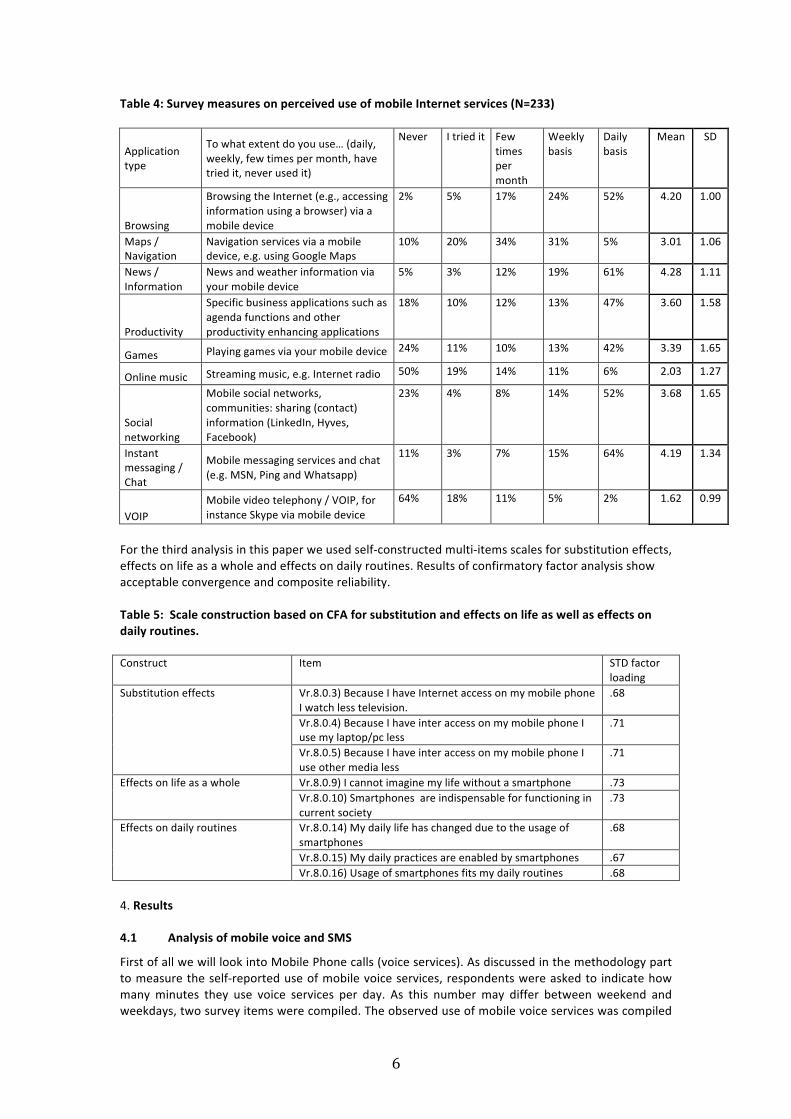
3.4 Survey measures To measure the perceived use of mobile voice, SMS, email and mobile applications, participants filled out a short questionnaire. Mobile voice usage was measured by asking how many minutes one usually calls on a weekday, and on the weekend. For SMS we focussed on messages send and received on a weekday and during the weekend. In the similar grain we asked for email usage. Next participants were asked to which extent they were currently using specific mobile Internet services. The survey scale used a five-‐point Likert scale that is often used when measuring perceived usage levels. Table 4 displays the mean values and standard deviations for those respondents that were included in the final sample.
6
Table 4: Survey measures on perceived use of mobile Internet services (N=233)
Application type
To what extent do you use… (daily, weekly, few times per month, have tried it, never used it)
Never I tried it Few times per month
Weekly basis
Daily basis
Mean SD
Browsing
Browsing the Internet (e.g., accessing information using a browser) via a mobile device
2% 5% 17% 24% 52% 4.20 1.00
Maps / Navigation
Navigation services via a mobile device, e.g. using Google Maps
10% 20% 34% 31% 5% 3.01 1.06
News / Information
News and weather information via your mobile device
5% 3% 12% 19% 61% 4.28 1.11
Productivity
Specific business applications such as agenda functions and other productivity enhancing applications
18% 10% 12% 13% 47% 3.60 1.58
Games Playing games via your mobile device 24% 11% 10% 13% 42% 3.39 1.65
Online music Streaming music, e.g. Internet radio 50% 19% 14% 11% 6% 2.03 1.27
Social networking
Mobile social networks, communities: sharing (contact) information (LinkedIn, Hyves, Facebook)
23% 4% 8% 14% 52% 3.68 1.65
Instant messaging / Chat
Mobile messaging services and chat (e.g. MSN, Ping and Whatsapp)
11% 3% 7% 15% 64% 4.19 1.34
VOIP Mobile video telephony / VOIP, for instance Skype via mobile device
64% 18% 11% 5% 2% 1.62 0.99
For the third analysis in this paper we used self-‐constructed multi-‐items scales for substitution effects, effects on life as a whole and effects on daily routines. Results of confirmatory factor analysis show acceptable convergence and composite reliability. Table 5: Scale construction based on CFA for substitution and effects on life as well as effects on daily routines. Construct Item STD factor
loading Substitution effects Vr.8.0.3) Because I have Internet access on my mobile phone
I watch less television. .68
Vr.8.0.4) Because I have inter access on my mobile phone I use my laptop/pc less
.71
Vr.8.0.5) Because I have inter access on my mobile phone I use other media less
.71
Effects on life as a whole Vr.8.0.9) I cannot imagine my life without a smartphone .73 Vr.8.0.10) Smartphones are indispensable for functioning in current society
.73
Effects on daily routines Vr.8.0.14) My daily life has changed due to the usage of smartphones
.68
Vr.8.0.15) My daily practices are enabled by smartphones .67 Vr.8.0.16) Usage of smartphones fits my daily routines .68
4. Results 4.1 Analysis of mobile voice and SMS
First of all we will look into Mobile Phone calls (voice services). As discussed in the methodology part to measure the self-‐reported use of mobile voice services, respondents were asked to indicate how many minutes they use voice services per day. As this number may differ between weekend and weekdays, two survey items were compiled. The observed use of mobile voice services was compiled
7
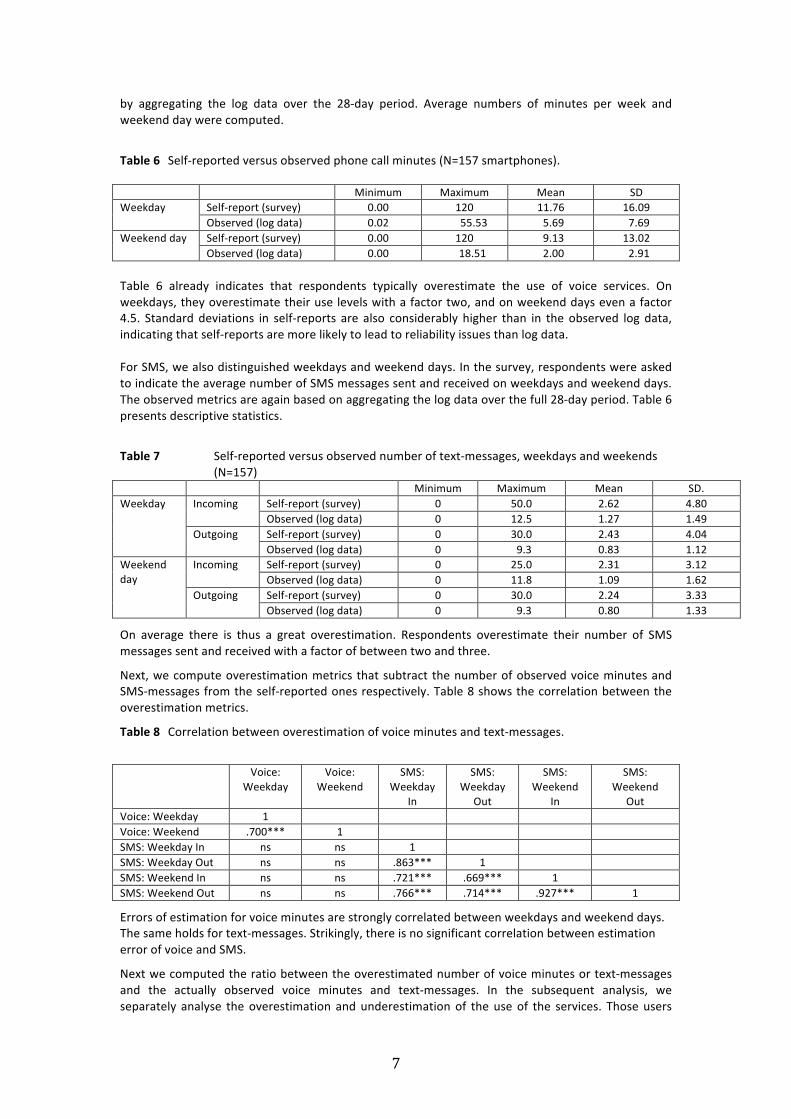
by aggregating the log data over the 28-‐day period. Average numbers of minutes per week and weekend day were computed.
Table 6 Self-‐reported versus observed phone call minutes (N=157 smartphones).
Minimum Maximum Mean SD Weekday Self-‐report (survey) 0.00 120 11.76 16.09
Observed (log data) 0.02 55.53 5.69 7.69 Weekend day Self-‐report (survey) 0.00 120 9.13 13.02
Observed (log data) 0.00 18.51 2.00 2.91 Table 6 already indicates that respondents typically overestimate the use of voice services. On weekdays, they overestimate their use levels with a factor two, and on weekend days even a factor 4.5. Standard deviations in self-‐reports are also considerably higher than in the observed log data, indicating that self-‐reports are more likely to lead to reliability issues than log data. For SMS, we also distinguished weekdays and weekend days. In the survey, respondents were asked to indicate the average number of SMS messages sent and received on weekdays and weekend days. The observed metrics are again based on aggregating the log data over the full 28-‐day period. Table 6 presents descriptive statistics.
Table 7 Self-‐reported versus observed number of text-‐messages, weekdays and weekends (N=157)
Minimum Maximum Mean SD. Weekday Incoming Self-‐report (survey) 0 50.0 2.62 4.80
Observed (log data) 0 12.5 1.27 1.49 Outgoing Self-‐report (survey) 0 30.0 2.43 4.04
Observed (log data) 0 9.3 0.83 1.12 Weekend day
Incoming Self-‐report (survey) 0 25.0 2.31 3.12 Observed (log data) 0 11.8 1.09 1.62
Outgoing Self-‐report (survey) 0 30.0 2.24 3.33 Observed (log data) 0 9.3 0.80 1.33
On average there is thus a great overestimation. Respondents overestimate their number of SMS messages sent and received with a factor of between two and three.
Next, we compute overestimation metrics that subtract the number of observed voice minutes and SMS-‐messages from the self-‐reported ones respectively. Table 8 shows the correlation between the overestimation metrics.
Table 8 Correlation between overestimation of voice minutes and text-‐messages.
Voice:
Weekday Voice:
Weekend SMS:
Weekday In
SMS: Weekday
Out
SMS: Weekend
In
SMS: Weekend
Out Voice: Weekday 1 Voice: Weekend .700*** 1 SMS: Weekday In ns ns 1 SMS: Weekday Out ns ns .863*** 1 SMS: Weekend In ns ns .721*** .669*** 1 SMS: Weekend Out ns ns .766*** .714*** .927*** 1
Errors of estimation for voice minutes are strongly correlated between weekdays and weekend days. The same holds for text-‐messages. Strikingly, there is no significant correlation between estimation error of voice and SMS.
Next we computed the ratio between the overestimated number of voice minutes or text-‐messages and the actually observed voice minutes and text-‐messages. In the subsequent analysis, we separately analyse the overestimation and underestimation of the use of the services. Those users
8
that were not observed to be using a certain type of voice or text-‐message at all, were excluded from the analysis.
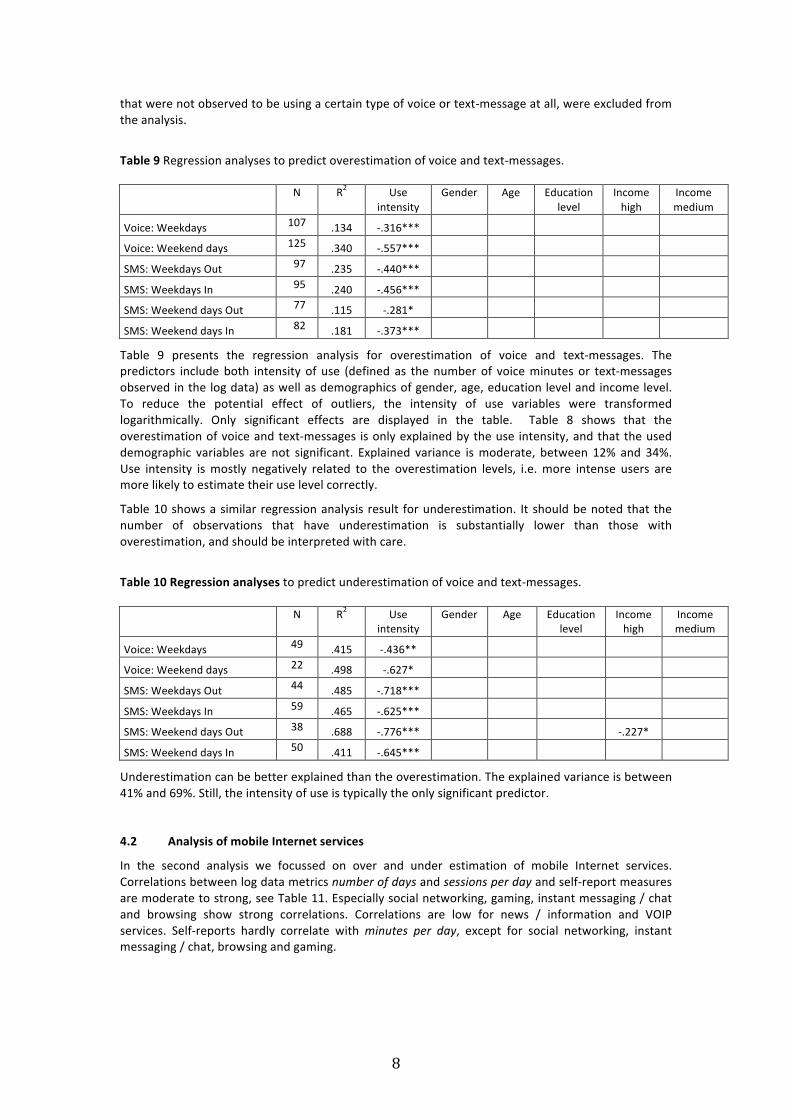
Table 9 Regression analyses to predict overestimation of voice and text-‐messages.
N R2 Use intensity
Gender Age Education level
Income high
Income medium
Voice: Weekdays 107 .134 -‐.316*** Voice: Weekend days 125 .340 -‐.557*** SMS: Weekdays Out 97 .235 -‐.440*** SMS: Weekdays In 95 .240 -‐.456*** SMS: Weekend days Out 77 .115 -‐.281* SMS: Weekend days In 82 .181 -‐.373***
Table 9 presents the regression analysis for overestimation of voice and text-‐messages. The predictors include both intensity of use (defined as the number of voice minutes or text-‐messages observed in the log data) as well as demographics of gender, age, education level and income level. To reduce the potential effect of outliers, the intensity of use variables were transformed logarithmically. Only significant effects are displayed in the table. Table 8 shows that the overestimation of voice and text-‐messages is only explained by the use intensity, and that the used demographic variables are not significant. Explained variance is moderate, between 12% and 34%. Use intensity is mostly negatively related to the overestimation levels, i.e. more intense users are more likely to estimate their use level correctly.
Table 10 shows a similar regression analysis result for underestimation. It should be noted that the number of observations that have underestimation is substantially lower than those with overestimation, and should be interpreted with care.
Table 10 Regression analyses to predict underestimation of voice and text-‐messages.
N R2 Use intensity
Gender Age Education level
Income high
Income medium
Voice: Weekdays 49 .415 -‐.436** Voice: Weekend days 22 .498 -‐.627* SMS: Weekdays Out 44 .485 -‐.718*** SMS: Weekdays In 59 .465 -‐.625*** SMS: Weekend days Out 38 .688 -‐.776***
-‐.227* SMS: Weekend days In 50 .411 -‐.645***
Underestimation can be better explained than the overestimation. The explained variance is between 41% and 69%. Still, the intensity of use is typically the only significant predictor.
4.2 Analysis of mobile Internet services
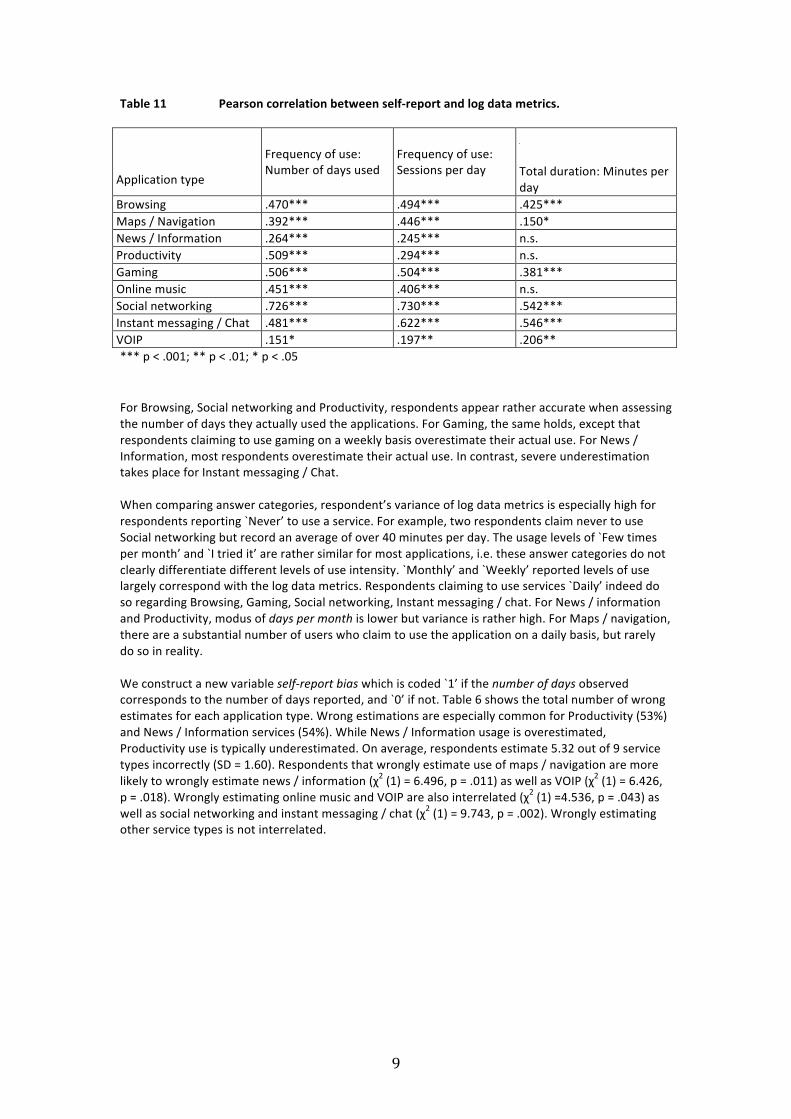
In the second analysis we focussed on over and under estimation of mobile Internet services. Correlations between log data metrics number of days and sessions per day and self-‐report measures are moderate to strong, see Table 11. Especially social networking, gaming, instant messaging / chat and browsing show strong correlations. Correlations are low for news / information and VOIP services. Self-‐reports hardly correlate with minutes per day, except for social networking, instant messaging / chat, browsing and gaming.
9
Table 11 Pearson correlation between self-‐report and log data metrics.
Application type
Frequency of use: Number of days used
Frequency of use: Sessions per day
Total duration: Minutes per day
Browsing .470*** .494*** .425*** Maps / Navigation .392*** .446*** .150* News / Information .264*** .245*** n.s. Productivity .509*** .294*** n.s. Gaming .506*** .504*** .381*** Online music .451*** .406*** n.s. Social networking .726*** .730*** .542*** Instant messaging / Chat .481*** .622*** .546*** VOIP .151* .197** .206** *** p < .001; ** p < .01; * p < .05
For Browsing, Social networking and Productivity, respondents appear rather accurate when assessing the number of days they actually used the applications. For Gaming, the same holds, except that respondents claiming to use gaming on a weekly basis overestimate their actual use. For News / Information, most respondents overestimate their actual use. In contrast, severe underestimation takes place for Instant messaging / Chat. When comparing answer categories, respondent’s variance of log data metrics is especially high for respondents reporting `Never’ to use a service. For example, two respondents claim never to use Social networking but record an average of over 40 minutes per day. The usage levels of `Few times per month’ and `I tried it’ are rather similar for most applications, i.e. these answer categories do not clearly differentiate different levels of use intensity. `Monthly’ and `Weekly’ reported levels of use largely correspond with the log data metrics. Respondents claiming to use services `Daily’ indeed do so regarding Browsing, Gaming, Social networking, Instant messaging / chat. For News / information and Productivity, modus of days per month is lower but variance is rather high. For Maps / navigation, there are a substantial number of users who claim to use the application on a daily basis, but rarely do so in reality. We construct a new variable self-‐report bias which is coded `1’ if the number of days observed corresponds to the number of days reported, and `0’ if not. Table 6 shows the total number of wrong estimates for each application type. Wrong estimations are especially common for Productivity (53%) and News / Information services (54%). While News / Information usage is overestimated, Productivity use is typically underestimated. On average, respondents estimate 5.32 out of 9 service types incorrectly (SD = 1.60). Respondents that wrongly estimate use of maps / navigation are more likely to wrongly estimate news / information (χ2 (1) = 6.496, p = .011) as well as VOIP (χ2 (1) = 6.426, p = .018). Wrongly estimating online music and VOIP are also interrelated (χ2 (1) =4.536, p = .043) as well as social networking and instant messaging / chat (χ2 (1) = 9.743, p = .002). Wrongly estimating other service types is not interrelated.
10
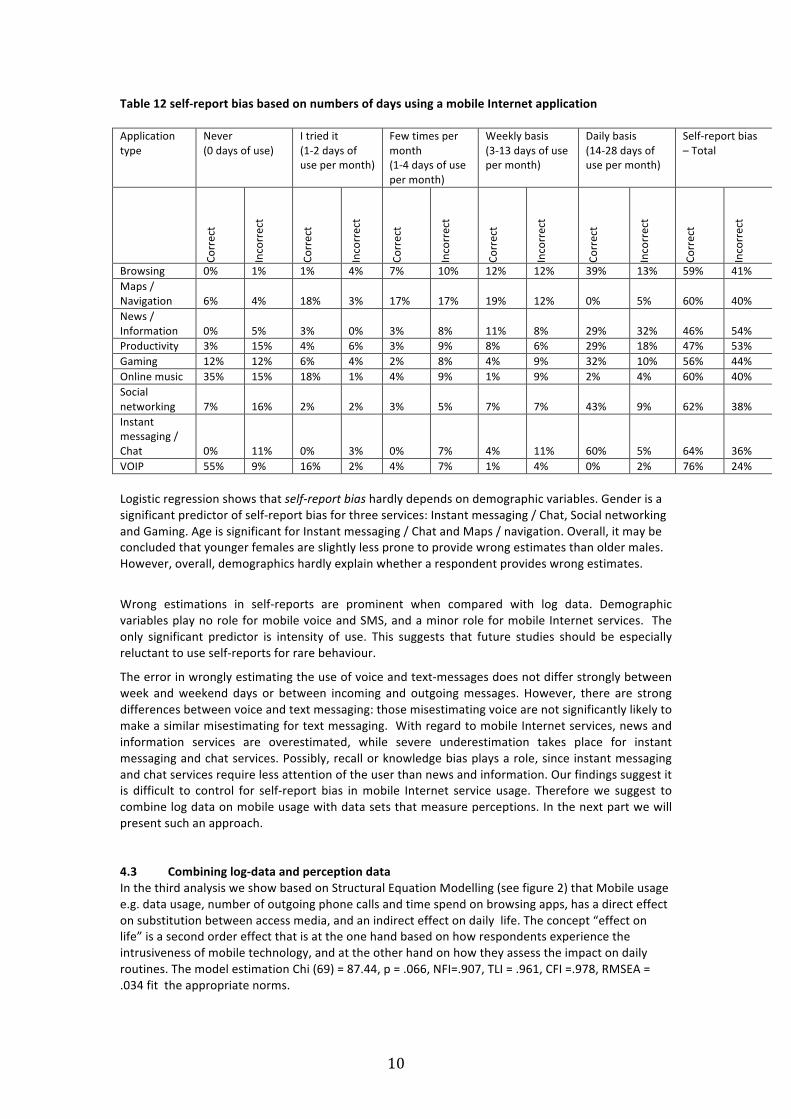
Table 12 self-‐report bias based on numbers of days using a mobile Internet application Application type
Never (0 days of use)
I tried it (1-‐2 days of use per month)
Few times per month (1-‐4 days of use per month)
Weekly basis (3-‐13 days of use per month)
Daily basis (14-‐28 days of use per month)
Self-‐report bias – Total
Co
rrect
Incorrect
Correct
Incorrect
Correct
Incorrect
Correct
Incorrect
Correct
Incorrect
Correct
Incorrect
Browsing 0% 1% 1% 4% 7% 10% 12% 12% 39% 13% 59% 41% Maps / Navigation 6% 4% 18% 3% 17% 17% 19% 12% 0% 5% 60% 40% News / Information 0% 5% 3% 0% 3% 8% 11% 8% 29% 32% 46% 54% Productivity 3% 15% 4% 6% 3% 9% 8% 6% 29% 18% 47% 53% Gaming 12% 12% 6% 4% 2% 8% 4% 9% 32% 10% 56% 44% Online music 35% 15% 18% 1% 4% 9% 1% 9% 2% 4% 60% 40% Social networking 7% 16% 2% 2% 3% 5% 7% 7% 43% 9% 62% 38% Instant messaging / Chat 0% 11% 0% 3% 0% 7% 4% 11% 60% 5% 64% 36% VOIP 55% 9% 16% 2% 4% 7% 1% 4% 0% 2% 76% 24% Logistic regression shows that self-‐report bias hardly depends on demographic variables. Gender is a significant predictor of self-‐report bias for three services: Instant messaging / Chat, Social networking and Gaming. Age is significant for Instant messaging / Chat and Maps / navigation. Overall, it may be concluded that younger females are slightly less prone to provide wrong estimates than older males. However, overall, demographics hardly explain whether a respondent provides wrong estimates.
Wrong estimations in self-‐reports are prominent when compared with log data. Demographic variables play no role for mobile voice and SMS, and a minor role for mobile Internet services. The only significant predictor is intensity of use. This suggests that future studies should be especially reluctant to use self-‐reports for rare behaviour.
The error in wrongly estimating the use of voice and text-‐messages does not differ strongly between week and weekend days or between incoming and outgoing messages. However, there are strong differences between voice and text messaging: those misestimating voice are not significantly likely to make a similar misestimating for text messaging. With regard to mobile Internet services, news and information services are overestimated, while severe underestimation takes place for instant messaging and chat services. Possibly, recall or knowledge bias plays a role, since instant messaging and chat services require less attention of the user than news and information. Our findings suggest it is difficult to control for self-‐report bias in mobile Internet service usage. Therefore we suggest to combine log data on mobile usage with data sets that measure perceptions. In the next part we will present such an approach.
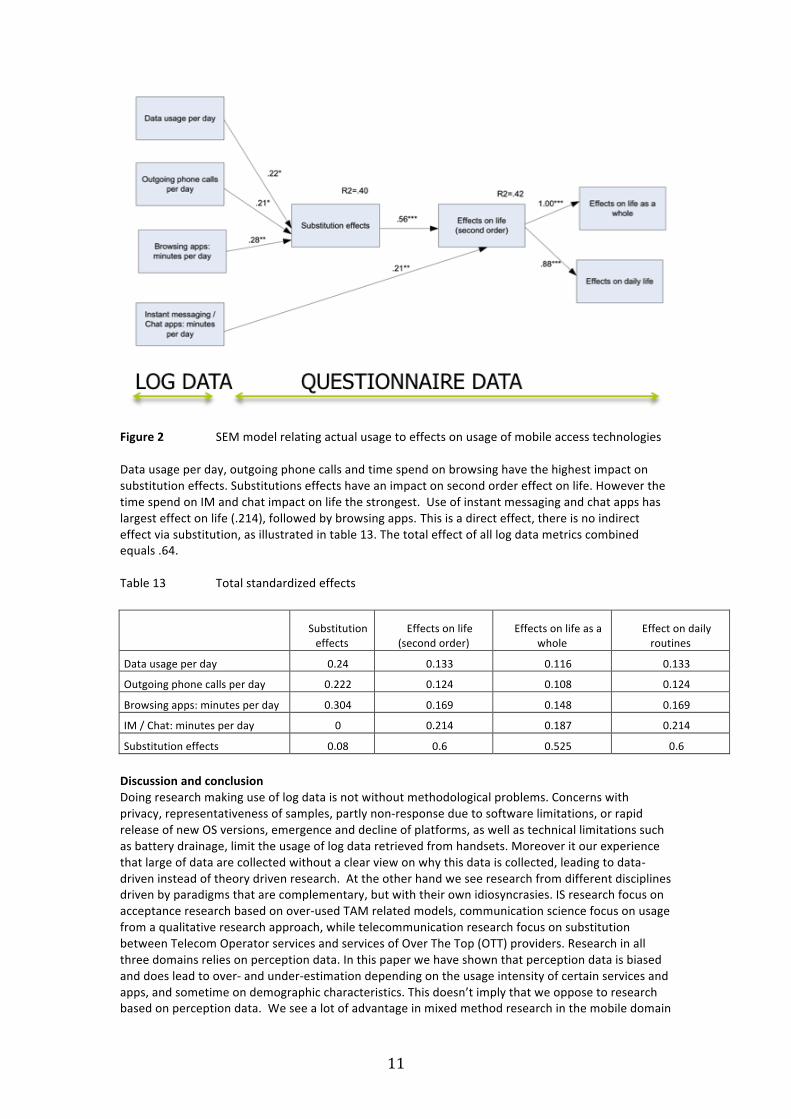
4.3 Combining log-‐data and perception data In the third analysis we show based on Structural Equation Modelling (see figure 2) that Mobile usage e.g. data usage, number of outgoing phone calls and time spend on browsing apps, has a direct effect on substitution between access media, and an indirect effect on daily life. The concept “effect on life” is a second order effect that is at the one hand based on how respondents experience the intrusiveness of mobile technology, and at the other hand on how they assess the impact on daily routines. The model estimation Chi (69) = 87.44, p = .066, NFI=.907, TLI = .961, CFI =.978, RMSEA = .034 fit the appropriate norms.
11
Figure 2 SEM model relating actual usage to effects on usage of mobile access technologies Data usage per day, outgoing phone calls and time spend on browsing have the highest impact on substitution effects. Substitutions effects have an impact on second order effect on life. However the time spend on IM and chat impact on life the strongest. Use of instant messaging and chat apps has largest effect on life (.214), followed by browsing apps. This is a direct effect, there is no indirect effect via substitution, as illustrated in table 13. The total effect of all log data metrics combined equals .64. Table 13 Total standardized effects
Substitution effects
Effects on life (second order)
Effects on life as a whole
Effect on daily routines
Data usage per day 0.24 0.133 0.116 0.133
Outgoing phone calls per day 0.222 0.124 0.108 0.124
Browsing apps: minutes per day 0.304 0.169 0.148 0.169
IM / Chat: minutes per day 0 0.214 0.187 0.214
Substitution effects 0.08 0.6 0.525 0.6
Discussion and conclusion Doing research making use of log data is not without methodological problems. Concerns with privacy, representativeness of samples, partly non-‐response due to software limitations, or rapid release of new OS versions, emergence and decline of platforms, as well as technical limitations such as battery drainage, limit the usage of log data retrieved from handsets. Moreover it our experience that large of data are collected without a clear view on why this data is collected, leading to data-‐driven instead of theory driven research. At the other hand we see research from different disciplines driven by paradigms that are complementary, but with their own idiosyncrasies. IS research focus on acceptance research based on over-‐used TAM related models, communication science focus on usage from a qualitative research approach, while telecommunication research focus on substitution between Telecom Operator services and services of Over The Top (OTT) providers. Research in all three domains relies on perception data. In this paper we have shown that perception data is biased and does lead to over-‐ and under-‐estimation depending on the usage intensity of certain services and apps, and sometime on demographic characteristics. This doesn’t imply that we oppose to research based on perception data. We see a lot of advantage in mixed method research in the mobile domain
12
and we expect that new research venues will open based on large scale research and data-‐analytics, in combination with perception research. Making use of such an approach we tested a new model for understanding the way people use mobile technologies and how it impacts their daily life. Our research show that there is an indirect effect on how mobile technology affect daily life by means of substitution, but that there is also a direct effect of time spent on mobile IM and Chat. Of course the research has a number of limitations. The research is executed in a small country with a specific regulatory regime and market conditions. The Netherlands have been the second country that adopted a Net Neutrality law. Market conditions in the Netherlands are rapidly changing. The role of the incumbent operator, and external pressure they experience, affect innovations in the field of mobile services. There are also limitations with regard to response, representativeness of the sample and partly non-‐response, as mentioned in the start of this conclusion. Nevertheless, our research that combines log-‐data studies with perception data, open interesting avenues for new research moving away from acceptance and adoption studies towards assessment of positive (and negative) effects of advanced mobile technologies. References Boase, J. & Ling, R., 2013. Measuring Mobile Phone Use: Self-‐Report Versus Log Data. Journal of
Computer-‐Mediated Communication, doi: 10.1111/jcc4.12021 Eagle, N. & Pentland, A. (2006). Reality Mining: Sensing Complex Social Systems. Personal and
Ubiquitous Computing, 10 (4), pp.255-‐268. Falaki, H., Lymberopoulos, D., Mahajan, R., Kandula, S. & Estrin, D. (2010). A first look at traffic on
smartphones. In: Proceedings of the 2010 Internet Measurement Conference (IMC2010). Melbourne, Australia 1-‐3 November 2010.
Gerpot, T.J. (2010). Impacts of mobile Internet use intensity on the demand of SMS and voice services of mobile network operators: an empirical multi-‐method study of German mobile Internet customers. Telecommunication Policy, Vol. 34, iss.8, pp. 430-‐443.
Haddon, L. (2003). Domestication and mobile telephony. Machines that become us: The social context of personal communication technology, 43-‐55.
Ishii, K. (2006). Implications of mobility: The uses of personal communication media in everyday life. Journal of Communication, 56(2), 346-‐365.
Karikoski, J. (2013). Empirical analysis of mobile interpersonal communication services. Helsinki: Aalto University. Doctoral Dissertation.
Kobayashi, T., & Boase, J. (2012). No such effect? The implications of measurement error in self-‐report measures of mobile communication use. Communication Methods and Measures, 6(2), 126-‐143.
Nikou, S. (2012). Opening the Black Box of IT artifacts. Looking into Mobile Service Characteristics and individual perceptions. Doctoral thesis. Turku: TUCS Dissertations, no. 149.
Ongena, G., H. Bouwman & H. Gillebaard (2012). Displacement and Supplemental Effects of the Mobile Internet on Fixed Internet Use. Journal of Media Management . Vol. 14. Iss. 4. Pp. 279-‐299
Oksman, V., & Turtiainen, J. (2004). Mobile communication as a social stage meanings of mobile communication in everyday life among teenagers in Finland. New Media & Society, 6(3), 319-‐339.
Smura, T., Kivi, A. & Töyli, J., 2009. A framework for analysing the usage of mobile services. Info, 11 (4), pp.53-‐67
Verkasalo, H., 2007. Handset-‐based measurement of smartphone service evolution in Finland. Journal of Targeting, Measurement and Analysis for Marketing, 16 (1), pp.7-‐25
Zhang, L., J. Zhi & Q. Liu (2012). A meta-‐analysis of mobile commerce adoption and moderating effect of culture. Computers in Human Behaviour, Vol. 28, pp. 1902-‐1911.


